Table of Contents
UNITED STATES
SECURITIES AND EXCHANGE COMMISSION
Washington, D.C. 20549
FORM 10-Q
☒ | ☒ | Quarterly report pursuant to Section 13 or 15(d) of the Securities Exchange Act of 1934 |
| |
| for the quarterly period ended September 30, 2017March 31, 2024. |
| | |
OR
☐ | ☐ | Transition report pursuant to Section 13 or 15(d) of the Securities Exchange Act of 1934 |
| |
| for the transition period from _________ to _________ . |
| | |
Commission File Number: 001-34765
Teucrium Commodity Trust |
(Exact name of registrant as specified in its charter) |
Teucrium Commodity Trust
(Exact name of registrant as specified in its charter)
Delaware | | 27-0724963 |
Delaware | 61-1604335 |
(State or other jurisdiction of | | (I.R.S. Employer |
incorporation or organization) | | Identification No.) |
| |
232 Hidden Lake Road, Building AThree Main Street, Suite 215 Burlington, VT 05401
Brattleboro, Vermont 05301
(Address of principal executive offices) (Zip code)
(802) 257-1617540-0019
(Registrant’sRegistrant’s telephone number, including area code)
Indicate by check mark whether the registrant (1) has filed all reports required to be filed by Section 13 or 15(d) of the Securities Exchange Act of 1934 during the preceding 12 months (or for such shorter period that the registrant was required to file such reports), and (2) has been subject to such filing requirements for the past 90 days.
☒ Yes ☐ No
Indicate by check mark whether the registrant has submitted electronically and posted on its corporate Web site, if any, every Interactive Data File required to be submitted and posted pursuant to Rule 405 of Regulation S-T (§232.405 of this chapter) during the preceding 12 months (or for such shorter period that the registrant was required to submit and post such files).
☒ Yes ☐ No
Indicate by check mark whether the registrant is a large accelerated filer, an accelerated filer, a non-accelerated filer, smaller reporting company or an emerging growth company. See the definitions of “large accelerated filer,” “accelerated filer,” “smaller reporting company,” and “emerging growth company” in Rule 12b-2 of the Exchange Act.
Large accelerated filer | ☐ | Accelerated filer | ☐ |
Non-accelerated Filer | ☒ | Smaller reporting company | ☒ |
| | |
Large accelerated filer ☐ | Accelerated filer ☒ |
Non-accelerated filer ☐ | Smaller reporting company ☐ |
(Do not check if a smaller reporting company) | Emerging growth company | ☐ |
If an emerging growth company, indicate by a check mark if the registrant has elected not to use the extended transition period for complying with any new or revised financial accounting standards provided pursuant to Section 13(a) of the Exchange Act. ☐
Indicate by check mark whether the registrant is a shell company (as defined in Rule 12b-2 of the Exchange Act).
☐ Yes ☒ No
Indicate the number of shares outstanding of each of the issuer’s classes of common stock, as of the last practicable date.
| | Total Number of Outstanding Shares as of May 9, 2024 | |
Teucrium Corn Fund | | 3,550,004 | |
Teucrium Sugar Fund | | 1,075,004 | |
Teucrium Soybean Fund | | 1,350,004 | |
Teucrium Wheat Fund | | 26,750,004 | |
Teucrium Agricultural Fund | | 512,502 | |
TEUCRIUM COMMODITY TRUST
Table of Contents
TEUCRIUM COMMODITY TRUST
Table of Contents
Part I. FINANCIAL INFORMATION
Item 1. Financial Statements.
Index to Financial Statements
Documents | | Page | |
TEUCRIUM COMMODITY TRUST | | | |
Combined Statements of Assets and Liabilities at September 30, 2017March 31, 2024 (Unaudited) and December 31, 20162023 | | 4F-1 | |
Combined Schedule of Investments at September 30, 2017March 31, 2024 (Unaudited) and December 31, 20162023 | | 5F-2 | |
Combined Statements of Operations (Unaudited) for the three and nine months ended September 30, 2017March 31, 2024 and 20162023 | | 7F-6 | |
Combined Statements of Changes in Net Assets (Unaudited) for the ninethree months ended September 30, 2017March 31, 2024 and 20162023 | | 8F-7 | |
Combined Statements of Cash Flows (Unaudited) for the ninethree months ended September 30, 2017March 31, 2024 and 20162023 | | 9F-8 | |
Notes to Combined Financial Statements | | 10F-9 | |
TEUCRIUM CORN FUND | | | |
TEUCRIUM CORN FUND | | | |
Statements of Assets and Liabilities at September 30, 2017March 31, 2024 (Unaudited) and December 31, 20162023 | | 22F-25 | |
Schedule of Investments at September 30, 2017March 31, 2024 (Unaudited) and December 31, 20162023 | | 23F-26 | |
Statements of Operations (Unaudited) for the three and nine months ended September 30, 2017March 31, 2024 and 20162023 | | 25F-28 | |
Statements of Changes in Net Assets (Unaudited) for the ninethree months ended September 30, 2017March 31, 2024 and 20162023 | | 26F-29 | |
Statements of Cash Flows (Unaudited) for the ninethree months ended September 30, 2017March 31, 2024 and 20162023 | | 27F-30 | |
Notes to Financial Statements | | 28F-31 | |
TEUCRIUM SOYBEAN FUND | | | |
TEUCRIUM SOYBEAN FUND | | | |
Statements of Assets and Liabilities at September 30, 2017March 31, 2024 (Unaudited) and December 31, 20162023 | | 38F-46 | |
Schedule of Investments at September 30, 2017March 31, 2024 (Unaudited) and December 31, 20162023 | | 39F-47 | |
Statements of Operations (Unaudited) for the three and nine months ended September 30, 2017March 31, 2024 and 20162023 | | 41F-49 | |
Statements of Changes in Net Assets (Unaudited) for the ninethree months ended September 30, 2017March 31, 2024 and 20162023 | | 42F-50 | |
Statements of Cash Flows (Unaudited) for the ninethree months ended September 30, 2017March 31, 2024 and 20162023 | | 43F-51 | |
Notes to Financial Statements | | 44F-52 | |
TEUCRIUM SUGAR FUND | | | |
TEUCRIUM SUGAR FUND | | | |
Statements of Assets and Liabilities at September 30, 2017March 31, 2024 (Unaudited) and December 31, 20162023 | | 56F-66 | |
Schedule of Investments at September 30, 2017March 31, 2024 (Unaudited) and December 31, 20162023 | | 57F-67 | |
Statements of Operations (Unaudited) for the three and nine months ended September 30, 2017March 31, 2024 and 20162023 | | 59F-69 | |
Statements of Changes in Net Assets (Unaudited) for the ninethree months ended September 30, 2017March 31, 2024 and 20162023 | | 60F-70 | |
Statements of Cash Flows (Unaudited) for the ninethree months ended September 30, 2017March 31, 2024 and 20162023 | | 61F-71 | |
Notes to Financial Statements | | 62F-72 | |
TEUCRIUM WHEAT FUND | | | |
TEUCRIUM WHEAT FUND | | | |
Statements of Assets and Liabilities at September 30, 2017March 31, 2024 (Unaudited) and December 31, 20162023 | | 73F-85 | |
Schedule of Investments at September 30, 2017March 31, 2024 (Unaudited) and December 31, 20162023 | | 74F-86 | |
Statements of Operations (Unaudited) for the three and nine months ended September 30, 2017March 31, 2024 and 20162023 | | 76F-88 | |
Statements of Changes in Net Assets (Unaudited) for the ninethree months ended September 30, 2017March 31, 2024 and 20162023 | | 77F-89 | |
Statements of Cash Flows (Unaudited) for the ninethree months ended September 30, 2017March 31, 2024 and 20162023 | | 78F-90 | |
Notes to Financial Statements | | 79F-91 | |
TEUCRIUM AGRICULTURAL FUND | | | |
TEUCRIUM AGRICULTURAL FUND | | | |
Statements of Assets and Liabilities at September 30, 2017March 31, 2024 (Unaudited) and December 31, 20162023 | | 91F-104 | |
Schedule of Investments at September 30, 2017March 31, 2024 (Unaudited) and December 31, 20162023 | | 92F-105 | |
Statements of Operations (Unaudited) for the three and nine months ended September 30, 2017March 31, 2024 and 20162023 | | 94F-107 | |
Statements of Changes in Net Assets (Unaudited) for the ninethree months ended September 30, 2017March 31, 2024 and 20162023 | | 95F-108 | |
Statements of Cash Flows (Unaudited) for the ninethree months ended September 30, 2017March 31, 2024 and 20162023 | | 96F-109 | |
Notes to Financial Statements | | 97F-110 | |
| | | |
HASHDEX BITCOIN FUTURES ETF | | | |
Statements of Assets and Liabilities at March 31, 2024 (Unaudited) and December 31, 2023 | | F-121 | |
Schedule of Investments at March 31, 2024 (Unaudited) and December 31, 2023 | | F-121 | |
Statements of Operations (Unaudited) for the three months ended March 31, 2024 and 2023 | | F-124 | |
Statements of Changes in Net Assets (Unaudited) for the three months ended March 31, 2024 and 2023 | | F-125 | |
Statements of Cash Flows (Unaudited) for the three months ended March 31, 2024 and 2023 | | F-126 | |
Notes to Financial Statements | | F-127 | |
TEUCRIUM COMMODITY TRUST
COMBINED STATEMENTS OF ASSETS AND LIABILITIES
| | | September 30, 2017 | | | December 31, 2016 | | | March 31, 2024 | | | December 31, 2023 | |
| | | (Unaudited) | | | | | | | (Unaudited) | | | |
| Assets | | | | | | | | | | | | |
| Cash and cash equivalents | | $ | 154,329,202 | | | $ | 145,323,469 | | | $ | 253,695,600 | | | $ | 292,237,362 | |
| Interest receivable | | | 753 | | | | 708 | | | 253,928 | | | 410,596 | |
| Restricted cash | | | 21,616 | | | | 151,684 | | |
| Other assets | | | 111,434 | | | | 27,135 | | | 16,381 | | | 5,362 | |
| Equity in trading accounts: | | | | | | | | | |
| Commodity futures contracts | | | 514,217 | | | | 542,647 | | |
Commodity and cryptocurrency futures contracts | | | 1,667,718 | | | 2,367,012 | |
| Due from broker | | | 13,865,286 | | | | 13,782,616 | | | | 41,016,750 | | | | 30,935,806 | |
| Total equity in trading accounts | | | 14,379,503 | | | | 14,325,263 | | | | 42,684,468 | | | | 33,302,818 | |
| Total assets | | $ | 168,842,508 | | | $ | 159,828,259 | | | $ | 296,650,377 | | | $ | 325,956,138 | |
| | | | | | | | | | |
| Liabilities | | | | | | | | | | | | |
| Management fee payable to Sponsor | | | 127,162 | | | | 129,201 | | | $ | 228,413 | | | $ | 276,900 | |
| Other liabilities | | | 24,861 | | | | 15,916 | | | 281,114 | | | 242,982 | |
| Equity in trading accounts: | | | | | | | | | |
| Commodity futures contracts | | | 6,782,169 | | | | 5,725,955 | | |
Commodity and cryptocurrency futures contracts | | | | 18,352,042 | | | | 10,888,842 | |
| Total liabilities | | $ | 6,934,192 | | | $ | 5,871,072 | | | | 18,861,569 | | | $ | 11,408,724 | |
| | | | | | | | | | |
| Net assets | | $ | 161,908,316 | | | $ | 153,957,187 | | |
Net Assets | | | $ | 277,788,808 | | | $ | 314,547,414 | |
The accompanying notes are an integral part of these financial statements.
TEUCRIUM COMMODITY TRUST
COMBINED SCHEDULE OF INVESTMENTS
March 31, 2024
(Unaudited)
| | | | | | | | | | | | | | | Percentage of | | | | | |
Description: Assets | | Yield | | | Cost | | | Fair Value | | | Net Assets | | | Shares | |
| | | | | | | | | | | | | | | | | | | | | |
Cash equivalents | | | | | | | | | | | | | | | | | | | | |
Money market funds | | | | | | | | | | | | | | | | | | | | |
U.S. Bank Deposit Account | | | 5.240 | % | | $ | 22,987,077 | | | $ | 22,987,077 | | | | 8.28 | % | | | 22,987,077 | |
Goldman Sachs Financial Square Government Fund - Institutional Class | | | 5.210 | % | | | 82,672,927 | | | | 82,672,927 | | | | 29.76 | | | | 82,672,927 | |
Total money market funds | | | | | | $ | 105,660,004 | | | $ | 105,660,004 | | | | 38.04 | % | | | | |
| | Maturity | | | | | | | | | | | | | | Percentage of | | | Principal | |
| | Date | | Yield | | | Cost | | | Fair Value | | | Net Assets | | | Amount | |
Commercial Paper | | | | | | | | | | | | | | | | | | | | | |
American Electric Power Company, Inc. | June 12, 2024 | | | 5.465 | % | | $ | 4,941,190 | | | $ | 4,946,401 | | | | 1.78 | % | | | 5,000,000 | |
Brookfield Infrastructure Holdings (Canada) Inc. | April 23, 2024 | | | 5.844 | % | | | 2,465,045 | | | | 2,491,261 | | | | 0.90 | | | | 2,500,000 | |
Brookfield Infrastructure Holdings (Canada) Inc. | May 7, 2024 | | | 5.834 | % | | | 2,465,106 | | | | 2,485,725 | | | | 0.89 | | | | 2,500,000 | |
Brookfield Infrastructure Holdings (Canada) Inc. | May 9, 2024 | | | 5.710 | % | | | 4,946,334 | | | | 4,970,444 | | | | 1.79 | | | | 5,000,000 | |
Brookfield Infrastructure Holdings (Canada) Inc. | May 14, 2024 | | | 5.782 | % | | | 2,464,625 | | | | 2,483,098 | | | | 0.89 | | | | 2,500,000 | |
Brookfield Infrastructure Holdings (Canada) Inc. | May 16, 2024 | | | 5.772 | % | | | 4,929,376 | | | | 4,964,688 | | | | 1.79 | | | | 5,000,000 | |
Brookfield Infrastructure Holdings (Canada) Inc. | May 22, 2024 | | | 5.780 | % | | | 2,466,590 | | | | 2,479,954 | | | | 0.89 | | | | 2,500,000 | |
Campbell Soup Company | May 1, 2024 | | | 5.601 | % | | | 4,955,696 | | | | 4,977,084 | | | | 1.79 | | | | 5,000,000 | |
The Cigna Group | April 5, 2024 | | | 5.501 | % | | | 2,970,300 | | | | 2,998,200 | | | | 1.08 | | | | 3,000,000 | |
Crown Castle Inc. | April 18, 2024 | | | 5.530 | % | | | 9,945,600 | | | | 9,974,312 | | | | 3.59 | | | | 10,000,000 | |
EIDP, Inc. | May 23, 2024 | | | 5.314 | % | | | 4,934,875 | | | | 4,962,372 | | | | 1.79 | | | | 5,000,000 | |
FMC Corporation | April 22, 2024 | | | 5.755 | % | | | 2,487,815 | | | | 2,491,746 | | | | 0.90 | | | | 2,500,000 | |
General Motors Financial Company, Inc. | April 23, 2024 | | | 5.511 | % | | | 4,932,500 | | | | 4,983,500 | | | | 1.79 | | | | 5,000,000 | |
General Motors Financial Company, Inc. | April 29, 2024 | | | 5.408 | % | | | 3,465,928 | | | | 3,485,545 | | | | 1.25 | | | | 3,500,000 | |
Glencore Funding LLC | April 16, 2024 | | | 5.490 | % | | | 7,456,125 | | | | 7,483,125 | | | | 2.69 | | | | 7,500,000 | |
Glencore Funding LLC | April 30, 2024 | | | 5.493 | % | | | 4,964,750 | | | | 4,978,250 | | | | 1.79 | | | | 5,000,000 | |
Glencore Funding LLC | May 10, 2024 | | | 5.475 | % | | | 7,440,597 | | | | 7,456,287 | | | | 2.68 | | | | 7,500,000 | |
Harley-Davidson Financial Services, Inc. | April 26, 2024 | | | 5.700 | % | | | 2,482,111 | | | | 2,490,278 | | | | 0.90 | | | | 2,500,000 | |
Harley-Davidson Financial Services, Inc. | May 16, 2024 | | | 5.815 | % | | | 4,943,792 | | | | 4,964,376 | | | | 1.79 | | | | 5,000,000 | |
National Fuel Gas Company | April 4, 2024 | | | 5.544 | % | | | 7,476,113 | | | | 7,496,588 | | | | 2.70 | | | | 7,500,000 | |
Stanley Black & Decker, Inc. | April 4, 2024 | | | 5.604 | % | | | 4,987,734 | | | | 4,997,700 | | | | 1.80 | | | | 5,000,000 | |
VW Credit, Inc. | April 11, 2024 | | | 5.511 | % | | | 9,865,000 | | | | 9,985,000 | | | | 3.59 | | | | 10,000,000 | |
VW Credit, Inc. | May 16, 2024 | | | 5.402 | % | | | 4,943,320 | | | | 4,966,876 | | | | 1.45 | | | | 5,000,000 | |
WGL Holdings, Inc. | April 15, 2024 | | | 5.616 | % | | | 4,984,640 | | | | 4,989,248 | | | | 1.46 | | | | 5,000,000 | |
Total Commercial Paper | | | | | | $ | 117,915,162 | | | $ | 118,502,058 | | | | 41.97 | % | | | | |
Total Cash Equivalents | | | | | | | | | | $ | 224,162,062 | | | | 80.01 | % | | | | |
| | | Number of | | | | | | | Percentage of | | | Notional Amount | |
| | | Contracts | | | Fair Value | | | Net Assets | | | (Long Exposure) | |
Commodity and Cryptocurrency futures contracts | | | | | | | | | | | | | | | | |
United States corn futures contracts | | | | | | | | | | | | | | | | |
CBOT Corn Futures SEP24 | | | 901 | | | $ | 154,412 | | | | 0.06 | % | | $ | 20,925,725 | |
| | | | | | | | | | | | | | | | | |
United States wheat futures contracts | | | | | | | | | | | | | | | | |
CBOT wheat futures SEP24 | | | 1,599 | | | | 1,513,306 | | | | 0.54 | | | | 47,290,425 | |
Total commodity and cryptocurrency futures contracts | | | | | | $ | 1,667,718 | | | | 0.60 | % | | $ | 68,216,150 | |
| | | Number of | | | | | | | Percentage of | | | Notional Amount | |
Description: Liabilities | | Contracts | | | Fair Value | | | Net Assets | | | (Long Exposure) | |
| | | | | | | | | | | | | | | | | |
Commodity and Cryptocurrency futures contracts | | | | | | | | | | | | | | | | |
United States corn futures contracts | | | | | | | | | | | | | | | | |
CBOT Corn Futures JUL24 | | | 1,072 | | | $ | 2,021,501 | | | | 0.73 | % | | $ | 24,361,200 | |
CBOT Corn Futures DEC24 | | | 1,022 | | | | 1,911,222 | | | | 0.69 | | | | 24,413,025 | |
| | | | | | | | | | | | | | | | | |
United States soybean futures contracts | | | | | | | | | | | | | | | | |
CBOT soybean futures JUL24 | | | 197 | | | | 308,999 | | | | 0.11 | | | | 11,871,713 | |
CBOT soybean futures NOV24 | | | 172 | | | | 478,846 | | | | 0.17 | | | | 10,201,750 | |
CBOT soybean futures NOV25 | | | 204 | | | | 7,131 | | | | 0.00 | | | | 11,860,050 | |
| | | | | | | | | | | | | | | | | |
United States sugar futures contracts | | | | | | | | | | | | | | | | |
ICE sugar futures JUL24 | | | 234 | | | | 594,646 | | | | 0.21 | | | | 5,805,072 | |
ICE sugar futures OCT24 | | | 201 | | | | 83,984 | | | | 0.03 | | | | 4,963,896 | |
ICE sugar futures MAR25 | | | 233 | | | | 135,771 | | | | 0.05 | | | | 5,769,826 | |
| | | | | | | | | | | | | | | | | |
United States wheat futures contracts | | | | | | | | | | | | | | | | |
CBOT wheat futures JUL24 | | | 1,915 | | | | 3,610,065 | | | | 1.30 | | | | 55,128,063 | |
CBOT wheat futures DEC24 | | | 1,800 | | | | 9,199,877 | | | | 3.31 | | | | 55,080,000 | |
Total commodity and cryptocurrency futures contracts | | | | | | $ | 18,352,042 | | | | 6.60 | % | | $ | 209,454,595 | |
| | | | | | | | | | | Percentage of | | | | | |
Exchange-traded funds* | | Cost | | | Fair Value | | | Net Assets | | | Shares | |
Teucrium Corn Fund | | | | | | $ | 3,661,367 | | | | 1.32 | % | | | 181,115 | |
Teucrium Soybean Fund | | | | | | | 3,574,703 | | | | 1.29 | | | | 142,076 | |
Teucrium Sugar Fund | | | | | | | 3,605,828 | | | | 1.30 | | | | 267,233 | |
Teucrium Wheat Fund | | | | | | | 3,673,518 | | | | 1.32 | | | | 682,062 | |
Total exchange-traded funds | | $ | 16,068,429 | | | $ | 14,515,416 | | | | 5.23 | % | | | | |
*The Trust eliminates the shares owned by the Teucrium Agricultural Fund from its combined statements of assets and liabilities due to the fact that these represent holdings of the other four Funds (“Underlying Funds”) owned by the Teucrium Agricultural Fund, which are included as shares outstanding of the Underlying Funds.
The accompanying notes are an integral part of these financial statements.
TEUCRIUM COMMODITY TRUST
COMBINED SCHEDULE OF INVESTMENTS
September 30, 2017
(Unaudited)December 31, 2023
| | | | | | | | | | | | | | | | | | | Percentage of | | | |
| Description: Assets | | Fair Value | | | Percentage of
Net Assets | | | Shares | | | Yield | | | Cost | | | Fair Value | | | Net Assets | | | Shares | |
| | | | | | | | | |
| Cash equivalents | | | | | | | | | | | | | | | | | | | | | | |
| Money market funds | | | | | | | | | | | | | |
| Fidelity Institutional Money Market Funds - Government Portfolio (cost $2,318,065) | | $ | 2,318,065 | | | | 1.43 | % | | | 2,318,065 | | |
U.S. Bank Deposit Account | | | 5.270 | % | | $ | 39,325,186 | | | $ | 39,325,186 | | | 12.50 | % | | 39,325,186 | |
Goldman Sachs Financial Square Government Fund - Institutional Class | | | 5.250 | % | | | 80,722,654 | | | | 80,722,654 | | | | 25.66 | | | 80,722,654 | |
Total money market funds | | | | | | $ | 120,047,840 | | | $ | 120,047,840 | | | | 38.16 | % | | | |
| | | | | | | | | | |
| | | | | | | | | Notional Amount | |
| | | | | | | | | (Long Exposure) | |
| Commodity futures contracts | | | | | | | | | | | | |
| United States corn futures contracts | | | | | | | | | | | | |
| CBOT corn futures May18 (1,073 contracts) | | $ | 68,413 | | | | 0.04 | % | | $ | 20,185,813 | |
| | | | | | | | | | | | | |
| United States soybean futures contracts | | | | | | | | | | | | |
| CBOT soybean futures JAN18 (144 contracts) | | | 18,450 | | | | 0.01 | | | | 7,045,200 | |
| CBOT soybean futures MAR18 (123 contracts) | | | 67,400 | | | | 0.04 | | | | 6,074,663 | |
| CBOT soybean futures NOV18 (143 contracts) | | | 49,325 | | | | 0.03 | | | | 7,051,688 | |
| | | | | | | | | | | | | |
| United States sugar futures contracts | | | | | | | | | | | | |
| ICE sugar futures JULY18 (122 contracts) | | | 14,067 | | | | 0.01 | | | | 1,966,250 | |
| | | | | | | | | | | | | |
| United States wheat futures contracts | | | | | | | | | | | | |
| CBOT wheat futures MAY18 (848 contracts) | | | 296,562 | | | | 0.18 | | | | 20,320,200 | |
| Total commodity futures contracts | | $ | 514,217 | | | | 0.31 | % | | $ | 62,643,814 | |
| | Maturity | | | | | | | | | | | | | | Percentage of | | | Principal | |
| | Date | | Yield | | | Cost | | | Fair Value | | | Net Assets | | | Amount | |
Commercial Paper | | | | | | | | | | | | | | | | | | | | | |
Albemarle Corporation | January 3, 2024 | | | 5.770 | % | | $ | 4,950,475 | | | $ | 4,998,428 | | | | 1.59 | % | | | 5,000,000 | |
Albemarle Corporation | January 4, 2024 | | | 5.753 | % | | | 4,960,764 | | | | 4,997,646 | | | | 1.59 | | | | 5,000,000 | |
Albemarle Corporation | January 8, 2024 | | | 5.738 | % | | | 4,952,302 | | | | 4,994,526 | | | | 1.59 | | | | 5,000,000 | |
Albemarle Corporation | January 11, 2024 | | | 5.808 | % | | | 4,956,460 | | | | 4,992,083 | | | | 1.59 | | | | 5,000,000 | |
Brookfield Infrastructure Holdings (Canada) Inc. | January 9, 2024 | | | 5.794 | % | | | 4,979,416 | | | | 4,993,666 | | | | 1.59 | | | | 5,000,000 | |
Brookfield Infrastructure Holdings (Canada) Inc. | January 16, 2024 | | | 5.853 | % | | | 4,933,150 | | | | 4,988,062 | | | | 1.59 | | | | 5,000,000 | |
Brookfield Infrastructure Holdings (Canada) Inc. | January 30, 2024 | | | 5.814 | % | | | 3,032,227 | | | | 3,040,948 | | | | 0.97 | | | | 3,055,000 | |
Entergy Corporation | March 1, 2024 | | | 5.665 | % | | | 7,402,875 | | | | 7,430,625 | | | | 2.36 | | | | 7,500,000 | |
FMC Corporation | January 19, 2024 | | | 5.816 | % | | | 7,466,634 | | | | 7,478,550 | | | | 2.38 | | | | 7,500,000 | |
General Motors Financial Company, Inc. | January 18, 2024 | | | 5.617 | % | | | 7,420,795 | | | | 7,480,486 | | | | 2.38 | | | | 7,500,000 | |
General Motors Financial Company, Inc. | January 24, 2024 | | | 5.661 | % | | | 4,941,417 | | | | 4,982,271 | | | | 1.58 | | | | 5,000,000 | |
General Motors Financial Company, Inc. | February 9, 2024 | | | 5.700 | % | | | 7,397,667 | | | | 7,454,648 | | | | 2.37 | | | | 7,500,000 | |
Harley-Davidson Financial Services, Inc. | January 9, 2024 | | | 5.843 | % | | | 4,949,066 | | | | 4,993,634 | | | | 1.59 | | | | 5,000,000 | |
Harley-Davidson Financial Services, Inc. | February 1, 2024 | | | 5.867 | % | | | 7,441,200 | | | | 7,462,800 | | | | 2.37 | | | | 7,500,000 | |
Harley-Davidson Financial Services, Inc. | February 14, 2024 | | | 5.927 | % | | | 7,421,323 | | | | 7,446,741 | | | | 2.37 | | | | 7,500,000 | |
National Fuel Gas Company | January 8, 2024 | | | 5.867 | % | | | 4,960,800 | | | | 4,994,400 | | | | 1.59 | | | | 5,000,000 | |
National Fuel Gas Company | January 26, 2024 | | | 5.941 | % | | | 2,478,948 | | | | 2,489,879 | | | | 0.79 | | | | 2,500,000 | |
Oracle Corporation | March 6, 2024 | | | 5.562 | % | | | 4,934,904 | | | | 4,950,799 | | | | 1.57 | | | | 5,000,000 | |
Stanley Black & Decker, Inc. | January 22, 2024 | | | 5.807 | % | | | 7,437,063 | | | | 7,475,063 | | | | 2.38 | | | | 7,500,000 | |
V.F. Corporation | January 17, 2024 | | | 5.674 | % | | | 4,936,679 | | | | 4,987,645 | | | | 1.59 | | | | 5,000,000 | |
V.F. Corporation | January 18, 2024 | | | 5.606 | % | | | 4,947,292 | | | | 4,987,014 | | | | 1.59 | | | | 5,000,000 | |
V.F. Corporation | January 25, 2024 | | | 5.910 | % | | | 4,928,362 | | | | 4,950,783 | | | | 1.57 | | | | 4,970,000 | |
WGL Holdings, Inc. | January 3, 2024 | | | 5.793 | % | | | 4,981,792 | | | | 4,998,416 | | | | 1.59 | | | | 5,000,000 | |
WGL Holdings, Inc. | January 12, 2024 | | | 5.849 | % | | | 7,461,666 | | | | 7,486,824 | | | | 2.38 | | | | 7,500,000 | |
Walgreens Boots Alliance, Inc. | January 12, 2024 | | | 6.028 | % | | | 7,950,009 | | | | 7,985,529 | | | | 2.54 | | | | 8,000,000 | |
Total Commercial Paper | | | | | | $ | 142,223,286 | | | $ | 143,041,466 | | | | 45.50 | % | | | | |
Total Cash Equivalents | | | | | | | | | | $ | 263,089,306 | | | | 83.66 | % | | | | |
| | | | | | Percentage of | | | Notional Amount | |
| Description: Liabilities | | Fair Value | | | Net Assets | | | (Long Exposure) | |
| | | | | | | | | | |
| Commodity futures contracts | | | | | | | | | | | | |
| United States corn futures contracts | | | | | | | | | | | | |
| CBOT corn futures MAR18 (1,281 contracts) | | $ | 2,250,325 | | | | 1.39 | % | | $ | 23,554,388 | |
| CBOT corn futures DEC18 (1,183 contracts) | | | 247,888 | | | | 0.15 | | | | 23,630,425 | |
| | | | | | | | | | | | | |
| United States sugar futures contracts | | | | | | | | | | | | |
| ICE sugar futures MAY18 (145 contracts) | | | 20,664 | | | | 0.01 | | | | 2,309,328 | |
| ICE sugar futures MAR19 (135 contracts) | | | 197,792 | | | | 0.12 | | | | 2,314,872 | |
| | | | | | | | | | | | | |
| United States wheat futures contracts | | | | | | | | | | | | |
| CBOT wheat futures MAR18 (1,016 contracts) | | | 3,814,512 | | | | 2.36 | | | | 23,698,200 | |
| CBOT wheat futures DEC18 (908 contracts) | | | 250,988 | | | | 0.16 | | | | 23,812,300 | |
| Total commodity futures contracts | | $ | 6,782,169 | | | | 4.19 | % | | $ | 99,319,513 | |
| | | | | | | | | | | | | |
| | | | | | | | | | | Shares | |
| Exchange-traded funds* | | | | | | | | | | | | |
| Teucrium Corn Fund | | $ | 295,854 | | | | 0.18 | % | | | 16,808 | |
| Teucrium Soybean Fund | | | 299,411 | | | | 0.18 | | | | 16,331 | |
| Teucrium Sugar Fund | | | 278,403 | | | | 0.17 | | | | 29,524 | |
| Teucrium Wheat Fund | | | 301,700 | | | | 0.19 | | | | 45,937 | |
| Total exchange-traded funds (cost $1,799,330) | | $ | 1,175,368 | | | | 0.72 | % | | | | |
| | | Number of | | | | | | | Percentage of | | | Notional Amount | |
| | | Contracts | | | Fair Value | | | Net Assets | | | (Long Exposure) | |
Commodity and Cryptocurrency futures contracts | | | | | | | | | | | | | | | | |
United States wheat futures contracts | | | | | | | | | | | | | | | | |
CBOT wheat futures MAY24 | | | 2,018 | | | $ | 363,500 | | | | 0.12 | % | | $ | 64,525,550 | |
CBOT wheat futures JUL24 | | | 1,711 | | | | 1,873,993 | | | | 0.60 | | | | 55,243,913 | |
| | | | | | | | | | | | | | | | | |
United States CME Bitcoin futures contracts | | | | | | | | | | | | | | | | |
CME Bitcoin futures JAN24 | | | 6 | | | | 129,519 | | | | 0.04 | | | | 1,274,550 | |
Total commodity and cryptocurrency futures contracts | | | | | | $ | 2,367,012 | | | | 0.76 | % | | $ | 121,044,013 | |
| | | Number of | | | | | | | Percentage of | | | Notional Amount | |
Description: Liabilities | | Contracts | | | Fair Value | | | Net Assets | | | (Long Exposure) | |
| | | | | | | | | | | | | | | | | |
Commodity and Cryptocurrency futures contracts | | | | | | | | | | | | | | | | |
United States corn futures contracts | | | | | | | | | | | | | | | | |
CBOT corn futures MAY24 | | | 1,171 | | | $ | 1,102,254 | | | | 0.35 | % | | $ | 28,338,200 | |
CBOT corn futures JUL24 | | | 983 | | | | 384,407 | | | | 0.12 | | | | 24,280,100 | |
CBOT corn futures DEC24 | | | 1,128 | | | | 695,480 | | | | 0.22 | | | | 28,397,400 | |
| | | | | | | | | | | | | | | | | |
United States soybean futures contracts | | | | | | | | | | | | | | | | |
CBOT soybean futures MAR24 | | | 156 | | | | 617,118 | | | | 0.20 | | | | 10,124,400 | |
CBOT soybean futures MAY24 | | | 133 | | | | 633,749 | | | | 0.20 | | | | 8,693,213 | |
CBOT soybean futures NOV24 | | | 164 | | | | 140,794 | | | | 0.04 | | | | 10,215,150 | |
| | | | | | | | | | | | | | | | | |
United States sugar futures contracts | | | | | | | | | | | | | | | | |
ICE sugar futures MAY24 | | | 270 | | | | 1,051,261 | | | | 0.33 | | | | 6,175,008 | |
ICE sugar futures JUL24 | | | 233 | | | | 1,128,473 | | | | 0.36 | | | | 5,326,193 | |
ICE sugar futures MAR25 | | | 268 | | | | 508,264 | | | | 0.16 | | | | 6,216,314 | |
| | | | | | | | | | | | | | | | | |
United States wheat futures contracts | | | | | | | | | | | | | | | | |
CBOT wheat futures DEC24 | | | 1,924 | | | | 4,575,666 | | | | 1.45 | | | | 64,357,800 | |
| | | | | | | | | | | | | | | | | |
United States CME Bitcoin futures contracts | | | | | | | | | | | | | | | | |
CME Bitcoin futures FEB24 | | | 6 | | | | 51,376 | | | | 0.02 | | | | 1,288,500 | |
Total commodity and cryptocurrency futures contracts | | | | | | $ | 10,888,842 | | | | 3.45 | % | | $ | 193,412,278 | |
| | | | | | | | | | | Percentage of | | | | | |
Exchange-traded funds* | | Cost | | | Fair Value | | | Net Assets | | | Shares | |
Teucrium Corn Fund | | | | | | $ | 4,567,949 | | | | 1.45 | % | | | 211,348 | |
Teucrium Soybean Fund | | | | | | | 4,546,758 | | | | 1.45 | | | | 168,219 | |
Teucrium Sugar Fund | | | | | | | 4,624,253 | | | | 1.47 | | | | 371,871 | |
Teucrium Wheat Fund | | | | | | | 4,662,940 | | | | 1.48 | | | | 779,782 | |
Total exchange-traded funds | | $ | 19,469,359 | | | $ | 18,401,900 | | | | 5.85 | % | | | | |
*The Trust eliminates the shares owned by the Teucrium Agricultural Fund from its combined statements of assets and liabilities due to the fact that these represent holdings of the Underlying Funds owned by the Teucrium Agricultural Fund, which are included as shares outstanding of the Underlying Funds.
The accompanying notes are an integral part of these financial statements.
TEUCRIUM COMMODITY TRUST
COMBINED SCHEDULE OF INVESTMENTS
December 31, 2016
| | | | | | Percentage of | | | | |
| Description: Assets | | Fair Value | | | Net Assets | | | Shares | |
| | | | | | | | | | |
| Cash equivalents | | | | | | | | | | | | |
| Money market funds | | | | | | | | | | | | |
| Fidelity Institutional Money Market Funds – Government Portfolio (cost $1,412,423) | | $ | 1,412,423 | | | | 0.92 | % | | | 1,412,423 | |
| | | | | | | | | | |
| | | | | | | | | Notional Amount | |
| | | | | | | | | (Long Exposure) | |
| Commodity futures contracts | | | | | | | | | | | | |
| United States soybean futures contracts | | | | | | | | | | | | |
| CBOT soybean futures MAR17 (90 contracts) | | $ | 107,125 | | | | 0.07 | % | | $ | 4,518,000 | |
| CBOT soybean futures NOV17 (91 contracts) | | | 250,375 | | | | 0.16 | | | | 4,501,088 | |
| | | | | | | | | | | | | |
| United States sugar futures contracts | | | | | | | | | | | | |
| ICE sugar futures MAR18 (93 contracts) | | | 185,147 | | | | 0.12 | | | | 1,935,293 | |
| Total commodity futures contracts | | $ | 542,647 | | | | 0.35 | % | | $ | 10,954,381 | |
| | | | | | | | | | |
| | | | | | Percentage of | | | Notional Amount | |
| Description: Liabilities | | Fair Value | | | Net Assets | | | (Long Exposure) | |
| | | | | | | | | | |
| Commodity futures contracts | | | | | | | | | | | | |
| United States corn futures contracts | | | | | | | | | | | | |
| CBOT corn futures MAY17 (1,438 contracts) | | $ | 50,713 | | | | 0.03 | % | | $ | 25,704,250 | |
| CBOT corn futures JUL17 (1,207 contracts) | | | 576,650 | | | | 0.37 | | | | 21,982,488 | |
| CBOT corn futures DEC17 (1,347 contracts) | | | 833,437 | | | | 0.54 | | | | 25,593,000 | |
| | | | | | | | | | | | | |
| United States soybean futures contracts | | | | | | | | | | | | |
| CBOT soybean futures MAY17 (76 contracts) | | | 12,025 | | | | 0.01 | | | | 3,847,500 | |
| | | | | | | | | | | | | |
| United States sugar futures contracts | | | | | | | | | | | | |
| ICE sugar futures MAY17 (89 contracts) | | | 105,829 | | | | 0.07 | | | | 1,918,840 | |
| ICE sugar futures JUL17 (79 contracts) | | | 225,713 | | | | 0.15 | | | | 1,667,848 | |
| | | | | | | | | | | | | |
| United States wheat futures contracts | | | | | | | | | | | | |
| CBOT wheat futures MAY17 (1,037 contracts) | | | 1,011,350 | | | | 0.66 | | | | 21,802,925 | |
| CBOT wheat futures JUL17 (861 contracts) | | | 213,963 | | | | 0.14 | | | | 18,694,463 | |
| CBOT wheat futures DEC17 (939 contracts) | | | 2,696,275 | | | | 1.75 | | | | 21,831,750 | |
| Total commodity futures contracts | | $ | 5,725,955 | | | | 3.72 | % | | $ | 143,043,064 | |
| | | | | | | | | | | | | |
| Exchange-traded funds* | | | | | | | | | | | Shares | |
| Teucrium Corn Fund | | $ | 323,979 | | | | 0.21 | % | | | 17,258 | |
| Teucrium Soybean Fund | | | 315,486 | | | | 0.20 | | | | 16,531 | |
| Teucrium Sugar Fund | | | 342,822 | | | | 0.22 | | | | 26,424 | |
| Teucrium Wheat Fund | | | 331,267 | | | | 0.22 | | | | 48,087 | |
| Total exchange-traded funds (cost $2,033,919) | | $ | 1,313,554 | | | | 0.85 | % | | | | |
*The Trust eliminates the shares owned by the Teucrium Agricultural Fund from its combined statements of assets and liabilities due to the fact that these represent holdings of the Underlying Funds owned by the Teucrium Agricultural Fund, which are included as shares outstanding of the Underlying Funds.
TEUCRIUM COMMODITY TRUST
COMBINED STATEMENTS OF OPERATIONS
(Unaudited)
| | | Three months
ended | | Three months
ended | | Nine months
ended | | Nine months
ended | | | Three months ended | | Three months ended | |
| | | September 30, 2017 | | | September 30, 2016 | | | September 30, 2017 | | | September 30, 2016 | | | March 31, 2024 | | | March 31, 2023 | |
| Income | | | | | | | | | | | | | | | | | | | | |
| Realized and unrealized loss on trading of commodity futures contracts: | | | | | | | | | | | | | | | | | |
| Realized loss on commodity futures contracts | | $ | (363,195 | ) | | $ | (11,187,329 | ) | | $ | (3,036,823 | ) | | $ | (13,175,344 | ) | |
| Net change in unrealized depreciation on commodity futures contracts | | | (13,715,137 | ) | | | (1,385,513 | ) | | | (1,084,644 | ) | | | (635,252 | ) | |
| Interest Income | | | 489,124 | | | | 207,383 | | | | 1,229,246 | | | | 483,009 | | |
Realized and unrealized gain (loss) on trading of commodity futures contracts: | | |
Realized loss on commodity and cryptocurrency futures contracts | | | $ | (17,194,951 | ) | | $ | (26,591,126 | ) |
Net change in unrealized depreciation on commodity and cryptocurrency futures contracts | | | (7,969,968 | ) | | (5,823,279 | ) |
Interest income | | | | 3,704,387 | | | | 4,331,014 | |
| Total loss | | | (13,589,208 | ) | | | (12,365,459 | ) | | | (2,892,221 | ) | | | (13,327,587 | ) | | | (21,460,532 | ) | | | (28,083,391 | ) |
| | | | | | | | | | | | | | | | | | |
| Expenses | | | | | | | | | | | | | | | | | | | | |
| Management fees | | | 379,462 | | | | 380,847 | | | | 1,155,626 | | | | 902,344 | | | 701,923 | | | 989,515 | |
| Professional fees | | | 352,288 | | | | 438,651 | | | | 983,524 | | | | 986,600 | | | 302,008 | | | 446,052 | |
| Distribution and marketing fees | | | 715,384 | | | | 721,439 | | | | 1,912,998 | | | | 1,690,002 | | | 947,591 | | | 927,712 | |
| Custodian fees and expenses | | | 91,666 | | | | 88,672 | | | | 263,485 | | | | 223,961 | | | 95,024 | | | 120,560 | |
| Business permits and licenses fees | | | 19,849 | | | | 28,854 | | | | 77,862 | | | | 72,322 | | | 56,338 | | | 34,617 | |
| General and administrative expenses | | | 74,494 | | | | 60,148 | | | | 220,472 | | | | 173,288 | | | 70,863 | | | 49,142 | |
| Brokerage commissions | | | 44,377 | | | | 30,802 | | | | 121,696 | | | | 82,213 | | |
| Other expenses | | | 23,979 | | | | 27,362 | | | | 67,375 | | | | 67,982 | | | | 66 | | | | - | |
| Total expenses | | | 1,701,499 | | | | 1,776,775 | | | | 4,803,038 | | | | 4,198,712 | | | | 2,173,813 | | | | 2,567,598 | |
| | | | | | | | | | | | | | | | | | |
| Expenses waived by the Sponsor | | | (284,299 | ) | | | (304,726 | ) | | | (545,764 | ) | | | (403,282 | ) | | (131,847 | ) | | (196,064 | ) |
| | | | | | | | | | | | | | | | | | |
| Total expenses, net | | | 1,417,200 | | | | 1,472,049 | | | | 4,257,274 | | | | 3,795,430 | | | | 2,041,966 | | | | 2,371,534 | |
| | | | | | | | | | | | | | | | | | |
| Net loss | | $ | (15,006,408 | ) | | $ | (13,837,508 | ) | | $ | (7,149,495 | ) | | $ | (17,123,017 | ) | | $ | (23,502,498 | ) | | $ | (30,454,925 | ) |
The accompanying notes are an integral part of these financial statements.
TEUCRIUM COMMODITY TRUST
COMBINED STATEMENTS OF CHANGES IN NET ASSETS
(Unaudited)*
| | | Nine months ended | | Nine months ended | | | Three months ended | | Three months ended | |
| | | September 30, 2017 | | | September 30, 2016 | | | March 31, 2024 | | | March 31, 2023 | |
| Operations | | | | | | | | | |
| Net loss | | $ | (7,149,495 | ) | | $ | (17,123,017 | ) | | $ | (23,502,498 | ) | | $ | (30,454,925 | ) |
| Capital transactions | | | | | | | | | |
Distribution of Net Assets to Acquiring Fund | | | (2,574,071 | ) | | - | |
| Issuance of Shares | | | 76,238,431 | | | | 97,154,354 | | | 13,002,447 | | | 17,208,235 | |
| Redemption of Shares | | | (61,140,856 | ) | | | (27,059,248 | ) | | (26,854,784 | ) | | (100,669,768 | ) |
| Net change in the cost of the Underlying Funds | | | 3,049 | | | | 5,547 | | | | 3,170,300 | | | | 5,715,382 | |
| Total capital transactions | | | 15,100,624 | | | | 70,100,653 | | | (13,256,108 | ) | | (77,746,151 | ) |
| | | | | | | | | | |
| Net change in net assets | | | 7,951,129 | | | | 52,977,636 | | | | (36,758,606 | ) | | | (108,201,076 | ) |
| | | | | | | | | | |
| Net assets, beginning of period | | | 153,957,187 | | | | 99,601,487 | | | | 314,547,414 | | | | 465,375,598 | |
| | | | | | | | | | |
| Net assets, end of period | | $ | 161,908,316 | | | $ | 152,579,123 | | | $ | 277,788,808 | | | $ | 357,174,522 | |
* The Hashdex Bitcoin Futures ETF was transferred to the Tidal Commodities Trust I as described in Note 1 to these financials.
The accompanying notes are an integral part of these financial statements.
TEUCRIUM COMMODITY TRUST
COMBINED STATEMENTS OF CASH FLOWS
(Unaudited)*
| | | Nine months ended | | Nine months ended | | | Three months ended | | Three months ended | |
| | | September 30, 2017 | | | September 30, 2016 | | | March 31, 2024 | | | March 31, 2023 | |
| Cash flows from operating activities: | | | | | | | | | | | | |
| Net loss | | $ | (7,149,495 | ) | | $ | (17,123,017 | ) | | $ | (23,502,498 | ) | | $ | (30,454,925 | ) |
| Adjustments to reconcile net loss to net cash used in operating activities: | | | | | | | | | | | | |
| Net change in unrealized depreciation on commodity futures contracts | | | 1,084,644 | | | | 635,252 | | |
Net change in unrealized appreciation on commodity and cryptocurrency futures contracts | | | 7,969,968 | | | 5,823,279 | |
| Changes in operating assets and liabilities: | | | | | | | | | | | | |
| Due from broker | | | (82,670 | ) | | | (5,722,273 | ) | | (10,080,944 | ) | | 5,668,407 | |
| Interest receivable | | | (45 | ) | | | (17,128 | ) | | 146,371 | | | 11,703 | |
| Restricted cash | | | 130,068 | | | | 116,999 | | |
| Other assets | | | (84,299 | ) | | | (56,088 | ) | | (722 | ) | | (50,462 | ) |
| Due to broker | | | — | | | | 250,600 | | | - | | | 2,101,900 | |
| Management fee payable to Sponsor | | | (2,039 | ) | | | 45,219 | | | (48,487 | ) | | (122,242 | ) |
| Other liabilities | | | 8,945 | | | | (6,934 | ) | | | 38,132 | | | | 61,862 | |
| Net cash used in operating activities | | | (6,094,891 | ) | | | (21,877,370 | ) | | (25,478,180 | ) | | (16,960,478 | ) |
| | | | | | | | | | |
| Cash flows from financing activities: | | | | | | | | | | | | |
Distribution to Acquiring Fund upon consummation of merger and liquidation agreement - see Note 1 to the finanical statements | | | (2,381,545 | ) | | - | |
| Proceeds from sale of Shares | | | 76,238,431 | | | | 97,154,354 | | | 13,002,447 | | | 18,185,376 | |
| Redemption of Shares | | | (61,140,856 | ) | | | (26,517,868 | ) | | (26,854,784 | ) | | (110,853,683 | ) |
| Net change in cost of the Underlying Funds | | | 3,049 | | | | 5,547 | | | | 3,170,300 | | | | 5,715,382 | |
| Net cash provided by financing activities | | | 15,100,624 | | | | 70,642,033 | | |
Net cash used in financing activities | | | (13,063,582 | ) | | (86,952,925 | ) |
| | | | | | | | | | |
| Net change in cash and cash equivalents | | | 9,005,733 | | | | 48,764,663 | | | (38,541,762 | ) | | (103,913,403 | ) |
| Cash and cash equivalents, beginning of period | | | 145,323,469 | | | | 92,561,610 | | |
| Cash and cash equivalents, end of period | | $ | 154,329,202 | | | $ | 141,326,273 | | |
Cash and cash equivalents beginning of period | | | | 292,237,362 | | | | 434,062,296 | |
Cash and cash equivalents end of period | | | $ | 253,695,600 | | | $ | 330,148,893 | |
* The Hashdex Bitcoin Futures ETF was transferred to the Tidal Commodities Trust I as described in Note 1 to these financials.
The accompanying notes are an integral part of these financial statements.
NOTES TO COMBINED FINANCIAL STATEMENTS
September 30, 2017
March 31, 2024
(Unaudited)
Note 1– Organization and Operation
Teucrium Commodity Trust (“Trust”), a Delaware statutory trust organized on September 11, 2009, is a series trust consisting of fivesix series: Teucrium Corn Fund (“CORN”), Teucrium Sugar Fund (“CANE”), Teucrium Soybean Fund (“SOYB”), Teucrium Wheat Fund (“WEAT”), and Teucrium Agricultural Fund (“TAGS”) and Hashdex Bitcoin Futures ETF (“DEFI”). As discussed elsewhere in this Form 10-Q, the Trust, on behalf of its series, Hashdex Bitcoin Futures Fund ("Acquired Fund"), and Tidal Commodities Trust I, on behalf of its series, Hashdex Bitcoin Futures Fund, entered into an Agreement and Plan of Merger and Liquidation dated as of October 30, 2023 ("Plan of Merger"). The Merger closed on the January 3, 2024. Upon such closing, the Plan of Merger caused all of the Acquired Fund's shares to be canceled and the Acquired Fund to be liquidated. All of these series of the Trust are collectively referred to as the “Funds” and singularly as the “Fund.” Collectively, CORN, CANE, SOYB, and WEAT are referred to as the “Agricultural Funds”. Each Fund is a commodity pool that is a series of the Trust. The Funds issue common units, called the “Shares,” representing fractional undivided beneficial interests in a Fund. TheEffective as of April 29, 2019, the Trust and the Funds operate pursuant to the Trust’s SecondFifth Amended and Restated Declaration of Trust and Trust Agreement (the “Trust Agreement”).
On June 5,7, 2010, the initial Form S-1S-1 for CORN was declared effective by the U.S. Securities and Exchange Commission (“SEC”). On June 8, 2010, four Creation Baskets for CORN were issued representing 200,000 shares and $5,000,000. CORN began trading on the New York Stock Exchange (“NYSE”) Arca on June 9, 2010. On April 29, 2016, a second subsequentThe current registration statement for CORN was declared effective by the SEC.SEC on April 7, 2022. This registration statement for CORN registered an indeterminate number of shares.
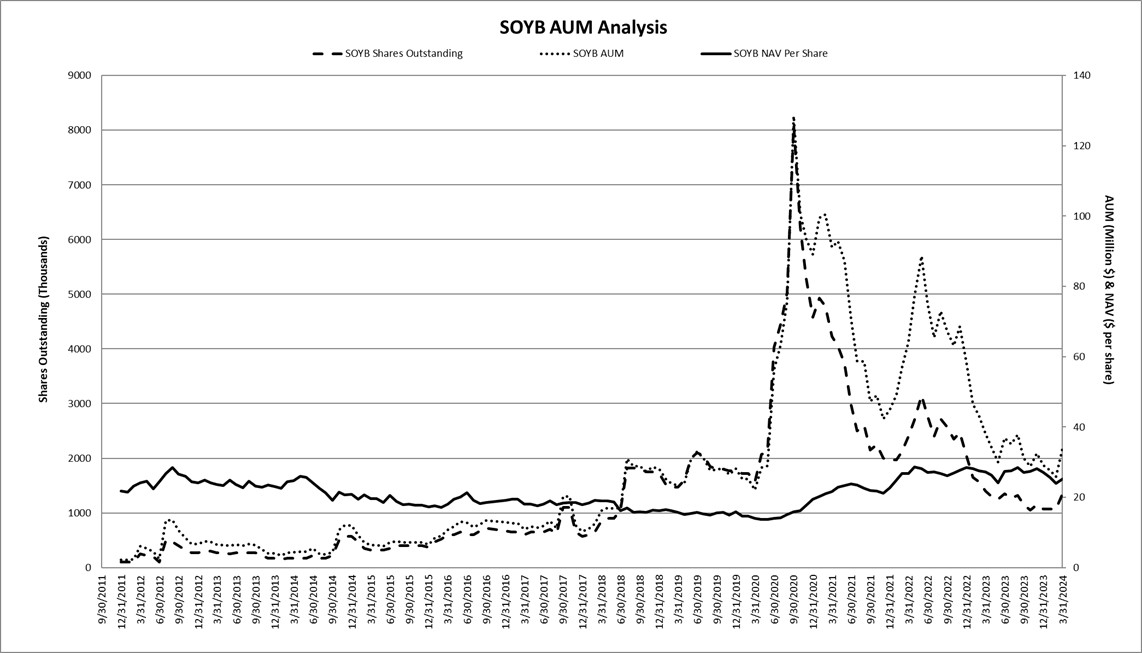
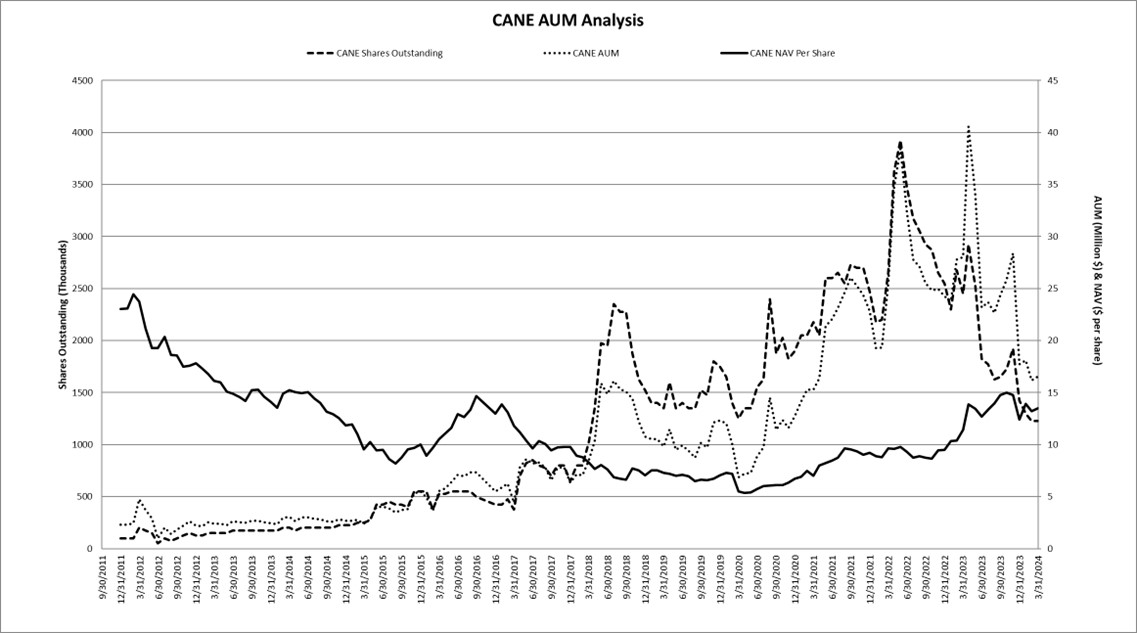
On June 17,13, 2011, the initial Forms S-1S-1 for CANE, SOYB, and WEAT were declared effective by the SEC. On September 16, 2011, two Creation Baskets were issued for each Fund, representing 100,000 shares and $2,500,000,$2,500,000, for CANE, SOYB, and WEAT. On September 19, 2011, CANE, SOYB, and WEAT started trading on the NYSE Arca. On July 15, 2016, a subsequent registration statement for WEAT was declared effective. This registration statement for WEAT registered an additional 24,050,000 shares. On May 1, 2017, subsequentThe current registration statements for CANE and SOYB were declared effective by the SEC.SEC on April 7, 2022. The registration statements for SOYB and CANE registered an indeterminate number of shares each. The current registration statement for WEAT was declared effective on March 9, 2022. This registration statement for WEAT registered an indeterminate number of shares.
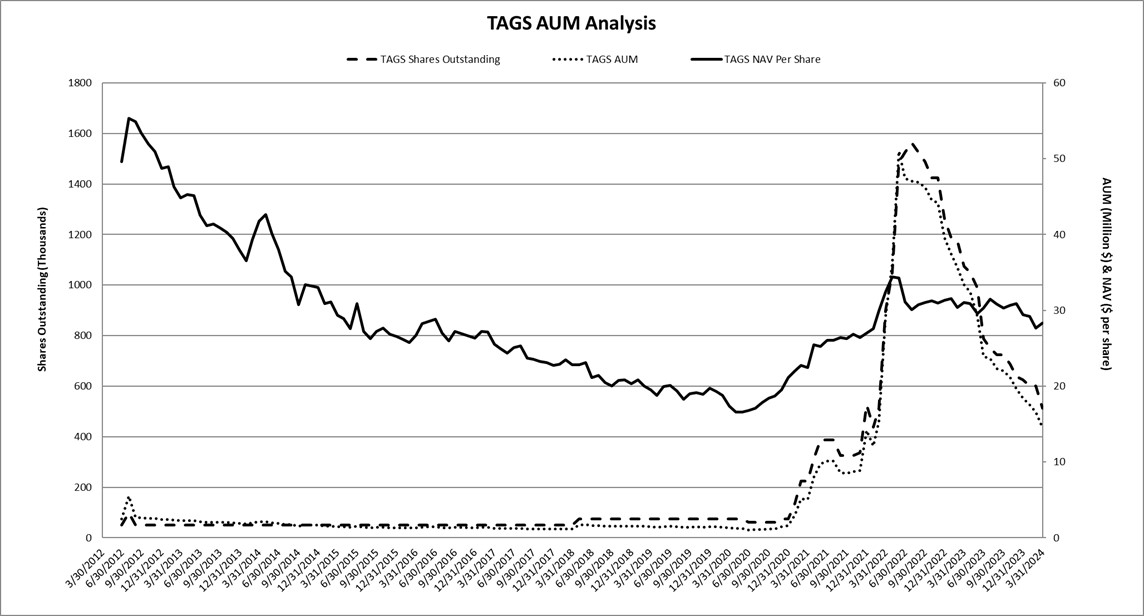
On February 10, 2012, the initial Form S-1S-1 for TAGS was declared effective by the SEC. On March 27, 2012, six Creation Baskets for TAGS were issued representing 300,000 shares and $15,000,000. TAGS began trading on the NYSE Arca on March 28, 2012. On April 30, 2015, a subsequentThe current registration statement for TAGS was declared effective by the SEC.SEC on April 7, 2022. This registration statement for TAGS registered an indeterminate number of shares.
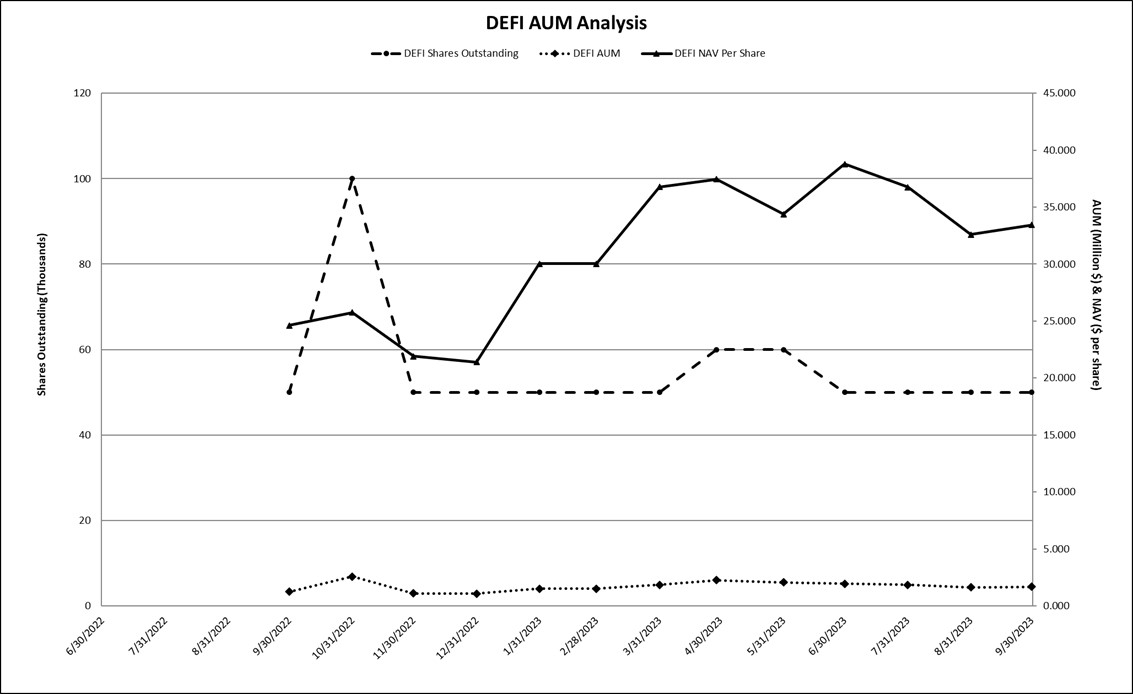
On September 14, 2022, the Form S-1 for DEFI was declared effective by the SEC. This registration statement for DEFI registered an indeterminate number of shares. On September 15, 2022, five Creation Baskets for DEFI were issued representing 50,000 shares and $1,250,000. DEFI began trading on the NYSE Arca on September 16, 2022.
As reported by the registrant on a Form 8-K filed with the Securities and Exchange Commission on November 7, 2023 (File No.001-34765), Teucrium Commodity Trust (the “Teucrium Trust”), on behalf of its series, Hashdex Bitcoin Futures ETF (“Acquired Fund”), and Tidal Commodities Trust I (“Acquiring Trust”), on behalf of its series, Hashdex Bitcoin Futures ETF (“Acquiring Fund”), entered into an Agreement and Plan of Partnership Merger and Liquidation dated as of October 30, 2023 (the “Plan of Merger”). The specific investment objectiveMerger closed on January 3, 2024 (the “Closing Date”).
Pursuant to the Plan of Merger, each Acquired Fund shareholder received one share of the Acquiring Fund for every one share of the Acquired Fund held on the Closing Date based on the net asset value per share of the Acquiring Fund being equal to the net asset value per share of the Acquired Fund determined immediately prior to the Merger closing. Upon the Merger closing, the Acquiring Fund acquired all the assets of the Acquired Fund and information regardingassumed all the organization and operation of each Fund are included in each Fund’s financial statements and accompanying notes, as well as in other sections of this Form 10-Q filing. In general, the investment objective of each Fund is to have the daily changes in percentage terms of its Shares’ Net Asset Value (“NAV”) reflect the daily changes in percentage terms of a weighted averageliabilities of the Acquired Fund via distribution. Upon the Merger closing, settlement prices forthe Plan of Merger caused all of the Acquired Fund’s shares to be cancelled and the Acquired Fund to be liquidated.
The sponsor of the Teucrium Trust, Teucrium Trading, LLC (“Teucrium”), is not receiving any compensation dependent on the consummation of the Merger. Pursuant to a certain Futures Contracts forAmended and Restated ‘33 Act Fund Platform Support Agreement, as amended (the “Support Agreement”) among Tidal Investments LLC (f/k/a Toroso Investments, LLC) (“Tidal”), Tidal ETF Services, LLC, Hashdex Asset Management Ltd., and Teucrium, Tidal has agreed to provide Teucrium after the commodity specified for that Fund. The investment objectiveMerger with a monthly amount equal to the greater of TAGS is to have the daily changes in percentage terms of NAV of its common units (“Shares”) reflect the daily changes in percentage terms of a weighted average (the “Underlying Fund Average”seven percent (7%) of the NAVs per sharemanagement fee paid to Tidal from the Acquiring Fund and 0.04% of four other commodity pools that are seriesmonthly average net assets of the Trust and are sponsored byAcquiring Fund (“Teucrium Compensation”). Any payment of the Sponsor: CORN, WEAT, SOYB, and CANE (collectively, the “Underlying Funds”). The Underlying Fund Average will have a weighting of 25% to each Underlying Fund, and the Fund’s assetsTeucrium Compensation will be rebalanced to maintainmade from the approximate 25% allocation to each Underlyingresources of Tidal and not from the assets of the Acquiring Fund.
Teucrium Trading, LLC is the sponsor (“Sponsor”) of the Trust. The Sponsor is a member of the National Futures Association (the “NFA”) and became a commodity pool operator (“CPO”) registered with the Commodity Futures Trading Commission (the “CFTC”) effective November 10, 2009. The Sponsor registered as a Commodity Trading Advisor (“CTA”) with the CFTC effective September 8, 2017.
The accompanying unaudited financial statements have been prepared in accordance with Rule 10-0110-01 of Regulation S-XS-X promulgated by the SEC and, therefore, do not include all information and footnote disclosures required under accounting principles generally accepted in the United States of America (“GAAP”). The financial information included herein is unaudited; however, such financial information reflects all adjustments which are, in the opinion of management, necessary for the fair presentation of the Trust’s financial statements for the interim period. It is suggested that these interim financial statements be read in conjunction with the audited financial statements and related notes included in the Trust’s Annual Report on Form 10-K,10-K, as well as the most recent Form S-1 filing, as applicable. The operating results for the three and nine months ended September 30, 2017March 31, 2024, are not necessarily indicative of the results to be expected for the full year ending December 31, 2017.2024.
Subject to the terms of the Trust Agreement, Teucrium Trading, LLC in its capacity as the Sponsor (“Sponsor”) of the Trust may terminate a Fund at any time, regardless of whether the Fund has incurred losses, including, for instance, if it determines that the Fund’s aggregate net assets in relation to its operating expenses make the continued operation of the Fund unreasonable or imprudent. However, no level of losses will require the Sponsor to terminate a Fund.
Note 2– Principal Contracts and Agreements
On August 17, 2015 (the “Conversion Date”), U.S. Bank N.A. replaced The Bank of New York Mellon as the Custodian for the Funds. The principal business address for U.S. Bank N.A. is 1555 North RiverCenter Drive, Suite 302, Milwaukee, Wisconsin 53212. U.S. Bank N.A. is a Wisconsin state chartered bank subject to regulation by the Board of Governors of the Federal Reserve System and the Wisconsin State Banking Department. The principal address forSponsor employs U.S. Bancorp Fund Services, LLC, doing business as U.S. Bank Global Fund Services (“USBFS”Global Fund Services”), for Transfer Agency, Fund Accounting and Fund Administration services. The principal address for Global Fund Services is 777 East Wisconsin Avenue,615 E. Michigan Street, Milwaukee, WI 53202. In addition, effective on the Conversion Date, USBFS, a wholly owned subsidiary of U.S. Bank, commenced serving as administrator for each Fund, performing certain administrative and accounting services and preparing certain SEC reports on behalf of the Funds, and also became the registrar and transfer agent for each Fund’s Shares. For such services, U.S. Bank and USBFS will receive an asset-based fee, subject to a minimum annual fee.
For custody services, the Funds will pay to U.S. Bank N.A. 0.0075% of average gross assets up to $1$1 billion, and .0050% of average gross assets over $1$1 billion, annually, plus certain per-transaction charges. For Transfer Agency, Fund Accounting and Fund Administration services, which are based on the total assets for all the Funds in the Trust, the Funds will pay to USBFS 0.06%Global Fund Services 0.05% of average gross assets on the first $250 million, 0.05% on the next $250$500 million, 0.04% on the next $500$500 million, 0.03% on the next $2 billion and 0.03%0.02% on the balance over $1$3 billion annually. A combined minimum annual fee of up to $64,500$47,000 for custody, transfer agency, accounting and administrative services is assessed per Fund.For the three months ended September 30, 2017 and 2016, the Funds recognized $91,666 and $88,672, respectively, for these These services which are recorded inas custodian fees and expenses on the combined statements of operations;operations. A summary of these expenses $7,972 in 2017 and $4,471 in 2016 were waived by the Sponsor.For the nine months ended September 30, 2017 and 2016, the Funds recognized $263,485 and $223,961, respectively, for these services, which were recorded in custodian fees and expenses on the combined statements of operations; of these expenses $12,611 in 2017 and $11,515 in 2016 were waived by the Sponsor.is included below.
The Sponsor employs Foreside Fund Services, LLC (“Foreside” or the “Distributor”) as the Distributor for the Funds. The Distribution Services Agreement among the Distributor and the Sponsor calls for the Distributor to work with the Custodian in connection with the receipt and processing of orders for Creation Baskets and Redemption Baskets and the review and approval of all Fund sales literature and advertising materials. The Distributor and the Sponsor have also entered into a Securities Activities and Service Agreement (the “SASA”) under which certain employees and officers of the Sponsor are licensed as registered representatives or registered principals of the Distributor, under Financial Industry Regulatory Authority (“FINRA”) rules. For its services as the Distributor, Foreside receives a fee of 0.01% of theeach Fund’s average daily net assets and an aggregate annual fee of $100,000 for all Teucrium Funds, along with certain expense reimbursements. For its services under the SASA, Foreside receives a fee of $5,000 per registered representative and $1,000 per registered location. For the three months ended September 30, 2017 and 2016, the Funds recognized$42,782 and $36,423, respectively, for theseThese services which wasare recorded inas distribution and marketing fees on the combined statements of operations;operations. A summary of these expenses $13,582 in 2017 and $1,829 in 2016 were waived by the Sponsor.For the nine months ended September 30, 2017 and 2016, the Funds recognized $136,568 and $110,466, respectively, for these services, which was recorded in distribution and marketing fees on the combined statements of operations; of these expenses $27,719 in 2017 and $4,822 in 2016 were waived by the Sponsor.is included below.
ED&F ManMarex Capital Markets, Inc. (“ED&F Man”Marex”), StoneX Financial Inc. (“StoneX”) servesand Phillip Capital Inc. (“Phillip Capital”) serve as the Underlying Funds’ clearing brokerbrokers to execute and clear the Underlying Funds’ futures contracts and provide other brokerage-related services. ED&F Man isMarex, StoneX and Phillip Capital are each registered as a FCMfutures commission merchants (“FCM”) with the U.S. CFTC and isare members of the NFA. The clearing brokers are registered as broker-dealers with the SEC and are each a member of the NFA. ED&F Man is also registered as a broker/dealer with the U.S. SecuritiesFINRA. Marex, StoneX and Exchange Commission and is a member of the FINRA. ED&F Man is aPhillip Capital are each clearing membermembers of ICE Futures U.S., Inc., Chicago Board of Trade, Chicago Mercantile Exchange, New York Mercantile Exchange, and all other major United States commodity exchanges. For Corn, Soybean, Sugar and Wheat Futures Contracts, ED&F ManMarex is paid $9.00$3.00 per round turn.Forturn exclusive of pass-through fees for the three months ended September 30, 2017exchange and 2016, such expenses, which are recorded in brokeragethe NFA. StoneX is paid $2.50 per round turn exclusive of pass-through fees for the exchange and the NFA. Additionally, if the monthly commissions paid by each Fund does not equal or exceed 16.5% return on the combined statementsStoneX Capital Requirement at 9.6% of operations, totaled $44,377 in 2017 and $30,802 in 2016 for these services and was paid by the Funds.ForExchange Maintenance Margin, each Fund will pay a true up to meet that return at the nine months ended September 30, 2017 and 2016, the Fundsend of each month. These expenses are recognized $121,696 and $82,213, respectively, for these services, which was recorded in brokerage commissionson a per-trade basis. The half-turn is recognized as an unrealized loss on the combined statements of operations, and werea full turn is recognized as a realized loss on the combined statements of operations when a contract is sold. For Bitcoin futures contracts, StoneX is paid $10.00 - $25.00 per half-turn exclusive of pass through fees for by the Funds.exchange and NFA. Phillip Capital is paid $35.00 - $45.00 per half-turn exclusive of pass through fees for the exchange, NFA, execution fees and platform and exchange data fees. A summary of these expenses can be found under the heading, Brokerage Commissions.
The sole Trustee of the Trust is Wilmington Trust Company, a Delaware banking corporation. The Trustee will accept service of legal process on the Trust in the State of Delaware and will make certain filings under the Delaware Statutory Trust Act. For its services, the Trustee receives an annual fee of $3,300 from the Trust. For the three and nine months ended September 30, 2017 and 2016, the Funds recognized $3,072 and $3,039 respectively, for theseThese services which isare recorded in business permits and licenses fees on the combined statements of operations;operations. A summary of these expenses $1,515 in 2017 and $3,039 in 2016 were waived by the Sponsor.is included below.
| | | Three months ended March 31, 2024 | | | Three months ended March 31, 2023 | |
Amount Recognized for Custody Services | | $ | 93,105 | | | $ | 120,560 | |
Amount of Custody Services Waived | | $ | 3,615 | | | $ | 7,329 | |
| | | | | | | | | |
Amount Recognized for Distribution Services | | $ | 36,539 | | | $ | 38,765 | |
Amount of Distribution Services Waived | | $ | 1,527 | | | $ | 2,322 | |
| | | | | | | | | |
Amount Recognized for Wilmington Trust | | $ | - | | | $ | - | |
Amount of Wilmington Trust Waived | | $ | - | | | $ | - | |
Note 3– Summary of Significant Accounting Policies
Basis of Presentation
The accompanying financial statements have been prepared on a combined basis in conformity with accounting principles generally accepted in the United States of America (“U.S. GAAP”) as detailed in the Financial Accounting Standards Board’s Accounting Standards Codification and include the accounts of the Trust, CORN, CANE, SOYB, WEAT, TAGS and TAGS.DEFI. Refer to the accompanying separate financial statements for each Fund for more detailed information. For theThe periods represented by the financial statements herein the operations of the Trust contain the results of CORN, SOYB, CANE, WEAT, TAGS and TAGS except for eliminations for TAGS as explained belowDEFI for the months during which each Fund was in operation.operation, except for eliminations for TAGS as explained below.
Given the investment objective of TAGS as described in Note 1 above, TAGS will buy, sell, and hold, as part of its normal operations, shares of the four Underlying Agricultural Funds. The Trust eliminates the shares of the other series of the Trust owned by the Teucrium Agricultural FundTAGS from its combined statements of assets and liabilities. The Trust eliminates the net change in unrealized appreciation or depreciation on securities owned by the Teucrium Agricultural FundTAGS from its combined statements of operations. The combined statements of changes in net assets and cash flows present a net presentation of the purchases and sales of the Underlying Funds ofby TAGS.
Revenue Recognition
Commodity and cryptocurrency futures contracts are recorded on the trade date. All such transactions are recorded on the identified cost basis and marked to market daily. Unrealized appreciation or depreciation on commodity and cryptocurrency futures contracts are reflected in the combined statements of operations as the difference between the original contract amount and the fair market value as of the last business day of the year or as of the last date of the financial statements. Changes in the appreciation or depreciation between periods are reflected in the combined statements of operations. Interest on cash equivalents with financial institutions are recognized on thean accrual basis. The Funds earn interest on funds held at the custodian and other financial institutions at prevailing market rates for such investments.
The Sponsor invests a portion of cash in commercial paper, which is deemed a cash equivalent based on the rating and duration of contracts as described in the notes to the combined financial statements and reflected in cash and cash equivalents on the combined statements of assets and liabilities and on the combined statements of cash flows. Accretion on these investments is recognized using the effective interest method in U.S. dollars and included in interest income on the combined statements of operations.
The Sponsor invests a portion of the cash held by the broker in short term Treasury Bills as collateral for open futures contracts. Accretion on these investments is recognized using the effective interest method in U.S. dollars and included in interest income on the combined statements of operations.
Brokerage Commissions
BrokerageThe Sponsor recognizes the expense for brokerage commissions for futures contract trades on all open commodity futures contracts are accrueda per-trade basis. The below table shows the amounts included on the trade date combined statements of operations as total brokerage commissions paid inclusive of unrealized loss for the three months ended March 31, 2024 and on a full-turn basis.2023.
| | | CORN | | | SOYB | | | CANE | | | WEAT | | | TAGS | | | DEFI | | | TRUST | |
Three months ended March 31, 2024 | | $ | 9,706 | | | $ | 4,158 | | | $ | 2,008 | | | $ | 15,580 | | | $ | - | | | $ | 192 | | | $ | 31,644 | |
Three months ended March 31, 2023 | | $ | 17,270 | | | $ | 6,340 | | | $ | 6,055 | | | $ | 21,746 | | | $ | - | | | $ | 609 | | | $ | 52,020 | |
Income Taxes
The Trust is organized and will be operated as a Delaware statutory trust, is considered a trust fortrust. For federal income tax purposes, and is, thus, a pass through entity. For tax purposes, the Fundseach Fund will be treated as partnerships.a publicly traded partnership. A publicly traded partnership is generally treated as a corporation for federal income tax purposes unless 90% or more of the publicly traded partnership’s gross income for each taxable year of its existence consists of qualifying income as defined in section 7704(d) of the Internal Revenue Code of 1986, as amended. Qualifying income is defined as generally including, in pertinent part, interest (other than from a financial business), dividends, and gains from the sale or disposition of capital assets held for the production of interest or dividends. In the case of a partnership of which a principal activity is the buying and selling of commodities, other than as inventory, or of futures, forwards and options with respect to commodities, qualifying income also includes income and gains from commodities and from futures, forwards, options with respect to commodities and, provided the partnership is a trader or investor with respect to such assets, swaps and other notional principal contracts with respect to commodities. Each Fund expects that at least 90% of the Fund’s gross income for each taxable year will consist of qualifying income and that the Fund will be taxed as a partnership for federal income tax purposes. Therefore, the Funds do not record a provision for income taxes because the shareholders report their share of a Fund’s income or loss on their income tax returns. The financial statements reflect the Funds’ transactions without adjustment, if any, required for income tax purposes.
The Funds are required to determine whether a tax position is more likely than not to be sustained upon examination by the applicable taxing authority, including resolution of any related appeals or litigation processes, based on the technical merits of the position. The Funds file income tax returns in the U.S. federal jurisdiction and may file income tax returns in various U.S. states and foreign jurisdictions. For all tax years 20142021 to 2016,2023, the Funds remain subject to income tax examinations by major taxing authorities. The tax benefit recognized is measured as the largest amount of benefit that has a greater than fifty percent likelihood of being realized upon ultimate settlement. De-recognition of a tax benefit previously recognized results in the Funds recording a tax liability that reduces net assets. Based on their analysis, the Funds have determined that they have not incurred any liability for unrecognized tax benefits as of September 30, 2017March 31, 2024, and for the years ended December 31, 2016, 2015,2023, 2022 and 2014.2021. However, the Funds’ conclusions regarding this policy may be subject to review and adjustment at a later date based on factors including, but not limited to, ongoing analysis of and changes to tax laws, regulations, and interpretations thereof.
There is very limited authority on the U.S. federal income tax treatment of bitcoin and no direct authority on bitcoin derivatives, such as Bitcoin Futures Contracts. Bitcoin Futures Contracts more likely than not will be considered futures with respect to commodities for purposes of the qualifying income exception under section 7704 of the Code. Based on a CFTC determination that treats bitcoin as a commodity under the CEA, the Fund intends to take the position that Bitcoin Futures Contracts consist of futures on commodities for purposes of the qualifying income exception under section 7704 of the Code. Shareholders should be aware that the Fund’s position is not binding on the IRS, and no assurance can be given that the IRS will not challenge the Fund’s position, or that the IRS or a court will not ultimately reach a contrary conclusion, which would result in the material adverse consequences to Shareholders and the Fund.
The Funds recognize interest accrued related to unrecognized tax benefits and penalties related to unrecognized tax benefits in income tax fees payable, if assessed. No interest expense or penalties have been recognized as of and for the three and nine months ended September 30, 2017 March 31, 2024 and 2016.2023.
The Funds may be subject to potential examination by U.S. federal, U.S. state, or foreign jurisdictional authorities in the area of income taxes. These potential examinations may include questioning the timing and amount of deductions, the nexus of income among various tax jurisdictions, and compliance with U.S. federal, U.S. state and foreign tax laws. The Funds’ management does not expect that the total amount of unrecognized tax benefits will materially change over the next twelve months.
Creations and Redemptions
Authorized Purchasers may purchase Creation Baskets from each Fund. The amount of the proceeds required to purchase a Creation Basket will be equal to the NAV of the shares in the Creation Basket determined as of 4:00 p.m. New York(ET) time on the day the order to create the basket is properly received.received in good order.
Authorized Purchasers may redeem shares from each Fund only in blocks of shares called “Redemption Baskets.” The amount of the redemption proceeds for a Redemption Basket will be equal to the NAV of the shares in the Redemption Basket determined as of 4:00 p.m. New York time(ET) on the day the order to redeem the basket is properly received.received in good order.
Each Fund receives or pays the proceeds from shares sold or redeemed within three business days after the trade date of the purchase or redemption. The amounts due from Authorized Purchasers are reflected in the statements of assets and liabilities as receivable forcapital shares sold.receivable. Amounts payable to Authorized Purchasers upon redemption are reflected in the statements of assets and liabilities as payable for shares redeemed.
There are a minimum number of baskets and associated Shares specified for each Fund in the Fund’s respective prospectus, as amended from time to time. If a Fund experienced redemptions that caused the number of Shares outstanding to decrease to the minimum level of Shares required to be outstanding, until the minimum number of Shares is again exceeded through the purchase of a new Creation Basket, there can be no more redemptions by an Authorized Purchaser. These minimum levels are as follows:
CORN: 50,000 shares representing 2 baskets
SOYB: 50,000 shares representing 2 baskets
CANE: 50,000 shares representing 2 baskets
WEAT: 50,000 shares representing 2 baskets
TAGS: 50,000 shares representing 24 baskets (at minimum level as of September 30, 2017 and December 31, 2016)
DEFI: 50,000 shares representing 5 baskets
Cash and Cash Equivalents
Cash equivalents are highly-liquidhighly liquid investments with original maturity dates of 90 days or less when acquired. The Trust reported its cash equivalents in the combined statements of assets and liabilities at market value, or at carrying amounts that approximate fair value, because of their highly-liquidhighly liquid nature and short-term maturities. Each Fund that is a series of the Trust has the balance of its assetscash equivalents on deposit with banks.financial institutions. The Trust hadholds a balance of $2,318,065 and $1,412,423 in money market funds at September 30, 2017 and December 31, 2016, respectively; these balances arethat is included in cash and cash equivalents on the combined statements of assets and liabilities. Effective in the second quarter 2015, theThe Sponsor investedinvests a portion of the available cash for the Funds in alternative demand-depositdemand deposit savings accounts, which isare classified as cash and not as cash equivalents. The Funds had a balance of $152,013,174 on September 30, 2017 and $143,915,277 on December 31, 2016 in demand-deposit savings accounts. This change resulted in a reduction in the balance held in money market funds. Assets deposited with the bank may, at times, exceed federally insured limits. The Sponsor invests a portion of the available cash for the Funds in investment grade commercial paper with durations of 90 days or less, which is classified as a cash equivalent and is not FDIC insured. The Sponsor may invest a portion of the cash held by the broker in short term Treasury Bills as collateral for open futures contracts, which is classified as a cash equivalent and is not FDIC insured.
| | | March 31, 2024 | | | December 31, 2023 | |
Money Market Funds | | $ | 105,660,004 | | | $ | 120,047,840 | |
Demand Deposit Savings Accounts | | | 29,533,538 | | | | 29,148,056 | |
Commercial Paper | | | 118,502,058 | | | | 143,041,466 | |
Total cash and cash equivalents as presented on the combined Statement of Assets and Liabilities | | $ | 253,695,600 | | | $ | 292,237,362 | |
Restricted CashPayable for Purchases of Commercial Paper
On August 17, 2015 (the “Conversion Date”), U.S. Bank N.A. replaced The Bank of New York Mellonamount recorded by the Trust for commercial paper transactions awaiting settlement represents the amount payable for contracts purchased but not yet settled as the Custodian for the Funds. Per the amended agreement between the Sponsor and The Bank of New York Mellon dated August 14, 2015, certain cash amounts for each Fund, except in the case of TAGS, are to remain at The Bank of New York Mellon until amounts for services and early termination fees are paid. The amended agreement allows for payments for such amounts owed to be made through December 31, 2017. Cash balances that are held in custody at The Bank of New York Mellon under this amended agreement are reflected on the combined statements of assets and liabilities of the Fundreporting date. The value of the contract is included in cash and cash equivalents, and the Trustpayable amount is included as restricted cash.a liability.
Due from/to Broker
The amount recorded by the Trust for the amount due from and to the clearing broker includes, but is not limited to, cash held by the broker, amounts payable to the clearing broker related to open transactions, and payables for commodities futures accounts liquidating to an equity balance on the clearing broker’s records.records, and amounts of brokerage commissions paid and recognized as unrealized losses.
Margin is the minimum amount of funds that must be deposited by a commodity interest trader with the trader’s broker to initiate and maintain an open position in futures contracts. A margin deposit acts to assure the trader’s performance of the futures contracts purchased or sold. Futures contracts are customarily bought and sold on initial margin that represents a very small percentage of the aggregate purchase or sales price of the contract. Because of such low margin requirements, price fluctuations occurring in the futures markets may create profits and losses that, in relation to the amount invested, are greater than are customary in other forms of investment or speculation. As discussed below, adverse price changes in the futures contract may result in margin requirements that greatly exceed the initial margin. In addition, the amount of margin required in connection with a particular futures contract is set from time to time by the exchange on which the contract is traded and may be modified from time to time by the exchange during the term of the contract. Brokerage firms, such as the Funds’ clearing brokers, carrying accounts for traders in commodity interest contracts generally require higher amounts of margin as a matter of policy to further protect themselves. Over-the-counterOver the counter trading generally involves the extension of credit between counterparties, so the counterparties may agree to require the posting of collateral by one or both parties to address credit exposure.
When a trader purchases an option, there is no margin requirement; however, the option premium must be paid in full. When a trader sells an option, on the other hand, he or she is required to deposit margin in an amount determined by the margin requirements established for the underlying interest and, in addition, an amount substantially equal to the current premium for the option. The margin requirements imposed on the selling of options, although adjusted to reflect the probability that out-of-the-money options will not be exercised, can in fact be higher than those imposed in dealing in the futures markets directly. Complicated margin requirements apply to spreads and conversions, which are complex trading strategies in which a trader acquires a mixture of options positions and positions in the underlying interest.
Ongoing or “maintenance” margin requirements are computed each day by a trader’s clearing broker. When the market value of a particular open futures contract changes to a point where the margin on deposit does not satisfy maintenance margin requirements, a margin call is made by the broker. If the margin call is not met within a reasonable time, the broker may close out the trader’s position. With respect to the Funds’ trading, the Funds (and not their shareholders personally) are subject to margin calls.
Finally, many major U.S. exchanges have passed certain cross margining arrangements involving procedures pursuant to which the futures and options positions held in an account would, in the case of some accounts, be aggregated, and margin requirements would be assessed on a portfolio basis, measuring the total risk of the combined positions.
Payable/Receivable for Securities Purchased/Sold
Due from/to broker for investments in securities are securities transactions pending settlement. The Trust and the Funds are subject to credit risk to the extent any broker with whom it conducts business is unable to fulfill contractual obligations on its behalf. The management of the Trust and the Funds monitors the financial condition of such brokers and does not anticipate any losses from these counterparties. Since the inception of the Fund, theThe principal broker through which the Trust and TAGS clearcan execute securities transactions for TAGS is theU.S. Bank of New York Mellon Capital Markets.N.A.
Sponsor Fee, Allocation of Expenses and Related Party Transactions
The Fund’s sponsor is Teucrium Trading, LLC (the “Sponsor”). The Sponsor is responsible for investing the assets of the FundsFund in accordance with the objectives and policies of eachthe Fund. In addition, the Sponsor arranges for one or more third parties to provide administrative, custodial, accounting, transfer agency, compliance, and other necessary services to the Trust and the Funds. In addition, the Sponsor elected not to outsourceFund, including services directly attributable to the Trust and the FundsFund such as accounting, financial reporting, regulatory compliance, and trading activities. In some cases, at its discretion, the Sponsor may elect not to outsource certain of these expenses.
In addition, the Agricultural Funds, except for TAGS, which has no such fee are contractually obligated to pay a monthly management fee to the Sponsor, based on average daily net assets, at a rate equal to 1.00% per annum.
The Agricultural Funds generally pay for all brokerage fees, taxes, and other expenses, including licensing fees for the use of intellectual property, registration or other fees paid to the SEC, FINRA (formerly the National Association of Securities Dealers)Financial Industry Regulatory Authority (“FINRA”), or any other regulatory agency in connection with the offer and sale of subsequent Shares after its initial registration and all legal, accounting, printing and other expenses associated therewith. The FundsEach Fund also paypays its portion of the fees and expenses associated with the Trust’s tax accounting and reporting requirements. Certain aggregate expenses common to all Funds within the Trust are allocated by the Sponsor to the respective FundFunds based on activity drivers deemed most appropriate by the Sponsor for such expenses, including but not limited to relative assets under management and creation and redeem order activity.
These aggregate common expenses include, but are not limited to, legal, auditing, accounting and financial reporting, tax-preparation, regulatory compliance, trading activities, and insurance costs, as well as fees paid to the Distributor, which are included in the related line item in the combined statements of operations. A portion of these aggregate common expenses are related to services provided by the Sponsor or related parties of principals of the Sponsor; these are necessary services to the Trust and the Funds, which are primarily the cost of performing accounting and financial reporting, regulatory compliance, and trading activities that are directly attributable to the TrustFunds and the Funds. For the three months ended September 30, 2017 and 2016; such expenses, which are, primarily, included as distribution and marketing fees totaled $454,469on the statements of operations. These amounts, for the Trust and $415,328 respectively;for each Fund, are detailed in the notes to the financial statements included in Part I of these amounts, $169,163this filing.
DEFI is contractually obligated to pay a monthly management fee to the Sponsor, based on average daily net assets, at a rate equal to 0.94% per annum. From the Management Fee, the Sponsor pays all of the routine operational, administrative and other ordinary expenses of the Fund, generally as determined by the Sponsor, including but not limited to, fees and expenses of the Administrator, Custodian, Distributor, Transfer Agent, licensors, accounting and audit fees expenses, tax preparation expenses, legal fees, ongoing SEC registration fees, individual Schedule K-1 preparation and mailing fees, and report preparation and mailing expenses. These fees and expenses are not included in 2017the breakeven table because they are paid for by the Sponsor through the proceeds from the Management Fee. The Fund pays all of its non-recurring and $160,317 in 2016, were waivedunusual fees and expenses, if any, as determined by the Sponsor. For the nine months ended September 30, 2017Non-recurring and 2016;unusual fees and expenses are unexpected or unusual in nature, such as legal claims and liabilities and litigation costs or indemnification or other unanticipated expenses. Extraordinary fees and expenses also include material expenses which are primarily included as distributionnot currently anticipated obligations of the Fund. Routine operational, administrative, and marketing fees, totaled $1,747,602 in 2017 and $1,417,388 in 2016; of these amounts, $292,825 in 2017 and $204,372 in 2016 were waived by the Sponsor. All asset-based fees andother ordinary expenses for the Funds are calculated on the prior day’s net assets.not deemed extraordinary expenses.
| | | Three months ended March 31, 2024 | | | Three months ended March 31, 2023 | |
Recognized Related Party Transactions | | $ | 614,406 | | | $ | 591,603 | |
Waived Related Party Transactions | | $ | 25,585 | | | $ | 23,865 | |
The Sponsor has the ability to elect to pay certain expenses on behalf of the Funds or waive the management fee. This election is subject to change by the Sponsor, at its discretion. Expenses paid by the Sponsor and Management fees waived by the Sponsor are, if applicable, presented as waived expenses in the statements of operations for each Fund.
For the three months ended September 30, 2017, there were $284,299 of expenses that were on the combined statements of operations of the Trust as expenses that were waived by the Sponsor. These were specifically: $95,836 for CORN, $31,348 for SOYB, $45,186 for CANE, $105,942 for WEAT and $5,987 for TAGS. The Sponsor has determined that there wouldwill be no recovery sought for thesethe amounts below in any future period.
For the three months ended September 30, 2016, there were $304,726 of expenses that were on the combined statements of operations of the Trust as expenses that were waived by the Sponsor. These were specifically: $134,161 for CORN, $63,113 for SOYB, $48,043 for CANE, $49,516 for WEAT and $9,893 for TAGS. The Sponsor has determined that there would be no recovery sought for these amounts in any future period.
| | | CORN | | | SOYB | | | CANE | | | WEAT | | | TAGS | | | DEFI | | | TRUST | |
Three months ended March 31, 2024 | | $ | - | | | $ | - | | | $ | - | | | $ | - | | | $ | 69,538 | | | $ | 62,309 | | | $ | 131,847 | |
Three months ended March 31, 2023 | | $ | - | | | $ | - | | | $ | - | | | $ | - | | | $ | 125,494 | | | $ | 70,570 | | | $ | 196,064 | |
For the nine months ended September 30, 2017 there were $545,764 of expenses that were on the combined statements of operations of the Trust as expenses that were waived by the Sponsor. These were specifically: $264,656 for CORN, $58,457 for SOYB, $83,550 for CANE, $105,942 for WEAT and $33,159 for TAGS. The Sponsor has determined that there would be no recovery sought for these amounts in any future period.
For the nine months ended September 30, 2016, there were $403,282 of expenses that were on the combined statements of operations of the Trust as expenses that were waived by the Sponsor. These were specifically: $134,161 for CORN, $63,113 for SOYB, $121,429 for CANE, $49,516 for WEAT and $35,063 for TAGS. The Sponsor has determined that there would be no recovery sought for these amounts in any future period.
As of August 21, 2017, Mr. Miller no longer retains an ownership interest in the Sponsor which is equal to or greater than 10%, and, thus, is no longer a principal of the Sponsor as defined by the rules of the Commodity Futures Trading Commission.
Use of Estimates
The preparation of financial statements in conformity with U.S. GAAP requires management to make estimates and assumptions that affect the reported amountamounts of assets and liabilities and disclosure of contingent assets and liabilities at the date of the financial statements, and the reported amounts of the revenue and expenses during the reporting period. Actual results could differ from those estimates.
Fair Value - Definition and Hierarchy
In accordance with U.S. GAAP, fair value is defined as the price that would be received to sell an asset or paid to transfer a liability (i.e., the “exit price”) in an orderly transaction between market participants at the measurement date.
In determining fair value, the Trust uses various valuation approaches. In accordance with U.S. GAAP, a fair value hierarchy for inputs is used in measuring fair value that maximizes the use of observable inputs and minimizes the use of unobservable inputs by requiring that the most observable inputs be used when available. Observable inputs are those that market participants would use in pricing the asset or liability based on market data obtained from sources independent of the Trust. Unobservable inputs reflect the Trust’s assumptions about the inputs market participants would use in pricing the asset or liability developed based on the best information available in the circumstances. The fair value hierarchy is categorized into three levels based on the inputs as follows:
Level 1 - Valuations based on unadjusted quoted prices in active markets for identical assets or liabilities that the Trust has the ability to access. Valuation adjustments and block discounts are not applied to Level 1 futures contracts held by CORN, SOYB, CANE, WEAT and WEAT,DEFI, the securities of the Underlying Funds held by TAGS, and any other securities held by any Fund, together referenced throughout this filing as “financial instruments.” Since valuations are based on quoted prices that are readily and regularly available in an active market, valuation of these securities does not entail a significant degree of judgment.
Level 2 - Valuations based on quoted prices in markets that are not active or for which all significant inputs are observable, either directly or indirectly.
Level 3 - Valuations based on inputs that are unobservable and significant to the overall fair value measurement.
The availability of valuation techniques and observable inputs can vary from financial instrument to financial instrument and is affected by a wide variety of factors including, the type of financial instrument, whether the financial instrument is new and not yet established in the marketplace, and other characteristics particular to the transaction. To the extent that valuation is based on models or inputs that are less observable or unobservable in the market, the determination of fair value requires more judgment. Those estimated values do not necessarily represent the amounts that may be ultimately realized due to the occurrence of future circumstances that cannot be reasonably determined. Because of the inherent uncertainty of valuation, those estimated values may be materially higher or lower than the values that would have been used had a ready market for the financial instruments existed. Accordingly, the degree of judgment exercised by the Fund in determining fair value is greatest for financial instruments categorized in Level 3. In certain cases, the inputs used to measure fair value may fall into different levels of the fair value hierarchy. In such cases, for disclosure purposes, the level in the fair value hierarchy, within which the fair value measurement in its entirety falls, is determined based on the lowest level input that is significant to the fair value measurement.
Fair value is a market-based measure considered from the perspective of a market participant rather than an entity-specific measure. Therefore, even when market assumptions are not readily available, the Trust’s own assumptions are set to reflect those that market participants would use in pricing the asset or liability at the measurement date. The Trust uses prices and inputs that are current as of the measurement date, including periods of market dislocation. In periods of market dislocation, the observability of prices and inputs may be reduced for many financial instruments. This condition could cause a financial instrument to be reclassified to a lower level within the fair value hierarchy. For instance, when Corn Futures Contracts on the Chicago Board of Trade (“CBOT”) are not actively trading due to a “limit-up” or ‘limit-down” condition, meaning that the daily change in the Corn Futures Contracts has exceeded the limits established, the Trust and the Fund will revert to alternative verifiable sources of valuation of its assets. When such a situation exists on a quarter close, the Sponsor will calculate the NAV on a particular day using the Level 1 valuation but will later recalculate the NAV for the impacted Fund based upon the valuation inputs from these alternative verifiable sources (Level 2 or Level 3)3) and will report such NAV in its applicable financial statements and reports.
On September 30, 2017March 31, 2024 and December 31, 2016,2023, in the opinion of the Trust, the reported value at the close of the market for each commodity and cryptocurrency contract fairly reflected the value of the futures and no alternative valuations were required. The determination is made as of the settlement of the futures contracts on the last day of trading for the reporting period. In making the determination of a Level 1 or Level 2 transfer, the Funds consider the average volume of the specific underlying futures contracts traded on the relevant exchange for the periods being reported.
For the ninethree months ended September 30, 2017March 31, 2024 and year ended December 31, 2016,2023, the Funds did not have any significant transfers between any of the levels of the fair value hierarchy.
The Funds and the Trust record their derivative activities at fair value. Gains and losses from derivative contracts are included in the statements of operations. Derivative contracts include futures contracts related to commodity prices. Futures, which are listed on a national securities exchange, such as the CBOT and the ICE, or reported on another national market, are generally categorized in Level 1 of the fair value hierarchy. OTC derivatives contracts (such as forward and swap contracts), which may be valued using models, depending on whether significant inputs are observable or unobservable, are categorized in Levels 2 or 3 of the fair value hierarchy.
Investments in the securities of the Underlying Funds are freely traded and listed on the NYSE Arca. These investments are valued at the NAV of the Underlying Fund as of the valuation date as calculated by the administrator based on the exchange-quoted prices of the commodity futures contracts held by the Underlying Fund.
Expenses
Expenses are recorded using the accrual method of accounting.
New Accounting Pronouncements
The Financial Accounting Standards Board (“FASB”) issued Accounting Standards Update (“ASU”) 2017-13, “Revenue Recognition (Topic 605), Leases (Topic 840), and Leases (Topic 842):issued ASU 2023-06 – Disclosure Improvements: Codification Amendments to SEC Paragraphs Pursuantin Response to the Staff Announcement atSEC’s Disclosure Update and Simplification Initiative. The amendments require an entity to disclose its accounting policy for where cash flows associated with derivative instruments and their related gains and losses are presented. The Trust and Funds already disclose the July 20,2017 EITF Meetingaccounting policy related to the derivative gains and Rescissionlosses presented on the cash flow statement. The amendment was adopted early for the period ended December 31, 2023. There is no impact to the financial statements of Prior SEC Staff Announcements and Observer Comments”the Trust or the Funds.
The FASB issued ASU 2023-01, related to Leases – (Topic 842). The amendment amendsresponse to concerns about applying Topic 842 to related party arrangements between entities under common control. The update was adopted early for the earlyquarter ended March 31, 2023; the adoption date option for certain companies related to adoption of ASU No. 2014-09 and ASU No. 2016-02. The SEC staff stated the SEC would did not object to a public business entity that otherwise would not meet the definition of a public business entity except for a requirement to include or the inclusion of its financial statements or financial information in another entity’s filing with the SEC adopting ASC Topic 842 for fiscal years beginning after December 15, 2019, and interim periods within fiscal years beginning after December 15, 2020. This amendment is not expected to have a material impact on the financial statements and disclosures of the Trust or the Funds.
The FASB issued ASU 2017-12, “Derivatives and Hedging (Topic 815): Targeted Improvements to Accounting for Hedging Activities”. These amendments refine and expand hedge accounting for both financial (e.g., interest rate) and commodity risks. Its provisions create more transparency around how economic results are presented, both on the face
Table of the financial statements and in the footnotes. It also makes certain targeted improvements to simplify the application of hedge accounting guidance. The amendments are effective for public business entities for fiscal years beginning after December 15, 2018 and interim periods within those fiscal years. The Trust and the Funds are currently evaluating the impact on the financial statements and disclosures; but, based on our review to date, we do not expect the update will have a material impact on the financial statements and disclosures of the Trust or the Funds.The FASB issued ASU 2017-03, “Accounting Changes and Error Corrections (Topic 250) and Investments – Equity Method and Joint Ventures (Topic 323)”. These amendments require disclosure of the impact that recently issued accounting standards will have on the financial statements of a registrant when such standards are adopted in a future period. The adoption did not have a material impact on the financial statements and disclosures of the Trust or the Funds.
The FASB issued ASU 2017-01, “Business Combinations (Topic 805): Clarifying the Definition of a Business”. The amendments are intended to help companies and other organizations evaluate whether transactions should be accounted for as acquisitions (or disposals) of assets or businesses. The amendments are effective for public companies for annual periods beginning after December 15, 2017, including interim periods within those periods. The Trust and the Funds are currently evaluating the impact on the financial statements and disclosures; but, based on our review to date, we do not expect the update will have a material impact on the financial statements and disclosures of the Trust or the Funds.
The FASB issued ASU 2016-19, “Technical Corrections and Improvements”. The amendments in this update represent changes to clarify, correct errors, or make minor improvements to the Accounting Standards Codification. The amendments make the Accounting Standards Codification easier to understand and easier to apply by eliminating inconsistencies and providing clarifications. The amendments are effective for fiscal years, and interim periods with those fiscal years, for all entities beginning after December 15, 2016. The adoption did not have a material impact on the financial statements and disclosures of the Trust or the Funds.
The FASB issued ASU 2016-18, “Statement of Cash Flows (Topic 230)”. The amendments in this update require that a statement of cash flows explain the change during the period in the total of cash, cash equivalents, and amounts generally described as restricted cash or restricted cash equivalents. Therefore, amounts generally described as restricted cash and restricted cash equivalents should be included with cash and cash equivalents when reconciling the beginning-of-period and end-of-period total amounts shown on the statement of cash flows. The amendments are effective for fiscal years beginning after December 15, 2017, and interim periods within those fiscal years. This update is not expected to have a material impact on the financial statements and disclosures of the Trust or the Funds. The Sponsor believes there will be a change in presentation of restricted cash on the statements of cash flows.
Contents
The FASB issued ASU 2016-17, “Consolidation (Topic 810): Interests Held through Related Parties That are under Common Control”. The amendments in this update alters how a decision maker needs to consider indirect interests in a variable interest entity (VIE) held through an entity under common control. The new guidance amends ASU 2015-02, Consolidation (Topic 810): Amendments to the Consolidation Analysis, issued in February 2015. The amendments are effective for fiscal years beginning after December 15, 2016, including interim periods within those fiscal years. The adoption did not have a material impact on the financial statements and disclosures of the Trust or the Funds.
The FASB issued ASU 2016-15, “Statement of Cash Flows (Topic 230): Classification of Certain Cash Receipts and Cash Payments”. The amendments provide cash flow statement classification guidance. The amendments in this update are effective for fiscal years beginning after December 15, 2017. The Trust and the Funds are currently evaluating the impact on the financial statements and disclosures, but do not expect the adoption to have a material impact on the financial statements and disclosures of the Trust or the Funds. The Trust and the Funds do not expect to adopt the guidance until the effective date.
The FASB issued ASU 2014-09 in May 2014, “Revenue from Contracts with Customers (Topic 606),” which replaces the revenue recognition requirements of “Revenue Recognition (Topic 605).” This ASU is based on the principle that revenue is recognized to depict the transfer of goods and services to customers in an amount that reflects the consideration to which the entity expects to be entitled in exchange for those goods or services. This ASU provides new and more detailed guidance on specific topics and expands and improves disclosures about revenue. In August 2015, the FASB issued ASU 2015-14 which defers the effective date of ASU 2014-09 by one year to fiscal years beginning after December 15, 2017. ASU 2015-14 also permits early adoption of ASU 2014-09, but not before the original effective date, which was for fiscal years beginning after December 15, 2016. The Trust and the Funds record income or loss from the recognition and measurement of futures contracts and from interest income under Subtopic 825-10. Revenue from financial instruments which are valued under Subtopic 825 will not be subject to the application of ASU 2014-09 and 2015-14. Therefore, these standards will not have a material impact on the financial statements and disclosures of the Trust or the Funds.
The FASB issued ASU 2016-11, “Revenue Recognition (Topic 605) and Derivatives and Hedging (Topic 815): Rescission of SEC Guidance Because of Accounting Standards Updates 2014-09 and 2014-16 Pursuant to Staff Announcements at the March 3, 2016 EITF Meeting”. The amendments make targeted improvements to clarify the principal versus agent assessment and are intended to make the guidance more operable and lead to more consistent application. The Trust and the Funds record income or loss from the recognition and measurement of futures contracts and from interest income under Subtopic 825-10. Revenue from financial instruments which are valued under Subtopic 825 will not be subject to the application of ASU 2016-11. Therefore, this standard will not have a material impact on the financial statements and disclosures of the Trust or the Funds.
The FASB issued ASU 2016-02, “Leases (Topic 842).” The amendments in this update increase transparency and comparability among organizations by recognizing lease assets and lease liabilities on the balance sheet and disclosing key information about leasing arrangements. The amendments in this update are effective for fiscal years beginning after December 15, 2018. This update is not expected to have a material impact on the financial statements and disclosures of the Trust or the Funds.
The FASB issued ASU 2016-01, “Financial Instruments-Overall (Subtopic 825-10): Recognition and Measurement of Financial Assets and Financial Liabilities.” The amendments in this update are intended to improve the recognitions measurement and disclosure of financial instruments. The amendments to this update are effective for fiscal years beginning after December 15, 2017, and interim periods within those fiscal years. These amendments are required to be applied prospectively. The Trust and the Fund are currently evaluating the impact on the financial statements and disclosures; but based on our review to date we do not expect the update will have a material impact on the financial statements and disclosures of the Trust or the Funds.
Note 4– Fair Value Measurements
The Trust’s assets and liabilities recorded at fair value have been categorized based upon a fair value hierarchy as described in the Trust’s significant accounting policies in Note 3. The following table presents information about the Trust’s assets and liabilities measured at fair value as of September 30, 2017March 31, 2024 and December 31, 2016:2023:
September 30, 2017
| | | | | | | | | Balance as of | | |
| Assets: | | Level 1 | | Level 2 | | Level 3 | | September 30, 2017 | | | Level 1 | | | Level 2 | | | Level 3 | | | Balance as of March 31, 2024 | |
| Cash equivalents | | $ | 2,318,065 | | $ | — | | $ | — | | $ | 2,318,065 | | |
| Commodity futures contracts | | | | | | | | | | |
Cash Equivalents | | | $ | 224,162,062 | | | $ | - | | | $ | - | | | $ | 224,162,062 | |
Commodity Futures Contracts | | | | | | | | | | |
| Corn futures contracts | | 68,413 | | — | | — | | 68,413 | | | 154,412 | | | - | | | - | | | 154,412 | |
| Soybean futures contracts | | 135,175 | | — | | — | | 135,175 | | |
| Sugar futures contracts | | 14,067 | | — | | — | | 14,067 | | |
| Wheat futures contracts | | | 296,562 | | | — | | | — | | | 296,562 | | | 1,513,306 | | | - | | | - | | | 1,513,306 | |
| Total | | $ | 2,832,282 | | $ | — | | $ | — | | $ | 2,832,282 | | | $ | 225,829,780 | | | $ | - | | | $ | - | | | $ | 225,829,780 | |
| | | | | | | | | | | | Balance as of | |
| Liabilities: | | Level 1 | | | Level 2 | | | Level 3 | | | September 30, 2017 | |
| Commodity futures contracts | | | | | | | | | | | | | | | | |
| Corn futures contracts | | $ | 2,498,213 | | | $ | — | | | $ | — | | | $ | 2,498,213 | |
| Sugar futures contracts | | | 218,456 | | | | — | | | | — | | | | 218,456 | |
| Wheat futures contracts | | | 4,065,500 | | | | — | | | | — | | | | 4,065,500 | |
| Total | | $ | 6,782,169 | | | $ | — | | | $ | — | | | $ | 6,782,169 | |
Liabilities | | Level 1 | | | Level 2 | | | Level 3 | | | Balance as of March 31, 2024 | |
Commodity Futures Contracts | | | | | | | | | | | | | | | | |
Corn futures contracts | | $ | 3,932,723 | | | $ | - | | | $ | - | | | $ | 3,932,723 | |
Soybean futures contracts | | | 794,976 | | | | - | | | | - | | | | 794,976 | |
Sugar futures contracts | | | 814,401 | | | | - | | | | - | | | | 814,401 | |
Wheat futures contracts | | | 12,809,942 | | | | - | | | | - | | | | 12,809,942 | |
Total | | $ | 18,352,042 | | | $ | - | | | $ | - | | | $ | 18,352,042 | |
| December 31, 2016 | | | | | | | | | | | | |
| | | | | | | | | | | | Balance as of | |
| Assets: | | Level 1 | | | Level 2 | | | Level 3 | | | December 31, 2016 | |
| Cash equivalents | | $ | 1,412,423 | | | $ | — | | | $ | — | | | $ | 1,412,423 | |
| Commodity futures contracts | | | | | | | | | | | | | | | | |
| Soybean futures contracts | | | 357,500 | | | | — | | | | — | | | | 357,500 | |
| Sugar futures contracts | | | 185,147 | | | | — | | | | — | | | | 185,147 | |
| Total | | $ | 1,955,070 | | | $ | — | | | $ | — | | | $ | 1,955,070 | |
Assets: | | Level 1 | | | Level 2 | | | Level 3 | | | Balance as of December 31, 2023 | |
Cash Equivalents | | $ | 263,089,306 | | | $ | - | | | $ | - | | | $ | 263,089,306 | |
Commodity and Cryptocurrency Futures Contracts | | | | | | | | | | | | | | | | |
Wheat futures contracts | | | 2,237,493 | | | | - | | | | - | | | | 2,237,493 | |
Bitcoin futures contracts | | | 129,519 | | | | - | | | | - | | | | 129,519 | |
Total | | $ | 265,456,318 | | | $ | - | | | $ | - | | | $ | 265,456,318 | |
| | | | | | | | | Balance as of | | |
| Liabilities: | | Level 1 | | Level 2 | | Level 3 | | December 31, 2016 | | |
| Commodity futures contracts | | | | | | | | | | |
Liabilities | | | Level 1 | | | Level 2 | | | Level 3 | | | Balance as of December 31, 2023 | |
Cash Equivalents | | | | | | | | | | |
Commodity and Cryptocurrency Futures Contracts | | | | | | | | | | |
| Corn futures contracts | | $ | 1,460,800 | | $ | — | | $ | — | | $ | 1,460,800 | | | $ | 2,182,141 | | | $ | - | | | $ | - | | | $ | 2,182,141 | |
| Soybean futures contracts | | 12,025 | | — | | — | | 12,025 | | | 1,391,661 | | - | | - | | 1,391,661 | |
| Sugar futures contracts | | 331,542 | | — | | — | | 331,542 | | | 2,687,998 | | | - | | | - | | | 2,687,998 | |
| Wheat futures contracts | | | 3,921,588 | | | — | | | — | | | 3,921,588 | | | 4,575,666 | | | - | | | - | | | 4,575,666 | |
Bitcoin futures contracts | | | | 51,376 | | | - | | | - | | | 51,376 | |
| Total | | $ | 5,725,955 | | $ | — | | $ | — | | $ | 5,725,955 | | | $ | 10,888,842 | | | $ | - | | | $ | - | | | $ | 10,888,842 | |
For the ninethree months ended September 30, 2017March 31, 2024 and year ended December 31, 2016,2023, the Funds did not have any significant transfers between any of the levels of the fair value hierarchy. The determination is made as of the settlement of the futures contracts on the last day of trading for the reporting period. In making the determination of a Level 1 or Level 2 transfer, the Funds consider the average volume of the specific underlying futures contracts traded on the relevant exchange for the periods being reported.
See theFair Value - Definition and Hierarchy section in Note 3 above for an explanation of the transfers into and out of each level of the fair value hierarchy.
Note 5– Derivative Instruments and Hedging Activities
In the normal course of business, the Funds utilize derivative contracts in connection with its proprietary trading activities. Investments in derivative contracts are subject to additional risks that can result in a loss of all or part of an investment. The Funds’ derivative activities and exposure to derivative contracts are classified by the following primary underlying risks: interest rate, credit, commodity price, and equity price risks. In addition to its primary underlying risks, the Funds are also subject to additional counterparty risk due to the inability of its counterparties to meet the terms of their contracts. For the ninethree months ended September 30, 2017March 31, 2024 and year ended December 31, 2016,2023, the Funds invested only in commodity and cryptocurrency futures contracts specifically related to each Fund.
Futures Contracts
The Funds are subject to commodity and cryptocurrency price risk in the normal course of pursuing their investment objectives. A futures contract represents a commitment for the future purchase or sale of an asset at a specified price on a specified date.
The purchase and sale of futures contracts requires margin deposits with aan FCM. Subsequent payments (variation margin) are made or received by each Fund each day, depending on the daily fluctuations in the value of the contract, and are recorded as unrealized gains or losses by each Fund. Futures contracts may reduce the Funds’ exposure to counterparty risk since futures contracts are exchange-traded; and the exchange’s clearinghouse, as the counterparty to all exchange-traded futures, guarantees the futures against default.
The Commodity Exchange Act requires an FCM to segregate all customer transactions and assets from the FCM’s proprietary activities. A customer’s cash and other equity deposited with an FCM are considered commingled with all other customer funds subject to the FCM’s segregation requirements. In the event of an FCM’s insolvency, recovery may be limited to each Fund’s pro rata share of segregated customer funds available. It is possible that the recovery amount could be less than the total of cash and other equity deposited.
The following table discloses information about offsetting assets and liabilities presented in the combined statements of assets and liabilities to enable users of these financial statements to evaluate the effect or potential effect of netting arrangements for recognized assets and liabilities. These recognized assets and liabilities are presented as defined in the Financial Accounting Standards Board’s (“FASB”) Accounting Standards Update (“ASU”) No. 2011-112011-11 “Balance Sheet (Topic 210)210): Disclosures about Offsetting Assets and Liabilities” and subsequently clarified in FASB ASU 2013-012013-01 “Balance Sheet (Topic 210)210): Clarifying the Scope of Disclosures about Offsetting Assets and Liabilities.”
The following table also identifies the fair value amounts of derivative instruments included in the combined statements of assets and liabilities as derivative contracts, categorized by primary underlying risk, and held by the FCM, ED&F ManFCMs, Marex, and StoneX as of September 30, 2017March 31, 2024, and December 31, 2016.2023. The DEFI Fund has an account open at Phillip Capital with no contracts held as of March 31, 2024.
Offsetting*The amount of Financial Assetscollateral presented in Collateral, Due from Broker, is limited to the liability for the futures contracts and Derivative Assets as of September 30, 2017accordingly does not include the excess collateral pledged.
| | | (i) | | (ii) | | (iii) = (i) – (ii) | | (iv) | | (v) = (iii) – (iv) | | |
| | | | | | | | | | | | | |
| | | | | | | | | Gross Amount Not Offset in the | | | | |
| | | | | | | | | Statement of Assets and
Liabilities | | | | |
| | | Gross Amount | | Net Amount | | |
| | | Offset in the | | Presented in the | | |
Offsetting of Financial Assets and Derivative Assets as of March 31, 2024 | | Offsetting of Financial Assets and Derivative Assets as of March 31, 2024 | |
| | | Gross Amount | | Statement of | | Statement of | | | (i) | | (ii) | | (iii) = (i-ii) | | (iv) | | (v) = (iii)-(iv) | |
| | | of Recognized | | Assets and | | Assets and | | Futures Contracts | | Collateral, Due | | | | | | | | | | | | Gross Amount Not Offset in the Statement of Assets and Liabilities | | | |
| Description | | Assets | | Liabilities | | Liabilities | | Available for Offset | | from Broker | | Net Amount | | | Gross Amount of Recognized Assets | | | Gross Amount Offset in the Statement of Assets and Liabilities | | | Net Amount Presented in the Statement of Assets and Liabilities | | | Futures Contracts Available for Offset | | | Collateral, Due to Broker | | | Net Amount | |
| Commodity price | | | | | | | | | | | | | | |
Commodity Price | | |
| Corn futures contracts | | $ | 68,413 | | $ | — | | $ | 68,413 | | $ | 68,413 | | $ | — | | $ | — | | | $ | 154,412 | | | $ | - | | | $ | 154,412 | | | $ | 154,412 | | | $ | - | | | $ | - | |
| Soybean futures contracts | | 135,175 | | — | | 135,175 | | — | | — | | 135,175 | | |
| Sugar futures contracts | | 14,067 | | — | | 14,067 | | 14,067 | | — | | — | | |
| Wheat futures contracts | | 296,562 | | — | | 296,562 | | 296,562 | | — | | — | | | $ | 1,513,306 | | | $ | - | | | $ | 1,513,306 | | | $ | 1,513,306 | | | $ | - | | | $ | - | |
Offsetting of Financial Liabilities and Derivative Liabilities as of March 31, 2024 | |
| | | (i) | | | (ii) | | | (iii) = (i-ii) | | | (iv) | | | (v) = (iii)-(iv) | |
| | | | | | | | | | | | | | | Gross Amount Not Offset in the Statement of Assets and Liabilities | | | | | |
Description | | Gross Amount of Recognized Liabilities | | | Gross Amount Offset in the Statement of Assets and Liabilities | | | Net Amount Presented in the Statement of Assets and Liabilities | | | Futures Contracts Available for Offset | | | Collateral, Due from Broker* | | | Net Amount | |
Commodity Price | | | | | | | | | | | | | | | | | | | | | | | | |
Corn futures contracts | | $ | 3,932,723 | | | $ | - | | | $ | 3,932,723 | | | $ | 154,412 | | | $ | 3,778,311 | | | $ | - | |
Soybean futures contracts | | $ | 794,976 | | | $ | - | | | $ | 794,976 | | | $ | - | | | $ | 794,976 | | | $ | - | |
Sugar futures contracts | | $ | 814,401 | | | $ | - | | | $ | 814,401 | | | $ | - | | | $ | 814,401 | | | $ | - | |
Wheat futures contracts | | $ | 12,809,942 | | | $ | - | | | $ | 12,809,942 | | | $ | 1,513,306 | | | $ | 11,296,636 | | | $ | - | |
Offsetting
Offsetting of Financial Assets and Derivative Assets as of December 31, 2023 | |
| | | (i) | | | (ii) | | | (iii) = (i-ii) | | | (iv) | | | (v) = (iii)-(iv) | |
| | | | | | | | | | | | | | | Gross Amount Not Offset in the Statement of Assets and Liabilities | | | | | |
Description | | Gross Amount of Recognized Assets | | | Gross Amount Offset in the Statement of Assets and Liabilities | | | Net Amount Presented in the Statement of Assets and Liabilities | | | Futures Contracts Available for Offset | | | Collateral, Due to Broker | | | Net Amount | |
Commodity and Cryptocurrency Price | | | | | | | | | | | | | | | | | | | | | | | | |
Wheat futures contracts | | $ | 2,237,493 | | | $ | - | | | $ | 2,237,493 | | | $ | 2,237,493 | | | $ | - | | | $ | - | |
Bitcoin futures contracts | | $ | 129,519 | | | $ | - | | | $ | 129,519 | | | $ | 51,376 | | | $ | - | | | $ | 78,143 | |
| | | (i) | | | (ii) | | | (iii) = (i) – (ii) | | | (iv) | | | (v) = (iii) – (iv) | |
| | | | | | | | | | | | | | | | | | | |
| | | | | | | | | | | | Gross Amount Not Offset in the | | | | |
| | | | | | | | | | | | Statement of Assets and
Liabilities | | | | |
| | | | | | Gross Amount | | | Net Amount | | | | | | | | | | |
| | | | | | Offset in the | | | Presented in the | | | | | | | | | | |
| | | Gross Amount | | | Statement of | | | Statement of | | | | | | | | | | |
| | | of Recognized | | | Assets and | | | Assets and | | | Futures Contracts | | | Collateral, Due | | | | |
| Description | | Liabilities | | | Liabilities | | | Liabilities | | | Available for Offset | | | to Broker | | | Net Amount | |
| Commodity price | | | | | | | | | | | | | | | | | | | | | | | | |
| Corn futures contracts | | $ | 2,498,213 | | | $ | — | | | $ | 2,498,213 | | | $ | 68,413 | | | $ | 2,429,800 | | | $ | — | |
| Sugar futures contracts | | | 218,456 | | | | — | | | | 218,456 | | | | 14,067 | | | | 204,389 | | | | — | |
| Wheat futures contracts | | | 4,065,500 | | | | — | | | | 4,065,500 | | | | 296,562 | | | | 3,768,938 | | | | — | |
Offsetting of Financial Assets and Derivative Assets as of December 31, 2016
| | | | (i) | | | (ii) | | | (iii) = (i) – (ii) | | | (iv) | | (v) = (iii) – (iv) |
| | | | | | | | | | | | | | | | | | |
| | | | | | | | | | | | | Gross Amount Not Offset in the | | | |
| | | | | | | | | | | | | Statement of Assets and
Liabilities | | | |
| | | | | | | Gross Amount | | | Net Amount | | | | | | | | | | | | |
| | | | | | | Offset in the | | | Presented in the | | | | | | | | | | | | |
| | | Gross Amount | | | Statement of | | | Statement of | | | | | | | | | | | | |
| | | of Recognized | | | Assets and | | | Assets and | | | Futures Contracts | | | Collateral, Due | | | | | |
| Description | | Assets | | | Liabilities | | | Liabilities | | | Available for Offset | | | from Broker | | | Net Amount | |
| Commodity price | | | | | | | | | | | | | | | | | | | | | |
| Soybean futures contracts | | $ | 357,500 | | | $ | — | | | $ | 357,500 | | | $ | 12,025 | | | $ | — | | | $ | 345,475 | |
| Sugar futures contracts | | | 185,147 | | | | — | | | | 185,147 | | | | 185,147 | | | | — | | | | — | |
Offsetting of Financial Liabilities and Derivative Liabilities as of December 31, 2016
| | | (i) | | (ii) | | (iii) = (i) – (ii) | | (iv) | | (v) = (iii) – (iv) | |
| | | | | | | | | | | | | | |
| | | | | | | | | Gross Amount Not Offset in the | | | | |
| | | | | | | | | Statement of Assets and
Liabilities | | | | |
| | | Gross Amount | | Net Amount | | |
| | | Offset in the | | Presented in the | | |
Offsetting of Financial Liabilities and Derivative Liabilities as of December 31, 2023 | | Offsetting of Financial Liabilities and Derivative Liabilities as of December 31, 2023 | |
| | | Gross Amount | | Statement of | | Statement of | | | (i) | | (ii) | | (iii) = (i-ii) | | (iv) | | (v) = (iii)-(iv) | |
| | | of Recognized | | Assets and | | Assets and | | Futures Contracts | | Collateral, Due | | | | | | | | | | | | Gross Amount Not Offset in the Statement of Assets and Liabilities | | | |
| Description | | Liabilities | | Liabilities | | Liabilities | | Available for Offset | | to Broker | | Net Amount | | | Gross Amount of Recognized Liabilities | | | Gross Amount Offset in the Statement of Assets and Liabilities | | | Net Amount Presented in the Statement of Assets and Liabilities | | | Futures Contracts Available for Offset | | | Collateral, Due from Broker* | | | Net Amount | |
| Commodity price | | | | | | | | | | | | | | |
Commodity and Cryptocurrency Price | | |
| Corn futures contracts | | $ | 1,460,800 | | $ | — | | $ | 1,460,800 | | $ | — | | $ | 1,460,800 | | $ | — | | | $ | 2,182,141 | | | $ | - | | | $ | 2,182,141 | | | $ | - | | | $ | 2,182,141 | | | $ | - | |
| Soybean futures contracts | | 12,025 | | — | | 12,025 | | 12,025 | | — | | — | | | $ | 1,391,661 | | $ | - | | $ | 1,391,661 | | $ | - | | $ | 1,391,661 | | $ | - | |
| Sugar futures contracts | | 331,542 | | — | | 331,542 | | 185,147 | | 146,395 | | — | | | $ | 2,687,998 | | | $ | - | | | $ | 2,687,998 | | | $ | - | | | $ | 2,687,998 | | | $ | - | |
| Wheat futures contracts | | 3,921,588 | | — | | 3,921,588 | | — | | 3,921,588 | | — | | | $ | 4,575,666 | | | $ | - | | | $ | 4,575,666 | | | $ | 2,237,493 | | | $ | 2,338,173 | | | $ | - | |
Bitcoin futures contracts | | | $ | 51,376 | | $ | - | | $ | 51,376 | | $ | 51,376 | | $ | - | | $ | - | |
The following is a summary of realized and unrealized gains (losses) of the derivative instruments utilized by the Trust:
Three months ended September 30, 2017March 31, 2024
| | | | | | | |
| Primary Underlying Risk | | Realized (Loss) Gain on
Commodity Futures
Contracts | | | Net Change in Unrealized
Depreciation or
Appreciation on
Commodity Futures
Contracts | |
| Commodity price | | | | | | | | |
| Corn futures contracts | | $ | (1,616,988 | ) | | $ | (3,363,975 | ) |
| Soybean futures contracts | | | (24,025 | ) | | | 241,863 | |
| Sugar futures contracts | | | (678,070 | ) | | | 532,963 | |
| Wheat futures contracts | | | 1,955,888 | | | | (11,125,988 | ) |
| Total commodity futures contracts | | $ | (363,195 | ) | | $ | (13,175,137 | ) |
| | | Realized Loss on Commodity Futures Contracts | | | Net Change in Unrealized (Depreciation) Appreciation on Commodity Futures Contracts | |
Commodity Price and Cryptocurrency Price | | | | | | | | |
Corn futures contracts | | $ | (3,964,335 | ) | | $ | (1,596,170 | ) |
Soybeans futures contracts | | | (2,632,854 | ) | | | 596,685 | |
Sugar futures contracts | | | (482,314 | ) | | | 1,873,597 | |
Wheat futures contracts | | | (10,037,305 | ) | | | (8,958,463 | ) |
Bitcoin futures Contracts | | | (78,143 | ) | | | 114,383 | |
Total commodity and cryptocurrency futures contracts | | $ | (17,194,951 | ) | | $ | (7,969,968 | ) |
Three months ended September 30, 2016March 31, 2023
| Primary Underlying Risk | | Realized (Loss) Gain on
Commodity Futures
Contracts | | | Net Change in Unrealized
Appreciation or
Depreciation on
Commodity Futures
Contracts | |
| Commodity price | | | | | | | | |
| Corn futures contracts | | $ | (6,486,500 | ) | | $ | 937,100 | |
| Soybean futures contracts | | | 28,163 | | | | (1,612,025 | ) |
| Sugar futures contracts | | | 948,483 | | | | (18,088 | ) |
| Wheat futures contracts | | | (5,677,475 | ) | | | (692,500 | ) |
| Total commodity futures contracts | | $ | (11,187,329 | ) | | $ | (1,385,513 | ) |
| | | Realized (Loss) Gain on Commodity Futures Contracts | | | Net Change in Unrealized (Depreciation) Appreciation on Commodity Futures Contracts | |
Commodity Price and Cryptocurrency Price | | | | | | | | |
Corn futures contracts | | $ | (6,268,935 | ) | | $ | (3,299,360 | ) |
Soybeans futures contracts | | | 1,067,543 | | | | (3,699,642 | ) |
Sugar futures contracts | | | 1,339,448 | | | | 3,139,817 | |
Wheat futures contracts | | | (23,358,733 | ) | | | (2,092,562 | ) |
Bitcoin futures Contracts | | | 629,551 | | | | 128,468 | |
Total commodity and cryptocurrency futures contracts | | $ | (26,591,126 | ) | | $ | (5,823,279 | ) |
Nine months ended September 30, 2017
| | | | | | | | | |
| Primary Underlying Risk | | Realized (Loss) Gain on
Commodity Futures
Contracts | | | Net Change in Unrealized
Depreciation or
Appreciation on
Commodity Futures
Contracts | |
| Commodity price | | | | | | | | |
| Corn futures contracts | | $ | (2,064,200 | ) | | $ | (969,000 | ) |
| Soybean futures contracts | | | 7,475 | | | | (210,300 | ) |
| Sugar futures contracts | | | (2,266,185 | ) | | | (57,994 | ) |
| Wheat futures contracts | | | 1,286,087 | | | | 152,650 | |
| Total commodity futures contracts | | $ | (3,036,823 | ) | | $ | (1,084,644 | ) |
Nine months ended September 30, 2016
| Primary Underlying Risk | | Realized (Loss) Gain on
Commodity Futures
Contracts | | | Net Change in Unrealized
Appreciation or
Depreciation on
Commodity Futures
Contracts | |
| Commodity price | | | | | | | | |
| Corn futures contracts | | $ | (8,878,588 | ) | | $ | 1,188,163 | |
| Soybean futures contracts | | | 990,062 | | | | (21,100 | ) |
| Sugar futures contracts | | | 1,957,357 | | | | 305,435 | |
| Wheat futures contracts | | | (7,244,175 | ) | | | (2,107,750 | ) |
| Total commodity futures contracts | | $ | (13,175,344 | ) | | $ | (635,252 | ) |
Volume of Derivative Activities
The average notional market value categorized by primary underlying risk for the futures contracts held was $154.2 million and $155.5$277.8 million for the three and nine months ended September 30, 2017March 31, 2024 and $154.1 million and $119.1$382.3 million for the same periods in 2016.three months ended March 31, 2023.
Note 6 - Organizational and Offering Costs
Expenses incurred in organizing of the Trust and the initial offering of the shares of the Funds, including applicable SEC registration fees, were borne directly by the Sponsor for the Funds, and will be borne directly by the Sponsor for any series of the Trust which is not yet operating or will be issued in the future. The Trust will not be obligated to reimburse the Sponsor.
Note 7– Detail of the net assets and shares outstanding of the Funds that are a series of the Trust
The following are the net assets and shares outstanding of each Fund that is a series of the Trust and, thus, in total, comprise the combined net assets of the Trust:
September 30, 2017 | | | | |
| | | | | |
| | | Outstanding Shares | | | Net Assets | |
| Teucrium Corn Fund | | | 3,825,004 | | | $ | 67,327,657 | |
| Teucrium Soybean Fund | | | 1,100,004 | | | | 20,167,321 | |
| Teucrium Sugar Fund | | | 700,004 | | | | 6,600,831 | |
| Teucrium Wheat Fund | | | 10,325,004 | | | | 67,811,387 | |
| Teucrium Agricultural Fund: | | | | | | | | |
| Net assets including the investment in the Underlying Funds | | | 50,002 | | | | 1,176,488 | |
| Less: Investment in the Underlying Funds | | | | | | | 1,175,368 | |
| Net for the Fund in the combined net assets of the Trust | | | | | | | 1,120 | |
| Total | | | | | | $ | 161,908,316 | |
March 31, 2024
| | | Outstanding | | | | | |
| | | Shares | | | Net Assets | |
Teucrium Corn Fund | | | 3,450,004 | | | $ | 69,744,097 | |
Teucrium Soybean Fund | | | 1,350,004 | | | | 33,966,763 | |
Teucrium Sugar Fund | | | 1,225,004 | | | | 16,529,172 | |
Teucrium Wheat Fund | | | 29,250,004 | | | | 157,537,309 | |
Teucrium Agricultural Fund: | | | 512,502 | | | | | |
Net assets including the investment in the Underlying Funds | | | | | | | 14,526,883 | |
Less: Investment in the Underlying Funds | | | | | | | (14,515,416 | ) |
Net for the Fund in the combined net assets of the Trust | | | | | | | 11,467 | |
Total | | | | | | $ | 277,788,808 | |
December 31, 20162023
| | | | | | | Outstanding | | | |
| | | Outstanding Shares | | | Net Assets | | | Shares | | | Net Assets | |
| Teucrium Corn Fund | | 3,900,004 | | $ | 73,213,541 | | | 3,750,004 | | | $ | 81,050,442 | |
| Teucrium Soybean Fund | | 675,004 | | 12,882,100 | | | 1,075,004 | | | 29,056,020 | |
| Teucrium Sugar Fund | | 425,004 | | 5,513,971 | | | 1,425,004 | | | 17,720,099 | |
| Teucrium Wheat Fund | | 9,050,004 | | 62,344,759 | | | 30,800,004 | | | 184,176,669 | |
Hashdex Bitcoin Futures ETF | | | 50,000 | | | 2,536,958 | |
| Teucrium Agricultural Fund: | | | | | | | 625,002 | | | |
| Net assets including the investment in the Underlying Funds | | 50,002 | | 1,316,370 | | | | | | 18,409,126 | |
| Less: Investment in the Underlying Funds | | | | | (1,313,554 | ) | | | | | | (18,401,900 | ) |
| Net for the Fund in the combined net assets of the Trust | | | | | 2,816 | | | | | | | 7,226 | |
| Total | | | | $ | 153,957,187 | | | | | | $ | 314,547,414 | |
The detailed information for the subscriptions and redemptions, and other financial information for each Fund that is a series of the Trust are included in the accompanying financial statements of each Fund.
Note 8– Subsequent Events
Management has evaluated the financial statements for the quarter-ended September 30, 2017March 31, 2024 for subsequent events through the date of this filing and noted no material events requiring either recognition through the date of the filing or disclosure herein for the Trust and Funds other than those noted below:
CORN: Effective October 3, 2017, CORN purchased Commercial Paper with maturitiesTrust:
Legal Matters: A settlement agreement (“Agreement”), by and among Teucrium Trading, LLC, Salvatore Gilbertie, Carl Miller III, Cory Mullen-Rusin, Steve Kahler, and Dale and Barbara Riker, was entered into as of ninety daysApril 26, 2024 and is expected to become effective on or less as describedbefore May 17, 2024. The Agreement resolves all of the claims raised in the prospectus supplements filed with the SEC on October 2, 2017.actions captioned Dale Riker v. Sal Gilbertie et al., C.A. 656794/2020 (N.Y. Supreme Court), SalGilbertie, et. al. v. Dale Riker, et al., C.A. 2020-1018-LWW (Del. Ch.) and Dale Riker, et al. v. Teucrium Trading, LLC, C.A. 2022-1030-LWW (Del. Ch.).
CORN:
Nothing to report.
SOYB: As of this filing, $21,616 of cash that had been held in custody at The Bank of New York Mellon was transferred
Nothing to the Fund’s account at U.S. Bank. The balance for Restricted Cash is $0.report.
CANE: Nothing
The net assets of the fund decreased by $3,645,989, or 22.1%, for the period March 31, 2024 to reportMay 9, 2024. This was driven by a decrease in the shares outstanding by 12.2% and a decrease in the NAV per share of 11.2%.
WEAT: Effective October 3, 2017, WEAT purchased Commercial Paper with maturities of ninety days or less as described in the prospectus supplements filed with the SEC on October 2, 2017.
Nothing to report.
TAGS:
Nothing to reportreport.
DEFI:
Nothing to report.
TEUCRIUM CORN FUND
STATEMENTS OF ASSETS AND LIABILITIES
| | | September 30, 2017 | | December 31, 2016 | | | March 31, 2024 | | | December 31, 2023 | |
| | | (Unaudited) | | | | | (Unaudited) | | | |
| Assets | | | | | | | | | |
| Cash and cash equivalents | | $ | 63,752,344 | | $ | 69,072,284 | | | $ | 63,692,529 | | | $ | 76,745,471 | |
| Interest receivable | | 202 | | 339 | | | 75,550 | | | 105,283 | |
| Other assets | | 27,592 | | 10,451 | | |
| Equity in trading accounts: | | | | | | |
| Commodity futures contracts | | 68,413 | | — | | | 154,412 | | | - | |
| Due from broker | | | 6,048,890 | | | 5,664,656 | | | | 9,899,988 | | | | 6,533,938 | |
| Total equity in trading accounts | | | 6,117,303 | | | 5,664,656 | | | | 10,054,400 | | | | 6,533,938 | |
| Total assets | | $ | 69,897,441 | | $ | 74,747,730 | | | | 73,822,479 | | | | 83,384,692 | |
| | | | | | | |
| Liabilities | | | | | | | | | |
| Management fee payable to Sponsor | | 55,357 | | 65,165 | | | 58,311 | | | 71,506 | |
| Other liabilities | | 16,214 | | 8,224 | | | 87,348 | | | 80,603 | |
| Equity in trading accounts: | | | | | | |
| Commodity futures contracts | | | 2,498,213 | | | 1,460,800 | | | 3,932,723 | | | 2,182,141 | |
| Total liabilities | | | 2,569,784 | | | 1,534,189 | | | | 4,078,382 | | | | 2,334,250 | |
| | | | | | | |
| Net assets | | $ | 67,327,657 | | $ | 73,213,541 | | | $ | 69,744,097 | | | $ | 81,050,442 | |
| | | | | | | |
| Shares outstanding | | | 3,825,004 | | | 3,900,004 | | | | 3,450,004 | | | | 3,750,004 | |
| | | | | | | |
Shares Authorized | | | | * | | | | * | |
| | | |
| Net asset value per share | | $ | 17.60 | | $ | 18.77 | | | $ | 20.22 | | | $ | 21.61 | |
| | | | | | | |
| Market value per share | | $ | 17.64 | | $ | 18.71 | | | $ | 20.18 | | | $ | 21.57 | |
* On April 7, 2022, the Teucrium Corn Fund registered an indeterminate number of shares of the Fund pursuant to Rule 456(d) under the Securities Act of 1933.
The accompanying notes are an integral part of these financial statements.
TEUCRIUM CORN FUND
SCHEDULE OF INVESTMENTS
September 30, 2017
(Unaudited)
| | | | | | Percentage of | | | | |
| Description: Assets | | Fair Value | | | Net Assets | | | Shares | |
| | | | | | | | | | |
| Cash equivalents | | | | | | | | | | | | |
| Money market funds | | | | | | | | | | | | |
| Fidelity Institutional Money Market Funds - Government Portfolio (cost $558,225) | | $ | 558,225 | | | | 0.83 | % | | | 558,225 | |
| | | | | | | | | | | Notional Amount | |
| | | | | | | | | | | (Long Exposure) | |
| Commodity futures contracts | | | | | | | | | | | | |
| United States corn futures contracts | | | | | | | | | | | | |
| CBOT corn futures MAY18 (1,073 contracts) | | $ | 68,413 | | | | 0.10 | % | | $ | 20,185,813 | |
| | | | | | Percentage of | | | Notional Amount | |
| Description: Liabilities | | Fair Value | | | Net Assets | | | (Long Exposure) | |
| | | | | | | | | | | | | |
| Commodity futures contracts | | | | | | | | | | | | |
| United States corn futures contracts | | | | | | | | | | | | |
| CBOT corn futures MAR18 (1,281 contracts) | | $ | 2,250,325 | | | | 3.34 | % | | $ | 23,554,388 | |
| CBOT corn futures DEC18 (1,183 contracts) | | | 247,888 | | | | 0.37 | | | | 23,630,425 | |
| Total commodity futures contracts | | $ | 2,498,213 | | | | 3.71 | % | | $ | 47,184,813 | |
The accompanying notes are an integral part of these financial statements.
TEUCRIUM CORN FUND
SCHEDULE OF INVESTMENTS
DecemberMarch 31, 2016
| | | | | | Percentage of | | | | |
| Description: Assets | | Fair Value | | | Net Assets | | | Shares | |
| | | | | | | | | | |
| Cash equivalents | | | | | | | | | | | | |
| Money market funds | | | | | | | | | | | | |
| Fidelity Institutional Money Market Funds - Government Portfolio (cost $692,293) | | $ | 692,293 | | | | 0.95 | % | | | 692,293 | |
| | | | | | Percentage of | | | Notional Amount | |
| Description: Liabilities | | Fair Value | | | Net Assets | | | (Long Exposure) | |
| | | | | | | | | | | | | |
| Commodity futures contracts | | | | | | | | | | | | |
| United States corn futures contracts | | | | | | | | | | | | |
| CBOT corn futures MAY17 (1,438 contracts) | | $ | 50,713 | | | | 0.07 | % | | $ | 25,704,250 | |
| CBOT corn futures JUL17 (1,207 contracts) | | | 576,650 | | | | 0.79 | | | | 21,982,488 | |
| CBOT corn futures DEC17 (1,347 contracts) | | | 833,437 | | | | 1.14 | | | | 25,593,000 | |
| Total commodity futures contracts | | $ | 1,460,800 | | | | 2.00 | % | | $ | 73,279,738 | |
The accompanying notes are an integral part of these financial statements.
TEUCRIUM CORN FUND
STATEMENTS OF OPERATIONS2024
(Unaudited)
| | | Three months ended September 30, 2017 | | | Three months ended September 30, 2016 | | | Nine months ended September 30, 2017 | | | Nine months ended September 30, 2016 | |
| Income | | | | | | | | | | | | | | | | |
| Realized and unrealized gain (loss) on trading of commodity futures contracts: | | | | | | | | | | | | | | | | |
| Realized loss on commodity futures contracts | | $ | (1,616,988 | ) | | $ | (6,486,500 | ) | | $ | (2,064,200 | ) | | $ | (8,878,588 | ) |
| Net change in unrealized depreciation or appreciation on commodity futures contracts | | | (3,363,975 | ) | | | 937,100 | | | | (969,000 | ) | | | 1,188,163 | |
| Interest income | | | 217,130 | | | | 109,115 | | | | 549,003 | | | | 273,344 | |
| Total loss | | | (4,763,833 | ) | | | (5,440,285 | ) | | | (2,484,197 | ) | | | (7,417,081 | ) |
| | | | | | | | | | | | | | | | | |
| Expenses | | | | | | | | | | | | | | | | |
| Management fees | | | 167,636 | | | | 201,142 | | | | 516,610 | | | | 510,014 | |
| Professional fees | | | 134,545 | | | | 228,200 | | | | 443,246 | | | | 642,025 | |
| Distribution and marketing fees | | | 317,813 | | | | 354,406 | | | | 914,110 | | | | 908,656 | |
| Custodian fees and expenses | | | 38,350 | | | | 38,950 | | | | 120,725 | | | | 120,410 | |
| Business permits and licenses fees | | | 5,911 | | | | 4,250 | | | | 22,140 | | | | 11,850 | |
| General and administrative expenses | | | 32,968 | | | | 22,128 | | | | 104,600 | | | | 79,133 | |
| Brokerage commissions | | | 22,225 | | | | 16,775 | | | | 64,450 | | | | 49,375 | |
| Other expenses | | | 10,224 | | | | 12,252 | | | | 31,085 | | | | 30,312 | |
| Total expenses | | | 729,672 | | | | 878,103 | | | | 2,216,966 | | | | 2,351,775 | |
| | | | | | | | | | | | | | | | | |
| Expenses Waived by the Sponsor | | | (95,836 | ) | | | (134,161 | ) | | | (264,656 | ) | | | (134,161 | ) |
| | | | | | | | | | | | | | | | | |
| Total expenses, net | | | 633,836 | | | | 743,942 | | | | 1,952,310 | | | | 2,217,614 | |
| | | | | | | | | | | | | | | | | |
| Net loss | | $ | (5,397,669 | ) | | $ | (6,184,227 | ) | | $ | (4,436,507 | ) | | $ | (9,634,695 | ) |
| | | | | | | | | | | | | | | | | |
| Net loss per share | | $ | (1.49 | ) | | $ | (1.63 | ) | | $ | (1.17 | ) | | $ | (2.53 | ) |
| Net loss per weighted average share | | $ | (1.48 | ) | | $ | (1.46 | ) | | $ | (1.21 | ) | | $ | (2.88 | ) |
| Weighted average shares outstanding | | | 3,640,221 | | | | 4,244,297 | | | | 3,665,114 | | | | 3,342,431 | |
| | | | | | | | | | | | | | | Percentage of | | | | | |
Description: Assets | | Yield | | | Cost | | | Fair Value | | | Net Assets | | | Shares | |
| | | | | | | | | | | | | | | | | | | | | |
Cash equivalents | | | | | | | | | | | | | | | | | | | | |
Money market funds | | | | | | | | | | | | | | | | | | | | |
U.S. Bank Deposit Account | | | 5.240 | % | | $ | 3,095,240 | | | $ | 3,095,240 | | | | 4.44 | % | | | 3,095,240 | |
Goldman Sachs Financial Square Government Fund - Institutional Class | | | 5.210 | % | | | 17,795,011 | | | | 17,795,011 | | | | 25.51 | | | | 17,795,011 | |
Total money market funds | | | | | | $ | 20,890,251 | | | $ | 20,890,251 | | | | 29.95 | % | | | | |
The accompanying notes are an integral part of these financial statements.
| | | Maturity | | | | | | | | | | | | | | Percentage of | | | Principal | |
| | | Date | | Yield | | | Cost | | | Fair Value | | | Net Assets | | | Amount | |
Commercial Paper | | | | | | | | | | | | | | | | | | | | | | |
Brookfield Infrastructure Holdings (Canada) Inc. | | May 9, 2024 | | | 5.710 | % | | | 2,473,167 | | | $ | 2,485,222 | | | | 3.56 | % | | | 2,500,000 | |
Brookfield Infrastructure Holdings (Canada) Inc. | | May 14, 2024 | | | 5.782 | % | | | 2,464,625 | | | | 2,483,098 | | | | 3.56 | | | | 2,500,000 | |
Brookfield Infrastructure Holdings (Canada) Inc. | | May 16, 2024 | | | 5.772 | % | | | 2,464,688 | | | | 2,482,344 | | | | 3.56 | | | | 2,500,000 | |
Campbell Soup Company | | May 1, 2024 | | | 5.601 | % | | | 2,477,848 | | | | 2,488,542 | | | | 3.57 | | | | 2,500,000 | |
Crown Castle Inc. | | April 18, 2024 | | | 5.530 | % | | | 4,972,800 | | | | 4,987,156 | | | | 7.15 | | | | 5,000,000 | |
Glencore Funding LLC | | April 16, 2024 | | | 5.490 | % | | | 2,485,375 | | | | 2,494,375 | | | | 3.58 | | | | 2,500,000 | |
Harley-Davidson Financial Services, Inc. | | May 16, 2024 | | | 5.815 | % | | | 2,471,896 | | | | 2,482,188 | | | | 3.56 | | | | 2,500,000 | |
Stanley Black & Decker, Inc. | | April 4, 2024 | | | 5.604 | % | | | 2,493,867 | | | | 2,498,850 | | | | 3.58 | | | | 2,500,000 | |
VW Credit, Inc. | | April 11, 2024 | | | 5.511 | % | | | 4,932,500 | | | | 4,992,500 | | | | 7.16 | | | | 5,000,000 | |
VW Credit, Inc. | | May 16, 2024 | | | 5.402 | % | | | 2,471,660 | | | | 2,483,438 | | | | 3.56 | | | | 2,500,000 | |
WGL Holdings, Inc. | | April 15, 2024 | | | 5.616 | % | | | 2,492,320 | | | | 2,494,624 | | | | 3.58 | | | | 2,500,000 | |
Total Commercial Paper | | | | | | $ | 32,200,746 | | | $ | 32,372,337 | | | | 46.42 | % | | | | |
Total Cash Equivalents | | | | | | | | | | $ | 53,262,588 | | | | 76.37 | % | | | | |
TEUCRIUM CORN FUND
STATEMENTS OF CHANGES IN NET ASSETS
(Unaudited)
| | | Nine months ended September 30, 2017 | | | Nine months ended September 30, 2016 | |
| Operations | | | | | | | | |
| Net loss | | $ | (4,436,507 | ) | | $ | (9,634,695 | ) |
| Capital transactions | | | | | | | | |
| Issuance of Shares | | | 23,479,448 | | | | 45,239,528 | |
| Redemption of Shares | | | (24,928,825 | ) | | | (19,488,880 | ) |
| Total capital transactions | | | (1,449,377 | ) | | | 25,750,648 | |
| Net change in net assets | | | (5,885,884 | ) | | | 16,115,953 | |
| | | | | | | | | |
| Net assets, beginning of period | | $ | 73,213,541 | | | $ | 61,056,223 | |
| | | | | | | | | |
| Net assets, end of period | | $ | 67,327,657 | | | $ | 77,172,176 | |
| | | | | | | | | |
| Net asset value per share at beginning of period | | $ | 18.77 | | | $ | 21.24 | |
| | | | | | | | | |
| Net asset value per share at end of period | | $ | 17.60 | | | $ | 18.71 | |
| | | | | | | | | |
| Creation of Shares | | | 1,225,000 | | | | 2,225,000 | |
| Redemption of Shares | | | 1,300,000 | | | | 975,000 | |
| | | Number of | | | | | | | Percentage of | | | Notional Amount | |
| | | Contracts | | | Fair Value | | | Net Assets | | | (Long Exposure) | |
Commodity futures contracts | | | | | | | | | | | | | | | | |
United States corn futures contracts | | | | | | | | | | | | | | | | |
CBOT Corn Futures SEP24 | | | 901 | | | $ | 154,412 | | | | 0.22 | % | | $ | 20,925,725 | |
The accompanying notes are an integral part of these financial statements.
TEUCRIUM CORN FUND
STATEMENTS OF CASH FLOWS
(Unaudited)
| | | Number of | | | | | | | Percentage of | | | Notional Amount | |
Description: Liabilities | | Contracts | | | Fair Value | | | Net Assets | | | (Long Exposure) | |
| | | | | | | | | | | | | | | | | |
Commodity futures contracts | | | | | | | | | | | | | | | | |
United States corn futures contracts | | | | | | | | | | | | | | | | |
CBOT Corn Futures JUL24 | | | 1,072 | | | $ | 2,021,501 | | | | 2.90 | % | | $ | 24,361,200 | |
CBOT Corn Futures DEC24 | | | 1,022 | | | | 1,911,222 | | | | 2.74 | | | | 24,413,025 | |
Total commodity futures contracts | | | | | | $ | 3,932,723 | | | | 5.64 | % | | $ | 48,774,225 | |
| | | Nine months ended September 30, 2017 | | | Nine months ended September 30, 2016 | |
| Cash flows from operating activities: | | | | | | | | |
| Net loss | | $ | (4,436,507 | ) | | $ | (9,634,695 | ) |
| Adjustments to reconcile net loss to net cash used in operating activities: | | | | | | | | |
| Net change in unrealized appreciation or depreciation on commodity futures contracts | | | 969,000 | | | | (1,188,163 | ) |
| Changes in operating assets and liabilities: | | | | | | | | |
| Due from broker | | | (384,234 | ) | | | (1,524,937 | ) |
| Interest receivable | | | 137 | | | | (8,925 | ) |
| Other assets | | | (17,141 | ) | | | 54,953 | |
| Management fee payable to Sponsor | | | (9,808 | ) | | | 12,784 | |
| Other liabilities | | | 7,990 | | | | (3,255 | ) |
| Net cash used in operating activities | | | (3,870,563 | ) | | | (12,292,238 | ) |
| | | | | | | | | |
| Cash flows from financing activities: | | | | | | | | |
| Proceeds from sale of Shares | | | 23,479,448 | | | | 45,239,528 | |
| Redemption of Shares | | | (24,928,825 | ) | | | (19,488,880 | ) |
| Net cash (used in) provided by financing activities | | | (1,449,377 | ) | | | 25,750,648 | |
| | | | | | | | | |
| Net change in cash and cash equivalents | | | (5,319,940 | ) | | | 13,458,410 | |
| Cash and cash equivalents, beginning of period | | | 69,072,284 | | | | 57,110,089 | |
| Cash and cash equivalents, end of period | | $ | 63,752,344 | | | $ | 70,568,499 | |
The accompanying notes are an integral part of these financial statements.
27TEUCRIUM CORN FUND
SCHEDULE OF INVESTMENTS
December 31, 2023
| | | | | | | | | | | | | | | Percentage of | | | | | |
Description: Assets | | Yield | | | Cost | | | Fair Value | | | Net Assets | | | Shares | |
| | | | | | | | | | | | | | | | | | | | | |
Cash equivalents | | | | | | | | | | | | | | | | | | | | |
Money market funds | | | | | | | | | | | | | | | | | | | | |
U.S. Bank Deposit Account | | | 5.270 | % | | $ | 7,523,423 | | | $ | 7,523,423 | | | | 9.28 | % | | | 7,523,423 | |
Goldman Sachs Financial Square Government Fund - Institutional Class | | | 5.250 | % | | | 19,050,119 | | | | 19,050,119 | | | | 23.51 | | | | 19,050,119 | |
Total money market funds | | | | | | $ | 26,573,542 | | | $ | 26,573,542 | | | | 32.79 | % | | | | |
| | Maturity | | | | | | | | | | | | | | Percentage of | | | Principal | |
| | Date | | Yield | | | Cost | | | Fair Value | | | Net Assets | | | Amount | |
Commercial Paper | | | | | | | | | | | | | | | | | | | | | |
Albemarle Corporation | January 3, 2024 | | | 5.770 | % | | $ | 4,950,475 | | | $ | 4,998,428 | | | | 6.17 | % | | | 5,000,000 | |
Albemarle Corporation | January 11, 2024 | | | 5.808 | % | | | 2,478,230 | | | | 2,496,042 | | | | 3.08 | | | | 2,500,000 | |
Brookfield Infrastructure Holdings (Canada) Inc. | January 9, 2024 | | | 5.794 | % | | | 2,489,708 | | | | 2,496,833 | | | | 3.08 | | | | 2,500,000 | |
Brookfield Infrastructure Holdings (Canada) Inc. | January 16, 2024 | | | 5.853 | % | | | 2,466,575 | | | | 2,494,031 | | | | 3.08 | | | | 2,500,000 | |
Entergy Corporation | March 1, 2024 | | | 5.665 | % | | | 2,467,625 | | | | 2,476,875 | | | | 3.06 | | | | 2,500,000 | |
FMC Corporation | January 19, 2024 | | | 5.816 | % | | | 2,488,878 | | | | 2,492,850 | | | | 3.07 | | | | 2,500,000 | |
Harley-Davidson Financial Services, Inc. | January 9, 2024 | | | 5.843 | % | | | 2,474,533 | | | | 2,496,817 | | | | 3.08 | | | | 2,500,000 | |
Harley-Davidson Financial Services, Inc. | February 1, 2024 | | | 5.867 | % | | | 2,480,400 | | | | 2,487,600 | | | | 3.07 | | | | 2,500,000 | |
Harley-Davidson Financial Services, Inc. | February 14, 2024 | | | 5.927 | % | | | 2,473,774 | | | | 2,482,247 | | | | 3.06 | | | | 2,500,000 | |
National Fuel Gas Company | January 8, 2024 | | | 5.867 | % | | | 2,480,400 | | | | 2,497,200 | | | | 3.08 | | | | 2,500,000 | |
Oracle Corporation | March 6, 2024 | | | 5.562 | % | | | 2,467,452 | | | | 2,475,400 | | | | 3.05 | | | | 2,500,000 | |
V.F. Corporation | January 18, 2024 | | | 5.606 | % | | | 2,473,646 | | | | 2,493,507 | | | | 3.08 | | | | 2,500,000 | |
WGL Holdings, Inc. | January 3, 2024 | | | 5.793 | % | | | 2,490,896 | | | | 2,499,208 | | | | 3.08 | | | | 2,500,000 | |
WGL Holdings, Inc. | January 12, 2024 | | | 5.849 | % | | | 2,487,222 | | | | 2,495,608 | | | | 3.08 | | | | 2,500,000 | |
Walgreens Boots Alliance, Inc. | January 12, 2024 | | | 6.028 | % | | | 2,484,378 | | | | 2,495,478 | | | | 3.08 | | | | 2,500,000 | |
Total Commercial Paper | | | | | | $ | 39,654,192 | | | $ | 39,878,124 | | | | 49.20 | % | | | | |
Total Cash Equivalents | | | | | | | | | | $ | 66,451,666 | | | | 81.99 | % | | | | |
| | | Number of | | | | | | | Percentage of | | | Notional Amount | |
Description: Liabilities | | Contracts | | | Fair Value | | | Net Assets | | | (Long Exposure) | |
| | | | | | | | | | | | | | | | | |
Commodity futures contracts | | | | | | | | | | | | | | | | |
United States corn futures contracts | | | | | | | | | | | | | | | | |
CBOT corn futures MAY24 | | | 1,171 | | | $ | 1,102,254 | | | | 1.36 | % | | $ | 28,338,200 | |
CBOT corn futures JUL24 | | | 983 | | | | 384,407 | | | | 0.47 | | | | 24,280,100 | |
CBOT corn futures DEC24 | | | 1,128 | | | | 695,480 | | | | 0.86 | | | | 28,397,400 | |
Total commodity futures contracts | | | | | | $ | 2,182,141 | | | | 2.69 | % | | $ | 81,015,700 | |
The accompanying notes are an integral part of these financial statements.
TEUCRIUM CORN FUND
STATEMENTS OF OPERATIONS
(Unaudited)
| | | Three months ended | | | Three months ended | |
| | | March 31, 2024 | | | March 31, 2023 | |
Income | | | | | | | | |
Realized and unrealized gain (loss) on trading of commodity futures contracts: | | | | | | | | |
Realized loss on commodity futures contracts | | $ | (3,964,335 | ) | | $ | (6,268,935 | ) |
Net change in unrealized depreciation on commodity futures contracts | | | (1,596,170 | ) | | | (3,299,360 | ) |
Interest income | | | 948,218 | | | | 1,454,236 | |
Total loss | | | (4,612,287 | ) | | | (8,114,059 | ) |
| | | | | | | | | |
Expenses | | | | | | | | |
Management fees | | | 178,243 | | | | 328,874 | |
Professional fees | | | 57,038 | | | | 78,808 | |
Distribution and marketing fees | | | 205,464 | | | | 239,078 | |
Custodian fees and expenses | | | 21,972 | | | | 33,044 | |
Business permits and licenses fees | | | 7,130 | | | | 6,578 | |
General and administrative expenses | | | 15,426 | | | | 13,312 | |
Total expenses | | | 485,273 | | | | 699,694 | |
| | | | | | | | | |
Expenses waived by the Sponsor | | | - | | | | - | |
| | | | | | | | | |
Total expenses, net | | | 485,273 | | | | 699,694 | |
| | | | | | | | | |
Net loss | | $ | (5,097,560 | ) | | $ | (8,813,753 | ) |
| | | | | | | | | |
Net loss per share | | $ | (1.39 | ) | | $ | (1.63 | ) |
Net loss per weighted average share | | $ | (1.43 | ) | | $ | (1.71 | ) |
Weighted average shares outstanding | | | 3,554,125 | | | | 5,145,004 | |
The accompanying notes are an integral part of these financial statements.
TEUCRIUM CORN FUND
STATEMENTS OF CHANGES IN NET ASSETS
(Unaudited)
| | | Three months ended | | | Three months ended | |
| | | March 31, 2024 | | | March 31, 2023 | |
Operations | | | | | | | | |
Net loss | | $ | (5,097,560 | ) | | $ | (8,813,753 | ) |
Capital transactions | | | | | | | | |
Issuance of Shares | | | 2,436,790 | | | | 1,991,168 | |
Redemption of Shares | | | (8,645,575 | ) | | | (30,190,763 | ) |
Total capital transactions | | | (6,208,785 | ) | | | (28,199,595 | ) |
Net change in net assets | | | (11,306,345 | ) | | | (37,013,348 | ) |
| | | | | | | | | |
Net assets, beginning of period | | $ | 81,050,442 | | | $ | 152,638,405 | |
| | | | | | | | | |
Net assets, end of period | | $ | 69,744,097 | | | $ | 115,625,057 | |
| | | | | | | | | |
Net asset value per share at beginning of period | | $ | 21.61 | | | $ | 26.90 | |
| | | | | | | | | |
Net asset value per share at end of period | | $ | 20.22 | | | $ | 25.27 | |
| | | | | | | | | |
Creation of Shares | | | 125,000 | | | | 75,000 | |
Redemption of Shares | | | 425,000 | | | | 1,175,000 | |
The accompanying notes are an integral part of these financial statements.
TEUCRIUM CORN FUND
STATEMENTS OF CASH FLOWS
(Unaudited)
| | | Three months ended | | | Three months ended | |
| | | March 31, 2024 | | | March 31, 2023 | |
Cash flows from operating activities: | | | | | | | | |
Net loss | | $ | (5,097,560 | ) | | $ | (8,813,753 | ) |
Adjustments to reconcile net loss to net cash used in operating activities: | | | | | | | | |
Net change in unrealized depreciation on commodity futures contracts | | | 1,596,170 | | | | 3,299,360 | |
Changes in operating assets and liabilities: | | | | | | | | |
Due from broker | | | (3,366,050 | ) | | | (1,572,445 | ) |
Interest receivable | | | 29,733 | | | | (3,744 | ) |
Other assets | | | - | | | | 854 | |
Management fee payable to Sponsor | | | (13,195 | ) | | | (43,305 | ) |
Other liabilities | | | 6,745 | | | | 1,016 | |
Net cash used in operating activities | | | (6,844,157 | ) | | | (7,132,017 | ) |
| | | | | | | | | |
Cash flows from financing activities: | | | | | | | | |
Proceeds from sale of Shares | | | 2,436,790 | | | | 3,335,998 | |
Redemption of Shares | | | (8,645,575 | ) | | | (31,535,593 | ) |
Net cash used in financing activities | | | (6,208,785 | ) | | | (28,199,595 | ) |
| | | | | | | | | |
Net change in cash and cash equivalents | | | (13,052,942 | ) | | | (35,331,612 | ) |
Cash and cash equivalents, beginning of period | | | 76,745,471 | | | | 142,434,737 | |
Cash and cash equivalents, end of period | | $ | 63,692,529 | | | $ | 107,103,125 | |
The accompanying notes are an integral part of these financial statements.
NOTES TO FINANCIAL STATEMENTS
September 30, 2017March 31, 2024
(Unaudited)
Note 1– Organization and Operation
Teucrium Corn Fund (referred to herein as “CORN,” or the “Fund”) is a commodity pool that is a series of Teucrium Commodity Trust (“Trust”), a Delaware statutory trust formed on September 11, 2009. The Fund issues common units, called the “Shares,” representing fractional undivided beneficial interests in the Fund. The Fund continuously offers Creation Baskets consisting of 25,000 Shares at their Net Asset Value (“NAV”) to “Authorized Purchasers” through Foreside Fund Services, LLC, which is the distributor for the Fund (the “Distributor”). Authorized Purchasers sell such Shares, which are listed on the New York Stock Exchange (“NYSE”) Arca under the symbol “CORN,” to the public at per-Share offering prices that reflect, among other factors, the trading price of the Shares on the NYSE Arca, the NAV of the Fund at the time the Authorized Purchaser purchased the Creation Baskets and the NAV at the time of the offer of the Shares to the public, the supply of and demand for Shares at the time of sale, and the liquidity of the markets for corn interests. The Fund’s Shares trade in the secondary market on the NYSE Arca at prices that are lower or higher than their NAV per Share.
The investment objective of CORN is to have the daily changes in percentage termsthe NAV of the Shares’ Net Asset Value (“NAV”)Fund’s Shares reflect the daily changes in percentage terms ofthe corn market for future delivery as measured by the Benchmark. The Benchmark is a weighted average of the closing settlement prices for three futures contracts for corn (“Corn Futures Contracts”) that are traded on the Chicago Board of Trade (“CBOT”):
CORN Benchmark
CBOT Corn Futures Contract | | Weighting | |
Second to expire | 35% | | 35 | % |
Third to expire | 30% | | 30 | % |
December following the third to expire | 35% | | 35 | % |
The Fund commenced investment operations on June 9, 2010 and has a fiscal year ending on December 31. The Fund’s sponsor is Teucrium Trading, LLC (the “Sponsor”). The Sponsor is responsible for the management of the Fund. The Sponsor is registered as a commodity pool operator (“CPO”) and a commodity trading adviser (“CTA”) with the Commodity Futures Trading Commission (“CFTC”) and is a member of the National Futures Association (the “NFA”(“NFA”) and became a commodity pool operator registered with the Commodity Futures Trading Commission (the “CFTC”) effective November 10, 2009..
On June 5,7, 2010, the Fund’s initial registration of 30,000,000 shares on Form S-1S-1 for CORN was declared effective by the U.S. Securities and Exchange Commission (“SEC”). On June 8, 2010, four Creation Baskets for CORN were issued representing 200,000 shares and $5,000,000. CORN began trading on the New York Stock Exchange (“NYSE”) Arca on June 9, 2010, the Fund listed its shares on the NYSE Arca under the ticker symbol “CORN.” On the day prior to that, the Fund issued 200,000 shares in exchange for $5,000,000 at the Fund’s initial NAV of $25 per share. 2010. The Fund also commenced investment operations on June 9, 2010 by purchasing commodity futures contracts traded on the CBOT. On April 29, 2016, a second subsequentcurrent registration statement for CORN was declared effective by the SEC.SEC on April 7, 2022. This registration statement for CORN registered an indeterminate number of shares.
The accompanying unaudited financial statements have been prepared in accordance with Rule 10-0110-01 of Regulation S-XS-X promulgated by the SEC and, therefore, do not include all information and footnote disclosures required under accounting principles generally accepted in the United States of America (“GAAP”). The financial information included herein is unaudited; however, such financial information reflects all adjustments which are, in the opinion of management, necessary for the fair presentation of the Fund’s financial statements for the interim period. It is suggested that these interim financial statements be read in conjunction with the financial statements and related notes included in the Trust’s Annual Report on Form 10-K,10-K, as well as the most recent Form S-3S-1 filing, as applicable. The operating results for the three and nine months ended September 30, 2017March 31, 2024 are not necessarily indicative of the results to be expected for the full year ending December 31, 2017.2024.
Subject to the terms of the Trust Agreement, Teucrium Trading, LLC, in its capacity as the Sponsor (“Sponsor”), may terminate a Fund at any time, regardless of whether the Fund has incurred losses, including, for instance, if it determines that the Fund’s aggregate net assets in relation to its operating expenses make the continued operation of the Fund unreasonable or imprudent. However, no level of losses will require the Sponsor to terminate a Fund.
Note 2– Principal Contracts and Agreements
On August 17, 2015 (the “Conversion Date”), U.S. Bank N.A. replaced The Bank of New York Mellon as the Custodian for the Fund. The principal business address for U.S. Bank N.A. is 1555 North RiverCenter Drive, Suite 302, Milwaukee, Wisconsin 53212. U.S. Bank N.A. is a Wisconsin state chartered bank subject to regulation by the Board of Governors of the Federal Reserve System and the Wisconsin State Banking Department. The principal address forSponsor employs U.S. Bancorp Fund Services, LLC, doing business as U.S. Bank Global Fund Services (“USBFS”Global Fund Services”), for Transfer Agency, Fund Accounting and Fund Administration services. The principal address for Global Fund Services is 777 East Wisconsin Avenue,615 E. Michigan Street, Milwaukee, WI 53202. In addition, effective on the Conversion Date, USBFS, a wholly owned subsidiary of U.S. Bank, commenced serving as administrator for each Fund, performing certain administrative and accounting services and preparing certain SEC reports on behalf of the Funds, and also became the registrar and transfer agent for each Fund’s Shares. For such services, U.S. Bank and USBFS will receive an asset-based fee, subject to a minimum annual fee.
For custody services, the Funds will pay to U.S. Bank N.A. 0.0075% of average gross assets up to $1$1 billion, and .0050% of average gross assets over $1$1 billion, annually, plus certain per-transaction charges. For Transfer Agency, Fund Accounting and Fund Administration services, which are based on the total assets for all the Funds in the Trust, the Funds will pay to USBFS 0.06%Global Fund Services 0.05% of average gross assets on the first $250 million, 0.05% on the next $250$500 million, 0.04% on the next $500$500 million, 0.03% on the next $2 billion and 0.03%0.02% on the balance over $1$3 billion annually. A combined minimum annual fee of up to $64,500$47,000 for custody, transfer agency, accounting and administrative services is assessed per Fund. For the three months ended September 30, 2017 and 2016, the Fund recognized $38,350 and $38,950, respectively, for theseThese services which wasare recorded inas custodian fees and expenses on the statements of operations and paid for by the Fund. For the nine months ended September 30, 2017 and 2016, the Fund recognized $120,725 and $120,410, respectively, foroperations. A summary of these services, which was recorded in custodian fees and expenses on the statements of operations and paid for by the Fund.is included below.
The Sponsor employs Foreside Fund Services, LLC (“Foreside” or the “Distributor”) as the Distributor for the Funds. The Distribution Services Agreement among the Distributor and the Sponsor calls for the Distributor to work with the Custodian in connection with the receipt and processing of orders for Creation Baskets and Redemption Baskets and the review and approval of all Fund sales literature and advertising materials. The Distributor and the Sponsor have also entered into a Securities Activities and Service Agreement (the “SASA”) under which certain employees and officers of the Sponsor are licensed as registered representatives or registered principals of the Distributor, under Financial Industry Regulatory Authority (“FINRA”) rules. For its services as the Distributor, Foreside receives a fee of 0.01% of theeach Fund’s average daily net assets and an aggregate annual fee of $100,000 for all Teucrium Funds, along with certain expense reimbursements. For its services under the SASA, Foreside receives a fee of $5,000 per registered representative and $1,000 per registered location. For the three months ended September 30, 2017 and 2016, the Fund recognized $18,753 and $19,244, respectively, for theseThese services which wasare recorded inas distribution and marketing fees on the statements of operations;operations. A summary of these amounts, $5,191 and $0 were waived by the Sponsor in 2017 and 2016 respectively. For the nine months ended September 30, 2017 and 2016, the Fund recognized $63,665 and $57,119, respectively, for these services, which was recorded in distribution and marketing fees on the statements of operations; of these amounts, $16,227 and $0 were waived by the Sponsor in 2017 and 2016 respectively.expenses is included below.
ED&F ManMarex Capital Markets, Inc. (“ED&F Man”Marex”) servesand StoneX Financial Inc (“StoneX”) serve as the Underlying Funds’ clearing brokerbrokers to execute and clear the Underlying Funds’ futures contracts and provide other brokerage-related services. ED&F Man isMarex and StoneX are each registered as a FCMfutures commission merchants (“FCM”) with the U.S. CFTC and isare members of the NFA. The clearing brokers are registered as broker-dealers with the SEC and are each a member of the NFA. ED&F Man is also registered as a broker/dealer with the U.S. SecuritiesFINRA. Marex and Exchange Commission and is a member of the FINRA. ED&F Man is aStoneX are each clearing membermembers of ICE Futures U.S., Inc., Chicago Board of Trade, Chicago Mercantile Exchange, New York Mercantile Exchange, and all other major United States commodity exchanges. For Corn, Soybean, Sugar and Wheat Futures Contracts, ED&F ManMarex is paid $9.00$3.00 per round turn. Forturn exclusive of pass-through fees for the three months ended September 30, 2017exchange and 2016, the NFA. StoneX is paid $2.50 per round turn exclusive of pass-through fees for the exchange and the NFA. Additionally, if the monthly commissions paid by each Fund does not equal or exceed 16.5% return on the StoneX Capital Requirement at 9.6% of the Exchange Maintenance Margin, each Fund will pay a true up to meet that return at the end of each month. These expenses are recognized $22,225 and $16,775, respectively, for these services, which was recorded in brokerage commissionson a per-trade basis. The half-turn is recognized as an unrealized loss on the statements of operations for contracts that have been purchased since the change in recognition, and was paid for by the Fund. For the nine months ended September 30, 2017 and 2016, the Funda full turn is recognized $64,450 and $49,375, respectively, for these services, which was recorded in brokerage commissionsas a realized loss on the statements of operations and was paid for bywhen a contract is sold. A summary of these expenses can be found under the Fund.heading, Brokerage Commissions.
The sole Trustee of the Trust is Wilmington Trust Company, a Delaware banking corporation. The Trustee will accept service of legal process on the Trust in the State of Delaware and will make certain filings under the Delaware Statutory Trust Act. For its services, the Trustee receives an annual fee of $3,300 from the Trust. For the three and nine months ended September 30, 2017 and 2016, the Fund recognized $1,311 and $1,550 expense for theseThese services which isare recorded in business permits and licenses fees on the statements of operations;operations. A summary of these amounts, $1,311 and $1,550 were waived by the Sponsor in 2017 and 2016 respectively.expenses is included below.
| | | Three months ended March 31, 2024 | | | Three months ended March 31, 2023 | |
Amount Recognized for Custody Services | | $ | 21,972 | | | $ | 33,044 | |
Amount of Custody Services Waived | | $ | - | | | $ | - | |
| | | | | | | | | |
Amount Recognized for Distribution Services | | $ | 8,128 | | | $ | 10,053 | |
Amount of Distribution Services Waived | | $ | - | | | $ | - | |
| | | | | | | | | |
Amount Recognized for Wilmington Trust | | $ | - | | | $ | - | |
Amount of Wilmington Trust Waived | | $ | - | | | $ | - | |
| | | | | | | | | |
Note 3– Summary of Significant Accounting Policies
Basis of Presentation
The accompanying financial statements have been prepared in accordance with accounting principles generally accepted in the United States of America (“U.S. GAAP”) as detailed in the Financial Accounting Standards Board’s Accounting Standards Codification.
Revenue Recognition
Commodity futures contracts are recorded on the trade date. All such transactions are recorded on the identified cost basis and marked to market daily. Unrealized appreciation or depreciation on commodity futures contracts are reflected in the statements of operations as the difference between the original contract amount and the fair market value as of the last business day of the year or as of the last date of the financial statements. Changes in the appreciation or depreciation between periods are reflected in the statements of operations. InterestThe Fund seeks to earn interest on cash equivalentsits assets denominated in U.S. dollars on deposits with financial institutions are recognized on the accrual basis. The Funds earnFutures Commission Merchant. In addition, the Fund earns interest on funds held at the custodian and at other financial institutions at prevailing market rates for such investments.
The Sponsor invests a portion of cash in commercial paper, which is deemed a cash equivalent based on the rating and duration of contracts as described in the notes to the financial statements and reflected in cash and cash equivalents on the statements of assets and liabilities and statements of cash flows. Accretion on these investments is recognized using the effective interest method in U.S. dollars and included in interest income on the statements of operations.
The Sponsor invests a portion of the cash held by the broker in short term Treasury Bills as collateral for open futures contracts. Accretion on these investments is recognized using the effective interest method in U.S. dollars and included in interest income on the statements of operations.
Brokerage Commissions
BrokerageThe Sponsor recognizes the expense for brokerage commissions for futures contract trades on all open commodity futures contracts are accrueda per-trade basis. The below table shows the amounts included on the trade date statements of operations as total brokerage commissions paid inclusive of unrealized loss for the three months ended March 31, 2024 and on a full-turn basis.2023.
| | | CORN | |
Three months ended March 31, 2024 | | $ | 9,706 | |
Three months ended March 31, 2023 | | $ | 17,270 | |
Income Taxes
For federal income tax purposes, the Fund will be treated as a publicly traded partnership. A publicly traded partnership is generally treated as a corporation for federal income tax purposes unless 90% or more of the publicly traded partnership’s gross income for each taxable year of its existence consists of qualifying income as defined in section 7704(d) of the Internal Revenue Code of 1986, as amended. Qualifying income is defined as generally including, in pertinent part, interest (other than from a financial business), dividends, and gains from the sale or disposition of capital assets held for the production of interest or dividends. In the case of a partnership of which a principal activity is the buying and selling of commodities, other than as inventory, or of futures, forwards and options with respect to commodities, qualifying income also includes income and gains from commodities and from futures, forwards, options with respect to commodities and, provided the partnership is a trader or investor with respect to such assets, swaps and other notional principal contracts with respect to commodities. The Fund expects that at least 90% of the Fund’s gross income for each taxable year will consist of qualifying income and that the Fund will be taxed as a partnership for federal income tax purposes. The Fund does not record a provision for income taxes because the shareholders report their share of the Fund’s income or loss on their income tax returns. The financial statements reflect the Fund’s transactions without adjustment, if any, required for income tax purposes.
The Fund is required to determine whether a tax position is more likely than not to be sustained upon examination by the applicable taxing authority, including resolution of any related appeals or litigation processes, based on the technical merits of the position. The Fund files an income tax return in the U.S. federal jurisdiction and may file income tax returns in various U.S. states and foreign jurisdictions. For all tax years 20142021 to 2016,2023, the Fund remains subject to income tax examinations by major taxing authorities. The tax benefit recognized is measured as the largest amount of benefit that has a greater than fifty percent likelihood of being realized upon ultimate settlement. De-recognition of a tax benefit previously recognized results in the Fund recording a tax liability that reduces net assets. Based on its analysis, the Fund has determined that it has not incurred any liability for unrecognized tax benefits as of September 30, 2017March 31, 2024 and for the years ended December 31, 2016, 20152023, 2022, and 2014.2021. However, the Fund’s conclusions regarding this policy may be subject to review and adjustment at a later date based on factors including, but not limited to, ongoing analysis of and changes to tax laws, regulations, and interpretations thereof.
The Fund recognizes interest accrued related to unrecognized tax benefits and penalties related to unrecognized tax benefits in income tax fees payable, if assessed. No interest expense or penalties have been recognized as of and for the three and nine months ended September 30, 2017 March 31, 2024 and 2016.2023.
The Fund may be subject to potential examination by U.S. federal, U.S. state, or foreign jurisdictional authorities in the area of income taxes. These potential examinations may include questioning the timing and amount of deductions, the nexus of income among various tax jurisdictions, and compliance with U.S. federal, U.S. state and foreign tax laws. The Fund’s management does not expect that the total amount of unrecognized tax benefits will materially change over the next twelve months.
Creations and Redemptions
Authorized Purchasers may purchase Creation Baskets consisting of 25,000 shares from CORN. The amount of the proceeds required to purchase a Creation Basket will be equal to the NAV of the shares in the Creation Basket determined as of 4:00 p.m. New York time(ET) on the day the order to create the basket is properly received.received in good order.
Authorized Purchasers may redeem shares from the Fund only in blocks of 25,000 shares called “Redemption Baskets.” The amount of the redemption proceeds for a Redemption Basket will be equal to the NAV of the shares in the Redemption Basket determined as of 4:00 p.m. New York time(ET) on the day the order to redeem the basket is properly received.received in good order.
The Fund receives or pays the proceeds from shares sold or redeemed within three business days after the trade date of the purchase or redemption. The amounts due from Authorized Purchasers are reflected in the Fund’s statements of assets and liabilities as receivable forcapital shares sold.receivable. Amounts payable to Authorized Purchasers upon redemption are reflected in the Fund’s statements of assets and liabilities as payable for shares redeemed.
As outlined in the most recent Form S-3S-1 filing, 50,000 shares represents represent two Redemption Baskets for the Fund and a minimum level of shares. If the Fund experienced redemptions that caused the number of Shares outstanding to decrease to the minimum level of Shares required to be outstanding, until the minimum number of Shares is again exceeded through the purchase of a new Creation Basket, there can be no more redemptions by an Authorized Purchaser.
Allocation of Shareholder Income and Losses
Profit or loss is allocated among the shareholders of the Fund in proportion to the number of shares each shareholder holds as of the close of each month.
Cash and Cash Equivalents
Cash equivalents are highly-liquidhighly liquid investments with maturity dates of 90 days or less when acquired. The Fund reported its cash equivalents in the statements of assets and liabilities at market value, or at carrying amounts that approximate fair value, because of their highly-liquidhighly liquid nature and short-term maturities. TheEach Fund that is a series of the Trust has these balancesthe balance of its assetscash equivalents on deposit with banks.financial institutions. The Fund hadholds a balance of $558,225 and $692,293 in money market funds at September 30, 2017 and December 31, 2016, respectively; these balances arethat is included in cash and cash equivalents on the statements of assets and liabilities. Effective in the second quarter 2015, theThe Sponsor investedinvests a portion of the available cash for the FundFunds in alternative demand-depositdemand deposit savings accounts, which is classified as cash and not as a cash equivalent. The Fund had a balance of $63,195,008 as of September 30, 2017 and $68,382,027 as of December 31, 2016, in demand-deposit savings accounts. This change resulted in a reduction in the balance held in money market funds.equivalents. Assets deposited with the bank may, at times, exceed federally insured limits. The Sponsor invests a portion of the available cash for the Funds in investment grade commercial paper with durations of 90 days or less, which is classified as a cash equivalent and is not FDIC insured. The Sponsor may invest a portion of the cash held by the broker in short term Treasury Bills as collateral for open futures contracts, which is classified as a cash equivalent and is not FDIC insured.
| | | March 31, 2024 | | | December 31, 2023 | |
Money Market Funds | | $ | 20,890,251 | | | $ | 26,573,542 | |
Demand Deposit Savings Accounts | | | 10,429,941 | | | | 10,293,805 | |
Commercial Paper | | | 32,372,337 | | | | 39,878,124 | |
Total cash and cash equivalents as presented on the Statements of Assets and Liabilities | | $ | 63,692,529 | | | $ | 76,745,471 | |
Payable for Purchases of Commercial Paper
The amount recorded by the Fund for commercial paper transactions awaiting settlement, represents the amount payable for contracts purchased but not yet settled as of the reporting date. The value of the contract is included in cash and cash equivalents, and the payable amount is included as a liability.
Due from/to Broker
The amount recorded by the Fund for the amount due from and to the clearing broker includes, but is not limited to, cash held by the broker, amounts payable to the clearing broker related to open transactions, and payables for commodities futures accounts liquidating to an equity balance on the clearing broker’s records.records and amounts of brokerage commissions paid and recognized as unrealized losses.
Margin is the minimum amount of funds that must be deposited by a commodity interest trader with the trader’s broker to initiate and maintain an open position in futures contracts. A margin deposit acts to assure the trader’s performance of the futures contracts purchased or sold. Futures contracts are customarily bought and sold on initial margin that represents a very small percentage of the aggregate purchase or sales price of the contract. Because of such low margin requirements, price fluctuations occurring in the futures markets may create profits and losses that, in relation to the amount invested, are greater than are customary in other forms of investment or speculation. As discussed below, adverse price changes in the futures contract may result in margin requirements that greatly exceed the initial margin. In addition, the amount of margin required in connection with a particular futures contract is set from time to time by the exchange on which the contract is traded and may be modified from time to time by the exchange during the term of the contract. Brokerage firms, such as the Fund’s clearing brokers, carrying accounts for traders in commodity interest contracts generally require higher amounts of margin as a matter of policy to further protect themselves. Over-the-counterOver the counter trading generally involves the extension of credit between counterparties, so the counterparties may agree to require the posting of collateral by one or both parties to address credit exposure.
When a trader purchases an option, there is no margin requirement; however, the option premium must be paid in full. When a trader sells an option, on the other hand, he or she is required to deposit margin in an amount determined by the margin requirements established for the underlying interest and, in addition, an amount substantially equal to the current premium for the option. The margin requirements imposed on the selling of options, although adjusted to reflect the probability that out-of-the-money options will not be exercised, can in fact be higher than those imposed in dealing in the futures markets directly. Complicated margin requirements apply to spreads and conversions, which are complex trading strategies in which a trader acquires a mixture of options positions and positions in the underlying interest.
Ongoing or “maintenance” margin requirements are computed each day by a trader’s clearing broker. When the market value of a particular open futures contract changes to a point where the margin on deposit does not satisfy maintenance margin requirements, a margin call is made by the broker. If the margin call is not met within a reasonable time, the broker may close out the trader’s position. With respect to the Fund’s trading, the Fund (and not its shareholders personally) is subject to margin calls.
Finally, many major U.S. exchanges have passed certain cross margining arrangements involving procedures pursuant to which the futures and options positions held in an account would, in the case of some accounts, be aggregated and margin requirements would be assessed on a portfolio basis, measuring the total risk of the combined positions.
Calculation of Net Asset Value
The Fund’s NAV is calculated by:
| ● | Taking the current market value of its total assets and |
| ● | Subtracting any liabilities. |
The administrator, USBFS,Global Fund Services, calculates the NAV of the Fund once each trading day. It calculates the NAV as of the earlier of the close of the NYSE or 4:00 p.m. New York time.(ET). The NAV for a particular trading day is released after 4:15 p.m. New York time.(ET).
In determining the value of Corn Futures Contracts, the administrator uses the CBOT closing price. The administrator determines the value of all other Fund investments as of the earlier of the close of the NYSE or 4:00 p.m. New York time.(ET). The value of over-the-counter corn interests is determined based on the value of the commodity or futures contract underlying such corn interest, except that a fair value may be determined if the Sponsor believes that the Fund is subject to significant credit risk relating to the counterparty to such corn interest. For purposes of financial statements and reports, the Sponsor will recalculate the NAV where necessary to reflect the “fair value” of a Futures Contract when the Futures Contract closes at its price fluctuation limit for the day. Short term Treasury securities held by the Fund are valued by the administrator using values received from recognized third-partythird-party vendors and dealer quotes. NAV includes any unrealized profit or loss on open corn interests and any other income or expense accruing to the Fund but unpaid or not received by the Fund.
Sponsor Fee, Allocation of Expenses and Related Party Transactions
The Sponsor is responsible for investing the assets of the Fund in accordance with the objectives and policies of the Fund. In addition, the Sponsor arranges for one or more third parties to provide administrative, custodial, accounting, transfer agency and other necessary services to the Trust and the Funds. In addition, the Sponsor has elected not to outsource services directly attributable to the Trust and the Funds such as accounting, financial reporting, regulatory compliance, and trading activities.activities, which the Sponsor performs itself. In addition, the Fund is contractually obligated to pay a monthly management fee to the Sponsor, based on average daily net assets, at a rate equal to 1.00% per annum.
The Fund generally pays for all brokerage fees, taxes, and other expenses, including licensing fees for the use of intellectual property, registration or other fees paid to the SEC, FINRA, formerly the National Association of Securities Dealers, or any other regulatory agency in connection with the offer and sale of subsequent Shares after its initial registration and all legal, accounting, printing and other expenses associated therewith. The Fund also pays its portion of the fees and expenses associated with the Trust’s tax accounting and reporting requirements. Certain aggregate expenses common to all Funds within the Trust are allocated by the Sponsor to the respective fundsFund based on activity drivers deemed most appropriate by the Sponsor for such expenses, including but not limited to relative assets under management and creation and redeem order activity.
These aggregate common expenses include, but are not limited to, legal, auditing, accounting and financial reporting, tax-preparation, regulatory compliance, trading activities, and insurance costs, as well as fees paid to the Distributor, which are included in the related line item in the statements of operations. A portion of these aggregate common expenses are related to the Sponsor or related parties of principals of the Sponsor; these are necessary services to the Funds, which are primarily the cost of performing accounting and financial reporting, regulatory compliance, and trading activities that are directly attributable to the Fund. For the three months ended September 30, suchSuch expenses which are primarily recorded as distribution and marketing fees in the financial statements of each Fund.
| | | Three months ended March 31, 2024 | | | Three months ended March 31, 2023 | |
Recognized Related Party Transactions | | $ | 136,525 | | | $ | 154,915 | |
Waived Related Party Transactions | | $ | - | | | $ | - | |
The Sponsor has the ability to elect to pay certain expenses on behalf of the statement of operations, totaled $198,999 in 2017Funds or waive the management fee. This election is subject to change by the Sponsor, at its discretion. Expenses paid by the Sponsor and $216,161 in 2016; of these amounts, $68,457 in 2017 and $105,139 in 2016 wereManagement fees waived by the Sponsor. For the nine months ended September 30, suchSponsor are, if applicable, presented as waived expenses totaled $825,189 in 2017 and $726,626 in 2016; of these amounts, $164,203 in 2017 and $105,139 in 2016 were waived by the Sponsor. All asset-based fees and expenses for the Funds are calculated on the prior day’s net assets.
For the three and nine months ended September 30, 2017, there were $95,836 and $264,656 of expenses that were on the statements of operations offor each Fund. There were no expenses waived for the Fund as expenses that were waived by the Sponsor. The Sponsor has determined that there would be no recovery sought for these amounts in any future period.
For the three and nine months ended September 30, 2016, there were $134,161 of expenses that were on the statements of operations of the Fund as expenses that were waived by the Sponsor. The Sponsor has determined that there would be no recovery sought for these amounts in any future period.
As of August 21, 2017, Mr. Miller no longer retains an ownership interest in the Sponsor which is equal to or greater than 10%, March 31, 2024 and thus, is no longer a principal of the Sponsor as defined by the rules of the Commodity Futures Trading Commission.2023.
Use of Estimates
The preparation of financial statements in conformity with U.S. GAAP requires management to make estimates and assumptions that affect the reported amount of assets and liabilities and disclosure of contingent assets and liabilities at the date of the financial statements, and the reported amounts of the revenue and expenses during the reporting period. Actual results could differ from those estimates.
Fair Value - Definition and Hierarchy
In accordance with U.S. GAAP, fair value is defined as the price that would be received to sell an asset or paid to transfer a liability (i.e., the “exit price”) in an orderly transaction between market participants at the measurement date.
In determining fair value, the Fund uses various valuation approaches. In accordance with GAAP, a fair value hierarchy for inputs is used in measuring fair value that maximizes the use of observable inputs and minimizes the use of unobservable inputs by requiring that the most observable inputs be used when available. Observable inputs are those that market participants would use in pricing the asset or liability based on market data obtained from sources independent of the Fund. Unobservable inputs reflect the Fund’s assumptions about the inputs market participants would use in pricing the asset or liability developed based on the best information available in the circumstances. The fair value hierarchy is categorized into three levels based on the inputs as follows:
Level 1 - Valuations based on unadjusted quoted prices in active markets for identical assets or liabilities that the Fund has the ability to access. Valuation adjustments and block discounts are not applied to Level 1 financial instruments. Since valuations are based on quoted prices that are readily and regularly available in an active market, valuation of these financial instruments does not entail a significant degree of judgment.
Level 2 - Valuations based on quoted prices in markets that are not active or for which all significant inputs are observable, either directly or indirectly.
Level 3 - Valuations based on inputs that are unobservable and significant to the overall fair value measurement.
The availability of valuation techniques and observable inputs can vary from financial instrument to financial instrument and is affected by a wide variety of factors including, the type of financial instrument, whether the financial instrument is new and not yet established in the marketplace, and other characteristics particular to the transaction. To the extent that valuation is based on models or inputs that are less observable or unobservable in the market, the determination of fair value requires more judgment. Those estimated values do not necessarily represent the amounts that may be ultimately realized due to the occurrence of future circumstances that cannot be reasonably determined. Because of the inherent uncertainty of valuation, those estimated values may be materially higher or lower than the values that would have been used had a ready market for the financial instruments existed. Accordingly, the degree of judgment exercised by the Fund in determining fair value is greatest for financial instruments categorized in Level 3. In certain cases, the inputs used to measure fair value may fall into different levels of the fair value hierarchy. In such cases, for disclosure purposes, the level in the fair value hierarchy, within which the fair value measurement in its entirety falls, is determined based on the lowest level input that is significant to the fair value measurement.
Fair value is a market-based measure considered from the perspective of a market participant rather than an entity-specific measure. Therefore, even when market assumptions are not readily available, the Fund’s own assumptions are set to reflect those that market participants would use in pricing the asset or liability at the measurement date. The Fund uses prices and inputs that are current as of the measurement date, including during periods of market dislocation. In periods of market dislocation, the observability of prices and inputs may be reduced for many securities. This condition could cause a financial instrument to be reclassified to a lower level within the fair value hierarchy. For instance, when Corn Futures Contracts on the CBOT are not actively trading due to a “limit-up” or limit-down” condition, meaning that the daily change in the Corn Futures Contracts has exceeded the limits established, the Trust and the Fund will revert to alternative verifiable sources of valuation of its assets. When such a situation exists on a quarter close, the Sponsor will calculate the Net Asset Value (“NAV”) on a particular day using the Level 1 valuation but will later recalculate the NAV for the impacted Fund based upon the valuation inputs from these alternative verifiable sources (Level 2 or Level 3)3) and will report such NAV in its applicable financial statements and reports.
On September 30, 2017March 31, 2024 and December 31, 2016,2023, in the opinion of the Trust and the Fund, the reported value at the close of the Corn Futures Contracts traded on the CBOTmarket for each commodity contract fairly reflected the value of the Corn Futures Contracts held by the Fund,futures and no adjustments alternative valuations were necessary.required. The determination is made as of the settlement of the futures contracts on the last day of trading for the reporting period. In making the determination of a Level 1 or Level 2 transfer, the Fund considers the average volume of the specific underlying futures contracts traded on the relevant exchange for the periods being reported.
For the ninethree months ended September 30, 2017March 31, 2024 and for the year ended December 31, 2016,2023, the Fund did not have any significant transfers between any of the levels of the fair value hierarchy.
The Fund records its derivative activities at fair value. Gains and losses from derivative contracts are included in the statements of operations. Derivative contracts include futures contracts related to commodity prices. Futures, which are listed on a national securities exchange, such as the CBOT and the ICE, or reported on another national market, are generally categorized in Level 1 of the fair value hierarchy. OTC derivatives contracts (such as forward and swap contracts) which may be valued using models, depending on whether significant inputs are observable or unobservable, are categorized in Levels 2 or 3 of the fair value hierarchy.
Expenses
Expenses are recorded using the accrual method of accounting.
Net Income (Loss) per Share
Net income (loss) per share is the difference between the NAV per unit at the beginning of each period and at the end of each period. The weighted average number of units outstanding was computed for purposes of disclosing net income (loss) per weighted average unit. The weighted average units are equal to the number of units outstanding at the end of the period, adjusted proportionately for units created or redeemed based on the amount of time the units were outstanding during such period.
New Accounting Pronouncements
The Financial Accounting Standards Board (“FASB”) issued Accounting Standards Update (“ASU”) 2017-13, “Revenue Recognition (Topic 605), Leases (Topic 840), and Leases (Topic 842):issued ASU 2023-06 – Disclosure Improvements: Codification Amendments to SEC Paragraphs Pursuantin Response to the Staff Announcement atSEC’s Disclosure Update and Simplification Initiative. The amendments require an entity to disclose its accounting policy for where cash flows associated with derivative instruments and their related gains and losses are presented. The Trust and Fund already discloses the July 20,2017 EITF Meetingaccounting policy related to the derivative gains and Rescissionlosses presented on the cash flow statement. The amendment was adopted early for the period ended December 31, 2023. There is no impact to the financial statements of Prior SEC Staff Announcements and Observer Comments”the Trust or the Fund.
The FASB issued ASU 2023-01, related to Leases – (Topic 842). The amendment amendsresponse to concerns about applying Topic 842 to related party arrangements between entities under common control. The update was adopted early for the earlyquarter ended March 31, 2023; the adoption date option for certain companies related to adoption of ASU No. 2014-09 and ASU No. 2016-02. The SEC staff stated the SEC would did not object to a public business entity that otherwise would not meet the definition of a public business entity except for a requirement to include or the inclusion of its financial statements or financial information in another entity’s filing with the SEC adopting ASC Topic 842 for fiscal years beginning after December 15, 2019, and interim periods within fiscal years beginning after December 15, 2020. This amendment is not expected to have a material impact on the financial statements and disclosures of the Trust or the Fund.
The FASB issued ASU 2017-12, “Derivatives and Hedging (Topic 815): Targeted Improvements to Accounting for Hedging Activities”. These amendments refine and expand hedge accounting for both financial (e.g., interest rate) and commodity risks. Its provisions create more transparency around how economic results are presented, both on the face
The FASB issued ASU 2016-19, “Technical Corrections and Improvements”. The amendments in this update represent changes to clarify, correct errors, or make minor improvements to the Accounting Standards Codification. The amendments make the Accounting Standards Codification easier to understand and easier to apply by eliminating inconsistencies and providing clarifications. The amendments are effective for fiscal years, and interim periods with those fiscal years, for all entities beginning after December 15, 2016. The adoption did not have a material impact on the financial statements and disclosures of the Trust or the Fund.
The FASB issued ASU 2016-18, “Statement of Cash Flows (Topic 230)”. The amendments in this update require that a statement of cash flows explain the change during the period in the total of cash, cash equivalents, and amounts generally described as restricted cash or restricted cash equivalents. Therefore, amounts generally described as restricted cash and restricted cash equivalents should be included with cash and cash equivalents when reconciling the beginning-of-period and end-of-period total amounts shown on the statement of cash flows. The amendments are effective for fiscal years beginning after December 15, 2017, and interim periods within those fiscal years. This update is not expected to have a material impact on the financial statements and disclosures of the Trust or the Fund. The Sponsor believes there will be a change in presentation of restricted cash on the statements of cash flows.
The FASB issued ASU 2016-17, “Consolidation (Topic 810): Interests Held through Related Parties That are under Common Control”. The amendments in this update alters how a decision maker needs to consider indirect interests in a variable interest entity (VIE) held through an entity under common control. The new guidance amends ASU 2015-02, Consolidation (Topic 810): Amendments to the Consolidation Analysis, issued in February 2015. The amendments are effective for fiscal years beginning after December 15, 2016, including interim periods within those fiscal years. The adoption did not have a material impact on the financial statements and disclosures of the Trust or the Fund.
The FASB issued ASU 2016-15, “Statement of Cash Flows (Topic 230): Classification of Certain Cash Receipts and Cash Payments”. The amendments provide cash flow statement classification guidance. The amendments in this update are effective for fiscal years beginning after December 15, 2017. The Trust and the Fund are currently evaluating the impact on the financial statements and disclosures, but do not expect the adoption to have a material impact on the financial statements and disclosures of the Trust or the Fund. The Trust and the Fund do not expect to adopt the guidance until the effective date.
The FASB issued ASU 2014-09 in May 2014, “Revenue from Contracts with Customers (Topic 606),” which replaces the revenue recognition requirements of “Revenue Recognition (Topic 605).” This ASU is based on the principle that revenue is recognized to depict the transfer of goods and services to customers in an amount that reflects the consideration to which the entity expects to be entitled in exchange for those goods or services. This ASU provides new and more detailed guidance on specific topics and expands and improves disclosures about revenue. In August 2015, the FASB issued ASU 2015-14 which defers the effective date of ASU 2014-09 by one year to fiscal years beginning after December 15, 2017. ASU 2015-14 also permits early adoption of ASU 2014-09, but not before the original effective date, which was for fiscal years beginning after December 15, 2016. The Trust and the Fund record income or loss from the recognition and measurement of futures contracts and from interest income under Subtopic 825-10. Revenue from financial instruments which are valued under Subtopic 825 will not be subject to the application of ASU 2014-09 and 2015-14. Therefore, these standards will not have a material impact on the financial statements and disclosures of the Trust or the Fund.
The FASB issued ASU 2016-11, “Revenue Recognition (Topic 605) and Derivatives and Hedging (Topic 815): Rescission of SEC Guidance Because of Accounting Standards Updates 2014-09 and 2014-16 Pursuant to Staff Announcements at the March 3, 2016 EITF Meeting”. The amendments make targeted improvements to clarify the principal versus agent assessment and are intended to make the guidance more operable and lead to more consistent application. The Trust and the Fund record income or loss from the recognition and measurement of futures contracts and from interest income under Subtopic 825-10. Revenue from financial instruments which are valued under Subtopic 825 will not be subject to the application of ASU 2016-11. Therefore, this standard will not have a material impact on the financial statements and disclosures of the Trust or the Fund.
The FASB issued ASU 2016-02, “Leases (Topic 842).” The amendments in this update increase transparency and comparability among organizations by recognizing lease assets and lease liabilities on the balance sheet and disclosing key information about leasing arrangements. The amendments in this update are effective for fiscal years beginning after December 15, 2018. This update is not expected to have a material impact on the financial statements and disclosures of the Trust or the Fund.
The FASB issued ASU 2016-01, “Financial Instruments-Overall (Subtopic 825-10): Recognition and Measurement of Financial Assets and Financial Liabilities.” The amendments in this update are intended to improve the recognitions measurement and disclosure of financial instruments. The amendments to this update are effective for fiscal years beginning after December 15, 2017, and interim periods within those fiscal years. These amendments are required to be applied prospectively. The Trust and the Fund are currently evaluating the impact on the financial statements and disclosures; but based on our review to date we do not expect the update will have a material impact on the financial statements and disclosures of the Trust or the Fund.
Note 4– Fair Value Measurements
The Fund’s assets and liabilities recorded at fair value have been categorized based upon a fair value hierarchy as described in the Fund’s significant accounting policies in Note 2.3. The following table presents information about the Fund’s assets and liabilities measured at fair value as of September 30, 2017March 31, 2024 and December 31, 2016:2023:
September 30, 2017March 31, 2024
| | | | | | | | | | | | | Balance as of | |
| Assets: | | Level 1 | | Level 2 | | Level 3 | | Balance as of
September 30,
2017 | | | Level 1 | | | Level 2 | | | Level 3 | | | March 31, 2024 | |
| Cash equivalents | | $ | 558,225 | | $ | — | | $ | — | | $ | 558,225 | | |
Cash Equivalents | | | $ | 53,262,588 | | | $ | - | | | $ | - | | | $ | 53,262,588 | |
Commodity Futures Contracts | | | | | | | | | | |
| Corn futures contracts | | | 68,413 | | | — | | | — | | | 68,413 | | | 154,412 | | - | | - | | 154,412 | |
| Total | | $ | 626,638 | | $ | — | | $ | — | | $ | 626,638 | | | $ | 53,417,000 | | $ | - | | $ | - | | $ | 53,417,000 | |
| Liabilities: | | Level 1 | | Level 2 | | Level 3 | | Balance as of
September 30,
2017 | | |
| | | | | | | | | | | | | Balance as of | |
Liabilities | | | Level 1 | | | Level 2 | | | Level 3 | | | March 31, 2024 | |
Commodity Futures Contracts | | |
| Corn futures contracts | | $ | 2,498,213 | | | $ | — | | | $ | — | | | $ | 2,498,213 | | | $ | 3,932,723 | | | $ | - | | | $ | - | | | $ | 3,932,723 | |
December 31, 20162023
| | | | | | | | | | | | | Balance as of | |
| Assets: | | Level 1 | | Level 2 | | Level 3 | | Balance as of
December 31, 2016 | | | Level 1 | | | Level 2 | | | Level 3 | | | December 31, 2023 | |
| Cash equivalents | | $ | 692,293 | | $ | — | | $ | — | | $ | 692,293 | | |
Cash Equivalents | | | $ | 66,451,666 | | | $ | - | | | $ | - | | | $ | 66,451,666 | |
| Liabilities: | | Level 1 | | Level 2 | | Level 3 | | Balance as of
December 31,
2016 | | |
| | | | | | | | | | | | | Balance as of | |
Liabilities | | | Level 1 | | | Level 2 | | | Level 3 | | | December 31, 2023 | |
| Corn futures contracts | | $ | 1,460,800 | | $ | — | | $ | — | | $ | 1,460,800 | | | $ | 2,182,141 | | | $ | - | | | $ | - | | | $ | 2,182,141 | |
For the ninethree months ended September 30, 2017March 31, 2024 and year ended December 31, 2016,2023, the Fund did not have any significant transfers between any of the levels of the fair value hierarchy.
See theFair Value - Definition and Hierarchy section in Note 3 above for an explanation of the transfers into and out of each level of the fair value hierarchy.
Note 5– Derivative Instruments and Hedging Activities
In the normal course of business, the Fund utilizes derivative contracts in connection with its proprietary trading activities. Investments in derivative contracts are subject to additional risks that can result in a loss of all or part of an investment. The Fund’s derivative activities and exposure to derivative contracts are classified by the following primary underlying risks: interest rate, credit, commodity price, and equity price risks. In addition to its primary underlying risks, the Fund is also subject to additional counterparty risk due to inability of its counterparties to meet the terms of their contracts. For ninethe three months ended September 30, 2017March 31, 2024 and year ended December 31, 2016,2023, the Fund invested only in commodity futures contracts.
Futures Contracts
The Fund is subject to commodity price risk in the normal course of pursuing its investment objectives. A futures contract represents a commitment for the future purchase or sale of an asset at a specified price on a specified date.
The purchase and sale of futures contracts requires margin deposits with aan FCM. Subsequent payments (variation margin) are made or received by the Fund each day, depending on the daily fluctuations in the value of the contract, and are recorded as unrealized gains or losses by the Fund. Futures contracts may reduce the Fund’s exposure to counterparty risk since futures contracts are exchange-traded; and the exchange’s clearinghouse, as the counterparty to all exchange-traded futures, guarantees the futures against default.
The Commodity Exchange Act requires an FCM to segregate all customer transactions and assets from the FCM’s proprietary activities. A customer’s cash and other equity deposited with an FCM are considered commingled with all other customer funds subject to the FCM’s segregation requirements. In the event of an FCM’s insolvency, recovery may be limited to the Fund’s pro rata share of segregated customer funds available. It is possible that the recovery amount could be less than the total of cash and other equity deposited.
The following table discloses information about offsetting assets and liabilities presented in the statements of assets and liabilities to enable users of these financial statements to evaluate the effect or potential effect of netting arrangements for recognized assets and liabilities. These recognized assets and liabilities are presented as defined in FASB ASU No. 2011-112011-11 “Balance Sheet (Topic 210)210): Disclosures about Offsetting Assets and Liabilities” and subsequently clarified in FASB ASU 2013-012013-01 “Balance Sheet (Topic 210)210): Clarifying the Scope of Disclosures about Offsetting Assets and Liabilities.”
The following table also identifies the fair value amounts of derivative instruments included in the statements of assets and liabilities as derivative contracts, categorized by primary underlying risk, and held by the FCM, ED&F ManFCMs, Marex and StoneX as of September 30, 2017March 31, 2024, and December 31, 2016.2023.
*The amount of collateral presented in Collateral, Due from Broker, is limited to the liability for the futures contracts and accordingly does not include the excess collateral pledged.
Offsetting of Financial Assets and Derivative Assets as of September 30, 2017March 31, 2024
| | | (i) | | (i) | | (iii) = (i) – (ii) | | (iv) | | (v) = (iii) –(iv) | | | (i) | | (ii) | | (iii) = (i)-(ii) | | (iv) | | (v)=(iii)-(iv) | |
| | | | | | | | | Gross Amount Not Offset in the Statement of Assets and
Liabilities | | | | | | | | | | | | | | | | | Gross Amount Not Offset in the Statement of Assets and Liabilities | | | | |
| Description | | Gross
Amount
of Recognized
Assets | | Gross
Amount
Offset in the
Statement of
Assets and
Liabilities | | Net Amount
Presented in
the
Statement of
Assets and
Liabilities | | Futures
Contracts
Available for
Offset | Collateral,
Due
from Broker | | Net Amount | | | Gross Amount of Recognized Assets | | | Gross Amount Offset in the Statement of Assets and Liabilities | | | Net Amount Presented in the Statement of Assets and Liabilities | | | Futures Contracts Available for Offset | | | Collateral, Due to Broker | | | Net Amount | |
| Commodity price | | | | | | | | | | | | | | | | | | | |
Commodity Price | | | | | | | | | | | | | | |
| Corn futures contracts | | $ | 68,413 | | | $ | — | | | $ | 68,413 | | $ | 68,413 | | $ | — | | $ | — | | | $ | 154,412 | | | $ | - | | | $ | 154,412 | | | $ | 154,412 | | | $ | - | | | $ | - | |
Offsetting of Financial Liabilities and Derivative Liabilities as of September 30, 2017March 31, 2024
| | | (i) | | (ii) | | (iii) = (i) – (ii) | | | (iv) | | | (v) = (iii) – (iv) | | (i) | | (ii) | | (iii) = (i)-(ii) | | (iv) | | (v)=(iii)-(iv) | |
| | | | | | | | | | Gross Amount Not Offset in the Statement of Assets and
Liabilities | | | | | | | | | | | | | | Gross Amount Not Offset in the Statement of Assets and Liabilities | | | |
| Description | | Gross
Amount
of
Recognized
Liabilities | | Gross
Amount
Offset in the
Statement of
Assets and
Liabilities |
| | Net Amount
Presented in
the
Statement of
Assets and
Liabilities | | | Futures
Contracts
Available for
Offset | | Collateral,
Due
to Broker | | | Net Amount | | Gross Amount of Recognized Liabilities | | | Gross Amount Offset in the Statement of Assets and Liabilities | | | Net Amount Presented in the Statement of Assets and Liabilities | | | Futures Contracts Available for Offset | | | Collateral, Due from Broker* | | | Net Amount | |
| Commodity price | | | | | | | | | | | | | | | | | | | |
Commodity Price | | |
| Corn futures contracts | | $ | 2,498,213 | | $ | — | | $ | 2,498,213 | | | $ | 68,413 | | $ | 2,429,800 | | | $ | — | | | $ | 3,932,723 | | | $ | - | | | $ | 3,932,723 | | | $ | 154,412 | | | $ | 3,778,311 | | | $ | - | |
Offsetting of Financial Liabilities and Derivative Liabilities as of December 31, 20162023
| | | (i) | | (ii) | | (iii) = (i) – (ii) | | (iv) | | (v) = (iii) – (iv) | | | (i) | | (ii) | | (iii) = (i)-(ii) | | (iv) | | (v)=(iii)-(iv) | |
| | | | | | | | | Gross Amount Not Offset in
the Statement of Assets and
Liabilities | | | | | | | | | | | | | | Gross Amount Not Offset in the Statement of Assets and Liabilities | | | |
| Description | | Gross
Amount
of Recognized
Liabilities | | Gross
Amount
Offset in the
Statement of
Assets and
Liabilities | | Net Amount
Presented in
the
Statement of
Assets and
Liabilities | | Futures
Contracts Available for Offset | | Collateral, Due
to Broker | | Net Amount | | | Gross Amount of Recognized Liabilities | | | Gross Amount Offset in the Statement of Assets and Liabilities | | | Net Amount Presented in the Statement of Assets and Liabilities | | | Futures Contracts Available for Offset | | | Collateral, Due from Broker* | | | Net Amount | |
| Commodity price | | | | | | | | | | | | | | | | | | | |
Commodity Price | | |
| Corn futures contracts | | $ | 1,460,800 | | | $ | — | | $ | 1,460,800 | | $ | — | | $ | 1,460,800 | | $ | — | | | $ | 2,182,141 | | | $ | - | | | $ | 2,182,141 | | | $ | - | | | $ | 2,182,141 | | | $ | - | |
The following tables identify the net gain and loss amounts included in the statements of operations as realized and unrealized gains and losses on trading of commodity futures contracts categorized by primary underlying risk:
Three months ended September 30, 2017March 31, 2024
| Primary Underlying Risk | | | Realized Loss on
Commodity Futures Contracts | | | Net Change in Unrealized
Depreciation on Commodity
Futures Contracts | |
| Commodity Price | | | | | | | | | |
| Corn futures contracts | | | $ | (1,616,988 | ) | | $ | (3,363,975 | ) |
| | | Realized Loss on Commodity Futures Contracts | | | Net Change in Unrealized Depreciation on Commodity Futures Contracts | |
Commodity Price | | | | | | | | |
Corn futures contracts | | $ | (3,964,335 | ) | | $ | (1,596,170 | ) |
Three months ended September 30, 2016March 31, 2023
| | | | | | | | |
| Primary Underlying Risk | | | Realized Loss on
Commodity Futures Contracts | | | Net Change in Unrealized
Appreciation on Commodity
Futures Contracts | |
| Commodity Price | | | | | | | | | |
| Corn futures contracts | | | $ | (6,486,500 | ) | | $ | 937,100 | |
Nine months ended September 30, 2017
| | | | | | | | |
| Primary Underlying Risk | | | Realized Loss on
Commodity Futures Contracts | | | Net Change in Unrealized
Depreciation on Commodity
Futures Contracts | |
| Commodity Price | | | | | | | | | |
| Corn futures contracts | | | $ | (2,064,200 | ) | | $ | (969,000 | ) |
Nine months ended September 30, 2016
| | | | | | | | | Realized Loss on Commodity Futures Contracts | | | Net Change in Unrealized Depreciation on Commodity Futures Contracts | |
| Primary Underlying Risk | | Realized Loss on
Commodity Futures Contracts | | | Net Change in Unrealized
Appreciation on Commodity
Futures Contracts | | |
| Commodity Price | | | | | | |
| Corn futures contracts | | $ | (8,878,588 | ) | | $ | 1,188,163 | | | $ | (6,268,935 | ) | | $ | (3,299,360 | ) |
Volume of Derivative Activities
The average notional market value categorized by primary underlying risk for the futures contracts held was $67.0 million and $68.2$69.4 million for the three and nine months ended September 30, 2017March 31, 2024 and $81.5 million and $67.0$126.4 million for the same periods in 2016.three months ended March 31, 2023.
Note 6– Financial Highlights
The following tables present per unit performance data and other supplemental financial data for the three and nine months ended September 30, 2017 March 31, 2024 and 2016.2023. This information has been derived from information presented in the financial statements and is presented with total expenses gross of expenses waived by the Sponsor and with total expenses net of expenses waived by the Sponsor, as appropriate.
| | | | Three months ended | | Three months ended | |
| | | | March 31, 2024 | | | March 31, 2023 | |
| Per Share Operation Performance | | Three months ended
September 30, 2017 | | | Three months ended
September 30, 2016 | | | Nine months ended
September 30, 2017 | | | Nine months ended
September 30, 2016 | | | | | |
| Net asset value at beginning of period | | $ | 19.09 | | | $ | 20.34 | | | $ | 18.77 | | | $ | 21.24 | | | $ | 21.61 | | | $ | 26.90 | |
| Income (loss) from investment operations: | | | | | | | | | | | | | | | | | |
| Investment Income | | | 0.06 | | | | 0.03 | | | | 0.15 | | | | 0.08 | | |
Income from investment operations: | | |
Interest income | | | 0.27 | | | 0.28 | |
| Net realized and unrealized loss on commodity futures contracts | | | (1.38 | ) | | | (1.48 | ) | | | (0.79 | ) | | | (1.95 | ) | | (1.53 | ) | | (1.77 | ) |
| Total expenses | | | (0.17 | ) | | | (0.18 | ) | | | (0.53 | ) | | | (0.66 | ) | |
Total expenses, net | | | | (0.13 | ) | | | (0.14 | ) |
| Net decrease in net asset value | | | (1.49 | ) | | | (1.63 | ) | | | (1.17 | ) | | | (2.53 | ) | | | (1.39 | ) | | | (1.63 | ) |
| Net asset value at end of period | | $ | 17.60 | | | $ | 18.71 | | | $ | 17.60 | | | $ | 18.71 | | | $ | 20.22 | | | $ | 25.27 | |
| Total Return | | | (7.81 | )% | | | (8.01 | )% | | | (6.23 | )% | | | (11.91 | )% | | -6.47 | % | | -6.03 | % |
| Ratios to Average Net Assets (Annualized) | | | | | | | | | | | | | | | | | | | | |
| Total expenses | | | 4.35 | % | | | 4.37 | % | | | 4.29 | % | | | 4.61 | % | | 2.72 | % | | 2.13 | % |
| Total expense, net | | | 3.78 | % | | | 3.70 | % | | | 3.78 | % | | | 4.35 | % | |
| Net investment loss | | | (2.49 | )% | | | (3.16 | )% | | | (2.72 | )% | | | (3.81 | )% | |
Total expenses, net | | | 2.72 | % | | 2.13 | % |
Net investment income | | | 2.60 | % | | 2.29 | % |
The financial highlights per share data are calculated consistent with the methodology used to calculate asset-based fees and expenses.
Note 7– Organizational and Offering Costs
Expenses incurred in organizing of the Trust and the initial offering of the Shares of the Fund, including applicable SEC registration fees were borne directly by the Sponsor. The Fund will not be obligated to reimburse the Sponsor.
Note 8– Subsequent Events
Management has evaluated the financial statements for the quarter-ended September 30, 2017March 31, 2024 for subsequent events through the date of this filing and noted no material events requiring either recognition through the date of the filing or disclosure herein for the Fund other than those noted below:
Effective October 3, 2017, CORN purchased Commercial Paper with maturities of ninety days or less as described in the prospectus supplements filed with the SEC on October 2, 2017.Fund.
TEUCRIUM SOYBEAN FUND
STATEMENTS OF ASSETS AND LIABILITIES
| | | September 30, 2017 | | | December 31, 2016 | |
| | | | (Unaudited) | | | | | |
| Assets | | | | | | | | |
| Cash and cash equivalents | | $ | 19,199,547 | | | $ | 12,300,383 | |
| Interest receivable | | | 231 | | | | 38 | |
| Restricted cash | | | 21,616 | | | | 77,616 | |
| Other assets | | | 18,151 | | | | 4,104 | |
| Equity in trading accounts: | | | | | | | | |
| Commodity futures contracts | | | 135,175 | | | | 357,500 | |
| Due from broker | | | 804,693 | | | | 170,973 | |
| Total equity in trading accounts | | | 939,868 | | | | 528,473 | |
| Total assets | | | 20,179,413 | | | | 12,910,614 | |
| | | | | | | | | |
| Liabilities | | | | | | | | |
| Management fee payable to Sponsor | | | 9,865 | | | | 11,891 | |
| Other liabilities | | | 2,227 | | | | 4,598 | |
| Equity in trading accounts: | | | | | | | | |
| Commodity futures contracts | | | — | | | | 12,025 | |
| Total liabilities | | | 12,092 | | | | 28,514 | |
| | | | | | | | | |
| Net assets | | $ | 20,167,321 | | | $ | 12,882,100 | |
| | | | | | | | | |
| Shares outstanding | | | 1,100,004 | | | | 675,004 | |
| | | | | | | | | |
| Net asset value per share | | $ | 18.33 | | | $ | 19.08 | |
| | | | | | | | | |
| Market value per share | | $ | 18.36 | | | $ | 19.10 | |
The accompanying notes are an integral part of these financial statements.
TEUCRIUM SOYBEAN FUND
SCHEDULESTATEMENTS OF INVESTMENTS
September 30, 2017
(Unaudited)ASSETS AND LIABILITIES
| Description: Assets | | Fair Value | | | Percentage of Net Assets | | | Shares | |
| | | | | | | | | | |
| Cash equivalents | | | | | | | | | | | | |
| Money market funds | | | | | | | | | | | | |
| Fidelity Institutional Money Market Funds - Government Portfolio (cost $1,477,379) | | $ | 1,477,379 | | | | 7.33 | % | | | 1,477,379 | |
| | | March 31, 2024 | | | December 31, 2023 | |
| | | (Unaudited) | | | | | |
Assets | | | | | | | | |
Cash and cash equivalents | | $ | 32,652,507 | | | $ | 28,107,189 | |
Interest receivable | | | 53,269 | | | | 36,662 | |
Other assets | | | 883 | | | | - | |
Equity in trading accounts: | | | | | | | | |
Due from broker | | | 2,165,633 | | | | 2,385,040 | |
Total assets | | | 34,872,292 | | | | 30,528,891 | |
| | | | | | | | | |
Liabilities | | | | | | | | |
Management fee payable to Sponsor | | | 26,755 | | | | 25,659 | |
Other liabilities | | | 83,798 | | | | 55,551 | |
Equity in trading accounts: | | | | | | | | |
Commodity futures contracts | | | 794,976 | | | | 1,391,661 | |
Total liabilities | | | 905,529 | | | | 1,472,871 | |
| | | | | | | | | |
Net assets | | $ | 33,966,763 | | | $ | 29,056,020 | |
| | | | | | | | | |
Shares outstanding | | | 1,350,004 | | | | 1,075,004 | |
| | | | | | | | | |
Shares authorized | | | * | | | | * | |
| | | | | | | | | |
Net asset value per share | | $ | 25.16 | | | $ | 27.03 | |
| | | | | | | | | |
Market value per share | | $ | 25.21 | | | $ | 27.01 | |
| | | | | | | | | Notional Amount
(Long Exposure) | |
| Commodity futures contracts | | | | | | | | | | | | |
| United States soybean futures contracts | | | | | | | | | | | | |
| CBOT soybean futures JAN18 (144 contracts) | | $ | 18,450 | | | | 0.09 | % | | $ | 7,045,200 | |
| CBOT soybean futures MAR18 (123 contracts) | | | 67,400 | | | | 0.33 | | | | 6,074,663 | |
| CBOT soybean futures NOV18 (143 contracts) | | | 49,325 | | | | 0.24 | | | | 7,051,688 | |
| Total commodity futures contracts | | $ | 135,175 | | | | 0.66 | % | | $ | 20,171,551 | |
The accompanying notes are* On April 7, 2022, the Teucrium Soybean Fund registered an integral partindeterminate number of these financial statements.shares of the Fund pursuant to Rule 456(d) under the Securities Act of 1933.
TEUCRIUM SOYBEAN FUND
SCHEDULE OF INVESTMENTS
December 31, 2016
| Description: Assets | | Fair Value | | | Percentage of
Net Assets | | | Shares | |
| | | | | | | | | | |
| Cash equivalents | | | | | | | | | | | | |
| Money market funds | | | | | | | | | | | | |
| Fidelity Investments Money Market Funds - Government Portfolio (cost $185,661) | | $ | 185,661 | | | | 1.44 | % | | | 185,661 | |
| | | | | | | | | Notional Amount
(Long Exposure) | |
| Commodity futures contracts | | | | | | | | | |
| United States soybean futures contracts | | | | | | | | | |
| CBOT soybean futures MAR17 (90 contracts) | | $ | 107,125 | | | | 0.83 | % | | $ | 4,518,000 | |
| CBOT soybean futures NOV17 (91 contracts) | | | 250,375 | | | | 1.95 | | | | 4,501,088 | |
| Total commodity futures contracts | | $ | 357,500 | | | | 2.78 | % | | $ | 9,019,088 | |
| Description: Liabilities | | Fair Value | | | Percentage of Net Assets | | | Notional Amount
(Long Exposure) | |
| | | | | | | | | | |
| Commodity futures contracts | | | | | | | | | | | | |
| United States soybean futures contracts | | | | | | | | | | | | |
| CBOT soybean futures MAY17 (76 contracts) | | $ | 12,025 | | | | 0.09 | % | | $ | 3,847,500 | |
The accompanying notes are an integral part of these financial statements.
TEUCRIUM SOYBEAN FUND
STATEMENTSSCHEDULE OF OPERATIONSINVESTMENTS
March 31, 2024
(Unaudited)
| | | Three months ended September 30, 2017 | | | Three months ended September 30, 2016 | | | Nine months ended September 30, 2017 | | | Nine months ended September 30, 2016 | |
| Income | | | | | | | | | | | | | | | | |
| Realized and unrealized (loss) gain on trading of commodity futures contracts: | | | | | | | | | | | | | | | | |
| Realized (loss) gain on commodity futures contracts | | $ | (24,025 | ) | | $ | 28,163 | | | $ | 7,475 | | | $ | 990,062 | |
| Net change in unrealized appreciation or depreciation on commodity futures contracts | | | 241,863 | | | | (1,612,025 | ) | | | (210,300 | ) | | | (21,100 | ) |
| Interest income | | | 39,234 | | | | 16,996 | | | | 96,402 | | | | 44,291 | |
| Total income (loss) | | | 257,072 | | | | (1,566,866 | ) | | | (106,423 | ) | | | 1,013,253 | |
| | | | | | | | | | | | | | | | | |
| Expenses | | | | | | | | | | | | | | | | |
| Management fees | | | 30,157 | | | | 31,398 | | | | 90,382 | | | | 83,216 | |
| Professional fees | | | 39,502 | | | | 77,033 | | | | 106,251 | | | | 96,954 | |
| Distribution and marketing fees | | | 54,527 | | | | 59,675 | | | | 134,724 | | | | 154,687 | |
| Custodian fees and expenses | | | 7,908 | | | | 7,291 | | | | 18,479 | | | | 19,231 | |
| Business permits and licenses fees | | | 4,223 | | | | 4,451 | | | | 13,759 | | | | 13,598 | |
| General and administrative expenses | | | 6,515 | | | | 7,453 | | | | 17,354 | | | | 21,856 | |
| Brokerage commissions | | | 2,007 | | | | — | | | | 5,406 | | | | 1,507 | |
| Other expenses | | | 2,613 | | | | 2,346 | | | | 6,348 | | | | 7,792 | |
| Total expenses | | | 147,452 | | | | 189,647 | | | | 392,703 | | | | 398,841 | |
| | | | | | | | | | | | | | | | | |
| Expenses waived by the Sponsor | | | (31,348 | ) | | | (63,113 | ) | | | (58,457 | ) | | | (63,113 | ) |
| | | | | | | | | | | | | | | | | |
| Total expenses, net | | | 116,104 | | | | 126,534 | | | | 334,246 | | | | 335,728 | |
| | | | | | | | | | | | | | | | | |
| Net income (loss) | | $ | 140,968 | | | $ | (1,693,400 | ) | | $ | (440,669 | ) | | $ | 677,525 | |
| | | | | | | | | | | | | | | | | |
| Net income (loss) per share | | $ | 0.23 | | | $ | (2.84 | ) | | $ | (0.75 | ) | | $ | 1.19 | |
| Net income (loss) per weighted average share | | $ | 0.22 | | | $ | (2.58 | ) | | $ | (0.68 | ) | | $ | 1.15 | |
| Weighted average shares outstanding | | | 650,004 | | | | 656,526 | | | | 649,638 | | | | 588,234 | |
| | | | | | | | | | | | | | | Percentage of | | | | | |
Description: Assets | | Yield | | | Cost | | | Fair Value | | | Net Assets | | | Shares | |
| | | | | | | | | | | | | | | | | | | | | |
Cash equivalents | | | | | | | | | | | | | | | | | | | | |
Money market funds | | | | | | | | | | | | | | | | | | | | |
First American Government Obligations Fund - Class X | | | 5.240 | % | | $ | 7,780,493 | | | $ | 7,780,493 | | | | 22.91 | % | | | 7,780,493 | |
Goldman Sachs Financial Square Government Fund - Institutional Class | | | 5.210 | % | | | 4,447,673 | | | | 4,447,673 | | | | 13.09 | | | | 4,447,673 | |
Total money market funds | | | | | | $ | 12,228,166 | | | $ | 12,228,166 | | | | 36.00 | % | | | | |
The accompanying notes are an integral part of these financial statements.
| | Maturity | | | | | | | | | | | | | | Percentage of | | | Principal | |
| | Date | | Yield | | | Cost | | | Fair Value | | | Net Assets | | | Amount | |
Commercial Paper | | | | | | | | | | | | | | | | | | | | | |
FMC Corporation | April 22, 2024 | | | 5.755 | % | | $ | 2,487,815 | | | $ | 2,491,746 | | | | 7.34 | % | | | 2,500,000 | |
General Motors Financial Company, Inc. | April 29, 2024 | | | 5.408 | % | | | 2,475,663 | | | | 2,489,675 | | | | 7.33 | | | | 2,500,000 | |
Glencore Funding LLC | April 30, 2024 | | | 5.493 | % | | | 2,482,375 | | | | 2,489,125 | | | | 7.33 | | | | 2,500,000 | |
Glencore Funding LLC | May 10, 2024 | | | 5.475 | % | | | 2,480,199 | | | | 2,485,429 | | | | 7.32 | | | | 2,500,000 | |
National Fuel Gas Company | April 4, 2024 | | | 5.544 | % | | | 2,492,038 | | | | 2,498,863 | | | | 7.36 | | | | 2,500,000 | |
Stanley Black & Decker, Inc. | April 4, 2024 | | | 5.604 | % | | | 2,493,867 | | | | 2,498,850 | | | | 7.36 | | | | 2,500,000 | |
Total Commercial Paper | | | | | | $ | 14,911,957 | | | $ | 14,953,688 | | | | 44.04 | % | | | | |
Total Cash Equivalents | | | | | | | | | | $ | 27,181,854 | | | | 80.04 | % | | | | |
TEUCRIUM SOYBEAN FUND
STATEMENTS OF CHANGES IN NET ASSETS
(Unaudited)
| | | Nine months ended September 30, 2017 | | | Nine months ended September 30, 2016 | |
| Operations | | | | | | | | |
| Net (loss) income | | $ | (440,669 | ) | | $ | 677,525 | |
| Capital transactions | | | | | | | | |
| Issuance of Shares | | | 11,934,318 | | | | 8,210,615 | |
| Redemption of Shares | | | (4,208,428 | ) | | | (1,954,480 | ) |
| Total capital transactions | | | 7,725,890 | | | | 6,256,135 | |
| Net change in net assets | | | 7,285,221 | | | | 6,933,660 | |
| | | | | | | | | |
| Net assets, beginning of period | | $ | 12,882,100 | | | $ | 6,502,552 | |
| | | | | | | | | |
| Net assets, end of period | | $ | 20,167,321 | | | $ | 13,436,212 | |
| | | | | | | | | |
| Net asset value per share at beginning of period | | $ | 19.08 | | | $ | 17.34 | |
| | | | | | | | | |
| Net asset value per share at end of period | | $ | 18.33 | | | $ | 18.53 | |
| | | | | | | | | |
| Creation of Shares | | | 650,000 | | | | 450,000 | |
| Redemption of Shares | | | 225,000 | | | | 100,000 | |
| | | Number of | | | | | | | Percentage of | | | Notional Amount | |
Description: Liabilities | | Contracts | | | Fair Value | | | Net Assets | | | (Long Exposure) | |
| | | | | | | | | | | | | | | | | |
Commodity futures contracts | | | | | | | | | | | | | | | | |
United States soybean futures contracts | | | | | | | | | | | | | | | | |
CBOT soybean futures JUL24 | | | 197 | | | $ | 308,999 | | | | 0.91 | % | | $ | 11,871,713 | |
CBOT soybean futures NOV24 | | | 172 | | | | 478,846 | | | | 1.41 | | | | 10,201,750 | |
CBOT soybean futures NOV25 | | | 204 | | | | 7,131 | | | | 0.02 | | | | 11,860,050 | |
Total commodity futures contracts | | | | | | $ | 794,976 | | | | 2.34 | % | | $ | 33,933,513 | |
The accompanying notes are an integral part of these financial statements.
42
TEUCRIUM SOYBEAN FUND
STATEMENTSSCHEDULE OF CASH FLOWSINVESTMENTS
(Unaudited)December 31, 2023
| | | Nine months ended | | | Nine months ended | |
| | | September 30, 2017 | | | September 30, 2016 | |
| Cash flows from operating activities: | | | | | | | | |
| Net (loss) income | | $ | (440,669 | ) | | $ | 677,525 | |
| Adjustments to reconcile net (loss) income to net cash (used in) provided by operating activities: | | | | | | | | |
| Net change in unrealized appreciation on commodity futures contracts | | | 210,300 | | | | 21,100 | |
| Changes in operating assets and liabilities: | | | | | | | | |
| Due from broker | | | (633,720 | ) | | | (429,267 | ) |
| Interest receivable | | | (193 | ) | | | (1,415 | ) |
| Restricted cash | | | 56,000 | | | | 39,000 | |
| Other assets | | | (14,047 | ) | | | (4,940 | ) |
| Management fee payable to Sponsor | | | (2,026 | ) | | | 4,966 | |
| Other liabilities | | | (2,371 | ) | | | (3,035 | ) |
| Net cash (used in) provided by operating activities | | | (826,726 | ) | | | 303,934 | |
| | | | | | | | | |
| Cash flows from financing activities: | | | | | | | | |
| Proceeds from sale of Shares | | | 11,934,318 | | | | 8,210,615 | |
| Redemption of Shares | | | (4,208,428 | ) | | | (1,954,480 | ) |
| Net cash provided by financing activities | | | 7,725,890 | | | | 6,256,135 | |
| | | | | | | | | |
| Net change in cash and cash equivalents | | | 6,899,164 | | | | 6,560,069 | |
| Cash and cash equivalents, beginning of period | | | 12,300,383 | | | | 5,937,824 | |
| Cash and cash equivalents, end of period | | $ | 19,199,547 | | | $ | 12,497,893 | |
| | | | | | | | | | | | | | | Percentage of | | | | | |
Description: Assets | | Yield | | | Cost | | | Fair Value | | | Net Assets | | | Shares | |
| | | | | | | | | | | | | | | | | | | | | |
Cash equivalents | | | | | | | | | | | | | | | | | | | | |
Money market funds | | | | | | | | | | | | | | | | | | | | |
U.S. Bank Deposit Account | | | 5.270 | % | | $ | 1,075,007 | | | $ | 1,075,007 | | | | 3.70 | % | | | 1,075,007 | |
Goldman Sachs Financial Square Government Fund - Institutional Class | | | 5.250 | % | | | 6,671,092 | | | | 6,671,092 | | | | 22.96 | | | | 6,671,092 | |
Total money market funds | | | | | | $ | 7,746,099 | | | $ | 7,746,099 | | | | 26.66 | % | | | | |
| | Maturity | | | | | | | | | | | | | | Percentage of | | | Principal | |
| | Date | | Yield | | | Cost | | | Fair Value | | | Net Assets | | | Amount | |
Commercial Paper | | | | | | | | | | | | | | | | | | | | | |
Albemarle Corporation | January 8, 2024 | | | 5.738 | % | | $ | 2,476,151 | | | $ | 2,497,263 | | | | 8.59 | % | | | 2,500,000 | |
Brookfield Infrastructure Holdings (Canada) Inc. | January 9, 2024 | | | 5.794 | % | | | 2,489,708 | | | | 2,496,833 | | | | 8.59 | | | | 2,500,000 | |
FMC Corporation | January 19, 2024 | | | 5.816 | % | | | 2,488,878 | | | | 2,492,850 | | | | 8.58 | | | | 2,500,000 | |
Harley-Davidson Financial Services, Inc. | February 1, 2024 | | | 5.867 | % | | | 2,480,400 | | | | 2,487,600 | | | | 8.56 | | | | 2,500,000 | |
Stanley Black & Decker, Inc. | January 22, 2024 | | | 5.807 | % | | | 2,479,021 | | | | 2,491,688 | | | | 8.58 | | | | 2,500,000 | |
WGL Holdings, Inc. | January 12, 2024 | | | 5.849 | % | | | 2,487,222 | | | | 2,495,608 | | | | 8.59 | | | | 2,500,000 | |
Total Commercial Paper | | | | | | $ | 14,901,380 | | | $ | 14,961,842 | | | | 51.49 | % | | | | |
Total Cash Equivalents | | | | | | | | | | $ | 22,707,941 | | | | 78.15 | % | | | | |
| | | Number of | | | | | | | Percentage of | | | Notional Amount | |
Description: Liabilities | | Contracts | | | Fair Value | | | Net Assets | | | (Long Exposure) | |
| | | | | | | | | | | | | | | | | |
Commodity futures contracts | | | | | | | | | | | | | | | | |
United States soybean futures contracts | | | | | | | | | | | | | | | | |
CBOT soybean futures MAR24 | | | 156 | | | $ | 617,118 | | | | 2.12 | % | | $ | 10,124,400 | |
CBOT soybean futures MAY24 | | | 133 | | | | 633,749 | | | | 2.18 | | | | 8,693,213 | |
CBOT soybean futures NOV24 | | | 164 | | | | 140,794 | | | | 0.48 | | | | 10,215,150 | |
Total commodity futures contracts | | | | | | $ | 1,391,661 | | | | 4.78 | % | | $ | 29,032,763 | |
The accompanying notes are an integral part of these financial statements.
TEUCRIUM SOYBEAN FUND
STATEMENTS OF OPERATIONS
(Unaudited)
| | | Three months ended | | | Three months ended | |
| | | March 31, 2024 | | | March 31, 2023 | |
Income | | | | | | | | |
Realized and unrealized gain (loss) on trading of commodity futures contracts: | | | | | | | | |
Realized (loss) gain on commodity futures contracts | | $ | (2,632,854 | ) | | $ | 1,067,543 | |
Net change in unrealized appreciation/(depreciation) on commodity futures contracts | | | 596,685 | | | | (3,699,642 | ) |
Interest income | | | 380,411 | | | | 511,623 | |
Total loss | | | (1,655,758 | ) | | | (2,120,476 | ) |
| | | | | | | | | |
Expenses | | | | | | | | |
Management fees | | | 70,722 | | | | 114,690 | |
Professional fees | | | 38,420 | | | | 57,998 | |
Distribution and marketing fees | | | 100,750 | | | | 69,185 | |
Custodian fees and expenses | | | 8,486 | | | | 3,441 | |
Business permits and licenses fees | | | 6,269 | | | | 2,294 | |
General and administrative expenses | | | 7,072 | | | | 2,294 | |
Total expenses | | | 231,719 | | | | 249,902 | |
| | | | | | | | | |
Expenses waived by the Sponsor | | | - | | | | - | |
| | | | | | | | | |
Total expenses, net | | | 231,719 | | | | 249,902 | |
| | | | | | | | | |
Net loss | | $ | (1,887,477 | ) | | $ | (2,370,378 | ) |
| | | | | | | | | |
Net loss per share | | $ | (1.87 | ) | | $ | (1.31 | ) |
Net loss per weighted average share | | $ | (1.67 | ) | | $ | (1.42 | ) |
Weighted average shares outstanding | | | 1,129,400 | | | | 1,668,615 | |
The accompanying notes are an integral part of these financial statements.
TEUCRIUM SOYBEAN FUND
STATEMENTS OF CHANGES IN NET ASSETS
(Unaudited)
| | | Three months ended | | | Three months ended | |
| | | March 31, 2024 | | | March 31, 2023 | |
Operations | | | | | | | | |
Net loss | | $ | (1,887,477 | ) | | $ | (2,370,378 | ) |
Capital transactions | | | | | | | | |
Issuance of Shares | | | 8,094,215 | | | | 3,526,043 | |
Redemption of Shares | | | (1,295,995 | ) | | | (21,521,150 | ) |
Total capital transactions | | | 6,798,220 | | | | (17,995,107 | ) |
Net change in net assets | | | 4,910,743 | | | | (20,365,485 | ) |
| | | | | | | | | |
Net assets, beginning of period | | $ | 29,056,020 | | | $ | 58,429,985 | |
| | | | | | | | | |
Net assets, end of period | | $ | 33,966,763 | | | $ | 38,064,500 | |
| | | | | | | | | |
Net asset value per share at beginning of period | | $ | 27.03 | | | $ | 28.50 | |
| | | | | | | | | |
Net asset value per share at end of period | | $ | 25.16 | | | $ | 27.19 | |
| | | | | | | | | |
Creation of Shares | | | 325,000 | | | | 125,000 | |
Redemption of Shares | | | 50,000 | | | | 775,000 | |
The accompanying notes are an integral part of these financial statements.
TEUCRIUM SOYBEAN FUND
STATEMENTS OF CASH FLOWS
(Unaudited)
| | | Three months ended | | | Three months ended | |
| | | March 31, 2024 | | | March 31, 2023 | |
Cash flows from operating activities: | | | | | | | | |
Net loss | | $ | (1,887,477 | ) | | $ | (2,370,378 | ) |
Adjustments to reconcile net loss to net cash used in operating activities: | | | | | | | | |
Net change in unrealized (depreciation)/appreciation on commodity futures contracts | | | (596,685 | ) | | | 3,699,642 | |
Changes in operating assets and liabilities: | | | | | | | | |
Due from broker | | | 219,407 | | | | (2,578,615 | ) |
Interest receivable | | | (16,607 | ) | | | 34,657 | |
Other assets | | | (883 | ) | | | (29,849 | ) |
Management fee payable to Sponsor | | | 1,096 | | | | (21,191 | ) |
Other liabilities | | | 28,247 | | | | (7,119 | ) |
Net cash used in operating activities | | | (2,252,902 | ) | | | (1,272,853 | ) |
| | | | | | | | | |
Cash flows from financing activities: | | | | | | | | |
Proceeds from sale of Shares | | | 8,094,215 | | | | 3,526,043 | |
Redemption of Shares | | | (1,295,995 | ) | | | (24,371,410 | ) |
Net cash provided by (used in) financing activities | | | 6,798,220 | | | | (20,845,367 | ) |
| | | | | | | | | |
Net change in cash and cash equivalents | | | 4,545,318 | | | | (22,118,220 | ) |
Cash and cash equivalents beginning of period | | | 28,107,189 | | | | 58,212,569 | |
Cash and cash equivalents end of period | | $ | 32,652,507 | | | $ | 36,094,349 | |
The accompanying notes are an integral part of these financial statements.
NOTES TO FINANCIAL STATEMENTS
September 30, 2017March 31, 2024
(Unaudited)
Note 1– Organization and Operation
Teucrium Soybean Fund (referred to herein as “SOYB” or the “Fund”) is a commodity pool that is a series of Teucrium Commodity Trust (“Trust”), a Delaware statutory trust formed on September 11, 2009. The Fund issues common units, called the “Shares,” representing fractional undivided beneficial interests in the Fund. The Fund continuously offers Creation Baskets consisting of 25,000 Shares at their Net Asset Value (“NAV”) to “Authorized Purchasers” through Foreside Fund Services, LLC, which is the distributor for the Fund (the “Distributor”). Authorized Purchasers sell such Shares, which are listed on the New York Stock Exchange (“NYSE”) Arca under the symbol “SOYB,” to the public at per-Shareper Share offering prices that reflect, among other factors, the trading price of the Shares on the NYSE Arca, the NAV of the Fund at the time the Authorized Purchaser purchased the Creation Baskets and the NAV at the time of the offer of the Shares to the public, the supply of and demand for Shares at the time of sale, and the liquidity of the markets for soybean interests. The Fund’s Shares trade in the secondary market on the NYSE Arca at prices that are lower or higher than their NAV per Share.
The investment objective of SOYB is to have the daily changes in percentage termsthe NAV of the Shares’ Net Asset Value (“NAV”)Fund’s Shares reflect the daily changes in percentage terms ofthe soybean market for future delivery as measured by the Benchmark. The Benchmark is a weighted average of the closing settlement prices for three futures contracts for soybeans (“SoybeansSoybean Futures Contracts”) that are traded on the Chicago Board of Trade (“CBOT”):
SOYB Benchmark
CBOT SoybeansSoybean Futures Contract | | Weighting | |
Second to expire (excluding August & September) | 35% | | 35 | % |
Third to expire (excluding August & September) | 30% | | 30 | % |
Expiring in the November following the expiration of the third-to-expirethird to expire contract | 35% | | 35 | % |
The Fund commenced investment operations on September 19, 2011 and has a fiscal year ending December 31. The Fund’s sponsor is Teucrium Trading, LLC (the “Sponsor”). The Sponsor is responsible for the management of the Fund. The Sponsor is registered as a commodity pool operator (“CPO”) and a commodity trading adviser (“CTA”) with the Commodity Futures Trading Commission (“CFTC”) and is a member of the National Futures Association (the “NFA”(“NFA”) and became a commodity pool operator registered with the Commodity Futures Trading Commission (the “CFTC”) effective November 10, 2009..
On June 17,13, 2011, the Fund’s registration of 10,000,000 shares oninitial Form S-1S-1 for SOYB was declared effective by the SEC. On September 16, 2011, two Creation Baskets were issued representing 100,000 shares and $2,500,000. On September 19, 2011, the Fund listed its sharesSOYB started trading on the NYSE Arca under the ticker symbol “SOYB.” On the business day prior to that, the Fund issued 100,000 shares in exchange for $2,500,000 at the Fund’s initial NAV of $25 per share.Arca. The Fund also commenced investment operations on September 19, 2011 by purchasing soybean commodity futures contracts traded on the CBOT. On December 31, 2010, the Fund had four shares outstanding, which were owned by the Sponsor. On May 1, 2017, a subsequentcurrent registration statement for SOYB was declared effective by the SEC.SEC on April 7, 2022. This registration statement for SOYB registered an indeterminate number of shares.
The accompanying unaudited financial statements have been prepared in accordance with Rule 10-0110-01 of Regulation S-XS-X promulgated by the SEC and, therefore, do not include all information and footnote disclosures required under accounting principles generally accepted in the United States of America (“GAAP”). The financial information included herein is unaudited; however, such financial information reflects all adjustments which are, in the opinion of management, necessary for the fair presentation of the Fund’s financial statements for the interim period. It is suggested that these interim financial statements be read in conjunction with the financial statements and related notes included in the Trust’s Annual Report on Form 10-K,10-K, as well as the most recent Form S-1S-1 filing, as applicable. The operating results for the three and nine months ended September 30, 2017March 31, 2024 are not necessarily indicative of the results to be expected for the full year ending December 31, 2017.2024.
Subject to the terms of the Trust Agreement, Teucrium Trading, LLC, in its capacity as the Sponsor (“Sponsor”), may terminate a Fund at any time, regardless of whether the Fund has incurred losses, including, for instance, if it determines that the Fund’s aggregate net assets in relation to its operating expenses make the continued operation of the Fund unreasonable or imprudent. However, no level of losses will require the Sponsor to terminate a Fund.
Note 2– Principal Contracts and Agreements
On August 17, 2015 (the “Conversion Date”), U.S. Bank N.A. replaced The Bank of New York Mellon as the Custodian for the Fund. The principal business address for U.S. Bank N.A. is 1555 North RiverCenter Drive, Suite 302, Milwaukee, Wisconsin 53212. U.S. Bank N.A. is a Wisconsin state chartered bank subject to regulation by the Board of Governors of the Federal Reserve System and the Wisconsin State Banking Department. The principal address forSponsor employs U.S. Bancorp Fund Services, LLC, doing business as U.S. Bank Global Fund Services (“USBFS”Global Fund Services”), for Transfer Agency, Fund Accounting and Fund Administration services. The principal address for Global Fund Services is 777 East Wisconsin Avenue,615 E. Michigan Street, Milwaukee, WI 53202. In addition, effective on the Conversion Date, USBFS, a wholly owned subsidiary of U.S. Bank, commenced serving as administrator for each Fund, performing certain administrative and accounting services and preparing certain SEC reports on behalf of the Funds, and also became the registrar and transfer agent for each Fund’s Shares. For such services, U.S. Bank and USBFS will receive an asset-based fee, subject to a minimum annual fee.
For custody services, the Funds will pay to U.S. Bank N.A. 0.0075% of average gross assets up to $1$1 billion, and .0050% of average gross assets over $1$1 billion, annually, plus certain per-transaction charges. For Transfer Agency, Fund Accounting and Fund Administration services, which are based on the total assets for all the Funds in the Trust, the Funds will pay to USBFS 0.06%Global Fund Services 0.05% of average gross assets on the first $250 million, 0.05% on the next $250$500 million, 0.04% on the next $500$500 million, 0.03% on the next $2 billion and 0.03%0.02% on the balance over $1$3 billion annually. A combined minimum annual fee of up to $64,500$47,000 for custody, transfer agency, accounting and administrative services is assessed per Fund. For the three months ended September 30, 2017 and 2016, the Fund recognized $7,908 and $7,291, respectively, for theseThese services which wasare recorded inas custodian fees and expenses on the statements of operations;operations. A summary of these amounts $2,074 and $0 in 2017 and 2016 respectively were waived by the Sponsor. For the nine months ended September 30, 2017 and 2016, the Fund recognized $18,479 and $19,231, respectively, for these services, which was recorded in custodian fees and expenses on the statements of operations; of these amounts $2,074 and $0 in 2017 and 2016 respectively were waived by the Sponsor.is included below.
The Sponsor employs Foreside Fund Services, LLC (“Foreside” or the “Distributor”) as the Distributor for the Funds. The Distribution Services Agreement among the Distributor and the Sponsor calls for the Distributor to work with the Custodian in connection with the receipt and processing of orders for Creation Baskets and Redemption Baskets and the review and approval of all Fund sales literature and advertising materials. The Distributor and the Sponsor have also entered into a Securities Activities and Service Agreement (the “SASA”) under which certain employees and officers of the Sponsor are licensed as registered representatives or registered principals of the Distributor, under Financial Industry Regulatory Authority (“FINRA”) rules. For its services as the Distributor, Foreside receives a fee of 0.01% of theeach Fund’s average daily net assets and an aggregate annual fee of $100,000 for all Teucrium Funds, along with certain expense reimbursements. For its services under the SASA, Foreside receives a fee of $5,000 per registered representative and $1,000 per registered location. For the three months ended September 30, 2017 and 2016, the Fund recognized $3,087 and $2,871, respectively, for theseThese services which wasare recorded inas distribution and marketing fees on the statements of operations; of these amounts $1,739 and $0 were waived by the Sponsor in 2017 and 2016. For the nine months ended September 30, 2017 and 2016, the Fund recognized $9,893 and $10,670, respectively, for these services, which was recorded in distribution and marketing fees on the statements of operations;operations. A summary of these expenses $2,512 in 2017 and $0 in 2016 were waived by the Sponsor.is included below.
ED&F ManMarex Capital Markets, Inc. (“ED&F Man”Marex”) servesand StoneX Financial Inc. (“StoneX”) serve as the Underlying Funds’ clearing brokerbrokers to execute and clear the Underlying Funds’ futures contracts and provide other brokerage-related services. ED&F Man isMarex and StoneX are each registered as a FCMfutures commission merchants (“FCM”) with the U.S. CFTC and isare members of the NFA. The clearing brokers are registered as broker-dealers with the SEC and are each a member of the NFA. ED&F Man is also registered as a broker/dealer with the U.S. SecuritiesFINRA. Marex and Exchange Commission and is a member of the FINRA. ED&F Man is aStoneX are each clearing membermembers of ICE Futures U.S., Inc., Chicago Board of Trade, Chicago Mercantile Exchange, New York Mercantile Exchange, and all other major United States commodity exchanges. For Corn, Soybean, Sugar, and Wheat Futures Contracts ED&FE D & F Man is paid $9.00$3.00 per round turn. Forturn exclusive of pass-through fees for the three months ended September 30, 2017exchange and 2016, the NFA. StoneX is paid $2.50 per round turn exclusive of pass-through fees for the exchange and the NFA. Additionally, if the monthly commissions paid by each Fund does not equal or exceed 16.5% return on the StoneX Capital Requirement at 9.6% of the Exchange Maintenance Margin, each Fund will pay a true up to meet that return at the end of each month. These expenses are recognized $2,007 and $0, respectively, for these services, which was recorded in brokerage commissionson a per-trade basis. The half-turn is recognized as an unrealized loss on the statements of operations for contracts that have been purchased since the change in recognition, and paid for by the Fund. For the nine months ended September 30, 2017 and 2016, the Funda full turn is recognized $5,406 and $1,507, respectively, for these services, which was recorded in brokerage commissionsas a realized loss on the statements of operations and paid for bywhen a contract is sold. A summary of these expenses can be found under the Fund.heading, Brokerage Commissions.
The sole Trustee of the Trust is Wilmington Trust Company, a Delaware banking corporation. The Trustee will accept service of legal process on the Trust in the State of Delaware and will make certain filings under the Delaware Statutory Trust Act. For its services, the Trustee receives an annual fee of $3,300 from the Trust. For the three and nine months ended September 30, 2017 and 2016, the Fund recognized $204 and $257, respectively, for theseThese services and were waived by the Sponsor. This expense isare recorded in business permits and licenses fees on the statements of operations. A summary of these expenses is included below.
| | | Three months ended March 31, 2024 | | | Three months ended March 31, 2023 | |
Amount Recognized for Custody Services | | $ | 8,486 | | | $ | 3,441 | |
Amount of Custody Services Waived | | $ | - | | | $ | - | |
| | | | | | | | | |
Amount Recognized for Distribution Services | | $ | 3,063 | | | $ | 3,266 | |
Amount of Distribution Services Waived | | $ | - | | | $ | - | |
| | | | | | | | | |
Amount Recognized for Wilmington Trust | | $ | - | | | $ | - | |
Amount of Wilmington Trust Waived | | $ | - | | | $ | - | |
Note 3– Summary of Significant Accounting Policies
Basis of Presentation
The accompanying financial statements have been prepared in accordance with accounting principles generally accepted in the United States of America (“U.S. GAAP”) as detailed in the Financial Accounting Standards Board’s Accounting Standards Codification.
Revenue Recognition
Commodity futures contracts are recorded on the trade date. All such transactions are recorded on the identified cost basis and marked to market daily. Unrealized appreciation or depreciation on commodity futures contracts are reflected in the statements of operations as the difference between the original contract amount and the fair market value as of the last business day of the year or as of the last date of the financial statements. Changes in the appreciation or depreciation between periods are reflected in the statements of operations. InterestThe Fund seeks to earn interest on cash equivalentsits assets denominated in U.S. dollars on deposits with financial institutions are recognized on the accrual basis. The FundsFutures Commission Merchant. In addition, the Fund seeks to earn interest on funds held at the custodian and other financial institutions at prevailing market rates for such investments.
The Sponsor invests a portion of cash in commercial paper, which is deemed a cash equivalent based on the rating and duration of contracts as described in the notes to the financial statements and reflected in cash and cash equivalents on the statements of assets and liabilities and on the statements of cash flows. Accretion on these investments is recognized using the effective interest method in U.S. dollars and included in interest income on the statements of operations.
The Sponsor invests a portion of the cash held by the broker in short term Treasury Bills as collateral for open futures contracts. Accretion on these investments is recognized using the effective interest method in U.S. dollars and included in interest income on the statements of operations.
Brokerage Commissions
BrokerageThe Sponsor recognizes the expense for brokerage commissions for futures contract trades on all open commodity futures contracts are accrueda per-trade basis. The below table shows the amounts included on the trade date statements of operations as total brokerage commissions paid inclusive of unrealized loss for the three months ended March 31, 2024 and on a full-turn basis.2023.
| | | SOYB | |
Three months ended March 31, 2024 | | $ | 4,158 | |
Three months ended March 31, 2023 | | $ | 6,340 | |
Income Taxes
For federal income tax purposes, theeach Fund will be treated as a publicly traded partnership. A publicly traded partnership is generally treated as a corporation for federal income tax purposes unless 90% or more of the publicly traded partnership’s gross income for each taxable year of its existence consists of qualifying income as defined in section 7704(d) of the Internal Revenue Code of 1986, as amended. Qualifying income is defined as generally including, in pertinent part, interest (other than from a financial business), dividends, and gains from the sale or disposition of capital assets held for the production of interest or dividends. In the case of a partnership of which a principal activity is the buying and selling of commodities, other than as inventory, or of futures, forwards and options with respect to commodities, qualifying income also includes income and gains from commodities and from futures, forwards, options with respect to commodities and, provided the partnership is a trader or investor with respect to such assets, swaps and other notional principal contracts with respect to commodities. The Fund expects that at least 90% of the Fund’s gross income for each taxable year will consist of qualifying income and that the Fund will be taxed as a partnership for federal income tax purposes. The Fund does not record a provision for income taxes because the shareholders report their share of the Fund’s income or loss on their income tax returns. The financial statements reflect the Fund’s transactions without adjustment, if any, required for income tax purposes.
The Fund is required to determine whether a tax position is more likely than not to be sustained upon examination by the applicable taxing authority, including resolution of any related appeals or litigation processes, based on the technical merits of the position. The Fund files an income tax return in the U.S. federal jurisdiction and may file income tax returns in various U.S. states and foreign jurisdictions. For all tax years 20142021 to 2016,2023, the Fund remains subject to income tax examinations by major taxing authorities. The tax benefit recognized is measured as the largest amount of benefit that has a greater than fifty percent likelihood of being realized upon ultimate settlement. De-recognition of a tax benefit previously recognized results in the Fund recording a tax liability that reduces net assets. Based on its analysis, the Fund has determined that it has not incurred any liability for unrecognized tax benefits as of September 30, 2017March 31, 2024 and for the years ended December 31, 2016, 20152023, 2022, and 2014.2021. However, the Fund’s conclusions regarding this policy may be subject to review and adjustment at a later date based on factors including, but not limited to, ongoing analysis of and changes to tax laws, regulations, and interpretations thereof.
The Fund recognizes interest accrued related to unrecognized tax benefits and penalties related to unrecognized tax benefits in income tax fees payable, if assessed. No interest expense or penalties have been recognized as of and for the three and nine months ended September 30, 2017 March 31, 2024 and 2016.2023.
The Fund may be subject to potential examination by U.S. federal, U.S. state, or foreign jurisdictional authorities in the area of income taxes. These potential examinations may include questioning the timing and amount of deductions, the nexus of income among various tax jurisdictions, and compliance with U.S. federal, U.S. state and foreign tax laws. The Fund’s management does not expect that the total amount of unrecognized tax benefits will materially change over the next twelve months.
Creations and Redemptions
Authorized Purchasers may purchase Creation Baskets consisting of 25,000 shares from the Fund. The amount of the proceeds required to purchase a Creation Basket will be equal to the NAV of the shares in the Creation Basket determined as of 4:00 p.m. New York time(ET) on the day the order to create the basket is properly received.received in good order.
Authorized Purchasers may redeem shares from the Fund only in blocks of 25,000 shares called “Redemption Baskets.” The amount of the redemption proceeds for a Redemption Basket will be equal to the NAV of the shares in the Redemption Basket determined as of 4:00 p.m. New York time(ET) on the day the order to redeem the basket is properly received.received in good order.
The Fund receives or pays the proceeds from shares sold or redeemed within three business days after the trade date of the purchase or redemption. The amounts due from Authorized Purchasers are reflected in the Fund’s statements of assets and liabilities as receivable forcapital shares sold.receivable. Amounts payable to Authorized Purchasers upon redemption are reflected in the Fund’s statements of assets and liabilities as payable for shares redeemed.
As outlined in the most recent Form S-1S-1 filing, 50,000 shares represents represent two Redemption Baskets for the Fund and a minimum level of shares. If the Fund experienced redemptions that caused the number of Shares outstanding to decrease to the minimum level of Shares required to be outstanding, until the minimum number of Shares is again exceeded through the purchase of a new Creation Basket, there can be no more redemptions by an Authorized Purchaser.
Allocation of Shareholder Income and Losses
Profit or loss is allocated among the shareholders of the Fund in proportion to the number of shares each shareholder holds as of the close of each month.
Cash and Cash Equivalents
Cash equivalents are highly-liquidhighly liquid investments with maturity dates of 90 days or less when acquired. The FundTrust reported its cash equivalents in the statements of assets and liabilities at market value, or at carrying amounts that approximate fair value, because of their highly-liquidhighly liquid nature and short-term maturities. TheEach Fund that is a series of the Trust has these balancesthe balance of its assetscash equivalents on deposit with banks.financial institutions. The Fund hadholds a balance of $1,477,379 and $185,661 in money market funds at September 30, 2017 and December 31, 2016, respectively; these balances arethat is included in cash and cash equivalents on the statements of assets and liabilities. The Sponsor investedinvests a portion of the available cash for the FundFunds in alternative demand-depositdemand deposit savings accounts, which is classified as cash and not as a cash equivalent. The Fund had a balance of $17,722,329 as of September 30, 2017 and $12,115,082 as of December 31, 2016 in demand-deposit savings accounts.equivalents. Assets deposited with the bank may, at times, exceed federally insured limits. The Sponsor invests a portion of the available cash for the Funds in investment grade commercial paper with durations of 90 days or less, which is classified as a cash equivalent and is not FDIC insured. The Sponsor may invest a portion of the cash held by the FCM in short term Treasury Bills as collateral for open futures contracts, which is classified as a cash equivalent and is not FDIC insured.
| | | March 31, 2024 | | | December 31, 2023 | |
Money Market Funds | | $ | 12,228,166 | | | $ | 7,746,099 | |
Demand Deposit Savings Accounts | | | 5,470,653 | | | | 5,399,248 | |
Commercial Paper | | | 14,953,688 | | | | 14,961,842 | |
Total cash and cash equivalents as presented on the Statements of Assets and Liabilities | | $ | 32,652,507 | | | $ | 28,107,189 | |
Restricted CashPayable for Purchases of Commercial Paper
On August 17, 2015 (the “Conversion Date”), U.S. Bank N.A. replaced The Bank of New York Mellonamount recorded by the Fund for commercial paper transactions awaiting settlement, represents the amount payable for contracts purchased but not yet settled as the Custodian for the Funds. Per the amended agreement between the Sponsor and The Bank of New York Mellon dated August 14, 2015, certain cash amounts for each Fund, except in the case of TAGS, are to remain at The Bank of New York Mellon until amounts for services and early termination fees are paid. The amended agreement allows for payments for such amounts owed to be made through December 31, 2017. Cash balances that are held in custody at The Bank of New York Mellon under this amended agreement are reflected on the statements of assets and liabilities of the Fundreporting date. The value of the contract is included in cash and cash equivalents, and the Trustpayable amount is included as restricted cash.a liability.
Due from/to Broker
The amount recorded by the Fund for the amount due from and to the clearing broker includes, but is not limited to, cash held by the broker, amounts payable to the clearing broker related to open transactions, and payables for commodities futures accounts liquidating to an equity balance on the clearing broker’s records.records and amounts of brokerage commissions paid and recognized as unrealized losses.
Margin is the minimum amount of funds that must be deposited by a commodity interest trader with the trader’s broker to initiate and maintain an open position in futures contracts. A margin deposit acts to assure the trader’s performance of the futures contracts purchased or sold. Futures contracts are customarily bought and sold on initial margin that represents a very small percentage of the aggregate purchase or sales price of the contract. Because of such low margin requirements, price fluctuations occurring in the futures markets may create profits and losses that, in relation to the amount invested, are greater than are customary in other forms of investment or speculation. As discussed below, adverse price changes in the futures contract may result in margin requirements that greatly exceed the initial margin. In addition, the amount of margin required in connection with a particular futures contract is set from time to time by the exchange on which the contract is traded and may be modified from time to time by the exchange during the term of the contract. Brokerage firms, such as the Fund’s clearing brokers, carrying accounts for traders in commodity interest contracts generally require higher amounts of margin as a matter of policy to further protect themselves. Over-the-counterOver the counter trading generally involves the extension of credit between counterparties, so the counterparties may agree to require the posting of collateral by one or both parties to address credit exposure.
When a trader purchases an option, there is no margin requirement; however, the option premium must be paid in full. When a trader sells an option, on the other hand, he or she is required to deposit margin in an amount determined by the margin requirements established for the underlying interest and, in addition, an amount substantially equal to the current premium for the option. The margin requirements imposed on the selling of options, although adjusted to reflect the probability that out-of-the-money options will not be exercised, can in fact be higher than those imposed in dealing in the futures markets directly. Complicated margin requirements apply to spreads and conversions, which are complex trading strategies in which a trader acquires a mixture of options positions and positions in the underlying interest.
Ongoing or “maintenance” margin requirements are computed each day by a trader’s clearing broker. When the market value of a particular open futures contract changes to a point where the margin on deposit does not satisfy maintenance margin requirements, a margin call is made by the broker. If the margin call is not met within a reasonable time, the broker may close out the trader’s position. With respect to the Fund’s trading, the Fund (and not its shareholders personally) is subject to margin calls.
Finally, many major U.S. exchanges have passed certain cross margining arrangements involving procedures pursuant to which the futures and options positions held in an account would, in the case of some accounts, be aggregated and margin requirements would be assessed on a portfolio basis, measuring the total risk of the combined positions.
Calculation of Net Asset Value
The Fund’s NAV is calculated by:
| | ●• | Taking the current market value of its total assets and |
| | ●• | Subtracting any liabilities. |
The administrator, USBFS,Global Fund Services, calculates the NAV of the Fund once each trading day. It calculates the NAV as of the earlier of the close of the NYSE or 4:00 p.m. New York time.(ET). The NAV for a particular trading day is released after 4:15 p.m. New York time.(ET).
In determining the value of Soybean Futures Contracts, the administrator uses the CBOT closing price. The administrator determines the value of all other Fund investments as of the earlier of the close of the NYSE or 4:00 p.m. New York time.(ET). The value of over-the-counter soybean interests is determined based on the value of the commodity or futures contract underlying such soybean interest, except that a fair value may be determined if the Sponsor believes that the Fund is subject to significant credit risk relating to the counterparty to such soybean interest. For purposes of financial statements and reports, the Sponsor will recalculate the NAV where necessary to reflect the “fair value” of a Futures Contract when the Futures Contract closes at its price fluctuation limit for the day. Short term Treasury securities held by the Fund are valued by the administrator using values received from recognized third-partythird-party vendors and dealer quotes. NAV includes any unrealized profit or loss on open soybean interests and any other income or expense accruing to the Fund but unpaid or not received by the Fund.
Sponsor Fee, Allocation of Expenses and Related Party Transactions
The Sponsor is responsible for investing the assets of the Fund in accordance with the objectives and policies of the Fund. In addition, the Sponsor arranges for one or more third parties to provide administrative, custodial, accounting, transfer agency and other necessary services to the Trust and the Funds. In addition, the Sponsor has elected not to outsource services directly attributable to the Trust and the Funds such as accounting, financial reporting, regulatory compliance, and trading activities.activities, which the Sponsor performs itself. In addition, the Fund is contractually obligated to pay a monthly management fee to the Sponsor, based on average daily net assets, at a rate equal to 1.00% per annum.
The Fund generally pays for all brokerage fees, taxes, and other expenses, including licensing fees for the use of intellectual property, registration or other fees paid to the SEC, FINRA, formerly the National Association of Securities Dealers, or any other regulatory agency in connection with the offer and sale of subsequent Shares after its initial registration and all legal, accounting, printing and other expenses associated therewith. The Fund also pays its portion of the fees and expenses associated with the Trust’s tax accounting and reporting requirements. Certain aggregate expenses common to all Funds within the Trust are allocated by the Sponsor to the respective fundsFund based on activity drivers deemed most appropriate by the Sponsor for such expenses, including but not limited to relative assets under management and creation and redeem order activity.
These aggregate common expenses include, but are not limited to, legal, auditing, accounting and financial reporting, tax-preparation, regulatory compliance, trading activities, and insurance costs, as well as fees paid to the Distributor, which are included in the related line item in the statements of operations. A portion of these aggregate common expenses are related to the Sponsor or related parties of principals of the Sponsor; these are necessary services to the Funds, which are primarily the cost of performing accounting and financial reporting, regulatory compliance, and trading activities that are directly attributable to the Fund. Such expenses are primarily recorded in distribution and marketing fees on the statements of operations. For the three months ended September 30, 2017 and 2016; such expenses, which are primarily recorded as distribution and marketing fees in the financial statements of each Fund.
| | | Three months ended March 31, 2024 | | | Three months ended March 31, 2023 | |
Recognized Related Party Transactions | | $ | 51,460 | | | $ | 50,267 | |
Waived Related Party Transactions | | $ | - | | | $ | - | |
The Sponsor has the ability to elect to pay certain expenses on behalf of the Funds or waive the management fee. This election is subject to change by the Sponsor, at its discretion. Expenses paid by the Sponsor and Management fees waived by the Sponsor are, if applicable, presented as waived expenses in the statements of operations totaled $32,932 in 2017 and $33,624 in 2016; of these amounts, $15,760 in 2017 and $10,720 in 2016for each Fund. There were no expenses waived byfor the Sponsor. For the ninethree months ended September 30, 2017 March 31, 2024 and 2016; such expenses, which are primarily included as distribution and marketing fees on the statements of operations, totaled $128,336 in 2017 and $136,289 in 2016; of these amounts, $24,601 in 2017 and $10,720 in 2016 were waived by the Sponsor. All asset-based fees and expenses for the Funds are calculated on the prior day’s net assets.2023.
For the three and nine months ended September 30, 2017, there were $31,348 and $58,457, respectively, of expenses identified on the statements of operations of the Fund as expenses that were waived by the Sponsor. The Sponsor has determined that there would be no recovery sought for these amounts in any future period.
For the three and nine months ended September 30, 2016, there were $63,113 and $63,113, respectively, of expenses identified on the statements of operations of the Fund as expenses that were waived by the Sponsor. The Sponsor has determined that there would be no recovery sought for these amounts in any future period.
As of August 21, 2017, Mr. Miller no longer retains an ownership interest in the Sponsor which is equal to or greater than 10%, and, thus, is no longer a principal of the Sponsor as defined by the rules of the Commodity Futures Trading Commission.
Use of Estimates
The preparation of financial statements in conformity with U.S. GAAP requires management to make estimates and assumptions that affect the reported amount of assets and liabilities and disclosure of contingent assets and liabilities at the date of the financial statements, and the reported amounts of the revenue and expenses during the reporting period. Actual results could differ from those estimates.
Fair Value - Definition and Hierarchy
In accordance with U.S. GAAP, fair value is defined as the price that would be received to sell an asset or paid to transfer a liability (i.e., the “exit price”) in an orderly transaction between market participants at the measurement date.
In determining fair value, the Fund uses various valuation approaches. In accordance with U.S. GAAP, a fair value hierarchy for inputs is used in measuring fair value that maximizes the use of observable inputs and minimizes the use of unobservable inputs by requiring that the most observable inputs be used when available. Observable inputs are those that market participants would use in pricing the asset or liability based on market data obtained from sources independent of the Fund. Unobservable inputs reflect the Fund’s assumptions about the inputs market participants would use in pricing the asset or liability developed based on the best information available in the circumstances. The fair value hierarchy is categorized into three levels based on the inputs as follows:
Level 1 - Valuations based on unadjusted quoted prices in active markets for identical assets or liabilities that the Fund has the ability to access. Valuation adjustments and block discounts are not applied to Level 1 financial instruments. Since valuations are based on quoted prices that are readily and regularly available in an active market, valuation of these financial instruments does not entail a significant degree of judgment.
Level 2 - Valuations based on quoted prices in markets that are not active or for which all significant inputs are observable, either directly or indirectly.
Level 3 - Valuations based on inputs that are unobservable and significant to the overall fair value measurement.
The availability of valuation techniques and observable inputs can vary from financial instrument to financial instrument and is affected by a wide variety of factors including, the type of financial instrument, whether the financial instrument is new and not yet established in the marketplace, and other characteristics particular to the transaction. To the extent that valuation is based on models or inputs that are less observable or unobservable in the market, the determination of fair value requires more judgment. Those estimated values do not necessarily represent the amounts that may be ultimately realized due to the occurrence of future circumstances that cannot be reasonably determined. Because of the inherent uncertainty of valuation, those estimated values may be materially higher or lower than the values that would have been used had a ready market for the financial instruments existed. Accordingly, the degree of judgment exercised by the Fund in determining fair value is greatest for financial instruments categorized in Level 3. In certain cases, the inputs used to measure fair value may fall into different levels of the fair value hierarchy. In such cases, for disclosure purposes, the level in the fair value hierarchy, within which the fair value measurement in its entirety falls, is determined based on the lowest level input that is significant to the fair value measurement.
Fair value is a market-based measure considered from the perspective of a market participant rather than an entity-specific measure. Therefore, even when market assumptions are not readily available, the Fund’s own assumptions are set to reflect those that market participants would use in pricing the asset or liability at the measurement date. The Fund uses prices and inputs that are current as of the measurement date, including periods of market dislocation. In periods of market dislocation, the observability of prices and inputs may be reduced for many financial instruments. This condition could cause a financial instrument to be reclassified to a lower level within the fair value hierarchy. When such a situation exists on a quarter close, the Sponsor will calculate the NAV on a particular day using the Level 1 valuation but will later recalculate the NAV for the impacted Fund based upon the valuation inputs from these alternative verifiable sources (Level 2 or Level 3)3) and will report such NAV in its applicable financial statements and reports.
On September 30, 2017March 31, 2024 and December 31, 2016,2023, in the opinion of the Trust and the Fund, the reported value at the close of the Soybean Futures Contracts traded on the CBOTmarket for each commodity contract fairly reflected the value of the Soybean Futures Contracts held by the Fund, with futures and no adjustments necessary. alternative valuations were required. The determination is made as of the settlement of the futures contracts on the last day of trading for the reporting period. In making the determination of a Level 1 or Level 2 transfer, the Fund considers the average volume of the specific underlying futures contracts traded on the relevant exchange for the periods being reported.
For the ninethree months ended September 30, 2017March 31, 2024 and for the year ended December 31, 2016,2023, the Fund did not have any significant transfers between any of the levels of the fair value hierarchy.
The Fund records its derivative activities at fair value. Gains and losses from derivative contracts are included in the statements of operations. Derivative contracts include futures contracts related to commodity prices. Futures, which are listed on a national securities exchange, such as the CBOT and the ICE, or reported on another national market, are generally categorized in Level 1 of the fair value hierarchy. OTC derivatives contracts (such as forward and swap contracts) which may be valued using models, depending on whether significant inputs are observable or unobservable, are categorized in Levels 2 or 3 of the fair value hierarchy.
Expenses
Expenses are recorded using the accrual method of accounting.
Net Income (Loss) per Share
Net income (loss) per Share is the difference between the NAV per unit at the beginning of each period and at the end of each period. The weighted average number of Shares outstanding was computed for purposes of disclosing net income (loss) per weighted average Share. The weighted average Shares are equal to the number of Shares outstanding at the end of the period, adjusted proportionately for Shares created or redeemed based on the amount of time the Shares were outstanding during such period.
New Accounting Pronouncements
The Financial Accounting Standards Board (“FASB”) issued Accounting Standards Update (“ASU”) 2017-13, “Revenue Recognition (Topic 605), Leases (Topic 840), and Leases (Topic 842):issued ASU 2023-06 – Disclosure Improvements: Codification Amendments to SEC Paragraphs Pursuantin Response to the Staff Announcement atSEC’s Disclosure Update and Simplification Initiative. The amendments require an entity to disclose its accounting policy for where cash flows associated with derivative instruments and their related gains and losses are presented. The Trust and Fund already discloses the July 20,2017 EITF Meetingaccounting policy related to the derivative gains and Rescissionlosses presented on the cash flow statement. The amendment was adopted early for the period ended December 31, 2023. There is no impact to the financial statements of Prior SEC Staff Announcements and Observer Comments”the Trust or the Fund.
The FASB issued ASU 2023-01, related to Leases – (Topic 842). The amendment amendsresponse to concerns about applying Topic 842 to related party arrangements between entities under common control. The update was adopted early for the earlyquarter ended March 31, 2023; the adoption date option for certain companies related to adoption of ASU No. 2014-09 and ASU No. 2016-02. The SEC staff stated the SEC would did not object to a public business entity that otherwise would not meet the definition of a public business entity except for a requirement to include or the inclusion of its financial statements or financial information in another entity’s filing with the SEC adopting ASC Topic 842 for fiscal years beginning after December 15, 2019, and interim periods within fiscal years beginning after December 15, 2020. This amendment is not expected to have a material impact on the financial statements and disclosures of the Trust or the Fund.
The FASB issued ASU 2017-12, “Derivatives and Hedging (Topic 815): Targeted Improvements to Accounting for Hedging Activities”. These amendments refine and expand hedge accounting for both financial (e.g., interest rate) and commodity risks. Its provisions create more transparency around how economic results are presented, both on the face
Table of the financial statements and in the footnotes. It also makes certain targeted improvements to simplify the application of hedge accounting guidance. The amendments are effective for public business entities for fiscal years beginning after December 15, 2018 and interim periods within those fiscal years. The Trust and the Fund are currently evaluating the impact on the financial statements and disclosures; but, based on our review to date, we do not expect the update will have a material impact on the financial statements and disclosures of the Trust or the Fund.The FASB issued ASU 2017-03, “Accounting Changes and Error Corrections (Topic 250) and Investments – Equity Method and Joint Ventures (Topic 323)”. These amendments require disclosure of the impact that recently issued accounting standards will have on the financial statements of a registrant when such standards are adopted in a future period. The adoption did not have a material impact on the financial statements and disclosures of the Trust or the Fund.
The FASB issued ASU 2017-01, “Business Combinations (Topic 805): Clarifying the Definition of a Business”. The amendments are intended to help companies and other organizations evaluate whether transactions should be accounted for as acquisitions (or disposals) of assets or businesses. The amendments are effective for public companies for annual periods beginning after December 15, 2017, including interim periods within those periods. The Trust and the Fund are currently evaluating the impact on the financial statements and disclosures; but, based on our review to date, we do not expect the update will have a material impact on the financial statements and disclosures of the Trust or the Fund.
The FASB issued ASU 2016-19, “Technical Corrections and Improvements”. The amendments in this update represent changes to clarify, correct errors, or make minor improvements to the Accounting Standards Codification. The amendments make the Accounting Standards Codification easier to understand and easier to apply by eliminating inconsistencies and providing clarifications. The amendments are effective for fiscal years, and interim periods with those fiscal years, for all entities beginning after December 15, 2016. The adoption did not have a material impact on the financial statements and disclosures of the Trust or the Fund.
The FASB issued ASU 2016-18, “Statement of Cash Flows (Topic 230)”. The amendments in this update require that a statement of cash flows explain the change during the period in the total of cash, cash equivalents, and amounts generally described as restricted cash or restricted cash equivalents. Therefore, amounts generally described as restricted cash and restricted cash equivalents should be included with cash and cash equivalents when reconciling the beginning-of-period and end-of-period total amounts shown on the statement of cash flows. The amendments are effective for fiscal years beginning after December 15, 2017, and interim periods within those fiscal years. This update is not expected to have a material impact on the financial statements and disclosures of the Trust or the Fund. The Sponsor believes there will be a change in presentation of restricted cash on the statements of cash flows.
The FASB issued ASU 2016-17, “Consolidation (Topic 810): Interests Held through Related Parties That are under Common Control”. The amendments in this update alters how a decision maker needs to consider indirect interests in a variable interest entity (VIE) held through an entity under common control. The new guidance amends ASU 2015-02, Consolidation (Topic 810): Amendments to the Consolidation Analysis, issued in February 2015. The amendments are effective for fiscal years beginning after December 15, 2016, including interim periods within those fiscal years. The adoption did not have a material impact on the financial statements and disclosures of the Trust or the Fund.
The FASB issued ASU 2016-15, “Statement of Cash Flows (Topic 230): Classification of Certain Cash Receipts and Cash Payments”. The amendments provide cash flow statement classification guidance. The amendments in this update are effective for fiscal years beginning after December 15, 2017. The Trust and the Fund are currently evaluating the impact on the financial statements and disclosures, but do not expect the adoption to have a material impact on the financial statements and disclosures of the Trust or the Fund. The Trust and the Fund do not expect to adopt the guidance until the effective date.
The FASB issued ASU 2014-09 in May 2014, “Revenue from Contracts with Customers (Topic 606),” which replaces the revenue recognition requirements of “Revenue Recognition (Topic 605).” This ASU is based on the principle that revenue is recognized to depict the transfer of goods and services to customers in an amount that reflects the consideration to which the entity expects to be entitled in exchange for those goods or services. This ASU provides new and more detailed guidance on specific topics and expands and improves disclosures about revenue. In August 2015, the FASB issued ASU 2015-14 which defers the effective date of ASU 2014-09 by one year to fiscal years beginning after December 15, 2017. ASU 2015-14 also permits early adoption of ASU 2014-09, but not before the original effective date, which was for fiscal years beginning after December 15, 2016. The Trust and the Fund record income or loss from the recognition and measurement of futures contracts and from interest income under Subtopic 825-10. Revenue from financial instruments which are valued under Subtopic 825 will not be subject to the application of ASU 2014-09 and 2015-14. Therefore, these standards will not have a material impact on the financial statements and disclosures of the Trust or the Fund.
Contents
The FASB issued ASU 2016-11, “Revenue Recognition (Topic 605) and Derivatives and Hedging (Topic 815): Rescission of SEC Guidance Because of Accounting Standards Updates 2014-09 and 2014-16 Pursuant to Staff Announcements at the March 3, 2016 EITF Meeting”. The amendments make targeted improvements to clarify the principal versus agent assessment and are intended to make the guidance more operable and lead to more consistent application. The Trust and the Fund record income or loss from the recognition and measurement of futures contracts and from interest income under Subtopic 825-10. Revenue from financial instruments which are valued under Subtopic 825 will not be subject to the application of ASU 2016-11. Therefore, this standard will not have a material impact on the financial statements and disclosures of the Trust or the Fund.
The FASB issued ASU 2016-02, “Leases (Topic 842).” The amendments in this update increase transparency and comparability among organizations by recognizing lease assets and lease liabilities on the balance sheet and disclosing key information about leasing arrangements. The amendments in this update are effective for fiscal years beginning after December 15, 2018. This update is not expected to have a material impact on the financial statements and disclosures of the Trust or the Fund.
The FASB issued ASU 2016-01, “Financial Instruments-Overall (Subtopic 825-10): Recognition and Measurement of Financial Assets and Financial Liabilities.” The amendments in this update are intended to improve the recognitions measurement and disclosure of financial instruments. The amendments to this update are effective for fiscal years beginning after December 15, 2017, and interim periods within those fiscal years. These amendments are required to be applied prospectively. The Trust and the Fund are currently evaluating the impact on the financial statements and disclosures; but based on our review to date we do not expect the update will have a material impact on the financial statements and disclosures of the Trust or the Fund.
Note 4– Fair Value Measurements
The Fund’s assets and liabilities recorded at fair value have been categorized based upon a fair value hierarchy as described in the Fund’s significant accounting policies in Note 2.3. The following table presents information about the Fund’s assets and liabilities measured at fair value as of September 30, 2017March 31, 2024 and December 31, 2016:2023:
September 30, 2017March 31, 2024
| Assets: | | Level 1 | | | Level 2 | | | Level 3 | | | Balance as of
September 30, 2017 | |
| Cash equivalents | | $ | 1,477,379 | | | $ | — | | | $ | — | | | $ | 1,477,379 | |
| Soybean futures contracts | | | 135,175 | | | | — | | | | — | | | | 135,175 | |
| Total | | $ | 1,612,554 | | | $ | — | | | $ | — | | | $ | 1,612,554 | |
| | | | | | | | | | | | | | | Balance as of | |
Assets: | | Level 1 | | | Level 2 | | | Level 3 | | | March 31, 2024 | |
Cash Equivalents | | $ | 27,181,854 | | | $ | - | | | $ | - | | | $ | 27,181,854 | |
| | | | | | | | | | | | | | | Balance as of | |
Liabilities | | Level 1 | | | Level 2 | | | Level 3 | | | March 31, 2024 | |
Commodity Futures Contracts | | | | | | | | | | | | | | | | |
Soybean futures contracts | | $ | 794,976 | | | $ | - | | | $ | - | | | $ | 794,976 | |
December 31, 20162023
| Assets: | | Level 1 | | | Level 2 | | | Level 3 | | | Balance as of December 31, 2016 | |
| Cash equivalents | | $ | 185,661 | | | $ | — | | | $ | — | | | $ | 185,661 | |
| Soybean futures contracts | | | 357,500 | | | | — | | | | — | | | | 357,500 | |
| Total | | $ | 543,161 | | | $ | — | | | $ | — | | | $ | 543,161 | |
| | | | | | | | | | | | | | | Balance as of | |
Assets: | | Level 1 | | | Level 2 | | | Level 3 | | | December 31, 2023 | |
Cash Equivalents | | $ | 22,707,941 | | | $ | - | | | $ | - | | | $ | 22,707,941 | |
| Liabilities: | | Level 1 | | Level 2 | | Level 3 | | Balance as of December 31, 2016 | | |
| | | | | | | | | | | | | | | | Balance as of | |
Liabilities | | | Level 1 | | | Level 2 | | | Level 3 | | | December 31, 2023 | |
| Soybean futures contracts | | $ | 12,025 | | $ | — | | $ | — | | $ | 12,025 | | | $ | 1,391,661 | | | $ | - | | | $ | - | | | $ | 1,391,661 | |
For the ninethree months ended September 30, 2017March 31, 2024 and year ended December 31, 2016,2023, the Fund did not have any significant transfers between any of the levels of the fair value hierarchy.
See theFair Value - Definition and Hierarchy section in Note 3 above for an explanation of the transfers into and out of each level of the fair value hierarchy.
Note 5– Derivative Instruments and Hedging Activities
In the normal course of business, the Fund utilizes derivative contracts in connection with its proprietary trading activities. Investments in derivative contracts are subject to additional risks that can result in a loss of all or part of an investment. The Fund’s derivative activities and exposure to derivative contracts are classified by the following primary underlying risks: interest rate, credit, commodity price, and equity price risks. In addition to its primary underlying risks, the Fund is also subject to additional counterparty risk due to inability of its counterparties to meet the terms of their contracts. For the ninethree months ended September 30, 2017March 31, 2024 and year ended December 31, 2016,2023, the Fund invested only in commodity futures contracts.
Futures Contracts
The Fund is subject to commodity price risk in the normal course of pursuing its investment objectives. A futures contract represents a commitment for the future purchase or sale of an asset at a specified price on a specified date.
The purchase and sale of futures contracts requires margin deposits with aan FCM. Subsequent payments (variation margin) are made or received by the Fund each day, depending on the daily fluctuations in the value of the contract, and are recorded as unrealized gains or losses by the Fund. Futures contracts may reduce the Fund’s exposure to counterparty risk since futures contracts are exchange-traded; and the exchange’s clearinghouse, as the counterparty to all exchange-traded futures, guarantees the futures against default.
The Commodity Exchange Act requires an FCM to segregate all customer transactions and assets from the FCM’s proprietary activities. A customer’s cash and other equity deposited with an FCM are considered commingled with all other customer funds subject to the FCM’s segregation requirements. In the event of an FCM’s insolvency, recovery may be limited to the Fund’s pro rata share of segregated customer funds available. It is possible that the recovery amount could be less than the total of cash and other equity deposited.
The following table discloses information about offsetting assets and liabilities presented in the statements of assets and liabilities to enable users of these financial statements to evaluate the effect or potential effect of netting arrangements for recognized assets and liabilities. These recognized assets and liabilities are presented as defined in FASB ASU No. 2011-112011-11 “Balance Sheet (Topic 210)210): Disclosures about Offsetting Assets and Liabilities” and subsequently clarified in FASB ASU 2013-012013-01 “Balance Sheet (Topic 210)210): Clarifying the Scope of Disclosures about Offsetting Assets and Liabilities.”
The following table also identifies the fair value amounts of derivative instruments included in the statements of assets and liabilities as derivative contracts, categorized by primary underlying risk, and held by the FCM, ED&F ManFCMs, Marex and StoneX as of September 30, 2017March 31, 2024, and December 31, 2016.2023.
*The amount of collateral presented in Collateral, Due from Broker, is limited to the liability for the futures contracts and accordingly does not include the excess collateral pledged.
Offsetting of Financial Assets and Derivative Assets as of September 30, 2017
| | | (i) | | | (ii) | | | (iii) = (i) – (ii) | | | (iv) | | | (v) = (iii) – (iv) | |
| | | | | | | | | | | | | | | | | | | |
| | | | | | | | | | | | Gross Amount Not Offset in the | | | | |
| | | | | | | | | | | | Statement of Assets and Liabilities | | | | |
| | | | | | Gross Amount | | | Net Amount | | | | | | | | | | |
| | | | | | Offset in the | | | Presented in the | | | | | | | | | | |
| | | Gross Amount | | | Statement of | | | Statement of | | | | | | | | | | |
| | | of Recognized | | | Assets and | | | Assets and | | | Futures Contracts | | | Collateral, Due | | | | |
| Description | | Assets | | | Liabilities | | | Liabilities | | | Available for Offset | | | from Broker | | | Net Amount | |
| Commodity price | | | | | | | | | | | | | | | | | | | | | | | | |
| Soybean futures contracts | | $ | 135,175 | | | $ | — | | | $ | 135,175 | | | $ | — | | | $ | — | | | $ | 135,175 | |
Offsetting of Financial Assets and Derivative Assets as of December 31, 2016
| | | (i) | | | (ii) | | | (iii) = (i) – (ii) | | | (iv) | | | (v) = (iii) – (iv) | |
| | | | | | | | | | | | | | | | |
| | | | | | | | | | | | Gross Amount Not Offset in the
Statement of Assets and Liabilities | | | | |
| Description | | Gross Amount
of Recognized
Assets | | | Gross Amount
Offset in the
Statement of
Assets and
Liabilities | | | Net Amount
Presented in the
Statement of
Assets and
Liabilities | | | Futures Contracts
Available for Offset | | | Collateral, Due
from Broker | | | Net Amount | |
| Commodity price | | | | | | | | | | | | | | | | | | |
| Soybean futures contracts | | $ | 357,500 | | | $ | — | | | $ | 357,500 | | | $ | 12,025 | | | $ | — | | | $ | 345,475 | |
| | | | | | | | | | | | | | | | | | | | | | | | | |
Offsetting of Financial Liabilities and Derivative Liabilities as of DecemberMarch 31, 20162024
| | | (i) | | | (ii) | | | (iii) = (i)-(ii) | | | (iv) | | | (v)=(iii)-(iv) | |
| | | | | | | | | | | | | | | Gross Amount Not Offset in the Statement of Assets and Liabilities | | | | | |
Description | | Gross Amount of Recognized Liabilities | | | Gross Amount Offset in the Statement of Assets and Liabilities | | | Net Amount Presented in the Statement of Assets and Liabilities | | | Futures Contracts Available for Offset | | | Collateral, Due from Broker* | | | Net Amount | |
Commodity Price | | | | | | | | | | | | | | | | | | | | | | | | |
Soybean futures contracts | | $ | 794,976 | | | $ | - | | | $ | 794,976 | | | $ | - | | | $ | 794,976 | | | $ | - | |
| | | (i) | | | (ii) | (iii) = (i) –(ii) | (iv) | | | (v) = (iii) –(iv) | |
| | | | | | | | | | | | |
| | | | | | | | | | | | | | | Gross Amount Not Offset in the
Statement of Assets and Liabilities | | | | | |
| Description | | Gross
Amount
of Recognized
Liabilities | | | Gross Amount
Offset in the
Statement of
Assets and
Liabilities | | | Net Amount
Presented in the
Statement of
Assets and
Liabilities | | | Futures Contracts
Available for Offset | | | Collateral, Due
to Broker | | | Net Amount | |
| Commodity price | | | | | | | | | | | | | | | | | | | | | | | | |
| Soybean futures contracts | | $ | 12,025 | | | $ | — | | | $ | 12,025 | | | $ | 12,025 | | | $ | — | | | $ | — | |
Offsetting of Financial Liabilities and Derivative Liabilities as of December 31, 2023
| | | (i) | | | (ii) | | | (iii) = (i)-(ii) | | | (iv) | | | (v)=(iii)-(iv) | |
| | | | | | | | | | | | | | | Gross Amount Not Offset in the Statement of Assets and Liabilities | | | | | |
Description | | Gross Amount of Recognized Liabilities | | | Gross Amount Offset in the Statement of Assets and Liabilities | | | Net Amount Presented in the Statement of Assets and Liabilities | | | Futures Contracts Available for Offset | | | Collateral, Due from Broker* | | | Net Amount | |
Commodity Price | | | | | | | | | | | | | | | | | | | | | | | | |
Soybean futures contracts | | $ | 1,391,661 | | | $ | - | | | $ | 1,391,661 | | | $ | - | | | $ | 1,391,661 | | | $ | - | |
The following is a summary of realized and unrealized gains and losses of the derivative instruments utilized by the Fund:
Three months ended September 30, 2017March 31, 2024
| Primary Underlying Risk | | Realized Loss on
Commodity Futures Contracts | | | Net Change in Unrealized
Appreciation on
Commodity Futures Contracts | |
| Commodity price | | | | | | |
| Soybean futures contracts | | $ | (24,025 | ) | | $ | 241,863 | |
| | | Realized Loss on Commodity Futures Contracts | | | Net Change in Unrealized Appreciation on Commodity Futures Contracts | |
Commodity Price | | | | | | | | |
Soybean futures contracts | | $ | (2,632,854 | ) | | $ | 596,685 | |
Three months ended September 30, 2016March 31, 2023
| Primary Underlying Risk | | Realized Gain on
Commodity Futures Contracts | | | Net Change in Unrealized
Depreciation on
Commodity Futures Contracts | |
| Commodity price | | | | | | |
| Soybean futures contracts | | $ | 28,163 | | | $ | (1,612,025 | ) |
Nine months ended September 30, 2017
| Primary Underlying Risk | | Realized Gain on
Commodity Futures Contracts | | | Net Change in Unrealized
Depreciation on
Commodity Futures Contracts | |
| Commodity price | | | | | | |
| Soybean futures contracts | | $ | 7,475 | | | $ | (210,300 | ) |
Nine months ended September 30, 2016
| Primary Underlying Risk | | Realized Gain on
Commodity Futures Contracts | | | Net Change in Unrealized
Depreciation on
Commodity Futures Contracts | |
| Commodity price | | | | | | |
| Soybean futures contracts | | $ | 990,062 | | | $ | (21,100 | ) |
| | | Realized Gain on Commodity Futures Contracts | | | Net Change in Unrealized Depreciation on Commodity Futures Contracts | |
Commodity Price | | | | | | | | |
Soybean futures contracts | | $ | 1,067,543 | | | $ | (3,699,642 | ) |
Volume of Derivative Activities
The average notional market value categorized by primary underlying risk for all futures contracts held was $14.9 million and $12.9$29.1 million for the three and nine months ended September 30, 2017March 31, 2024 and $12.4 million and $10.9$42.6 million for the three and nine months ended September 30, 2016.March 31, 2023.
Note 6–Financial Highlights
The following tables present per unit performance data and other supplemental financial data for the three and nine months ended September 30, 2017 March 31, 2024 and 2016. This information has been derived from information presented in the financial statements.2023. This information has been derived from information presented in the financial statements and is presented with total expenses gross of expenses waived by the Sponsor and with total expenses net of expenses waived by the Sponsor, as appropriate.
| | | | Three months ended | | Three months ended | |
| | | | March 31, 2024 | | | March 31, 2023 | |
| Per Share Operation Performance | | Three months ended
September 30, 2017 | | Three months ended
September 30, 2016 | | Nine months
ended
September 30,
2017 | | Nine months ended
September 30, 2016 | | | | | |
| Net asset value at beginning of period | | $ | 18.10 | | $ | 21.37 | | $ | 19.08 | | $ | 17.34 | | | $ | 27.03 | | | $ | 28.50 | |
| Income (loss) from investment operations: | | | | | | | | | | |
| Investment Income | | 0.06 | | 0.02 | | 0.15 | | 0.07 | | |
| Net realized and unrealized gain (loss) on commodity futures contracts | | 0.35 | | (2.67 | ) | | (0.38 | ) | | 1.69 | | |
| Total expenses | | | (0.18 | ) | | | (0.19 | ) | | | (0.52 | ) | | | (0.57 | ) | |
| Net increase (decrease) in net asset value | | | 0.23 | | | | (2.84 | ) | | | (0.75 | ) | | | 1.19 | | |
Income from investment operations: | | |
Interest income | | | 0.34 | | | 0.31 | |
Net realized and unrealized loss on commodity futures contracts | | | (2.00 | ) | | (1.47 | ) |
Total expenses, net | | | | (0.21 | ) | | | (0.15 | ) |
Net decrease in net asset value | | | | (1.87 | ) | | | (1.31 | ) |
| Net asset value at end of period | | $ | 18.33 | | $ | 18.53 | | $ | 18.33 | | $ | 18.53 | | | $ | 25.16 | | | $ | 27.19 | |
| Total Return | | 1.27 | % | | (13.29 | )% | | (3.93 | )% | | 6.86 | % | | -6.91 | % | | -4.61 | % |
| Ratios to Average Net Assets (Annualized) | | | | | | | | | | | | | |
| Total expenses | | 4.89 | % | | 6.04 | % | | 4.34 | % | | 4.79 | % | | 3.28 | % | | 2.18 | % |
| Total expenses, net | | 3.85 | % | | 4.03 | % | | 3.70 | % | | 4.03 | % | | 3.28 | % | | 2.18 | % |
| Net investment loss | | (2.55 | )% | | (3.49 | )% | | (2.63 | )% | | (3.50 | )% | |
Net investment income | | | 2.10 | % | | 2.28 | % |
The financial highlights per share data are calculated consistent with the methodology used to calculate asset-based fees and expenses.
Note 7– Organizational and Offering Costs
Expenses incurred in organizing of the Trust and the initial offering of the Shares of the Fund, including applicable SEC registration fees were borne directly by the Sponsor. The Fund will not be obligated to reimburse the Sponsor.
Note 8– Subsequent Events
Management has evaluated the financial statements for the quarter-ended September 30, 2017March 31, 2024 for subsequent events through the date of this filing and noted no material events requiring either recognition through the date of the filing or disclosure herein for the Fund other than those noted below:
As of this filing, $21,616 of cash that had been held in custody at The Bank of New York Mellon was transferred to the Fund’s account at U.S. Bank. The balance for Restricted Cash is $0.Fund.
TEUCRIUM SUGAR FUND
STATEMENTS OF ASSETS AND LIABILITIES
| | | September 30, 2017 | | December 31, 2016 | | | March 31, 2024 | | | December 31, 2023 | |
| | | (Unaudited) | | | | | (Unaudited) | | | |
| Assets | | | | | | | | | |
| Cash and cash equivalents | | $ | 6,052,584 | | $ | 5,016,531 | | | $ | 15,283,959 | | | $ | 16,773,745 | |
| Interest receivable | | 119 | | 51 | | | 21,734 | | | 31,551 | |
| Restricted cash | | — | | 74,068 | | |
| Other assets | | 12,182 | | 4,435 | | | 9,114 | | | 835 | |
| Equity in trading accounts: | | | | | | |
| Commodity futures contracts | | 14,067 | | 185,147 | | |
| Due from broker | | | 747,925 | | | 565,281 | | | | 2,063,532 | | | | 3,650,191 | |
| Total equity in trading accounts | | | 761,992 | | | 750,428 | | |
| Total assets | | | 6,826,877 | | | 5,845,513 | | | | 17,378,339 | | | | 20,456,322 | |
| | | | | | | |
| Liabilities | | | | | | | | | |
| Management fee payable to Sponsor | | 6,159 | | — | | | 13,643 | | | 17,451 | |
| Other liabilities | | 1,431 | | — | | | 21,123 | | | 30,774 | |
| Equity in trading accounts: | | | | | | |
| Commodity futures contracts | | | 218,456 | | | 331,542 | | | | 814,401 | | | | 2,687,998 | |
| Total liabilities | | | 226,046 | | | 331,542 | | | | 849,167 | | | | 2,736,223 | |
| | | | | | | |
| Net assets | | $ | 6,600,831 | | $ | 5,513,971 | | | $ | 16,529,172 | | | $ | 17,720,099 | |
| | | | | | | |
| Shares outstanding | | | 700,004 | | | 425,004 | | | | 1,225,004 | | | | 1,425,004 | |
| | | | | | | |
Shares authorized | | | | * | | | | * | |
| | | |
| Net asset value per share | | $ | 9.43 | | $ | 12.97 | | | $ | 13.49 | | | $ | 12.44 | |
| | | | | | | |
| Market value per share | | $ | 9.48 | | $ | 13.00 | | | $ | 13.49 | | | $ | 12.40 | |
The accompanying notes are* On April 7, 2022, the Teucrium Sugar Fund registered an integral partindeterminate number of these financial statements.shares of the Fund pursuant to Rule 456(d) under the Securities Act of 1933.
TEUCRIUM SUGAR FUND
SCHEDULE OF INVESTMENTS
September 30, 2017
(Unaudited)
| | | | | | Percentage of | | | | |
| Description: Assets | | Fair Value | | | Net Assets | | | Shares | |
| | | | | | | | | | |
| Cash equivalents | | | | | | | | | | | | |
| Money market funds | | | | | | | | | | | | |
| Fidelity Institutional Money Market Funds - Government Portfolio (cost $196,877) | | $ | 196,877 | | | | 2.98 | % | | | 196,877 | |
| | | | | | | | | | | | | |
| | | | | | | | | | | Notional Amount
(Long Exposure) | |
| Commodity futures contracts | | | | | | | | | | | | |
| United States sugar futures contracts | | | | | | | | | | | | |
| ICE sugar futures JULY18 (122 contracts) | | $ | 14,067 | | | | 0.21 | % | | $ | 1,966,250 | |
| | | | | | | | | | | | | |
| Description: Liabilities | | Fair Value | | | Percentage of
Net Assets | | | Notional Amount
(Long Exposure) | |
| | | | | | | | | | | | | |
| Commodity futures contracts | | | | | | | | | | | | |
| United States sugar futures contracts | | | | | | | | | | | | |
| ICE sugar futures MAY18 (145 contracts) | | $ | 20,664 | | | | 0.31 | % | | $ | 2,309,328 | |
| ICE sugar futures MAR19 (135 contracts) | | | 197,792 | | | | 3.00 | | | | 2,314,872 | |
| Total commodity futures contracts | | $ | 218,456 | | | | 3.31 | % | | $ | 4,624,200 | |
The accompanying notes are an integral part of these financial statements.
TEUCRIUM SUGAR FUND
SCHEDULE OF INVESTMENTS
DecemberMarch 31, 20162024
(Unaudited)
| | | | | | Percentage of | | | | |
| Description: Assets | | Fair Value | | | Net Assets | | | Shares | |
| | | | | | | | | | |
| Cash equivalents | | | | | | | | | | | | |
| Money market funds | | | | | | | | | | | | |
| Fidelity Investments Money Market Funds - Government Portfolio (cost $125,182) | | $ | 125,182 | | | | 2.27 | % | | | 125,182 | |
| | | | | | | | | | | | | |
| | | | | | | | | | | Notional Amount | |
| | | | | | | | | | | (Long Exposure) | |
| Commodity futures contracts | | | | | | | | | | | | |
| United States sugar futures contracts | | | | | | | | | | | | |
| ICE sugar futures MAR18 (93 contracts) | | $ | 185,147 | | | | 3.36 | % | | $ | 1,935,293 | |
| | | | | | | | | | | | | |
| Description: Liabilities | | | Fair Value | | | | Percentage of Net Assets | | | Notional Amount
(Long Exposure) | |
| | | | | | | | | | | | | |
| Commodity futures contracts | | | | | | | | | | | | |
| United States sugar futures contracts | | | | | | | | | | | | |
| ICE sugar futures MAY17 (89 contracts) | | $ | 105,829 | | | | 1.92 | % | | $ | 1,918,840 | |
| ICE sugar futures JUL17 (79 contracts) | | | 225,713 | | | | 4.09 | | | | 1,667,848 | |
| Total commodity futures contracts | | $ | 331,542 | | | | 6.01 | % | | $ | 3,586,688 | |
| | | | | | | | | | | | | | | Percentage of | | | | | |
Description: Assets | | Yield | | | Cost | | | Fair Value | | | Net Assets | | | Shares | |
| | | | | | | | | | | | | | | | | | | | | |
Cash equivalents | | | | | | | | | | | | | | | | | | | | |
Money market funds | | | | | | | | | | | | | | | | | | | | |
U.S. Bank Deposit Account | | | 5.240 | % | | $ | 1,342,798 | | | $ | 1,342,798 | | | | 8.12 | % | | | 1,342,798 | |
Goldman Sachs Financial Square Government Fund - Institutional Class | | | 5.210 | % | | | 2,708,188 | | | | 2,708,188 | | | | 16.38 | | | | 2,708,188 | |
Total Money Market Funds | | | | | | $ | 4,050,986 | | | $ | 4,050,986 | | | | 24.50 | % | | | | |
| | Maturity | | | | | | | | | | | | | | Percentage of | | | Principal | |
| | Date | | Yield | | | Cost | | | Fair Value | | | Net Assets | | | Amount | |
Commercial Paper | | | | | | | | | | | | | | | | | | | | | |
The Cigna Group | April 5, 2024 | | | 5.501 | % | | $ | 495,050 | | | $ | 499,700 | | | | 3.02 | % | | | 500,000 | |
Campbell Soup Company | May 1, 2024 | | | 5.601 | % | | | 2,477,848 | | | | 2,488,542 | | | | 15.06 | | | | 2,500,000 | |
Glencore Funding LLC | April 16, 2024 | | | 5.490 | % | | | 2,485,375 | | | | 2,494,375 | | | | 15.09 | | | | 2,500,000 | |
Glencore Funding LLC | May 10, 2024 | | | 5.475 | % | | | 2,480,199 | | | | 2,485,429 | | | | 15.04 | | | | 2,500,000 | |
Total Commercial Paper | | | | | | $ | 7,938,472 | | | $ | 7,968,046 | | | | 48.21 | % | | | | |
Total Cash Equivalents | | | | | | | | | | $ | 12,019,032 | | | | 72.71 | % | | | | |
The accompanying notes are an integral part of these financial statements.
TEUCRIUM SUGAR FUND
STATEMENTS OF OPERATIONS
(Unaudited)
| | | | | | | | | | | | | |
| | | Three months ended September 30, 2017 | | | Three months ended September 30, 2016 | | | Nine months ended September 30, 2017 | | | Nine months ended September 30, 2016 | |
| Income | | | | | | | | | | | | | | | | |
| Realized and unrealized (loss) gain on trading of commodity futures contracts: | | | | | | | | | | | | | | | | |
| Realized (loss) gain on commodity futures contracts | | $ | (678,070 | ) | | $ | 948,483 | | | $ | (2,266,185 | ) | | $ | 1,957,357 | |
| Net change in unrealized appreciation or depreciation on commodity futures contracts | | | 532,963 | | | | (18,088 | ) | | | (57,994 | ) | | | 305,435 | |
| Interest income | | | 24,194 | | | | 9,517 | | | | 55,045 | | | | 23,050 | |
| Total (loss) income | | | (120,913 | ) | | | 939,912 | | | | (2,269,134 | ) | | | 2,285,842 | |
| | | | | | | | | | | | | | | | | |
| Expenses | | | | | | | | | | | | | | | | |
| Management fees | | | 19,423 | | | | 18,006 | | | | 52,362 | | | | 44,723 | |
| Professional fees | | | 21,298 | | | | 21,511 | | | | 43,699 | | | | 39,020 | |
| Distribution and marketing fees | | | 40,751 | | | | 28,782 | | | | 86,949 | | | | 91,874 | |
| Custodian fees and expenses | | | 7,684 | | | | 5,786 | | | | 14,075 | | | | 13,137 | |
| Business permits and licenses fees | | | 4,786 | | | | 6,136 | | | | 12,677 | | | | 12,697 | |
| General and administrative expenses | | | 3,771 | | | | 4,649 | | | | 11,021 | | | | 11,702 | |
| Brokerage commissions | | | 2,765 | | | | 2,826 | | | | 6,615 | | | | 6,498 | |
| Other expenses | | | 2,007 | | | | 1,220 | | | | 3,723 | | | | 4,619 | |
| Total expenses | | | 102,485 | | | | 88,916 | | | | 231,121 | | | | 224,270 | |
| | | | | | | | | | | | | | | | | |
| Expenses waived by the Sponsor | | | (45,186 | ) | | | (48,043 | ) | | | (83,550 | ) | | | (121,429 | ) |
| | | | | | | | | | | | | | | | | |
| Total expenses, net | | | 57,299 | | | | 40,873 | | | | 147,571 | | | | 102,841 | |
| | | | | | | | | | | | | | | | | |
| Net (loss) income | | $ | (178,212 | ) | | $ | 899,039 | | | $ | (2,416,705 | ) | | $ | 2,183,001 | |
| | | | | | | | | | | | | | | | | |
| Net (loss) income per share | | $ | (0.21 | ) | | $ | 1.73 | | | $ | (3.54 | ) | | $ | 4.63 | |
| Net (loss) income per weighted average share | | $ | (0.23 | ) | | $ | 1.67 | | | $ | (3.75 | ) | | $ | 4.22 | |
| Weighted average shares outstanding | | | 784,515 | | | | 538,319 | | | | 644,235 | | | | 517,887 | |
| | | Number of | | | | | | | Percentage of | | | Notional Amount | |
Description: Liabilities | | Contracts | | | Fair Value | | | Net Assets | | | (Long Exposure) | |
| | | | | | | | | | | | | | | | | |
Commodity futures contracts | | | | | | | | | | | | | | | | |
United States sugar futures contracts | | | | | | | | | | | | | | | | |
ICE sugar futures JUL24 | | 234 | | | $ | 594,646 | | | | 3.60 | % | | $ | 5,805,072 | |
ICE sugar futures OCT24 | | 201 | | | | 83,984 | | | | 0.51 | | | | 4,963,896 | |
ICE sugar futures MAR25 | | 233 | | | | 135,771 | | | | 0.82 | | | | 5,769,826 | |
Total commodity futures contracts | | | $ | 814,401 | | | | 4.93 | % | | $ | 16,538,794 | |
The accompanying notes are an integral part of these financial statements.
STATEMENTS OF CHANGES IN NET ASSETS(Unaudited)
| | | Nine months ended | | | Nine months ended | |
| | | September 30, 2017 | | | September 30, 2016 | |
| Operations | | | | | | | | |
| Net (loss) income | | $ | (2,416,705 | ) | | $ | 2,183,001 | |
| Capital transactions | | | | | | | | |
| Issuance of Shares | | | 8,537,990 | | | | 2,487,753 | |
| Redemption of Shares | | | (5,034,425 | ) | | | (2,852,268 | ) |
| Total capital transactions | | | 3,503,565 | | | | (364,515 | ) |
| Net change in net assets | | | 1,086,860 | | | | 1,818,486 | |
| | | | | | | | | |
| Net assets, beginning of period | | $ | 5,513,971 | | | $ | 5,508,663 | |
| | | | | | | | | |
| Net assets, end of period | | $ | 6,600,831 | | | $ | 7,327,149 | |
| | | | | | | | | |
| Net asset value per share at beginning of period | | $ | 12.97 | | | $ | 10.02 | |
| | | | | | | | | |
| Net asset value per share at end of period | | $ | 9.43 | | | $ | 14.65 | |
| | | | | | | | | |
| Creation of Shares | | | 750,000 | | | | 225,000 | |
| Redemption of Shares | | | 475,000 | | | | 275,000 | |
The accompanying notes are an integral partTable of these financial statements.
Contents
TEUCRIUM SUGAR FUND
SCHEDULE OF INVESTMENTS
STATEMENTS OF CASH FLOWS
(Unaudited)December 31, 2023
| | | Nine months ended | | | Nine months ended | |
| | | September 30, 2017 | | | September 30, 2016 | |
| Cash flows from operating activities: | | | | | | | | |
| Net (loss) income | | $ | (2,416,705 | ) | | $ | 2,183,001 | |
| Adjustments to reconcile net (loss) income to net cash (used in) provided by operating activities: | | | | | | | | |
| Net change in unrealized appreciation or depreciation on commodity futures contracts | | | 57,994 | | | | (305,435 | ) |
| Changes in operating assets and liabilities: | | | | | | | | |
| Due from broker | | | (182,644 | ) | | | 58,431 | |
| Interest receivable | | | (68 | ) | | | (781 | ) |
| Restricted cash | | | 74,068 | | | | 55,389 | |
| Other assets | | | (7,747 | ) | | | (17,966 | ) |
| Due to broker | | | — | | | | 250,600 | |
| Management fee payable to Sponsor | | | 6,159 | | | | 5,864 | |
| Other liabilities | | | 1,431 | | | | (1,063 | ) |
| Net cash (used in) provided by operating activities | | | (2,467,512 | ) | | | 2,228,040 | |
| | | | | | | | | |
| Cash flows from financing activities: | | | | | | | | |
| Proceeds from sale of Shares | | | 8,537,990 | | | | 2,487,753 | |
| Redemption of Shares | | | (5,034,425 | ) | | | (2,852,268 | ) |
| Net cash provided by (used in) financing activities | | | 3,503,565 | | | | (364,515 | ) |
| | | | | | | | | |
| Net change in cash and cash equivalents | | | 1,036,053 | | | | 1,863,525 | |
| Cash and cash equivalents, beginning of period | | | 5,016,531 | | | | 4,932,791 | |
| Cash and cash equivalents, end of period | | $ | 6,052,584 | | | $ | 6,796,316 | |
| | | | | | | | | | | | | | | Percentage of | | | | | |
Description: Assets | | Yield | | | Cost | | | Fair Value | | | Net Assets | | | Shares | |
| | | | | | | | | | | | | | | | | | | | | |
Cash equivalents | | | | | | | | | | | | | | | | | | | | |
Money market funds | | | | | | | | | | | | | | | | | | | | |
U.S. Bank Deposit Account | | | 5.270 | % | | $ | 1,532,232 | | | $ | 1,532,232 | | | | 8.65 | % | | | 1,532,232 | |
Goldman Sachs Financial Square Government Fund - Institutional Class | | | 5.250 | % | | | 1,501,006 | | | | 1,501,006 | | | | 8.47 | | | | 1,501,006 | |
Total Money Market Funds | | | | | | $ | 3,033,238 | | | $ | 3,033,238 | | | | 17.12 | % | | | | |
| | Maturity | | | | | | | | | | | | | | Percentage of | | | Principal | |
| | Date | | Yield | | | Cost | | | Fair Value | | | Net Assets | | | Amount | |
Commercial Paper | | | | | | | | | | | | | | | | | | | | | |
Albemarle Corporation | January 4, 2024 | | | 5.753 | % | | $ | 2,480,382 | | | $ | 2,498,823 | | | | 14.10 | % | | | 2,500,000 | |
Brookfield Infrastructure Holdings (Canada) Inc. | January 30, 2024 | | | 5.814 | % | | | 550,863 | | | | 552,447 | | | | 3.12 | | | | 555,000 | |
Entergy Corporation | March 1, 2024 | | | 5.665 | % | | | 2,467,625 | | | | 2,476,875 | | | | 13.98 | | | | 2,500,000 | |
FMC Corporation | January 19, 2024 | | | 5.816 | % | | | 2,488,878 | | | | 2,492,850 | | | | 14.07 | | | | 2,500,000 | |
National Fuel Gas Company | January 8, 2024 | | | 5.867 | % | | | 2,480,400 | | | | 2,497,200 | | | | 14.09 | | | | 2,500,000 | |
Total Commercial Paper | | | | | | $ | 10,468,148 | | | $ | 10,518,195 | | | | 59.36 | % | | | | |
Total Cash Equivalents | | | | | | | | | | $ | 13,551,433 | | | | 76.47 | % | | | | |
| | | Number of | | | | | | | Percentage of | | | Notional Amount | |
Description: Liabilities | | Contracts | | | Fair Value | | | Net Assets | | | (Long Exposure) | |
| | | | | | | | | | | | | | | | | |
Commodity futures contracts | | | | | | | | | | | | | | | | |
United States sugar futures contracts | | | | | | | | | | | | | | | | |
ICE sugar futures MAY24 | | | 270 | | | $ | 1,051,261 | | | | 5.93 | % | | $ | 6,175,008 | |
ICE sugar futures JUL24 | | 233 | | | 1,128,473 | | | 6.37 | | | 5,326,193 | |
ICE sugar futures MAR25 | | 268 | | | 508,264 | | | 2.87 | | | 6,216,314 | |
Total commodity futures contracts | | | | | | $ | 2,687,998 | | | | 15.17 | % | | $ | 17,717,515 | |
The accompanying notes are an integral part of these financial statements.
TEUCRIUM SUGAR FUND
STATEMENTS OF OPERATIONS
(Unaudited)
| | | Three months ended | | | Three months ended | |
| | | March 31, 2024 | | | March 31, 2023 | |
Income | | | | | | | | |
Realized and unrealized gain (loss) on trading of commodity futures contracts: | | | | | | | | |
Realized (loss) gain on commodity futures contracts | | $ | (482,314 | ) | | $ | 1,339,448 | |
Net change in unrealized appreciation on commodity futures contracts | | | 1,873,597 | | | | 3,139,817 | |
Interest income | | | 224,625 | | | | 271,449 | |
Total income | | | 1,615,908 | | | | 4,750,714 | |
| | | | | | | | | |
Expenses | | | | | | | | |
Management fees | | | 42,559 | | | | 61,338 | |
Professional fees | | | 27,663 | | | | 69,929 | |
Distribution and marketing fees | | | 82,545 | | | | 34,816 | |
Custodian fees and expenses | | | 8,512 | | | | 1,036 | |
Business permits and licenses fees | | | 5,631 | | | | 2,491 | |
General and administrative expenses | | | 5,107 | | | | 613 | |
Total expenses | | | 172,017 | | | | 170,223 | |
| | | | | | | | | |
Expenses waived by the Sponsor | | | - | | | | - | |
| | | | | | | | | |
Total expenses, net | | | 172,017 | | | | 170,223 | |
| | | | | | | | | |
Net income | | $ | 1,443,891 | | | $ | 4,580,491 | |
| | | | | | | | | |
Net income per share | | $ | 1.05 | | | $ | 1.93 | |
Net income per weighted average share | | $ | 1.12 | | | $ | 1.87 | |
Weighted average shares outstanding | | | 1,287,641 | | | | 2,446,948 | |
The accompanying notes are an integral part of these financial statements.
TEUCRIUM SUGAR FUND
STATEMENTS OF CHANGES IN NET ASSETS
(Unaudited)
| | | Three months ended | | | Three months ended | |
| | | March 31, 2024 | | | March 31, 2023 | |
Operations | | | | | | | | |
Net income | | $ | 1,443,891 | | | $ | 4,580,491 | |
Capital transactions | | | | | | | | |
Issuance of Shares | | | - | | | | 5,458,637 | |
Redemption of Shares | | | (2,634,818 | ) | | | (6,262,695 | ) |
Total capital transactions | | | (2,634,818 | ) | | | (804,058 | ) |
Net change in net assets | | | (1,190,927 | ) | | | 3,776,433 | |
| | | | | | | | | |
Net assets, beginning of period | | $ | 17,720,099 | | | $ | 24,262,359 | |
| | | | | | | | | |
Net assets, end of period | | $ | 16,529,172 | | | $ | 28,038,792 | |
| | | | | | | | | |
Net asset value per share at beginning of period | | $ | 12.44 | | | $ | 9.51 | |
| | | | | | | | | |
Net asset value per share at end of period | | $ | 13.49 | | | $ | 11.44 | |
| | | | | | | | | |
Creation of Shares | | | - | | | | 525,000 | |
Redemption of Shares | | | 200,000 | | | | 625,000 | |
The accompanying notes are an integral part of these financial statements.
TEUCRIUM SUGAR FUND
STATEMENTS OF CASH FLOWS
(Unaudited)
| | | Three months ended | | | Three months ended | |
| | | March 31, 2024 | | | March 31, 2023 | |
Cash flows from operating activities: | | | | | | | | |
Net income | | $ | 1,443,891 | | | $ | 4,580,491 | |
Adjustments to reconcile net income to net cash provided by operating activities: | | | | | | | | |
Net change in unrealized appreciation on commodity futures contracts | | | (1,873,597 | ) | | | (3,139,817 | ) |
Changes in operating assets and liabilities: | | | | | | | | |
Due from broker | | | 1,586,659 | | | | 447,801 | |
Interest receivable | | | 9,817 | | | | (16,719 | ) |
Other assets | | | (8,279 | ) | | | (16,995 | ) |
Due to broker | | | - | | | | 2,101,900 | |
Management fee payable to Sponsor | | | (3,808 | ) | | | 2,877 | |
Other liabilities | | | (9,651 | ) | | | (623 | ) |
Net cash provided by operating activities | | | 1,145,032 | | | | 3,958,915 | |
| | | | | | | | | |
Cash flows from financing activities: | | | | | | | | |
Proceeds from sale of Shares | | | - | | | | 5,458,637 | |
Redemption of Shares | | | (2,634,818 | ) | | | (6,262,695 | ) |
Net cash used in financing activities | | | (2,634,818 | ) | | | (804,058 | ) |
| | | | | | | | | |
Net change in cash and cash equivalents | | | (1,489,786 | ) | | | 3,154,857 | |
Cash and cash equivalents beginning of period | | | 16,773,745 | | | | 22,977,480 | |
Cash and cash equivalents end of period | | $ | 15,283,959 | | | $ | 26,132,337 | |
The accompanying notes are an integral part of these financial statements.
NOTES TO FINANCIAL STATEMENTS
September 30, 2017March 31, 2024
(Unaudited)
Note 1– Organization and Operation
Teucrium Sugar Fund (referred to herein as “CANE” or the “Fund”) is a commodity pool that is a series of Teucrium Commodity Trust (“Trust”), a Delaware statutory trust formed on September 11, 2009. The Fund issues common units, called the “Shares,” representing fractional undivided beneficial interests in the Fund. The Fund continuously offers Creation Baskets consisting of 25,000 Shares at their Net Asset Value (“NAV”) to “Authorized Purchasers” through Foreside Fund Services, LLC, which is the distributor for the Fund (the “Distributor”). Authorized Purchasers sell such Shares, which are listed on the New York Stock Exchange (“NYSE”) Arca under the symbol “CANE,” to the public at per-Share offering prices that reflect, among other factors, the trading price of the Shares on the NYSE Arca, the NAV of the Fund at the time the Authorized Purchaser purchased the Creation Baskets and the NAV at the time of the offer of the Shares to the public, the supply of and demand for Shares at the time of sale, and the liquidity of the markets for sugar interests. The Fund’s Shares trade in the secondary market on the NYSE Arca at prices that are lower or higher than their NAV per Share.
The investment objective of CANE is to have the daily changes in percentage termsthe NAV of the Shares’ Net Asset Value (“NAV”)Fund’s Shares reflect the daily changes in percentage terms ofthe sugar market for future delivery as measured by the Benchmark. The Benchmark is a weighted average of the closing settlement prices for three futures contracts for No.11 sugar (“Sugar Futures Contracts”) that are traded on the ICE Futures US (“ICE”):
CANE Benchmark
ICE Sugar Futures Contract | | Weighting | |
Second to expire | 35% | | 35 | % |
Third to expire | 30% | | 30 | % |
Expiring in the March following the expiration of the third-to-expirethird to expire contract | 35% | | 35 | % |
The Fund commenced investment operations on September 19, 2011 and has a fiscal year ending December 31. The Fund’s sponsor is Teucrium Trading, LLC (the “Sponsor”). The Sponsor is responsible for the management of the Fund. The Sponsor is registered as a commodity pool operator (“CPO”) and a commodity trading adviser (“CTA”) with the Commodity Futures Trading Commission (“CFTC”) and is a member of the National Futures Association (the “NFA”(“NFA”) and became a commodity pool operator registered with the Commodity Futures Trading Commission (the “CFTC”) effective November 10, 2009..
On June 17,13, 2011, the Fund’s registration of 10,000,000 shares oninitial Form S-1 was declared effective by the U.S. Securities and Exchange Commission (“SEC”). On September 19, 2011, the Fund listed its shares on the NYSE Arca under the ticker symbol “CANE.” On the business day prior to that, the Fund issued 100,000 shares in exchange for $2,500,000 at the Fund’s initial NAV of $25 per share. The Fund also commenced investment operations on September 19, 2011 by purchasing commodity futures contracts traded on ICE. On December 31, 2010, the Fund had four shares outstanding, which were owned by the Sponsor. On May S-1 2017, a subsequent registration for CANE was declared effective by the SEC. On September 16, 2011, two Creation Baskets were issued representing 100,000 shares and $2,500,000. On September 19, 2011, CANE started trading on the NYSE Arca. The current registration statement for CANE was declared effective by the SEC on April 7, 2022. This registration statement for CANE registered an indeterminate number of shares.
The accompanying unaudited financial statements have been prepared in accordance with Rule 10-0110-01 of Regulation S-XS-X promulgated by the SEC and, therefore, do not include all information and footnote disclosures required under accounting principles generally accepted in the United States of America (“GAAP”). The financial information included herein is unaudited; however, such financial information reflects all adjustments which are, in the opinion of management, necessary for the fair presentation of the Fund’s financial statements for the interim period. It is suggested that these interim financial statements be read in conjunction with the financial statements and related notes included in the Trust’s Annual Report on Form 10-K,10-K, as well as the most recent Form S-1S-1 filing, as applicable. The operating results for the three and nine months ended September 30, 2017March 31, 2024 are not necessarily indicative of the results to be expected for the full year ending December 31, 2017.2024.
Subject to the terms of the Trust Agreement, Teucrium Trading, LLC, in its capacity as the Sponsor (“Sponsor”), may terminate a Fund at any time, regardless of whether the Fund has incurred losses, including, for instance, if it determines that the Fund’s aggregate net assets in relation to its operating expenses make the continued operation of the Fund unreasonable or imprudent. However, no level of losses will require the Sponsor to terminate a Fund.
Note 2– Principal Contracts and Agreements
On August 17, 2015 (the “Conversion Date”), U.S. Bank N.A. replaced The Bank of New York Mellon as the Custodian for the Fund. The principal business address for U.S. Bank N.A. is 1555 North RiverCenter Drive, Suite 302, Milwaukee, Wisconsin 53212. U.S. Bank N.A. is a Wisconsin state chartered bank subject to regulation by the Board of Governors of the Federal Reserve System and the Wisconsin State Banking Department. The principal address forSponsor employs U.S. Bancorp Fund Services, LLC, doing business as U.S. Bank Global Fund Services (“USBFS”Global Fund Services”), for Transfer Agency, Fund Accounting and Fund Administration services. The principal address for Global Fund Services is 777 East Wisconsin Avenue,615 E. Michigan Street, Milwaukee, WI 53202. In addition, effective on the Conversion Date, USBFS, a wholly owned subsidiary of U.S. Bank, commenced serving as administrator for each Fund, performing certain administrative and accounting services and preparing certain SEC reports on behalf of the Funds, and also became the registrar and transfer agent for each Fund’s Shares. For such services, U.S. Bank and USBFS will receive an asset-based fee, subject to a minimum annual fee.
For custody services, the Funds will pay to U.S. Bank N.A. 0.0075% of average gross assets up to $1$1 billion, and .0050% of average gross assets over $1$1 billion, annually, plus certain per-transaction charges. For Transfer Agency, Fund Accounting and Fund Administration services, which are based on the total assets for all the Funds in the Trust, the Funds will pay to USBFS 0.06%Global Fund Services 0.05% of average gross assets on the first $250 million, 0.05% on the next $250$500 million, 0.04% on the next $500$500 million, 0.03% on the next $2 billion and 0.03%0.02% on the balance over $1$3 billion annually. A combined minimum annual fee of up to $64,500$47,000 for custody, transfer agency, accounting and administrative services is assessed per Fund. For the three months ended September 30, 2017 and 2016, the Fund recognized $7,684 and $5,786, respectively, for theseThese services which wasare recorded inas custodian fees and expenses on the statements of operations;operations. A summary of these expenses $5,582 in 2017 and $3,868 in 2016 were waived by the Sponsor. For the nine months ended September 30, 2017 and 2016, the Fund recognized $14,075 and $13,137 respectively, for these services, which was recorded in custodian fees and expenses on the statements of operations; of these expenses $9,203 in 2017 and $9,694 in 2016 were waived by the Sponsor.is included below.
The Sponsor employs Foreside Fund Services, LLC (“Foreside” or the “Distributor”) as the Distributor for the Funds. The Distribution Services Agreement among the Distributor and the Sponsor calls for the Distributor to work with the Custodian in connection with the receipt and processing of orders for Creation Baskets and Redemption Baskets and the review and approval of all Fund sales literature and advertising materials. The Distributor and the Sponsor have also entered into a Securities Activities and Service Agreement (the “SASA”) under which certain employees and officers of the Sponsor are licensed as registered representatives or registered principals of the Distributor, under Financial Industry Regulatory Authority (“FINRA”) rules. For its services as the Distributor, Foreside receives a fee of 0.01% of theeach Fund’s average daily net assets and an aggregate annual fee of $100,000 for all Teucrium Funds, along with certain expense reimbursements. For its services under the SASA, Foreside receives a fee of $5,000 per registered representative and $1,000 per registered location. For the three months ended September 30, 2017 and 2016, the Fund recognized $2,814 and $1,578, respectively, for theseThese services which wasare recorded inas distribution and marketing fees on the statements of operations;operations. A summary of these expenses $1,178 in 2017 and $1,578 in 2016 were waived by the Sponsor. For the nine months ended September 30, 2017 and 2016, the Fund recognized $6,697 and $6,606, respectively, for these services, which was recorded in distribution and marketing fees on the statements of operations; of these expenses $3,093 in 2017 and $4,047 in 2016 were waived by the Sponsor.is included below.
ED&F ManMarex Capital Markets, Inc. (“ED&F Man”Marex”) servesand StoneX Financial Inc. (“StoneX”) serve as the Underlying Funds’ clearing brokerbrokers to execute and clear the Underlying Funds’ futures contracts and provide other brokerage-related services. ED&F Man isMarex and StoneX are each registered as a FCMfutures commission merchants (“FCM”) with the U.S. CFTC and isare members of the NFA. The clearing brokers are registered as broker-dealers with the SEC and are each a member of the NFA. ED&F Man is also registered as a broker/dealer with the U.S. SecuritiesFINRA. Marex and Exchange Commission and is a member of the FINRA. ED&F Man is aStoneX are each clearing membermembers of ICE Futures U.S., Inc., Chicago Board of Trade, Chicago Mercantile Exchange, New York Mercantile Exchange, and all other major United States commodity exchanges. For Corn, Soybean, Sugar, and Wheat Futures Contracts ED&F ManMarex is paid $9.00$3.00 per round turn. Forturn exclusive of pass-through fees for the three months ended September 30, 2017exchange and 2016, the NFA. StoneX is paid $2.50 per round turn exclusive of pass-through fees for the exchange and the NFA. Additionally, if the monthly commissions paid by each Fund does not equal or exceed 16.5% return on the StoneX Capital Requirement at 9.6% of the Exchange Maintenance Margin, each Fund will pay a true up to meet that return at the end of each month. These expenses are recognized $2,765 and $2,826, respectively, for these services, which was recorded in brokerage commissionson a per-trade basis. The half-turn is recognized as an unrealized loss on the statements of operations for contracts that have been purchased since the change in recognition, and paid for by the Fund. For the nine months ended September 30, 2017 and 2016, the Funda full turn is recognized $6,615 and $6,498, respectively, for these services, which was recorded in brokerage commissionsas a realized loss on the statements of operations and paid for bywhen a contract is sold. A summary of these expenses can be found under the Fund.heading, Brokerage Commissions.
The sole Trustee of the Trust is Wilmington Trust Company, a Delaware banking corporation. The Trustee will accept service of legal process on the Trust in the State of Delaware and will make certain filings under the Delaware Statutory Trust Act. For its services, the Trustee receives an annual fee of $3,300 from the Trust. For the three and nine months ended September 30, 2017 and 2016, the Fund recognized $192 and $133 for these services; of these expenses $0 and $133 were waived by the Sponsor in 2017 and 2016 respectively. This expense isThese services are recorded in business permits and licenses fees on the statements of operations. A summary of these expenses is included below.
| | | Three months ended March 31, 2024 | | | Three months ended March 31, 2023 | |
Amount Recognized for Custody Services | | $ | 8,512 | | | $ | 1,036 | |
Amount of Custody Services Waived | | $ | - | | | $ | - | |
| | | | | | | | | |
Amount Recognized for Distribution Services | | $ | 3,491 | | | $ | 1,548 | |
Amount of Distribution Services Waived | | $ | - | | | $ | - | |
| | | | | | | | | |
Amount Recognized for Wilmington Trust | | $ | - | | | $ | - | |
Amount of Wilmington Trust Waived | | $ | - | | | $ | - | |
Note 3 – Summary of Significant Accounting Policies
Basis of Presentation
The accompanying financial statements have been prepared in accordance with accounting principles generally accepted in the United States of America (“U.S. GAAP”) as detailed in the Financial Accounting Standards Board’s Accounting Standards Codification.
Revenue Recognition
Commodity futures contracts are recorded on the trade date. All such transactions are recorded on the identified cost basis and marked to market daily. Unrealized appreciation or depreciation on commodity futures contracts are reflected in the statements of operations as the difference between the original contract amount and the fair market value as of the last business day of the year or as of the last date of the financial statements. Changes in the appreciation or depreciation between periods are reflected in the statements of operations. Interest on cash equivalents with financial institutions are recognized on thean accrual basis. The FundsFund seeks to earn interest on funds held at the custodian and other financial institutions at prevailing market rates for such investments.
The Sponsor invests a portion of cash in commercial paper, which is deemed a cash equivalent based on the rating and duration of contracts as described in the notes to the financial statements and reflected in cash and cash equivalents on the statements of assets and liabilities and on the statements of cash flows. Accretion on these investments is recognized using the effective interest method in U.S. dollars and included in interest income on the statements of operations.
The Sponsor invests a portion of the cash held by the broker in short term Treasury Bills as collateral for open futures contracts. Accretion on these investments is recognized using the effective interest method in U.S. dollars and included in interest income on the statements of operations.
Brokerage Commissions
BrokerageThe Sponsor recognizes the expense for brokerage commissions for futures contract trades on all open commodity futures contracts are accrueda per-trade basis. The below table shows the amounts included on the trade date statements of operations as total brokerage commissions paid inclusive of unrealized loss for the three months ended March 31, 2024 and on a full-turn basis.2023.
| | | CANE | |
Three months ended March 31, 2024 | | $ | 2,008 | |
Three months ended March 31, 2023 | | $ | 6,055 | |
Income Taxes
For federal income tax purposes, the Fund will be treated as a publicly traded partnership. A publicly traded partnership is generally treated as a corporation for federal income tax purposes unless 90% or more of the publicly traded partnership’s gross income for each taxable year of its existence consists of qualifying income as defined in section 7704(d) of the Internal Revenue Code of 1986, as amended. Qualifying income is defined as generally including, in pertinent part, interest (other than from a financial business), dividends, and gains from the sale or disposition of capital assets held for the production of interest or dividends. In the case of a partnership of which a principal activity is the buying and selling of commodities, other than as inventory, or of futures, forwards and options with respect to commodities, qualifying income also includes income and gains from commodities and from futures, forwards, options with respect to commodities and, provided the partnership is a trader or investor with respect to such assets, swaps and other notional principal contracts with respect to commodities. The Fund expects that at least 90% of the Fund’s gross income for each taxable year will consist of qualifying income and that the Fund will be taxed as a partnership for federal income tax purposes. The Fund does not record a provision for income taxes because the shareholders report their share of the Fund’s income or loss on their income tax returns. The financial statements reflect the Fund’s transactions without adjustment, if any, required for income tax purposes.
The Fund is required to determine whether a tax position is more likely than not to be sustained upon examination by the applicable taxing authority, including resolution of any related appeals or litigation processes, based on the technical merits of the position. The Fund files an income tax return in the U.S. federal jurisdiction and may file income tax returns in various U.S. states and foreign jurisdictions. For all tax years 20142021 to 2016,2023, the Fund remains subject to income tax examinations by major taxing authorities. The tax benefit recognized is measured as the largest amount of benefit that has a greater than fifty percent likelihood of being realized upon ultimate settlement. De-recognition of a tax benefit previously recognized results in the Fund recording a tax liability that reduces net assets. Based on its analysis, the Fund has determined that it has not incurred any liability for unrecognized tax benefits as of September 30, 2017March 31, 2024 and for the years ended December 31, 2016, 20152023, 2022, and 2014.2021. However, the Fund’s conclusions regarding this policy may be subject to review and adjustment at a later date based on factors including, but not limited to, ongoing analysis of and changes to tax laws, regulations, and interpretations thereof.
The Fund recognizes interest accrued related to unrecognized tax benefits and penalties related to unrecognized tax benefits in income tax fees payable, if assessed. No interest expense or penalties have been recognized as of and for the three and nine months ended September 30, 2017 March 31, 2024 and 2016.2023.
The Fund may be subject to potential examination by U.S. federal, U.S. state, or foreign jurisdictional authorities in the area of income taxes. These potential examinations may include questioning the timing and amount of deductions, the nexus of income among various tax jurisdictions, and compliance with U.S. federal, U.S. state and foreign tax laws. The Fund’s management does not expect that the total amount of unrecognized tax benefits will materially change over the next twelve months.
Creations and Redemptions
Authorized Purchasers may purchase Creation Baskets consisting of 25,000 shares from the Fund. The amount of the proceeds required to purchase a Creation Basket will be equal to the NAV of the shares in the Creation Basket determined as of 4:00 p.m. New York time(ET) on the day the order to create the basket is properly received.received in good order.
Authorized Purchasers may redeem shares from the Fund only in blocks of 25,000 shares called “Redemption Baskets.” The amount of the redemption proceeds for a Redemption Basket will be equal to the NAV of the shares in the Redemption Basket determined as of 4:00 p.m. New York time(ET) on the day the order to redeem the basket is properly received.received in good order.
The Fund receives or pays the proceeds from shares sold or redeemed within three business days after the trade date of the purchase or redemption. The amounts due from Authorized Purchasers are reflected in the Fund’s statements of assets and liabilities as receivable forcapital shares sold.receivable. Amounts payable to Authorized Purchasers upon redemption are reflected in the Fund’s statements of assets and liabilities as payable for shares redeemed.
As outlined in the most recent Form S-1S-1 filing, 50,000 shares represents two Redemption Baskets for the Fund and a minimum level of shares. If the Fund experienced redemptions that caused the number of Shares outstanding to decrease to the minimum level of Shares required to be outstanding, until the minimum number of Shares is again exceeded through the purchase of a new Creation Basket, there can be no more redemptions by an Authorized Purchaser.
Allocation of Shareholder Income and Losses
Profit or loss is allocated among the shareholders of the Fund in proportion to the number of shares each shareholder holds as of the close of each month.
Cash and Cash Equivalents
Cash equivalents are highly-liquidhighly liquid investments with maturity dates of 90 days or less when acquired. The FundTrust reported its cash equivalents in the statements of assets and liabilities at market value, or at carrying amounts that approximate fair value, because of their highly-liquidhighly liquid nature and short-term maturities. TheEach Fund that is a series of the Trust has these balancesthe balance of its assetscash equivalents on deposit with banks.financial institutions. The Fund hadholds a balance of $196,877 and $125,182 in money market funds at September 30, 2017 and December 31, 2016, respectively; these balances arethat is included in cash and cash equivalents on the statements of assets and liabilities. The Sponsor investedinvests a portion of the available cash for the FundFunds in alternative demand-depositdemand deposit savings accounts, which is classified as cash and not as a cash equivalent. The Fund had a balance of $5,855,801 as of September 30, 2017 and $4,891,490 as of December 31, 2016 in a demand-deposit savings account. This change resulted in a reduction in the balance held in money market funds.equivalents. Assets deposited with financial institutions, the bank may, at times, exceed federally insured limits. The Sponsor invests a portion of the available cash for the Funds in investment grade commercial paper with durations of 90 days or less, which is classified as a cash equivalent and is not FDIC insured. The Sponsor may invest a portion of the cash held by the broker in short term Treasury Bills as collateral for open futures contracts, which is classified as a cash equivalent and is not FDIC insured.
Restricted Cash
| | | March 31, 2024 | | | December 31, 2023 | |
Money Market Funds | | $ | 4,050,986 | | | $ | 3,033,238 | |
Demand Deposit Savings Accounts | | | 3,264,927 | | | | 3,222,312 | |
Commercial Paper | | | 7,968,046 | | | | 10,518,195 | |
Total cash and cash equivalents as presented on the Statements of Assets and Liabilities | | $ | 15,283,959 | | | $ | 16,773,745 | |
On August 17, 2015 (the “Conversion Date”), U.S. Bank N.A. replaced The Bank
Due from/to Broker
The amount recorded by the Fund for the amount due from and to the clearing broker includes, but is not limited to, cash held by the broker, amounts payable to the clearing broker related to open transactions, and payables for commodities futures accounts liquidating to an equity balance on the clearing broker’s records.records, and amounts of brokerage commissions paid and recognized as unrealized losses.
Margin is the minimum amount of funds that must be deposited by a commodity interest trader with the trader’s broker to initiate and maintain an open position in futures contracts. A margin deposit acts to assure the trader’s performance of the futures contracts purchased or sold. Futures contracts are customarily bought and sold on initial margin that represents a very small percentage of the aggregate purchase or sales price of the contract. Because of such low margin requirements, price fluctuations occurring in the futures markets may create profits and losses that, in relation to the amount invested, are greater than are customary in other forms of investment or speculation. As discussed below, adverse price changes in the futures contract may result in margin requirements that greatly exceed the initial margin. In addition, the amount of margin required in connection with a particular futures contract is set from time to time by the exchange on which the contract is traded and may be modified from time to time by the exchange during the term of the contract. Brokerage firms, such as the Fund’s clearing brokers, carrying accounts for traders in commodity interest contracts generally require higher amounts of margin as a matter of policy to further protect themselves. Over-the-counterOver the counter trading generally involves the extension of credit between counterparties, so the counterparties may agree to require the posting of collateral by one or both parties to address credit exposure.
When a trader purchases an option, there is no margin requirement; however, the option premium must be paid in full. When a trader sells an option, on the other hand, he or she is required to deposit margin in an amount determined by the margin requirements established for the underlying interest and, in addition, an amount substantially equal to the current premium for the option. The margin requirements imposed on the selling of options, although adjusted to reflect the probability that out-of-the-money options will not be exercised, can in fact be higher than those imposed in dealing in the futures markets directly. Complicated margin requirements apply to spreads and conversions, which are complex trading strategies in which a trader acquires a mixture of options positions and positions in the underlying interest.
Ongoing or “maintenance” margin requirements are computed each day by a trader’s clearing broker. When the market value of a particular open futures contract changes to a point where the margin on deposit does not satisfy maintenance margin requirements, a margin call is made by the broker. If the margin call is not met within a reasonable time, the broker may close out the trader’s position. With respect to the Fund’s trading, the Fund (and not its shareholders personally) is subject to margin calls.
Finally, many major U.S. exchanges have passed certain cross margining arrangements involving procedures pursuant to which the futures and options positions held in an account would, in the case of some accounts, be aggregated and margin requirements would be assessed on a portfolio basis, measuring the total risk of the combined positions.
Calculation of Net Asset Value
The Fund’s NAV is calculated by:
| | ●• | Taking the current market value of its total assets and |
| | • | |
| ● | Subtracting any liabilities. |
The administrator, USBFS,Global Fund Services, calculates the NAV of the Fund once each trading day. It calculates the NAV as of the earlier of the close of the NYSE or 4:00 p.m. New York time.(ET). The NAV for a particular trading day is released after 4:15 p.m. New York time.(ET).
In determining the value of Sugar Futures Contracts, the administrator uses the ICE closing price. The administrator determines the value of all other Fund investments as of the earlier of the close of the NYSE or 4:00 p.m. New York time.(ET). The value of over-the-counter sugar interests is determined based on the value of the commodity or futures contract underlying such sugar interest, except that a fair value may be determined if the Sponsor believes that the Fund is subject to significant credit risk relating to the counterparty to such sugar interest. For purposes of financial statements and reports, the Sponsor will recalculate the NAV where necessary to reflect the “fair value” of a Futures Contract when the Futures Contract closes at its price fluctuation limit for the day. Short term Treasury securities held by the Fund are valued by the administrator using values received from recognized third-partythird-party vendors and dealer quotes. NAV includes any unrealized profit or loss on open sugar interests and any other income or expense accruing to the Fund but unpaid or not received by the Fund.
Sponsor Fee, Allocation of Expenses and Related Party Transactions
The Sponsor is responsible for investing the assets of the Fund in accordance with the objectives and policies of the Fund. In addition, the Sponsor arranges for one or more third parties to provide administrative, custodial, accounting, transfer agency and other necessary services to the Trust and the Funds. In addition, the Sponsor has elected not to outsource services directly attributable to the Trust and the Funds such as accounting, financial reporting, regulatory compliance, and trading activities.activities, which the Sponsor performs itself. In addition, the Fund is contractually obligated to pay a monthly management fee to the Sponsor, based on average daily net assets, at a rate equal to 1.00% per annum.
The Fund generally pays for all brokerage fees, taxes, and other expenses, including licensing fees for the use of intellectual property, registration or other fees paid to the SEC, FINRA, formerly the National Association of Securities Dealers, or any other regulatory agency in connection with the offer and sale of subsequent Shares after its initial registration and all legal, accounting, printing and other expenses associated therewith. The Fund also pays its portion of the fees and expenses associated with the Trust’s tax accounting and reporting requirements. Certain aggregate expenses common to all Funds within the Trust are allocated by the Sponsor to the respective fundsFund based on activity drivers deemed most appropriate by the Sponsor for such expenses, including but not limited to relative assets under management and creation and redeem order activity.
These aggregate common expenses include, but are not limited to, legal, auditing, accounting and financial reporting, tax-preparation, regulatory compliance, trading activities, and insurance costs, as well as fees paid to the Distributor, which are included in the related line item in the statements of operations. A portion of these aggregate common expenses are related to the Sponsor or related parties of principals of the Sponsor; these are necessary services to the Funds, which are primarily the cost of performing accounting and financial reporting, regulatory compliance, and trading activities that are directly attributable to the Fund. For the three months ended September 30, 2017 and 2016, suchSuch expenses which are primarily recorded as distribution and marketing fees in the financial statements of each Fund.
| | | Three months ended March 31, 2024 | | | Three months ended March 31, 2023 | |
Recognized Related Party Transactions | | $ | 58,527 | | | $ | 23,761 | |
Waived Related Party Transactions | | $ | - | | | $ | - | |
The Sponsor has the ability to elect to pay certain expenses on behalf of the statement of operations, totaled $29,360 in 2017Funds or waive the management fee. This election is subject to change by the Sponsor, at its discretion. Expenses paid by the Sponsor and $18,520 in 2016; of these amounts, $20,499 in 2017 and $18,520 in 2016 wereManagement fees waived by the Sponsor. For the nine months ended September 30, 2017 and 2016, suchSponsor are, if applicable, presented as waived expenses totaled $78,734 in 2017 and $86,877 in 2016; of these amounts, $33,446 in 2017 and $55,587 in 2016 were waived by the Sponsor. All asset-based fees and expenses for the Funds are calculated on the prior day’s net assets.
For the three and nine months ended September 30, 2017, there were $45,186 and $83,550, respectively, of expenses that were identified on the statements of operations offor each Fund. There were no expenses waived for the Fund as expenses that were waived by the Sponsor. The Sponsor has determined that there would be no recovery sought for these amounts in any future period.three months ended March 31, 2024 and 2023.
For the three and nine months ended September 30, 2016, there were $48,043 and $121,429, respectively,
Use of Estimates
The preparation of financial statements in conformity with U.S. GAAP requires management to make estimates and assumptions that affect the reported amount of assets and liabilities and disclosure of contingent assets and liabilities at the date of the financial statements, and the reported amounts of the revenue and expenses during the reporting period. Actual results could differ from those estimates.
Fair Value -– Definition and Hierarchy
In accordance with U.S. GAAP, fair value is defined as the price that would be received to sell an asset or paid to transfer a liability (i.e., the “exit price”) in an orderly transaction between market participants at the measurement date.
In determining fair value, the Fund uses various valuation approaches. In accordance with U.S. GAAP, a fair value hierarchy for inputs is used in measuring fair value that maximizes the use of observable inputs and minimizes the use of unobservable inputs by requiring that the most observable inputs be used when available. Observable inputs are those that market participants would use in pricing the asset or liability based on market data obtained from sources independent of the Fund. Unobservable inputs reflect the Fund’s assumptions about the inputs market participants would use in pricing the asset or liability developed based on the best information available in the circumstances. The fair value hierarchy is categorized into three levels based on the inputs as follows:
Level 1 -– Valuations based on unadjusted quoted prices in active markets for identical assets or liabilities that the Fund has the ability to access. Valuation adjustments and block discounts are not applied to Level 1 financial instruments. Since valuations are based on quoted prices that are readily and regularly available in an active market, valuation of these financial instruments does not entail a significant degree of judgment.
Level 2 -– Valuations based on quoted prices in markets that are not active or for which all significant inputs are observable, either directly or indirectly.
Level 3 -– Valuations based on inputs that are unobservable and significant to the overall fair value measurement.
The availability of valuation techniques and observable inputs can vary from financial instrument to financial instrument and is affected by a wide variety of factors including, the type of financial instrument, whether the financial instrument is new and not yet established in the marketplace, and other characteristics particular to the transaction. To the extent that valuation is based on models or inputs that are less observable or unobservable in the market, the determination of fair value requires more judgment. Those estimated values do not necessarily represent the amounts that may be ultimately realized due to the occurrence of future circumstances that cannot be reasonably determined. Because of the inherent uncertainty of valuation, those estimated values may be materially higher or lower than the values that would have been used had a ready market for the financial instruments existed. Accordingly, the degree of judgment exercised by the Fund in determining fair value is greatest for financial instruments categorized in Level 3. In certain cases, the inputs used to measure fair value may fall into different levels of the fair value hierarchy. In such cases, for disclosure purposes, the level in the fair value hierarchy, within which the fair value measurement in its entirety falls, is determined based on the lowest level input that is significant to the fair value measurement.
Fair value is a market-based measure considered from the perspective of a market participant rather than an entity-specific measure. Therefore, even when market assumptions are not readily available, the Fund’s own assumptions are set to reflect those that market participants would use in pricing the asset or liability at the measurement date. The Fund uses prices and inputs that are current as of the measurement date, including periods of market dislocation. In periods of market dislocation, the observability of prices and inputs may be reduced for many financial instruments. This condition could cause a financial instrument to be reclassified to a lower level within the fair value hierarchy. When such a situation exists on a quarter close, the Sponsor will calculate the NAV on a particular day using the Level 1 valuation but will later recalculate the NAV for the impacted Fund based upon the valuation inputs from these alternative verifiable sources (Level 2 or Level 3)3) and will report such NAV in its applicable financial statements and reports.
On September 30, 2017March 31, 2024 and December 31, 2016,2023, in the opinion of the Trust and the Fund, the reported value of the Sugar Futures Contracts traded on the ICE fairly reflected the value of the Sugar Futures Contracts held by the Fund, and no adjustments were necessary. The determination is made as of the settlement of the futures contracts on the last day of trading for the reporting period. In making the determination of a Level 1 or Level 2 transfer, the Fund considers the average volume of the specific underlying futures contracts traded on the relevant exchange for the periods being reported.
For the ninethree months ended September 30, 2017March 31, 2024 and year ended December 31, 2016,2023, the Fund did not have any significant transfers between any of the levels of the fair value hierarchy.
The Fund records its derivative activities at fair value. Gains and losses from derivative contracts are included in the statements of operations. Derivative contracts include futures contracts related to commodity prices. Futures, which are listed on a national securities exchange, such as the CBOT and the ICE, or reported on another national market, are generally categorized in Level 1 of the fair value hierarchy. OTC derivatives contracts (such as forward and swap contracts) which may be valued using models, depending on whether significant inputs are observable or unobservable, are categorized in Levels 2 or 3 of the fair value hierarchy.
Expenses
Expenses are recorded using the accrual method of accounting.
Net Income (Loss) per Share
Net income (loss) per share is the difference between the NAV per unit at the beginning of each period and at the end of each period. The weighted average number of units outstanding was computed for purposes of disclosing net income (loss) per weighted average unit. The weighted average units are equal to the number of units outstanding at the end of the period, adjusted proportionately for units created or redeemed based on the amount of time the units were outstanding during such period.
New Accounting Pronouncements
The Financial Accounting Standards Board (“FASB”) issued Accounting Standards Update (“ASU”) 2017-13, “Revenue Recognition (Topic 605), Leases (Topic 840), and Leases (Topic 842):issued ASU 2023-06 – Disclosure Improvements: Codification Amendments to SEC Paragraphs Pursuantin Response to the Staff Announcement atSEC’s Disclosure Update and Simplification Initiative. The amendments require an entity to disclose its accounting policy for where cash flows associated with derivative instruments and their related gains and losses are presented. The Trust and Fund already discloses the July 20,2017 EITF Meetingaccounting policy related to the derivative gains and Rescissionlosses presented on the cash flow statement. The amendment was adopted early for the period ended December 31, 2023. There is no impact to the financial statements of Prior SEC Staff Announcements and Observer Comments”the Trust or the Fund.
The FASB issued ASU 2023-01, related to Leases – (Topic 842). The amendment amendsresponse to concerns about applying Topic 842 to related party arrangements between entities under common control. The update was adopted early for the earlyquarter ended March 31, 2023; the adoption date option for certain companies related to adoption of ASU No. 2014-09 and ASU No. 2016-02. The SEC staff stated the SEC would did not object to a public business entity that otherwise would not meet the definition of a public business entity except for a requirement to include or the inclusion of its financial statements or financial information in another entity’s filing with the SEC adopting ASC Topic 842 for fiscal years beginning after December 15, 2019, and interim periods within fiscal years beginning after December 15, 2020. This amendment is not expected to have a material impact on the financial statements and disclosures of the Trust or the Fund.
The FASB issued ASU 2017-12, “Derivatives and Hedging (Topic 815): Targeted Improvements to Accounting for Hedging Activities”. These amendments refine and expand hedge accounting for both financial (e.g., interest rate) and commodity risks. Its provisions create more transparency around how economic results are presented, both on the face
Table of the financial statements and in the footnotes. It also makes certain targeted improvements to simplify the application of hedge accounting guidance. The amendments are effective for public business entities for fiscal years beginning after December 15, 2018 and interim periods within those fiscal years. The Trust and the Fund are currently evaluating the impact on the financial statements and disclosures; but, based on our review to date, we do not expect the update will have a material impact on the financial statements and disclosures of the Trust or the Fund.The FASB issued ASU 2017-03, “Accounting Changes and Error Corrections (Topic 250) and Investments – Equity Method and Joint Ventures (Topic 323)”. These amendments require disclosure of the impact that recently issued accounting standards will have on the financial statements of a registrant when such standards are adopted in a future period. The adoption did not have a material impact on the financial statements and disclosures of the Trust or the Fund.
The FASB issued ASU 2017-01, “Business Combinations (Topic 805): Clarifying the Definition of a Business”. The amendments are intended to help companies and other organizations evaluate whether transactions should be accounted for as acquisitions (or disposals) of assets or businesses. The amendments are effective for public companies for annual periods beginning after December 15, 2017, including interim periods within those periods. The Trust and the Fund are currently evaluating the impact on the financial statements and disclosures; but, based on our review to date, we do not expect the update will have a material impact on the financial statements and disclosures of the Trust or the Fund.
The FASB issued ASU 2016-19, “Technical Corrections and Improvements”. The amendments in this update represent changes to clarify, correct errors, or make minor improvements to the Accounting Standards Codification. The amendments make the Accounting Standards Codification easier to understand and easier to apply by eliminating inconsistencies and providing clarifications. The amendments are effective for fiscal years, and interim periods with those fiscal years, for all entities beginning after December 15, 2016. The adoption did not have a material impact on the financial statements and disclosures of the Trust or the Fund.
The FASB issued ASU 2016-18, “Statement of Cash Flows (Topic 230)”. The amendments in this update require that a statement of cash flows explain the change during the period in the total of cash, cash equivalents, and amounts generally described as restricted cash or restricted cash equivalents. Therefore, amounts generally described as restricted cash and restricted cash equivalents should be included with cash and cash equivalents when reconciling the beginning-of-period and end-of-period total amounts shown on the statement of cash flows. The amendments are effective for fiscal years beginning after December 15, 2017, and interim periods within those fiscal years. This update is not expected to have a material impact on the financial statements and disclosures of the Trust or the Fund. The Sponsor believes there will be a change in presentation of restricted cash on the statements of cash flows.
The FASB issued ASU 2016-17, “Consolidation (Topic 810): Interests Held through Related Parties That are under Common Control”. The amendments in this update alters how a decision maker needs to consider indirect interests in a variable interest entity (VIE) held through an entity under common control. The new guidance amends ASU 2015-02, Consolidation (Topic 810): Amendments to the Consolidation Analysis, issued in February 2015. The amendments are effective for fiscal years beginning after December 15, 2016, including interim periods within those fiscal years. The adoption did not have a material impact on the financial statements and disclosures of the Trust or the Fund.
The FASB issued ASU 2016-15, “Statement of Cash Flows (Topic 230): Classification of Certain Cash Receipts and Cash Payments”. The amendments provide cash flow statement classification guidance. The amendments in this update are effective for fiscal years beginning after December 15, 2017. The Trust and the Fund are currently evaluating the impact on the financial statements and disclosures, but do not expect the adoption to have a material impact on the financial statements and disclosures of the Trust or the Fund. The Trust and the Fund do not expect to adopt the guidance until the effective date.
The FASB issued ASU 2014-09 in May 2014, “Revenue from Contracts with Customers (Topic 606),” which replaces the revenue recognition requirements of “Revenue Recognition (Topic 605).” This ASU is based on the principle that revenue is recognized to depict the transfer of goods and services to customers in an amount that reflects the consideration to which the entity expects to be entitled in exchange for those goods or services. This ASU provides new and more detailed guidance on specific topics and expands and improves disclosures about revenue. In August 2015, the FASB issued ASU 2015-14 which defers the effective date of ASU 2014-09 by one year to fiscal years beginning after December 15, 2017. ASU 2015-14 also permits early adoption of ASU 2014-09, but not before the original effective date, which was for fiscal years beginning after December 15, 2016. The Trust and the Fund record income or loss from the recognition and measurement of futures contracts and from interest income under Subtopic 825-10. Revenue from financial instruments which are valued under Subtopic 825 will not be subject to the application of ASU 2014-09 and 2015-14. Therefore, these standards will not have a material impact on the financial statements and disclosures of the Trust or the Fund.
Contents
The FASB issued ASU 2016-11, “Revenue Recognition (Topic 605) and Derivatives and Hedging (Topic 815): Rescission of SEC Guidance Because of Accounting Standards Updates 2014-09 and 2014-16 Pursuant to Staff Announcements at the March 3, 2016 EITF Meeting”. The amendments make targeted improvements to clarify the principal versus agent assessment and are intended to make the guidance more operable and lead to more consistent application. The Trust and the Fund record income or loss from the recognition and measurement of futures contracts and from interest income under Subtopic 825-10. Revenue from financial instruments which are valued under Subtopic 825 will not be subject to the application of ASU 2016-11. Therefore, this standard will not have a material impact on the financial statements and disclosures of the Trust or the Fund.
The FASB issued ASU 2016-02, “Leases (Topic 842).” The amendments in this update increase transparency and comparability among organizations by recognizing lease assets and lease liabilities on the balance sheet and disclosing key information about leasing arrangements. The amendments in this update are effective for fiscal years beginning after December 15, 2018. This update is not expected to have a material impact on the financial statements and disclosures of the Trust or the Fund.
The FASB issued ASU 2016-01, “Financial Instruments-Overall (Subtopic 825-10): Recognition and Measurement of Financial Assets and Financial Liabilities.” The amendments in this update are intended to improve the recognitions measurement and disclosure of financial instruments. The amendments to this update are effective for fiscal years beginning after December 15, 2017, and interim periods within those fiscal years. These amendments are required to be applied prospectively. The Trust and the Fund are currently evaluating the impact on the financial statements and disclosures; but based on our review to date we do not expect the update will have a material impact on the financial statements and disclosures of the Trust or the Fund.
Note 4– Fair Value Measurements
The Fund’s assets and liabilities recorded at fair value have been categorized based upon a fair value hierarchy as described in the Fund’s significant accounting policies in Note 3. The following table presents information about the Fund’s assets and liabilities measured at fair value as of September 30, 2017March 31, 2024 and December 31, 2016:2023:
September 30, 2017March 31, 2024
| | | | | | | | | | | | Balance as of | |
| Assets: | | Level 1 | | | Level 2 | | | Level 3 | | | September 30, 2017 | |
| Cash equivalents | | $ | 196,877 | | | $ | — | | | $ | — | | | $ | 196,877 | |
| Sugar futures contracts | | | 14,067 | | | | — | | | | — | | | | 14,067 | |
| Total | | $ | 210,944 | | | $ | — | | | $ | — | | | $ | 210,944 | |
| | | | | | | | | | | | | |
| | | | | | | | | | | | Balance as of | |
| Liabilities: | | Level 1 | | | Level 2 | | | Level 3 | | | September 30, 2017 | |
| Sugar futures contracts | | $ | 218,456 | | | $ | — | | | $ | — | | | $ | 218,456 | |
| | | | | | | | | | | | | | | Balance as of | |
Assets: | | Level 1 | | | Level 2 | | | Level 3 | | | March 31, 2024 | |
Cash Equivalents | | $ | 12,019,032 | | | $ | - | | | $ | - | | | $ | 12,019,032 | |
| | | | | | | | | | | | | | | Balance as of | |
Liabilities | | Level 1 | | | Level 2 | | | Level 3 | | | March 31, 2024 | |
Commodity Futures Contracts | | | | | | | | | | | | | | | | |
Sugar futures contracts | | $ | 814,401 | | | $ | - | | | $ | - | | | $ | 814,401 | |
December 31, 20162023
| | | | | | | | | | | | Balance as of | |
| Assets: | | Level 1 | | | Level 2 | | | Level 3 | | | December 31, 2016 | |
| Cash equivalents | | $ | 125,182 | | | $ | — | | | $ | — | | | $ | 125,182 | |
| Sugar futures contracts | | | 185,147 | | | | — | | | | — | | | | 185,147 | |
| Total | | $ | 310,329 | | | $ | — | | | $ | — | | | $ | 310,329 | |
| | | | | | | | | | | | | |
| | | | | | | | | | | | Balance as of | |
| Liabilities: | | Level 1 | | | Level 2 | | | Level 3 | | | December 31, 2016 | |
| Sugar futures contracts | | $ | 331,542 | | | $ | — | | | $ | — | | | $ | 331,542 | |
| | | | | | | | | | | | | | | Balance as of | |
Assets: | | Level 1 | | | Level 2 | | | Level 3 | | | December 31, 2023 | |
Cash Equivalents | | $ | 13,551,433 | | | $ | - | | | $ | - | | | $ | 13,551,433 | |
| | | | | | | | | | | | | | | Balance as of | |
Liabilities | | Level 1 | | | Level 2 | | | Level 3 | | | December 31, 2023 | |
Sugar futures contracts | | $ | 2,687,998 | | | $ | - | | | $ | - | | | $ | 2,687,998 | |
For the ninethree months ended September 30, 2017March 31, 2024 and year ended December 31, 2016,2023, the Fund did not have any significant transfers between any of the levels of the fair value hierarchy.
See theFair Value -– Definition and Hierarchysection in Note 3 above for an explanation of the transfers into and out of each level of the fair value hierarchy.
Note 5– Derivative Instruments and Hedging Activities
In the normal course of business, the Fund utilizes derivative contracts in connection with its proprietary trading activities. Investments in derivative contracts are subject to additional risks that can result in a loss of all or part of an investment. The Fund’s derivative activities and exposure to derivative contracts are classified by the following primary underlying risks: interest rate, credit, commodity price, and equity price risks. In addition to its primary underlying risks, the Fund is also subject to additional counterparty risk due to inability of its counterparties to meet the terms of their contracts. For the ninethree months ended September 30, 2017March 31, 2024 and year ended December 31, 2016,2023, the Fund invested only in commodity futures contracts.
Futures Contracts
The Fund is subject to commodity price risk in the normal course of pursuing its investment objectives. A futures contract represents a commitment for the future purchase or sale of an asset at a specified price on a specified date.
The purchase and sale of futures contracts requires margin deposits with aan FCM. Subsequent payments (variation margin) are made or received by the Fund each day, depending on the daily fluctuations in the value of the contract, and are recorded as unrealized gains or losses by the Fund. Futures contracts may reduce the Fund��sFund’s exposure to counterparty risk since futures contracts are exchange-traded; and the exchange’s clearinghouse, as the counterparty to all exchange-traded futures, guarantees the futures against default.
The Commodity Exchange Act requires an FCM to segregate all customer transactions and assets from the FCM’s proprietary activities. A customer’s cash and other equity deposited with an FCM are considered commingled with all other customer funds subject to the FCM’s segregation requirements. In the event of an FCM’s insolvency, recovery may be limited to the Fund’s pro rata share of segregated customer funds available. It is possible that the recovery amount could be less than the total of cash and other equity deposited.
The following table discloses information about offsetting assets and liabilities presented in the statements of assets and liabilities to enable users of these financial statements to evaluate the effect or potential effect of netting arrangements for recognized assets and liabilities. These recognized assets and liabilities are presented as defined in FASB ASU No. 2011-112011-11 “Balance Sheet (Topic 210)210): Disclosures about Offsetting Assets and Liabilities” and subsequently clarified in FASB ASU 2013-012013-01 “Balance Sheet (Topic 210)210): Clarifying the Scope of Disclosures about Offsetting Assets and Liabilities.”
The following table also identifies the fair value amounts of derivative instruments included in the statements of assets and liabilities as derivative contracts, categorized by primary underlying risk, and held by the FCM, ED&F ManFCMs, Marex and StoneX as of September 30, 2017March 31, 2024, and December 31, 2016.2023.
Offsetting*The amount of Financial Assetscollateral presented in Collateral, Due from Broker, is limited to the liability for the futures contracts and Derivative Assets as of September 30, 2017accordingly does not include the excess collateral pledged.
| | | (i) | | | (ii) | | | (iii) = (i) – (ii) | | | (iv) | | | (v) = (iii) – (iv) | |
| | | | | | | | | | | | | | | | |
| | | | | | | | | | | | Gross Amount Not Offset in the | | | | |
| | | | | | | | | | | | Statement of Assets and Liabilities | | | | |
| | | | | | Gross Amount | | | Net Amount | | | | | | | | | | | |
| | | | | | Offset in the | | | Presented in the | | | | | | | | | | | |
| | | Gross Amount | | | Statement of | | | Statement of | | | | | | | | | | | |
| | | of Recognized | | | Assets and | | | Assets and | | | Futures Contracts | | | Collateral, Due | | | | |
| Description | | Assets | | | Liabilities | | | Liabilities | | | Available for Offset | | | to Broker | | | Net Amount | |
| Commodity price | | | | | | | | | | | | | | | | | | | | |
| Sugar futures contracts | | $ | 14,067 | | | $ | — | | | $ | 14,067 | | | $ | 14,067 | | | $ | — | | | $ | — | |
Offsetting of Financial Liabilities and Derivative Liabilities as of September 30, 2017March 31, 2024
| | | (i) | | (ii) | | | (iii) = (i) – (ii) | | | (iv) | | | (v) = (iii) – (iv) | | |
| | | | | | | | | | | | | | | | |
| | | | | | | | | | | Gross Amount Not Offset in the | | | | | |
| | | | | | | | | | | Statement of Assets and Liabilities | | | | | |
| | | | | Gross Amount | | | Net Amount | | | | | | | | | | |
| | | | | Offset in the | | | Presented in the | | | | | | | | | | |
| | | Gross Amount | | Statement of | | | Statement of | | | | | | | | | | | (i) | | (ii) | | (iii) = (i)-(ii) | | (iv) | | (v)=(iii)-(iv) | |
| | | of Recognized | | Assets and | | | Assets and | | | Futures Contracts | | | Collateral, Due | | | | | | | | | | | | | | | Gross Amount Not Offset in the Statement of Assets and Liabilities | | | | |
| Description | | Liabilities | | Liabilities | | | Liabilities | | | Available for Offset | | | from Broker | | | Net Amount | | | Gross Amount of Recognized Liabilities | | | Gross Amount Offset in the Statement of Assets and Liabilities | | | Net Amount Presented in the Statement of Assets and Liabilities | | | Futures Contracts Available for Offset | | | Collateral, Due from Broker* | | | Net Amount | |
| Commodity price | | | | | | | | | | | | | | | | | | | |
Commodity Price | | |
| Sugar futures contracts | | $ | 218,456 | | $ | — | | | $ | 218,456 | | | $ | 14,067 | | | $ | 204,389 | | | $ | — | | | $ | 814,401 | | | $ | - | | | $ | 814,401 | | | $ | - | | | $ | 814,401 | | | $ | - | |
Offsetting of Financial Assets and Derivative Assets as of December 31, 2016
| | | (i) | | | (ii) | | | (iii) = (i) – (ii) | | | (iv) | | | (v) = (iii) – (iv) | |
| | | | | | | | | | | | | | | | |
| | | | | | | | | | | | Gross Amount Not Offset in the
Statement of Assets and Liabilities | | | | |
| Description | | Gross Amount
of Recognized
Assets | | | Gross Amount
Offset in the
Statement of
Assets and
Liabilities | | | Net Amount
Presented in the
Statement of
Assets and
Liabilities | | | Futures Contracts
Available for Offset | | | Collateral, Due
from Broker | | | Net Amount | |
| Commodity price | | | | | | | | | | | | | | | | | | | | | | | | |
| Sugar futures contracts | | $ | 185,147 | | | $ | — | | | $ | 185,147 | | | $ | 185,147 | | | $ | — | | | $ | — | |
Offsetting of Financial Liabilities and Derivative Liabilities as of December 31, 20162023
| | | (i) | | (ii) | | (iii) = (i) – (ii) | | (iv) | | (v) = (iii) – (iv) | | |
| | | | | | | | | | | | | | (i) | | (ii) | | (iii) = (i)-(ii) | | (iv) | | (v)=(iii)-(iv) | |
| | | | | | | | | Gross Amount Not Offset in the
Statement of Assets and Liabilities | | | | | | | | | | | | | | Gross Amount Not Offset in the Statement of Assets and Liabilities | | | |
| Description | | Gross Amount
of Recognized
Liabilities | | Gross Amount
Offset in the
Statement of
Assets and
Liabilities | | Net Amount
Presented in the
Statement of
Assets and
Liabilities | | Futures Contracts
Available for Offset | | Collateral, Due
to Broker | | Net Amount | | | Gross Amount of Recognized Liabilities | | | Gross Amount Offset in the Statement of Assets and Liabilities | | | Net Amount Presented in the Statement of Assets and Liabilities | | | Futures Contracts Available for Offset | | | Collateral, Due from Broker* | | | Net Amount | |
| Commodity price | | | | | | | | | | | | | | |
Commodity Price | | |
| Sugar futures contracts | | $ | 331,542 | | $ | — | | $ | 331,542 | | $ | 185,147 | | $ | 146,395 | | $ | — | | | $ | 2,687,998 | | | $ | - | | | $ | 2,687,998 | | | $ | 2,687,998 | | | $ | - | | | $ | - | |
The following tables identify the net gain and loss amounts included in the statements of operations as realized and unrealized gains and losses on trading of commodity futures contracts categorized by primary underlying risk:
Three months ended September 30, 2017March 31, 2024
| Primary Underlying Risk | | Realized Loss
on Commodity
Futures Contracts | | | Net Change in Unrealized
Appreciation on
Commodity Futures
Contracts | |
| Commodity price | | | | | | | | |
| Sugar futures contracts | | $ | (678,070 | ) | | $ | 532,963 | |
| | | Realized Loss on Commodity Futures Contracts | | | Net Change in Unrealized Appreciation on Commodity Futures Contracts | |
Commodity Price | | | | | | | | |
Sugar futures contracts | | $ | (482,314 | ) | | $ | 1,873,597 | |
Three months ended September 30, 2016March 31, 2023
| Primary Underlying Risk | | Realized Gain
on Commodity
Futures Contracts | | | Net Change in Unrealized
Depreciation on
Commodity Futures
Contracts | |
| Commodity price | | | | | | | | |
| Sugar futures contracts | | $ | 948,483 | | | $ | (18,088 | ) |
| | | Realized Gain on Commodity Futures Contracts | | | Net Change in Unrealized Appreciation on Commodity Futures Contracts | |
Commodity Price | | | | | | | | |
Sugar futures contracts | | $ | 1,339,448 | | | $ | 3,139,817 | |
Nine months ended September 30, 2017
| Primary Underlying Risk | | Realized Loss on Commodity Futures
Contracts | | | Net Change in Unrealized
Depreciation on
Commodity Futures
Contracts | |
| Commodity price | | | | | | | | |
| Sugar futures contracts | | $ | (2,266,185 | ) | | $ | (57,994 | ) |
Nine months ended September 30, 2016
| Primary Underlying Risk | | Realized Gain on
Commodity Futures
Contracts | | | Net Change in Unrealized
Appreciation on
Commodity Futures
Contracts | |
| Commodity price | | | | | | | | |
| Sugar futures contracts | | $ | 1,957,357 | | | $ | 305,435 | |
Volume of Derivative Activities
The average notional market value categorized by primary underlying risk for all futures contracts held were $7.56 million and $7.09$16.9 million for the three and nine months ended September 30, 2017March 31, 2024 and $7.2 million and $5.8$25.7 million for the same periods in 2016.three months ended March 31, 2023.
Note 6–Financial Highlights
The following table presents per unit performance data and other supplemental financial data for the three and nine months ended September 30, 2017 March 31, 2024 and 2016. This information has been derived from information presented in the financial statements.2023. This information has been derived from information presented in the financial statements and is presented with total expenses gross of expenses waived by the Sponsor and with total expenses net of expenses waived by the Sponsor, as appropriate.
| | | | Three months ended | | Three months ended | |
| | | Three months ended | | | Three months ended | | | Nine months ended | | Nine months ended | | | March 31, 2024 | | | March 31, 2023 | |
| Per Share Operation Performance | | September 30, 2017 | | September 30, 2016 | | | September 30, 2017 | | September 30, 2016 | | | | | |
| Net asset value at beginning of period | | $ | 9.64 | | | $ | 12.92 | | | $ | 12.97 | | | $ | 10.02 | | | $ | 12.44 | | | $ | 9.51 | |
| Income (loss) from investment operations: | | | | | | | | | | | | | | | | | |
| Investment Income | | | 0.03 | | | | 0.02 | | | | 0.09 | | | | 0.04 | | |
| Net realized and unrealized (loss) gain on commodity futures contracts | | | (0.17 | ) | | | 1.79 | | | | (3.40 | ) | | | 4.79 | | |
| Total expenses | | | (0.07 | ) | | | (0.08 | ) | | | (0.23 | ) | | | (0.20 | ) | |
| Net (decrease) increase in net asset value | | | (0.21 | ) | | | 1.73 | | | | (3.54 | ) | | | 4.63 | | |
Interest income | | | 0.17 | | | 0.11 | |
Net realized and unrealized gain on commodity futures contracts | | | 1.01 | | | 1.89 | |
Total expenses, net | | | | (0.13 | ) | | | (0.07 | ) |
Net increase in net asset value | | | | 1.05 | | | | 1.93 | |
| Net asset value at end of period | | $ | 9.43 | | | $ | 14.65 | | | $ | 9.43 | | | $ | 14.65 | | | $ | 13.49 | | | $ | 11.44 | |
| Total Return | | | (2.18 | )% | | | 13.39 | % | | | (27.29 | )% | | | 46.21 | % | | 8.51 | % | | 20.28 | % |
| Ratios to Average Net Assets (Annualized) | | | | | | | | | | | | | | | | | | | | |
| Total expenses | | | 5.28 | % | | | 4.94 | % | | | 4.41 | % | | | 5.01 | % | | 4.04 | % | | 2.78 | % |
| Total expenses, net | | | 2.95 | % | | | 2.27 | % | | | 2.82 | % | | | 2.30 | % | | 4.04 | % | | 2.78 | % |
| Net investment loss | | | (1.70 | )% | | | (1.74 | )% | | | (1.77 | )% | | | (1.78 | )% | |
Net investment income | | | 1.24 | % | | 1.65 | % |
The financial highlights per share data are calculated consistent with the methodology used to calculate asset-based fees and expenses.
Note 7– Organizational and Offering Costs
Expenses incurred in organizing of the Trust and the initial offering of the Shares of the Fund, including applicable SEC registration fees, were borne directly by the Sponsor. The Fund will not be obligated to reimburse the Sponsor.
Note 8– Subsequent Events
Management has evaluated the financial statements for the quarter-ended September 30, 2017March 31, 2024 for subsequent events through the date of this filing and noted no material events requiring either recognition through the date of the filing or disclosure herein for the Fund.Fund other than those notes below:
The net assets of the fund decreased by $3,645,989, or 22.1%, for the period March 31, 2024 to May 9, 2024. This was driven by a decrease in the shares outstanding by 12.2% and a decrease in the NAV per share of 11.2%.
TEUCRIUM WHEAT FUND
STATEMENTS OF ASSETS AND LIABILITIES
| | | September 30,
2017 | | December 31,
2016 | | | March 31, 2024 | | | December 31, 2023 | |
| | | (Unaudited) | | | | | (Unaudited) | | | |
| Assets | | | | | | | | | |
| Cash and cash equivalents | | $ | 65,323,760 | | | $ | 58,931,911 | | | $ | 142,056,904 | | | $ | 168,732,086 | |
| Interest receivable | | | 199 | | | | 279 | | | 103,341 | | | 226,748 | |
| Other assets | | | 52,754 | | | | 7,637 | | | 813 | | | 4,527 | |
| Equity in trading accounts: | | | | | | | | | |
| Commodity futures contracts | | | 296,562 | | | | — | | | 1,513,306 | | | 2,237,493 | |
| Due from broker | | | 6,263,778 | | | | 7,381,706 | | | | 26,887,597 | | | | 17,783,729 | |
| Total equity in trading accounts | | | 6,560,340 | | | | 7,381,706 | | | | 28,400,903 | | | | 20,021,222 | |
| Total assets | | | 71,937,053 | | | | 66,321,533 | | | | 170,561,961 | | | | 188,984,583 | |
| | | | | | | | | | |
| Liabilities | | | | | | | | | | | | |
| Management fee payable to Sponsor | | | 55,781 | | | | 52,145 | | | 129,704 | | | 160,231 | |
| Other liabilities | | | 4,385 | | | | 3,041 | | | 85,006 | | | 72,017 | |
| Equity in trading accounts: | | | | | | | | | |
| Commodity futures contracts | | | 4,065,500 | | | | 3,921,588 | | | | 12,809,942 | | | | 4,575,666 | |
| Total liabilities | | | 4,125,666 | | | | 3,976,774 | | | | 13,024,652 | | | | 4,807,914 | |
| | | | | | | | | | |
| Net assets | | $ | 67,811,387 | | | $ | 62,344,759 | | | $ | 157,537,309 | | | $ | 184,176,669 | |
| | | | | | | | | | |
| Shares outstanding | | | 10,325,004 | | | | 9,050,004 | | | | 29,250,004 | | | | 30,800,004 | |
| | | | | | | | | | |
Shares authorized | | | | * | | | | * | |
| | | |
| Net asset value per share | | $ | 6.57 | | | $ | 6.89 | | | $ | 5.39 | | | $ | 5.98 | |
| | | | | | | | | | |
| Market value per share | | $ | 6.58 | | | $ | 6.88 | | | $ | 5.41 | | | $ | 5.97 | |
* On March 9, 2022, the Teucrium Wheat Fund registered an indeterminate number of shares of the Fund pursuant to Rule 456(d) under the Securities Act of 1933.
The accompanying notes are an integral part of these financial statements.
TEUCRIUM WHEAT FUND
SCHEDULE OF INVESTMENTS
September 30, 2017
March 31, 2024
(Unaudited)
| | | | | | Percentage of | | | | | | | | | | | | | | | Percentage of | | | |
| Description: Assets | | Fair Value | | Net Assets | | Shares | | | Yield | | | Cost | | | Fair Value | | | Net Assets | | | Shares | |
| | | | | | | | | |
| Cash equivalents | | | | | | | | | | | | | | | | | | | | | | |
| Money market funds | | | | | | | | |
| Fidelity Institutional Money Market Funds - Government Portfolio (cost $84,617) | | $ | 84,617 | | 0.12 | % | | 84,617 | | |
U.S. Bank Deposit Account | | | 5.240 | % | | $ | 10,758,845 | | | $ | 10,758,845 | | | 6.83 | % | | 10,758,845 | |
Goldman Sachs Financial Square Government Fund - Institutional Class | | | 5.210 | % | | | 57,722,055 | | | | 57,722,055 | | | | 36.64 | | | 57,722,055 | |
Total money market funds | | | | | | $ | 68,480,900 | | | $ | 68,480,900 | | | | 43.47 | % | | | |
| | | | | | | | | | | Notional Amount | |
| | | | | | | | | | | (Long Exposure) | |
| Commodity futures contracts | | | | | | | | | | | | |
| United States wheat futures contracts | | | | | | | | | | | | |
| CBOT wheat futures MAY18 (848 contracts) | | $ | 296,562 | | | | 0.44 | % | | $ | 20,320,200 | |
| Description: Liabilities | | Fair Value | | | Percentage of
Net Assets | | | Notional Amount
(Long Exposure) | |
| | | | | | | | | | |
| Commodity futures contracts | | | | | | | | | | | | |
| United States sugar futures contracts | | | | | | | | | | | | |
| CBOT wheat futures MAR18 (1,016 contracts) | | $ | 3,814,512 | | | | 5.63 | % | | $ | 23,698,200 | |
| CBOT wheat futures DEC18 (908 contracts) | | | 250,988 | | | | 0.37 | | | | 23,812,300 | |
| Total commodity futures contracts | | $ | 4,065,500 | | | | 6.00 | % | | $ | 47,510,500 | |
| | Maturity | | | | | | | | | | | | | | Percentage of | | | Principal | |
| | Date | | Yield | | | Cost | | | Fair Value | | | Net Assets | | | Amount | |
Commercial Paper | | | | | | | | | | | | | | | | | | | | | |
American Electric Power Company, Inc. | June 12, 2024 | | | 5.465 | % | | $ | 4,941,190 | | | $ | 4,946,401 | | | | 3.14 | % | | | 5,000,000 | |
Brookfield Infrastructure Holdings (Canada) Inc. | April 23, 2024 | | | 5.844 | % | | | 2,465,045 | | | | 2,491,261 | | | | 1.58 | | | | 2,500,000 | |
Brookfield Infrastructure Holdings (Canada) Inc. | May 7, 2024 | | | 5.834 | % | | | 2,465,106 | | | | 2,485,725 | | | | 1.58 | | | | 2,500,000 | |
Brookfield Infrastructure Holdings (Canada) Inc. | May 9, 2024 | | | 5.710 | % | | | 2,473,167 | | | | 2,485,222 | | | | 1.58 | | | | 2,500,000 | |
Brookfield Infrastructure Holdings (Canada) Inc. | May 16, 2024 | | | 5.772 | % | | | 2,464,688 | | | | 2,482,344 | | | | 1.58 | | | | 2,500,000 | |
Brookfield Infrastructure Holdings (Canada) Inc. | May 22, 2024 | | | 5.780 | % | | | 2,466,590 | | | | 2,479,954 | | | | 1.57 | | | | 2,500,000 | |
The Cigna Group | April 5, 2024 | | | 5.501 | % | | | 2,475,250 | | | | 2,498,500 | | | | 1.59 | | | | 2,500,000 | |
Crown Castle Inc. | April 18, 2024 | | | 5.530 | % | | | 4,972,800 | | | | 4,987,156 | | | | 3.17 | | | | 5,000,000 | |
EIDP, Inc. | May 23, 2024 | | | 5.314 | % | | | 4,934,875 | | | | 4,962,372 | | | | 3.15 | | | | 5,000,000 | |
General Motors Financial Company, Inc. | April 23, 2024 | | | 5.511 | % | | | 4,932,500 | | | | 4,983,500 | | | | 3.16 | | | | 5,000,000 | |
General Motors Financial Company, Inc. | April 29, 2024 | | | 5.408 | % | | | 990,265 | | | | 995,870 | | | | 0.63 | | | | 1,000,000 | |
Glencore Funding LLC | April 16, 2024 | | | 5.490 | % | | | 2,485,375 | | | | 2,494,375 | | | | 1.58 | | | | 2,500,000 | |
Glencore Funding LLC | April 30, 2024 | | | 5.493 | % | | | 2,482,375 | | | | 2,489,125 | | | | 1.58 | | | | 2,500,000 | |
Glencore Funding LLC | May 10, 2024 | | | 5.475 | % | | | 2,480,199 | | | | 2,485,429 | | | | 1.58 | | | | 2,500,000 | |
Harley-Davidson Financial Services, Inc. | April 26, 2024 | | | 5.700 | % | | | 2,482,111 | | | | 2,490,278 | | | | 1.58 | | | | 2,500,000 | |
Harley-Davidson Financial Services, Inc. | May 16, 2024 | | | 5.815 | % | | | 2,471,896 | | | | 2,482,188 | | | | 1.58 | | | | 2,500,000 | |
National Fuel Gas Company | April 4, 2024 | | | 5.544 | % | | | 4,984,075 | | | | 4,997,725 | | | | 3.17 | | | | 5,000,000 | |
VW Credit, Inc. | April 11, 2024 | | | 5.511 | % | | | 4,932,500 | | | | 4,992,500 | | | | 3.17 | | | | 5,000,000 | |
VW Credit, Inc. | May 16, 2024 | | | 5.402 | % | | | 2,471,660 | | | | 2,483,438 | | | | 1.58 | | | | 2,500,000 | |
WGL Holdings, Inc. | April 15, 2024 | | | 5.616 | % | | | 2,492,320 | | | | 2,494,624 | | | | 1.58 | | | | 2,500,000 | |
Total Commercial Paper | | | | | | $ | 62,863,987 | | | $ | 63,207,987 | | | | 40.13 | % | | | | |
Total Cash Equivalents | | | | | | | | | | | $ | 131,688,887 | | | | 83.60 | % | | | | |
| | | Number of | | | | | | | Percentage of | | | Notional Amount | |
| | | Contracts | | | Fair Value | | | Net Assets | | | (Long Exposure) | |
Commodity futures contracts | | | | | | | | | | | | | | | | |
United States wheat futures contracts | | | | | | | | | | | | | | | | |
CBOT wheat futures SEP24 | | | 1,599 | | | $ | 1,513,306 | | | | 0.96 | % | | $ | 47,290,425 | |
| | | Number of | | | | | | | Percentage of | | | Notional Amount | |
Description: Liabilities | | Contracts | | | Fair Value | | | Net Assets | | | (Long Exposure) | |
| | | | | | | | | | | | | | | | | |
Commodity futures contracts | | | | | | | | | | | | | | | | |
United States wheat futures contracts | | | | | | | | | | | | | | | | |
CBOT wheat futures JUL24 | | | 1,915 | | | $ | 3,610,065 | | | | 2.29 | % | | $ | 55,128,063 | |
CBOT wheat futures DEC24 | | | 1,800 | | | | 9,199,877 | | | | 5.84 | | | | 55,080,000 | |
Total commodity futures contracts | | | | | | $ | 12,809,942 | | | | 8.13 | % | | $ | 110,208,063 | |
The accompanying notes are an integral part of these financial statements.
TEUCRIUM WHEAT FUND
SCHEDULE OF INVESTMENTS
December 31, 20162023
| | | | | | Percentage of | | | | | | | | | | | | | | | | | | Percentage of | | | | |
| Description: Assets | | Fair Value | | Net Assets | | Shares | | | Yield | | | Cost | | | Fair Value | | | Net Assets | | | Shares | |
| | | | | | | | | |
| Cash equivalents | | | | | | | | | | | | | | | | | |
| Money market funds | | | | | | | | |
| Fidelity Investments Money Market Funds – Government Portfolio (cost $406,927) | | $ | 406,927 | | | | 0.65 | % | | | 406,927 | | |
U.S. Bank Deposit Account | | | 5.270 | % | | $ | 27,315,653 | | | $ | 27,315,653 | | | 14.83 | % | | 27,315,653 | |
Goldman Sachs Financial Square Government Fund - Institutional Class | | | 5.250 | % | | | 53,500,438 | | | | 53,500,438 | | | | 29.05 | | | 53,500,438 | |
Total money market funds | | | | | | $ | 80,816,091 | | | $ | 80,816,091 | | | | 43.88 | % | | | |
| Description: Liabilities | | Fair Value | | | Percentage of
Net Assets | | | Notional Amount
(Long Exposure) | |
| | | | | | | | | | | | | |
| Commodity futures contracts | | | | | | | | | | | | |
| United States wheat futures contracts | | | | | | | | | | | | |
| CBOT wheat futures MAY17 (1,037 contracts) | | $ | 1,011,350 | | | | 1.62 | % | | $ | 21,802,925 | |
| CBOT wheat futures JUL17 (861 contracts) | | | 213,963 | | | | 0.34 | | | | 18,694,463 | |
| CBOT wheat futures DEC17 (939 contracts) | | | 2,696,275 | | | | 4.33 | | | | 21,831,750 | |
| Total commodity futures contracts | | $ | 3,921,588 | | | | 6.29 | % | | $ | 62,329,138 | |
| | Maturity | | | | | | | | | | | | | | Percentage of | | | Principal | |
| | Date | | Yield | | | Cost | | | Fair Value | | | Net Assets | | | Amount | |
Commercial Paper | | | | | | | | | | | | | | | | | | | | | |
Albemarle Corporation | January 4, 2024 | | | 5.753 | % | | $ | 2,480,382 | | | $ | 2,498,823 | | | | 1.36 | % | | | 2,500,000 | |
Albemarle Corporation | January 8, 2024 | | | 5.738 | % | | | 2,476,151 | | | | 2,497,263 | | | | 1.36 | | | | 2,500,000 | |
Albemarle Corporation | January 11, 2024 | | | 5.808 | % | | | 2,478,230 | | | | 2,496,041 | | | | 1.36 | | | | 2,500,000 | |
Brookfield Infrastructure Holdings (Canada) Inc. | January 16, 2024 | | | 5.853 | % | | | 2,466,575 | | | | 2,494,031 | | | | 1.35 | | | | 2,500,000 | |
Brookfield Infrastructure Holdings (Canada) Inc. | January 30, 2024 | | | 5.814 | % | | | 2,481,364 | | | | 2,488,501 | | | | 1.35 | | | | 2,500,000 | |
Entergy Corporation | March 1, 2024 | | | 5.665 | % | | | 2,467,625 | | | | 2,476,875 | | | | 1.34 | | | | 2,500,000 | |
General Motors Financial Company, Inc. | January 18, 2024 | | | 5.617 | % | | | 7,420,795 | | | | 7,480,486 | | | | 4.06 | | | | 7,500,000 | |
General Motors Financial Company, Inc. | January 24, 2024 | | | 5.661 | % | | | 4,941,417 | | | | 4,982,271 | | | | 2.71 | | | | 5,000,000 | |
General Motors Financial Company, Inc. | February 9, 2024 | | | 5.700 | % | | | 7,397,667 | | | | 7,454,648 | | | | 4.05 | | | | 7,500,000 | |
Harley-Davidson Financial Services, Inc. | January 9, 2024 | | | 5.843 | % | | | 2,474,533 | | | | 2,496,817 | | | | 1.36 | | | | 2,500,000 | |
Harley-Davidson Financial Services, Inc. | February 1, 2024 | | | 5.867 | % | | | 2,480,400 | | | | 2,487,600 | | | | 1.35 | | | | 2,500,000 | |
Harley-Davidson Financial Services, Inc. | February 14, 2024 | | | 5.927 | % | | | 4,947,549 | | | | 4,964,494 | | | | 2.70 | | | | 5,000,000 | |
National Fuel Gas Company | January 26, 2024 | | | 5.941 | % | | | 2,478,948 | | | | 2,489,879 | | | | 1.35 | | | | 2,500,000 | |
Oracle Corporation | March 6, 2024 | | | 5.562 | % | | | 2,467,452 | | | | 2,475,399 | | | | 1.34 | | | | 2,500,000 | |
Stanley Black & Decker, Inc. | January 22, 2024 | | | 5.807 | % | | | 4,958,042 | | | | 4,983,375 | | | | 2.71 | | | | 5,000,000 | |
V.F. Corporation | January 17, 2024 | | | 5.674 | % | | | 4,936,679 | | | | 4,987,645 | | | | 2.71 | | | | 5,000,000 | |
V.F. Corporation | January 18, 2024 | | | 5.606 | % | | | 2,473,646 | | | | 2,493,507 | | | | 1.35 | | | | 2,500,000 | |
V.F. Corporation | January 25, 2024 | | | 5.910 | % | | | 4,928,362 | | | | 4,950,783 | | | | 2.69 | | | | 4,970,000 | |
WGL Holdings, Inc. | January 3, 2024 | | | 5.793 | % | | | 2,490,896 | | | | 2,499,208 | | | | 1.36 | | | | 2,500,000 | |
WGL Holdings, Inc. | January 12, 2024 | | | 5.849 | % | | | 2,487,222 | | | | 2,495,608 | | | | 1.36 | | | | 2,500,000 | |
Walgreens Boots Alliance, Inc. | January 12, 2024 | | | 6.028 | % | | | 5,465,631 | | | | 5,490,051 | | | | 2.98 | | | | 5,500,000 | |
Total Commercial Paper | | | | | | $ | 77,199,566 | | | $ | 77,683,305 | | | | 42.20 | % | | | | |
Total Cash Equivalents | | | | | | | | | | $ | 158,499,396 | | | | 86.08 | % | | | | |
| | | Number of | | | | | | | Percentage of | | | Notional Amount | |
| | | Contracts | | | Fair Value | | | Net Assets | | | (Long Exposure) | |
Commodity futures contracts | | | | | | | | | | | | | | | | |
United States wheat futures contracts | | | | | | | | | | | | | | | | |
CBOT wheat futures MAY24 | | | 2,018 | | | $ | 363,500 | | | | 0.20 | % | | $ | 64,525,550 | |
CBOT wheat futures JUL24 | | | 1,711 | | | | 1,873,993 | | | | 1.02 | | | | 55,243,913 | |
Total commodity futures contracts | | | | | | $ | 2,237,493 | | | | 1.22 | % | | $ | 119,769,463 | |
| | | Number of | | | | | | | Percentage of | | | Notional Amount | |
Description: Liabilities | | Contracts | | | Fair Value | | | Net Assets | | | (Long Exposure) | |
| | | | | | | | | | | | | | | | | |
Commodity futures contracts | | | | | | | | | | | | | | | | |
United States wheat futures contracts | | | | | | | | | | | | | | | | |
CBOT wheat futures DEC24 | | | 1,924 | | | $ | 4,575,666 | | | | 2.48 | % | | $ | 64,357,800 | |
The accompanying notes are an integral part of these financial statements.
TEUCRIUM WHEAT FUND
STATEMENTS OF OPERATIONS
(Unaudited)
| | | | Three months ended | | Three months ended | |
| | | Three months ended
September 30, 2017 | | Three months ended
September 30, 2016 | | | Nine months
ended
September 30, 2017 | | Nine months
ended
September 30, 2016 | | | March 31, 2024 | | | March 31, 2023 | |
| Income | | | | | | | | | | | | | |
| Realized and unrealized gain (loss) on trading of commodity futures contracts: | | | | | | | | | | | | | | | | | |
| Realized gain (loss) on commodity futures contracts | | $ | 1,955,888 | | | $ | (5,677,475 | ) | | $ | 1,286,087 | | | $ | (7,244,175 | ) | |
| Net change in unrealized depreciation or appreciation on commodity futures contracts | | | (11,125,988 | ) | | | (692,500 | ) | | | 152,650 | | | | (2,107,750 | ) | |
Realized loss on commodity futures contracts | | | $ | (10,037,305 | ) | | $ | (23,358,733 | ) |
Net change in unrealized depreciation on commodity futures contracts | | | (8,958,463 | ) | | (2,092,562 | ) |
| Interest income | | | 208,562 | | | | 71,752 | | | | 528,785 | | | | 142,314 | | | | 2,149,924 | | | | 2,080,146 | |
| Total (loss) income | | | (8,961,538 | ) | | | (6,298,223 | ) | | | 1,967,522 | | | | (9,209,611 | ) | |
Total loss | | | | (16,845,844 | ) | | | (23,371,149 | ) |
| | | | | | | | | | | | | | | | | | |
| Expenses | | | | | | | | | | | | | | | | | | | | |
| Management fees | | | 162,246 | | | | 130,301 | | | | 496,272 | | | | 264,391 | | | 410,199 | | | 481,218 | |
| Professional fees | | | 152,758 | | | | 105,957 | | | | 379,875 | | | | 198,054 | | | 109,035 | | | 104,985 | |
| Distribution and marketing fees | | | 299,770 | | | | 274,281 | | | | 765,439 | | | | 521,490 | | | 521,828 | | | 544,062 | |
| Custodian fees and expenses | | | 37,295 | | | | 35,905 | | | | 108,579 | | | | 69,106 | | | 50,520 | | | 75,710 | |
| Business permits and licenses fees | | | 4,929 | | | | 13,996 | | | | 17,154 | | | | 22,041 | | | 16,408 | | | 4,812 | |
| General and administrative expenses | | | 30,980 | | | | 25,487 | | | | 86,043 | | | | 59,150 | | | | 41,020 | | | | 29,485 | |
| Brokerage commissions | | | 17,380 | | | | 11,201 | | | | 45,225 | | | | 24,610 | | |
| Other expenses | | | 9,007 | | | | 11,378 | | | | 25,746 | | | | 24,817 | | |
| Total expenses | | | 714,365 | | | | 608,506 | | | | 1,924,333 | | | | 1,183,659 | | | | 1,149,010 | | | | 1,240,272 | |
| | | | | | | | | | | | | | | | | | |
| Expenses waived by the Sponsor | | | (105,942 | ) | | | (49,516 | ) | | | (105,942 | ) | | | (49,516 | ) | | - | | | - | |
| | | | | | | | | | | | | | | | | | |
| Total expenses, net | | | 608,423 | | | | 558,990 | | | | 1,818,391 | | | | 1,134,143 | | | | 1,149,010 | | | | 1,240,272 | |
| | | | | | | | | | | | | | | | | | |
| Net (loss) income | | $ | (9,569,961 | ) | | $ | (6,857,213 | ) | | $ | 149,131 | | | $ | (10,343,754 | ) | |
Net loss | | | $ | (17,994,854 | ) | | $ | (24,611,421 | ) |
| | | | | | | | | | | | | | | | | | |
| Net loss per share | | $ | (1.27 | ) | | $ | (1.03 | ) | | $ | (0.32 | ) | | $ | (1.96 | ) | | $ | (0.59 | ) | | $ | (0.93 | ) |
| Net (loss) income per weighted average share | | $ | (1.04 | ) | | $ | (1.01 | ) | | $ | 0.02 | | | $ | (2.41 | ) | |
Net loss per weighted average share | | | $ | (0.60 | ) | | $ | (0.94 | ) |
| Weighted average shares outstanding | | | 9,197,287 | | | | 6,817,939 | | | | 9,420,883 | | | | 4,293,435 | | | | 29,990,663 | | | | 26,265,282 | |
The accompanying notes are an integral part of these financial statements.
TEUCRIUM WHEAT FUND
STATEMENTS OF CHANGES IN NET ASSETS
(Unaudited)
| | | Nine months ended | | Nine months ended | | | Three months ended | | Three months ended | |
| | | September 30, 2017 | | September 30, 2016 | | | March 31, 2024 | | | March 31, 2023 | |
| Operations | | | | | | | | | |
| Net income (loss) | | $ | 149,131 | | $ | (10,343,754 | ) | |
Net loss | | | $ | (17,994,854 | ) | | $ | (24,611,421 | ) |
| Capital transactions | | | | | | |
| Issuance of Shares | | 32,286,675 | | 41,216,458 | | | 2,471,442 | | | 5,864,698 | |
| Redemption of Shares | | | (26,969,178 | ) | | | (2,763,620 | ) | | | (11,115,948 | ) | | | (37,002,190 | ) |
| Total capital transactions | | | 5,317,497 | | | 38,452,838 | | | | (8,644,506 | ) | | | (31,137,492 | ) |
| Net change in net assets | | 5,466,628 | | 28,109,084 | | | (26,639,360 | ) | | (55,748,913 | ) |
| | | | | | | |
| Net assets, beginning of period | | $ | 62,344,759 | | $ | 26,529,260 | | | $ | 184,176,669 | | | $ | 228,972,039 | |
| | | | | | | |
| Net assets, end of period | | $ | 67,811,387 | | $ | 54,638,344 | | | $ | 157,537,309 | | | $ | 173,223,126 | |
| | | | | | | |
| Net asset value per share at beginning of period | | $ | 6.89 | | $ | 9.15 | | | $ | 5.98 | | | $ | 7.99 | |
| | | | | | | |
| Net asset value per share at end of period | | $ | 6.57 | | $ | 7.19 | | | $ | 5.39 | | | $ | 7.06 | |
| | | | | | | |
| Creation of Shares | | 4,800,000 | | 5,025,000 | | | 475,000 | | | 825,000 | |
| Redemption of Shares | | 3,525,000 | | 325,000 | | | 2,025,000 | | | 4,975,000 | |
The accompanying notes are an integral part of these financial statements.
TEUCRIUM WHEAT FUND
STATEMENTS OF CASH FLOWS
(Unaudited)
| | | Nine months ended | | Nine months ended | | | Three months ended | | Three months ended | |
| | | September 30, 2017 | | September 30, 2016 | | | March 31, 2024 | | | March 31, 2023 | |
| Cash flows from operating activities: | | | | | | | | | |
| Net income (loss) | | $ | 149,131 | | $ | (10,343,754 | ) | |
| Adjustments to reconcile net income (loss) to net cash provided by (used in) operating activities: | | | | | | |
| Net change in unrealized depreciation or appreciation on commodity futures contracts | | (152,650 | ) | | 2,107,750 | | |
Net loss | | | $ | (17,994,854 | ) | | $ | (24,611,421 | ) |
Adjustments to reconcile net loss to net cash used in operating activities: | | | | | |
Net change in unrealized depreciation on commodity futures contracts | | | 8,958,463 | | | 2,092,562 | |
| Changes in operating assets and liabilities: | | | | | | | | | |
| Due from broker | | 1,117,928 | | (3,826,500 | ) | | (9,103,868 | ) | | 9,481,490 | |
| Interest receivable | | 80 | | | (6,006 | ) | | 123,407 | | | (352 | ) |
| Restricted cash | | — | | 22,610 | | |
| Other assets | | (45,117 | ) | | (89,501 | ) | | 3,714 | | | 2,728 | |
| Management fee payable to Sponsor | | 3,636 | | 21,605 | | | (30,527 | ) | | (61,031 | ) |
| Other liabilities | | | 1,344 | | | — | | | | 12,989 | | | | 66,003 | |
| Net cash provided by (used in) operating activities | | 1,074,352 | | (12,113,796 | ) | |
Net cash used in operating activities | | | (18,030,676 | ) | | (13,030,021 | ) |
| | | | | | | |
| Cash flows from financing activities: | | | | | | | | | |
| Proceeds from sale of Shares | | 32,286,675 | | 41,216,458 | | | 2,471,442 | | | 5,864,698 | |
| Redemption of Shares | | | (26,969,178 | ) | | | (2,222,240 | ) | | | (11,115,948 | ) | | | (42,991,015 | ) |
| Net cash provided by financing activities | | 5,317,497 | | 38,994,218 | | |
Net cash used in financing activities | | | (8,644,506 | ) | | (37,126,317 | ) |
| | | | | | | |
| Net change in cash and cash equivalents | | 6,391,849 | | 26,880,422 | | | (26,675,182 | ) | | (50,156,338 | ) |
| Cash and cash equivalents, beginning of period | | | 58,931,911 | | | 24,579,091 | | | | 168,732,086 | | | | 209,730,825 | |
| Cash and cash equivalents, end of period | | $ | 65,323,760 | | $ | 51,459,513 | | | $ | 142,056,904 | | | $ | 159,574,487 | |
The accompanying notes are an integral part of these financial statements.
NOTES TO FINANCIAL STATEMENTS
September 30, 2017
March 31, 2024
(Unaudited)
Note 1– Organization and Operation
Teucrium Wheat Fund (referred to herein as “WEAT” or the “Fund”) is a commodity pool that is a series of Teucrium Commodity Trust (“Trust”), a Delaware statutory trust formed on September 11, 2009. The Fund issues common units, called the “Shares,” representing fractional undivided beneficial interests in the Fund. The Fund continuously offers Creation Baskets consisting of 25,000 Shares at their Net Asset Value (“NAV”) to “Authorized Purchasers” through Foreside Fund Services, LLC, which is the distributor for the Fund (the “Distributor”). Authorized Purchasers sell such Shares, which are listed on the New York Stock Exchange (“NYSE”) Arca under the symbol “WEAT,” to the public at per-Share offering prices that reflect, among other factors, the trading price of the Shares on the NYSE Arca, the NAV of the Fund at the time the Authorized Purchaser purchased the Creation Baskets and the NAV at the time of the offer of the Shares to the public, the supply of and demand for Shares at the time of sale, and the liquidity of the markets for wheat interests. The Fund’s Shares trade in the secondary market on the NYSE Arca at prices that are lower or higher than their NAV per Share.
The investment objective of WEAT is to have the daily changes in percentage termsthe NAV of the Shares’ Net Asset Value (“NAV”)Fund’s Shares reflect the daily changes in percentage terms ofthe wheat market for future delivery as measured by the Benchmark. The Benchmark is a weighted average of the closing settlement prices for three futures contracts for wheat (“Wheat Futures Contracts”) that are traded on the Chicago Board of Trade (“CBOT”):
WEAT Benchmark
CBOT Wheat Futures Contract | | Weighting | |
Second to expire | 35% | | 35 | % |
Third to expire | 30% | | 30 | % |
December following the third-to-expirethird to expire | 35% | | 35 | % |
The Fund commenced investment operations on September 19, 2011 and has a fiscal year ending December 31. The Fund’s sponsor is Teucrium Trading, LLC (the “Sponsor”). The Sponsor is responsible for the management of the Fund. The Sponsor is registered as a commodity pool operator (“CPO”) and a commodity trading adviser (“CTA”) with the Commodity Futures Trading Commission (“CFTC”) and is a member of the National Futures Association (the “NFA”(“NFA”) and became a commodity pool operator registered with the Commodity Futures Trading Commission (the “CFTC”) effective November 10, 2009..
On June 17,13, 2011, the Fund’s initial registration of 10,000,000 shares on Form S-1S1 was declared effective by the SEC. On September 19, 2011, the Fund listed its shares on the NYSE Arca under the ticker symbol “WEAT.” On the business day prior to that, the Fund issued 100,000 shares in exchange for $2,500,000 at the Fund’s initial NAV of $25 per share. The Fund also commenced investment operations on September 19, 2011 by purchasing commodity futures contracts traded on the CBOT. On December 31, 2010, the Fund had four shares outstanding, which were owned by the Sponsor. On June 30, 2014, a subsequentThe current registration statement for WEAT was declared effective by the SEC. On July 15, 2016, a subsequent registration statement for WEAT was declared effective. on March 9, 2022. This registration statement for WEAT registered an additional 24,050,000indeterminate number of shares.
The accompanying unaudited financial statements have been prepared in accordance with Rule 10-0110-01 of Regulation S-XS-X promulgated by the SEC and, therefore, do not include all information and footnote disclosures required under accounting principles generally accepted in the United States of America (“GAAP”). The financial information included herein is unaudited; however, such financial information reflects all adjustments which are, in the opinion of management, necessary for the fair presentation of the Fund’s financial statements for the interim period. It is suggested that these interim financial statements be read in conjunction with the financial statements and related notes included in the Trust’s Annual Report on Form 10-K,10-K, as well as the most recent Form S-1S-1 filing, as applicable. The operating results for the three and nine months ended September 30, 2017March 31, 2024 are not necessarily indicative of the results to be expected for the full year ending December 31, 2017.2024.
Subject to the terms of the Trust Agreement, Teucrium Trading, LLC, in its capacity as the Sponsor (“Sponsor”), may terminate a Fund at any time, regardless of whether the Fund has incurred losses, including, for instance, if it determines that the Fund’s aggregate net assets in relation to its operating expenses make the continued operation of the Fund unreasonable or imprudent. However, no level of losses will require the Sponsor to terminate a Fund.
Note 2– Principal Contracts and Agreements
On August 17, 2015 (the “Conversion Date”), U.S. Bank N.A. replaced The Bank of New York Mellon as the Custodian for the Fund. The principal business address for U.S. Bank N.A. is 1555 North RiverCenter Drive, Suite 302, Milwaukee, Wisconsin 53212. U.S. Bank N.A. is a Wisconsin state chartered bank subject to regulation by the Board of Governors of the Federal Reserve System and the Wisconsin State Banking Department. The principal address forSponsor employs U.S. Bancorp Fund Services, LLC, doing business as U.S. Bank Global Fund Services (“USBFS”Global Fund Services”), for Transfer Agency, Fund Accounting and Fund Administration services. The principal address for Global Fund Services is 777 East Wisconsin Avenue,615 E. Michigan Street, Milwaukee, WI 53202. In addition, effective on the Conversion Date, USBFS, a wholly owned subsidiary of U.S. Bank, commenced serving as administrator for each Fund, performing certain administrative and accounting services and preparing certain SEC reports on behalf of the Funds, and also became the registrar and transfer agent for each Fund’s Shares. For such services, U.S. Bank and USBFS will receive an asset-based fee, subject to a minimum annual fee.
For custody services, the Funds will pay to U.S. Bank N.A. 0.0075% of average gross assets up to $1$1 billion, and .0050% of average gross assets over $1$1 billion, annually, plus certain per-transaction charges. For Transfer Agency, Fund Accounting and Fund Administration services, which are based on the total assets for all the Funds in the Trust, the Funds will pay to USBFS 0.06%Global Fund Services 0.05% of average gross assets on the first $250 million, 0.05% on the next $250$500 million, 0.04% on the next $500$500 million, 0.03% on the next $2 billion and 0.03%0.02% on the balance over $1$3 billion annually. A combined minimum annual fee of up to $64,500$47,000 for custody, transfer agency, accounting and administrative services is assessed per Fund. For the three months ended September 30, 2017 and 2016, the Fund recognized $37,295 and $35,905, respectively, for theseThese services which wasare recorded inas custodian fees and expenses on the statements of operations and was paid for by the Fund. For the nine months ended September 30, 2017 and 2016, the Fund recognized $108,579 and $69,106, respectively, foroperations. A summary of these services, which was recorded in custodian fees and expenses on the statements of operations and paid for by the Fund.is included below.
The Sponsor employs Foreside Fund Services, LLC (“Foreside” or the “Distributor”) as the Distributor for the Funds. The Distribution Services Agreement among the Distributor and the Sponsor calls for the Distributor to work with the Custodian in connection with the receipt and processing of orders for Creation Baskets and Redemption Baskets and the review and approval of all Fund sales literature and advertising materials. The Distributor and the Sponsor have also entered into a Securities Activities and Service Agreement (the “SASA”) under which certain employees and officers of the Sponsor are licensed as registered representatives or registered principals of the Distributor, under Financial Industry Regulatory Authority (“FINRA”) rules. For its services as the Distributor, Foreside receives a fee of 0.01% of theeach Fund’s average daily net assets and an aggregate annual fee of $100,000 for all Teucrium Funds, along with certain expense reimbursements. For its services under the SASA, Foreside receives a fee of $5,000 per registered representative and $1,000 per registered location. For the three months ended September 30, 2017 and 2016, the Fund recognized $17,894 and $12,479, respectively, for theseThese services which wasare recorded inas distribution and marketing fees on the statements of operationsoperations. A summary of these expenses $5,451 in 2017 and $0 in 2016 were waived by the Sponsor. For the nine months ended September 30, 2017 and 2016, the Fund recognized $55,527 and $35,190, respectively, for these services, which was recorded in distribution and marketing fees on the statements of operations; of these expenses, $5,451 in 2017 and $0 in 2016 were waived by the Sponsor.is included below.
ED&F ManMarex Capital Markets, Inc. (“ED&F Man”Marex”) servesand StoneX Financial Inc. (“StoneX”) serve as the Underlying Funds’ clearing brokerbrokers to execute and clear the Underlying Funds’ futures contracts and provide other brokerage-related services. ED&F Man isMarex and StoneX are each registered as a FCMfutures commission merchants (“FCM”) with the U.S. CFTC and isare members of the NFA. The clearing brokers are registered as broker-dealers with the SEC and are each a member of the NFA. ED&F Man is also registered as a broker/dealer with the U.S. SecuritiesFINRA. Marex and Exchange Commission and is a member of the FINRA. ED&F Man is aStoneX are each clearing membermembers of ICE Futures U.S., Inc., Chicago Board of Trade, Chicago Mercantile Exchange, New York Mercantile Exchange, and all other major United States commodity exchanges. For Corn, Soybean, Sugar, and Wheat Futures Contracts ED&F ManMarex is paid $9.00$3.00 per round turn. Forturn exclusive of pass-through fees for the three months ended September 30, 2017exchange and 2016, the NFA. StoneX is paid $2.50 per round turn exclusive of pass-through fees for the exchange and the NFA. Additionally, if the monthly commissions paid by each Fund does not equal or exceed 16.5% return on the StoneX Capital Requirement at 9.6% of the Exchange Maintenance Margin, each Fund will pay a true up to meet that return at the end of each month. These expenses are recognized $17,380 and $11,201, respectively, for these services, which was recorded in brokerage commissionson a per-trade basis. The half-turn is recognized as an unrealized loss on the statements of operations for contracts that have been purchased since the change in recognition, and paid for by the Fund. For the nine months ended September 30, 2017 and 2016, the Funda full turn is recognized $45,225 and $24,610, respectively, for these services, which was recorded in brokerage commissionsas a realized loss on the statements of operations and paid for bywhen a contract is sold. A summary of these expenses can be found under the Fund.heading, Brokerage Commissions.
The sole Trustee of the Trust is Wilmington Trust Company, a Delaware banking corporation. The Trustee will accept service of legal process on the Trust in the State of Delaware and will make certain filings under the Delaware Statutory Trust Act. For its services, the Trustee receives an annual fee of $3,300 from the Trust. For the three and nine months ended September 30, 2017 and 2016, the Fund recognized $1,349 and $1,078 for this expense which isThese services are recorded in business permits and licenses fees on the statements of operation;operations. A summary of these expenses $0 in 2017 and $1,078 in 2016 were waived by the Sponsor.is included below.
| | | Three months ended March 31, 2024 | | | Three months ended March 31, 2023 | |
Amount Recognized for Custody Services | | $ | 50,520 | | | $ | 75,710 | |
Amount of Custody Services Waived | | $ | - | | | $ | - | |
| | | | | | | | | |
Amount Recognized for Distribution Services | | $ | 20,330 | | | $ | 21,576 | |
Amount of Distribution Services Waived | | $ | - | | | $ | - | |
| | | | | | | | | |
Amount Recognized for Wilmington Trust | | $ | - | | | $ | - | |
Amount of Wilmington Trust Waived | | $ | - | | | $ | - | |
Note 3– Summary of Significant Accounting Policies
Basis of Presentation
The accompanying financial statements have been prepared in accordance with accounting principles generally accepted in the United States of America (“U.S. GAAP”) as detailed in the Financial Accounting Standards Board’s Accounting Standards Codification.
Revenue Recognition
Commodity futures contracts are recorded on the trade date. All such transactions are recorded on the identified cost basis and marked to market daily. Unrealized appreciation or depreciation on commodity futures contracts are reflected in the statements of operations as the difference between the original contract amount and the fair market value as of the last business day of the year or as of the last date of the financial statements. Changes in the appreciation or depreciation between periods are reflected in the statements of operations. Interest on cash equivalents with financial institutions are recognized on thean accrual basis. The FundsFund seeks to earn interest on funds held at the custodian and other financial institutions at prevailing market rates for such investments.
The Sponsor invests a portion of cash in commercial paper, which is deemed a cash equivalent based on the rating and duration of contracts as described in the notes to the financial statements and reflected in cash and cash equivalents on the statements of assets and liabilities and on the statements of cash flows. Accretion on these investments is recognized using the effective interest method in U.S. dollars and included in interest income on the statements of operations.
The Sponsor invests a portion of the cash held by the broker in short term Treasury Bills as collateral for open futures contracts. Accretion on these investments is recognized using the effective interest method in U.S. dollars and included in interest income on the statements of operations.
Brokerage Commissions
BrokerageThe Sponsor recognizes the expense for brokerage commissions for futures contract trades on all open commodity futures contracts are accrueda per-trade basis. The below table shows the amounts included on the trade date statements of operations as total brokerage commissions paid inclusive of unrealized loss for the three months ended March 31, 2024 and on a full-turn basis.2023.
| | | WEAT | |
Three months ended March 31, 2024 | | $ | 15,580 | |
Three months ended March 31, 2023 | | $ | 21,746 | |
Income Taxes
For federal income tax purposes, the Fund will be treated as a publicly traded partnership. A publicly traded partnership is generally treated as a corporation for federal income tax purposes unless 90% or more of the publicly traded partnership’s gross income for each taxable year of its existence consists of qualifying income as defined in section 7704(d) of the Internal Revenue Code of 1986, as amended. Qualifying income is defined as generally including, in pertinent part, interest (other than from a financial business), dividends, and gains from the sale or disposition of capital assets held for the production of interest or dividends. In the case of a partnership of which a principal activity is the buying and selling of commodities, other than as inventory, or of futures, forwards and options with respect to commodities, qualifying income also includes income and gains from commodities and from futures, forwards, options with respect to commodities and, provided the partnership is a trader or investor with respect to such assets, swaps and other notional principal contracts with respect to commodities. The Fund expects that at least 90% of the Fund’s gross income for each taxable year will consist of qualifying income and that the Fund will be taxed as a partnership for federal income tax purposes. The Fund does not record a provision for income taxes because the shareholders report their share of the Fund’s income or loss on their income tax returns. The financial statements reflect the Fund’s transactions without adjustment, if any, required for income tax purposes.
The Fund is required to determine whether a tax position is more likely than not to be sustained upon examination by the applicable taxing authority, including resolution of any related appeals or litigation processes, based on the technical merits of the position. The Fund files an income tax return in the U.S. federal jurisdiction and may file income tax returns in various U.S. states and foreign jurisdictions. For all tax years 20142021 to 2016,2023, the Fund remains subject to income tax examinations by major taxing authorities. The tax benefit recognized is measured as the largest amount of benefit that has a greater than fifty percent likelihood of being realized upon ultimate settlement. De-recognition of a tax benefit previously recognized results in the Fund recording a tax liability that reduces net assets. Based on its analysis, the Fund has determined that it has not incurred any liability for unrecognized tax benefits as of September 30, 2017March 31, 2024 and for the years ended December 31, 2016, 20152023, 2022 and 2014.2021. However, the Fund’s conclusions regarding this policy may be subject to review and adjustment at a later date based on factors including, but not limited to, ongoing analysis of and changes to tax laws, regulations, and interpretations thereof.
The Fund recognizes interest accrued related to unrecognized tax benefits and penalties related to unrecognized tax benefits in income tax fees payable, if assessed. No interest expense or penalties have been recognized as of and for the three and nine months ended September 30, 2017 March 31, 2024 and 2016.2023.
The Fund may be subject to potential examination by U.S. federal, U.S. state, or foreign jurisdictional authorities in the area of income taxes. These potential examinations may include questioning the timing and amount of deductions, the nexus of income among various tax jurisdictions, and compliance with U.S. federal, U.S. state and foreign tax laws. The Fund’s management does not expect that the total amount of unrecognized tax benefits will materially change over the next twelve months.
Creations and Redemptions
Authorized Purchasers may purchase Creation Baskets consisting of 25,000 shares from the Fund..Fund. The amount of the proceeds required to purchase a Creation Basket will be equal to the NAV of the shares in the Creation Basket determined as of 4:00 p.m. New York time(ET) on the day the order to create the basket is properly received.
Authorized Purchasers may redeem shares from the Fund only in blocks of 25,000 shares called “Redemption Baskets.” The amount of the redemption proceeds for a Redemption Basket will be equal to the NAV of the shares in the Redemption Basket determined as of 4:00 p.m. New York time(ET) on the day the order to redeem the basket is properly received.
The Fund receives or pays the proceeds from shares sold or redeemed within three business days after the trade date of the purchase or redemption. The amounts due from Authorized Purchasers are reflected in the Fund’s statements of assets and liabilities as receivable forcapital shares sold.receivable. Amounts payable to Authorized Purchasers upon redemption are reflected in the Fund’s statements of assets and liabilities as payable for shares redeemed.
As outlined in the most recent Form S-1S-1 filing, 50,000 shares represents represent two Redemption Baskets for the Fund and a minimum level of shares. If the Fund experienced redemptions that caused the number of Shares outstanding to decrease to the minimum level of Shares required to be outstanding, until the minimum number of Shares is again exceeded through the purchase of a new Creation Basket, there can be no more redemptions by an Authorized Purchaser.
Allocation of Shareholder Income and Losses
Profit or loss is allocated among the shareholders of the Fund in proportion to the number of shares each shareholder holds as of the close of each month.
Cash and Cash Equivalents
Cash equivalents are highly-liquidhighly liquid investments with maturity dates of 90 days or less when acquired. The FundTrust reported its cash equivalents in the statements of assets and liabilities at market value, or at carrying amounts that approximate fair value, because of their highly-liquidhighly liquid nature and short-term maturities. TheEach Fund that is a series of the Trust has these balancesthe balance of its assetscash equivalents on deposit with banks.financial institutions. The Fund hadholds a balance of $84,617 and $406,927 in money market funds at September 30, 2017 and December 31, 2016, respectively; these balances arethat is included in cash and cash equivalents on the statements of assets and liabilities. The Sponsor investedinvests a portion of the available cash for the FundFunds in alternative demand-depositdemand deposit savings accounts, which is classified as cash and not as a cash equivalent. The Fund had a balance of $65,240,036 as of September 30, 2017 and $58,526,678 as of December 31, 2016 in a demand-deposit savings account.equivalents. Assets deposited with a financial institution the bank may, at times, exceed federally insured limits. The Sponsor invests a portion of the available cash for the Funds in investment grade commercial paper with durations of 90 days or less, which is classified as a cash equivalent and is not FDIC insured. The Sponsor may invest a portion of the cash held by the broker in short term Treasury Bills as collateral for open futures contracts, which is classified as a cash equivalent and is not FDIC insured.
| | | March 31, 2024 | | | December 31, 2023 | |
Money Market Funds | | $ | 68,480,900 | | | $ | 80,816,091 | |
Demand Deposit Savings Accounts | | | 10,368,017 | | | | 10,232,690 | |
Commercial Paper | | | 63,207,987 | | | | 77,683,305 | |
Total cash and cash equivalents as presented on the Statements of Assets and Liabilities | | $ | 142,056,904 | | | $ | 168,732,086 | |
Payable for Purchases of Commercial Paper
The amount recorded by the Fund for commercial paper transactions awaiting settlement, represents the amount payable for contracts purchased but not yet settled as of the reporting date. The value of the contract is included in cash and cash equivalents, and the payable amount is included as a liability.
Due from/to Broker
The amount recorded by the Fund for the amount due from and to the clearing broker includes, but is not limited to, cash held by the broker, amounts payable to the clearing broker related to open transactions, and payables for commodities futures accounts liquidating to an equity balance on the clearing broker’s records.records and amounts of brokerage commissions paid and recognized as unrealized losses.
Margin is the minimum amount of funds that must be deposited by a commodity interest trader with the trader’s broker to initiate and maintain an open position in futures contracts. A margin deposit acts to assure the trader’s performance of the futures contracts purchased or sold. Futures contracts are customarily bought and sold on initial margin that represents a very small percentage of the aggregate purchase or sales price of the contract. Because of such low margin requirements, price fluctuations occurring in the futures markets may create profits and losses that, in relation to the amount invested, are greater than are customary in other forms of investment or speculation. As discussed below, adverse price changes in the futures contract may result in margin requirements that greatly exceed the initial margin. In addition, the amount of margin required in connection with a particular futures contract is set from time to time by the exchange on which the contract is traded and may be modified from time to time by the exchange during the term of the contract. Brokerage firms, such as the Fund’s clearing brokers, carrying accounts for traders in commodity interest contracts generally require higher amounts of margin as a matter of policy to further protect themselves. Over-the-counterOver the counter trading generally involves the extension of credit between counterparties, so the counterparties may agree to require the posting of collateral by one or both parties to address credit exposure.
When a trader purchases an option, there is no margin requirement; however, the option premium must be paid in full. When a trader sells an option, on the other hand, he or she is required to deposit margin in an amount determined by the margin requirements established for the underlying interest and, in addition, an amount substantially equal to the current premium for the option. The margin requirements imposed on the selling of options, although adjusted to reflect the probability that out-of-the-money options will not be exercised, can in fact be higher than those imposed in dealing in the futures markets directly. Complicated margin requirements apply to spreads and conversions, which are complex trading strategies in which a trader acquires a mixture of options positions and positions in the underlying interest.
Ongoing or “maintenance” margin requirements are computed each day by a trader’s clearing broker. When the market value of a particular open futures contract changes to a point where the margin on deposit does not satisfy maintenance margin requirements, a margin call is made by the broker. If the margin call is not met within a reasonable time, the broker may close out the trader’s position. With respect to the Fund’s trading, the Fund (and not its shareholders personally) is subject to margin calls.
Finally, many major U.S. exchanges have passed certain cross margining arrangements involving procedures pursuant to which the futures and options positions held in an account would, in the case of some accounts, be aggregated and margin requirements would be assessed on a portfolio basis, measuring the total risk of the combined positions.
Calculation of Net Asset Value
The Fund’s NAV is calculated by:
| | ●• | Taking the current market value of its total assets and |
| | • | |
| ● | Subtracting any liabilities. |
The administrator, USBFS,Global Fund Services, calculates the NAV of the Fund once each trading day. It calculates the NAV as of the earlier of the close of the NYSE or 4:00 p.m. New York time.(ET). The NAV for a particular trading day is released after 4:15 p.m. New York time.(ET).
In determining the value of Wheat Futures Contracts, the administrator uses the CBOT closing price. The administrator determines the value of all other Fund investments as of the earlier of the close of the NYSE or 4:00 p.m. New York time.(ET). The value of over-the-counter wheat interests is determined based on the value of the commodity or futures contract underlying such wheat interest, except that a fair value may be determined if the Sponsor believes that the Fund is subject to significant credit risk relating to the counterparty to such wheat interest. For purposes of financial statements and reports, the Sponsor will recalculate the NAV where necessary to reflect the “fair value” of a Futures Contract when the Futures Contract closes at its price fluctuation limit for the day. Short term Treasury securities held by the Fund are valued by the administrator using values received from recognized third-partythird-party vendors and dealer quotes. NAV includes any unrealized profit or loss on open wheat interests and any other income or expense accruing to the Fund but unpaid or not received by the Fund.
Sponsor Fee, Allocation of Expenses and Related Party Transactions
The Sponsor is responsible for investing the assets of the Fund in accordance with the objectives and policies of the Fund. In addition, the Sponsor arranges for one or more third parties to provide administrative, custodial, accounting, transfer agency and other necessary services to the Trust and the Funds. In addition, the Sponsor elected not to outsource services directly attributable to the Trust and the Funds such as accounting, financial reporting, regulatory compliance, and trading activities.activities, which the Sponsor performs itself. In addition, the Fund is contractually obligated to pay a monthly management fee to the Sponsor, based on average daily net assets, at a rate equal to 1.00% per annum.
The Fund generally pays for all brokerage fees, taxes, and other expenses, including licensing fees for the use of intellectual property, registration or other fees paid to the SEC, FINRA, formerly the National Association of Securities Dealers, or any other regulatory agency in connection with the offer and sale of subsequent Shares after its initial registration and all legal, accounting, printing and other expenses associated therewith. The Fund also pays its portion of the fees and expenses associated with the Trust’s tax accounting and reporting requirements. Certain aggregate expenses common to all Funds within the Trust are allocated by the Sponsor to the respective fundsFund based on activity drivers deemed most appropriate by the Sponsor for such expenses, including but not limited to relative assets under management and creation and redeem order activity.
These aggregate common expenses include, but are not limited to, legal, auditing, accounting and financial reporting, tax-preparation, regulatory compliance, trading activities, and insurance costs, as well as fees paid to the Distributor, which are included in the related line item in the statements of operations. A portion of these aggregate common expenses are related to the Sponsor or related parties of principals of the Sponsor; these are necessary services to the Funds, which are primarily the cost of performing accounting and financial reporting, regulatory compliance, and trading activities that are directly attributable to the Fund. For the three months ended September 30, 2017 and 2016, suchSuch expenses which are primarily recorded as distribution and marketing fees in the financial statements of each Fund.
| | | Three months ended March 31, 2024 | | | Three months ended March 31, 2023 | |
Recognized Related Party Transactions | | $ | 342,309 | | | $ | 328,187 | |
Waived Related Party Transactions | | $ | - | | | $ | - | |
The Sponsor has the ability to elect to pay certain expenses on behalf of the statement of operations, totaled $190,699 in 2017Funds or waive the management fee. This election is subject to change by the Sponsor, at its discretion. Expenses paid by the Sponsor and $144,122 in 2016; of these amounts $63,119 in 2017 and $23,037 in 2016 wereManagement fees waived by the Sponsor. For the nine months ended September 30, 2017 and 2016, suchSponsor are, if applicable, presented as waived expenses totaled $705,159 in 2017 and $456,178 in 2016; of these amounts $63,119 in 2017 and $23,037 in 2016 were waived by the Sponsor. All asset-based fees and expenses for the Funds are calculated on the prior day’s net assets.
For the three and nine months ended September 30, 2017, there were $105,942 and $105,942, respectively, of expenses that were identified on the statements of operations offor each Fund. There were no expenses waived for the Fund as expenses that were waived by the Sponsor. The Sponsor has determined that there would be no recovery sought for these amounts in any future period.three months ended March 31, 2024 and 2023.
For the three and nine months ended September 30, 2016, there were $49,516 and $49,516, respectively,
As of August 21, 2017, Mr. Miller no longer retains an ownership interest in the Sponsor which is equal to or greater than 10%, and, thus, is no longer a principal of the Sponsor as defined by the rules of the Commodity Futures Trading Commission.
Use of Estimates
The preparation of financial statements in conformity with U.S. GAAP requires management to make estimates and assumptions that affect the reported amount of assets and liabilities and disclosure of contingent assets and liabilities at the date of the financial statements, and the reported amounts of the revenue and expenses during the reporting period. Actual results could differ from those estimates.
Fair Value - Definition and Hierarchy
In accordance with U.S. GAAP, fair value is defined as the price that would be received to sell an asset or paid to transfer a liability (i.e., the “exit price”) in an orderly transaction between market participants at the measurement date.
In determining fair value, the Fund uses various valuation approaches. In accordance with U.S. GAAP, a fair value hierarchy for inputs is used in measuring fair value that maximizes the use of observable inputs and minimizes the use of unobservable inputs by requiring that the most observable inputs be used when available. Observable inputs are those that market participants would use in pricing the asset or liability based on market data obtained from sources independent of the Fund. Unobservable inputs reflect the Fund’s assumptions about the inputs market participants would use in pricing the asset or liability developed based on the best information available in the circumstances. The fair value hierarchy is categorized into three levels based on the inputs as follows:
Level 1 - Valuations based on unadjusted quoted prices in active markets for identical assets or liabilities that the Fund has the ability to access. Valuation adjustments and block discounts are not applied to Level 1 financial instruments. Since valuations are based on quoted prices that are readily and regularly available in an active market, valuation of these financial instruments does not entail a significant degree of judgment.
Level 2 - Valuations based on quoted prices in markets that are not active or for which all significant inputs are observable, either directly or indirectly.
Level 3 - Valuations based on inputs that are unobservable and significant to the overall fair value measurement.
The availability of valuation techniques and observable inputs can vary from financial instrument to financial instrument and is affected by a wide variety of factors including, the type of financial instrument, whether the financial instrument is new and not yet established in the marketplace, and other characteristics particular to the transaction. To the extent that valuation is based on models or inputs that are less observable or unobservable in the market, the determination of fair value requires more judgment. Those estimated values do not necessarily represent the amounts that may be ultimately realized due to the occurrence of future circumstances that cannot be reasonably determined. Because of the inherent uncertainty of valuation, those estimated values may be materially higher or lower than the values that would have been used had a ready market for the financial instruments existed. Accordingly, the degree of judgment exercised by the Fund in determining fair value is greatest for financial instruments categorized in Level 3. In certain cases, the inputs used to measure fair value may fall into different levels of the fair value hierarchy. In such cases, for disclosure purposes, the level in the fair value hierarchy, within which the fair value measurement in its entirety falls, is determined based on the lowest level input that is significant to the fair value measurement.
Fair value is a market-based measure considered from the perspective of a market participant rather than an entity-specific measure. Therefore, even when market assumptions are not readily available, the Fund’s own assumptions are set to reflect those that market participants would use in pricing the asset or liability at the measurement date. The Fund uses prices and inputs that are current as of the measurement date, including periods of market dislocation. In periods of market dislocation, the observability of prices and inputs may be reduced for many financial instruments. This condition could cause a financial instrument to be reclassified to a lower level within the fair value hierarchy. When such a situation exists on a quarter close, the Sponsor will calculate the NAV on a particular day using the Level 1 valuation but will later recalculate the NAV for the impacted Fund based upon the valuation inputs from these alternative verifiable sources (Level 2 or Level 3)3) and will report such NAV in its applicable financial statements and reports.
The determination is made as of the settlement of the futures contracts on the last day of trading for the reporting period. In making the determination of a Level 1 or Level 2 transfer, the Fund considers the average volume of the specific underlying futures contracts traded on the relevant exchange for the three months being reported.
On September 30, 2017March 31, 2024 and December 31, 2016,2023, in the opinion of the Trust and the Fund, the reported value of the Wheat Futures Contracts traded on the CBOT fairly reflected the value of the Wheat Futures Contracts held by the Fund, and no adjustments were necessary. The determination is made as of the settlement of the futures contracts on the last day of trading for the reporting period. In making the determination of a Level 1 or Level 2 transfer, the Fund considers the average volume of the specific underlying futures contracts traded on the relevant exchange for the periods being reported.
For the ninethree months ended September 30, 2017March 31, 2024 and year ended December 31, 2016,2023, the Fund did not have any significant transfers between any of the levels of the fair value hierarchy.
The Fund records its derivative activities at fair value. Gains and losses from derivative contracts are included in the statements of operations. Derivative contracts include futures contracts related to commodity prices. Futures, which are listed on a national securities exchange, such as the CBOT and the ICE, or reported on another national market, are generally categorized in Level 1 of the fair value hierarchy. OTC derivatives contracts (such as forward and swap contracts) which may be valued using models, depending on whether significant inputs are observable or unobservable, are categorized in Levels 2 or 3 of the fair value hierarchy.
Expenses
Expenses are recorded using the accrual method of accounting.
Net Income (Loss) per Share
Net income (loss) per share is the difference between the NAV per unit at the beginning of each period and at the end of each period. The weighted average number of units outstanding was computed for purposes of disclosing net income (loss) per weighted average unit. The weighted average units are equal to the number of units outstanding at the end of the period, adjusted proportionately for units created or redeemed based on the amount of time the units were outstanding during such period.
New Accounting Pronouncements
The Financial Accounting Standards Board (“FASB”) issued Accounting Standards Update (“ASU”) 2017-13, “Revenue Recognition (Topic 605), Leases (Topic 840), and Leases (Topic 842):issued ASU 2023-06 – Disclosure Improvements: Codification Amendments to SEC Paragraphs Pursuantin Response to the Staff Announcement atSEC’s Disclosure Update and Simplification Initiative. The amendments require an entity to disclose its accounting policy for where cash flows associated with derivative instruments and their related gains and losses are presented. The Trust and Fund already discloses the July 20,2017 EITF Meetingaccounting policy related to the derivative gains and Rescissionlosses presented on the cash flow statement. The amendment was adopted early for the period ended December 31, 2023. There is no impact to the financial statements of Prior SEC Staff Announcements and Observer Comments”the Trust or the Fund.
The FASB issued ASU 2023-01, related to Leases – (Topic 842). The amendment amendsresponse to concerns about applying Topic 842 to related party arrangements between entities under common control. The update was adopted early for the earlyquarter ended March 31, 2023; the adoption date option for certain companies related to adoption of ASU No. 2014-09 and ASU No. 2016-02. The SEC staff stated the SEC would did not object to a public business entity that otherwise would not meet the definition of a public business entity except for a requirement to include or the inclusion of its financial statements or financial information in another entity’s filing with the SEC adopting ASC Topic 842 for fiscal years beginning after December 15, 2019, and interim periods within fiscal years beginning after December 15, 2020. This amendment is not expected to have a material impact on the financial statements and disclosures of the Trust or the Fund.
The FASB issued ASU 2017-12, “Derivatives and Hedging (Topic 815): Targeted Improvements to Accounting for Hedging Activities”. These amendments refine and expand hedge accounting for both financial (e.g., interest rate) and commodity risks. Its provisions create more transparency around how economic results are presented, both on the face
The FASB issued ASU 2017-03, “Accounting Changes and Error Corrections (Topic 250) and Investments – Equity Method and Joint Ventures (Topic 323)”. These amendments require disclosure of the impact that recently issued accounting standards will have on the financial statements of a registrant when such standards are adopted in a future period. The adoption did not have a material impact on the financial statements and disclosures of the Trust or the Fund.
The FASB issued ASU 2017-01, “Business Combinations (Topic 805): Clarifying the Definition of a Business”. The amendments are intended to help companies and other organizations evaluate whether transactions should be accounted for as acquisitions (or disposals) of assets or businesses. The amendments are effective for public companies for annual periods beginning after December 15, 2017, including interim periods within those periods. The Trust and the Fund are currently evaluating the impact on the financial statements and disclosures; but, based on our review to date, we do not expect the update will have a material impact on the financial statements and disclosures of the Trust or the Fund.
The FASB issued ASU 2016-19, “Technical Corrections and Improvements”. The amendments in this update represent changes to clarify, correct errors, or make minor improvements to the Accounting Standards Codification. The amendments make the Accounting Standards Codification easier to understand and easier to apply by eliminating inconsistencies and providing clarifications. The amendments are effective for fiscal years, and interim periods with those fiscal years, for all entities beginning after December 15, 2016. The adoption did not have a material impact on the financial statements and disclosures of the Trust or the Fund.
The FASB issued ASU 2016-18, “Statement of Cash Flows (Topic 230)”. The amendments in this update require that a statement of cash flows explain the change during the period in the total of cash, cash equivalents, and amounts generally described as restricted cash or restricted cash equivalents. Therefore, amounts generally described as restricted cash and restricted cash equivalents should be included with cash and cash equivalents when reconciling the beginning-of-period and end-of-period total amounts shown on the statement of cash flows. The amendments are effective for fiscal years beginning after December 15, 2017, and interim periods within those fiscal years. This update is not expected to have a material impact on the financial statements and disclosures of the Trust or the Fund. The Sponsor believes there will be a change in presentation of restricted cash on the statements of cash flows.
The FASB issued ASU 2016-17, “Consolidation (Topic 810): Interests Held through Related Parties That are under Common Control”. The amendments in this update alters how a decision maker needs to consider indirect interests in a variable interest entity (VIE) held through an entity under common control. The new guidance amends ASU 2015-02, Consolidation (Topic 810): Amendments to the Consolidation Analysis, issued in February 2015. The amendments are effective for fiscal years beginning after December 15, 2016, including interim periods within those fiscal years. The adoption did not have a material impact on the financial statements and disclosures of the Trust or the Fund.
The FASB issued ASU 2016-15, “Statement of Cash Flows (Topic 230): Classification of Certain Cash Receipts and Cash Payments”. The amendments provide cash flow statement classification guidance. The amendments in this update are effective for fiscal years beginning after December 15, 2017. The Trust and the Fund are currently evaluating the impact on the financial statements and disclosures, but do not expect the adoption to have a material impact on the financial statements and disclosures of the Trust or the Fund. The Trust and the Fund do not expect to adopt the guidance until the effective date.
The FASB issued ASU 2014-09 in May 2014, “Revenue from Contracts with Customers (Topic 606),” which replaces the revenue recognition requirements of “Revenue Recognition (Topic 605).” This ASU is based on the principle that revenue is recognized to depict the transfer of goods and services to customers in an amount that reflects the consideration to which the entity expects to be entitled in exchange for those goods or services. This ASU provides new and more detailed guidance on specific topics and expands and improves disclosures about revenue. In August 2015, the FASB issued ASU 2015-14 which defers the effective date of ASU 2014-09 by one year to fiscal years beginning after December 15, 2017. ASU 2015-14 also permits early adoption of ASU 2014-09, but not before the original effective date, which was for fiscal years beginning after December 15, 2016. The Trust and the Fund record income or loss from the recognition and measurement of futures contracts and from interest income under Subtopic 825-10. Revenue from financial instruments which are valued under Subtopic 825 will not be subject to the application of ASU 2014-09 and 2015-14. Therefore, these standards will not have a material impact on the financial statements and disclosures of the Trust or the Fund.
The FASB issued ASU 2016-11, “Revenue Recognition (Topic 605) and Derivatives and Hedging (Topic 815): Rescission of SEC Guidance Because of Accounting Standards Updates 2014-09 and 2014-16 Pursuant to Staff Announcements at the March 3, 2016 EITF Meeting”. The amendments make targeted improvements to clarify the principal versus agent assessment and are intended to make the guidance more operable and lead to more consistent application. The Trust and the Fund record income or loss from the recognition and measurement of futures contracts and from interest income under Subtopic 825-10. Revenue from financial instruments which are valued under Subtopic 825 will not be subject to the application of ASU 2016-11. Therefore, this standard will not have a material impact on the financial statements and disclosures of the Trust or the Fund.
The FASB issued ASU 2016-02, “Leases (Topic 842).” The amendments in this update increase transparency and comparability among organizations by recognizing lease assets and lease liabilities on the balance sheet and disclosing key information about leasing arrangements. The amendments in this update are effective for fiscal years beginning after December 15, 2018. This update is not expected to have a material impact on the financial statements and disclosures of the Trust or the Fund.
The FASB issued ASU 2016-01, “Financial Instruments-Overall (Subtopic 825-10): Recognition and Measurement of Financial Assets and Financial Liabilities.” The amendments in this update are intended to improve the recognitions measurement and disclosure of financial instruments. The amendments to this update are effective for fiscal years beginning after December 15, 2017, and interim periods within those fiscal years. These amendments are required to be applied prospectively. The Trust and the Fund are currently evaluating the impact on the financial statements and disclosures; but based on our review to date we do not expect the update will have a material impact on the financial statements and disclosures of the Trust or the Fund.
Note 4– Fair Value Measurements
The Fund’s assets and liabilities recorded at fair value have been categorized based upon a fair value hierarchy as described in the Fund’s significant accounting policies in Note 3. The following table presents information about the Fund’s assets and liabilities measured at fair value as of September 30, 2017March 31, 2024 and December 31, 2016:2023:
September 30, 2017March 31, 2024
| | | | | | | | | | | | | Balance as of | |
| Assets: | | Level 1 | | Level 2 | | Level 3 | | Balance as of
September 30, 2017 | | | Level 1 | | | Level 2 | | | Level 3 | | | March 31, 2024 | |
| Cash equivalents | | $ | 84,617 | | | $ | — | | | $ | — | | | $ | 84,617 | | |
Cash Equivalents | | | $ | 131,688,887 | | | $ | - | | | $ | - | | | $ | 131,688,887 | |
Commodity Futures Contracts | | | | | | | | | | |
| Wheat futures contracts | | | 296,562 | | | | — | | | | — | | | | 296,562 | | | | 1,513,306 | | | - | | | - | | | 1,513,306 | |
| Total | | $ | 381,179 | | | $ | — | | | $ | — | | | $ | 381,179 | | | $ | 133,202,193 | | $ | - | | $ | - | | $ | 133,202,193 | |
| Liabilities: | | Level 1 | | Level 2 | | Level 3 | | Balance as of
September 30, 2017 | | |
| | | | | | | | | | | | | Balance as of | |
Liabilities | | | Level 1 | | | Level 2 | | | Level 3 | | | March 31, 2024 | |
Commodity Futures Contracts | | | | | | | | | | |
| Wheat futures contracts | | $ | 4,065,500 | | | $ | — | | | $ | — | | | $ | 4,065,500 | | | $ | 12,809,942 | | | $ | - | | | $ | - | | | $ | 12,809,942 | |
December 31, 20162023
| | | | | | | | | | | | | Balance as of | |
| Assets: | | Level 1 | | Level 2 | | Level 3 | | Balance as of
December 31, 2016 | | | Level 1 | | | Level 2 | | | Level 3 | | | December 31, 2023 | |
| Cash equivalents | | $ | 406,927 | | | $ | — | | | $ | — | | | $ | 406,927 | | |
| | | | | | | | | | | | | | | | | | |
Cash Equivalents | | | $ | 158,499,396 | | | $ | - | | | $ | - | | | $ | 158,499,396 | |
Commodity Futures Contracts | | | | | | | | | | |
Wheat futures contracts | | | | 2,237,493 | | | | - | | | | - | | | | 2,237,493 | |
Total | | | $ | 160,736,889 | | | $ | - | | | $ | - | | | $ | 160,736,889 | |
| Liabilities: | | Level 1 | | Level 2 | | Level 3 | | Balance as of
December 31, 2016 | | |
| | | | | | | | | | | | | Balance as of | |
Liabilities | | | Level 1 | | | Level 2 | | | Level 3 | | | December 31, 2023 | |
| Wheat futures contracts | | $ | 3,921,588 | | | $ | — | | | $ | — | | | $ | 3,921,588 | | | $ | 4,575,666 | | | $ | - | | | $ | - | | | $ | 4,575,666 | |
For the ninethree months ended September 30, 2017March 31, 2024 and year ended December 31, 2016,2023, the Fund did not have any significant transfers between any of the levels of the fair value hierarchy.
See theFair Value - Definition and Hierarchysection in Note 3 above for an explanation of the transfers into and out of each level of the fair value hierarchy.
Note 5– Derivative Instruments and Hedging Activities
In the normal course of business, the Fund utilizes derivative contracts in connection with its proprietary trading activities. Investments in derivative contracts are subject to additional risks that can result in a loss of all or part of an investment. The Fund’s derivative activities and exposure to derivative contracts are classified by the following primary underlying risks: interest rate, credit, commodity price, and equity price risks. In addition to its primary underlying risks, the Fund is also subject to additional counterparty risk due to inability of its counterparties to meet the terms of their contracts. For the ninethree months ended September 30, 2017March 31, 2024 and for the year ended December 31, 2016,2023, the Fund invested only in commodity futures contracts.
Futures Contracts
The Fund is subject to commodity price risk in the normal course of pursuing its investment objectives. A futures contract represents a commitment for the future purchase or sale of an asset at a specified price on a specified date.
The purchase and sale of futures contracts requires margin deposits with a Futures Commission Merchant (“FCM”). Subsequent payments (variation margin) are made or received by the Fund each day, depending on the daily fluctuations in the value of the contract, and are recorded as unrealized gains or losses by the Fund. Futures contracts may reduce the Fund’s exposure to counterparty risk since futures contracts are exchange-traded; and the exchange’s clearinghouse, as the counterparty to all exchange-traded futures, guarantees the futures against default.
The Commodity Exchange Act requires an FCM to segregate all customer transactions and assets from the FCM’s proprietary activities. A customer’s cash and other equity deposited with an FCM are considered commingled with all other customer funds subject to the FCM’s segregation requirements. In the event of an FCM’s insolvency, recovery may be limited to the Fund’s pro rata share of segregated customer funds available. It is possible that the recovery amount could be less than the total of cash and other equity deposited.
The following table discloses information about offsetting assets and liabilities presented in the statements of assets and liabilities to enable users of these financial statements to evaluate the effect or potential effect of netting arrangements for recognized assets and liabilities. These recognized assets and liabilities are presented as defined in the Financial Accounting Standards Board’s (“FASB”) Accounting Standards Update (“ASU”) No. 2011-112011-11 “Balance Sheet (Topic 210)210): Disclosures about Offsetting Assets and Liabilities” and subsequently clarified in FASB ASU 2013-012013-01 “Balance Sheet (Topic 210)210): Clarifying the Scope of Disclosures about Offsetting Assets and Liabilities.”
The following table also identifies the fair value amounts of derivative instruments included in the statements of assets and liabilities as derivative contracts, categorized by primary underlying risk, and held by the FCM, ED&F ManFCMs, Marex and StoneX as of September 30, 2017March 31, 2024 and December 31, 2016.2023.
*The amount of collateral presented in Collateral, Due from Broker, is limited to the liability for the futures contracts and accordingly does not include the excess collateral pledged.
Offsetting of Financial Assets and Derivative Assets as of September 30, 2017March 31, 2024
| | | (i) | | (ii) | | (iii) = (i) – (ii) | | (iv) | | | (v) = (iii) – (iv) | | |
| | | | | | | | | | | | | | (i) | | (ii) | | (iii) = (i)-(ii) | | (iv) | | (v)=(iii)-(iv) | |
| | | | | | | | | Gross Amount Not Offset in the
Statement of Assets and Liabilities | | | | | | | | | | | | | | | | | Gross Amount Not Offset in the Statement of Assets and Liabilities | | | | |
| Description | | Gross Amount
of Recognized
Assets | | Gross Amount
Offset in the
Statement of
Assets and
Liabilities | | Net Amount
Presented in the
Statement of
Assets and
Liabilities | | Futures Contracts
Available for
Offset | | | Collateral, Due
from Broker | | Net Amount | | | Gross Amount of Recognized Assets | | | Gross Amount Offset in the Statement of Assets and Liabilities | | | Net Amount Presented in the Statement of Assets and Liabilities | | | Futures Contracts Available for Offset | | | Collateral, Due to Broker | | | Net Amount | |
| Commodity price | | | | | | | | | | | | | | | |
Commodity Price | | |
| Wheat futures contracts | | $ | 296,562 | | $ | — | | $ | 296,562 | | $ | 296,562 | | | $ | — | | $ | — | | | $ | 1,513,306 | | | $ | - | | | $ | 1,513,306 | | | $ | 1,513,306 | | | $ | - | | | $ | - | |
Offsetting of Financial Liabilities and Derivative Liabilities as of September 30, 2017March 31, 2024
| | | (i) | | (ii) | | (iii) = (i) – (ii) | | (iv) | | | (v) = (iii) – (iv) | | |
| | | | | | | | | | | | | | (i) | | (ii) | | (iii) = (i)-(ii) | | (iv) | | (v)=(iii)-(iv) | |
| | | | | | | | | Gross Amount Not Offset in the
Statement of Assets and Liabilities | | | | | | | | | | | | | | | Gross Amount Not Offset in the Statement of Assets and Liabilities | | | |
| Description | | Gross Amount
of Recognized
Liabilities | | Gross Amount
Offset in the
Statement of
Assets and
Liabilities | | Net Amount
Presented in the
Statement of
Assets and
Liabilities | | Futures
Contracts
Available for
Offset | | | Collateral, Due
to Broker | | Net Amount | | | Gross Amount of Recognized Liabilities | | | Gross Amount Offset in the Statement of Assets and Liabilities | | | Net Amount Presented in the Statement of Assets and Liabilities | | | Futures Contracts Available for Offset | | | Collateral, Due from Broker* | | | Net Amount | |
| Commodity price | | | | | | | | | | | | | | | |
Commodity Price | | |
| Wheat futures contracts | | $ | 4,065,500 | | $ | — | | $ | 4,065,500 | | $ | 296,562 | | | $ | 3,768,938 | | $ | — | | | $ | 12,809,942 | | | $ | - | | | $ | 12,809,942 | | | $ | 1,513,306 | | | $ | 11,296,636 | | | $ | - | |
Offsetting of Financial Assets and Derivative Assets as of December 31, 2023
| | | (i) | | | (ii) | | | (iii) = (i)-(ii) | | | (iv) | | | (v)=(iii)-(iv) | |
| | | | | | | | | | | | | | | Gross Amount Not Offset in the Statement of Assets and Liabilities | | | | | |
Description | | Gross Amount of Recognized Assets | | | Gross Amount Offset in the Statement of Assets and Liabilities | | | Net Amount Presented in the Statement of Assets and Liabilities | | | Futures Contracts Available for Offset | | | Collateral, Due to Broker | | | Net Amount | |
Commodity Price | | | | | | | | | | | | | | | | | | | | | | | | |
Wheat futures contracts | | $ | 2,237,493 | | | $ | - | | | $ | 2,237,493 | | | $ | 2,237,493 | | | $ | - | | | $ | - | |
Offsetting of Financial Liabilities and Derivative Liabilities as of December 31, 20162023
| | | (i) | | (ii) | | (iii) = (i) – (ii) | | (iv) | | (v) = (iii) – (iv) | | |
| | | | | | | | | | | | | | (i) | | (ii) | | (iii) = (i)-(ii) | | (iv) | | (v)=(iii)-(iv) | |
| | | | | | | | | Gross Amount Not Offset in the
Statement of Assets and Liabilities | | | | | | | | | | | | | | Gross Amount Not Offset in the Statement of Assets and Liabilities | | | |
| Description | | Gross Amount
of Recognized
Liabilities | | Gross Amount
Offset in the
Statement of
Assets and
Liabilities | | Net Amount
Presented in the
Statement of
Assets and
Liabilities | | Futures
Contracts
Available for
Offset | | | Collateral, Due
to Broker | | Net Amount | | | Gross Amount of Recognized Liabilities | | | Gross Amount Offset in the Statement of Assets and Liabilities | | | Net Amount Presented in the Statement of Assets and Liabilities | | | Futures Contracts Available for Offset | | | Collateral, Due from Broker* | | | Net Amount | |
| Commodity price | | | | | | | | | | | | | | | |
Commodity Price | | |
| Wheat futures contracts | | $ | 3,921,588 | | $ | — | | $ | 3,921,588 | | $ | — | | | $ | 3,921,588 | | $ | — | | | $ | 4,575,666 | | | $ | - | | | $ | 4,575,666 | | | $ | 2,237,493 | | | $ | 2,338,173 | | | $ | - | |
The following tables identify the net gain and loss amounts included in the statements of operations as realized and unrealized gains and losses on trading of commodity futures contracts categorized by primary underlying risk:
Three months ended September 30, 2017March 31, 2024
| Primary Underlying Risk | | Realized Gain on
Commodity Futures
Contracts | | | Net Change in Unrealized
Depreciation on
Commodity Futures
Contracts | |
| Commodity price | | | | | | | | |
| Wheat futures contracts | | $ | 1,955,888 | | | $ | (11,125,988 | ) |
| | | Realized Loss on Commodity Futures Contracts | | | Net Change in Unrealized Depreciation on Commodity Futures Contracts | |
Commodity Price | | | | | | | | |
Wheat futures contracts | | $ | (10,037,305 | ) | | $ | (8,958,463 | ) |
Three months ended September 30, 2016March 31, 2023
| Primary Underlying Risk | | Realized Loss on
Commodity Futures
Contracts | | | Net Change in Unrealized
Depreciation on
Commodity Futures
Contracts | |
| Commodity price | | | | | | | | |
| Wheat futures contracts | | $ | (5,677,475 | ) | | $ | (692,500 | ) |
| | | Realized Loss on Commodity Futures Contracts | | | Net Change in Unrealized Depreciation on Commodity Futures Contracts | |
Commodity Price | | | | | | | | |
Wheat futures contracts | | $ | (23,358,733 | ) | | $ | (2,092,562 | ) |
Nine months ended September 30, 2017
| Primary Underlying Risk | | Realized Gain on
Commodity Futures
Contracts | | | Net Change in Unrealized
Appreciation on
Commodity Futures
Contracts | |
| Commodity price | | | | | | | | |
| Wheat futures contracts | | $ | 1,286,087 | | | $ | 152,650 | |
Nine months ended September 30, 2016
| Primary Underlying Risk | | Realized Loss on
Commodity Futures
Contracts | | | Net Change in Unrealized
Depreciation on
Commodity Futures Contracts | |
| Commodity price | | | | | | | | |
| Wheat futures contracts | | $ | (7,244,175 | ) | | $ | (2,107,750 | ) |
Volume of Derivative Activities
The average notional market value categorized by primary underlying risk for all futures contracts held was $64.8 million and $67.3$162.4 million, for the three and nine months ended September 30, 2017March 31, 2024 and $53.0 million and $35.3$185.9 million, for the three and nine months ended September 30, 2016.March 31, 2023.
Note 6–Financial Highlights
The following tables present per unit performance data and other supplemental financial data for the three and nine months ended September 30, 2017 March 31, 2024 and 2016. This information has been derived from information presented in the financial statements.2023. This information has been derived from information presented in the financial statements and is presented with total expenses gross of expenses waived by the Sponsor and with total expenses net of expenses waived by the Sponsor, as appropriate.
| | | | Three months ended | | Three months ended | |
| | | | March 31, 2024 | | | March 31, 2023 | |
| Per Share Operation Performance | | Three months ended
September 30, 2017 | | Three months ended
September 30, 2016 | | Nine months ended
September 30, 2017 | | Nine months ended
September 30, 2016 | | | | | |
| Net asset value at beginning of period | | $ | 7.84 | | $ | 8.22 | | $ | 6.89 | | $ | 9.15 | | | $ | 5.98 | | | $ | 7.99 | |
| Income (loss) from investment operations: | | | | | | | | | | |
| Investment income | | 0.02 | | 0.01 | | 0.05 | | 0.03 | | |
Interest income | | | 0.07 | | | 0.08 | |
Net realized and unrealized loss on commodity futures contracts | | (1.23 | ) | | (0.96 | ) | | (0.18 | ) | | (1.73 | ) | | (0.62 | ) | | (0.96 | ) |
| Total expenses, net | | | (0.06 | ) | | | (0.08 | ) | | | (0.19 | ) | | | (0.26 | ) | | | (0.04 | ) | | | (0.05 | ) |
| Net decrease in net asset value, net of expenses waived by the Sponsor | | | (1.27 | ) | | | (1.03 | ) | | | (0.32 | ) | | | (1.96 | ) | |
Net decrease in net asset value | | | | (0.59 | ) | | | (0.93 | ) |
| Net asset value at end of period | | $ | 6.57 | | $ | 7.19 | | $ | 6.57 | | $ | 7.19 | | | $ | 5.39 | | | $ | 7.06 | |
| Total Return | | (16.20 | )% | | (12.53 | )% | | (4.64 | )% | | (21.42 | )% | | -9.93 | % | | -11.55 | % |
| Ratios to Average Net Assets | | | | | | | | | | |
Ratios to Average Net Assets (Annualized) | | | | | |
| Total expenses | | 4.40 | % | | 4.67 | % | | 3.88 | % | | 4.48 | % | | 2.80 | % | | 2.58 | % |
| Total expenses, net | | 3.75 | % | | 4.29 | % | | 3.66 | % | | 4.29 | % | | 2.80 | % | | 2.58 | % |
| Net investment loss | | (2.46 | )% | | (3.74 | )% | | (2.60 | )% | | (3.75 | )% | |
Net investment income | | | 2.45 | % | | 1.76 | % |
The financial highlights per share data are calculated consistent with the methodology used to calculate asset-based fees and expenses.
Note 7– Organizational and Offering Costs
Expenses incurred in organizing of the Trust and the initial offering of the Shares of the Fund, including applicable SEC registration fees, were borne directly by the Sponsor. The Fund will not be obligated to reimburse the Sponsor.
Note 8– Subsequent Events
Management has evaluated the financial statements for the quarter-ended September 30, 2017March 31, 2024 for subsequent events through the date of this filing and noted no material events requiring either recognition through the date of the filing or disclosure herein for the Fund other than those noted below:
Effective October 3, 2017, WEAT purchased Commercial Paper with maturities of ninety days or less as described in the prospectus supplements filed with the SEC on October 2, 2017.Fund.
TEUCRIUM AGRICULTURAL FUND
STATEMENTS OF ASSETS AND LIABILITIES
| | | September 30, 2017 | | | December 31, 2016 | |
| | | | (Unaudited) | | | | | |
| Assets | | | | | | | | |
| Cash equivalents | | $ | 967 | | | $ | 2,360 | |
| Interest receivable | | | 2 | | | | 1 | |
| Other assets | | | 755 | | | | 508 | |
| Equity in trading accounts: | | | | | | | | |
| Investments in securities, at fair value (cost $1,799,330 and $2,033,919 as of September 30, 2017 and December 31, 2016, respectively) | | | 1,175,368 | | | | 1,313,554 | |
| Total assets | | $ | 1,177,092 | | | $ | 1,316,423 | |
| | | | | | | | | |
| Liabilities | | | | | | | | |
| Other liabilities | | | 604 | | | | 53 | |
| | | | | | | | | |
| Net assets | | $ | 1,176,488 | | | $ | 1,316,370 | |
| | | | | | | | | |
| Shares outstanding | | | 50,002 | | | | 50,002 | |
| | | | | | | | | |
| Net asset value per share | | $ | 23.53 | | | $ | 26.33 | |
| | | | | | | | | |
| Market value per share | | $ | 22.90 | | | $ | 25.68 | |
The accompanying notes are an integral part of these financial statements.
| | | March 31, 2024 | | | December 31, 2023 | |
| | | (Unaudited) | | | | | |
Assets | | | | | | | | |
Cash equivalents | | $ | 9,701 | | | $ | 11,208 | |
Interest receivable | | | 34 | | | | 55 | |
Other assets | | | 5,571 | | | | - | |
Equity in trading accounts: | | | | | | | | |
Investments in securities, at fair value (cost $16,068,429 and $19,469,359 as of March 31, 2024 and December 31, 2023, respectively) | | | 14,515,416 | | | | 18,401,900 | |
Total assets | | | 14,530,722 | | | | 18,413,163 | |
| | | | | | | | | |
Liabilities | | | | | | | | |
Other liabilities | | | 3,839 | | | | 4,037 | |
Total liabilities | | | 3,839 | | | | 4,037 | |
| | | | | | | | | |
Net assets | | $ | 14,526,883 | | | $ | 18,409,126 | |
| | | | | | | | | |
Shares outstanding | | | 512,502 | | | | 625,002 | |
| | | | | | | | | |
Shares authorized | | | * | | | | * | |
| | | | | | | | | |
Net asset value per share | | $ | 28.35 | | | $ | 29.45 | |
| | | | | | | | | |
Market value per share | | $ | 28.36 | | | $ | 29.41 | |
TEUCRIUM AGRICULTURAL FUND
SCHEDULE OF INVESTMENTS
September 30, 2017
(Unaudited)
| Description: Assets | | Fair Value | | | Percentage of
Net Assets | | | Shares | |
| | | | | | | | | | |
| Exchange-traded funds | | | | | | | | | | | | |
| Teucrium Corn Fund | | $ | 295,854 | | | | 25.15 | % | | | 16,808 | |
| Teucrium Soybean Fund | | | 299,411 | | | | 25.45 | | | | 16,331 | |
| Teucrium Sugar Fund | | | 278,403 | | | | 23.66 | | | | 29,524 | |
| Teucrium Wheat Fund | | | 301,700 | | | | 25.64 | | | | 45,937 | |
| Total exchange-traded funds (cost $1,799,330) | | $ | 1,175,368 | | | | 99.90 | % | | | | |
| | | | | | | | | | | | | |
| Cash equivalents | | | | | | | | | | | | |
| Money market funds | | | | | | | | | | | | |
| Fidelity Institutional Money Market Funds - Government Portfolio (cost $967) | | $ | 967 | | | | 0.08 | % | | | 967 | |
* On April 7, 2022, the Teucrium Agricultural Fund registered an indeterminate number of shares of the Fund pursuant to Rule 456(d) under the Securities Act of 1933.
The accompanying notes are an integral part of these financial statements.
TEUCRIUM AGRICULTURAL FUND
SCHEDULE OF INVESTMENTS
DecemberMarch 31, 2016
| | | Percentage of | |
| Description: Assets | | Fair Value | | | Net Assets | | | Shares | |
| | | | | | | | | | |
| Exchange-traded funds | | | | | | | | | | | | |
| Teucrium Corn Fund | | $ | 323,979 | | | | 24.61 | % | | | 17,258 | |
| Teucrium Soybean Fund | | | 315,486 | | | | 23.97 | | | | 16,531 | |
| Teucrium Sugar Fund | | | 342,822 | | | | 26.04 | | | | 26,424 | |
| Teucrium Wheat Fund | | | 331,267 | | | | 25.17 | | | | 48,087 | |
| Total exchange-traded funds (cost $2,033,919) | | $ | 1,313,554 | | | | 99.79 | % | | | | |
| | | | | | | | | | | | | |
| Cash equivalents | | | | | | | | | | | | |
| Money market funds | | | | | | | | | | | | |
| Fidelity Investments Money Market Funds - Government Portfolio (cost $2,360) | | $ | 2,360 | | | | 0.18 | % | | | 2,360 | |
The accompanying notes are an integral part of these financial statements.
TEUCRIUM AGRICULTURAL FUND
STATEMENTS OF OPERATIONS
2024
(Unaudited)
| | | Three months ended
September 30, 2017 | | | Three months ended
September 30, 2016 | | | Nine months ended
September 30, 2017 | | | Nine months ended
September 30, 2016 | |
| | | | | | | | | | | | | |
| Income | | | | | | | | | | | | | | | | |
| Realized and unrealized (loss) gain on trading of securities: | | | | | | | | | | | | | | | | |
| Realized loss on securities | | $ | (89,727 | ) | | $ | (14,208 | ) | | $ | (231,540 | ) | | $ | (55,766 | ) |
| Net change in unrealized appreciation or depreciation on securities | | | 13,272 | | | | (64,236 | ) | | | 96,403 | | | | 91,476 | |
| Interest income | | | 4 | | | | 3 | | | | 11 | | | | 10 | |
| Total (loss) income | | | (76,451 | ) | | | (78,441 | ) | | | (135,126 | ) | | | 35,720 | |
| | | | | | | | | | | | | | | | | |
| Expenses | | | | | | | | | | | | | | | | |
| Professional fees | | | 4,185 | | | | 5,950 | | | | 10,453 | | | | 10,547 | |
| Distribution and marketing fees | | | 2,523 | | | | 4,295 | | | | 11,776 | | | | 13,295 | |
| Custodian fees and expenses | | | 429 | | | | 740 | | | | 1,627 | | | | 2,077 | |
| Business permits and licenses fees | | | — | | | | 21 | | | | 12,132 | | | | 12,136 | |
| General and administrative expenses | | | 260 | | | | 431 | | | | 1,454 | | | | 1,447 | |
| Brokerage commissions | | | — | | | | — | | | | — | | | | 223 | |
| Other expenses | | | 128 | | | | 166 | | | | 473 | | | | 442 | |
| Total expenses | | | 7,525 | | | | 11,603 | | | | 37,915 | | | | 40,167 | |
| | | | | | | | | | | | | | | | | |
| Expenses waived by the Sponsor | | | (5,987 | ) | | | (9,893 | ) | | | (33,159 | ) | | | (35,063 | ) |
| | | | | | | | | | | | | | | | | |
| Total expenses, net | | | 1,538 | | | | 1,710 | | | | 4,756 | | | | 5,104 | |
| | | | | | | | | | | | | | | | | |
| Net (loss) income | | $ | (77,989 | ) | | $ | (80,151 | ) | | $ | (139,882 | ) | | $ | 30,616 | |
| | | | | | | | | | | | | | | | | |
| Net (loss) income per share | | $ | (1.56 | ) | | $ | (1.60 | ) | | $ | (2.80 | ) | | $ | 0.61 | |
| Net (loss) income per weighted average share | | $ | (1.56 | ) | | $ | (1.60 | ) | | $ | (2.80 | ) | | $ | 0.61 | |
| Weighted average shares outstanding | | | 50,002 | | | | 50,002 | | | | 50,002 | | | | 50,002 | |
| | | | | | | | | | | | | | | Percentage of | | | | | |
Description: Assets | | Yield | | | Cost | | | Fair Value | | | Net Assets | | | Shares | |
| | | | | | | | | | | | | | | | | | | | | |
Exchange-traded funds | | | | | | | | | | | | | | | | | | | | |
Teucrium Corn Fund | | | | | | | | | | $ | 3,661,367 | | | | 25.20 | % | | | 181,115 | |
Teucrium Soybean Fund | | | | | | | | | | | 3,574,703 | | | | 24.61 | | | | 142,076 | |
Teucrium Sugar Fund | | | | | | | | | | | 3,605,828 | | | | 24.82 | | | | 267,233 | |
Teucrium Wheat Fund | | | | | | | | | | | 3,673,518 | | | | 25.29 | | | | 682,062 | |
Total exchange-traded funds | | | | | | $ | 16,068,429 | | | $ | 14,515,416 | | | | 99.92 | % | | | | |
| | | | | | | | | | | | | | | | | | | | | |
Cash equivalents | | | | | | | | | | | | | | | | | | | | |
Money market funds | | | | | | | | | | | | | | | | | | | | |
U.S. Bank Deposit Account | | | 5.210 | % | | $ | 9,701 | | | $ | 9,701 | | | | 0.07 | % | | | 9,701 | |
The accompanying notes are an integral part of these financial statements.
TEUCRIUM AGRICULTURAL FUND
SCHEDULE OF INVESTMENTS
STATEMENTS OF CHANGES IN NET ASSETS
(Unaudited)December 31, 2023
| | | Nine months ended
September 30, 2017 | | | Nine months ended
September 30, 2016 | |
| Operations | | | | | | | | |
| Net (loss) income | | $ | (139,882 | ) | | $ | 30,616 | |
| Net change in net assets | | | (139,882 | ) | | | 30,616 | |
| | | | | | | | | |
| Net assets, beginning of period | | $ | 1,316,370 | | | $ | 1,329,390 | |
| | | | | | | | | |
| Net assets, end of period | | $ | 1,176,488 | | | $ | 1,360,006 | |
| | | | | | | | | |
| Net asset value per share at beginning of period | | $ | 26.33 | | | $ | 26.59 | |
| | | | | | | | | |
| Net asset value per share at end of period | | $ | 23.53 | | | $ | 27.20 | |
| | | | | | | | | |
| Creation of Shares | | | — | | | | — | |
| Redemption of Shares | | | — | | | | — | |
| | | | | | | | | | | | | | | Percentage of | | | | | |
Description: Assets | | Yield | | | Cost | | | Fair Value | | | Net Assets | | | Shares | |
| | | | | | | | | | | | | | | | | | | | | |
Exchange-traded funds | | | | | | | | | | | | | | | | | | | | |
Teucrium Corn Fund | | | | | | | | | | $ | 4,567,949 | | | | 24.81 | % | | | 211,348 | |
Teucrium Soybean Fund | | | | | | | | | | | 4,546,758 | | | | 24.70 | | | | 168,219 | |
Teucrium Sugar Fund | | | | | | | | | | | 4,624,253 | | | | 25.12 | | | | 371,871 | |
Teucrium Wheat Fund | | | | | | | | | | | 4,662,940 | | | | 25.33 | | | | 779,782 | |
Total exchange-traded funds | | | | | | $ | 19,469,359 | | | $ | 18,401,900 | | | | 99.96 | % | | | | |
| | | | | | | | | | | | | | | | | | | | | |
Cash equivalents | | | | | | | | | | | | | | | | | | | | |
Money market funds | | | | | | | | | | | | | | | | | | | | |
U.S. Bank Deposit Account | | | 5.270 | % | | $ | 11,208 | | | $ | 11,208 | | | | 0.06 | % | | | 11,208 | |
The accompanying notes are an integral part of these financial statements.
TEUCRIUM AGRICULTURAL FUND
STATEMENTS OF CASH FLOWS
OPERATIONS
(Unaudited)
| | | Nine months ended
September 30, 2017 | | | Nine months ended
September 30, 2016 | |
| Cash flows from operating activities: | | | | | | | | |
| Net (loss) income | | $ | (139,882 | ) | | $ | 30,616 | |
| Adjustments to reconcile net (loss) income to net cash (used in) provided by operating activities: | | | | | | | | |
| Net change in unrealized appreciation on securities | | | (96,403 | ) | | | (91,476 | ) |
| Changes in operating assets and liabilities: | | | | | | | | |
| Net sales of investments in securities | | | 234,589 | | | | 61,313 | |
| Interest receivable | | | (1 | ) | | | (1 | ) |
| Other assets | | | (247 | ) | | | 1,365 | |
| Other liabilities | | | 551 | | | | 420 | |
| Net cash (used in) provided by operating activities | | | (1,393 | ) | | | 2,237 | |
| | | | | | | | | |
| Net change in cash equivalents | | | (1,393 | ) | | | 2,237 | |
| Cash equivalents, beginning of period | | | 2,360 | | | | 1,815 | |
| Cash equivalents, end of period | | $ | 967 | | | $ | 4,052 | |
| | | Three months ended | | | Three months ended | |
| | | March 31, 2024 | | | March 31, 2023 | |
Income | | | | | | | | |
Realized and unrealized gain (loss) on trading of securities: | | | | | | | | |
Realized loss on securities | | $ | (230,630 | ) | | $ | (60,094 | ) |
Net change in unrealized depreciation on securities | | | (485,554 | ) | | | (439,126 | ) |
Interest income | | | 136 | | | | 112 | |
Total loss | | | (716,048 | ) | | | (499,108 | ) |
| | | | | | | | | |
Expenses | | | | | | | | |
Professional fees | | | 21,363 | | | | 75,512 | |
Distribution and marketing fees | | | 36,178 | | | | 39,209 | |
Custodian fees and expenses | | | 3,615 | | | | 7,070 | |
Business permits and licenses fees | | | 9,825 | | | | 8,313 | |
General and administrative expenses | | | 2,238 | | | | 3,438 | |
Other expenses | | | 66 | | | | - | |
Total expenses | | | 73,285 | | | | 133,542 | |
| | | | | | | | | |
Expenses waived by the Sponsor | | | (69,538 | ) | | | (125,494 | ) |
| | | | | | | | | |
Total expenses, net | | | 3,747 | | | | 8,048 | |
| | | | | | | | | |
Net loss | | $ | (719,795 | ) | | $ | (507,156 | ) |
| | | | | | | | | |
Net loss per share | | $ | (1.10 | ) | | $ | (0.30 | ) |
Net loss per weighted average share | | $ | (1.22 | ) | | $ | (0.43 | ) |
Weighted average shares outstanding | | | 590,524 | | | | 1,177,085 | |
The accompanying notes are an integral part of these financial statements.
TEUCRIUM AGRICULTURAL FUND
STATEMENTS OF CHANGES IN NET ASSETS
(Unaudited)
| | | Three months ended | | | Three months ended | |
| | | March 31, 2024 | | | March 31, 2023 | |
Operations | | | | | | | | |
Net loss | | $ | (719,795 | ) | | $ | (507,156 | ) |
Capital transactions | | | | | | | | |
Issuance of Shares | | | - | | | | - | |
Redemption of Shares | | | (3,162,448 | ) | | | (5,692,970 | ) |
Total capital transactions | | | (3,162,448 | ) | | | (5,692,970 | ) |
Net change in net assets | | | (3,882,243 | ) | | | (6,200,126 | ) |
| | | | | | | | | |
Net assets, beginning of period | | $ | 18,409,126 | | | $ | 39,575,245 | |
| | | | | | | | | |
Net assets, end of period | | $ | 14,526,883 | | | $ | 33,375,119 | |
| | | | | | | | | |
Net asset value per share at beginning of period | | $ | 29.45 | | | $ | 31.35 | |
| | | | | | | | | |
Net asset value per share at end of period | | $ | 28.35 | | | $ | 31.05 | |
| | | | | | | | | |
Creation of Shares | | | - | | | | - | |
Redemption of Shares | | | 112,500 | | | | 187,500 | |
The accompanying notes are an integral part of these financial statements.
TEUCRIUM AGRICULTURAL FUND
STATEMENTS OF CASH FLOWS
(Unaudited)
| | | Three months ended | | | Three months ended | |
| | | March 31, 2024 | | | March 31, 2023 | |
Cash flows from operating activities: | | | | | | | | |
Net loss | | $ | (719,795 | ) | | $ | (507,156 | ) |
Adjustments to reconcile net loss to net cash provided by operating activities: | | | | | | | | |
Net change in unrealized depreciation on securities | | | 485,554 | | | | 439,126 | |
Changes in operating assets and liabilities: | | | | | | | | |
Net sale of investments in securities | | | 3,400,930 | | | | 5,775,476 | |
Interest receivable | | | 21 | | | | (15 | ) |
Other assets | | | (5,571 | ) | | | (7,200 | ) |
Other liabilities | | | (198 | ) | | | 2,585 | |
Net cash provided by operating activities | | | 3,160,941 | | | | 5,702,816 | |
| | | | | | | | | |
Cash flows from financing activities: | | | | | | | | |
Redemption of Shares | | | (3,162,448 | ) | | | (5,692,970 | ) |
Net cash used in financing activities | | | (3,162,448 | ) | | | (5,692,970 | ) |
| | | | | | | | | |
Net change in cash equivalents | | | (1,507 | ) | | | 9,846 | |
Cash equivalents, beginning of period | | | 11,208 | | | | 4,716 | |
Cash equivalents, end of period | | $ | 9,701 | | | $ | 14,562 | |
The accompanying notes are an integral part of these financial statements.
NOTES TO FINANCIAL STATEMENTS
September 30, 2017
March 31, 2024
(Unaudited)
Note 1– Organization and Operation
Teucrium Agricultural Fund (referred to herein as “TAGS” or the “Fund”) is a series of Teucrium Commodity Trust (“Trust”), a Delaware statutory trust organized on September 11, 2009. The Fund operates pursuant to the Trust’s SecondFifth Amended and Restated Declaration of Trust and Trust Agreement (the “Trust Agreement”). The Fund was formed on March 29, 2011 and is managed and controlled by Teucrium Trading, LLC (the “Sponsor”). The Sponsor is a limited liability company formed in Delaware on July 28, 2009 that2009. The Sponsor is registered as a commodity pool operator (“CPO”) and a commodity trading adviser (“CTA”) with the Commodity Futures Trading Commission (“CFTC”) and is a member of the National Futures Association (“NFA”).
On April 22, 2011, a registration statement was filed with the Securities and Exchange Commission (“SEC”). On February 10, 2012, the Fund’s initial registration of 5,000,000 shares on Form S-1S-1 was declared effective by the U.S. Securities and Exchange Commission (“SEC”).SEC. On March 28, 2012, the Fund listed its shares on the NYSE Arca under the ticker symbol “TAGS.” On the business day prior to that, the Fund issued 300,000 shares in exchange for $15,000,000 at the Fund’s initial NAV of $50 per share. The Fund also commenced investment operations on March 28, 2012 by purchasing shares of the Underlying Funds. On December 31, 2011, the Fund had two shares outstanding, which were owned by the Sponsor. On April 30, 2015, a subsequentThe current registration statement for TAGS was declared effective by the SEC.on April 7, 2022. This registration statement for TAGS registered an indeterminate number of shares.
The investment objective of the TAGS is to have the daily changes in percentage terms of the NAV of its Shares reflect the daily changes in percentage terms of a weighted average (the “Underlying Fund Average”) of the NAVs per share of four other commodity pools that are series of the Trust and are sponsored by the Sponsor: the Teucrium Corn Fund, the Teucrium Wheat Fund, the Teucrium Soybean Fund and the Teucrium Sugar Fund (collectively, the “Underlying Funds”). The Underlying Fund Average will have a weighting of 25% to each Underlying Fund, and the Fund’s assets will be rebalanced, generally on a daily basis, to maintain the approximate 25% allocation to each Underlying Fund:
TAGS Benchmark
Underlying Fund | | Weighting | |
CORN | 25% | | 25 | % |
SOYB | 25% | | 25 | % |
CANE | 25% | | 25 | % |
WEAT | 25% | | 25 | % |
The Fund seeks to provide daily investment results that reflect the combined daily performance of the Underlying Funds. Under normal market conditions, the Fund seeks to achieve its investment objective generally by investing equally in shares of each Underlying Fund isand, to have the daily changesa lesser extent, cash equivalents. The Fund’s investments in percentage terms of its shares’ NAV reflect the daily changes in percentage terms of a weighted averageshares of the closing settlement prices for certain Futures Contracts forUnderlying Funds is rebalanced, generally on a daily basis, in order to maintain approximately a 25% allocation of the commodity specified in theFund’s assets to each Underlying Fund’s name.Fund. (This weighted average is referred to herein as the Underlying Fund’s “Benchmark,” the Futures Contracts that at any given time make up an Underlying Fund’s Benchmark are referred to herein as the Underlying Fund’s “Benchmark Component Futures Contracts,” and the commodity specified in the Underlying Fund’s name is referred to herein as its “Specified Commodity.”) Specifically, the Teucrium Corn Fund’s Benchmark is:
CORN Benchmark
CBOT Corn Futures Contract | Weighting |
Second to expire | 35% |
Third to expire | 30% |
December following the third to expire | 35% |
(1) the second to expire Futures Contract for corn traded on the Chicago Board of Trade (“CBOT”), weighted 35%, (2) the third to expire CBOT corn Futures Contract, weighted 30%, and (3) the CBOT corn Futures Contract expiring in the December following the expiration month of the third to expire contract, weighted 35%. The Teucrium Wheat Fund’s Benchmark is:
WEAT Benchmark
CBOT Wheat Futures Contract | Weighting |
Second to expire | 35% |
Third to expire | 30% |
December following the third-to-expire | 35% |
(1) the second to expire CBOT wheat Futures Contract, weighted 35%, (2) the third to expire CBOT wheat Futures Contract, weighted 30%, and (3) the CBOT wheat Futures Contract expiring in the December following the expiration month of the third to expire contract, weighted 35%. The Teucrium Soybean Fund’s Benchmark is:
SOYB (1) the second to expire CBOT soybean Futures Contract, weighted 35%, (2) the third to expire CBOT soybean Futures Contract, weighted 30%, and (3) the CBOT soybean Futures Contract expiring in the November following the expiration month of the third to expire contract, weighted 35%, except that CBOT soybean Futures Contracts expiring in August and September will not be part of the Teucrium Soybean Fund’s Benchmark
CBOT Soybeans Futures Contract | Weighting |
Second to expire (excluding August & September) | 35% |
Third to expire (excluding August & September) | 30% |
Expiring in the November following the expiration of the third-to-expire contract | 35% |
because of the less liquid market for these Futures Contracts. The Teucrium Sugar Fund’s Benchmark is: (1) the second to expire Sugar No.11 Futures Contract traded on ICE Futures US (“ICE Futures”), weighted 35%, (2) the third to expire ICE Futures Sugar No.11 Futures Contract, weighted 30%, and (3) the ICE Futures Sugar No.11 Futures Contract expiring in the March following the expiration month of the third to expire contract, weighted 35%.
CANE Benchmark
ICE Sugar Futures Contract | Weighting |
Second to expire | 35% |
Third to expire | 30% |
Expiring in the March following the expiration of the third-to-expire contract | 35% |
While the Fund expects to maintain substantially all of its assets in shares of the Underlying Funds at all times, the Fund may hold some residual amount of assets in obligations of the United States government (“Treasury Securities”) or cash equivalents, and/or merely hold such assets in cash (generally in interest-bearing accounts). The Underlying Funds invest in Commodity Interests to the fullest extent possible without being leveraged or unable to satisfy their expected current or potential margin or collateral obligations with respect to their investments in Commodity Interests. After fulfilling such margin and collateral requirements, the Underlying Funds will invest the remainder of the proceeds from the sale of baskets in short term Treasury Securities or cash equivalents, and/or merely hold such assets in cash. Therefore, the focus of the Sponsor in managing the Underlying Funds is investing in Commodity Interests and in Treasury Securities, cash and/or cash equivalents. The Fund and Underlying Funds will seek to earn interest income from the short-term Treasury Securities and/or cash equivalents that it purchases, and, on the cash, it holds through the Fund’s custodian.
The accompanying unaudited financial statements have been prepared in accordance with Rule 10-0110-01 of Regulation S-XS-X promulgated by the SEC and, therefore, do not include all information and footnote disclosures required under accounting principles generally accepted in the United States of America (“GAAP”). The financial information included herein is unaudited; however, such financial information reflects all adjustments which are, in the opinion of management, necessary for the fair presentation of the Fund’s financial statements for the interim period. It is suggested that these interim financial statements be read in conjunction with the financial statements and related notes included in the Trust’s Annual Report on Form 10-K,10-K, as well as the most recent Form S-1S-1 filing, as applicable. The operating results for the three and nine months ended September 30, 2017March 31, 2024 are not necessarily indicative of the results to be expected for the full year ending December 31, 2017.2024.
Subject to the terms of the Trust Agreement, Teucrium Trading, LLC, in its capacity as the Sponsor (“Sponsor”), may terminate a Fund at any time, regardless of whether the Fund has incurred losses, including, for instance, if it determines that the Fund’s aggregate net assets in relation to its operating expenses make the continued operation of the Fund unreasonable or imprudent. However, no level of losses will require the Sponsor to terminate a Fund.
Note 2– Principal Contracts and Agreements
On August 17, 2015 (the “Conversion Date”), U.S. Bank N.A. replaced The Bank of New York Mellon as the Custodian for the Fund. The principal business address for U.S. Bank N.A. is 1555 North RiverCenter Drive, Suite 302, Milwaukee, Wisconsin 53212. U.S. Bank N.A. is a Wisconsin state chartered bank subject to regulation by the Board of Governors of the Federal Reserve System and the Wisconsin State Banking Department. The principal address forSponsor employs U.S. Bancorp Fund Services, LLC, (“USBFS”), is 777 East Wisconsin Avenue, Milwaukee, Wi, 53202. In addition, effective on the Conversion Date, USBFS, a wholly owned subsidiary ofdoing business as U.S. Bank commenced serving as administratorGlobal Fund Services (“Global Fund Services”), for eachTransfer Agency, Fund performing certain administrativeAccounting and accounting services and preparing certain SEC reports on behalf of the Funds, and also became the registrar and transfer agentFund Administration services. The principal address for each Fund’s Shares. For such services, U.S. Bank and USBFS will receive an asset-based fee, subject to a minimum annual fee.Global Fund Services is 615 E. Michigan Street, Milwaukee, WI 53202.
For custody services, the Funds will pay to U.S. Bank N.A. 0.0075% of average gross assets up to $1$1 billion, and .0050% of average gross assets over $1$1 billion, annually, plus certain per-transaction charges. For Transfer Agency, Fund Accounting and Fund Administration services, which are based on the total assets for all the Funds in the Trust, the Funds will pay to USBFS 0.06%Global Fund Services 0.05% of average gross assets on the first $250 million, 0.05% on the next $250$500 million, 0.04% on the next $500$500 million, 0.03% on the next $2 billion and 0.03%0.02% on the balance over $1$3 billion annually. A combined minimum annual fee of up to $64,500$47,000 for custody, transfer agency, accounting and administrative services is assessed per Fund. For the three months ended September 30, 2017 and 2016, the Fund recognized $429 and $740, respectively, for theseThese services which wasare recorded inas custodian fees and expenses on the statements of operations;operations. A summary of these expenses $316 in 2017 and $603 in 2016 were waived by the Sponsor. For the nine months ended September 30, 2017 and 2016, the Fund recognized $1,627 and $2,077, respectively, for these services, which was recorded in custodian fees and expenses on the statements of operations; of these expenses $1,334 in 2017 and $1,821 in 2016 were waived by the Sponsor.is included below.
The Sponsor employs Foreside Fund Services, LLC (“Foreside” or the “Distributor”) as the Distributor for the Funds. The Distribution Services Agreement among the Distributor and the Sponsor calls for the Distributor to work with the Custodian in connection with the receipt and processing of orders for Creation Baskets and Redemption Baskets and the review and approval of all Fund sales literature and advertising materials. The Distributor and the Sponsor have also entered into a Securities Activities and Service Agreement (the “SASA”) under which certain employees and officers of the Sponsor are licensed as registered representatives or registered principals of the Distributor, under Financial Industry Regulatory Authority (“FINRA”) rules. For its services as the Distributor, Foreside receives a fee of 0.01% of theeach Fund’s average daily net assets and an aggregate annual fee of $100,000 for all Teucrium Funds, along with certain expense reimbursements. For its services under the SASA, Foreside receives a fee of $5,000 per registered representative and $1,000 per registered location.For the three months endedSeptember30, 2017 and 2016, the Fund recognized $234 and $251, respectively, for these These services which wasare recorded inas distribution and marketing fees on the statements of operations;operations. A summary of these expenses $23 in 2017 and $251 in 2016 were waived by the Sponsor.For the nine months ended September 30, 2017 and 2016, the Fund recognized $786 and $881, respectively, for these services, which was recorded in distribution and marketing fees on the statements of operations; of these expenses $436 in 2017 and $775 in 2016 were waived by the Sponsor.is included below.
ED&F ManMarex Capital Markets, Inc. (“ED&F Man”Marex”) servesand StoneX Financial Inc. (“StoneX”) serve as the Underlying Funds’ clearing brokerbrokers to execute and clear the Underlying Funds’ futures and provide other brokerage-related services. ED&F Man isMarex and StoneX are each registered as a FCMfutures commission merchants (“FCM”) with the U.S. CFTC and isare members of the NFA. The clearing brokers are registered as broker-dealers with the SEC and are each a member of the NFA. ED&F Man is also registered as a broker/dealer with the U.S. SecuritiesFINRA. Marex and Exchange Commission and is a member of the FINRA. ED&F Man is aStoneX are each clearing membermembers of ICE Futures U.S., Inc., Chicago Board of Trade, Chicago Mercantile Exchange, New York Mercantile Exchange, and all other major United States commodity exchanges. For Corn, Soybean, Sugar, and Wheat Futures Contracts ED&F ManMarex is paid $9.00$3.00 per round turn. The Bankturn exclusive of New York Mellon serves as the brokerpass-through fees for the Fund. Forexchange and the three months ended September 30, 2017NFA. StoneX is paid $2.50 per round turn exclusive of pass-through fees for the exchange and 2016, the NFA. Additionally, if the monthly commissions paid by each Fund did does not recognize any equal or exceed 16.5% return on the StoneX Capital Requirement at 9.6% of the Exchange Maintenance Margin, each Fund will pay a true up to meet that return at the end of each month. These expenses for these services. For the nine months ended September 30, 2017 and 2016, the Fund $0 and $223, respectively, for these services, which was recorded in brokerage commissionsare recognized on a per-trade basis. The half-turn is recognized as an unrealized loss on the statements of operations for contracts that have been purchased since the change in recognition, and paid for bya full turn is recognized as a realized loss on the Fund.statements of operations when a contract is sold. A summary of these expenses can be found under the heading, Brokerage Commissions.
The sole Trustee of the Trust is Wilmington Trust Company, a Delaware banking corporation. The Trustee will accept service of legal process on the Trust in the State of Delaware and will make certain filings under the Delaware Statutory Trust Act. For its services, the Trustee receives an annual fee of $3,300 from the Trust. For the three and nine months ended September 30, 2017 and 2016, the Fund recognized $16 and $21 for these services; of these expenses $0 in 2017 and $21 in 2016 were waived by the Sponsor. This expense isThese services are recorded in business permits and licenses fees on the statements of operations. A summary of these expenses is included below.
| | | Three months ended March 31, 2024 | | | Three months ended March 31, 2023 | |
Amount Recognized for Custody Services | | $ | 3,615 | | | $ | 7,070 | |
Amount of Custody Services Waived | | $ | 3,615 | | | $ | 7,070 | |
| | | | | | | | | |
Amount Recognized for Distribution Services | | $ | 1,527 | | | $ | 2,262 | |
Amount of Distribution Services Waived | | $ | 1,527 | | | $ | 2,262 | |
| | | | | | | | | |
Amount Recognized for Wilmington Trust | | $ | - | | | $ | - | |
Amount of Wilmington Trust Waived | | $ | - | | | $ | - | |
Note 3– Summary of Significant Accounting Policies
Basis of Presentation
The accompanying financial statements have been prepared in accordance with accounting principles generally accepted in the United States of America (“U.S. GAAP”) as detailed in the Financial Accounting Standards Board’s Accounting Standards Codification.
Revenue Recognition
Investment transactions are accounted for on a trade-date basis. All such transactions are recorded on the identified cost basis and marked to market daily. Unrealized appreciation or depreciation on investments are reflected in the statements of operations as the difference between the original amount and the fair market value as of the last business day of the year or as of the last date of the financial statements. Changes in the appreciation or depreciation between periods are reflected in the statements of operations. Interest on cash equivalents with financial institutions are recognized on the accrual basis. The Funds earn interest on funds held at the custodian and other financial institutions at prevailing market rates for such investments.
Brokerage Commissions
BrokerageThe Sponsor recognizes the expense for brokerage commissions are accrued on the trade date andfor futures contract trades on a full-turnper-trade basis.
Income Taxes
TheFor federal income tax purposes, the Fund will be treated as a publicly traded partnership. A publicly traded partnership is generally treated as a corporation for federal income tax purposes unless 90% or more of the publicly traded partnership’s gross income for each taxable year of its existence consists of qualifying income as defined in section 7704(d) of the Internal Revenue Code of 1986, as amended. Qualifying income is defined as generally including, in pertinent part, interest (other than from a financial business), dividends, and gains from the sale or disposition of capital assets held for the production of interest or dividends. In the case of a partnership of which a principal activity is the buying and selling of commodities, other than as inventory, or of futures, forwards and options with respect to commodities, qualifying income also includes income and gains from commodities and from futures, forwards, options with respect to commodities and, provided the partnership is a trader or investor with respect to such assets, swaps and other notional principal contracts with respect to commodities. The Fund expects that at least 90% of the Fund’s gross income for each taxable year will consist of qualifying income and that the Fund will be taxed as a partnership for United States federal income tax purposes. The Fund does not record a provision for income taxes because the shareholders report their share of the Fund’s income or loss on their income tax returns. The financial statements reflect the Fund’s transactions without adjustment, if any, required for income tax purposes.
The Fund is required to determine whether a tax position is more likely than not to be sustained upon examination by the applicable taxing authority, including resolution of any related appeals or litigation processes, based on the technical merits of the position. The Fund files an income tax return in the U.S. federal jurisdiction and may file income tax returns in various U.S. states and foreign jurisdictions. For all tax years 20142021 to 2016,December 31, 2023, the Fund remains subject to income tax examinations by major taxing authorities. The tax benefit recognized is measured as the largest amount of benefit that has a greater than fifty percent likelihood of being realized upon ultimate settlement. De-recognition of a tax benefit previously recognized results in the Fund recording a tax liability that reduces net assets. This policy has been applied to all existing tax positions upon the Fund’s initial adoption. Based on its analysis, the Fund has determined that it has not incurred any liability for unrecognized tax benefits as of September 30, 2017March 31, 2024 and for the years ended December 31, 2016, 20152023, 2022 and 2014.2021. However, the Fund’s conclusions regarding this policy may be subject to review and adjustment at a later date based on factors including, but not limited to, ongoing analysis of and changes to tax laws, regulations, and interpretations thereof.
The Fund recognizes interest accrued related to unrecognized tax benefits and penalties related to unrecognized tax benefits in income tax fees payable, if assessed. No interest expense or penalties have been recognized as of and for the three and nine months ended September 30, 2017 March 31, 2024 and 2016.2023.
The Fund may be subject to potential examination by U.S. federal, U.S. state, or foreign jurisdictional authorities in the area of income taxes. These potential examinations may include questioning the timing and amount of deductions, the nexus of income among various tax jurisdictions, and compliance with U.S. federal, U.S. state and foreign tax laws. The Fund’s management does not expect that the total amount of unrecognized tax benefits will materially change over the next twelve months.
Creations and Redemptions
Effective August 28, 2018, the Sponsor filed a prospectus supplement updating the Creation and Redemption Basket size to 12,500 shares. Prior to this prospectus supplement, the basket size for Creations and Redemptions was 25,000 shares.
Authorized Purchasers may purchase Creation Baskets consisting of 25,00012,500 shares from the Fund. The amount of the proceeds required to purchase a Creation Basket will be equal to the NAV of the shares in the Creation Basket determined as of 4:00 p.m. New York time(ET) on the day the order to create the basket is properly received.received in good order.
Authorized Purchasers may redeem shares from the Fund only in blocks of 25,00012,500 shares called “Redemption Baskets.” The amount of the redemption proceeds for a Redemption Basket will be equal to the NAV of the shares in the Redemption Basket determined as of 4:00 p.m. New York time(ET) on the day the order to redeem the basket is properly received.received in good order.
The Fund will receive the proceeds from shares sold or will pay for redeemed shares within three business days after the trade date of the purchase or redemption, respectively. The amounts due from Authorized Purchasers will be reflected in the Fund’s statements of assets and liabilities as receivable forcapital shares sold.receivable. Amounts payable to Authorized Purchasers upon redemption will be reflected in the Fund’s statements of assets and liabilities as payable for shares redeemed.
As outlined in the most recent Form S-1S-1 filing, 50,000 shares represents tworepresent four Redemption Baskets for the Fund and a minimum level of shares. If the Fund experienced redemptions that caused the number of Shares outstanding to decrease to the minimum level of Shares required to be outstanding, until the minimum number of Shares is again exceeded through the purchase of a new Creation Basket, there can be no more redemptions by an Authorized Purchaser. The Fund, currently, is at this minimum number of shares outstanding and no redemptions can be made until additional shares are created.
Allocation of Shareholder Income and Losses
Profit or loss is allocated among the shareholders of the Fund in proportion to the number of shares each shareholder holds as of the close of each month.
Cash Equivalents
Cash equivalents are highly-liquidhighly liquid investments with maturity dates of 90 days or less when acquired. The Fund reported its cash equivalents in the statements of assets and liabilities at market value, or at carrying amounts that approximate fair value, because of their highly-liquidhighly liquid nature and short-termshort term maturities. The Fund has these balances of its assets on deposit with banks. Assets deposited with a financial institution may, at times, exceed federally insured limits. TAGS had a balance of $967$9,701 and $2,360$11,208 in money market funds at September 30, 2017March 31, 2024 and December 31, 2016,2023, respectively; these balances are included in cash equivalents on the statements of assets and liabilities.
Payable/Receivable for Securities Purchased/Sold
Due from/to broker for investments in securities are securities transactions pending settlement. The Fund is subject to credit risk to the extent any broker with whom it conducts business is unable to fulfill contractual obligations on its behalf. The management of the FundsFund monitors the financial condition of such brokers and does not anticipate any losses from these counterparties.
Calculation of Net Asset Value
The Fund’s NAV is calculated by:
● | • | Taking the current market value of its total assets and |
| | |
●• | Subtracting any liabilities. |
The administrator, USBFS,Global Fund Services, will calculate the NAV of the Fund once each trading day. It will calculate the NAV as of the earlier of the close of the New York Stock Exchange or 4:00 p.m. New York time.(ET). The NAV for a particular trading day will be released after 4:15 p.m. New York time.(ET).
For purposes of the determining the Fund’s NAV, the Fund’s investments in the Underlying Funds will be valued based on the Underlying Funds’ NAVs. In turn, in determining the value of the Futures Contracts held by the Underlying Funds, the Administrator will use the closing price on the exchange on which they are traded. The Administrator will determine the value of all other FundFunds and Underlying Fund investments as of the earlier of the close of the New York Stock Exchange or 4:00 p.m. New York time,(ET), in accordance with the current Services Agreement between the Administrator and the Trust. The value of over-the-counter Commodity Interests will be determined based on the value of the commodity or Futures Contract underlying such Commodity Interest, except that a fair value may be determined if the Sponsor believes that the Underlying Fund is subject to significant credit risk relating to the counterparty to such Commodity Interest. For purposes of financial statements and reports, the Sponsor will recalculate the NAV of an Underlying Fund where necessary to reflect the “fair value” of a Futures Contract held by an Underlying Fund when a Futures Contract held by anthe Underlying Fund closes at its price fluctuation limit for the day. Short term Treasury Securities held by the Fund or Underlying Funds will be valued by the Administrator using values received from recognized third-partythird-party vendors (such as Reuters) and dealer quotes. NAV will include any unrealized profit or loss on open Commodity Interests and any other credit or debit accruing to the Fund but unpaid or not received by the Fund.
Sponsor Fee Allocation of Expenses and Related Party Transactions
The Sponsor is responsible for investing the assets of the Fund pays no direct management feesin accordance with the objectives and policies of the Fund. In addition, the Sponsor arranges for one or more third parties to provide administrative, custodial, accounting, transfer agency and other necessary services to the Sponsor.Trust and the Funds. In addition, the Sponsor elected not to outsource services directly attributable to the Trust and the Funds such as accounting, financial reporting, regulatory compliance, and trading activities. The Underlying Funds are contractually obligated to paySponsor does not receive a monthly management fee tofrom the Fund. The Sponsor based onreceives a management fee from each Underlying Fund at the annual rate of 1.00% of such Underlying Fund’s average daily net assets, payable monthly. The Sponsor can elect to waive the payment of this fee for any Underlying Fund in any amount at a rate equalits sole discretion, at any time and from time to 1.00% per annum; these fees are recognizedtime, in order to reduce the statements contained in this Form 10-QFund’s expenses or for eachany other purpose.
The Fund generally pays for all brokerage fees, taxes, and other expenses, including licensing fees for the use of intellectual property, registration or other fees paid to the SEC, FINRA, formerly the National Association of Securities Dealers, or any other regulatory agency in connection with the offer and sale of subsequent Shares after its initial registration and all legal, accounting, printing and other expenses associated therewith. The Fund also pays its portion of the fees and expenses for services directly attributable toassociated with the Fund such asTrust’s tax accounting financialand reporting regulatory compliance and trading activities, which the Sponsor elected not to outsource. The Sponsor may, at its discretion waive the payment by the Fund of certain expenses. This election is subject to change by the Sponsor, at its discretion.requirements. Certain aggregate expenses common to all Funds within the Trust are allocated by the Sponsor to the respective fundsFunds based on activity drivers deemed most appropriate by the Sponsor for such expenses, including but not limited to relative assets under management and creation and redeem order activity.
These aggregate common expenses include, but are not limited to, legal, auditing, accounting and financial reporting, tax-preparation, regulatory compliance, trading activities, and insurance costs, as well as fees paid to the Distributor, which are included in the related line item in the statements of operations. A portion of these aggregate common expenses are related to the Sponsor or related parties of principals of the Sponsor; these are necessary services to the Funds, which are primarily the cost of performing accounting and financial reporting, regulatory compliance, and trading activities that are directly attributable to the Fund. The Sponsor has the ability to elect to pay certainSuch expenses on behalf of the Fund. This election is subject to change by the Sponsor, at its discretion. For the three months ended September 30, 2017 and 2016 such expenses, which are primarily recorded as distribution and marketing fees on the statementstatements of operations, totaled $2,479 in 2017 and $2,901 in 2016; of these amounts $1,328 in 2017 and $2,901 in 2016 were waived by the Sponsor. For the nine months ended September 30, 2017 and 2016 such expenses totaled $10,184 in 2017 and $11,416 in 2016; of these amounts $7,456 in 2017 and $9,888 in 2016 were waived by the Sponsor.operations. All asset-based fees and expenses for the Funds are calculated on the prior day’s net assets.
| | | Three months ended March 31, 2024 | | | Three months ended March 31, 2023 | |
Recognized Related Party Transactions | | $ | 25,585 | | | $ | 34,473 | |
Waived Related Party Transactions | | $ | 25,585 | | | $ | 23,865 | |
The Sponsor canhas the ability to elect to adjustpay certain expenses on behalf of the daily expense accrualsFunds or waive the management fee. This election is subject to change by the Sponsor, at its discretion.
For Expenses paid by the threeSponsor and nine months ended September 30, 2017, there were $5,987 and $33,159, respectively, ofManagement fees waived by the Sponsor are, if applicable, presented as waived expenses that were identified onin the statements of operations of the Fund as expenses that were waived by the Sponsor.for each Fund. The Sponsor has determined that there wouldwill be no recovery sought for thesethe amounts below in any future period.period:
For the three and nine months ended September 30, 2017 and 2016, there were $9,893 and $35,063, respectively, of expenses that were identified on the statements of operations of the Fund as expenses that were waived by the Sponsor. The Sponsor has determined that there would be no recovery sought for these amounts in any future period.
As of August 21, 2017, Mr. Miller no longer retains an ownership interest in the Sponsor which is equal to or greater than 10%, and, thus, is no longer a principal of the Sponsor as defined by the rules of the Commodity Futures Trading Commission.
| | | TAGS | |
Three months ended March 31, 2024 | | $ | 69,538 | |
Three months ended March 31, 2023 | | $ | 125,494 | |
Expenses
Expenses are recorded using the accrual method of accounting.
Use of Estimates
The preparation of financial statements in conformity with accounting principles generally accepted in the United States of America requires management to make estimates and assumptions that affect the reported amount of assets and liabilities and disclosure of contingent assets and liabilities at the date of the financial statements, and the reported amounts of the revenue and expenses during the reporting period. Actual results could differ from those estimates.
New Accounting Pronouncements
The Financial Accounting Standards Board (“FASB”) issued Accounting Standards Update (“ASU”) issued ASU 2023-06 – Disclosure Improvements: Codification Amendments in Response to the SEC’s Disclosure Update and Simplification Initiative. The amendments require an entity to disclose its accounting policy for where cash flows associated with derivative instruments and their related gains and losses are presented. The Trust and Fund already discloses the accounting policy related to the derivative gains and losses presented on the cash flow statement. The amendment was adopted early for the period ended December 31, 2023. There is no impact to the financial statements of the Trust or the Fund.
The FASB issued ASU 2023-01, related to Leases – (Topic 842). The response to concerns about applying Topic 842 to related party arrangements between entities under common control. The update was adopted early for the quarter ended March 31, 2023; the adoption did not have a material impact on the financial statements and disclosures of the Trust or the Fund.
Fair Value - Definition and Hierarchy
In accordance with GAAP, fair value is defined as the price that would be received to sell an asset or paid to transfer a liability (i.e., the “exit price”) in an orderly transaction between market participants at the measurement date.
In determining fair value, the Fund uses various valuation approaches. In accordance with GAAP, a fair value hierarchy for inputs is used in measuring fair value that maximizes the use of observable inputs and minimizes the use of unobservable inputs by requiring that the most observable inputs be used when available. Observable inputs are those that market participants would use in pricing the asset or liability based on market data obtained from sources independent of the Fund. Unobservable inputs reflect the Fund’s assumptions about the inputs market participants would use in pricing the asset or liability developed based on the best information available in the circumstances. The fair value hierarchy is categorized into three levels based on the inputs as follows:
Level 1 - Valuations based on unadjusted quoted prices in active markets for identical assets or liabilities that the Fund has the ability to access. Valuation adjustments and block discounts are not applied to Level 1 financial instruments of the Underlying Funds and securities of the Fund, together the “financial instruments”. Since valuations are based on quoted prices that are readily and regularly available in an active market, valuation of these financial instruments does not entail a significant degree of judgment.
Level 2 - Valuations based on quoted prices in markets that are not active or for which all significant inputs are observable, either directly or indirectly.
Level 3 - Valuations based on inputs that are unobservable and significant to the overall fair value measurement.
The availability of valuation techniques and observable inputs can vary from financial instrument to financial instrument and is affected by a wide variety of factors including, the type of financial instrument, whether the financial instrument is new and not yet established in the marketplace, and other characteristics particular to the transaction. To the extent that valuation is based on models or inputs that are less observable or unobservable in the market, the determination of fair value requires more judgment. Those estimated values do not necessarily represent the amounts that may be ultimately realized due to the occurrence of future circumstances that cannot be reasonably determined. Because of the inherent uncertainty of valuation, those estimated values may be materially higher or lower than the values that would have been used had a ready market for the financial instruments existed. Accordingly, the degree of judgment exercised by the Fund in determining fair value is greatest for financial instruments categorized in Level 3. In certain cases, the inputs used to measure fair value may fall into different levels of the fair value hierarchy. In such cases, for disclosure purposes, the level in the fair value hierarchy, within which the fair value measurement in its entirety falls, is determined based on the lowest level input that is significant to the fair value measurement.
On March 31, 2024 and December 31, 2023, the reported value at the close of the market for each commodity futures contract of the Underlying Funds fairly reflected the value of the futures and no alternative valuations were required.
Net Income (Loss) per Share
Net income (loss) per share is the difference between the NAV per unit at the beginning of each period and at the end of each period. The weighted average number of units outstanding was computed for purposes of disclosing net income (loss) per weighted average unit. The weighted average units are equal to the number of units outstanding at the end of the period, adjusted proportionately for units created or redeemed based on the amount of time the units were outstanding during such period.
Note 4– Fair Value Measurements
The Fund’s assets and liabilities recorded at fair value have been categorized based upon a fair value hierarchy as described in the Fund’s significant accounting policies in Note 3. The following table presents information about the Fund’s assets and liabilities measured at fair value as of March 31, 2024 and December 31, 2023:
March 31, 2024
| | | | | | | | | | | | | | | Balance as of | |
Assets: | | Level 1 | | | Level 2 | | | Level 3 | | | March 31, 2024 | |
Exchange Traded Funds | | $ | 14,515,416 | | | $ | - | | | $ | - | | | $ | 14,515,416 | |
Cash Equivalents | | | 9,701 | | | | - | | | | - | | | | 9,701 | |
Total | | $ | 14,525,117 | | | $ | - | | | $ | - | | | $ | 14,525,117 | |
December 31, 2023
| | | | | | | | | | | | | | | Balance as of | |
Assets: | | Level 1 | | | Level 2 | | | Level 3 | | | December 31, 2023 | |
Exchange Traded Funds | | $ | 18,401,900 | | | $ | - | | | $ | - | | | $ | 18,401,900 | |
Cash Equivalents | | | 11,208 | | | | - | | | | - | | | | 11,208 | |
Total | | $ | 18,413,108 | | | $ | - | | | $ | - | | | $ | 18,413,108 | |
For the three months ended March 31, 2024 and year ended December 31, 2023, the Fund did not have any significant transfers between any of the levels of the fair value hierarchy.
See the Fair Value - Definition and Hierarchy section in Note 3 above for an explanation of the transfers into and out of each level of the fair value hierarchy.
Note 5– Financial Highlights
The following table presents per unit performance data and other supplemental financial data for the three months ended March 31, 2024 and 2023. This information has been derived from information presented in the financial statements and is presented with total expenses gross of expenses waived by the Sponsor and with total expenses net of expenses waived by the Sponsor, as appropriate.
| | | Three months ended | | | Three months ended | |
| | | March 31, 2024 | | | March 31, 2023 | |
Per Share Operation Performance | | | | | | | | |
Net asset value at beginning of period | | $ | 29.45 | | | $ | 31.35 | |
Income (loss) from investment operations: | | | | | | | | |
Net realized and unrealized loss on investment transactions | | | (1.09 | ) | | | (0.29 | ) |
Total expenses, net | | | (0.01 | ) | | | (0.01 | ) |
Net decrease in net asset value | | | (1.10 | ) | | | (0.30 | ) |
Net asset value at end of period | | $ | 28.35 | | | $ | 31.05 | |
Total Return | | | -3.77 | % | | | -0.96 | % |
Ratios to Average Net Assets (Annualized) | | | | | | | | |
Total expenses | | | 1.76 | % | | | 1.49 | % |
Total expenses, net | | | 0.09 | % | | | 0.09 | % |
Net investment loss | | | -0.09 | % | | | -0.09 | % |
The financial highlights per share data are calculated consistent with the methodology used to calculate asset-based fees and expenses.
Note 6– Organizational and Offering Costs
Expenses incurred in organizing of the Trust and the initial offering of the Shares of the Fund, including applicable SEC registration fees, were borne directly by the Sponsor. The Fund will not be obligated to reimburse the Sponsor.
Note 7– Subsequent Events
Management has evaluated the financial statements for the quarter-ended March 31, 2024 for subsequent events through the date of this filing and noted no material events requiring either recognition through the date of the filing or disclosure herein for the Fund.
HASHDEX BITCOIN FUTURES ETF
STATEMENTS OF ASSETS AND LIABILITIES
| | March 31, 2024** | | | December 31, 2023 | |
| | (Unaudited) | | | | | |
Assets | | | | | | | | |
Cash and cash equivalents | | $ | - | | | $ | 1,867,663 | |
Interest receivable | | | - | | | | 10,297 | |
Equity in trading accounts: | | | | | | | | |
Cryptocurrency futures contracts | | | - | | | | 129,519 | |
Due from broker | | | - | | | | 582,908 | |
Total equity in trading accounts | | | - | | | | 712,427 | |
Total assets | | | - | | | | 2,590,387 | |
| | | | | | | | |
Liabilities | | | | | | | | |
Management fee payable to Sponsor | | | - | | | | 2,053 | |
Equity in trading accounts: | | | | | | | | |
Cryptocurrency futures contracts | | | - | | | | 51,376 | |
Total liabilities | | | - | | | | 53,429 | |
| | | | | | | | |
Net assets | | $ | - | | | $ | 2,536,958 | |
| | | | | | | | |
Shares outstanding | | | - | | | | 50,000 | |
| | | | | | | | |
Shares authorized | | | * | | | | * | |
| | | | | | | | |
Net asset value per share | | $ | - | | | $ | 50.74 | |
| | | | | | | | |
Market value per share | | $ | - | | | $ | 50.73 | |
* On September 14, 2022, the Hashdex Bitcoin Futures ETF registered an indeterminate number of shares of the Fund pursuant to Rule 456(d) under the Securities Act of 1933.
**On January 3, 2024, the scheduled merger of the Hashdex Bitcoin Futures ETF (the “Acquired Fund”), a series of the Teucrium Commodity Trust into the Hashdex Bitcoin Futures ETF (the “Acquiring Fund”), a series of Tidal Commodities Trust I, became effective and therefore, no assets and liabilities remained after the effective date.
The accompanying notes are an integral part of these financial statements.
HASHDEX BITCOIN FUTURES ETF
SCHEDULE OF INVESTMENTS
March 31, 2024
(Unaudited)*
*On January 3, 2024, the scheduled merger of the Hashdex Bitcoin Futures ETF (the "Acquired Fund"), a series of the Teucrium Commodity Trust into the Hashdex Bitcoin Futures ETF (the "Acquiring Fund") a series of Tidal Commodities Trust I, became effective, and therefore, no assets and liabilities remained after the effective date.
The accompanying notes are an integral part of these financial statements.
HASHDEX BITCOIN FUTURES ETF
SCHEDULE OF INVESTMENTS
December 31, 2023
| | | | | | | | | | | | | | | Percentage of | | | | | |
Description: Assets | | Yield | | | Cost | | | Fair Value | | | Net Assets | | | Shares | |
| | | | | | | | | | | | | | | | | | | | | |
Cash equivalents | | | | | | | | | | | | | | | | | | | | |
Money market funds | | | | | | | | | | | | | | | | | | | | |
U.S. Bank Deposit Account | | | 5.270 | % | | $ | 1,867,663 | | | $ | 1,867,663 | | | | 73.62 | % | | | 1,867,663 | |
| | | Number of | | | | | | | Percentage of | | | Notional Amount | |
| | | Contracts | | | Fair Value | | | Net Assets | | | (Long Exposure) | |
Cryptocurrency futures contracts | | | | | | | | | | | | | | | | |
United States CME Bitcoin futures contracts | | | | | | | | | | | | | | | | |
CME Bitcoin futures JAN24 | | | 6 | | | $ | 129,519 | | | | 5.11 | % | | $ | 1,274,550 | |
| | | Number of | | | | | | | Percentage of | | | Notional Amount | |
Description: Liabilities | | Contracts | | | Fair Value | | | Net Assets | | | (Long Exposure) | |
| | | | | | | | | | | | | | | | | |
Cryptocurrency futures contracts | | | | | | | | | | | | | | | | |
United States CME Bitcoin futures contracts | | | | | | | | | | | | | | | | |
CME Bitcoin futures FEB24 | | | 6 | | | | 51,376 | | | | 2.03 | | | | 1,288,500 | |
HASHDEX BITCOIN FUTURES ETF
STATEMENTS OF OPERATIONS
(Unaudited)
| | | Three months ended | | | Three months ended | |
| | | March 31, 2024* | | | March 31, 2023 | |
Income | | | | | | | | |
Realized and unrealized gain (loss) on trading of cryptocurrency futures contracts: | | | | | | | | |
Realized (loss) gain on cryptocurrency futures contracts | | $ | (78,143 | ) | | $ | 629,551 | |
Net change in unrealized appreciation on cryptocurrency futures contracts | | | 114,383 | | | | 128,468 | |
Interest income | | | 1,073 | | | | 13,448 | |
Total income | | | 37,313 | | | | 771,467 | |
| | | | | | | | | |
Expenses | | | | | | | | |
Management fees | | | 200 | | | | 3,395 | |
Professional fees | | | 48,489 | | | | 58,820 | |
Distribution and marketing fees | | | 826 | | | | 1,362 | |
Custodian fees and expenses | | | 1,919 | | | | 259 | |
Business permits and licenses fees | | | 11,075 | | | | 10,129 | |
Total expenses | | | 62,509 | | | | 73,965 | |
| | | | | | | | | |
Expenses waived by the Sponsor | | | (62,309 | ) | | | (70,570 | ) |
| | | | | | | | | |
Total expenses, net | | | 200 | | | | 3,395 | |
| | | | | | | | | |
Net income | | $ | 37,113 | | | $ | 768,072 | |
| | | | | | | | | |
Net gain per share | | $ | 0.74 | | | $ | 15.36 | |
Net gain per weighted average share | | $ | 0.74 | | | $ | 15.36 | |
Weighted average shares outstanding | | | 50,000 | | | | 50,004 | |
*On January 3, 2024, the scheduled merger of the Hashdex Bitcoin Futures ETF (the "Acquired Fund"), a series of the Teucrium Commodity Trust into the Hashdex Bitcoin Futures ETF (the "Acquiring Fund") a series of Tidal Commodities Trust I, became effective, and therefore, the operations presented here reflect the Aqcuired Fund's operations from January 1, 2024 to January 3, 2024 only.
The accompanying notes are an integral part of these financial statements.
HASHDEX BITCOIN FUTURES ETF
STATEMENTS OF CHANGES IN NET ASSETS
(Unaudited)*
| | | Three months ended | | | Three months ended | |
| | | March 31, 2024 | | | March 31, 2023 | |
Operations | | | | | | | | |
Net income | | $ | 37,113 | | | $ | 768,072 | |
Capital transactions | | | | | | | | |
Distribution of Net Assets to Acquiring Fund | | | (2,574,071 | ) | | | - | |
Issuance of Shares | | | - | | | | 367,689 | |
Redemption of Shares | | | - | | | | - | |
Total capital transactions | | | (2,574,071 | ) | | | 367,689 | |
Net change in net assets | | | (2,536,958 | ) | | | 1,135,761 | |
| | | | | | | | | |
Net assets, beginning of period | | $ | 2,536,958 | | | $ | 1,070,263 | |
| | | | | | | | | |
Net assets, end of period | | $ | - | | | $ | 2,206,024 | |
| | | | | | | | | |
Net asset value per share at beginning of period | | $ | 50.74 | | | $ | 21.40 | |
| | | | | | | | | |
Net asset value per share at end of period | | $ | - | | | $ | 36.76 | |
| | | | | | | | | |
Creation of Shares | | | - | | | | 10,000 | |
Redemption of Shares | | | - | | | | - | |
* The Hashdex Bitcoin Futures ETF was merged into the Tidal Commodities Trust I as described in Note 1 to these financials.
The accompanying notes are an integral part of these financial statements.
HASHDEX BITCOIN FUTURES ETF
STATEMENTS OF CASH FLOWS*
(Unaudited)
| | | Three months ended | | | Three months ended | |
| | | March 31, 2024 | | | March 31, 2023 | |
Cash flows from operating activities: | | | | | | | | |
Net income | | $ | 37,113 | | | $ | 768,072 | |
Adjustments to reconcile net income to net cash (used in) provided by operating activities: | | | | | | | | |
Net change in unrealized appreciation on cryptocurrency futures contracts | | | (114,383 | ) | | | (128,468 | ) |
Changes in operating assets and liabilities: | | | | | | | | |
Due from broker | | | 582,908 | | | | (109,824 | ) |
Interest receivable | | | 10,297 | | | | (2,124 | ) |
Management fee payable to Sponsor | | | (2,053 | ) | | | 408 | |
Net cash (used in) provided by operating activities | | | 513,882 | | | | 528,064 | |
| | | | | | | | | |
Cash flows from financing activities: | | | | | | | | |
Distribution to Acquiring Fund upon consummation of merger and liquidation agreement - see Note 1 to the finanical statements | | | (2,381,545 | ) | | | - | |
Proceeds from sale of Shares | | | - | | | | - | |
Redemption of Shares | | | - | | | | - | |
Net cash provided by financing activities | | | (2,381,545 | ) | | | - | |
| | | | | | | | | |
Net change in cash and cash equivalents | | | (1,867,663 | ) | | | 528,064 | |
Cash and cash equivalents beginning of period | | | 1,867,663 | | | | 701,969 | |
Cash and cash equivalents end of period | | $ | - | | | $ | 1,230,033 | |
* The Hashdex Bitcoin Futures ETF was transferred into the Tidal Commodities Trust I as described in Note 1 to these financials.
The accompanying notes are an integral part of these financial statements.
NOTES TO FINANCIAL STATEMENTS
March 31, 2024
(Unaudited)
Note 1– Organization and Operation
Please note that as discussed further below, as of January 3, 2024, the Hashdex Bitcoin Futures ETF (the "Fund") was merged into an unaffiliated fund. The merger closed on January 3, 2024 and caused the Fund's shares to be canceled and the Fund to be liquidated. Accordingly, unless otherwise specifically noted, the information in the following notes to the Fund's financial statements are as of January 3, 2024. Hashdex Bitcoin Futures ETF (the “Fund”) is a series of Teucrium Commodity Trust (“Trust”), a Delaware statutory trust organized on September 11, 2009. The Fund operates pursuant to the Fifth Amended and Restated Declaration of Trust and Trust Agreement ("Trust Agreement"), dated April 26, 2019. The Trust Agreement may be found on the SEC’s EDGAR filing database at https://www.sec.gov/Archives/edgar/data/1471824/000165495419004865/ex31.htm. The Fund was formed and is managed and controlled by the Sponsor, a limited liability company formed in Delaware on July 28, 2009. The Sponsor is registered as a commodity pool operator (“CPO”) and a commodity trading adviser (“CTA”) with the Commodity Futures Trading Commission (“CFTC”) and is a member of the National Futures Association (“NFA”). The Fund intends to be treated as a partnership for U.S. federal income tax purposes.
On September 14, 2022, the Fund’s initial registration of an indeterminate number of shares on Form S-1 was declared effective by the SEC. On September 16, 2022, the Fund listed it’s shares on the NYSE Arca under the ticker symbol “DEFI”. On the business day prior to that, the Fund issued 50,000 shares in exchange for $1,250,000 at the Fund’s initial NAV of $25 per share.
The Fund’s investment objective is for changes in the Shares’ NAV to reflect the daily changes of the price of a specified benchmark (the “Benchmark”), less expenses from the Fund’s operations. The Benchmark currently is the average of the closing settlement prices for the first to expire and second to expire bitcoin futures contracts (“Bitcoin Futures Contracts”) listed on the CME. These futures contracts are the Benchmark Component Futures Contracts. The CME currently offers two Bitcoin Futures Contracts, one contract representing 5 bitcoin (“BTC Contracts”) and another contract representing 0.10 bitcoin (“MBT Contracts”). The Fund will invest in BTC Contracts and MBT Contracts to the extent necessary to achieve maximum exposure to the bitcoin futures market.
As reported by the registrant on a Form 8-K filed with the Securities and Exchange Commission on November 7, 2023 (File No.001-34765), Teucrium Commodity Trust (the “Teucrium Trust”), on behalf of its series, Hashdex Bitcoin Futures ETF (“Acquired Fund”), and Tidal Commodities Trust I (“Acquiring Trust”), on behalf of its series, Hashdex Bitcoin Futures ETF (“Acquiring Fund”), entered into an Agreement and Plan of Partnership Merger and Liquidation dated as of October 30, 2023 (the “Plan of Merger”). The Merger closed on January 3, 2024 (the “Closing Date”).
Pursuant to the Plan of Merger, each Acquired Fund shareholder received one share of the Acquiring Fund for every one share of the Acquired Fund held on the Closing Date based on the net asset value per share of the Acquiring Fund being equal to the net asset value per share of the Acquired Fund determined immediately prior to the Merger closing. Upon the Merger closing, the Acquiring Fund acquired all the assets of the Acquired Fund and assumed all the liabilities of the Acquired Fund and this balance is recognized in the financial statements as the net assets transferred to Acquiring Fund via distribution. Upon the Merger closing, the Plan of Merger caused all of the Acquired Fund’s shares to be cancelled and the Acquired Fund to be liquidated. Accordingly, the results of operations and Fund share activity reflected in the financial statements is only for the period from January 1, 2024 through January 3, 2024. Subsequently, as a result of the Merger, the Fund was de-recognized from the Trust.
The sponsor of the Teucrium Trust, Teucrium Trading, LLC (“Teucrium”), is not receiving any compensation dependent on the consummation of the Merger. Pursuant to a certain Amended and Restated ‘33 Act Fund Platform Support Agreement, as amended (the “Support Agreement”) among Tidal Investments LLC (f/k/a Toroso Investments, LLC) (“Tidal”), Tidal ETF Services, LLC, Hashdex Asset Management Ltd., and Teucrium, Tidal has agreed to provide Teucrium after the Merger with a monthly amount equal to the greater of seven percent (7%) of the management fee paid to Tidal from the Acquiring Fund and 0.04% of monthly average net assets of the Acquiring Fund (“Teucrium Compensation”). Any payment of the Teucrium Compensation will be made from the resources of Tidal and not from the assets of the Acquiring Fund.
DEFI Benchmark
CME Bitcoin Futures Contracts | | Weighting | |
First to expire | | | 50 | % |
Second to expire | | | 50 | % |
The accompanying unaudited financial statements have been prepared in accordance with Rule 10-01 of Regulation S-X promulgated by the SEC and, therefore, do not include all information and footnote disclosures required under accounting principles generally accepted in the United States of America (“GAAP”). The financial information included herein is unaudited; however, such financial information reflects all adjustments which are, in the opinion of management, necessary for the fair presentation of the Fund’s financial statements for the interim period. It is suggested that these interim financial statements be read in conjunction with the financial statements and related notes included in the Trust’s Annual Report on Form 10-K, as well as the most recent Form S-1 filing, as applicable. The operating results for the three months ended March 31, 2024 are not necessarily indicative of the results to be expected from the full year ended December 31, 2024.
Subject to the terms of the Trust Agreement, Teucrium Trading, LLC, in its capacity as the Sponsor (“Sponsor”), may terminate a Fund at any time, regardless of whether the Fund has incurred losses, including, for instance, if it determines that the Fund’s aggregate net assets in relation to its operating expenses make the continued operation of the Fund unreasonable or imprudent. However, no level of losses will require the Sponsor to terminate a Fund.
Note 2– Principal Contracts and Agreements
The Sponsor employs U.S. Bancorp Fund Services, LLC, doing business as U.S. Bank Global Fund Services (“Global Fund Services”), for Transfer Agency, Fund Accounting and Fund Administration services. The principal address for Global Fund Services is 615 E. Michigan Street, Milwaukee, WI 53202.
For custody services, the Funds will pay to U.S. Bank N.A. 0.0075% of average gross assets up to $1 billion, and .0050% of average gross assets over $1 billion, annually, plus certain per-transaction charges. For Transfer Agency, Fund Accounting and Fund Administration services, which are based on the total assets for all the Funds in the Trust, the Funds will pay to Global Fund Services 0.05% of average gross assets on the first$500 million, 0.04% on the next $500 million, 0.03% on the next $2 billion and 0.02% on the balance over $3 billion annually. A combined minimum annual fee of up to $47,000 for custody, transfer agency, accounting and administrative services is assessed per Fund. These services are recorded as custodian fees and expenses on the statements of operations. A summary of these expenses is included below.
The Sponsor employs Foreside Fund Services, LLC (“Foreside” or the “Distributor”) as the Distributor for the Funds. The Distribution Services Agreement among the Distributor and the Sponsor calls for the Distributor to work with the Custodian in connection with the receipt and processing of orders for Creation Baskets and Redemption Baskets and the review and approval of all Fund sales literature and advertising materials. For its services as the Distributor, Foreside receives a fee of 0.01% of each Fund’s average daily net assets and an aggregate annual fee of $100,000 for all Funds, along with certain expense reimbursements. These services are recorded as distribution and marketing fees on the statements of operations. A summary of these expenses is included below. Pursuant to a Consulting Services Agreement, Foreside Consulting Services, LLC, performs certain consulting support services for the Trust’s Sponsor.
StoneX Financial Inc. (“StoneX”) and Phillip Capital Inc. (“Phillip Capital”) serve as the Fund’s clearing brokers to execute futures contracts and provide other brokerage-related services. StoneX and Phillip Capital are each registered as futures commission merchants (“FCM”) with the U.S. CFTC and are members of the NFA. The clearing brokers are registered as broker-dealers with the SEC and are each a member of FINRA. StoneX and Phillip Capital are each clearing members of ICE Futures U.S., Inc., Chicago Board of Trade, Chicago Mercantile Exchange, New York Mercantile Exchange, and all other major United States commodity exchanges. StoneX is paid 10.00 - $25.00 per half-turn exclusive of pass through fees for the exchange, and the NFA. Additionally, if the monthly commissions paid by each Fund does not equal or exceed 16.5% return on the StoneX Capital Requirement at 9.6% of the Exchange Maintenance Margin, each Fund will pay a true up to meet that return at the end of each month. Phillip Capital is paid $35.00 - $45.00 per half-turn exclusive of pass through fees for the exchange, the NFA, execution fees and platform and exchange data fees. A summary of these expenses is included below.
The sole Trustee of the Trust is Wilmington Trust Company, a Delaware banking corporation. The Trustee will accept service of legal process on the Trust in the State of Delaware and will make certain filings under the Delaware Statutory Trust Act. For its services, the Trustee receives an annual fee of $3,300 from the Trust. These services are recorded in business permits and licenses fees on the statements of operations. A summary of these expenses is included below.
| | | Three months ended March 31, 2024 | | | Three months ended March 31, 2023 | |
Amount Recognized for Custody Services | | $ | - | | | $ | 259 | |
Amount of Custody Services Waived | | $ | - | | | $ | 259 | |
| | | | | | | | | |
Amount Recognized for Distribution Services | | $ | - | | | $ | 60 | |
Amount of Distribution Services Waived | | $ | - | | | $ | 60 | |
| | | | | | | | | |
Amount Recognized for Wilmington Trust | | $ | - | | | $ | - | |
Amount of Wilmington Trust Waived | | $ | - | | | $ | - | |
Note 3– Summary of Significant Accounting Policies
Basis of Presentation
The accompanying financial statements have been prepared in accordance with accounting principles generally accepted in the United States of America (“U.S. GAAP”) as detailed in the Financial Accounting Standards Board’s Accounting Standards Codification.
Revenue Recognition
Investment transactions are accounted for on a trade-date basis. All such transactions are recorded on the identified cost basis and marked to market daily. Unrealized appreciation or depreciation on investments are reflected in the statements of operations as the difference between the original amount and the fair market value as of the last business day of the year or as of the last date of the financial statements. Changes in the appreciation or depreciation between periods are reflected in the statements of operations.
Brokerage Commissions
The Sponsor recognizes the expense for brokerage commissions for futures contract trades on a per-trade basis. The below table shows the amounts included on the statements of operations as total brokerage commissions paid inclusive of unrealized loss for the quarter ended March 31, 2024.
| | | DEFI | |
Three months ended March 31, 2024 | | $ | 192 | |
Three months ended March 31, 2023 | | $ | 609 | |
Income Taxes
For federal income tax purposes, the Fund will be treated as a publicly traded partnership. A publicly traded partnership is generally treated as a corporation for federal income tax purposes unless 90% or more of the publicly traded partnership’s gross income for each taxable year of its existence consists of qualifying income as defined in section 7704(d) of the Internal Revenue Code of 1986, as amended. Qualifying income is defined as generally including, in pertinent part, interest (other than from a financial business), dividends, and gains from the sale or disposition of capital assets held for the production of interest or dividends. In the case of a partnership of which a principal activity is the buying and selling of commodities, other than as inventory, or of futures, forwards and options with respect to commodities, qualifying income also includes income and gains from commodities and from futures, forwards, options with respect to commodities and, provided the partnership is a trader or investor with respect to such assets, swaps and other notional principal contracts with respect to commodities. The Fund expects that at least 90% of the Fund’s gross income for each taxable year will consist of qualifying income and that the Fund will be taxed as a partnership for federal income tax purposes. The Fund does not record a provision for income taxes because the shareholders report their share of the Fund’s income or loss on their income tax returns. The financial statements reflect the Fund’s transactions without adjustment, if any, required for income tax purposes.
There is very limited authority on the U.S. federal income tax treatment of bitcoin and no direct authority on bitcoin derivatives, such as Bitcoin Futures Contracts. Bitcoin Futures Contracts more likely than not will be considered futures with respect to commodities for purposes of the qualifying income exception under section 7704 of the Code. Based on a CFTC determination that treats bitcoin as a commodity under the CEA, the Fund intends to take the position that Bitcoin Futures Contracts consist of futures on commodities for purposes of the qualifying income exception under section 7704 of the Code. Shareholders should be aware that the Fund’s position is not binding on the IRS, and no assurance can be given that the IRS will not challenge the Fund’s position, or that the IRS or a court will not ultimately reach a contrary conclusion, which would result in the material adverse consequences to Shareholders and the Fund.
The Fund is required to determine whether a tax position is more likely than not to be sustained upon examination by the applicable taxing authority, including resolution of any related appeals or litigation processes, based on the technical merits of the position. The Fund files an income tax return in the U.S. federal jurisdiction and may file income tax returns in various U.S. states and foreign jurisdictions. For the tax year December 31, 2023, the Fund remains subject to income tax examinations by major taxing authorities. The tax benefit recognized is measured as the largest amount of benefit that has a greater than fifty percent likelihood of being realized upon ultimate settlement. De-recognition of a tax benefit previously recognized results in the Fund recording a tax liability that reduces net assets. This policy has been applied to all existing tax positions upon the Fund’s initial adoption. Based on its analysis, the Fund has determined that it has not incurred any liability for unrecognized tax benefits as of March 31, 2024 and for the year ended December 31, 2023. However, the Fund’s conclusions regarding this policy may be subject to review and adjustment at a later date based on factors including, but not limited to, ongoing analysis of and changes to tax laws, regulations, and interpretations thereof.
The Fund recognizes interest accrued related to unrecognized tax benefits and penalties related to unrecognized tax benefits in income tax fees payable, if assessed. No interest expense or penalties have been recognized as of a March 31, 2024.
The Fund may be subject to potential examination by U.S. federal, U.S. state, or foreign jurisdictional authorities in the area of income taxes. These potential examinations may include questioning the timing and amount of deductions, the nexus of income among various tax jurisdictions, and compliance with U.S. federal, U.S. state and foreign tax laws.
Creations and Redemptions
Authorized Purchasers may purchase Creation Baskets consisting of 10,000 shares from the Fund. The amount of the proceeds required to purchase a Creation Basket will be equal to the NAV of the shares in the Creation Basket determined as of 4:00 p.m. (ET) on the day the order to create the basket is received in good order.
Authorized Purchasers may redeem shares from the Fund only in blocks of 10,000 shares called “Redemption Baskets.” The amount of the redemption proceeds for a Redemption Basket will be equal to the NAV of the shares in the Redemption Basket determined as of 4:00 p.m. (ET) on the day the order to redeem the basket is received in good order.
The Fund will receive the proceeds from shares sold or will pay for redeemed shares within three business days after the trade date of the purchase or redemption, respectively. The amounts due from Authorized Purchasers will be reflected in the Fund’s statements of assets and liabilities as capital shares receivable. Amounts payable to Authorized Purchasers upon redemption will be reflected in the Fund’s statements of assets and liabilities as payable for shares redeemed.
As outlined in the most recent Form S-1 filing, 50,000 shares represent five Redemption Baskets for the Fund and a minimum level of shares. If the Fund experienced redemptions that caused the number of Shares outstanding to decrease to the minimum level of Shares required to be outstanding, until the minimum number of Shares is again exceeded through the purchase of a new Creation Basket, there can be no more redemptions by an Authorized Purchaser.
Allocation of Shareholder Income and Losses
Profit or loss is allocated among the shareholders of the Fund in proportion to the number of shares each shareholder holds as of the close of each month.
Cash Equivalents
Cash equivalents are highly liquid investments with maturity dates of 90 days or less when acquired. The Fund reported its cash equivalents in the statements of assets and liabilities at market value, or at carrying amounts that approximate fair value, because of their highly liquid nature and short-term maturities. The Fund has these balances of its assets on deposit with banks. Assets deposited with a financial institution may, at times, exceed federally insured limits. DEFI had a balance of $1,867,663 in money market funds at December 31, 2023 respectively; this balances is included in cash equivalents on the statements of assets and liabilities.
Due from/to Broker
The amount recorded by the Fund for the amount due from and to the clearing broker includes, but is not limited to, cash held by the broker, amounts payable to the clearing broker related to open transactions, payables for cryptocurrency futures accounts liquidating to an equity balance on the clearing broker’s records and amounts of brokerage commissions paid and recognized as unrealized losses.
Margin is the minimum amount of funds that must be deposited by a cryptocurrency interest trader with the trader’s broker to initiate and maintain an open position in futures contracts. A margin deposit acts to assure the trader’s performance of the futures contracts purchased or sold. Futures contracts are customarily bought and sold on initial margin that represents a small percentage of the aggregate purchase or sales price of the contract. Because of such low margin requirements, price fluctuations occurring in the futures markets may create profits and losses that, in relation to the amount invested, are greater than customary in other forms of investment or speculation. As discussed below, adverse price changes in the futures contract may result in margin requirements that greatly exceed the initial margin. In addition, the amount of margin required in connection with a particular futures contract is set from time to time by the exchange on which the contract is traded and may be modified from time to time by the exchange during the term of the contract. Brokerage firms, such as the Fund’s clearing brokers, carrying accounts for traders in commodity interest contracts generally require higher amounts of margin as a matter of policy to further protect themselves. Over the counter trading generally involves the extension of credit between counterparties, so the counterparties may agree to require the posting of collateral by one or both parties to address credit exposure.
When a trader purchases an option, there is no margin requirement; however, the option premium must be paid in full. When a trader sells an option, on the other hand, he or she is required to deposit margin in an amount determined by the margin requirements established for the underlying interest and, in addition, an amount substantially equal to the current premium for the option. The margin requirements imposed on the selling of options, although adjusted to reflect the probability that out-of-the-money options will not be exercised, can in fact be higher than those imposed in dealing in the futures markets directly. Complicated margin requirements apply to spreads and conversions, which are complex trading strategies in which a trader acquires a mixture of options positions and positions in the underlying interest.
Ongoing or “maintenance” margin requirements are computed each day by a trader’s clearing broker. When the market value of a particular open futures contract changes to a point where the margin on deposit does not satisfy maintenance margin requirements, a margin call is made by the broker. If the margin call is not met within a reasonable time, the broker may close out the trader’s position. With respect to the Fund’s trading, the Fund (and not its shareholders personally) is subject to margin calls. Finally, many major U.S. exchanges have passed certain cross margining arrangements involving procedures pursuant to which the futures and options positions held in an account would, in the case of some accounts, be aggregated and margin requirements would be assessed on a portfolio basis, measuring the total risk of the combined positions.
Calculation of Net Asset Value
The Fund’s NAV is calculated by:
| • | Taking the current market value of its total assets and |
| • | Subtracting any liabilities. |
The administrator, Global Fund Services, will calculate the NAV of the Fund once each trading day. It will calculate the NAV as of the earlier of the close of the New York Stock Exchange or 4:00 p.m. (ET). The NAV for a particular trading day will be released after 4:15 p.m. (ET).
In determining the value of Bitcoin Futures Contracts, the Administrator uses the settlement price for the Benchmark Component Futures Contracts, as reported on the CME. CME Group staff determines the daily settlements for the Benchmark Component Futures Contracts based on trading activity on CME Globex exchange between 14:59:00 and 15:00:00 Central Time (CT), the settlement period, except that the “fair value” of Bitcoin Futures Contracts (as described in more detail below) may be used when Bitcoin Futures Contracts close at their price fluctuation limit for the day. The Administrator determines the value of all investments as of the earlier of the close of the New York Stock Exchange or 4:00 p.m. (ET), in accordance with the current Services Agreement between the Administrator and the Trust. NAV includes any unrealized profit or loss on open bitcoin interests and any other credit or debit accruing to the Fund but unpaid or not received by the Fund.
Sponsor Fee Allocation of Expenses and Related Party Transactions
The Sponsor is responsible for investing the assets of the Fund in accordance with the objectives and policies of the Fund. DEFI is contractually obligated to pay a monthly management fee to the Sponsor, based on average daily net assets, at a rate equal to 0.94% per annum. From the Management Fee, the Sponsor pays all of the routine operational, administrative and other ordinary expenses of the Fund, generally as determined by the Sponsor, including but not limited to, fees and expenses of the Administrator, Custodian, Distributor, Transfer Agent, licensors, accounting and audit fees expenses, tax preparation expenses, legal fees, ongoing SEC registration fees, individual Schedule K-1 preparation and mailing fees, and report preparation and mailing expenses. These fees and expenses are not included in the breakeven table because they are paid for by the Sponsor through the proceeds from the Management Fee. The Fund pays all of its non-recurring and unusual fees and expenses, if any, as determined by the Sponsor. Non-recurring and unusual fees and expenses are unexpected or unusual in nature, such as legal claims and liabilities and litigation costs or indemnification or other unanticipated expenses. Extraordinary fees and expenses also include material expenses which are not currently anticipated obligations of the Fund. Routine operational, administrative, and other ordinary expenses are not deemed extraordinary expenses.
The Sponsor has the ability to elect to pay certain expenses on behalf of the Funds or waive the management fee. This election is subject to change by the Sponsor, at its discretion. Expenses paid by the Sponsor and Management fees waived by the Sponsor are, if applicable, presented as waived expenses in the statements of operations for each Fund. The Sponsor has determined that there will be no recovery sought for the amounts below in any future period:
| | | DEFI | |
Three months ended March 31, 2024 | | $ | 62,309 | |
Three months ended March 31, 2023 | | $ | 70,570 | |
Expenses
Expenses are recorded using the accrual method of accounting.
Use of Estimates
The preparation of financial statements in conformity with accounting principles generally accepted in the United States of America requires management to make estimates and assumptions that affect the reported amount of assets and liabilities and disclosure of contingent assets and liabilities at the date of the financial statements, and the reported amounts of the revenue and expenses during the reporting period. Actual results could differ from those estimates.
New Accounting Pronouncements
The Financial Accounting Standards Board (“FASB”) issued Accounting Standards Update (“ASU”) 2017-13, “Revenue Recognitionissued ASU 2023-01, related to Leases – (Topic 605), Leases (Topic 840), and Leases (Topic 842): Amendments to SEC Paragraphs Pursuant to the Staff Announcement at the July 20,2017 EITF Meeting and Rescission of Prior SEC Staff Announcements and Observer Comments”842). The amendment amends the early adoption date option for certain companiesresponse to concerns about applying Topic 842 to related to adoption of ASU No. 2014-09 and ASU No. 2016-02. The SEC staff stated the SEC would not object to a public business entity that otherwise would not meet the definition of a public business entity except for a requirement to include or the inclusion of its financial statements or financial information in another entity’s filing with the SEC adopting ASC Topic 842 for fiscal years beginning after December 15, 2019, and interim periods within fiscal years beginning after December 15, 2020. This amendment is not expected to have a material impact on the financial statements and disclosures of the Trust or the Fund.
The FASB issued ASU 2017-12, “Derivatives and Hedging (Topic 815): Targeted Improvements to Accounting for Hedging Activities”. These amendments refine and expand hedge accounting for both financial (e.g., interest rate) and commodity risks. Its provisions create more transparency around how economic results are presented, both on the face of the financial statements and in the footnotes. It also makes certain targeted improvements to simplify the application of hedge accounting guidance. The amendments are effective for public businessparty arrangements between entities for fiscal years beginning after December 15, 2018 and interim periods within those fiscal years. The Trust and the Fund are currently evaluating the impact on the financial statements and disclosures; but, based on our review to date, we do not expect the update will have a material impact on the financial statements and disclosures of the Trust or the Fund.
The FASB issued ASU 2017-03, “Accounting Changes and Error Corrections (Topic 250) and Investments – Equity Method and Joint Ventures (Topic 323)”. These amendments require disclosure of the impact that recently issued accounting standards will have on the financial statements of a registrant when such standards are adopted in a future period. The adoption did not have a material impact on the financial statements and disclosures of the Trust or the Fund.
The FASB issued ASU 2017-01, “Business Combinations (Topic 805): Clarifying the Definition of a Business”. The amendments are intended to help companies and other organizations evaluate whether transactions should be accounted for as acquisitions (or disposals) of assets or businesses. The amendments are effective for public companies for annual periods beginning after December 15, 2017, including interim periods within those periods. The Trust and the Fund are currently evaluating the impact on the financial statements and disclosures; but, based on our review to date, we do not expect the update will have a material impact on the financial statements and disclosures of the Trust or the Fund.
The FASB issued ASU 2016-19, “Technical Corrections and Improvements”. The amendments in this update represent changes to clarify, correct errors, or make minor improvements to the Accounting Standards Codification. The amendments make the Accounting Standards Codification easier to understand and easier to apply by eliminating inconsistencies and providing clarifications. The amendments are effective for fiscal years, and interim periods with those fiscal years, for all entities beginning after December 15, 2016. The adoption did not have a material impact on the financial statements and disclosures of the Trust or the Fund.
The FASB issued ASU 2016-18, “Statement of Cash Flows (Topic 230)”. The amendments in this update require that a statement of cash flows explain the change during the period in the total of cash, cash equivalents, and amounts generally described as restricted cash or restricted cash equivalents. Therefore, amounts generally described as restricted cash and restricted cash equivalents should be included with cash and cash equivalents when reconciling the beginning-of-period and end-of-period total amounts shown on the statement of cash flows. The amendments are effective for fiscal years beginning after December 15, 2017, and interim periods within those fiscal years. This update is not expected to have a material impact on the financial statements and disclosures of the Trust or the Fund. The Sponsor believes there will be a change in presentation of restricted cash on the statements of cash flows.
The FASB issued ASU 2016-17, “Consolidation (Topic 810): Interests Held through Related Parties That are under Common Control”. The amendments in this update alters how a decision maker needs to consider indirect interests in a variable interest entity (VIE) held through an entity under common control. The new guidance amends ASU 2015-02, Consolidation (Topic 810): Amendments toupdate was adopted early for the Consolidation Analysis, issued in February 2015. The amendments are effective for fiscal years beginning after December 15, 2016, including interim periods within those fiscal years. Thequarter ended March 31, 2023; the adoption did not have a material impact on the financial statements and disclosures of the Trust or the Fund.
The FASB issued ASU 2016-15, “Statement of Cash Flows (Topic 230): Classification of Certain Cash Receipts and Cash Payments”. The amendments provide cash flow statement classification guidance. The amendments in this update are effective for fiscal years beginning after December 15, 2017. The Trust and the Fund are currently evaluating the impact on the financial statements and disclosures, but do not expect the adoption to have a material impact on the financial statements and disclosures of the Trust or the Fund. The Trust and the Fund do not expect to adopt the guidance until the effective date.
The FASB issued ASU 2014-09 in May 2014, “Revenue from Contracts with Customers (Topic 606),” which replaces the revenue recognition requirements of “Revenue Recognition (Topic 605).” This ASU is based on the principle that revenue is recognized to depict the transfer of goods and services to customers in an amount that reflects the consideration to which the entity expects to be entitled in exchange for those goods or services. This ASU provides new and more detailed guidance on specific topics and expands and improves disclosures about revenue. In August 2015, the FASB issued ASU 2015-14 which defers the effective date of ASU 2014-09 by one year to fiscal years beginning after December 15, 2017. ASU 2015-14 also permits early adoption of ASU 2014-09, but not before the original effective date, which was for fiscal years beginning after December 15, 2016. The Trust and the Fund record income or loss from the recognition and measurement of futures contracts and from interest income under Subtopic 825-10. Revenue from financial instruments which are valued under Subtopic 825 will not be subject to the application of ASU 2014-09 and 2015-14. Therefore, these standards will not have a material impact on the financial statements and disclosures of the Trust or the Fund.
The FASB issued ASU 2016-11, “Revenue Recognition (Topic 605) and Derivatives and Hedging (Topic 815): Rescission of SEC Guidance Because of Accounting Standards Updates 2014-09 and 2014-16 Pursuant to Staff Announcements at the March 3, 2016 EITF Meeting”. The amendments make targeted improvements to clarify the principal versus agent assessment and are intended to make the guidance more operable and lead to more consistent application. The Trust and the Fund record income or loss from the recognition and measurement of futures contracts and from interest income under Subtopic 825-10. Revenue from financial instruments which are valued under Subtopic 825 will not be subject to the application of ASU 2016-11. Therefore, this standard will not have a material impact on the financial statements and disclosures of the Trust or the Fund.
The FASB issued ASU 2016-02, “Leases (Topic 842).” The amendments in this update increase transparency and comparability among organizations by recognizing lease assets and lease liabilities on the balance sheet and disclosing key information about leasing arrangements. The amendments in this update are effective for fiscal years beginning after December 15, 2018. This update is not expected to have a material impact on the financial statements and disclosures of the Trust or the Fund.
The FASB issued ASU 2016-01, “Financial Instruments-Overall (Subtopic 825-10): Recognition and Measurement of Financial Assets and Financial Liabilities.” The amendments in this update are intended to improve the recognitions measurement and disclosure of financial instruments. The amendments to this update are effective for fiscal years beginning after December 15, 2017, and interim periods within those fiscal years. These amendments are required to be applied prospectively. The Trust and the Fund are currently evaluating the impact on the financial statements and disclosures; but based on our review to date we do not expect the update will have a material impact on the financial statements and disclosures of the Trust or the Fund.
Fair Value - Definition and Hierarchy
In accordance with GAAP, fair value is defined as the price that would be received to sell an asset or paid to transfer a liability (i.e., the “exit price”) in an orderly transaction between market participants at the measurement date.
In determining fair value, the Fund uses various valuation approaches. In accordance with GAAP, a fair value hierarchy for inputs is used in measuring fair value that maximizes the use of observable inputs and minimizes the use of unobservable inputs by requiring that the most observable inputs be used when available. Observable inputs are those that market participants would use in pricing the asset or liability based on market data obtained from sources independent of the Fund. Unobservable inputs reflect the Fund’s assumptions about the inputs market participants would use in pricing the asset or liability developed based on the best information available in the circumstances. The fair value hierarchy is categorized into three levels based on the inputs as follows:
Level 1 - Valuations based on unadjusted quoted prices in active markets for identical assets or liabilities that the Fund has the ability to access. Valuation adjustments and block discounts are not applied to Level 1 financial instruments of the Underlying Funds and securities of the Fund, together the “financial instruments”. Since valuations are based on quoted prices that are readily and regularly available in an active market, valuation of these financial instruments does not entail a significant degree of judgment.
Level 2 - Valuations based on quoted prices in markets that are not active or for which all significant inputs are observable, either directly or indirectly.
Level 3 - Valuations based on inputs that are unobservable and significant to the overall fair value measurement.
The availability of valuation techniques and observable inputs can vary from financial instrument to financial instrument and is affected by a wide variety of factors including, the type of financial instrument, whether the financial instrument is new and not yet established in the marketplace, and other characteristics particular to the transaction. To the extent that valuation is based on models or inputs that are less observable or unobservable in the market, the determination of fair value requires more judgment. Those estimated values do not necessarily represent the amounts that may be ultimately realized due to the occurrence of future circumstances that cannot be reasonably determined. Because of the inherent uncertainty of valuation, those estimated values may be materially higher or lower than the values that would have been used had a ready market for the financial instruments existed. Accordingly, the degree of judgment exercised by the Fund in determining fair value is greatest for financial instruments categorized in Level 3. In certain cases, the inputs used to measure fair value may fall into different levels of the fair value hierarchy. In such cases, for disclosure purposes, the level in the fair value hierarchy, within which the fair value measurement in its entirety falls, is determined based on the lowest level input that is significant to the fair value measurement.
On March 31, 2024 and December 31, 2023, the reported value at the close of the market for each cryptocurrency contract fairly reflected the value of the futures and no alternative valuations were required.
Net Income (Loss) per Share
Net income (loss) per share is the difference between the NAV per unit at the beginning of each period and at the end of each period. The weighted average number of units outstanding was computed for purposes of disclosing net income (loss) per weighted average unit. The weighted average units are equal to the number of units outstanding at the end of the period, adjusted proportionately for units created or redeemed based on the amount of time the units were outstanding during such period.
Note 4– Fair Value Measurements
The Fund’s assets and liabilities recorded at fair value have been categorized based upon a fair value hierarchy as described in the Fund’s significant accounting policies in Note 2.3. The following table presents information about the Fund’s assets and liabilities measured at fair value as of September 30, 2017 and December 31, 2016:2023. The Fund did not have any assets or liabilities as of March 31, 2024.
September 30, 2017
December 31, 2023
| | | | | | | | | Balance as of | | | | | | | | | | | | Balance as of | |
| Assets: | | Level 1 | | Level 2 | | Level 3 | | September 30, 2017 | | | Level 1 | | | Level 2 | | | Level 3 | | | December 31, 2023 | |
| Exchange-traded funds | | $ | 1,175,368 | | | $ | — | | | $ | — | | | $ | 1,175,368 | | |
| Cash equivalents | | | 967 | | | | — | | | | — | | | | 967 | | |
Cash Equivalents | | | $ | 1,867,663 | | | $ | - | | | $ | - | | | $ | 1,867,663 | |
Bitcoin futures contracts | | | | 129,519 | | | | - | | | | - | | | | 129,519 | |
| Total | | $ | 1,176,335 | | | $ | — | | | $ | — | | | $ | 1,176,335 | | | $ | 1,997,182 | | | $ | - | | | $ | - | | | $ | 1,997,182 | |
December 31, 2016
| | | | | | | | | | | | Balance as of | |
| Assets: | | Level 1 | | | Level 2 | | | Level 3 | | | December 31, 2016 | |
| Exchange-traded funds | | $ | 1,313,554 | | | $ | — | | | $ | — | | | $ | 1,313,554 | |
| Cash equivalents | | | 2,360 | | | | — | | | | — | | | | 2,360 | |
| Total | | $ | 1,315,914 | | | $ | — | | | $ | — | | | $ | 1,315,914 | |
| | | | | | | | | | | | | | | Balance as of | |
Liabilities | | Level 1 | | | Level 2 | | | Level 3 | | | December 31, 2023 | |
Bitcoin futures contracts | | $ | 51,376 | | | $ | - | | | $ | - | | | $ | 51,376 | |
For the ninethree months ended September 30, 2017March 31, 2024 and year ended December 31, 2016,2023, the Fund did not have any significant transfers between any of the levellevels of the fair value hierarchy.
See theFair Value - Definition and Hierarchysection in Note 3 above for an explanation of the transfers into and out of each level of the fair value hierarchy.
Note 5– Derivative Instruments and Hedging Activities
In the normal course of business, the Fund utilizes derivative contracts in connection with its proprietary trading activities. Investments in derivative contracts are subject to additional risks that can result in a loss of all or part of an investment. The Fund’s derivative activities and exposure to derivative contracts are classified by the following primary underlying risks: interest rate, credit, commodity price, and equity price risks. In addition to its primary underlying risks, the Fund is also subject to additional counterparty risk due to inability of its counterparties to meet the terms of their contracts. For the quarter ended December 31, 2023, the Fund invested only in cryptocurrency futures contracts. The Fund did not have any derivative assets or derivative liabilities as of March 31, 2024.
Futures Contracts
The Fund is subject to cryptocurrency price risk in the normal course of pursuing its investment objectives. A futures contract represents a commitment for the future purchase or sale of an asset at a specified price on a specified date.
The purchase and sale of futures contracts requires margin deposits with a Futures Commission Merchant (“FCM”). Subsequent payments (variation margin) are made or received by the Fund each day, depending on the daily fluctuations in the value of the contract, and are recorded as unrealized gains or losses by the Fund. Futures contracts may reduce the Fund’s exposure to counterparty risk since futures contracts are exchange-traded; and the exchange’s clearinghouse, as the counterparty to all exchange-traded futures, guarantees the futures against default.
The Commodity Exchange Act requires an FCM to segregate all customer transactions and assets from the FCM’s proprietary activities. A customer’s cash and other equity deposited with an FCM are considered commingled with all other customer funds subject to the FCM’s segregation requirements. In the event of an FCM’s insolvency, recovery may be limited to the Fund’s pro rata share of segregated customer funds available. It is possible that the recovery amount could be less than the total of cash and other equity deposited.
The following table discloses information about offsetting assets and liabilities presented in the statements of assets and liabilities to enable users of these financial statements to evaluate the effect or potential effect of netting arrangements for recognized assets and liabilities. These recognized assets and liabilities are presented as defined in the Financial Accounting Standards Board’s (“FASB”) Accounting Standards Update (“ASU”) No.2011-11 “Balance Sheet (Topic 210): Disclosures about Offsetting Assets and Liabilities” and subsequently clarified in FASB ASU 2013-01 “Balance Sheet (Topic 210): Clarifying the Scope of Disclosures about Offsetting Assets and Liabilities.”
The following table also identifies the fair value amounts of derivative instruments included in the statements of assets and liabilities as derivative contracts, categorized by primary underlying risk, and held by the FCMs, StoneX as of December 31, 2023. The Fund did not have any derivative assets or derivative liabilities as of March 31, 2024.
*The amount of collateral presented in Collateral, Due from Broker, is limited to the liability for the futures contracts and accordingly does not include the excess collateral pledged.
Offsetting of Financial Assets and Derivative Assets as of December 31, 2023
| | | (i) | | | (ii) | | | (iii) = (i)-(ii) | | | (iv) | | | (v)=(iii)-(iv) | |
| | | | | | | | | | | | | | | Gross Amount Not Offset in the Statement of Assets and Liabilities | | | | | |
Description | | Gross Amount of Recognized Assets | | | Gross Amount Offset in the Statement of Assets and Liabilities | | | Net Amount Presented in the Statement of Assets and Liabilities | | | Futures Contracts Available for Offset | | | Collateral, Due from Broker* | | | Net Amount | |
Cryptocurrency Price | | | | | | | | | | | | | | | | | | | | | | | | |
Bitcoin futures contracts | | $ | 129,519 | | | $ | - | | | $ | 129,519 | | | $ | 51,376 | | | $ | - | | | $ | 78,143 | |
Offsetting of Financial Liabilities and Derivative Liabilities as of December 31, 2023
| | | (i) | | | (ii) | | | (iii) = (i)-(ii) | | | (iv) | | | (v)=(iii)-(iv) | |
| | | | | | | | | | | | | | | Gross Amount Not Offset in the Statement of Assets and Liabilities | | | | | |
Description | | Gross Amount of Recognized Liabilities | | | Gross Amount Offset in the Statement of Assets and Liabilities | | | Net Amount Presented in the Statement of Assets and Liabilities | | | Futures Contracts Available for Offset | | | Collateral, Due from Broker* | | | Net Amount | |
Cryptocurrency Price | | | | | | | | | | | | | | | | | | | | | | | | |
Bitcoin futures contracts | | $ | 51,376 | | | $ | - | | | $ | 51,376 | | | $ | 51,376 | | | $ | - | | | $ | - | |
The following tables identify the net gain and loss amounts included in the statements of operations as realized and unrealized gains and losses on trading of cryptocurrency futures contracts categorized by primary underlying risk:
Three months ended March 31, 2024
| | | Realized Loss on Cryptocurrency Futures Contracts | | | Net Change in Unrealized Appreciation on Cryptocurrency Futures Contracts | |
Cryptocurrency Price | | | | | | | | |
Bitcoin futures Contracts | | $ | (78,143 | ) | | $ | 114,383 | |
Three months ended March 31, 2023
| | | Realized Loss on Cryptocurrency Futures Contracts | | | Net Change in Unrealized Depreciation on Cryptocurrency Futures Contracts | |
Cryptocurrency Price | | | | | | | | |
Bitcoin futures Contracts | | $ | (5,942 | ) | | $ | (14,372 | ) |
Volume of Derivative Activities
The average notional market value categorized by primary underlying risk for all futures contracts held was $1.7 million for the three months ended March 31, 2023
Note 6– Financial Highlights
The following table presents per unit performance data and other supplemental financial data for the three and nine months ended September 30, 2017March 31, 2024 and 2016. This information has been derived from information presented in the financial statements.March 31, 2023. This information has been derived from information presented in the financial statements and is presented with total expenses gross of expenses waived by the Sponsor and with total expenses net of expenses waived by the Sponsor, as appropriate.
| | | | Three months ended | | Three months ended | |
| | | Three months ended | | Three months ended | | Nine months ended | | Nine months ended | | | March 31, 2024 | | | March 31, 2023 | |
| Per Share Operation Performance | | September 30, 2017 | | September 30, 2016 | | September 30, 2017 | | September 30, 2016 | | | | | |
| Net asset value at beginning of period | | $ | 25.09 | | | $ | 28.80 | | | $ | 26.33 | | | $ | 26.59 | | | $ | 50.74 | | | $ | 21.40 | |
| Income (loss) from investment operations: | | | | | | | | | | | | | | | | | |
| Net realized and unrealized (loss) gain on investment transactions | | | (1.53 | ) | | | (1.57 | ) | | | (2.70 | ) | | | 0.71 | | |
| Total expenses | | | (0.03 | ) | | | (0.03 | ) | | | (0.10 | ) | | | (0.10 | ) | |
Interest income | | | 0.02 | | | 0.27 | |
Net assets transferred to Acquired Fund | | | (51.48 | ) | | | |
Net realized and unrealized gain on cryptocurrency futures contracts | | | 0.72 | | | 15.16 | |
Total expenses, net | | | | 0.00 | | | | (0.07 | ) |
| Net (decrease) increase in net asset value | | | (1.56 | ) | | | (1.60 | ) | | | (2.80 | ) | | | 0.61 | | | | (50.74 | ) | | | 15.36 | |
| Net asset value at end of period | | $ | 23.53 | | | $ | 27.20 | | | $ | 23.53 | | | $ | 27.20 | | | $ | - | | | $ | 36.76 | |
| Total Return | | | (6.22 | )% | | | (5.56 | )% | | | (10.63 | )% | | | 2.29 | % | | 0.00 | % | | 71.79 | % |
| Ratios to Average Net Assets (Annualized) | | | | | | | | | | | | | | | | | | | | |
| Total expenses | | | 2.45 | % | | | 3.39 | % | | | 3.99 | % | | | 3.93 | % | | 286.28 | % | | 20.48 | % |
| Total expenses, net | | | 0.50 | % | | | 0.50 | % | | | 0.50 | % | | | 0.50 | % | | 0.92 | % | | 0.94 | % |
| Net investment loss | | | (0.50 | )% | | | (0.50 | )% | | | (0.50 | )% | | | (0.50 | )% | |
Net investment income | | | 4.00 | % | | 2.78 | % |
The financial highlights per share data are calculated consistent with the methodology used to calculate asset-based fees and expenses.
Note 6 7– Organizational and Offering Costs
Expenses incurred in organizing of the Trust and the initial offering of the Shares of the Fund, including applicable SEC registration fees, were borne directly by the Sponsor. The Fund will not be obligated to reimburse the Sponsor.
Note 7 8– Subsequent Events
Management has evaluated the financial statements for the quarter-ended September 30, 2017March 31, 2024 for subsequent events through the date of this filing and noted no material events requiring either recognition through the date of the filing or disclosure herein for the Fund.
Item 2. Management’sManagement’s Discussion and Analysis of Financial Condition and Results of Operations.
This information should be read in conjunction with the financial statements and notes included in Item 1 of Part I of this Quarterly Report (the “Report”“Report”). The discussion and analysis which follows may contain trend analysis and other forward-looking statements within the meaning of Section 21E of the Securities Exchange Act of 1934 which reflect our current views with respect to future events and financial results. Words such as “anticipate,“anticipate,” “expect,“expect,” “intend,“intend,” “plan,“plan,” “believe,“believe,” “seek,“seek,” “outlook”“outlook” and “estimate,“estimate,” as well as similar words and phrases, signify forward-looking statements. Teucrium Commodity Trust’sTrust’s (the “Trust’s”“Trust’s”) forward-looking statements are not guaranteesa guarantee of future results and conditions, and important factors, risks and uncertainties may cause our actual results to differ materially from those expressed in our forward-looking statements.
You should not place undue reliance on any forward-looking statements. Except as expressly required by the Federal securities laws, Teucrium Trading, LLC (the “Sponsor”“Sponsor”) undertakes no obligation to publicly update or revise any forward-looking statements or the risks, uncertainties or other factors described in this Report, as a result of new information, future events or changed circumstances or for any other reason after the date of this Report.
Overview/Introduction
Teucrium Commodity Trust (“Trust”), a Delaware statutory trust organized on September 11, 2009, is a series trust consisting of fivesix series: Teucrium Corn Fund (“CORN”), Teucrium Sugar Fund (“CANE”), Teucrium Soybean Fund (“SOYB”), Teucrium Wheat Fund (“WEAT”), and Teucrium Agricultural Fund (collectively, “the Agricultural Funds”) and Hashdex Bitcoin Futures ETF (“TAGS”DEFI”). All of the series of the Trust are collectively referred to as the “Funds” and singularly as the “Fund.” Each Fund is a commodity pool that is a series of the Trust. The Funds issue common units, called the “Shares,” representing fractional undivided beneficial interests in a Fund. TheEffective as of April 26, 2019, the Trust and the Funds operate pursuant to the Trust’s SecondFifth Amended and Restated Declaration of Trust and Trust Agreement (the “Trust Agreement”).
On June 5,7, 2010, the initial Form S-1 for CORN was declared effective by the U.S. Securities and Exchange Commission (“SEC”). On June 8, 2010, four Creation Baskets for CORN were issued representing 200,000 shares and $5,000,000. CORN began trading on the New York Stock Exchange (“NYSE”) Arca on June 9, 2010. The current registration statement for CORN was declared effective by the SEC on April 29, 2016.7, 2022. This registration statement for CORN registered an indeterminate number of shares.
On June 17,13, 2011, the initial Forms S-1 for CANE, SOYB, and WEAT were declared effective by the SEC. On September 16, 2011, two Creation Baskets were issued for each Fund, representing 100,000 shares and $2,500,000, for CANE, SOYB, and WEAT. On September 19, 2011, CANE, SOYB, and WEAT started trading on the NYSE Arca. The current registration statements for CANESOYB and SOYBCANE were declared effective by the SEC on May 1, 2017.April 7, 2022. The registration statements for SOYB and CANE registered an indeterminate number of shares each. The current registration statement for WEAT was declared effective on July 15, 2016.March 9, 2022. This registration statement for WEAT registered an additional 24,050,000indeterminate number of shares.
On February 10, 2012, the Form S-1 for TAGS was declared effective by the SEC. On March 27, 2012, six Creation Baskets for TAGS were issued representing 300,000 shares and $15,000,000. TAGS began trading on the NYSE Arca on March 28, 2012. The current registration statement for TAGS was declared effective by the SEC on April 30, 2015.7, 2022. This registration statement for TAGS registered an indeterminate number of shares.
On September 14, 2022, the Form S-1 for DEFI was declared effective by the SEC. On September 15, 2022, five Creation Baskets for DEFI were issued representing 50,000 shares and $1,250,000. DEFI began trading on the NYSE Arca on September 16, 2022. This registration statement for DEFI registered an indeterminate number of shares.
As reported by the registrant on a Form 8-K filed with the Securities and Exchange Commission on November 7, 2023 (File No. 001-34765), Teucrium Commodity Trust (the “Teucrium Trust”), on behalf of its series, Hashdex Bitcoin Futures ETF (“Acquired Fund”), and Tidal Commodities Trust I (“Acquiring Trust”), on behalf of its series, Hashdex Bitcoin Futures ETF (“Acquiring Fund”), entered into an Agreement and Plan of Partnership Merger and Liquidation dated as of October 30, 2023 (the “Plan of Merger”). The Funds are designed and managed so thatMerger closed on January 3, 2024 (the “Closing Date”).
Pursuant to the daily changes in percentage termsPlan of Merger, each Acquired Fund shareholder received one share of the Shares’ Net Asset Value (“NAV”) reflect the daily changes in percentage terms of a weighted averageAcquiring Fund for every one share of the closing settlement prices for specific futures contractsAcquired Fund held on designated commodities or the closing Net Asset ValueClosing Date based on the net asset value per share of the Underlying Funds (as defined below)Acquiring Fund being equal to the net asset value per share of the Acquired Fund determined immediately prior to the Merger closing. Upon the Merger closing, the Acquiring Fund acquired all the assets of the Acquired Fund and assumed all the liabilities of the Acquired Fund. Upon the Merger closing, the Plan of Merger caused all of the Acquired Fund’s shares to be cancelled and the Acquired Fund to be liquidated.
The sponsor of the Teucrium Trust, Teucrium Trading, LLC (“Teucrium”), is not receiving any compensation dependent on the consummation of the Merger. Pursuant to a certain Amended and Restated ‘33 Act Fund Platform Support Agreement, as amended (the “Support Agreement”) among Tidal Investments LLC (f/k/a Toroso Investments, LLC) (“Tidal”), Tidal ETF Services, LLC, Hashdex Asset Management Ltd., and Teucrium, Tidal has agreed to provide Teucrium after the Merger with a monthly amount equal to the greater of seven percent (7%) of the management fee paid to Tidal from the Acquiring Fund and 0.04% of monthly average net assets of the Acquiring Fund (“Teucrium Compensation”). Any payment of the Teucrium Compensation will be made from the resources of Tidal and not from the assets of the Acquiring Fund.
The occurrence of a severe weather event, natural disaster, terrorist attack, geopolitical events, outbreak, or public health emergency as declared by the World Health Organization, the continuation or expansion of war or other hostilities, or a prolonged government shutdown may have significant adverse effects on an Agricultural Fund and its investments and alter current assumptions and expectations. For example, in late February 2022, Russia invaded Ukraine, significantly amplifying already existing geopolitical tensions among Russia and other countries in the case of TAGS. Each Fund pursues its investment objective by investing in a portfolio of exchange-traded futures contracts (each, a “Futures Contract”) that expire in a specific monthregion and trade on a specific exchange in the designated commodity comprisingwest. The responses of countries and political bodies to Russia’s actions, the Benchmark, as defined below or shareslarger overarching tensions, and Ukraine’s military response and the potential for wider conflict may increase financial market volatility generally, have severe adverse effects on regional and global economic markets, and cause volatility in the price of agricultural commodities, agricultural futures and the share price of an Agricultural Funds.
A climate of uncertainty and panic, including the contagion of the UnderlyingCOVID-19 virus and other infectious viruses or diseases, may adversely affect global, regional, and local economies and reduce the availability of potential investment opportunities, and increases the difficulty of performing due diligence and modeling market conditions, potentially reducing the accuracy of financial projections. Under these circumstances, the Funds inmay have difficulty achieving their investment objectives which may adversely impact performance. Further, such events can be highly disruptive to economies and markets, significantly disrupt the caseoperations of TAGS. Each Fund also holds United States Treasury Obligations and/orindividual companies (including, but not limited to, the Funds’ Sponsor and third-party service providers), sectors, industries, markets, securities and commodity exchanges, currencies, interest and inflation rates, credit ratings, investor sentiment, and other high credit quality short-term fixed income securities for deposit withfactors affecting the commodity brokervalue of the Funds’ investments. These factors could cause substantial market volatility, exchange trading suspensions and closures that could impact the ability of the Funds to complete redemptions and otherwise affect Fund performance and Fund trading in the secondary market. A widespread crisis may also affect the global economy in ways that cannot necessarily be foreseen at the current time. How long such events will last and whether they will continue or recur cannot be predicted. Impacts from these events could have significant impact on a Fund’s performance, resulting in losses to your investment. The global economic shocks being experienced as margin.of the date hereof may cause the underlying assumptions and expectations of the Funds to become outdated quickly or inaccurate, resulting in significant losses.
In addition, DEFI is subject to the risks associated with bitcoin. Bitcoin is a digital asset or cryptocurrency that is a unit of account on the “Bitcoin Network,” an open source, decentralized peer-to-peer computer network. The ownership and operation of bitcoin is determined by purchasers in the Bitcoin Network. The Bitcoin Network connects computers that run publicly accessible, or open source, software that follows the rules and procedures governing the Bitcoin Network. This is commonly referred to as the Bitcoin Protocol. Bitcoin may be held, may be used to purchase goods and services or may be exchanged for fiat currency. No single entity owns or operates the Bitcoin Network, and the value of bitcoin is not backed by any government, corporation, or other entity. Instead, the value of bitcoin is determined in part by the supply and demand in markets created to facilitate the trading of bitcoin. Public key cryptography protects the ownership and transaction records for bitcoin. Because the source code for the Bitcoin Network is open source, anyone can contribute to its development. At this time, the ultimate supply of bitcoin is finite and limited to 21 million “coins” with the number of bitcoin available increasing gradually as new bitcoin supplies are mined until the 21 million current protocol cap is reached. The following factors, among others, may affect the price and market for bitcoin: DEFI does not invest directly in bitcoin.
● | How widely bitcoin is adopted, including the use of bitcoin as a payment. |
● | The regulatory environment for cryptocurrencies, which continues to evolve in the U.S., and which may delay, impede, or restrict the adoption or use of bitcoin. |
● | Speculative activity in the market for bitcoin, including by holders of large amounts of bitcoin, which may increase volatility. |
● | Cyberattacks, including the risk that malicious actors will exploit flaws in the code or structure of bitcoin, control the blockchain, steal information or cause disruptions to the internet. |
● | Rewards for mining bitcoin are designed to decline over time, which may lessen the incentive for miners to process and confirm transactions on the Bitcoin Network. |
● | The open-source nature of the Bitcoin Network may result in forks, or changes to the underlying code of bitcoin that result in the creation of new, separate digital assets. |
● | Fraud, manipulation, security failure or operational problems at bitcoin exchanges that result in a decline in adoption or acceptance of bitcoin. |
● | Scalability as the use of bitcoin expands to a greater number of users. |
The Investment Objective of the Funds
The investment objective of CORN is to have the daily changes in percentage termsthe NAV of the Shares’ Net Asset Value (“NAV”)Fund’s Shares reflect the daily changes in percentage terms ofthe corn market for future delivery as measured by the Benchmark. The Benchmark is a weighted average of the closing settlement prices for three futures contracts for corn (“Corn Futures Contracts”) that are traded on the Chicago Board of Trade (“CBOT”):
CORN Benchmark
CBOT Corn Futures Contract | | Weighting | |
Second to expire | 35% | | 35 | % |
Third to expire | 30% | | 30 | % |
December following the third to expire | 35% | | 35 | % |
The investment objective of SOYB is to have the daily changes in percentage termsthe NAV of the Shares’ Net Asset Value (“NAV”)Fund’s Shares reflect the daily changes in percentage terms ofthe soybean market for future delivery as measured by the Benchmark. The Benchmark is a weighted average of the closing settlement prices for three futures contracts for soybeans (“SoybeansSoybean Futures Contracts”) that are traded on the Chicago Board of Trade (“CBOT”):
SOYB Benchmark
CBOT SoybeansSoybean Futures Contract | | Weighting | |
Second to expire (excluding August & September) | 35% | | 35 | % |
Third to expire (excluding August & September) | 30% | | 30 | % |
Expiring in the November following the expiration of the third-to-expirethird to expire contract | 35% | | 35 | % |
The investment objective of CANE is to have the daily changes in percentage termsthe NAV of the Shares’ Net Asset Value (“NAV”)Fund’s Shares reflect the daily changes in percentage terms ofthe sugar market for future delivery as measured by the Benchmark. The Benchmark is a weighted average of the closing settlement prices for three futures contracts for No. 11 sugar (“Sugar Futures Contracts”) that are traded on the ICE Futures US (“ICE”):
CANE Benchmark
ICE Sugar Futures Contract | | Weighting | |
Second to expire | 35% | | 35 | % |
Third to expire | 30% | | 30 | % |
Expiring in the March following the expiration of the third-to-expirethird to expire contract | 35% | | 35 | % |
The investment objective of WEAT is to have the daily changes in percentage termsthe NAV of the Shares’ Net Asset Value (“NAV”)Fund’s Shares reflect the daily changes in percentage terms ofthe wheat market for future delivery as measured by the Benchmark. The Benchmark is a weighted average of the closing settlement prices for three futures contracts for wheat (“Wheat Futures Contracts”) that are traded on the Chicago Board of Trade (“CBOT”):
WEAT Benchmark
CBOT Wheat Futures Contract | | Weighting | |
Second to expire | 35% | | 35 | % |
Third to expire | 30% | | 30 | % |
December following the third-to-expirethird to expire | 35% | | 35 | % |
The investment objective of TAGS is to provide daily investment results that reflect the combined daily performance of four other commodity pools, specifically CORN, SOYB, CANE and WEAT (the “Underlying Funds”). Under normal market conditions, the Fund seeks to achieve its investment objective generally by investing equally in shares of each Underlying Fund and, to a lesser extent, cash equivalents. The Fund’s investments in shares of Underlying Funds are rebalanced, generally on a daily basis, in order to maintain approximately a 25% allocation of the Fund’s assets to each Underlying Fund:
TAGS Benchmark
Underlying Fund | | Weighting | |
CORN | | | 25 | % |
SOYB | | | 25 | % |
CANE | | | 25 | % |
WEAT | | | 25 | % |
The investment objective of DEFI is to have the daily changes in percentage terms of the NAV of itsthe Fund’s Shares reflect the daily changes in percentage terms of a weighted average (the “Underlying Fund Average”) of the NAVs per share of four other commodity pools that are seriesprice of the Trust and are sponsored by the Sponsor: the Teucrium CornHashdex U.S. Bitcoin Futures Fund the Teucrium Wheat Fund, the Teucrium Soybean Fund and the Teucrium Sugar Fund (collectively, the “Underlying Funds”Benchmark (the “Benchmark”). The Underlying Fund Average will have a weighting of 25% to each Underlying Fund, and, less expenses from the Fund’s assets will be rebalanced, generally on a daily basis, to maintainoperations. The Benchmark is currently the approximate 25% allocation to each Underlying Fund:
TAGS Benchmark
Underlying Fund | Weighting |
CORN | 25% |
SOYB | 25% |
CANE | 25% |
WEAT | 25% |
This weighted average of the referenced specificclosing settlement prices for the first to expire and second to expire bitcoin futures contracts (“Bitcoin Futures Contracts for each Fund is referred to herein asContracts”) listed on the “Benchmark,” and the specific Futures Contracts that at any given time make up theChicago Mercantile Exchange Inc. (“CME”).
DEFI Benchmark for that Fund and are referred to herein as the “Benchmark Component Futures Contracts.”
CME Bitcoin Futures Contract | | Weighting | |
First to expire | | | 50 | % |
Second to expire | | | 50 | % |
The notional amount of each Benchmark Component Futures Contract included in each Benchmark is intended to reflect the changes in market value of each such Benchmark Component Futures Contract within the Benchmark. The closing level of each Benchmark is calculated on each business day by U.S. BancorpBank Global Fund Services LLC (the “Administrator”(“Global Fund Services”) based on the closing price of the futures contracts for each of the underlying Benchmark Component Futures Contracts and the notional amounts of such Benchmark Component Futures Contracts.
Each Benchmark is rebalanced periodically to ensure that each of the Benchmark Component Futures Contracts is weighted in the same proportion as in the investment objective for each Fund. The following tables reflect the September 30, 2017,March 31, 2024, Benchmark Component Futures Contracts weights for each of the Funds. TheFunds, the contract held is identified by the generally accepted nomenclature of contract month and year, which may differ from the month in which the contract expires:
| CORN Benchmark Component Futures Contracts | | Notional Value | | | Weight
(%) | |
| | | | | | | |
| CBOT Corn Futures (1,281 contracts, MAR18) | | $ | 23,554,388 | | | | 35 | % |
| CBOT Corn Futures (1,073 contracts, MAY18) | | | 20,185,813 | | | | 30 | |
| CBOT Corn Futures (1,183 contracts, DEC18) | | | 23,630,425 | | | | 35 | |
| | | | | | | | | |
| Total at September 30, 2017 | | $ | 67,370,626 | | | | 100 | % |
CORN Benchmark Component Futures Contracts | | Notional Value | | | Weight (%) | |
CBOT Corn Futures (1,072 contracts, JUL24) | | $ | 24,361,200 | | | | 35 | % |
CBOT Corn Futures (901 contracts, SEP24) | | | 20,925,725 | | | | 30 | |
CBOT Corn Futures (1,022 contracts, DEC24) | | | 24,413,025 | | | | 35 | |
| | | | | | | | | |
Total at March 31, 2024 | | $ | 69,699,950 | | | | 100 | % |
| SOYB Benchmark Component Futures Contracts | | Notional
Value | | | Weight
(%) | |
| | | | | | | |
| CBOT Soybean Futures (144 contracts, JAN18) | | $ | 7,045,200 | | | | 35 | % |
| CBOT Soybean Futures (123 contracts, MAR18) | | | 6,074,663 | | | | 30 | |
| CBOT Soybean Futures (143 contracts, NOV18) | | | 7,051,688 | | | | 35 | |
| | | | | | | | | |
| Total at September 30, 2017 | | $ | 20,171,551 | | | | 100 | % |
SOYB Benchmark Component Futures Contracts | | Notional Value | | | Weight (%) | |
| | | | | | | | | |
CBOT Soybean Futures (197 contracts, JUL24) | | $ | 11,871,713 | | | | 35 | % |
CBOT Soybean Futures (172 contracts, NOV24) | | | 10,201,705 | | | | 30 | |
CBOT Soybean Futures (204 contracts, NOV25) | | | 11,860,050 | | | | 35 | |
| | | | | | | | | |
Total at March 31, 2024 | | $ | 33,933,513 | | | | 100 | % |
| CANE Benchmark Component Futures Contracts | | Notional
Value | | | Weight
(%) | |
| | | | | | | |
| ICE Sugar Futures (145 contracts, MAY18) | | $ | 2,309,328 | | | | 35 | % |
| ICE Sugar Futures (122 contracts, JUL18) | | | 1,966,250 | | | | 30 | |
| ICE Sugar Futures (135 contracts, MAR19) | | | 2,314,872 | | | | 35 | |
| | | | | | | | | |
| Total at September 30, 2017 | | $ | 6,590,450 | | | | 100 | % |
CANE Benchmark Component Futures Contracts | | Notional Value | | | Weight (%) | |
| | | | | | | | | |
ICE Sugar Futures (234 contracts, JUL24) | | $ | 5,805,072 | | | | 35 | % |
ICE Sugar Futures (201 contracts, OCT24) | | | 4,963,896 | | | | 30 | |
ICE Sugar Futures (233 contracts, MAR25) | | | 5,769,826 | | | | 35 | |
| | | | | | | | | |
Total at March 31, 2024 | | $ | 16,538,794 | | | | 100 | % |
| WEAT Benchmark Component Futures Contracts | | Notional
Value | | | Weight
(%) | |
| | | | | | | |
| CBOT Wheat Futures (1,016 contracts, MAR18) | | $ | 23,698,200 | | | | 35 | % |
| CBOT Wheat Futures (848 contracts, MAY18) | | | 20,320,200 | | | | 30 | |
| CBOT Wheat Futures (908 contracts, DEC18) | | | 23,812,300 | | | | 35 | |
| | | | | | | | | |
| Total at September 30, 2017 | | $ | 67,830,700 | | | | 100 | % |
WEAT Benchmark Component Futures Contracts | | Notional Value | | | Weight (%) | |
| | | | | | | | | |
CBOT Wheat Futures (1,915 contracts, JUL24) | | $ | 55,128,063 | | | | 35 | % |
CBOT Wheat Futures (1,599 contracts, SEP24) | | | 47,290,425 | | | | 30 | |
CBOT Wheat Futures (1,800 contracts, DEC24) | | | 55,080,000 | | | | 35 | |
| | | | | | | | | |
Total at March 31, 2024 | | $ | 157,498,488 | | | | 100 | % |
| TAGS Benchmark Component Futures Contracts | | Fair Value | | | Weight (%) | |
| Shares of Teucrium Corn Fund (16,808 shares) | | $ | 295,854 | | | | 25 | % |
| Shares of Teucrium Soybean Fund (16,331 shares) | | | 299,411 | | | | 25 | |
| Shares of Teucrium Wheat Fund (45,937 shares) | | | 301,700 | | | | 26 | |
| Shares of Teucrium Sugar Fund (29,524 shares) | | | 278,403 | | | | 24 | |
| | | | | | | | | |
| Total at September 30, 2017 | | $ | 1,175,368 | | | | 100 | % |
TAGS Benchmark Component Futures Contracts | | Fair Value | | | Weight (%) | |
Shares of Teucrium Corn Fund (181,115 shares) | | $ | 3,661,367 | | | | 25 | % |
Shares of Teucrium Soybean Fund (142,076 shares) | | | 3,574,703 | | | | 25 | |
Shares of Teucrium Wheat Fund (682,062 shares) | | | 3,673,518 | | | | 25 | |
Shares of Teucrium Sugar Fund (267,233 shares) | | | 3,605,828 | | | | 25 | |
| | | | | | | | | |
Total at March 31, 2024 | | $ | 14,515,416 | | | | 100 | % |
The price relationship between the near month Futures Contract to expire and the Benchmark Component Futures Contracts will vary and may impact both the total return of each Fund over time and the degree to which such total return tracks the total return of the price indices related to the commodity of each Fund. In cases in which the near month contract’s price is lower than later-expiringlater expiring contracts’ prices (a situation known as “contango” in the futures markets), then absent the impact of the overall movement in commodity prices the value of the Benchmark Component Futures Contracts would tend to decline as they approach expiration. In cases in which the near month contract’s price is higher than later-expiringlater expiring contracts’ prices (a situation known as “backwardation” in the futures markets), then absent the impact of the overall movement in a Fund’s prices the value of the Benchmark Component Futures Contracts would tend to rise as they approach expiration, all other things being equal.
The total portfolio composition for each Fund is disclosed each business day that the NYSE Arca is open for trading on the Fund’sSponsor’s website. The website for CORNthe Agricultural Funds and the Sponsor iswww.teucriumcornfund.com; www.teucrium.com. The website for CANEthe Hashdex Bitcoin Futures ETF iswww.teucriumcanefund.com; for SOYB iswww.teucriumsoybfund.com; for WEAT iswww.teucriumweatfund.com; for TAGS iswww.teucriumtagsfund.com. These sites www.hashdex-etfs.com. The website(s) are accessible at no charge. The website disclosure of portfolio holdings is made daily and includes, as applicable, the name and value of each Futures Contract, other commodity interestor cryptocurrency interests and the amount of cash and cash equivalents held in the Fund’s portfolio. The specific types of other commodity interests held (if any, which may include options on futures contracts and derivative contracts such as swaps) (collectively,collectively, “Other Commodity Interests,” and together with Futures Contracts, “Commodity Interests” or “Interests”) (in in addition to futures contracts, options on futures contracts and derivative contracts)contracts that are tied to various commodities are entered into outside of public exchanges. These “over-the-counter”“over the counter” contracts are entered into between two parties in private contracts, or on a recently formed swap execution facility (“SEF”) for standardized swaps. For example, unlike Futures Contracts, which are guaranteed by a clearing organization, each party to an over-the-counterover the counter derivative contract bears the credit risk of the other party (unless such over-the-counterover the counter swap is cleared through a derivatives clearing organization (“DCO”)), i.e., the risk that the other party will not be able to perform its obligations under its contract, and characteristics of such Other Commodity Interests.
Consistent with achieving a Fund’s investment objective of closely tracking the Benchmark, the Sponsor may for certain reasons cause thea Fund to enter into or hold Futures Contracts other than the Benchmark Component Futures Contracts and/or Other Commodity or Cryptocurrency Interests. Other Commodity or Cryptocurrency Interests that do not have standardized terms and are not exchange-traded,exchange traded, referred to as “over-the-counter” Corn“over the counter” Commodity or Cryptocurrency Interests, can generally be structured as the parties to the CornCommodity or Cryptocurrency Interest contract desire. Therefore, each Fund might enter into multiple and/or over-the-counterover the counter Interests intended to replicate the performance of each of the Benchmark Component Futures Contracts for thea Fund, or a single over-the-counterover the counter Interest designed to replicate the performance of the Benchmark as a whole. Assuming that there is no default by a counterparty to an over-the-counterover the counter Interest, the performance of the Interest will necessarily correlate with the performance of the Benchmark or the applicable Benchmark Component Futures Contract. Each Fund might also enter into or hold Interests other than Benchmark Component Futures Contracts to facilitate effective trading, consistent with the discussion of the Fund’s “roll” strategy. In addition, each Fund might enter into or hold Interests that would be expected to alleviate overall deviation between the Fund’s performance and that of the Benchmark that may result from certain market and trading inefficiencies or other reasons. By utilizing certain or all of the investments described above, the Sponsor will endeavor to cause the Fund’s performance to closely track that of the Benchmark of theeach Fund.
An “exchange for related position” (“EFRP”) can be used by theeach Agricultural Fund as a technique to facilitate the exchanging of a futures hedge position against a creation or redemption order, and thus theeach Fund may use an EFRP transaction in connection with the creation and redemption of shares. The market specialist/market maker that is the ultimate purchaser or seller of shares in connection with the creation or redemption basket, respectively, agrees to sell or purchase a corresponding offsetting futures position which is then settled on the same business day as a cleared futures transaction by the FCMs. The Fund will become subject to the credit risk of the market specialist/market maker until the EFRP is settled within the business day, which is typically 7 hours or less. TheEach Fund reports all activity related to EFRP transactions under the procedures and guidelines of the CFTC and the exchanges on which the futures are traded.
The Funds seek to earn interest and other income (“interest income”) from cash equivalents that it purchases and, on the cash it holds through the Custodian or other financial institution.institutions. The Sponsor anticipates that the interest income will increase the NAV of each Fund. The Funds apply the interest income to the acquisition of additional investments or use it to pay its expenses. If the Fund reinvests the earned interest income, it makes investments that are consistent with its investment objectives as disclosed. Any cash equivalent invested by a Fund will have original maturity dates of three and nine months or less at inception. Any cash equivalentsequivalent invested by a Fund will be rated in the highest short-term rating category by a nationally recognized statistical rating organization or will be deemed by the Sponsor to be of investment grade quality. At the endAs of the quarter,March 31, 2024, available cash balances in each of the Funds were invested in either the Fidelity Institutional Money Market FundsFirst American Government Obligations Fund – Class X, Goldman Sachs Financial Square Government Portfolio orFund, in demand deposits at Rabobank, N.A. Effective October 3, 2017, CORNCapital One, and WEAT purchasedin commercial paper with maturities of ninety days or lessless. Additionally, the CORN, SOYB, CANE, WEAT and DEFI Funds may invest a portion of the amount of funds required to be deposited with the FCM as describedinitial margin in U.S. Treasury obligations with time to maturity of 90 days or less. The obligations are purchased and held in the prospectus supplements filed withrespective Fund accounts through the SEC on October 2, 2017.FCM.
In managing the assets of the Funds, the Sponsor does not use a technical trading system that automatically issues buy and sell orders. Instead, the Sponsor will purchase or sell the specific underlying Commodity or Cryptocurrency Interests with an aggregate market value that approximates the amount of cash received or paid upon the purchase or redemption of Shares.
The Sponsor doesanticipates managing each Fund in a way that tracks the stated benchmark. The Agricultural Funds’ benchmarks do not hold spot futures and therefore do not anticipate letting the commodity Futures Contracts of any Fund expire, thus takingavoiding delivery of the underlying commodity. Instead,instead, the Sponsor will close out existing positions, for instance, in response to ongoingordinary scheduled changes in the Benchmark or, if at the Sponsor’s sole discretion, it otherwise determines it would be appropriate to do so, andwill reinvest the proceeds in new Commodity or Cryptocurrency Interests. Positions may also be closed out to meet redemption orders, in which case the proceeds from closing the positions are not reinvested. DEFI does hold spot month futures, but the Fund will not be reinvested.trade or roll these contracts on the exchange before delivery or receipt of the underlying cryptocurrency is required.
The Sponsor employs a “neutral” investment strategy intended to track the changes in the Benchmark of each Fund regardless of whether the Benchmark goes up or goes down. The Fund’s “neutral” investment strategy is designed to permit investors generally to purchase and sell the Fund’s Shares for the purpose of investing indirectly in the commodity-specificcommodity specific market in a cost-effective manner. Such investors may include participants in the specific industry and other industries seeking to hedge the risk of losses in their commodity-specific-relatedcommodity specific related transactions, as well as investors seeking exposure to that commodity market. Accordingly, depending on the investment objective of an individual investor, the risks generally associated with investing in the commodity-specificcommodity or cryptocurrency specific market and/or the risks involved in hedging may exist. In addition, an investment in a Fund involves the risksrisk that the changes in the price of the Fund’s Shares will not accurately track the changes in the Benchmark, and that changes in the Benchmark will not closely correlate with changes in the price of the commodity or cryptocurrency on the spot market. The Sponsor does not intend to operate each Fund in a fashion such that its per share NAV equals, in dollar terms, the spot price of the commodity or the price of any particular commodity-specificcommodity or cryptocurrency specific Futures Contract.
The Sponsor
Teucrium Trading, LLC is the sponsor of the Trust and each of the series of the Trust. The Sponsor is a Delaware limited liability company, formed on July 28, 2009. The principal office is located at 232 Hidden Lake Road, Brattleboro,Three Main Street, Suite 215, Burlington, Vermont 05301.05401. The Sponsor is registered as a commodity pool operator (“CPO”) and a commodity trading adviser (“CTA”) with the Commodity Futures Trading Commission (“CFTC”) and becameis a member of the National Futures Association (“NFA”) on November 10, 2009.. Teucrium Investment Advisors, LLC, a wholly owned subsidiary of Teucrium Trading, LLC, is a Delaware limited liability company, which was formed on January 4, 2022. Teucrium Investment Advisors, LLC is a U.S. SEC registered investment advisor. Teucrium Investment Advisors, LLC was registered with the CFTC as a commodity trading advisor withCPO on May 2, 2022, a CTA on May 2, 2022, and a Swap Firm on May 9, 2022. Teucrium Investment Advisors, LLC became a member of the NFA effective September 8, 2017. on May 9, 2022. Teucrium became a listed principal of Teucrium Investment Advisors, LLC on May 20, 2022.
Effective July 2, 2023, ConvexityShares LLC ("ConvexityShares") resigned from its position as sponsor of the ConvexityShares Trust (the “ConvexityShares Trust”) and Teucrium Trading, LLC was appointed concurrently as the new sponsor of the ConvexityShares Trust. The ConvexityShares Trust filed a current report on Form 8-K on July 3, 2023, describing the transactions pursuant to which Teucrium Trading, LLC, replaced ConvexityShares as sponsor of the ConvexityShares Trust. The Form 8-K can be found here: https://www.sec.gov/ix?doc=/Archives/edgar/data/1817218/000121390023053886/ea181271-8k_convexity.htm.
Additionally, Teucrium Trading LLC, as the sponsor of ConvexityShares Trust, announced in a press release dated November 1, 2023 that it will close the ConvexityShares Daily 1.5 SPIKES Futures ETF and ConvexityShares 1x SPIKES Futures ETF (together, the “ConvexityShares Funds”). Teucrium Trading, LLC, determined that the closure of the ConvexityShares Funds is advisable because of a recent announcement by the Minneapolis Grain Exchange, LLC (“MGEX”) that the SPIKES™ Volatility Index Futures (“SPIKES Futures”) in which the ConvexityShares Funds invest will cease trading at close of trading (4:00pm CT) on Friday, December 29, 2023. Therefore, MGEX has filed to suspend trading and clearing of certain previously listed SPIKES Futures contracts that expire in or after January 2024. Further detail may be obtained by accessing the Form 8-K filed by the Teucrium Commodities Trust on November 1, 2023, available here: https://www.sec.gov/ix?doc=/Archives/edgar/data/1817218/000121390023081930/ea187567-8k_convexity.htm.
The Trust and the Funds operate pursuant to the Trust Agreement.
Under the Trust Agreement, the Sponsor is solely responsible for the management and conducts or directs the conduct of the business of the Trust, the Funds,Fund, and any other Fundseries of the Trust that may from time to time be established and designated by the Sponsor. The Sponsor is required to oversee the purchase and sale of Shares by firms designated as “Authorized Purchasers”Authorized Purchasers and to manage the Funds’Fund’s investments, including to evaluate the credit risk of futures commission merchantsFCMs and swap counterparties and to review daily positions and margin/collateral requirements. The Sponsor has the power to enter into agreements as may be necessary or appropriate for the offer and sale of the Funds’Fund’s Shares and the conductoversight of the Trust’s activities. Accordingly, the Sponsor is responsible for selecting the Trustee, Administrator, Distributor, the independent registered public accounting firm of the Trust, and any legal counsel employed by the Trust. The Sponsor is also responsible for preparing and filing periodic reports on behalf of the Trust with the SEC and providingwill provide any required certification for such reports. No person other than the Sponsor and its principals was involved in the organization of the Trust or the Funds.Fund.
Teucrium Trading, LLC designs the Funds to offer liquidity, transparency, and capacity in single-commodity investing for a variety of investors, including institutions and individuals, in an exchange-traded product format. The Funds have also been designed to mitigate the impacts of contango and backwardation, situations that can occur in the course of commodity trading which can affect the potential returns to investors. Backwardation is defined as a market condition in which a futures price of a commodity is lower in the distant delivery months than in the near delivery months, while contango, the opposite of backwardation, is defined as a condition in which distant delivery prices for futures exceed spot prices, often due to the costs of storing and insuring the underlying commodity.
The Sponsor has a patent on certain business methods and procedures used with respect to the Funds.
Performance Summary
This report covers the periods from January 1 to September 30, 2017March 31, 2024 for each Fund.CORN, SOYB, CANE, WEAT, TAGS and DEFI. Total expenses are presented both gross and net of any expenses waived or paid by the Sponsor that would have been incurred by the Funds (“expenses waived by the Sponsor”).
| CORN Per Share Operation Performance | | | | | |
| Net asset value at beginning of period | | $ | 18.77 | | | $ | 21.61 | |
| Loss from investment operations: | | | | | |
Income from investment operations: | | | - | |
| Investment income | | | 0.15 | | | 0.27 | |
| Net realized and unrealized loss on commodity futures contracts | | | (0.79 | ) | | (1.53 | ) |
| Total expenses | | | (0.53 | ) | | | (0.13 | ) |
| Net decrease in net asset value | | | (1.17 | ) | | | (1.39 | ) |
| Net asset value end of period | | $ | 17.60 | | | $ | 20.22 | |
| Total Return | | | (6.23 | )% | | -6.47 | % |
| Ratios to Average Net Assets (Annualized) | | | | | | |
| Total expenses | | | 4.29 | % | | 2.72 | % |
| Total expenses, net | | | 3.78 | % | | 2.72 | % |
| Net investment loss | | | (2.72 | )% | |
| | | | | | |
| SOYB Per Share Operation Performance | | | | | |
| Net asset value at beginning of period | | $ | 19.08 | | |
| Loss from investment operations: | | | | | |
| Investment income | | | 0.15 | | |
| Net realized and unrealized loss on commodity futures contracts | | | (0.38 | ) | |
| Total expenses | | | (0.52 | ) | |
| Net decrease in net asset value | | | (0.75 | ) | |
| Net asset value at end of period | | $ | 18.33 | | |
| Total Return | | | (3.93 | )% | |
| Ratios to Average Net Assets (Annualized) | | | | | |
| Total expenses | | | 4.34 | % | |
| Total expenses, net | | | 3.70 | % | |
| Net investment loss | | | (2.63 | )% | |
Net investment income | | | 2.60 | % |
| CANE Per Share Operation Performance | | | | |
SOYB Per Share Operation Performance | | | |
| Net asset value at beginning of period | | $ | 12.97 | | | $ | 27.03 | |
| Loss from investment operations: | | | | |
Income from investment operations: | | | - | |
| Investment income | | 0.09 | | | 0.34 | |
| Net realized and unrealized loss on commodity futures contracts | | (3.40 | ) | | (2.00 | ) |
| Total expenses | | (0.23 | ) | |
Total expenses, net | | | | (0.21 | ) |
| Net decrease in net asset value | | (3.54 | ) | | | (1.87 | ) |
| Net asset value at end of period | | $ | 9.43 | | | $ | 25.16 | |
| Total Return | | (27.29 | )% | | -6.91 | % |
| Ratios to Average Net Assets (Annualized) | | | | |
| Total expenses | | 4.41 | % | | 3.28 | % |
| Total expenses, net | | 2.82 | % | | 3.28 | % |
| Net investment loss | | (1.77 | )% | |
| | | | | |
| WEAT Per Share Operation Performance | | | | |
| Net asset value at beginning of period | | $ | 6.89 | | |
| Loss from investment operations: | | | | |
| Investment income | | 0.05 | | |
| Net realized and unrealized loss on commodity futures contracts | | (0.18 | ) | |
| Total expenses | | (0.19 | ) | |
| Net decrease in net asset value | | (0.32 | ) | |
| Net asset value at end of period | | $ | 6.57 | | |
| Total Return | | (4.64 | )% | |
| Ratios to Average Net Assets (Annualized) | | | | |
| Total expenses | | 3.88 | % | |
| Total expenses, net | | 3.66 | % | |
| Net investment loss | | (2.60 | )% | |
Net investment income | | | 2.10 | % |
| TAGS Per Share Operation Performance | | | |
| Net asset value at beginning of period | | $ | 26.33 | |
| Loss from investment operations: | | | | |
| Investment income | | | 0.00 | |
| Net realized and unrealized loss on investment transactions | | | (2.70 | ) |
| Total expenses | | | (0.10 | ) |
| Net decrease in net asset value | | | (2.80 | ) |
| Net asset value at end of period | | $ | 23.53 | |
| Total Return | | | (10.63 | )% |
| Ratios to Average Net Assets (Annualized) | | | | |
| Total expenses | | | 3.99 | % |
| Total expenses, net | | | 0.50 | % |
| Net investment loss | | | (0.50 | )% |
CANE Per Share Operation Performance | | | | |
Net asset value at beginning of period | | $ | 12.44 | |
Income (loss) from investment operations: | | | - | |
Investment income | | | 0.17 | |
Net realized and unrealized gain on commodity futures contracts | | | 1.01 | |
Total expenses, net | | | (0.13 | ) |
Net increase in net asset value | | | 1.05 | |
Net asset value at end of period | | $ | 13.49 | |
Total Return | | | 8.51 | % |
Ratios to Average Net Assets (Annualized) | | | | |
Total expenses | | | 4.04 | % |
Total expenses, net | | | 4.04 | % |
Net investment income | | | 1.24 | % |
WEAT Per Share Operation Performance | | | | |
Net asset value at beginning of period | | $ | 5.98 | |
Income (loss) from investment operations: | | | | |
Investment income | | | 0.07 | |
Net realized and unrealized loss on commodity futures contracts | | | (0.62 | ) |
Total expenses, net | | | (0.04 | ) |
Net decrease in net asset value | | | (0.59 | ) |
Net asset value at end of period | | $ | 5.39 | |
Total Return | | | (9.93 | )% |
Ratios to Average Net Assets (Annualized) | | | | |
Total expenses | | | 2.80 | % |
Total expenses, net | | | 2.80 | % |
Net investment income | | | 2.45 | % |
TAGS Per Share Operation Performance | | | | |
Net asset value at beginning of period | | $ | 29.45 | |
Income from investment operations: | | | | |
Net realized and unrealized loss on investment transactions | | | (1.09 | ) |
Total expenses | | | (0.01 | ) |
Net decrease in net asset value | | | (1.10 | ) |
Net asset value at end of period | | $ | 28.35 | |
Total Return | | | (3.77 | )% |
Ratios to Average Net Assets (Annualized) | | | | |
Total expenses | | | 1.76 | % |
Total expenses, net | | | 0.09 | % |
Net investment loss | | | (0.09 | )% |
DEFI Per Share Operation Performance | | | | |
Net asset value at beginning of period | | $ | 50.74 | |
Income (loss) from investment operations: | | | | |
Investment income | | | 0.02 | |
Net assets transferred to Acquired Fund | | | (51.48 | ) |
Net realized and unrealized gain on cryptocurrency futures contracts | | | 0.72 | |
Total expenses, net | | | 0.00 | |
Net decrease in net asset value | | | (50.74 | ) |
Net asset value at end of period | | $ | - | |
Total Return | | | 0.00 | % |
Ratios to Average Net Assets (Annualized) | | | | |
Total expenses | | | 286.28 | % |
Total expenses, net | | | 0.92 | % |
Past performance of a Fund is not necessarily indicative of future performance.
Results of Operations
The following includes a section for each Fund of the Trust.
The discussion below addresses the material changes in the results of operations for the three and nine months ended September 30, 2017March 31, 2024 compared to the same periodsperiod in 2016.2023. The following includes a section for each Fund of the Trust for the periods in which each Fund was in operation. CORN, SOYB, WEAT, CANE and TAGS each operated for the entirety of all periods. For DEFI, as reported by the registrant on a Form 8-K filed with the Securities and Exchange Commission on November 7, 2023 (File No. 001-34765), Teucrium Commodity Trust (the “Teucrium Trust”), on behalf of its series, Hashdex Bitcoin Futures ETF (“Acquired Fund”), and Tidal Commodities Trust I (“Acquiring Trust”), on behalf of its series, Hashdex Bitcoin Futures ETF (“Acquiring Fund”), entered into an Agreement and Plan of Partnership Merger and Liquidation dated as of October 30, 2023 (the “Plan of Merger”). The Merger closed on January 3, 2024 (the “Closing Date”).
Pursuant to the Plan of Merger, each Acquired Fund shareholder received one share of the Acquiring Fund for every one share of the Acquired Fund held on the Closing Date based on the net asset value per share of the Acquiring Fund being equal to the net asset value per share of the Acquired Fund determined immediately prior to the Merger closing. Upon the Merger closing, the Acquiring Fund acquired all the assets of the Acquired Fund and assumed all the liabilities of the Acquired Fund. Upon the Merger closing, the Plan of Merger caused all of the Acquired Fund’s shares to be cancelled and the Acquired Fund to be liquidated.
The sponsor of the Teucrium Trust, Teucrium Trading, LLC (“Teucrium”), is not receiving any compensation dependent on the consummation of the Merger. Pursuant to a certain Amended and Restated ‘33 Act Fund Platform Support Agreement, as amended (the “Support Agreement”) among Tidal Investments LLC (f/k/a Toroso Investments, LLC) (“Tidal”), Tidal ETF Services, LLC, Hashdex Asset Management Ltd., and Teucrium, Tidal has agreed to provide Teucrium after the Merger with a monthly amount equal to the greater of seven percent (7%) of the management fee paid to Tidal from the Acquiring Fund and 0.04% of monthly average net assets of the Acquiring Fund (“Teucrium Compensation”). Any payment of the Teucrium Compensation will be made from the resources of Tidal and not from the assets of the Acquiring Fund.
Total expenses for the current and comparative periods are presented both gross and net of any expenses waived or paid by the Sponsor that would have been incurred by the Funds (“expenses waived by the Sponsor”). For all expenses waived in 20162023 and 2017,2024, the Sponsor has determined that no reimbursement will be sought in future periods. “Total expenses, net” is after the impact of any expenses waived by the Sponsor, and are presented in the same manner as previously reported. There is, therefore, no impact to or change in the Net gain or Net loss in any period for the Trust and each Fund as a result of this change in presentation.
The Sponsor is responsible for investing the assets of the FundFunds in accordance with the objectives and policies of theeach Fund. In addition, the Sponsor arranges for one or more third parties to provide administrative, custodial, accounting, transfer agency, compliance, and other necessary services to the Fund, including services directly attributable to the FundFunds such as accounting, financial reporting, regulatory compliance, and trading activities, whichactivities. In some cases, at its discretion, the Sponsor electedmay elect not to outsource. outsource certain of these expenses.
In addition, the Agricultural Funds, except for TAGS, which has no such fee are contractually obligated to pay a monthly management fee to the Sponsor, based on average daily net assets, at a rate equal to 1.00% per annum.
The FundAgricultural Funds generally payspay for all brokerage fees, taxes, and other expenses, including licensing fees for the use of intellectual property, registration or other fees paid to the SEC, the Financial Industry Regulatory Authority (“FINRA”), or any other regulatory agency in connection with the offer and sale of subsequent Shares after its initial registration and all legal, accounting, printing and other expenses associated therewith. Each Fund also pays its portion of the fees and expenses associated with the Trust’s tax accounting and reporting requirements. Certain aggregate expenses common to all Funds within the Trust are allocated by the Sponsor to the respective funds based on activity drivers deemed most appropriate by the Sponsor for such expenses, including but not limited to relative assets under management and creation and redemption order activity. These aggregate common expenses include, but are not limited to, legal, auditing, accounting and financial reporting, tax-preparation, regulatory compliance, trading activities, and insurance costs, as well as fees paid to the Distributor, which are included in the related line item in the statements of operations. A portion of these aggregate common expenses are related to services provided by the Sponsor or related parties of principals of the Sponsor; these are necessary services to the Funds, which are primarily the cost of performing accounting and financial reporting, regulatory compliance, and trading activities that are directly attributable to the Funds and are, primarily, included as distribution and marketing fees on the statements of operations. These amounts, for the Trust and for each Fund, are detailed in the notes to the financial statements included in Part I of this filing.
DEFI is contractually obligated to pay a monthly management fee to the Sponsor, based on average daily net assets, at a rate equal to 0.94% per annum. From the Management Fee, the Sponsor pays all of the routine operational, administrative and other ordinary expenses of the Fund, generally as determined by the Sponsor, including but not limited to, fees and expenses of the Administrator, Custodian, Distributor, Transfer Agent, licensors, accounting and audit fees expenses, tax preparation expenses, legal fees, ongoing SEC registration fees, individual Schedule K-1 preparation and mailing fees, and report preparation and mailing expenses. These fees and expenses are not included in the breakeven table because they are paid for by the Sponsor through the proceeds from the Management Fee. The Fund pays all of its non-recurring and unusual fees and expenses, if any, as determined by the Sponsor. Non-recurring and unusual fees and expenses are unexpected or unusual in nature, such as legal claims and liabilities and litigation costs or indemnification or other unanticipated expenses. Extraordinary fees and expenses also include material expenses which are not currently anticipated obligations of the Fund. Routine operational, administrative, and other ordinary expenses are not deemed extraordinary expenses.
The Sponsor canhas the ability to elect to pay certain expenses on behalf of the Funds or waive the management fee. This election is subject to change by the Sponsor, at its discretion. Expenses paid by the Sponsor and Managementmanagement fees waived by the Sponsor are, if applicable, presented as waived expenses in the statements of operations for each Fund.
Teucrium Corn Fund
The Teucrium Corn Fund commenced investment operations on June 9, 2010. The investment objective of the Corn Fund is to have the daily changes in percentage terms of the Shares’ NAV reflect the daily changes in percentage terms of a weighted average of the closing settlement prices for three futures contracts for corn (“Corn Futures Contracts”) that are traded on the Chicago Board of Trade (“CBOT”), specifically (1) the second-to-expiresecond to expire CBOT Corn Futures Contract, weighted 35%, (2) the third-to-expirethird to expire CBOT Corn Futures Contract, weighted 30%, and (3) the CBOT Corn Futures Contract expiring in the December following the expiration month of the third-to-expirethird to expire contract, weighted 35%. The Fund does not track the spot price of corn.
On September 30, 2017,March 31, 2024, the Corn Fund held a total of 2,995 CBOT Corn Futures contracts with a notional value of $69,699,950. The contracts had 3,825,004 shares outstandingan asset fair value of $154,412 and net assetsa liability fair value of $67,327,657. This$3,932,723. The weighting of the notional value of the contracts is in comparison to 4,125,004 shares outstanding and net assets of $77,172,176 on September 30, 2016 and 3,500,004 shares outstanding with net assets of $66,830,725 on June 30, 2017. Shares outstanding decreased by 300,000 or 7% for the period ended September 30, 2017 when compared to September 30, 2016 and increased by 325,000 or 9% for the period ended September 30, 2017 when compared to June 30, 2017. In the opinion of management, this decrease year over year was dueas follows: (1) 35% to the higher than expected global corn productionJUL24 contracts, the second to expire CBOT Corn Futures Contract, (2) 30% to SEP24 CBOT contracts, the third to expire CBOT Corn Futures Contract, and (3) 35% to DEC24 CBOT contracts, the CBOT Corn Futures Contract expiring in the northern hemisphere. When comparing September 30, 2017 with June 30, 2017, there was an increase dueDecember following the expiration month of the third to uncertainty concerning global weather patterns and a decrease in the price, which had generated investor interest.expire contract.
| | | Quarter Ending | | | Quarter Ending | | | Year Ending | |
| | | March 31, 2024 | | | March 31, 2023 | | | December 31, 2023 | |
Total Net Assets | | $ | 69,744,097 | | | $ | 115,625,057 | | | $ | 81,050,442 | |
Shares Outstanding | | | 3,450,004 | | | | 4,575,004 | | | | 3,750,004 | |
Net Asset Value per share | | $ | 20.22 | | | $ | 25.27 | | | $ | 21.57 | |
Closing Price | | $ | 20.18 | | | $ | 25.23 | | | $ | 21.61 | |
Total net assets for the Fund were $67,327,657 on September 30, 2017 compared to $77,172,176 on September 30, 2016 and $66,830,725 on June 30, 2017. The Net Asset Values (“NAV”) per share related to these balances were $17.60, $18.71 and $19.09 respectively. This represents a decrease in total net assets for thedecreased year over year of 13%by 40%, driven by a combination of a decrease in total shares outstanding of 7%1,125,000 shares or 25% and a changedecrease in the NAV per share whichof ($5.06) or 20%. The net assets for the Fund decreased by 6%. When14% when comparing September 30, 2017 with June 30, 2017, there was an increaseMarch 31, 2024, to December 31, 2023. The change in total net assets year over year, in the opinion of 1%, driven bymanagement, was generally due to a combination of an increase in total shares outstanding of 9% and a change in the NAV per share which decreased by 8%. The closing prices per share for September 30, 2017 and 2016 and June 30, 2017, as reported by the NYSE Arca, were $17.64, $18.68 and $19.05, respectively. The change from September 30, 2017 over the same period last year was a 6% decrease, and a 7% decrease from June 30, 2017.
The graph below shows the actual shares outstanding, total net assets (or AUM) and net asset value per share (NAV per share) for the Fund from inception to September 30, 2017 and serves to illustrate the relative changes of these components.
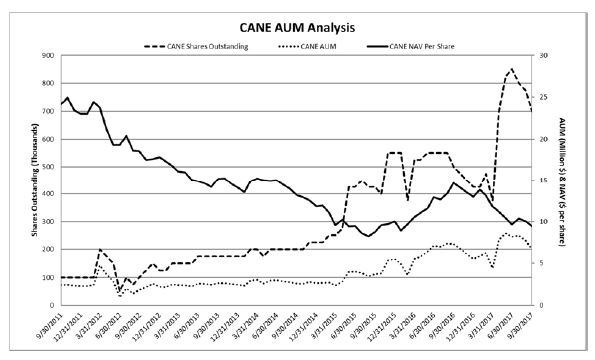
The total loss for the three-month period ended September 30, 2017 was ($4,763,833) resulting primarily from the net change in realized loss on commodity futures contracts totaling ($1,616,988), and by a net change in unrealized depreciation of commodity futures contractsprices and investor out-flows which was driven by excess supply estimates, and mandates for plant-based renewable fuels contributing to weakness.
For the Three Months Ended March 31, 2024, compared to the Three Months Ended March 31, 2023
| | | Three Months Ended | | | Three Months Ended | |
| | | March 31, 2024 | | | March 31, 2023 | |
Average daily total net assets | | $ | 71,689,282 | | | $ | 133,376,850 | |
Net realized and unrealized (loss) gain on futures contracts | | $ | (5,560,505 | ) | | $ | (9,568,295 | ) |
Interest income earned on cash equivalents | | $ | 948,218 | | | $ | 1,454,236 | |
Annualized interest yield based on average daily total net assets | | | 1.32 | % | | | 1.09 | % |
Net Loss | | $ | (5,097,560 | ) | | $ | (8,813,753 | ) |
Weighted average share outstanding | | | 3,554,125 | | | | 5,145,004 | |
Management Fees | | $ | 178,243 | | | $ | 328,874 | |
Total gross fees and other expenses excluding management fees | | $ | 307,030 | | | $ | 370,820 | |
Brokerage Commissions | | $ | 9,706 | | | $ | 17,270 | |
Total gross expense ratio | | | 2.72 | % | | | 2.13 | % |
Total expense ratio net of expenses waived by the Sponsor | | | 2.72 | % | | | 2.13 | % |
Net investment gain | | | 2.60 | % | | | 2.29 | % |
Creation of Shares | | | 125,000 | | | | 75,000 | |
Redemption of Shares | | | 425,000 | | | | 1,175,000 | |
Table of ($3,363,975). Total loss was ($5,440,285) in the same period of 2016. The total loss for the nine-month period ended September 30, 2017 was ($2,484,197) resulting primarily from the net change in realized loss on commodity futures contracts totaling ($2,064,200), and by a net change in unrealized depreciation of commodity futures contracts of ($969,000). Total loss was ($7,417,081) in the same period of 2016. Contents Realized gain or loss on trading of commodity futures contracts is a function of: 1) the change in the price of the particular contracts sold as part of a “roll” in contracts as the nearest to expire contracts are exchanged for the appropriate contactcontract given the investment objective of the fund, 2) the change in the price of particular contracts sold in relation to redemption of shares, 3) the gain or loss associated with rebalancing trades which are made to ensure conformance to the benchmark, and 4) the number of contracts held and then sold for either circumstance aforementioned. The Fund recognizes the expense for brokerage commissions for futures contract trades on a per trade basis. Unrealized gain or loss on trading of commodity futures contracts is a function of the change in the price of contracts held on the final date of the period versus the purchase price for each contract and the number of contracts held in each contract month. The Sponsor has a static benchmark as described above and trades futures contracts to adhere to that benchmark and to adjust for the creation or redemption of shares.
Interest incomeThe decrease in interest and other income for three-month periodyear over year was due to lower average net assets. As a result, the amount of interest income earned was lower in the three months ended September 30, 2017March 31, 2024, compared to the three months ended March 31, 2023. The Fund seeks to earn interest and 2016, respectively, was $217,130other income in investment grade, short-duration instruments or deposits associated with the pool’s cash management strategy that may be used to offset expenses. These investments may include, but are not limited to, short-term Treasury Securities, demand deposits, money market funds and $109,115. Forinvestments in commercial paper. These interest rate levels may be lower or higher than the nine-month period, these amounts were $549,003 and $273,344. This increase year-over-year was the result of higher realizedprojected interest rates on cash balances in 2017 compared to 2016, due to the increasesstated in the Federal Funds rate.prospectuses and thus will impact your breakeven point.
Total expenses gross of expenses waived by the Sponsor and reimbursement to the Sponsor for previously waived expenses (“Total expenses”) for the three-month period ended September 30, 2017 were $729,672 and for the same period in 2016 were $878,103. This represents a ($148,431) or 17% decrease for 2017 over 2016. The decrease was driven by: 1) a ($33,506) or 17% increase/decrease in the management fee paid to the Sponsor becauseis a result of higher/lower average net assets; 2)assets. As a ($93,655) or 41% decreaseresult of the decline in professionalthe amount of assets of the Fund, the amount of management fees related to auditing, legal and tax preparation fees; 3) a ($36,593) or 10% decreasewas lower in distribution and marketing expenses; and 4) ($2,028) or 17% decrease in other expenses. These decreases were offset by; 1) a $1,661 or 39% increase in business permits and licenses; 2) a $10,840 or 49% increase in general and administrative expenses; and 3) a $5,450 or 32% increase in brokerage commissions due to an increase in contracts purchased and rolled. All other expense categories remained relatively flat year over year. The decreases were due, in general,the three months ended March 31, 2024, compared to the decrease in the average assets under management relative to the other Funds. The total expense ratio gross of expenses waived by the Sponsor for the three-month periods were 4.35% in 2017 and 4.37% in 2016.three months ended March 31, 2023. The management fee is calculated at an annual rate of 1% of the Fund’s daily average net assets.
Total expenses gross of expenses waived by the Sponsor and reimbursement to the Sponsor for previously waived expenses (“Total expenses”) for the nine-month period ended September 30, 2017 were $2,216,966 and for the same period in 2016 were $2,351,775. This represents a ($134,809) or 6% decrease for 2017 over 2016. The decrease was driven by a ($198,779) or 31% decrease in professional fees related to auditing, legal and tax preparation fees. The decrease was offset by an increase in all other expense categories, primarily; 1) a $10,290 or 87% increase in business permits and licenses; 2) a $25,467 or 32% increase in general and administrative expenses; and 3) a $15,075 or 31% increase in brokerage commissions due to an increase in contracts purchased and rolled. All other expense categories remained relatively flat year over year. The total expense ratio gross of expenses waived by the Sponsor for the nine-month periods were 4.29% in 2017 and 4.61% in 2016. The management fee is calculated at an annual rate of 1% of the Fund’s daily average net assets.
The Sponsor can elect to pay certain expenses on behalf of the Fund or waive the management fee. This election is subject to change by the Sponsor, at its discretion. For the three-month period ended September 30, 2017 and 2016, the Sponsor waived fees of $95,836 and $134,161 respectively. For the nine-month period ended September 30, 2017 and 2016, the Sponsor waived fees of $264,656 and $134,161 respectively.
Total expenses net of expenses waived by the Sponsor (“Total expenses, net”) for the three-month period ended September 30, 2017 and 2016 were $633,836 and $743,942, respectively. The total expense ratio net of expenses waived by the Sponsor was 3.78% in 2017 and 3.70% in 2016. Net investment loss, which includes the impact of expenses and interest income, was 2.49% in 2017 and 3.16% in 2016.
Total expenses net of expenses waived by the Sponsor (“Total expenses, net”) for the nine-month period ended September 30, 2017 and 2016 were $1,952,310 and $2,217,614, respectively. The total expense ratio net of expenses waived by the Sponsor was 3.78% in 2017 and 4.35% in 2016. Net investment loss, which includes the impact of expenses and interest income, was 2.72% in 2017 and 3.81% in 2016.
Other than the management fee to the Sponsor and the brokerage commissions, most of the expenses incurred by the Fund are associated with the day-to-day operation of the Fund and the necessary functions related to regulatory compliance. These are generally based on contracts, which extend for some period of time and up to one year, or commitments regardless of the level of assets under management. The structure of the Fund and the nature of the expenses are such that as total net assets grow, there is a scalability of expenses that may allow the total expense ratio to be reduced. However, if total net assets for the Fund fall, the total expense ratio of the Fund will increase unless additional reductions are made by the Sponsor to the daily expense accrual.accruals. The Sponsor can elect to adjust the daily expense accruals at its discretion based on market conditions and other Fund considerations.
The increase/decrease in total gross fees and other expenses excluding management fees for the three months ended March 31, 2024 compared to the three months ended March 31, 2023 was generally due to the allocation of expenses and total net assets relative to the other Funds. The Sponsor has the ability to elect to pay certain expenses on behalf of the Fund or waive the management fee. This election is subject to change by the Sponsor, at its discretion. The Sponsor has determined that no reimbursement will be sought in future periods for those expenses which have been waived for the period.
The decrease in total brokerage commissions for the three months ended March 31, 2024 compared to the three months ended March 31, 2023, was primarily due to a decrease in contracts purchased, liquidated, and rolled.
The graph below shows the actual shares outstanding, total net assets (or AUM) and net asset value per share (NAV per share) for the Fund from inception to March 31, 2024 and serves to illustrate the relative changes of these components.
The seasonality patterns for corn futures prices are impacted by a variety of factors. These include, but are not limited to, the harvest in the fall, the planting conditions in the spring, and the weather throughout the critical germination and growing periods. Prices for corn futures are affected by the availability and demand for substitute agricultural commodities, including soybeans and wheat, and the demand for corn as an additive for fuel, through the productionproduction of ethanol. The price of corn futures contracts is also influenced by global economic conditions, including the demand for exports to other countries. Such factors will impact the performance of the Fund and the results of operations on an ongoing basis. The Sponsor cannot predict the impact of such factors.
Teucrium Soybean Fund
The Teucrium Soybean Fund commenced investment operations on September 19, 2011. The investment objective of the Fund is to have the daily changes in percentage terms of the Shares’ Net Asset Value (“NAV”) reflect the daily changes in percentage terms of a weighted average of the closing settlement prices for three futures contracts for soybeans (“Soybean Futures Contracts”) that are traded on the Chicago Board of Trade (“CBOT”). The three Soybean Futures Contracts, are: (1) the second-to-expire excluding August andand September, will be: (1) second to expire CBOT Soybean Futures Contract, weighted 35%, (2) the third-to-expire excluding August and Septemberthird to expire CBOT Soybean Futures Contract, weighted 30%, and (3) the CBOT Soybean Futures Contract expiring in the November following the expiration month of the third-to-expirethird to expire contract, weighted 35%.
On September 30, 2017,March 31, 2024, the Fund held a total of 573 CBOT soybean futures contracts with a notional value of $33,933,513. The contracts had 1,100,004 shares outstandinga liability fair value of $794,976. The weighting of the notional value of the contracts is as follows: (1) 35% to JUL24 CBOT contracts, (2) 30% to NOV24 CBOT contracts, and net assets of $20,167,321. This is in comparison(3) 35% to 725,004 shares outstanding and net assets of $13,436,212 on September 30, 2016 and 650,004 shares outstanding with net assets of $11,762,511 on June 30, 2017. Shares outstanding increased by 375,000 or 52% for the period ended September 30, 2017 when compared to September 30, 2016 and by 450,000 or 69% when compared to June 30, 2017. This increase year over year was, in the opinion of management, due to the relative low price of soybean compared to the last decade which generated renewed investor interest in the commodity.NOV25 CBOT contracts.
| | | Quarter Ending | | | Quarter Ending | | | Year Ending | |
| | | March 31, 2024 | | | March 31, 2023 | | | December 31, 2023 | |
Total Net Assets | | $ | 33,966,763 | | | $ | 38,064,500 | | | $ | 29,056,020 | |
Shares Outstanding | | | 1,350,004 | | | | 1,400,004 | | | | 1,075,004 | |
Net Asset Value per share | | $ | 25.16 | | | $ | 27.19 | | | $ | 27.03 | |
Closing Price | | $ | 25.21 | | | $ | 27.14 | | | $ | 27.01 | |
Total net assets for the Fund were $20,167,321 on September 30, 2017 compared to $13,436,212 on September 30, 2016 and $11,762,511 on June 30, 2017. The Net Asset Values (“NAV”) per share related to these balances were $18.33, $18.53 and $18.10 respectively. This represents an increase in total net assets for thedecreased year over year of 50%by -11%, driven by an increasea combination of a decrease in total shares outstanding which increasedof 50,000 shares or -4% and by 52% and a changedecrease in the NAV per share which decreasedof ($2.03) or 7%. The net assets for the Fund increased by 1%. When17% when comparing September 30, 2017 with June 30, 2017, there was an increaseMarch 31, 2024, to December 31, 2023. The change in total net assets of 71%, driven by an increase in total shares outstanding of 69%. The closing prices per share for September 30, 2017 and 2016 and June 30, 2017, as reported by the NYSE Arca, were $18.36, $18.48 and $18.05, respectively. The change from September 30, 2017year over the same period last year, was a 1% decrease, and a 2% increase from June 30, 2017.
The graph below shows the actual shares outstanding, total net assets (or AUM) and net asset value per share (NAV per share) for the Fund from inception to September 30, 2017 and serves to illustrate the relative changes of these components.
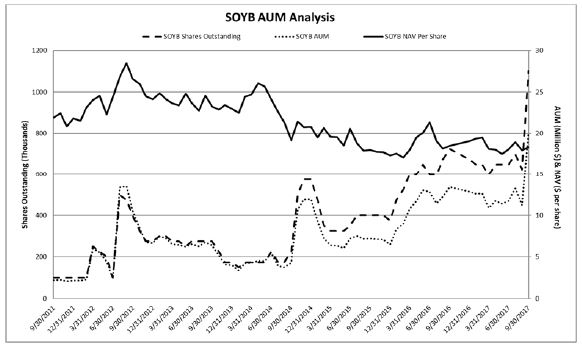
The total income for the three-month period ended September 30, 2017 was $257,072 resulting primarily from the net change in realized loss on commodity futures contracts totaling ($24,025), and by a net change in unrealized appreciation of commodity futures contracts of $241,863. Total loss was ($1,566,866) in the same periodopinion of 2016. The total loss for the nine-month period ended September 30, 2017management, was ($106,423) resulting primarily from the net change in realized gain on commodity futures contracts totaling $7,475, and bygenerally due to a net change in unrealizedcombination of a depreciation of commodity futures contracts of ($210,300). Total incomeprices and investor out-flows which was $1,013,253 indriven by excess supply estimates, and mandates for plant-based renewable fuels contributing to weakness.
For the same period of 2016. Three Months Ended March 31, 2024, compared to the Three Months Ended March 31, 2023
| | | Three Months Ended | | | Three Months Ended | |
| | | March 31, 2024 | | | March 31, 2023 | |
Average daily total net assets | | $ | 28,444,136 | | | $ | 46,513,386 | |
Net realized and unrealized loss on futures contracts | | $ | (2,036,169 | ) | | $ | (2,632,099 | ) |
Interest income earned on cash and cash equivalents | | $ | 380,411 | | | $ | 511,623 | |
Annualized interest yield based on average daily total net assets | | | 1.34 | % | | | 1.10 | % |
Net Loss | | $ | (1,887,477 | ) | | $ | (2,370,378 | ) |
Weighted average share outstanding | | | 1,129,400 | | | | 1,668,615 | |
Management Fees | | $ | 70,722 | | | $ | 114,690 | |
Total gross fees and other expenses excluding management fees | | $ | 160,997 | | | $ | 135,212 | |
Brokerage Commissions | | $ | 4,158 | | | $ | 6,340 | |
Total gross expense ratio | | | 3.28 | % | | | 2.18 | % |
Total expense ratio net of expenses waived by the Sponsor | | | 3.28 | % | | | 2.18 | % |
Net investment gain | | | 2.10 | % | | | 2.28 | % |
Creation of Shares | | | 325,000 | | | | 125,000 | |
Redemption of Shares | | | 50,000 | | | | 775,000 | |
Realized gain or loss on trading of commodity futures contracts is a function of: 1) the change in the price of the particular contracts sold as part of a “roll” in contracts as the nearest to expire contracts are exchanged for the appropriate contactcontract given the investment objective of the fund, 2) the change in the price of particular contracts sold in relation to redemption of shares, 3) the gain or loss associated with rebalancing trades which are made to ensure conformance to the benchmark, and 4) the number of contracts held and then sold for either circumstance aforementioned. The Fund recognized the expense for brokerage commissions for futures contract trades on a per trade basis. Unrealized gain or loss on trading of commodity futures contracts is a function of the change in the price of contracts held on the final date of the period versus the purchase price for each contract and the number of contracts held in each contract month. The Sponsor has a static benchmark as described above and trades futures contracts to adhere to that benchmark and to adjust for the creation or redemption of shares.
Interest income
The decrease in interest and other income for three-month periodyear over year was due to lower average net assets. As a result, the amount of interest income earned as a percentage of average daily total net assets was lower in the three months ended September 30, 2017March 31, 2024, compared to the three months ended March 31, 2023. The Fund seeks to earn interest and 2016, respectively, was $39,234other income in investment grade, short-duration instruments or deposits associated with the pool’s cash management strategy that may be used to offset expenses. These investments may include, but are not limited to, short-term Treasury Securities, demand deposits, money market funds and $16,996. Forinvestments in commercial paper. These interest rate levels may be lower or higher than the nine-month period, these amounts were $96,402 and $44,291. This increase year-over-year was the result of higher realizedprojected interest rates on cash balances in 2017 compared to 2016, due to the increasesstated in the Federal Funds rate.prospectuses and thus will impact your breakeven point.
Total expenses gross of expenses waived by the Sponsor and reimbursement to the Sponsor for previously waived expenses (“Total expenses”) for the three-month period ended September 30, 2017 were $147,452 and for the same period in 2016 were $189,647. This represents a ($42,195) or 22% decrease for 2017 over 2016. The decrease in 2017 was driven by; 1) a ($1,241) or 4% increase/decrease in management fee paid to the Sponsor due to slightly loweris a result of lower/higher average net assetsassets. As a result of the decline in the amount of assets of the Fund, during the period; 2) a ($37,531) or 49% decreaseamount of management fees was lower in professional fees relatedthe three months ended March 31, 2024, compared to auditing, legal and tax preparation fees; 3) a ($5,148) or 9% decrease in distribution and marketing fees; 4) a ($228) or 5% decrease in business permits and licenses; and 5) a ($938) or 13% decrease in general and administrative expenses. These decreases were offset by: 1) a $617 or 8% increase in custodian fees and expenses; 2) a $2,007 or 100% increase in brokerage commissions and expenses due to an increase in contracts purchased and rolled; and 3) a $267 or 11% increase in other expenses. The total expense ratio gross of expenses waived by the Sponsor for the three-month periods were 4.89% in 2017 and 6.04% in 2016.three months ended March 31, 2023. The management fee is calculated at an annual rate of 1% of the Fund’s daily average net assets.
Total expenses gross of expenses waived by the Sponsor and reimbursement to the Sponsor for previously waived expenses (“Total expenses”) for the nine-month period ended September 30, 2017 were $392,703 and for the same period in 2016 were $398,841. This represents a ($6,138) or 2% decrease for 2017 over 2016. The slight decrease in 2017 was driven by; 1) a ($19,963) or 13% decrease in distribution and marketing fees; 2) a ($752) or 4% decrease in custodian fees and expenses; 3) a ($4,502) or 21% decrease in general and administrative expenses; and 4) a ($1,444) or 19% decrease in other expenses. The decreases were offset by; 1) a $7,166 or 9% increase in management fee paid to the Sponsor as a result of higher average net assets; 2) a $9,297 or 10% increase in professional fees related to auditing, legal and tax preparation fees; and 3) a $3,899 or 259% increase in brokerage commissions due to an increase in contracts purchased and rolled. All other expense categories remained relatively flat year over year. The total expense ratio gross of expenses waived by the Sponsor for the nine-month periods were 4.34% in 2017 and 4.79% in 2016. The management fee is calculated at an annual rate of 1% of the Fund’s daily average net assets.
The Sponsor can elect to pay certain expenses on behalf of the Fund or waive the management fee. This election is subject to change by the Sponsor, at its discretion. For the three-month period ended September 30, 2017 and 2016, the Sponsor waived fees of $31,348 and $63,113 respectively. For the nine-month period ended September 30, 2017 and 2016, the Sponsor waived fees of $58,457 and $63,113 respectively.
Total expenses net of expenses waived by the Sponsor (“Total expenses, net”) for the three-month periods ended September 30, 2017 and 2016 were $116,104 and $126,534, respectively. The total expense ratio net of expenses waived by the Sponsor was 3.85% in 2017 and 4.03% in 2016. Net investment loss, which includes the impact of expenses and interest income, was 2.55% in 2017 and 3.49% in 2016.
Total expenses net of expenses waived by the Sponsor (“Total expenses, net”) for the nine-month periods ended September 30, 2017 and 2016 were $334,246 and $335,728, respectively. The total expense ratio net of expenses waived by the Sponsor was 3.70% in 2017 and 4.03% in 2016. Net investment loss, which includes the impact of expenses and interest income, was 2.63% in 2017 and 3.50% in 2016.
Other than the management fee to the Sponsor and the brokerage commissions, most of the expenses incurred by the Fund are associated with the day-to-day operation of the Fund and the necessary functions related to regulatory compliance. These are generally based on contracts, which extend for some period of time and up to one year, or commitments regardless of the level of assets under management. The structure of the Fund and the nature of the expenses are such that as total net assets grow, there is a scalability of expenses that may allow the total expense ratio to be reduced. However, if total net assets for the Fund fall, the total expense ratio of the Fund will increase unless additional reductions are made by the Sponsor to the daily expense accrual.accruals. The Sponsor can elect to adjust the daily expense accruals at its discretion based on market conditions and other Fund considerations.
The increase in total gross fees and other expenses excluding management fees for the three months ended March 31, 2024 compared to the three months ended March 31, 2023 was generally due to the average net assets relative to the other Funds. The Sponsor has the ability to elect to pay certain expenses on behalf of the Fund or waive the management fee. This election is subject to change by the Sponsor, at its discretion. The Sponsor has determined that no reimbursement will be sought in future periods for those expenses which have been waived for the period.
The decrease in total brokerage commissions for the three months ended March 31, 2024 compared to the three months ended March 31, 2023, was primarily due to a decrease in contracts purchased, liquidated, and rolled.
The graph below shows the actual shares outstanding, total net assets (or AUM) and net asset value per share (NAV per share) for the Fund from inception to March 31, 2024 and serves to illustrate the relative changes of these components.
The seasonality patterns for soybean futures prices are impacted by a variety of factors. These include, but are not limited to, the harvest in the fall, the planting conditions in the spring, and the weather throughout the critical germination and growing periods. Prices for soybean futures are affected by the availability and demand for substitute agricultural commodities, including corn and wheat. The price of soybean futures contracts is also influenced by global economic conditions, including the demand for exports to other countries. Such factors will impact the performance of the Fund and the results of operations on an ongoing basis. The Sponsor cannot predict the impact of such factors.
Teucrium Sugar Fund
The Teucrium Sugar Fund commenced investment operations on September 19, 2011. The investment objective of the Fund is to have the daily changes in percentage terms of the Shares’ Net Asset Value (“NAV”) reflect the daily changes in percentage terms of a weighted average of the closing settlement prices for three futures contracts for sugar (“Sugar Futures Contracts”) that are traded on ICE Futures US (“ICE Futures”), specifically: (1) the second-to-expiresecond to expire Sugar No. 11 Futures Contract (a “Sugar No. 11 Futures Contract”), weighted 35%, (2) the third-to-expirethird to expire Sugar No. 11 Futures Contract, weighted 30%, and (3) the Sugar No. 11 Futures Contract expiring in the March following the expiration month of the third-to-expirethird to expire contract, weighted 35%.
On September 30, 2017,March 31, 2024, the Fund held a total of 668 ICE sugar futures contracts with a notional value of $16,538,794. The contracts had 700,004 shares outstanding and net assetsa liability fair value of $6,600,831. This$814,401. The weighting of the notional value of the contracts is in comparison to 500,004 shares outstanding and net assets of $7,327,149 on September 30, 2016 and 850,004 shares outstanding with net assets of $8,192,411 on June 30, 2017. Shares outstanding increased by 200,000 or 40% for the period ended September 30, 2017 when compared to September 30, 2016 and decreased by 150,000 or 18% for the period ended September 30, 2017 when compared to June 30, 2017. This increase year over year was, in the opinion of management, dueas follows: (1) 35% to the relative low price of sugar, comparedJUL24 ICE No 11 contracts, (2) 30% to the last decade, which generated renewed investor interest inOCT24 ICE No 11 contracts, and (3) 35% to the commodity.MAR25 ICE No 11 contracts.
| | | Quarter Ending | | | Quarter Ending | | | Year Ending | |
| | | March 31, 2024 | | | March 31, 2023 | | | December 31, 2023 | |
Total Net Assets | | $ | 16,529,172 | | | $ | 28,038,792 | | | $ | 17,720,099 | |
Shares Outstanding | | | 1,225,004 | | | | 2,450,004 | | | | 1,425,004 | |
Net Asset Value per share | | $ | 13.49 | | | $ | 11.44 | | | $ | 12.44 | |
Closing Price | | $ | 13.49 | | | $ | 11.38 | | | $ | 12.40 | |
Total net assets for the Fund were $6,600,831 on September 30, 2017 compared to $7,327,149 on September 30, 2016 and $8,192,411 on June 30, 2017. The Net Asset Values (“NAV”) per share related to these balances were $9.43, $14.65 and $9.64, respectively. This represents a decrease in total net assets for thedecreased year over year of 10%, driven by combination of an increase in total shares outstanding of 40% and a decrease of ($5.22) or 36% in the NAV per share. When comparing September 30, 2017 with June 30, 2017, there was a decrease in total net assets of 19%41%, driven by a combination of a decrease in total shares outstanding of 18%1,225,000 or -50% and a decreasean increase in the NAV per share of 2%$2.05 or 18%. The closing prices per share for September 30, 2017 and 2016 and June 30, 2017, as reported by the NYSE Arca, were $9.48, $14.48 and $9.63, respectively. The change from September 30, 2017 over the same period last year was a 35% decrease, and a 2% decrease from June 30, 2017.
The graph below shows the actual shares outstanding, total net assets (or AUM) and net asset value per share (NAV per share) for the Fund from inceptiondecreased by 7% when comparing March 31, 2024, to September 30, 2017December 31, 2023. This change was, in the opinion of management, due to the stabilization of prices worldwide, strong demand and serves to illustrate the relative changes of these components.with modestly higher production which accelerated investor interest.
For the Three Months Ended March 31, 2024, compared to the Three Months Ended March 31, 2023
| | | Three Months Ended | | | Three Months Ended | |
| | | March 31, 2024 | | | March 31, 2023 | |
Average daily total net assets | | $ | 17,117,195 | | | $ | 24,875,934 | |
Net realized and unrealized gain on futures contracts | | $ | 1,391,283 | | | $ | 4,479,265 | |
Interest income earned on cash and cash equivalents | | $ | 224,625 | | | $ | 271,449 | |
Annualized interest yield based on average daily total net assets | | | 1.31 | % | | | 1.09 | % |
Net Income | | $ | 1,443,891 | | | $ | 4,580,491 | |
Weighted average share outstanding | | | 1,287,641 | | | | 2,446,948 | |
Management Fees | | $ | 42,559 | | | $ | 61,338 | |
Total gross fees and other expenses excluding management fees | | $ | 129,458 | | | $ | 108,885 | |
Brokerage Commissions | | $ | 2,008 | | | $ | 6,055 | |
Total gross expense ratio | | | 4.04 | % | | | 2.78 | % |
Total expense ratio net of expenses waived by the Sponsor | | | 4.04 | % | | | 2.78 | % |
Net investment gain | | | 1.24 | % | | | 1.65 | % |
Creation of Shares | | | - | | | | 525,000 | |
Redemption of Shares | | | 200,000 | | | | 625,000 | |
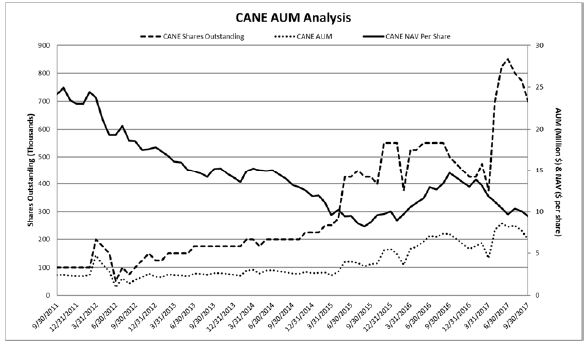
The total loss for the three-month period ended September 30, 2017 was ($120,913) resulting primarily from the net change in realized loss on commodity futures contracts totaling ($678,070) and by a net change in unrealized appreciation of commodity futures contracts of $532,963. Total income was $939,912 in the same period of 2016. The total loss for the nine-month period ended September 30, 2017 was ($2,269,134) resulting primarily from the net change in realized loss on commodity futures contracts totaling ($2,266,185) and by a net change in unrealized depreciation of commodity futures contracts of ($57,994). Total income was $2,285,842 in the same period of 2016. Realized gain or loss on trading of commodity futures contracts is a function of: 1) the change in the price of the particular contracts sold as part of a “roll” in contracts as the nearest to expire contracts are exchanged for the appropriate contactcontract given the investment objective of the fund, 2) the change in the price of particular contracts sold in relation to redemption of shares, 3) the gain or loss associated with rebalancing trades which are made to ensure conformance to the benchmark, and 4) the number of contracts held and then sold for either circumstance aforementioned. The Fund recognizes the expense for brokerage commissions for futures contract trades on a per trade basis. Unrealized gain or loss on trading of commodity futures contracts is a function of the change in the price of contracts held on the final date of the period versus the purchase price for each contract and the number of contracts held in each contract month. The Sponsor has a static benchmark as described above and trades futures contracts to adhere to that benchmark and to adjust for the creation or redemption of shares.
Interest incomeThe decrease in interest and other income for three-month periodsyear over year was due to lower average net assets. As a result, the amount of interest income earned as a percentage of average daily total net assets was lower in the three months ended September 30, 2017March 31, 2024, compared to the three months ended March 31, 2023. The Fund seeks to earn interest and 2016, respectively, was $24,194other income in investment grade, short-duration instruments or deposits associated with the pool’s cash management strategy that may be used to offset expenses. These investments may include, but are not limited to, short-term Treasury Securities, demand deposits, money market funds and $9,517. Forinvestments in commercial paper. These interest rate levels may be lower or higher than the nine-month period, these amounts were $55,045 and $23,050. This increase year-over-year was the result of higher realizedprojected interest rates on cash balances in 2017 compared to 2016, due to the increasesstated in the Federal Funds rate.prospectuses and thus will impact your breakeven point.
Total expenses gross of expenses waived by the Sponsor and reimbursement to the Sponsor for previously waived expenses (“Total expenses”) for the three-month period ended September 30, 2017 were $102,485 and for the same period in 2016 were $88,916. This represents a $13,569 or 15% increase for 2017 over 2016. The increase in 2017 was driven by; 1) a $1,417 or 8% increaseincrease/decrease in management fee paid to the Sponsor due to is a result of lower/higher average net assets. As a result of the decline in the amount of assets duringof the period; 2) a $11,969 or 42% increaseFund, the amount of management fees was lower in distribution and marketing fees; 3) a $1,898 or 33% increase in custodian fees and expenses; and 4) a $787 or 65% increase in brokerage commissions duethe three months ended March 31, 2024, compared to an increase in contracts purchased and rolled. These decreases were offset by; 1) a ($1,350) or 22% decrease in business permits and licenses; and 2) a ($878) or 19% decrease in general and administrative expenses. All other expense categories remained relatively flat year over year. The total expense ratio gross of expenses waived by the Sponsor for the three-month periods were 5.28% in 2017 and 4.94% in 2016.three months ended March 31, 2023. The management fee is calculated at an annual rate of 1% of the Fund’s daily average net assets.
Total expenses gross of expenses waived by the Sponsor and reimbursement to the Sponsor for previously waived expenses (“Total expenses”) for the nine-month period ended September 30, 2017 were $231,121 and for the same period in 2016 were $224,270. This represents a $6,851 or 3% increase for 2017 over 2016. The increase in 2017 was driven by; 1) a $7,639 or 17% increase in management fee paid to the Sponsor due to higher average net assets under management; 2) a $4,679 or 12% increase in professional fees related to auditing, legal and tax preparation fees; and 3) a $938 or 7% increase in custodian fees and expenses. These increases were offset by; 1) a ($4,925) or 5% decrease in distribution and marketing fees; 2) a ($681) or 6% decrease in general and administrative expenses; and 3) a ($896) or 19% decrease in other expenses. All other expense categories remained relatively flat year over year. The total expense ratio gross of expenses waived by the Sponsor for the nine-month periods were 4.41% in 2017 and 5.01% in 2016. The management fee is calculated at an annual rate of 1% of the Fund’s daily average net assets.
The Sponsor can elect to pay certain expenses on behalf of the Fund or waive the management fee. This election is subject to change by the Sponsor, at its discretion. For the three-month periods ended September 30, 2017 and 2016, the Sponsor waived fees of $45,186 and $48,043 respectively. For the nine-month periods ended September 30, 2017 and 2016, the Sponsor waived fees of $83,550 and $121,429 respectively.
Total expenses net of expenses waived by the Sponsor (“Total expenses, net”) for the three-month period ended September 30, 2017 and 2016 were $57,299 and $40,873 respectively. The total expense ratio net of expenses waived by the Sponsor was 2.95% in 2017 and 2.27% in 2016. Net investment loss, which includes the impact of expenses and interest income, was 1.70% in 2017 and 1.74% in 2016.
Total expenses net of expenses waived by the Sponsor (“Total expenses, net”) for the nine-month period ended September 30, 2017 and 2016 were $147,571 and $102,841, respectively. The total expense ratio net of expenses waived by the Sponsor was 2.82% in 2017 and 2.30% in 2016. Net investment loss, which includes the impact of expenses and interest income, was 1.77% in 2017 and 1.78% in 2016.
Other than the management fee to the Sponsor and the brokerage commissions, most of the expenses incurred by the Fund are associated with the day-to-day operation of the Fund and the necessary functions related to regulatory compliance. These are generally based on contracts, which extend for some period and up to one year, or commitments regardless of the level of assets under management. The structure of the Fund and the nature of the expenses are such that as total net assets grow, there is a scalability of expenses that may allow the total expense ratio to be reduced. However, if total net assets for the Fund fall, the total expense ratio of the Fund will increase unless additional reductions are made by the Sponsor to the daily expense accrual. The Sponsor can elect to adjust the daily expense accruals at its discretion based on market conditions and other Fund considerations.
Teucrium Wheat Fund
The Teucrium Wheat Fund commenced investment operations on September 19, 2011. The investment objective of the Fund is to have the daily changes in percentage terms of the Shares’ Net Asset Value reflect the daily changes in percentage terms of a weighted average of the closing settlement prices for three futures contracts for wheat (“Wheat Futures Contracts”) that are traded on the Chicago Board of Trade (“CBOT”), specifically: (1) the second-to-expire CBOT Wheat Futures Contract, weighted 35%, (2) the third-to-expire CBOT Wheat Futures Contract, weighted 30%, and (3) the CBOT Wheat Futures Contract expiring in the December following the expiration month of the third-to-expire contract, weighted 35%.
On September 30, 2017, the Fund had 10,325,004 shares outstanding and net assets of $67,811,387. This is in comparison to 7,600,004 shares outstanding and net assets of $54,638,344 on September 30, 2016 and 9,900,004 shares outstanding with net assets of $77,583,718 on June 30, 2017. Shares outstanding increased by 2,725,000 or 36% for the period ended September 30, 2017 when compared to September 30, 2016 and increased by 425,000 or 4% for the period ended September 30, 2017 when compared to June 30, 2017. This increase year over year was, in the opinion of management, due to the low price of wheat relative to recent years which accelerated investor interest.
Total net assets for the Fund were $67,811,387 on September 30, 2017 compared to $54,638,344 on September 30, 2016 and $77,583,718 on June 30, 2017. The Net Asset Values (“NAV”) per share related to these balances were $6.57, $7.19 and $7.84 respectively. This represents an increase in total net assets for the year over year of 24%, driven by an increase in total shares outstanding of 36% and a decrease in the NAV per share of 9%. When comparing September 30, 2017 with June 30, 2017, there was a decrease in total net assets of 13%, driven by a combination of an increase in total shares outstanding of 4% and a decrease in the NAV per share of ($1.27) or 16%. The closing prices per share for September 30, 2017 and 2016 and June 30, 2017, as reported by the NYSE Arca, were $6.58, $7.19 and $7.83, respectively. The change from September 30, 2017 over the same period last year was an 8% decrease, and a 16% decrease from June 30, 2017.
The graph below shows the actual shares outstanding, total net assets (or AUM) and net asset value per share (NAV per share) for the Fund from inception to September 30, 2017 and serves to illustrate the relative changes of these components.
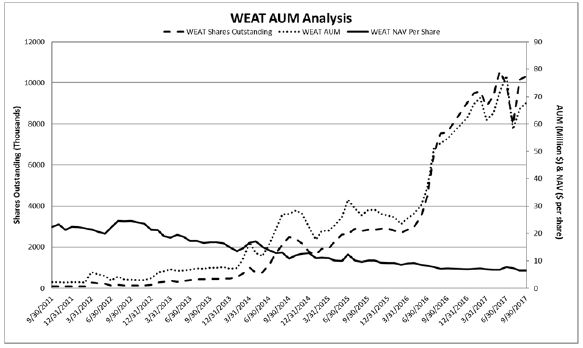
The total loss for the three-month period ended September 30, 2017 was ($8,961,538) resulting primarily from the net change in realized gain on commodity futures contracts totaling $1,955,888 and by a net change in unrealized depreciation of commodity futures contracts of ($11,125,988). Total loss was ($6,298,223) in the same period of 2016. The total income for the nine-month period ended September 30, 2017 was $1,967,522 resulting primarily from the net change in realized gain on commodity futures contracts totaling $1,286,087 and by a net change in unrealized appreciation of commodity futures contracts of $152,650. Total loss was ($9,209,611) in the same period of 2016. Realized gain or loss on trading of commodity futures contracts is a function of: 1) the change in the price of the particular contracts sold as part of a “roll” in contracts as the nearest to expire contracts are exchanged for the appropriate contact given the investment objective of the fund, 2) the change in the price of particular contracts sold in relation to redemption of shares, 3) the gain or loss associated with rebalancing trades which are made to ensure conformance to the benchmark and 4) the number of contracts held and then sold for either circumstance aforementioned. Unrealized gain or loss on trading of commodity futures contracts is a function of the change in the price of contracts held on the final date of the period versus the purchase price for each contract and the number of contracts held in each contract month. The Sponsor has a static benchmark as described above and trades futures contracts to adhere to that benchmark and to adjust for the creation or redemption of shares.
Interest income and other income for three-month periods ended September 30, 2017 and 2016, respectively, was $208,562 and $71,752. For the nine-month periods, these amounts were $528,785 and $142,314. This increase year-over-year was the result of higher cash balances and higher realized interest rates on cash balances in 2017 compared to 2016, due to the increases in the Federal Funds rate.
Total expenses gross of expenses waived by the Sponsor and reimbursement to the Sponsor for previously waived expenses (“Total expenses”) for the three-month period ended September 30, 2017 were $714,365 and for the same period in 2016 were $608,506. This represents a $105,859 or 17% increase for 2017 over 2016. The increase in 2017 was driven by higher average net assets relative to the other funds. Specifically; 1) a $31,945 or 25% increase in the management fee paid to the Sponsor as a result of higher average net assets; 2) a $46,801 or 44% increase in professional fees related to auditing, legal and tax preparation fees; 3) a $25,489 or 9% increase in distribution and marketing fees; 4) a $1,390 or 4% increase in custodian fees and expenses; 5) a $5,493 or 22% increase in general and administrative expenses; and 6) a $6,179 or 55% increase in brokerage commissions due to an increase in contracts purchased and rolled. These increases were slightly offset by; 1) a ($9,067) or 65% decrease in business permits and license fees; and 2) a ($2,371) or 21% decrease in other expenses. The total expense ratio gross of expenses waived by the Sponsor for the three-month periods were 4.40% in 2017 and 4.67% in 2016. The management fee is calculated at an annual rate of 1% of the Fund’s daily average net assets.
Total expenses gross of expenses waived by the Sponsor and reimbursement to the Sponsor for previously waived expenses (“Total expenses”) for the nine-month periods ended September 30, 2017 were $1,924,333 and for the same period in 2016 were $1,183,659. This represents a $740,674 or 63% increase for 2017 over 2016. The increase for 2017 over 2016 was driven by increases in all, but one expense category period over period, due to the increase in average assets under management compared to the other Funds. Increases were: 1) a $231,881 or 88% increase in the management fee paid to the Sponsor as a result of higher average net assets; 2) a $181,821 or 92% increase in professional fees related to auditing, legal and tax preparation fees; 3) a $243,949 or 47% increase in distribution and marketing fees; 4) a $39,473 or 57% increase in custodian fees and expenses; 5) a $26,893 or 45% increase in general and administrative expenses; 6) a $20,615 or 84% increase in brokerage commissions due to an increase in contracts purchased and rolled; and 7) a $929 or 4% increase in other expenses. These increases were offset by a ($4,887) or 22% decrease in business permits and license fees. The total expense ratio gross of expenses waived by the Sponsor for the six-month periods were 3.88% in 2017 and 4.48% in 2016. The management fee is calculated at an annual rate of 1% of the Fund’s daily average net assets.
The Sponsor can elect to pay certain expenses on behalf of the Fund or waive the management fee. This election is subject to change by the Sponsor, at its discretion. For the three-month and nine-month periods ended September 30, 2017 and 2016, the Sponsor waived fees of $105,942 and $49,516 respectively.
Total expenses net of expenses waived by the Sponsor (“Total expenses, net”) for the three-month periods ended September 30, 2017 and 2016 were $608,423 and $558,990, respectively. The total expense ratio net of expenses waived by the Sponsor was 3.75% in 2017 and 4.29% in 2016. Net investment loss, which includes the impact of expenses and interest income, was 2.46% in 2017 and 3.74% in 2016.
Total expenses net of expenses waived by the Sponsor (“Total expenses, net”) for the nine-month period ended September 30, 2017 and 2016 were $1,818,391 and $1,134,143, respectively. The total expense ratio net of expenses waived by the Sponsor was 3.66% in 2017 and 4.29% in 2016. Net investment loss, which includes the impact of expenses and interest income, was 2.60% in 2017 and 3.75% in 2016.
Other than the management fee to the Sponsor and the brokerage commissions, most of the expenses incurred by the Fund are associated with the day-to-day operation of the Fund and the necessary functions related to regulatory compliance. These are generally based on contracts, which extend for some period of time and up to one year, or commitments regardless of the level of assets under management. The structure of the Fund and the nature of the expenses are such that as total net assets grow, there is a scalability of expenses that may allow the total expense ratio to be reduced. However, if total net assets for the Fund fall, the total expense ratio of the Fund will increase unless additional reductions are made by the Sponsor to the daily expense accrual.accruals. The Sponsor can elect to adjust the daily expense accruals at its discretion based on market conditions and other Fund considerations.
The increase in total gross fees and other expenses excluding management fees for the three months ended March 31, 2024, respectively, compared to the three months ended March 31, 2023 was generally due to the average net assets relative to the other Funds. The Sponsor has the ability to elect to pay certain expenses on behalf of the Fund or waive the management fee. This election is subject to change by the Sponsor, at its discretion. The Sponsor has determined that no reimbursement will be sought in future periods for those expenses which have been waived for the period.
The decrease in total brokerage commissions for the three months ended March 31, 2024 compared to the three months ended March 31, 2023, was primarily due to a decrease in contracts purchased, liquidated, and rolled.
The graph below shows the actual shares outstanding, total net assets (or AUM) and net asset value per share (NAV per share) for the Fund from inception to March 31, 2024 and serves to illustrate the relative changes of these components.
The seasonality patterns for sugar cane futures prices are impacted by a variety of factors. In the futures market, contracts expiring during the harvest season are typically priced lower than contracts expiring in the winter and spring. While the sugar harvest seasons varies from country to country, prices of Sugar Futures Contracts tend to be lowest in the late spring and early summer, reflecting the harvest season in Brazil, the world’s leading producer of sugarcane. Thus, seasonal fluctuations could result in an investor incurring losses upon the sale of Fund Shares, particularly if the investor needs to sell Shares when the Benchmark Component Futures Contracts are, in whole or part, Sugar Futures Contracts expiring in the late spring or early summer. The price of sugar futures contracts is also influenced by global economic conditions, including the demand for imports and exports to other countries. Such factors will impact the performance of the Fund and the results of operations on an ongoing basis. The Sponsor cannot predict the impact of such factors.
Teucrium Wheat Fund
The Teucrium Wheat Fund commenced investment operations on September 19, 2011. The investment objective of the Fund is to have the daily changes in percentage terms of the Shares’ Net Asset Value reflect the daily changes in percentage terms of a weighted average of the closing settlement prices for three futures contracts for wheat (“Wheat Futures Contracts”) that are traded on the Chicago Board of Trade (“CBOT”), specifically: (1) the second to expire CBOT Wheat Futures Contract, weighted 35%, (2) the third to expire CBOT Wheat Futures Contract, weighted 30%, and (3) the CBOT Wheat Futures Contract expiring in the December following the expiration month of the third to expire contract, weighted 35%.
On March 31, 2024, the Fund held a total of 5,314 CBOT wheat futures contracts with a notional value of $157,498,488. The contracts had an asset fair value of $1,513,306. The weighting of the notional value contracts is as follows: (1) 35% to JUL24 CBOT contracts, (2) 30% to SEP24 CBOT contracts, and (3) 35% to DEC24 CBOT contracts.
| | | Quarter Ending | | | Quarter Ending | | | Quarter Ending | |
| | | March 31, 2024 | | | March 31, 2023 | | | December 31, 2023 | |
Total Net Assets | | $ | 157,537,309 | | | $ | 173,223,126 | | | $ | 184,176,669 | |
Shares Outstanding | | | 29,250,004 | | | | 24,525,004 | | | | 30,800,004 | |
Net Asset Value per share | | $ | 5.39 | | | $ | 7.06 | | | $ | 5.98 | |
Closing Price | | $ | 5.41 | | | $ | 7.06 | | | $ | 5.97 | |
Total net assets for the Fund decreased year over year by 9%, driven by a decrease in the NAV per share of ($1.68) or -24%. The net assets for the Fund decreased by 14% when comparing March 31, 2024 to December 31, 2023. The change in total net assets year over year, in the opinion of management, was generally due to a combination of the depreciation of commodity prices and investor out-flows which may be attributed to ample wheat stocks from Russia and record exports flowing from the Black Sea continue to weigh on global wheat prices.
For the Three Months Ended March 31, 2024, compared to the Three Months Ended March 31, 2023
| | | Three Months Ended | | | Three Months Ended | |
| | | March 31, 2024 | | | March 31, 2023 | |
Average daily total net assets | | $ | 164,981,213 | | | $ | 195,160,845 | |
Net realized and unrealized (loss) gain on futures contracts | | $ | (18,995,768 | ) | | $ | (25,451,295 | ) |
Interest income earned on cash and cash equivalents | | $ | 2,149,924 | | | $ | 2,080,146 | |
Annualized interest yield based on average daily total net assets | | | 1.30 | % | | | 1.07 | % |
Net Loss | | $ | (17,994,854 | ) | | $ | (24,611,421 | ) |
Weighted average share outstanding | | | 29,990,663 | | | | 26,265,282 | |
Management Fees | | $ | 410,199 | | | $ | 481,218 | |
Total gross fees and other expenses excluding management fees | | $ | 738,811 | | | $ | 759,054 | |
Brokerage Commissions | | $ | 15,580 | | | $ | 21,746 | |
Total gross expense ratio | | | 2.80 | % | | | 2.58 | % |
Total expense ratio net of expenses waived by the Sponsor | | | 2.80 | % | | | 2.58 | % |
Net investment gain | | | 2.45 | % | | | 1.76 | % |
Creation of Shares | | | 475,000 | | | | 825,000 | |
Redemption of Shares | | | 2,025,000 | | | | 4,975,000 | |
Realized gain or loss on trading of commodity futures contracts is a function of: 1) the change in the price of the particular contracts sold as part of a “roll” in contracts as the nearest to expire contracts are exchanged for the appropriate contract given the investment objective of the fund, 2) the change in the price of particular contracts sold in relation to redemption of shares, 3) the gain or loss associated with rebalancing trades which are made to ensure conformance to the benchmark, 4) the number of contracts held and then sold for either circumstance aforementioned. The Fund recognized the expense for brokerage commissions for futures contract trades on a per trade basis. Unrealized gain or loss on trading of commodity futures contracts is a function of the change in the price of contracts held on the final date of the period versus the purchase price for each contract and the number of contracts held in each contract month. The Sponsor has a static benchmark as described above and trades futures contracts to adhere to that benchmark and to adjust for the creation or redemption of shares.
The increase in interest and other income year over year was due to an increase in average net assets. As a result, the amount of interest income earned as a percentage of average daily total net assets was higher in the three months ended March 31, 2024, compared to the three months ended March 31, 2023. The Fund seeks to earn interest and other income in investment grade, short-duration instruments or deposits associated with the pool’s cash management strategy that may be used to offset expenses. These investments may include, but are not limited to, short-term Treasury Securities, demand deposits, money market funds and investments in commercial paper. These interest rate levels may be lower or higher than the projected interest rates stated in the prospectuses and thus will impact your breakeven point.
The decrease in management fee paid to the Sponsor is a result of lower average net assets. As a result of the decline in the amount of assets of the Fund, the amount of management fees was lower in the three months ended March 31, 2024, compared to the three months ended March 31, 2023. The management fee is calculated at an annual rate of 1% of the Fund’s daily average net assets.
Other than the management fee to the Sponsor and the brokerage commissions, most of the expenses incurred by the Fund are associated with the day-to-day operation of the Fund and the necessary functions related to regulatory compliance. These are generally based on contracts, which extend for some period of time and up to one year, or commitments regardless of the level of assets under management. The structure of the Fund and the nature of the expenses are such that as total net assets grow, there is a scalability of expenses that may allow the total expense ratio to be reduced. However, if total net assets for the Fund fall, the total expense ratio of the Fund will increase unless additional reductions are made by the Sponsor to the daily expense accruals. The Sponsor can elect to adjust the daily expense accruals at its discretion based on market conditions and other Fund considerations.
The decrease in total gross fees and other expenses excluding management fees for the three months ended March 31, 2024, respectively, compared to the three months ended March 31, 2023 was generally due to a decrease in average net assets relative to the other Funds. The Sponsor has the ability to elect to pay certain expenses on behalf of the Fund or waive the management fee. This election is subject to change by the Sponsor, at its discretion. The Sponsor has determined that no reimbursement will be sought in future periods for those expenses which have been waived for the period.
The decrease in total brokerage commissions for the three months ended March 31, 2024 compared to the three months ended March 31, 2023, was primarily due to a decrease in contracts purchased, liquidated, and rolled.
The graph below shows the actual shares outstanding, total net assets (or AUM) and net asset value per share (NAV per share) for the Fund from inception to March 31, 2024 and serves to illustrate the relative changes of these components.
The seasonality patterns for wheat futures prices are impacted by a variety of factors. These include, but are not limited to, the harvest in thesummer and fall, the planting conditions, in the spring, and the weather throughout the critical germination and growing periods. Prices for wheat futures are affected by the availability and demand for substitute agricultural commodities, including corn and soybeans.other feed grains. The price of wheat futures contracts is also influenced by global economic conditions, including the demand for exports to other countries. Such factors will impact the performance of the Fund and the results of operations on an ongoing basis. The Sponsor cannot predict the impact of such factors.
Teucrium Agricultural Fund
The Teucrium Agricultural Fund commenced operation on March 28, 2012. The investment objective of the Fund is to have the daily changes in percentage terms of the Net Asset Value (“NAV”) of its common units (“Shares”) reflect the daily changes in percentage terms of a weighted average (the “Underlying Fund Average”) of the NAVs per share of four other commodity pools that are series of the Trust and are sponsored by the Sponsor: the Teucrium Corn Fund (“CORN”), the Teucrium Wheat Fund (“WEAT”), the Teucrium Soybean Fund (“SOYB”) and the Teucrium Sugar Fund (“CANE”) (collectively, the “Underlying Funds”). The Underlying Fund Average will have a weighting of 25% to each Underlying Fund, and the Fund’s assets will be rebalanced, generally on a daily basis, to maintain the approximate 25% allocation to each Underlying Fund. The Fund does not intend to invest directly in futures contracts (“Futures Contracts”), although it reserves the right to do so in the future, including if an Underlying Fund ceases operation.
The investment objective of each Underlying Fund is to have the daily changes in percentage terms of its shares’ NAV reflect the daily changes in percentage terms of a weighted average of the closing settlement prices for certain Futures Contracts for the commodity specified in the Underlying Fund’s name. (This weighted average is referred to herein as the Underlying Fund’s “Benchmark,” the Futures Contracts that at any given time make up an Underlying Fund’s Benchmark are referred to herein as the Underlying Fund’s “Benchmark Component Futures Contracts,” and the commodity specified in the Underlying Fund’s name is referred to herein as its “Specified Commodity.”) Specifically, the Teucrium Corn Fund’s Benchmark is: (1) the second-to-expiresecond to expire Futures Contract for corn traded on the CBOT,Chicago Board of Trade (“CBOT”), weighted 35%, (2) the third-to-expirethird to expire CBOT corn Futures Contract, weighted 30%, and (3) the CBOT corn Futures Contract expiring in the December following the expiration month of the third-to-expirethird to expire contract, weighted 35%. The Teucrium Wheat Fund’s Benchmark is: (1) the second-to-expiresecond to expire CBOT wheat Futures Contract, weighted 35%, (2) the third-to-expirethird to expire CBOT wheat Futures Contract, weighted 30%, and (3) the CBOT wheat Futures Contract expiring in the December following the expiration month of the third-to-expirethird to expire contract, weighted 35%. The Teucrium Soybean Fund’s Benchmark is: (1) the second-to-expire excluding August and Septembersecond to expire CBOT soybean Futures Contract, weighted 35%, (2) the third-to-expire excluding August and Septemberthird to expire CBOT soybean Futures Contract, weighted 30%, and (3) the CBOT soybean Futures Contract expiring in the November following the expiration month of the third-to-expirethird to expire contract, weighted 35%, except that CBOT soybean Futures Contracts expiring in August and September will not be part of the Teucrium Soybean Fund’s Benchmark because of the less liquid market for these Futures Contracts. The Teucrium Sugar Fund’s Benchmark is: (1) the second-to-expiresecond to expire Sugar No. 11 Futures Contract traded on ICE Futures US (“ICE Futures”), weighted 35%, (2) the third-to-expirethird to expire ICE Futures Sugar No. 11 Futures Contract, weighted 30%, and (3) the ICE Futures Sugar No. 11 Futures Contract expiring in the March following the expiration month of the third-to-expirethird to expire contract, weighted 35%.
On September 30, 2017,March 31, 2024, the Fund had 50,002held: 1) 181,115 shares outstandingof CORN with a fair value of $3,661,367; 2) 682,062 shares of WEAT with a fair value of $3,673,518; 3) 142,076 shares of SOYB with a fair value of $3,574,703; and net assets4) 267,233 shares of $1,176,488. This is in comparisonCANE with a fair value of $3,605,828. The weighting on March 31, 2024 was 25% to 50,002 shares outstandingCORN, 25% to WEAT, 25% to SOYB and net assets of $1,360,006 on September 30, 2016 and 50,002 shares outstanding with net assets of $1,254,477 on June 30, 2017. The Net Asset Values (“NAV”) per share related25% to these balances were $23.53, $27.20 and $25.09 respectively. This represents a decrease in totalCANE.
| | | Quarter Ending | | | Quarter Ending | | | Year Ending | |
| | | March 31, 2024 | | | March 31, 2023 | | | December 31, 2023 | |
Total Net Assets | | $ | 14,526,883 | | | $ | 33,375,119 | | | $ | 18,409,126 | |
Shares Outstanding | | | 512,502 | | | | 1,075,002 | | | | 625,002 | |
Net Asset Value per share | | $ | 28.35 | | | $ | 31.05 | | | $ | 29.45 | |
Closing Price | | $ | 28.36 | | | $ | 31.04 | | | $ | 29.41 | |
Total net assets for the Fund decreased year over year of 13% which was the result of a change in the NAV per share which decreased by ($3.67) or 13%. When comparing September 30, 2017 with June 30, 2017, there was a decrease in total net assets of 6%56%, driven by a decrease in the NAV per shareshares outstanding of ($1.56)562,500 shares or 6%-52%. The closing prices per sharenet assets for September 30, 2017 and 2016 and June 30, 2017, as reportedthe Fund decreased by the NYSE Arca, were $22.90, $26.72 and $24.80 respectively.21% when comparing March 31, 2024 to December 31, 2023. The change from September 30, 2017 over the same period last year was a 14% decrease, and an 8% decrease from June 30, 2017.
The graph below shows the actual shares outstanding,in total net assets (or AUM)year over year, in the opinion of management, was generally due to a combination of depreciation of commodity prices and net asset value per share (NAV per share) forinvestor out-flows which was driven by the Fund from inception to September 30, 2017ample supply estimates and serves to illustrate the relative changesstabilization of these components.prices worldwide.
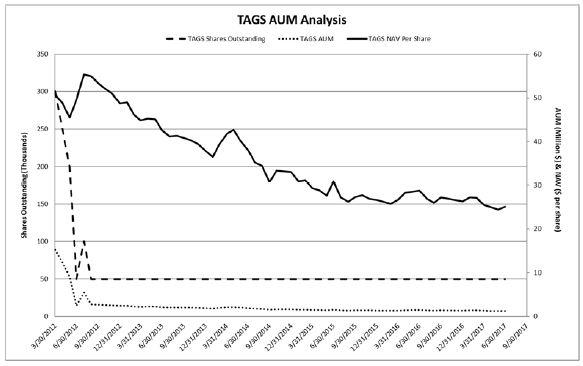
For the Three Months Ended March 31, 2024, compared to the Three Months Ended March 31, 2023
| | | Three Months Ended | | | Three Months Ended | |
| | | March 31, 2024 | | | March 31, 2023 | |
Average daily total net assets | | $ | 16,742,854 | | | $ | 36,266,530 | |
Net realized and unrealized gain on securities | | $ | (716,184 | ) | | $ | (499,220 | ) |
Interest income earned on cash equivalents | | $ | 136 | | | $ | 112 | |
Annualized interest yield based on average daily total net assets | | | 0.00 | % | | | 0.00 | % |
Net Loss | | $ | (719,795 | ) | | $ | (507,156 | ) |
Weighted average share outstanding | | | 590,524 | | | | 1,177,085 | |
Total gross fees and other expenses | | $ | 73,285 | | | $ | 133,542 | |
Expenses waived by the Sponsor | | $ | (69,538 | ) | | $ | (125,494 | ) |
Total gross expense ratio | | | 1.76 | % | | | 1.49 | % |
Total expense ratio net of expenses waived by the Sponsor | | | 0.09 | % | | | 0.09 | % |
Net investment loss | | | (0.09 | )% | | | (0.09 | )% |
Creation of Shares | | | - | | | | - | |
Redemption of Shares | | | 112,500 | | | | 187,500 | |
Total loss for the three-month period ended September 30, 2017 was ($76,451) resulting from the realized loss on the securities of the Underlying Funds totaling ($89,727) and a gain generated by the unrealized appreciation on the securities of the Underlying Funds of $13,272. Total loss for the same period in 2016 was ($78,441). Total loss for the nine-month period ended September 30, 2017 was ($135,126) resulting from the realized loss on the securities of the Underlying Funds totaling ($231,540) and a gain generated by the unrealized appreciation on the securities of the Underlying Funds of $96,403. Total income for the same period in 2016 was $35,720.
Realized gain or loss on the securities of the Underlying Funds is a function of:of 1) the change in the price of particular contracts sold in relation to redemption of shares, and 2) the gain or loss associated with rebalancing trades which are made to ensure conformance to the benchmark.benchmark and 3) the full-turn brokerage commission fee recognized on a per trade basis. Unrealized gain or loss on the securities of the Underlying Funds is a function of the change in the price of shares held on the final date of the period versus the purchase price for each and the number held. The Sponsor has a static benchmark as described above and trades futures contracts to adhere to that benchmark and to adjust for the creation or redemption of shares.
TotalOther than the brokerage commissions, most of the expenses grossincurred by the Fund are associated with the day-to-day operation of the Fund and the necessary functions related to regulatory compliance. These are generally based on contracts, which extend for some period of time and up to one year, or commitments regardless of the level of assets under management. The structure of the Fund and the nature of the expenses are such that as total net assets grow, there is a scalability of expenses waivedthat may allow the total expense ratio to be reduced. However, if total net assets for the Fund fall, the total expense ratio of the Fund will increase unless additional reductions are made by the Sponsor and reimbursement to the daily expense accruals. The Sponsor for previously waived expenses (“Total expenses”) forcan elect to adjust the three-month period ended September 30, 2017 were $7,525daily expense accruals at its discretion based on market conditions and for the same period in 2016 were $11,603. This represents a ($4,078) or 35% decrease for 2017 over 2016. The decrease for 2017 was driven by a reduction in all expense categories, specifically; 1) a ($1,765) or 30% decrease in professional fees related to auditing, legal and tax preparation fees; 2) a ($1,772) or 41% decrease in distribution and marketing expenses; 3) a ($311) or 42% decrease in custodian fees and expenses; 4) a ($21) or a 100% decrease in business permits and licenses; 5) a ($171) or 40% decrease in general and administrative expenses; and 6) a ($38) or 23% decrease in other expenses. The total expense ratio gross of expenses waived by the Sponsor for the three-month periods were 2.45% in 2017 and 3.39% in 2016.
Total expenses gross of expenses waived by the Sponsor and reimbursement to the Sponsor for previously waived expenses (“Total expenses”) for the nine-month period ended September 30, 2017 were $37,915 and for the same period in 2016 were $40,167. This represents a ($2,252) or 6% decrease for 2017 over 2016. The decrease for 2017 was driven by; 1) a ($94) or 1% decrease in professional fees related to auditing, legal and tax preparation fees; 2) a ($1,519) or 11% decrease in distribution and marketing fees; 3) a ($450) or 22% decrease in custodian fees and expenses; and 4) a ($223) or 100% decrease in brokerage commissions. The decreases were offset by a $31 or 7% increase in other expenses. All other expenses categories remained relatively flat from year over year. The total expense ratio gross of expenses waived by the Sponsor for the nine-month periods were 3.99% in 2017 and 3.93% in 2016.Fund considerations.
The decrease in total gross fees and other expenses for the three months ended March 31, 2024 compared to the three months ended March 31, 2023 was generally due to the decrease in average net assets and the net assets relative to the other Funds. The Sponsor canhas the ability to elect to pay certain expenses on behalf of the Fund or waive the management fee. This election is subject to change by the Sponsor, at its discretion. ForThe Sponsor has determined that no reimbursement will be sought in future periods for those expenses which have been waived for the three-month periods ended September 30, 2017period.
The graph below shows the actual shares outstanding, total net assets (or AUM) and 2016,net asset value per share (NAV per share) for the Sponsor waived feesFund from inception to March 31, 2024 and serves to illustrate the relative changes of $5,987 and $9,893 respectively. For the nine-month periods ended September 30, 2017 and 2016, the Sponsor waived fees of $33,159 and $35,063 respectively.these components.
Hashdex Bitcoin Futures ETF
TotalThe Hashdex Bitcoin Futures ETF Fund commenced investment operations on September 15, 2022. The investment objective of the Fund is to have the daily changes in percentage terms of the Shares’ Net Asset Value reflect the daily changes in percentage terms of a weighted average of the closing settlement prices for two futures contracts for Bitcoin (“Bitcoin Futures Contracts”) that are traded on the Chicago Mercantile Exchange (“CME”), specifically: (1) the first to expire CME Bitcoin Futures Contract, weighted 50%, (2) the second to expire CME Bitcoin Futures Contract, weighted 50%.
On March 31, 2024, the Fund did not hold any bitcoin futures contracts.
| | | | | | | | | | | | |
| | | Quarter Ending | | | Quarter Ending | | | Year Ending | |
| | | March 31, 2024 | | | March 31, 2023 | | | December 31, 2023 | |
Total Net Assets | | $ | - | | | $ | 2,206,024 | | | $ | 1,938,929 | |
Shares Outstanding | | | - | | | | 60,004 | | | | 50,004 | |
Net Asset Value per share | | $ | - | | | $ | 36.76 | | | $ | 38.78 | |
Closing Price | | $ | - | | | $ | 36.80 | | | $ | 38.85 | |
For the three months ended March 31, 2024 compared to the three months ended March 31, 2023.
| | | | | | | | | |
| | | Quarter Ending | | | Quarter Ending | |
| | | March 31, 2024 | | | March 31, 2023 | |
Average daily total net assets | | $ | 2,663,903 | | | $ | 1,465,004 | |
Net realized and unrealized loss on futures contracts | | $ | 36,240 | | | $ | 758,019 | |
Interest income earned on cash equivalents | | $ | 1,073 | | | $ | 13,448 | |
Annualized interest yield based on average daily total net assets | | | 0.04 | % | | | 0.92 | % |
Net Loss | | $ | 37,113 | | | $ | 768,072 | |
Weighted average share outstanding | | | 50,000 | | | | 50,004 | |
Management Fees | | $ | 200 | | | $ | 3,395 | |
Total gross fees and other expenses excluding management fees | | $ | 62,309 | | | $ | 73,965 | |
Brokerage Commissions | | $ | - | | | $ | 609 | |
Expenses waived by the Sponsor | | $ | (62,309 | ) | | $ | (70,570 | ) |
Total gross expense ratio | | | 286.28 | % | | | 20.48 | % |
Total expense ratio net of expenses waived by the Sponsor | | | 0.92 | % | | | 0.94 | % |
Net investment gain | | | 4.00 | % | | | 2.78 | % |
Creation of Shares | | | - | | | | 10,000 | |
Redemption of Shares | | | - | | | | - | |
Realized gain or loss on trading of cryptocurrency futures contracts is a function of: 1) the change in the price of the particular contracts sold as part of a “roll” in contracts as the nearest to expire contracts are exchanged for the appropriate contract given the investment objective of the fund, 2) the change in the price of particular contracts sold in relation to redemption of shares, 3) the gain or loss associated with rebalancing trades which are made to ensure conformance to the benchmark, 4) the number of contracts held and then sold for either circumstance aforementioned. The Fund recognizes the expense for brokerage commissions for futures contract trades on a per trade basis. Unrealized gain or loss on trading of cryptocurrency futures contracts is a function of the change in the price of contracts held on the final date of the period versus the purchase price for each contract and the number of contracts held in each contract month. The Sponsor has a static benchmark as described above and trades futures contracts to adhere to that benchmark and to adjust for the creation or redemption of shares.
The Fund seeks to earn interest and other income in investment grade, short-duration instruments or deposits associated with the pool’s cash management strategy that may be used to offset expenses. These investments may include, but are not limited to, short-term Treasury Securities, demand deposits, money market funds and investments in commercial paper. These interest rate levels may be lower or higher than the projected interest rates stated in the prospectuses and thus will impact your breakeven point.
DEFI is contractually obligated to pay a monthly management fee to the Sponsor, based on average daily net assets, at a rate equal to 0.94% per annum. From the Management Fee, the Sponsor pays all of the routine operational, administrative and other ordinary expenses net of expenses waivedthe Fund, generally as determined by the Sponsor, (“Totalincluding but not limited to, fees and expenses net”)of the Administrator, Custodian, Distributor, Transfer Agent, licensors, accounting and audit fees expenses, tax preparation expenses, legal fees, ongoing SEC registration fees, individual Schedule K-1 preparation and mailing fees, and report preparation and mailing expenses. These fees and expenses are not included in the breakeven table because they are paid for by the Sponsor through the proceeds from the Management Fee. The Fund pays all of its non-recurring and unusual fees and expenses, if any, as determined by the Sponsor. Non-recurring and unusual fees and expenses are unexpected or unusual in nature, such as legal claims and liabilities and litigation costs or indemnification or other unanticipated expenses. Extraordinary fees and expenses also include material expenses which are not currently anticipated obligations of the Fund. Routine operational, administrative, and other ordinary expenses are not deemed extraordinary expenses.
The graph below shows the actual shares outstanding, total net assets (or AUM) and net asset value per share (NAV per share) for the three-month periods ended September 30, 2017Fund from inception to March 31, 2024 and 2016 were $1,538serves to illustrate the relative changes of these components.
Other than the management fee to the Sponsor and $1,710 respectively.the brokerage commissions, most of the expenses incurred by the Fund are associated with the day-to-day operation of the Fund and the necessary functions related to regulatory compliance. These are generally based on contracts, which extend for some period of time and up to one year, or commitments regardless of the level of assets under management. The structure of the Fund and the nature of the expenses are such that as total net assets grow, there is a scalability of expenses that may allow the total expense ratio to be reduced. However, if total net assets for the Fund fall, the total expense ratio of expenses waivedthe Fund will increase unless additional reductions are made by the Sponsor periods was 0.50% in 2017to the daily expense accruals. The Sponsor can elect to adjust the daily expense accruals at its discretion based on market conditions and 0.50% in 2016. Net investment loss, which includes the impact of expenses and interest income, was 0.50% in 2017 and 0.50% in 2016.other Fund considerations.
Total expenses net of expenses waived by the Sponsor (“Total expenses, net”) for the nine-month periods ended September 30, 2017 and 2016 were $4,756 and $5,104 respectively. The total expense ratio net of expenses waived by the Sponsor periods was 0.50% in 2017 and 0.50% in 2016. Net investment loss, which includes the impact of expenses and interest income, was 0.50% in 2017 and 0.50% in 2016.
Market Outlook
The Corn Market
Corn is currently the most widely produced livestock feed grain in the United States. The two largest demands of the United States’ corn crop are used in livestock feed and ethanol production. Corn is also processed into food and industrial products, including starch, sweeteners, corn oil, beverages, and industrial alcohol. The United States Department of Agriculture (“USDA”) publishes weekly, monthly, quarterly, and annual updates for U.S. domestic and worldwide corn production and consumption, and for other grains such as soybeans and wheat which can be used in some cases as a substitute for corn. These reports are available on the USDA’s website, www.usda.gov, at no charge. The outlook provided below is from the April 2024 USDA report.
As a general matter, the occurrence of a severe weather event, natural disaster, terrorist attack, geopolitical events, outbreak, or public health emergency as declared by the World Health Organization, the continuation or expansion of war or other hostilities, or a prolonged government shutdown may have significant adverse effects on the Fund and its investments and alter current assumptions and expectations. For example, in late February 2022, Russia invaded Ukraine, significantly amplifying existing geopolitical tensions among Russia and other countries in the region and in the west. The responses of countries and political bodies to Russia’s actions, Ukraine’s military response and the potential for wider conflict may increase financial market volatility. Generally, these adverse effects may cause continued volatility in the price of corn, corn futures, and the share price of the Fund.
The price per bushel of corn in the United States is primarily a function of both U.S. and global production and demand. Long term impacts from sanctions, shipping disruptions, collateral war damage, and a potential expansion of the conflict between Russia and Ukraine could further disrupt the availability of corn supplies. These impacts remain important to track as both countries have played important roles in supplying grain to other parts of the world.
Geopolitical events have at times impacted the level of “backwardation” experienced by the Fund. As a result, near to expire contracts can trade at a higher price than longer to expire contracts, a situation referred to as “backwardation.” Putting aside the impact of the overall movement in prices of corn and corn futures, the Benchmark Component Futures Contracts (the corn futures contracts that the Fund invests in to achieve its investment objective) would tend to rise as they approach expiration. This backwardation may benefit the Fund because it will sell more expensive contracts and buy less expensive contracts on an ongoing basis.
Conversely, in the event of a corn futures market where near to expire contracts trade at a lower price than longer to expire contracts, a situation referred to as “contango,” then absent the impact of the overall movement in corn prices the value of the Benchmark Component Futures Contracts would tend to decline as they approach expiration. If the price of corn and corn futures were to decline, the Fund would experience the negative impact of contango.
The United States is the world’s leading producer and exporter of corn. For the Crop Year 2017-18,2023-24, the United States Department of Agriculture (“USDA”) estimates that the U.S. will produce approximately 35%32% of all the corn globally, of which about 13%14% will be exported. For 2017-2018,2023-2024, based on the April 2024, USDA reports, global consumption of 1,064.81,212 Million Metric Tons (MMT) is expected to be slightly higherlower than global production of 1,038.81,228 MMT. If the global supply ofdemand for corn exceedsis not equal to global demand,supply, this may have an adverse impact on the price of corn. Besides the United States, other principal world corn exporters include Argentina, Brazil, Russia, South Africa, and the former Soviet Union nations known as the FSU-12 which includes the Ukraine. Major importerimport nations include Mexico, Japan, the European Union (EU), South Korea, Egypt, and parts of Southeast Asia. China’s production at 215289 MMT is approximately 12%6% less than its domestic usage.
According to the USDA, global corn consumption has increased just over 440%617% from crop yearyears 1960/1961 to 2017/20182023/2024 as demonstrated by the graph below and is projected to continue to grow in upcomingcoming years. Consumption growth is the result of a combination of many factors including: 1) global population growth, which, according to the U.S. Census Department, is estimated to increase by approximately 77.9 million people in the 2017-18 timeframe and reach over 9.759.7 billion by 2050; 2) a growing global middle class which is increasing the demand for protein and meat-based products globally and most significantly in developing countries; and 3) increased use of bio-fuels,biofuels, including ethanol in the United States. Based on USDA estimates as of October 12, 2017, for each person added to the population, there needs to be an additional 5.6 bushels of corn, 1.7 bushels of soybeans and 3.7 bushels of wheat produced.

Globalcorn consumption may fluctuate year over year due to any number of reasons which may include, but is not limited to, economic conditions, global health concerns, international trade policy. Corn is a staple commodity used pervasively across the globe so that any contractions in consumption may only be temporary as has historically been the case.
While global consumption of corn has increased over the 1960/1961-2017/20181961-2023/2024 period, so has production, driven by increases in acres planted and yield per acre. However, according to the USDA and United Nations, future growth in planted acres and yield may be inhibited by lower-productivelower productive land, and lack of infrastructure and transportation. In addition, agricultural crops such as corn are highly weather-dependentweather dependent for yield and therefore susceptible to changing weather patterns. In addition, given the current production/consumption patterns, nearly 100% of all corn produced globally is consumed which leaves minimal excess inventory if production issues arise.
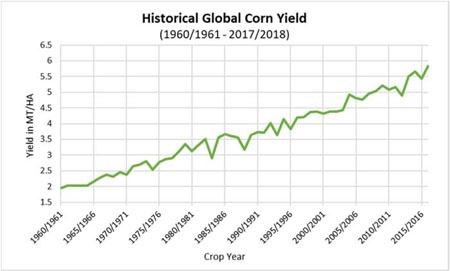
The price per bushel of corn in the United States is primarily a function of both U.S. and global production, as well as U.S. and global demand. The graph below shows the USDA published price per bushel by month for the period January 2007 to August 2017.February 2024.
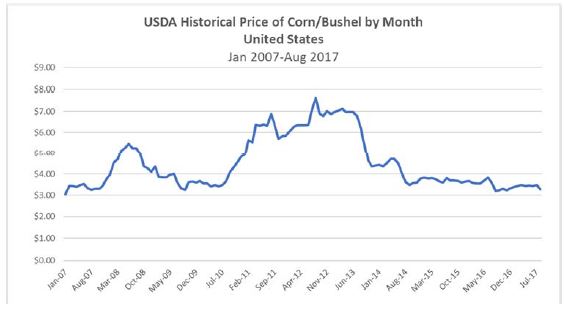
On October 12, 2017,April 11, 2024, the USDA released its monthly World Agricultural Supply and Demand Estimates (WASDE) for the Crop Year 2017-18.2023-24. The exhibit below provides a summary of historical and current information for United States corn production.
U.S. Corn Supply/Demand Balance Marketing Year September - August Million Bushels | | | | | | | | | | | | | | | | |
U.S. Corn Supply/Demand Balance | | U.S. Corn Supply/Demand Balance |
Marketing Year September - August | | Marketing Year September - August |
Million Bushels | | Million Bushels |
| | | | Apr 11 Est. | 22-23 to | Apr 11 Est. | 23-24 to |
| | | | | | | | | | | | | | | | | | | | | | | | | | | | | | | | | | | | | | | | | | | | Oct. 12 Est. USDA | | | | Sept. 12 Est. USDA | | | | Oct. 12 Est. USDA | | | |
Change from last month | | USDA | 21-22 | USDA | 22-23 |
| Crop Year | | | 06-07 | | | | 07-08 | | | | 08-09 | | | | 09-10 | | | | 10-11 | | | | 11-12 | | | | 12-13 | | | | 13-14 | | | | 14-15 | | | | 15-16 | | | | 16-17 | | | | 17-18 | | | | 17-18 | | | | Change | | | % Change | 12-13 | 13-14 | 14-15 | 15-16 | 16-17 | 17-18 | 18-19 | 19-20 | 20-21 | 21-22 | 22-23 | % Change | 23-24 | % Change |
| Planted Acres | | | 78.3 | | | | 93.5 | | | | 86.0 | | | | 86.4 | | | | 88.2 | | | | 91.9 | | | | 97.3 | | | | 95.4 | | | | 90.6 | | | | 88.0 | | | | 94.0 | | | | 90.9 | | | | 90.4 | | | | (1 | ) | | -0.6% | 97.3 | 95.4 | 90.6 | 88.0 | 94.0 | 90.2 | 88.9 | 89.7 | 90.7 | 92.9 | 88.2 | -5% | 94.6 | 7% |
| Harvested Acres | | | 70.6 | | | | 86.5 | | | | 78.6 | | | | 79.5 | | | | 81.4 | | | | 84.0 | | | | 87.4 | | | | 87.5 | | | | 83.1 | | | | 80.8 | | | | 86.7 | | | | 83.5 | | | | 83.1 | | | | (0 | ) | | -0.5% | 87.4 | 87.5 | 83.1 | 80.8 | 86.7 | 82.7 | 81.3 | 82.3 | 85.0 | 78.7 | -7% | 86.5 | 10% |
| Difference | | | 7.7 | | | | 7.0 | | | | 7.4 | | | | 6.9 | | | | 6.8 | | | | 7.9 | | | | 9.9 | | | | 7.9 | | | | 7.5 | | | | 7.2 | | | | 7.3 | | | | 7.4 | | | | 7.3 | | | | (0.1 | ) | | -1.4% | 9.9 | 7.9 | 7.5 | 7.2 | 7.3 | 7.5 | 7.6 | 8.4 | 7.9 | 9.5 | 20% | 8.1 | -15% |
| Yield | | | 149.1 | | | | 150.7 | | | | 153.9 | | | | 164.7 | | | | 152.8 | | | | 147.2 | | | | 123.1 | | | | 158.1 | | | | 171.0 | | | | 168.4 | | | | 174.6 | | | | 169.9 | | | | 171.8 | | | | 2 | | | 1.1% | 123.1 | 158.1 | 171.0 | 168.4 | 174.6 | 176.6 | 176.4 | 167.5 | 171.4 | 176.7 | 173.4 | -2% | 177.3 | 2% |
| | | | | | | | | | | | | | | | | | | | | | | | | | | | | | | | | | | | | | | | | | | | | | | | | | | | | | | | | | | | | | | |
| Beginning Stocks | | | 1,967 | | | | 1,304 | | | | 1,624 | | | | 1,673 | | | | 1,708 | | | | 1,128 | | | | 989 | | | | 821 | | | | 1,232 | | | | 1,731 | | | | 1,737 | | | | 2,350 | | | | 2,295 | | | | (55 | ) | | -2.3% | 989 | 821 | 1,232 | 1,731 | 1,737 | 2,293 | 2,140 | 2,221 | 1,919 | 1,235 | 1,377 | 11% | 1,360 | -1% |
| Production | | | 10,531 | | | | 13,038 | | | | 12,092 | | | | 13,092 | | | | 12,447 | | | | 12,360 | | | | 10,755 | | | | 13,829 | | | | 14,216 | | | | 13,602 | | | | 15,148 | | | | 14,184 | | | | 14,280 | | | | 96 | | | 0.7% | 10,755 | 13,829 | 14,216 | 13,602 | 15,148 | 14,609 | 14,340 | 13,620 | 14,111 | 15,018 | 13,651 | -9% | 15,342 | 12% |
| Imports | | | 12 | | | | 20 | | | | 14 | | | | 8 | | | | 28 | | | | 29 | | | | 160 | | | | 36 | | | | 32 | | | | 68 | | | | 57 | | | | 50 | | | | 50 | | | | — | | | 0.0% | 160 | 36 | 32 | 68 | 57 | 36 | 28 | 42 | 24 | 39 | 63% | 25 | -36% |
| Total Supply | | | 12,510 | | | | 14,362 | | | | 13,730 | | | | 14,774 | | | | 14,182 | | | | 13,516 | | | | 11,904 | | | | 14,686 | | | | 15,479 | | | | 15,401 | | | | 16,942 | | | | 16,585 | | | | 16,625 | | | | 40 | | | 0.2% | 11,904 | 14,686 | 15,479 | 15,401 | 16,942 | 16,939 | 16,509 | 15,883 | 16,055 | 16,277 | 15,066 | -7% | 16,727 | 11% |
| | | | | | | | | | | | | | | | | | | | | | | | | | | | | | | | | | | | | | | | | | | | | | | | | | | | | | | | | | | | | | |
| Feed | | | 5,540 | | | | 5,858 | | | | 5,205 | | | | 5,125 | | | | 4,793 | | | | 4,545 | | | | 4,315 | | | | 5,040 | | | | 5,280 | | | | 5,114 | | | | 5,464 | | | | 5,475 | | | | 5,500 | | | | 25 | | | 0.5% | 4,315 | 5,040 | 5,280 | 5,114 | 5,470 | 5,304 | 5,429 | 5,900 | 5,607 | 5,671 | 5,486 | -3% | 5,700 | 4% |
| Food/Seed/Industrial | | | 3,541 | | | | 4,442 | | | | 4,993 | | | | 5,961 | | | | 6,428 | | | | 6,439 | | | | 6,038 | | | | 6,493 | | | | 6,601 | | | | 6,648 | | | | 6,890 | | | | 6,925 | | | | 6,935 | | | | 10 | | | 0.1% | 6,038 | 6,493 | 6,601 | 6,648 | 6,885 | 7,057 | 6,793 | 6,286 | 6,467 | 6,757 | 6,558 | -3% | 6,805 | 4% |
| Ethanol for Fuel (incld above) | | | 2,119 | | | | 3,049 | | | | 3,677 | | | | 4,591 | | | | 5,021 | | | | 5,011 | | | | 4,641 | | | | 5,124 | | | | 5,200 | | | | 5,224 | | | | 5,438 | | | | 5,475 | | | | 5,475 | | | | — | | | 0.0% | |
Ethanol for Fuel(incld above) | | 4,641 | 5,124 | 5,200 | 5,224 | 5,432 | 5,605 | 5,378 | 4,857 | 5,028 | 5,320 | 5,176 | -3% | 5,400 | 4% |
| Exports | | | 2,125 | | | | 2,437 | | | | 1,858 | | | | 1,980 | | | | 1,834 | | | | 1,543 | | | | 730 | | | | 1,920 | | | | 1,867 | | | | 1,901 | | | | 2,293 | | | | 1,850 | | | | 1,850 | | | | — | | | 0.0% | 730 | 1,920 | 1,867 | 1,901 | 2,294 | 2,438 | 2,066 | 1,777 | 2,747 | 2,472 | 1,661 | -33% | 2,100 | 26% |
| Total Usage | | | 11,206 | | | | 12,737 | | | | 12,056 | | | | 13,066 | | | | 13,055 | | | | 12,527 | | | | 11,083 | | | | 13,454 | | | | 13,748 | | | | 13,664 | | | | 14,647 | | | | 14,250 | | | | 14,285 | | | | 35 | | | 0.2% | 11,083 | 13,454 | 13,748 | 13,664 | 14,650 | 14,798 | 14,288 | 13,963 | 14,821 | 14,900 | 13,706 | -8% | 14,605 | 7% |
| | | | | | | | | | | | | | | | | | | | | | | | | | | | | | | | | | | | | | | | | | | | | | | | | | | | | | | | | | | | | | |
| Ending Stocks (Inventory) | | | 1,304 | | | | 1,624 | | | | 1,673 | | | | 1,708 | | | | 1,128 | | | | 989 | | | | 821 | | | | 1,232 | | | | 1,731 | | | | 1,737 | | | | 2,295 | | | | 2,335 | | | | 2,340 | | | | 5 | | | 0.2% | 821 | 1,232 | 1,731 | 1,737 | 2,293 | 2,140 | 2,221 | 1,919 | 1,235 | 1,377 | 1,360 | -1% | 2,122 | 56% |
| | | | | | | | | | | | | | | | | | | | | | | | | | | | | | | | | | | | | | | | | | | | | | | | | | | | | | | | | | | | | | |
| Stocks/Use Ratio | | | 12 | % | | | 13 | % | | | 14 | % | | | 13 | % | | | 9 | % | | | 8 | % | | | 7 | % | | | 9 | % | | | 13 | % | | | 13 | % | | | 16 | % | | | 16 | % | | | 16 | % | | | | | 7% | 9% | 13% | 16% | 14% | 16% | 14% | 8% | 9% | 10% | 7% | 15% | 46% |
| farm Price ($/bushel) | | $ | 3.04 | | | $ | 4.20 | | | $ | 4.06 | | | $ | 3.55 | | | $ | 5.18 | | | $ | 6.22 | | | $ | 6.89 | | | $ | 4.46 | | | $ | 3.70 | | | $ | 3.61 | | | $ | 3.36 | | | $2.80 - 3.60 | | | $2.80 - 3.60 | | | | | | $ 6.89 | $ 4.46 | $ 3.70 | $ 3.61 | $ 3.36 | $3.36 | $3.61 | $3.56 | $4.53 | $6.00 | $6.54 | | $4.70 | |
| | | | | | | | | | | | | | | | | | | | | | | | | | | | | | | | | | | | | | | | | | | | | | | | | | | | | | | | | | | | | | |
| Calculations: | | | | | | | | | | | | | | | | | | | | | | | | | | | | | | | | | | | | | | | | | | | | | | | | | | | | | | | | | | | | | |
| Demand per day (incld expt)¹ | | | 30.7 | | | | 34.9 | | | | 33.0 | | | | 35.8 | | | | 35.8 | | | | 34.3 | | | | 30.4 | | | | 36.9 | | | | 37.7 | | | | 37.4 | | | | 40.1 | | | | 39.0 | | | | 39.1 | | | | 0.1 | | | 0.2% | |
Demand per day (incld expt)¹ | | 30.4 | 36.9 | 37.7 | 37.4 | 40.1 | 40.5 | 39.1 | 38.3 | 40.6 | 40.8 | 37.6 | -8% | 40.0 | 7% |
| Carry-out days supply | | | 42.5 | | | | 46.5 | | | | 50.7 | | | | 47.7 | | | | 31.5 | | | | 28.8 | | | | 27.0 | | | | 33.4 | | | | 46.0 | | | | 46.4 | | | | 57.2 | | | | 59.8 | | | | 59.8 | | | | -0.02 | | | 0.0% | 27.0 | 33.4 | 46.0 | 46.4 | 57.1 | 52.8 | 56.7 | 50.2 | 30.4 | 33.7 | 36.2 | 7% | 53.0 | 46% |
¹ in millions of bushels per day | | | | | | |
¹ in millions of bushels per day
Standard Corn Futures Contracts trade on the CBOT in units of 5,000 bushels, although 1,000 bushels “mini-corn” Corn Futures Contracts also trade.bushels. Three grades of corn are deliverable under CBOT Corn Futures Contracts: Number 1 yellow, which may be delivered at 1.5 cents over the contract price; Number 2 yellow, which may be delivered at the contract price; and Number 3 yellow, which may be delivered at 1.5between a 2 and 4 cents per bushel under the contract price.price depending on broken corn and foreign material and damage grade factors. There are five months each year in which CBOT Corn Futures Contracts expire: March, May, July, September, and December.
If the futures market is in a state of backwardation (i.e., when the price of corn in the future is expected to be less than the current price), the Fund will buy later-to-expirelater to expire contracts for a lower price than the sooner-to-expiresooner to expire contracts that it sells. Hypothetically, and assuming no changes to either prevailing corn prices or the price relationship between immediate delivery, soon-to-expiresoon to expire contracts and later-to-expirelater to expire contracts, the value of a contract will rise as it approaches expiration. Over time, if backwardation remained constant, the differences would continue to increase. If the futures market is in contango, the Fund will buy later-to-expirelater to expire contracts for a higher price than the sooner-to-expiresooner to expire contracts that it sells. Hypothetically, and assuming no other changes to either prevailing corn prices or the price relationship between the spot price, soon-to-expiresoon to expire contracts and later-to-expirelater to expire contracts, the value of a contract will fall as it approaches expiration. Over time, if contango remained constant, the difference would continue to increase. Historically, the corn futures markets have experienced periods of both contango and backwardation. Frequently, whether contango or backwardation exists is a function, among other factors, of the seasonality of the corn market and the corn harvest cycle. All other things being equal, a situation involving prolonged periods of contango may adversely impact the returns of the Fund; conversely a situation involving prolonged periods of backwardation may positively impact the returns of the Fund.
Futures contracts may be either bought or sold, long or short. The U.S Commodity Futures Trading Commission weekly releases the “Commitment of Traders” (COT) report, which depicts the open interest as well as long and short positions in the market. Market participants may use this report to gauge market sentiment.
The Soybean Market
Global soybean production is concentrated in the U.S., Brazil, Argentina, and China. The United States Department of Agriculture (“USDA”) has estimated that, for the Crop Year 2017-18,2023-24, the United States will produce approximately 120.6113 MMT of soybeans or approximately 35%29% of estimated world production, with Brazil production at 107155 MMT. Argentina is projected to produce about 5750 MMT. For 2017-18,2023-24, based on the April 11, 2024 USDA report, global consumption of 344.4381 MMT is estimated slightly lower than global production of 347.9397 MMT. If the global supply ofdemand for soybeans exceedsis not equal to global demand,supply, this may have an adverse impact on the price of soybeans. Global soybean consumption may fluctuate year over year due to any number of reasons which may include, but is not limited to, economic conditions, global health concerns, and international trade policy. Soybeans are a staple commodity used pervasively across the globe so that any contractions in consumption may only be temporary as has historically been the case. The USDA publishes weekly, monthly, quarterly, and annual updates for U.S. domestic and worldwide soybean production and consumption. These reports are available on the USDA’s website, www.usda.gov, at no charge. The outlook provided below is from the April 11, 2024 USDA report.
Global soybean production is concentrated in the U.S., Brazil, Argentina, and China. The United States Department of Agriculture (“USDA”) has estimated that, for the Crop Year 2023-24, the United States will produce approximately 113 MMT of soybeans or approximately 29% of estimated world production, with Brazil production at 155 MMT. Argentina is projected to produce about 50 MMT. For 2023-24, based on the April 11, 2024 USDA report, global consumption of 381 MMT is estimated slightly lower than global production of 397 MMT. If the global demand for soybeans is not equal to global supply, this may have an impact on the price of soybeans. Global soybean consumption may fluctuate year over year due to any number of reasons which may include, but is not limited to, economic conditions, global health concerns, and international trade policy. Soybeans are a staple commodity used pervasively across the globe so that any contractions in consumption may only be temporary as has historically been the case. The USDA publishes weekly, monthly, quarterly, and annual updates for U.S. domestic and worldwide soybean production and consumption. These reports are available on the USDA’s website, www.usda.gov, at no charge. The outlook provided below is from the April 11, 2024 USDA report.
As a general matter, the occurrence of a severe weather event, natural disaster, terrorist attack, geopolitical events, outbreak, or public health emergency as declared by the World Health Organization, the continuation or expansion of war or other hostilities, or a prolonged government shutdown may have significant adverse effects on the Fund and its investments and alter current assumptions and expectations. For example, in late February 2022, Russia invaded Ukraine, significantly amplifying existing geopolitical tensions among Russia and other countries in the region and in the west. Global response to Russia’s actions, the larger overarching tensions, and Ukraine’s military response may increase financial market volatility generally, have severe adverse effects on global economic markets, and cause volatility in the price of agricultural products, including agricultural futures, and the share price of the Fund.
The price per bushel of soybeans in the United States is primarily a function of both U.S. and global production and demand. The price per bushel of soybeans can be affected by the price of corn; because corn and soybeans are planted on the same acres, farmers must choose which crop to plant each year. If corn prices rise enough to incentivize the planting of corn over soybeans, the supply and price of soybeans could be affected. Long term impacts from sanctions, shipping disruptions, collateral war damage, and a potential expansion of the conflict between Russia and Ukraine could further disrupt the availability of agricultural products and supplies. China remains the largest importer of soybeans in the world.
Geopolitical events may have impacted the level of “backwardation” experienced by the Fund. The Russian invasion and related developments have indirectly placed upward pressure on the price of soybean and soybean futures contracts. As a result, near to expire contracts trade at a higher price than longer to expire contracts, a situation referred to as “backwardation.” Putting aside the impact of the overall movement in prices of soybean and soybean futures, the Benchmark Component Futures Contracts (the soybean futures contracts that the Fund invests in to achieve its investment objective) would tend to rise as they approach expiration. This backwardation may benefit the Fund because it will sell more expensive contracts and buy less expensive contracts on an ongoing basis. The degree of backwardation is also shown in the following table.
Conversely, in the event of a soybean futures market where near to expire contracts trade at a lower price than longer to expire contracts, a situation referred to as “contango,” then absent the impact of the overall movement in soybean prices the value of the Benchmark Component Futures Contracts would tend to decline as they approach expiration. If the prices of soybeans and soybean futures were to decline, for example the Fund would experience the negative impact of contango.
The soybean processing industry converts soybeans into soybean meal, soybean hulls, and soybean oil. Soybean meal and soybean hulls are processed into soy flour or soy protein, which are used, along with other commodities, by livestock producers and the farm fishingfish farming industry as feed. Soybean oil is sold in multiple grades and is used by the food, petroleum, and chemical industries. The food industry uses soybean oil in cooking and salad dressings, baking and frying fats, and butter substitutes, among other uses. In addition, the soybean industry continues to introduce soy-based products as substitutes to various petroleum-based products including lubricants, plastics, ink,inks, crayons, and candles. Soybean oil is also converted to biodiesel and renewable diesel for use as fuel.
Standard Soybean Futures Contracts trade on the CBOT in units of 5,000 bushels, although 1,000 bushel “mini-sized” Soybean Futures Contracts also trade. Three grades of soybeansoybeans are deliverable under CBOT Soybean Futures Contracts: Number 1 yellow, which may be delivered at 6 cents per bushel over the contract price; Number 2 yellow, which may be delivered at the contract price; and Number 3 yellow, which may be delivered at 6 cents per bushel under the contract price. There are seven months each year in which CBOT Soybean Futures Contracts expire: January, March, May, July, August, September, and November.
If the futures market is in a state of backwardation (i.e., when the price of soybeans in the future is expected to be less than the current price), the Fund will buy later-to-expirelater to expire contracts for a lower price than the sooner-to-expiresooner to expire contracts that it sells. Hypothetically, and assuming no changes to either prevailing soybean prices or the price relationship between immediate delivery, soon-to-expiresoon to expire contracts and later-to-expirelater to expire contracts, the value of a contract will rise as it approaches expiration. If the futures market is in contango, the Fund will buy later-to-expirelater to expire contracts for a higher price than the sooner-to-expiresooner to expire contracts that it sells. Hypothetically, and assuming no other changes to either prevailing soybean prices or the price relationship between the spot price, soon-to-expiresoon to expire contracts and later-to-expirelater to expire contracts, the value of a contract will fall as it approaches expiration. Historically, the soybeans futures markets have experienced periods of both contango and backwardation. Frequently, whether contango or backwardation exists is a function, among other factors, of the seasonality of the soybean market and the soybean harvest cycle. All other things being equal, a situation involving prolonged periods of contango may adversely impact the returns of the Fund; conversely a situation involving prolonged periods of backwardation may positively impact the returns of the Fund.
The price per bushel of soybeans in the United States is primarily a function of both U.S. and global production, as well as U.S. and global demand. The graph below shows the USDA published price per bushel by month for the period January 2007 to August 2017.
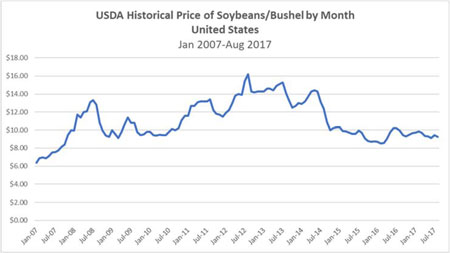
On October 12, 2017,April 11, 2024, the USDA released its monthly World Agricultural Supply and Demand Estimates (WASDE) for the Crop Year 2017-18.2023-24. The exhibit below provides a summary of historical and current information for United States soybean production.
| | | U.S. Soybean Supply/Demand Balance | | | | | | | | | | | |
| | | Marketing Year September - August | | | | | | | | | | | |
U.S. Soybean Supply/Demand Balance | | U.S. Soybean Supply/Demand Balance |
Marketing Year September - August | | Marketing Year September - August |
Million Bushels | | Million Bushels |
| | | Million Bushels | | | | | | | | | | | | | | | | | | | | | | Apr 11 Est. | 22-23 to | Apr 11 Est. | 23-24 to |
| | | | | | | | | | | | | | | | | | | | | | | | | | | | | | | | | | | | | | | | | | | | Oct. 12 Est. USDA | | | | Sept 12 Est. USDA | | | | Oct. 12 Est. USDA | | | Change from last month | | | USDA | 21-22 | USDA | 22-23 |
| Crop Year | | | 06-07 | | | | 07-08 | | | | 08-09 | | | | 09-10 | | | | 10-11 | | | | 11-12 | | | | 12-13 | | | | 13-14 | | | | 14-15 | | | | 15-16 | | | | 16-17 | | | | 17-18 | | | | 17-18 | | | | Change | | | | % Change | | 12-13 | 13-14 | 14-15 | 15-16 | 16-17 | 17-18 | 18-19 | 19-20 | 20-21 | 21-22 | 22-23 | % Change | 23-24 | % Change |
| Planted Acres | | | 75.5 | | | | 64.7 | | | | 75.7 | | | | 77.5 | | | | 77.4 | | | | 75.0 | | | | 77.2 | | | | 76.8 | | | | 83.3 | | | | 82.7 | | | | 83.4 | | | | 89.5 | | | | 90.2 | | | | 0.70 | | | | 1 | % | 77.2 | 76.8 | 83.3 | 82.7 | 83.5 | 90.2 | 89.2 | 76.1 | 83.4 | 87.2 | 87.5 | 0% | 83.6 | -4% |
| Harvested Acres | | | 74.6 | | | | 64.1 | | | | 74.7 | | | | 76.4 | | | | 76.6 | | | | 73.8 | | | | 76.1 | | | | 76.3 | | | | 82.6 | | | | 81.7 | | | | 82.7 | | | | 88.7 | | | | 89.5 | | | | 0.80 | | | | 1 | % | 76.1 | 76.3 | 82.6 | 81.7 | 82.7 | 89.5 | 87.6 | 74.9 | 82.6 | 86.3 | 86.2 | 0% | 82.4 | -4% |
| Difference | | | 0.9 | | | | 0.6 | | | | 1.0 | | | | 1.1 | | | | 0.8 | | | | 1.2 | | | | 1.0 | | | | 0.5 | | | | 0.7 | | | | 1.0 | | | | 0.7 | | | | 0.8 | | | | 0.7 | | | | (0.10 | ) | | | -12 | % | 1.0 | 0.5 | 0.7 | 1.0 | 0.8 | 0.7 | 1.6 | 1.2 | 0.8 | 0.9 | 1.3 | 44% | 1.2 | -8% |
| Yield | | | 42.9 | | | | 41.7 | | | | 39.7 | | | | 44.0 | | | | 43.5 | | | | 41.9 | | | | 40.0 | | | | 44.0 | | | | 47.5 | | | | 48.0 | | | | 52.0 | | | | 49.9 | | | | 49.5 | | | | (0.40 | ) | | | -1 | % | 40.0 | 44.0 | 47.5 | 48.0 | 51.9 | 49.3 | 50.6 | 47.4 | 51.0 | 51.7 | 49.6 | -4% | 50.6 | 2% |
| | | | | | | | | | | | | | | | | | | | | | | | | | | | | | | | | | | | | | | | | | | | | | | | | | | | | | | | | | | | | | | | |
| Beginning Stocks | | | 449 | | | | 574 | | | | 205 | | | | 138 | | | | 151 | | | | 215 | | | | 169 | | | | 141 | | | | 92 | | | | 191 | | | | 197 | | | | 345 | | | | 301 | | | | (44.00 | ) | | | -13 | % | 169 | 141 | 92 | 191 | 197 | 302 | 438 | 909 | 525 | 257 | 274 | 7% | 264 | -4% |
| Production | | | 3,197 | | | | 2,677 | | | | 2,967 | | | | 3,359 | | | | 3,329 | | | | 3,094 | | | | 3,042 | | | | 3,358 | | | | 3,927 | | | | 3,926 | | | | 4,296 | | | | 4,431 | | | | 4,431 | | | | — | | | | 0 | % | 3,042 | 3,358 | 3,927 | 3,926 | 4,296 | 4,412 | 4,428 | 3,552 | 4,216 | 4,464 | 4,270 | -4% | 4,165 | -2% |
| Imports | | | 9 | | | | 10 | | | | 13 | | | | 15 | | | | 14 | | | | 16 | | | | 41 | | | �� | 72 | | | | 33 | | | | 24 | | | | 22 | | | | 25 | | | | 25 | | | | — | | | | 0 | % | 41 | 72 | 33 | 24 | 22 | 14 | 15 | 20 | 16 | 25 | 56% | 25 | 0% |
| Total Supply | | | 3,655 | | | | 3,261 | | | | 3,185 | | | | 3,512 | | | | 3,495 | | | | 3,325 | | | | 3,252 | | | | 3,570 | | | | 4,052 | | | | 4,140 | | | | 4,515 | | | | 4,801 | | | | 4,757 | | | | (44.00 | ) | | | -1 | % | 3,252 | 3,570 | 4,052 | 4,140 | 4,516 | 4,735 | 4,880 | 4,476 | 4,761 | 4,737 | 4,569 | -4% | 4,454 | -3% |
| | | | | | | | | | | | | | | | | | | | | | | | | | | | | | | | | | | | | | | | | | | | | | | | | | | | | | | | | | | | | | | | |
| Crushings | | | 1,808 | | | | 1,801 | | | | 1,662 | | | | 1,752 | | | | 1,648 | | | | 1,703 | | | | 1,689 | | | | 1,734 | | | | 1,873 | | | | 1,886 | | | | 1,899 | | | | 1,940 | | | | 1,940 | | | | — | | | | 0 | % | 1,689 | 1,734 | 1,873 | 1,886 | 1,901 | 2,055 | 2,092 | 2,165 | 2,141 | 2,204 | 2,212 | 0% | 2,300 | 4% |
| Seed, Feed and Residual | | | 157 | | | | 93 | | | | 106 | | | | 110 | | | | 131 | | | | 89 | | | | 105 | | | | 107 | | | | 146 | | | | 115 | | | | 141 | | | | 136 | | | | 136 | | | | — | | | | 0 | % | 105 | 107 | 146 | 115 | 147 | 109 | 127 | 108 | 97 | 107 | 101 | -6% | 113 | 12% |
| Exports | | | 1,116 | | | | 1,162 | | | | 1,279 | | | | 1,499 | | | | 1,501 | | | | 1,365 | | | | 1,317 | | | | 1,638 | | | | 1,842 | | | | 1,942 | | | | 2,174 | | | | 2,250 | | | | 2,250 | | | | — | | | | 0 | % | 1,317 | 1,638 | 1,842 | 1,942 | 2,166 | 2,134 | 1,752 | 1,679 | 2,266 | 2,152 | 1,992 | -7% | 1,700 | -15% |
| Total Usage | | | 3,081 | | | | 3,056 | | | | 3,047 | | | | 3,361 | | | | 3,280 | | | | 3,155 | | | | 3,111 | | | | 3,478 | | | | 3,862 | | | | 3,944 | | | | 4,214 | | | | 4,326 | | | | 4,326 | | | | — | | | | 0 | % | 3,111 | 3,478 | 3,862 | 3,944 | 4,214 | 4,297 | 3,971 | 3,952 | 4,504 | 4,463 | 4,305 | -4% | 4,114 | -4% |
| | | | | | | | | | | | | | | | | | | | | | | | | | | | | | | | | | | | | | | | | | | | | | | | | | | | | | | | | | | | | | | | |
| Ending Stocks (Inventory) | | | 574 | | | | 205 | | | | 138 | | | | 151 | | | | 215 | | | | 169 | | | | 141 | | | | 92 | | | | 191 | | | | 197 | | | | 301 | | | | 475 | | | | 430 | | | | (45.00 | ) | | | -9 | % | 141 | 92 | 191 | 197 | 302 | 438 | 909 | 525 | 257 | 274 | 264 | -4% | 340 | 29% |
| | | | | | | | | | | | | | | | | | | | | | | | | | | | | | | | | | | | | | | | | | | | | | | | | | | | | | | | | | | | | | | | |
| Stocks/Use Ratio | | | 18.6 | % | | | 6.7 | % | | | 4.5 | % | | | 4.5 | % | | | 6.6 | % | | | 5.4 | % | | | 4.5 | % | | | 2.6 | % | | | 4.9 | % | | | 5.0 | % | | | 7.1 | % | | | 11.0 | % | | | 9.9 | % | | | (0.01 | ) | | | -9 | % | 4.5% | 2.6% | 4.9% | 5.0% | 7.2% | 10.2% | 22.9% | 13.3% | 5.7% | 6.1% | 6% | 0% | 8.3% | 35% |
| farm Price ($/bushel) | | $ | 6.43 | | | $ | 10.10 | | | $ | 9.97 | | | $ | 9.59 | | | $ | 11.30 | | | $ | 12.50 | | | $ | 14.40 | | | $ | 13.00 | | | $ | 10.10 | | | $ | 8.95 | | | $ | 9.47 | | | $8.35-10.05 | | | $8.35-10.05 | | | | | | | | | | $ 14.40 | $ 13.00 | $ 10.10 | $ 8.95 | $ 9.47 | $9.33 | $8.48 | $8.57 | $10.80 | $13.30 | $14.20 | | $12.55 | |
| | | | | | | | | | | | | | | | | | | | | | | | | | | | | | | | | | | | | | | | | | | | | | | | | | | | | | | | | | | | | | | | |
| Calculations: | | | | | | | | | | | | | | | | | | | | | | | | | | | | | | | | | | | | | | | | | | | | | | | | | | | | | | | | | | | | | | | |
| Demand per day (incld expt)¹ | | | 8.4 | | | | 8.4 | | | | 8.3 | | | | 9.2 | | | | 9.0 | | | | 8.6 | | | | 8.5 | | | | 9.5 | | | | 10.6 | | | | 10.8 | | | | 11.5 | | | | 11.9 | | | | 11.9 | | | | — | | | | 0 | % | |
Demand per day (incld expt)¹ | | 8.5 | 9.5 | 10.6 | 10.8 | 11.5 | 11.8 | 10.9 | 10.8 | 12.3 | 12.2 | 11.8 | -4% | 11.3 | -4% |
| Carry-out days supply | | | 68.0 | | | | 24.5 | | | | 16.5 | | | | 16.4 | | | | 23.9 | | | | 19.6 | | | | 16.6 | | | | 9.7 | | | | 18.1 | | | | 18.2 | | | | 26.1 | | | | 40.1 | | | | 36.3 | | | | (3.80 | ) | | | -9 | % | 16.6 | 9.7 | 18.1 | 18.2 | 26.2 | 37.2 | 83.6 | 48.5 | 20.8 | 22.4 | 22.4 | 0% | 30.2 | 35% |
¹ in millions of bushels per day | | | | |
¹ in millions
The Sugar Market
Sugarcane accounts for about 75%nearly 79% of the world’s sugar production, while sugar beets account for the remainder of the world’s sugar production. Sugar manufacturers use sugar beets and sugarcane as the raw material from which refined sugar (sucrose) for industrial and consumer use is produced. Sugar is produced in various forms, including granulated, powdered, liquid, brown, and molasses. The food industry (in particular, producers of baked goods, beverages, cereal, confections, and dairy products) uses sugar and sugarcane molasses to make sugar-containing food products. Sugar beet pulp and molasses products are used as animal feed ingredients. Ethanol is an important by-product of sugarcane processing. Additionally, the material that is left over after sugarcane is processed is used to manufacture paper, cardboard, and “environmentally friendly” eating utensils.
As a general matter, the occurrence of a severe weather event, natural disaster, terrorist attack, geopolitical events, outbreak, or public health emergency as declared by the World Health Organization, the continuation or expansion of war or other hostilities, or a prolonged government shutdown may have significant adverse effects on the Fund and its investments and alter current assumptions and expectations. For example, in late February 2022, Russia invaded Ukraine, significantly amplifying existing geopolitical tensions among Russia and other countries in the region and in the west. The responses of countries and political bodies to Russia’s actions, the larger overarching tensions, and Ukraine’s military response and the potential for wider conflict may increase financial market volatility generally, have severe adverse effects on global economic markets, and cause volatility in the price of agricultural products, including agricultural futures, and the share price of the Fund.
The price per pound of sugar in the United States is primarily a function of both U.S. and global production and demand as well as expansive protectionist policies implemented by the US Government. Long term impacts from sanctions, shipping disruptions, collateral war damage, and a potential expansion of the conflict between Russia and Ukraine could further disrupt the availability of agricultural products and supplies. Russian production of sugar comes primarily from sugar beets. Ukraine’s sugar production is small and relatively inconsequential to global sugar markets.
Geopolitical events may have also impacted the level of “backwardation” experienced by the Fund. The Russian invasion and related developments may have placed upward pressure on the price of sugar and sugar futures contracts. As a result, near to expire contracts trade at a higher price than longer to expire contracts, a situation referred to as “backwardation.” Putting aside the impact of the overall movement in prices of sugar and sugar futures, the Benchmark Component Futures Contracts (the sugar futures contracts that the Fund invests in to achieve its investment objective) would tend to rise as they approach expiration. This backwardation may benefit the Fund because it will sell more expensive contracts and buy less expensive contracts on an ongoing basis.
Conversely, in the event of a sugar futures market where near to expire contracts trade at a lower price than longer to expire contracts, a situation referred to as “contango,” then absent the impact of the overall movement in sugar prices the value of the Benchmark Component Futures Contracts would tend to decline as they approach expiration. If the prices of sugar and sugar futures were to decline the Fund would experience the negative impact of contango.
The Sugar No. 11 Futures Contract is the world benchmark contract for raw sugar trading. This contract prices the physical delivery of raw cane sugar, delivered to the receiver’s vessel at a specified port within the country of origin of the sugar. Sugar No. 11 Futures Contracts trade on ICE Futures US and the NYMEX in units of 112,000 pounds.
The United States Department of Agriculture (“USDA”) publishes two major reports annually on U.S. domestic and worldwide sugar production and consumption. These are usually released in November and May. In addition, the USDA publishes periodic, but not as comprehensive, reports on sugar monthly. These reports are available on the USDA’s website, www.usda.gov, at no charge. The USDA’s May 2017November 2023 report forecasts that Brazil, withfor the 2023-24 Marketing year estimated global production of 39.7 million metric tons, will continue183.5 MMT with higher production in Brazil and India expected to be the leading producer of sugarcane worldwide. Brazil’s production, which outpaces the other principal global producers, namely India,more than offset declines in Thailand and China, equatesPakistan. Consumption is expected to approximately 22% of the world’s supply. The principal producers of sugar beets, as forecasted by the USDA for 2017, include the European Union, the United States,rise due to growth in markets including India and Russia.
World estimated raw sugar productionPakistan. Stocks are forecast lower to help meet domestic demand and higher exports from markets including Brazil and Thailand. Sugar is a near-record 180 million metric tons and is up sharply fromstaple commodity used pervasively across the previous two years. The USDA’s May 2017 report estimatesglobe so that record globalany contractions in consumption of 172 million metric tons will stillmay only be below production. Despite this year record production, ending stocks are projected to fall 2% to 38 million tons. Unliketemporary as has historically been the previous two years in which demand exceeded supply, the most current period may see the global supply for sugar exceed demand. In the past, this situation has, generally, resulted in price decrease. However, if the global demand of sugar exceeds global supply, prices will generally increase.case.
The USDA, in its May 2017 report highlights, in the graph immediately below, the fact that sugar prices have fallen in response to record production. The second graph shows the increased exports out
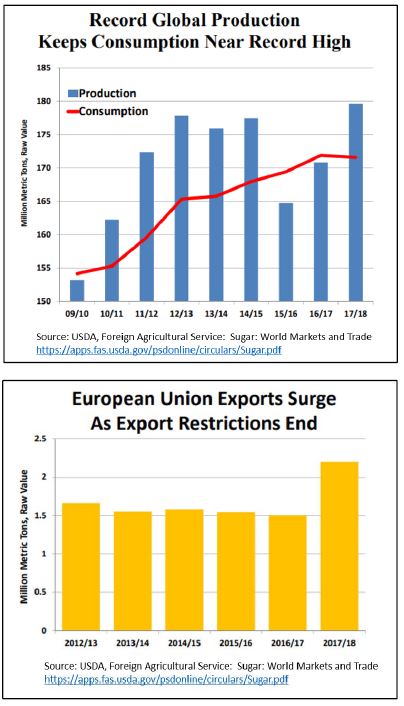
If the futures market is in a state of backwardation (i.e., when the price of sugar in the future is expected to be less than the current price), the Fund will buy later-to-expirelater to expire contracts for a lower price than the sooner-to-expiresooner to expire contracts that it sells. Hypothetically, and assuming no changes to either prevailing sugar prices or the price relationship between immediate delivery, soon-to-expiresoon to expire contracts and later-to-expirelater to expire contracts, the value of a contract will rise as it approaches expiration. If the futures market is in contango, the Fund will buy later-to-expirelater to expire contracts for a higher price than the sooner-to-expiresooner to expire contracts that it sells. Hypothetically, and assuming no other changes to either prevailing sugar prices or the price relationship between the spot price, soon-to-expiresoon to expire contracts and later-to-expirelater to expire contracts, the value of a contract will fall as it approaches expiration. Historically, the sugar futures markets have experienced periods of both contango and backwardation. Frequently, whether contango or backwardation exists is a function, among other factors, of the seasonality of the sugar market and the sugar harvest cycle. All other things being equal, a situation involving prolonged periods of contango may adversely impact the returns of the Funds; conversely a situation involving prolonged periods of backwardation may positively impact the returns of the Funds.
Futures contracts may be either bought or sold long or short. The U.S Commodity Futures Trading Commission weekly releases the “Commitment of Traders” (COT) report, which depicts the open interest as well as long and short positions in the market. Market participants may use this report to gauge market sentiment.
The Wheat Market
Wheat is used to produce flour, the key ingredient for breads, pasta, crackers, and many other food products, as well as several industrial products such as starches and adhesives. Wheat by-products are used in livestock feeds. Wheat is the principal food grain produced in the United States, and the United States’ output of wheat is typically exceeded only by that of China, the European Union, the former Soviet nations, known as the FSU-12, including the Ukraine,Russia, and India. The United States Department of Agriculture (“USDA”) estimates that for 2017-18,2023-24, the principal global producers of wheat will be the EU, the former Soviet nations known as the FSU-12,Russia, Ukraine, China, India, the United States, Australia, and Canada. The U.S. generates approximately 6% of the global production, with approximately 56%39% of that being exported. For 2017-18,2023-24, based on the April 11, 2024 USDA report, global consumption of 739.6800 MMT is estimated to be slightly lowerhigher than production of 751.2787 MMT. If the global supplydemand of wheat exceedsis not equal to global demand,supply, this may have an adverse impact on the price of wheat. Global wheat consumption may fluctuate year over year due to any number of reasons which may include, but is not limited to, economic conditions, global health concerns, international trade policy. Wheat is a staple commodity used pervasively across the globe so that any contractions in consumption may only be temporary as has historically been the case. The USDA publishes weekly, monthly, quarterly, and annual updates for U.S. domestic and worldwide wheat production and consumption. These reports are available on the USDA’s website, www.usda.gov, at no charge. The outlook provided herein is from the April 11, 2024 USDA report.
As a general matter, the occurrence of a severe weather event, natural disaster, terrorist attack, geopolitical events, outbreak, or public health emergency as declared by the World Health Organization, the continuation or expansion of war or other hostilities, or a prolonged government shutdown may have significant adverse effects on the Fund and its investments and alter current assumptions and expectations. For example, in late February 2022, Russia invaded Ukraine, significantly amplifying already existing geopolitical tensions among Russia and other countries in the region and in the west. The responses of countries and political bodies to Russia’s actions, the larger overarching tensions, Ukraine’s military response may increase financial market volatility. The results can have severe adverse effects on global economic markets, and cause volatility in the price of wheat, wheat futures and the share price of the Fund.
The price per bushel of wheat in the United States is primarily a function of both U.S. and global wheat production and demand. Russia and Ukraine, historically, have constituted the top export supply of wheat by volume (approximately 30 percent of total global wheat exports) to the world. The escalating conflict between the two countries, including but not limited to, sanctions, shipping disruptions, and collateral war damage could further disrupt the availability of wheat supplies. The conflict has greatly impacted exports of the wheat crop that was harvested last season and is currently in storage.
Geopolitical events have also impacted the level of “backwardation” experienced by the Fund. The Russian invasion and related developments placed upward pressure on the price of wheat and wheat futures contracts. As a result, near to expire contracts traded at a higher price than longer to expire contracts, a situation referred to as “backwardation.” Putting aside the impact of the overall movement in prices of wheat and wheat futures, the Benchmark Component Futures Contracts (the wheat futures contracts that the Fund invests in to achieve its investment objective) would tend to rise as they approach expiration. This backwardation may benefit the Fund because it will sell more expensive contracts and buy less expensive contracts on an ongoing basis. The degree of backwardation is also shown in the following table.
Conversely, in the event of a wheat futures market where near to expire contracts trade at a lower price than longer to expire contracts, a situation referred to as “contango,” then absent the impact of the overall movement in wheat prices the value of the Benchmark Component Futures Contracts would tend to decline as they approach expiration. If the prices of wheat and wheat futures were to decline, for example, the Fund would experience the negative impact of contango.
There are several types of wheat grown in the U.S., which are classified in terms of color, hardness, and growing season. CBOT Wheat Futures Contracts call for delivery of #2 soft red winter wheat, which is generally grown in the eastern third of the United States, but other types and grades of wheat may also be delivered (Grade #1 soft red winter wheat, Hard Red Winter, Dark Northern Spring and Northern Spring wheat may be delivered at 3 cents premium per bushel over the contract price and #2 soft red winter wheat, Hard Red Winter, Dark Northern Spring and Northern Spring wheat may be delivered at the contract price.) Winter wheat is planted in the fall and is harvested in the late spring or early summer of the following year, while spring wheat is planted in the spring and harvested in late summer or fall of the same year. Standard Wheat Futures Contracts trade on the CBOT in units of 5,000 bushels, although 1,000 bushel “mini-wheat” Wheat Futures Contracts also trade.bushels. There are five months each year in which CBOT Wheat Futures Contracts expire: March, May, July, September, and December.
If the futures market is in a state of backwardation (i.e., when the price of wheat in the future is expected to be less than the current price), the Fund will buy later-to-expirelater to expire contracts for a lower price than the sooner-to-expiresooner to expire contracts that it sells. Hypothetically, and assuming no changes to either prevailing wheat prices or the price relationship between immediate delivery, soon-to-expiresoon to expire contracts and later-to-expirelater to expire contracts, the value of a contract will rise as it approaches expiration. If the futures market is in contango, the Fund will buy later-to-expirelater to expire contracts for a higher price than the sooner-to-expiresooner to expire contracts that it sells. Hypothetically, and assuming no other changes to either prevailing wheat prices or the price relationship between the spot price, soon-to-expiresoon to expire contracts and later-to-expirelater to expire contracts, the value of a contract will fall as it approaches expiration. Historically, the wheat futures markets have experienced periods of both contango and backwardation. Frequently, whether contango or backwardation exists is a function, among other factors, of the seasonality of the wheat market and the wheat harvest cycle. All other things being equal, a situation involving prolonged periods of contango may adversely impact the returns of the Fund; conversely a situation involving prolonged periods of backwardation may positively impact the returns of the Fund.
Futures contracts may be either bought or sold, long or short. The U.S Commodity Futures Trading Commission weekly releases the “Commitment of Traders” (COT) report, which depicts the open interest as well as long and short positions in the market. Market participants may use this report to gauge market sentiment.
The price per bushel of wheat in the United States is primarily a function of both U.S. and global production, as well as U.S. and global demand. The graph below shows the USDA published price per bushel by month for the period January 2007 to August 2017.
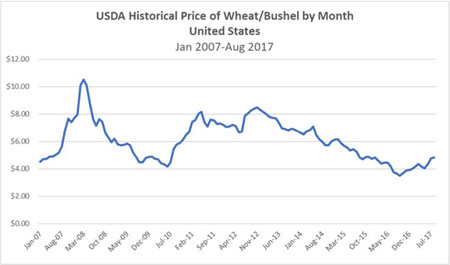
On October 12, 2017,April 11, 2024, the USDA released its monthly World Agricultural Supply and Demand Estimates (WASDE) for the Crop Year 2017-18.2023-24. The exhibit below provides a summary of historical and current information for United States wheat production.
| | | U.S. Wheat Supply/Demand Balance | | | | | | | | | | | | |
| | | Marketing Year June - May | | | | | | | | | | | | |
U.S. Wheat Supply/Demand Balance | | U.S. Wheat Supply/Demand Balance |
Marketing Year June - May | | Marketing Year June - May |
Million Bushels | | Million Bushels |
| | | Million Bushels | | | | | | | | | | | | | Apr 11 Est. | 22-23 to | Apr 11 Est. | 23-24 to |
| | | | | | | | | | | | | | | | | | | | | | | | Oct. 12 Est. USDA | | | Sept 12 Est. USDA | | | Oct. 12 Est. USDA | | | Change from last month | | | USDA | 21-22 | USDA | 22-23 |
| Crop Year | | 06-07 | | 07-08 | | 08-09 | | 09-10 | | 10-11 | | 11-12 | | 12-13 | | 13-14 | | 14-15 | | 15-16 | | | 16-17 | | | 17-18 | | | 17-18 | | | Change | | | % Change | | 12-13 | 13-14 | 14-15 | 15-16 | 16-17 | 17-18 | 18-19 | 19-20 | 20-21 | 21-22 | 22-23 | % Change | 23-24 | % Change |
| Planted Acres | | | 57.3 | | | | 60.5 | | | | 63.2 | | | | 59.2 | | | | 53.6 | | | | 54.4 | | | | 55.3 | | | | 56.2 | | | | 56.8 | | | | 55.0 | | | | 50.1 | | | | 45.7 | | | | 46.0 | | | | 0.30 | | | | 0.7 | % | 55.3 | 56.2 | 56.8 | 55.0 | 50.1 | 46.1 | 47.8 | 45.5 | 44.5 | 46.7 | 45.8 | -2% | 49.6 | 8% |
| Harvested Acres | | | 46.8 | | | | 51.0 | | | | 55.7 | | | | 49.9 | | | | 47.6 | | | | 45.7 | | | | 48.8 | | | | 45.3 | | | | 46.4 | | | | 47.3 | | | | 43.9 | | | | 38.1 | | | | 37.6 | | | | (0.50 | ) | | | -1.3 | % | 48.8 | 45.3 | 46.4 | 47.3 | 43.8 | 37.6 | 39.6 | 37.4 | 36.8 | 37.1 | 35.5 | -4% | 37.3 | 5% |
| Difference | | | 10.5 | | | | 9.5 | | | | 7.5 | | | | 9.3 | | | | 6.0 | | | | 8.7 | | | | 6.5 | | | | 10.9 | | | | 10.4 | | | | 7.7 | | | | 6.2 | | | | 7.6 | | | | 8.4 | | | | 0.80 | | | | 10.5 | % | 6.5 | 10.9 | 10.4 | 7.7 | 6.3 | 8.5 | 8.2 | 8.1 | 7.7 | 9.6 | 10.3 | 7% | 12.3 | 19% |
| Yield | | | 38.6 | | | | 40.2 | | | | 44.9 | | | | 44.5 | | | | 46.3 | | | | 43.7 | | | | 46.2 | | | | 47.1 | | | | 43.7 | | | | 43.6 | | | | 52.7 | | | | 45.6 | | | | 46.3 | | | | 0.70 | | | | 1.5 | % | 46.2 | 47.1 | 43.7 | 43.6 | 52.7 | 46.4 | 47.6 | 51.7 | 49.7 | 44.3 | 46.5 | 5% | 48.6 | 5% |
| | | | | | | | | | | | | | | | | | | | | | | | | | | | | | | | | | | | | | | | | | | | | | | | | | | | | | | | | | | | | | | | | | |
| Beginning Stocks | | | 571 | | | | 456 | | | | 306 | | | | 657 | | | | 976 | | | | 862 | | | | 743 | | | | 718 | | | | 590 | | | | 752 | | | | 976 | | | | 1,184 | | | | 1,181 | | | | (3.00 | ) | | | -0.3 | % | 743 | 718 | 590 | 752 | 976 | 1,181 | 1,099 | 1,080 | 1,028 | 845 | 674 | -20% | 570 | -15% |
| Production | | | 1,808 | | | | 2,051 | | | | 2,499 | | | | 2,218 | | | | 2,207 | | | | 1,999 | | | | 2,252 | | | | 2,135 | | | | 2,026 | | | | 2,062 | | | | 2,309 | | | | 1,739 | | | | 1,741 | | | | 2.00 | | | | 0.1 | % | 2,252 | 2,135 | 2,026 | 2,062 | 2,309 | 1,741 | 1,885 | 1,932 | 1,828 | 1,646 | 1,650 | 0% | 1,812 | 10% |
| Imports | | | 122 | | | | 113 | | | | 127 | | | | 119 | | | | 97 | | | | 112 | | | | 123 | | | | 173 | | | | 151 | | | | 113 | | | | 118 | | | | 150 | | | | 150 | | | | — | | | | 0.0 | % | 123 | 173 | 151 | 113 | 118 | 158 | 135 | 104 | 100 | 96 | 122 | 27% | 140 | 15% |
| Total Supply | | | 2,501 | | | | 2,620 | | | | 2,932 | | | | 2,993 | | | | 3,279 | | | | 2,974 | | | | 3,118 | | | | 3,026 | | | | 2,768 | | | | 2,927 | | | | 3,402 | | | | 3,074 | | | | 3,071 | | | | (3.00 | ) | | | -0.1 | % | 3,118 | 3,026 | 2,768 | 2,927 | 3,402 | 3,080 | 3,119 | 3,116 | 2,956 | 2,588 | 2,446 | -5% | 2,522 | 3% |
| | | | | | | | | | | | | | | | | | | | | | | | | | | | | | | | | | | | | | | | | | | | | | | | | | | | | | | | | | | | | | | | | | |
| Food | | | 938 | | | | 948 | | | | 927 | | | | 919 | | | | 926 | | | | 941 | | | | 951 | | | | 955 | | | | 958 | | | | 957 | | | | 949 | | | | 950 | | | | 950 | | | | — | | | | 0.0 | % | 951 | 955 | 958 | 957 | 949 | 964 | 954 | 962 | 961 | 971 | 973 | 0% | 960 | -1% |
| Seed | | | 82 | | | | 88 | | | | 78 | | | | 69 | | | | 71 | | | | 76 | | | | 73 | | | | 77 | | | | 79 | | | | 67 | | | | 61 | | | | 66 | | | | 66 | | | | — | | | | 0.0 | % | 73 | 77 | 79 | 67 | 61 | 63 | 59 | 62 | 64 | 58 | 68 | 17% | 64 | -6% |
| Feed and residual | | | 117 | | | | 16 | | | | 255 | | | | 150 | | | | 132 | | | | 164 | | | | 364 | | | | 228 | | | | 114 | | | | 149 | | | | 157 | | | | 150 | | | | 120 | | | | (30.00 | ) | | | -20.0 | % | 364 | 228 | 114 | 149 | 160 | 47 | 88 | 95 | 93 | 88 | 77 | -13% | 90 | 17% |
| Exports | | | 908 | | | | 1,263 | | | | 1,015 | | | | 879 | | | | 1,289 | | | | 1,050 | | | | 1,012 | | | | 1,176 | | | | 864 | | | | 778 | | | | 1,055 | | | | 975 | | | | 975 | | | | — | | | | 0.0 | % | 1,012 | 1,176 | 864 | 778 | 1,051 | 906 | 937 | 969 | 994 | 796 | 759 | -5% | 710 | -6% |
| Total Usage | | | 2,045 | | | | 2,315 | | | | 2,275 | | | | 2,018 | | | | 2,417 | | | | 2,231 | | | | 2,400 | | | | 2,436 | | | | 2,015 | | | | 1,951 | | | | 2,222 | | | | 2,141 | | | | 2,111 | | | | (30.00 | ) | | | -1.4 | % | 2,400 | 2,436 | 2,015 | 1,951 | 2,222 | 1,981 | 2,039 | 2,087 | 2,111 | 1,913 | 1,876 | -2% | 1,824 | -3% |
| | | | | | | | | | | | | | | | | | | | | | | | | | | | | | | | | | | | | | | | | | | | | | | | | | | | | | | | | | | | | | | | | | |
| Ending Stocks (Inventory) | | | 456 | | | | 305 | | | | 657 | | | | 976 | | | | 862 | | | | 743 | | | | 718 | | | | 590 | | | | 752 | | | | 976 | | | | 1,181 | | | | 933 | | | | 960 | | | | 27.00 | | | | 2.9 | % | 718 | 590 | 752 | 976 | 1,181 | 1,099 | 1,080 | 1,028 | 845 | 674 | 570 | -15% | 698 | 22% |
| | | | | | | | | | | | | | | | | | | | | | | | | | | | | | | | | | | | | | | | | | | | | | | | | | | | | | | | | | | | | | | | | | |
| Stocks/Use Ratio | | | 22.3 | % | | | 13.2 | % | | | 28.9 | % | | | 48.4 | % | | | 35.7 | % | | | 33.3 | % | | | 29.7 | % | | | 24.2 | % | | | 37.3 | % | | | 50.0 | % | | | 53.2 | % | | | 43.6 | % | | | 45.5 | % | | | 0.02 | | | | | | 29.7% | 24.2% | 37.3% | 50.0% | 53.2% | 55.5% | 53.0% | 49.3% | 40.0% | 35.2% | 30.4% | -14% | 38.3% | 26% |
| farm Price ($/bushel) | | $ | 4.26 | | | $ | 6.48 | | | $ | 6.78 | | | $ | 4.87 | | | $ | 5.70 | | | $ | 7.24 | | | $ | 7.77 | | | $ | 6.87 | | | $ | 5.99 | | | $ | 4.89 | | | $ | 3.89 | | | $4.30 - 4.90 | | | $4.40 - 4.80 | | | | | | | | | | $ 7.77 | $ 6.87 | $ 5.99 | $ 4.89 | $ 3.89 | $4.72 | $5.16 | $4.58 | $5.05 | $7.63 | $8.83 | | $7.10 | |
| | | | | | | | | | | | | | | | | | | | | | | | | | | | | | | | | | | | | | | | | | | | | | | | | | | | | | | | | | | | | | | | | | |
| Calculations: | | | | | | | | | | | | | | | | | | | | | | | | | | | | | | | | | | | | | | | | | | | | | | | | | | | | | | | | | | | | | | | | | |
| Demand per day (incld expt)¹ | | | 5.6 | | | | 6.3 | | | | 6.2 | | | | 5.5 | | | | 6.6 | | | | 6.1 | | | | 6.6 | | | | 6.7 | | | | 5.5 | | | | 5.3 | | | | 6.1 | | | | 5.9 | | | | 5.8 | | | | (0.08 | ) | | | -1.4 | % | |
Demand per day (incld expt)¹ | | 6.6 | 6.7 | 5.5 | 5.3 | 6.1 | 5.4 | 5.6 | 5.7 | 5.8 | 5.2 | 5.1 | -2% | 5.0 | -3% |
| Carry-out days supply | | | 81.4 | | | | 48.1 | | | | 105.4 | | | | 176.5 | | | | 130.2 | | | | 121.6 | | | | 108.6 | | | | 88.4 | | | | 136.2 | | | | 182.6 | | | | 194.0 | | | | 159.1 | | | | 166.0 | | | | 6.93 | | | | 4.4 | % | 108.6 | 88.4 | 136.2 | 182.6 | 194.0 | 202.5 | 193.3 | 179.8 | 146.1 | 128.6 | 110.9 | -14% | 139.7 | 26% |
¹ in millions of bushels per day | | | | | | |
¹ in millions of bushels per dayThe Bitcoin Industry
Bitcoin
Bitcoin is a digital asset that serves as the unit of account on an open-source, decentralized, peer-to-peer computer network. Bitcoin may be used to pay for goods and services, stored for future use, or converted to a fiat currency. As of the date of this update, the adoption of bitcoin for these purposes has been limited. The value of bitcoin is not backed by any government, corporation, or other identified body.
The value of bitcoin is determined in part by the supply of (which is limited), and demand for, bitcoin in the markets for exchange that have been organized to facilitate the trading of bitcoin. By design, the supply of bitcoin is limited to 21 million bitcoins. As of the date of this update, there are approximately 19 million bitcoins in circulation.
Bitcoin is maintained on the decentralized, open source, peer-to-peer computer network (the “Bitcoin Network”). No single entity owns or operates the Bitcoin Network. The Bitcoin Network is accessed through software and governs bitcoin’s creation and movement. The source code for the Bitcoin Network, often referred to as the Bitcoin Protocol, is open-source, and anyone can contribute to its development.
Price movements for bitcoin are influenced by, among other things, the environment, natural or man-made disasters, governmental oversight and regulation, demographics, economic conditions, infrastructure limitations, existing and future technological developments, and a variety of other factors now known and unknown, any and all of which can have an impact on the supply, demand, and price fluctuations in the bitcoin markets. More generally, cryptocurrency prices may be influenced by economic and monetary events such as changes in interest rates, changes in balances of payments and trade, U.S. and international inflation rates, currency valuations and devaluations, U.S. and international economic events, and changes in the philosophies and emotions of market purchasers. Because the Fund invests in futures contracts in a single cryptocurrency, it is not a diversified investment vehicle, and therefore may be subject to greater volatility than a diversified portfolio of stocks or bonds or a more diversified commodity or cryptocurrency pool.
The Bitcoin Network
The infrastructure of the Bitcoin Network is collectively maintained by participants in the Bitcoin Network, which include miners, developers, and users. Miners validate transactions and are currently compensated for that service in bitcoin. Developers maintain and contribute updates to the Bitcoin Network’s source code, often referred to as the Bitcoin Protocol. Users access the Bitcoin Network using open-source software. Anyone can be a user, developer, or miner.
Bitcoin is “stored” on a digital transaction ledger commonly known as a “blockchain.” A blockchain is a type of shared and continually reconciled database, stored in a decentralized manner on the computers of certain users of the digital asset and is protected by cryptography. The Bitcoin Blockchain contains a record and history for each bitcoin transaction.
New bitcoin is created by “mining.” Miners use specialized computer software and hardware to solve a highly complex mathematical problem presented by the Bitcoin Protocol. The first miner to successfully solve the problem is permitted to add a block of transactions to the Bitcoin Blockchain. The new block is then confirmed through acceptance by a majority of users who maintain versions of the blockchain on their individual computers. Miners that successfully add a block to the Bitcoin Blockchain are automatically rewarded with a fixed amount of bitcoin for their effort plus any transaction fees paid by transferors whose transactions are recorded in the block. This reward system is the means by which new bitcoin enter circulation and is the mechanism by which versions of the blockchain held by users on a decentralized network are kept in consensus.
The Bitcoin Protocol
The Bitcoin Protocol is an open source project with no official company or group in control. Anyone can review the underlying code and suggest changes. There are, however, a number of individual developers that regularly contribute to a specific distribution of bitcoin software known as the “Bitcoin Core.” Developers of the Bitcoin Core loosely oversee the development of the source code. There are many other compatible versions of the bitcoin software, but Bitcoin Core is the most widely adopted and currently provides the de facto standard for the Bitcoin Protocol. The core developers are able to access, and can alter, the Bitcoin Network source code and, as a result, they are responsible for quasi-official releases of updates and other changes to the Bitcoin Network’s source code.
However, because bitcoin has no central authority, the release of updates to the Bitcoin Network’s source code by the core developers does not guarantee that the updates will be automatically adopted by the other purchasers. Users and miners must accept any changes made to the source code by downloading the proposed modification and that modification is effective only with respect to those bitcoin users and miners who choose to download it. As a practical matter, a modification to the source code becomes part of the Bitcoin Network only if it is accepted by participants that collectively have a majority of the processing power on the Bitcoin Network. If a modification is accepted by only a percentage of users and miners, a division will occur such that one network will run the pre-modification source code and the other network will run the modified source code. Such a division is known as a “fork.”
Calculating the Net Asset Value
The NAV of each Fund is calculated by:
| | ●• | Takingtaking the current market value of its total assets, and |
| | • | |
| ● | Subtractingsubtracting any liabilities. |
The Administrator calculates the NAV of eachthe Fund once each trading day. It calculates NAV as of the earlier of the close of the New York Stock Exchange or 4:00 p.m., New York time. (ET). The NAV for a particular trading day will beis released after 4:15 p.m., New York time. (ET).
In determining the value of the Futures Contracts for each Fund, the Administrator uses the closing price on the exchange on which the commodity or cryptocurrency is traded, commonly referred to as the settlement price. The time of settlement for each exchange is determined by that exchange and may change from time to time. The current settlement time for each exchange can be found at the appropriaterespective website which are:for the CBOT, CME, or ICE, as the case may be, as follows:
1) for the CBOT (CORN, SOYB and WEAT) http://www.cmegroup.com/trading_hours/commodities-hours.html;
2) for ICE (CANE) http://www.theice.com/productguide/Search.shtml?tradingHours=.
3) for the CME (DEFI) https://www.cmegroup.com/trading-hours.html
The Administrator determines the value of all other investments for each Fund as of the earlier of the close of the New York Stock Exchange or 4:00 p.m., New York time,(ET), in accordance with the current Services Agreement between the Administrator and the Trust.
The value of over-the-counter Commodity Interests will be determined based on the value of the commodity or Futures Contract underlying such Commodity Interest, except that a fair value may be determined if the Sponsor believes that a Fund is subject to significant credit risk relating to the counterparty to such Commodity Interest. For purposes of financial statements and reports, the Sponsor will recalculate the NAV of a specific Fund where necessary to reflect the “fair value” of a Futures Contract when the Futures Contract of such Fund closes at its price fluctuation limit for the day. Treasury Securities held by the Fund are valued by the Administrator using values received from recognized third-party vendors (such as Reuters) and dealer quotes. The NAV includes any unrealized profit or loss on open Commodity Interests and any other credit or debit accruing to each Fund but unpaid or not received by the Fund.
In addition, in order to provide updated information relating to the Funds for use by investors and market professionals, the NYSE ArcaICE Data Indices, LLC calculates and disseminates throughout the trading day an updated indicative fund value for each Fund. The indicative fund value is calculated by using the prior day’s closing NAV per share of the Fund as a base and updating that value throughout the trading day to reflect changes in the value of the Fund’s Commodity or Cryptocurrency Interests during the trading day. Changes in the value of short-term Treasury Securities and cash equivalents will not be included in the calculation of indicative value.value throughout the day. For this and other reasons, the indicative fund value disseminated during NYSE Arca trading hours should not be viewed as an actual real time update of the NAV for each Fund. The NAV is calculated only once at the end of each trading day.
The indicative fund value is disseminated on a per shareShare basis every 15 seconds during regular NYSE Arca trading hours of 9:30 a.m., New York time,(ET), to 4:00 p.m., New York time.(ET). The CBOT, CME, and the ICE are generally open for trading only during specified hours which vary by exchange and may be adjusted by the exchange. However, the futures markets on these exchanges do not currently operate twenty-four hours per day. In addition, there may be some trading hours which may be limited to electronic trading only. This means that there is a gap in time at the beginning and the end of each day during which the Fund’s Shares are traded on the NYSE Arca, when, for example, real-time CBOT trading prices for Corn Futures Contracts traded on such Exchange are not available. As a result, during those gaps there will be no update to the indicative fund values. The most current trading hours for each exchange may be found on the website of that exchange as listed above.
The NYSE ArcaICE Data Indices, LLC disseminates the intraday indicative fund value (also referred to in this report as "approximate net asset value") of the Fund's Shares through the facilities of CTA/CQConsolidated Tape Association's Consolidated Quotation High Speed Lines. In addition,Lines (also known as the indicative fund value is published on"CTA/QC High Speed Lines"). ICE Data Indices, LLC will make the NYSE Arca’s website and isBenchmark information available through on-lineonline information services, such as Yahoo Finance, Bloomberg and Reuters.
Dissemination of the indicative fund valuesvalue provides additional information that is not otherwise available to the public and is useful to investors and market professionals in connection with the trading of Fund Shares of the Funds on the NYSE Arca. Investors and market professionals are able throughout the trading day to compare the market price of eachthe Fund and itsthe indicative fund value. If the market price of theFund Shares of a Fund diverges significantly from the indicative fund value, market professionals may have an incentive to execute arbitrage trades. For example, if the Fund appears to be trading at a discount compared to the indicative fund value, a market professional could buy Fund Shares on the NYSE Arca, aggregate them into Redemption Baskets, and receive the NAV of such Shares by redeeming them to the Trust, provided that there is not a minimum number of shares outstanding for the Fund. Such arbitrage trades can tighten the tracking between the market price of the Fund and the indicative fund value.
Critical Accounting Policies
The Trust’s critical accounting policies for all the Funds are as follows:
1. | 1. | Preparation of the financial statements and related disclosures in conformity with U.S. generally-acceptedgenerally accepted accounting principles (“GAAP”) requires the application of appropriate accounting rules and guidance, as well as the use of estimates, and requires management to make estimates and assumptions that affect the reported amounts of assets and liabilities, revenue and expense and related disclosure of contingent assets and liabilities during the reporting period of the combined financial statements and accompanying notes. The Trust’s application of these policies involves judgments and actual results may differ from the estimates used. |
| | |
2. | The Sponsor has determined that the valuation of Commodity Interestscommodity or cryptocurrency interests that are not traded on a U.S. or internationally recognized futures exchange (such as swaps and other over-the-counterover the counter contracts) involves a critical accounting policy. The values which are used by the Funds for futures contracts will be provided by the commodity broker who will use market prices when available, while over-the-counterover the counter contracts will be valued based on the present value of estimated future cash flows that would be received from or paid to a third party in settlement of these derivative contracts prior to their delivery date. Values will be determined on a daily basis. |
| | |
3. | Commodity or cryptocurrency futures contracts held by the Funds are recorded on the trade date. All such transactions are recorded on the identified cost basis and marked to market daily. Unrealized appreciation or depreciation on commodity or cryptocurrency futures contracts are reflected in the statement of operations as the difference between the original contract amount and the fair market value as of the last business day of the year or as of the last date of the financial statements. Changes in the appreciation or depreciation between periods are reflected in the statement of operations. Interest on cash equivalents and deposits are recognized on thean accrual basis. The Funds earn interest on funds held at the custodian or other financial institutions at prevailing market rates for such investments. |
4. | 4. | Cash and cash equivalents are cash held at financial institutions in demand-deposit accounts or highly-liquidhighly liquid investments with original maturity dates of three months or less at inception. The Funds reportedreport cash equivalents in the statements of assets and liabilities at market value, or at carrying amounts that approximate fair value, because of their highly-liquidhighly liquid nature and short-term maturities. The Funds have a substantial portion of its assets on deposit with banks. Assets deposited with financial institutions may, at times, exceed federally insured limits. |
5. | 5. | The use of fair value to measure financial instruments, with related unrealized gains or losses recognized in earnings in each period is fundamental to the Trust’s financial statements. In accordance with GAAP, fair value is defined as the price that would be received to sell an asset or paid to transfer a liability (i.e., the “exit price”) in an orderly transaction between market participants at the measurement date. In determining fair value, the Trust uses various valuation approaches. In accordance with GAAP, a fair value hierarchy for inputs is used in measuring fair value that maximizes the use of observable inputs and minimizes the use of unobservable inputs by requiring that the most observable inputs be used when available. Observable inputs are those that market participants would use in pricing the asset or liability based on market data obtained from sources independent of the Trust. Unobservable inputs reflect the Trust’s assumptions about the inputs market participants would use in pricing the asset or liability developed based on the best information available in the circumstances. The fair value hierarchy is categorized into three levels: a) Level 1 - Valuations based on unadjusted quoted prices in active markets for identical assets or liabilities that the Trust has the ability to access. Valuation adjustments and block discounts are not applied to Level 1 securities and financial instruments. Since valuations are based on quoted prices that are readily and regularly available in an active market, valuation of these securities and financial instruments does not entail a significant degree of judgment, b) Level 2 - Valuations based on quoted prices in markets that are not active or for which all significant inputs are observable, either directly or indirectly, and c) Level 3 - Valuations based on inputs that are unobservable and significant to the overall fair value measurement. See the notes within the financial statements for further information. The Funds and the Trust record their derivative activities at fair value. Gains and losses from derivative contracts are included in the statement of operations. Derivative contracts include futures contracts related to commodity or cryptocurrency prices. Futures, which are listed on a national securities exchange, such as the CBOT, ICE, or CME, or reported on another national market, are generally categorized in Level 1 of the fair value hierarchy. OTC derivatives contracts (such as forward and swap contracts) which may be valued using models, depending on whether significant inputs are observable or unobservable, are categorized in Levels 2 or 3 of the fair value hierarchy. |
In determining fair value, the Trust uses various valuation approaches. In accordance with GAAP, a fair value hierarchy for inputs is used in measuring fair value that maximizes the use
Table of observable inputs and minimizes the use of unobservable inputs by requiring that the most observable inputs be used when available. Observable inputs are those that market participants would use in pricing the asset or liability based on market data obtained from sources independent of the Trust. Unobservable inputs reflect the Trust’s assumptions about the inputs market participants would use in pricing the asset or liability developed based on the best information available in the circumstances. The fair value hierarchy is categorized into three levels: a) Level 1 - Valuations based on unadjusted quoted prices in active markets for identical assets or liabilities that the Trust has the ability to access. Valuation adjustments and block discounts are not applied to Level 1 securities and financial instruments. Since valuations are based on quoted prices that are readily and regularly available in an active market, valuation of these securities and financial instruments does not entail a significant degree of judgment, b) Level 2 - Valuations based on quoted prices in markets that are not active or for which all significant inputs are observable, either directly or indirectly, and c) Level 3 - Valuations based on inputs that are unobservable and significant to the overall fair value measurement. See the notes within the financial statements for further information.The Funds and the Trust record their derivative activities at fair value. Gains and losses from derivative contracts are included in the statement of operations. Derivative contracts include futures contracts related to commodity prices. Futures, which are listed on a national securities exchange, such as the CBOT or the New York Mercantile Exchange (“NYMEX”), or reported on another national market, are generally categorized in Level 1 of the fair value hierarchy. OTC derivatives contracts (such as forward and swap contracts) which may be valued using models, depending on whether significant inputs are observable or unobservable, are categorized in Levels 2 or 3 of the fair value hierarchy.
Contents
6. | 6. | BrokerageThe Funds recognize brokerage commissions on all open commodity futures contracts are accrued on a full-turnfull trade basis. |
7. | 7. | Margin is the minimum amount of funds that must be deposited by a commodity or cryptocurrency interest trader with the trader’s broker to initiate and maintain an open position in futures contracts. A margin deposit acts to assure the trader’s performance of the futures contracts purchased or sold. Futures contracts are customarily bought and sold on initial margin that represents a very small percentage of the aggregate purchase or sales price of the contract. Because of such low margin requirements, price fluctuations occurring in the futures markets may create profits and losses that, in relation to the amount invested, are greater than are customary in other forms of investment or speculation. As discussed below, adverse price changes in the futures contract may result in margin requirements that greatly exceed the initial margin. In addition, the amount of margin required in connection with a particular futures contract is set from time to time by the exchange on which the contract is traded and may be modified from time to time by the exchange during the term of the contract. Brokerage firms, such as the Funds’ clearing brokers, carrying accounts for traders in commodity or cryptocurrency interest contracts generally require higher amounts of margin as a matter of policy to further protect themselves. Over-the-counterOver the counter trading generally involves the extension of credit between counterparties, so the counterparties may agree to require the posting of collateral by one or both parties to address credit exposure. When a trader purchases an option, there is no margin requirement; however, the option premium must be paid in full. When a trader sells an option, on the other hand, he or she is required to deposit margin in an amount determined by the margin requirements established for the underlying interest and, in addition, an amount substantially equal to the current premium for the option. The margin requirements imposed on the selling of options, although adjusted to reflect the probability that out of the money options will not be exercised, can in fact be higher than those imposed in dealing in the futures markets directly. Complicated margin requirements apply to spreads and conversions, which are complex trading strategies in which a trader acquires a mixture of options positions and positions in the underlying interest. Ongoing or “maintenance” margin requirements are computed each day by a trader’s clearing broker. When the market value of a particular open futures contract changes to a point where the margin on deposit does not satisfy maintenance margin requirements, a margin call is made by the broker. If the margin call is not met within a reasonable time, the broker may close out the trader’s position. With respect to the Funds’ trading, the Funds (and not its shareholders personally) are subject to margin calls. Finally, many major U.S. exchanges have passed certain cross margining arrangements involving procedures pursuant to which the futures and options positions held in an account would, in the case of some accounts, be aggregated, and margin requirements would be assessed on a portfolio basis, measuring the total risk of the combined positions. |
When a trader purchases an option, there is no margin requirement; however, the option premium must be paid in full. When a trader sells an option, on the other hand, he or she is required to deposit margin in an amount determined by the margin requirements established for the underlying interest and, in addition, an amount substantially equal to the current premium for the option. The margin requirements imposed on the selling of options, although adjusted to reflect the probability that out-of-the-money options will not be exercised, can in fact be higher than those imposed in dealing in the futures markets directly. Complicated margin requirements apply to spreads and conversions, which are complex trading strategies in which a trader acquires a mixture of options positions and positions in the underlying interest.
Ongoing or “maintenance” margin requirements are computed each day by a trader’s clearing broker. When the market value of a particular open futures contract changes to a point where the margin on deposit does not satisfy maintenance margin requirements, a margin call is made by the broker. If the margin call is not met within a reasonable time, the broker may close out the trader’s position. With respect to the Funds’ trading, the Funds (and not its shareholders personally) are subject to margin calls.
Finally, many major U.S. exchanges have passed certain cross margining arrangements involving procedures pursuant to which the futures and options positions held in an account would, in the case of some accounts, be aggregated, and margin requirements would be assessed on a portfolio basis, measuring the total risk of the combined positions.
8. | 8. | Due from/to broker for investments in financial instruments are securities transactions pending settlement. The Trust and TAGS are subject to credit risk to the extent any broker with whom it conducts business is unable to fulfill contractual obligations on its behalf. The management of the Trust and the Funds monitors the financial condition of such brokers and does not anticipate any losses from these counterparties. Since the inception of the Fund, theThe principal broker through which the Trust and TAGS has the ability to clear securities transactions for TAGS is U.S. Bank N.A. |
9. | The Sponsor is responsible for investing the Bankassets of New York Mellon Capital Markets.the Funds in accordance with the objectives and policies of each Fund. CORN, SOYB, CANE, WEAT, and TAGS pays for all brokerage fees, taxes, and other expenses, including licensing fees for the use of intellectual property, registration or other fees paid to the SEC, FINRA, formally the National Association of Securities Dealers, or any other regulatory agency in connection with the offer and sale of subsequent Shares after its initial registration and all legal, accounting, printing and other expenses associated therewith. The Fund also pays its portion of the fees and expenses for services directly attributable to the Fund such as accounting, financial reporting, regulatory compliance, and trading activities, which the Sponsor elected not to outsource. Certain aggregate expenses common to all Teucrium Funds within the Trust are allocated by the Sponsor to the respective Funds based on activity drivers deemed most appropriate by the Sponsor for such expenses, including but not limited to relative assets under management and creation order activity. These aggregate common expenses include, but are not limited to, legal, auditing, accounting and financial reporting, tax-preparation, regulatory compliance, trading activities, and insurance costs, as well as fees paid to the Distributor. A portion of these aggregate common expenses are related to the Sponsor or related parties of principals of the Sponsor; these are necessary services to the Teucrium Funds, which are primarily the cost of performing certain accounting and financial reporting, regulatory compliance, and trading activities that are directly attributable to the Fund and are included, primarily, in distribution and marketing fees. In addition, the Agricultural Funds, except for TAGS which has no such fee, are contractually obligated to pay a monthly management fee to the Sponsor, based on average daily net assets, at a rate equal to 1.00% per annum. DEFI is contractually obligated to pay a monthly management fee to the Sponsor, based on average daily net assets, at a rate equal to 0.94% per annum. From the Management Fee, the Sponsor pays all of the routine operational, administrative and other ordinary expenses of each Fund, generally as determined by the Sponsor, including but not limited to, fees and expenses of the Administrator, Custodian, Distributor, Transfer Agent, licensors, accounting and audit fees and expenses, tax preparation expenses, legal fees, ongoing SEC registration fees, individual Schedule K-1 preparation and mailing fees, and report preparation and mailing expenses. These fees and expenses are not included in the breakeven table because they are paid for by the Sponsor through the proceeds from the Management Fee. The Fund pays all of its non-recurring and unusual fees and expenses, if any, as determined by the Sponsor. Non-recurring and unusual fees and expenses are unexpected or unusual in nature, such as legal claims and liabilities and litigation costs or indemnification or other unanticipated expenses. Extraordinary fees and expenses also include material expenses which are not currently anticipated obligations of the Fund. Routine operational, administrative and other ordinary expenses are not deemed extraordinary expenses. |
10. | 9. | The investment objective of TAGS is to have the daily changes in percentage terms of the Net Asset Value (“NAV”) of its common units (“Shares”) reflect the daily changes in percentage terms of a weighted average (the “Underlying Fund Average”) of the NAVs per share of four other commodity pools that are series of the Trust and are sponsored by the Sponsor: the Teucrium Corn Fund, the Teucrium Wheat Fund, the Teucrium Soybean Fund and the Teucrium Sugar Fund (collectively, the “Underlying Funds”). The Underlying Fund Average will have a weighting of 25% to each Underlying Fund, and the Fund’s assets will be rebalanced, generally on a daily basis, to maintain the approximate 25% allocation to each Underlying Fund. As such, TAGS will buy, sell, and hold as part of its normal operations shares of the four Underlying Funds. The Trust excludes the shares of the other series of the Trust owned by the Teucrium Agricultural Fund from its statements of assets and liabilities. The Trust excludes the net change in unrealized appreciation or depreciation on securities owned by the Teucrium Agricultural Fund from its statements of operations. Upon the sale of the Underlying Funds by the Teucrium Agricultural Fund, the Trust includes any realized gain or loss in its statements of changes in net assets.operations. |
11. | 10. | For U.S. federal income tax purposes, the Funds will be treated as partnerships. Therefore, the Funds do not record a provision for income taxes because the partners report their share of a Fund’s income or loss on their income tax returns. The financial statements reflect the Funds’ transactions without adjustment, if any, required for income tax purposes. |
12. | For commercial paper, the Agricultural Commodity Funds use the effective interest method for calculating the actual interest rate in a period based on the amount of a financial instrument’s book value at the beginning of the accounting period. Accretion on these investments is recognized using the effective interest method in U.S. dollars and recognized in cash equivalents. All discounts on purchase prices of debt securities are accreted over the life of the respective security. |
Credit Risk
When any of the Funds enter into Commodity or Cryptocurrency Interests, it will be exposed to the credit risk that the counterparty will not be able to meet its obligations. For purposes of credit risk, the counterparty for the Futures Contracts traded on the CBOT, NYMEX,ICE, and ICECME is the clearinghouse associated with those exchanges. In general, clearinghouses are backed by their members who may be required to share in the financial burden resulting from the nonperformance of one of their members, which should significantly reduce credit risk. Some foreign exchanges are not backed by their clearinghouse members but may be backed by a consortium of banks or other financial institutions. Unlike in the case of exchange-tradedexchange traded futures contracts, the counterparty to an over-the-counter Commodity Interest contract is generally a single bank or other financial institution. As a result, there will be greater counterparty credit risk in over-the-counter transactions. There can be no assurance that any counterparty, clearinghouse, or their financial backers will satisfy their obligations to any of the Funds.
The Commodity Funds may engage in off exchange transactions broadly called an “exchange for risk” transaction, also referred to as an “exchange for swap.” For purposes of the Dodd-Frank Act and related CFTC rules, an “exchange for risk” transaction is treated as a “swap.” An “exchange for risk” transaction, sometimes referred to as an “exchange for swap” or “exchange of futures for risk,” is a privately negotiated and simultaneous exchange of a futures contract position for a swap or other over-the-counterover the counter instrument on the corresponding commodity. An exchange for risk transaction can be used by the Commodity Funds as a technique to avoid taking physical delivery of a commodity futures contract, corn for example, in that a counterparty will take the Fund’s position in a Corn Futures Contract into its own account in exchange for a swap that does not by its terms call for physical delivery. The Funds will become subject to the credit risk of a counterparty when it acquires an over-the-counter position in an exchange for risk transaction. The Fund may use an “exchange for risk” transaction in connection with the creation and redemption of shares. These transactions willmust be carried out only in accordance with the rules of the applicable exchange where the futures contracts trade.
The Sponsor will attempt to manage the credit risk of each Fund by following certain trading limitations and policies. In particular, each Fund intends to post margin and collateral and/or hold liquid assets that will be equal to approximately the face amount of the Interests it holds. The Sponsor will implement procedures that will include, but will not be limited to, executing, and clearing trades and entering into over-the-counter transactions only with parties it deems creditworthy and/or requiring the posting of collateral by such parties for the benefit of each Fund to limit its credit exposure.
The CEA requires all FCMs, such as the Teucrium Funds’ clearing brokers, to meet and maintain specified fitness and financial requirements, to segregate customer funds from proprietary funds and account separately for all customers’ funds and positions, and to maintain specified books and records open to inspection by the staff of the CFTC. The CFTC has similar authority over introducing brokers, or persons who solicit or accept orders for commodity interest trades but who do not accept margin deposits for the execution of trades. The CEA authorizes the CFTC to regulate trading by FCMs and by their officers and directors, permits the CFTC to require action by exchanges in the event of market emergencies, and establishes an administrative procedure under which customers may institute complaints for damages arising from alleged violations of the CEA. The CEA also gives the states powers to enforce its provisions and the regulations of the CFTC.
On November 14, 2013, the CFTC published final regulations that require enhanced customer protections, risk management programs, internal monitoring and controls, capital and liquidity standards, customer disclosures and auditing and examination programs for FCMs. The rules are intended to afford greater assurances to market participants that customer segregated funds and secured amounts are protected, customers are provided with appropriate notice of the risks of futures trading and of the FCMs with which they may choose to do business, FCMs are monitoring and managing risks in a robust manner, the capital and liquidity of FCMs are strengthened to safeguard the continued operations and the auditing and examination programs of the CFTC and the self-regulatory organizationsSROs are monitoring the activities of FCMs in a thorough manner.
Marex , StoneX and Phillip Capital serve as the Fund’s clearing brokers to execute futures contracts and provide other brokerage-related services.
The Commodity Funds, other than TAGS, will generally retain cash positions of approximately 95% of total net assets;assets and DEFI will retain approximately 70%; this balance represents the total net assets less the initial margin requirements held by the FCM. These cash assets are either: 1) deposited by the Sponsor in demand deposit accounts of financial institutions which are rated in the highest short-term rating category by a nationally recognized statistical rating organization or deemed by the Sponsor to be of comparable quality;investment level quality, 2) held in cash equivalents with maturities of ninety days or less; or 3) held in a money-market fund which is deemed to be a cash equivalent under the most recent SEC definition.definition, or 3) held in a cash equivalent with a maturity of 90 days or less that is deemed by the Sponsor to be of investment level quality.
Liquidity and Capital Resources
The Funds do not anticipate making use of borrowings or other lines of credit to meet their obligations. The Funds meet their liquidity needs in the normal course of business from the proceeds of the sale of their investments from the cash and cash equivalents and/or the Treasuries Securities that they intend to hold, and/or from the fee waivers provided by the Sponsor. The Funds’ liquidity needs include:include redeeming their shares, providing margin deposits for existing Futures Contracts or the purchase of additional Futures Contracts, posting collateral for over-the-counter Commodity Interests, and paying expenses.
The Funds generate cash primarily from (i) the sale of Creation Baskets and (ii) interest earned on cash and cash equivalents. Generally, all of the net assets of the Funds are allocated to trading in Commodity or Cryptocurrency Interests. Most of the assets of the Funds are held in cash and/or cash equivalents that could or are used as margin or collateral for trading in Commodity Interests.equivalents. The percentage that such assets bear to the total net assets will vary from period to period as the market values of the Commodity or Cryptocurrency Interests change. Interest earned on interest-bearing assets of a Fund are paid to that Fund. During times of extreme market volatility and economic uncertainty, the Funds may experience a significant change in interest rates, and as such the Funds may experience a change in the breakeven point.
The investments of a Fund in Commodity or Cryptocurrency Interests are subject to periods of illiquidity because of market conditions, regulatory considerations, and other reasons. For example, U.S. futures exchanges limit the fluctuations in the prices of certain Futures Contracts during a single day by regulations referred to as “daily limits.” During a single day, no trades may be executed at prices beyond the daily limit. Once the price of such a Futures Contract has increased or decreased by an amount equal to the daily limit, positions in the contracts can neither be taken nor liquidated unless the traders are willing to effect trades at or within the limit. Such market conditions could prevent the Fund from promptly liquidating a position in Futures Contracts.
132War and other geopolitical events in eastern Europe, including but not limited to Russia and Ukraine, may cause volatility in commodity prices including energy and grain prices, due to the region’s importance to these markets, potential impacts to global transportation and shipping, and other supply chain disruptions. These events are unpredictable and may lead to extended periods of price volatility.
More generally, a climate of uncertainty and panic, including the contagion of the COVID-19 virus and other infectious viruses or diseases, may adversely affect global, regional, and local economies and reduce the availability of potential investment opportunities, and increases the difficulty of performing due diligence and modeling market conditions, potentially reducing the accuracy of financial projections. Under these circumstances, the Funds may have difficulty achieving their investment objectives which may adversely impact performance. Further, such events can be highly disruptive to economies and markets, significantly disrupt the operations of individual companies (including, but not limited to, the Funds’ Sponsor and third-party service providers), sectors, industries, markets, securities and commodity exchanges, currencies, interest and inflation rates, credit ratings, investor sentiment, and other factors affecting the value of the Funds’ investments. These factors could cause substantial market volatility, exchange trading suspensions and closures that could impact the ability of the Funds to complete redemptions and otherwise affect Fund performance and Fund trading in the secondary market. A widespread crisis may also affect the global economy in ways that cannot necessarily be foreseen at the current time. How long such events will last and whether they will continue or recur cannot be predicted. Impacts from these events could have significant impact on a Fund’s performance, resulting in losses to your investment. The global economic shocks being experienced as of the date hereof may cause the underlying assumptions and expectations of the Funds to become outdated quickly or inaccurate, resulting in significant losses.
Market Risk
Trading in Commodity or Cryptocurrency Interests such as Futures Contracts will involve the Funds entering into contractual commitments to purchase or sell specific amounts of commodities or cryptocurrencies at a specified date in the future. The gross or face amount of the contracts is expected to significantly exceed the future cash requirements of each Fund as each Fund intends to close out any open positions prior to the contractual expiration date. As a result, each Fund’s market risk is the risk of loss arising from the decline in value of the contracts, not from the need to make delivery under the contracts. The Funds consider the “fair value” of derivative instruments to be the unrealized gain or loss on the contracts. The market risk associated with the commitment by the Funds to purchase a specific commodity or cryptocurrency will be limited to the aggregate face amount of the contacts held.
The exposure of the Funds to market risk will depend on a number of factors including the markets for the specific commodity or cryptocurrency, the volatility of interest rates and foreign exchange rates, the liquidity of the commodity-specific InterestCommodity or Cryptocurrency Specific Interests markets and the relationships among the contracts held by each Fund.
Regulatory Considerations
The regulation of futures markets, futures contracts, and futures exchanges has historically been comprehensive. The CFTC and the exchanges are authorized to take extraordinary actions in the event of a market emergency including, for example, the retroactive implementation of speculative position limits, increased margin requirements, the establishment of daily price limits and the suspension of trading on an exchange or trading facility.
In addition, considerable regulatory attention has recently been focused on non-traditional publicly distributed investment pools such as the Funds. Furthermore, various national governments have expressed concern regarding the disruptive effects of speculative trading in certain commodity markets and the need to regulate the derivatives markets in general. The effect of any future regulatory change on the Funds is impossible to predict, but could be substantial and adverse.
Pursuant to authority in the CEA, the NFA has been formed and registered with the CFTC as a registered futures association. At the present time, the NFA is the only self-regulatory organizationSRO for commodity interest professionals, other than futures exchanges. The CFTC has delegated to the NFA responsibility for the registration of CPOs and FCMs and their respective associated persons. The Sponsor and the Fund’s clearing broker are members of the NFA. As such, they will be subject to NFA standards relating to fair trade practices, financial condition, and consumer protection. The NFA also arbitrates disputes between members and their customers and conducts registration and fitness screening of applicants for membership and audits of its existing members. Neither the Trust nor the Teucrium Funds are required to become a member of the NFA. The regulation of commodity interest transactions in the United States is a rapidly changing area of law and is subject to ongoing modification by governmental and judicial action. As noted above, considerableConsiderable regulatory attention has been focused on non-traditional investment pools that are publicly distributed in the United States. There is a possibility of future regulatory changes within the United States altering, perhaps to a material extent, the nature of an investment in the Funds,Fund, or the ability of a Fund to continue to implement its investment strategy. In addition, various national governments outside of the United States have expressed concern regarding the disruptive effects of speculative trading in the commodities markets and the need to regulate the derivatives markets in general. The effect of any future regulatory change on the Teucrium Funds is impossible to predict but could be substantial and adverse.
The CFTC possesses exclusive jurisdiction to regulate the activities of commodity pool operators and commodity trading advisors with respect to “commodity interests,” such as futures, and swaps, and options, and has adopted regulations with respect to the activities of those persons and/or entities. Under the Commodity Exchange Act (“CEA”), a registered commodity pool operator, such as the Sponsor, is required to make annual filings with the CFTC and the NFA describing its organization, capital structure, management and controlling persons. In addition, the CEA authorizes the CFTC to require and review books and records of, and documents prepared by, registered commodity pool operators. Pursuant to this authority, the CFTC requires commodity pool operators to keep accurate, current, and orderly records for each pool that they operate. The CFTC may suspend the registration of a commodity pool operator (1) if the CFTC finds that the operator’s trading practices tend to disrupt orderly market conditions, (2) if any controlling person of the operator is subject to an order of the CFTC denying such person trading privileges on any exchange, and (3) in certain other circumstances. Suspension, restriction, or termination of the Sponsor’s registration as a commodity pool operator would prevent it, until that registration werewas to be reinstated, from managing the Funds,Fund, and might result in the termination of athe Fund if a successor sponsor is not elected pursuant to the Trust Agreement. Neither the Trust nor the Funds areFund is required to be registered with the CFTC in any capacity.
The Funds’Fund’s investors are afforded prescribed rights for reparations under the CEA. Investors may also be able to maintain a private right of action for violations of the CEA. The CFTC has adopted rules implementing the reparation provisions of the CEA, which provide that any person may file a complaint for a reparations award with the CFTC for violation of the CEA against a floor broker or an FCM, introducing broker, commodity trading advisor, CPO, and their respective associated persons.
The regulations of the CFTC and the NFA prohibit any representation by a person registered with the CFTC or by any member of the NFA, that registration with the CFTC, or membership in the NFA, in any respect indicates that the CFTC or the NFA has approved or endorsed that person or that person’s trading program or objectives. The registrations and memberships of the parties described in this summary must not be considered as constituting any such approval or endorsement. Likewise, no futures exchange has given or will give any similar approval or endorsement.
Trading venues in the United States are subject to varying degrees of regulation under the CEA depending on whether such exchange is a designated contract market (i.e., a futures exchange) or a swap execution facility. Clearing organizations are also subject to the CEA and the rules and regulations adopted thereunder as administered by the CFTC. The CFTC’s function is to implement the CEA’s objectives of preventing price manipulation and excessive speculation and promoting orderly and efficient commodity interest markets. In addition, the various exchanges and clearing organizations themselves as self-regulatory organizationsSROs exercise regulatory and supervisory authority over their member firms.
The Dodd-Frank Wall Street Reform and Consumer Protection Act (the “Dodd-Frank Act”) was enacted in response to the economic crisis of 2008 and 2009 and it significantly altered the regulatory regime to which the securities and commodities markets are subject. To date, the CFTC has issued proposed or final versions of almost all of the rules it is required to promulgate under the Dodd-Frank Act, and it continues to issue proposed versions of additional rules that it has authority to promulgate. Provisions of the new law include the requirement that position limits be established on a wide range of commodity interests, including agricultural, energy, and metal-based commodity futures contracts, options on such futures contracts and uncleared swaps that are economically equivalent to such futures contracts and options (“Reference Contracts”); new registration and recordkeeping requirements for swap market participants; capital and margin requirements for “swap dealers” and “major swap participants,” as determined by the new law and applicable regulations; reporting of all swap transactions to swap data repositories; and the mandatory use of clearinghouse mechanisms for sufficiently standardized swap transactions that were historically entered into in the over-the-counterover the counter market, but are now designated as subject to the clearing requirement; and margin requirements for over-the-counterover the counter swaps that are not subject to the clearing requirements.
In addition, considerable regulatory attention has recently been focused on non-traditional publicly distributed investment pools such as the Fund. Furthermore, various national governments have expressed concern regarding the disruptive effects of speculative trading in certain commodity markets and the need to regulate the derivatives markets in general. The effect of any future regulatory change on the Teucrium Funds is impossible to predict but could be substantial and adverse.
The Dodd-Frank Act was intended to reduce systemic risks that may have contributed to the 2008/2009 financial crisis. Since the first draft of what became the Dodd-Frank Act, supporters and opponents have criticizeddebated the broad scope of the legislation and, in particular,legislation. As the regulations implemented by federal agencies as a result. Since 2010, and most notably in 2015 and 2016, Republicans have proposed comprehensive legislation both in the House and the Senate of the US Congress. These bills are intended to pare back some of the provisions of the Dodd-Frank Act of 2010 that critics view as overly broad, unnecessary to the stabilityAdministrations of the U.S. financial system,change, the interpretation and inhibiting the growth of the U.S. economy. Further, during the campaign and after taking office, President Donald J. Trump has promised and issued several executive orders intended to relieve the financial burden created by the Dodd-Frank Act, although these executive orders only set forth several general principles to be followed by the federal agencies and do not mandate the wholesale repeal of the Dodd-Frank Act. The scope of the effect that passage of new financial reform legislation could have on U.S. securities, derivatives and commodities markets is not clear at this time because each federal regulatory agency would have to promulgate new regulations to implement such legislation.implementation will change along with them. Nevertheless, regulatory reform of any kind may have a significant impact on U.S.-regulatedU.S. regulated entities.
Management believes that as of September 30, 2017, it had fulfilled in a timely manner all Dodd-Frank or other regulatory requirements to which it is subject.
The Securities and Exchange Commission made a final ruling on March 29, 2017 to adopt proposed amendments to the Settlement Cycle Rule (Rule 15c6-1(a)) under the Securities Exchange Act of 1934 to shorten the standard settlement cycle for most broker-dealer transactions from three business days after the trade date (T+3) to two business days after the trade date (T+2). The effective date of the adopted amendments was May 30, 2017 with a resulting implementation date of September 5, 2017. The amended rule prohibited broker-dealers from effecting or entering into a contract for the purchase or sale of a security (other than certain exempted securities) that provides for payment of funds and delivery of securities later than the second business day after the date of the contract, unless otherwise expressly agreed to by the parties at the time of the transaction. The products subject to the shortened settlement cycle include equities, corporate bonds, municipal bonds, unit investment trusts, and financial instruments comprised of these security types. Shortening the settlement cycle is expected to yield benefits for the industry and market participants including the further reduction of credit, market, and liquidity risk, and as a result a reduction in systemic risk, for U.S. market participants.
Management successfully completed all steps necessary to implement the rule on September 5, 2017.
Position Limits, Aggregation Limits, Accountability Levels, Price Fluctuation Limits
OnThe CFTC and US futures exchanges impose limits on the maximum net long or net short speculative positions that any person may hold or control in any particular futures or options contracts traded on US futures exchanges. For example, the CFTC currently imposes speculative position limits on a number of commodities (e.g., corn, oats, wheat, soybeans, and cotton) and US futures exchanges currently impose speculative position limits on many other commodities. A Fund could be required to liquidate positions it holds in order to comply with position limits or may not be able to fully implement trading instructions generated by its trading models, in order to comply with position limits. Any such liquidation or limited implementation could result in substantial costs to a Fund. Limits are generally applied on an aggregate basis to positions held in accounts that are subject to 10% or greater common ownership or control. In December 16, 2016, the CFTC issued a finaladopted rule amendments that provide exemptions from the general requirement to amend part 150 ofaggregate all positions that are held pursuant to 10% or greater common ownership or control.
The Dodd-Frank Act significantly expanded the CFTC’s regulationsauthority to impose position limits with respect to futures contracts and options on futures contracts, swaps that are economically equivalent to futures or options on futures, and swaps that are traded on a regulated exchange and certain swaps that perform a significant price discovery function.
In October 2020, the policy for aggregation under the CFTC’sCFTC adopted new speculative position limits regime forwith respect to futures and option contractsoptions on ninefutures on many physical commodities, including energy, metals and agricultural commodities (“the Aggregation Requirements”(the “core referenced futures contracts“). This final rule addressed the circumstances under which market participants would be required to aggregate all their positions, for purposes of the, and on economically equivalent swaps. The CFTC’s new position limits rules include an exemption from limits for bona fide hedging transactions or positions. A bona fide hedging transaction or position may exceed the applicable federal position limits if the transaction or position: (1) represents a substitute for transactions or positions made or to be made at a later time in a physical marketing channel; (2) is economically appropriate to the reduction of all positionsprice risks in Reference Contractsthe conduct and management of a commercial enterprise; and (3) arises from the 9 agricultural commodities held bypotential change in value of (A) assets which a single entity and its affiliates, regardlessperson owns, produces, manufactures, processes or merchandises, or anticipates owning, producing, manufacturing, processing or merchandising; (B) liabilities which a person owes or anticipates incurring; or (C) services that a person provides or purchases, or anticipates providing or purchasing. The CFTC’s new position rules set forth a list of whether such positions exist on US futures exchanges, non-US futures exchanges, or in over-the-counter swaps. An affiliate ofenumerated bona fide hedges for which a market participant is definednot required to request prior approval from the CFTC in order to hold a bona fide hedge position above the federal position limit. However, a market participant holding an enumerated bona fide hedge position still would need to request an exemption from the relevant exchange for exchange-set limits. For non-enumerated bona fide hedge positions, a market participant may request CFTC approval which must be granted prior to exceeding the applicable federal position limit, except where there is a demonstrated sudden or unforeseen increase in bona fide hedging needs (in which case the application must be submitted within five business days after the market participant exceeds the applicable limit). The compliance dates for the CFTC’s new federal speculative position limits are January 1, 2022 for the core referenced futures contracts and January 1, 2023 for economically equivalent swaps.
Position Aggregation. In general, a market participant is required by CFTC or exchange rules, as twoapplicable, to aggregate all positions in accounts as to which the market participant has 10% or greater ownership or control. CFTC and exchange rules, as applicable, provide exemptions from this requirement. For example, a market participant is not required to aggregate positions in multiple accounts that it owns or controls if that market participant is able to satisfy the requirements of an exemption from aggregation of those accounts, including, where available, the independent account controller exemption. Failure to comply with the independent account controller exemption or another exemption from the aggregation requirement could obligate the Sponsor to aggregate positions in multiple accounts under its control, which could include the Fund and other commodity pools or accounts under the Sponsor’s control. In such a scenario, a Fund may not be able to obtain exposure to one or more persons actingcontracts necessary to pursue its investment objective, or it may be required to liquidate existing contract positions in order to comply with a limit. Such an outcome could adversely affect a Fund’s ability to pursue its investment objective or achieve favorable performance. The CFTC amended its position aggregation rules in December 2016. The CFTC staff subsequently issued time-limited no-action relief from compliance with certain requirements under the amended aggregation rules, including the general requirement to aggregate positions in the same commodity futures contracts traded pursuant to an expresssubstantially identical trading strategies. This no-action relief expires on August 12, 2025.
Accountability Levels. Exchanges may establish accountability levels applicable to a futures contract instead of position limits, provided that the futures contract is not subject to federal position limits. An exchange may order a person who holds or implied agreement or understanding. The Aggregation Requirements became effective on February 14, 2017. On August 10, 2017, the CFTC issuedcontrols a No-Action Relief Letter No. 17-37 to clarify several provisions under Regulation 150.4, regarding position aggregation filing requirements of market participants. The Sponsor does not anticipate that this order will have an impact on the abilityin excess of a Fundposition accountability level not to meetfurther increase its respective investment objectives.
In addition, on December 30, 2016,position, to comply with any prospective limit that exceeds the CFTC reproposed regulationssize of the position owned or controlled, or to reduce any open position that wouldexceeds the position accountability level if the exchange determines that such action is necessary to maintain an orderly market. Position accountability levels could adversely affect a Fund’s ability to establish revised specific limits on speculativeand maintain positions in commodity futures contracts option contracts and swaps on 25 agricultural, energy and metals commodities (the “Proposed Position Limit Rules”).
The Proposed Position Limit Rules were a reproposal and the CFTC has requested comments from the public. It remains to be seen whether the Proposed Position Limit Rules will become effective as the CFTC has proposed, as comments could result in modifications to the proposed limits or implementation could be delayed for other reasons. In general, the Proposed Position Limit Rules do not appear to have a substantial or adverse effect on the Funds. However,which such levels apply if the total net assets of a Fund were to increase significantly from current levels,trade in such contracts. Such an outcome could adversely affect a Fund’s ability to pursue its investment objective.
Daily Limits. U.S. futures exchanges and some foreign exchanges have regulations that limit the Position Limit Rulesamount of fluctuation in futures contract prices that may occur during a single business day. These limits are generally referred to as proposed could negatively impact“daily price fluctuation limits” or “daily limits,” and the abilitymaximum or minimum price of a Fundcontract on any given day as a result of these limits is referred to meet its respective investment objectives through limits that may inhibit the Sponsor’s ability to sell additional Creation Baskets of the Fund. However, it is not expected that any Fund will reach asset levels that would cause these position limits to be reached in the near future.
In addition, the Proposed Position Limit Rules state that the CFTC will review, and may amend, the Position Limit Rules atas a minimum every two years and more often as deemed necessary. Such future amendments may affect a Fund or Funds, and it may, at that time, be substantial and adverse. By way of example, future amendments, in combination with the Position Limit Rules, may negatively impact the ability of the Fund to meet its respective investment objectives through limits that may inhibit the Sponsor’s ability to sell additional Creation Baskets of the Fund, if the total net assets of a Fund grow significantly from current levels.
The futures exchanges, e.g. the CME, may under the Proposed Position Limit Rules impose position limits which are lower than those imposed by the CFTC. Such“limit price.” Once a limit by an exchange on which a Fund trades futures contracts may negatively and adversely impact the ability of the Fund to meet its respective investment objectives through limits that may inhibit the Sponsor’s ability to sell additional Creation Baskets of the Fund. No such lower limits by an exchange are currently in place.
The aggregate position limits currently in place under the current position limits and the Aggregation Requirements are as follows for each of the commodities traded by the Funds:
Commodity Future | Spot Month Position Limit | All Month Aggregate Position Limit |
corn | 600 contracts | 33,000 contracts |
soybeans | 600 contracts | 15,000 contracts |
sugar | 5,000 contracts | Only Accountability Limits |
wheat | 600 contracts | 12,000 contracts |
The aggregate speculative position limits currently as proposed in the Proposed Position Limit Rules are as follows for each of the commodities traded by the Funds:
Commodity Future | Spot Month Position Limit | All Month Aggregate Position Limit |
corn | 600 contracts | 62,400 contracts |
soybeans | 600 contracts | 31,900 contracts |
sugar | 23,300 contracts | 38,400 contracts |
wheat | 600 contracts | 32,800 contracts |
Accountability levels differ from position limits in that they do not represent a fixed ceiling, but rather a threshold above which a futures exchange may exercise greater scrutiny and control over an investor’s positions. If a Fund were to exceed an applicable accountability level for investments in futures contracts, the exchange will monitor the Fund’s exposure and may ask for further information on its activities, including the total size of all positions, investment and trading strategy, and the extent of liquidity resources of the Fund. If deemed necessary by the exchange, the Fund could be ordered to reduce its aggregate net position back to the accountability level.
In addition to position limits and accountability levels, the exchanges set daily price fluctuation limits on futures contracts. The daily price fluctuation limit establishes the maximum amount that the price of futures contracts may vary either up or down from the previous day’s settlement price. Once the daily price fluctuation limit has been reached in a particular futures contract, it is usually the case that no trades may be made at a different price beyond thatthan specified in the limit. The duration of limit prices generally varies. Limit prices may have the effect of precluding a Fund from trading in a particular contract or requiring the Fund to liquidate contracts at disadvantageous times or prices. Either of those outcomes could adversely affect a Fund’s ability to pursue its investment objective.
AsPotential Effects of May 1, 2014, the CME replaced the fixed price fluctuationPositions Limits, Aggregation Limits, Accountability Levels, and Price Fluctuation Limits. The Funds are currently subject to position limits with variable priceand may be subject to new and more restrictive position limits for corn, soybeans and wheat. The change, which is now effective and is described in the CME Group Special Executive Report S-7038 and canfuture. If a Fund reached a position limit or accountability level or became subject to a daily limit, its ability to issue new creation units or reinvest income in additional commodity futures contracts may be accessed athttp://www.cmegroup.com/tools-information/lookups/advisories/ser/SER-7038.html.limited to the extent these restrictions limit its ability to establish new futures positions, add to existing positions, or otherwise transact in futures. Limiting the size of a Fund, or restricting a Fund’s futures trading, under these requirements could adversely affect a Fund’s ability to pursue its investment objective.
Off Balance Sheet Financing
As of September 30, 2017,March 31, 2024, neither the Trust nor any of the Funds has any loan guarantees, credit support or other off-balance sheet arrangements of any kind other than agreements entered into in the normal course of business, which may include indemnification provisions relating to certain risks service providers undertake in performing services which are in the best interests of the Funds. While the exposure of each Fund under these indemnification provisions cannot be estimated, they are not expected to have a material impact on the financial positions of each Fund.
Redemption Basket Obligation
Other than as necessary to meet the investment objective of the Funds and pay the contractual obligations described below, the Funds will require liquidity to redeem Redemption Baskets. Each Fund intends to satisfy this obligation through the transfer of cash of the Fund (generated, if necessary, through the sale of short-term Treasury Securities)Securities or other cash equivalents) in an amount proportionate to the number of units being redeemed.
Contractual Obligations
The primary contractual obligations of each Fund will be with the Sponsor and certain other service providers. Except for TAGS, which has no management fee, the Sponsor, in return for its services, will be entitled to a management fee calculated as a fixed percentage of each Agricultural Fund’s NAV, currently 1.00% of its average net assets. Each FundDEFI is contractually obligated to pay a monthly management fee to the Sponsor, based on average daily net assets, at a rate equal to 0.94% per annum.
CORN, CANE, SOYB, WEAT and TAGS will also be responsible for all ongoing fees, costs and expenses of its operation, including (i) brokerage and other fees and commissions incurred in connection with the trading activities of the Fund; (ii) expenses incurred in connection with registering additional Shares of the Fund or offering Shares of the Fund; (iii) the routine expenses associated with the preparation and, if required, the printing and mailing of monthly, quarterly, annual and other reports required by applicable U.S. federal and state regulatory authorities, Trust meetings and preparing, printing and mailing proxy statements to Shareholders; (iv) the payment of any distributions related to redemption of Shares; (v) payment for routine services of the Trustee, legal counsel and independent accountants; (vi) payment for routine accounting, bookkeeping, compliance, distribution and solicitation-related services, custodial and transfer agency services, whether performed by an outside service provider or by affiliates of the Sponsor; (vii) postage and insurance; (viii) costs and expenses associated with client relations and services; (ix) costs of preparation of all federal, state, local and foreign tax returns and any taxes payable on the income, assets or operations of the Fund; and (xi) extraordinary expenses (including, but not limited to, legal claims and liabilities and litigation costs and any indemnification related thereto).
The Management Fee for DEFI is paid in consideration of the Sponsor’s services related to the management of the Fund’s business and affairs, including the provision of commodity futures trading advisory services. DEFI pays all of its respective brokerage commissions, including applicable exchange fees, NFA fees and give-up fees, and other transaction related fees and expenses charged in connection with trading activities for the Fund’s investments in CFTC regulated investments. DEFI bears other transaction costs related to the FCM capital requirements on a monthly basis. The Sponsor pays all of the routine operational, administrative and other ordinary expenses of the Fund, generally as determined by the Sponsor, including but not limited to, fees and expenses of the Administrator, Custodian, Distributor, Transfer Agent, licensors, accounting and audit fees and expenses, tax preparation expenses, legal fees, ongoing SEC registration fees, individual Schedule K-1 preparation and mailing fees, and report preparation and mailing expenses. DEFI pays all of its non-recurring and unusual fees and expenses, if any, as determined by the Sponsor. Non-recurring and unusual fees and expenses are unexpected or unusual in nature, such as legal claims and liabilities and litigation costs or indemnification or other unanticipated expenses. Extraordinary fees and expenses also include material expenses which are not currently anticipated obligations of the Fund. Routine operational, administrative and other ordinary expenses are not deemed extraordinary expenses.
Toroso Investments, LLC (“Toroso”), Tidal ETF Services LLC (“Tidal”) and Victory Capital Management Inc. (“Victory Capital”), Hashdex Asset Management Ltd. (“Hashdex”) and the Sponsor (the “Parties”) have entered into an agreement (the “Support Agreement”) that sets forth certain terms and conditions applicable to the launch, marketing, promotion, development, and ongoing operation of DEFI, as well the respective rights in profits and obligations for expenses.
The primary responsibilities and rights of each Party with respect to the Fund are described below:
● | The Support Agreement provides that Hashdex will provide to the other Parties research and analysis regarding bitcoin and bitcoin markets for use in the operation and marketing of the Fund. Subject to mutual agreement of the Parties, Victory Capital will provide sub-advisory and sales support services for the Fund. |
| |
● | The Sponsor, Toroso, Hashdex and Victory Capital were responsible for paying for all listing, legal, and regulatory costs and expenses incurred in connection with the regulatory process related to the launch of the Fund, including drafting the Fund’s registration statement, exchange listing fees, and other regulatory or service provider fees, as determined in the Support Agreement (“Start-Up Costs”). The Fund will not be responsible for the Start-Up Costs. Each Party is responsible for its own internal expenses. |
| |
● | The Sponsor will receive a sponsor fee, administrative fee and trading fee, which are paid out of the proceeds from the Management Fee of the Fund (if sufficient) and/or from Toroso and Hashdex/Victory Capital (if insufficient). After an additional deduction of operational costs from the Management Fee, the resulting profits or losses will be shared equally among Toroso, on the one hand, and Hashdex and Victory Capital, on the other. |
While the Sponsor paid the initial registration fees to the SEC, FINRA and any other regulatory agency in connection with the offer and sale of the Shares offered through each Fund’sAgricultural Fund prospectus, the legal, printing, accounting and other expenses associated with such registrations, and the initial fee of approximately $5,000 for listing the Shares on the NYSE Arca, each Fund will be responsible for any registration fees and related expenses incurred in connection with any future offer and sale of Shares of the Fund in excess of those offered through its prospectus.Fund.
Any general expenses of the Trust will be allocated among the Funds and any other series of the Trust as determined by the Sponsor or in the Support Agreement described in the DEFI prospectus, in its sole and absolute discretion. The Trust is also responsible for extraordinary expenses, including, but not limited to, legal claims and liabilities and litigation costs and any indemnification related thereto. The Trust and/or the Sponsor may be required to indemnify the Trustee, Distributor or Administrator under certain circumstances.
The parties cannot anticipate the amount of payments that will be required under these arrangements for future periods as the NAV and trading levels to meet investment objectives for each Fund will not be known until a future date. These agreements are effective for a specific term agreed upon by the parties with an option to renew, or, in some cases, are in effect for the duration of each Fund’s existence. The parties may terminate these agreements earlier for certain reasons listed in the agreements.
On August 17, 2015 (the “Conversion Date”), U.S. Bank N.A. replaced The Bank of New York Mellon as the Custodian for the Funds. The principal business address for U.S. Bank N.A. is 1555 North Rivercenter Drive, Suite 302, Milwaukee, Wisconsin 53212. In addition, effective on the Conversion Date, U.S. Bancorp Fund Services, LLC (“USBFS”), a wholly owned subsidiary of U.S. Bank, commenced serving as administrator for each Fund, performing certain administrative and accounting services and preparing certain SEC reports on behalf of the Funds, and also became the registrar and transfer agent for each Fund’s Shares. The principal address for USBFS is 777 East Wisconsin Avenue, Milwaukee, WI, 53202. For such services, U.S. Bank and USBFS will receive an asset-based fee, subject to a minimum annual fee.
Benchmark Performance
Investing in Commodity or Cryptocurrency Interests subjects the Funds to the risks of the underlying commodity or cryptocurrency market, and this could result in substantial fluctuations in the price of each Fund’s Shares. Unlike mutual funds, the Funds generally willcurrently are not expected to distribute dividends to Shareholders. Although this could change if interest rates continue to rise, and the assets of the Funds increase. Investors may choose to use the Funds as a means of investing indirectly in the underlying commodity or cryptocurrency, and there are risks involved in such investments. The Sponsor has limited experience operating a commodity pool. Investors may choose to use the Funds as vehicles to hedge against the risk of loss, and there are risks involved in hedging activities.
During the period from January 1, 20172024 through September 30, 2017March 31, 2024 the average daily change in the NAV of each Fund was within plus/minus 10 percent of the average daily change in the Benchmark of each Fund, as stated in the applicable prospectus for each Fund.
Frequency Distribution of Premiums and Discounts: NAV versus the 4pm Bid/Ask Midpoint on the NYSE ArcaArca.
CORN
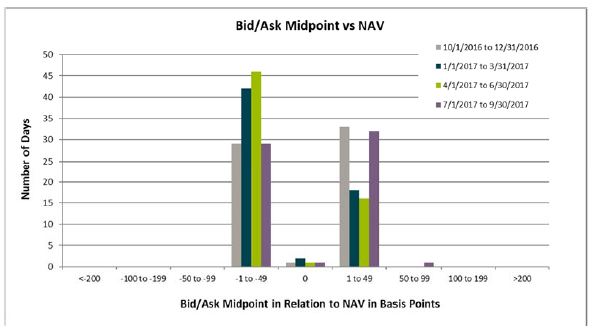
CORN | Q2 2023 | Q3 2023 | Q4 2023 | Q1 2024 | Total |
Days at premium | 31 | 28 | 26 | 20 | 105 |
Days at NAV | 3 | 6 | 5 | 7 | 21 |
Days at discount | 28 | 29 | 32 | 34 | 123 |
The performance data above for the Teucrium Corn Fund represents past performance. Past performance is not a guarantee of future results. Investment return and value of the Fund’s Shares will fluctuate so that an investor’s Shares, when sold, may be worth more or less than their original cost. Performance may be lower or higher than performance data quoted.
SOYB | Q2 2023 | Q3 2023 | Q4 2023 | Q1 2024 | Total |
Days at premium | 32 | 27 | 40 | 46 | 145 |
Days at NAV | 6 | 5 | 5 | 2 | 18 |
Days at discount | 24 | 31 | 18 | 13 | 86 |
47
SOYB
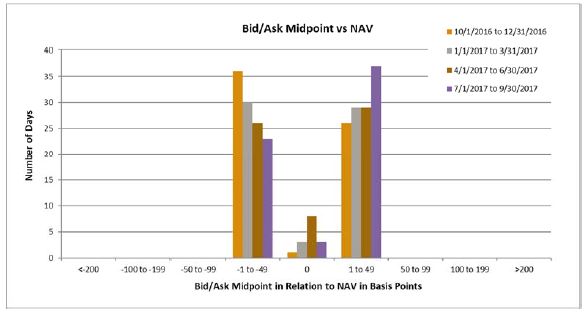
The performance data above for the Teucrium Soybean Fund represents past performance. Past performance is not a guarantee of future results. Investment return and value of the Fund’s Shares will fluctuate so that an investor’s Shares, when sold, may be worth more or less than their original cost. Performance may be lower or higher than performance data quoted.
CANE
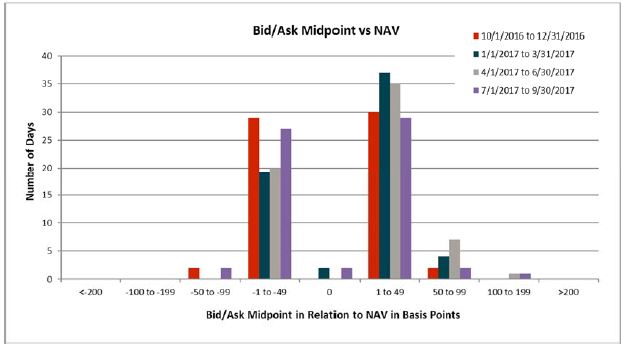
CANE | Q2 2023 | Q3 2023 | Q4 2023 | Q1 2024 | Total |
Days at premium | 30 | 30 | 31 | 28 | 119 |
Days at NAV | 7 | 10 | 10 | 6 | 33 |
Days at discount | 25 | 23 | 22 | 27 | 97 |
The performance data above for the Teucrium Sugar Fund represents past performance. Past performance is not a guarantee of future results. Investment return and value of the Fund’s Shares will fluctuate so that an investor’s Shares, when sold, may be worth more or less than their original cost. Performance may be lower or higher than performance data quoted.
WEAT | Q2 2023 | Q3 2023 | Q4 2023 | Q1 2024 | Total |
Days at premium | 27 | 23 | 26 | 16 | 92 |
Days at NAV | 14 | 21 | 20 | 24 | 79 |
Days at discount | 21 | 19 | 17 | 21 | 78 |
WEAT
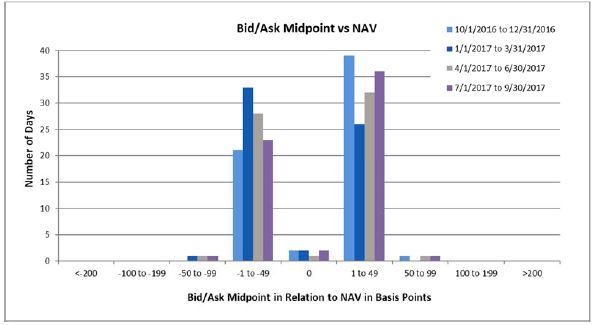
The performance data above for the Teucrium Wheat Fund represents past performance. Past performance is not a guarantee of future results. Investment return and value of the Fund’s Shares will fluctuate so that an investor’s Shares, when sold, may be worth more or less than their original cost. Performance may be lower or higher than performance data quoted.
TAGS
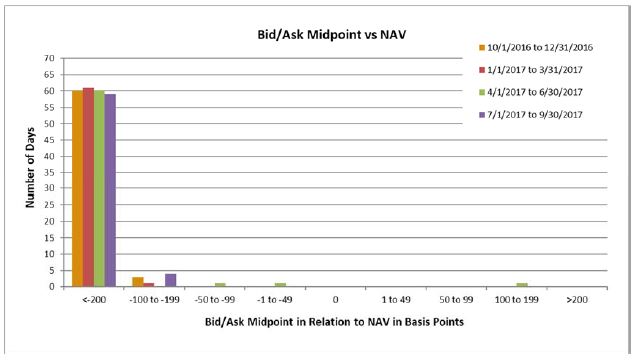
TAGS | Q2 2023 | Q3 2023 | Q4 2023 | Q1 2024 | Total |
Days at premium | 13 | 14 | 16 | 10 | 53 |
Days at NAV | 2 | 5 | 13 | 5 | 25 |
Days at discount | 47 | 44 | 34 | 46 | 171 |
The performance data above for the Teucrium Agricultural Fund represents past performance. Past performance is not a guarantee of future results. Investment return and value of the Fund’s Shares will fluctuate so that an investor’s Shares, when sold, may be worth more or less than their original cost. Performance may be lower or higher than performance data quoted.
Beginning on
For the period from August 2, 2012 through September 30, 2017,April 10, 2018, TAGS hashad 50,002 shares currently outstanding; this represents the minimum number of shares and, thus, no shares cancould be redeemed until additional shares have been created. This situation has generated a situation, at times, in which the spread between the bid/ask midpoint at 4pm and the NAV falls outside of the “1 to 49” or “-1 to -49” range. The situation does not affect the actual NAV of the Fund.
DEFI | Q2 2023 | Q3 2023 | Q4 2023 | Q1 2024 | Total |
Days at premium | 11 | 6 | 7 | 2 | 26 |
Days at NAV | 32 | 37 | 37 | 47 | 153 |
Days at discount | 19 | 20 | 19 | 12 | 70 |
The performance data above for the Hashdex Bitcoin Futures ETF represents past performance. Past performance is not a guarantee of future results. Investment return and value of the Fund’s Shares will fluctuate so that an investor’s Shares, when sold, may be worth more or less than their original cost. Performance may be lower or higher than performance data quoted.
Description
The above frequency distribution charts present information about the difference between the daily market price for Shares of each Fund and the Fund’s reported Net Asset Value per share. The amount that a Fund’s market price is above the reported NAV is called the premium. The amount that a Fund’s market price is below the reported NAV is called the discount. The market price is determined using the midpoint between the highest bid and the lowest offer on the listing exchange, as of the time that a Fund’s NAV is calculated (usually 4:00 p.m., New York time)(ET)). The horizontal axis of the chart shows the premium or discount expressed in basis points. The vertical axis indicates the number of trading daysEach value in the period covered by the chart. Each bar in the chart showstables represents the number of trading days in which a Fund traded within the premium/discount range indicated. The premium or discount is expressed in basis points.
*A unit that is equal to 1/100th of 1% and is used to denote the change in a financial instrument.
NEITHER THE PAST PERFORMANCE OF A FUND NOR THE PRIOR INDEX LEVELS AND CHANGES, POSITIVE OR NEGATIVE, SHOULD BE TAKEN AS AN INDICATION OF THE FUND’SFUND’S FUTURE PERFORMANCE.
Item 3. Quantitative and Qualitative Disclosures About Market Risk
Market Risk
The discussion and analysis which follows may contain trend analysis and other forward-looking statements within the meaning of Section 21E of the Securities Exchange Act of 1934 which reflect our current views with respect to future events and financial results. Words such as “anticipate,“anticipate,” “expect,“expect,” “intend,“intend,” “plan,“plan,” “believe,“believe,” “seek,“seek,” “outlook”“outlook” and “estimate,“estimate,” as well as similar words and phrases, signify forward-looking statements. The Trust’sTrust’s forward-looking statements are not guarantees of future results and conditions, and important factors, risks and uncertainties may cause our actual results to differ materially from those expressed in our forward-looking statements.
You should not place undue reliance on any forward-looking statements. Except as expressly required by the Federal securities laws, the Sponsor undertakes no obligation to publicly update or revise any forward-looking statements or the risks, uncertainties or other factors described in this Report, as a result of new information, future events or changed circumstances or for any other reason after the date of this Report.
Trading in Commodity and Cryptocurrency Interests such as Futures Contracts will involve the Funds entering into contractual commitments to purchase or sell specific amounts of commodities or cryptocurrencies at a specified date in the future. The gross or face amount of the contracts is expected to significantly exceed the future cash requirements of each Fund as each Fund intends to close out any open positions prior to the contractual expiration date. As a result, each Fund’s market risk is the risk of loss arising from the decline in value of the contracts, not from the need to make delivery under the contracts. The Funds consider the “fair value” of derivative instruments to be the unrealized gain or loss on the contracts. The market risk associated with the commitment by the Funds to purchase a specific commodity or cryptocurrency will be limited to the aggregate face amount of the contacts held.
The exposure of the Funds to market risk will depend primarily on a numberthe market price of factors including the markets for the specific commodity,commodities or cryptocurrency held by the Fund. The market price of the commodities or cryptocurrency depends in part on the volatility of interest rates and foreign exchange rates and the liquidity of the commodity-specific Interest markets and the relationships among the contracts held by each Fund.
commodity or cryptocurrency specific markets. TAGS is subject to the risks of the commodity-specificcommodity specific futures contracts of the Underlying Funds as the fair value of its holdings is based on the NAV of each of the Underlying Funds, each of which is directly impacted by the factors discussed above.
The tables below present a quantitative analysis of hypothetical impact of price decreases and increases in each of the commodity or cryptocurrency futures contracts held by each of the Funds, or the Underlying Funds in the case of TAGS, on the actual holdings and NAV per share as of September 30, 2017.March 31, 2024. For purposes of this analysis, all futures contracts held by the Funds and the Underlying Funds are assumed to change by the same percentage. In addition, the cash held by the Funds and any management fees paid to the Sponsor are assumed to remain constant and not impact the NAV per share. There may be very slight and immaterial differences, due to rounding, in the tables presented below.
CORN:
| | | | | | | | | | | | | | | | | | | | | | | | | | | | |
| | | September 30, 2017 as Reported | | | 10% Decrease | | | 15% Decrease | | | 20% Decrease | | | 10% Increase | | | 15% Increase | | | 20% Increase | |
| | | Number of | | | | | | Notional | | | Notional | | | Notional | | | Notional | | | Notional | | | Notional | | | Notional | |
| Holdings as of September 30, 2017 | | Contracts Held | | | Closing Price | | | Amount | | | Amount | | | Amount | | | Amount | | | Amount | | | Amount | | | Amount | |
| CBOT Corn Futures MAR18 | | | 1,281 | | | $ | 3.6775 | | | $ | 23,554,388 | | | $ | 21,198,949 | | | $ | 20,021,229 | | | $ | 18,843,510 | | | $ | 25,909,826 | | | $ | 27,087,546 | | | $ | 28,265,265 | |
| CBOT Corn Futures MAY18 | | | 1,073 | | | $ | 3.7625 | | | $ | 20,185,813 | | | $ | 18,167,231 | | | $ | 17,157,941 | | | $ | 16,148,650 | | | $ | 22,204,394 | | | $ | 23,213,684 | | | $ | 24,222,975 | |
| CBOT Corn Futures DEC18 | | | 1,183 | | | $ | 3.9950 | | | $ | 23,630,425 | | | $ | 21,267,383 | | | $ | 20,085,861 | | | $ | 18,904,340 | | | $ | 25,993,468 | | | $ | 27,174,989 | | | $ | 28,356,510 | |
| Total CBOT Corn Futures | | | | | | | | | | $ | 67,370,626 | | | $ | 60,633,563 | | | $ | 57,265,031 | | | $ | 53,896,500 | | | $ | 74,107,688 | | | $ | 77,476,219 | | | $ | 80,844,750 | |
| | | | | | | | | | | | | | | | | | | | | | | | | | | | | | | | | | | | | |
| Shares outstanding | | | | | | | | | | | 3,825,004 | | | | 3,825,004 | | | | 3,825,004 | | | | 3,825,004 | | | | 3,825,004 | | | | 3,825,004 | | | | 3,825,004 | |
| | | | | | | | | | | | | | | | | | | | | | | | | | | | | | | | | | | | | |
| Net Asset Value per Share attributable directly to | | | | | | | | | | | | | | | | | | | | | | | | | | | | | | | | | | | | |
| CBOT Corn Futures | | | | | | | | | | $ | 17.61 | | | $ | 15.85 | | | $ | 14.97 | | | $ | 14.09 | | | $ | 19.37 | | | $ | 20.26 | | | $ | 21.14 | |
| Total Net Asset Value per Share as reported | | | | | | | | | | $ | 17.60 | | | | | | | | | | | | | | | | | | | | | | | | | |
| Change in the Net Asset Value per Share | | | | | | | | | | | | | | $ | (1.76 | ) | | $ | (2.64 | ) | | $ | (3.52 | ) | | $ | 1.76 | | | $ | 2.64 | | | $ | 3.52 | |
| | | | | | | | | | | | | | | | | | | | | | | | | | | | | | | | | | | | | |
| Percent Change in the Net Asset Value per Share | | | | | | | | | | | | | | | -10.01 | % | | | -15.01 | % | | | -20.01 | % | | | 10.01 | % | | | 15.01 | % | | | 20.01 | % |
| | | March 31, 2024 as Reported | | | 10% Decrease | | | 15% Decrease | | | 20% Decrease | | | 10% Increase | | | 15% Increase | | | 20% Increase | |
Holdings as of March 31, 2024 | | Number of Contracts Held | | | Closing Price | | | Notional Amount | | | Notional Amount | | | Notional Amount | | | Notional Amount | | | Notional Amount | | | Notional Amount | | | Notional Amount | |
CBOT Corn Futures JUL24 | | | 1,072 | | | $ | 4.5450 | | | $ | 24,361,200 | | | $ | 21,925,080 | | | $ | 20,707,020 | | | $ | 19,488,960 | | | $ | 26,797,320 | | | $ | 28,015,380 | | | $ | 29,233,440 | |
CBOT Corn Futures SEP24 | | | 901 | | | $ | 4.6450 | | | $ | 20,925,725 | | | $ | 18,833,153 | | | $ | 17,786,866 | | | $ | 16,740,580 | | | $ | 23,018,298 | | | $ | 24,064,584 | | | $ | 25,110,870 | |
CBOT Corn Futures DEC24 | | | 1,022 | | | $ | 4.7775 | | | $ | 24,413,025 | | | $ | 21,971,723 | | | $ | 20,751,071 | | | $ | 19,530,420 | | | $ | 26,854,328 | | | $ | 28,074,979 | | | $ | 29,295,630 | |
Total CBOT Corn Futures | | | | | | | | | | $ | 69,699,950 | | | $ | 62,729,956 | | | $ | 59,244,957 | | | $ | 55,759,960 | | | $ | 76,669,946 | | | $ | 80,154,943 | | | $ | 83,639,940 | |
| | | | | | | | | | | | | | | | | | | | | | | | | | | | | | | | | | | | | |
Shares outstanding | | | | | | | | | | | 3,450,004 | | | | 3,450,004 | | | | 3,450,004 | | | | 3,450,004 | | | | 3,450,004 | | | | 3,450,004 | | | | 3,450,004 | |
| | | | | | | | | | | | | | | | | | | | | | | | | | | | | | | | | | | | | |
Net Asset Value per Share attributable directly to CBOT Corn Futures | | | | | | | | | | $ | 20.20 | | | $ | 18.18 | | | $ | 17.17 | | | $ | 16.16 | | | $ | 22.22 | | | $ | 23.23 | | | $ | 24.24 | |
Total Net Asset Value per Share as reported | | | | | | | | | | $ | 20.22 | | | | | | | | | | | | | | | | | | | | | | | | | |
Change in the Net Asset Value per Share | | | | | | | | | | | | | | $ | (2.02 | ) | | $ | (3.03 | ) | | $ | (4.04 | ) | | $ | 2.02 | | | $ | 3.03 | | | $ | 4.04 | |
| | | | | | | | | | | | | | | | | | | | | | | | | | | | | | | | | | | | | |
Percent Change in the Net Asset Value per Share | | | | | | | | | | | | | | | -9.99 | % | | | -14.99 | % | | | -19.99 | % | | | 9.99 | % | | | 14.99 | % | | | 19.99 | % |
SOYB:
| | | March 31, 2024 as Reported | | | 10% Decrease | | | 15% Decrease | | | 20% Decrease | | | 10% Increase | | | 15% Increase | | | 20% Increase | |
Holdings as of March 31, 2024 | | Number of Contracts Held | | | Closing Price | | | Notional Amount | | | Notional Amount | | | Notional Amount | | | Notional Amount | | | Notional Amount | | | Notional Amount | | | Notional Amount | |
CBOT Soybean Futures JUL24 | | | 197 | | | $ | 12.0525 | | | $ | 11,871,713 | | | $ | 10,684,541 | | | $ | 10,090,956 | | | $ | 9,497,370 | | | $ | 13,058,884 | | | $ | 13,652,469 | | | $ | 14,246,055 | |
CBOT Soybean Futures NOV24 | | | 172 | | | $ | 11.8625 | | | $ | 10,201,750 | | | $ | 9,181,575 | | | $ | 8,671,488 | | | $ | 8,161,400 | | | $ | 11,221,925 | | | $ | 11,732,013 | | | $ | 12,242,100 | |
CBOT Soybean Futures NOV25 | | | 204 | | | $ | 11.6275 | | | $ | 11,860,050 | | | $ | 10,674,045 | | | $ | 10,081,043 | | | $ | 9,488,040 | | | $ | 13,046,055 | | | $ | 13,639,058 | | | $ | 14,232,060 | |
Total CBOT Soybean Futures | | | | | | | | | | $ | 33,933,513 | | | $ | 30,540,161 | | | $ | 28,843,487 | | | $ | 27,146,810 | | | $ | 37,326,864 | | | $ | 39,023,540 | | | $ | 40,720,215 | |
| | | | | | | | | | | | | | | | | | | | | | | | | | | | | | | | | | | | | |
Shares outstanding | | | | | | | | | | | 1,350,004 | | | | 1,350,004 | | | | 1,350,004 | | | | 1,350,004 | | | | 1,350,004 | | | | 1,350,004 | | | | 1,350,004 | |
| | | | | | | | | | | | | | | | | | | | | | | | | | | | | | | | | | | | | |
Net Asset Value per Share attributable directly to CBOT Soybean Futures | | | | | | | | | | $ | 25.14 | | | $ | 22.62 | | | $ | 21.37 | | | $ | 20.11 | | | $ | 27.65 | | | $ | 28.91 | | | $ | 30.16 | |
Total Net Asset Value per Share as reported | | | | | | | | | | $ | 25.16 | | | | | | | | | | | | | | | | | | | | | | | | | |
Change in the Net Asset Value per Share | | | | | | | | | | | | | | $ | (2.51 | ) | | $ | (3.77 | ) | | $ | (5.03 | ) | | $ | 2.51 | | | $ | 3.77 | | | $ | 5.03 | |
| | | | | | | | | | | | | | | | | | | | | | | | | | | | | | | | | | | | | |
Percent Change in the Net Asset Value per Share | | | | | | | | | | | | | | | -9.99 | % | | | -14.99 | % | | | -19.98 | % | | | 9.99 | % | | | 14.99 | % | | | 19.98 | % |
CANE:
| | | March 31, 2024 as Reported | | | 10% Decrease | | | 15% Decrease | | | 20% Decrease | | | 10% Increase | | | 15% Increase | | | 20% Increase | |
Holdings as of March 31, 2024 | | Number of Contracts Held | | | Closing Price | | | Notional Amount | | | Notional Amount | | | Notional Amount | | | Notional Amount | | | Notional Amount | | | Notional Amount | | | Notional Amount | |
ICE #11 Sugar Futures JUL24 | | | 234 | | | $ | 0.2215 | | | $ | 5,805,072 | | | $ | 5,224,565 | | | $ | 4,934,311 | | | $ | 4,644,058 | | | $ | 6,385,579 | | | $ | 6,675,833 | | | $ | 6,966,086 | |
ICE #11 Sugar Futures OCT24 | | | 201 | | | $ | 0.2205 | | | $ | 4,963,896 | | | $ | 4,467,506 | | | $ | 4,219,312 | | | $ | 3,971,117 | | | $ | 5,460,286 | | | $ | 5,708,480 | | | $ | 5,956,675 | |
ICE #11 Sugar Futures MAR25 | | | 233 | | | $ | 0.2211 | | | $ | 5,769,826 | | | $ | 5,192,843 | | | $ | 4,904,352 | | | $ | 4,615,861 | | | $ | 6,346,809 | | | $ | 6,635,300 | | | $ | 6,923,791 | |
Total ICE #11 Sugar Futures | | | | | | | | | | $ | 16,538,794 | | | $ | 14,884,914 | | | $ | 14,057,975 | | | $ | 13,231,036 | | | $ | 18,192,674 | | | $ | 19,019,613 | | | $ | 19,846,552 | |
| | | | | | | | | | | | | | | | | | | | | | | | | | | | | | | | | | | | | |
Shares outstanding | | | | | | | | | | | 1,225,004 | | | | 1,225,004 | | | | 1,225,004 | | | | 1,225,004 | | | | 1,225,004 | | | | 1,225,004 | | | | 1,225,004 | |
| | | | | | | | | | | | | | | | | | | | | | | | | | | | | | | | | | | | | |
Net Asset Value per Share attributable directly to ICE #11 Sugar Futures | | | | | | | | | | $ | 13.50 | | | $ | 12.15 | | | $ | 11.48 | | | $ | 10.80 | | | $ | 14.85 | | | $ | 15.53 | | | $ | 16.20 | |
Total Net Asset Value per Share as reported | | | | | | | | | | $ | 13.49 | | | | | | | | | | | | | | | | | | | | | | | | | |
Change in the Net Asset Value per Share | | | | | | | | | | | | | | $ | (1.35 | ) | | $ | (2.03 | ) | | $ | (2.70 | ) | | $ | 1.35 | | | $ | 2.03 | | | $ | 2.70 | |
| | | | | | | | | | | | | | | | | | | | | | | | | | | | | | | | | | | | | |
Percent Change in the Net Asset Value per Share | | | | | | | | | | | | | | | -10.01 | % | | | -15.01 | % | | | -20.01 | % | | | 10.01 | % | | | 15.01 | % | | | 20.01 | % |
51
| SOYB: | | | | | | | | | | | | | | | | | | |
| | | | | | | | | | | | | | | | | | | |
| | | September 30, 2017 as Reported | | | 10% Decrease | | | 15% Decrease | | | 20% Decrease | | | 10% Increase | | | 15% Increase | | | 20% Increase | |
| | | Number of | | | | | | Notional | | | Notional | | | Notional | | | Notional | | | Notional | | | Notional | | | Notional | |
| Holdings as of September 30, 2017 | | Contracts Held | | | Closing Price | | | Amount | | | Amount | | | Amount | | | Amount | | | Amount | | | Amount | | | Amount | |
| CBOT Soybean Futures JAN18 | | | 144 | | | $ | 9.7850 | | | $ | 7,045,200 | | | $ | 6,340,680 | | | $ | 5,988,420 | | | $ | 5,636,160 | | | $ | 7,749,720 | | | $ | 8,101,980 | | | $ | 8,454,240 | |
| CBOT Soybean Futures MAR18 | | | 123 | | | $ | 9.8775 | | | $ | 6,074,663 | | | $ | 5,467,196 | | | $ | 5,163,463 | | | $ | 4,859,730 | | | $ | 6,682,129 | | | $ | 6,985,862 | | | $ | 7,289,595 | |
| CBOT Soybean Futures NOV18 | | | 143 | | | $ | 9.8625 | | | $ | 7,051,688 | | | $ | 6,346,519 | | | $ | 5,993,934 | | | $ | 5,641,350 | | | $ | 7,756,856 | | | $ | 8,109,441 | | | $ | 8,462,025 | |
| Total CBOT Soybean Futures | | | | | | | | | | $ | 20,171,551 | | | $ | 18,154,395 | | | $ | 17,145,818 | | | $ | 16,137,240 | | | $ | 22,188,705 | | | $ | 23,197,283 | | | $ | 24,205,860 | |
| | | | | | | | | | | | | | | | | | | | | | | | | | | | | | | | | | | | | |
| Shares outstanding | | | | | | | | | | | 1,100,004 | | | | 1,100,004 | | | | 1,100,004 | | | | 1,100,004 | | | | 1,100,004 | | | | 1,100,004 | | | | 1,100,004 | |
| | | | | | | | | | | | | | | | | | | | | | | | | | | | | | | | | | | | | |
| Net Asset Value per Share attributable directly to | | | | | | | | | | | | | | | | | | | | | | | | | | | | | | | | | | | | |
| CBOT Soybean Futures | | | | | | | | | | $ | 18.34 | | | $ | 16.50 | | | $ | 15.59 | | | $ | 14.67 | | | $ | 20.17 | | | $ | 21.09 | | | $ | 22.01 | |
| Total Net Asset Value per Share as reported | | | | | | | | | | $ | 18.33 | | | | | | | | | | | | | | | | | | | | | | | | | |
| Change in the Net Asset Value per Share | | | | | | | | | | | | | | $ | (1.83 | ) | | $ | (2.75 | ) | | $ | (3.67 | ) | | $ | 1.83 | | | $ | 2.75 | | | $ | 3.67 | |
| | | | | | | | | | | | | | | | | | | | | | | | | | | | | | | | | | | | | |
| Percent Change in the Net Asset Value per Share | | | | | | | | | | | | | | | -10.00 | % | | | -15.00 | % | | | -20.00 | % | | | 10.00 | % | | | 15.00 | % | | | 20.00 | % |
| | | | | | | | | | | | | | | | | | | |
| CANE: | | | | | | | | | | | | | | | | | | |
| | | | | | | | | | | | | | | | | | | |
| | | September 30, 2017 as Reported | | | 10% Decrease | | | 15% Decrease | | | 20% Decrease | | | 10% Increase | | | 15% Increase | | | 20% Increase | |
| | | Number of | | | | | | Notional | | | Notional | | | Notional | | | Notional | | | Notional | | | Notional | | | Notional | |
| Holdings as of September 30, 2017 | | Contracts Held | | | Closing Price | | | Amount | | | Amount | | | Amount | | | Amount | | | Amount | | | Amount | | | Amount | |
| ICE #11 Sugar Futures MAY18 | | | 145 | | | $ | 0.1422 | | | $ | 2,309,328 | | | $ | 2,078,395 | | | $ | 1,962,929 | | | $ | 1,847,462 | | | $ | 2,540,261 | | | $ | 2,655,727 | | | $ | 2,771,194 | |
| ICE #11 Sugar Futures JUL18 | | | 122 | | | $ | 0.1439 | | | $ | 1,966,250 | | | $ | 1,769,625 | | | $ | 1,671,312 | | | $ | 1,573,000 | | | $ | 2,162,875 | | | $ | 2,261,187 | | | $ | 2,359,500 | |
| ICE #11 Sugar Futures MAR19 | | | 135 | | | $ | 0.1531 | | | $ | 2,314,872 | | | $ | 2,083,385 | | | $ | 1,967,641 | | | $ | 1,851,898 | | | $ | 2,546,359 | | | $ | 2,662,103 | | | $ | 2,777,846 | |
| Total ICE #11 Sugar Futures | | | | | | | | | | $ | 6,590,450 | | | $ | 5,931,405 | | | $ | 5,601,882 | | | $ | 5,272,360 | | | $ | 7,249,495 | | | $ | 7,579,017 | | | $ | 7,908,540 | |
| | | | | | | | | | | | | | | | | | | | | | | | | | | | | | | | | | | | | |
| Shares outstanding | | | | | | | | | | | 700,004 | | | | 700,004 | | | | 700,004 | | | | 700,004 | | | | 700,004 | | | | 700,004 | | | | 700,004 | |
| | | | | | | | | | | | | | | | | | | | | | | | | | | | | | | | | | | | | |
| Net Asset Value per Share attributable directly to ICE | | | | | | | | | | | | | | | | | | | | | | | | | | | | | | | | | | | | |
| #11 Sugar Futures | | | | | | | | | | $ | 9.41 | | | $ | 8.47 | | | $ | 8.00 | | | $ | 7.53 | | | $ | 10.36 | | | $ | 10.83 | | | $ | 11.30 | |
| Total Net Asset Value per Share as reported | | | | | | | | | | $ | 9.43 | | | | | | | | | | | | | | | | | | | | | | | | | |
| Change in the Net Asset Value per Share | | | | | | | | | | | | | | $ | (0.94 | ) | | $ | (1.41 | ) | | $ | (1.88 | ) | | $ | 0.94 | | | $ | 1.41 | | | $ | 1.88 | |
| | | | | | | | | | | | | | | | | | | | | | | | | | | | | | | | | | | | | |
| Percent Change in the Net Asset Value per Share | | | | | | | | | | | | | | | -9.98 | % | | | -14.98 | % | | | -19.97 | % | | | 9.98 | % | | | 14.98 | % | | | 19.97 | % |
| | | | | | | | | | | | | | | | | | | | | | | | | | | | | | | | | | | | | |
| WEAT: | | | | | | | | | | | | | | | | | | |
| | | | | | | | | | | | | | | | | | | |
| | | | | | | | | | | | | | | | | | | |
| | | September 30, 2017 as Reported | | | 10% Decrease | | | 15% Decrease | | | 20% Decrease | | | 10% Increase | | | 15% Increase | | | 20% Increase | |
| | | Number of | | | | | | Notional | | | Notional | | | Notional | | | Notional | | | Notional | | | Notional | | | Notional | |
| Holdings as of September 30, 2017 | | Contracts Held | | | Closing Price | | | Amount | | | Amount | | | Amount | | | Amount | | | Amount | | | Amount | | | Amount | |
| CBOT Wheat Futures MAR18 | | | 1,016 | | | $ | 4.6650 | | | $ | 23,698,200 | | | $ | 21,328,380 | | | $ | 20,143,470 | | | $ | 18,958,560 | | | $ | 26,068,020 | | | $ | 27,252,930 | | | $ | 28,437,840 | |
| CBOT Wheat Futures MAY18 | | | 848 | | | $ | 4.7925 | | | $ | 20,320,200 | | | $ | 18,288,180 | | | $ | 17,272,170 | | | $ | 16,256,160 | | | $ | 22,352,220 | | | $ | 23,368,230 | | | $ | 24,384,240 | |
| CBOT Wheat Futures DEC18 | | | 908 | | | $ | 5.2450 | | | $ | 23,812,300 | | | $ | 21,431,070 | | | $ | 20,240,455 | | | $ | 19,049,840 | | | $ | 26,193,530 | | | $ | 27,384,145 | | | $ | 28,574,760 | |
| Total CBOT Wheat Futures | | | | | | | | | | $ | 67,830,700 | | | $ | 61,047,630 | | | $ | 57,656,095 | | | $ | 54,264,560 | | | $ | 74,613,770 | | | $ | 78,005,305 | | | $ | 81,396,840 | |
| | | | | | | | | | | | | | | | | | | | | | | | | | | | | | | | | | | | | |
| Shares outstanding | | | | | | | | | | | 10,325,004 | | | | 10,325,004 | | | | 10,325,004 | | | | 10,325,004 | | | | 10,325,004 | | | | 10,325,004 | | | | 10,325,004 | |
| | | | | | | | | | | | | | | | | | | | | | | | | | | | | | | | | | | | | |
| Net Asset Value per Share attributable directly to | | | | | | | | | | | | | | | | | | | | | | | | | | | | | | | | | | | | |
| CBOT Wheat Futures | | | | | | | | | | $ | 6.57 | | | $ | 5.91 | | | $ | 5.58 | | | $ | 5.26 | | | $ | 7.23 | | | $ | 7.55 | | | $ | 7.88 | |
| Total Net Asset Value per Share as reported | | | | | | | | | | $ | 6.57 | | | | | | | | | | | | | | | | | | | | | | | | | |
| Change in the Net Asset Value per Share | | | | | | | | | | | | | | $ | (0.66 | ) | | $ | (0.99 | ) | | $ | (1.31 | ) | | $ | 0.66 | | | $ | 0.99 | | | $ | 1.31 | |
| | | | | | | | | | | | | | | | | | | | | | | | | | | | | | | | | | | | | |
| Percent Change in the Net Asset Value per Share | | | | | | | | | | | | | | | -10.00 | % | | | -15.00 | % | | | -20.00 | % | | | 10.00 | % | | | 15.00 | % | | | 20.00 | % |
| | | | | | | | | | | | | | | | | | | | | | | | | | | | | | | | | | | | | |
| TAGS: | | | | | | | | | | | | | | | | | | |
| | | September 30, 2017 as Reported | | | 10% Decrease | | | 15% Decrease | | | 20% Decrease | | | 10% Increase | | | 15% Increase | | | 20% Increase | |
| | | Number of | | | | | | | | | | | | | | | | | | | | | | | | | |
| Holdings as of September 30, 2017 | | Shares Held | | | Closing NAV | | | Fair Value | | | Fair Value | | | Fair Value | | | Fair Value | | | Fair Value | | | Fair Value | | | Fair Value | |
| Teucrium Corn Fund | | | 16,808 | | | $ | 17.6020 | | | $ | 295,854 | | | $ | 266,269 | | | $ | 251,476 | | | $ | 236,684 | | | $ | 325,440 | | | $ | 340,233 | | | $ | 355,025 | |
| Teucrium Soybean Fund | | | 16,331 | | | $ | 18.3339 | | | $ | 299,411 | | | $ | 269,470 | | | $ | 254,499 | | | $ | 239,529 | | | $ | 329,352 | | | $ | 344,323 | | | $ | 359,293 | |
| Teucrium Sugar Fund | | | 29,524 | | | $ | 9.4297 | | | $ | 278,403 | | | $ | 250,563 | | | $ | 236,643 | | | $ | 222,723 | | | $ | 306,244 | | | $ | 320,164 | | | $ | 334,084 | |
| Teucrium Wheat Fund | | | 45,937 | | | $ | 6.5677 | | | $ | 301,700 | | | $ | 271,530 | | | $ | 256,445 | | | $ | 241,360 | | | $ | 331,870 | | | $ | 346,955 | | | $ | 362,041 | |
| Total value of shares of the Underlying Funds | | | | | | | | | | $ | 1,175,368 | | | $ | 1,057,832 | | | $ | 999,064 | | | $ | 940,295 | | | $ | 1,292,906 | | | $ | 1,351,675 | | | $ | 1,410,443 | |
| | | | | | | | | | | | | | | | | | | | | | | | | | | | | | | | | | | | | |
| Shares outstanding | | | | | | | | | | | 50,002 | | | | 50,002 | | | | 50,002 | | | | 50,002 | | | | 50,002 | | | | 50,002 | | | | 50,002 | |
| | | | | | | | | | | | | | | | | | | | | | | | | | | | | | | | | | | | | |
| Net Asset Value per Share attributable directly to | | | | | | | | | | | | | | | | | | | | | | | | | | | | | | | | | | | | |
| shares of the Underlying Funds | | | | | | | | | | $ | 23.51 | | | $ | 21.16 | | | $ | 19.98 | | | $ | 18.81 | | | $ | 25.86 | | | $ | 27.03 | | | $ | 28.21 | |
| Total Net Asset Value per Share as reported | | | | | | | | | | $ | 23.53 | | | | | | | | | | | | | | | | | | | | | | | | | |
| Change in the Net Asset Value per Share | | | | | | | | | | | | | | $ | (2.35 | ) | | $ | (3.53 | ) | | $ | (4.70 | ) | | $ | 2.35 | | | $ | 3.53 | | | $ | 4.70 | |
| | | | | | | | | | | | | | | | | | | | | | | | | | | | | | | | | | | | | |
| Percent Change in the Net Asset Value per Share | | | | | | | | | | | | | | | -9.99 | % | | | -14.99 | % | | | -19.98 | % | | | 9.99 | % | | | 14.99 | % | | | 19.98 | % |
WEAT:
| | | March 31, 2024 as Reported | | | 10% Decrease | | | 15% Decrease | | | 20% Decrease | | | 10% Increase | | | 15% Increase | | | 20% Increase | |
Holdings as of March 31, 2024 | | Number of Contracts Held | | | Closing Price | | | Notional Amount | | | Notional Amount | | | Notional Amount | | | Notional Amount | | | Notional Amount | | | Notional Amount | | | Notional Amount | |
CBOT Wheat Futures JUL24 | | | 1,915 | | | $ | 5.7575 | | | $ | 55,128,063 | | | $ | 49,615,257 | | | $ | 46,858,854 | | | $ | 44,102,450 | | | $ | 60,640,869 | | | $ | 63,397,272 | | | $ | 66,153,676 | |
CBOT Wheat Futures SEP24 | | | 1,599 | | | $ | 5.9150 | | | $ | 47,290,425 | | | $ | 42,561,383 | | | $ | 40,196,861 | | | $ | 37,832,340 | | | $ | 52,019,468 | | | $ | 54,383,989 | | | $ | 56,748,510 | |
CBOT Wheat Futures DEC24 | | | 1,800 | | | $ | 6.1200 | | | $ | 55,080,000 | | | $ | 49,572,000 | | | $ | 46,818,000 | | | $ | 44,064,000 | | | $ | 60,588,000 | | | $ | 63,342,000 | | | $ | 66,096,000 | |
Total CBOT Wheat Futures | | | | | | | | | | $ | 157,498,488 | | | $ | 141,748,640 | | | $ | 133,873,715 | | | $ | 125,998,790 | | | $ | 173,248,337 | | | $ | 181,123,261 | | | $ | 188,998,186 | |
| | | | | | | | | | | | | | | | | | | | | | | | | | | | | | | | | | | | | |
Shares outstanding | | | | | | | | | | | 29,250,004 | | | | 29,250,004 | | | | 29,250,004 | | | | 29,250,004 | | | | 29,250,004 | | | | 29,250,004 | | | | 29,250,004 | |
| | | | | | | | | | | | | | | | | | | | | | | | | | | | | | | | | | | | | |
Net Asset Value per Share attributable directly to CBOT Wheat Futures | | | | | | | | | | $ | 5.38 | | | $ | 4.85 | | | $ | 4.58 | | | $ | 4.31 | | | $ | 5.92 | | | $ | 6.19 | | | $ | 6.46 | |
Total Net Asset Value per Share as reported | | | | | | | | | | $ | 5.39 | | | | | | | | | | | | | | | | | | | | | | | | | |
Change in the Net Asset Value per Share | | | | | | | | | | | | | | $ | (0.54 | ) | | $ | (0.81 | ) | | $ | (1.08 | ) | | $ | 0.54 | | | $ | 0.81 | | | $ | 1.08 | |
| | | | | | | | | | | | | | | | | | | | | | | | | | | | | | | | | | | | | |
Percent Change in the Net Asset Value per Share | | | | | | | | | | | | | | | -10.00 | % | | | -15.00 | % | | | -20.00 | % | | | 10.00 | % | | | 15.00 | % | | | 20.00 | % |
TAGS:
| | | March 31, 2024 as Reported | | | 10% Decrease | | | 15% Decrease | | | 20% Decrease | | | 10% Increase | | | 15% Increase | | | 20% Increase | |
Holdings as of March 31, 2024 | | Number of Shares Held | | | Closing NAV | | | Fair Value | | | Fair Value | | | Fair Value | | | Fair Value | | | Fair Value | | | Fair Value | | | Fair Value | |
Teucrium Corn Fund | | | 181,115 | | | $ | 20.2157 | | | $ | 3,661,367 | | | $ | 3,295,230 | | | $ | 3,112,162 | | | $ | 2,929,093 | | | $ | 4,027,503 | | | $ | 4,210,571 | | | $ | 4,393,640 | |
Teucrium Soybean Fund | | | 142,076 | | | $ | 25.1605 | | | $ | 3,574,703 | | | $ | 3,217,233 | | | $ | 3,038,498 | | | $ | 2,859,763 | | | $ | 3,932,174 | | | $ | 4,110,909 | | | $ | 4,289,644 | |
Teucrium Wheat Fund | | | 682,062 | | | $ | 5.3859 | | | $ | 3,673,518 | | | $ | 3,306,166 | | | $ | 3,122,490 | | | $ | 2,938,814 | | | $ | 4,040,870 | | | $ | 4,224,545 | | | $ | 4,408,221 | |
Teucrium Sugar Fund | | | 267,233 | | | $ | 13.4932 | | | $ | 3,605,828 | | | $ | 3,245,245 | | | $ | 3,064,954 | | | $ | 2,884,663 | | | $ | 3,966,411 | | | $ | 4,146,703 | | | $ | 4,326,994 | |
Total value of shares of the Underlying Funds | | | | | | | | | | $ | 14,515,416 | | | $ | 13,063,874 | | | $ | 12,338,104 | | | $ | 11,612,333 | | | $ | 15,966,958 | | | $ | 16,692,728 | | | $ | 17,418,499 | |
| | | | | | | | | | | | | | | | | | | | | | | | | | | | | | | | | | | | | |
Shares outstanding | | | | | | | | | | | 512,502 | | | | 512,502 | | | | 512,502 | | | | 512,502 | | | | 512,502 | | | | 512,502 | | | | 512,502 | |
| | | | | | | | | | | | | | | | | | | | | | | | | | | | | | | | | | | | | |
Net Asset Value per Share attributable directly to shares of the Underlying Funds | | | | | | | | | | $ | 28.32 | | | $ | 25.49 | | | $ | 24.07 | | | $ | 22.66 | | | $ | 31.15 | | | $ | 32.57 | | | $ | 33.99 | |
Total Net Asset Value per Share as reported | | | | | | | | | | $ | 28.35 | | | | | | | | | | | | | | | | | | | | | | | | | |
Change in the Net Asset Value per Share | | | | | | | | | | | | | | $ | (2.83 | ) | | $ | (4.25 | ) | | $ | (5.66 | ) | | $ | 2.83 | | | $ | 4.25 | | | $ | 5.66 | |
| | | | | | | | | | | | | | | | | | | | | | | | | | | | | | | | | | | | | |
Percent Change in the Net Asset Value per Share | | | | | | | | | | | | | | | -9.99 | % | | | -14.99 | % | | | -19.98 | % | | | 9.99 | % | | | 14.99 | % | | | 19.98 | % |
DEFI:
Margin is the minimum amount of funds that must be deposited by a commodity or cryptocurrency interest trader with the trader’s broker to initiate and maintain an open position in futures contracts. A margin deposit acts to assure the trader’s performance of the futures contracts purchased or sold. Futures contracts are customarily bought and sold on initial margin that represents a very small percentage of the aggregate purchase or sales price of the contract. Because of such low margin requirements, price fluctuations occurring in the futures markets may create profits and losses that, in relation to the amount invested, are greater than are customary in other forms of investment or speculation. As discussed below, adverse price changes in the futures contract may result in margin requirements that greatly exceed the initial margin. In addition, the amount of margin required in connection with a particular futures contract is set from time to time by the exchange on which the contract is traded and may be modified from time to time by the exchange during the term of the contract. Brokerage firms, such as the Funds’ clearing brokers, carrying accounts for traders in commodity or cryptocurrency interest contracts generally require higher amounts of margin as a matter of policy to further protect themselves. Over-the-counterAn FCM may impose a financial ceiling on initial margin that could change and become more or less restrictive on a Fund’s activities depending upon a variety of conditions beyond the Sponsor’s control. Over the counter trading generally involves the extension of credit between counterparties, so the counterparties may agree to require the posting of collateral by one or both parties to address credit exposure.
When a trader purchases an option, there is no margin requirement; however, the option premium must be paid in full. When a trader sells an option, on the other hand, he or she is required to deposit margin in an amount determined by the margin requirements established for the underlying interest and, in addition, an amount substantially equal to the current premium for the option. The margin requirements imposed on the selling of options, although adjusted to reflect the probability that out-of-the-money options will not be exercised, can in fact be higher than those imposed in dealing in the futures markets directly. Complicated margin requirements apply to spreads and conversions, which are complex trading strategies in which a trader acquires a mixture of options positions and positions in the underlying interest.
Ongoing or “maintenance” margin requirements are computed each day by a trader’s clearing broker. When the market value of a particular open futures contract changes to a point where the margin on deposit does not satisfy maintenance margin requirements, a margin call is made by the broker. If the margin call is not met within a reasonable time, the broker may close out the trader’s position. With respect to the Funds’ trading, the Funds (and not their shareholders personally) are subject to margin calls.
Finally, many major U.S. exchanges have passed certain cross margining arrangements involving procedures pursuant to which the futures and options positions held in an account would, in the case of some accounts, be aggregated, and margin requirements would be assessed on a portfolio basis, measuring the total risk of the combined positions.
The Dodd-Frank Act requires the CFTC, the SEC and the Office of the Comptroller of the Currency, the Board of Governors of the Federal Reserve System, the Federal Deposit Insurance Corporation, the Farm Credit System and the Federal Housing Finance Agency (collectively, the “Prudential Regulators”) to establish “both initial and variation margin requirements on all swaps that are not cleared by a registered clearing organization” (i.e., uncleared or over-the-counterover the counter swaps). The proposed rules would require swap dealers and major swap participants to collect both variation and initial margin from counterparties known as “financial end-users” such as the Funds or Underlying Funds and in certain circumstances require these swap dealers or major swap participants to post variation margin or initial margin to the Funds or Underlying Funds. The CFTC and the Prudential Regulators finalized these rules in 2016 and compliance became necessary in September 2016.
An “exchange for related position” (“EFRP”) can be used by the Fund as a technique to facilitate the exchanging of a futures hedge position against a creation or redemption order, and thus the Fund may use an EFRP transaction in connection with the creation and redemption of shares. The market specialist/market maker that is the ultimate purchaser or seller of shares in connection with the creation or redemption basket, respectively, agrees to sell or purchase a corresponding offsetting futures position which is then settled on the same business day as a cleared futures transaction by the FCMs. The Fund will become subject to the credit risk of the market specialist/market maker until the EFRP is settled within the business day, which is typically 7 hours or less. The Fund reports all activity related to EFRP transactions under the procedures and guidelines of the CFTC and the exchanges on which the futures are traded.
The Funds, other than TAGS and DEFI, will generally retain cash positions of approximately 95% of total net assets; this balance represents the total net assets less the initial margin requirements discussed above.held by the FCM. DEFI will generally retain cash positions of approximately 70% of total net assets. These cash assets are either: 1) deposited by the Sponsor in demand deposit accounts of financial institutions which are rated in the highest short-term rating category by a nationally recognized statistical rating organization or deemed by the Sponsor to be of comparable quality;investment level quality, 2) held in short-term Treasury Securities; or 3) held in a money-market fund which is deemed to be a cash equivalent under the most recent SEC definition.definition, or 3) held in a cash equivalent with a maturity of 90 days or less that is deemed by the Sponsor to be of investment level quality.
Item 4. Controls and Procedures
Evaluation of Disclosure Controls and Procedures
The Trust and each Fund maintains disclosure controls and procedures that are designed to ensure that information required to be disclosed in the Trust’s periodic reports filed or submitted under the Securities Exchange Act of 1934, as amended (the “Exchange Act”) is recorded, processed, summarized, and reported within the time period specified in the SEC’s rules and forms for the Trust and each Fund thereof.
Management of the Sponsor of the Funds (“Management”), including Dale Riker,Sal Gilbertie, the Sponsor’s Principal Executive Officer and Barbara Riker,Cory Mullen-Rusin, the Sponsor’s Principal Financial Officer, who perform functions equivalent to those of a principal executive officer and principal financial officer of the Trust if the Trust had any officers, have evaluated the effectiveness of the design and operation of the Trust’s and each Fund’s disclosure controls and procedures (as defined in Rule 13a-15(e) or 15d-15(e) of the Securities Exchange Act of 1934, as amended (the “Exchange Act”)) as of the end of the period covered by this report, and, based upon that evaluation, concluded that the Trust’s and each Fund’s disclosure controls and procedures were effective as of the end of such period, to ensure that information the Trust is required to disclose in the reports that it files or submits with the SEC under the Exchange Act is recorded, processed, summarized and reported, within the time periods specified in the SEC’s rules and forms, and to ensure that information required to be disclosed by the Trust in the reports that it files or submits under the Exchange Act is accumulated and communicated to management of the Sponsor, as appropriate, to allow timely decisions regarding required disclosure. The scope of the evaluation of the effectiveness of the design and operation of its disclosure controls and procedures covers the Trust, as well as separately for each Fund that is a series of the Trust.
The certifications of the Chief Executive Officer and Chief Financial Officer are applicable to each Fund individually as well as the Trust as a whole.
Changes in Internal Control over Financial Reporting
There has been no change in the Trust’s or the Funds’ internal controls over the financial reporting (as defined in the Rules 13a-15(f) and 15d-15(f) of the Exchange Act) that occurred during the Trust’s last fiscal quarter that has materially affected, or is reasonably likely to materially affect, the Trust’s or the Funds’ internal control over financial reporting.
PART II. OTHER INFORMATION
Item 1. Legal Proceedings.
None.Litigation and Claims
On September 13, 2018, Barbara Riker, the then-current Chief Financial Officer, Chief Accounting Officer and Chief Compliance Officer of Teucrium Trading, LLC (“Teucrium,” the “Sponsor” or the “Company”), resigned from each of her positions. Ms. Riker was replaced by Cory Mullen-Rusin. On September 17, 2018, Dale Riker, the then-current Chief Executive Officer (“CEO”) of the Sponsor, was removed from his position. He was replaced by Sal Gilbertie. After Mr. Riker was removed as CEO, he pursued a books and records action against Teucrium in the Delaware Court of Chancery, which resulted in a final judgment on May 19, 2020, following a one-day trial.
Mr. Riker later decided to pursue litigation, and on November 24, 2020, he provided Teucrium with a draft complaint that he threatened to file (purportedly because of an order in the books and records action governing the disclosure), and subsequently did file, in New York Supreme Court. See Dale Riker v. Sal Gilbertie, et al., No. 656794-2020 (N.Y. Sup. Ct.). On November 30, 2020, certain officers and members of the Sponsor, along with the Sponsor, filed a Verified Complaint (as amended through the Amended Verified Complaint filed on February 18, 2021) (the “Gilbertie complaint”) in the Delaware Court of Chancery, C.A. No. 2020-1018-LWW (the “Gilbertie case”). The Gilbertie complaint responded to and addressed certain allegations that Mr. Riker had made in his draft complaint. The Gilbertie complaint asserted various claims against Mr. and Ms. Riker.
On December 7, 2020, Mr. Riker filed his New York complaint. On April 22, 2021, the Supreme Court of the State of New York, New York County dismissed Mr. Riker’s case without prejudice to the case being refiled after the conclusion of the Gilbertie case in Delaware Court of Chancery. See Dale Riker, et al. v. Teucrium Trading, LLC et al, Decision + Order on Motions, No. 6567943-2020 (N.Y. Sup. Ct.) (Apr. 22, 2021).
On June 29, 2021, Mr. Riker, individually and derivatively on behalf of the Sponsor and Ms. Riker, filed a new suit in the Delaware Court of Chancery against the Sponsor’s officers and certain of the Sponsor’s members. See Dale Riker v. Salvatore Gilbertie et al., C.A. No. 2021-0561-LWW (the “Riker case”). The Rikers’ complaint was similar, but not identical, to the complaint Mr. Riker had earlier filed in New York, and which had earlier been dismissed by the New York Court. The Court ordered Mr. Riker’s newly filed Delaware action consolidated with the Gilbertie case, and thus the Rikers eventually refiled their remaining claims as counterclaims in the Gilbertie case.
Following various motions, five counts from the Gilbertie complaint and two of Mr. Riker’s counterclaims remained in the Gilbertie case. The first remaining count from the Gilbertie case was a claim brought by Teucrium against Ms. Riker for an alleged breach of her separation agreement that she entered into after resigning from Teucrium. The second count was a claim brought against Mr. Riker for tortious interference with Ms. Riker’s separation agreement. The third count was a claim brought against Ms. Riker seeking a declaration that the releases in her separation agreement are null and void. The fourth count was a claim brought against Mr. Riker for breach of Teucrium’s amended and restated limited liability agreement (the “Operating Agreement”). The fifth count was a claim brought against Mr. Riker for breach of fiduciary duty. The first of Mr. Riker’s remaining counterclaims was a claim against Messrs. Gilbertie and Miller alleging that Mr. Riker’s removal breached the Operating Agreement. The second remaining counterclaim, which Mr. Riker brought against Mr. Gilbertie, sought specific performance of an alleged oral agreement for Mr. Gilbertie to purchase Mr. Riker’s equity in Teucrium.
In August of 2022, both Dale and Barbara Riker demanded advancement of their legal fees and costs related to the litigation, by virtue of their status as former officers of the Company and Dale Riker’s status as a member. The Company denied the demand as to Barbara Riker. As to Dale Riker, the Company informed his counsel that it was willing to advance some of the fees and costs, but not the full amount he had demanded to date. On November 15, 2022, Dale Riker and Barbara Riker filed a verified complaint captioned “Dale Riker and Barbara Riker v. Teucrium Trading, LLC,” C.A. No. 2022-1030-LWW, to obtain advancement of legal fees and costs in connection with the Gilbertie case.
Following briefing and a hearing, on June 13, 2023, the Court of Chancery ruled that the Rikers are entitled to advancement. As a result of that ruling, the Company has paid to the Rikers, as payment of their fees and costs for the advancement action and as advancement pursuant to the Court ruling, a total of $2,132,246, including interest.
On June 23, 2023, Teucrium asked the Court to permit an appeal of the advancement ruling to the Delaware Supreme Court. See Application for Certification of an Interlocutory Appeal, C.A. 2022-1030-LWW. On July 7, 2023, the Court denied Teucrium’s request for interlocutory appeal, finding that the costs of an interlocutory appeal, including the drain on judicial resources from adjudicating piecemeal appeals, would outweigh any benefits. See June 13, 2023 Transcript Ruling and June 13, 2023 Order of the Court of Chancery of the State of Delaware, C.A. No. 2022-1030-LWW. Teucrium subsequently petitioned the Delaware Supreme Court directly to accept an appeal from the ruling of the Court of Chancery, which that Court denied.
On June 22, 2023, Messrs. Gilbertie, Kahler and Miller, Ms. Mullen-Rusin and Teucrium, the plaintiffs in the Gilbertie case, filed a motion asking the Court of Chancery to allow them to voluntarily dismiss all of the plaintiffs’ remaining claims in the litigation. See Plaintiffs’ Motion To Grant Voluntary Dismissal of Claims with Prejudice, C.A. 2022-1030-LWW. On July 7, 2023, the Rikers filed a response, arguing that any dismissal should be subject to various conditions. On September 5, 2023, the Court ruled that it would grant the motion to voluntarily dismiss the plaintiffs’ claims, without any of the conditions that the Rikers had requested. Following the Court’s ruling, Teucrium filed a motion in the advancement action to terminate its advancement obligation in light of the dismissal of the claims against the Rikers. The Rikers opposed the motion. On October 20, 2023, at a hearing on the motion, the Court granted the motion terminating advancement obligations. On October 26, 2023, the Court issued a written implementing order, making clear that advancement obligations terminated on September 5, 2023, the day the Court granted the motion to dismiss claims voluntarily.
The two counterclaims by Mr. Riker discussed above remain.
Except as described above, within the past 10 years of the date of this report, there have been no material administrative, civil or criminal actions against the Sponsor, the Trust or any of the Funds, or any principal or affiliate of any of them. This includes any actions pending, on appeal, concluded, threatened, or otherwise known to them.
Item 1A. Risk Factors applicable to Funds
There have been no material changes to the risk factors previously disclosed in the Trust’s Annual Report on Form 10-K for the fiscal year ended December 31, 2016,2023, filed on March 16, 2017. On October 2, 2017, supplements to the Registration Statements for CORN and WEAT were filed with the SEC.February 29, 2024 other than those noted below:
The commodity interests in which each of the Funds invests, and in which TAGS invests indirectly through the Shares of the Underlying Funds, are referred to as Commodity Interests and for each Fund individually as the specific commodity interests, e.g. Corn Interests.
Risks Applicable to all Funds
There are Risks Related to Fund Structure and Operations of the Funds
Unlike mutual funds, commodity pools and other investment pools that manage their investments so as to realize income and gains for distribution to their investors, a Fund generally does not distribute dividends to Shareholders. You should not invest in a Fund if you will need cash distributionsArising from the Fund to pay taxes on your share of income and gains of the Fund, if any, or for other purposes.
The Sponsor has consulted with legal counsel, accountants and other advisers regarding the formation and operation of the Trust and the Funds. No counsel has been appointed to represent you in connection with the offering of Shares. Accordingly, you should consult with your own legal, tax and financial advisers regarding the desirability of an investment in the Shares.
The Sponsor intends to re-invest any income and realized gains of a Fund in additional Commodity Interests, or Shares of the Underlying Funds in the case of TAGS, rather than distributing cash to Shareholders. Although a Fund does not intend to make cash distributions, the income earned from its investments held directly or posted as margin may reach levels that merit distribution, e.g., at levels where such income is not necessary to support its underlying investments in Commodity Interests, corn for example, and where investors adversely react to being taxed on such income without receiving distributions that could be used to pay such tax. Cash distributions may be made in these and similar instances.Israel-Hamas War
A Fund must pay for all brokerage fees, taxes and other expenses, including licensing fees for the use of intellectual property, registration or other fees paid to the SEC, the Financial Industry Regulatory Authority (“FINRA”), or any other regulatory agency in connection with the offer and sale of subsequent Shares, after its initial registration, and all legal, accounting, printing and other expenses associated therewith. Each Fund also pays the fees and expenses associated with the Trust’s tax accounting and reporting requirements. Each Fund, excluding TAGS, is also contractually obligated to pay a management fee to the Sponsor. Such fees may be waivedrecent report by the Sponsor at its discretion. Accordingly, each Fund must have sufficient total net assets to be able realize in actualityWorld Bank's Commodity Markets Outlook raised concerns about the total expense ratio filed in regulatory filings.
A Fund may terminate at any time, regardless of whether the Fund has incurred losses, subject to the termsglobal commodity markets, indicating that an escalation of the Trust Agreement. For example, the dissolution or resignation of the Sponsor would cause the Trust to terminate unless shareholders holding a majority of the outstanding shares of the Trust elect within 90 days of the event to continue the Trust and appoint a successor Sponsor. In addition, the Sponsor may terminate a Fund if it determines that the Fund’s aggregate net assets in relation to its operating expenses make the continued operation of the Fund unreasonable or imprudent. However, no level of losses will require the Sponsor to terminate a Fund. The Fund’s termination would resultongoing conflict in the liquidationMiddle East, coupled with disruptions caused by Russia's invasion of its investments and the distribution of its remaining assetsUkraine, could lead to the Shareholders on a pro rata basis in accordance with their Shares, and the Fund could incur losses in liquidating its investments in connection with a termination. Termination could also negatively affect the overall maturity and timing of your investment portfolio. Any expenses related to the operation of a Fund would need to be paid by the Fund at the time of termination.
To the extent that investors use a Fund as a means of investing indirectly in a specific Commodity Interest, there is the risk that the changesunforeseen challenges in the price of the Fund’s Shares on the NYSE Arca will not closely track the changes in spot price of that Commodity Interest. Thisworld's commodities, which could happen if the price of Shares traded on the NYSE Arca does not correlate with the Fund’s NAV, if the changes in the Fund’s NAV do not correlate with changes in the Benchmark, or if the changes in the Benchmark do not correlate with changes in the cash or spot price of the specific Commodity Interest. This is a risk because if these correlations are not sufficiently close, then investors may not be able to use the Fund as a cost-effective way to invest indirectly in the specific Commodity Interest, or the underlying specific Commodity Interest in the case of TAGS, or as a hedge against the risk of loss in commodity-related transactions.
Only an Authorized Purchaser may engage in creation or redemption transactions directly with the Funds. The Funds have a limited number of institutions that act as Authorized Purchasers. To the extent that these institutions exit the business or are unable to proceed with creation and/or redemption orders with respect to the Funds and no other Authorized Purchaser is able to step forward to create or redeem Creation Units, Fund shares may trade at a discount to NAV and possibly face trading halts and/or delisting. In addition, a decision by a market maker or lead market maker to step away from activities for a Fund, particularly in times of market stress, could adversely affect liquidity, the spread between the bid and ask quotes for the Fund’s Shares, and potentially the price of the Shares. The Sponsor can make no guarantees that participation by Authorized Purchasers or market makers will continue.
An investment in a Fund faces numerous risks from its shares being traded in the secondary market, any of which may lead to the Fund’s shares trading at a premium or discount to NAV. Although Fund shares are listed for trading on the NYSE Arca, there can be no assurance that an active trading market for such shares will develop or be maintained. Trading in Fund shares may be halted due to market conditions or for reasons that, in the view of the NYSE Arca, make trading in shares inadvisable. There can be no assurance that the requirements of the NYSE Arca necessary to maintain the listing of any Fund will continue to be met or will remain unchanged or that the shares will trade with any volume, or at all. The NAV of each Fund’s shares will generally fluctuate with changes in the market value of the Fund’s portfolio holdings. The market prices of shares will generally fluctuate in accordance with changes in the Fund’s NAV and supply and demand of shares on the NYSE Arca. It cannot be predicted whether a Fund shares will trade below, at or above their NAV. Investors buying or selling Fund shares in the secondary market will pay brokerage commissions or other charges imposed by brokers as determined by that broker. Brokerage commissions are often a fixed amount and may be a significant proportional cost for investors seeking to buy or sell relatively small amounts of shares.
None of the Funds are an investment company subject to the Investment Company Act of 1940. Accordingly, you do not have the protections afforded by that statute, which, for example, requires investment companies to have a board of directors with a majority of disinterested directors and regulates the relationship between the investment company and its investment manager.
The arrangements between clearing brokers and counterparties on the one hand and the Funds on the other generally are terminable by the clearing brokers or counterparty upon notice to the Funds. In addition, the agreements between the Funds and their third-party service providers, such as the Distributor and the Custodian, are generally terminable at specified intervals. Upon termination, the Sponsor may be required to renegotiate or make other arrangements for obtaining similar services if the Funds intend to continue to operate. Comparable services from another party may not be available, or even if available, these services may not be available on the terms as favorable as those of the expired or terminated arrangements.
The Sponsor does not employ trading advisors for the Funds; however, it reserves the right to employ them in the future. The only advisor to the Funds is the Sponsor. A lack of independent trading advisors may be disadvantageous to the Funds because they will not receive the benefit of their independent expertise.
The Sponsor’s trading strategy is quantitative in nature, and it is possible that the Sponsor will make errors in its implementation. The execution of the quantitative strategy is subject to human error, such as incorrect inputs into the Sponsor’s computer systems and incorrect information provided to the Funds’ clearing brokers. In addition, it is possible that a computer or software program may malfunction and cause an error in computation. Any failure, inaccuracy or delay in executing the Funds’ transactions could affect its ability to achieve its investment objective. It could also result in decisions to undertake transactions based on inaccurate or incomplete information. This could cause substantial losses on transactions. The Sponsor is not required to reimburse a Fund for any costs associated with an error in the placement or execution of a tradeadditional volatility in commodity futures interests or shares of the Underlying Funds.contracts.
The Funds’ trading activities depend on the integrity and performance
Table of the computer and communications systems supporting them. Extraordinary transaction volume, hardware or software failure, power or telecommunications failure, a natural disaster or other catastrophe could cause the computer systems to operate at an unacceptably slow speed or even fail. Any significant degradation or failure of the systems that the Sponsor uses to gather and analyze information, enter orders, process data, monitor risk levels and otherwise engage in trading activities may result in substantial losses on transactions, liability to other parties, lost profit opportunities, damages to the Sponsor’s and Funds’ reputations, increased operational expenses and diversion of technical resources.Contents
The development of complex computer and communications systems and new technologies may render the existing computer and communications systems supporting the Funds’ trading activities obsolete. In addition, these computer and communications systems must be compatible with those of third parties, such as the systems of exchanges, clearing brokers and the executing brokers. As a result, if these third parties upgrade their systems, the Sponsor will need to make corresponding upgrades to continue effectively its trading activities. The Funds’ future success may depend on the Funds’ ability to respond to changing technologies on a timely and cost-effective basis.
The Funds depend on the proper and timely function of complex computer and communications systems maintained and operated by the futures exchanges, brokers and other data providers that the Sponsor uses to conduct trading activities. Failure or inadequate performance of any of these systems could adversely affect the Sponsor’s ability to complete transactions, including its ability to close out positions, and result in lost profit opportunities and significant losses on commodity interest transactions. This could have a material adverse effect on revenues and materially reduce the Funds’ available capital. For example, unavailability of price quotations from third parties may make it difficult or impossible for the Sponsor to conduct trading activities so that each Fund will closely track its Benchmark. Unavailability of records from brokerage firms may make it difficult or impossible for the Sponsor to accurately determine which transactions have been executed or the details, including price and time, of any transaction executed. This unavailability of information also may make it difficult or impossible for the Sponsor to reconcile its records of transactions with those of another party or to accomplish settlement of executed transactions.
The operations of the Funds, the exchanges, brokers and counterparties with which the Funds do business, and the markets in which the Funds do business could be severely disrupted in the event of a major terrorist attack, natural disaster, or the outbreak, continuation or expansion of war or other hostilities. Global terrorist attacks, anti-terrorism initiatives, and political unrest continue to fuel this concern.
Failures or breaches of the electronic systems of the Funds, the Sponsor, the Custodian or mutual funds or other financial institutions in which the Funds invest, or the Funds’ other service providers, market makers, Authorized Purchasers, NYSE Arca, exchanges on which Futures Contracts or Other Commodity Interests are traded or cleared, or counterparties have the ability to cause disruptions and negatively impact the Funds’ business operations, potentially resulting in financial losses to a Fund and its shareholders. While the Funds have established business continuity plans and risk management systems seeking to address system breaches or failures, there are inherent limitations in such plans and systems. Furthermore, the Funds cannot control the cyber security plans and systems of the Custodian or mutual funds or other financial institutions in which the Funds invest, or the Funds’ other service providers, market makers, Authorized Purchasers, NYSE Arca, exchanges on which Futures Contracts or Other Commodity Interests are traded or cleared, or counterparties.
The Trust may, in its discretion, suspend the right to redeem Shares of a Fund or postpone the redemption settlement date: (1) for any period during which an applicable exchange is closed other than customary weekend or holiday closing, or trading is suspended or restricted; (2) for any period during which an emergency exists as a result of which delivery, disposal or evaluation of a Fund’s assets is not reasonably practicable; (3) for such other period as the Sponsor determines to be necessary for the protection of Shareholders; (4) if there is a possibility that any or all of the Benchmark Component Futures Contracts of a Fund on the specific exchange where the Fund is traded and from which the NAV of the Fund is calculated will be priced at a daily price limit restriction; or (5) if, in the sole discretion of the Sponsor, the execution of such an order would not be in the best interest of a Fund or its Shareholders. In addition, the Trust will reject a redemption order if the order is not in proper form as described in the agreement with the Authorized Purchaser or if the fulfillment of the order, in the opinion of its counsel, might be unlawful. Any such postponement, suspension or rejection could adversely affect a redeeming Shareholder. For example, the resulting delay may adversely affect the value of the Shareholder’s redemption proceeds if the NAV of a Fund declines during the period of delay. The Trust Agreement provides that the Sponsor and its designees will not be liable for any loss or damage that may result from any such suspension or postponement. A minimum number of baskets and associated Shares are specified for each Fund in its prospectus and in Part I, Item 1 of this document. Once that minimum number of Shares outstanding is reached, there can be no further redemptions until there has been a Creation Basket.
The Intraday Indicative Value (“IIV”) and the Benchmark for each Fund are calculated and disseminated by the NYSE Arca under an agreement between the Sponsor and the NYSE Arca. Additionally, information may be calculated and disseminated under similar agreements between the Sponsor and other third-party entities. Although reasonable efforts are taken to ensure the accuracy of the information disseminated under this agreement, there may, from time to time, be recalculations of previously released information.
Third parties may assert that the Sponsor has infringed or otherwise violated their intellectual property rights. Third parties may independently develop business methods, trademarks or proprietary software and other technology similar to that of the Sponsor and claim that the Sponsor has violated their intellectual property rights, including their copyrights, trademark rights, trade names, trade secrets and patent rights. As a result, the Sponsor may have to litigate in the future to determine the validity and scope of other parties’ proprietary rights, or defend itself against claims that it has infringed or otherwise violated other parties’ rights. Any litigation of this type, even if the Sponsor is successful and regardless of the merits, may result in significant costs, may divert resources from the Fund, or may require the Sponsor to change its proprietary software and other technology or enter into royalty or licensing agreements. The Sponsor has a patent on certain business methods and procedures used with respect to the Funds. The Sponsor utilizes certain proprietary software. Any unauthorized use of such proprietary software, business methods and/or procedures could adversely affect the competitive advantage of the Sponsor or the Funds and/or cause the Sponsor to take legal action to protect its rights.
In managing and directing the day-to-day activities and affairs of these Funds, the Sponsor relies almost entirely on a small number of individuals, including Mr. Sal Gilbertie, Mr. Dale Riker, Mr. Steve Kahler and Ms. Barbara Riker. If Mr. Gilbertie, Mr. Riker, Mr. Kahler or Ms. Riker were to leave or be unable to carry out their present responsibilities, it may have an adverse effect on the management of the Funds. To the extent that the Sponsor establishes additional commodity pools, even greater demands will be placed on these individuals.
The Sponsor was formed for the purpose of managing the Trust, including all the Funds, and any other series of the Trust that may be formed in the future, and has been provided with capital primarily by its principals and a small number of outside investors. If the Sponsor operates at a loss for an extended period, its capital will be depleted, and it may be unable to obtain additional financing necessary to continue its operations. If the Sponsor were unable to continue to provide services to these Funds, the Funds would be terminated if a replacement Sponsor could not be found.
You cannot be assured that the Sponsor will be willing or able to continue to service each Fund for any length of time. The Sponsor was formed for the purpose of sponsoring the Funds and other commodity pools, and has limited financial resources and no significant source of income apart from its management fees from such commodity pools to support its continued service for each Fund. If the Sponsor discontinues its activities on behalf of a Fund, the Fund may be adversely affected. If the Sponsor’s registrations with the CFTC or memberships in the NFA were revoked or suspended, the Sponsor would no longer be able to provide services to the Funds.
The Sponsor May Have Conflicts of Interest
The structure and operation of the Funds may involve conflicts of interest. For example, a conflict may arise because the Sponsor and its principals and affiliates may trade for themselves. In addition, the Sponsor has sole current authority to manage the investments and operations, and the interests of the Sponsor may conflict with the Shareholders’ best interests, including the authority of the Sponsor to allocate expenses to and between the Funds.
The Performance of Each Fund May Not Correlate with the Applicable Benchmark
Each Fund has a limited operating history, so there is limited performance history to serve as a basis for you to evaluate an investment in the Fund.
If a Fund is required to sell Treasury Securities or cash equivalents at a price lower than the price at which they were acquired, the Fund will experience a loss. This loss may adversely impact the price of the Shares and may decrease the correlation between the price of the Shares, the Benchmark, and the spot price of the specific commodity interest or the commodity interests of the Underlying Funds in the case of TAGS. The value of Treasury Securities and other debt securities generally moves inversely with movements in interest rates. The prices of longer maturity securities are subject to greater market fluctuations as a result of changes in interest rates. While the short-term nature of a Fund’s investments in Treasury Securities and cash equivalents should minimize the interest rate risk to which the Fund is subject, it is possible that the Treasury Securities and cash equivalents held by the Fund will decline in value.
The Sponsor’s trading system is quantitative in nature, and it is possible that the Sponsor may make errors. In addition, it is possible that a computer or software program may malfunction and cause an error in computation.
Increases in assets under management may affect trading decisions. While all of the Funds’ assets are currently at manageable levels, the Sponsor does not intend to limit the amount of any Fund’s assets. The more assets the Sponsor manages, the more difficult it may be for it to trade profitably because of the difficulty of trading larger positions without adversely affecting prices and performance and of managing risk associated with larger positions.
Each Fund seeks to have the changes in its Shares’ NAV in percentage terms track changes in the Benchmark in percentage terms, rather than profit from speculative trading of the specific Commodity Interests, or the commodity interests of the Underlying Funds in the case of TAGS.
The Sponsor therefore endeavors to manage each Fund so that the Fund’s assets are, unlike those of many other commodity pools, not leveraged (i.e., so that the aggregate amount of the Fund’s exposure to losses from its investments in specific Commodity Interests at any time will not exceed the value of the Fund’s assets). There is no assurance that the Sponsor will successfully implement this investment strategy. If the Sponsor permits a Fund to become leveraged, you could lose all or substantially all of your investment if the Fund’s trading positions suddenly turns unprofitable. These movements in price may be the result of factors outside of the Sponsor’s control and may not be anticipated by the Sponsor.
The Sponsor cannot predict to what extent the performance of the commodity interest will or will not correlate to the performance of other broader asset classes such as stocks and bonds. If the performance of a specific Fund were to move more directly with the financial markets, an investment in the Fund may provide you little or no diversification benefits. Thus, in a declining market, the Fund may have no gains to offset your losses from other investments, and you may suffer losses on your investment in the Fund at the same time you may incur losses with respect to other asset classes. Variables such as drought, floods, weather, embargoes, tariffs and other political events may have a larger impact on commodity and Commodity Interests prices than on traditional securities and broader financial markets. These additional variables may create additional investment risks that subject a Fund’s investments to greater volatility than investments in traditional securities. Lower correlation should not be confused with negative correlation, where the performance of two asset classes would be opposite of each other. There is no historic evidence that the spot price of a specific commodity, corn, for example, and prices of other financial assets, such as stocks and bonds, are negatively correlated. In the absence of negative correlation, a Fund cannot be expected to be automatically profitable during unfavorable periods for the stock market, or vice versa.
Under the Trust Agreement, the Trustee and the Sponsor are not liable, and have the right to be indemnified, for any liability or expense incurred absent gross negligence or willful misconduct on the part of the Trustee or Sponsor, as the case may be. That means the Sponsor may require the assets of a Fund to be sold in order to cover losses or liability suffered by the Sponsor or by the Trustee. Any sale of that kind would reduce the NAV of the Fund and the value of its Shares.
The Shares of a Fund are limited liability investments; Shareholders may not lose more than the amount that they invest plus any profits recognized on their investment. However, Shareholders could be required, as a matter of bankruptcy law, to return to the estate of the Fund any distribution they received at a time when the Fund was in fact insolvent or in violation of its Trust Agreement.
The price relationship between the near month Commodity Futures Contract to expire and the Benchmark Component Futures Contracts for each Fund, or the Underlying Funds in the case of TAGS, will vary and may impact both a Fund’s total return over time and the degree to which such total return tracks the total return of the specific commodity price indices. In cases in which the near month contract’s price is lower than later-expiring contracts’ prices (a situation known as “contango” in the futures markets), then absent the impact of the overall movement in the commodity specific prices the value of the Benchmark Component Futures Contracts would tend to decline as they approach expiration which could cause the Benchmark Component Futures Contracts, and therefore the Fund’s total return, to track lower. In cases in which the near month contract’s price is higher than later-expiring contracts’ prices (a situation known as “backwardation” in the futures markets), then absent the impact of the overall movement in commodity specific prices, the value of the Benchmark Component Futures Contracts would tend to rise as they approach expiration.
While it is expected that the trading prices of the Shares will fluctuate in accordance with the changes in a Fund’s NAV, the prices of Shares may also be influenced by various market factors, including but not limited to, the number of shares of the Fund outstanding and the liquidity of the underlying Commodity Interests. There is no guarantee that the Shares will not trade at appreciable discounts from, and/or premiums to, the Fund’s NAV. This could cause the changes in the price of the Shares to substantially vary from the changes in the spot price of the underlying commodity, even if a Fund’s NAV was closely tracking movements in the spot price of that commodity. If this occurs, you may incur a partial or complete loss of your investment.
Investors, including those who directly participate in the specific commodity market, may choose to use a Fund as a vehicle to hedge against the risk of loss, and there are risks involved in hedging activities. While hedging can provide protection against an adverse movement in market prices, it can also preclude a hedger’s opportunity to benefit from a favorable market movement.
While it is not the current intention of the Funds to take physical delivery of any Commodity under its Commodity Interests, Commodity Futures Contracts are traditionally physically-deliverable contracts, and, unless a position was traded out of, it is possible to take or make delivery under these and some Other Commodity Interests. Storage costs associated with purchasing the specific commodity could result in costs and other liabilities that could impact the value of the Commodity Futures Contracts or certain Other Commodity Interests. Storage costs include the time value of money invested in the physical commodity plus the actual costs of storing the commodity less any benefits from ownership that are not obtained by the holder of a futures contract. In general, Commodity Futures Contracts have a one-month delay for contract delivery and the pricing of back month contracts (the back month is any future delivery month other than the spot month) includes storage costs. To the extent that these storage costs change for the commodity while a Fund holds the Commodity Interests, the value of the Commodity Interests, and therefore the Fund’s NAV, may change as well.
The design of each Fund’s Benchmark is such that the Benchmark Component Futures Contracts change throughout the year, and the Fund’s investments must be rolled periodically to reflect the changing composition of the Benchmark. For example, when the second-to-expire Commodity Futures Contract becomes the first-to-expire contract, such contract will no longer be a Benchmark Component Futures Contract and the Fund’s position in it will no longer be consistent with tracking the Benchmark. In the event of a commodity futures market where near-to-expire contracts trade at a higher price than longer-to-expire contracts, a situation referred to as “backwardation,” then absent the impact of the overall movement in the specific commodity prices of the Fund, the value of the Benchmark Component Futures Contracts would tend to rise as they approach expiration. As a result, a Fund may benefit because it would be selling more expensive contracts and buying less expensive ones on an ongoing basis. Conversely, using corn as an example, in the event of a corn futures market where near-to-expire contracts trade at a lower price than longer-to-expire contracts, a situation referred to as “contango,” then absent the impact of the overall movement in corn prices the value of the Benchmark Component Futures Contracts would tend to decline as they approach expiration. As a result, the Fund’s total return may be lower than might otherwise be the case because it would be selling less expensive contracts and buying more expensive ones. The impact of backwardation and contango may lead the total return of a Fund to vary significantly from the total return of other price references, such as the spot price of the specific commodity. In the event of a prolonged period of contango, and absent the impact of rising or falling specific commodity prices, this could have a significant negative impact on a Fund’s NAV and total return.
The Sponsor may use spreads and straddles as part of its overall trading strategy to closely follow the Benchmark. There is a risk that a Fund’s NAV may not closely track the change in its Benchmark. Spreads combine simultaneous long and short positions in related futures contracts that differ by commodity, by market or by delivery month (for example, long April, short November). Spreads gain or lose value as a result of relative changes in price between the long and short positions. Spreads often reduce risk to investors because the contracts tend to move up or down together. However, both legs of the spread could move against an investor simultaneously, in which case the spread would lose value. Certain types of spreads may face unlimited risk, e.g., because the price of a futures contract underlying a short position can increase by an unlimited amount and the investor would have to take delivery or offset at that price. A commodity straddle takes both long and short option position in the same commodity in the same market and delivery month simultaneously. The buyer of a straddle profits if either the long or the short leg of the straddle moves further than the combined cost of both options. The seller of the straddle profits if both the long and short positions do not trade beyond a range equal to the combined premium for selling both options. If the Sponsor were to utilize a spread or straddle position and the position performed differently than expected, the results could impact that Fund’s tracking error. This could affect the Fund’s investment objective of having its NAV closely track the Benchmark. Additionally, a loss on the position would negatively impact the Fund’s absolute return.
Position limits and daily price fluctuation limits set by the CFTC and the exchanges have the potential to cause tracking error, which could cause the price of Shares of the Fund to substantially vary from the Benchmark and prevent you from being able to effectively use the Fund as a way to hedge against underlying commodity-related losses or as a way to indirectly invest in the underlying commodity.
The Trust Structure and the Trust Agreement Provide Limited Shareholder Rights
You will have no rights to participate in the management of any of the Funds and will have to rely on the duties and judgment of the Sponsor to manage the Funds.
As interests in separate series of a Delaware statutory trust, the Shares do not involve the rights normally associated with the ownership of shares of a corporation (including, for example, the right to bring shareholder oppression and derivative actions). In addition, the Shares have limited voting and distribution rights (for example, Shareholders do not have the right to elect directors, as the Trust does not have a board of directors, and generally will not receive regular distributions of the net income and capital gains earned by the Fund). The Funds are also not subject to certain investor protection provisions of the Sarbanes Oxley Act of 2002 and the NYSE Arca governance rules (for example, audit committee requirements).
Each Fund is a series of a Delaware statutory trust and not itself a legal entity separate from the other Funds. The Delaware Statutory Trust Act provides that if certain provisions are included in the formation and governing documents of a statutory trust organized in series and if separate and distinct records are maintained for any series and the assets associated with that series are held in separate and distinct records and are accounted for in such separate and distinct records separately from the other assets of the statutory trust, or any series thereof, then the debts, liabilities, obligations and expenses incurred by a particular series are enforceable against the assets of such series only, and not against the assets of the statutory trust generally or any other series thereof. Conversely, none of the debts, liabilities, obligations and expenses incurred with respect to any other series thereof is enforceable against the assets of such series. The Sponsor is not aware of any court case that has interpreted this inter-series limitation on liability or provided any guidance as to what is required for compliance. The Sponsor intends to maintain separate and distinct records for each Fund and account for each Fund separately from any other Trust series, but it is possible a court could conclude that the methods used do not satisfy the Delaware Statutory Trust Act, which would potentially expose assets in any Fund to the liabilities of one or more of the Funds and/or any other Trust series created in the future.
Neither the Sponsor nor the Trustee is obligated to, although each may, in its respective discretion, prosecute any action, suit or other proceeding in respect of any Fund property. The Trust Agreement does not confer upon Shareholders the right to prosecute any such action, suit or other proceeding.
Rapidly Changing Regulation May Adversely Affect the Ability of the Funds to Meet Their Investment Objectives
The regulation of futures markets, futures contracts, and futures exchanges has historically been comprehensive. The CFTC and the exchanges are authorized to take extraordinary actions in the event of a market emergency including, for example, the retroactive implementation of speculative position limits, increased margin requirements, the establishment of daily price limits and the suspension of trading on an exchange or a trading facility.
The regulation of commodity interest transactions in the United States is a rapidly changing area of law and is subject to ongoing modification by governmental and judicial action. Subsequent to the enactment of the Dodd-Frank Act in 2010, swap agreements became fully regulated by the CFTC under the amended Commodity Exchange Act and the CFTC’s regulations thereunder. Considerable regulatory attention has been focused on non-traditional investment pools that are publicly distributed in the United States and that use trading in futures and options as an investment strategy and not for hedging or price discovery purposes, therefore altering traditional participation in futures and swaps markets. As the Dodd-Frank Act continues to be implemented by the CFTC and the SEC, there is a possibility of future regulatory changes within the United States altering, perhaps to a material extent, the nature of an investment in the Funds, or the ability of a Fund to continue to implement its investment strategy. In addition, various national governments outside of the United States have expressed concern regarding the disruptive effects of speculative trading in the commodities markets and the need to regulate the derivatives markets in general. The effect of any future regulatory change on the Funds is impossible to predict but could be substantial and adverse.
Further, President Donald J. Trump has promised and issued several executive orders intended to relieve the financial burden created by the Dodd-Frank Act, although these executive orders only set forth several general principles to be followed by the federal agencies and do not mandate the wholesale repeal of the Dodd-Frank Act. The scope of the effect that passage of new financial reform legislation could have on U.S. securities, derivatives and commodities markets is not clear at this time because each federal regulatory agency would have to promulgate new regulations to implement such legislation. These regulatory changes may affect the continued operation of the Funds. For additional information regarding recent regulatory developments that may impact the Funds or the Trust, refer to the section entitled “Regulatory Considerations” section of this document.
There Is No Assurance that There Will Be a Liquid Market for the Shares of the Funds or the Funds’ Underlying Investments, which May Mean that Shareholders May Not be Able to Sell Their Shares at a Market Price Relatively Close to the NAV
If a substantial number of requests for redemption of Redemption Baskets are received by a Fund during a relatively short period of time, the Fund may not be able to satisfy the requests from the Fund’s assets not committed to trading. As a consequence, it could be necessary to liquidate the Fund’s trading positions before the time that its trading strategies would otherwise call for liquidation.
A portion of a Fund’s investments could be illiquid, which could cause large losses to investors at any time or from time to time.
A Fund may not always be able to liquidate its positions in its investments at the desired price. As to futures contracts, it may be difficult to execute a trade at a specific price when there is a relatively small volume of buy and sell orders in a market. Limits imposed by futures exchanges or other regulatory organizations, such as accountability levels, position limits and price fluctuation limits, may contribute to a lack of liquidity with respect to some exchange-traded commodity Interests. In addition, over-the-counter contracts may be illiquid because they are contracts between two parties and generally may not be transferred by one party to a third party without the counterparty’s consent. Conversely, a counterparty may give its consent, but the Fund still may not be able to transfer an over-the-counter Commodity Interest to a third party due to concerns regarding the counterparty’s credit risk.
The exchanges set daily price fluctuation limits on futures contracts. The daily price fluctuation limit establishes the maximum amount that the price of futures contracts may vary either up or down from the previous day’s settlement price. Once the daily price fluctuation limit has been reached in a particular futures contract, no trades may be made at a price beyond that limit.
On March 12, 2014, the CME announced that, subject to CFTC approval, it would replace its fixed price fluctuation limits with variable price limits. The change was approved and went into effect May 1, 2014. Using corn as an example, this change amended Appendix A, Chapter 10 (Corn Futures), Section 10102.D (Trading Specifications – Daily Price Limits) to read as follows:
Daily price limits for Corn futures are reset every six months. The first reset date would be the first trading day in May based on the following: Daily settlement prices are collected for the nearest July contract over 45 consecutive trading days before and on the business day prior to April 16th. The average price is calculated based on the collected settlement prices and then multiplied by seven percent. The resulting number rounded to the nearest 5 cents per bushel, or 20 cents per bushel, whichever is higher will be the new initial price limits for Corn futures and will become effective on the first trading day in May and will remain in effect through the last trading day in October.
The second reset date would be the first trading day in November based on the following: Daily settlement prices are collected for the nearest December contract over 45 consecutive trading days before and on the business day prior to October 16th. The average price is calculated based on the collected settlement prices and then multiplied by seven percent. The resulting number, rounded to the nearest 5 cents per bushel, or 20 cents per bushel, whichever is higher, will be the new initial price limits for Corn futures and will become effective on the first trading day in November and will remain in effect through the last trading day in next April.
There shall be no trading in Corn futures at a price more than the initial price limit above or below the previous day’s settlement price. Should two or more Corn futures contract months within the first five listed non-spot contracts (or the remaining contract month in a crop year, which is the September contract) settle at limit, the daily price limits for all contract months shall increase by 50 percent the next business day, rounded up to the nearest 5 cents per bushel. If no Corn futures contract month settles at the expanded limit the next business day, daily price limits for all contract months shall revert back to the initial price limit the following business day. There shall be no price limits on the current month contract on or after the second business day preceding the first day of the delivery month.
A market disruption, such as a foreign government taking political actions that disrupt the market in its currency, its commodity production or exports, or in another major export, can also make it difficult to liquidate a position. Unexpected market illiquidity may cause major losses to investors at any time or from time to time. In addition, no Fund intends at this time to establish a credit facility, which would provide an additional source of liquidity, but instead will rely only on the Treasury Securities, cash and/or cash equivalents that it holds to meet its liquidity needs. The anticipated large value of the positions in a specific Commodity Interest that the Sponsor will acquire or enter into for a Fund increases the risk of illiquidity. Because Commodity Interests may be illiquid, a Fund’s holdings may be more difficult to liquidate at favorable prices in periods of illiquid markets and losses may be incurred during the period in which positions are being liquidated.
A Fund may invest in Other Commodity Interests. To the extent that these Other Commodity Interests are contracts individually negotiated between their parties, they may not be as liquid as Commodity Futures Contracts and will expose the Fund to credit risk that its counterparty may not be able to satisfy its obligations to the Fund.
The changing nature of the participants in the commodity specific market will influence whether futures prices are above or below the expected future spot price. Producers of the specific commodity will typically seek to hedge against falling commodity prices by selling Commodity Futures Contracts. Therefore, if commodity producers become the predominant hedgers in the futures market, prices of Commodity Futures Contracts will typically be below expected future spot prices. Conversely, if the predominant hedgers in the futures market are the purchasers of the commodity, who purchase Commodity Futures Contracts to hedge against a rise in prices, prices of the Commodity Futures Contracts will likely be higher than expected future spot prices. This can have significant implications for a Fund when it is time to sell a Commodity Futures Contract that is no longer a Benchmark Component Futures Contract and purchase a new Commodity Futures Contract or to sell a Commodity Futures Contract to meet redemption requests. A Fund may invest in Other Commodity Interests. To the extent that these Other Commodity Interests are contracts individually negotiated between their parties, they may not be as liquid as Commodity Futures Contracts and will expose the Fund to credit risk that its counterparty may not be able to satisfy its obligations to the Fund.
A Fund’s NAV includes, in part, any unrealized profits or losses on open swap agreements, futures or forward contracts. Under normal circumstances, the NAV reflects the quoted exchange settlement price of open futures contracts on the date when the NAV is being calculated. In instances when the quoted settlement price of a futures contract traded on an exchange may not be reflective of fair value based on market condition, generally due to the operation of daily limits or other rules of the exchange or otherwise, the NAV may not reflect the fair value of open future contracts on such date. For purposes of financial statements and reports, the Sponsor will recalculate the NAV where necessary to reflect the “fair value” of a Futures Contract when the Futures Contract closes at its price fluctuation limit for the day.
In the event that one or more Authorized Purchasers that are actively involved in purchasing and selling Shares cease to be so involved, the liquidity of the Shares will likely decrease, which could adversely affect the market price of the Shares and result in your incurring a loss on your investment. In addition, a decision by a market maker or lead market maker to cease activities for the Fund could adversely affect liquidity, the spread between the bid and ask quotes, and potentially the price of the Shares. The Sponsor can make no guarantees that participation by Authorized Purchasers or market makers will continue.
If a minimum number of Shares is outstanding for a Fund, market makers may be less willing to purchase Shares of that Fund in the secondary market which may limit your ability to sell Shares. There are a minimum number of baskets and associated Shares specified for each Fund. Once the minimum number of baskets is reached, there can be no more redemptions by an Authorized Purchaser of that Fund until there has been a Creation Basket. In such case, market makers may be less willing to purchase Shares of that Fund from investors in the secondary market, which may in turn limit the ability of Shareholders of that Fund to sell their Shares in the secondary market.
Trading in Shares of a Fund may be halted due to market conditions or, in light of NYSE Arca rules and procedures, for reasons that, in the view of the NYSE Arca, make trading in Shares inadvisable. In addition, trading is subject to trading halts caused by extraordinary market volatility pursuant to “circuit breaker” rules that require trading to be halted for a specified period based on a specified market decline. There can be no assurance that the requirements necessary to maintain the listing of the Shares will continue to be met or will remain unchanged. A Fund will be terminated if its Shares are delisted.
There is Credit Risk Associated with the Operation of the Funds, Service Providers and Counter-Parties Which May Cause an Investment Loss
For all of the Funds except for TAGS, the majority of each Fund’s assets are held in cash and short-term cash equivalents with the Custodian or with one or more alternate financial institutions unrelated to the Custodian (each, a “Financial Institution”). Any cash or cash equivalents invested by a Fund will be placed by the Sponsor in a Financial Institution rated by a nationally recognized statistical rating organization and will be deemed by the Sponsor to be of investment quality.
The insolvency of the Custodian or any Financial Institution in which funds are deposited could result in a complete loss of a Fund’s assets held by the Custodian or the Financial Institution, which, at any given time, would likely comprise a substantial portion of a Fund’s total assets. Assets deposited with the Custodian or a Financial Institution will generally exceed federally insured limits. For TAGS, the vast majority of the Fund’s assets are held in Shares of the Underlying Funds. The failure or insolvency of the Custodian or the Financial Institution could impact the ability to access in a timely manner TAGS’ assets held by the Custodian.
Under CFTC regulations, a clearing broker with respect to a Fund’s exchange-traded Commodity Interests must maintain customers’ assets in a bulk segregated account. If a clearing broker fails to do so, or is unable to satisfy a substantial deficit in a customer account, its other customers may be subject to risk of a substantial loss of their funds in the event of that clearing broker’s bankruptcy. In that event, the clearing broker’s customers, such as a Fund, are entitled to recover, even in respect of property specifically traceable to them, only a proportional share of all property available for distribution to all of that clearing broker’s customers. A Fund also may be subject to the risk of the failure of, or delay in performance by, any exchanges and markets and their clearing organizations, if any, on which Commodity Interests are traded. From time to time, the clearing brokers may be subject to legal or regulatory proceedings in the ordinary course of their business. A clearing broker’s involvement in costly or time-consuming legal proceedings may divert financial resources or personnel away from the clearing broker’s trading operations, which could impair the clearing broker’s ability to successfully execute and clear a Fund’s trades. For additional information regarding recent regulatory developments that may impact the Funds or the Trust, refer to the section entitled “Regulatory Considerations” section of this document.
Commodity pools’ trading positions in futures contracts or other commodity interests are typically required to be secured by the deposit of margin funds that represent only a small percentage of a futures contract’s (or other commodity interest’s) entire market value. This feature permits commodity pools to “leverage” their assets by purchasing or selling futures contracts (or other commodity interests) with an aggregate notional amount in excess of the commodity pool’s assets. While this leverage can increase a pool’s profits, relatively small adverse movements in the price of a pool’s commodity interests can cause significant losses to the pool. While the Sponsor does not intend to leverage the Funds’ assets, it is not prohibited from doing so under the Trust Agreement. If the Sponsor were to cause or permit a Fund to become leveraged, you could lose all or substantially all of your investment if the Fund’s trading positions suddenly turns unprofitable.
An “exchange for related position” (“EFRP”) can be used by the Fund as a technique to facilitate the exchanging of a futures hedge position against a creation or redemption order, and thus the Fund may use an EFRP transaction in connection with the creation and redemption of shares. The market specialist/market maker that is the ultimate purchaser or seller of shares in connection with the creation or redemption basket, respectively, agrees to sell or purchase a corresponding offsetting futures position which is then settled on the same business day as a cleared futures transaction by the FCMs. The Fund will become subject to the credit risk of the market specialist/market maker until the EFRP is settled or terminated. The Fund reports all activity related to EFRP transactions under the procedures and guidelines of the CFTC and the exchanges on which the futures are traded. EFRPs are subject to specific rules of the CME and CFTC guidance. It is likely that EFRP mechanisms will be subject to changes in the future which may make it uneconomical or impossible from the regulatory perspective to utilize this mechanism by the Funds.
A portion of the Fund’s assets may be used to trade over-the-counter Commodity Interests, such as forward contracts or swaps. Currently, over-the-counter contracts are typically traded on a principal-to-principal non-cleared basis through dealer markets that are dominated by major money center and investment banks and other institutions and that prior to the passage of the Dodd-Frank Act had been essentially unregulated by the CFTC, although this is an area of pending, substantial regulatory change. The markets for over-the-counter contracts will continue to rely upon the integrity of market participants in lieu of the additional regulation imposed by the CFTC on participants in the futures markets. To date, the forward markets have been largely unregulated, except for anti-manipulation and anti-fraud prohibitions, forward contracts have been executed bi-laterally and, in general historically, forward contracts have not been cleared or guaranteed by a third party. On November 16, 2012, the Secretary of the Treasury issued a final determination that exempts both foreign exchange swaps and foreign exchange forwards from the definition of “swap” and, by extension, additional regulatory requirements (such as clearing and margin). The final determination does not extend to other FX derivatives, such as FX options, certain currency swaps, and non-deliverable forwards. While the Dodd-Frank Act and certain regulations adopted thereunder are intended to provide additional protections to participants in the over-the-counter market, the lack of regulation in these markets could expose the Fund in certain circumstances to significant losses in the event of trading abuses or financial failure by participants. While increased regulation of over-the-counter Commodity Interests is likely to result from changes that are required to be effectuated by the Dodd-Frank Act, there is no guarantee that such increased regulation will be effective to reduce these risks.
Each Fund faces the risk of non-performance by the counterparties to the over-the-counter contracts. Unlike in futures contracts, the counterparty to these contracts is generally a single bank or other financial institution, rather than a clearing organization backed by a group of financial institutions. As a result, there will be greater counterparty credit risk in these transactions. A counterparty may not be able to meet its obligations to a Fund, in which case the Fund could suffer significant losses on these contracts. If a counterparty becomes bankrupt or otherwise fails to perform its obligations due to financial difficulties, a Fund may experience significant delays in obtaining any recovery in a bankruptcy or other reorganization proceeding. During any such period, the Fund may have difficulty in determining the value of its contracts with the counterparty, which in turn could result in the overstatement or understatement of the Fund’s NAV. The Fund may eventually obtain only limited recovery or no recovery in such circumstances.
Over-the-counter contracts may have terms that make them less marketable than Futures Contracts. Over-the-counter contracts are less marketable because they are not traded on an exchange, do not have uniform terms and conditions, and are entered into based upon the creditworthiness of the parties and the availability of credit support, such as collateral, and in general, they are not transferable without the consent of the counterparty. These conditions make such contracts less liquid than standardized futures contracts traded on a commodities exchange and diminish the ability to realize the full value of such contracts. In addition, even if collateral is used to reduce counterparty credit risk, sudden changes in the value of over-the-counter transactions may leave a party open to financial risk due to a counterparty default since the collateral held may not cover a party’s exposure on the transaction in such situations. In general, valuing OTC derivatives is less certain than valuing actively traded financial instruments such as exchange traded futures contracts and securities because the price and terms on which such OTC derivatives are entered into or can be terminated are individually negotiated, and those prices and terms may not reflect the best price or terms available from other sources. In addition, while market makers and dealers generally quote indicative prices or terms for entering into or terminating OTC contracts, they typically are not contractually obligated to do so, particularly if they are not a party to the transaction. As a result, it may be difficult to obtain an independent value for an outstanding OTC derivatives transaction.
There are Risks Associated with Trading in International Markets
A significant portion of the Futures Contracts entered into by the Funds is traded on United States exchanges. However, a portion of the Funds’ trades may take place on markets or exchanges outside the United States. Some non-U.S. markets present risks because they are not subject to the same degree of regulation as their U.S. counterparts. None of the CFTC, NFA, or any domestic exchange regulates activities of any foreign boards of trade or exchanges, including the execution, delivery and clearing of transactions, has the power to compel enforcement of the rules of a foreign board of trade or exchange or of any applicable non-U.S. laws. Similarly, the rights of market participants, such as the Funds, in the event of the insolvency or bankruptcy of a non-U.S. market or broker are also likely to be more limited than in the case of U.S. markets or brokers. As a result, in these markets, the Funds have less legal and regulatory protection than it does when they trade domestically. Currently the Funds do not place trades on any markets or exchanges outside of the United States and do not anticipate doing so in the foreseeable future. In some of these non-U.S. markets, the performance on a futures contract is the responsibility of the counterparty and is not backed by an exchange or clearing corporation and therefore exposes the Funds to credit risk. Additionally, trading on non-U.S. exchanges is subject to the risks presented by exchange controls, expropriation, increased tax burdens and exposure to local economic declines and political instability. An adverse development with respect to any of these variables could reduce the profit or increase the loss earned on trades in the affected international markets.
The price of any non-U.S. Commodity Interest and, therefore, the potential profit and loss on such investment, may be affected by any variance in the foreign exchange rate between the time the order is placed and the time it is liquidated, offset or exercised. As a result, changes in the value of the local currency relative to the U.S. dollar may cause losses to a Fund even if the contract is profitable. The Funds invest primarily in Commodity Interests that are traded or sold in the United States. However, a portion of the trades for a Fund may take place in markets and on exchanges outside the United States. Some non-U.S. markets present risks because they are not subject to the same degree of regulation as their U.S. counterparts. In some of these non-U.S. markets, the performance on a contract is the responsibility of the counterparty and is not backed by an exchange or clearing corporation and therefore exposes a Fund to credit risk. Trading in non-U.S. markets also leaves a Fund susceptible to fluctuations in the value of the local currency against the U.S. dollar.
The CFTC’s implementation of its regulations under the Dodd-Frank Act may further affect the ability of the Funds to enter into foreign exchange contracts and to hedge its exposure to foreign exchange loss.
Some non-U.S. exchanges also may be in a more developmental stage so that prior price histories may not be indicative of current price dynamics. In addition, a Fund may not have the same access to certain positions on foreign trading exchanges as do local traders, and the historical market data on which the Sponsor bases its strategies may not be as reliable or accessible as it is for U.S. exchanges.
The Funds are Treated as Partnerships for Tax Purposes which Means that There May be a Lack of Certainty as to Tax Treatment for an Investor’s Gains and Losses
Cash or property will be distributed at the sole discretion of the Sponsor, and the Sponsor currently does not intend to make cash or other distributions with respect to Shares. You will be required to pay U.S. federal income tax and, in some cases, state, local, or foreign income tax, on your allocable share of a Fund’s taxable income, without regard to whether you receive distributions or the amount of any distributions. Therefore, the tax liability resulting from your ownership of Shares may exceed the amount of cash or value of property (if any) distributed.
Due to the application of the assumptions and conventions applied by a Fund in making allocations for U.S. federal income tax purposes and other factors, your allocable share of the Fund’s income, gain, deduction or loss may be different than your economic profit or loss from your Shares for a taxable year. This difference could be temporary or permanent and, if permanent, could result in your being taxed on amounts in excess of your economic income.
The Funds are treated as partnerships for United States federal income tax purposes. The U.S. tax rules pertaining to entities taxed as partnerships are complex and their application to publicly traded partnerships such as the Funds are in many respects uncertain. The Funds apply certain assumptions and conventions in an attempt to comply with the intent of the applicable rules and to report taxable income, gains, deductions, losses and credits in a manner that properly reflects Shareholders’ economic gains and losses. These assumptions and conventions may not fully comply with all aspects of the Internal Revenue Code (the “Code”) and applicable Treasury Regulations, however, and it is possible that the U.S. Internal Revenue Service (the “IRS”) will successfully challenge our allocation methods and require us to reallocate items of income, gain, deduction, loss or credit in a manner that adversely affects you. If this occurs, you may be required to file an amended tax return and to pay additional taxes plus deficiency interest.
The Trust has received an opinion of counsel that, under current U.S. federal income tax laws, the Funds will be treated as partnerships that are not taxable as corporations for U.S. federal income tax purposes, provided that (i) at least 90 percent of each Fund’s annual gross income consists of “qualifying income” as defined in the Code, (ii) the Funds are organized and operated in accordance with its governing agreements and applicable law, and (iii) the Funds do not elect to be taxed as corporations for federal income tax purposes. Although the Sponsor anticipates that the Funds have satisfied and will continue to satisfy the “qualifying income” requirement for all of its taxable years, that result cannot be assured. The Funds have not requested and will not request any ruling from the IRS with respect to its classification as partnerships not taxable as corporations for federal income tax purposes. If the IRS were to successfully assert that the Funds are taxable as corporations for federal income tax purposes in any taxable year, rather than passing through its income, gains, losses and deductions proportionately to Shareholders, each Fund would be subject to tax on its net income for the year at corporate tax rates. In addition, although the Sponsor does not currently intend to make distributions with respect to Shares, any distributions would be taxable to Shareholders as dividend income. Taxation of the Funds as corporations could materially reduce the after-tax return on an investment in Shares and could substantially reduce the value of your Shares.
Although the timing and nature of legislative changes is uncertain, based on recent comments made by the current Administration and Congress, the possibility exists that there will be significant tax reform legislation considered by the current Congress in the next several years. Among other things, measures have been proposed that would impact the general tax rates for corporations and individuals, tax rates on investment income, and base broadening including changes to the interest deduction. Overseas property investment may also be impacted by international tax reform. The taxation of investments in pass-through entities may also be altered as a result of tax reform. Congress may enact all or none of these or adopt additional measures not mentioned. Please consult a tax advisor with respect to legislative developments and their effect on an investment in any Shares of the Funds.
Risks Specific to the Teucrium Corn Fund
Investors may choose to use the Fund as a means of investing indirectly in corn, and there are risks involved in such investments. The risks and hazards that are inherent in corn production may cause the price of corn to fluctuate widely. Price movements for corn are influenced by, among other things: weather conditions, crop failure, production decisions, governmental policies, changing demand, the corn harvest cycle, and various economic and monetary events. Corn production is also subject to U.S. federal, state and local regulations that materially affect operations.
The price movements for corn are influenced by, among other things, weather conditions, crop disease, transportation difficulties, various planting, growing and harvesting problems, governmental policies, changing demand, and seasonal fluctuations in supply. More generally, commodity prices may be influenced by economic and monetary events such as changes in interest rates, changes in balances of payments and trade, U.S. and international inflation rates, currency valuations and devaluations, U.S. and international economic events, and changes in the philosophies and emotions of market participants. Because the Fund invests primarily in interests in a single commodity, it is not a diversified investment vehicle, and therefore may be subject to greater volatility than a diversified portfolio of stocks or bonds or a more diversified commodity pool.
The Fund is subject to the risks and hazards of the corn market because it invests in Corn Interests. The risks and hazards that are inherent in the corn market may cause the price of corn to fluctuate widely. If the changes in percentage terms of the Fund’s Shares accurately track the percentage changes in the Benchmark or the spot price of corn, then the price of its Shares will fluctuate accordingly.
The price and availability of corn is influenced by economic and industry conditions, including but not limited to supply and demand factors such as: crop disease and infestation (including, but not limited to, Leaf Blight, Ear Rot and Root Rot); transportation difficulties; various planting, growing, or harvesting problems; and severe weather conditions (particularly during the spring planting season and the fall harvest) such as drought, floods, or frost that are difficult to anticipate and which cannot be controlled. Demand for corn in the United States to produce ethanol has also been a significant factor affecting the price of corn. In turn, demand for ethanol has tended to increase when the price of gasoline has increased, and has been significantly affected by United States governmental policies designed to encourage the production of ethanol. Recent changes in government policy have the potential to reduce the demand for ethanol over the next several years. Additionally, demand for corn is affected by changes in consumer tastes, national, regional and local economic conditions, and demographic trends. Finally, because corn is often used as an ingredient in livestock feed, demand for corn is subject to risks associated with the outbreak of livestock disease.
Corn production is subject to United States federal, state, and local policies and regulations that materially affect operations. Governmental policies affecting the agricultural industry, such as taxes, tariffs, duties, subsidies, incentives, acreage control, and import and export restrictions on agricultural commodities and commodity products, can influence the planting of certain crops, the location and size of crop production, the volume and types of imports and exports, the availability and competitiveness of feedstocks as raw materials, and industry profitability. Additionally, corn production is affected by laws and regulations relating to, but not limited to, the sourcing, transporting, storing, and processing of agricultural raw materials as well as the transporting, storing and distributing of related agricultural products. U.S. corn producers also must comply with various environmental laws and regulations, such as those regulating the use of certain pesticides, and local laws that regulate the production of genetically modified crops. In addition, international trade disputes can adversely affect agricultural commodity trade flows by limiting or disrupting trade between countries or regions.
Seasonal fluctuations in the price of corn may cause risk to an investor because of the possibility that Share prices will be depressed because of the corn harvest cycle. In the United States, the corn market is normally at its weakest point, and corn prices are lowest, shortly before and during the harvest (between September and November), due to the high supply of corn in the market. Conversely, corn prices are generally highest during the winter and spring (between December and May), when farmer-owned corn has largely been sold and used. Seasonal corn market peaks generally occur after planting is complete in May or June, and again as harvest begins around August. These normal market conditions are, however, often influenced by weather patterns, and domestic and global economic conditions, among others factors, and any specific year may not necessarily follow the traditional seasonal fluctuations described above. In the futures market, these seasonal fluctuations are typically reflected in contracts expiring in the relevant season (e.g., contracts expiring during the harvest season are typically priced lower than contracts expiring in the winter and spring). Thus, seasonal fluctuations could result in an investor incurring losses upon the sale of Fund Shares, particularly if the investor needs to sell Shares when the Benchmark Component Futures Contracts are, in whole or part, Corn Futures Contracts expiring in the fall.
The CFTC and U.S. designated contract markets such as the CBOT have established position limits on the maximum net long or net short futures contracts in commodity interests that any person or group of persons under common trading control (other than as a hedge, which an investment by the Fund is not) may hold, own or control. For example, the current position limit for aggregate investments at any one time in U.S. exchange traded Corn Futures Contracts, non-U.S. exchange Corn Futures Contracts, and over-the-counter corn swaps are 600 spot month contracts, 33,000 contracts expiring in any other non-spot single month, or 33,000 cumulative total for all non-spot months. These position limits are fixed ceilings that the Fund would not be able to exceed without specific CFTC authorization.
All of these limits may potentially cause a tracking error between the price of the Shares and the Benchmark. This may in turn prevent you from being able to effectively use the Fund as a way to hedge against corn-related losses or as a way to indirectly invest in corn.
The Fund does not intend to limit the size of the offering and will attempt to expose substantially all of its proceeds to the corn market utilizing Corn Interests. If the Fund encounters position limits, accountability levels, or price fluctuation limits for Corn Futures Contracts on the CBOT, it may then, if permitted under applicable regulatory requirements, purchase Other Corn Interests and/or Corn Futures Contracts listed on foreign exchanges. However, the Corn Futures Contracts available on such foreign exchanges may have different underlying sizes, deliveries, and prices. In addition, the Corn Futures Contracts available on these exchanges may be subject to their own position limits and accountability levels. In any case, notwithstanding the potential availability of these instruments in certain circumstances, position limits could force the Fund to limit the number of Creation Baskets that it sells.
Risks Specific to the Teucrium Soybean Fund
Investors may choose to use the Fund as a means of investing indirectly in soybeans, and there are risks involved in such investments. The risks and hazards that are inherent in soybean production may cause the price of soybeans to fluctuate widely. Global price movements for soybeans are influenced by, among other things: weather conditions, crop failure, production decisions, governmental policies, changing demand, the soybean harvest cycle, and various economic and monetary events. Soybean production is also subject to domestic and foreign regulations that materially affect operations.
As discussed in more detail below, price movements for soybeans are influenced by, among other things, weather conditions, crop disease, transportation difficulties, various planting, growing and harvesting problems, governmental policies, changing demand, and seasonal fluctuations in supply. More generally, commodity prices may be influenced by economic and monetary events such as changes in interest rates, changes in balances of payments and trade, U.S. and international inflation rates, currency valuations and devaluations, U.S. and international economic events, and changes in the philosophies and emotions of market participants. Because the Fund invests primarily in interests in a single commodity, it is not a diversified investment vehicle, and therefore may be subject to greater volatility than a diversified portfolio of stocks or bonds or a more diversified commodity pool.
The Fund is subject to the risks and hazards of the soybean market because it invests in Soybean Interests. The risks and hazards that are inherent in the soybean market may cause the price of soybeans to fluctuate widely. If the changes in percentage terms of the Fund’s Shares accurately track the percentage changes in the Benchmark or the spot price of soybeans, then the price of its Shares will fluctuate accordingly.
The price and availability of soybeans is influenced by economic and industry conditions, including but not limited to supply and demand factors such as: crop disease; weed control; water availability; various planting, growing, or harvesting problems; severe weather conditions such as drought, floods, heavy rains, frost, or natural disasters that are difficult to anticipate and which cannot be controlled; uncontrolled fires, including arson; challenges in doing business with foreign companies; legal and regulatory restrictions; transportation costs; interruptions in energy supply; currency exchange rate fluctuations; and political and economic instability. Additionally, demand for soybeans is affected by changes in international, national, regional and local economic conditions, and demographic trends. The increased production of soybean crops in South America and the rising demand for soybeans in emerging nations such as China and India have increased competition in the soybean market.
The supply of soybeans could be reduced by the spread of soybean rust. Soybean rust is a wind-borne fungal disease that attacks soybeans. Although soybean rust can be killed with chemicals, chemical treatment increases production costs for farmers.
Soybean production is subject to United States and foreign policies and regulations that materially affect operations. Governmental policies affecting the agricultural industry, such as taxes, tariffs, duties, subsidies, incentives, acreage control, and import and export restrictions on agricultural commodities and commodity products, can influence the planting of certain crops, the location and size of crop production, the volume and types of imports and exports, and industry profitability. Additionally, soybean production is affected by laws and regulations relating to, but not limited to, the sourcing, transporting, storing and processing of agricultural raw materials as well as the transporting, storing and distributing of related agricultural products. Soybean producers also may need to comply with various environmental laws and regulations, such as those regulating the use of certain pesticides. In addition, international trade disputes can adversely affect agricultural commodity trade flows by limiting or disrupting trade between countries or regions.
Because processing soybean oil can create trans-fats, the demand for soybean oil may decrease due to heightened governmental regulation of trans-fats or trans-fatty acids. The U.S. Food and Drug Administration currently requires food manufacturers to disclose levels of trans-fats contained in their products, and various local governments have enacted or are considering restrictions on the use of trans-fats in restaurants. Several food processors have either switched or indicated an intention to switch to oil products with lower levels of trans-fats or trans-fatty acids.
In recent years, there has been increased global interest in the production of biofuels as alternatives to traditional fossil fuels and as a means of promoting energy independence. Soybeans can be converted into biofuels such as biodiesel. Accordingly, the soybean market has become increasingly affected by demand for biofuels and related legislation.
The costs related to soybean production could increase and soybean supply could decrease as a result of restrictions on the use of genetically modified soybeans, including requirements to segregate genetically modified soybeans and the products generated from them from other soybean products.
Seasonal fluctuations in the price of soybeans may cause risk to an investor because of the possibility that Share prices will be depressed because of the soybean harvest cycle. In the futures market, fluctuations are typically reflected in contracts expiring in the harvest season (i.e., contracts expiring during the fall are typically priced lower than contracts expiring in the winter and spring). Thus, seasonal fluctuations could result in an investor incurring losses upon the sale of Fund Shares, particularly if the investor needs to sell Shares when the Benchmark Component Futures Contracts are, in whole or part, Soybean Futures Contracts expiring in the fall.
The CFTC and U.S. designated contract markets have established position limits on the maximum net long or net short futures contracts in commodity interests that any person or group of persons under common trading control (other than as a hedge, which an investment by the Fund is not) may hold, own or control. For example, the current position limit for aggregate investments at any one time in U.S. exchange traded Soybean Futures Contracts, non-U.S. exchange Soybean Futures Contracts, and over-the-counter soybean swaps are 600 spot month contracts, 15,000 contracts expiring in any other single non-spot month, or 15,000 cumulative total for all non-spot months. These position limits are fixed ceilings that the Fund would not be able to exceed without specific CFTC authorization.
All of these limits may potentially cause a tracking error between the price of the Shares and the Benchmark. This may in turn prevent you from being able to effectively use the Fund as a way to hedge against soybean-related losses or as a way to indirectly invest in soybeans.
If the Fund encounters position limits or price fluctuation limits for Soybean Futures Contracts on the CBOT, it may then, if permitted under applicable regulatory requirements, purchase Other Soybean Interests and/or Soybean Futures Contracts listed on foreign exchanges. However, the Soybean Futures Contracts available on such foreign exchanges may have different underlying sizes, deliveries, and prices. In addition, the Soybean Futures Contracts available on these exchanges may be subject to their own position limits or similar restrictions. In any case, notwithstanding the potential availability of these instruments in certain circumstances, position limits could force the Fund to limit the number of Creation Baskets that it sells.
Risks Specific to the Teucrium Sugar Fund
Investors may choose to use the Fund as a means of investing indirectly in sugar, and there are risks involved in such investments. The risks and hazards that are inherent in sugar production may cause the price of sugar to fluctuate widely. Global price movements for sugar are influenced by, among other things: weather conditions, crop failure, production decisions, governmental policies, changing demand, the sugar harvest cycle, and various economic and monetary events. Sugar production is also subject to domestic and foreign regulations that materially affect operations.
As discussed in more detail below price movements for sugar are influenced by, among other things, weather conditions, crop disease, transportation difficulties, various planting, growing and harvesting problems, governmental policies, changing demand, and seasonal fluctuations in supply. More generally, commodity prices may be influenced by economic and monetary events such as changes in interest rates, changes in balances of payments and trade, U.S. and international inflation rates, currency valuations and devaluations, U.S. and international economic events, and changes in the philosophies and emotions of market participants. Because the Fund invests primarily in interests in a single commodity, it is not a diversified investment vehicle, and therefore may be subject to greater volatility than a diversified portfolio of stocks or bonds or a more diversified commodity pool.
The Fund is subject to the risks and hazards of the world sugar market because it invests in Sugar Interests. The two primary sources for the production of sugar are sugarcane and sugar beets, both of which are grown in various countries around the world. The risks and hazards that are inherent in the world sugar market may cause the price of sugar to fluctuate widely. If the changes in percentage terms of the Fund’s Shares accurately track the percentage changes in the Benchmark or the spot price of sugar, then the price of its Shares will fluctuate accordingly.
The global price and availability of sugar is influenced by economic and industry conditions, including but not limited to supply and demand factors such as: crop disease; weed control; water availability; various planting, growing, or harvesting problems; severe weather conditions such as drought, floods, or frost that are difficult to anticipate and which cannot be controlled; uncontrolled fires, including arson; challenges in doing business with foreign companies; legal and regulatory restrictions; fluctuation of shipping rates; currency exchange rate fluctuations; and political and economic instability. Global demand for sugar to produce ethanol has also been a significant factor affecting the price of sugar. Additionally, demand for sugar is affected by changes in consumer tastes, national, regional and local economic conditions, and demographic trends. The spread of consumerism and the rising affluence of emerging nations such as China and India have created demand for sugar. An influx of people in developing countries moving from rural to urban areas may create more disposable income to be spent on sugar products, and might also reduce sugar production in rural areas on account of worker shortages, all of which would result in upward pressure on sugar prices. On the other hand, public health concerns regarding obesity, heart disease and diabetes, particularly in developed countries, may reduce demand for sugar. In light of the time it takes to grow sugarcane and sugar beets and the cost of new facilities for processing these crops, it may not be possible to increase supply quickly or in a cost-effective manner in response to an increase in demand for sugar.
Sugar production is subject to United States and foreign policies and regulations that materially affect operations. Governmental policies affecting the agricultural industry, such as taxes, tariffs, duties, subsidies, incentives, acreage control, and import and export restrictions on agricultural commodities and commodity products, can influence the planting of certain crops, the location and size of crop production, the volume and types of imports and exports, and industry profitability. Many foreign countries subsidize sugar production, resulting in lower prices, but this has led other countries, including the United States, to impose tariffs and import restrictions on sugar imports. Sugar producers also may need to comply with various environmental laws and regulations, such as those regulating the use of certain pesticides.
Seasonal fluctuations in the price of sugar may cause risk to an investor because of the possibility that Share prices will be depressed because of the sugar harvest cycle. In the futures market, contracts expiring during the harvest season are typically priced lower than contracts expiring in the winter and spring. While the sugar harvest seasons varies from country to country, prices of Sugar Futures Contracts tend to be lowest in the late spring and early summer and again in early autumn of the Northern Hemisphere, reflecting the varied harvest seasons in Brazil, India, and Thailand the world’s leading producers and exporters of sugarcane. Thus, seasonal fluctuations could result in an investor incurring losses upon the sale of Fund Shares, particularly if the investor needs to sell Shares when the Benchmark Component Futures Contracts are, in whole or part, Sugar Futures Contracts expiring in the Northern Hemisphere’s late spring, early summer, or early autumn.
U.S. designated contract markets such as the ICE Futures and the NYMEX have established position limits and accountability levels on the maximum net long or net short Sugar Futures Contracts that any person or group of persons under common trading control may hold, own or control. The CFTC has not currently set position limits for Sugar Futures Contracts, and the ICE Futures and the NYMEX have established position limits only on spot month Sugar No. 11 Futures Contracts. For example, the ICE Futures’ position limit for Sugar No. 11 Futures Contracts is 5,000 spot month contracts, whereas the NYMEX Sugar No. 11 Futures limit is 1,000 spot month contracts, generally applicable only during the last month before expiration. All Sugar Futures Contracts held under the control of the Sponsor, including those held by any future series of the Trust, will be aggregated in determining the application of these position limits. However, because spot month contracts are not Benchmark Component Futures Contracts and the Fund’s roll strategy calls for the sale of all spot month Sugar No.11 Futures Contracts prior to the time the position limits would become applicable, it is unlikely that position limits on Sugar Futures Contracts will come into play.
In contrast to position limits, accountability levels are not fixed ceilings, but rather thresholds above which an exchange may exercise greater scrutiny and control over an investor, including by imposing position limits on the investor. For example, the current ICE Futures-established accountability level for investments in Sugar No. 11 Futures Contracts for any one month is 10,000, and the accountability level for all combined months is 15,000. (The current accountability level for Sugar No. 11 Futures Contracts traded on the NYMEX is 9,000 for any one month, and 9,000 for all combined months. Even though accountability levels are not fixed ceilings, the Fund does not intend to invest in Sugar Futures Contracts in excess of any applicable accountability levels.
All of these limits may potentially cause a tracking error between the price of the Shares and the Benchmark. This may in turn prevent you from being able to effectively use the Fund as a way to hedge against sugar-related losses or as a way to indirectly invest in sugar.
If the Fund encounters accountability levels, position limits, or price fluctuation limits for Sugar Futures Contracts on ICE Futures, it may then, if permitted under applicable regulatory requirements, purchase Other Sugar Interests and/or Sugar Futures Contracts listed on the NYMEX or foreign exchanges. However, the Sugar Futures Contracts available on such foreign exchanges may have different underlying sizes, deliveries, and prices. In addition, the Sugar Futures Contracts available on these exchanges may be subject to their own position limits and accountability levels. In any case, notwithstanding the potential availability of these instruments in certain circumstances, position limits could force the Fund to limit the number of Creation Baskets that it sells.
Risks Specific to the Teucrium Wheat Fund
Investors may choose to use the Fund as a means of investing indirectly in wheat, and there are risks involved in such investments. The risks and hazards that are inherent in wheat production may cause the price of wheat to fluctuate widely. Price movements for wheat are influenced by, among other things: weather conditions, crop failure, production decisions, governmental policies, changing demand, the wheat harvest cycle, and various economic and monetary events. Wheat production is also subject to U.S. federal, state and local regulations that materially affect operations.
As discussed in more detail below, price movements for wheat are influenced by, among other things, weather conditions, crop disease, transportation difficulties, various planting, growing and harvesting problems, governmental policies, changing demand, and seasonal fluctuations in supply. More generally, commodity prices may be influenced by economic and monetary events such as changes in interest rates, changes in balances of payments and trade, U.S. and international inflation rates, currency valuations and devaluations, U.S. and international economic events, and changes in the philosophies and emotions of market participants. Because the Fund invests primarily in interests in a single commodity, it is not a diversified investment vehicle, and therefore may be subject to greater volatility than a diversified portfolio of stocks or bonds or a more diversified commodity pool.
The Fund is subject to the risks and hazards of the wheat market because it invests in Wheat Interests. The risks and hazards that are inherent in the wheat market may cause the price of wheat to fluctuate widely. If the changes in percentage terms of the Fund’s Shares accurately track the percentage changes in the Benchmark or the spot price of wheat, then the price of its Shares will fluctuate accordingly.
The price and availability of wheat is influenced by economic and industry conditions, including but not limited to supply and demand factors such as: crop disease; weed control; water availability; various planting, growing, or harvesting problems; severe weather conditions such as drought, floods, or frost that are difficult to anticipate and which cannot be controlled. Demand for food products made from wheat flour is affected by changes in consumer tastes, national, regional and local economic conditions, and demographic trends. More specifically, demand for such food products in the United States is relatively unaffected by changes in wheat prices or disposable income, but is closely tied to tastes and preferences. For example, in recent years the increase in the popularity of low-carbohydrate diets caused the consumption of wheat flour to decrease rapidly before rebounding somewhat after 2005. Export demand for wheat fluctuates yearly, based largely on crop yields in the importing countries.
Wheat production is subject to United States federal, state and local policies and regulations that materially affect operations. Governmental policies affecting the agricultural industry, such as taxes, tariffs, duties, subsidies, incentives, acreage control, and import and export restrictions on agricultural commodities and commodity products, can influence the planting of certain crops, the location and size of crop production, the volume and types of imports and exports, the availability and competitiveness of feedstocks as raw materials, and industry profitability. Additionally, wheat production is affected by laws and regulations relating to, but not limited to, the sourcing, transporting, storing and processing of agricultural raw materials as well as the transporting, storing and distributing of related agricultural products. U.S. wheat producers also must comply with various environmental laws and regulations, such as those regulating the use of certain pesticides, and local laws that regulate the production of genetically modified crops. In addition, international trade disputes can adversely affect agricultural commodity trade flows by limiting or disrupting trade between countries or regions.
Seasonal fluctuations in the price of wheat may cause risk to an investor because of the possibility that Share prices will be depressed because of the wheat harvest cycle. In the United States, the market for winter wheat, the type of wheat upon which CBOT Wheat Futures Contracts are based, is at its lowest point, and wheat prices are lowest, shortly before and during the harvest (in the spring or early summer), due to the high supply of wheat in the market. Conversely, winter wheat prices are generally highest in the fall or early winter, when the wheat harvested that year has largely been sold and used. In the futures market, these seasonal fluctuations are typically reflected in contracts expiring in the relevant season (e.g., contracts expiring during the harvest season are typically priced lower than contracts expiring in the fall and early winter). Thus, seasonal fluctuations could result in an investor incurring losses upon the sale of Fund Shares, particularly if the investor needs to sell Shares when the Benchmark Component Futures Contracts are, in whole or part, Wheat Futures Contracts expiring in the spring.
Position limits and daily price fluctuation limits set by the CFTC and the exchanges have the potential to cause tracking error, which could cause the price of Shares to substantially vary from the Benchmark and prevent you from being able to effectively use the Fund as a way to hedge against wheat-related losses or as a way to indirectly invest in wheat.
The CFTC and U.S. designated contract markets such as the CBOT have established position limits on the maximum net long or net short futures contracts in commodity interests that any person or group of persons under common trading control (other than as a hedge, which an investment by the Fund is not) may hold, own or control. For example, the current position limit for aggregate investments at any one time in U.S. exchange traded Wheat Futures Contracts, non-U.S. exchange linked Wheat Futures Contracts, and over-the-counter wheat swaps are 600 spot month contracts, 12,000 contracts expiring in any other single month, or cumulative 12,000 total for all months. These position limits are fixed ceilings that the Fund would not be able to exceed without specific CFTC authorization.
If the Fund encounters position limits, accountability levels, or price fluctuation limits for Wheat Futures Contracts on the CBOT, it may then, if permitted under applicable regulatory requirements, purchase Other Wheat Interests and/or Wheat Futures Contracts listed on foreign exchanges. However, the Wheat Futures Contracts available on such foreign exchanges may have different underlying sizes, deliveries, and prices. In addition, the Wheat Futures Contracts available on these exchanges may be subject to their own position limits and accountability levels. In any case, notwithstanding the potential availability of these instruments in certain circumstances, position limits could force the Fund to limit the number of Creation Baskets that it sells.
Item 2. Unregistered Sales of Equity Securities and Use of Proceeds
(b) | (b) | On July 31, 2010, for all Funds listed below except the Teucrium Agricultural Fund for which the contribution was made on April 1, 2011 and the Hashdex Bitcoin Futures ETF for which the contribution was made on May 25, 2022, the Sponsor made the following capital contributions and received the following shares for that contribution prior to each Fund’s commencement of operations; such shares were sold in private offerings exempt from registration under Section 4(2) of the Securities Act of 1933, as amended: |
1. | a $100 capital contribution to the Teucrium Corn Fund, another series of the Trust, in exchange for four shares of such fund; |
2. | | |
| 1. | a $100 capital contribution to the Teucrium Soybean Fund, another series of the Trust, in exchange for four shares of such fund; |
3. | | |
| 2. | a $100 capital contribution to the Teucrium Sugar Fund, another series of the Trust, in exchange for four shares of such fund; and |
4. | | |
| 3. | a $100 capital contribution to the Teucrium Wheat Fund, another series of the Trust, in exchange for four shares of such fund.fund; |
5. | | |
| 4. | a $100 capital contribution to the Teucrium Agricultural Fund, another series of the Trust, in exchange for two shares of such fund.fund; and |
6. | | |
The original registration statement on Form S-1 registering 30,000,000 common units, or “Shares,”
a $100 capital contribution to the Hashdex Bitcoin Futures ETF, another series of the Trust, in exchange for four shares of such fund.
Teucrium Corn Fund (File No. 333-162033) was declared effective on June 7, 2010. A second registration statement on Form S-1 (File No. 333-187463) which replaced the original registration statement was declared effective on April 30, 2013 and a third (File No. 333-210010) was declared effective on April 29, 2016.
Registration Statement on Form S-1 | | | File Number | | | Registered Common Units | | Effective Date |
| 1 | | | 333-162033 | | | 30,000,000 | | June 7, 2010 |
| 2 | | | 333-187463 | | | - | | April 30, 2013 |
| 3 | | | 333-210010 | | | - | | April 29, 2016 |
| 4 | | | 333-230626 | | | - | | April 29, 2019 |
| 5 | | | 333-237234 | | | 10,000,000 | | May 1, 2020 |
| 6 | | | 333-248546 | | | 20,000,000 | | October 2, 2020 |
| 7 | | | 333-263434 | | | Indeterminate Number of Shares | | April 7, 2022 |
From June 9, 2010 (the commencement of operations) through September 30, 2017, 15,575,000March 31, 2024, 46,725,000 Shares of the Fund were sold at an aggregate offering price of $479,941,161.$1,046,688,885. The Fund paid fees to Foreside Fund Services, LLC for its services to the Fund from June 9, 2010 (the commencement of operations) through September 30, 2017March 31, 2024 in an amount equal to $803,207,$1,239,890, resulting in net offering proceeds of $479,137,954.$1,045,448,995. The offering proceeds were invested in corn futures contracts and cash and cash equivalents in accordance with the Fund’s investment objective stated in the prospectus.
The original registration statement on Form S-1 registering 10,000,000 common units, or “Shares,” of Teucrium Soybean Fund (File No. 333-167590) was declared effective on June 17, 2011. A second registration statement on Form S-1 (File No. 333-196210) which replaced the original registration statement was declared effective on June 30, 2014 and a third (File No. 333-217247) was declared effective on May 1, 2017.
Registration Statement on Form S-1 | | File Number | | | Registered Common Units | | Effective Date |
1 | | 333-167590 | | | 10,000,000 | | June 13, 2011 |
2 | | 333-196210 | | | - | | June 30, 2014 |
3 | | 333-217247 | | | - | | May 1, 2017 |
4 | | 333-223940 | | | 5,000,000 | | April 30, 2018 |
5 | | 333-241569 | | | 15,000,000 | | August 24, 2020 |
6 | | 333-263448 | | | Indeterminate Number of Shares | | April 7, 2022 |
From September 19, 2011 (the commencement of the offering) through September 30, 2017, 2,625,000March 31, 2024, 17,100,000 Shares of the Fund were sold at an aggregate offering price of $55,558,509.$318,148,042. The Fund paid fees to Foreside Fund Services, LLC for its services to the Fund through September 30, 2017March 31, 2024 in an amount equal to $81,014,$269,279, resulting in net offering proceeds of $55,477,495.$317,878,763. The offering proceeds were invested in soybean futures contracts and cash and cash equivalents in accordance with the Fund’s investment objective stated in the prospectus.
The original registration statement on Form S-1 registering 10,000,000 common units, or “Shares,” of Teucrium Sugar Fund (File No. 333-167585) was declared effective on June 17, 2011. A second registration statement on Form S-1 (File No. 333-196211) which replaced the original registration statement was declared effective on June 30, 2014 and a third (File No. 333-217248) was declared effective on May 1, 2017.
Registration Statement on Form S-1 | | File Number | | | Registered Common Units | | Effective Date |
1 | | 333-167585 | | | 10,000,000 | | June 13, 2011 |
2 | | 333-196211 | | | - | | June 30, 2014 |
3 | | 333-217248 | | | - | | May 1, 2017 |
4 | | 333-223941 | | | 5,000,000 | | April 30, 2018 |
5 | | 333-248545 | | | 15,000,000 | | October 2, 2020 |
6 | | 333-263438 | | | Indeterminate Number of Shares | | April 7, 2022 |
From September 19, 2011 (the commencement of the offering) through September 30, 2017, 1,850,000March 31, 2024, 13,300,000 Shares of the Fund were sold at an aggregate offering price of $24,787,661.$126,639,200. The Fund paid fees to Foreside Fund Services, LLC for its services to the Fund through September 30, 2017March 31, 2024 in an amount equal to $36,556,$114,857, resulting in net offering proceeds of $24,751,105.$126,524,343. The offering proceeds were invested in sugar futures contracts and cash and cash equivalents in accordance with the Fund’s investment objective stated in the prospectus.
The original registration statement on Form S-1 registering 10,000,000 common units, or “Shares,” of Teucrium Wheat Fund (File No. 333-167591) was declared effective on June 17, 2011. A second registration statement on Form S-1 (File No. 333-196209) which replaced the original registration statement was declared effective on June 30, 2014. A third registration statement on Form S-1 (File No. 333-212481) which registered a total of 25,350,000 shares was declared effective on July 15, 2016.
Registration Statement on Form S-1 | | File Number | | | Registered Common Units | | Effective Date |
1 | | 333-167591 | | | 10,000,000 | | June 13, 2011 |
2 | | 333-196209 | | | - | | June 30, 2014 |
3 | | 333-212481 | | | 25,050,000 | | July 15, 2016 |
4 | | 333-230623 | | | 30,000,000 | | April 29, 2019 |
5 | | 333-263293 | | | Indeterminate Number of Shares | | March 9, 2022 |
From September 19, 2011 (the commencement of the offering) through September 30, 2017, 16,300,000March 31, 2024, 131,225,000 Shares of the Fund were sold at an aggregate offering price of $152,653,378.$1,231,836,778. The Fund paid fees to Foreside Fund Services, LLC for its services to the Fund through September 30, 2017March 31, 2024 in an amount equal to $195,602,$604,442, resulting in net offering proceeds of $152,457,776.$1,231,232,336 The offering proceeds were invested in wheat futures contracts and cash and cash equivalents in accordance with the Fund’s investment objective stated in the prospectus.
The original registration statement on Form S-1 registering 5,000,000 common units, or “Shares,”
Teucrium Agricultural Fund (File No. 333-173691) was declared effective on February 10, 2012. A second registration statement on Form S-1 (File No. 333-201953) which replaced the original registration statement was declared effective on April 30, 2015.
Registration Statement on Form S-1 | | File Number | | | Registered Common Units | | Effective Date |
1 | | 333-173691 | | | 5,000,000 | | February 10, 2012 |
2 | | 333-201953 | | | - | | April 30, 2015 |
3 | | 333-223943 | | | - | | April 30, 2018 |
4 | | 333-254650 | | | - | | April 30, 2021 |
5 | | 333-263450 | | | Indeterminate Number of Shares | | April 7, 2022 |
From March 28, 2012 (the commencement of the offering) through September 30, 2017, 350,000March 31, 2024, 2,287,500 Shares of the Fund were sold at an aggregate offering price of $17,706,578.$77,555,646. The Fund paid fees to Foreside Fund Services, LLC for its services to the Fund through September 30, 2017March 31, 2024 in an amount equal to $8,605,$34,773, resulting in net offering proceeds of $17,697,973.$77,520,873. The offering proceeds were invested in Shares of the Underlying Funds and cash and cash equivalents in accordance with the Fund’s investment objective stated in the prospectus.
Hashdex Bitcoin Futures ETF
From September 15, 2022 (the commencement of the offering) through March 31, 2024, 110,000 Shares of the Fund were sold at an aggregate offering price of $2,829,029. The offering proceeds were invested in bitcoin futures contracts and cash and cash equivalents in accordance with the Fund’s investment objective stated in the prospectus.
Issuer Purchases of CORN Shares:
| | | | | | | | | | | | |
| Period | | | Total
Number of
Shares
Purchased | | | Average
Price
Paid per
Share | | | Total Number
of
Shares
Purchased
as Part of
Publicly
Announced
Plans
or Programs | | Maximum Number
(or
Approximate
Dollar
Value) of Shares that
May Yet Be
Purchased
Under the Plans or
Programs |
| July 1 to July 31, 2017 | | | | 150,000 | | | $ | 19.42 | | | N/A | | N/A |
| August 1 to August 31, 2017 | | | | 50,000 | | | $ | 18.22 | | | N/A | | N/A |
| September 1 to September 30, 2017 | | | | 50,000 | | | $ | 17.35 | | | N/A | | N/A |
| Total | | | | 250,000 | | | $ | 18.77 | | | | | |
Period | Total Number of Shares Purchased | Average Price Paid per Share | Total Number of Shares Purchased as Part of Publicly Announced Plans or Programs | Maximum Number (or Approximate Dollar Value) of Shares that May Yet Be Purchased Under the Plans or Programs |
January 1 to January 31, 2024 | 250,000 | $ 20.61 | N/A | N/A |
February 1 to February 29, 2024 | 100,000 | $ 19.99 | N/A | N/A |
March 1 to March 31, 2024 | 75,000 | $ 19.92 | N/A | N/A |
Total | 425,000 | $ 20.34 | | |
| | | | | |
January 1 to March 31, 2024 | 425,000 | $ 20.34 | N/A | N/A |
Issuer Purchases of CANE Shares:
Period | Total Number of Shares Purchased | Average Price Paid per Share | Total Number of Shares Purchased as Part of Publicly Announced Plans or Programs | Maximum Number (or Approximate Dollar Value) of Shares that May Yet Be Purchased Under the Plans or Programs |
January 1 to January 31, 2024 | 125,000 | $ 13.00 | N/A | N/A |
February 1 to February 29, 2024 | 75,000 | $ 13.47 | N/A | N/A |
March 1 to March 31, 2024 | - | $ - | N/A | N/A |
Total | 200,000 | $ 13.17 | | |
| | | | | |
January 1 to March 31, 2024 | 200,000 | $ 13.17 | N/A | N/A |
Issuer Purchases of WEAT Shares:
Period | Total Number of Shares Purchased | Average Price Paid per Share | Total Number of Shares Purchased as Part of Publicly Announced Plans or Programs | Maximum Number (or Approximate Dollar Value) of Shares that May Yet Be Purchased Under the Plans or Programs |
January 1 to January 31, 2024 | 525,000 | $ 5.72 | N/A | N/A |
February 1 to February 29, 2024 | 1,025,000 | $ 5.48 | N/A | N/A |
March 1 to March 31, 2024 | 475,000 | $ 5.26 | N/A | N/A |
Total | 2,025,000 | $ 5.49 | | |
| | | | | |
January 1 to March 31, 2024 | 12,825,000 | $ 6.66 | N/A | N/A |
Issuer Purchases of SOYB Shares:
| | | | | | | | | | | | |
| Period | | | Total
Number of
Shares
Purchased | | | Average
Price
Paid per
Share | | | Total Number
of
Shares
Purchased
as Part of
Publicly
Announced
Plans
or Programs | | Maximum Number
(or
Approximate
Dollar
Value) of Shares that
May Yet Be
Purchased
Under the Plans or
Programs |
| July 1 to July 31, 2017 | | | | — | | | $ | — | | | N/A | | N/A |
| August 1 to August 31, 2017 | | | | 125,000 | | | $ | 18.17 | | | N/A | | N/A |
| September 1 to September 30, 2017 | | | | — | | | $ | — | | | N/A | | N/A |
| Total | | | | 125,000 | | | $ | 18.17 | | | | | |
Period | Total Number of Shares Purchased | Average Price Paid per Share | Total Number of Shares Purchased as Part of Publicly Announced Plans or Programs | Maximum Number (or Approximate Dollar Value) of Shares that May Yet Be Purchased Under the Plans or Programs |
January 1 to January 31, 2024 | 50,000 | $ 25.92 | N/A | N/A |
February 1 to February 29, 2024 | - | $ - | N/A | N/A |
March 1 to March 31, 2024 | - | $ - | N/A | N/A |
Total | 50,000 | $ 25.92 | | |
| | | | | |
January 1 to March 31, 2024 | 50,000 | $ 25.92 | N/A | N/A |
Issuer Purchases of WEAT Shares:
| | | | | | | | | | | | |
| Period | | | Total
Number of
Shares
Purchased | | | Average
Price
Paid per
Share | | | Total Number
of
Shares
Purchased
as Part of
Publicly
Announced
Plans
or Programs | | Maximum
Number (or
Approximate
Dollar
Value) of Shares
that
May Yet Be
Purchased
Under the Plans or
Programs |
| July 1 to July 31, 2017 | | | | 1,925,000 | | | $ | 8.06 | | | N/A | | N/A |
| August 1 to August 31, 2017 | | | | 125,000 | | | $ | 7.18 | | | N/A | | N/A |
| September 1 to September 30, 2017 | | | | 75,000 | | | $ | 6.66 | | | N/A | | N/A |
| Total | | | | 2,125,000 | | | $ | 7.96 | | | | | |
Issuer Purchases of CANE Shares:
| | | | | | | | | | | | |
| Period | | | Total
Number of
Shares
Purchased | | | Average
Price
Paid per
Share | | | Total Number of
Shares
Purchased
as Part of
Publicly
Announced
Plans
or Programs | | Maximum Number
(or
Approximate
Dollar
Value) of Shares
that
May Yet Be
Purchased
Under the Plans or
Programs |
| July 1 to July 31, 2017 | | | | 100,000 | | | $ | 9.79 | | | N/A | | N/A |
| August 1 to August 31, 2017 | | | | 100,000 | | | $ | 9.49 | | | N/A | | N/A |
| September 1 to September 30, 2017 | | | | 75,000 | | | $ | 9.80 | | | N/A | | N/A |
| Total | | | | 275,000 | | | $ | 9.68 | | | | | |
Issuer Purchases of TAGS Shares:
Period | Total Number of Shares Purchased | Average Price Paid per Share | Total Number of Shares Purchased as Part of Publicly Announced Plans or Programs | Maximum Number (or Approximate Dollar Value) of Shares that May Yet Be Purchased Under the Plans or Programs |
January 1 to January 31, 2024 | 25,000 | $ 28.99 | N/A | N/A |
February 1 to February 29, 2024 | - | $ - | N/A | N/A |
March 1 to March 31, 2024 | 87,500 | $ 27.86 | N/A | N/A |
Total | 112,500 | $ 28.11 | | |
| | | | | |
January 1 to March 31, 2024 | 637,500 | $ 31.11 | N/A | N/A |
Issuer Purchases of DEFI Shares: Nothing to Reportreport.
Item 3. Defaults Upon Senior Securities
None.
Item 4. Mine Safety Disclosures
None.
Item 5. Other Information
(a) None.None.
(b) Not Applicable.
Item 6. Exhibits
The following exhibits are filed as part of this report as required under Item 601 of Regulation S-K:
(1) Filed herewith.
SIGNATURES
Pursuant to the requirements of the Securities Exchange Act of 1934, the Registrant has duly caused this report to be signed on its behalf by the undersigned, thereunto duly authorized.
Teucrium Commodity Trust (Registrant)
By: | | |
By: | Teucrium Trading, LLC | |
| | its Sponsor | |
| | | |
By: | /s/ Barbara RikerCory Mullen-Rusin | |
Name: | Barbara RikerCory Mullen-Rusin | |
| | Chief Financial Officer | |
| | | |
| | Date: November 9, 2017May 10, 2024 | |
Teucrium Commodity Trust (Registrant)
By: | Teucrium Trading, LLC | |
| its Sponsor | |
| | |
By: | /s/ Sal Gilbertie | |
Name: | Sal Gilbertie | |
| Chief Executive Officer | |
| | |
| Date: May 10, 2024 | |