UNITED STATES
SECURITIES AND EXCHANGE COMMISSION
Washington, D.C. 20549
FORM 10-Q
[ X ] Quarterly Report Pursuant To Section 13 or 15(d) of the Securities Exchange Act of 1934
For the Quarterly Period Ended Sept. 30, 2017March 31, 2018
or
[ ] Transition Report Pursuant to Section 13 or 15(d) of the Securities Exchange Act of 1934
Commission File No. 001-35651
THE BANK OF NEW YORK MELLON CORPORATION
(Exact name of registrant as specified in its charter)
|
| |
| Delaware | 13-2614959 |
| (State or other jurisdiction of | (I.R.S. Employer Identification No.) |
| incorporation or organization) | |
225 Liberty Street
New York, New York 10286
(Address of principal executive offices) (Zip Code)
Registrant’s telephone number, including area code -- (212) 495-1784
Indicate by check mark whether the registrant (1) has filed all reports required to be filed by Section 13 or 15(d) of the Securities Exchange Act of 1934 during the preceding 12 months (or for such shorter period that the registrant was required to file such reports), and (2) has been subject to such filing requirements for the past 90 days. Yes XxNo ___o
Indicate by check mark whether the registrant has submitted electronically and posted on its corporate Web site, if any, every Interactive Data File required to be submitted and posted pursuant to Rule 405 of Regulation S-T (§232.405 of this chapter) during the preceding 12 months (or for such shorter period that the registrant was required to submit and post such files). Yes XxNo ___o
Indicate by check mark whether the registrant is a large accelerated filer, an accelerated filer, a non-accelerated filer, a smaller reporting company, or an emerging growth company. See the definitions of “large accelerated filer,” “accelerated filer,” “smaller reporting company,” and “emerging growth company” in Rule 12b-2 of the Exchange Act.
|
| |
Large accelerated filer [ X ]x | Smaller reporting company [ ]o |
Accelerated filer [ ]o | Emerging growth company [ ]o |
Non-accelerated filer [ ]o (Do not check if a smaller reporting company) | |
If an emerging growth company, indicate by check mark if the registrant has elected not to use the extended transition period for complying with any new or revised financial accounting standards provided pursuant to Section 13(a) of the Exchange Act. [ ]o
Indicate by check mark whether the registrant is a shell company (as defined in Rule 12b-2 of the Exchange Act).Yes ___oNo Xx
Indicate the number of shares outstanding of each of the issuer’s classes of common stock, as of the latest practicable date.
|
| | | | |
| | Class | Outstanding as of |
| |
| | | Sept. 30, 2017March 31, 2018 |
| |
| | Common Stock, $0.01 par value | 1,024,022,3531,010,676,179 |
| |
THE BANK OF NEW YORK MELLON CORPORATION
ThirdFirst Quarter 20172018 Form 10-Q
Table of Contents
|
| |
| | Page |
| |
| | |
| Part I - Financial Information | |
| Items 2. and 3. Management’s Discussion and Analysis of Financial Condition and Results of Operations; Quantitative and Qualitative Disclosures about Market Risk: | |
| |
| |
Key thirdHighlights of first quarter 2017 events2018 results | |
Highlights of third quarter 2017 results | |
| |
| |
| |
| |
| |
| |
| |
| |
| |
| |
| |
| |
| |
| |
| |
| |
| | |
| Item 1. Financial Statements: | |
| |
| |
| |
| |
| |
|
| |
| | Page |
| Notes to Consolidated Financial Statements: | |
| |
| |
| |
| |
| |
| |
| |
| |
| |
| |
| |
| |
| |
| |
| |
| |
| |
| |
| |
| |
| |
| |
| |
| |
| |
| | |
| |
| |
| | |
| Part II - Other Information | |
| |
| |
| |
| |
| | |
| Index to Exhibits | |
| Signature | |
The Bank of New York Mellon Corporation (and its subsidiaries)
Consolidated Financial Highlights (unaudited)
| | | | Quarter ended | | Year-to-date | Quarter ended |
| (dollar amounts in millions, except per share amounts and unless otherwise noted) | Sept. 30, 2017 |
| June 30, 2017 |
| Sept. 30, 2016 |
| | Sept. 30, 2017 |
| Sept. 30, 2016 |
| |
| (dollars in millions, except per share amounts and unless otherwise noted) | | March 31, 2018 |
| Dec. 31, 2017 |
| March 31, 2017 |
|
| Results applicable to common shareholders of The Bank of New York Mellon Corporation: | | | | |
| Net income | $ | 983 |
| $ | 926 |
| $ | 974 |
| | $ | 2,789 |
| $ | 2,603 |
| $ | 1,135 |
| $ | 1,126 |
| $ | 880 |
|
| Basic earnings per share | 0.94 |
| 0.88 |
| 0.90 |
| | 2.66 |
| 2.39 |
| 1.11 |
| 1.09 |
| 0.83 |
|
| Diluted earnings per share | 0.94 |
| 0.88 |
| 0.90 |
| | 2.64 |
| 2.38 |
| 1.10 |
| 1.08 |
| 0.83 |
|
| | | | | |
| Fee and other revenue | $ | 3,167 |
| $ | 3,120 |
| $ | 3,150 |
| | $ | 9,305 |
| $ | 9,119 |
| $ | 3,270 |
| $ | 2,860 |
| $ | 3,018 |
|
| Income from consolidated investment management funds | 10 |
| 10 |
| 17 |
| | 53 |
| 21 |
| |
| (Loss) income from consolidated investment management funds | | (11 | ) | 17 |
| 33 |
|
| Net interest revenue | 839 |
| 826 |
| 774 |
| | 2,457 |
| 2,307 |
| 919 |
| 851 |
| 792 |
|
| Total revenue | $ | 4,016 |
| $ | 3,956 |
| $ | 3,941 |
| | $ | 11,815 |
| $ | 11,447 |
| $ | 4,178 |
| $ | 3,728 |
| $ | 3,843 |
|
| | | | | |
Return on common equity (annualized) (a) | 10.6 | % | 10.4 | % | 10.8 | % | | 10.4 | % | 9.8 | % | 12.2 | % | 12.1 | % | 10.2 | % |
Adjusted return on common equity (annualized) – Non-GAAP (a)(b) | 11.0 | % | 10.8 | % | 11.3 | % | | 10.9 | % | 10.3 | % | |
| | | | | |
Return on tangible common equity (annualized) – Non-GAAP (a)(c) | 21.9 | % | 21.9 | % | 23.5 | % | | 22.0 | % | 21.5 | % | |
Adjusted return on tangible common equity (annualized) – Non-GAAP (a)(b)(c) | 22.0 | % | 22.1 | % | 23.6 | % | | 22.1 | % | 21.7 | % | |
Return on tangible common equity (annualized) – Non-GAAP (a) | | 25.9 | % | 25.9 | % | 22.2 | % |
| | | | | |
Return on average assets (annualized) | 1.13 | % | 1.09 | % | 1.10 | % | | 1.09 | % | 0.96 | % | 1.29 | % | 1.27 | % | 1.06 | % |
| | | | | |
| Fee revenue as a percentage of total revenue | 78 | % | 79 | % | 79 | % | | 79 | % | 79 | % | 79 | % | 77 | % | 78 | % |
| | | | | |
| Percentage of non-U.S. total revenue | 36 | % | 35 | % | 36 | % | | 35 | % | 34 | % | 37 | % | 39 | % | 34 | % |
| | | | | |
Pre-tax operating margin (a) | 34 | % | 33 | % | 33 | % | | 33 | % | 31 | % | |
Adjusted pre-tax operating margin – Non-GAAP (a)(b) | 35 | % | 35 | % | 35 | % | | 34 | % | 33 | % | |
| Pre-tax operating margin | | 35 | % | 20 | % | 31 | % |
| | | | | |
| Net interest margin | 1.15 | % | 1.14 | % | 1.05 | % | | 1.14 | % | 1.00 | % | 1.22 | % | 1.14 | % | 1.13 | % |
Net interest margin on a fully taxable equivalent (“FTE”) basis – Non-GAAP (d) | 1.16 | % | 1.16 | % | 1.06 | % | | 1.16 | % | 1.02 | % | |
Net interest margin on a fully taxable equivalent (“FTE”) basis – Non-GAAP (b) | | 1.23 | % | 1.16 | % | 1.14 | % |
| | | | | |
Assets under management (“AUM”) at period end (in billions) (e) | $ | 1,824 |
| $ | 1,771 |
| $ | 1,715 |
| | $ | 1,824 |
| $ | 1,715 |
| |
Assets under custody and/or administration (“AUC/A”) at period end (in trillions) (f) | $ | 32.2 |
| $ | 31.1 |
| $ | 30.5 |
| | $ | 32.2 |
| $ | 30.5 |
| |
Market value of securities on loan at period end (in billions) (g) | $ | 382 |
| $ | 336 |
| $ | 288 |
| | $ | 382 |
| $ | 288 |
| |
Assets under custody and/or administration (“AUC/A”) at period end (in trillions) (c) | | $ | 33.5 |
| $ | 33.3 |
| $ | 30.6 |
|
Assets under management (“AUM”) at period end (in billions) (d) | | $ | 1,868 |
| $ | 1,893 |
| $ | 1,727 |
|
Market value of securities on loan at period end (in billions) (e) | | $ | 436 |
| $ | 408 |
| $ | 314 |
|
| | | | | |
Average common shares and equivalents outstanding (in thousands): (h) | | | | |
Average common shares and equivalents outstanding (in thousands): | | |
| Basic | 1,035,337 |
| 1,035,829 |
| 1,062,248 |
| | 1,037,431 |
| 1,071,457 |
| 1,016,797 |
| 1,024,828 |
| 1,041,158 |
|
| Diluted | 1,041,138 |
| 1,041,879 |
| 1,067,682 |
| | 1,043,585 |
| 1,077,150 |
| 1,021,731 |
| 1,030,404 |
| 1,047,746 |
|
| | | | | |
| Selected average balances: | | | | |
| Interest-earning assets | $ | 291,841 |
| $ | 289,496 |
| $ | 296,703 |
| | $ | 288,283 |
| $ | 308,560 |
| $ | 302,069 |
| $ | 297,166 |
| $ | 283,421 |
|
| Assets of operations | $ | 344,966 |
| $ | 341,607 |
| $ | 350,190 |
| | $ | 340,588 |
| $ | 362,092 |
| $ | 357,483 |
| $ | 350,129 |
| $ | 335,080 |
|
| Total assets | $ | 345,709 |
| $ | 342,515 |
| $ | 351,230 |
| | $ | 341,510 |
| $ | 363,290 |
| $ | 358,175 |
| $ | 350,786 |
| $ | 336,200 |
|
| Interest-bearing deposits | $ | 142,490 |
| $ | 142,336 |
| $ | 155,109 |
| | $ | 141,558 |
| $ | 160,728 |
| $ | 155,704 |
| $ | 147,763 |
| $ | 139,820 |
|
| Long-term debt | $ | 28,138 |
| $ | 27,398 |
| $ | 23,930 |
| | $ | 27,148 |
| $ | 22,779 |
| $ | 28,407 |
| $ | 28,245 |
| $ | 25,882 |
|
| Noninterest-bearing deposits | $ | 70,168 |
| $ | 73,886 |
| $ | 81,619 |
| | $ | 72,524 |
| $ | 82,861 |
| $ | 71,005 |
| $ | 69,111 |
| $ | 73,555 |
|
| Preferred stock | $ | 3,542 |
| $ | 3,542 |
| $ | 3,284 |
| | $ | 3,542 |
| $ | 2,798 |
| $ | 3,542 |
| $ | 3,542 |
| $ | 3,542 |
|
| Total The Bank of New York Mellon Corporation common shareholders’ equity | $ | 36,780 |
| $ | 35,862 |
| $ | 35,767 |
| | $ | 35,876 |
| $ | 35,616 |
| $ | 37,593 |
| $ | 36,952 |
| $ | 34,965 |
|
| | | | | |
| Other information at period end: | | | | |
| Cash dividends per common share | $ | 0.24 |
| $ | 0.19 |
| $ | 0.19 |
| | $ | 0.62 |
| $ | 0.53 |
| $ | 0.24 |
| $ | 0.24 |
| $ | 0.19 |
|
| Common dividend payout ratio | 26 | % | 22 | % | 21 | % | | 23 | % | 22 | % | 22 | % | 22 | % | 23 | % |
Common dividend yield (annualized) | 1.8 | % | 1.5 | % | 1.9 | % | | 1.6 | % | 1.8 | % | 1.9 | % | 1.8 | % | 1.6 | % |
| Closing stock price per common share | $ | 53.02 |
| $ | 51.02 |
| $ | 39.88 |
| | $ | 53.02 |
| $ | 39.88 |
| $ | 51.53 |
| $ | 53.86 |
| $ | 47.23 |
|
| Market capitalization | $ | 54,294 |
| $ | 52,712 |
| $ | 42,167 |
| | $ | 54,294 |
| $ | 42,167 |
| $ | 52,080 |
| $ | 54,584 |
| $ | 49,113 |
|
Book value per common share (a) | $ | 36.11 |
| $ | 35.26 |
| $ | 34.19 |
| | $ | 36.11 |
| $ | 34.19 |
| |
Tangible book value per common share – Non-GAAP (a)(c) | $ | 18.19 |
| $ | 17.53 |
| $ | 16.67 |
| | $ | 18.19 |
| $ | 16.67 |
| |
| Book value per common share | | $ | 37.78 |
| $ | 37.21 |
| $ | 34.23 |
|
Tangible book value per common share – Non-GAAP (a) | | $ | 18.78 |
| $ | 18.24 |
| $ | 16.65 |
|
| Full-time employees | 52,900 |
| 52,800 |
| 52,300 |
| | 52,900 |
| 52,300 |
| 52,100 |
| 52,500 |
| 52,600 |
|
Common shares outstanding (in thousands) | 1,024,022 |
| 1,033,156 |
| 1,057,337 |
| | 1,024,022 |
| 1,057,337 |
| 1,010,676 |
| 1,013,442 |
| 1,039,877 |
|
Consolidated Financial Highlights (unaudited) (continued)
| | | Regulatory and Capital ratios | Sept. 30, 2017 |
| June 30, 2017 |
| Dec. 31, 2016 |
| March 31, 2018 |
| Dec. 31, 2017 |
| March 31, 2017 |
|
Average liquidity coverage ratio (“LCR”) (i) | 119 | % | 116 | % | 114 | % | 116 | % | 118 | % | 117 | % |
| | | |
Regulatory capital ratios: (j)(f) | | |
| Standardized: | | |
| Advanced: | | |
| Common equity Tier 1 (“CET1”) ratio | 12.3 | % | 12.0 | % | 12.3 | % | 10.7 | % | 10.3 | % | 10.0 | % |
| Tier 1 capital ratio | 14.6 |
| 14.3 |
| 14.5 |
| 12.7 |
| 12.3 |
| 12.1 |
|
| Total (Tier 1 plus Tier 2) capital ratio | 15.6 |
| 14.8 |
| 15.2 |
| 13.4 |
| 13.0 |
| 12.4 |
|
| Advanced: | | |
| Standardized: | | |
| CET1 ratio | 11.1 |
| 10.8 |
| 10.6 |
| 11.7 | % | 11.5 | % | 11.5 | % |
| Tier 1 capital ratio | 13.2 |
| 12.9 |
| 12.6 |
| 14.0 |
| 13.7 |
| 13.9 |
|
| Total (Tier 1 plus Tier 2) capital ratio | 14.0 |
| 13.2 |
| 13.0 |
| 14.9 |
| 14.7 |
| 14.5 |
|
| | | |
Leverage capital ratio (j) | 6.8 |
| 6.7 |
| 6.6 |
| |
Tier 1 leverage ratio (f) | | 6.5 | % | 6.4 | % | 6.4 | % |
Supplementary leverage ratio (“SLR”) (j)(f) | 6.3 |
| 6.2 |
| 6.0 |
| 5.9 |
| 5.9 |
| 5.9 |
|
| | | |
| BNY Mellon shareholders’ equity to total assets ratio – GAAP | 11.4 |
| 11.3 |
| 11.6 |
| |
| BNY Mellon common shareholders’ equity to total assets ratio – GAAP | 10.4 |
| 10.3 |
| 10.6 |
| |
| | | |
Selected regulatory capital ratios – fully phased-in – Non-GAAP: (k) | | |
| Estimated CET1 ratio: | | |
| Standardized Approach | 11.9 | % | 11.5 | % | 11.3 | % | |
| Advanced Approach | 10.7 |
| 10.4 |
| 9.7 |
| |
| | | |
| Estimated SLR | 6.1 |
| 6.0 |
| 5.6 |
| |
| BNY Mellon shareholders’ equity to total assets ratio | | 11.2 | % | 11.1 | % | 11.6 | % |
| BNY Mellon common shareholders’ equity to total assets ratio | | 10.2 |
| 10.1 |
| 10.5 |
|
| |
| (a) | See “Supplemental information – Explanation of GAAP and Non-GAAP financial measures” beginningReturn on page 49 for a reconciliation of Non-GAAP measures. |
| |
(b) | Non-GAAP information for all periods presented excludes the amortization of intangible assets and merger and integration (“M&I”), litigation and restructuring charges. Non-GAAP information for the third quarter of 2016 and for the first nine months of 2016 also excludes a recovery of the previously impaired loan to Sentinel Management Group, Inc. (“Sentinel”). Additionally, the pre-tax operating margin (Non-GAAP) excludes the net income attributable to noncontrolling interests of consolidated investment management funds. |
| |
(c) | Tangibletangible common equity – Non-GAAP and tangible book value, per common share – Non-GAAP measures, exclude goodwill and intangible assets, net of deferred tax liabilities. See “Supplemental information – Explanation of GAAP and Non-GAAP financial measures” beginning on page 4940 for the reconciliation of Non-GAAP measures. |
| |
(d)(b) | See “Average balances and interest rates” on page 119 for a reconciliation of this Non-GAAP measures.measure. |
| |
(e)(c) | Excludes securities lending cash management assets and assets managed in the Investment Services business. |
| |
(f) | Includes the AUC/A of CIBC Mellon Global Securities Services Company (“CIBC Mellon”), a joint venture with the Canadian Imperial Bank of Commerce, of $1.3 trillion at Sept. 30,March 31, 2018 and Dec. 31, 2017 and $1.2 trillionat both June 30, 2017 and Sept. 30, 2016.March 31, 2017. |
| |
(g)(d) | Excludes securities lending cash management assets and assets managed in the Investment Services business. |
| |
| (e) | Represents the total amount of securities on loan in our agency securities lending program managed by the Investment Services business. Excludes securities for which BNY Mellon acts as an agent on behalf of CIBC Mellon clients, which totaled $68$73 billion at Sept. 30, 2017, $66March 31, 2018, $71 billion at June 30,Dec. 31, 2017 and $64$65 billion at Sept. 30, 2016.March 31, 2017. |
| |
(h) | Beginning in the third quarter of 2017, vested stock awards to retirement eligible employees are included in common shares outstanding for earnings per share purposes. This change increased both average basic and average diluted shares outstanding by approximately 6 million for the quarter, which resulted in a de minimis impact to both basic and diluted earnings per share. For additional information, see the “Consolidated Income Statement” beginning on page 57. |
| |
(i) | For additional information on our LCR, see “Liquidity and dividends” beginning on page 33. |
| |
(j)(f) | For our CET1, Tier 1 capital and Total capital ratios, our effective capital ratios under U.S. capital rules are the lower of the ratios as calculated under the Standardized and Advanced Approaches. The leveragerisk-based regulatory capital ratio is based on Tier I capital, as phased-in, and quarterly average total assets. The SLR is based onratios, Tier 1 capital, asleverage ratio and SLR are presented on a fully phased-in basis for Dec. 31, 2017 and average quarterly assets and certain off-balance sheet exposures.March 31, 2017. Beginning Jan. 1, 2018, regulatory ratios are fully phased-in. For additional information on our capital ratios, see “Capital” beginning on page 37. |
| |
(k) | The estimated fully phased-in CET1 and SLR ratios (Non-GAAP) are based on our interpretation of the U.S. capital rules, which are being gradually phased-in over a multi-year period. For additional information on these Non-GAAP ratios, see “Capital” beginning on page 37.31. |
|
|
Part I - Financial Information
|
|
|
| Items 2. and 3. Management’s Discussion and Analysis of Financial Condition and Results of Operations; Quantitative and Qualitative Disclosures about Market Risk |
General
In this Quarterly Report on Form 10-Q, references to “our,” “we,” “us,” “BNY Mellon,” the “Company” and similar terms refer to The Bank of New York Mellon Corporation and its consolidated subsidiaries. The term “Parent” refers to The Bank of New York Mellon Corporation but not its subsidiaries.
Certain business terms used in this report are defined in the Glossary included in our Annual Report on Form 10-K for the year ended Dec. 31, 20162017 (“20162017 Annual Report”).
The following should be read in conjunction with the Consolidated Financial Statements included in this report. Investors should also read the section titled “Forward-looking Statements.”���
How we reported results
Throughout this Form 10-Q, certain measures which are noted as “Non-GAAP financial measures,measures.” excludeThese items include the return on tangible common equity and tangible book value, net interest revenue and net interest margin both presented on an FTE basis, the growth rates for investment management and performance fees on a constant currency basis and the pre-tax operating margin for the Investment Management business. See “Supplemental information - Explanation of GAAP and Non-GAAP financial measures” beginning on page 40 for a reconciliation of the financial measures presented on a Non-GAAP basis, other than net interest revenue and net interest margin on an FTE basis. See “Net interest revenue,” including “Average balances and interest rates” beginning on page 8 for information on measures presented on an FTE basis.
In addition, certain items or otherwise include components that differ from U.S. generally accepted accounting principles (“GAAP”). BNY Mellon believes that these measures are useful to investors because they permit a focus on period-to-period comparisons using measures that relate to our ability to enhance revenues and limit expenses in circumstances where such matters are within our control or because they provide additional information about our ability to meet fully phased-in capital requirements. Certain immaterial reclassifications have been made to prior periods to place them on a basis comparable with the current period presentation. See “Supplemental information - Explanation of GAAP and Non-GAAP financial measures” beginning on page 49 for a reconciliation of financial measures presented in accordance with GAAP to adjusted Non-GAAP financial measures. See “Net interest revenue,” including the “Average balances and interest rates” beginning on page 10 for information on measures presented on a fully taxable equivalent basis. Also see “Capital” beginning on page 37 for information on our fully phased-in capital requirements.
Overview
The Bank of New York Mellon Corporation wasEstablished in 1784 by Alexander Hamilton, we were the first company listed on the New York Stock Exchange (NYSE: BK). With a richmore than 230-year history, ofmaintaining our financial strength and stability through all business cycles, BNY Mellon is a global investments company dedicated to improving lives through investing.that
We managemanages and serviceservices assets for financial institutions, corporations and individual investors in 35 countries and more than 100 markets. As of Sept. 30, 2017, BNY Mellon had $32.2 trillion in assets under custody and/or administration (“AUC/A”), and $1.8 trillion in assets under management (“AUM”). countries.
BNY Mellon is focused on enhancing our clients’ experience by leveraging our scalehas two business segments, Investment Services and Investment Management, which offer a comprehensive set of capabilities and deep expertise across the investment lifecycle, enabling the company to deliver innovative and strategicprovide solutions for our clients, and building trusted relationships that drive value. We hold a unique position in the global financial services industry. We service both theto buy-side and sell-side providing us with distinctive marketplace insights that enable us to support our clients’ success.market participants, as well as leading institutional and wealth management clients globally.
BNY Mellon’s businesses benefit from global growthThe diagram below presents our two business segments and lines of business, with the remaining operations in financial assets, the globalization of the investment process, changes in demographics and the continued evolution of the regulatory landscape—each providing us with opportunities to advise and service clients.Other segment.
Key third quarter 2017 events
Definitive agreement to sell CenterSquare Investment Management
In September 2017, we announced that we entered into a definitive agreement to sell CenterSquare Investment Management (“CenterSquare”), one of our Investment Management boutiques. CenterSquare had approximately $9 billion in AUM in U.S. and global real estate and infrastructure investments. The transaction is subject to standard regulatory and other required approvals and is expected to be completed in the fourth quarter of 2017 or first quarter of 2018.
Charles W. Scharf named chief executive officer; Gerald L. Hassell, chairman, to retire
In July 2017, Charles W. Scharf was appointed chief executive officer and member of the board of directors of the Company. Mr. Scharf succeeds Gerald L. Hassell, who will continue as the Company’s chairman of the board of directors until his retirement at the end of the year. After Mr. Hassell’s retirement, Mr. Scharf will become chairman, effective Jan. 1, 2018.
Resolution plan
As required by the Dodd-Frank Act, the Parent must submit annually to the Board of Governors of the Federal Reserve System (“Federal Reserve”) and the Federal Deposit Insurance Corporation (“FDIC”) a plan for its rapid and orderly resolution in the event of material financial distress or failure. The Parent filed its most recent resolution plan on July 1, 2017. We believe the 2017 resolution plan addresses all shortcomings and deficiencies identified by the FDIC and the Federal Reserve in the Company’s 2015 resolution plan. The public portion of our 2017 resolution plan is available on the Federal Reserve’s and FDIC’s websites.
In September 2017, the Federal Reserve and FDIC extended the filing deadline by one year to July 1, 2019 for the Parent’s next resolution plan.
Increase in cash dividend on common stock
BNY Mellon’s 2017 capital plan submitted in connection with our Comprehensive Capital Analysis and Review (“CCAR”) included a 26% increase in the quarterly cash dividend to $0.24 per common share. The first payment of the increased quarterly cash dividend was made on Aug. 11, 2017.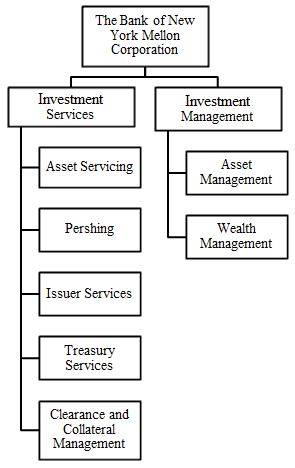
Highlights of thirdfirst quarter 20172018 results
We reported net income applicable to common shareholders of $983 million,$1.14 billion, or $0.94$1.10 per diluted common share, in the thirdfirst quarter of 2017.2018. Net income applicable to common shareholders was $974$880 million, or $0.90$0.83 per diluted common share, in the third quarter of 2016 and $926 million, or $0.88 per diluted common share, in the secondfirst quarter of 2017. The highlights below are based on the first quarter of 2018 compared with the first quarter of 2017 unless otherwise noted.
Total revenue of $4.2 billion increased 9% primarily reflecting:
Fee revenue increased 10% primarily reflecting higher equity market values, the favorable impact of a weaker U.S. dollar, higher performance fees and foreign exchange revenue, and growth in collateral management. (See “Fee and other revenue” beginning on page 6.)
Net interest revenue increased 16% driven by higher interest rates and higher deposits. (See “Net interest revenue” on page 8.)
Weaker U.S. dollar increased total revenue approximately 2%.
Noninterest expense of $2.7 billion increased 4% reflecting the unfavorable impact of a weaker U.S. dollar, higher staff expense and volume-related sub-custodian and clearing expenses, partially offset by lower consulting expense. (See “Noninterest expense” beginning on page 10.)
Weaker U.S. dollar increased expense approximately 3%.
Effective tax rate of 19.5% reflecting a lower federal statutory tax rate. Effective January 2018, the corporate federal tax rate was reduced to 21% from 35% as a result of the Tax Cuts and Jobs Act of 2017 (“U.S. tax legislation”). (See “Income taxes” on page 10.)
Capital and liquidity
CET1 ratio under the Advanced Approach was 10.7% at March 31, 2018 and 10.3%, on a fully phased-in basis, at Dec. 31, 2017. The increase
Highlights of the third quarter of 2017 include:primarily reflects capital generated through earnings and additional paid-in capital resulting from stock awards, partially offset by capital deployed through common stock repurchased and dividends paid. (See “Capital” beginning on page 31.)
Repurchased 11 million common shares for $644 million and paid $246 million in dividends to common shareholders.
Highlights of our principal businesses
Investment Services
Total revenue increased 11%
Income before taxes increased 22%
Record AUC/A totaled a record $32.2of $33.5 trillion, at Sept. 30, 2017 compared with $30.5 trillion at Sept. 30, 2016. The 6% increase primarily reflectsup 9%, reflecting higher market values, the favorable impact of a weaker U.S. dollar and net new business. (See “Investment Services business” beginning on page 19.)
Investment Management
Total revenue increased 13%
Income before taxes increased 38%
AUM totaled a record $1.82of $1.9 trillion at Sept. 30, 2017 compared with $1.72 trillion at Sept. 30, 2016. The 6% increase primarily reflects higher market values, net inflows andincreased 8% reflecting the favorable impact of a weaker U.S. dollar (principally versus the British pound). AUM excludes securities lending cash management assets and assets managed in the Investment Services business. (See “Investment Management business” beginning on page 16.)
Investment services fees totaled $1.92 billion, an increase of 1% compared with $1.89 billion in the third quarter of 2016. The increase primarily reflects, higher money market fees, higher equity market values and net new business,inflows, partially offset by lower Depositary Receipts revenue. (See “Investment Services business” beginning on page 19.)
the divestiture of CenterSquare Investment management and performance fees totaled $901 million, an increase of 5% compared with $860 million in the third quarter of 2016. The increase primarily reflects higher equity market values and money market fees. (See “Investment Management business” beginning on page 16.(“CenterSquare”)
Foreign exchange and other trading revenue totaled $173 million compared with $183 million in the third quarterchanges.
See “Review of 2016. Foreign exchange revenue totaled $158 million, a decrease of 10% compared with $175 million in the third quarter of 2016, primarily reflecting lower volatilitybusinesses” and lower Depositary Receipt-related foreign exchange activity, partially offset by higher volumes. (See “Fee and other revenue” beginningNote 19 for additional information on page 7.)our businesses.
Investment and other income totaled $63 million compared with $92 million in the third quarter of 2016. The decrease primarily reflects lower other income driven by our investments in renewable energy and lower seed capital gains. (See “Fee and other revenue” beginning on page 7.)
Net interest revenue totaled $839 million compared with $774 million in the third quarter of 2016. The 8% increase was primarily driven by higher interest rates, partially offset by lower average deposits and loans. Net interest margin was 1.15% in the third quarter of 2017 compared with 1.05% in the third quarter of 2016. The net interest margin (FTE) (Non-GAAP) was 1.16% in the third quarter of 2017 compared with 1.06% in the third quarter of 2016. (See “Net interest revenue” on page 10.)
The provision for credit losses was a credit of $6 million in the third quarter of 2017 and a credit of $19 million in the third quarter of 2016. (See “Asset quality and allowance for credit losses” beginning on page 29.)
Noninterest expense totaled $2.65 billion compared with $2.64 billion in the third quarter of 2016. The increase primarily reflects higher software and professional, legal and other purchased services expenses, partially offset by lower litigation expense and bank assessment charges. (See “Noninterest expense” beginning on page 13.)
The provision for income taxes was $348 million and the effective rate was 25.4% in the third quarter of 2017 compared with an income tax provision of $324 million and an effective tax rate of 24.6% in the third quarter of 2016. (See “Income taxes” on page 14.)
The net unrealized pre-tax gain on the total investment securities portfolio was $257 million at Sept. 30, 2017 compared with a pre-tax gain of $151 million at June 30, 2017. The increase was primarily driven by a decrease in long-term interest rates. (See “Investment securities” beginning on page 25.)
Our CET1 ratio under the Advanced Approach was 11.1% at Sept. 30, 2017 and 10.8% at June 30, 2017. The increase was primarily driven by CET1 generation. Our CET1 ratio under the Standardized Approach was 12.3% at Sept. 30, 2017 and 12.0% at June 30, 2017. (See “Capital” beginning on page 37.)
Our estimated CET1 ratio (Non-GAAP) calculated under the Advanced Approach on a fully phased-in basis was 10.7% at Sept. 30, 2017 and 10.4% at June 30, 2017. The increase primarily reflects CET1 generation. Our estimated CET1 ratio (Non-GAAP) calculated under the Standardized Approach on a fully phased-in basis was 11.9% at Sept. 30, 2017 and 11.5% at June 30, 2017. (See “Capital” beginning on page 37.)
Fee and other revenue
| | | Fee and other revenue | | | | | YTD17 |
| | 1Q18 vs. |
| | | 3Q17 vs. | | | vs. | |
| (dollars in millions, unless otherwise noted) | 3Q17 |
| 2Q17 |
| 3Q16 |
| 2Q17 |
| 3Q16 |
| | YTD17 |
| YTD16 |
| YTD16 |
| 1Q18 |
| 4Q17 |
| 1Q17 |
| 4Q17 |
| 1Q17 |
|
| Investment services fees: | | | | | | | |
Asset servicing (a) | $ | 1,105 |
| $ | 1,085 |
| $ | 1,067 |
| 2 | % | 4 | % | | $ | 3,253 |
| $ | 3,176 |
| 2 | % | $ | 1,168 |
| $ | 1,130 |
| $ | 1,063 |
| 3 | % | 10 | % |
| Clearing services | 383 |
| 394 |
| 349 |
| (3 | ) | 10 |
| | 1,153 |
| 1,049 |
| 10 |
| 414 |
| 400 |
| 376 |
| 4 |
| 10 |
|
| Issuer services | 288 |
| 241 |
| 337 |
| 20 |
| (15 | ) | | 780 |
| 815 |
| (4 | ) | 260 |
| 197 |
| 251 |
| 32 |
| 4 |
|
| Treasury services | 141 |
| 140 |
| 137 |
| 1 |
| 3 |
| | 420 |
| 407 |
| 3 |
| 138 |
| 137 |
| 139 |
| 1 |
| (1 | ) |
| Total investment services fees | 1,917 |
| 1,860 |
| 1,890 |
| 3 |
| 1 |
| | 5,606 |
| 5,447 |
| 3 |
| 1,980 |
| 1,864 |
| 1,829 |
| 6 |
| 8 |
|
| Investment management and performance fees | 901 |
| 879 |
| 860 |
| 3 |
| 5 |
| | 2,622 |
| 2,502 |
| 5 |
| 960 |
| 962 |
| 842 |
| — |
| 14 |
|
| Foreign exchange and other trading revenue | 173 |
| 165 |
| 183 |
| 5 |
| (5 | ) | | 502 |
| 540 |
| (7 | ) | 209 |
| 166 |
| 164 |
| 26 |
| 27 |
|
| Financing-related fees | 54 |
| 53 |
| 58 |
| 2 |
| (7 | ) | | 162 |
| 169 |
| (4 | ) | 52 |
| 54 |
| 55 |
| (4 | ) | (5 | ) |
| Distribution and servicing | 40 |
| 41 |
| 43 |
| (2 | ) | (7 | ) | | 122 |
| 125 |
| (2 | ) | 36 |
| 38 |
| 41 |
| (5 | ) | (12 | ) |
| Investment and other income | 63 |
| 122 |
| 92 |
| N/M |
| N/M |
| | 262 |
| 271 |
| N/M |
| |
| Investment and other income (loss) | | 82 |
| (198 | ) | 77 |
| N/M |
| Total fee revenue | 3,148 |
| 3,120 |
| 3,126 |
| 1 |
| 1 |
| | 9,276 |
| 9,054 |
| 2 |
| 3,319 |
| 2,886 |
| 3,008 |
| 15 |
| 10 |
|
| Net securities gains | 19 |
| — |
| 24 |
| N/M |
| N/M |
| | 29 |
| 65 |
| N/M | |
| Net securities (losses) gains | | (49 | ) | (26 | ) | 10 |
| N/M |
| Total fee and other revenue | $ | 3,167 |
| $ | 3,120 |
| $ | 3,150 |
| 2 | % | 1 | % | | $ | 9,305 |
| $ | 9,119 |
| 2 | % | $ | 3,270 |
| $ | 2,860 |
| $ | 3,018 |
| 14 | % | 8 | % |
| | | | | | | | |
| Fee revenue as a percentage of total revenue | 78 | % | 79 | % | 79 | % | | | 79 | % | 79 | % | | 79 | % | 77 | % | 78 | % | |
| | | | | | | | |
AUM at period end (in billions) (b) | $ | 1,824 |
| $ | 1,771 |
| $ | 1,715 |
| 3 | % | 6 | % | | $ | 1,824 |
| $ | 1,715 |
| 6 | % | $ | 1,868 |
| $ | 1,893 |
| $ | 1,727 |
| (1 | )% | 8 | % |
AUC/A at period end (in trillions) (c) | $ | 32.2 |
| $ | 31.1 |
| $ | 30.5 |
| 4 | % | 6 | % | | $ | 32.2 |
| $ | 30.5 |
| 6 | % | $ | 33.5 |
| $ | 33.3 |
| $ | 30.6 |
| 1 | % | 9 | % |
| |
| (a) | Asset servicing fees include securities lending revenue of $47$55 million in the thirdfirst quarter of 2017, $48 million in the second quarter of 2017,2018, $51 million in the thirdfourth quarter of 2016, $1442017 and $49 million in the first nine monthsquarter of 2017 and $153 million in the first nine months of 2016.2017. |
| |
| (b) | Excludes securities lending cash management assets and assets managed in the Investment Services business. |
| |
| (c) | Includes the AUC/A of CIBC Mellon of $1.3 trillion at Sept. 30,March 31, 2018 and Dec. 31, 2017 and $1.2 trillion at both June 30, 2017 and Sept. 30, 2016. March 31, 2017. |
N/M - Not meaningful.
Fee and other revenue increased 1%8% compared with the thirdfirst quarter of 20162017 and 2%14% (unannualized) compared with the secondfourth quarter of 2017. The increase compared with the thirdfirst quarter of 20162017 primarily reflects higher investment management and performance fees, asset servicing fees, and clearing services fees, partially offset by lower issuer services fees, investment and other income and foreign exchange and other trading revenue.revenue and clearing services fees. The increase compared with the secondfourth quarter of 2017 primarily reflects seasonally higher investment and other income, issuer services fees, investment managementforeign exchange and performance fees,other trading revenue and asset servicing fees and net securities gains,fees. Both increases were partially offset by lower investment and other income.net securities losses.
Investment services fees
Investment services fees were impacted by the following compared with the thirdfirst quarter of 20162017 and the secondfourth quarter of 2017:
Asset servicing fees increased 4%10% compared with the thirdfirst quarter of 20162017 and 2%3% (unannualized) compared with the secondfourth quarter of 2017. The
increase compared with the third quarter of 2016Both increases primarily reflectsreflect higher equity market values, and net new business, including growth in collateral management, partially offset by the impact of downsizing the retail UK transfer agency business. The increase compared with the second quarter of 2017 was primarily driven by the favorable impact of a weaker U.S. dollar and higher equity market values.net new business, including growth in collateral management.
Clearing services fees increased 10% compared with the thirdfirst quarter of 20162017 and decreased 3%4% (unannualized) compared with the secondfourth quarter of 2017. The increase wasBoth increases were primarily driven by higher money market fees anddue to growth in long-term mutual fund assets. The decrease primarily reflects lowerbalances and clearance volumes.
Issuer services fees decreased 15%increased 4% compared with the thirdfirst quarter of 20162017 and increased 20%32% (unannualized) compared with the secondfourth quarter of 2017. The decrease primarily reflects fewer corporate actions, lost business and lower fees due to a reduction in shares outstanding in certain depositary receipts programs, partially offset by higher Corporate Trust revenue. The increase
compared with the secondfirst quarter of 2017 primarily reflects seasonalityhigher fees in Corporate Trust as well as the favorable impact of a weaker U.S. dollar. The increase compared with the fourth quarter of 2017 primarily reflects seasonally higher Depositary Receipts revenue and higher Corporate Trust revenue.
Treasury services fees increased 3%decreased 1% compared with the thirdfirst quarter of 20162017 and increased 1% (unannualized) compared with the secondfourth quarter of 2017. Both increases primarily reflectcomparisons were impacted by the offsetting impact of higher payment volumes, partially offset by higher compensating balance credits provided to clients, which reducesreduce fee revenue and increasesincrease net interest revenue.revenue and higher payment volumes.
See the “Investment Services business” in “Review of businesses” for additional details.
Investment management and performance fees
Investment management and performance fees increased 5%14% compared with the thirdfirst quarter of 20162017 and 3%decreased slightly (unannualized) compared with the secondfourth quarter of 2017, primarily reflecting higher equity market values and money market fees. The increase compared with the third quarter of 2016 also reflects higher performance fees. The increase compared with the second quarter of 2017 also reflects the favorable impact of2017. On a weaker U.S. dollar. Changes inconstant currency rates had an insignificant impact on the growth rate ofbasis (Non-GAAP), investment management and performance fees increased 9% compared with the thirdfirst quarter of 2016.2017. Performance fees were $15$48 million in the thirdfirst quarter of 2018, $12 million in the first quarter of 2017 $8and $50 million in the third quarter of 2016 and $17 million in the secondfourth quarter of 2017.
Total AUM for the Investment Management business increased 6%was $1.9 trillion, an increase of 8% compared with Sept. 30, 2016March 31, 2017 and 3%a decrease of 1% compared with June 30,Dec. 31, 2017. The increase compared with Sept. 30, 2016 primarily reflects higher market values, net inflows and the favorable impact of a weaker U.S. dollar (principally versus the British pound). The increase compared with June 30, 2017 primarily reflects the favorable impact of a weaker U.S. dollar (principally versus the British pound), higher market values and net inflows. Net long-term inflows of fixed income and multi-asset and alternative investments were offset by outflows of index, equity and liability-driven investments in the third quarter of 2017. Net short-term inflows of $10 billion in the third quarter of 2017 were a result of increased distribution through our liquidity portals.
See the “Investment Management business” in “Review of businesses” for additional details regarding the drivers of investment management and performance fees.fees, AUM and AUM flows.
Foreign exchange and other trading revenue
| | | Foreign exchange and other trading revenue | Foreign exchange and other trading revenue | | Foreign exchange and other trading revenue | |
| (in millions) | 3Q17 |
| 2Q17 |
| 3Q16 |
| YTD17 |
| YTD16 |
| 1Q18 |
| 4Q17 |
| 1Q17 |
|
| Foreign exchange | $ | 158 |
| $ | 151 |
| $ | 175 |
| $ | 463 |
| $ | 512 |
| $ | 183 |
| $ | 175 |
| $ | 154 |
|
| Other trading revenue | 15 |
| 14 |
| 8 |
| 39 |
| 28 |
| |
| Other trading revenue (loss) | | 26 |
| (9 | ) | 10 |
|
| Total foreign exchange and other trading revenue | $ | 173 |
| $ | 165 |
| $ | 183 |
| $ | 502 |
| $ | 540 |
| $ | 209 |
| $ | 166 |
| $ | 164 |
|
Foreign exchange and other trading revenue decreased 5% compared with the third quarter of 2016 and increased 5% (unannualized) compared with the second quarter of 2017.
Foreign exchange revenue is primarily driven by the volume of client transactions and the spread realized on these transactions, both of which are impacted by market volatility, and the impact of foreign currency hedging activities. Foreign exchange revenue decreased 10%increased 19% compared with the thirdfirst quarter of 2016, primarily reflecting lower volatility2017 and lower Depositary Receipt-related foreign exchange activity, partially offset by higher volumes. Foreign exchange revenue increased 5% (unannualized) compared with the secondfourth quarter of 2017. The increases primarily reflect higher volumes. The increase compared with the fourth quarter of 2017 reflectingalso reflects higher volumes.volatility. The increase in other trading revenue for both comparisons was primarily driven by hedging activities in the Investment Management business. Foreign exchange revenue is primarily reported in the Investment Services business and, to a lesser extent, the Investment Management business and the Other segment.
Our custody clients may enter into foreign exchange transactions in a number of ways, including through our standing instruction programs. While the shift of custody clients from our standing instruction programs to other trading options has abated, our foreign exchange revenue continues to be impacted by changes in volume and volatility. For the quarter ended Sept. 30, 2017, our total revenue for all types of foreign exchange trading transactions was $158 million, or 4% of our total revenue, and approximately 28% of our foreign exchange revenue was generated by transactions in our standing instruction programs.
Financing-related fees
Financing-related fees, which are primarily reported in the Investment Services business and the Other
segment, include capital markets fees, loan commitment fees and credit-related fees. Financing-relatedBoth decreases primarily reflect lower fees decreasedfrom standby letters of credit and lower syndication fees. The decrease compared with the third quarter of 2016 primarily reflecting lower syndication fees. Financing-related fees increased compared with the secondfourth quarter of 2017 primarily reflectingwas partially offset by higher underwriting fees.
Distribution and servicing fees
DistributionThe decrease in distribution and servicing fees decreased compared with the thirdfirst quarter of 20162017 primarily reflectingreflects lower fees paid to introducing brokers, partially offset by higherfrom money market fees.funds.
Investment and other income
The following table provides the components of investment and other income.
| | | Investment and other income | Investment and other income | | Investment and other income | |
| (in millions) | 3Q17 |
| 2Q17 |
| 3Q16 |
| YTD17 |
| YTD16 |
| 1Q18 |
| 4Q17 |
| 1Q17 |
|
| Asset-related gains | | $ | 46 |
| $ | — |
| $ | 3 |
|
| Corporate/bank-owned life insurance | $ | 37 |
| $ | 43 |
| $ | 34 |
| $ | 110 |
| $ | 96 |
| 36 |
| 43 |
| 30 |
|
| Expense reimbursements from joint venture | | 16 |
| 15 |
| 14 |
|
Seed capital gains (a) | | — |
| 7 |
| 9 |
|
| Lease-related gains | — |
| 51 |
| — |
| 52 |
| 44 |
| — |
| 4 |
| 1 |
|
| Expense reimbursements from joint venture | 18 |
| 17 |
| 18 |
| 49 |
| 52 |
| |
| Equity investment income (loss) | — |
| 7 |
| (1 | ) | 33 |
| (8 | ) | |
Seed capital gains (a) | 6 |
| 10 |
| 16 |
| 25 |
| 38 |
| |
| Asset-related gains (losses) | 1 |
| (5 | ) | 8 |
| (1 | ) | 9 |
| |
| Other income (loss) | 1 |
| (1 | ) | 17 |
| (6 | ) | 40 |
| |
| Total investment and other income | $ | 63 |
| $ | 122 |
| $ | 92 |
| $ | 262 |
| $ | 271 |
| |
| Equity investment income | | — |
| 4 |
| 26 |
|
| Other (loss) | | (16 | ) | (271 | ) | (6 | ) |
| Total investment and other income (loss) | | $ | 82 |
| $ | (198 | ) | $ | 77 |
|
| |
| (a) | Excludes the gains (losses) on seed capital investments ingains related to consolidated investment management funds, which are reflected in operations of consolidated investment management funds, net of noncontrolling interests. The gains on seed capital investments in consolidated investment management funds were $7 million in the third quarter of 2017, $7 million in the second quarter of 2017, $8 million in the third quarter of 2016, $29 million in the first nine months of 2017 and $15 million in the first nine months of 2016.funds. |
Investment and other income decreasedincreased compared with both the thirdfirst quarter of 20162017 and secondthe fourth quarter of 2017. The decreaseincrease compared with the thirdfirst quarter of 20162017 primarily reflects lowerhigher asset related gains, including the gain on the sale of CenterSquare, partially offset by a gain on an equity investment recorded in the first quarter of 2017 and decreases in other income driven bydue to our increased pre-tax losses on our investments in renewable energy and lower seed capital gains. The pre-taxenergy. Pre-tax losses on theour renewable energy investments are offset by corresponding tax benefits and credits recorded as a reduction to the provision forcredits. The increase in investment and other income taxes. The decrease compared with the secondfourth quarter of 2017 primarily reflects lease-related gainsthe impact of U.S. tax legislation on our renewable energy investments recorded in the secondfourth quarter of 2017.
Net securities losses
Net securities losses recorded in the first quarter of 2018 and fourth quarter of 2017 and lower income from corporate/bank-owned life insurance.
Year-to-date 2017 compared with year-to-date 2016
Fee and other revenue increased 2% compared withprimarily relate to the first nine monthssale of 2016, primarily reflecting higher investment management and performance fees, clearing services fees and asset servicing fees, partially offset by lower foreign exchange and other trading revenue, net securities gains and issuer services fees. The 5% increase in investment management and performance fees primarily reflects higher market values, money market fees and performance fees, partially offset by the unfavorable impact of a stronger U.S. dollar (principally versus the British pound). The 10% increase in clearing services fees primarily reflects higher money market fees and growth in long-term mutual fund assets. The 2% increase in asset servicing fees primarily reflects net new business, including growth in collateral management and higher equity market values, partially offset by the unfavorable impact of a stronger U.S. dollar and the impact of downsizing the retail UK transfer agency business. The 7% decrease in foreign exchange and other trading revenue primarily reflects lower volatility and lower Depositary Receipts-related foreign exchange activity. The 4% decrease in issuer services fees primarily reflects lower Depositary Receipts revenue.
debt securities.
Net interest revenue
| | | Net interest revenue | | | | | YTD17 |
| | 1Q18 vs. |
| | | 3Q17 vs. | | | vs. | |
| (dollars in millions) | 3Q17 |
| 2Q17 |
| 3Q16 |
| 2Q17 |
| 3Q16 |
| | YTD17 |
| YTD16 |
| YTD16 |
| 1Q18 |
| 4Q17 |
| 1Q17 |
| 4Q17 |
| 1Q17 |
|
| Net interest revenue | $ | 839 |
| $ | 826 |
| $ | 774 |
| 2 | % | 8 | % | | $ | 2,457 |
| $ | 2,307 |
| 7 | % | $ | 919 |
| $ | 851 |
| $ | 792 |
| 8 | % | 16 | % |
| Tax equivalent adjustment | 12 |
| 12 |
| 12 |
| N/M | | 36 |
| 39 |
| N/M | |
| Add: Tax equivalent adjustment | | 6 |
| 11 |
| 12 |
| N/M |
Net interest revenue (FTE) – Non-GAAP (a) | $ | 851 |
| $ | 838 |
| $ | 786 |
| 2 | % | 8 | % | | $ | 2,493 |
| $ | 2,346 |
| 6 | % | $ | 925 |
| $ | 862 |
| $ | 804 |
| 7 | % | 15 | % |
| | | | | | | | |
| Average interest-earning assets | $ | 291,841 |
| $ | 289,496 |
| $ | 296,703 |
| 1 | % | (2 | )% | | $ | 288,283 |
| $ | 308,560 |
| (7 | )% | $ | 302,069 |
| $ | 297,166 |
| $ | 283,421 |
| 2 | % | 7 | % |
| | | | | | | | |
| Net interest margin | 1.15 | % | 1.14 | % | 1.05 | % | 1 | bps | 10 | bps | | 1.14 | % | 1.00 | % | 14 | bps | 1.22 | % | 1.14 | % | 1.13 | % | 8 | bps | 9 | bps |
Net interest margin (FTE) – Non-GAAP (a) | 1.16 | % | 1.16 | % | 1.06 | % | — |
| 10 | bps | | 1.16 | % | 1.02 | % | 14 | bps | 1.23 | % | 1.16 | % | 1.14 | % | 7 | bps | 9 | bps |
| |
| (a) | Net interest revenue (FTE) – Non-GAAP and net interest margin (FTE) – Non-GAAP include the tax equivalent adjustments on tax-exempt income which allows for comparisons of amounts arising from both taxable and tax-exempt sources and is consistent with industry practice. The adjustment to an FTE basis has no impact on net income. |
FTE - fully taxable equivalent.
N/M - Not meaningful.
bps - basis points.
Net interest revenue increased 8%16% compared with the thirdfirst quarter of 20162017 and 2%8% (unannualized) compared with the secondfourth quarter of 2017. Both increases primarily reflect higher interest rates and deposits. The increase compared with the first quarter of 2017 was partially offset by higher average long-term debt. The increase compared with the fourth quarter of 2017 was also favorably impacted by interest rate hedging activities.
Net interest margin increased9 basis points compared with the first quarter of 2017 and 8 basis points
compared with the fourth quarter of 2017. Both increases primarily reflectingreflect higher interest rates, partially offset by lowerhigher average deposits and loans. The sequential increase also reflects an additional interest-earning day during the quarter.assets.
Net interest margin increased 10 basis points compared with the third quarter of 2016, primarily reflecting the factors listed above.
Average non-U.S. dollar deposits comprised approximately 30% of our average total deposits in the thirdfirst quarter of 2017.2018. Approximately 45% of the average non-U.S. dollar deposits in the thirdfirst quarter of 20172018 were euro-denominated.
Year-to-date 2017 compared with year-to-date 2016
Net interest revenue increased 7% compared with the first nine months of 2016, primarily driven by higher interest rates and lower premium amortization, partially offset by lower average deposits and interest-earning assets. The increase in the net interest margin was primarily driven by the factors listed above.
| | | Average balances and interest rates | Quarter ended | Quarter ended |
| | Sept. 30, 2017 | | June 30, 2017 | | Sept. 30, 2016 | March 31, 2018 | | Dec. 31, 2017 | | March 31, 2017 |
| (dollar amounts in millions, presented on an FTE basis) | Average balance |
| Interest |
| Average rates |
| | Average balance |
| Interest |
| Average rates |
| | Average balance |
| Interest |
| Average rates |
| |
| (dollars in millions, presented on an FTE basis) | | Average balance |
| Interest |
| Average rates |
| | Average balance |
| Interest |
| Average rates |
| | Average balance |
| Interest |
| Average rates |
|
| Assets | | | | | | | | | | | | | | | | |
| Interest-earning assets: | | | | | | | | | | | | | | | | |
| Interest-bearing deposits with banks (primarily foreign banks) | $ | 15,899 |
| $ | 34 |
| 0.86 | % | | $ | 14,832 |
| $ | 27 |
| 0.73 | % | | $ | 14,066 |
| $ | 26 |
| 0.74 | % | $ | 13,850 |
| $ | 42 |
| 1.25 | % | | $ | 14,068 |
| $ | 37 |
| 1.03 | % | | $ | 14,714 |
| $ | 22 |
| 0.60 | % |
| Interest-bearing deposits held at the Federal Reserve and other central banks | 70,430 |
| 89 |
| 0.50 |
| | 69,316 |
| 71 |
| 0.41 |
| | 74,102 |
| 37 |
| 0.20 |
| 79,068 |
| 126 |
| 0.64 |
| | 74,961 |
| 102 |
| 0.54 |
| | 66,043 |
| 57 |
| 0.35 |
|
| Federal funds sold and securities purchased under resale agreements | 28,120 |
| 119 |
| 1.67 |
| | 26,873 |
| 86 |
| 1.29 |
| | 26,376 |
| 62 |
| 0.93 |
| 27,903 |
| 170 |
| 2.47 |
| | 28,417 |
| 151 |
| 2.11 |
| | 25,312 |
| 67 |
| 1.07 |
|
| Margin loans | 13,206 |
| 87 |
| 2.60 |
| | 15,058 |
| 87 |
| 2.32 |
| | 18,132 |
| 67 |
| 1.48 |
| 15,674 |
| 115 |
| 2.98 |
| | 14,018 |
| 94 |
| 2.67 |
| | 15,753 |
| 75 |
| 1.94 |
|
| Non-margin loans: | | | | | | | | | | | | | | | | |
| Domestic offices | 29,950 |
| 216 |
| 2.87 |
| | 30,734 |
| 207 |
| 2.70 |
| | 30,534 |
| 171 |
| 2.22 |
| 30,415 |
| 228 |
| 3.02 |
| | 30,462 |
| 208 |
| 2.73 |
| | 30,963 |
| 188 |
| 2.44 |
|
| Foreign offices | 12,788 |
| 67 |
| 2.09 |
| | 13,001 |
| 65 |
| 1.99 |
| | 12,912 |
| 47 |
| 1.45 |
| 12,517 |
| 77 |
| 2.51 |
| | 12,292 |
| 69 |
| 2.21 |
| | 13,596 |
| 57 |
| 1.71 |
|
| Total non-margin loans | 42,738 |
| 283 |
| 2.64 |
| | 43,735 |
| 272 |
| 2.49 |
| | 43,446 |
| 218 |
| 1.99 |
| 42,932 |
| 305 |
| 2.87 |
| | 42,754 |
| 277 |
| 2.58 |
| | 44,559 |
| 245 |
| 2.22 |
|
| Securities: | | | | | | | | | | | | | | | | |
| U.S. Government obligations | 25,349 |
| 106 |
| 1.67 |
| | 25,928 |
| 106 |
| 1.64 |
| | 25,279 |
| 94 |
| 1.49 |
| 23,460 |
| 109 |
| 1.88 |
| | 25,195 |
| 109 |
| 1.71 |
| | 26,239 |
| 104 |
| 1.60 |
|
| U.S. Government agency obligations | 61,710 |
| 309 |
| 2.00 |
| | 59,533 |
| 290 |
| 1.95 |
| | 56,464 |
| 240 |
| 1.70 |
| 62,975 |
| 350 |
| 2.23 |
| | 62,889 |
| 325 |
| 2.07 |
| | 56,857 |
| 271 |
| 1.90 |
|
State and political subdivisions – tax-exempt | 3,226 |
| 25 |
| 3.06 |
| | 3,298 |
| 26 |
| 3.09 |
| | 3,598 |
| 27 |
| 2.98 |
| 2,875 |
| 19 |
| 2.62 |
| | 3,010 |
| 23 |
| 3.10 |
| | 3,373 |
| 26 |
| 3.11 |
|
| Other securities | 28,804 |
| 98 |
| 1.34 |
| | 28,468 |
| 81 |
| 1.15 |
| | 33,064 |
| 102 |
| 1.23 |
| 29,149 |
| 123 |
| 1.69 |
| | 29,131 |
| 98 |
| 1.34 |
| | 28,317 |
| 88 |
| 1.25 |
|
Trading securities | 2,359 |
| 13 |
| 2.26 |
| | 2,455 |
| 18 |
| 2.85 |
| | 2,176 |
| 13 |
| 2.62 |
| 4,183 |
| 28 |
| 2.62 |
| | 2,723 |
| 14 |
| 2.02 |
| | 2,254 |
| 17 |
| 3.12 |
|
| Total securities | 121,448 |
| 551 |
| 1.81 |
| | 119,682 |
| 521 |
| 1.74 |
| | 120,581 |
| 476 |
| 1.58 |
| 122,642 |
| 629 |
| 2.05 |
| | 122,948 |
| 569 |
| 1.85 |
| | 117,040 |
| 506 |
| 1.74 |
|
Total interest-earning assets (a) | $ | 291,841 |
| $ | 1,163 |
| 1.59 | % | | $ | 289,496 |
| $ | 1,064 |
| 1.47 | % | | $ | 296,703 |
| $ | 886 |
| 1.19 | % | $ | 302,069 |
| $ | 1,387 |
| 1.85 | % | | $ | 297,166 |
| $ | 1,230 |
| 1.65 | % | | $ | 283,421 |
| $ | 972 |
| 1.38 | % |
| Allowance for loan losses | (165 | ) | | | | (164 | ) | | | | (165 | ) | | | |
| Cash and due from banks | 4,961 |
| | | | 4,972 |
| | | | 4,189 |
| | | |
| Other assets | 48,329 |
| | | | 47,303 |
| | | | 49,463 |
| | | |
| Assets of consolidated investment management funds | 743 |
| | | | 908 |
| | | | 1,040 |
| | | |
| Noninterest-earnings assets | | 56,106 |
| | | | 53,620 |
| | | | 52,779 |
| | |
| Total assets | $ | 345,709 |
| | | | $ | 342,515 |
| | | | $ | 351,230 |
| | | $ | 358,175 |
| | | | $ | 350,786 |
| | | | $ | 336,200 |
| | |
| Liabilities | | | | | | | | | | | | | | | | |
| Interest-bearing liabilities: | | | | | | | | | | | | | | | | |
| Interest-bearing deposits: | | | | | | | | | | | | | | | | |
| Money market rate accounts | $ | 7,509 |
| $ | 1 |
| 0.06 | % | | $ | 7,379 |
| $ | 1 |
| 0.04 | % | | $ | 7,346 |
| $ | 1 |
| 0.06 | % | $ | 8,359 |
| $ | 3 |
| 0.14 | % | | $ | 7,642 |
| $ | 1 |
| 0.08 | % | | $ | 7,510 |
| $ | 1 |
| 0.05 | % |
| Savings | 837 |
| 1 |
| 0.76 |
| | 1,014 |
| 2 |
| 0.75 |
| | 1,201 |
| 1 |
| 0.41 |
| 773 |
| 4 |
| 1.95 |
| | 787 |
| 2 |
| 1.09 |
| | 1,094 |
| 2 |
| 0.61 |
|
| Demand deposits | 5,932 |
| 5 |
| 0.27 |
| | 5,659 |
| 2 |
| 0.14 |
| | 2,681 |
| 3 |
| 0.36 |
| 8,379 |
| 11 |
| 0.52 |
| | 6,592 |
| 6 |
| 0.38 |
| | 5,371 |
| 1 |
| 0.12 |
|
| Time deposits | 29,934 |
| 24 |
| 0.32 |
| | 34,757 |
| 15 |
| 0.18 |
| | 45,186 |
| 7 |
| 0.07 |
| 34,101 |
| 53 |
| 0.63 |
| | 30,259 |
| 32 |
| 0.41 |
| | 35,429 |
| 11 |
| 0.12 |
|
| Foreign offices | 98,278 |
| 26 |
| 0.10 |
| | 93,527 |
| 12 |
| 0.05 |
| | 98,695 |
| (18 | ) | (0.08 | ) | 104,092 |
| 46 |
| 0.18 |
| | 102,483 |
| 23 |
| 0.09 |
| | 90,416 |
| (6 | ) | (0.03 | ) |
| Total interest-bearing deposits | 142,490 |
| 57 |
| 0.16 |
| | 142,336 |
| 32 |
| 0.09 |
| | 155,109 |
| (6 | ) | (0.02 | ) | 155,704 |
| 117 |
| 0.30 |
| | 147,763 |
| 64 |
| 0.17 |
| | 139,820 |
| 9 |
| 0.03 |
|
| Federal funds purchased and securities sold under repurchase agreements | 21,403 |
| 70 |
| 1.30 |
| | 17,970 |
| 38 |
| 0.84 |
| | 9,585 |
| 6 |
| 0.24 |
| 18,963 |
| 107 |
| 2.29 |
| | 20,211 |
| 93 |
| 1.83 |
| | 18,995 |
| 24 |
| 0.51 |
|
| Trading liabilities | 1,434 |
| 2 |
| 0.54 |
| | 1,216 |
| 2 |
| 0.61 |
| | 735 |
| 2 |
| 1.11 |
| 1,569 |
| 9 |
| 2.26 |
| | 1,406 |
| 1 |
| 0.38 |
| | 908 |
| 2 |
| 0.89 |
|
| Other borrowed funds | 2,197 |
| 7 |
| 1.38 |
| | 1,193 |
| 4 |
| 1.24 |
| | 874 |
| 1 |
| 0.76 |
| 2,119 |
| 9 |
| 1.67 |
| | 3,421 |
| 13 |
| 1.46 |
| | 822 |
| 2 |
| 0.98 |
|
| Commercial paper | 2,736 |
| 8 |
| 1.15 |
| | 2,215 |
| 5 |
| 0.95 |
| | 1,173 |
| 1 |
| 0.35 |
| 3,131 |
| 12 |
| 1.59 |
| | 3,391 |
| 11 |
| 1.23 |
| | 2,164 |
| 5 |
| 0.88 |
|
| Payables to customers and broker-dealers | 18,516 |
| 19 |
| 0.42 |
| | 20,609 |
| 16 |
| 0.30 |
| | 16,873 |
| 3 |
| 0.07 |
| 17,101 |
| 31 |
| 0.75 |
| | 17,868 |
| 22 |
| 0.49 |
| | 18,961 |
| 7 |
| 0.16 |
|
| Long-term debt | 28,138 |
| 149 |
| 2.07 |
| | 27,398 |
| 129 |
| 1.87 |
| | 23,930 |
| 93 |
| 1.54 |
| 28,407 |
| 177 |
| 2.49 |
| | 28,245 |
| 164 |
| 2.29 |
| | 25,882 |
| 119 |
| 1.85 |
|
| Total interest-bearing liabilities | $ | 216,914 |
| $ | 312 |
| 0.57 | % | | $ | 212,937 |
| $ | 226 |
| 0.42 | % | | $ | 208,279 |
| $ | 100 |
| 0.19 | % | $ | 226,994 |
| $ | 462 |
| 0.82 | % | | $ | 222,305 |
| $ | 368 |
| 0.65 | % | | $ | 207,552 |
| $ | 168 |
| 0.33 | % |
| Total noninterest-bearing deposits | 70,168 |
| | | | 73,886 |
| | | | 81,619 |
| | | 71,005 |
| | | | 69,111 |
| | | | 73,555 |
| | |
| Other liabilities | 17,728 |
| | | | 15,545 |
| | | | 21,343 |
| | | |
| Liabilities and obligations of consolidated investment management funds | 35 |
| | | | 111 |
| | | | 238 |
| | | |
| Other noninterest-bearing liabilities | | 18,571 |
| | | | 18,422 |
| | | | 15,844 |
| | |
| Total liabilities | 304,845 |
| | | | 302,479 |
| | | | 311,479 |
| | | 316,570 |
| | | | 309,838 |
| | | | 296,951 |
| | |
| Temporary equity | | | | | | | | | | | | | | | | |
| Redeemable noncontrolling interests | 188 |
| | | | 172 |
| | | | 179 |
| | | 193 |
| | | | 197 |
| | | | 161 |
| | |
| Permanent equity | | | | | | | | | | | | | | | | |
| Total BNY Mellon shareholders’ equity | 40,322 |
| | | | 39,404 |
| | | | 39,051 |
| | | |
| Total The Bank of New York Mellon Corporation shareholders’ equity | | 41,135 |
| | | | 40,494 |
| | | | 38,507 |
| | |
| Noncontrolling interests | 354 |
| | | | 460 |
| | | | 521 |
| | | 277 |
| | | | 257 |
| | | | 581 |
| | |
| Total permanent equity | 40,676 |
| | | | 39,864 |
| | | | 39,572 |
| | | 41,412 |
| | | | 40,751 |
| | | | 39,088 |
| | |
| Total liabilities, temporary equity and permanent equity | $ | 345,709 |
| | | | $ | 342,515 |
| | | | $ | 351,230 |
| | | $ | 358,175 |
| | | | $ | 350,786 |
| | | | $ | 336,200 |
| | |
| Net interest revenue (FTE) – Non-GAAP | | $ | 851 |
| | | | $ | 838 |
| | | | $ | 786 |
| | | $ | 925 |
| | | | $ | 862 |
| | | | $ | 804 |
| |
| Net interest margin (FTE) – Non-GAAP | | 1.16 | % | | | 1.16 | % | | | 1.06 | % | | 1.23 | % | | | 1.16 | % | | | 1.14 | % |
Less: Tax equivalent adjustment (b) | | 12 |
| | | | 12 |
| | | | 12 |
| | | 6 |
| | | | 11 |
| | | | 12 |
| |
| Net interest revenue – GAAP | | $ | 839 |
| | | | $ | 826 |
| | | | $ | 774 |
| | | $ | 919 |
| | | | $ | 851 |
| | | | $ | 792 |
| |
| Net interest margin – GAAP | | 1.15 | % | | | 1.14 | % | | | 1.05 | % | | 1.22 | % | | | 1.14 | % | | | 1.13 | % |
| |
Note: | Interest and average rates were calculated on a taxable equivalent basis using dollar amounts in thousands and actual number of days in the year. |
| |
| (a) | Interest income and average yieldyields are presented on an FTE basis (Non-GAAP). |
| |
| (b) | BasedThe tax equivalent adjustment relates to tax-exempt securities, primarily state and political subdivisions, and is based on the applicablefederal statutory tax rate of 21% for the quarter ended March 31, 2018 and 35%. for the quarters ended Dec. 31, 2017 and March 31, 2017, adjusted for applicable state income taxes, net of the related federal tax benefit. |
|
| | | | | | | | | | | | | | | | | |
| Average balances and interest rates | Year-to-date |
| | Sept. 30, 2017 | | Sept. 30, 2016 |
| (dollar amounts in millions, presented on an FTE basis) | Average balance |
| Interest |
| Average rates |
| | Average balance |
| Interest |
| Average rates |
|
| Assets | | | | | | | |
| Interest-earning assets: | | | | | | | |
| Interest-bearing deposits with banks (primarily foreign banks) | $ | 15,153 |
| $ | 83 |
| 0.73 | % | | $ | 14,455 |
| $ | 76 |
| 0.70 | % |
| Interest-bearing deposits held at the Federal Reserve and other central banks | 68,613 |
| 217 |
| 0.42 |
| | 86,947 |
| 170 |
| 0.26 |
|
| Federal funds sold and securities purchased under resale agreements | 26,779 |
| 272 |
| 1.36 |
| | 25,275 |
| 167 |
| 0.88 |
|
| Margin loans | 14,663 |
| 249 |
| 2.27 |
| | 18,420 |
| 194 |
| 1.41 |
|
| Non-margin loans: | | | | | | | |
| Domestic offices | 30,545 |
| 611 |
| 2.67 |
| | 29,488 |
| 493 |
| 2.23 |
|
| Foreign offices | 13,126 |
| 189 |
| 1.93 |
| | 13,112 |
| 144 |
| 1.47 |
|
| Total non-margin loans | 43,671 |
| 800 |
| 2.45 |
| | 42,600 |
| 637 |
| 2.00 |
|
| Securities: | | | | | | | |
| U.S. Government obligations | 25,835 |
| 316 |
| 1.64 |
| | 24,778 |
| 278 |
| 1.50 |
|
| U.S. Government agency obligations | 59,384 |
| 870 |
| 1.95 |
| | 56,161 |
| 727 |
| 1.73 |
|
| State and political subdivisions – tax-exempt | 3,298 |
| 77 |
| 3.09 |
| | 3,784 |
| 83 |
| 2.92 |
|
| Other securities | 28,531 |
| 267 |
| 1.25 |
| | 33,592 |
| 309 |
| 1.23 |
|
| Trading securities | 2,356 |
| 48 |
| 2.74 |
| | 2,548 |
| 45 |
| 2.37 |
|
| Total securities | 119,404 |
| 1,578 |
| 1.76 |
| | 120,863 |
| 1,442 |
| 1.59 |
|
Total interest-earning assets (a) | $ | 288,283 |
| $ | 3,199 |
| 1.48 | % | | $ | 308,560 |
| $ | 2,686 |
| 1.16 | % |
| Allowance for loan losses | (166 | ) | | | | (162 | ) | | |
| Cash and due from banks | 5,010 |
| | | | 4,070 |
| | |
| Other assets | 47,461 |
| | | | 49,624 |
| | |
| Assets of consolidated investment management funds | 922 |
| | | | 1,198 |
| | |
| Total assets | $ | 341,510 |
| | | | $ | 363,290 |
| | |
| Liabilities | | | | | | | |
| Interest-bearing liabilities: | | | | | | | |
| Interest-bearing deposits: | | | | | | | |
| Money market rate accounts | $ | 7,466 |
| $ | 3 |
| 0.05 | % | | $ | 7,337 |
| $ | 3 |
| 0.06 | % |
| Savings | 980 |
| 5 |
| 0.70 |
| | 1,203 |
| 3 |
| 0.36 |
|
| Demand deposits | 5,656 |
| 8 |
| 0.18 |
| | 1,782 |
| 5 |
| 0.40 |
|
| Time deposits | 33,354 |
| 50 |
| 0.20 |
| | 44,832 |
| 19 |
| 0.06 |
|
| Foreign offices | 94,102 |
| 32 |
| 0.05 |
| | 105,574 |
| (9 | ) | (0.01 | ) |
| Total interest-bearing deposits | 141,558 |
| 98 |
| 0.09 |
| | 160,728 |
| 21 |
| 0.02 |
|
| Federal funds purchased and securities sold under repurchase agreements | 19,465 |
| 132 |
| 0.90 |
| | 15,471 |
| 28 |
| 0.24 |
|
| Trading liabilities | 1,188 |
| 6 |
| 0.65 |
| | 650 |
| 5 |
| 1.05 |
|
| Other borrowed funds | 1,409 |
| 13 |
| 1.26 |
| | 827 |
| 5 |
| 0.90 |
|
| Commercial paper | 2,374 |
| 18 |
| 1.01 |
| | 1,657 |
| 5 |
| 0.37 |
|
| Payables to customers and broker-dealers | 19,360 |
| 42 |
| 0.29 |
| | 16,870 |
| 9 |
| 0.07 |
|
| Long-term debt | 27,148 |
| 397 |
| 1.93 |
| | 22,779 |
| 267 |
| 1.55 |
|
| Total interest-bearing liabilities | $ | 212,502 |
| $ | 706 |
| 0.44 | % | | $ | 218,982 |
| $ | 340 |
| 0.21 | % |
| Total noninterest-bearing deposits | 72,524 |
| | | | 82,861 |
| | |
| Other liabilities | 16,299 |
| | | | 21,993 |
| | |
| Liabilities and obligations of consolidated investment management funds | 129 |
| | | | 250 |
| | |
| Total liabilities | 301,454 |
| | | | 324,086 |
| | |
| Temporary equity | | | | | | | |
| Redeemable noncontrolling interests | 174 |
| | | | 183 |
| | |
| Permanent equity | | | | | | | |
| Total BNY Mellon shareholders’ equity | 39,418 |
| | | | 38,414 |
| | |
| Noncontrolling interests | 464 |
| | | | 607 |
| | |
| Total permanent equity | 39,882 |
| | | | 39,021 |
| | |
| Total liabilities, temporary equity and permanent equity | $ | 341,510 |
| | | | $ | 363,290 |
| | |
| Net interest revenue (FTE) – Non-GAAP | | $ | 2,493 |
| | | | $ | 2,346 |
| |
| Net interest margin (FTE) – Non-GAAP | | | 1.16 | % | | | | 1.02 | % |
Less: Tax equivalent adjustment (b) | | 36 |
| | | | 39 |
| |
| Net interest revenue – GAAP | | $ | 2,457 |
| | | | $ | 2,307 |
| |
| Net interest margin – GAAP | | | 1.14 | % | | | | 1.00 | % |
| |
Note: | Interest and average rates were calculated on a taxable equivalent basis using dollar amounts in thousands and actual number of days in the year. |
| |
(a) | Interest income and average yield are presented on an FTE basis (Non-GAAP). |
| |
(b) | Based on the applicable tax rate of 35%. |
Noninterest expense
| | | Noninterest expense | | | | | YTD17 |
| | 1Q18 vs. |
| | | 3Q17 vs. | | | vs. | |
| (dollars in millions) | 3Q17 |
| 2Q17 |
| 3Q16 |
| 2Q17 |
| 3Q16 |
| | YTD17 |
| YTD16 |
| YTD16 |
| 1Q18 |
| 4Q17 |
| 1Q17 |
| 4Q17 |
| 1Q17 |
|
| Staff | $ | 1,469 |
| $ | 1,417 |
| $ | 1,467 |
| 4 | % | — | % | | $ | 4,358 |
| $ | 4,338 |
| — | % | |
Staff (a) | | $ | 1,576 |
| $ | 1,628 |
| $ | 1,488 |
| (3 | )% | 6 | % |
| Professional, legal and other purchased services | 305 |
| 319 |
| 292 |
| (4 | ) | 4 |
| | 936 |
| 860 |
| 9 |
| 291 |
| 339 |
| 313 |
| (14 | ) | (7 | ) |
| Software | 175 |
| 173 |
| 156 |
| 1 |
| 12 |
| | 514 |
| 470 |
| 9 |
| 173 |
| 230 |
| 166 |
| (25 | ) | 4 |
|
| Net occupancy | 141 |
| 139 |
| 143 |
| 1 |
| (1 | ) | | 416 |
| 437 |
| (5 | ) | 139 |
| 153 |
| 136 |
| (9 | ) | 2 |
|
Sub-custodian and clearing (b) | | 119 |
| 102 |
| 103 |
| 17 |
| 16 |
|
| Distribution and servicing | 109 |
| 104 |
| 105 |
| 5 |
| 4 |
| | 313 |
| 307 |
| 2 |
| 106 |
| 106 |
| 100 |
| — |
| 6 |
|
| Sub-custodian | 62 |
| 65 |
| 59 |
| (5 | ) | 5 |
| | 191 |
| 188 |
| 2 |
| |
| Furniture and equipment | 58 |
| 59 |
| 59 |
| (2 | ) | (2 | ) | | 174 |
| 187 |
| (7 | ) | 61 |
| 67 |
| 57 |
| (9 | ) | 7 |
|
Bank assessment charges (a) | 51 |
| 59 |
| 61 |
| (14 | ) | (16 | ) | | 167 |
| 166 |
| 1 |
| |
| Bank assessment charges | | 52 |
| 53 |
| 57 |
| (2 | ) | (9 | ) |
| Business development | 49 |
| 63 |
| 52 |
| (22 | ) | (6 | ) | | 163 |
| 174 |
| (6 | ) | 51 |
| 66 |
| 51 |
| (23 | ) | — |
|
| Amortization of intangible assets | | 49 |
| 52 |
| 52 |
| (6 | ) | (6 | ) |
Other (a)(c) | 177 |
| 192 |
| 170 |
| (8 | ) | 4 |
| | 536 |
| 546 |
| (2 | ) | 122 |
| 210 |
| 119 |
| (42 | ) | 3 |
|
| Amortization of intangible assets | 52 |
| 53 |
| 61 |
| (2 | ) | (15 | ) | | 157 |
| 177 |
| (11 | ) | |
| M&I, litigation and restructuring charges | 6 |
| 12 |
| 18 |
| N/M | | 26 |
| 42 |
| N/M | |
| Total noninterest expense – GAAP | $ | 2,654 |
| $ | 2,655 |
| $ | 2,643 |
| — | % | — | % | | $ | 7,951 |
| $ | 7,892 |
| 1 | % | |
| | | | | | | |
| Staff expense as a percentage of total revenue | 37 | % | 36 | % | 37 | % | | | 37 | % | 38 | % | | |
| Total noninterest expense | | $ | 2,739 |
| $ | 3,006 |
| $ | 2,642 |
| (9 | )% | 4 | % |
| | | | | | | | |
|
| Full-time employees at period end | 52,900 |
| 52,800 |
| 52,300 |
| — | % | 1 | % | | 52,900 |
| 52,300 |
| 1 | % | 52,100 |
| 52,500 |
| 52,600 |
| (1 | )% | (1 | )% |
| | | | | | | |
| Memo: | | | | | | |
| Adjusted total noninterest expense excluding amortization of intangible assets and M&I, litigation and restructuring charges – Non-GAAP | $ | 2,596 |
| $ | 2,590 |
| $ | 2,564 |
| — | % | 1 | % | | $ | 7,768 |
| $ | 7,673 |
| 1 | % | |
| |
| (a) | In the first quarter of 2017,2018, we began disclosing bank assessment charges onadopted new accounting guidance included in Accounting Standards Update (“ASU”) 2017-07, Compensation-Retirement Benefits - Improving the Presentation of Net Periodic Pension Cost and Net Periodic Postretirement Benefit Cost, which required the reclassification of the components of pension and other post-retirement costs, other than the service cost component. As a quarterly basis. The bank assessment charges wereresult, staff expense increased and other expense decreased. Prior periods have been reclassified. For additional information, see Note 2 of the Notes to Consolidated Financial Statements. |
| |
| (b) | Beginning in the first quarter of 2018, clearing expense, which was previously included in other expense, was included with sub-custodian expense. All priorPrior periods were reclassified. |
N/M - Not meaningful.
| |
| (c) | Beginning in the first quarter of 2018, merger and integration ("M&I"), litigation and restructuring charges are no longer separately disclosed. Expenses previously reported in this line have been reclassified to existing expense categories, primarily other expense. |
Total noninterest expense increased less than 1%4% compared with the thirdfirst quarter of 20162017 and decreased slightly9% (unannualized) compared with the secondfourth quarter of 2017. The increase primarily reflects the unfavorable impact of a weaker U.S. dollar, higher softwarestaff expense driven by the annual merit increase that was effective in July 2017 and professional, legalhigher performance-based incentives. The increase also reflects higher volume-related sub-custodian and other purchased servicesclearing expenses, partially offset by lower litigation expense and bank assessment charges.consulting expense. The decrease in total noninterest expense compared with the fourth quarter of 2017 primarily reflects lower other, professional, legalseverance, litigation and other purchased services and business development expensesan asset impairment recorded in the fourth quarter of 2017, as well as lower bank assessment charges,expenses in nearly all categories. The decrease was partially offset by higher staff expense. Excluding amortizationincentives due to the impact of intangible assetsvesting of long-term stock awards for retirement eligible employees and M&I, litigation and restructuring charges, total noninterest expense, as adjusted (Non-GAAP), increased 1% compared with the third quarterunfavorable impact of 2016 and less than 1% (unannualized) compared with the second quarter of 2017.a weaker U.S. dollar.
We continue to invest in our risk management, regulatory compliance and other control functions to improve our safety and soundness and in light ofOur technology-related expenses, including staff expense, increased global regulatory requirements. Asas a result of our continued investment in technology infrastructure and platforms. We expect to incur expenses in 2018 related to the submissioncontinued execution of our 2017 resolution plan, we began to experience a modest decrease in the expenses relating to these functions in the third quarter of 2017.real estate strategy.
Staff expense
Given our mix of fee-based businesses, which are staffed with high-quality professionals, staff expense comprised 55% of total noninterest expense in the third quarter of 2017, 56% in the third quarter of 2016 and 53%in the second quarter of 2017.
Staff expense increased slightly compared with the third quarter of 2016 as the annual employee merit increase was offset by lower severance. Staff expense increased 4% (unannualized) compared with the second quarter of 2017, primarily due to higher incentives expense reflecting stronger performance and the annual employee merit increase.
Non-staff expense
Non-staff expense includes certain expenses that vary with the levels of business activity and levels of expensed business investments, fixed infrastructure costs and expenses associated with corporate activities related to technology, compliance, legal, productivity initiatives and business development.
Non-staff expense totaled $1.2 billion, an increase of 1% compared with the third quarter of 2016 and a decrease of 4% (unannualized) compared with the second quarter of 2017. The increase primarily reflects higher software and professional, legal and other purchased services expenses, partially offset by lower litigation expense and bank assessment charges. The decrease primarily reflects lower other, professional, legal and other purchases services and business development expenses as well as lower bank assessment charges. The decrease in professional, legal and other purchased services was driven by lower consulting expense related to resolution planning.
Year-to-date 2017 compared with year-to-date 2016
Noninterest expense increased 1% compared with the first nine months of 2016, primarily reflecting higher consulting and software expenses, partially offset by lower net occupancy. The increase in consulting expense primarily reflects higher regulatory and compliance costs. Net occupancy expense decreased as we continue to benefit from the savings generated by the business improvement process.
Income taxes
BNY Mellon recorded an income tax provision of $348$282 million (25.4%(19.5% effective tax rate) in the thirdfirst quarter of 2018 and $269 million (22.3% effective tax rate) in the first quarter of 2017. The income tax provision was $324benefit of $453 million (24.6% effective tax rate) in the thirdfourth quarter of 2016 and $3322017 included the estimated tax benefit of $710 million (25.4% effectiverelated to U.S. tax rate) in the second quarter of 2017.legislation. For additional information, see Note 1011 of the Notes to Consolidated Financial Statements.
We expect the effective tax rate to be approximately 25-26%21% in 20172018 based on current income tax rates. Based on our expected revenue growth as well as the mix of earnings we project for next year, we expect our effective tax rate may rise approximately 100 basis points in 2018.
Any legislation affecting income tax rates could have an impact on our future effective tax rate, the significance of which would depend on the timing, nature and scope of any such legislation, as well as the level and composition of our earnings.
10 BNY Mellon
Review of businesses
We have an internal information system that produces performance data along product and service lines for our two principal businesses, Investment Services and Investment Management, and the Other segment.
Business accounting principles
Our business data has been determined on an internal management basis of accounting, rather than the generally accepted accounting principles used for consolidated financial reporting. These measurement principles are designed so that reported results of the businesses will track their economic performance.
For information on the accounting principles of our businesses, the primary types of revenue by business and how our businesses are presented and analyzed, see Note 1819 of the Notes to Consolidated Financial Statements.
Business results are subject to reclassification when organizational changes are made or when improvements are mademade. There were no significant organizational changes in the measurement principles.first quarter of 2018. The results are also subject to refinements in revenue and expense allocation methodologies, which are typically reflected on a prospective basis.
The results of our businesses may be influenced by client and other activities that vary by quarter. In the first quarter, incentivesincentive expense typically increases reflecting the vesting of long-term stock awards for retirement-eligible employees. In the third quarter, Depositary Receipts revenue is typically higher due to an increased level of client dividend payments. Also in the third quarter, volume-related fees may decline due to reduced client activity. In the third quarter, staff expense typically increases reflecting the annual employee merit increase. In the fourth quarter, we typically incur higher business development and marketing expenses. In our Investment Management business, performance fees are typically higher in the fourth quarter, as the fourth
quarter represents the end of the measurement period for many of the performance fee-eligible relationships.
The results of our businesses may also be impacted by the translation of financial results denominated in foreign currencies to the U.S. dollar. We are primarily impacted by activities denominated in the British pound and the euro. On a consolidated basis and in our Investment Services business, we typically have more foreign currency denominatedcurrency-denominated expenses than revenues. However, our Investment
Management business typically has more foreign currency denominatedcurrency-denominated revenues than expenses. Overall, currency fluctuations impact the year-over-year growth rate in the Investment Management
business more than the Investment Services business. However, currency fluctuations, in isolation, are not expected to significantly impact net income on a consolidated basis.
The following table presents key market metrics at period end and on an average basis.
|
| | | | | | | | | | | | | | | | | | | | | | | | | | | | |
| Key market metrics | | | | | | | | | | | YTD17 |
|
| | | | | | | 3Q17 vs. | | | | vs. |
| | 3Q17 |
| 2Q17 |
| 1Q17 |
| 4Q16 |
| 3Q16 |
| 2Q17 |
| 3Q16 |
| | YTD17 |
| YTD16 |
| YTD16 |
|
Standard & Poor’s (“S&P”) 500 Index (a) | 2519 |
| 2423 |
| 2363 |
| 2239 |
| 2168 |
| 4 | % | 16 | % | | 2519 |
| 2168 |
| 16 | % |
| S&P 500 Index – daily average | 2467 |
| 2398 |
| 2326 |
| 2185 |
| 2162 |
| 3 |
| 14 |
| | 2397 |
| 2065 |
| 16 |
|
FTSE 100 Index (a) | 7373 |
| 7313 |
| 7323 |
| 7143 |
| 6899 |
| 1 |
| 7 |
| | 7373 |
| 6899 |
| 7 |
|
| FTSE 100 Index – daily average | 7380 |
| 7391 |
| 7274 |
| 6923 |
| 6765 |
| — |
| 9 |
| | 7348 |
| 6326 |
| 16 |
|
MSCI EAFE (a) | 1974 |
| 1883 |
| 1793 |
| 1684 |
| 1702 |
| 5 |
| 16 |
| | 1974 |
| 1702 |
| 16 |
|
| MSCI EAFE – daily average | 1934 |
| 1856 |
| 1749 |
| 1660 |
| 1677 |
| 4 |
| 15 |
| | 1847 |
| 1640 |
| 13 |
|
Barclays Capital Global Aggregate BondSM Index (a)(b) | 480 |
| 471 |
| 459 |
| 451 |
| 486 |
| 2 |
| (1 | ) | | 480 |
| 486 |
| (1 | ) |
NYSE and NASDAQ share volume (in billions) | 179 |
| 199 |
| 186 |
| 189 |
| 186 |
| (10 | ) | (4 | ) | | 565 |
| 608 |
| (7 | ) |
JPMorgan G7 Volatility Index – daily average (c) | 8.17 |
| 7.98 |
| 10.10 |
| 10.24 |
| 10.19 |
| 2 |
| (20 | ) | | 8.75 |
| 10.63 |
| (18 | ) |
| Average interest on excess reserves paid by the Federal Reserve | 1.25 | % | 1.04 | % | 0.79 | % | 0.55 | % | 0.50 | % | 21 | bps | 75 | bps | | 1.03 | % | 0.50 | % | 53 | bps |
| | | | | | | | | | | | |
| Foreign exchange rates vs. U.S. dollar: | | | | | |
| | | | | |
British pound (a) | $ | 1.34 |
| $ | 1.30 |
| $ | 1.25 |
| $ | 1.23 |
| $ | 1.30 |
| 3 | % | 3 | % | | $ | 1.34 |
| $ | 1.30 |
| 3 | % |
| British pound – average rate | 1.31 |
| 1.28 |
| 1.24 |
| 1.24 |
| 1.31 |
| 2 |
| — |
| | 1.28 |
| 1.39 |
| (8 | ) |
Euro (a) | 1.18 |
| 1.14 |
| 1.07 |
| 1.05 |
| 1.12 |
| 4 |
| 5 |
| | 1.18 |
| 1.12 |
| 5 |
|
| Euro – average rate | 1.17 |
| 1.10 |
| 1.07 |
| 1.08 |
| 1.12 |
| 6 |
| 4 |
| | 1.13 |
| 1.12 |
| 1 |
|
| |
(b) | Unhedged in U.S. dollar terms. |
| |
(c) | The JPMorgan G7 Volatility Index is based on the implied volatility in 3-month currency options. |
bps - basis points.
Fee revenue in Investment Management, and to a lesser extent in Investment Services, is impacted by the value of market indices. At Sept. 30, 2017,March 31, 2018, we estimate that a 5% change in global equity markets, spread evenly throughout the year, would impact fee revenue by less than 1% and diluted earnings per common share by $0.02$0.03 to $0.04.
$0.05.
In the first quarter of 2018, we began presenting total revenue for each of the primary lines of business in our two principal businesses. Note 19 of the Notes to Consolidated Financial Statements summarizes the products and services in each line of business and the primary types of revenue generated. We believe that the updated presentation provides investors a clearer picture of our business results and permits investors to view revenue on a basis consistent with management.
See Note 1819 of the Notes to Consolidated Financial Statements for the consolidating schedules which show the contribution of our businesses to our overall profitability.
Investment Management business
|
| | | | | | | | | | | | | | | | | | | | | | | | | | | | |
| | | | | | | | | | | | YTD17 |
|
| | | | | | | 3Q17 vs. | | | | vs. |
| (dollars in millions) | 3Q17 |
| 2Q17 |
| 1Q17 |
| 4Q16 |
| 3Q16 |
| 2Q17 |
| 3Q16 |
| | YTD17 |
| YTD16 |
| YTD16 |
|
| Revenue: | | | | | | | | | | | |
| Investment management fees: | | | | | | | | | | | |
| Mutual funds | $ | 332 |
| $ | 314 |
| $ | 299 |
| $ | 297 |
| $ | 309 |
| 6 | % | 7 | % | | $ | 945 |
| $ | 913 |
| 4 | % |
| Institutional clients | 367 |
| 362 |
| 348 |
| 340 |
| 362 |
| 1 |
| 1 |
| | 1,077 |
| 1,040 |
| 4 |
|
| Wealth management | 172 |
| 169 |
| 167 |
| 164 |
| 166 |
| 2 |
| 4 |
| | 508 |
| 478 |
| 6 |
|
Investment management fees (a) | 871 |
| 845 |
| 814 |
| 801 |
| 837 |
| 3 |
| 4 |
| | 2,530 |
| 2,431 |
| 4 |
|
| Performance fees | 15 |
| 17 |
| 12 |
| 32 |
| 8 |
| N/M |
| 88 |
| | 44 |
| 28 |
| 57 |
|
| Investment management and performance fees | 886 |
| 862 |
| 826 |
| 833 |
| 845 |
| 3 |
| 5 |
| | 2,574 |
| 2,459 |
| 5 |
|
| Distribution and servicing | 51 |
| 53 |
| 52 |
| 48 |
| 49 |
| (4 | ) | 4 |
| | 156 |
| 144 |
| 8 |
|
Other (a) | (19 | ) | (16 | ) | (1 | ) | (1 | ) | (18 | ) | N/M |
| N/M |
| | (36 | ) | (59 | ) | N/M |
|
Total fee and other revenue (a) | 918 |
| 899 |
| 877 |
| 880 |
| 876 |
| 2 |
| 5 |
| | 2,694 |
| 2,544 |
| 6 |
|
| Net interest revenue | 82 |
| 87 |
| 86 |
| 80 |
| 82 |
| (6 | ) | — |
| | 255 |
| 247 |
| 3 |
|
| Total revenue | 1,000 |
| 986 |
| 963 |
| 960 |
| 958 |
| 1 |
| 4 |
| | 2,949 |
| 2,791 |
| 6 |
|
| Provision for credit losses | (2 | ) | — |
| 3 |
| 6 |
| — |
| N/M |
| N/M |
| | 1 |
| — |
| N/M |
|
| Noninterest expense (ex. amortization of intangible assets) | 687 |
| 683 |
| 668 |
| 672 |
| 680 |
| 1 |
| 1 |
| | 2,038 |
| 2,024 |
| 1 |
|
| Amortization of intangible assets | 15 |
| 15 |
| 15 |
| 22 |
| 22 |
| — |
| (32 | ) | | 45 |
| 60 |
| (25 | ) |
| Total noninterest expense | 702 |
| 698 |
| 683 |
| 694 |
| 702 |
| 1 |
| — |
| | 2,083 |
| 2,084 |
| — |
|
| Income before taxes | $ | 300 |
| $ | 288 |
| $ | 277 |
| $ | 260 |
| $ | 256 |
| 4 | % | 17 | % | | $ | 865 |
| $ | 707 |
| 22 | % |
Income before taxes (ex. amortization of intangible assets) – Non-GAAP | $ | 315 |
| $ | 303 |
| $ | 292 |
| $ | 282 |
| $ | 278 |
| 4 | % | 13 | % | | $ | 910 |
| $ | 767 |
| 19 | % |
| | | | | | | | | | | | |
| Pre-tax operating margin | 30 | % | 29 | % | 29 | % | 27 | % | 27 | % | | | | 29 | % | 25 | % | |
Adjusted pre-tax operating margin – Non-GAAP (b) | 35 | % | 34 | % | 34 | % | 33 | % | 33 | % | | | | 35 | % | 31 | % | |
| | | | | | | | | | | | |
| Average balances: | | | | | | | | | | | |
| Average loans | $ | 16,724 |
| $ | 16,560 |
| $ | 16,153 |
| $ | 15,673 |
| $ | 15,308 |
| 1 | % | 9 | % | | $ | 16,481 |
| $ | 14,795 |
| 11 | % |
| Average deposits | $ | 12,374 |
| $ | 14,866 |
| $ | 15,781 |
| $ | 15,511 |
| $ | 15,600 |
| (17 | )% | (21 | )% | | $ | 14,283 |
| $ | 15,696 |
| (9 | )% |
| |
(a) | Total fee and other revenue includes the impact of the consolidated investment management funds, net of noncontrolling interests. See page 52 for a breakdown of the revenue line items in the Investment Management business impacted by the consolidated investment management funds. Additionally, other revenue includes asset servicing, treasury services, foreign exchange and other trading revenue and investment and other income.
|
| |
(b) | Excludes amortization of intangible assets, provision for credit losses and distribution and servicing expense. See “Supplemental information – Explanation of GAAP and Non-GAAP financial measures” beginning on page 49 for the reconciliation of this Non-GAAP measure.
|
N/M - Not meaningful.
|
| | | | | | | | | | | | | | | | | | | |
AUM trends (a) | | | | | | 3Q17 vs. |
| (dollars in billions) | 3Q17 |
| 2Q17 |
| 1Q17 |
| 4Q16 |
| 3Q16 |
| 2Q17 |
| 3Q16 |
|
| AUM at period end, by product type: | | | | | | | |
| Equity | $ | 158 |
| $ | 163 |
| $ | 158 |
| $ | 153 |
| $ | 156 |
| (3 | )% | 1 | % |
| Fixed income | 206 |
| 198 |
| 191 |
| 186 |
| 194 |
| 4 |
| 6 |
|
| Index | 333 |
| 324 |
| 330 |
| 312 |
| 302 |
| 3 |
| 10 |
|
Liability-driven investments (b) | 622 |
| 607 |
| 584 |
| 554 |
| 607 |
| 2 |
| 2 |
|
| Multi-asset and alternative investments | 207 |
| 192 |
| 188 |
| 181 |
| 189 |
| 8 |
| 10 |
|
| Cash | 298 |
| 287 |
| 276 |
| 262 |
| 267 |
| 4 |
| 12 |
|
| Total AUM | $ | 1,824 |
| $ | 1,771 |
| $ | 1,727 |
| $ | 1,648 |
| $ | 1,715 |
| 3 | % | 6 | % |
| | | | | | | | |
| AUM at period end, by client type: | | | | | | | |
| Institutional | $ | 1,285 |
| $ | 1,265 |
| $ | 1,243 |
| $ | 1,182 |
| $ | 1,234 |
| 2 | % | 4 | % |
| Mutual funds | 447 |
| 418 |
| 397 |
| 381 |
| 396 |
| 7 |
| 13 |
|
| Private client | 92 |
| 88 |
| 87 |
| 85 |
| 85 |
| 5 |
| 8 |
|
| Total AUM | $ | 1,824 |
| $ | 1,771 |
| $ | 1,727 |
| $ | 1,648 |
| $ | 1,715 |
| 3 | % | 6 | % |
| | | | | | | | |
| Changes in AUM: | | | | | | | |
| Beginning balance of AUM | $ | 1,771 |
| $ | 1,727 |
| $ | 1,648 |
| $ | 1,715 |
| $ | 1,664 |
| | |
| Net inflows (outflows): | | | | | | | |
| Long-term strategies: | | | | | | | |
| Equity | (2 | ) | (2 | ) | (4 | ) | (5 | ) | (6 | ) | | |
| Fixed income | 4 |
| 2 |
| 2 |
| (1 | ) | (1 | ) | | |
Liability-driven investments (b) | (2 | ) | 15 |
| 14 |
| (7 | ) | 4 |
| | |
| Multi-asset and alternative investments | 3 |
| 1 |
| 2 |
| 3 |
| 7 |
| | |
| Total long-term active strategies inflows (outflows) | 3 |
| 16 |
| 14 |
| (10 | ) | 4 |
| | |
| Index | (3 | ) | (13 | ) | — |
| (1 | ) | (3 | ) | | |
| Total long-term strategies inflows (outflows) | — |
| 3 |
| 14 |
| (11 | ) | 1 |
| | |
| Short term strategies: | | | | | | | |
| Cash | 10 |
| 11 |
| 13 |
| (3 | ) | (1 | ) | | |
| Total net inflows (outflows) | 10 |
| 14 |
| 27 |
| (14 | ) | — |
| | |
| Net market impact/other | 17 |
| 1 |
| 41 |
| (11 | ) | 80 |
| | |
| Net currency impact | 26 |
| 29 |
| 11 |
| (42 | ) | (29 | ) | | |
| Ending balance of AUM | $ | 1,824 |
| $ | 1,771 |
| $ | 1,727 |
| $ | 1,648 |
| $ | 1,715 |
| 3 | % | 6 | % |
| |
(a) | Excludes securities lending cash management assets and assets managed in the Investment Services business.
|
| |
(b) | Includes currency overlay AUM.
|
Business description
Our Investment Management business consists of our affiliated investment management boutiques, Wealth Management business and global distribution companies. See pages 19 and 20 of our 2016 Annual Report for additional information on our Investment Management business.
Review of financial results
AUM increased 6% compared with Sept. 30, 2016 primarily reflecting higher market values, net inflows and the favorable impact of the weaker U.S. dollar (principally versus the British pound). The increase compared with June 30, 2017 primarily reflects the favorable impact of the weaker U.S. dollar (principally versus the British pound), higher market values and net inflows.
Net long-term inflows of fixed income and multi-asset and alternative investments were offset by outflows of index, equity and liability-driven investments in the third quarter of 2017. Net short-term inflows of $10 billion in the third quarter of 2017 were a result of increased distribution through our liquidity portals. Market and regulatory trends have driven investable assets toward investments in lower fee asset management products, which negatively impacted our investment management fees.
Total revenue increased 4% compared with the third quarter of 2016 and 1% (unannualized) compared with the second quarter of 2017. Both increases primarily reflect higher investment management and performance fees.
Revenue generated in the Investment Management business included 41% from non-U.S. sources in the
third quarter of 2017, compared with 40% in both the third quarter of 2016 and second quarter of 2017.
Investment management fees in the Investment Management business increased 4% compared with the third quarter of 2016 and 3% (unannualized) compared with the second quarter of 2017. Both increases primarily reflect higher equity market values and money market fees. The increase compared with the second quarter of 2017 also reflects the favorable impact of a weaker U.S. dollar.
Distribution and servicing fees increased compared with the third quarter of 2016 primarily reflecting higher money market fees.
Other revenue decreased compared with the third quarter of 2016 primarily reflecting higher payments to Investment Services related to higher money market fees.
Net interest revenue was unchanged compared with the third quarter of 2016 and decreased 6% (unannualized) compared with the second quarter of 2017. The decrease primarily reflects lower average deposits. Average loans increased 9% compared with the third quarter of 2016 and 1% compared with the second quarter of 2017. Average deposits decreased 21% compared with the third quarter of 2016 and 17% compared with the second quarter of 2017.
Noninterest expense, excluding amortization of intangible assets, increased 1% compared with the third quarter of 2016 and 1% (unannualized) compared with the second quarter of 2017. The increase compared with the third quarter of 2016 primarily reflects higher other and distribution and servicing expenses, partially offset by lower severance expense. The increase compared with the second quarter of 2017 primarily reflects higher distribution and servicing expense.
Year-to-date 2017 compared with year-to-date 2016
Income before taxes increased 22% compared with the first nine months of 2016, primarily reflecting revenue growth of 6%, partially offset by a 1% increase in noninterest expense, excluding amortization of intangible assets. Fee and other revenue increased 6% primarily reflecting higher investment management and performance fees. The increase in investment management and performance fees primarily reflects higher market values, money market fees and performance fees, partially offset by the unfavorable impact of a stronger U.S. dollar (principally versus the British pound). Net interest revenue increased 3% primarily due to higher interest rates and average loans, partially offset by lower average deposits. Noninterest expense, excluding amortization of intangible assets, increased 1% primarily reflecting higher incentives expense, driven by stronger performance, partially offset by the favorable impact of a stronger U.S. dollar (principally versus the British pound).
Investment Services business
| | | | | | | | YTD17 | | 1Q18 vs. |
| (dollar amounts in millions, unless otherwise noted) | | 3Q17 vs. | | | vs. | |
| 3Q17 |
| 2Q17 |
| 1Q17 |
| 4Q16 |
| 3Q16 |
| 2Q17 |
| 3Q16 |
| | YTD17 |
| YTD16 |
| YTD16 |
| |
| (dollars in millions unless otherwise noted) | | 1Q18 |
| 4Q17 |
| 3Q17 |
| 2Q17 |
| 1Q17 |
| 4Q17 |
| 1Q17 |
|
| Revenue: | | | | | | | |
| Investment services fees: | | | | | | | |
| Asset servicing | $ | 1,081 |
| $ | 1,061 |
| $ | 1,038 |
| $ | 1,043 |
| $ | 1,039 |
| 2 | % | 4 | % | | $ | 3,180 |
| $ | 3,098 |
| 3 | % | $ | 1,143 |
| $ | 1,106 |
| $ | 1,081 |
| $ | 1,061 |
| $ | 1,038 |
| 3 | % | 10 | % |
| Clearing services | 381 |
| 393 |
| 375 |
| 354 |
| 347 |
| (3 | ) | 10 |
| | 1,149 |
| 1,045 |
| 10 |
| 414 |
| 400 |
| 381 |
| 393 |
| 375 |
| 4 |
| 10 |
|
| Issuer services | 288 |
| 241 |
| 250 |
| 211 |
| 336 |
| 20 |
| (14 | ) | | 779 |
| 813 |
| (4 | ) | 260 |
| 196 |
| 288 |
| 241 |
| 250 |
| 33 |
| 4 |
|
| Treasury services | 141 |
| 139 |
| 139 |
| 139 |
| 136 |
| 1 |
| 4 |
| | 419 |
| 402 |
| 4 |
| 138 |
| 136 |
| 141 |
| 139 |
| 139 |
| 1 |
| (1 | ) |
| Total investment services fees | 1,891 |
| 1,834 |
| 1,802 |
| 1,747 |
| 1,858 |
| 3 |
| 2 |
| | 5,527 |
| 5,358 |
| 3 |
| 1,955 |
| 1,838 |
| 1,891 |
| 1,834 |
| 1,802 |
| 6 |
| 8 |
|
| Foreign exchange and other trading revenue | 154 |
| 145 |
| 153 |
| 157 |
| 177 |
| 6 |
| (13 | ) | | 452 |
| 506 |
| (11 | ) | 169 |
| 168 |
| 154 |
| 145 |
| 153 |
| 1 |
| 10 |
|
Other (a) | 142 |
| 136 |
| 129 |
| 128 |
| 148 |
| 4 |
| (4 | ) | | 407 |
| 403 |
| 1 |
| 126 |
| 135 |
| 142 |
| 136 |
| 129 |
| (7 | ) | (2 | ) |
| Total fee and other revenue | 2,187 |
| 2,115 |
| 2,084 |
| 2,032 |
| 2,183 |
| 3 |
| — |
| | 6,386 |
| 6,267 |
| 2 |
| 2,250 |
| 2,141 |
| 2,187 |
| 2,115 |
| 2,084 |
| 5 |
| 8 |
|
| Net interest revenue | 777 |
| 761 |
| 707 |
| 713 |
| 715 |
| 2 |
| 9 |
| | 2,245 |
| 2,084 |
| 8 |
| 844 |
| 813 |
| 777 |
| 761 |
| 707 |
| 4 |
| 19 |
|
| Total revenue | 2,964 |
| 2,876 |
| 2,791 |
| 2,745 |
| 2,898 |
| 3 |
| 2 |
| | 8,631 |
| 8,351 |
| 3 |
| 3,094 |
| 2,954 |
| 2,964 |
| 2,876 |
| 2,791 |
| 5 |
| 11 |
|
| Provision for credit losses | (2 | ) | (3 | ) | — |
| — |
| 1 |
| N/M | | (5 | ) | 8 |
| N/M | (7 | ) | (2 | ) | (2 | ) | (3 | ) | — |
| N/M |
| Noninterest expense (ex. amortization of intangible assets) | 1,837 |
| 1,889 |
| 1,812 |
| 1,786 |
| 1,812 |
| (3 | ) | 1 |
| | 5,538 |
| 5,401 |
| 3 |
| |
| Noninterest expense (excluding amortization of intangible assets) | | 1,913 |
| 2,060 |
| 1,837 |
| 1,889 |
| 1,812 |
| (7 | ) | 6 |
|
| Amortization of intangible assets | 37 |
| 38 |
| 37 |
| 38 |
| 39 |
| (3 | ) | (5 | ) | | 112 |
| 117 |
| (4 | ) | 36 |
| 37 |
| 37 |
| 38 |
| 37 |
| (3 | ) | (3 | ) |
| Total noninterest expense | 1,874 |
| 1,927 |
| 1,849 |
| 1,824 |
| 1,851 |
| (3 | ) | 1 |
| | 5,650 |
| 5,518 |
| 2 |
| 1,949 |
| 2,097 |
| 1,874 |
| 1,927 |
| 1,849 |
| (7 | ) | 5 |
|
| Income before taxes | $ | 1,092 |
| $ | 952 |
| $ | 942 |
| $ | 921 |
| $ | 1,046 |
| 15 | % | 4 | % | | $ | 2,986 |
| $ | 2,825 |
| 6 | % | $ | 1,152 |
| $ | 859 |
| $ | 1,092 |
| $ | 952 |
| $ | 942 |
| 34 | % | 22 | % |
Income before taxes (ex. amortization of intangible assets) – Non-GAAP | $ | 1,129 |
| $ | 990 |
| $ | 979 |
| $ | 959 |
| $ | 1,085 |
| 14 | % | 4 | % | | $ | 3,098 |
| $ | 2,942 |
| 5 | % | |
| | | | | |
| |
| |
| Pre-tax operating margin | 37 | % | 33 | % | 34 | % | 34 | % | 36 | % | | | 35 | % | 34 | % |
|
| 37 | % | 29 | % | 37 | % | 33 | % | 34 | % |
|
| |
Adjusted pre-tax operating margin (ex. provision for credit losses and amortization of intangible assets) – Non-GAAP | 38 | % | 34 | % | 35 | % | 35 | % | 37 | % | | | 36 | % | 35 | % |
|
| |
| | | | | |
| |
| Investment services fees as a percentage of noninterest expense (ex. amortization of intangible assets) | 103 | % | 97 | % | 99 | % | 98 | % | 103 | % | | | 100 | % | 99 | % |
|
| |
| | | | | |
|
| |
|
| |
| Securities lending revenue | $ | 41 |
| $ | 42 |
| $ | 40 |
| $ | 44 |
| $ | 42 |
| (2 | )% | (2 | )% | | $ | 123 |
| $ | 126 |
| (2 | )% | $ | 48 |
| $ | 45 |
| $ | 41 |
| $ | 42 |
| $ | 40 |
| 7 | % | 20 | % |
| | | |
|
|
|
|
| Total revenue by line of business: | | |
|
|
|
|
| Asset Servicing | | $ | 1,519 |
| $ | 1,459 |
| $ | 1,420 |
| $ | 1,378 |
| $ | 1,346 |
| 4 | % | 13 | % |
| Pershing | | 581 |
| 569 |
| 542 |
| 547 |
| 522 |
| 2 |
| 11 |
|
| Issuer Services | | 418 |
| 352 |
| 442 |
| 398 |
| 396 |
| 19 |
| 6 |
|
| Treasury Services | | 321 |
| 322 |
| 316 |
| 311 |
| 302 |
| — |
| 6 |
|
| Clearance and Collateral Management | | 255 |
| 252 |
| 244 |
| 242 |
| 225 |
| 1 |
| 13 |
|
| Total revenue by line of business | | $ | 3,094 |
| $ | 2,954 |
| $ | 2,964 |
| $ | 2,876 |
| $ | 2,791 |
| 5 | % | 11 | % |
| | | | | |
| | |
| Metrics: | | | | |
| |
| |
| Average loans | $ | 38,038 |
| $ | 40,931 |
| $ | 42,818 |
| $ | 45,832 |
| $ | 44,329 |
| (7 | )% | (14 | )% | | $ | 40,578 |
| $ | 44,373 |
| (9 | )% | $ | 39,200 |
| $ | 38,845 |
| $ | 38,038 |
| $ | 40,931 |
| $ | 42,818 |
| 1 | % | (8 | )% |
| Average deposits | $ | 198,299 |
| $ | 200,417 |
| $ | 197,690 |
| $ | 213,531 |
| $ | 220,316 |
| (1 | )% | (10 | )% | | $ | 198,796 |
| $ | 219,344 |
| (9 | )% | $ | 214,130 |
| $ | 204,680 |
| $ | 198,299 |
| $ | 200,417 |
| $ | 197,690 |
| 5 | % | 8 | % |
| | | | | |
|
| |
|
| |
AUC/A at period end (in trillions) (b) | $ | 32.2 |
| $ | 31.1 |
| $ | 30.6 |
| $ | 29.9 |
| $ | 30.5 |
| 4 | % | 6 | % | | $ | 32.2 |
| $ | 30.5 |
| 6 | % | $ | 33.5 |
| $ | 33.3 |
| $ | 32.2 |
| $ | 31.1 |
| $ | 30.6 |
| 1 | % | 9 | % |
Market value of securities on loan at period end (in billions) (c) | $ | 382 |
| $ | 336 |
| $ | 314 |
| $ | 296 |
| $ | 288 |
| 14 | % | 33 | % | | $ | 382 |
| $ | 288 |
| 33 | % | $ | 436 |
| $ | 408 |
| $ | 382 |
| $ | 336 |
| $ | 314 |
| 7 | % | 39 | % |
| | | | | |
|
| |
|
| |
| Asset servicing: | | | | |
|
| |
Estimated new business wins (AUC/A) (in billions) | $ | 166 |
| $ | 152 |
| $ | 109 |
| $ | 141 |
| $ | 150 |
| | | | | |
| | | | | | | |
| Clearing services: | | | | | | |
Average active clearing accounts (U.S. platform) (in thousands) | 6,203 |
| 6,159 |
| 6,058 |
| 5,960 |
| 5,942 |
| 1 | % | 4 | % | | | | |
| Pershing: | | | |
Average active clearing accounts (U.S. platform) (in thousands) | | 6,075 |
| 6,126 |
| 6,203 |
| 6,159 |
| 6,058 |
| (1 | )% | — | % |
| Average long-term mutual fund assets (U.S. platform) | $ | 500,998 |
| $ | 480,532 |
| $ | 460,977 |
| $ | 438,460 |
| $ | 443,112 |
| 4 | % | 13 | % | | | | $ | 514,542 |
| $ | 508,873 |
| $ | 500,998 |
| $ | 480,532 |
| $ | 460,977 |
| 1 | % | 12 | % |
| Average investor margin loans (U.S. platform) | $ | 8,886 |
| $ | 9,812 |
| $ | 10,740 |
| $ | 10,562 |
| $ | 10,834 |
| (9 | )% | (18 | )% | | | | $ | 10,930 |
| $ | 9,822 |
| $ | 8,886 |
| $ | 9,812 |
| $ | 10,740 |
| 11 | % | 2 | % |
| | |
|
|
|
| | | | | |
| Depositary Receipts: | |
|
|
|
| | | | |
| Number of sponsored programs | 938 |
| 1,025 |
| 1,050 |
| 1,062 |
| 1,094 |
| (8 | )% | (14 | )% | | | | |
| | | | | | | |
| Broker-Dealer: | | | | | | |
Average tri-party repo balances (in billions) | $ | 2,534 |
| $ | 2,498 |
| $ | 2,373 |
| $ | 2,307 |
| $ | 2,212 |
| 1 | % | 15 | % | | | | |
| Clearance and Collateral Management: | | | |
Average tri-party collateral management balances (in billions) | | $ | 2,698 |
| $ | 2,606 |
| $ | 2,534 |
| $ | 2,498 |
| $ | 2,373 |
| 4 | % | 14 | % |
| |
| (a) | Other revenue includes investment management fees, financing-related fees, distribution and servicing revenue and investment and other income. |
| |
| (b) | Includes the AUC/A of CIBC Mellon of $1.3 trillion at March 31, 2018, Dec. 31, 2017 and Sept. 30, 2017 and $1.2 trillion at June 30, 2017andMarch 31, 2017, Dec. 31, 2016 and Sept. 30, 2016.2017. |
| |
| (c) | Represents the total amount of securities on loan in our agency securities lending program managed by the Investment Services business. Excludes securities for which BNY Mellon acts as agent on behalf of CIBC Mellon clients, which totaled $73 billion at March 31, 2018, $71 billion at Dec. 31, 2017, $68 billion at Sept. 30, 2017, $66 billion at June 30, 2017 and $65 billion at March 31, 2017, $63 billion at Dec. 31, 2016 and $64 billion at Sept. 30, 2016.2017. |
N/M - Not meaningful.
Business description
BNY Mellon Investment Services provides business services and technology solutions across the investments process to entities including financial institutions, corporations, foundations and endowments, public funds and government agencies. Our lines of business include: Asset Servicing, Pershing, Issuer Services, Treasury Services and Clearance and Collateral Management.
We are one of the leading global investment services providers with $32.2$33.5 trillion of AUC/A at Sept. 30, 2017.March 31, 2018.
We are the primary provider of U.S. government securities clearance and a provider of non-U.S. government securities clearance. We provide services to settle securities transactions in approximately 100 markets.
We are a leading provider of tri-party repo collateral management services with approximately $2.5$2.7 trillion serviced globally andincluding approximately $1.6 trillion of the U.S. tri-party repo market.
Our agency securities lending program is one of the largest lenders of U.S. and non-U.S. securities, servicing a lendable asset pool of approximately $3.3$3.4 trillion in 3334 separate markets.
We serve as trustee and/or paying agent on more than 50,000 debt-related issuances globally.
The Asset Servicing business provides a comprehensive suite of solutions. As one of the largest providers of depositary receipts services in the world, we served as depositary for 938 sponsored Americanglobal custody and global depositary receipts programs at Sept. 30, 2017, acting in partnership with leading companies from 59 countries.
We offer asset servicing, clearing services, issuer services and treasury services to our clients. BNY Mellon’s comprehensive suite of asset servicing solutions includes: custody, foreign exchange, fund services, securities finance, investment manager outsourcing, performance and risk analytics, alternative investment services, broker-dealer services, and collateral and liquidity services.
As one of the largest fund accounting providers and a trusted partner, we offer services to ensurefor the safekeeping of assets in capital markets globally. These services include financial reporting, tax reporting services, calculating and reporting net asset values (“NAV”), computing yields, maintaining brokerage account records, and providing
administrative support to clients so they may meet their Securities and Exchange Commission (“SEC”) and other compliance requirements.
Ourglobally as well as alternative investment services and structured products business provides a full range of solutions for alternative investment managers, including primeproduct strategies. We provide custody fund accounting, and client and regulatory reporting services. We alsoforeign exchange services, support exchange-traded funds and unit investment trusts providing fund administration, custody, basket creation and dissemination, authorized participant interactionprovide our clients outsourcing capabilities. We deliver securities lending and order processing, among other services.
Securities finance deliversfinancing solutions on both an agency and principal basis. The principal finance program supports a diverse group of client segments, including hedge and liquid alternative funds and other institutional clients.
InOur market leading liquidity services our market leading portal enables cash investments for institutional clients via money market funds, deposit products, and direct investments in money market securities, and includes fund research and analytics.
Our broker-dealer services business clears and settles equity and fixed-income transactions globally and serves as custodian for tri-party repo collateral worldwide.
Clearing services, primarily Pershing LLC, an indirect subsidiary of BNY Mellon (“Pershing”) and its affiliates, provides clearing, custody, business and technology solutions, delivering dependable operational and practice management support to financial organizations globally, delivering dependable operational support, robust trading services, flexible technology, an expansive array of investment and retirement solutions, practice management support and service excellence.globally.
The Issuer Services business includes Corporate Trust and Depositary Receipts. Our collateral services include collateral management, administration and segregation. We offer innovative solutions, like new collateral types and transaction structures, automation and efficiency, access to global markets, and industry expertise, to help financial institutions and institutional investors mine opportunities from liquidity, financing, risk and balance sheet challenges.
Our corporate trustCorporate Trust business delivers a full range of issuer and related investor services, including trustee, paying agency, fiduciary, escrow and other financial services.
services. We are a leading provider to the debt capital markets, providing customized and market-driven solutions to investors, bondholders and lenders. Our Depositary Receipts business drives global investing by providing servicing and value-added solutions that enable, facilitate and enhance cross-border trading, clearing, settlement and ownership. We are one of the largest providers of depositary receipts services in the world, partnering with leading companies from more than 50 countries.
Our treasury services includeTreasury Services business includes customizable solutions and innovative technology that deliver high-quality cash management, payment and trade support for corporate and institutional global treasury needs. We are a leading provider to the debt capital markets, providing customized
Our Clearance and market-driven solutions to investors, bondholdersCollateral Management business clears and lenders.settles equity and fixed-income transactions globally and serves as custodian for tri-party repo collateral worldwide. Our collateral services include collateral management, administration and segregation.
We also provide credit facilitiesoffer innovative solutions and solutionsindustry expertise which help financial institutions and institutional investors to support our clients globally.
Role of BNY Mellon, as a trustee, for mortgage-backed securitizations
BNY Mellon acts as trusteemine opportunities from liquidity, financing, risk and document custodian for certain mortgage-backed security (“MBS”) securitization trusts. The role of trustee for MBS securitizations is limited; our primary role as trustee is to calculate and distribute monthly bond payments to bondholders. As a document custodian, we hold the mortgage, note, and related documents provided to us by the loan originator or seller and provide periodic reporting to these parties. BNY Mellon, either as document custodian or trustee, does not receive mortgage underwriting files (the files that contain information related to the creditworthiness of the borrower). As trustee or custodian, we have no responsibility or liability for the quality of the portfolio; we are liable only for performance of our limited duties as described above and in the trust documents. BNY Mellon is indemnified by the servicers or directly from trust assets under the governing agreements. BNY Mellon may appear as the named plaintiff in legal actions brought by servicers in foreclosure and other related proceedings because the trustee is the nominee owner of the mortgage loans within the trusts.
BNY Mellon also has been named as a defendant in legal actions brought by MBS investors alleging that the trustee has expansive duties under the governing agreements, including to investigate and pursue claims against other parties to the MBS transaction. For additional information on our legal proceedings related to this matter, see Note 17 of the Notes to Consolidated Financial Statements.balance sheet challenges.
Review of financial results
AUC/A increased 6%9% compared with Sept. 30, 2016March 31, 2017 to a record $32.2$33.5 trillion, primarily reflecting higher market values, the favorable impact of a weaker U.S. dollar and net new business. AUC/A consisted of
37% equity securities and 63% fixed incomefixed-income securities at Sept. 30, 2017,both March 31, 2018 and March 31, 2017.
Total revenue of $3.1 billion increased compared with 34% equity securitiesboth the first quarter of 2017 and 66% fixed income securities at Sept. 30, 2016.the fourth quarter of 2017. Net interest revenue increased in most businesses primarily driven by higher interest rates. The other drivers of net interest revenue and fee revenue by line of business are indicated below.
Investment services feesAsset Servicing revenue of $1.5 billion increased 2%13% compared with the thirdfirst quarter of 20162017 and 3%4% (unannualized) compared with the secondfourth quarter of 2017, reflecting the following factors:2017. Both increases primarily reflect higher net interest revenue due in part to an increase in deposit balances, higher fees driven by an increase in
Asset servicing fees (custody, fund services, broker-dealer services, securities finance, collateralBNY Mellon 13
volumes, market values and liquidity services)foreign exchange volumes, as well as the favorable impact of a weaker U.S. dollar.
Pershing revenue of $581 million increased 4%11% compared with the thirdfirst quarter of 20162017 and 2% (unannualized) compared with the secondfourth quarter of 2017. Both increases primarily reflect higher net interest revenue and higher fees due to growth in long-term mutual fund balances and clearance volumes.
Issuer Services revenue of $418 million increased 6% compared with the first quarter of 2017 and 19% (unannualized) compared with the fourth quarter of 2017. The increase compared with the third quarter of 2016 primarily reflects higher equity market values and net new business, including growth in collateral management, partially offset by the impact of downsizing the retail UK transfer agency business. The increase compared with the secondfirst quarter of 2017 was primarily driven byreflects higher net interest revenue in Corporate Trust as well as the favorable impact of a weaker U.S. dollar and higher equity market values.
Clearing services fees increased 10%dollar. The increase compared with the thirdfourth quarter of 20162017 primarily driven byreflects seasonally higher money market fees and growth in long-term mutual fund assets. Clearing services fees decreased 3% (unannualized)Depositary Receipts revenue.
Treasury Services revenue of $321 million increased 6% compared with the secondfirst quarter of 2017 primarily reflecting lower clearancehigher net interest revenue and payment volumes.
Issuer services fees (Depositary ReceiptsClearance and Corporate Trust) decreased 14%Collateral Management revenue of $255 million increased 13% compared with the thirdfirst quarter of 2016 and increased 20% (unannualized) compared with the second quarter of 2017. The decrease compared with the third quarter of 2016 primarily reflects fewer corporate actions, lost business and lower fees due to a reduction in shares outstanding in certain depositary receipts programs, partially offset by higher Corporate Trust revenue. The increase compared with the second quarter of 2017 primarily reflects seasonality in Depositary Receipts revenue and higher Corporate Trust revenue.
Treasury services fees (global payments, trade finance and cash management) increased 4% compared with the third quarter of 2016 and 1% (unannualized) compared with the secondfourth quarter of 2017. The increase compared with the first quarter of 2017 primarily reflectingreflects growth in collateral management, higher paymentclearance volumes partially offset by higher compensating
balance credits provided to clients, which reduces fee revenue and increases net interest revenue.
Market and regulatory trends are driving investable assets toward lower fee asset management products at reduced margins for our clients. These dynamics are also negatively impacting our investment services fees. However, at the same time, these trends are providing additional outsourcing opportunities as clients and other market participants seek to comply with new regulations and reduce their operating costs.
Foreign exchange and other trading revenue decreased 13%Noninterest expense of $1.9 billion increased 5% compared with the thirdfirst quarter of 2016 primarily reflecting lower volatility2017 and lower Depositary Receipt-related foreign exchange activity, partially offset by higher volumes. Foreign exchange and other trading revenue increased 6%decreased 7% (unannualized) compared with the secondfourth quarter of 2017 primarily reflecting higher volumes.
Other revenue decreased 4% compared with the third quarter of 2016 and increased 4% (unannualized) compared with the second quarter of 2017. The third quarter of 2016 results include termination fees related to the clearing services business. Both comparisons reflect higher payments from Investment Management related totechnology costs, the unfavorable impact of the weaker U.S. dollar and higher money market fees.
Net interest revenue increased 9%volume-related sub-custodian and clearing expense. The increase compared with the thirdfirst quarter of 2016 primarily reflecting the impact of the higher interest rates,2017 was partially offset by lower average deposits and loans. Net interest revenue increased 2% (unannualized)consulting expenses. The decrease compared with the secondfourth quarter of 2017 primarily reflecting higher interest rates.
Noninterest expense, excluding amortization of intangible assets, increased 1% compared with the third quarter of 2016 and decreased 3% (unannualized) compared with the second quarter of 2017. The increase primarily reflects additional technology related-costs, partially offset by lower staff expense. The decrease primarily reflects lower consulting expense, volume-related clearing and sub-custodian expenses and lower business development expense.
Year-to-date 2017 compared with year-to-date 2016
Income before taxes increased 6% compared with the first nine months of 2016, primarily driven by revenue growth of 3%, partially offset by a 3% increase in noninterest expense, excluding amortization of intangible assets. Fee and other revenue increased 2% primarily reflecting higher clearing services and asset servicing fees, partially offset by lower foreign exchange and other trading revenue. The increase in clearing services fees primarily reflects higher money market fees and growth in long-term mutual fund assets. The increase in asset servicing fees primarily reflects net new business, including growth in collateral management and higher equity market values, partially offset by the impact of downsizing the retail UK transfer agency business and the unfavorable impact of a stronger U.S. dollar. The decrease in foreign exchange and other trading revenue primarily reflects lower volatility and lower Depositary Receipt-related foreign exchange activity. Net interest revenue increased 8%was primarily due to higher interest rates, partially offset by lower average deposits. Noninterest expense, excluding amortizationseverance, litigation and an asset impairment recorded in the fourth quarter of intangible assets, increased 3% primarily reflecting higher expenses from regulatory and compliance costs and additional technology investments, partially offset by lower litigation expense and the favorable impact of a stronger U.S. dollar.2017.
Investment Management business
|
| | | | | | | | | | | | | | | | | | | |
| | | | | | | 1Q18 vs. |
| (dollars in millions) | 1Q18 |
| 4Q17 |
| 3Q17 |
| 2Q17 |
| 1Q17 |
| 4Q17 |
| 1Q17 |
|
| Revenue: | | | | | | | |
Investment management fees (a) | $ | 898 |
| $ | 898 |
| $ | 871 |
| $ | 845 |
| $ | 814 |
| — | % | 10 | % |
| Performance fees | 48 |
| 50 |
| 15 |
| 17 |
| 12 |
| N/M |
| 300 |
|
Investment management and performance fees (b) | 946 |
| 948 |
| 886 |
| 862 |
| 826 |
| — |
| 15 |
|
| Distribution and servicing | 50 |
| 51 |
| 51 |
| 53 |
| 52 |
| (2 | ) | (4 | ) |
Other (a) | 16 |
| (25 | ) | (19 | ) | (16 | ) | (1 | ) | N/M |
| N/M |
|
Total fee and other revenue (a) | 1,012 |
| 974 |
| 918 |
| 899 |
| 877 |
| 4 |
| 15 |
|
| Net interest revenue | 76 |
| 74 |
| 82 |
| 87 |
| 86 |
| 3 |
| (12 | ) |
| Total revenue | 1,088 |
| 1,048 |
| 1,000 |
| 986 |
| 963 |
| 4 |
| 13 |
|
| Provision for credit losses | 2 |
| 1 |
| (2 | ) | — |
| 3 |
| N/M |
| N/M |
|
| Noninterest expense (excluding amortization of intangible assets) | 692 |
| 756 |
| 687 |
| 683 |
| 668 |
| (8 | ) | 4 |
|
| Amortization of intangible assets | 13 |
| 15 |
| 15 |
| 15 |
| 15 |
| (13 | ) | (13 | ) |
| Total noninterest expense | 705 |
| 771 |
| 702 |
| 698 |
| 683 |
| (9 | ) | 3 |
|
| Income before taxes | $ | 381 |
| $ | 276 |
| $ | 300 |
| $ | 288 |
| $ | 277 |
| 38 | % | 38 | % |
| | | | | | | | |
| Pre-tax operating margin | 35 | % | 26 | % | 30 | % | 29 | % | 29 | % | | |
Adjusted pre-tax operating margin – Non-GAAP (c) | 39 | % | 29 | % | 34 | % | 33 | % | 32 | % | | |
| | | | | | | | |
| Total revenue by line of business: | | | | | | | |
| Asset Management | $ | 770 |
| $ | 738 |
| $ | 693 |
| $ | 683 |
| $ | 661 |
| 4 | % | 16 | % |
| Wealth Management | 318 |
| 310 |
| 307 |
| 303 |
| 302 |
| 3 |
| 5 |
|
| Total revenue by line of business | $ | 1,088 |
| $ | 1,048 |
| $ | 1,000 |
| $ | 986 |
| $ | 963 |
| 4 | % | 13 | % |
| | | | | | | | |
| Average balances: | | | | | | | |
| Average loans | $ | 16,876 |
| $ | 16,813 |
| $ | 16,724 |
| $ | 16,560 |
| $ | 16,153 |
| — | % | 4 | % |
| Average deposits | $ | 13,363 |
| $ | 11,633 |
| $ | 12,374 |
| $ | 14,866 |
| $ | 15,781 |
| 15 | % | (15 | )% |
| |
| (a) | Total fee and other revenue includes the impact of the consolidated investment management funds, net of noncontrolling interests. Additionally, other revenue includes asset servicing, treasury services, foreign exchange and other trading revenue and investment and other income. |
| |
| (b) | On a constant currency basis, investment management and performance fees increased 10% (Non-GAAP) compared with the first quarter of 2017. |
| |
| (c) | Net of distribution and servicing expense. See “Supplemental information – Explanation of GAAP and Non-GAAP financial measures” beginning on page 40 for the reconciliation of this Non-GAAP measure. In the first quarter of 2018, the adjusted pre-tax margin – Non-GAAP for prior periods was restated to include amortization of intangible assets and the provision for credit losses. |
N/M - Not meaningful.
|
| | | | | | | | | | | | | | | | | | | |
AUM trends (a) | | | | | | 1Q18 vs. |
| (dollars in billions) | 1Q18 |
| 4Q17 |
| 3Q17 |
| 2Q17 |
| 1Q17 |
| 4Q17 |
| 1Q17 |
|
| AUM at period end, by product type: | | | | | | | |
| Equity | $ | 161 |
| $ | 161 |
| $ | 158 |
| $ | 163 |
| $ | 158 |
| — | % | 2 | % |
| Fixed income | 206 |
| 206 |
| 206 |
| 198 |
| 191 |
| — |
| 8 |
|
| Index | 333 |
| 350 |
| 333 |
| 324 |
| 330 |
| (5 | ) | 1 |
|
Liability-driven investments (b) | 700 |
| 667 |
| 622 |
| 607 |
| 584 |
| 5 |
| 20 |
|
| Multi-asset and alternative investments | 185 |
| 214 |
| 207 |
| 192 |
| 188 |
| (14 | ) | (2 | ) |
| Cash | 283 |
| 295 |
| 298 |
| 287 |
| 276 |
| (4 | ) | 3 |
|
| Total AUM | $ | 1,868 |
| $ | 1,893 |
| $ | 1,824 |
| $ | 1,771 |
| $ | 1,727 |
| (1 | )% | 8 | % |
| | | | | | |
|
|
| Changes in AUM: | | | | | | | |
| Beginning balance of AUM | $ | 1,893 |
| $ | 1,824 |
| $ | 1,771 |
| $ | 1,727 |
| $ | 1,648 |
| | |
| Net inflows: | | | | | | | |
| Long-term strategies: | | | | | | | |
| Equity | — |
| (6 | ) | (2 | ) | (2 | ) | (4 | ) | | |
| Fixed income | 7 |
| (2 | ) | 4 |
| 2 |
| 2 |
| | |
Liability-driven investments (b) | 13 |
| 23 |
| (2 | ) | 15 |
| 14 |
| | |
| Multi-asset and alternative investments | (3 | ) | 2 |
| 3 |
| 1 |
| 2 |
| | |
| Total long-term active strategies inflows | 17 |
| 17 |
| 3 |
| 16 |
| 14 |
| | |
| Index | (13 | ) | (1 | ) | (3 | ) | (13 | ) | — |
| | |
| Total long-term strategies inflows | 4 |
| 16 |
| — |
| 3 |
| 14 |
| | |
| Short-term strategies: | | | | | | | |
| Cash | (14 | ) | (4 | ) | 10 |
| 11 |
| 13 |
| | |
| Total net (outflows) inflows | (10 | ) | 12 |
| 10 |
| 14 |
| 27 |
| | |
| Net market impact | (14 | ) | 47 |
| 17 |
| 1 |
| 41 |
| | |
| Net currency impact | 29 |
| 10 |
| 26 |
| 29 |
| 11 |
| | |
Divestitures/Other (c) | (30 | ) | — |
| — |
| — |
| — |
| | |
| Ending balance of AUM | $ | 1,868 |
| $ | 1,893 |
| $ | 1,824 |
| $ | 1,771 |
| $ | 1,727 |
| (1 | )% | 8 | % |
| | | | | | |
|
|
|
|
Wealth Management client assets (d) | $ | 246 |
| $ | 251 |
| $ | 245 |
| $ | 239 |
| $ | 236 |
| (2 | )% | 4 | % |
| |
| (a) | Excludes securities lending cash management assets and assets managed in the Investment Services business. |
| |
| (b) | Includes currency overlay AUM. |
| |
| (c) | Primarily reflects a change in methodology beginning in the first quarter of 2018 to exclude AUM related to equity method investments as well as the CenterSquare divestiture. |
| |
| (d) | Includes AUM and AUC/A in the Wealth Management business. |
Business description
Our Investment Management business consists of two lines of business, Asset Management and Wealth Management. The Asset Management business offers diversified investment management strategies and distribution of investment products. The Wealth Management business provides investment management, custody, wealth and estate planning and private banking services. See pages 19 and 20 of our 2017 Annual Report for additional information on our Investment Management business.
Review of financial results
AUM increased 8% compared with March 31, 2017 primarily reflecting the favorable impact of a weaker U.S. dollar (principally versus the British pound), higher market values and net inflows, partially offset by the divestiture of CenterSquare and other changes.
Net long-term inflows of $4 billion in the first quarter of 2018 were a result of $17 billion of inflows into actively managed strategies, primarily liability-driven and fixed income investments, and $13 billion of outflows from index strategies. Net short-term outflows were $14 billion in the first quarter of 2018. Market and regulatory trends have resulted in increased demand for lower fee asset management products, and for performance-based fees.
Total revenue of $1.1 billion increased 13% compared with the first quarter of 2017 and 4% (unannualized) compared with the fourth quarter of 2017.
Asset Management revenue of $770 million increased 16% compared with the first quarter of 2017 and 4% (unannualized) compared with the fourth quarter of 2017. Both increases primarily reflect higher equity market values, the favorable impact of a weaker U.S. dollar (principally versus the British pound) and the
impact of the sale of CenterSquare. The increase compared with the first quarter of 2017 also reflects higher performance fees due primarily to strong liability-driven investment and alternative investment performance.
Wealth Management revenue of $318 million increased 5% compared with the first quarter of 2017 and 3% (unannualized) compared with the fourth quarter of 2017. Both increases primarily reflect higher equity market values. The increase compared with the first quarter of 2017 also reflects net new business, partially offset by lower net interest revenue due to lower deposit balances.
Revenue generated in the Investment Management business included 42% from non-U.S. sources in the first quarter of 2018, compared with 40% in the first quarter of 2017 and 42% in the fourth quarter of 2017.
Noninterest expense increased 3% compared with the first quarter of 2017, primarily reflecting the unfavorable impact of a weaker U.S. dollar. The 9% (unannualized) decrease compared with the fourth quarter of 2017 primarily reflects lower severance and incentive expense.
Other segment
|
| | | | | | | | | | | | | | | | | | | | | |
| | | | | | | | |
| (in millions) | 3Q17 |
| 2Q17 |
| 1Q17 |
| 4Q16 |
| 3Q16 |
| YTD17 |
| YTD16 |
|
| Revenue: | | | | | | | |
| Fee and other revenue | $ | 69 |
| $ | 113 |
| $ | 72 |
| $ | 42 |
| $ | 100 |
| $ | 254 |
| $ | 324 |
|
| Net interest (expense) revenue | (20 | ) | (22 | ) | (1 | ) | 38 |
| (23 | ) | (43 | ) | (24 | ) |
| Total revenue | 49 |
| 91 |
| 71 |
| 80 |
| 77 |
| 211 |
| 300 |
|
| Provision for credit losses | (2 | ) | (4 | ) | (8 | ) | 1 |
| (20 | ) | (14 | ) | (26 | ) |
| Noninterest expense (ex. M&I and restructuring charges) | 77 |
| 28 |
| 106 |
| 108 |
| 88 |
| 211 |
| 282 |
|
| M&I and restructuring charges | — |
| — |
| 1 |
| 2 |
| — |
| 1 |
| 2 |
|
| Total noninterest expense | 77 |
| 28 |
| 107 |
| 110 |
| 88 |
| 212 |
| 284 |
|
| (Loss) income before taxes | $ | (26 | ) | $ | 67 |
| $ | (28 | ) | $ | (31 | ) | $ | 9 |
| $ | 13 |
| $ | 42 |
|
(Loss) income before taxes (ex. M&I and restructuring charges) – Non-GAAP | $ | (26 | ) | $ | 67 |
| $ | (27 | ) | $ | (29 | ) | $ | 9 |
| $ | 14 |
| $ | 44 |
|
| | | | | | | | |
| Average loans and leases | $ | 1,182 |
| $ | 1,302 |
| $ | 1,341 |
| $ | 2,142 |
| $ | 1,941 |
| $ | 1,275 |
| $ | 1,853 |
|
|
| | | | | | | | | | | | | | | |
| | | | | | |
| (in millions) | 1Q18 |
| 4Q17 |
| 3Q17 |
| 2Q17 |
| 1Q17 |
|
| Fee revenue (loss) | $ | 57 |
| $ | (221 | ) | $ | 50 |
| $ | 113 |
| $ | 62 |
|
| Net securities (losses) gains | (49 | ) | (26 | ) | 19 |
| — |
| 10 |
|
| Total fee and other revenue (loss) | 8 |
| (247 | ) | 69 |
| 113 |
| 72 |
|
| Net interest (expense) | (1 | ) | (36 | ) | (20 | ) | (22 | ) | (1 | ) |
| Total revenue (loss) | 7 |
| (283 | ) | 49 |
| 91 |
| 71 |
|
| Provision for credit losses | — |
| (5 | ) | (2 | ) | (4 | ) | (8 | ) |
| Noninterest expense | 87 |
| 135 |
| 77 |
| 28 |
| 107 |
|
| (Loss) income before taxes | $ | (80 | ) | $ | (413 | ) | $ | (26 | ) | $ | 67 |
| $ | (28 | ) |
| | | | | | |
| Average loans and leases | $ | 2,530 |
| $ | 1,114 |
| $ | 1,182 |
| $ | 1,302 |
| $ | 1,341 |
|
See pagepages 25 and 26 of our 20162017 Annual Report for additional information on the Other segment.
Review of financial results
Total fee and otherFee revenue decreased $31increased $278 million compared with the thirdfourth quarter of 2016 and $44 million compared with2017 primarily reflecting the second quarterimpact of 2017. The decrease compared with the third quarter of 2016 primarily reflects lower other income, driven by increased lossesU.S. tax legislation on our investments in renewable energy, and lower asset-related and netwhich resulted in a reduction of $279 million recorded in the fourth quarter of 2017.
Net securities gains. The decreaselosses recorded in the first quarter of 2018 primarily relate to the sale of approximately $1 billion of debt securities.
Net interest expense decreased $35 million compared with the secondfourth quarter of 2017, primarily reflects lease-related gains recorded inreflecting the secondimpact of interest rate hedging activities.
Noninterest expense decreased $20 million compared with the first quarter of 2017 and lower income from corporate/bank-owned life insurance, partially offset by higher net securities gains.
Net interest expense decreased $3$48 million compared with the third quarter of 2016 and $2 million compared with the secondfourth quarter of 2017. Both decreases primarily reflect higher interest rates.
Noninterest expense, excluding M&I and restructuring charges, decreased $11 million compared with the third quarter of 2016 and increased $49 million compared with the second quarter of 2017. The decrease was primarily driven by lower litigation and other expenses. The increase was primarily driven by higher staff expense resulting from a methodology change in the second quarter of 2017 for allocating employee benefits expense to the business segments with no impact to consolidated results. The increase was partially offset by lower other and professional, legal and other purchased services expenses.
Year-to-date 2017 compared with year-to-date 2016
Income before taxes decreased $29 millionexpense, partially offset by higher incentive expense. The decrease compared with the first nine monthsfourth quarter of 2016. Fee2017 also reflects lower severance, software and other revenue decreased $70 million primarily reflecting lower net securities gains and lower other income driven by increased pre-tax losses on our investments in renewable energy. Net interest expense increased $19 million reflecting the impact of higher crediting rates to the businesses. Noninterest expense, excluding M&I and restructuring charges, decreased $71 million primarily reflecting lower staff, other and litigationoccupancy expenses.
Critical accounting estimates
Our significant accounting policies are described in Note 1 of the Notes to Consolidated Financial Statements in our 20162017 Annual Report. Our critical accounting estimates are those related to the allowance for loan losses and allowance for lending-related commitments, fair value of financial instruments and derivatives, other-than-temporary impairment (“OTTI”), goodwill and other intangibles, and pension accounting, as referenced below.
|
| |
| Critical policy | Reference |
| Allowance for loan losses and allowance for lending-related commitments | 20162017 Annual Report, pages 29-31.29-30. |
| Fair value of financial instruments and derivatives | 20162017 Annual Report, pages 31-32.30-32. |
| OTTI | 20162017 Annual Report, page 33.pages 32-33. |
| Goodwill and other intangibles | Second quarter 2017 Form 10-Q, page 24.Annual Report, pages 33-34. |
| Pension accounting | 20162017 Annual Report, pages 34-36.34-35. |
Consolidated balance sheet review
One of our key risk management objectives is to maintain a balance sheet that remains strong throughout market cycles to meet the expectations of our major stakeholders, including our shareholders, clients, creditors and regulators.
We also seek to ensureverify that the overall liquidity risk, including intra-dayintraday liquidity risk, that we undertake stays within our risk appetite. The objective of our balance sheet management strategy is to maintain a balance sheet that is characterized by strong liquidity and asset quality, ready access to external funding sources at competitive rates and a strong capital structure that supports our risk-taking activities and is adequate to absorb potential losses. In managing the balance sheet, appropriate consideration is given to balancing the competing needs of maintaining sufficient levels of liquidity and complying with applicable regulations and supervisory expectations while optimizing profitability.
At Sept. 30, 2017,March 31, 2018, total assets were $354$374 billion compared with $333$372 billion at Dec. 31, 2016.2017. The increase in total assets was primarily driven by higher interest-bearing deposits with the Federal Reserve and other central banks, partially offset by lower loans.banks. Deposits totaled $231$242 billion at Sept. 30, 2017March 31, 2018 and $221$244 billion at Dec. 31, 2016,2017, and were driven by lower noninterest-
bearing deposits and interest-bearing deposits in non-U.S. offices, partially offset by higher interest-bearing deposits in non-U.S.U.S. offices. At Sept. 30, 2017,March 31, 2018, total interest-bearing deposits were 50%52% of total interest-earning assets, compared with 51% at Dec. 31, 2016.2017.
At Sept. 30, 2017,March 31, 2018, we had $43$44 billion of liquid funds (which include interest-bearing deposits with banks and federal funds sold and securities purchased under resale agreements) and $82$96 billion of cash (including $76$91 billion of overnight deposits with the Federal Reserve and other central banks) for a total of $125$140 billion of available funds. This compares with available funds of $104$137 billion at Dec. 31, 2016.2017. Total available funds as a percentage of total assets were 35%37% at Sept. 30, 2017 compared with 31% atboth March 31, 2018 and Dec. 31, 2016.2017. For additional information on our liquid funds and available funds, see “Liquidity and dividends.”
Investment securities were $120.0$119 billion, or 34%32% of total assets, at Sept. 30, 2017,March 31, 2018, compared with $114.7$120 billion, or 34%32% of total assets, at Dec. 31, 2016.2017. The increase in investmentlower level of securities primarily reflects additional investmentsa decrease in commercial mortgage-
backedU.S. Treasury securities, consumer asset-backed securities (“MBS”ABS”) and, agency residential mortgage-backed securities (“RMBS”), and other securities, partially offset by fewer investmentsan increase in consumer asset-backedcommercial mortgage-backed securities (“ABS”MBS”). For additional information on our investment securities portfolio, see “Investment securities” and Note 4 of the Notes to Consolidated Financial Statements.
Loans were $59.1$61 billion, or 16% of total assets, at March 31, 2018, compared with $62 billion, or 17% of total assets, at Sept. 30, 2017, compared with $64.5 billion, or 19% of total assets, at Dec. 31, 2016.2017. The decrease in loans was primarily driven by lower margin loans and loans to financial institutions.loans. For additional information on our loan portfolio, see “Loans” and Note 5 of the Notes to Consolidated Financial Statements.
Long-term debt totaled $28.4$28 billion at Sept. 30, 2017both March 31, 2018 and $24.5 billion at Dec. 31, 2016.2017. The increasebalance reflects issuances of $4.75$1.8 billion, partially offset by the maturitymaturities of $500 million$1.4 billion and a decrease in the redemptionfair value of trust preferred securities.hedged long-term debt. For additional information on long-term debt, see “Liquidity and dividends.”
The Bank of New York Mellon Corporation total shareholders’ equity increased to $40.5$42 billion from $38.8$41 billion at Dec. 31, 2016.2017. For additional information on our capital, see “Capital.”
Country risk exposure
We have exposure to certain countries with higher risk profiles. Exposure described below reflects the country of operations and risk of the immediate counterparty. We continue to monitor our exposure to these and other countries as part of our risk management process. See “Risk management” in our 20162017 Annual Report for additional information on how our exposures are managed.
BNY Mellon has a limited economic interest in the performance of assets of consolidated investment management funds, and therefore they are excluded from this disclosure.
Italy and Spain
Events in recent years have resulted in increased focus on Italy and Spain. We had net exposure of $1.3$1.8 billion to Italy and $2.0$2.2 billion to Spain at Sept. 30, 2017. We had net exposure of $1.2March 31, 2018 and $1.8 billion to Italy and $2.0$2.1 billion to Spain at Dec. 31, 2016.2017. At both Sept. 30, 2017March 31, 2018 and Dec. 31, 2016,2017, exposure to Italy and Spain primarily consisted of investment grade
sovereign debt. Investment securities exposure totaled $1.2 billion in Italy and $1.7 billion in Spain at Sept. 30, 2017March 31, 2018 and $1.1$1.3 billion in Italy and $1.8$1.6 billion in Spain at Dec. 31, 20162017.
Brazil
Current conditions in Brazil have resulted in increased focus on its economic and political stability. We have operations in Brazil providing investment services and investment management services. In addition, at Sept. 30, 2017At
March 31, 2018 and Dec. 31, 2016,2017, we had total net exposure to Brazil of $1.4$1.7 billion and $1.3$1.4 billion, respectively. This included $1.2$1.6 billion and $1.3 billion, respectively, in loans, which are primarily short-term trade finance loans extended to large financial institutions. At Sept. 30, 2017March 31, 2018 and Dec. 31, 2016,2017, we held $140$133 million and $73$136 million, respectively, of noninvestmentnon-investment grade sovereign debt.
Turkey
Events in recent years have resulted in increased focus on exposure to Turkey. We mainly provide treasury and issuer services, as well as foreign exchange products primarily to the top-10top-ten largest financial institutions in the country. As of Sept. 30, 2017March 31, 2018 and Dec. 31, 2016,2017, our exposure totaled $780$682 million and $713$707 million, respectively, consisting primarily of syndicated credit facilities and trade finance loans.
Investment securities
In the discussion of our investment securities portfolio, we have included certain credit ratings information because the information can indicate the degree of credit risk to which we are exposed. Significant changes in ratings classifications for our investment securities portfolio could indicate increased credit risk for us and could be accompanied by a reduction in the fair value of our investment securities portfolio.
The following table shows the distribution of our total investment securities portfolio.
| | Investment securities portfolio
(dollars in millions) | June 30, 2017 |
| | 3Q17 change in unrealized gain (loss) |
| Sept. 30, 2017 | Fair value as a % of amortized cost (a) |
| Unrealized gain (loss) |
| | Ratings (b) | Dec. 31, 2017 |
| | 1Q18 change in unrealized gain (loss) |
| March 31, 2018 | Fair value as a % of amortized cost (a) |
| Unrealized gain (loss) |
| | Ratings (b) |
| | | BB+ and lower | | | | BB+ and lower | |
Fair value |
| | Amortized cost |
| Fair value |
| | | AAA/ AA- | A+/ A- | BBB+/ BBB- | Not rated | Fair value |
| | Amortized cost |
| Fair value |
| | | AAA/ AA- | A+/ A- | BBB+/ BBB- | Not rated |
| Agency RMBS | $ | 49,544 |
| | $ | 81 |
| $ | 50,121 |
| $ | 49,917 |
| | 100 | % | $ | (204 | ) | | 100 | % | — | % | — | % | — | % | — | % | $ | 49,746 |
| | $ | (556 | ) | $ | 50,113 |
| $ | 49,093 |
| | 98 | % | $ | (1,020 | ) | | 100 | % | — | % | — | % | — | % | — | % |
| U.S. Treasury | 25,325 |
| | (5 | ) | 25,256 |
| 25,159 |
| | 100 |
| (97 | ) | | 100 |
| — |
| — |
| — |
| — |
| 24,848 |
| | (58 | ) | 23,706 |
| 23,545 |
| | 99 |
| (161 | ) | | 100 |
| — |
| — |
| — |
| — |
|
Sovereign debt/sovereign guaranteed (c) | 14,025 |
| | 6 |
| 13,951 |
| 14,102 |
| | 101 |
| 151 |
| | 72 |
| 6 |
| 21 |
| 1 |
| — |
| 14,128 |
| | (11 | ) | 14,613 |
| 14,732 |
| | 101 |
| 119 |
| | 74 |
| 6 |
| 19 |
| 1 |
| — |
|
Non-agency RMBS (d) | 1,239 |
| | 9 |
| 885 |
| 1,185 |
| | 84 |
| 300 |
| | — |
| 1 |
| 3 |
| 87 |
| 9 |
| 1,640 |
| | (13 | ) | 1,229 |
| 1,534 |
| | 90 |
| 305 |
| | 3 |
| 1 |
| 10 |
| 69 |
| 17 |
|
| Non-agency RMBS | 627 |
| | 9 |
| 555 |
| 594 |
| | 97 |
| 39 |
| | 7 |
| 4 |
| 17 |
| 71 |
| 1 |
| |
European floating rate notes (e) | 523 |
| | (1 | ) | 393 |
| 387 |
| | 98 |
| (6 | ) | | 63 |
| 37 |
| — |
| — |
| — |
| 271 |
| | 1 |
| 271 |
| 268 |
| | 97 |
| (3 | ) | | 50 |
| 50 |
| — |
| — |
| — |
|
| Commercial MBS | 10,574 |
| | 5 |
| 11,051 |
| 11,033 |
| | 100 |
| (18 | ) | | 99 |
| 1 |
| — |
| — |
| — |
| 11,394 |
| | (13 | ) | 12,324 |
| 12,280 |
| | 100 |
| (44 | ) | | 100 |
| — |
| — |
| — |
| — |
|
| State and political subdivisions | 3,299 |
| | 1 |
| 3,109 |
| 3,141 |
| | 101 |
| 32 |
| | 80 |
| 17 |
| — |
| — |
| 3 |
| 2,973 |
| | (21 | ) | 2,756 |
| 2,742 |
| | 100 |
| (14 | ) | | 76 |
| 17 |
| 4 |
| — |
| 3 |
|
Foreign covered bonds (f) | 2,471 |
| | 1 |
| 2,612 |
| 2,626 |
| | 101 |
| 14 |
| | 100 |
| — |
| — |
| — |
| — |
| 2,615 |
| | (13 | ) | 2,808 |
| 2,806 |
| | 100 |
| (2 | ) | | 100 |
| — |
| — |
| — |
| — |
|
| Corporate bonds | 1,318 |
| | 4 |
| 1,262 |
| 1,275 |
| | 101 |
| 13 |
| | 17 |
| 69 |
| 14 |
| — |
| — |
| 1,255 |
| | (20 | ) | 1,236 |
| 1,222 |
| | 99 |
| (14 | ) | | 17 |
| 68 |
| 15 |
| — |
| — |
|
| CLOs | 2,642 |
| | 1 |
| 2,542 |
| 2,550 |
| | 100 |
| 8 |
| | 99 |
| — |
| — |
| 1 |
| — |
| 2,909 |
| | (3 | ) | 3,121 |
| 3,129 |
| | 100 |
| 8 |
| | 98 |
| — |
| — |
| 1 |
| 1 |
|
| U.S. government agencies | 2,210 |
| | 2 |
| 2,480 |
| 2,496 |
| | 101 |
| 16 |
| | 100 |
| — |
| — |
| — |
| — |
| 2,603 |
| | (46 | ) | 2,682 |
| 2,669 |
| | 100 |
| (13 | ) | | 100 |
| — |
| — |
| — |
| — |
|
| Consumer ABS | 1,330 |
| | 1 |
| 1,152 |
| 1,157 |
| | 100 |
| 5 |
| | 89 |
| 4 |
| 5 |
| 2 |
| — |
| 1,043 |
| | (2 | ) | 277 |
| 278 |
| | 100 |
| 1 |
| | 93 |
| — |
| 7 |
| — |
| — |
|
Other (g) | 3,758 |
| | (8 | ) | 4,118 |
| 4,122 |
| | 100 |
| 4 |
| | 81 |
| 17 |
| — |
| — |
| 2 |
| 4,483 |
| | (13 | ) | 3,920 |
| 3,905 |
| | 100 |
| (15 | ) | | 80 |
| 18 |
| — |
| — |
| 2 |
|
| Total investment securities | $ | 118,885 |
| (h) | $ | 106 |
| $ | 119,487 |
| $ | 119,744 |
| (h) | 100 | % | $ | 257 |
| (h)(i) | 93 | % | 3 | % | 3 | % | 1 | % | — | % | $ | 119,908 |
| (h) | $ | (768 | ) | $ | 119,056 |
| $ | 118,203 |
| (h) | 99 | % | $ | (853 | ) | (h)(i) | 93 | % | 3 | % | 3 | % | 1 | % | — | % |
| |
| (a) | Amortized cost before impairments. |
| |
| (b) | Represents ratings by S&P or the equivalent. |
| |
| (c) | Primarily consists of exposure to UK, France, Germany, Spain, Italy and the Netherlands. |
| |
| (d) | TheseIncludes RMBS that were included in the former Grantor Trust of $1,091 million at Dec. 31, 2017 and were marked-to-market in 2009. We believe these RMBS would receive higher credit ratings if these ratings incorporated, as additional credit enhancements, the difference between the written-down amortized cost and the current face amount of each of these securities.$1,019 million at March 31, 2018. |
| |
| (e) | Includes RMBS and commercial MBS. Primarily consists of exposure to UK and the Netherlands. |
| |
| (f) | Primarily consists of exposure to Canada, Australia, the Netherlands, NorwayUK and UK.Sweden. |
| |
| (g) | Includes commercial paper with a fair value of $700 million at both Dec. 31, 2017 and $700 million andMarch 31, 2018. Also includes money market funds with a fair value of $896$963 million at Dec. 31, 2017. In the first quarter of 2018, we adopted the new accounting guidance included in ASU 2016-01, Recognition and $939 million at June 30, 2017Measurement of Financial Assets and Sept. 30, 2017, respectively. Financial Liabilities. As a result, the money market fund investments were reclassified to trading assets, primarily from available-for-sale securities. |
| |
| (h) | Includes net unrealized losses on derivatives hedging securities available-for-sale of $251$147 million at June 30,Dec. 31, 2017 and a net unrealized gain of $238 million at Sept. 30, 2017. March 31, 2018. |
| |
| (i) | Unrealized gainsloss of $324$29 million at Sept. 30, 2017March 31, 2018 related to available-for-sale securities, net of hedges. |
The fair value of our investment securities portfolio, including related hedges, was $119.7$118.2 billion at Sept. 30, 2017,March 31, 2018, compared with $114.3$119.9 billion at Dec. 31, 2016.2017. The higherlower level of securities primarily reflects additional investmentsa decrease in commercial MBS andU.S. Treasury securities, consumer ABS, agency RMBS and other securities driven by the reclassification of money market fund investments, partially offset by a decreasean increase in consumer ABS.commercial MBS.
At Sept. 30, 2017,March 31, 2018, the total investment securities portfolio had a net unrealized pre-tax gainloss of $257$853 million, compared with a pre-taxnet unrealized loss of $221$85 million at Dec. 31, 2016,2017, including the impact of related hedges. The increase in net unrealized pre-tax gainloss was primarily driven by a decrease in long-termhigher interest rates.
The unrealized gain,loss, net of tax, on our available-for-sale investment securities portfolio included in accumulated other comprehensive income (“OCI”) was $226$12 million at Sept. 30, 2017,March 31, 2018, compared with $45an unrealized gain of $184 million at Dec. 31, 2016.2017.
At Sept. 30, 2017,March 31, 2018, 93% of the securities in our portfolio were rated AAA/AA-, unchanged compared with Dec. 31, 2016.2017.
We routinely test our investment securities for OTTI. See “Critical accounting estimates” for additional information regarding OTTI.
The following table presents the amortizable purchase premium (net of discount) related to the investment securities portfolio and accretable discount related to the 2009 restructuring of the investment securities portfolio.
| | Net premium amortization and discount accretion of investment securities (a) | | |
| (dollars in millions) | 3Q17 |
| 2Q17 |
| 1Q17 |
| 4Q16 |
| 3Q16 |
| 1Q18 |
| 4Q17 |
| 3Q17 |
| 2Q17 |
| 1Q17 |
|
| Amortizable purchase premium (net of discount) relating to investment securities: | | |
| Balance at period end | $ | 2,053 |
| $ | 2,111 |
| $ | 2,058 |
| $ | 2,188 |
| $ | 2,267 |
| $ | 1,827 |
| $ | 1,987 |
| $ | 2,053 |
| $ | 2,111 |
| $ | 2,058 |
|
Estimated average life remaining at period end (in years) | 5.0 |
| 5.0 |
| 4.9 |
| 4.9 |
| 4.5 |
| 5.2 |
| 5.0 |
| 5.0 |
| 5.0 |
| 4.9 |
|
| Amortization | $ | 140 |
| $ | 134 |
| $ | 138 |
| $ | 146 |
| $ | 163 |
| $ | 122 |
| $ | 135 |
| $ | 140 |
| $ | 134 |
| $ | 138 |
|
| Accretable discount related to the prior restructuring of the investment securities portfolio: | | |
| Balance at period end | $ | 302 |
| $ | 279 |
| $ | 299 |
| $ | 315 |
| $ | 331 |
| $ | 250 |
| $ | 274 |
| $ | 302 |
| $ | 279 |
| $ | 299 |
|
Estimated average life remaining at period end (in years) | 6.5 |
| 6.3 |
| 6.2 |
| 6.2 |
| 5.9 |
| 6.3 |
| 6.3 |
| 6.5 |
| 6.3 |
| 6.2 |
|
| Accretion | $ | 24 |
| $ | 25 |
| $ | 25 |
| $ | 25 |
| $ | 24 |
| $ | 25 |
| $ | 26 |
| $ | 24 |
| $ | 25 |
| $ | 25 |
|
| |
| (a) | Amortization of purchase premium decreases net interest revenue while accretion of discount increases net interest revenue. Both were recorded on a level yield basis. |
The following table presents pre-tax net securities (losses) gains (losses) by type.
| | | Net securities gains (losses) | | |
| Net securities (losses) gains | | |
| (in millions) | 3Q17 |
| 2Q17 |
| 3Q16 |
| YTD17 |
| YTD16 |
| 1Q18 |
| 4Q17 |
| 1Q17 |
|
| Agency RMBS | $ | 4 |
| $ | — |
| $ | 9 |
| $ | 5 |
| $ | 22 |
| $ | (42 | ) | $ | (17 | ) | $ | 1 |
|
| U.S. Treasury | 1 |
| (1 | ) | (1 | ) | — |
| 4 |
| (4 | ) | (16 | ) | — |
|
| Foreign covered bonds | — |
| — |
| — |
| — |
| 10 |
| |
| Non-agency RMBS | (1 | ) | — |
| (1 | ) | (2 | ) | 1 |
| — |
| 6 |
| (1 | ) |
| Other | 15 |
| 1 |
| 17 |
| 26 |
| 28 |
| (3 | ) | 1 |
| 10 |
|
| Total net securities gains | $ | 19 |
| $ | — |
| $ | 24 |
| $ | 29 |
| $ | 65 |
| |
| Total net securities (losses) gains | | $ | (49 | ) | $ | (26 | ) | $ | 10 |
|
On a quarterly basis, we perform our impairment analysis using several factors, including projected loss severities and default rates. In the thirdfirst quarter of 2017,2018, this analysis resulted in other-than-temporary credit losses of less than $1 million, primarily in our non-agency RMBS portfolio. At Sept. 30, 2017,March 31, 2018, if we were to increase or decrease each of our projected loss severity and default rates by 100 basis points on each of the positions in our non-agency RMBS
portfolio, including the securities previously held by the Grantor Trust, credit-related impairment charges on these securities would have increased or decreased by less than $1 million (pre-tax). See Note 4 of the Notes to Consolidated Financial Statements for the projected weighted-average default rates and loss severities.
The following table shows the fair value of the European floating rate notes by geographical location at Sept. 30, 2017.March 31, 2018. The net unrealized loss on these securities was $6$3 million at Sept. 30, 2017,March 31, 2018, compared with $11$4 million at Dec. 31, 2016.2017.
| | European floating rate notes at Sept. 30, 2017 (a) | |
European floating rate notes at March 31, 2018 (a) | | European floating rate notes at March 31, 2018 (a) |
| (in millions) | RMBS |
| Other |
| Total fair value |
| RMBS |
| Other |
| Total fair value |
|
| United Kingdom | $ | 169 |
| $ | 58 |
| $ | 227 |
| $ | 93 |
| $ | 57 |
| $ | 150 |
|
| Netherlands | 160 |
| — |
| 160 |
| 118 |
| — |
| 118 |
|
| Total fair value | $ | 329 |
| $ | 58 |
| $ | 387 |
| $ | 211 |
| $ | 57 |
| $ | 268 |
|
| |
| (a) | Sixty-threeFifty percent of these securities are in the AAA to AA- ratings category. |
See Note 1415 of the Notes to Consolidated Financial Statements for details of securities by level in the fair value hierarchy.
Loans
| | | Total exposure – consolidated | Sept. 30, 2017 | | Dec. 31, 2016 | March 31, 2018 | | Dec. 31, 2017 |
| (in billions) | Loans |
| Unfunded commitments |
| Total exposure |
| | Loans |
| Unfunded commitments |
| Total exposure |
| Loans |
| Unfunded commitments |
| Total exposure |
| | Loans |
| Unfunded commitments |
| Total exposure |
|
| Non-margin loans: | | | | | | |
| Financial institutions | $ | 11.9 |
| $ | 32.7 |
| $ | 44.6 |
| | $ | 14.7 |
| $ | 33.7 |
| $ | 48.4 |
| $ | 12.8 |
| $ | 32.7 |
| $ | 45.5 |
| | $ | 13.1 |
| $ | 32.5 |
| $ | 45.6 |
|
| Commercial | 3.0 |
| 16.6 |
| 19.6 |
| | 2.6 |
| 17.5 |
| 20.1 |
| 2.6 |
| 17.7 |
| 20.3 |
| | 2.9 |
| 18.0 |
| 20.9 |
|
| Subtotal institutional | 14.9 |
| 49.3 |
| 64.2 |
| | 17.3 |
| 51.2 |
| 68.5 |
| 15.4 |
| 50.4 |
| 65.8 |
| | 16.0 |
| 50.5 |
| 66.5 |
|
| Wealth management loans and mortgages | 16.3 |
| 1.1 |
| 17.4 |
| | 15.6 |
| 1.3 |
| 16.9 |
| 16.4 |
| 0.9 |
| 17.3 |
| | 16.5 |
| 1.1 |
| 17.6 |
|
| Commercial real estate | 4.9 |
| 3.5 |
| 8.4 |
| | 4.7 |
| 3.2 |
| 7.9 |
| 4.9 |
| 3.5 |
| 8.4 |
| | 4.9 |
| 3.5 |
| 8.4 |
|
| Lease financings | 1.3 |
| — |
| 1.3 |
| | 1.7 |
| — |
| 1.7 |
| 1.3 |
| — |
| 1.3 |
| | 1.3 |
| — |
| 1.3 |
|
| Other residential mortgages | 0.7 |
| — |
| 0.7 |
| | 0.9 |
| — |
| 0.9 |
| 0.7 |
| — |
| 0.7 |
| | 0.7 |
| — |
| 0.7 |
|
| Overdrafts | 5.8 |
| — |
| 5.8 |
| | 5.5 |
| — |
| 5.5 |
| 5.8 |
| — |
| 5.8 |
| | 5.1 |
| — |
| 5.1 |
|
| Other | 1.3 |
| — |
| 1.3 |
| | 1.2 |
| — |
| 1.2 |
| 1.2 |
| — |
| 1.2 |
| | 1.2 |
| — |
| 1.2 |
|
| Subtotal non-margin loans | 45.2 |
| 53.9 |
| 99.1 |
| | 46.9 |
| 55.7 |
| 102.6 |
| 45.7 |
| 54.8 |
| 100.5 |
| | 45.7 |
| 55.1 |
| 100.8 |
|
| Margin loans | 13.9 |
| — |
| 13.9 |
| | 17.6 |
| 0.1 |
| 17.7 |
| 15.1 |
| 0.1 |
| 15.2 |
| | 15.8 |
| — |
| 15.8 |
|
| Total | $ | 59.1 |
| $ | 53.9 |
| $ | 113.0 |
| | $ | 64.5 |
| $ | 55.8 |
| $ | 120.3 |
| $ | 60.8 |
| $ | 54.9 |
| $ | 115.7 |
| | $ | 61.5 |
| $ | 55.1 |
| $ | 116.6 |
|
At Sept. 30, 2017,March 31, 2018, total exposures of $113.0$115.7 billion decreased 6%1% compared with Dec. 31, 2016,2017, primarily reflecting slightly lower exposure in both the commercial and margin loans and exposure to financial institutions,loan portfolios, partially offset by higher wealth management loans and mortgages.overdrafts.
Our financial institutions and commercial portfolios comprise our largest concentrated risk. These portfolios comprised 57% of our total exposure at both Sept. 30, 2017March 31, 2018 and Dec. 31, 2016.2017. Additionally, most of our overdrafts relate to financial institutions.
Financial institutions
The financial institutions portfolio is shown below.
| | Financial institutions portfolio exposure (dollar amounts in billions) | Sept. 30, 2017 | | Dec. 31, 2016 | |
| Loans |
| Unfunded commitments |
| Total exposure |
| % Inv. grade |
| % due <1 yr. |
| | Loans |
| Unfunded commitments |
| Total exposure |
| |
Financial institutions portfolio exposure (dollars in billions) | | March 31, 2018 | | Dec. 31, 2017 |
| Loans |
| Unfunded commitments |
| Total exposure |
| % Inv. grade |
| % due <1 yr. |
| | Loans |
| Unfunded commitments |
| Total exposure |
|
| Securities industry | $ | 2.9 |
| $ | 19.0 |
| $ | 21.9 |
| 99 | % | 99 | % | | $ | 3.8 |
| $ | 19.2 |
| $ | 23.0 |
| $ | 3.6 |
| $ | 19.2 |
| $ | 22.8 |
| 98 | % | 99 | % | | $ | 3.6 |
| $ | 19.2 |
| $ | 22.8 |
|
| Banks | | 6.9 |
| 1.3 |
| 8.2 |
| 66 |
| 94 |
| | 7.0 |
| 1.2 |
| 8.2 |
|
| Asset managers | 1.6 |
| 6.5 |
| 8.1 |
| 97 |
| 87 |
| | 1.5 |
| 6.2 |
| 7.7 |
| 1.3 |
| 6.5 |
| 7.8 |
| 99 |
| 87 |
| | 1.4 |
| 6.4 |
| 7.8 |
|
| Banks | 6.3 |
| 1.4 |
| 7.7 |
| 68 |
| 94 |
| | 7.9 |
| 2.0 |
| 9.9 |
| |
| Insurance | 0.1 |
| 3.4 |
| 3.5 |
| 99 |
| 17 |
| | 0.1 |
| 3.8 |
| 3.9 |
| 0.1 |
| 3.5 |
| 3.6 |
| 99 |
| 12 |
| | 0.1 |
| 3.5 |
| 3.6 |
|
| Government | — |
| 1.0 |
| 1.0 |
| 91 |
| 46 |
| | 0.1 |
| 0.9 |
| 1.0 |
| 0.1 |
| 0.9 |
| 1.0 |
| 91 |
| 33 |
| | 0.1 |
| 0.9 |
| 1.0 |
|
| Other | 1.0 |
| 1.4 |
| 2.4 |
| 98 |
| 45 |
| | 1.3 |
| 1.6 |
| 2.9 |
| 0.8 |
| 1.3 |
| 2.1 |
| 98 |
| 62 |
| | 0.9 |
| 1.3 |
| 2.2 |
|
| Total | $ | 11.9 |
| $ | 32.7 |
| $ | 44.6 |
| 93 | % | 86 | % | | $ | 14.7 |
| $ | 33.7 |
| $ | 48.4 |
| $ | 12.8 |
| $ | 32.7 |
| $ | 45.5 |
| 93 | % | 86 | % | | $ | 13.1 |
| $ | 32.5 |
| $ | 45.6 |
|
The financial institutions portfolio exposure was $44.6$45.5 billion at Sept. 30, 2017,March 31, 2018, a slight decrease compared with $48.4$45.6 billion at Dec. 31, 2016. The decrease primarily reflects lower exposure in the banks and securities industry portfolios.2017.
Financial institution exposures are high-quality, with 93% of the exposures meeting the investment grade equivalent criteria of our internal credit rating classification at Sept. 30, 2017.March 31, 2018. Each customer is assigned an internal credit rating, which is mapped to
an equivalent external rating agency grade based upon a number of dimensions, which are continually evaluated and may change over time. The exposure to financial institutions is generally short-term. Of
these exposures, 86% expire within one year and 61%23% expire within 90 days. In addition, 80%77% of the financial institutions exposure is secured. For example, securities industry clients and asset managers often borrow against marketable securities held in custody.
For ratings of non-U.S. counterparties, our internal credit rating is generally capped at a rating equivalent to the sovereign rating of the country where the counterparty resides, regardless of the internal credit rating assigned to the counterparty or the underlying collateral.
At Sept. 30, 2017,March 31, 2018, the secured intraday credit provided to dealers in connection with their tri-party repo activity totaled $18.5$18.7 billion and was primarily included in the securities industry portfolio. Dealers secure the outstanding intraday credit with high-quality liquid collateral having a market value in excess of the amount of the outstanding credit.
Our bank exposure primarily relates to our global trade finance. These exposures are short-term in nature, with 94% due in less than one year. The investment grade percentage of our bank exposure was 68%66% at Sept. 30, 2017,March 31, 2018, compared with 69%68% at
Dec. 31, 2016.2017, reflecting our non-investment grade exposure to Brazil. Our exposure in Brazil includes $1.6 billion in loans, which are primarily short-term trade finance loans extended to large financial institutions.
The asset manager portfolio exposure was high-quality with 97%99% of the exposures meeting our investment grade equivalent ratings criteria as of Sept. 30, 2017.March 31, 2018. These exposures are generally short-term liquidity facilities, with the vast majority to regulated mutual funds.
Commercial
The commercial portfolio is presented below.
| | | Commercial portfolio exposure | Sept. 30, 2017 | | Dec. 31, 2016 | March 31, 2018 | | Dec. 31, 2017 |
| (dollar amounts in billions) | Loans |
| Unfunded commitments |
| Total exposure |
| % Inv. grade |
| % due <1 yr. |
| | Loans |
| Unfunded commitments |
| Total exposure |
| |
| (dollars in billions) | | Loans |
| Unfunded commitments |
| Total exposure |
| % Inv. grade |
| % due <1 yr. |
| | Loans |
| Unfunded commitments |
| Total exposure |
|
| Manufacturing | $ | 1.4 |
| $ | 6.3 |
| $ | 7.7 |
| 96 | % | 22 | % | | $ | 1.1 |
| $ | 6.7 |
| $ | 7.8 |
| $ | 1.3 |
| $ | 6.1 |
| $ | 7.4 |
| 95 | % | 21 | % | | $ | 1.3 |
| $ | 6.1 |
| $ | 7.4 |
|
| Services and other | 0.9 |
| 4.4 |
| 5.3 |
| 95 |
| 28 |
| | 0.6 |
| 4.3 |
| 4.9 |
| 0.7 |
| 5.8 |
| 6.5 |
| 96 |
| 28 |
| | 0.9 |
| 6.0 |
| 6.9 |
|
| Energy and utilities | 0.6 |
| 4.5 |
| 5.1 |
| 95 |
| 7 |
| | 0.6 |
| 4.7 |
| 5.3 |
| 0.6 |
| 4.4 |
| 5.0 |
| 95 |
| 9 |
| | 0.7 |
| 4.4 |
| 5.1 |
|
| Media and telecom | 0.1 |
| 1.4 |
| 1.5 |
| 95 |
| 15 |
| | 0.3 |
| 1.8 |
| 2.1 |
| — |
| 1.4 |
| 1.4 |
| 95 |
| 14 |
| | — |
| 1.5 |
| 1.5 |
|
| Total | $ | 3.0 |
| $ | 16.6 |
| $ | 19.6 |
| 95 | % | 19 | % | | $ | 2.6 |
| $ | 17.5 |
| $ | 20.1 |
| $ | 2.6 |
| $ | 17.7 |
| $ | 20.3 |
| 95 | % | 20 | % | | $ | 2.9 |
| $ | 18.0 |
| $ | 20.9 |
|
The commercial portfolio exposure decreased to $19.6$20.3 billion at Sept. 30, 2017,March 31, 2018, from $20.1$20.9 billion at Dec. 31, 2016,2017, primarily reflecting lower exposure into the mediaservices and telecomother portfolio.
Utilities-related exposure represents approximately 78% of the energy and utilities portfolio.portfolio at March 31, 2018. The remaining exposure in the energy and utilities portfolio, which includes exposure to exploration and production companies, refining, pipelines and integrated companies, was 76%78% investment grade at both Sept. 30, 2017March 31, 2018, and 77% at Dec. 31, 2016.2017.
Our credit strategy is to focus on investment grade clients that are active users of our non-credit services. The following table summarizes the percentage of the financial institutions and commercial portfolio exposures that are investment grade.
|
| | | | | | | | | | |
| Percentage of the portfolios that are investment grade |
| | March 31,
2018 |
| Dec. 31, 2017 |
| Sept. 30, 2017 |
| June 30,
2017 |
| March 31, 2017 |
|
| |
| Financial institutions | 93 | % | 93 | % | 93 | % | 93 | % | 93 | % |
| Commercial | 95 | % | 95 | % | 95 | % | 96 | % | 95 | % |
|
| | | | | | | | | | |
| Percentage of the portfolios that are investment grade | |
| | Sept. 30, 2017 |
| June 30, 2017 |
| March 31, 2017 |
| Dec. 31, 2016 |
| Sept. 30, 2016 |
|
| |
| Financial institutions | 93 | % | 93 | % | 93 | % | 92 | % | 93 | % |
| Commercial | 95 | % | 96 | % | 95 | % | 94 | % | 94 | % |
Our credit strategy is to focus on investment grade clients that are active users of our non-credit services. The execution of our strategy has resulted in 93% of our financial institutions portfolio and 95% of our commercial portfolio rated as investment grade at Sept. 30, 2017.
Wealth management loans and mortgages
Our wealth management exposure was $17.4$17.3 billion at Sept. 30, 2017,March 31, 2018, compared with $16.9$17.6 billion at Dec. 31, 2016.2017. Wealth management loans and mortgages primarily consist of loans to high-net-worth individuals, which are secured by marketable securities and/or residential property. Wealth management mortgages are primarily interest-only, adjustable-rate mortgages with a weighted-average loan-to-value ratio of 62% at origination. In the wealth management portfolio, lessLess than 1% of the mortgages were past due at Sept. 30, 2017.March 31, 2018.
At Sept. 30, 2017,March 31, 2018, the wealth management mortgage portfolio consisted of the following geographic concentrations: California - 24%; New York - 19%18%; Massachusetts - 11%; Florida - 8%; and other - 38%39%.
Commercial real estate
Our commercial real estate exposure totaled $8.4 billion at Sept. 30, 2017, compared with $7.9 billion atMarch 31, 2018 and Dec. 31, 2016.2017. Our income-producing commercial real estate facilities are focused on experienced owners and are structured with moderate leverage based on existing cash flows.
Our commercial real estate lending activities also include construction and renovation facilities. Our client base consists of experienced developers and long-term holders of real estate assets. Loans are approved on the basis of existing or projected cash flows and supported by appraisals and knowledge of local market conditions. Development loans are structured with moderate leverage, and in many instances, involve some level of recourse to the developer.
At Sept. 30, 2017, 59%March 31, 2018, 60% of our commercial real estate portfolio was secured. The secured portfolio is diverse by project type, with 45%48% secured by residential buildings, 35%32% secured by office buildings, 12%11% secured by retail properties and 8%9% secured by other categories. Approximately 97%98% of the unsecured portfolio consists of real estate investment trusts (“REITs”) and real estate operating companies, which are both predominantly investment grade.
At Sept. 30, 2017,March 31, 2018, our commercial real estate portfolio consists of the following concentrations: New York metro - 40%; REITs and real estate operating companies - 40%; New York metro - 39%; and other - 20%21%.
Lease financings
The leasing portfolio exposure totaled $1.3 billion at Sept. 30, 2017 compared with $1.7 billion atMarch 31, 2018 and Dec. 31, 2016.2017. At Sept. 30, 2017, approximately 94% of the leasing portfolio exposure was investment grade, or investment grade equivalent.
At Sept. 30, 2017,March 31, 2018, the lease financings portfolio consisted of exposures backed by well-diversified assets, including large-ticket transportation equipment.equipment, and approximately 96% of the leasing portfolio exposure was investment grade, or investment grade equivalent.
Other residential mortgages
The other residential mortgages portfolio primarily consists of 1-4 family residential mortgage loans and totaled $741$680 million at Sept. 30, 2017March 31, 2018 and $854$708 million at Dec. 31, 2016.2017. Included in this portfolio at Sept. 30, 2017March 31, 2018 are $181$160 million of mortgage loans
purchased in 2005, 2006 and the first quarter of 2007 that are predominantly prime mortgage loans, with a small portion of Alt-A loans. As of Sept. 30, 2017,March 31, 2018, the purchased loans in this portfolio had a weighted-average loan-to-value ratio of 76% at origination and 11%12% of the serviced loan balance was at least 60 days delinquent. The properties securing the prime and Alt-A mortgage loans were located (in order of
concentration) in California, Florida, Virginia, the tri-state area (New York, New Jersey and Connecticut) and Maryland.
To determine the projected loss on the prime and Alt-A mortgage portfolios, we calculate the total estimated defaults of these mortgages and multiply that amount by an estimate of realizable value upon sale in the marketplace (severity).
Overdrafts
Overdrafts primarily relate to custody and securities clearance clients. Overdrafts occur on a daily basis primarily in the custody and securities clearance business and are generally repaid within two business days.
Other loans
Other loans primarily include loans to consumers that are fully collateralized with equities, mutual funds and fixed incomefixed-income securities.
Margin loans
Margin loans are collateralized with marketable securities, and borrowers are required to maintain a daily collateral margin in excess of 100% of the value of the loan. Margin loans included $4.2$4.1 billion at Sept. 30, 2017March 31, 2018 and $6.3$4.2 billion at Dec. 31, 20162017 related to a term loan program that offers fully collateralized loans to broker-dealers.
Asset quality and allowance for credit losses
Our credit strategy is to focus on investment grade clients who are active users of our non-credit services. Our primary exposure to the credit risk of a customer consists of funded loans, unfunded contractual commitments to lend, standby letters of credit (“SBLC”) and overdrafts associated with our custody and securities clearance businesses.
The following table details changes in our allowance for credit losses.
| | | Allowance for credit losses activity | Sept. 30, 2017 |
| June 30, 2017 |
| Dec. 31, 2016 |
| Sept. 30, 2016 |
| March 31, 2018 |
| Dec. 31, 2017 |
| March 31, 2017 |
|
| (dollar amounts in millions) |
| (dollars in millions) | | March 31, 2018 |
| Dec. 31, 2017 |
| March 31, 2017 |
|
| Non-margin loans | $ | 45,196 |
| $ | 47,516 |
| $ | 46,868 |
| $ | 48,411 |
|
| Margin loans | 13,872 |
| 14,157 |
| 17,590 |
| 17,557 |
| 15,139 |
| 15,785 |
| 16,149 |
|
| Total loans | $ | 59,068 |
| $ | 61,673 |
| $ | 64,458 |
| $ | 65,968 |
| $ | 60,809 |
| $ | 61,540 |
| $ | 60,868 |
|
| Beginning balance of allowance for credit losses | $ | 270 |
| $ | 276 |
| $ | 274 |
| $ | 280 |
| $ | 261 |
| $ | 265 |
| $ | 281 |
|
| Provision for credit losses | (6 | ) | (7 | ) | 7 |
| (19 | ) | (5 | ) | (6 | ) | (5 | ) |
| Net recoveries: | | |
| Other residential mortgages | 1 |
| 1 |
| — |
| — |
| — |
| 2 |
| — |
|
| Financial institutions | — |
| — |
| — |
| 13 |
| |
| Net recoveries | 1 |
| 1 |
| — |
| 13 |
| — |
| 2 |
| — |
|
| Ending balance of allowance for credit losses | $ | 265 |
| $ | 270 |
| $ | 281 |
| $ | 274 |
| $ | 256 |
| $ | 261 |
| $ | 276 |
|
| Allowance for loan losses | $ | 161 |
| $ | 165 |
| $ | 169 |
| $ | 148 |
| $ | 156 |
| $ | 159 |
| $ | 164 |
|
| Allowance for lending-related commitments | 104 |
| 105 |
| 112 |
| 126 |
| 100 |
| 102 |
| 112 |
|
| Allowance for loan losses as a percentage of total loans | 0.27 | % | 0.27 | % | 0.26 | % | 0.22 | % | 0.26 | % | 0.26 | % | 0.27 | % |
| Allowance for loan losses as a percentage of non-margin loans | 0.36 |
| 0.35 |
| 0.36 |
| 0.31 |
| 0.34 |
| 0.35 |
| 0.37 |
|
| Total allowance for credit losses as a percentage of total loans | 0.45 |
| 0.44 |
| 0.44 |
| 0.42 |
| 0.42 |
| 0.42 |
| 0.45 |
|
| Total allowance for credit losses as a percentage of non-margin loans | 0.59 |
| 0.57 |
| 0.60 |
| 0.57 |
| 0.56 |
| 0.57 |
| 0.62 |
|
Net recoveries were $1 million in the third quarter of 2017 and second quarter of 2017. Net recoveries in the third quarter of 2016 of $13 million were recorded in the financial institutions portfolio.
The provision for credit losses was a credit of $6 million in the third quarter of 2017, a credit of $7 million in the second quarter of 2017 and a credit of $19 million in the third quarter of 2016.
The total allowance for credit losses was $265decreased $5 million at Sept. 30, 2017, $281 million atcompared with Dec. 31, 20162017 and $274$20 million at Sept. 30, 2016. The ratio ofcompared with March 31, 2017. Both decreases were driven by the total allowancecredit to provision for credit losses to non-margin loans was 0.59% at Sept. 30, 2017, 0.60% at Dec. 31, 2016 and 0.57% at Sept. 30, 2016. The ratio of the allowance for loan losses to non-margin loans was 0.36% at Sept. 30, 2017, 0.36% at Dec. 31, 2016 and 0.31% at Sept. 30, 2016.losses.
We had $13.9$15.1 billion of secured margin loans on our balance sheet at Sept. 30, 2017March 31, 2018 compared with $17.6$15.8 billion at Dec. 31, 20162017 and $17.6$16.1 billion at Sept. 30, 2016.March 31, 2017. We have rarely suffered a loss on these types of loans and do not allocate any of our allowance for credit losses to them. As a result, we believe that the ratio of total allowance for credit losses as a percentage of non-margin loans is a more appropriate metric to measure the adequacy of the reserve.
The allowance for loan losses and allowance for lending-related commitments represent management’s estimate of probable losses inherent in our credit portfolio. This evaluation process is subject to numerous estimates and judgments. For additional information on this process, see “Critical
accounting estimates” in our 2016 Annual Report. To the extent actual results differ from forecasts or management’s judgment, the allowance for credit losses may be greater or less than future charge-offs.
Based on an evaluation of the allowance for credit losses as discussed in “Critical accounting estimates” and Note 1 of the Notes to Consolidated Financial Statements, both in our 20162017 Annual Report, we have allocated our allowance for credit losses as follows.
|
| | | | | | | |
| | Allocation of allowance | March 31, 2018 |
| Dec. 31, 2017 |
| March 31, 2017 |
|
| |
| | Commercial | 29 | % | 30 | % | 30 | % |
| | Commercial real estate | 29 |
| 29 |
| 27 |
|
| | Foreign | 14 |
| 13 |
| 13 |
|
| | Financial institutions | 9 |
| 9 |
| 8 |
|
| | Wealth management (a) | 9 |
| 8 |
| 9 |
|
| | Other residential mortgages | 7 |
| 8 |
| 9 |
|
| | Lease financing | 3 |
| 3 |
| 4 |
|
| | Total | 100 | % | 100 | % | 100 | % |
|
| | | | | | | | | |
| | Allocation of allowance | Sept. 30, 2017 |
| June 30, 2017 |
| Dec. 31, 2016 |
| Sept. 30, 2016 |
|
| |
| | Commercial | 31 | % | 30 | % | 29 | % | 33 | % |
| | Commercial real estate | 28 |
| 28 |
| 26 |
| 23 |
|
| | Foreign | 13 |
| 13 |
| 13 |
| 11 |
|
| | Financial institutions | 9 |
| 8 |
| 9 |
| 11 |
|
| | Wealth management (a) | 8 |
| 9 |
| 8 |
| 7 |
|
| | Other residential mortgages | 8 |
| 8 |
| 10 |
| 10 |
|
| | Lease financing | 3 |
| 4 |
| 5 |
| 5 |
|
| | Total | 100 | % | 100 | % | 100 | % | 100 | % |
| |
| (a) | Includes the allowance for wealth management mortgages. |
The allocation of the allowance for credit losses is inherently judgmental, and the entire allowance for credit losses is available to absorb credit losses regardless of the nature of the loss.losses.
The credit rating assigned to each credit is a significant variable in determining the allowance. If each credit were rated one grade better, the allowance would have decreased by $65$62 million, while if each credit were rated one grade worse, the allowance would have increased by $109$104 million. Similarly, if the loss given default were one rating worse, the
allowance would have increased by $41$40 million, while if the loss given default were one rating better, the allowance would have decreased by $29$28 million. For impaired credits, if the net carrying value of the
loans was 10% higher or lower, the allowance would have decreased or increased by less than $1 million, respectively.
Nonperforming assets
The following table shows the distribution ofTotal nonperforming assets.
|
| | | | | | | | | |
| Nonperforming assets | Sept. 30, 2017 |
| June 30, 2017 |
| Dec. 31, 2016 |
|
| (dollars in millions) |
| Nonperforming loans: | | | |
| Other residential mortgages | $ | 80 |
| $ | 84 |
| $ | 91 |
|
| Wealth management loans and mortgages | 8 |
| 10 |
| 8 |
|
| Financial institutions | 2 |
| 2 |
| — |
|
| Lease financings | — |
| — |
| 4 |
|
| Total nonperforming loans | 90 |
| 96 |
| 103 |
|
| Other assets owned | 4 |
| 4 |
| 4 |
|
| Total nonperforming assets | $ | 94 |
| $ | 100 |
| $ | 107 |
|
| Nonperforming assets ratio | 0.16 | % | 0.16 | % | 0.17 | % |
| Nonperforming assets ratio, excluding margin loans | 0.21 |
| 0.21 |
| 0.23 |
|
| Allowance for loan losses/nonperforming loans | 178.9 |
| 171.9 |
| 164.1 |
|
| Allowance for loan losses/nonperforming assets | 171.3 |
| 165.0 |
| 157.9 |
|
| Total allowance for credit losses/nonperforming loans | 294.4 |
| 281.3 |
| 272.8 |
|
| Total allowance for credit losses/nonperforming assets | 281.9 |
| 270.0 |
| 262.6 |
|
|
| | | | | | | | | |
| Nonperforming assets activity | Sept. 30, 2017 |
| June 30, 2017 |
| Dec. 31, 2016 |
|
| (in millions) |
| Balance at beginning of quarter | $ | 100 |
| $ | 107 |
| $ | 109 |
|
| Additions | 3 |
| 2 |
| 4 |
|
| Return to accrual status | (1 | ) | — |
| — |
|
| Charge-offs | — |
| — |
| — |
|
| Paydowns/sales | (8 | ) | (9 | ) | (6 | ) |
| Balance at end of quarter | $ | 94 |
| $ | 100 |
| $ | 107 |
|
Nonperforming assets decreased $13were $85 million at March 31, 2018 compared with $90 million at Dec. 31, 2016,2017. The decrease primarily reflectingreflects lower other residential mortgagesmortgage loans driven by paydowns and lease financings.
The nonperforming assets ratio was 0.16% at Sept. 30, 2017, 0.16% at June 30, 2017 and 0.17% at Dec. 31, 2016. The ratiosales. See Note 5 of the allowanceNotes to Consolidated Financial Statements for loan losses toadditional information on nonperforming loans was 178.9% at Sept. 30, 2017, 171.9% at June 30, 2017 and 164.1% at Dec. 31, 2016. The ratio of the total allowance for credit losses to nonperforming loans was 294.4% at Sept. 30, 2017, 281.3% at June 30, 2017 and 272.8% at Dec. 31, 2016.assets.
Deposits
Total deposits were $231.0$241.8 billion at Sept. 30, 2017, an increaseMarch 31, 2018, a decrease of 4%1% compared with $221.5$244.3 billion at
Dec. 31, 2016.2017. The increasedecrease in deposits primarily reflects higherlower noninterest-bearing deposits in U.S. offices and interest-bearing deposits in non-U.S. offices, and noninterest-bearing deposits in U.S. offices, partially offset by lowerhigher interest-bearing deposits in U.S. offices.
Noninterest-bearing deposits were $80.4$76.9 billion at Sept. 30, 2017March 31, 2018 compared with $78.3$82.7 billion at Dec. 31, 2016.2017. Interest-bearing deposits were $150.6$164.9 billion at Sept. 30, 2017March 31, 2018 compared with $143.2$161.6 billion at Dec. 31, 2016.2017.
Short-term borrowings
We fund ourselves primarily through deposits and, to a lesser extent, other short-term borrowings and long-term debt. Short-term borrowings consist of federal funds purchased and securities sold under repurchase agreements, payables to customers and broker-dealers, commercial paper and other borrowed funds. Certain other borrowings, for example, securities sold under repurchase agreements, require the delivery of securities as collateral.
See “Liquidity and dividends” for a discussion of long-term debt and liquidity metrics that we monitor.
Information related to federal funds purchased and securities sold under repurchase agreements is presented below.
|
| | | | | | | | | |
Federal funds purchased and securities sold under repurchase agreements |
| | Quarter ended |
| (dollars in millions) | March 31, 2018 |
| Dec. 31, 2017 |
| March 31, 2017 |
|
| Maximum month-end balance during the quarter | $ | 21,600 |
| $ | 20,098 |
| $ | 18,703 |
|
| Average daily balance | $ | 18,963 |
| $ | 20,211 |
| $ | 18,995 |
|
| Weighted-average rate during the quarter | 2.29 | % | 1.83 | % | 0.51 | % |
| Ending balance | $ | 21,600 |
| $ | 15,163 |
| $ | 11,149 |
|
| Weighted-average rate at period end | 2.24 | % | 2.33 | % | 0.53 | % |
|
| | | | | | | | | |
Federal funds purchased and securities sold under repurchase agreements |
| | Quarter ended |
| (dollars in millions) | Sept. 30, 2017 |
| June 30, 2017 |
| Sept. 30, 2016 |
|
| Maximum month-end balance during the quarter | $ | 21,850 |
| $ | 19,786 |
| $ | 11,184 |
|
| Average daily balance | $ | 21,403 |
| $ | 17,970 |
| $ | 9,585 |
|
| Weighted-average rate during the quarter | 1.30 | % | 0.84 | % | 0.24 | % |
| Ending balance | $ | 10,314 |
| $ | 10,934 |
| $ | 8,052 |
|
| Weighted-average rate at period end | 1.35 | % | 0.93 | % | 0.25 | % |
Fluctuations of federal funds purchased and securities sold under repurchase agreements between periods resulted fromreflect changes in overnight borrowing opportunities. The increase in the weighted-average rates, compared with Sept. 30, 2016,March 31, 2017, primarily reflects increases in the Fed Funds effective rate.
Information related to payables to customers and broker-dealers is presented below.
| | Payables to customers and broker-dealers | | | Quarter ended | Quarter ended |
| (dollars in millions) | Sept. 30, 2017 |
| June 30, 2017 |
| Sept. 30, 2016 |
| March 31, 2018 |
| Dec. 31, 2017 |
| March 31, 2017 |
|
| Maximum month-end balance during the quarter | $ | 21,563 |
| $ | 21,622 |
| $ | 21,162 |
| $ | 20,905 |
| $ | 21,380 |
| $ | 21,306 |
|
Average daily balance (a) | $ | 21,280 |
| $ | 21,078 |
| $ | 20,616 |
| $ | 20,389 |
| $ | 21,130 |
| $ | 20,840 |
|
Weighted-average rate during the quarter (a) | 0.42 | % | 0.30 | % | 0.07 | % | 0.75 | % | 0.49 | % | 0.16 | % |
| Ending balance | $ | 21,176 |
| $ | 21,622 |
| $ | 21,162 |
| $ | 20,172 |
| $ | 20,184 |
| $ | 21,306 |
|
| Weighted-average rate at period end | 0.43 | % | 0.34 | % | 0.07 | % | 0.85 | % | 0.56 | % | 0.18 | % |
| |
| (a) | The weighted-average rate is calculated based on, and is applied to, the average interest-bearing payables to customers and broker-dealers, which were $18,516$17,101 million in the thirdfirst quarter of 2017, $20,6092018, $17,868 million in the secondfourth quarter of 2017 and $16,873$18,961 million in the thirdfirst quarter of 20162017. |
Payables to customers and broker-dealers represent funds awaiting re-investment and short sale proceeds payable on demand. Payables to customers and broker-dealers are driven by customer trading activity levels and market volatility.
Information related to commercial paper is presented below.
| | | Commercial paper | Quarter ended | Quarter ended |
| (dollars in millions) | Sept. 30, 2017 |
| June 30, 2017 |
| Sept. 30, 2016 |
| March 31, 2018 |
| Dec. 31, 2017 |
| March 31, 2017 |
|
| Maximum month-end balance during the quarter | $ | 4,277 |
| $ | 2,193 |
| $ | 1,000 |
| $ | 3,936 |
| $ | 4,714 |
| $ | 2,642 |
|
| Average daily balance | $ | 2,736 |
| $ | 2,215 |
| $ | 1,173 |
| $ | 3,131 |
| $ | 3,391 |
| $ | 2,164 |
|
| Weighted-average rate during the quarter | 1.15 | % | 0.95 | % | 0.35 | % | 1.59 | % | 1.23 | % | 0.88 | % |
| Ending balance | $ | 2,501 |
| $ | 876 |
| $ | — |
| $ | 3,936 |
| $ | 3,075 |
| $ | 2,543 |
|
| Weighted-average rate at period end | 1.18 | % | 0.98 | % | — | % | 1.97 | % | 1.27 | % | 0.93 | % |
The Bank of New York Mellon, our largest bank subsidiary, issues commercial paper that matures within 397 days from date of issue and is not redeemable prior to maturity or subject to voluntary prepayment. The increase in commercial paper balances,at March 31, 2018, as compared with prior periods, primarily reflects management of overall liquidity. The increase in weighted-average rates, compared with prior periods, primarily reflects increases in the Fed Funds effective rate and the issuance of higher-yielding term commercial paper.
Information related to other borrowed funds is presented below.
| | | Other borrowed funds | Quarter ended | Quarter ended |
| (dollars in millions) | Sept. 30, 2017 |
| June 30, 2017 |
| Sept. 30, 2016 |
| March 31, 2018 |
| Dec. 31, 2017 |
| March 31, 2017 |
|
| Maximum month-end balance during the quarter | $ | 3,353 |
| $ | 2,379 |
| $ | 993 |
| $ | 2,227 |
| $ | 3,955 |
| $ | 1,173 |
|
| Average daily balance | $ | 2,197 |
| $ | 1,193 |
| $ | 874 |
| $ | 2,119 |
| $ | 3,421 |
| $ | 822 |
|
| Weighted-average rate during the quarter | 1.38 | % | 1.24 | % | 0.76 | % | 1.67 | % | 1.46 | % | 0.98 | % |
| Ending balance | $ | 3,353 |
| $ | 1,338 |
| $ | 993 |
| $ | 1,550 |
| $ | 3,028 |
| $ | 1,022 |
|
| Weighted-average rate at period end | 1.56 | % | 1.69 | % | 0.75 | % | 2.03 | % | 1.48 | % | 1.30 | % |
Other borrowed funds primarily include borrowings from the Federal Home Loan Bank (“FHLB”), overdrafts of sub-custodian account balances in our Investment Services businesses, capital lease obligations and borrowings under lines of credit by our Pershing subsidiaries. Overdrafts typically relate to timing differences for settlements. The increasedecrease in other borrowed funds balances compared with both prior periodsDec. 31, 2017 primarily reflects lower borrowings from the FHLB. The increase in other borrowed funds compared with Sept. 30, 2016 alsoMarch 31, 2017 primarily reflects borrowings from the FHLB and an increase in capital lease obligations
as a result of converting an operating lease to a capital lease.
Liquidity and dividends
BNY Mellon defines liquidity as the ability of the Parent and its subsidiaries to access funding or convert assets to cash quickly and efficiently, or to rolloverroll over or issue new debt, especially during periods of market stress, at a reasonable cost and in order to meet its short-term (up to one year) obligations. Funding liquidity risk is the risk that BNY Mellon cannot meet its cash and collateral obligations at a reasonable cost for both expected and unexpected cash flow and collateral needs without adversely affecting daily operations or our financial condition. Funding liquidity risk can arise from funding mismatches, market constraints from the inability to convert assets to cash, the inability to hold or raise cash, low overnight deposits, deposit run-off or contingent liquidity events.
We also manage liquidity risks on an intra-dayintraday basis. Intraday liquidity risk is the risk that BNY Mellon cannot access funds during the business day to make payments or settle immediate obligations, usually in real time. Intraday liquidity risk can arise from timing mismatches, market constraints from an inability to convert assets to cash, an inability to raise cash intraday, low overnight deposits and/or adverse stress events.
Changes in economic conditions or exposure to credit, market, operational, legal and reputational risks also can affect BNY Mellon’s liquidity risk profile and are considered in our liquidity risk framework.
The Parent’s policy is to have access to sufficient unencumbered cash and cash equivalents at each quarter-end to cover forecasted debt redemptions, net interest payments and net tax payments for the following 18-month period, and to provide sufficient collateral to satisfy transactions subject to Section 23A of the Federal Reserve Act. As of Sept. 30, 2017,March 31, 2018, the Parent was in compliance with this policy. For additional information on our liquidity policy, see “Risk Management - Liquidity risk” in our 20162017 Annual Report. Our overall approach to liquidity management is further described in “Liquidity and dividends” in our 20162017 Annual Report.
We define available funds for internal liquidity management purposes as liquid funds (which include interest-bearing deposits with banks and federal funds sold and securities purchased under resale agreements), cash and due from banks, and interest-bearinginterest-
bearing deposits with the Federal Reserve and other central banks. The following table presents our total available funds, including liquid funds, at period end and on an average basis.
| | | Available and liquid funds | Sept. 30, 2017 |
| Dec. 31, 2016 |
| Average | March 31, 2018 |
| Dec. 31, 2017 |
| Average |
| (dollars in millions) | 3Q17 |
| 2Q17 |
| 3Q16 |
| |
| (in millions) | | March 31, 2018 |
| Dec. 31, 2017 |
| 1Q18 |
| 4Q17 |
| 1Q17 |
|
| Available funds: | | |
| Liquid funds: | | |
| Interest-bearing deposits with banks | $ | 15,256 |
| $ | 15,086 |
| $ | 15,899 |
| $ | 14,832 |
| $ | 14,066 |
| $ | 15,186 |
| $ | 11,979 |
| $ | 13,850 |
| $ | 14,068 |
| $ | 14,714 |
|
| Federal funds sold and securities purchased under resale agreements | 27,883 |
| 25,801 |
| 28,120 |
| 26,873 |
| 26,376 |
| 28,784 |
| 28,135 |
| 27,903 |
| 28,417 |
| 25,312 |
|
| Total liquid funds | 43,139 |
| 40,887 |
| 44,019 |
| 41,705 |
| 40,442 |
| 43,970 |
| 40,114 |
| 41,753 |
| 42,485 |
| 40,026 |
|
| Cash and due from banks | 5,557 |
| 4,822 |
| 4,961 |
| 4,972 |
| 4,189 |
| 4,636 |
| 5,382 |
| 5,047 |
| 5,124 |
| 5,097 |
|
| Interest-bearing deposits with the Federal Reserve and other central banks | 75,808 |
| 58,041 |
| 70,430 |
| 69,316 |
| 74,102 |
| 91,431 |
| 91,510 |
| 79,068 |
| 74,961 |
| 66,043 |
|
| Total available funds | $ | 124,504 |
| $ | 103,750 |
| $ | 119,410 |
| $ | 115,993 |
| $ | 118,733 |
| $ | 140,037 |
| $ | 137,006 |
| $ | 125,868 |
| $ | 122,570 |
| $ | 111,166 |
|
| Total available funds as a percentage of total assets | 35 | % | 31 | % | 35 | % | 34 | % | 34 | % | 37 | % | 37 | % | 35 | % | 35 | % | 33 | % |
We had $43$44.0 billion of liquid funds at Sept. 30, 2017March 31, 2018 and $41$40.1 billionatDec. 31, 2016.2017. Of the $43$44.0 billion in liquid funds held at Sept. 30, 2017, $15March 31, 2018, $15.2 billion was placed in interest-bearing deposits with large, highly rated global financial institutions with a weighted-average life to maturity of approximately nine21 days. Of the $15$15.2 billion, $3$2.9 billion was placed with banks in the Eurozone.
Total available funds were $125$140.0 billion at Sept. 30, 2017,March 31, 2018, compared with $104$137.0 billion at Dec. 31, 2016.
2017. The increase was primarily due to an increase in interest-bearing deposits with the Federal Reserve and other central banks.
On an average basis for the nine months ended Sept. 30, 2017 and the nine months ended Sept. 30, 2016,Average non-core sources of funds, such as money market rate accounts, federal funds purchased and securities sold under repurchase agreements, trading liabilities, commercial paper and other borrowings, were $31.9$34.1 billion for the three months ended March 31, 2018 and $25.9$30.4 billion respectively.for the three months ended March 31, 2017. The increase
primarily reflects an increaseincreases in securities sold under repurchase agreements.other borrowed funds, commercial paper and money market rate accounts.
Average foreign deposits, primarily from our European-based Investment Services business, were $94.1$104.1 billion for the ninethree months ended Sept. 30, 2017,March 31, 2018, compared with $105.6$90.4 billion for the ninethree months ended Sept. 30, 2016.March 31, 2017. Domestic savings, interest-bearing demand and time deposits averaged $40.0$43.3 billion for the ninethree months ended Sept. 30, 2017March 31, 2018 and $47.8$41.9 billion for the ninethree months ended Sept. 30, 2016.March 31, 2017. The decreaseincrease primarily reflects an increase in demand deposits, partially offset by a decrease in time deposits, partially offset by an increase in demand deposits.
Average payables to customers and broker-dealers were $19.4$17.1 billion for the ninethree months ended Sept. 30, 2017March 31, 2018 and $16.9$19.0 billion for the ninethree months ended Sept. 30, 2016.March 31, 2017. Payables to customers and broker-dealers are driven by customer trading activity and market volatility.
Long-term debt averaged $27.1$28.4 billion for the ninethree months ended Sept. 30, 2017March 31, 2018 and $22.8$25.9 billion for the ninethree months ended Sept. 30, 2016,March 31, 2017, with the increase reflecting issuances of long-term debt.
Average noninterest-bearing deposits decreased to $72.5$71.0 billion for the ninethree months ended Sept. 30, 2017March 31, 2018 from $82.9$73.6 billion for the ninethree months ended Sept. 30, 2016,March 31, 2017, reflecting a decrease in client deposits.
A significant reduction in our Investment Services business would reduce our access to deposits. See
“Asset/ “Asset/liability management” for additional factors that could impact our deposit balances.
Sources of liquidity
In the second quarter of 2017, we entered into a support agreement with certain key subsidiaries to facilitate the provision of capital and liquidity resources in the event of material financial distress or failure. Pursuant to the support agreement, the Parent transferred its intercompany loans and most of its cash to our intermediate holding company (“IHC”), and will continue to transfer cash and other liquid financial assets to the IHC, subject to certain amounts retained by the Parent to meet its near-term cash needs. In connection with the initial transfer, the IHC issued unsecured subordinated funding notes to the Parent. The IHC has also provided the Parent with a committed line of credit that allows the Parent to draw funds necessary to service near-term obligations. The Parent’s and the IHC’s obligations under the support agreement are secured.
The Parent’s three major sources of liquidity are access to the debt and equity markets, dividends from its subsidiaries, and cash on hand and cash otherwise made available in business-as-usual circumstances to the Parent through a committed credit facility with our IHC.intermediate holding company (“IHC”).
The Parent had cash of $416 million$1.4 billion at Sept. 30, 2017,March 31, 2018, compared with $8.7 billion$451 million at Dec. 31, 2016, a decrease2017, an increase of $8.3 billion,$977 million, primarily reflecting the transfer of cash to the IHC pursuant to the support agreement.
issuance of long-term debt and dividends from subsidiaries, partially offset by long-term debt maturities and common stock repurchases.
Our ability to access the capital markets on favorable terms, or at all, is partially dependent on our credit ratings, which are as follows:
|
| | | | | | | |
Credit ratings at Sept. 30, 2017March 31, 2018 | | | | | | | |
| | Moody’s | | S&P | | Fitch | | DBRS |
| Parent: | | | | | | | |
| Long-term senior debt | A1 | | A | | AA- | | AA (low) |
| Subordinated debt | A2 | | A- | | A+ | | A (high) |
| Preferred stock | Baa1 | | BBB | | BBB | | A (low) |
| Outlook - Parent: | Stable | | Stable | | Stable | | Stable |
| |
| The Bank of New York Mellon: |
| Long-term senior debt | Aa2 | | AA- | | AA | | AA |
| Subordinated debt | Aa3 | | A | | A+ | | NR |
| Long-term deposits | Aa1 | | AA- | | AA+ | | AA |
| Short-term deposits | P1 | | A-1+ | | F1+ | | R-1 (high) |
| Commercial paper | P1 | | A-1+ | | F1+ | | R-1 (high) |
| | | | | | | | |
| BNY Mellon, N.A.: | | | | | | | |
| Long-term senior debt | Aa2 | | AA- | | AA | (a) | AA |
| Long-term deposits | Aa1 | | AA- | | AA+ | | AA |
| Short-term deposits | P1 | | A-1+ | | F1+ | | R-1 (high) |
| | | | | | | | |
| Outlook - Banks: | Stable | | Stable | | Stable | | Stable |
| |
| (a) | Represents senior debt issuer default rating. |
NR - Not rated.
Long-term debt totaled $28.4$27.9 billion at Sept. 30, 2017March 31, 2018 and $24.5$28.0 billion at Dec. 31, 2016.2017. The increasebalance reflects issuances of $4.75$1.75 billion, partially offset by the maturitymaturities of $500 million$1.4 billion and a decrease in the redemptionfair value of trust preferred securities.hedged long-term debt. The Parent has $250 million$2.25 billion of long-term debt that will mature in the remainder of 2017.2018.
In August 2017,April 2018, we issued $750 million of fixed rate senior subordinated notes maturing in 20292023 at an annual interest rate of 3.30%3.50% and $500 million of fixed rate senior notes maturing in 2028 at an annual interest rate of 3.85%.
The Bank of New York Mellon, our largest bank subsidiary, issues commercial paper that matures within 397 days from date of issue and is not redeemable prior to maturity or subject to voluntary prepayment. The average commercial paper borrowings were $2.7$3.1 billion infor the third quarter of 2017three months ended March 31, 2018 and $1.2$2.2 billion infor the third quarter of 2016.three months ended March 31, 2017. Commercial paper outstanding was $2.5$3.9 billion at Sept. 30, 2017. There was no commercial paper outstandingMarch 31, 2018 and $3.1 billion at Dec. 31, 2016.2017.
Subsequent to Sept. 30, 2017,March 31, 2018, our U.S. bank subsidiaries could declare dividends to the Parent of approximately $6.2$4.9 billion, without the need for a regulatory waiver. In addition, at Sept. 30, 2017,March 31, 2018, non-bank subsidiaries of the Parent had liquid assets of approximately $1.6$1.2 billion. Restrictions on our ability to obtain funds from our subsidiaries are
discussed in more detail in “Supervision and Regulation - Capital Planning and Stress Testing - Payment of Dividends, Stock Repurchases and Other Capital Distributions” and in Note 17 of the Notes to Consolidated Financial Statements in our 20162017 Annual Report.
Pershing LLC has uncommitted lines of credit in place for liquidity purposes which are guaranteed by the Parent. Pershing LLC has eight separate uncommitted lines of credit amounting to $1.5 billion in aggregate. There were no borrowings under these lines in the thirdfirst quarter of 2017.2018. Pershing Limited, an indirect UK-based subsidiary of BNY Mellon, has two separate uncommitted lines of credit amounting to $250 million in aggregate. Average borrowings under these lines were $6$2 million, in aggregate, in the thirdfirst quarter of 2017.2018.
The double leverage ratio is the ratio of our equity investment in subsidiaries divided by our consolidated parent company equity, which includes our noncumulative perpetual preferred stock. In short, the double leverage ratio measures the extent to which equity in subsidiaries is financed by Parent company debt. As the double leverage ratio increases, this can reflect greater demands on a company’s cash flows in order to service interest payments and debt maturities. BNY Mellon’s double leverage ratio is managed in a range considering the
high level of unencumbered available liquid assets held in its principal subsidiaries (such as central bank deposits and government securities), the Company’s cash generating fee-based business model, with feesfee revenue representing approximately 80%79% of total revenue in the first quarter of 2018, and the dividend capacity of our banking subsidiaries. Our double leverage ratio was 123.2%121.1% at Sept. 30, 2017March 31, 2018 and 119.1%122.5% at Dec. 31, 2016,2017, and within the range targeted by management.
Uses of funds
The Parent’s major uses of funds are payment of dividends, repurchases of common stock, principal and interest payments on its borrowings, acquisitions and additional investments in its subsidiaries.
In August 2017, aFebruary 2018, our quarterly cash dividend was paid to common shareholders ofwas $0.24 per common share. Our common stock dividend payout ratio was 23%22% for the first ninethree months of 2017.2018. The Federal Reserve’s instructions for the 2017 CCAR provided2018 Comprehensive Capital Analysis and Review (“CCAR”) provide that, for large bank holding companies (“BHCs”) like us, dividend payout ratios exceeding 30% of after-tax net income wouldwill receive particularly close scrutiny.
In the third quarterfirst three months of 2017,2018, we repurchased 1211 million common shares at an average price of $52.74$56.23 per common share for a total cost of $650$644 million.
Liquidity coverage ratio
U.S. regulators have established an LCR that requires certain banking organizations, including BNY Mellon, to maintain a minimum amount of unencumbered high qualityhigh-quality liquid assets (“HQLA”) sufficient to withstand the net cash outflow under a hypothetical standardized acute liquidity stress scenario for a 30-day time horizon.
The following table presents the consolidated HQLA at Sept. 30, 2017,March 31, 2018, and the average HQLA and average LCR for the thirdfirst quarter of 2017.2018.
| | | Consolidated HQLA and LCR | Sept. 30, 2017 |
| March 31, 2018 |
|
| (dollars in billions) |
Securities (a) | $ | 105 |
| $ | 107 |
|
Cash (b) | 70 |
| 86 |
|
Total consolidated HQLA (c) | $ | 175 |
| $ | 193 |
|
| | | |
Total consolidated HQLA - average (c) | $ | 162 |
| $ | 177 |
|
| Average LCR | 119 | % | 116 | % |
| |
| (a) | Primarily includes U.S. Treasury, U.S. agency, sovereign securities, securities of U.S. government-sponsored enterprises, sovereign securities, U.S. Treasury, U.S. agency and investment-grade corporate debt and publicly traded common equity.debt. |
| |
| (b) | Primarily includes cash on deposit with central banks. |
| |
| (c) | Consolidated HQLA presented before adjustments. After haircuts and the impact of trapped liquidity, consolidated HQLA totaled $137$154 billion at Sept. 30, 2017March 31, 2018 and averaged $126$141 billion for the thirdfirst quarter of 2017.2018. |
The U.S. LCR rule became fully phased-in on Jan. 1, 2017 and requires BNY Mellon and each of our affected domestic bank subsidiaries to meet an LCR of at least 100%. The LCR for BNY Mellon and each of our domestic bank subsidiaries waswere compliant with the U.S. LCR requirements forthroughout the third quarterfirst three months of 2017. For additional information on the LCR, see “Supervision and Regulation - Liquidity Standards - Basel III and U.S. Rules and Proposals” in our 2016 Annual Report.2018.
We also perform liquidity stress tests (“LSTs”) to evaluate whether the Company maintains sufficient liquidity resources under multiple stress scenarios. Stress testsLSTs are based on scenarios that measure liquidity risks under unlikely but plausible conditions. We perform these tests under various time horizons ranging from one day to one year in a base case, as well as supplemental tests to determine whether the Company’s liquidity is sufficient for severe market events and firm-specific events. Under our scenario testing program,Our LST framework includes a test known as the results of the tests indicate that the Company has sufficient liquidity.
As part of our resolution planning, we monitor, among other measures, our Resolution Liquidity Adequacy and Positioning (“RLAP”). The RLAP methodologies aretest is designed to ensure that the liquidity needs of certain key subsidiaries in a stress environment can be met by available resources held at the entity or at the Parent or IHC, as applicable. Under our scenario testing program, the results of the tests indicate that the Company has sufficient liquidity.
Statement of cash flows
The following summarizes the activity reflected on the statement of cash flows. While this information may be helpful to highlight certain macro trends and business strategies, the cash flow analysis may not be as relevant when analyzing changes in our net
earnings and net assets. We believe that in addition to the traditional cash flow analysis, the discussion related to liquidity and dividends and asset/liability management herein may provide more useful context in evaluating our liquidity position and related activity.
Net cash provided byused for operating activities was $3.4$852 million in the three months ended March 31, 2018, compared with $1.2 billion in the ninethree months ended Sept. 30, 2017, compared with $1.6 billion in the nine months ended Sept. 30, 2016.March 31, 2017. In both the first ninethree months of 2018 and first three months of 2017, cash flows providedused by operations werewas principally the result of earnings. In the first nine months of 2016, cash flows provided by operations were principally the result of earnings and changes in trading activities, partially offset by earnings. In the first three months of 2017, cash flows used for operations also resulted from changes in accruals.
Net cash used for investing activities was $14.0$1.4 billion in the ninethree months ended Sept. 30, 2017,March 31, 2018, compared
with $2.8 billion in the three months ended March 31, 2017. In the first three months of 2018, net cash providedused for investing activity primarily reflects changes in interest-bearing deposits with banks, partially offset by investing activitieschanges in interest-bearing deposits with the
of $21.1 billionFederal Reserve and other central banks and net changes in the nine months ended Sept. 30, 2016.securities. In the first ninethree months of 2017, net cash used for investing activities primarily reflects changes in interest-bearing deposits with the Federal Reserve and other central banks, was a significant use of funds. In the first nine months of 2016, changes in interest-bearing deposits with the Federal Reserve and other central banks was a significant source of funds, partially offset by changes in federal funds sold and securities purchased under resale agreements.loans.
Net cash provided by financing activities was $11.2$971 million in the three months ended March 31, 2018, compared with $4.0 billion in the ninethree months ended Sept. 30, 2017, compared with cash used for financing activities of $24.2 billion in the nine months ended Sept. 30, 2016.March 31, 2017. In the first ninethree months of 2017, the proceeds from the issuance of long-term debt, changes in deposits and increases in commercial paper and other borrowed funds were significant sources of funds, partially offset2018, net cash provided by common stock repurchased. In the first nine months of 2016, changes in deposits,financing activities primarily reflects changes in federal funds purchased and securities sold under repurchase agreements,agreement and net proceeds from the issuance of long-term debt, partially offset by changes in deposits, changes in other borrowed funds, repayment of long-term debt and treasurycommon stock repurchases were significant usesrepurchases. In the first three months of funds, partially offset2017, net cash provided by financing activities primarily reflects changes in commercial paper and net proceeds from the issuance of long-term debt.debt, partially offset by changes in deposits and common stock repurchases.
Capital
| | Capital data (dollar amounts in millions except per share amounts; common shares in thousands) | Sept. 30, 2017 |
| June 30, 2017 |
| Dec. 31, 2016 |
| |
Capital data (dollars in millions except per share amounts; common shares in thousands) | | March 31, 2018 |
| Dec. 31, 2017 |
|
| Average common equity to average assets | 10.6 | % | 10.5 | % | 10.2 | % | 10.5 | % | 10.5 | % |
| | | |
| At period end: | | |
| BNY Mellon shareholders’ equity to total assets ratio | 11.4 | % | 11.3 | % | 11.6 | % | 11.2 | % | 11.1 | % |
| BNY Mellon common shareholders’ equity to total assets ratio | 10.4 | % | 10.3 | % | 10.6 | % | 10.2 | % | 10.1 | % |
| Total BNY Mellon shareholders’ equity | $ | 40,523 |
| $ | 39,974 |
| $ | 38,811 |
| $ | 41,728 |
| $ | 41,251 |
|
Total BNY Mellon common shareholders’ equity | $ | 36,981 |
| $ | 36,432 |
| $ | 35,269 |
| $ | 38,186 |
| $ | 37,709 |
|
BNY Mellon tangible common shareholders’ equity – Non-GAAP (a) | $ | 18,630 |
| $ | 18,106 |
| $ | 16,957 |
| $ | 18,978 |
| $ | 18,486 |
|
Book value per common share (a) | $ | 36.11 |
| $ | 35.26 |
| $ | 33.67 |
| $ | 37.78 |
| $ | 37.21 |
|
Tangible book value per common share – Non-GAAP (a) | $ | 18.19 |
| $ | 17.53 |
| $ | 16.19 |
| $ | 18.78 |
| $ | 18.24 |
|
| Closing stock price per common share | $ | 53.02 |
| $ | 51.02 |
| $ | 47.38 |
| $ | 51.53 |
| $ | 53.86 |
|
| Market capitalization | $ | 54,294 |
| $ | 52,712 |
| $ | 49,630 |
| $ | 52,080 |
| $ | 54,584 |
|
| Common shares outstanding | 1,024,022 |
| 1,033,156 |
| 1,047,488 |
| 1,010,676 |
| 1,013,442 |
|
| | | |
| Cash dividends per common share | $ | 0.24 |
| $ | 0.19 |
| $ | 0.19 |
| $ | 0.24 |
| $ | 0.24 |
|
| Common dividend payout ratio | 26 | % | 22 | % | 25 | % | 22 | % | 22 | % |
| Common dividend yield | 1.8 | % | 1.5 | % | 1.6 | % | |
Common dividend yield (annualized) | | 1.9 | % | 1.8 | % |
| |
| (a) | See “Supplemental information – Explanation of GAAP and Non-GAAP financial measures” beginning on page 4940 for a reconciliation of GAAP to Non-GAAP. |
The Bank of New York Mellon Corporation total shareholders’ equity increased to $40.5$41.7 billion at Sept. 30, 2017March 31, 2018 from $38.8$41.3 billion at Dec. 31, 2016.2017. The increase primarily reflects earnings, the impact of incentives and employee-related activity and foreign
currency translation adjustments, $638 million resulting from stock awards, the exercise of stock options and stock issued for employee benefit plans, and the unrealized gain in our investment securities portfolio, partially offset by share repurchases and dividends.
The unrealized gain,loss, net of tax, on our available-for-sale investment securities portfolio recordedincluded in accumulated other comprehensive income was $226 $12
million at Sept. 30, 2017,March 31, 2018, compared with $45a net unrealized gain of $184 million at Dec. 31, 2016.2017. The increasedecrease in the unrealized gain, net of tax, was primarily driven by a decreasean increase in long-term interest rates.
Our 2017 capital plan, submitted in connection with our CCAR, includedIn the authorization to repurchase an average of $650 million of common stock each quarter starting in the thirdfirst quarter of 2017 and continuing through the second quarter of 2018. In the third quarter of 2017,2018, we repurchased 1211 million common shares at an average price of $52.74$56.23 per common share for a total cost of $650 million.
Also included in$644 million under the 2017 capital plan was a 26% increase in the quarterly cash dividend to $0.24 per common share. The first payment of the increased quarterly cash dividend was made on Aug. 11, 2017.current program.
Capital adequacy
Regulators establish certain levels of capital for bank holding companiesBHCs and banks, including BNY Mellon and our bank subsidiaries, in accordance with established quantitative measurements. For the Parent to maintain its status as a financial holding company, our U.S. bank subsidiaries and BNY Mellon must, among other things, qualify as “well capitalized.”
As of Sept. 30, 2017March 31, 2018 and Dec. 31, 2016, 2017, BNY Mellon and our U.S. bank subsidiaries were “well capitalized.”
Failure to satisfy regulatory standards, including “well capitalized” status or capital adequacy rules more generally, could result in limitations on our activities and adversely affect our financial condition.
See the discussion of these matters in “Supervision and Regulation - Regulated Entities of BNY Mellon and Ancillary Regulatory Requirements” and “Risk Factors - Operational Risk - Failure to satisfy regulatory standards, including “well capitalized” and “well managed” status or capital adequacy and liquidity rules more generally, could result in limitations on our activities and adversely affect our business and financial condition” in our 20162017 Annual Report.
The “well capitalized” and other capital categories (where applicable), as established by applicable regulations for bank holding companies and depository institutions, have been established by those regulations solely for purposes of implementing their respective requirements (for example, eligibility for financial holding company status in the case of bank holding companies and prompt corrective action measures in the case of depository institutions). A bank holding company’s or depository institution’s qualification for a capital category may not constitute an accurate representation of the entity’s overall financial condition or prospects.
The U.S. banking agencies’ capital rules are based on the framework adopted by the Basel Committee on Banking Supervision (“BCBS”), as amended from time to time. For additional information on these capital requirements, see “Supervision and Regulation” in our 20162017 Annual Report. BNY Mellon is subject to the U.S. capital rules, which are being gradually phased-in over a multi-year period through Jan. 1, 2019. The phase-in requirements for capital were completed on Jan. 1, 2018.
Our estimated CET1 and SLR ratios on a fully phased-in basis are based on our current interpretation of the U.S. capital rules. Our risk-based capital adequacy is determined using the higher of risk-weighted assets (“RWAs”) determined using the Advanced Approach and Standardized Approach.
The transitionaltable below presents our consolidated and largest bank subsidiary regulatory capital ratios for Sept. 30, 2017 and June 30, 2017 included in the following table were negatively impacted by the additional phase-in requirements that became effective on Jan. 1, 2017.ratios.
|
| | | | | | | | | | | | | | |
| Consolidated and largest bank subsidiary regulatory capital ratios | Sept. 30, 2017 | | | | |
| Well capitalized |
| | Minimum
required |
| | Capital ratios |
| | June 30, 2017 |
| | Dec. 31, 2016 |
|
| | (a) | | |
Consolidated regulatory capital ratios: (b) | | | | | | | | | |
| Standardized Approach: | | | | | | | | | |
| CET1 ratio | N/A |
| (c) | 6.5 | % | | 12.3 | % | | 12.0 | % | | 12.3 | % |
| Tier 1 capital ratio | 6 | % | | 8 |
| | 14.6 |
| | 14.3 |
| | 14.5 |
|
| Total (Tier 1 plus Tier 2) capital ratio | 10 |
| | 10 |
| | 15.6 |
| | 14.8 |
| | 15.2 |
|
| Advanced Approach: | | | | | | | | | |
| CET1 ratio | N/A |
| (c) | 6.5 | % | | 11.1 | % | | 10.8 | % | | 10.6 | % |
| Tier 1 capital ratio | 6 | % | | 8 |
| | 13.2 |
| | 12.9 |
| | 12.6 |
|
| Total (Tier 1 plus Tier 2) capital ratio | 10 |
| | 10 |
| | 14.0 |
| | 13.2 |
| | 13.0 |
|
Leverage capital ratio (b) | N/A |
| (c) | 4 |
| | 6.8 |
| | 6.7 |
| | 6.6 |
|
SLR (d) | 5 |
| (c)(e) | 3 |
| | 6.3 |
| | 6.2 |
| | 6.0 |
|
| | | | | | | | | | |
Selected regulatory capital ratios – fully phased-in – Non-GAAP: (c) | | | | | | | | | |
| Estimated CET1 ratio: | | | | | | | | | |
| Standardized Approach | 8.5 | % | (e) | 6.5 | % | | 11.9 | % | | 11.5 | % | | 11.3 | % |
| Advanced Approach | 8.5 |
| (e) | 6.5 |
| | 10.7 |
| | 10.4 |
| | 9.7 |
|
| Estimated SLR | 5 |
| (e) | 3 |
| | 6.1 |
| | 6.0 |
| | 5.6 |
|
| | | | | | | | | | |
The Bank of New York Mellon regulatory capital ratios: (b) | | | | | | | | | |
| Advanced Approach: | | | | | | | | | |
| CET1 ratio | 6.5 | % | | 5.75 | % | | 14.8 | % | | 14.1 | % | | 13.6 | % |
| Tier 1 capital ratio | 8 |
| | 7.25 |
| | 15.1 |
| | 14.4 |
| | 13.9 |
|
| Total (Tier 1 plus Tier 2) capital ratio | 10 |
| | 9.25 |
| | 15.5 |
| | 14.8 |
| | 14.2 |
|
| Leverage capital ratio | 5 |
| | 4 |
| | 7.8 |
| | 7.6 |
| | 7.2 |
|
SLR (d) | 6 |
| | 3 |
| | 7.1 |
| | 6.9 |
| | 6.5 |
|
| | | | | | | | | | |
Selected regulatory capital ratios – fully phased-in – Non-GAAP: | | | | | | | | | |
| Estimated SLR | 6 | % | | 3 | % | | 6.8 | % | | 6.7 | % | | 6.1 | % |
|
| | | | | | | | | | | | | | |
| Consolidated and largest bank subsidiary regulatory capital ratios | March 31, 2018 | | Dec. 31, 2017 | |
| Well capitalized |
| | Minimum
required |
| | Capital ratios |
| | Fully phased-in |
| Transitional
Approach |
| (b) |
| | (a) | |
Consolidated regulatory capital ratios: (c)(d) | | | | | | | | | |
| Advanced Approach: | | | | | | | | | |
| CET1 ratio | N/A |
| (e) | 7.5 | % | | 10.7 | % | | 10.3 | % | 10.7 | % | |
| Tier 1 capital ratio | 6 | % | | 9 |
| | 12.7 |
| | 12.3 |
| 12.7 |
| |
| Total capital ratio | 10 |
| | 11 |
| | 13.4 |
| | 13.0 |
| 13.4 |
| |
| Standardized Approach: | | | | | | | | | |
| CET1 ratio | N/A |
| (e) | 7.5 | % | | 11.7 | % | | 11.5 | % | 11.9 | % | |
| Tier 1 capital ratio | 6 | % | | 9 |
| | 14.0 |
| | 13.7 |
| 14.2 |
| |
| Total capital ratio | 10 |
| | 11 |
| | 14.9 |
| | 14.7 |
| 15.1 |
| |
| Tier 1 leverage ratio | N/A |
| (e) | 4 |
| | 6.5 |
| | 6.4 |
| 6.6 |
| |
SLR (f) | N/A |
| (e) | 5 |
| | 5.9 |
| | 5.9 |
| 6.1 |
| |
| | | | | | | | | | |
The Bank of New York Mellon regulatory capital ratios: (c) | | | | | | | | | |
| Advanced Approach: | | | | | | | | | |
| CET1 ratio | 6.5 | % | | 6.375 | % | | 14.6 | % | | N/A |
| 14.1 | % | |
| Tier 1 capital ratio | 8 |
| | 7.875 |
| | 14.8 |
| | N/A |
| 14.4 |
| |
| Total capital ratio | 10 |
| | 9.875 |
| | 15.2 |
| | N/A |
| 14.7 |
| |
| Tier 1 leverage ratio | 5 |
| | 4 |
| | 7.6 |
| | N/A |
| 7.6 |
| |
SLR (f) | 6 |
| | 3 |
| | 6.8 |
| | 6.7 | % | 6.9 |
| |
| |
| (a) | Minimum requirements for Sept. 30, 2017March 31, 2018 include Basel III minimum thresholds plus currently applicable buffers. |
| |
| (b) | Reflects transitional adjustments to CET1, Tier 1 capital, Tier 2 capital required in 2017 under the U.S. capital rules. |
| |
| (c) | For our CET1, Tier 1 capital and Total capital ratios, our effective capital ratios under U.S. capital rules are the lower of the ratios as calculated under the Standardized and Advanced Approaches. The Tier 1 leverage capital ratio is based on Tier 1 capital as phased-in and quarterly average total assets. |
| |
(c) | The Federal Reserve’s regulations do not establish well capitalized thresholds for these measures for bank holding companies.
|
| |
| (d) | The SLR does not become a binding measure until the first quarter of 2018. The SLR is based on Tier 1 capital, as phased-in, and average quarterly assets and certain off-balance sheet exposures.
|
| |
(e) | Fully phased-in Basel III minimum with expected buffers. See page 4135 for the capital ratios with the phase-in of the capital conservation buffer and the U.S. G-SIB surcharge, as well as the introduction of the SLR buffer.
|
| |
| (e) | The Federal Reserve’s regulations do not establish well capitalized thresholds for these measures for BHCs. |
| |
| (f) | SLR became a binding measure on Jan. 1, 2018. The SLR is based on Tier 1 capital and total leverage exposure, which includes certain off-balance sheet exposures. |
Our CET1 ratio determined under the Advanced Approach was 11.1%10.7% at Sept. 30, 2017March 31, 2018 and 10.6%10.7%, on a transitional basis, at Dec. 31, 2016.2017. The increase primarily reflects CET1 generation, partiallyratio was unchanged reflecting capital generated through earnings and additional paid-in capital resulting from stock awards, offset by the additionalfinal phase-in requirements under the U.S. capital rules that became effective Jan. 1, 2017.
Our estimated CET1 ratio (Non-GAAP) calculated underand the Advanced Approach on a fully phased-in basis was 10.7% at Sept. 30, 2017capital deployed through common stock repurchased and 9.7% at Dec. 31, 2016. The increase primarily reflects CET1 generation. Our estimated CET1 ratio (Non-GAAP) calculated under the Standardized Approach on a
fully phased-in basis was 11.9% at Sept. 30, 2017 and 11.3% at Dec. 31, 2016.dividends paid.
The estimated fully phased-in SLR (Non-GAAP) ofwas 5.9% at March 31, 2018 and 6.1% at Sept. 30, 2017 and 5.6%, on a transitional basis, at Dec. 31, 2016 was based on our interpretation of the U.S. capital rules, as supplemented by the Federal Reserve’s final rules on the SLR. BNY Mellon will be subject to an enhanced SLR, which will require a buffer in excess of 2% over the minimum SLR of 3%. The insured depository institution subsidiaries of the U.S. global systemically important banks (“G-SIBs”), including
those of BNY Mellon, must maintain a 6% SLR to be considered “well capitalized.”2017.
For additional information on the U.S. capital rules, see “Supervision and Regulation - Capital Requirements - Generally” in our 20162017 Annual Report.Report and “Recent regulatory developments” in this report.
The Advanced Approach capital ratios are significantly impacted by RWAs for operational risk.
Our operational loss risk model is informed by external losses, including fines and penalties levied against institutions in the financial services industry, particularly those that relate to businesses in which we operate, and as a result external losses have impacted and could in the future impact the amount of capital that we are required to hold.
Management views the estimated fully phased-in CET1 and other risk-based capital ratios and SLR as key measures in monitoring BNY Mellon’s capital position and progress against future regulatory capital standards. Additionally, the presentation of the estimated fully phased-in CET1 and other risk-based capital ratios and SLR are intended to allow investors to compare these ratios with estimates presented by other companies.
Our capital ratios are necessarily subject to, among other things, anticipated compliance with all necessary enhancements to model calibration, approval by regulators of certain models used as part of RWA calculations, other refinements, further implementation guidance from regulators, market practices and standards and any changes BNY Mellon may make to its businesses. As a consequence of these factors, our capital ratios may materially change, and may be volatile over time and from period to period.
The following table presents our capital components and RWAs at March 31, 2018 and Dec. 31, 2017.
|
| | | | | | | | | | |
| Capital components and risk-weighted assets | | Dec. 31, 2017 | |
| | March 31, 2018 |
| Fully phased-in |
| Transitional
Approach |
| (a) |
| (in millions) |
| CET1: | | | | |
| Common shareholders’ equity | $ | 38,186 |
| $ | 37,709 |
| $ | 37,859 |
| |
| Adjustments for: | | | | |
Goodwill and intangible assets (b) | (19,208 | ) | (19,223 | ) | (18,684 | ) | |
| Net pension fund assets | (218 | ) | (211 | ) | (169 | ) | |
| Equity method investments | (376 | ) | (387 | ) | (372 | ) | |
| Deferred tax assets | (42 | ) | (41 | ) | (33 | ) | |
| Other | (8 | ) | (9 | ) | (8 | ) | |
| Total CET1 | 18,334 |
| 17,838 |
| 18,593 |
| |
| Other Tier 1 capital: | | | | |
| Preferred stock | 3,542 |
| 3,542 |
| 3,542 |
| |
| Deferred tax assets | — |
| — |
| (8 | ) | |
| Net pension fund assets | — |
| — |
| (42 | ) | |
| Other | (41 | ) | (41 | ) | (41 | ) | |
| Total Tier 1 capital | $ | 21,835 |
| $ | 21,339 |
| $ | 22,044 |
| |
| Tier 2 capital: | | | | |
| Subordinated debt | $ | 1,250 |
| $ | 1,250 |
| $ | 1,250 |
| |
| Allowance for credit losses | 256 |
| 261 |
| 261 |
| |
| Other | (1 | ) | (12 | ) | (12 | ) | |
| Total Tier 2 capital – Standardized Approach | 1,505 |
| 1,499 |
| 1,499 |
| |
| Excess of expected credit losses | 37 |
| 31 |
| 31 |
| |
| Less: Allowance for credit losses | 256 |
| 261 |
| 261 |
| |
| Total Tier 2 capital – Advanced Approach | $ | 1,286 |
| $ | 1,269 |
| $ | 1,269 |
| |
| Total capital: | | | | |
| Standardized Approach | $ | 23,340 |
| $ | 22,838 |
| $ | 23,543 |
| |
| Advanced Approach | $ | 23,121 |
| $ | 22,608 |
| $ | 23,313 |
| |
| | | | | |
| Risk-weighted assets: | | | | |
| Standardized Approach | $ | 156,472 |
| $ | 155,324 |
| $ | 155,621 |
| |
| Advanced Approach: | | | | |
| Credit Risk | $ | 99,138 |
| $ | 101,366 |
| $ | 101,681 |
| |
| Market Risk | 3,884 |
| 3,657 |
| 3,657 |
| |
| Operational Risk | 68,888 |
| 68,688 |
| 68,688 |
| |
| Total Advanced Approach | $ | 171,910 |
| $ | 173,711 |
| $ | 174,026 |
| |
| | | | | |
| Average assets for Tier 1 leverage ratio | $ | 338,291 |
| $ | 330,894 |
| $ | 331,600 |
| |
| Total leverage exposure for SLR | $ | 367,818 |
| $ | 360,543 |
| $ | 361,249 |
| |
| |
| (a) | Reflects transitional adjustments to CET1, Tier 1 capital, Tier 2 capital required in 2017 under the U.S. capital rules. |
| |
| (b) | Reduced by deferred tax liabilities associated with intangible assets and tax deductible goodwill. |
The table below presents the factors that impacted the CET1 capital on a fully phased-in basis.
|
| | | |
| CET1 generation | March 31, 2018 (a) |
|
| (in millions) |
| CET1 – Beginning of period (fully phased-in) | $ | 17,838 |
|
| Net income applicable to common shareholders of The Bank of New York Mellon Corporation | 1,135 |
|
| Goodwill and intangible assets, net of related deferred tax liabilities | 15 |
|
| Gross CET1 generated | 1,150 |
|
| Capital deployed: | |
| Common stock dividends | (246 | ) |
| Common stock repurchased | (644 | ) |
| Total capital deployed | (890 | ) |
| Other comprehensive income: | |
| Foreign currency translation | 238 |
|
| Unrealized loss on assets available-for-sale | (237 | ) |
| Defined benefit plans | 17 |
|
| Unrealized gain on cash flow hedges | (2 | ) |
| Other | (2 | ) |
| Total other comprehensive income | 14 |
|
Additional paid-in capital (b) | 246 |
|
| Other additions (deductions): | |
| Net pension fund assets | (7 | ) |
| Deferred tax assets | (1 | ) |
| Embedded goodwill | 11 |
|
| Other | (27 | ) |
| Total other deductions | (24 | ) |
| Net CET1 generated | 496 |
|
| CET1 – End of period | $ | 18,334 |
|
| |
| (b) | Primarily related to stock awards, the exercise of stock options and stock issued for employee benefit plans. |
Minimum capital ratios and capital buffers
The U.S. capital rules include a series of buffers and surcharges over required minimums that apply to bank holding companies,BHCs, including BNY Mellon, which are being phased-in over time. Banking organizations with a risk-based ratio or SLR above the minimum required level, but with a risk-based ratio or SLR below the minimum level with buffers
will face constraints on dividends, equity repurchases and discretionary executive compensation based on the amount of the shortfall. Different regulatory capital minimums, buffers and surcharges apply to our banking subsidiaries.
The U.S. capital rules introduced a capital conservation buffer and countercyclical capital buffer that add to the minimum regulatory capital ratios. The capital conservation buffer–1.25% for 2017 and 2.5% when fully phased-in on Jan. 1, 2019–is designed to absorb losses during periods of economic stress and applies to all banking organizations. During periods of excessive growth, the capital conservation buffer may be expanded through the imposition of a countercyclical capital buffer that may be as high as an additional 2.5%. The countercyclical capital buffer, when applicable, applies only to Advanced Approach banking organizations. The countercyclical capital buffer is currently set to zero with respect to U.S. exposures, but it could increase if the banking agencies determine that systemic vulnerabilities are meaningfully above normal.
BNY Mellon is subject to an additional G-SIB surcharge, which is implemented as an extension of the capital conservation buffer and must be satisfied with CET1 capital. For 2017, the G-SIB surcharge applicable to BNY Mellon is 0.75%, and, when fully phased-in on Jan. 1, 2019, as calculated, applying metrics as currently applicable to BNY Mellon, would be 1.5%.
The following table presents the principal minimum capital ratio requirements with buffers and surcharges, as phased-in, applicable to the Parent and The Bank of New York Mellon. This table does not include the imposition of a countercyclical capital buffer. The U.S. capital rules also provide for transitional arrangements for qualifying instruments, deductions and adjustments, which are not reflected in this table. Buffers and surcharges are not applicable to the Tier 1 leverage capital ratio. These buffers, other than the SLR buffer, and surcharge began to phase-in on Jan. 1, 2016 and will be fully implemented on Jan. 1, 2019.
| | | Capital ratio requirements | Well capitalized |
| | Minimum ratios |
| | Minimum ratios with buffers, as phased-in (a) | Capital ratio requirements | | | Minimum ratios with buffers, as phased-in (a) | |
| | | Well capitalized |
| Minimum ratios |
| |
| | Well capitalized |
| | Minimum ratios |
| | 2017 |
| | 2018 |
| | 2019 |
| | | 2018 |
| | 2019 |
| |
| Capital conservation buffer (CET1) | | 1.25 | % | | 1.875 | % | | 2.5 | % | | | | 1.875 | % | | 2.5 | % | |
U.S. G-SIB surcharge (CET1) (b)(c) | | | | | 0.75 | % | | 1.125 | % | | 1.5 | % | | | | 1.125 | % | | 1.5 | % | |
| | | | | | | | | | | | | | | | | |
| Consolidated: | | | | | | | | | | | | | | | | |
| CET1 ratio | N/A |
| | 4.5 | % | | 6.5 | % | | 7.5 | % | | 8.5 | % | | N/A |
| 4.5 | % | | 7.5 | % | | 8.5 | % | |
| Tier 1 capital ratio | 6.0 | % | | 6.0 | % | | 8.0 | % | | 9.0 | % | | 10.0 | % | | 6.0 | % | 6.0 | % | | 9.0 | % | | 10.0 | % | |
| Total capital ratio | 10.0 | % | | 8.0 | % | | 10.0 | % | | 11.0 | % | | 12.0 | % | | 10.0 | % | 8.0 | % | | 11.0 | % | | 12.0 | % | |
| | | | | | | | | | | | | | | | | |
| Enhanced SLR buffer (Tier 1 capital) | N/A |
| | | | N/A |
| | 2.0 | % | | 2.0 | % | | N/A |
| | | 2.0 | % | | 2.0 | % | |
| SLR | N/A |
| | 3.0 | % | | N/A |
| | 5.0 | % | | 5.0 | % | | N/A |
| 3.0 | % | | 5.0 | % | | 5.0 | % | |
| | | | | | | | | | | | | | | | | |
Bank subsidiaries: (c) | | | | | | | | | | | | | | | | |
| CET1 ratio | 6.5 | % | | 4.5 | % | | 5.75 | % | | 6.375 | % | | 7.0 | % | | 6.5 | % | 4.5 | % | | 6.375 | % | | 7.0 | % | |
| Tier 1 capital ratio | 8.0 | % | | 6.0 | % | | 7.25 | % | | 7.875 | % | | 8.5 | % | | 8.0 | % | 6.0 | % | | 7.875 | % | | 8.5 | % | |
| Total capital ratio | 10.0 | % | | 8.0 | % | | 9.25 | % | | 9.875 | % | | 10.5 | % | | 10.0 | % | 8.0 | % | | 9.875 | % | | 10.5 | % | |
| | | | | | | | | | | | | | | | | |
| SLR | 6.0 | % | | 3.0 | % | | N/A |
| | 6.0 | % | (d) | 6.0 | % | (d) | 6.0 | % | 3.0 | % | | 6.0 | % | (d) | 6.0 | % | (d) |
| |
| (a) | Countercyclical capital buffer currently set to 0%. |
| |
| (b) | The fully phased-in U.S. G-SIB surcharge of 1.5% applicable to BNY Mellon is subject to change. |
| |
| (c) | The U.S. G-SIB surcharge is not applicable to the regulatory capital ratios of the bank subsidiaries. |
| |
| (d) | Well capitalized threshold. |
The table below presents the factors that impacted the transitional and fully phased-in CET1.
|
| | | | | | |
| Estimated CET1 generation | Quarter ended Sept. 30, 2017 |
| (in millions) | Transitional basis (a) |
| Fully phased-in - Non-GAAP (b) |
|
| CET1 – Beginning of period | $ | 18,371 |
| $ | 17,629 |
|
| Net income applicable to common shareholders of The Bank of New York Mellon Corporation | 983 |
| 983 |
|
| Goodwill and intangible assets, net of related deferred tax liabilities | (33 | ) | (26 | ) |
| Gross CET1 generated | 950 |
| 957 |
|
| Capital deployed: | | |
| Common stock dividends | (253 | ) | (253 | ) |
| Common stock repurchased | (650 | ) | (650 | ) |
| Total capital deployed | (903 | ) | (903 | ) |
| Other comprehensive income: | | |
| Foreign currency translation | 281 |
| 281 |
|
| Unrealized loss on assets available-for-sale | 13 |
| 16 |
|
| Defined benefit plans | 12 |
| 15 |
|
| Total other comprehensive income | 306 |
| 312 |
|
Additional paid-in capital (c) | 156 |
| 156 |
|
| Other additions (deductions): | | |
| Deferred tax assets | (1 | ) | (2 | ) |
| Embedded goodwill | (9 | ) | (8 | ) |
| Total other deductions | (10 | ) | (10 | ) |
| Net CET1 generated | 499 |
| 512 |
|
| CET1 – End of period | $ | 18,870 |
| $ | 18,141 |
|
| |
(a) | Reflects transitional adjustments to CET1 required under the U.S. capital rules. |
| |
(c) | Primarily related to stock awards, the exercise of stock options and stock issued for employee benefit plans. |
The following table presents the components of our transitional and fully phased-in CET1, Tier 1 and Tier 2 capital, the RWAs determined under both the Standardized and Advanced Approaches, the average assets used for leverage capital purposes and the total leverage exposure for estimated SLR purposes.
|
| | | | | | | | | | | | | | | | | | | | |
| Capital components and ratios | Sept. 30, 2017 | | June 30, 2017 | | Dec. 31, 2016 |
| (dollars in millions) | Transitional Approach (a) |
| Fully phased-in - Non-GAAP (b) |
| | Transitional
Approach (a) |
| Fully phased-in - Non-GAAP (b) |
| | Transitional
Approach (a) |
| Fully phased-in - Non-GAAP (b) |
|
| CET1: | | | | | | | | |
| Common shareholders’ equity | $ | 37,195 |
| $ | 36,981 |
| | $ | 36,652 |
| $ | 36,432 |
| | $ | 35,794 |
| $ | 35,269 |
|
| Goodwill and intangible assets | (17,876 | ) | (18,351 | ) | | (17,843 | ) | (18,325 | ) | | (17,314 | ) | (18,312 | ) |
| Net pension fund assets | (72 | ) | (90 | ) | | (72 | ) | (90 | ) | | (55 | ) | (90 | ) |
| Equity method investments | (334 | ) | (348 | ) | | (325 | ) | (340 | ) | | (313 | ) | (344 | ) |
| Deferred tax assets | (31 | ) | (39 | ) | | (30 | ) | (37 | ) | | (19 | ) | (32 | ) |
| Other | (12 | ) | (12 | ) | | (11 | ) | (11 | ) | | — |
| (1 | ) |
| Total CET1 | 18,870 |
| 18,141 |
|
| 18,371 |
| 17,629 |
| | 18,093 |
| 16,490 |
|
| Other Tier 1 capital: | | | | | | | | |
| Preferred stock | 3,542 |
| 3,542 |
| | 3,542 |
| 3,542 |
| | 3,542 |
| 3,542 |
|
| Deferred tax assets | (8 | ) | — |
| | (7 | ) | — |
| | (13 | ) | — |
|
| Net pension fund assets | (19 | ) | — |
| | (18 | ) | — |
| | (36 | ) | — |
|
| Other | (34 | ) | (34 | ) | | (24 | ) | (24 | ) | | (121 | ) | (121 | ) |
| Total Tier 1 capital | $ | 22,351 |
| $ | 21,649 |
|
| $ | 21,864 |
| $ | 21,147 |
| | $ | 21,465 |
| $ | 19,911 |
|
| Tier 2 capital: | | | | | | | | |
| Subordinated debt | $ | 1,300 |
| $ | 1,250 |
| | $ | 550 |
| $ | 550 |
| | $ | 550 |
| $ | 550 |
|
| Allowance for credit losses | 265 |
| 265 |
| | 270 |
| 270 |
| | 281 |
| 281 |
|
| Trust preferred securities | — |
| — |
| | — |
| — |
| | 148 |
| — |
|
| Other | (7 | ) | (7 | ) | | (7 | ) | (7 | ) | | (12 | ) | (11 | ) |
| Total Tier 2 capital - Standardized Approach | 1,558 |
| 1,508 |
|
| 813 |
| 813 |
| | 967 |
| 820 |
|
| Excess of expected credit losses | 49 |
| 49 |
| | 59 |
| 59 |
| | 50 |
| 50 |
|
| Less: Allowance for credit losses | 265 |
| 265 |
| | 270 |
| 270 |
| | 281 |
| 281 |
|
| Total Tier 2 capital - Advanced Approach | $ | 1,342 |
| $ | 1,292 |
|
| $ | 602 |
| $ | 602 |
| | $ | 736 |
| $ | 589 |
|
| Total capital: | | | | | | | | |
| Standardized Approach | $ | 23,909 |
| $ | 23,157 |
| | $ | 22,677 |
| $ | 21,960 |
| | $ | 22,432 |
| $ | 20,731 |
|
| Advanced Approach | $ | 23,693 |
| $ | 22,941 |
| | $ | 22,466 |
| $ | 21,749 |
| | $ | 22,201 |
| $ | 20,500 |
|
| | | | | | | | |
| Risk-weighted assets: | | | | | | | | |
| Standardized Approach | $ | 153,494 |
| $ | 152,995 |
| | $ | 153,179 |
| $ | 152,645 |
| | $ | 147,671 |
| $ | 146,475 |
|
| Advanced Approach: | | | | | | | | |
| Credit Risk | $ | 98,201 |
| $ | 97,672 |
| | $ | 99,030 |
| $ | 98,465 |
| | $ | 97,659 |
| $ | 96,391 |
|
| Market Risk | 2,996 |
| 2,996 |
| | 3,225 |
| 3,225 |
| | 2,836 |
| 2,836 |
|
| Operational Risk | 68,625 |
| 68,625 |
| | 67,788 |
| 67,788 |
| | 70,000 |
| 70,000 |
|
| Total Advanced Approach | $ | 169,822 |
| $ | 169,293 |
|
| $ | 170,043 |
| $ | 169,478 |
| | $ | 170,495 |
| $ | 169,227 |
|
| | | | | | | | | |
| Standardized Approach: | | | | | | | | |
| CET1 ratio | 12.3 | % | 11.9 | % | | 12.0 | % | 11.5 | % | | 12.3 | % | 11.3 | % |
| Tier 1 capital ratio | 14.6 |
| 14.2 |
| | 14.3 |
| 13.9 |
| | 14.5 |
| 13.6 |
|
| Total (Tier 1 plus Tier 2) capital ratio | 15.6 |
| 15.1 |
| | 14.8 |
| 14.4 |
| | 15.2 |
| 14.2 |
|
| Advanced Approach: | | | | | | | | |
| CET1 ratio | 11.1 | % | 10.7 | % | | 10.8 | % | 10.4 | % | | 10.6 | % | 9.7 | % |
| Tier 1 capital ratio | 13.2 |
| 12.8 |
| | 12.9 |
| 12.5 |
| | 12.6 |
| 11.8 |
|
| Total (Tier 1 plus Tier 2) capital ratio | 14.0 |
| 13.6 |
| | 13.2 |
| 12.8 |
| | 13.0 |
| 12.1 |
|
| | | | | | | | | |
| Average assets for leverage capital purposes | $ | 327,555 |
| | | $ | 324,423 |
| | | $ | 326,809 |
| |
| Total leverage exposure for SLR purposes | | $ | 355,960 |
| | | $ | 352,448 |
| | | $ | 355,083 |
|
| |
(a) | Reflects transitional adjustments to CET1, Tier 1 capital and Tier 2 capital required in 2017 and 2016 under the U.S. capital rules. |
The following table shows the impact on the consolidated capital ratios at Sept. 30, 2017March 31, 2018 of a $100 million increase or decrease in common equity, or a $1 billion increase or decrease in RWAs, quarterly average assets or total leverage exposure.
|
| | | | |
| Sensitivity of consolidated capital ratios at Sept. 30, 2017 |
| | Increase or decrease of |
| (in basis points) | $100 million in common equity | $1 billion in RWA, quarterly average assets or total leverage exposure |
| CET1: | | | | |
| Standardized Approach | 7 | bps | 8 | bps |
| Advanced Approach | 6 | | 7 | |
| | | | | |
| Tier 1 capital: | | | | |
| Standardized Approach | 7 | | 10 | |
| Advanced Approach | 6 | | 8 | |
| | | | | |
| Total capital: | | | | |
| Standardized Approach | 7 | | 10 | |
| Advanced Approach | 6 | | 8 | |
| | | | | |
| Leverage capital | 3 | | 2 | |
| | | | | |
| SLR | 3 | | 2 | |
| | | | | |
| Estimated CET1 ratio, fully phased-in – Non-GAAP: | | | | |
| Standardized Approach | 7 | | 8 | |
| Advanced Approach | 6 | | 6 | |
| | | | | |
| Estimated SLR, fully phased-in – Non-GAAP | 3 | | 2 | |
|
| | | | |
| Sensitivity of consolidated capital ratios at March 31, 2018 |
| | Increase or decrease of |
| (in basis points) | $100 million in common equity | $1 billion in RWA, quarterly average assets or total leverage exposure |
| CET1: | | | | |
| Standardized Approach | 6 | bps | 8 | bps |
| Advanced Approach | 6 | | 6 | |
| | | | | |
| Tier 1 capital: | | | | |
| Standardized Approach | 6 | | 9 | |
| Advanced Approach | 6 | | 7 | |
| | | | | |
| Total capital: | | | | |
| Standardized Approach | 6 | | 10 | |
| Advanced Approach | 6 | | 8 | |
| | | | | |
| Tier 1 leverage | 3 | | 2 | |
| | | | | |
| SLR | 3 | | 2 | |
Capital ratios vary depending on the size of the balance sheet at quarter-end and the levels and types of investments in assets. The balance sheet size fluctuates from quarter to quarter based on levels of customer and market activity. In general, when servicing clients are more actively trading securities, deposit balances and the balance sheet as a whole are higher. In addition, when markets experience significant volatility or stress, our balance sheet size may increase considerably as client deposit levels increase.
Supplementary Leverage Ratio
BNY Mellon has presented its consolidated and largest bank subsidiary’s estimated fully phased-in SLRs based on its interpretation of the U.S. capital rules, which are being gradually phased-in over a multi-year period and on the application of such rules to BNY Mellon’s businesses as currently conducted.
The following table presents the components of our SLR on both the transitional and fully phased-in basis for BNY Mellon and our largest bank subsidiary, The Bank of New York Mellon.
|
| | | | | | | | | | | | | | | | | | | | |
| SLR | Sept. 30, 2017 | | June 30, 2017 | | Dec. 31, 2016 |
| (dollars in millions) | Transitional basis |
| Fully phased-in - Non-GAAP (a) |
| | Transitional basis |
| Fully phased-in - Non-GAAP (a) |
| | Transitional basis |
| Fully phased-in - Non-GAAP (a) |
|
| Consolidated: | | | | | | | | |
| Total Tier 1 capital | $ | 22,351 |
| $ | 21,649 |
| | $ | 21,864 |
| $ | 21,147 |
| | $ | 21,465 |
| $ | 19,911 |
|
| | | | | | | | | |
| Total leverage exposure: | | | | | | | | |
| Quarterly average total assets | $ | 345,709 |
| $ | 345,709 |
| | $ | 342,515 |
| $ | 342,515 |
| | $ | 344,142 |
| $ | 344,142 |
|
| Less: Amounts deducted from Tier 1 capital | 18,154 |
| 18,856 |
| | 18,092 |
| 18,810 |
| | 17,333 |
| 18,887 |
|
| Total on-balance sheet assets, as adjusted | 327,555 |
| 326,853 |
|
| 324,423 |
| 323,705 |
| | 326,809 |
| 325,255 |
|
| Off-balance sheet exposures: | | | | | | | | |
| Potential future exposure for derivative contracts (plus certain other items) | 6,213 |
| 6,213 |
| | 6,014 |
| 6,014 |
| | 6,021 |
| 6,021 |
|
| Repo-style transaction exposures | 1,034 |
| 1,034 |
| | 631 |
| 631 |
| | 533 |
| 533 |
|
| Credit-equivalent amount of other off-balance sheet exposures (less SLR exclusions) | 21,860 |
| 21,860 |
| | 22,098 |
| 22,098 |
| | 23,274 |
| 23,274 |
|
| Total off-balance sheet exposures | 29,107 |
| 29,107 |
|
| 28,743 |
| 28,743 |
| | 29,828 |
| 29,828 |
|
| Total leverage exposure | $ | 356,662 |
| $ | 355,960 |
|
| $ | 353,166 |
| $ | 352,448 |
| | $ | 356,637 |
| $ | 355,083 |
|
| | | | | | | | | |
SLR - Consolidated (b) | 6.3 | % | 6.1 | % | | 6.2 | % | 6.0 | % | | 6.0 | % | 5.6 | % |
| | | | | | | | | |
| The Bank of New York Mellon, our largest bank subsidiary: | | | | | | | | |
| Tier 1 capital | $ | 20,718 |
| $ | 19,955 |
| | $ | 19,897 |
| $ | 19,125 |
| | $ | 19,011 |
| $ | 17,708 |
|
| Total leverage exposure | $ | 292,759 |
| $ | 292,421 |
| | $ | 286,983 |
| $ | 286,634 |
| | $ | 291,022 |
| $ | 290,230 |
|
| | | | | | | | | |
SLR - The Bank of New York Mellon (b) | 7.1 | % | 6.8 | % | | 6.9 | % | 6.7 | % | | 6.5 | % | 6.1 | % |
| |
(b) | The estimated fully phased-in SLR (Non-GAAP) is based on our interpretation of the U.S. capital rules. When the SLR is fully phased-in in 2018 as a required minimum ratio, we expect to maintain an SLR of over 5%. The minimum required SLR is 3% and there is a 2% buffer, in addition to the minimum, that is applicable to U.S. G-SIBs. The insured depository institution subsidiaries of the U.S. G-SIBs, including those of BNY Mellon, must maintain a 6% SLR to be considered “well-capitalized.” |
Trading activities and risk management
Our trading activities are focused on acting as a market-maker for our customers, facilitating customer trades and risk mitigating hedging in compliance with the Volcker Rule. The risk from market-making activities for customers is managed by our traders and limited in total exposure through a system of position limits, value-at-risk (“VaR”) methodology and other market sensitivity measures. VaR is the potential loss in value due to adverse market movements over a defined time horizon with a specified confidence level. The calculation of our VaR used by management and presented below assumes a one-day holding period, utilizes a 99% confidence level, and incorporates non-linear product characteristics. VaR
facilitates comparisons across portfolios of different risk characteristics. VaR also captures the
diversification of aggregated risk at the firm widefirm-wide level.
VaR represents a key risk management measure and it is important to note the inherent limitations to VaR, which include:
VaR does not estimate potential losses over longer time horizons where moves may be extreme;
VaR does not take account of potential variability of market liquidity; and
Previous moves in market risk factors may not produce accurate predictions of all future market moves.
See Note 1617 of the Notes to Consolidated Financial Statements for additional information on the VaR methodology.
In an effort to improve our enterprise level risk management capabilities, we have changed our VaR model from Monte Carlo simulation to historical simulation for both management and RWA calculations. This change was effective as of Jan. 1, 2017. In addition to this model enhancement, the impact of credit valuation adjustment (“CVA”) is now included.
The following tables indicate the calculated VaR amounts for the trading portfolio for the designated periods using the newly implemented historical simulation VaR model. The impact of changes in methodology is not material.
| | VaR (a) | 3Q17 | Sept. 30, 2017 |
| 1Q18 | March 31, 2018 |
|
| (in millions) | Average |
| Minimum |
| Maximum |
| Average |
| Minimum |
| Maximum |
|
| Interest rate | $ | 3.3 |
| $ | 2.8 |
| $ | 4.2 |
| $ | 2.7 |
| $ | 4.5 |
| $ | 4.0 |
| $ | 5.5 |
| $ | 4.1 |
|
| Foreign exchange | 3.7 |
| 3.1 |
| 5.6 |
| 4.8 |
| 5.3 |
| 4.0 |
| 8.3 |
| 4.0 |
|
| Equity | 0.9 |
| 0.8 |
| 1.1 |
| 0.9 |
| 0.8 |
| 0.6 |
| 1.2 |
| 0.9 |
|
| Credit | 1.0 |
| 0.6 |
| 1.4 |
| 1.0 |
| 1.4 |
| 0.9 |
| 2.6 |
| 1.0 |
|
| Diversification | (5.1 | ) | N/M |
| N/M |
| (5.3 | ) | (5.5 | ) | N/M |
| N/M |
| (4.3 | ) |
| Overall portfolio | 3.8 |
| 3.2 |
| 5.3 |
| 4.1 |
| 6.5 |
| 4.8 |
| 10.4 |
| 5.7 |
|
| | VaR (a) | 2Q17 | June 30, 2017 |
| 4Q17 | Dec. 31, 2017 |
|
| (in millions) | Average |
| Minimum |
| Maximum |
| Average |
| Minimum |
| Maximum |
|
| Interest rate | $ | 3.3 |
| $ | 2.8 |
| $ | 4.1 |
| $ | 4.0 |
| $ | 3.8 |
| $ | 2.4 |
| $ | 4.7 |
| $ | 4.4 |
|
| Foreign exchange | 4.3 |
| 3.4 |
| 5.8 |
| 4.6 |
| 4.6 |
| 3.6 |
| 8.6 |
| 8.6 |
|
| Equity | 0.2 |
| 0.1 |
| 1.1 |
| 1.1 |
| 0.8 |
| 0.7 |
| 0.9 |
| 0.8 |
|
| Credit | 1.1 |
| 0.5 |
| 1.4 |
| 0.8 |
| 1.2 |
| 0.9 |
| 1.6 |
| 1.3 |
|
| Diversification | (4.8 | ) | N/M |
| N/M |
| (5.8 | ) | (5.4 | ) | N/M |
| N/M |
| (5.2 | ) |
| Overall portfolio | 4.1 |
| 3.3 |
| 5.4 |
| 4.7 |
| 5.0 |
| 3.3 |
| 9.9 |
| 9.9 |
|
|
| | | | | | | | | |
VaR (a) | YTD17 |
| (in millions) | Average |
| Minimum |
| Maximum |
|
| Interest rate | $ | 3.5 |
| $ | 2.8 |
| $ | 4.9 |
|
| Foreign exchange | 3.9 |
| 2.6 |
| 5.8 |
|
| Equity | 0.4 |
| 0.1 |
| 1.1 |
|
| Credit | 1.1 |
| 0.5 |
| 1.7 |
|
| Diversification | (4.9 | ) | N/M |
| N/M |
|
| Overall portfolio | 4.0 |
| 3.2 |
| 5.4 |
|
|
| | | | | | | | | | | | |
VaR (a) | 1Q17 | March 31, 2017 |
|
| (in millions) | Average |
| Minimum |
| Maximum |
|
| Interest rate | $ | 3.9 |
| $ | 2.9 |
| $ | 4.9 |
| $ | 3.3 |
|
| Foreign exchange | 3.6 |
| 2.6 |
| 4.9 |
| 3.3 |
|
| Equity | 0.2 |
| 0.2 |
| 0.4 |
| 0.2 |
|
| Credit | 1.3 |
| 1.1 |
| 1.7 |
| 1.2 |
|
| Diversification | (4.9 | ) | N/M |
| N/M |
| (4.5 | ) |
| Overall portfolio | 4.1 |
| 3.3 |
| 5.0 |
| 3.5 |
|
| |
| (a) | Beginning Jan. 1, 2017, the VaR figures reflect the impact of the CVA and hedges as per the guidance included in ASC 820, Fair Value Measurement. VaR exposure does not include the impact of the Company’s consolidated investment management funds and seed capital investments.
|
N/M - Because the minimum and maximum may occur on different days for different risk components, it is not meaningful to compute a minimum and maximum portfolio diversification effect.
The following tables indicate the calculated VaR amounts for the trading portfolio for the designated periods as previously reported under the former Monte Carlo simulation VaR model.
|
| | | | | | | | | | | | |
VaR (a) | 3Q16 | Sept. 30, 2016 |
|
| (in millions) | Average |
| Minimum |
| Maximum |
|
| Interest rate | $ | 7.3 |
| $ | 5.4 |
| $ | 8.9 |
| $ | 7.9 |
|
| Foreign exchange | 4.2 |
| 3.2 |
| 7.5 |
| 3.7 |
|
| Equity | 0.6 |
| 0.5 |
| 0.8 |
| 0.6 |
|
| Credit | 0.3 |
| 0.3 |
| 0.4 |
| 0.4 |
|
| Diversification | (5.8 | ) | N/M |
| N/M |
| (5.7 | ) |
| Overall portfolio | 6.6 |
| 5.0 |
| 7.7 |
| 6.9 |
|
|
| | | | | | | | | |
VaR (a) | YTD16 |
| (in millions) | Average |
| Minimum |
| Maximum |
|
| Interest rate | $ | 6.3 |
| $ | 4.3 |
| $ | 8.9 |
|
| Foreign exchange | 2.8 |
| 1.2 |
| 11.1 |
|
| Equity | 0.6 |
| 0.4 |
| 0.8 |
|
| Credit | 0.3 |
| 0.2 |
| 0.4 |
|
| Diversification | (4.0 | ) | N/M |
| N/M |
|
| Overall portfolio | 6.0 |
| 4.3 |
| 7.7 |
|
| |
(a) | VaR figures do not reflect the impact of the CVA guidance in ASC 820, Fair Value Measurement. This is consistent with the regulatory treatment. VaR exposure does not include the impact of the Company’s consolidated investment management funds and seed capital investments. |
N/M - Because the minimum and maximum may occur on different days for different risk components, it is not meaningful to compute a minimum and maximum portfolio diversification effect.
The interest rate component of VaR represents instruments whose values predominantly vary with the level or volatility of interest rates. These instruments include, but are not limited to: sovereign debt, swaps, swaptions, forward rate agreements, exchange-traded futures and options, and other interest rate derivative products.
The foreign exchange component of VaR represents instruments whose values predominantly vary with the level or volatility of currency exchange rates or interest rates. These instruments include, but are not limited to: currency balances, spot and forward transactions, currency options, exchange-traded futures and options, and other currency derivative products.
The equity component of VaR consists of instruments that represent an ownership interest in the form of domestic and foreign common stock or other equity-linked instruments. These instruments include, but are not limited to: common stock, exchange-traded funds, preferred stock, listed equity options (puts and calls), over-the-counter (“OTC”) equity options, equity total return swaps, equity index futures and other equity derivative products.
The credit component of VaR represents instruments whose values predominantly vary with the credit worthiness of counterparties. These instruments include, but are not limited to, credit derivatives (credit default swaps and exchange-traded credit index instruments) and exposures from corporate credit spreads, and mortgage prepayments. Credit derivatives are used to hedge various credit exposures.
The diversification component of VaR is the risk reduction benefit that occurs when combining portfolios and offsetting positions, and from the correlated behavior of risk factor movements.
During the thirdfirst quarter of 2017,2018, interest rate risk generated 37% of average gross VaR, foreign exchange risk generated 42%44% of average gross VaR, equity risk accounted for 10%7% of average gross VaR and credit risk generated 11%12% of average gross VaR. During the thirdfirst quarter of 2017,2018, our daily trading loss did not exceedexceeded our calculated VaR amount of the overall portfolio.portfolio on one occasion.
The following table of total daily trading revenue or loss illustrates the number of trading days in which our trading revenue or loss fell within particular ranges during the past five quarters.
| | Distribution of trading revenue (loss) (a) | Distribution of trading revenue (loss) (a) | | | Distribution of trading revenue (loss) (a) | | |
| | Quarter ended | Quarter ended |
| (dollars in millions) | Sept. 30, 2017 |
| June 30,
2017 |
| March 31,
2017 |
| Dec. 31, 2016 |
| Sept. 30, 2016 |
| March 31,
2018 |
| Dec. 31, 2017 |
| Sept. 30, 2017 |
| June 30,
2017 |
| March 31, 2017 |
|
| Revenue range: | Number of days | Number of days |
| Less than $(2.5) | — |
| — |
| — |
| — |
| — |
| — |
| 2 |
| — |
| — |
| — |
|
| $(2.5) – $0 | 1 |
| 2 |
| 1 |
| 3 |
| 6 |
| 2 |
| 4 |
| 1 |
| 2 |
| 1 |
|
| $0 – $2.5 | 29 |
| 31 |
| 31 |
| 28 |
| 22 |
| 18 |
| 23 |
| 29 |
| 31 |
| 31 |
|
| $2.5 – $5.0 | 29 |
| 27 |
| 26 |
| 23 |
| 25 |
| 32 |
| 22 |
| 29 |
| 27 |
| 26 |
|
| More than $5.0 | 4 |
| 4 |
| 4 |
| 7 |
| 11 |
| 10 |
| 11 |
| 4 |
| 4 |
| 4 |
|
| |
| (a) | Trading revenue (loss) includes realized and unrealized gains and losses primarily related to spot and forward foreign exchange transactions, derivatives and securities trades for our customers and excludes any associated commissions, underwriting fees and net interest revenue. |
Trading assets include debt and equity instruments and derivative assets, primarily interest rate and foreign exchange contracts, not designated as hedging instruments. Trading assets were $4.7$8.6 billion at Sept. 30, 2017March 31, 2018 and $5.7$6.0 billion atDec. 31, 2016.2017. The increase was impacted by the reclassification of money market fund investments of approximately $1 billion primarily from available-for-sale securities.
Trading liabilities include debt and equity instruments and derivative liabilities, primarily interest rate and
foreign exchange contracts, not designated as hedging instruments. Trading liabilities were $3.3$3.4 billion at Sept. 30, 2017March 31, 2018 and $4.4$4.0 billion at Dec. 31, 2016.2017.
Under our fair value methodology for derivative contracts, an initial “risk-neutral” valuation is performed on each position assuming time-discountingtime-
discounting based on a AA credit curve. In addition, we consider credit risk in arriving at the fair value of our derivatives.derivatives.
We reflect external credit ratings as well as observable credit default swap spreads for both ourselves and our counterparties when measuring the fair value of our derivative positions. Accordingly, the valuation of our derivative positions is sensitive to the current changes in our own credit spreads, as well as those of our counterparties.
At Sept. 30, 2017,March 31, 2018, our OTC derivative assets, including those in hedging relationships, of $3.6$2.7 billion included a CVAcredit valuation adjustment (“CVA”) deduction of $30$23 million. Our OTC derivative liabilities, including those in hedging relationships, of $3.2$2.4 billion included a debit valuation adjustment (“DVA”) of $2 million related to our own credit spread. Net of hedges, the CVA decreased by $1$2 million and the DVA was unchanged in the thirdfirst quarter of 2017. The net impact of these adjustments2018, which increased foreign exchange and other trading revenue by $1 million in the third quarter of 2017.
In the second quarter of 2017, net of hedges, the CVA decreased by $3 million and the DVA decreased by $1 million.revenue. The net impact of these adjustments increased foreign exchange and other trading revenue bywas $2 million in the secondfourth quarter of 2017.
In the third2017 and first quarter of 2016, net of hedges, the CVA decreased by $8 million and the DVA decreased by $4 million. The net impact of these adjustments increased foreign exchange and other trading revenue by $4 million in the third quarter of 2016.2017.
The table below summarizes the risk ratings for our foreign exchange and interest rate derivative counterparty credit exposure during the past five quarters. This information indicates the degree of risk to which we are exposed. Significant changes in ratings classifications for our foreign exchange and other trading activity could result in increased risk for us.
46 BNY Mellon
| | Foreign exchange and other trading counterparty risk rating profile (a) | Foreign exchange and other trading counterparty risk rating profile (a) | Foreign exchange and other trading counterparty risk rating profile (a) | |
| | Quarter ended | Quarter ended |
| | Sept. 30, 2017 |
| June 30,
2017 |
| March 31,
2017 |
| Dec. 31, 2016 |
| Sept. 30, 2016 |
| March 31, 2018 |
| Dec. 31, 2017 |
| Sept. 30, 2017 |
| June 30,
2017 |
| March 31,
2017 |
|
| Rating: | | |
| AAA to AA- | 41 | % | 44 | % | 43 | % | 35 | % | 45 | % | 48 | % | 44 | % | 41 | % | 44 | % | 43 | % |
| A+ to A- | 30 |
| 27 |
| 36 |
| 39 |
| 32 |
| 27 |
| 31 |
| 30 |
| 27 |
| 36 |
|
| BBB+ to BBB- | 24 |
| 22 |
| 17 |
| 22 |
| 19 |
| 20 |
| 20 |
| 24 |
| 22 |
| 17 |
|
| Noninvestment grade (BB+ and lower) | 5 |
| 7 |
| 4 |
| 4 |
| 4 |
| |
| Non-investment grade (BB+ and lower) | | 5 |
| 5 |
| 5 |
| 7 |
| 4 |
|
| Total | 100 | % | 100 | % | 100 | % | 100 | % | 100 | % | 100 | % | 100 | % | 100 | % | 100 | % | 100 | % |
| |
| (a) | Represents credit rating agency equivalent of internal credit ratings. |
Asset/liability management
Our diversified business activities include processing securities, accepting deposits, investing in securities, lending, raising money as needed to fund assets and other transactions. The market risks from these activities areinclude interest rate risk and foreign exchange risk. Our primary market risk is exposure to movements in U.S. dollar interest rates and certain foreign currency interest rates. We actively manage interest rate sensitivity and use earnings simulation and discounted cash flow models to identify interest rate exposures.
An earnings simulation model is the primary tool used to assess changes in pre-tax net interest revenue. The model incorporates management’s assumptions regarding interest rates, balance changes on core deposits, market spreads, changes in the prepayment behavior of loans and securities and the impact of
derivative financial instruments used for interest rate risk management purposes. These assumptions have been developed through a combination of historical analysis and future expected pricing behavior and are inherently uncertain. As a result, the earnings simulation model cannot precisely estimate net interest revenue or the impact of higher or lower interest rates on net interest revenue. Actual results may differ materially from projected results due to timing, magnitude and frequency of interest rate changes, and changes in market conditions and management’s strategies, among other factors.
TheIn the table below, relies on certain critical assumptions regardingwe use the balance sheet and depositors’ behavior relatedearnings simulation model to interest rate fluctuations and the prepayment and extension risk in certain of our assets. Generally, there has been an inverse relationship between interest rates and client deposit levels. To the extent that actual behavior is different from that assumed in the models, there could be a change in interest rate sensitivity.
We evaluate the effect on earnings by runningrun various interest rate ramp scenarios from a baseline scenario. The interest rate ramp scenarios are reviewed to examine the impact of large interest rate movements. In each scenario, all currenciescurrencies’ interest rates are shifted higher or lower. The baseline scenario is based on our quarter-end balance sheet and the spot yield curve. The 100 basis point ramp scenario assumes rates increase 25 basis points above the yield curve in each of the next four quarters and the 200 basis point ramp scenario assumes a 50 basis point per quarter increase. Interest rate sensitivity is quantified by calculating the change in pre-tax net interest revenue between the scenarios over a 12-month measurement period.
The following table shows net interest revenue sensitivity for BNY Mellon.
| | Estimated changes in net interest revenue
(in millions) | Sept. 30, 2017 |
| June 30,
2017 |
| March 31,
2017 |
| Dec. 31, 2016 |
| Sept. 30, 2016 |
| March 31, 2018 |
| Dec. 31, 2017 |
| March 31,
2017 |
|
up 200 bps parallel rate ramp vs. baseline (a) | $ | (2 | ) | $ | (69 | ) | $ | (136 | ) | $ | 6 |
| $ | 62 |
| |
up 100 bps parallel rate ramp vs. baseline (a) | 112 |
| 58 |
| 87 |
| 145 |
| 147 |
| |
Up 200 bps parallel rate ramp vs. baseline (a) | | $ | 244 |
| $ | 280 |
| $ | 586 |
|
Up 100 bps parallel rate ramp vs. baseline (a) | | 119 |
| 148 |
| 354 |
|
Long-term up 50 bps, short-term unchanged (b) | 113 |
| 92 |
| 92 |
| 81 |
| 116 |
| 83 |
| 105 |
| 92 |
|
Long-term down 50 bps, short-term unchanged (b) | (129 | ) | (85 | ) | (104 | ) | (88 | ) | (128 | ) | (102 | ) | (122 | ) | (104 | ) |
| |
| (a) | In the parallel rate ramp, both short-term and long-term rates move in four equal quarterly increments. |
| |
| (b) | Long-term is equal to or greater than one year. |
bps - basis points.
The baseline scenario used forIn the calculations infirst quarter of 2018, we changed the estimated changes in net interest revenue table above as of Sept. 30, 2017, June 30, 2017, March 31, 2017 and Dec. 31, 2016 arebased on our quarter-end balance sheet and the spot yield curve. The baseline scenario used for Sept. 30, 2016 was based on implied forward yield curves. We revised the
methodology as of Dec. 31, 2016 as we believe using the spot yield curve for the baseline scenario provides a more accurate reflection of net interest revenue sensitivity givenmethodology to assume static deposit levels. Previously, our sensitivities included assumptions about deposit runoff which were difficult to predict. Prior period results have been restated to conform to the recent increase in short-term interest rates and the implied forward rates. Because interest rates and the implied forward yield curves were lower in prior periods, the impact of using a
spot yield curve versus an implied forward yield curve was not as significant. The 100 basis point ramp scenario assumes rates increase 25 basis points aboveTo illustrate the yield curve in each of the next four quarters and the 200 basis point ramp scenario assumes a 50 basis point per quarter increase.
Our net interest revenue sensitivity table above incorporates assumptions aboutto deposit runoff, we note that a $5 billion reduction of U.S. dollar denominated non-interest bearing deposits would reduce the impact of changes innet interest rates on depositor behavior based on historical experience. Given the current historically low interest rate environment and the potential change to the implementation of monetary policy, the impact of depositor behavior is highly uncertain. The lowerrevenue sensitivity results in the ramp up 100 basis point and 200 basis point scenario compared with the 100 basis point scenario is driven by the assumption of increased deposit runoff and forecasted changesscenarios in the deposit pricing.table above by approximately $120 million and approximately $150 million, respectively. The impact would be smaller if the runoff was assumed to be a mixture of interest-bearing and noninterest-bearing deposits.
Growth or contraction of deposits could also be affected by the following factors:
Global economic uncertainty;
Our ratings relative to other financial institutions’ ratings; and
Any of these events could change our assumptions about depositordepositors’ behavior and have a significant impact on our balance sheet and net interest revenue.
Off-balance sheet arrangements
Off-balance sheet arrangements discussed in this section are limited to guarantees, retained or contingent interests and obligations arising out of unconsolidated variable interest entities (“VIEs”). For BNY Mellon, these items include certain credit guarantees and a securitization.guarantees. Guarantees include lending-related guaranteesSBLCs issued as part of our corporate banking business and securities lending indemnifications issued as part of our Investment Services business. See Note 1718 of the Notes to Consolidated Financial Statements for a further discussion of our off-balance sheet arrangements.
Supplemental information - Explanation of GAAP and Non-GAAP financial measures
BNY Mellon has included in this Form 10-Q certain Non-GAAP financial measures based on estimated fully phased-in CET1 and other risk-based capital ratios, the estimated fully phased-in SLR anda tangible basis, as a supplement to GAAP information. Tangible common shareholders’ equity. BNY Mellon believes that the CET1 and other risk-based capital ratios, on a fully phased-in basis, and the SLR, on a fully phased-in basis, are measures of capital strength that provide additional useful information to investors, supplementing the capital ratios which are, or were, required by regulatory authorities. The tangible common shareholders’ equity ratio, which excludes goodwill and intangible assets, net of deferred tax liabilities, includes changes in investment securities valuations which are reflected in total shareholders’ equity.liabilities. BNY Mellon believes that the return on tangible common equity measure is an additional useful measure for investors because it presents a measure of those assets that can generate income. BNY Mellon has provided a measure of tangible book value per common share, which it believes provides additional useful information as to the level of tangible assets in relation to shares of common stock outstanding.
BNY Mellon has presented revenue measures, which excludeThe presentation of the effectgrowth rates of noncontrolling interests related to consolidated investment management funds, and expense measures, which exclude amortization of intangible assets and M&I, litigation and restructuring charges. Operating margin, operating leverage and returnperformance fees on equity measures, whicha constant
exclude some or allcurrency basis permits investors to assess the significance of these items, as well aschanges in foreign currency exchange rates. Growth rates on a constant currency basis were determined by applying the recovery relatedcurrent period foreign currency exchange rates to Sentinel, are also presented. Operating margin measures may also exclude the provision for credit losses and distribution and servicing expense.prior period revenue. BNY Mellon believes that these measures are useful to investors because they permit a focus on period-to-period comparisons, which relate to the ability of BNY Mellon to enhance revenues and limit expenses in circumstances where such matters are within BNY Mellon’s control. M&I expenses primarily relate to acquisitions and generally continue for approximately three years after the transaction. Litigation charges represent accruals for loss contingencies that are both probable and reasonably estimable, but exclude standard business-related legal fees. Restructuring charges relate to our streamlining actions and Operational Excellence Initiatives. Excluding the charges mentioned above permits investors to view expenses on a basis consistent with how management views the business.
Thethis presentation, of income from consolidated investment management funds, net of net income attributable to noncontrolling interests related to the consolidation of certain investment management funds, permits investors to view revenue on a basis consistent with how management views the business. BNY Mellon believes that these presentations, as a supplement to GAAP information, givegives investors a clearer picture of the related revenue results of its primary businesses.without the variability caused by fluctuations in foreign currency exchange rates.
EachBNY Mellon has presented the operating margin for the Investment Management business net of these measures as described abovedistribution and servicing expense that is used by managementpassed to monitor financialthird parties who distribute or service our managed funds. BNY Mellon believes that this measure is useful when evaluating the business’s performance both on a company-wide and on a business-level basis.relative to industry competitors.
The following table presents the reconciliation of the pre-tax operating margin ratio.
|
| | | | | | | | | | | | | | | |
| Pre-tax operating margin | 3Q17 |
| 2Q17 |
| 3Q16 |
| YTD17 |
| YTD16 |
|
| (dollars in millions) |
| Income before income taxes – GAAP | $ | 1,368 |
| $ | 1,308 |
| $ | 1,317 |
| $ | 3,882 |
| $ | 3,573 |
|
| Less: Net income attributable to noncontrolling interests of consolidated investment management funds | 3 |
| 3 |
| 9 |
| 24 |
| 6 |
|
| Add: Amortization of intangible assets | 52 |
| 53 |
| 61 |
| 157 |
| 177 |
|
| M&I, litigation and restructuring charges | 6 |
| 12 |
| 18 |
| 26 |
| 42 |
|
| Recovery related to Sentinel | — |
| — |
| (13 | ) | — |
| (13 | ) |
Income before income taxes, as adjusted – Non-GAAP (a) | $ | 1,423 |
| $ | 1,370 |
| $ | 1,374 |
| $ | 4,041 |
| $ | 3,773 |
|
| | | | | | |
| Fee and other revenue – GAAP | $ | 3,167 |
| $ | 3,120 |
| $ | 3,150 |
| $ | 9,305 |
| $ | 9,119 |
|
| Income from consolidated investment management funds – GAAP | 10 |
| 10 |
| 17 |
| 53 |
| 21 |
|
| Net interest revenue – GAAP | 839 |
| 826 |
| 774 |
| 2,457 |
| 2,307 |
|
| Total revenue – GAAP | 4,016 |
| 3,956 |
| 3,941 |
| 11,815 |
| 11,447 |
|
| Less: Net income attributable to noncontrolling interests of consolidated investment management funds | 3 |
| 3 |
| 9 |
| 24 |
| 6 |
|
Total revenue, as adjusted – Non-GAAP (a) | $ | 4,013 |
| $ | 3,953 |
| $ | 3,932 |
| $ | 11,791 |
| $ | 11,441 |
|
| | | | | | |
Pre-tax operating margin – GAAP (b)(c) | 34 | % | 33 | % | 33 | % | 33 | % | 31 | % |
Adjusted pre-tax operating margin – Non-GAAP (a)(b)(c) | 35 | % | 35 | % | 35 | % | 34 | % | 33 | % |
| |
(a) | Non-GAAP information for all periods presented excludes the net income attributable to noncontrolling interests of consolidated investment management funds, amortization of intangible assets and M&I, litigation and restructuring charges. Non-GAAP information for the third quarter of 2016 and for the first nine months of 2016 also excludes a recovery of the previously impaired Sentinel loan. |
| |
(b) | Income before taxes divided by total revenue. |
| |
(c) | Our GAAP earnings include tax-advantaged investments such as low income housing, renewable energy, corporate/bank-owned life insurance and tax-exempt securities. The benefits of these investments are primarily reflected in tax expense. If reported on a tax-equivalent basis, these investments would increase revenue and income before taxes by $102 million for the third quarter of 2017, $106 million for the second quarter of 2017, $74 million for the third quarter of 2016, $309 million for the first nine months of 2017 and $225 million for the first nine months of 2016 and would increase our pre-tax operating margin by approximately 1.6% for the third quarter of 2017, 1.8% for the second quarter of 2017, 1.2% for the third quarter of 2016, 1.7% for the first nine months of 2017 and 1.3% for the first nine months of 2016.
|
The following table presents the reconciliation of operating leverage.
|
| | | | | | | | | | | | | |
| Operating leverage | 3Q17 |
| 2Q17 |
| 3Q16 |
| 3Q17 vs. |
| (dollars in millions) | 2Q17 |
| 3Q16 |
|
| Total revenue – GAAP | $ | 4,016 |
| $ | 3,956 |
| $ | 3,941 |
| 1.52 | % | 1.90 | % |
| Less: Net income attributable to noncontrolling interests of consolidated investment management funds | 3 |
| 3 |
| 9 |
| | |
| Total revenue, as adjusted – Non-GAAP | $ | 4,013 |
| $ | 3,953 |
| $ | 3,932 |
| 1.52 | % | 2.06 | % |
| | | | | | |
| Total noninterest expense – GAAP | $ | 2,654 |
| $ | 2,655 |
| $ | 2,643 |
| (0.04 | )% | 0.42 | % |
| Less: Amortization of intangible assets | 52 |
| 53 |
| 61 |
| | |
| M&I, litigation and restructuring charges | 6 |
| 12 |
| 18 |
| | |
| Total noninterest expense, as adjusted – Non-GAAP | $ | 2,596 |
| $ | 2,590 |
| $ | 2,564 |
| 0.23 | % | 1.25 | % |
| | | | | | |
Operating leverage – GAAP (a) | | | | 156 | bps | 148 | bps |
Adjusted operating leverage – Non-GAAP (a)(b) | | | | 129 | bps | 81 | bps |
| |
(a) | Operating leverage is the rate of increase (decrease) in total revenue less the rate of increase (decrease) in total noninterest expense. |
| |
(b) | Non-GAAP operating leverage for all periods presented excludes the net income attributable to noncontrolling interests of consolidated investment management funds, amortization of intangible assets and M&I, litigation and restructuring charges. |
bps - basis points.
The following table presents the reconciliation of the returns on common equity and tangible common equity.
|
| | | | | | | | | | | | | | | |
| Return on common equity and tangible common equity | 3Q17 |
| 2Q17 |
| 3Q16 |
| YTD17 |
| YTD16 |
|
| (dollars in millions) |
| Net income applicable to common shareholders of The Bank of New York Mellon Corporation – GAAP | $ | 983 |
| $ | 926 |
| $ | 974 |
| $ | 2,789 |
| $ | 2,603 |
|
| Add: Amortization of intangible assets | 52 |
| 53 |
| 61 |
| 157 |
| 177 |
|
| Less: Tax impact of amortization of intangible assets | 17 |
| 19 |
| 21 |
| 54 |
| 62 |
|
| Adjusted net income applicable to common shareholders of The Bank of New York Mellon Corporation excluding amortization of intangible assets – Non-GAAP | 1,018 |
| 960 |
| 1,014 |
| 2,892 |
| 2,718 |
|
| Add: M&I, litigation and restructuring charges | 6 |
| 12 |
| 18 |
| 26 |
| 42 |
|
| Recovery related to Sentinel | — |
| — |
| (13 | ) | — |
| (13 | ) |
| Less: Tax impact of M&I, litigation and restructuring charges | — |
| 3 |
| 5 |
| 5 |
| 13 |
|
| Tax impact of recovery related to Sentinel | — |
| — |
| (5 | ) | — |
| (5 | ) |
Adjusted net income applicable to common shareholders of The Bank of New York Mellon Corporation, as adjusted – Non-GAAP (a) | $ | 1,024 |
| $ | 969 |
| $ | 1,019 |
| $ | 2,913 |
| $ | 2,739 |
|
| | | | | | |
| Average common shareholders’ equity | $ | 36,780 |
| $ | 35,862 |
| $ | 35,767 |
| $ | 35,876 |
| $ | 35,616 |
|
| Less: Average goodwill | 17,497 |
| 17,408 |
| 17,463 |
| 17,415 |
| 17,549 |
|
| Average intangible assets | 3,487 |
| 3,532 |
| 3,711 |
| 3,532 |
| 3,770 |
|
Add: Deferred tax liability – tax deductible goodwill (b) | 1,561 |
| 1,542 |
| 1,477 |
| 1,561 |
| 1,477 |
|
Deferred tax liability – intangible assets (b) | 1,092 |
| 1,095 |
| 1,116 |
| 1,092 |
| 1,116 |
|
| Average tangible common shareholders’ equity – Non-GAAP | $ | 18,449 |
| $ | 17,559 |
| $ | 17,186 |
| $ | 17,582 |
| $ | 16,890 |
|
| | | | | | |
Return on common equity – GAAP (c) | 10.6 | % | 10.4 | % | 10.8 | % | 10.4 | % | 9.8 | % |
Adjusted return on common equity – Non-GAAP (a)(c) | 11.0 | % | 10.8 | % | 11.3 | % | 10.9 | % | 10.3 | % |
| | | | | | |
Return on tangible common equity – Non-GAAP (c) | 21.9 | % | 21.9 | % | 23.5 | % | 22.0 | % | 21.5 | % |
Adjusted return on tangible common equity – Non-GAAP (a)(c) | 22.0 | % | 22.1 | % | 23.6 | % | 22.1 | % | 21.7 | % |
| |
(a) | Non-GAAP information for all periods presented excludes the amortization of intangible assets and M&I, litigation and restructuring charges. Non-GAAP information for the third quarter of 2016 and for the first nine months of 2016 also excludes a recovery of the previously impaired Sentinel loan. |
| |
(b) | Deferred tax liabilities are based on fully phased-in Basel III capital rules. |
| |
(c) | Quarterly returns are annualized. |
The following table presents the reconciliation of book value and tangible book value per common share.
| | | Book value per common share | Sept. 30, 2017 |
| June 30,
2017 |
| Dec. 31, 2016 |
| Sept. 30, 2016 |
| |
| (dollars in millions, unless otherwise noted) | |
| Book value and tangible book value per common share reconciliation | | March 31, 2018 |
| Dec. 31, 2017 |
| March 31, 2017 |
|
| (dollars in millions except common shares) | |
| BNY Mellon shareholders’ equity at period end – GAAP | $ | 40,523 |
| $ | 39,974 |
| $ | 38,811 |
| $ | 39,695 |
| $ | 41,728 |
| $ | 41,251 |
| $ | 39,138 |
|
| Less: Preferred stock | 3,542 |
| 3,542 |
| 3,542 |
| 3,542 |
| 3,542 |
| 3,542 |
| 3,542 |
|
| BNY Mellon common shareholders’ equity at period end – GAAP | 36,981 |
| 36,432 |
| 35,269 |
| 36,153 |
| 38,186 |
| 37,709 |
| 35,596 |
|
| Less: Goodwill | 17,543 |
| 17,457 |
| 17,316 |
| 17,449 |
| 17,596 |
| 17,564 |
| 17,355 |
|
| Intangible assets | 3,461 |
| 3,506 |
| 3,598 |
| 3,671 |
| 3,370 |
| 3,411 |
| 3,549 |
|
Add: Deferred tax liability – tax deductible goodwill (a) | 1,561 |
| 1,542 |
| 1,497 |
| 1,477 |
| 1,042 |
| 1,034 |
| 1,518 |
|
Deferred tax liability – intangible assets (a) | 1,092 |
| 1,095 |
| 1,105 |
| 1,116 |
| 716 |
| 718 |
| 1,100 |
|
| BNY Mellon tangible common shareholders’ equity at period end – Non-GAAP | $ | 18,630 |
| $ | 18,106 |
| $ | 16,957 |
| $ | 17,626 |
| $ | 18,978 |
| $ | 18,486 |
| $ | 17,310 |
|
| | | |
Period-end common shares outstanding (in thousands) | 1,024,022 |
| 1,033,156 |
| 1,047,488 |
| 1,057,337 |
| 1,010,676 |
| 1,013,442 |
| 1,039,877 |
|
| | | |
| Book value per common share – GAAP | $ | 36.11 |
| $ | 35.26 |
| $ | 33.67 |
| $ | 34.19 |
| $ | 37.78 |
| $ | 37.21 |
| $ | 34.23 |
|
| Tangible book value per common share – Non-GAAP | $ | 18.19 |
| $ | 17.53 |
| $ | 16.19 |
| $ | 16.67 |
| $ | 18.78 |
| $ | 18.24 |
| $ | 16.65 |
|
| |
| (a) | Deferred tax liabilities, for the prior periods, are based on fully phased-in Basel IIIU.S. capital rules. |
The following table presents the reconciliation of the return on common equity and tangible common equity.
|
| | | | | | | | | |
| Return on common equity and tangible common equity reconciliation | | | |
| (dollars in millions) | 1Q18 |
| 4Q17 |
| 1Q17 |
|
| Net income applicable to common shareholders of The Bank of New York Mellon Corporation – GAAP | $ | 1,135 |
| $ | 1,126 |
| $ | 880 |
|
| Add: Amortization of intangible assets | 49 |
| 52 |
| 52 |
|
| Less: Tax impact of amortization of intangible assets | 12 |
| 18 |
| 18 |
|
| Adjusted net income applicable to common shareholders of The Bank of New York Mellon Corporation, excluding amortization of intangible assets – Non-GAAP | $ | 1,172 |
| $ | 1,160 |
| $ | 914 |
|
| | | | |
| Average common shareholders’ equity | $ | 37,593 |
| $ | 36,952 |
| $ | 34,965 |
|
| Less: Average goodwill | 17,581 |
| 17,518 |
| 17,338 |
|
| Average intangible assets | 3,397 |
| 3,437 |
| 3,578 |
|
Add: Deferred tax liability – tax deductible goodwill (a) | 1,042 |
| 1,034 |
| 1,518 |
|
Deferred tax liability – intangible assets (a) | 716 |
| 718 |
| 1,100 |
|
| Average tangible common shareholders’ equity – Non-GAAP | $ | 18,373 |
| $ | 17,749 |
| $ | 16,667 |
|
| | | | |
Return on common shareholders’ equity (annualized) – GAAP | 12.2 | % | 12.1 | % | 10.2 | % |
Return on tangible common shareholders’ equity (annualized) – Non-GAAP | 25.9 | % | 25.9 | % | 22.2 | % |
| |
| (a) | Deferred tax liabilities, for the prior periods, are based on fully phased-in U.S. capital rules. |
The following table presents income fromthe impact of changes in foreign currency exchange rates on our consolidated investment management funds, net of noncontrolling interests.and performance fees.
|
| | | | | | | | | | | | | | | |
Income from consolidated investment management funds, net of noncontrolling interests | | YTD17 |
| YTD16 |
|
| (in millions) | 3Q17 |
| 2Q17 |
| 3Q16 |
|
| Income from consolidated investment management funds | $ | 10 |
| $ | 10 |
| $ | 17 |
| $ | 53 |
| $ | 21 |
|
| Less: Net income attributable to noncontrolling interests of consolidated investment management funds | 3 |
| 3 |
| 9 |
| 24 |
| 6 |
|
| Income from consolidated investment management funds, net of noncontrolling interests | $ | 7 |
| $ | 7 |
| $ | 8 |
| $ | 29 |
| $ | 15 |
|
|
| | | | | | | | |
| Investment management and performance fees – Consolidated | | | 1Q18 vs. |
|
| (dollars in millions) | 1Q18 |
| 1Q17 |
| 1Q17 |
|
| Investment management and performance fees | $ | 960 |
| $ | 842 |
| 14 | % |
| Impact of changes in foreign currency exchange rates | — |
| 37 |
| |
| Adjusted investment management and performance fees – Non-GAAP | $ | 960 |
| $ | 879 |
| 9 | % |
The following table presents the revenue line itemsimpact of changes in foreign currency exchange rates on investment management and performance fees reported in the Investment Management business impacted by the consolidated investment management funds.business.
|
| | | | | | | | | | | | | | | | | | | | | |
| Income from consolidated investment management funds, net of noncontrolling interests - Investment Management business |
| (in millions) | 3Q17 |
| 2Q17 |
| 1Q17 |
| 4Q16 |
| 3Q16 |
| YTD17 |
| YTD16 |
|
| Investment management fees | $ | 1 |
| $ | 2 |
| $ | 2 |
| $ | 4 |
| $ | 2 |
| $ | 5 |
| $ | 7 |
|
| Other (Investment income (loss)) | 6 |
| 5 |
| 13 |
| (3 | ) | 6 |
| 24 |
| 8 |
|
| Income from consolidated investment management funds, net of noncontrolling interests | $ | 7 |
| $ | 7 |
| $ | 15 |
| $ | 1 |
| $ | 8 |
| $ | 29 |
| $ | 15 |
|
|
| | | | | | | | |
| Investment management and performance fees - Investment Management business | | | 1Q18 vs. |
|
| (dollars in millions) | 1Q18 |
| 1Q17 |
| 1Q17 |
|
| Investment management and performance fees | $ | 946 |
| $ | 826 |
| 15 | % |
| Impact of changes in foreign currency exchange rates | — |
| 37 |
| |
| Adjusted investment management and performance fees – Non-GAAP | $ | 946 |
| $ | 863 |
| 10 | % |
The following table presents the reconciliation of the pre-tax operating margin for the Investment Management business.
| | | Pre-tax operating margin - Investment Management business | | |
| Pre-tax operating margin reconciliation - Investment Management business | | Pre-tax operating margin reconciliation - Investment Management business | |
| (dollars in millions) | 3Q17 |
| 2Q17 |
| 1Q17 |
| 4Q16 |
| 3Q16 |
| YTD17 |
| YTD16 |
| 1Q18 |
| 4Q17 |
| 3Q17 |
| 2Q17 |
| 1Q17 |
|
| Income before income taxes – GAAP | $ | 300 |
| $ | 288 |
| $ | 277 |
| $ | 260 |
| $ | 256 |
| $ | 865 |
| $ | 707 |
| $ | 381 |
| $ | 276 |
| $ | 300 |
| $ | 288 |
| $ | 277 |
|
| Add: Amortization of intangible assets | 15 |
| 15 |
| 15 |
| 22 |
| 22 |
| 45 |
| 60 |
| |
| Provision for credit losses | (2 | ) | — |
| 3 |
| 6 |
| — |
| 1 |
| — |
| |
| Adjusted income before income taxes, excluding amortization of intangible assets and provision for credit losses – Non-GAAP | $ | 313 |
| $ | 303 |
| $ | 295 |
| $ | 288 |
| $ | 278 |
| $ | 911 |
| $ | 767 |
| |
| | | |
| Total revenue – GAAP | $ | 1,000 |
| $ | 986 |
| $ | 963 |
| $ | 960 |
| $ | 958 |
| $ | 2,949 |
| $ | 2,791 |
| $ | 1,088 |
| $ | 1,048 |
| $ | 1,000 |
| $ | 986 |
| $ | 963 |
|
Less: Distribution and servicing expense | 110 |
| 104 |
| 101 |
| 98 |
| 104 |
| 315 |
| 306 |
| 110 |
| 107 |
| 110 |
| 104 |
| 101 |
|
| Adjusted total revenue, net of distribution and servicing expense – Non-GAAP | $ | 890 |
| $ | 882 |
| $ | 862 |
| $ | 862 |
| $ | 854 |
| $ | 2,634 |
| $ | 2,485 |
| $ | 978 |
| $ | 941 |
| $ | 890 |
| $ | 882 |
| $ | 862 |
|
| | | |
Pre-tax operating margin – GAAP (a) | 30 | % | 29 | % | 29 | % | 27 | % | 27 | % | 29 | % | 25 | % | 35 | % | 26 | % | 30 | % | 29 | % | 29 | % |
Adjusted pre-tax operating margin, excluding amortization of intangible assets, provision for credit losses and distribution and servicing expense – Non-GAAP (a) | 35 | % | 34 | % | 34 | % | 33 | % | 33 | % | 35 | % | 31 | % | |
Adjusted pre-tax operating margin, net of distribution and servicing expense – Non-GAAP (a) | | 39 | % | 29 | % | 34 | % | 33 | % | 32 | % |
| |
| (a) | Income before taxes divided by total revenue. |
Recent accounting and regulatory developments
Recently issued accounting standards
The following Accounting Standards Updates (“ASUs”)ASUs issued by the Financial Accounting Standards Board (“FASB”) have not yet been adopted.
ASU 2017-12, Derivatives and Hedging: Targeted Improvements to Accounting for Hedging Activities
In August 2017, the FASB issued an ASU, Derivatives and Hedging: Targeted Improvements to Accounting for Hedging Activities. The objective of this ASU is to improve the financial reporting of hedging relationships to better portray the economic results of an entity’s risk management activities and to simplify the application of hedge accounting guidance.
The most significant impact of the new guidance to the Company relates to the new accounting alternatives for fair value hedges of interest rate risk, specifically, the ability to hedge only the benchmark component of the contractual cash flows, partial-term hedging and the introduction of the “last of layer” method for hedges of portfolios of prepayable financial assets. The guidance also changed presentation and disclosure requirements and made changes to how the shortcut method is applied which may result in the Company using that method going forward for certain hedging relationships.
This ASU is effective for the first quarter of 2019, with early adoption permitted. Certain transition elections are available including the ability to reclassify a debt security from held-to-maturity to available-for-sale if it is eligible to be hedged under the last of layer method with any unrealized gain or loss at the transfer date being recorded in other comprehensive income. If this ASU is adopted early, the new guidance will be applicable as of the beginning of that year. BNY Mellon is currently assessing the impacts of the new standard.
ASU 2017-07, Compensation-Retirement Benefits - Improving the Presentation of Net Periodic Pension Cost and Net Periodic Postretirement Benefit Cost
In March 2017, the FASB issued an ASU, Compensation-Retirement Benefits - Improving the
Presentation of Net Periodic Pension Cost and Net Periodic Postretirement Benefit Cost. The ASU requires the disaggregation of the service cost component from the other components of the net benefit cost in the income statement. The ASU also permits only the service cost component of net benefit cost to be eligible for capitalization. The ASU is effective for the first quarter of 2018, with early adoption permitted. The guidance in this ASU should be applied retrospectively for the presentation of the service cost component and the other components in the income statement, and prospectively for the capitalization of the service cost component in assets. BNY Mellon is assessing the impacts of the new standard. For information on the components of our pension and post-retirement health plan costs, see Note 9 of the Notes to Consolidated Financial Statements in this Form 10-Q and Note 16 of the Notes to Consolidated Financial Statements in our 2016 Annual Report. To the extent that our recent trend of having a net credit for pension and other post-retirement costs continues, the standard will result in an increase to staff expense and a reduction in other expense.
ASU 2016-18, Statement of Cash Flows – Restricted Cash
In November 2016, the FASB issued an ASU, Statement of Cash Flows – Restricted Cash. This ASU provides guidance on the presentation of restricted cash or restricted cash equivalents in the statement of cash flows and is effective for the first quarter of 2018. Earlier application is permitted. BNY Mellon is assessing the impacts of the new standard, and expects to include restricted cash (which totaled $4 billion as of Sept. 30, 2017) with cash and due from banks when reconciling the beginning-of-period and end-of-period total amounts shown on the statement of cash flows.
ASU 2016-15, Statement of Cash Flows – Classification of Certain Cash Receipts and Cash Payments
In August 2016, the FASB issued an ASU, Statement of Cash Flows – Classification of Certain Cash Receipts and Cash Payments. This ASU provides guidance on eight specific cash flow presentation issues and is effective for the first quarter of 2018. Earlier application is permitted, however all of the amendments must be adopted in the same period. BNY Mellon is assessing the impacts of the new
standard, and does not expect this ASU to materially affect the results of operations or financial condition.
ASU 2016-13, Financial Instruments – Credit Losses
In June 2016, the FASB issued an ASU, Financial Instruments – Credit Losses. This ASU introduces a new current expected credit losses model, which will apply to financial assets subject to credit losses and measured at amortized cost, including held-to-maturity securities and certain off-balance sheet credit exposures. The guidance will also change current practice for the impairment model for available-for-sale debt securities. The available-for-sale debt securities model will require the use of an allowance to record estimated credit losses and subsequent recoveries. This ASU is effective for the first quarter of 2020. Earlier application is permitted beginning with the first quarter of 2019. BNY Mellon has begun its implementation efforts and is currently identifying key interpretive issues, and will assess existing credit loss forecasting models and processes against the new guidance to determine what modifications may be required. The extent of the impact to our financial statements upon adoption depends on several factors including the remaining expected life of financial instruments at the time of adoption, the establishment of an allowance for expected credit loss on held-to-maturity securities, and the macroeconomic conditions and forecasts that exist at that date.
ASU 2014-09, Revenue from Contracts with Customers
In May 2014, the FASB issued ASU 2014-09, Revenue from Contracts with Customers. This ASU, as amended, provides guidance on the recognition of revenue related to the transfer of promised goods or services to customers, guidance on accounting for certain contract costs and additional disclosure requirements about revenue and contract costs. The standard supersedes most existing revenue recognition guidance and is effective for the first quarter of 2018 using either the retrospective or cumulative effect transition method upon adoption.
The Company has completed its evaluation of the potential impact of this guidance on our accounting policies, and based on that evaluation, the timing of most of our revenue recognition will remain the same and the impacts will not be material. The impacts primarily relate to deferring and amortizing certain
sales commission costs related to obtaining customer contracts and the timing of recognizing the contra revenue related to certain payments made to customers. The Company plans to adopt the guidance as of Jan. 1, 2018 using the cumulative effect transition method. The Company is currently developing the disclosures required about revenue and contract costs and finalizing changes to internal control.
ASU 2016-02, Leases
In February 2016, the FASB issued ASU 2016-02, Leases. The primary objective of this ASU is to increase transparency and comparability by recognizing lease assets and liabilities on the balance sheet and expand related disclosures. ASU 2016-02 requires a “right-of-use” asset and a payment obligation liability on the balance sheet for most leases and subleases. Additionally, depending on the lease classification under the standard, it may result in different expense recognition patterns and classification than under existing accounting principles. For leases classified as finance leases, it will result in higher expense recognition in the earlier periods and lower expense in the later periods of the lease.
The standard is effective for the first quarter of 2019, with early adoption permitted. We will utilizeAs permitted under a recently approved ASU, we expect to elect the modified retrospectivealternative transition approach asmethod which allows for the recognition of the beginning of the earliest period presented, which will result inleases using a cumulative effect recordedadjustment to the opening balance of retained earnings in the earliest period presented. Additionally,of adoption of the standard allows for various optional practical expedients to assist with the implementation and reporting requirements.standard. We are currently evaluating the potential impact of the leasing standard on our consolidated financial statements and evaluating the practical expedients that may be elected. Upon adoption, the implementation of the leasing standard is expected to result in an immaterial increase in both assets and liabilities.
ASU 2016-01, Recognition and Measurement2018-02, Reclassification of Financial Assets and Financial LiabilitiesCertain Tax Effects from Accumulated Other Comprehensive Income
In January 2016,February 2018, the FASB issued an ASU, Reclassification of Certain Tax Effects from Accumulated Other Comprehensive Income. This ASU 2016-01, Recognition and Measurementpermits a reclassification from accumulated other comprehensive income to retained earnings for the tax effects of Financial Assets and Financial Liabilities. The ASU requires investments in equity securitiesitems within accumulated other comprehensive income that do not result in consolidation and are not accountedreflect the lower statutory tax rate which was enacted by the U.S. tax legislation. This ASU is effective for under the equity method to be measured at fair value with
changes in the fair value recognized through net income, unless one of two available exceptions apply. The first exception, a scope exception, allows Federal Reserve Bank stock, FHLB stock and other exchange memberships held by broker dealers to remain accounted for at cost, less impairment. The second exception, a practicability exception, will be available for equity investments that do not have readily determinable fair values and do not qualify for the practical expedient to estimate fair value under ASC 820, Fair Value Measurement. To the extent the practicability exception applies, such investments will be accounted for at cost adjusted for impairment, if any, plus or minus changes from observable price changes.
The amendments also require an entity to present separately in other comprehensive income the portion of the total change in the fair value of a liability resulting from the entity’s “own credit risk” when the entity has elected to measure the liability at fair value. The amendments also eliminate the requirement to disclose the methods and significant assumptions used to estimate the fair values of financial instruments measured at amortized cost that are on the balance sheet.
The Company plans to adopt this guidance in the first quarter of 2018 using2019, with early adoption permitted. The guidance
in this ASU may be applied retrospectively to the cumulativeperiod in which the effect method of adoption. BNY Mellon doesthe change in the U.S. federal corporate income tax rate in the Tax Cuts and Jobs Act is recognized. We are assessing the impacts of the new standard, but would not expect the adoption of this ASU to have a material impact.
ASU 2016-13, Financial Instruments – Credit Losses
In June 2016, the FASB issued an ASU, Financial Instruments – Credit Losses. This ASU introduces a new current expected credit losses model, which will apply to financial assets subject to credit losses and measured at amortized cost, including held-to-maturity securities and certain off-balance sheet credit exposures. The guidance will also change current practice for the impairment model for available-for-sale debt securities. The available-for-sale debt securities model will require the use of an allowance to record estimated credit losses and subsequent recoveries. This ASU is effective for the first quarter of 2020, with early application permitted beginning with the first quarter of 2019. BNY Mellon has begun its implementation efforts and is currently working through key interpretive issues, and in 2018 we are addressing credit loss forecasting models and related processes. The extent of the impact to our financial statements upon adoption depends on several factors including the remaining expected life of financial statements.instruments at the time of adoption, the establishment of an allowance for expected credit loss on held-to-maturity securities, and the macroeconomic conditions and forecasts that exist at that date. We do not expect to early adopt this ASU.
Recent regulatory developments
For a summary of additional regulatory matters relevant to our operations, see Supervision and Regulation in our 20162017 Annual Report. The following discussions summarize certain regulatory developments that may affect BNY Mellon, the impact of which we are still evaluating.
Final Rule on Qualified Financial ContractsFederal Reserve and OCC Propose Amendments to the Enhanced Supplementary Leverage Ratio Requirements for U.S. G-SIBs
On Sept. 1, 2017,April 11, 2018, the Federal Reserve adopted a final rule to require U.S. global systemically important banking organizations (“G-SIBs”) and the U.S. operations of foreign G-SIBs to amend their covered qualified financial contracts (“QFCs”). The FDIC adopted a substantially equivalent proposal on Oct. 30, 2017 and the Office of the Comptroller of the Currency is expected(the “OCC”) issued a joint notice of proposed rule-making that would recalibrate the enhanced supplementary
leverage ratio standards that apply to do soU.S. global systemically important bank holding companies (“G-SIBs”) and certain of their insured depository institution subsidiaries. The proposed rule would supplant the 2% SLR buffer that currently applies to all U.S. G-SIBs with a buffer equal to 50% of the firm’s risk-based G-SIB surcharge. For insured depository institution subsidiaries of U.S. G-SIBs regulated by the Federal Reserve or the OCC including The Bank of New York Mellon, the proposal would replace the current 6% SLR threshold requirement for those institutions to be considered “well capitalized” under the agencies’ prompt corrective action framework with an SLR of at least 3% plus 50% of the G-SIB surcharge applicable to their top-tier holding companies. The proposed rule would also make corresponding changes to the total loss absorbing capacity (“TLAC”) SLR buffer and long-term debt requirements for U.S. G-SIBs, as well as technical changes to the Federal Reserve’s TLAC rule. The existing enhanced supplementary leverage ratio related requirements became effective on Jan. 1, 2018, and the TLAC-related requirements will become effective on Jan. 1, 2019.
Federal Reserve Proposes Substantial Changes to CCAR and its Capital Rules
On April 10, 2018, the Federal Reserve issued a proposed rule that would integrate its regulatory capital, capital planning, and stress test rules, as well as the CCAR process. The proposal would introduce a stress capital buffer (“SCB”) that would be determined based on the results of the severely adverse scenario in the near future. QFCs generally include derivatives, repurchase agreementssupervisory stress test and securities lending arrangements, among others.be part of the firm’s ongoing capital requirements, resulting in “firm-specific and risk-sensitive” capital requirements for large bank holding companies. Specifically, the proposal would replace the current static 2.5% capital conservation buffer with an SCB requirement for Standardized Approach capital ratios, based on (i) the projected decrease in a firm’s common equity tier 1 capital ratio, measured from the beginning to its lowest point, in the severely adverse scenario of the Federal Reserve’s supervisory severely adverse scenario, plus (ii) planned common stock dividends for the fourth through seventh quarters of the planning horizon, subject to a floor of 2.5%. For firms subject to the advanced approaches, such as BNY Mellon, the static 2.5% capital conservation buffer would continue to apply for Advanced Approaches risk-based capital ratios. The finalproposed rule includes two key requirements. First,would maintain the final rule generally requiresrequirement for
covered firms to submit capital plans, but would introduce a new requirement that QFCs of G-SIBs explicitly provide that any resolution staysfirms reduce their planned capital distributions if those distributions would not be consistent with the applicable to the exercise of default rights with respect to such QFCs and to any resolution transfers under U.S. special resolution regimes apply to such covered QFCs. Second, the final rule requires that QFCs of G-SIBs be amended to neither permit the exercise of default or cross-default rights against entities covered by the final rulebuffer constraints based on the resolution or bankruptcy of an affiliate of such entities, nor allow for any transfer restrictions with respectfirms’ own baseline scenario projections. The proposal would not, however, change the CCAR qualitative review process that allows the Federal Reserve to such QFCs.
The final rule allows G-SIBs to comply with the rule by adheringobject to the International Swapscapital plans of “large and Derivatives Association 2015 Universal Resolution Stay Protocol (the “Protocol”) or a similar protocol that accomplishescomplex” firms on the contractual amendments required by the rule. BNY Mellon entities that engage in QFC activities covered by the Protocol have adhered to the Protocol. Compliance with the Federal Reserve’s final rule will be required on a phased-in basis beginning on Jan. 1, 2019. BNY Mellon is evaluating the impact of the new regulations on its activities.qualitative deficiencies.
Resolution planOther aspects of the proposal include: (1) introducing a stress leverage buffer (“SLB”) that is analogous to the SCB and applies to firms’ tier 1 leverage ratios, although not subject to any floor; (2) limiting capital distributions if a firm’s own BHC baseline scenario projections indicate that the firm would not satisfy applicable buffer requirements; (3) revising assumptions for balance sheet growth and capital actions in the supervisory stress test; and (4) eliminating heightened supervisory scrutiny of capital plans that include a dividend payout ratio of more than 30%. Under the proposal, a firm’s first SCB and SLB would become effective on Oct. 1, 2019.
As required byFederal Reserve, OCC and FDIC Release Joint Proposal Regarding the Dodd-Frank Act, BNY Mellon must submit annually toImplementation of CECL and Their Regulatory Capital Rules
On April 13 and April 17, 2018, the Federal Reserve, the OCC and the FDIC released a planjoint proposal to revise their regulatory capital rules to address U.S. generally accepted accounting principles’ upcoming change to the Current Expected Credit Losses (“CECL”) treatment of credit expense and allowances and provide an optional three-year phase-in period for its rapid and orderly resolutionthe day-one adverse regulatory capital effects upon adopting CECL. Additionally, the proposal would address which credit loss allowances under CECL would be eligible for inclusion in the event of material financial distress or failure. BNY Mellon filed its most recent resolution plan on July 1, 2017. We believe the 2017 resolution plan addresses all shortcomings and deficiencies identified by the FDIC and the Federal Reserve in the Company’s 2015 resolution plan. The public portion of our 2017 resolution plan is available on the Federal Reserve’s and FDIC’s websites.tier 2 regulatory capital.
In September 2017,Upon adopting CECL, a company will record a one-time adjustment to its credit loss allowances as of the Federal Reservebeginning of its fiscal year of adoption equal to the difference between the amounts of its credit loss allowances under the incurred loss methodology and FDIC extendedCECL. The adjustment will be recognized with offsetting entries to deferred tax assets, if appropriate, and to the filing deadline by one year to July 1, 2019 for the Parent’s next resolution plan.new fiscal year’s beginning retained earnings.
European Capital Markets Union Developments
In March 2018, the European Commission released a communication on completing the Capital Markets Union (“CMU”), which aims to further develop and integrate European capital markets in order to grow investment and productivity. Future reforms under the CMU will focus on (i) enhancing the European Union Single Market through new EU-wide standardized products and reduction of barriers when residents of EU countries invest in other EU countries, (ii) supporting entrepreneurship through clearer and simpler insolvency laws, tax laws and intangible property ownership laws; and (iii) more efficient supervision of EU capital markets including an enhanced role for the European Supervision and Markets Authority.
Website information
Our website is www.bnymellon.com. We currently make available the following information under the Investor Relations portion of our website. With respect to SEC filings, we post such information as soon as reasonably practicable after we electronically file such materials with, or furnish them to, the SEC.
All of our SEC filings, including annual reports on Form 10-K, quarterly reports on Form 10-Q, current reports on Form 8-K and all amendments to these reports, SEC Forms 3, 4 and 5 and any proxy statement mailed by us in connection with the solicitation of proxies;
Financial statements and footnotes prepared using eXtensible Business Reporting Language (“XBRL”);
Our earnings materials and selected management conference calls and presentations;
Other regulatory disclosures, including: Pillar 3 Disclosures (and Market Risk Disclosure contained therein); Liquidity Coverage Ratio Disclosures; Federal Financial Institutions Examination Council - Consolidated Reports of Condition and Income for a Bank With Domestic and Foreign Offices; Consolidated Financial Statements for Bank Holding Companies; and the Dodd-Frank Act Stress Test Results for BNY Mellon and The Bank of New York Mellon; and
Our Corporate Governance Guidelines, Amended and Restated By-laws, Directors Code of Conduct and the Charters of the Audit, Finance, Corporate Governance, and Nominating Corporateand Social Responsibility, Human Resources and Compensation, Risk and Technology Committees of our Board of Directors.
We may use our website, our Twitter account (twitter.com/BNYMellon) and other social media channels as additional means of disclosing information to the public. The information disclosed through those channels may be considered to be material. The contents of theour website listed above or any other websitessocial media channels referenced herein are not incorporated by reference into this Quarterly Report on Form 10-Q.
|
|
| Item 1. Financial Statements |
| |
| The Bank of New York Mellon Corporation (and its subsidiaries) |
| |
Consolidated Income Statement (unaudited)
| | | | Quarter ended | | Year-to-date | Quarter ended |
| | Sept. 30, 2017 |
| June 30, 2017 |
| Sept. 30, 2016 |
| | Sept. 30, 2017 |
| Sept. 30, 2016 |
| March 31, 2018 |
| Dec. 31, 2017 |
| March 31, 2017 |
|
| (in millions) | |
| Fee and other revenue | | | | |
| Investment services fees: | | | | |
| Asset servicing | $ | 1,105 |
| $ | 1,085 |
| $ | 1,067 |
| | $ | 3,253 |
| $ | 3,176 |
| $ | 1,168 |
| $ | 1,130 |
| $ | 1,063 |
|
| Clearing services | 383 |
| 394 |
| 349 |
| | 1,153 |
| 1,049 |
| 414 |
| 400 |
| 376 |
|
| Issuer services | 288 |
| 241 |
| 337 |
| | 780 |
| 815 |
| 260 |
| 197 |
| 251 |
|
| Treasury services | 141 |
| 140 |
| 137 |
| | 420 |
| 407 |
| 138 |
| 137 |
| 139 |
|
| Total investment services fees | 1,917 |
| 1,860 |
| 1,890 |
| | 5,606 |
| 5,447 |
| 1,980 |
| 1,864 |
| 1,829 |
|
| Investment management and performance fees | 901 |
| 879 |
| 860 |
| | 2,622 |
| 2,502 |
| 960 |
| 962 |
| 842 |
|
| Foreign exchange and other trading revenue | 173 |
| 165 |
| 183 |
| | 502 |
| 540 |
| 209 |
| 166 |
| 164 |
|
| Financing-related fees | 54 |
| 53 |
| 58 |
| | 162 |
| 169 |
| 52 |
| 54 |
| 55 |
|
| Distribution and servicing | 40 |
| 41 |
| 43 |
| | 122 |
| 125 |
| 36 |
| 38 |
| 41 |
|
| Investment and other income | 63 |
| 122 |
| 92 |
| | 262 |
| 271 |
| |
| Investment and other income (loss) | | 82 |
| (198 | ) | 77 |
|
| Total fee revenue | 3,148 |
| 3,120 |
| 3,126 |
| | 9,276 |
| 9,054 |
| 3,319 |
| 2,886 |
| 3,008 |
|
| Net securities gains — including other-than-temporary impairment | 18 |
| — |
| 27 |
| | 28 |
| 67 |
| |
| Net securities (losses) gains — including other-than-temporary impairment | | (49 | ) | (22 | ) | 10 |
|
Noncredit-related portion of other-than-temporary impairment (recognized in other comprehensive income) | (1 | ) | — |
| 3 |
| | (1 | ) | 2 |
| — |
| 4 |
| — |
|
| Net securities gains | 19 |
| — |
| 24 |
| | 29 |
| 65 |
| |
| Net securities (losses) gains | | (49 | ) | (26 | ) | 10 |
|
| Total fee and other revenue | 3,167 |
| 3,120 |
| 3,150 |
| | 9,305 |
| 9,119 |
| 3,270 |
| 2,860 |
| 3,018 |
|
| Operations of consolidated investment management funds | | | | |
| Investment income | 10 |
| 10 |
| 20 |
| | 57 |
| 27 |
| |
| Investment (loss) income | | (11 | ) | 17 |
| 37 |
|
| Interest of investment management fund note holders | — |
| — |
| 3 |
| | 4 |
| 6 |
| — |
| — |
| 4 |
|
| Income from consolidated investment management funds | 10 |
| 10 |
| 17 |
| | 53 |
| 21 |
| |
| (Loss) income from consolidated investment management funds | | (11 | ) | 17 |
| 33 |
|
| Net interest revenue | | | | |
| Interest revenue | 1,151 |
| 1,052 |
| 874 |
| | 3,163 |
| 2,647 |
| 1,381 |
| 1,219 |
| 960 |
|
| Interest expense | 312 |
| 226 |
| 100 |
| | 706 |
| 340 |
| 462 |
| 368 |
| 168 |
|
| Net interest revenue | 839 |
| 826 |
| 774 |
| | 2,457 |
| 2,307 |
| 919 |
| 851 |
| 792 |
|
| Total revenue | 4,016 |
| 3,956 |
| 3,941 |
| | 11,815 |
| 11,447 |
| 4,178 |
| 3,728 |
| 3,843 |
|
| Provision for credit losses | (6 | ) | (7 | ) | (19 | ) | | (18 | ) | (18 | ) | (5 | ) | (6 | ) | (5 | ) |
| Noninterest expense | | | | |
Staff | 1,469 |
| 1,417 |
| 1,467 |
| | 4,358 |
| 4,338 |
| 1,576 |
| 1,628 |
| 1,488 |
|
| Professional, legal and other purchased services | 305 |
| 319 |
| 292 |
| | 936 |
| 860 |
| 291 |
| 339 |
| 313 |
|
| Software | 175 |
| 173 |
| 156 |
| | 514 |
| 470 |
| 173 |
| 230 |
| 166 |
|
| Net occupancy | 141 |
| 139 |
| 143 |
| | 416 |
| 437 |
| 139 |
| 153 |
| 136 |
|
Sub-custodian and clearing (b) | | 119 |
| 102 |
| 103 |
|
| Distribution and servicing | 109 |
| 104 |
| 105 |
| | 313 |
| 307 |
| 106 |
| 106 |
| 100 |
|
| Sub-custodian | 62 |
| 65 |
| 59 |
| | 191 |
| 188 |
| |
| Furniture and equipment | 58 |
| 59 |
| 59 |
| | 174 |
| 187 |
| 61 |
| 67 |
| 57 |
|
Bank assessment charges (a) | 51 |
| 59 |
| 61 |
| | 167 |
| 166 |
| 52 |
| 53 |
| 57 |
|
| Business development | 49 |
| 63 |
| 52 |
| | 163 |
| 174 |
| 51 |
| 66 |
| 51 |
|
Other (a) | 177 |
| 192 |
| 170 |
| | 536 |
| 546 |
| |
| Amortization of intangible assets | 52 |
| 53 |
| 61 |
| | 157 |
| 177 |
| 49 |
| 52 |
| 52 |
|
| Merger and integration, litigation and restructuring charges | 6 |
| 12 |
| 18 |
| | 26 |
| 42 |
| |
Other (a)(b)(c) | | 122 |
| 210 |
| 119 |
|
| Total noninterest expense | 2,654 |
| 2,655 |
| 2,643 |
| | 7,951 |
| 7,892 |
| 2,739 |
| 3,006 |
| 2,642 |
|
| Income | | | | |
| Income before income taxes | 1,368 |
| 1,308 |
| 1,317 |
| | 3,882 |
| 3,573 |
| 1,444 |
| 728 |
| 1,206 |
|
| Provision for income taxes | 348 |
| 332 |
| 324 |
| | 949 |
| 897 |
| |
| Provision (benefit) for income taxes | | 282 |
| (453 | ) | 269 |
|
| Net income | 1,020 |
| 976 |
| 993 |
| | 2,933 |
| 2,676 |
| 1,162 |
| 1,181 |
| 937 |
|
| Net (income) loss attributable to noncontrolling interests (includes $(3), $(3), $(9), $(24) and $(6) related to consolidated investment management funds, respectively) | (2 | ) | (1 | ) | (6 | ) | | (18 | ) | 1 |
| |
| Net loss (income) attributable to noncontrolling interests (includes $11, $(9) and $(18) related to consolidated investment management funds, respectively) | | 9 |
| (6 | ) | (15 | ) |
| Net income applicable to shareholders of The Bank of New York Mellon Corporation | 1,018 |
| 975 |
| 987 |
| | 2,915 |
| 2,677 |
| 1,171 |
| 1,175 |
| 922 |
|
| Preferred stock dividends | (35 | ) | (49 | ) | (13 | ) | | (126 | ) | (74 | ) | (36 | ) | (49 | ) | (42 | ) |
| Net income applicable to common shareholders of The Bank of New York Mellon Corporation | $ | 983 |
| $ | 926 |
| $ | 974 |
| | $ | 2,789 |
| $ | 2,603 |
| $ | 1,135 |
| $ | 1,126 |
| $ | 880 |
|
| |
| (a) | In the first quarter of 2017,2018, we began disclosing bank assessment charges onadopted new accounting guidance included in ASU 2017-07, Compensation-Retirement Benefits - Improving the Presentation of Net Periodic Pension Cost and Net Periodic Postretirement Benefit Cost, which required the reclassification of the components of pension and other post-retirement costs, other than the service cost component. As a quarterly basis. The bank assessment charges wereresult, staff expense increased and other expense decreased. Prior periods have been reclassified. See Note 2 of the Notes to Consolidated Financial Statements for additional information. |
| |
| (b) | Beginning in the first quarter of 2018, clearing expense, which was previously included in other expense, was included with sub-custodian expense. All priorPrior periods werehave been reclassified. |
| |
| (c) | Beginning in the first quarter of 2018, M&I, litigation and restructuring charges are no longer separately disclosed. Expenses previously reported in this line have been reclassified to existing expense categories, primarily other expense. |
|
|
| The Bank of New York Mellon Corporation (and its subsidiaries) |
Consolidated Income Statement (unaudited) (continued)
| | | Net income applicable to common shareholders of The Bank of New York Mellon Corporation used for the earnings per share calculation | Quarter ended | | Year-to-date | Quarter ended |
| Sept. 30, 2017 |
| June 30, 2017 |
| Sept. 30, 2016 |
| | Sept. 30, 2017 |
| Sept. 30, 2016 |
| March 31, 2018 |
| Dec. 31, 2017 |
| March 31, 2017 |
|
| (in millions) | |
| Net income applicable to common shareholders of The Bank of New York Mellon Corporation | $ | 983 |
| $ | 926 |
| $ | 974 |
| | $ | 2,789 |
| $ | 2,603 |
| $ | 1,135 |
| $ | 1,126 |
| $ | 880 |
|
Less: Earnings allocated to participating securities (a) | 8 |
| 13 |
| 15 |
| | 35 |
| 39 |
| 8 |
| 8 |
| 14 |
|
| Net income applicable to common shareholders of The Bank of New York Mellon Corporation after required adjustment for the calculation of basic and diluted earnings per common share | $ | 975 |
| $ | 913 |
| $ | 959 |
|
| $ | 2,754 |
| $ | 2,564 |
| $ | 1,127 |
| $ | 1,118 |
| $ | 866 |
|
| | Average common shares and equivalents outstanding of The Bank of New York Mellon Corporation (a) | Quarter ended | | Year-to-date | Quarter ended |
| Sept. 30, 2017 |
| June 30, 2017 |
| Sept. 30, 2016 |
| | Sept. 30, 2017 |
| Sept. 30, 2016 |
| March 31, 2018 |
| Dec. 31, 2017 |
| March 31, 2017 |
|
| (in thousands) | |
| Basic | 1,035,337 |
| 1,035,829 |
| 1,062,248 |
| | 1,037,431 |
| 1,071,457 |
| 1,016,797 |
| 1,024,828 |
| 1,041,158 |
|
| Common stock equivalents | 9,226 |
| 15,598 |
| 15,406 |
| | 14,216 |
| 15,306 |
| 8,188 |
| 9,473 |
| 17,886 |
|
| Less: Participating securities | (3,425 | ) | (9,548 | ) | (9,972 | ) | | (8,062 | ) | (9,613 | ) | (3,254 | ) | (3,897 | ) | (11,298 | ) |
| Diluted | 1,041,138 |
| 1,041,879 |
| 1,067,682 |
| | 1,043,585 |
| 1,077,150 |
| 1,021,731 |
| 1,030,404 |
| 1,047,746 |
|
| | | | | |
Anti-dilutive securities (b)(a) | 8,059 |
| 16,256 |
| 32,232 |
| | 13,906 |
| 32,699 |
| 7,248 |
| 7,784 |
| 17,359 |
|
| | Earnings per share applicable to common shareholders of The Bank of New York Mellon Corporation (c)(b) | Quarter ended | | Year-to-date | Quarter ended |
| Sept. 30, 2017 |
| June 30, 2017 |
| Sept. 30, 2016 |
| | Sept. 30, 2017 |
| Sept. 30, 2016 |
| March 31, 2018 |
| Dec. 31, 2017 |
| March 31, 2017 |
|
| (in dollars) | |
| Basic | $ | 0.94 |
| $ | 0.88 |
| $ | 0.90 |
| | $ | 2.66 |
| $ | 2.39 |
| $ | 1.11 |
| $ | 1.09 |
| $ | 0.83 |
|
| Diluted | $ | 0.94 |
| $ | 0.88 |
| $ | 0.90 |
| | $ | 2.64 |
| $ | 2.38 |
| $ | 1.10 |
| $ | 1.08 |
| $ | 0.83 |
|
| |
| (a) | Beginning in the third quarter of 2017, vested stock awards to retirement eligible employees are included in common shares outstanding for earnings per share purposes. This change increased both average basic and average diluted shares outstanding by approximately 6 million and reduced earnings allocated to participating securities by $6 million for the quarter, which resulted in a de minimis impact to both basic and diluted earnings per share. |
| |
(b) | Represents stock options, restricted stock, restricted stock units and participating securities outstanding but not included in the computation of diluted average common shares because their effect would be anti-dilutive. |
| |
(c)(b) | Basic and diluted earnings per share under the two-class method are determined on the net income applicable to common shareholders of The Bank of New York Mellon Corporation reported on the income statement less earnings allocated to participating securities. |
See accompanying Notes to Consolidated Financial Statements.
|
|
| The Bank of New York Mellon Corporation (and its subsidiaries) |
Consolidated Comprehensive Income Statement (unaudited)
| | | | Quarter ended | | Year-to-date | Quarter ended |
| | Sept. 30, 2017 |
| June 30, 2017 |
| Sept. 30, 2016 |
| | Sept. 30, 2017 |
| Sept. 30, 2016 |
| March 31, 2018 |
| Dec. 31, 2017 |
| March 31, 2017 |
|
| (in millions) | |
| Net income | $ | 1,020 |
| $ | 976 |
| $ | 993 |
| | $ | 2,933 |
| $ | 2,676 |
| $ | 1,162 |
| $ | 1,181 |
| $ | 937 |
|
| Other comprehensive income (loss), net of tax: | | | | |
| Other comprehensive income, net of tax: | | |
| Foreign currency translation adjustments | 286 |
| 330 |
| (186 | ) | | 741 |
| (433 | ) | 244 |
| 112 |
| 125 |
|
| Unrealized gain on assets available-for-sale: | | | | |
| Unrealized gain (loss) arising during the period | 28 |
| 91 |
| (53 | ) | | 213 |
| 227 |
| |
| Unrealized (loss) gain on assets available-for-sale: | | |
| Unrealized (loss) gain arising during the period | | (275 | ) | (60 | ) | 94 |
|
| Reclassification adjustment | (12 | ) | (1 | ) | (15 | ) | | (19 | ) | (43 | ) | 37 |
| 16 |
| (6 | ) |
| Total unrealized gain (loss) on assets available-for-sale | 16 |
| 90 |
| (68 | ) | | 194 |
| 184 |
| |
| Total unrealized (loss) gain on assets available-for-sale | | (238 | ) | (44 | ) | 88 |
|
| Defined benefit plans: | | | | |
| Net gain arising during the period | — |
| — |
| — |
| | 2 |
| 2 |
| — |
| 340 |
| 2 |
|
| Foreign exchange adjustment | | — |
| 1 |
| — |
|
| Amortization of prior service credit, net loss and initial obligation included in net periodic benefit cost | 15 |
| 16 |
| 14 |
| | 49 |
| 43 |
| 17 |
| 19 |
| 18 |
|
| Total defined benefit plans | 15 |
| 16 |
| 14 |
| | 51 |
| 45 |
| 17 |
| 360 |
| 20 |
|
| Net unrealized gain (loss) on cash flow hedges | — |
| 1 |
| 2 |
| | 11 |
| (4 | ) | |
Total other comprehensive income (loss), net of tax (a) | 317 |
| 437 |
| (238 | ) | | 997 |
| (208 | ) | |
| Net unrealized (loss) gain on cash flow hedges | | (2 | ) | (2 | ) | 10 |
|
Total other comprehensive income, net of tax (a) | | 21 |
| 426 |
| 243 |
|
| Total comprehensive income | 1,337 |
| 1,413 |
| 755 |
| | 3,930 |
| 2,468 |
| 1,183 |
| 1,607 |
| 1,180 |
|
| Net (income) loss attributable to noncontrolling interests | (2 | ) | (1 | ) | (6 | ) | | (18 | ) | 1 |
| |
| Other comprehensive (income) loss attributable to noncontrolling interests | (5 | ) | (6 | ) | 5 |
| | (13 | ) | 23 |
| |
| Net loss (income) attributable to noncontrolling interests | | 9 |
| (6 | ) | (15 | ) |
| Other comprehensive (income) attributable to noncontrolling interests | | (5 | ) | (2 | ) | (2 | ) |
| Comprehensive income applicable to shareholders of The Bank of New York Mellon Corporation | $ | 1,330 |
| $ | 1,406 |
| $ | 754 |
| | $ | 3,899 |
| $ | 2,492 |
| $ | 1,187 |
| $ | 1,599 |
| $ | 1,163 |
|
| |
| (a) | Other comprehensive income (loss) attributable to The Bank of New York Mellon Corporation shareholders was $312$16 million for the quarter ended Sept. 30, 2017, $431March 31, 2018, $424 million for the quarter ended June 30,Dec. 31, 2017 $(233)and $241 million for the quarter ended Sept. 30, 2016, $984 million for the nine months ended Sept. 30, 2017 and $(185) million for the nine months ended Sept. 30, 2016.March 31, 2017. |
See accompanying Notes to Consolidated Financial Statements.
|
|
| The Bank of New York Mellon Corporation (and its subsidiaries) |
Consolidated Balance Sheet (unaudited)
| | | | Sept. 30, 2017 |
| Dec. 31, 2016 |
| March 31, 2018 |
| Dec. 31, 2017 |
|
| (dollars in millions, except per share amounts) |
| Assets | | |
| Cash and due from: | | |
| Banks | $ | 5,557 |
| $ | 4,822 |
| $ | 4,636 |
| $ | 5,382 |
|
| Interest-bearing deposits with the Federal Reserve and other central banks | 75,808 |
| 58,041 |
| 91,431 |
| 91,510 |
|
| Interest-bearing deposits with banks | 15,256 |
| 15,086 |
| |
| Interest-bearing deposits with banks ($1,236 and $1,751 is restricted) | | 15,186 |
| 11,979 |
|
| Federal funds sold and securities purchased under resale agreements | 27,883 |
| 25,801 |
| 28,784 |
| 28,135 |
|
| Securities: | |
|
| |
|
|
| Held-to-maturity (fair value of $39,928 and $40,669) | 39,995 |
| 40,905 |
| |
| Held-to-maturity (fair value of $36,135 and $40,512) | | 36,959 |
| 40,827 |
|
| Available-for-sale | 80,054 |
| 73,822 |
| 81,830 |
| 79,543 |
|
| Total securities | 120,049 |
| 114,727 |
| 118,789 |
| 120,370 |
|
| Trading assets | 4,666 |
| 5,733 |
| 8,596 |
| 6,022 |
|
| Loans | 59,068 |
| 64,458 |
| 60,809 |
| 61,540 |
|
| Allowance for loan losses | (161 | ) | (169 | ) | (156 | ) | (159 | ) |
| Net loans | 58,907 |
| 64,289 |
| 60,653 |
| 61,381 |
|
| Premises and equipment | 1,631 |
| 1,303 |
| 1,702 |
| 1,634 |
|
| Accrued interest receivable | 547 |
| 568 |
| 610 |
| 610 |
|
| Goodwill | 17,543 |
| 17,316 |
| 17,596 |
| 17,564 |
|
| Intangible assets | 3,461 |
| 3,598 |
| 3,370 |
| 3,411 |
|
| Other assets (includes $827 and $1,339, at fair value) | 22,287 |
| 20,954 |
| |
| Other assets (includes $561 and $791, at fair value) | | 21,638 |
| 23,029 |
|
| Subtotal assets of operations | 353,595 |
| 332,238 |
| 372,991 |
| 371,027 |
|
| Assets of consolidated investment management funds, at fair value | 802 |
| 1,231 |
| 606 |
| 731 |
|
| Total assets | $ | 354,397 |
| $ | 333,469 |
| $ | 373,597 |
| $ | 371,758 |
|
| Liabilities | |
|
| |
|
|
| Deposits: | |
|
| |
|
|
| Noninterest-bearing (principally U.S. offices) | $ | 80,380 |
| $ | 78,342 |
| $ | 76,880 |
| $ | 82,716 |
|
| Interest-bearing deposits in U.S. offices | 46,023 |
| 52,049 |
| 58,269 |
| 52,294 |
|
| Interest-bearing deposits in non-U.S. offices | 104,593 |
| 91,099 |
| 106,695 |
| 109,312 |
|
| Total deposits | 230,996 |
| 221,490 |
| 241,844 |
| 244,322 |
|
| Federal funds purchased and securities sold under repurchase agreements | 10,314 |
| 9,989 |
| 21,600 |
| 15,163 |
|
| Trading liabilities | 3,253 |
| 4,389 |
| 3,365 |
| 3,984 |
|
| Payables to customers and broker-dealers | 21,176 |
| 20,987 |
| 20,172 |
| 20,184 |
|
| Commercial paper | 2,501 |
| — |
| 3,936 |
| 3,075 |
|
| Other borrowed funds | 3,353 |
| 754 |
| 1,550 |
| 3,028 |
|
Accrued taxes and other expenses | 6,070 |
| 5,867 |
| 5,349 |
| 6,225 |
|
| Other liabilities (including allowance for lending-related commitments of $104 and $112, also includes $812 and $597, at fair value) | 7,195 |
| 5,635 |
| |
| Long-term debt (includes $369 and $363, at fair value) | 28,408 |
| 24,463 |
| |
| Other liabilities (including allowance for lending-related commitments of $100 and $102, also includes $379 and $800, at fair value) | | 5,707 |
| 6,050 |
|
| Long-term debt (includes $363 and $367, at fair value) | | 27,939 |
| 27,979 |
|
| Subtotal liabilities of operations | 313,266 |
| 293,574 |
| 331,462 |
| 330,010 |
|
| Liabilities of consolidated investment management funds, at fair value | 27 |
| 315 |
| 11 |
| 2 |
|
| Total liabilities | 313,293 |
| 293,889 |
| 331,473 |
| 330,012 |
|
| Temporary equity | |
|
| |
|
|
| Redeemable noncontrolling interests | 197 |
| 151 |
| 184 |
| 179 |
|
| Permanent equity | |
|
| |
|
|
| Preferred stock – par value $0.01 per share; authorized 100,000,000 shares; issued 35,826 and 35,826 shares | 3,542 |
| 3,542 |
| 3,542 |
| 3,542 |
|
| Common stock – par value $0.01 per share; authorized 3,500,000,000 shares; issued 1,352,363,932 and 1,333,706,427 shares | 14 |
| 13 |
| |
| Common stock – par value $0.01 per share; authorized 3,500,000,000 shares; issued 1,362,857,226 and 1,354,163,581 shares | | 14 |
| 14 |
|
| Additional paid-in capital | 26,588 |
| 25,962 |
| 26,911 |
| 26,665 |
|
| Retained earnings | 24,757 |
| 22,621 |
| 26,496 |
| 25,635 |
|
| Accumulated other comprehensive loss, net of tax | (2,781 | ) | (3,765 | ) | (2,343 | ) | (2,357 | ) |
| Less: Treasury stock of 328,341,579 and 286,218,126 common shares, at cost | (11,597 | ) | (9,562 | ) | |
| Less: Treasury stock of 352,181,047 and 340,721,136 common shares, at cost | | (12,892 | ) | (12,248 | ) |
| Total The Bank of New York Mellon Corporation shareholders’ equity | 40,523 |
| 38,811 |
| 41,728 |
| 41,251 |
|
| Nonredeemable noncontrolling interests of consolidated investment management funds | 384 |
| 618 |
| 212 |
| 316 |
|
| Total permanent equity | 40,907 |
| 39,429 |
| 41,940 |
| 41,567 |
|
| Total liabilities, temporary equity and permanent equity | $ | 354,397 |
| $ | 333,469 |
| $ | 373,597 |
| $ | 371,758 |
|
See accompanying Notes to Consolidated Financial Statements.
|
|
| The Bank of New York Mellon Corporation (and its subsidiaries) |
Consolidated Statement of Cash Flows (unaudited)
| | | | Nine months ended Sept. 30, | Three months ended March 31, |
| (in millions) | 2017 |
| | 2016 |
| 2018 |
| 2017 |
|
| Operating activities | | | | |
| Net income | $ | 2,933 |
| | $ | 2,676 |
| $ | 1,162 |
| $ | 937 |
|
| Net (income) loss attributable to noncontrolling interests | (18 | ) | | 1 |
| |
| Net loss (income) attributable to noncontrolling interests | | 9 |
| (15 | ) |
| Net income applicable to shareholders of The Bank of New York Mellon Corporation | 2,915 |
| | 2,677 |
| 1,171 |
| 922 |
|
| Adjustments to reconcile net income to net cash provided by operating activities: | | | | |
| Adjustments to reconcile net income to net cash (used for) provided by operating activities: | | |
| Provision for credit losses | (18 | ) | | (18 | ) | (5 | ) | (5 | ) |
| Pension plan contributions | (12 | ) | | (17 | ) | (3 | ) | (5 | ) |
| Depreciation and amortization | 1,044 |
| | 1,118 |
| 335 |
| 347 |
|
| Deferred tax expense (benefit) | 272 |
| | (282 | ) | |
| Net securities (gains) | (29 | ) | | (65 | ) | |
| Deferred tax expense | | 16 |
| 130 |
|
| Net securities losses (gains) | | 49 |
| (10 | ) |
| Change in trading assets and liabilities | (66 | ) | | 1,680 |
| (2,214 | ) | (751 | ) |
| Originations of loans held-for-sale | — |
| | (350 | ) | |
| Proceeds from the sales of loans originated for sale | — |
| | 802 |
| |
| Change in accruals and other, net | (756 | ) | | (3,988 | ) | |
| Net cash provided by operating activities | 3,350 |
| | 1,557 |
| |
Change in accruals and other, net (a) | | (201 | ) | (1,852 | ) |
Net cash (used for) operating activities (a) | | (852 | ) | (1,224 | ) |
| Investing activities | | | | |
| Change in interest-bearing deposits with banks | 507 |
| | 880 |
| |
Change in interest-bearing deposits with banks (a) | | (3,700 | ) | 261 |
|
| Change in interest-bearing deposits with the Federal Reserve and other central banks | (14,467 | ) | | 33,473 |
| 1,489 |
| (6,569 | ) |
| Purchases of securities held-to-maturity | (5,878 | ) | | (4,169 | ) | (1,688 | ) | (2,896 | ) |
| Paydowns of securities held-to-maturity | 3,332 |
| | 3,577 |
| 1,011 |
| 1,067 |
|
| Maturities of securities held-to-maturity | 3,412 |
| | 2,933 |
| 3,468 |
| 2,469 |
|
| Purchases of securities available-for-sale | (18,974 | ) | | (21,491 | ) | (8,757 | ) | (5,510 | ) |
| Sales of securities available-for-sale | 3,531 |
| | 5,624 |
| 4,050 |
| 924 |
|
| Paydowns of securities available-for-sale | 7,047 |
| | 6,552 |
| 1,735 |
| 2,023 |
|
| Maturities of securities available-for-sale | 4,820 |
| | 7,610 |
| 1,436 |
| 1,462 |
|
| Net change in loans | 5,283 |
| | (2,884 | ) | 752 |
| 3,618 |
|
| Sales of loans and other real estate | 369 |
| | 172 |
| 1 |
| 72 |
|
| Change in federal funds sold and securities purchased under resale agreements | (2,082 | ) | | (10,456 | ) | |
Change in federal funds sold and securities purchased under resale agreements (a) | | (649 | ) | 26 |
|
| Net change in seed capital investments | (52 | ) | | (57 | ) | 12 |
| 72 |
|
| Purchases of premises and equipment/capitalized software | (933 | ) | | (495 | ) | (173 | ) | (286 | ) |
| Proceeds from the sale of premises and equipment | — |
| | 65 |
| |
| Acquisitions, net of cash | — |
| | (38 | ) | |
| Dispositions, net of cash | — |
| | 1 |
| 84 |
| — |
|
| Other, net | 82 |
| | (239 | ) | |
| Net cash (used for) provided by investing activities | (14,003 | ) | | 21,058 |
| |
Other, net (a) | | (501 | ) | 490 |
|
Net cash (used for) investing activities (a) | | (1,430 | ) | (2,777 | ) |
| Financing activities | | | | |
| Change in deposits | 4,459 |
| | (18,378 | ) | (4,283 | ) | (1,201 | ) |
| Change in federal funds purchased and securities sold under repurchase agreements | 325 |
| | (6,950 | ) | 6,437 |
| 1,160 |
|
| Change in payables to customers and broker-dealers | 177 |
| | (743 | ) | (12 | ) | 311 |
|
| Change in other borrowed funds | 2,187 |
| | 427 |
| (1,524 | ) | 233 |
|
| Change in commercial paper | 2,501 |
| | — |
| 861 |
| 2,543 |
|
| Net proceeds from the issuance of long-term debt | 4,739 |
| | 4,982 |
| 1,745 |
| 2,243 |
|
| Repayments of long-term debt | (796 | ) | | (2,453 | ) | (1,400 | ) | (296 | ) |
| Proceeds from the exercise of stock options | 383 |
| | 129 |
| 56 |
| 145 |
|
| Issuance of common stock | 24 |
| | 20 |
| 12 |
| 7 |
|
| Issuance of preferred stock | — |
| | 990 |
| |
| Treasury stock acquired | (2,035 | ) | | (1,550 | ) | (644 | ) | (879 | ) |
| Common cash dividends paid | (653 | ) | | (576 | ) | (246 | ) | (201 | ) |
| Preferred cash dividends paid | (126 | ) | | (74 | ) | (36 | ) | (42 | ) |
| Other, net | 46 |
| | (2 | ) | 5 |
| 9 |
|
| Net cash provided by (used for) financing activities | 11,231 |
| | (24,178 | ) | |
| Net cash provided by financing activities | | 971 |
| 4,032 |
|
| Effect of exchange rate changes on cash | 157 |
| | (17 | ) | 50 |
| 36 |
|
| Change in cash and due from banks | | | | |
| Change in cash and due from banks | 735 |
| | (1,580 | ) | |
| Cash and due from banks at beginning of period | 4,822 |
| | 6,537 |
| |
| Cash and due from banks at end of period | $ | 5,557 |
| | $ | 4,957 |
| |
Change in cash and due from banks and restricted cash (a) | | |
| Change in cash and due from banks and restricted cash | | (1,261 | ) | 67 |
|
| Cash and due from banks and restricted cash at beginning of period | | 7,133 |
| 8,204 |
|
| Cash and due from banks and restricted cash at end of period | | $ | 5,872 |
| $ | 8,271 |
|
Cash and due from banks and restricted cash: (a) | | |
| Cash and due from banks at end of period (unrestricted cash) | | $ | 4,636 |
| $ | 5,366 |
|
| Restricted cash at end of period | | 1,236 |
| 2,905 |
|
| Cash and due from banks and restricted cash at end of period | | $ | 5,872 |
| $ | 8,271 |
|
| Supplemental disclosures | | | | |
| Interest paid | $ | 721 |
| | $ | 371 |
| $ | 483 |
| $ | 211 |
|
| Income taxes paid | 316 |
| | 597 |
| 114 |
| 100 |
|
| Income taxes refunded | 19 |
| | 293 |
| 56 |
| 1 |
|
| |
| (a) | Reflects the impact of adopting new accounting guidance included in ASU 2016-15 and ASU 2016-18. Prior periods have been restated. See Note 2 for additional information. |
See accompanying Notes to Consolidated Financial Statements.
|
|
| The Bank of New York Mellon Corporation (and its subsidiaries) |
Consolidated Statement of Changes in Equity (unaudited)
| | | | The Bank of New York Mellon Corporation shareholders | Non- redeemable noncontrolling interests of consolidated investment management funds |
| Total permanent equity |
| | Redeemable non- controlling interests/ temporary equity |
| The Bank of New York Mellon Corporation shareholders | Non- redeemable noncontrolling interests of consolidated investment management funds |
| Total permanent equity |
| | Redeemable non- controlling interests/ temporary equity |
|
(in millions, except per
share amount) | Preferred stock |
| Common stock |
| Additional paid-in capital |
| Retained earnings |
| Accumulated
other
comprehensive (loss) income,
net of tax |
| Treasury stock |
| Preferred stock |
| Common stock |
| Additional paid-in capital |
| Retained earnings |
| Accumulated
other
comprehensive (loss) income,
net of tax |
| Treasury stock |
|
| Balance at Dec. 31, 2016 | $ | 3,542 |
| $ | 13 |
| $ | 25,962 |
| $ | 22,621 |
| $ | (3,765 | ) | $ | (9,562 | ) | $ | 618 |
| $ | 39,429 |
| (a) | $ | 151 |
| |
| Balance at Dec. 31, 2017 | | $ | 3,542 |
| $ | 14 |
| $ | 26,665 |
| $ | 25,635 |
| $ | (2,357 | ) | $ | (12,248 | ) | $ | 316 |
| $ | 41,567 |
| (a) | $ | 179 |
|
| Adjustment for the cumulative effect of applying ASU 2014-09 for contract revenue | | — |
| — |
| — |
| (55 | ) | — |
| — |
| — |
| (55 | ) | | — |
|
| Adjustment for the cumulative effect of applying ASU 2017-12 for derivatives and hedging | | — |
| — |
| — |
| 27 |
| (2 | ) | — |
| — |
| 25 |
| | — |
|
| Adjusted balance at Jan. 1, 2018 | | 3,542 |
| 14 |
| 26,665 |
| 25,607 |
| (2,359 | ) | (12,248 | ) | 316 |
| 41,537 |
| | 179 |
|
| Shares issued to shareholders of noncontrolling interests | — |
| — |
| — |
| — |
| — |
| — |
| — |
| — |
| | 40 |
| — |
| — |
| — |
| — |
| — |
| — |
| — |
| — |
| | 17 |
|
| Redemption of subsidiary shares from noncontrolling interests | — |
| — |
| — |
| — |
| — |
| — |
| — |
| — |
| | (16 | ) | — |
| — |
| — |
| — |
| — |
| — |
| — |
| — |
| | (32 | ) |
| Other net changes in noncontrolling interests | — |
| — |
| (11 | ) | — |
| — |
| — |
| (258 | ) | (269 | ) | | 15 |
| — |
| — |
| (11 | ) | — |
| — |
| — |
| (93 | ) | (104 | ) | | 13 |
|
| Net income (loss) | — |
| — |
| — |
| 2,915 |
| — |
| — |
| 24 |
| 2,939 |
| | (6 | ) | — |
| — |
| — |
| 1,171 |
| — |
| — |
| (11 | ) | 1,160 |
| | 2 |
|
| Other comprehensive income | — |
| — |
| — |
| — |
| 984 |
| — |
| — |
| 984 |
| | 13 |
| — |
| — |
| — |
| — |
| 16 |
| — |
| — |
| 16 |
| | 5 |
|
| Dividends: | | | | | | |
Common stock at $0.62 per
share | — |
| — |
| — |
| (653 | ) | — |
| — |
| — |
| (653 | ) | | — |
| |
Common stock at $0.24 per
share | | — |
| — |
| — |
| (246 | ) | — |
| — |
| — |
| (246 | ) | | — |
|
| Preferred stock | — |
| — |
| — |
| (126 | ) | — |
| — |
| — |
| (126 | ) | | — |
| — |
| — |
| — |
| (36 | ) | — |
| — |
| — |
| (36 | ) | | — |
|
| Repurchase of common stock | — |
| — |
| — |
| — |
| — |
| (2,035 | ) | — |
| (2,035 | ) | | — |
| — |
| — |
| — |
| — |
| — |
| (644 | ) | — |
| (644 | ) | | — |
|
| Common stock issued under: | | | | | | |
| Employee benefit plans | — |
| — |
| 21 |
| — |
| — |
| — |
| — |
| 21 |
| | — |
| — |
| — |
| 10 |
| — |
| — |
| — |
| — |
| 10 |
| | — |
|
| Direct stock purchase and dividend reinvestment plan | — |
| — |
| 18 |
| — |
| — |
| — |
| — |
| 18 |
| | — |
| — |
| — |
| 9 |
| — |
| — |
| — |
| — |
| 9 |
| | — |
|
| Stock awards and options exercised | — |
| 1 |
| 598 |
| — |
| — |
| — |
| — |
| 599 |
| | — |
| — |
| — |
| 238 |
| — |
| — |
| — |
| — |
| 238 |
| | — |
|
| Balance at Sept. 30, 2017 | $ | 3,542 |
| $ | 14 |
| $ | 26,588 |
| $ | 24,757 |
| $ | (2,781 | ) | $ | (11,597 | ) | $ | 384 |
| $ | 40,907 |
| (a) | $ | 197 |
| |
| Balance at March 31, 2018 | | $ | 3,542 |
| $ | 14 |
| $ | 26,911 |
| $ | 26,496 |
| $ | (2,343 | ) | $ | (12,892 | ) | $ | 212 |
| $ | 41,940 |
| (a) | $ | 184 |
|
| |
| (a) | Includes total The Bank of New York Mellon Corporation common shareholders’ equity of $35,269$37,709 million at Dec. 31, 20162017 and $36,981$38,186 million at Sept. 30, 2017.March 31, 2018. |
See accompanying Notes to Consolidated Financial Statements.
|
|
| Notes to Consolidated Financial Statements |
| |
Note 1 - 1–Basis of presentation
Basis of presentation
The accounting and financial reporting policies of BNY Mellon, a global financial services company, conform to U.S. generally accepted accounting principles (“GAAP”) and prevailing industry practices.
The accompanying consolidated financial statements are unaudited. In the opinion of management, all adjustments necessary for a fair presentation of financial position, results of operations and cash flows for the periods presented have been made. These financial statements should be read in conjunction with BNY Mellon’s Annual Report on Form 10-K for the year ended Dec. 31, 2016.2017. Certain immaterial reclassifications have been made to prior periods to place them on a basis comparable with current period presentation.
Use of estimates
The preparation of financial statements in conformity with U.S. GAAP requires management to make estimates based upon assumptions about future economic and market conditions which affect reported amounts and related disclosures in our financial statements. Although our current estimates contemplate current conditions and how we expect them to change in the future, it is reasonably possible that actual conditions could be worse than anticipated in those estimates, which could materially affect our results of operations and financial condition. Amounts subject to estimates are items such as the allowance for loan losses and lending-related commitments, the fair value of financial instruments and derivatives, other-than-temporary impairment, goodwill and other intangibles and pension accounting. Among other effects, such changes in estimates could result in future impairments of investment securities, goodwill and intangible assets and establishment of allowances for loan losses and lending-related commitments as well as changes in pension and post-retirement expense.
Note 2 - 2–Accounting changechanges and new accounting guidance
ASU 2017-04, Simplifying the Test for Goodwill Impairment
In January 2017, the FASB issued ASU 2017-04, Simplifying the Test for Goodwill Impairment. This ASU simplifies the annual goodwill impairment test by eliminating Step 2. The Step 2 calculation estimated the implied goodwill using the fair values of all assets, including previously unrecorded intangibles,following accounting changes and liabilities at the date of the test. Step 2 was required if the first step of the annual test indicated that the fair value of a reporting unit is less than its carrying value. After adopting this ASU, the amount of any goodwill impairment will be determined by the excess of the carrying value of a reporting unit over its fair value. The Company earlynew accounting guidance were adopted this ASU in the second quarter of 2017, in conjunction with its annual goodwill impairment test. The annual test did not result in any impairment.
ASU 2016-09, Compensation – Stock Compensation
In March 2016, the FASB issued ASU 2016-09, Compensation – Stock Compensation. This ASU simplifies several aspects of the accounting for share-based payment transactions, including income tax consequences, recognition of forfeitures and classification on the statement of cash flows. The Company adopted this ASU effective Jan. 1, 2017.
For the first nine months of 2017, we recorded an income tax benefit of $45 million related to the vesting of stock awards and option exercises in the provision for income taxes. Previously, this had been recorded directly to additional paid-in capital. The impact in future periods will vary depending on the number of restricted stock units vesting (which primarily occurs in the first quarter of each year), the number of stock options exercised and the change in value since the grant date.2018.
We continueASU 2017-12, Derivatives and Hedging: Targeted Improvements to apply ourAccounting for Hedging Activities
In August 2017, the FASB issued an ASU, Derivatives and Hedging: Targeted Improvements to Accounting for Hedging Activities. The objective of this ASU is to improve the financial reporting of hedging relationships to better portray the economic results of an entity’s risk management activities and to simplify the application of hedge accounting policy electionguidance.
The most significant impact of the new guidance to the Company relates to the new accounting alternatives for estimating forfeitures. Additionally, beginning infair value hedges of interest rate risk, specifically, the quarter ended March 31, 2017, we report excess tax benefits relatedability to stock-based compensation as operating activities onhedge only the statementbenchmark component of the contractual cash flows and partial-term hedging. The guidance also changed presentation and disclosure requirements and made changes to how the employee taxes paid will continue to be reported as financing activities.shortcut method is applied, which may result in the Company using that method going forward for certain hedging relationships.
BNY Mellon elected to early adopt this ASU on Jan. 31, 2018, which is the “as of” date for which the Company was permitted to make certain elections and the measurement date for recording the adoption impact for certain hedge modifications. As part of the adoption, we elected to reclassify approximately $1.1 billion of debt securities from held-to-maturity to available-for-sale which resulted in a decrease of $47 million pre-tax to accumulated other comprehensive income. The Company also elected to modify certain hedge relationships as of the adoption date primarily to utilize the benchmark component method of measuring hedge effectiveness, as such method is deemed to more closely match risk management objectives with accounting results. The Company recognized a $27 million after-tax increase in retained earnings as of Jan. 1, 2018 associated with the adoption impact of these hedge modifications.
|
|
Notes to Consolidated Financial Statements(continued) |
|
ASU 2017-07, Compensation-Retirement Benefits - Improving the Presentation of Net Periodic Pension Cost and Net Periodic Postretirement Benefit Cost
In March 2017, the FASB issued an ASU, Compensation-Retirement Benefits - Improving the Presentation of Net Periodic Pension Cost and Net Periodic Postretirement Benefit Cost. The ASU requires the disaggregation of the service cost component from the other components of the net benefit cost in the income statement. The ASU also permits only the service cost component of net benefit cost to be eligible for capitalization. BNY Mellon adopted this ASU in the first quarter of 2018, and applied the guidance retrospectively for the presentation of the service cost component and the other components in the income statement, and prospectively for the capitalization of the service cost component in assets. The adoption of this standard increased staff expense and decreased other expense by $14 million for the fourth quarter of 2017 and $16 million for the first quarter of 2017.
ASU 2016-18, Statement of Cash Flows – Restricted Cash
In November 2016, the FASB issued an ASU, Statement of Cash Flows – Restricted Cash. This ASU provides guidance on the presentation of restricted cash or restricted cash equivalents in the statement of cash flows. Restricted cash consists of excess client funds held by our broker-dealer business and totaled $1.2 billion at March 31, 2018 and $2.9 billion at March 31, 2017. Restricted cash is included in interest-bearing deposits with banks on the consolidated balance sheet and with cash and due from banks when reconciling the beginning and end-of-period balances on the consolidated cash flow statement.
We adopted the guidance in this ASU retrospectively. As a result, the change in interest-bearing deposits with banks, which is included in investing activities on the consolidated statement of cash flows, was restated to reflect the decrease in restricted cash of $477 million for the three months ended March 31, 2017. The change in restricted cash was a $515 million decrease for the three months ended March 31, 2018.
ASU 2016-15, Statement of Cash Flows – Classification of Certain Cash Receipts and Cash Payments
In August 2016, the FASB issued an ASU, Statement of Cash Flows – Classification of Certain Cash Receipts and Cash Payments. This ASU provides guidance on eight specific cash flow presentation issues. The most significant impact for BNY Mellon relates to distributions received from equity method investees. For equity method investments, BNY Mellon elected to report distributions received from equity method investees using the cumulative earnings approach. Distributions received are considered returns on investment and classified as cash inflows from operating activities on the consolidated cash flows statement. To the extent the returns on investment exceeded the cumulative equity in earnings recognized; the excess would be considered a return of investment and classified as cash inflows from investing activities on the consolidated cash flows statement. We adopted the guidance in this ASU retrospectively. As a result, the change in accruals and other, net which is included in operating activities on the consolidated cash flows statement, was restated to reflect distributions received of $9 million for the three months ended March 31, 2017. These distributions were previously included in other, net in investing activities on the consolidated cash flows statement. Distributions received for the three months ended March 31, 2018 were $9 million. The remaining seven specific cash flow presentation issues do not materially impact BNY Mellon.
ASU 2014-09, Revenue from Contracts with Customers
In May 2014, the FASB issued ASU 2014-09, Revenue from Contracts with Customers. This ASU, as amended, provides guidance on the recognition of revenue related to the transfer of promised goods or services to customers and guidance on accounting for certain contract costs. The standard provides a single revenue model to be applied by reporting companies under U.S. GAAP and supersedes most existing revenue recognition guidance.
The Company adopted the guidance on Jan. 1, 2018 using the cumulative effect transition method applied to contracts not completed as of Dec. 31, 2017, which resulted in a $55 million after-tax reduction to retained earnings. The comparative financial
|
|
Notes to Consolidated Financial Statements(continued) |
|
information for 2017 has not been restated and continues to be reported under the accounting standards in effect for that period.
Although the impact of the adoption of this ASU was not material, the most significant changes and quantitative impact of the changes are disclosed below.
Payments to customers
The timing of recognizing the reduction in revenue for certain payments made to depositary receipts customers has changed. Prior to adoption, annual payments to customers were capitalized and amortized as contra revenue over the remaining contract period, subject to impairment reviews.
Under the new guidance, annual payments are recorded as a reduction in revenue in proportion to the expected annual revenue generated from the related customer contract.
Costs to obtain a customer contract
Prior to adoption, costs to obtain a customer contract, primarily sales incentives, were expensed as incurred. Under the new guidance, an asset is recognized for the incremental sales incentives that are considered costs of obtaining a contract with a customer, if those costs are expected to be recovered.
The table below presents the cumulative effect of the adoption of the new guidance on the consolidated balance sheet as of Dec. 31, 2017.
|
| | | | | | | | | |
| Impact to the consolidated balance sheet | |
| | Dec. 31, 2017 |
| Impact of adoption |
| Jan. 1, 2018 |
|
| (in millions) |
| Assets | | | |
| Other assets | $ | 23,029 |
| $ | (9 | ) | $ | 23,020 |
|
| | | | |
| Liabilities | | | |
| Accrued tax and other expenses | $ | 6,225 |
| $ | (18 | ) | $ | 6,207 |
|
| Other liabilities | 6,050 |
| 64 |
| 6,114 |
|
| | | | |
| Equity | | | |
| Retained earnings | $ | 25,635 |
| $ | (55 | ) | $ | 25,580 |
|
The impact of the new guidance on the consolidated income statement for the first quarter of 2018 and consolidated balance sheet as of March 31, 2018 was
de minimis. See Note 8 for additional revenue and contract costs disclosures.
ASU 2016-01, Recognition and Measurement of Financial Assets and Financial Liabilities
In January 2016, the FASB issued ASU 2016-01, Recognition and Measurement of Financial Assets and Financial Liabilities. The ASU requires investments in equity securities that do not result in consolidation and are not accounted for under the equity method to be measured at fair value with changes in the fair value recognized through net income, unless one of two available exceptions apply. The first exception, a scope exception, allows Federal Reserve Bank stock, FHLB stock and exchange memberships to remain accounted for at cost, less impairment. The second practicability exception is an election available for equity investments that do not have readily determinable fair values. For certain investments where the Company has chosen the practicability exception, such investments are accounted for at cost adjusted for impairment, if any, plus or minus observable price changes.
The Company adopted this guidance in the first quarter of 2018 using the cumulative effect method of adoption, with a de minimis impact to retained earnings. As part of the adoption, we reclassified money market fund investments of approximately $1 billion to trading assets, primarily from available-for-sale securities.
As of March 31, 2018, we have $47 million of non-readily marketable equity securities, where we are utilizing the practicability exception, and carrying such investments at cost, plus or minus observed changes in fair value. The upward adjustments recognized on these equity securities were $20 million in the first quarter of 2018 resulting from activity that resulted in observable price changes.
We also have equity securities carried at fair value at March 31, 2018. The net gain recognized in the first quarter of 2018 was $2 million, comprised of $9 million of realized gains on equity securities sold in the first quarter of 2018 and $7 million on unrealized losses recognized on equity securities held at March 31, 2018.
|
|
Notes to Consolidated Financial Statements (continued) |
| |
Note 3 - 3–Acquisitions and dispositions
We sometimes structure our acquisitions with both an initial payment and later contingent payments tied to post-closing revenue or income growth. ContingentThere were no contingent payments totaled $2 million in the thirdfirst quarter of 2017 and the first nine months of 2017.2018.
At Sept. 30, 2017,March 31, 2018, we are potentially obligated to pay additional consideration which, using reasonable assumptions, could range from $0 million to $16 million over the next two yearstwelve months, but could be higher as certain of the arrangements do not contain a contractual maximum. The acquisitiondisposition described below did not have a material impact on BNY Mellon’s results of operations.
AcquisitionDisposition in 20162018
On April 1, 2016,Jan 2, 2018, BNY Mellon acquiredcompleted the assetssale of Atherton Lane Advisers, LLC,CenterSquare, one of our Investment Management boutiques, and recorded a U.S.-based investment manager withsmall gain on this transaction. CenterSquare had approximately $2.45$10 billion in AUM in U.S. and servicer for approximately 700 high-net-worth clients, for cashglobal real estate and infrastructure investments. In addition, goodwill of $38$52 million plus contingent payments measured at $22 million. Goodwill related towas removed from the balance sheet as a result of this acquisition totaled $29 million and is included in the Investment Management business. The customer relationship intangible asset related to this acquisition is included in the Investment Management business, with an estimated life of 14 years, and totaled $30 million at acquisition.sale.
Note 4 - 4–Securities
The following tables present the amortized cost, the gross unrealized gains and losses and the fair value of securities at Sept. 30, 2017March 31, 2018 and Dec. 31, 2016.2017, respectively.
| | | Securities at Sept. 30, 2017 | Gross unrealized | | |
| Securities at March 31, 2018 | | Securities at March 31, 2018 | Gross unrealized | |
| | Amortized cost |
| Gross unrealized | Fair value |
| Amortized cost |
| Fair value |
|
| (in millions) | Gains |
| Losses |
|
| Available-for-sale: | | |
| U.S. Treasury | $ | 15,389 |
| $ | 236 |
| $ | 123 |
| $ | 15,502 |
| $ | 17,108 |
| $ | 120 |
| $ | 274 |
| $ | 16,954 |
|
| U.S. government agencies | 866 |
| 4 |
| 6 |
| 864 |
| 1,179 |
| — |
| 25 |
| 1,154 |
|
| State and political subdivisions | 3,091 |
| 57 |
| 24 |
| 3,124 |
| 2,739 |
| 22 |
| 35 |
| 2,726 |
|
| Agency RMBS | 24,546 |
| 135 |
| 250 |
| 24,431 |
| 24,351 |
| 95 |
| 410 |
| 24,036 |
|
Non-agency RMBS | 491 |
| 37 |
| 3 |
| 525 |
| 1,175 |
| 303 |
| 2 |
| 1,476 |
|
| Other RMBS | 270 |
| 3 |
| 8 |
| 265 |
| 149 |
| 3 |
| 6 |
| 146 |
|
| Commercial MBS | 960 |
| 9 |
| 4 |
| 965 |
| 1,391 |
| 2 |
| 20 |
| 1,373 |
|
| Agency commercial MBS | 9,026 |
| 41 |
| 57 |
| 9,010 |
| 9,659 |
| 14 |
| 161 |
| 9,512 |
|
| CLOs | 2,542 |
| 9 |
| 1 |
| 2,550 |
| 3,121 |
| 10 |
| 2 |
| 3,129 |
|
| Other asset-backed securities | 1,152 |
| 5 |
| — |
| 1,157 |
| 277 |
| 1 |
| — |
| 278 |
|
| Foreign covered bonds | 2,529 |
| 20 |
| 7 |
| 2,542 |
| 2,722 |
| 15 |
| 18 |
| 2,719 |
|
| Corporate bonds | 1,262 |
| 21 |
| 8 |
| 1,275 |
| 1,236 |
| 11 |
| 25 |
| 1,222 |
|
| Sovereign debt/sovereign guaranteed | 12,393 |
| 195 |
| 23 |
| 12,565 |
| 13,100 |
| 164 |
| 30 |
| 13,234 |
|
| Other debt securities | 3,149 |
| 12 |
| 10 |
| 3,151 |
| 3,890 |
| 5 |
| 24 |
| 3,871 |
|
| Equity securities | 2 |
| 2 |
| — |
| 4 |
| |
| Money market funds | 939 |
| — |
| — |
| 939 |
| |
Non-agency RMBS (a) | 885 |
| 304 |
| 4 |
| 1,185 |
| |
Total securities available-for-sale (b) | $ | 79,492 |
| $ | 1,090 |
| $ | 528 |
| $ | 80,054 |
| $ | 82,097 |
| $ | 765 |
| $ | 1,032 |
| $ | 81,830 |
|
| Held-to-maturity: | | |
| U.S. Treasury | $ | 9,867 |
| $ | 21 |
| $ | 29 |
| $ | 9,859 |
| $ | 6,598 |
| $ | 3 |
| $ | 102 |
| $ | 6,499 |
|
| U.S. government agencies | 1,614 |
| — |
| 6 |
| 1,608 |
| 1,503 |
| — |
| 17 |
| 1,486 |
|
| State and political subdivisions | 18 |
| — |
| 1 |
| 17 |
| 17 |
| — |
| 1 |
| 16 |
|
| Agency RMBS | 25,575 |
| 96 |
| 185 |
| 25,486 |
| 25,762 |
| 10 |
| 715 |
| 25,057 |
|
| Non-agency RMBS | 64 |
| 5 |
| — |
| 69 |
| 54 |
| 4 |
| — |
| 58 |
|
| Other RMBS | 65 |
| — |
| 1 |
| 64 |
| 65 |
| 2 |
| — |
| 67 |
|
| Commercial MBS | 6 |
| — |
| — |
| 6 |
| 5 |
| — |
| — |
| 5 |
|
| Agency commercial MBS | 1,118 |
| 5 |
| 5 |
| 1,118 |
| 1,327 |
| — |
| 34 |
| 1,293 |
|
| Foreign covered bonds | 83 |
| 1 |
| — |
| 84 |
| 86 |
| 1 |
| — |
| 87 |
|
| Sovereign debt/sovereign guaranteed | 1,558 |
| 32 |
| — |
| 1,590 |
| 1,513 |
| 25 |
| — |
| 1,538 |
|
| Other debt securities | 27 |
| — |
| — |
| 27 |
| 29 |
| — |
| — |
| 29 |
|
| Total securities held-to-maturity | $ | 39,995 |
| $ | 160 |
| $ | 227 |
| $ | 39,928 |
| $ | 36,959 |
| $ | 45 |
| $ | 869 |
| $ | 36,135 |
|
| Total securities | $ | 119,487 |
| $ | 1,250 |
| $ | 755 |
| $ | 119,982 |
| $ | 119,056 |
| $ | 810 |
| $ | 1,901 |
| $ | 117,965 |
|
| |
| (a) | PreviouslyIncludes $1,019 million that were included in the former Grantor Trust. The Grantor Trust was dissolved in 2011. |
| |
| (b) | Includes gross unrealized gains of $53$47 million and gross unrealized losses of $155$107 million recorded in accumulated other comprehensive income related to investment securities that were transferred from available-for-sale to held-to-maturity. The unrealized gains and losses are primarily related to Agency RMBS and will be amortized into net interest revenue over the contractual lives of the securities. |
|
|
Notes to Consolidated Financial Statements (continued) |
| |
| | | Securities at Dec. 31, 2016 | Gross
unrealized |
|
| |
| Securities at Dec. 31, 2017 | | Securities at Dec. 31, 2017 | Gross unrealized | |
| | Amortized cost |
| Gross
unrealized | Fair value |
| Amortized cost |
| Fair value |
|
| (in millions) | Gains |
| Losses |
|
| Available-for-sale: | | |
| U.S. Treasury | $ | 14,373 |
| $ | 115 |
| $ | 181 |
| $ | 14,307 |
| $ | 15,159 |
| $ | 264 |
| $ | 160 |
| $ | 15,263 |
|
| U.S. government agencies | 366 |
| 2 |
| 9 |
| 359 |
| 917 |
| 1 |
| 10 |
| 908 |
|
| State and political subdivisions | 3,392 |
| 38 |
| 52 |
| 3,378 |
| 2,949 |
| 31 |
| 23 |
| 2,957 |
|
| Agency RMBS | 22,929 |
| 148 |
| 341 |
| 22,736 |
| 24,002 |
| 108 |
| 291 |
| 23,819 |
|
Non-agency RMBS | 620 |
| 31 |
| 13 |
| 638 |
| 1,265 |
| 317 |
| 4 |
| 1,578 |
|
| Other RMBS | 517 |
| 4 |
| 8 |
| 513 |
| 152 |
| 3 |
| 6 |
| 149 |
|
| Commercial MBS | 931 |
| 8 |
| 11 |
| 928 |
| 1,360 |
| 6 |
| 6 |
| 1,360 |
|
| Agency commercial MBS | 6,505 |
| 28 |
| 84 |
| 6,449 |
| 8,793 |
| 36 |
| 67 |
| 8,762 |
|
| CLOs | 2,593 |
| 6 |
| 1 |
| 2,598 |
| 2,898 |
| 12 |
| 1 |
| 2,909 |
|
| Other asset-backed securities | 1,729 |
| 4 |
| 6 |
| 1,727 |
| 1,040 |
| 3 |
| — |
| 1,043 |
|
| Foreign covered bonds | 2,126 |
| 24 |
| 9 |
| 2,141 |
| 2,520 |
| 18 |
| 9 |
| 2,529 |
|
| Corporate bonds | 1,391 |
| 22 |
| 17 |
| 1,396 |
| 1,249 |
| 17 |
| 11 |
| 1,255 |
|
| Sovereign debt/sovereign guaranteed | 12,248 |
| 261 |
| 20 |
| 12,489 |
| 12,405 |
| 175 |
| 23 |
| 12,557 |
|
| Other debt securities | 1,952 |
| 19 |
| 10 |
| 1,961 |
| 3,494 |
| 9 |
| 12 |
| 3,491 |
|
| Equity securities | 2 |
| 1 |
| — |
| 3 |
| |
| Money market funds | 842 |
| — |
| — |
| 842 |
| 963 |
| — |
| — |
| 963 |
|
Non-agency RMBS (a) | 1,080 |
| 286 |
| 9 |
| 1,357 |
| |
Total securities available-for-sale (b) | $ | 73,596 |
| $ | 997 |
| $ | 771 |
| $ | 73,822 |
| $ | 79,166 |
| $ | 1,000 |
| $ | 623 |
| $ | 79,543 |
|
| Held-to-maturity: | | |
| U.S. Treasury | $ | 11,117 |
| $ | 22 |
| $ | 41 |
| $ | 11,098 |
| $ | 9,792 |
| $ | 6 |
| $ | 56 |
| $ | 9,742 |
|
| U.S. government agencies | 1,589 |
| — |
| 6 |
| 1,583 |
| 1,653 |
| — |
| 12 |
| 1,641 |
|
| State and political subdivisions | 19 |
| — |
| 1 |
| 18 |
| 17 |
| — |
| 1 |
| 16 |
|
| Agency RMBS | 25,221 |
| 57 |
| 299 |
| 24,979 |
| 26,208 |
| 51 |
| 332 |
| 25,927 |
|
| Non-agency RMBS | 78 |
| 4 |
| 2 |
| 80 |
| 57 |
| 5 |
| — |
| 62 |
|
| Other RMBS | 142 |
| — |
| 4 |
| 138 |
| 65 |
| — |
| 1 |
| 64 |
|
| Commercial MBS | 7 |
| — |
| — |
| 7 |
| 6 |
| — |
| — |
| 6 |
|
| Agency commercial MBS | 721 |
| 1 |
| 10 |
| 712 |
| 1,324 |
| 2 |
| 9 |
| 1,317 |
|
| Foreign covered bonds | 74 |
| 1 |
| — |
| 75 |
| 84 |
| 2 |
| — |
| 86 |
|
| Sovereign debt/sovereign guaranteed | 1,911 |
| 42 |
| — |
| 1,953 |
| 1,593 |
| 30 |
| — |
| 1,623 |
|
| Other debt securities | 26 |
| — |
| — |
| 26 |
| 28 |
| — |
| — |
| 28 |
|
| Total securities held-to-maturity | $ | 40,905 |
| $ | 127 |
| $ | 363 |
| $ | 40,669 |
| $ | 40,827 |
| $ | 96 |
| $ | 411 |
| $ | 40,512 |
|
| Total securities | $ | 114,501 |
| $ | 1,124 |
| $ | 1,134 |
| $ | 114,491 |
| $ | 119,993 |
| $ | 1,096 |
| $ | 1,034 |
| $ | 120,055 |
|
| |
| (a) | PreviouslyIncludes $1,091 million that were included in the former Grantor Trust. The Grantor Trust was dissolved in 2011. |
| |
| (b) | Includes gross unrealized gains of $62$50 million and gross unrealized losses of $190$144 million recorded in accumulated other comprehensive income related to investment securities that were transferred from available-for-sale to held-to-maturity. The unrealized gains and losses are primarily related to Agency RMBS and will be amortized into net interest revenue over the contractual lives of the securities. |
The following table presents the gross securitiesrealized gains, losses and impairments.impairments, on a gross basis.
| | | Net securities gains (losses) | | |
| Net securities (losses) gains | | |
| (in millions) | 3Q17 |
| 2Q17 |
| 3Q16 |
| YTD17 |
| YTD16 |
| 1Q18 |
| 4Q17 |
| 1Q17 |
|
| Realized gross gains | $ | 20 |
| $ | 3 |
| $ | 26 |
| $ | 34 |
| $ | 71 |
| $ | 2 |
| $ | 13 |
| $ | 11 |
|
| Realized gross losses | — |
| (2 | ) | (1 | ) | (2 | ) | (1 | ) | (51 | ) | (38 | ) | — |
|
| Recognized gross impairments | (1 | ) | (1 | ) | (1 | ) | (3 | ) | (5 | ) | — |
| (1 | ) | (1 | ) |
| Total net securities gains | $ | 19 |
| $ | — |
| $ | 24 |
| $ | 29 |
| $ | 65 |
| |
| Total net securities (losses) gains | | $ | (49 | ) | $ | (26 | ) | $ | 10 |
|
In September 2017, other residential mortgage-backedthe first quarter of 2018, we adopted the new accounting guidance included in ASU 2016-01, Recognition and Measurement of Financial Assets and Financial Liabilities. As a result, money market fund investments were reclassified to trading assets, primarily from available-for-sale securities.
In the first quarter of 2018, certain debt securities with an aggregate amortized cost of $74$1,117 million and fair value of $76$1,070 million were transferred from held-to-maturity securities to available-for-sale securities. Duesecurities as part of the adoption of ASU 2017-12, Derivatives and Hedging: Targeted Improvements to recent ratings downgrades, the Company no longer intends to hold these securities to maturity.Accounting for Hedging Activities.
Temporarily impaired securities
At Sept. 30, 2017,March 31, 2018, the unrealized losses on the investment securities portfolio were primarily attributable to an increase in interest rates from date of purchase, and for certain securities that were transferred from available-for-sale to held-to-maturity, an increase in interest rates through the date they were transferred. Specifically, $155$107 million of the unrealized losses at Sept. 30, 2017March 31, 2018 and $190$144 million at Dec. 31, 20162017 reflected in the available-for-sale sections of the tables below relate to certain securities (primarily Agency RMBS) that were transferred in prior periods from available-for-sale to held-to-maturity. The unrealized losses will be amortized into net interest revenue over the contractual lives of the securities. The transfer created a new cost basis for the securities. As a result, if these securities have experienced unrealized losses since the date of transfer, the corresponding fair value and unrealized losses would be reflected in the held-to-maturity sections of the following tables. We do not intend to sell these securities and it is not more likely than not that we will have to sell these securities.
|
|
Notes to Consolidated Financial Statements (continued) |
| |
The following tables show the aggregate related fair value of investments with a continuous unrealized loss position for less than 12 months and those that have been in a continuous unrealized loss position for 12 months or more at Sept. 30, 2017March 31, 2018 and Dec. 31, 2016.2017, respectively.
| | | Temporarily impaired securities at Sept. 30, 2017 | Less than 12 months | | 12 months or more | | Total | |
| Temporarily impaired securities at March 31, 2018 | | Less than 12 months | | 12 months or more | | Total |
| Fair value |
| Unrealized losses |
| | Fair value |
| Unrealized losses |
| | Fair value |
| Unrealized losses |
|
| (in millions) | Fair
value |
| Unrealized
losses |
| | Fair
value |
| Unrealized
losses |
| | Fair
value |
| Unrealized
losses |
| |
| Available-for-sale: | | | | | | | | | | |
| U.S. Treasury | $ | 7,900 |
| $ | 111 |
| | $ | 495 |
| $ | 12 |
| | $ | 8,395 |
| $ | 123 |
| $ | 9,344 |
| $ | 149 |
| | $ | 2,686 |
| $ | 125 |
| | $ | 12,030 |
| $ | 274 |
|
| U.S. government agencies | 399 |
| 6 |
| | — |
| — |
| | 399 |
| 6 |
| 924 |
| 20 |
| | 120 |
| 5 |
| | 1,044 |
| 25 |
|
| State and political subdivisions | 310 |
| 4 |
| | 384 |
| 20 |
| | 694 |
| 24 |
| 740 |
| 7 |
| | 475 |
| 28 |
| | 1,215 |
| 35 |
|
| Agency RMBS | 8,935 |
| 72 |
| | 4,145 |
| 178 |
| | 13,080 |
| 250 |
| 10,067 |
| 175 |
| | 5,470 |
| 235 |
| | 15,537 |
| 410 |
|
| Non-agency RMBS | 5 |
| — |
| | 156 |
| 3 |
| | 161 |
| 3 |
| |
Non-agency RMBS (a) | | 20 |
| — |
| | 134 |
| 2 |
| | 154 |
| 2 |
|
| Other RMBS | 72 |
| 4 |
| | 83 |
| 4 |
| | 155 |
| 8 |
| 71 |
| 3 |
| | 37 |
| 3 |
| | 108 |
| 6 |
|
| Commercial MBS | 193 |
| 2 |
| | 92 |
| 2 |
| | 285 |
| 4 |
| 655 |
| 15 |
| | 120 |
| 5 |
| | 775 |
| 20 |
|
| Agency commercial MBS | 3,610 |
| 47 |
| | 561 |
| 10 |
| | 4,171 |
| 57 |
| 5,107 |
| 105 |
| | 1,269 |
| 56 |
| | 6,376 |
| 161 |
|
| CLOs | 449 |
| 1 |
| | — |
| — |
| | 449 |
| 1 |
| 375 |
| 2 |
| | 45 |
| — |
| | 420 |
| 2 |
|
| Foreign covered bonds | 1,017 |
| 7 |
| | 28 |
| — |
| | 1,045 |
| 7 |
| 1,261 |
| 15 |
| | 136 |
| 3 |
| | 1,397 |
| 18 |
|
| Corporate bonds | 306 |
| 3 |
| | 144 |
| 5 |
| | 450 |
| 8 |
| 753 |
| 23 |
| | 49 |
| 2 |
| | 802 |
| 25 |
|
| Sovereign debt/sovereign guaranteed | 2,263 |
| 20 |
| | 137 |
| 3 |
| | 2,400 |
| 23 |
| 2,322 |
| 22 |
| | 403 |
| 8 |
| | 2,725 |
| 30 |
|
| Other debt securities | 1,347 |
| 9 |
| | 84 |
| 1 |
| | 1,431 |
| 10 |
| 2,051 |
| 18 |
| | 259 |
| 6 |
| | 2,310 |
| 24 |
|
Non-agency RMBS (a) | 8 |
| 2 |
| | 13 |
| 2 |
| | 21 |
| 4 |
| |
Total securities available-for-sale (b) | $ | 26,814 |
| $ | 288 |
| | $ | 6,322 |
| $ | 240 |
| | $ | 33,136 |
| $ | 528 |
| $ | 33,690 |
| $ | 554 |
| | $ | 11,203 |
| $ | 478 |
| | $ | 44,893 |
| $ | 1,032 |
|
| Held-to-maturity: | | | | | | | | | | |
| U.S. Treasury | $ | 7,281 |
| $ | 29 |
| | $ | — |
| $ | — |
| | $ | 7,281 |
| $ | 29 |
| $ | 3,629 |
| $ | 66 |
| | $ | 2,587 |
| $ | 36 |
| | $ | 6,216 |
| $ | 102 |
|
| U.S. government agencies | 1,459 |
| 5 |
| | 99 |
| 1 |
| | 1,558 |
| 6 |
| 556 |
| 9 |
| | 930 |
| 8 |
| | 1,486 |
| 17 |
|
| State and political subdivisions | — |
| — |
| | 4 |
| 1 |
| | 4 |
| 1 |
| — |
| — |
| | 4 |
| 1 |
| | 4 |
| 1 |
|
| Agency RMBS | 17,125 |
| 172 |
| | 847 |
| 13 |
| | 17,972 |
| 185 |
| 15,166 |
| 352 |
| | 9,201 |
| 363 |
| | 24,367 |
| 715 |
|
| Other RMBS | 15 |
| — |
| | 35 |
| 1 |
| | 50 |
| 1 |
| |
| Agency commercial MBS | 557 |
| 5 |
| | — |
| — |
| | 557 |
| 5 |
| 1,206 |
| 30 |
| | 58 |
| 4 |
| | 1,264 |
| 34 |
|
| Total securities held-to-maturity | $ | 26,437 |
| $ | 211 |
| | $ | 985 |
| $ | 16 |
| | $ | 27,422 |
| $ | 227 |
| $ | 20,557 |
| $ | 457 |
| | $ | 12,780 |
| $ | 412 |
| | $ | 33,337 |
| $ | 869 |
|
| Total temporarily impaired securities | $ | 53,251 |
| $ | 499 |
| | $ | 7,307 |
| $ | 256 |
| | $ | 60,558 |
| $ | 755 |
| $ | 54,247 |
| $ | 1,011 |
| | $ | 23,983 |
| $ | 890 |
| | $ | 78,230 |
| $ | 1,901 |
|
| |
| (a) | PreviouslyIncludes $11 million with an unrealized loss of less than $1 million for less than 12 months and $9 million with an unrealized loss for 12 months or more of less than $1 million that were included in the former Grantor Trust. The Grantor Trust was dissolved in 2011. |
| |
| (b) | GrossIncludes gross unrealized losses for 12 months or more of $155$107 million were recorded in accumulated other comprehensive income and related to investment securities that were transferred from available-for-sale to held-to-maturity. The unrealized losses are primarily related to Agency RMBS and will be amortized into net interest revenue over the contractual lives of the securities. There were no gross unrealized losses for less than 12 months. |
|
|
Notes to Consolidated Financial Statements (continued) |
| |
| | | Temporarily impaired securities at Dec. 31, 2016 | Less than 12 months | | 12 months or more | | Total | |
| Temporarily impaired securities at Dec. 31, 2017 | | Less than 12 months | | 12 months or more | | Total |
| (in millions) | Fair value |
| Unrealized losses |
| | Fair value |
| Unrealized losses |
| | Fair value |
| Unrealized losses |
| Fair value |
| Unrealized losses |
| | Fair value |
| Unrealized losses |
| | Fair value |
| Unrealized losses |
|
| Available-for-sale: | | | | | | | | | | |
| U.S. Treasury | $ | 8,489 |
| $ | 181 |
| | $ | — |
| $ | — |
| | $ | 8,489 |
| $ | 181 |
| $ | 7,429 |
| $ | 131 |
| | $ | 2,175 |
| $ | 29 |
| | $ | 9,604 |
| $ | 160 |
|
| U.S. government agencies | 257 |
| 9 |
| | — |
| — |
| | 257 |
| 9 |
| 588 |
| 6 |
| | 160 |
| 4 |
| | 748 |
| 10 |
|
| State and political subdivisions | 1,058 |
| 33 |
| | 131 |
| 19 |
| | 1,189 |
| 52 |
| 732 |
| 3 |
| | 518 |
| 20 |
| | 1,250 |
| 23 |
|
| Agency RMBS | 14,766 |
| 141 |
| | 1,673 |
| 200 |
| | 16,439 |
| 341 |
| 8,567 |
| 66 |
| | 5,834 |
| 225 |
| | 14,401 |
| 291 |
|
Non-agency RMBS | 21 |
| — |
| | 332 |
| 13 |
| | 353 |
| 13 |
| 20 |
| — |
| | 149 |
| 4 |
| | 169 |
| 4 |
|
| Other RMBS | 26 |
| — |
| | 136 |
| 8 |
| | 162 |
| 8 |
| 71 |
| 4 |
| | 45 |
| 2 |
| | 116 |
| 6 |
|
| Commercial MBS | 302 |
| 7 |
| | 163 |
| 4 |
| | 465 |
| 11 |
| 476 |
| 3 |
| | 122 |
| 3 |
| | 598 |
| 6 |
|
| Agency commercial MBS | 3,570 |
| 78 |
| | 589 |
| 6 |
| | 4,159 |
| 84 |
| 3,077 |
| 28 |
| | 1,332 |
| 39 |
| | 4,409 |
| 67 |
|
| CLOs | 443 |
| 1 |
| | 404 |
| — |
| | 847 |
| 1 |
| 260 |
| 1 |
| | — |
| — |
| | 260 |
| 1 |
|
| Other asset-backed securities | 276 |
| 1 |
| | 357 |
| 5 |
| | 633 |
| 6 |
| |
| Foreign covered bonds | 712 |
| 9 |
| | — |
| — |
| | 712 |
| 9 |
| 953 |
| 7 |
| | 116 |
| 2 |
| | 1,069 |
| 9 |
|
| Corporate bonds | 594 |
| 16 |
| | 7 |
| 1 |
| | 601 |
| 17 |
| 274 |
| 2 |
| | 288 |
| 9 |
| | 562 |
| 11 |
|
| Sovereign debt/sovereign guaranteed | 1,521 |
| 20 |
| | 63 |
| — |
| | 1,584 |
| 20 |
| 1,880 |
| 12 |
| | 559 |
| 11 |
| | 2,439 |
| 23 |
|
| Other debt securities | 742 |
| 10 |
| | 50 |
| — |
| | 792 |
| 10 |
| 1,855 |
| 7 |
| | 368 |
| 5 |
| | 2,223 |
| 12 |
|
Non-agency RMBS (a) | 25 |
| — |
| | 47 |
| 9 |
| | 72 |
| 9 |
| |
Total securities available-for-sale (b) | $ | 32,802 |
| $ | 506 |
|
| $ | 3,952 |
| $ | 265 |
|
| $ | 36,754 |
| $ | 771 |
| $ | 26,182 |
| $ | 270 |
| | $ | 11,666 |
| $ | 353 |
| | $ | 37,848 |
| $ | 623 |
|
| Held-to-maturity: | | | | | | | | | | |
| U.S. Treasury | $ | 6,112 |
| $ | 41 |
| | $ | — |
| $ | — |
| | $ | 6,112 |
| $ | 41 |
| $ | 6,389 |
| $ | 41 |
| | $ | 2,909 |
| $ | 15 |
| | $ | 9,298 |
| $ | 56 |
|
| U.S. government agencies | 1,533 |
| 6 |
| | — |
| — |
| | 1,533 |
| 6 |
| 791 |
| 4 |
| | 850 |
| 8 |
| | 1,641 |
| 12 |
|
| State and political subdivisions | — |
| — |
| | 4 |
| 1 |
| | 4 |
| 1 |
| — |
| — |
| | 4 |
| 1 |
| | 4 |
| 1 |
|
| Agency RMBS | 19,498 |
| 297 |
| | 102 |
| 2 |
| | 19,600 |
| 299 |
| 9,458 |
| 81 |
| | 12,305 |
| 251 |
| | 21,763 |
| 332 |
|
| Non-agency RMBS | 4 |
| — |
| | 48 |
| 2 |
| | 52 |
| 2 |
| |
| Other RMBS | 15 |
| — |
| | 123 |
| 4 |
| | 138 |
| 4 |
| — |
| — |
| | 50 |
| 1 |
| | 50 |
| 1 |
|
| Agency commercial MBS | 621 |
| 10 |
| | — |
| — |
| | 621 |
| 10 |
| 737 |
| 7 |
| | 60 |
| 2 |
| | 797 |
| 9 |
|
| Total securities held-to-maturity | $ | 27,783 |
| $ | 354 |
|
| $ | 277 |
| $ | 9 |
|
| $ | 28,060 |
| $ | 363 |
| $ | 17,375 |
| $ | 133 |
| | $ | 16,178 |
| $ | 278 |
| | $ | 33,553 |
| $ | 411 |
|
| Total temporarily impaired securities | $ | 60,585 |
| $ | 860 |
|
| $ | 4,229 |
| $ | 274 |
|
| $ | 64,814 |
| $ | 1,134 |
| $ | 43,557 |
| $ | 403 |
| | $ | 27,844 |
| $ | 631 |
| | $ | 71,401 |
| $ | 1,034 |
|
| |
| (a) | PreviouslyIncludes $7 million with an unrealized loss of less than $1 million for less than 12 months and $12 million with an unrealized loss of $1 million for 12 months or more that were included in the former Grantor Trust. The Grantor Trust was dissolved in 2011. |
| |
| (b) | Includes gross unrealized losses for 12 months or more of $190$144 million recorded in accumulated other comprehensive income related to investment securities that were transferred from available-for-sale to held-to-maturity. The unrealized losses are primarily related to Agency RMBS and will be amortized into net interest revenue over the contractual lives of the securities. There were no gross unrealized losses for less than 12 months. |
The following table shows the maturity distribution by carrying amount and yield (on a tax equivalent basis) of our investment securities portfolio at Sept. 30, 2017.portfolio.
| | | Maturity distribution and yield on investment securities at Sept. 30, 2017 | U.S. Treasury | | U.S. government agencies | | State and political subdivisions | | Other bonds, notes and debentures | | Mortgage/ asset-backed and equity securities | | | |
| Maturity distribution and yield on investment securities at March 31, 2018 | | U.S. Treasury | | U.S. government agencies | | State and political subdivisions | | Other bonds, notes and debentures | | Mortgage/ asset-backed | | |
| (dollars in millions) | Amount |
| Yield (a) |
| | Amount |
| Yield (a) |
| | Amount |
| Yield (a) |
| | Amount |
| Yield (a) |
| | Amount |
| Yield (a) |
| | Total |
| Amount |
| Yield (a) |
| | Amount |
| Yield (a) |
| | Amount |
| Yield (a) |
| | Amount |
| Yield (a) |
| | Amount |
| Yield (a) |
| | Total |
|
| Securities available-for-sale: | | | | | | | | | | | | | | | | | | | | | | | | | | | | | | | | |
| One year or less | $ | 2,223 |
| 1.02 | % | | $ | — |
| — | % | | $ | 438 |
| 2.60 | % | | $ | 3,852 |
| 1.01 | % | | $ | — |
| — | % | | $ | 6,513 |
| $ | 5,093 |
| 1.67 | % | | $ | 16 |
| 2.16 | % | | $ | 380 |
| 2.04 | % | | $ | 5,103 |
| 1.12 | % | | $ | — |
| — | % | | $ | 10,592 |
|
| Over 1 through 5 years | 5,790 |
| 1.66 |
| | 174 |
| 1.29 |
| | 1,576 |
| 3.07 |
| | 12,648 |
| 0.99 |
| | — |
| — |
| | 20,188 |
| 5,851 |
| 1.89 |
| | 389 |
| 2.09 |
| | 1,445 |
| 2.88 |
| | 13,118 |
| 1.05 |
| | — |
| — |
| | 20,803 |
|
| Over 5 through 10 years | 4,002 |
| 1.90 |
| | 690 |
| 2.46 |
| | 912 |
| 3.34 |
| | 2,835 |
| 0.81 |
| | — |
| — |
| | 8,439 |
| 2,606 |
| 2.07 |
| | 749 |
| 2.59 |
| | 709 |
| 2.69 |
| | 2,616 |
| 0.80 |
| | — |
| — |
| | 6,680 |
|
| Over 10 years | 3,487 |
| 3.11 |
| | — |
| — |
| | 198 |
| 2.36 |
| | 198 |
| 1.64 |
| | — |
| — |
| | 3,883 |
| 3,404 |
| 3.11 |
| | — |
| — |
| | 192 |
| 2.67 |
| | 209 |
| 1.66 |
| | — |
| — |
| | 3,805 |
|
| Mortgage-backed securities | — |
| — |
| | — |
| — |
| | — |
| — |
| | — |
| — |
| | 36,381 |
| 2.78 |
| | 36,381 |
| — |
| — |
| | — |
| — |
| | — |
| — |
| | — |
| — |
| | 36,543 |
| 3.00 |
| | 36,543 |
|
| Asset-backed securities | — |
| — |
| | — |
| — |
| | — |
| — |
| | — |
| — |
| | 3,707 |
| 2.32 |
| | 3,707 |
| — |
| — |
| | — |
| — |
| | — |
| — |
| | — |
| — |
| | 3,407 |
| 2.75 |
| | 3,407 |
|
Equity securities (b) | — |
| — |
| | — |
| — |
| | — |
| — |
| | — |
| — |
| | 943 |
| — |
| | 943 |
| |
| Total | $ | 15,502 |
| 1.96 | % | | $ | 864 |
| 2.23 | % | | $ | 3,124 |
| 3.04 | % | | $ | 19,533 |
| 0.97 | % | | $ | 41,031 |
| 2.68 | % | | $ | 80,054 |
| $ | 16,954 |
| 2.10 | % | | $ | 1,154 |
| 2.41 | % | | $ | 2,726 |
| 2.70 | % | | $ | 21,046 |
| 1.04 | % | | $ | 39,950 |
| 2.98 | % | | $ | 81,830 |
|
| Securities held-to-maturity: | | | | | | | | | | | | | | | | | | | | | | | | | | | | | | | | |
| One year or less | $ | 4,943 |
| 0.97 | % | | $ | 731 |
| 0.99 | % | | $ | — |
| — | % | | $ | 700 |
| 0.60 | % | | $ | — |
| — | % | | $ | 6,374 |
| $ | 1,971 |
| 1.10 | % | | $ | 506 |
| 1.13 | % | | $ | — |
| — | % | | $ | 607 |
| 0.62 | % | | $ | — |
| — | % | | $ | 3,084 |
|
| Over 1 through 5 years | 3,517 |
| 1.67 |
| | 883 |
| 1.38 |
| | 2 |
| 6.88 |
| | 307 |
| 0.59 |
| | — |
| — |
| | 4,709 |
| 3,918 |
| 1.78 |
| | 997 |
| 1.67 |
| | 2 |
| 5.68 |
| | 469 |
| 0.46 |
| | — |
| — |
| | 5,386 |
|
| Over 5 through 10 years | 1,407 |
| 1.92 |
| | — |
| — |
| | 2 |
| 6.86 |
| | 661 |
| 0.73 |
| | — |
| — |
| | 2,070 |
| 709 |
| 1.79 |
| | — |
| — |
| | 1 |
| 5.71 |
| | 552 |
| 0.85 |
| | — |
| — |
| | 1,262 |
|
| Over 10 years | — |
| — |
| | — |
| — |
| | 14 |
| 5.32 |
| | — |
| — |
| | — |
| — |
| | 14 |
| — |
| — |
| | — |
| — |
| | 14 |
| 4.76 |
| | — |
| — |
| | — |
| — |
| | 14 |
|
| Mortgage-backed securities | — |
| — |
| | — |
| — |
| | — |
| — |
| | — |
| — |
| | 26,828 |
| 2.80 |
| | 26,828 |
| — |
| — |
| | — |
| — |
| | — |
| — |
| | — |
| — |
| | 27,213 |
| 2.82 |
| | 27,213 |
|
| Total | $ | 9,867 |
| 1.36 | % | | $ | 1,614 |
| 1.20 | % | | $ | 18 |
| 5.64 | % | | $ | 1,668 |
| 0.65 | % | | $ | 26,828 |
| 2.80 | % | | $ | 39,995 |
| $ | 6,598 |
| 1.57 | % | | $ | 1,503 |
| 1.48 | % | | $ | 17 |
| 4.94 | % | | $ | 1,628 |
| 0.65 | % | | $ | 27,213 |
| 2.82 | % | | $ | 36,959 |
|
| |
| (a) | Yields are based upon the amortized cost of securities. |
| |
(b) | Includes money market funds. |
|
|
Notes to Consolidated Financial Statements (continued) |
| |
Other-than-temporary impairment
We conduct periodic reviews of all securities to determine whether OTTI has occurred. Such reviews may incorporate the use of economic models. Various inputs to the economic models are used to determine if an unrealized loss on securities is other-than-temporary. For example, the most significant inputs related to non-agency RMBS are:
Default rate - the number of mortgage loans expected to go into default over the life of the transaction, which is driven by the roll rate of loans in each performance bucket that will ultimately migrate to default; and
Severity - the loss expected to be realized when a loan defaults.
To determine if an unrealized loss is other-than-temporary, we project total estimated defaults of the underlying assets (mortgages) and multiply that calculated amount by an estimate of realizable value upon sale of these assets in the marketplace (severity) in order to determine the projected collateral loss. In determining estimated default rate and severity assumptions, we review the performance of the underlying securities, industry studies and market forecasts, as well as our view of the economic outlook affecting collateral. We also evaluate the current credit enhancement underlying the bond to determine the impact on cash flows. If we determine that a given security will be subject to a write-down or loss, we record the expected credit loss as a charge to earnings.
The table below shows the projected weighted-average default rates and loss severities for the 2007, 2006 and late 2005 non-agency RMBS and the securities previously held in the Grantor Trust that we established in connection with the restructuring of our investment securities portfolio in 2009, at Sept. 30, 2017March 31, 2018 and Dec. 31, 20162017. See Note 15 for carrying values of these securities.
| | Projected weighted-average default rates and loss severities | | | Sept. 30, 2017 | | Dec. 31, 2016 | March 31, 2018 | | Dec. 31, 2017 |
| | Default rate |
| Severity |
| | Default rate |
| Severity |
| Default rate |
| Severity |
| | Default rate |
| Severity |
|
| Alt-A | 22 | % | 54 | % | | 30 | % | 54 | % | 22 | % | 52 | % | | 22 | % | 53 | % |
| Subprime | 38 | % | 66 | % | | 49 | % | 70 | % | 38 | % | 66 | % | | 38 | % | 66 | % |
| Prime | 13 | % | 39 | % | | 18 | % | 39 | % | 13 | % | 39 | % | | 13 | % | 39 | % |
The following table presents pre-tax net securities (losses) gains (losses) by type.
| | | Net securities gains (losses) | | |
| Net securities (losses) gains | | |
| (in millions) | 3Q17 |
| 2Q17 |
| 3Q16 |
| YTD17 |
| YTD16 |
| 1Q18 |
| 4Q17 |
| 1Q17 |
|
| Agency RMBS | $ | 4 |
| $ | — |
| $ | 9 |
| $ | 5 |
| $ | 22 |
| $ | (42 | ) | $ | (17 | ) | $ | 1 |
|
| U.S. Treasury | 1 |
| (1 | ) | (1 | ) | — |
| 4 |
| (4 | ) | (16 | ) | — |
|
| Foreign covered bonds | — |
| — |
| — |
| — |
| 10 |
| |
| Non-agency RMBS | (1 | ) | — |
| (1 | ) | (2 | ) | 1 |
| — |
| 6 |
| (1 | ) |
| Other | 15 |
| 1 |
| 17 |
| 26 |
| 28 |
| (3 | ) | 1 |
| 10 |
|
| Total net securities gains | $ | 19 |
| $ | — |
| $ | 24 |
| $ | 29 |
| $ | 65 |
| |
| Total net securities (losses) gains | | $ | (49 | ) | $ | (26 | ) | $ | 10 |
|
The following tables reflecttable reflects investment securities credit losses recorded in earnings. The beginning balance represents the credit loss component for which OTTI occurred on debt securities in prior periods. The additions represent the first time a debt security was credit impaired or when subsequent credit impairments have occurred. The deductions represent credit losses on securities that have been sold, are required to be sold, or for which it is our intention to sell.
|
| | | | | | |
| Debt securities credit loss roll forward | | |
| (in millions) | 3Q17 |
| 3Q16 |
|
| Beginning balance as of June 30 | $ | 85 |
| $ | 91 |
|
| Add: Initial OTTI credit losses | — |
| — |
|
| Subsequent OTTI credit losses | 1 |
| 1 |
|
| Less: Realized losses for securities sold | 2 |
| 5 |
|
| Ending balance as of Sept. 30 | $ | 84 |
| $ | 87 |
|
| | | Debt securities credit loss roll forward | | |
| (in millions) | YTD17 |
| YTD16 |
| 1Q18 |
| 1Q17 |
|
| Beginning balance as of Jan. 1 | $ | 88 |
| $ | 91 |
| $ | 84 |
| $ | 88 |
|
| Add: Initial OTTI credit losses | — |
| — |
| — |
| — |
|
| Subsequent OTTI credit losses | 3 |
| 5 |
| — |
| 1 |
|
| Less: Realized losses for securities sold | 7 |
| 9 |
| 4 |
| — |
|
| Ending balance as of Sept. 30 | $ | 84 |
| $ | 87 |
| |
| Ending balance as of March 31 | | $ | 80 |
| $ | 89 |
|
Pledged assets
At Sept. 30, 2017,March 31, 2018, BNY Mellon had pledged assets of $108$111 billion, including $87$92 billion pledged as collateral for potential borrowings at the Federal Reserve Discount Window and $4$5 billion pledged as collateral for borrowing at the Federal Home Loan Bank. The components of the assets pledged at Sept. 30, 2017March 31, 2018 included $92$93 billion of securities, $13 billion of loans, $2$4 billion of trading assets and $1 billion of interest-bearing deposits with banks.
|
|
Notes to Consolidated Financial Statements(continued)
|
|
If there has been no borrowing at the Federal Reserve Discount Window, the Federal Reserve generally allows banks to freely move assets in and out of their pledged assets account to sell or repledge the assets for other purposes. BNY Mellon regularly moves assets in and out of its pledged assets account at the Federal Reserve.
|
|
Notes to Consolidated Financial Statements(continued) |
|
At Dec. 31, 2016,2017, BNY Mellon had pledged assets of $102$111 billion, including $84$92 billion pledged as collateral for potential borrowing at the Federal Reserve Discount Window.Window and $5 billion pledged as collateral for borrowing at the Federal Home Loan Bank. The components of the assets pledged at Dec. 31, 20162017 included $87$96 billion of securities, $8$13 billion of loans $4 billion of interest-bearing deposits with banks and $3$2 billion of trading assets.
At Sept. 30, 2017March 31, 2018 and Dec. 31, 2016,2017, pledged assets included $13$10 billion and $6$10 billion, respectively, for which the recipients were permitted to sell or repledge the assets delivered.
We also obtain securities as collateral, including receipts under resale agreements, securities borrowed, derivative contracts and custody agreements on terms which permit us to sell or repledge the securities to others. At Sept. 30, 2017March 31, 2018 and Dec. 31, 2016,2017, the market value of the securities received that can be sold or repledged was $68$78 billion and $50$86 billion, respectively. We routinely sell or repledge these securities through delivery to third parties. As of Sept. 30, 2017March 31, 2018 and Dec. 31, 2016,2017, the market value of securities collateral sold or repledged was $39$43 billion and $20$49 billion, respectively.
Restricted cash and securities
Cash and securities may also be segregated under federal and other regulations or requirements. At Sept. 30, 2017March 31, 2018 and Dec. 31, 2016,2017, cash segregated under federal and other regulations or requirements was $4$1 billion and $3$2 billion, respectively. Restricted cash is included in interest-bearing deposits with banks on the consolidated balance sheet. Securities segregated for these purposes were $2$1 billion at Sept. 30, 2017March 31, 2018 and $2$1 billion at Dec. 31, 2016.2017. Restricted securities were sourced from securities purchased under resale agreements at Sept. 30, 2017March 31, 2018 and Dec. 31, 20162017 and are included in federal funds sold and securities purchased under resale agreements on the consolidated balance sheet.
Note 5 - 5–Loans and asset quality
Loans
The table below provides the details of our loan portfolio and industry concentrations of credit risk at Sept. 30, 2017March 31, 2018 and Dec. 31, 2016.2017.
| | | Loans | Sept. 30, 2017 |
| Dec. 31, 2016 |
| March 31, 2018 |
| Dec. 31, 2017 |
|
| (in millions) |
| Domestic: | | |
| Commercial | | $ | 2,284 |
| $ | 2,744 |
|
| Commercial real estate | | 4,888 |
| 4,900 |
|
| Financial institutions | $ | 5,155 |
| $ | 6,342 |
| 5,782 |
| 5,568 |
|
| Commercial | 2,698 |
| 2,286 |
| |
| Lease financings | | 749 |
| 772 |
|
| Wealth management loans and mortgages | 16,161 |
| 15,555 |
| 16,288 |
| 16,420 |
|
| Commercial real estate | 4,921 |
| 4,639 |
| |
| Lease financings | 823 |
| 989 |
| |
| Other residential mortgages | 741 |
| 854 |
| 680 |
| 708 |
|
| Overdrafts | 1,487 |
| 1,055 |
| 785 |
| 963 |
|
| Other | 1,159 |
| 1,202 |
| 1,089 |
| 1,131 |
|
| Margin loans | 13,720 |
| 17,503 |
| 14,993 |
| 15,689 |
|
| Total domestic | 46,865 |
| 50,425 |
| 47,538 |
| 48,895 |
|
| Foreign: | | |
| Commercial | | 325 |
| 167 |
|
| Commercial real estate | | 5 |
| — |
|
| Financial institutions | 6,741 |
| 8,347 |
| 7,011 |
| 7,483 |
|
| Commercial | 305 |
| 331 |
| |
| Lease financings | | 533 |
| 527 |
|
| Wealth management loans and mortgages | 104 |
| 99 |
| 113 |
| 108 |
|
| Commercial real estate | 6 |
| 15 |
| |
| Lease financings | 522 |
| 736 |
| |
| Other (primarily overdrafts) | 4,373 |
| 4,418 |
| 5,138 |
| 4,264 |
|
| Margin loans | 152 |
| 87 |
| 146 |
| 96 |
|
| Total foreign | 12,203 |
| 14,033 |
| 13,271 |
| 12,645 |
|
Total loans (a) | $ | 59,068 |
| $ | 64,458 |
| $ | 60,809 |
| $ | 61,540 |
|
| |
| (a) | Net of unearned income of $414382 million at Sept. 30, 2017March 31, 2018 and $527394 million at Dec. 31, 20162017 primarily onrelated to domestic and foreign lease financings. |
Our loan portfolio consists of three portfolio segments: commercial, lease financings and mortgages. We manage our portfolio at the class level which consists of six classes of financing receivables: commercial, commercial real estate, financial institutions, lease financings, wealth management loans and mortgages, and other residential mortgages.
The following tables are presented for each class of financing receivable and provide additional information about our credit risks and the adequacy of our allowance for credit losses.
|
|
Notes to Consolidated Financial Statements (continued) |
| |
Allowance for credit losses
Transactions in the allowance for credit losses are summarized as follows.
| | | Allowance for credit losses activity for the quarter ended Sept. 30, 2017 | Wealth management loans and mortgages |
| Other residential mortgages |
| | | | |
| Allowance for credit losses activity for the quarter ended March 31, 2018 | | Allowance for credit losses activity for the quarter ended March 31, 2018 | | Wealth management loans and mortgages |
| Other residential mortgages |
| | | |
| (in millions) | Commercial |
| Commercial real estate |
| Financial institutions |
| Lease financings |
| Wealth management loans and mortgages |
| Other residential mortgages |
| All other |
| | Foreign |
| Total |
| Commercial |
| Commercial real estate |
| Financial institutions |
| Lease financings |
| All other |
| | Foreign |
| Total |
|
| Beginning balance | $ | 80 |
| $ | 75 |
| $ | 23 |
| $ | 10 |
| $ | — |
| | $ | 34 |
| $ | 270 |
| $ | 77 |
| $ | 76 |
| $ | 23 |
| $ | 8 |
| $ | 22 |
| $ | 20 |
| $ | — |
| | $ | 35 |
| $ | 261 |
|
| Charge-offs | — |
| — |
| — |
| — |
| — |
| — |
| — |
| | — |
| — |
| — |
| — |
| — |
| — |
| — |
| — |
| — |
| | — |
| — |
|
| Recoveries | — |
| — |
| — |
| — |
| — |
| 1 |
| — |
| | — |
| 1 |
| — |
| — |
| — |
| — |
| — |
| — |
| — |
| | — |
| — |
|
| Net recoveries | — |
| — |
| — |
| — |
| — |
| 1 |
| — |
| | — |
| 1 |
| — |
| — |
| — |
| — |
| — |
| — |
| — |
| | — |
| — |
|
| Provision | 1 |
| — |
| — |
| (1 | ) | (4 | ) | (3 | ) | — |
| | 1 |
| (6 | ) | (2 | ) | (1 | ) | (1 | ) | (1 | ) | 1 |
| (1 | ) | — |
| | — |
| (5 | ) |
| Ending balance | $ | 81 |
| $ | 75 |
| $ | 23 |
| $ | 9 |
| $ | 21 |
| $ | 21 |
| $ | — |
| | $ | 35 |
| $ | 265 |
| $ | 75 |
| $ | 75 |
| $ | 22 |
| $ | 7 |
| $ | 23 |
| $ | 19 |
| $ | — |
| | $ | 35 |
| $ | 256 |
|
| Allowance for: | | | | | | |
| Loan losses | $ | 26 |
| $ | 57 |
| $ | 7 |
| $ | 9 |
| $ | 17 |
| $ | 21 |
| $ | — |
| | $ | 24 |
| $ | 161 |
| $ | 23 |
| $ | 58 |
| $ | 8 |
| $ | 7 |
| $ | 19 |
| $ | 19 |
| $ | — |
| | $ | 22 |
| $ | 156 |
|
| Lending-related commitments | 55 |
| 18 |
| 16 |
| — |
| 4 |
| — |
| — |
| | 11 |
| 104 |
| 52 |
| 17 |
| 14 |
| — |
| 4 |
| — |
| — |
| | 13 |
| 100 |
|
| Individually evaluated for impairment: | | | | | | |
| Loan balance | $ | — |
| $ | — |
| $ | 2 |
| $ | — |
| $ | 5 |
| $ | — |
| $ | — |
| | $ | — |
| $ | 7 |
| $ | — |
| $ | — |
| $ | 1 |
| $ | — |
| $ | 4 |
| $ | — |
| $ | — |
| | $ | — |
| $ | 5 |
|
| Allowance for loan losses | — |
| — |
| 2 |
| — |
| — |
| — |
| — |
| | — |
| 2 |
| — |
| — |
| — |
| — |
| 1 |
| — |
| — |
| | — |
| 1 |
|
| Collectively evaluated for impairment: | | | | | | |
| Loan balance | $ | 2,698 |
| $ | 4,921 |
| $ | 5,153 |
| $ | 823 |
| $ | 16,156 |
| $ | 741 |
| $ | 16,366 |
| (a) | $ | 12,203 |
| $ | 59,061 |
| $ | 2,284 |
| $ | 4,888 |
| $ | 5,781 |
| $ | 749 |
| $ | 16,284 |
| $ | 680 |
| $ | 16,867 |
| (a) | $ | 13,271 |
| $ | 60,804 |
|
| Allowance for loan losses | 26 |
| 57 |
| 5 |
| 9 |
| 17 |
| 21 |
| — |
| | 24 |
| 159 |
| 23 |
| 58 |
| 8 |
| 7 |
| 18 |
| 19 |
| — |
| | 22 |
| 155 |
|
| |
| (a) | Includes $1,487$785 million of domestic overdrafts, $13,720$14,993 million of margin loans and $1,159$1,089 million of other loans at Sept. 30, 2017.March 31, 2018. |
| | | Allowance for credit losses activity for the quarter ended June 30, 2017 | Wealth management loans and mortgages |
| Other residential mortgages |
| | | | |
| Allowance for credit losses activity for the quarter ended Dec. 31, 2017 | | Allowance for credit losses activity for the quarter ended Dec. 31, 2017 | | Wealth management loans and mortgages |
| Other residential mortgages |
| | | |
| (in millions) | Commercial |
| Commercial real estate |
| Financial institutions |
| Lease financings |
| Wealth management loans and mortgages |
| Other residential mortgages |
| All other |
| | Foreign |
| Total |
| Commercial |
| Commercial real estate |
| Financial institutions |
| Lease financings |
| All other |
| | Foreign |
| Total |
|
| Beginning balance | $ | 82 |
| $ | 73 |
| $ | 23 |
| $ | 10 |
| $ | — |
| | $ | 37 |
| $ | 276 |
| $ | 81 |
| $ | 75 |
| $ | 23 |
| $ | 9 |
| $ | 21 |
| $ | 21 |
| $ | — |
| | $ | 35 |
| $ | 265 |
|
| Charge-offs | — |
| — |
| — |
| — |
| — |
| — |
| — |
| | — |
| — |
| — |
| — |
| — |
| — |
| — |
| — |
| — |
| | — |
| — |
|
| Recoveries | — |
| — |
| — |
| — |
| — |
| 1 |
| — |
| | — |
| 1 |
| — |
| — |
| — |
| — |
| — |
| 2 |
| — |
| | — |
| 2 |
|
| Net recoveries | — |
| — |
| — |
| — |
| — |
| 1 |
| — |
| | — |
| 1 |
| — |
| — |
| — |
| — |
| — |
| 2 |
| — |
| | — |
| 2 |
|
| Provision | (2 | ) | 2 |
| — |
| — |
| (1 | ) | (3 | ) | — |
| | (3 | ) | (7 | ) | (4 | ) | 1 |
| — |
| (1 | ) | 1 |
| (3 | ) | — |
| | — |
| (6 | ) |
| Ending balance | $ | 80 |
| $ | 75 |
| $ | 23 |
| $ | 10 |
| $ | 25 |
| $ | 23 |
| $ | — |
| | $ | 34 |
| $ | 270 |
| $ | 77 |
| $ | 76 |
| $ | 23 |
| $ | 8 |
| $ | 22 |
| $ | 20 |
| $ | — |
| | $ | 35 |
| $ | 261 |
|
| Allowance for: | | | | | | |
| Loan losses | $ | 26 |
| $ | 55 |
| $ | 7 |
| $ | 10 |
| $ | 21 |
| $ | 23 |
| $ | — |
|
| $ | 23 |
| $ | 165 |
| $ | 24 |
| $ | 58 |
| $ | 7 |
| $ | 8 |
| $ | 18 |
| $ | 20 |
| $ | — |
| | $ | 24 |
| $ | 159 |
|
| Lending-related commitments | 54 |
| 20 |
| 16 |
| — |
| 4 |
| — |
| — |
|
| 11 |
| 105 |
| 53 |
| 18 |
| 16 |
| — |
| 4 |
| — |
| — |
| | 11 |
| 102 |
|
| Individually evaluated for impairment: | | | | | | |
| Loan balance | $ | — |
| $ | — |
| $ | 2 |
| $ | — |
| $ | 7 |
| $ | — |
| $ | — |
|
| $ | — |
| $ | 9 |
| $ | — |
| $ | — |
| $ | 1 |
| $ | — |
| $ | 5 |
| $ | — |
| $ | — |
| | $ | — |
| $ | 6 |
|
| Allowance for loan losses | — |
| — |
| 2 |
| — |
| 3 |
| — |
| — |
|
| — |
| 5 |
| — |
| — |
| — |
| — |
| 1 |
| — |
| — |
| | — |
| 1 |
|
| Collectively evaluated for impairment: | | | | | | |
| Loan balance | $ | 2,580 |
| $ | 5,017 |
| $ | 5,952 |
| $ | 847 |
| $ | 16,024 |
| $ | 780 |
| $ | 15,950 |
| (a) | $ | 14,514 |
| $ | 61,664 |
| $ | 2,744 |
| $ | 4,900 |
| $ | 5,567 |
| $ | 772 |
| $ | 16,415 |
| $ | 708 |
| $ | 17,783 |
| (a) | $ | 12,645 |
| $ | 61,534 |
|
| Allowance for loan losses | 26 |
| 55 |
| 5 |
| 10 |
| 18 |
| 23 |
| — |
|
| 23 |
| 160 |
| 24 |
| 58 |
| 7 |
| 8 |
| 17 |
| 20 |
| — |
| | 24 |
| 158 |
|
| |
| (a) | Includes $855$963 million of domestic overdrafts, $13,973$15,689 million of margin loans and $1,122$1,131 million of other loans at June 30,Dec. 31, 2017. |
|
|
Notes to Consolidated Financial Statements (continued) |
| |
| | | Allowance for credit losses activity for the quarter ended Sept. 30, 2016 | Wealth management loans and mortgages |
| Other residential mortgages |
| All other |
| | Foreign |
| Total |
| |
| Allowance for credit losses activity for the quarter ended March 31, 2017 | | Allowance for credit losses activity for the quarter ended March 31, 2017 | | Wealth management loans and mortgages |
| Other residential mortgages |
| All other |
| | Foreign |
| Total |
|
| (in millions) | Commercial |
| Commercial real estate |
| Financial institutions |
| Lease financings |
| Wealth management loans and mortgages |
| Other residential mortgages |
| All other |
| | Foreign |
| Total |
| Commercial |
| Commercial real estate |
| Financial institutions |
| Lease financings |
| |
| Beginning balance | $ | 90 |
| $ | 63 |
| $ | 29 |
| $ | 14 |
| | $ | 82 |
| $ | 73 |
| $ | 26 |
| $ | 13 |
| $ | 23 |
| $ | 28 |
| $ | — |
| | $ | 36 |
| $ | 281 |
|
| Charge-offs | — |
| — |
| — |
| — |
| — |
| (1 | ) | — |
| | — |
| (1 | ) | — |
| — |
| — |
| — |
| — |
| (1 | ) | — |
| | — |
| (1 | ) |
| Recoveries | — |
| — |
| 13 |
| — |
| — |
| 1 |
| — |
| | — |
| 14 |
| — |
| — |
| — |
| — |
| — |
| 1 |
| — |
| | — |
| 1 |
|
| Net recoveries | — |
| — |
| 13 |
| — |
| — |
| — |
| — |
| | — |
| 13 |
| |
| Net (charge-offs) recoveries | | — |
| — |
| — |
| — |
| — |
| — |
| — |
| | — |
| — |
|
| Provision | 1 |
| — |
| (13 | ) | — |
| — |
| (1 | ) | — |
| | (6 | ) | (19 | ) | — |
| — |
| (3 | ) | (3 | ) | 3 |
| (3 | ) | — |
| | 1 |
| (5 | ) |
| Ending balance | $ | 91 |
| $ | 63 |
| $ | 29 |
| $ | 14 |
| $ | 18 |
| $ | 28 |
| $ | — |
| | $ | 31 |
| $ | 274 |
| $ | 82 |
| $ | 73 |
| $ | 23 |
| $ | 10 |
| $ | 26 |
| $ | 25 |
| $ | — |
| | $ | 37 |
| $ | 276 |
|
| Allowance for: | | | | | | |
| Loan losses | $ | 22 |
| $ | 45 |
| $ | 9 |
| $ | 14 |
| $ | 14 |
| $ | 28 |
| $ | — |
| | $ | 16 |
| $ | 148 |
| $ | 24 |
| $ | 54 |
| $ | 5 |
| $ | 10 |
| $ | 22 |
| $ | 25 |
| $ | — |
| | $ | 24 |
| $ | 164 |
|
| Lending-related commitments | 69 |
| 18 |
| 20 |
| — |
| 4 |
| — |
| — |
| | 15 |
| 126 |
| 58 |
| 19 |
| 18 |
| — |
| 4 |
| — |
| — |
| | 13 |
| 112 |
|
| Individually evaluated for impairment: | | | | | | |
| Loan balance | $ | — |
| $ | 1 |
| $ | — |
| $ | 4 |
| $ | 4 |
| $ | — |
| $ | — |
| | $ | — |
| $ | 9 |
| $ | — |
| $ | — |
| $ | — |
| $ | — |
| $ | 5 |
| $ | — |
| $ | — |
| | $ | — |
| $ | 5 |
|
| Allowance for loan losses | — |
| 1 |
| — |
| 2 |
| — |
| — |
| — |
| | — |
| 3 |
| — |
| — |
| — |
| — |
| 3 |
| — |
| — |
| | — |
| 3 |
|
| Collectively evaluated for impairment: | | | | | | |
| Loan balance | $ | 2,292 |
| $ | 4,693 |
| $ | 6,783 |
| $ | 1,013 |
| $ | 15,027 |
| $ | 901 |
| $ | 20,189 |
| (a) | $ | 15,061 |
| $ | 65,959 |
| $ | 2,543 |
| $ | 4,698 |
| $ | 5,387 |
| $ | 846 |
| $ | 15,904 |
| $ | 817 |
| $ | 17,873 |
| (a) | $ | 12,795 |
| $ | 60,863 |
|
| Allowance for loan losses | 22 |
| 44 |
| 9 |
| 12 |
| 14 |
| 28 |
| — |
| | 16 |
| 145 |
| 24 |
| 54 |
| 5 |
| 10 |
| 19 |
| 25 |
| — |
| | 24 |
| 161 |
|
| |
| (a) | Includes $1,580$673 million of domestic overdrafts, $17,487$16,081 million of margin loans and $1,122$1,119 million of other loans at Sept. 30, 2016.March 31, 2017. |
|
| | | | | | | | | | | | | | | | | | | | | | | | | | | |
| Allowance for credit losses activity for the nine months ended Sept. 30, 2017 | Wealth management loans and mortgages |
| Other
residential
mortgages |
| All
other |
| Foreign |
| Total |
|
| (in millions) | Commercial |
| Commercial
real estate |
| Financial
institutions |
| Lease
financings |
|
| Beginning balance | $ | 82 |
| $ | 73 |
| $ | 26 |
| $ | 13 |
| $ | 23 |
| $ | 28 |
| $ | — |
| $ | 36 |
| $ | 281 |
|
| Charge-offs | — |
| — |
| — |
| — |
| — |
| (1 | ) | — |
| — |
| (1 | ) |
| Recoveries | — |
| — |
| — |
| — |
| — |
| 3 |
| — |
| — |
| 3 |
|
| Net recoveries | — |
| — |
| — |
| — |
| — |
| 2 |
| — |
| — |
| 2 |
|
| Provision | (1 | ) | 2 |
| (3 | ) | (4 | ) | (2 | ) | (9 | ) | — |
| (1 | ) | (18 | ) |
| Ending balance | $ | 81 |
| $ | 75 |
| $ | 23 |
| $ | 9 |
| $ | 21 |
| $ | 21 |
| $ | — |
| $ | 35 |
| $ | 265 |
|
The table below presents our nonperforming assets.
|
| | | | | | | | | | | | | | | | | | | | | | | | | | | |
| Allowance for credit losses activity for the nine months ended Sept. 30, 2016 | Wealth management loans and mortgages |
| Other
residential
mortgages |
| All
other |
| Foreign |
| Total |
|
| (in millions) | Commercial |
| Commercial
real estate |
| Financial
institutions |
| Lease
financings |
|
| Beginning balance | $ | 82 |
| $ | 59 |
| $ | 31 |
| $ | 15 |
| $ | 19 |
| $ | 34 |
| $ | — |
| $ | 35 |
| $ | 275 |
|
| Charge-offs | — |
| — |
| — |
| — |
| — |
| (1 | ) | — |
| — |
| (1 | ) |
| Recoveries | — |
| — |
| 13 |
| — |
| — |
| 4 |
| — |
| 1 |
| 18 |
|
| Net recoveries | — |
| — |
| 13 |
| — |
| — |
| 3 |
| — |
| 1 |
| 17 |
|
| Provision | 9 |
| 4 |
| (15 | ) | (1 | ) | (1 | ) | (9 | ) | — |
| (5 | ) | (18 | ) |
| Ending balance | $ | 91 |
| $ | 63 |
| $ | 29 |
| $ | 14 |
| $ | 18 |
| $ | 28 |
| $ | — |
| $ | 31 |
| $ | 274 |
|
|
| | | | | | | |
| | Nonperforming assets (in millions) | March 31, 2018 |
| Dec. 31, 2017 |
|
| |
| | Nonperforming loans: | | |
| | Other residential mortgages | $ | 74 |
| $ | 78 |
|
| | Wealth management loans and mortgages | 7 |
| 7 |
|
| | Commercial real estate | — |
| 1 |
|
| | Total nonperforming loans | 81 |
| 86 |
|
| | Other assets owned | 4 |
| 4 |
|
| | Total nonperforming assets | $ | 85 |
| $ | 90 |
|
At March 31, 2018, undrawn commitments to borrowers whose loans were classified as nonaccrual or reduced rate were not material.
Lost interest
Interest income would have increased by $1 million in the first quarter of 2018, fourth quarter of 2017 and first quarter of 2017, if nonperforming loans at period-end had been performing for the entire respective quarter.
Impaired loans
We use the discounted cash flow method as the primary method for valuing impaired loans. The average recorded investment and unpaid principal balance of impaired loans were less than $10 million for the first quarter of 2018, the fourth quarter of 2017 and the first quarter of 2017. The impaired loans had a related allowance of $1 million at both March 31, 2018 and Dec. 31, 2017.
Past due loans
The table below presents our past due loans.
|
| | | | | | | | | | | | | | | | | | | | | | | | | |
| Past due loans and still accruing interest | March 31, 2018 | | Dec. 31, 2017 |
| | Days past due | Total past due |
| | Days past due | Total past due |
|
| (in millions) | 30-59 |
| 60-89 |
| ≥90 |
| 30-59 |
| 60-89 |
| ≥90 |
|
| Commercial real estate | $ | 62 |
| $ | — |
| $ | — |
| $ | 62 |
| | $ | 44 |
| $ | — |
| $ | — |
| $ | 44 |
|
| Wealth management loans and mortgages | 36 |
| 1 |
| — |
| 37 |
| | 39 |
| 5 |
| — |
| 44 |
|
| Other residential mortgages | 13 |
| 5 |
| 5 |
| 23 |
| | 18 |
| 5 |
| 5 |
| 28 |
|
| Financial institutions | — |
| — |
| — |
| — |
| | 1 |
| — |
| — |
| 1 |
|
| Total past due loans | $ | 111 |
| $ | 6 |
| $ | 5 |
| $ | 122 |
|
| $ | 102 |
| $ | 10 |
| $ | 5 |
| $ | 117 |
|
|
|
Notes to Consolidated Financial Statements (continued) |
| |
Nonperforming assets
The table below presents our nonperforming assets.
|
| | | | | | | |
| | Nonperforming assets (in millions) | Sept. 30, 2017 |
| Dec. 31, 2016 |
|
| |
| | Nonperforming loans: | | |
| | Other residential mortgages | $ | 80 |
| $ | 91 |
|
| | Wealth management loans and mortgages | 8 |
| 8 |
|
| | Financial institutions | 2 |
| — |
|
| | Lease financings | — |
| 4 |
|
| | Total nonperforming loans | 90 |
| 103 |
|
| | Other assets owned | 4 |
| 4 |
|
| | Total nonperforming assets | $ | 94 |
| $ | 107 |
|
At Sept. 30, 2017, undrawn commitments to borrowers whose loans were classified as nonaccrual or reduced rate were not material.
Lost interest
The table below presents the amount of lost interest income.
|
| | | | | | | | | | | | | | | |
| Lost interest | | | | | |
| (in millions) | 3Q17 |
| 2Q17 |
| 3Q16 |
| YTD17 |
| YTD16 |
|
| Amount by which interest income recognized on nonperforming loans exceeded reversals | $ | — |
| $ | — |
| $ | — |
| $ | — |
| $ | — |
|
| Amount by which interest income would have increased if nonperforming loans at period end had been performing for the entire period | $ | 1 |
| $ | 1 |
| $ | 1 |
| $ | 4 |
| $ | 4 |
|
Impaired loans
The tables below present information about our impaired loans. We use the discounted cash flow method as the primary method for valuing impaired loans.
|
| | | | | | | | | | | | | | | | | | | | | | | | | | | | | | | |
| Impaired loans | 3Q17 | 2Q17 | 3Q16 | | YTD17 | YTD16 |
| (in millions) | Average recorded investment |
| Interest
income
recognized |
| Average recorded investment |
| Interest income recognized |
| Average
recorded
investment |
| Interest
income
recognized |
| | Average
recorded
investment |
| Interest
income
recognized |
| Average
recorded
investment |
| Interest
income
recognized |
|
| Impaired loans with an allowance: | | | | | | | | | | | |
| Commercial real estate | $ | — |
| $ | — |
| $ | — |
| $ | — |
| $ | 1 |
| $ | — |
| | $ | — |
| $ | — |
| $ | 1 |
| $ | — |
|
| Financial institutions | 2 |
| — |
| 1 |
| — |
| — |
| — |
| | 1 |
| — |
| — |
| — |
|
| Wealth management loans and mortgages | 2 |
| — |
| 3 |
| — |
| 3 |
| — |
| | 3 |
| — |
| 5 |
| — |
|
| Lease financings | — |
| — |
| — |
| — |
| 4 |
| — |
| | 1 |
| — |
| 3 |
| — |
|
| Total impaired loans with an allowance | 4 |
| — |
| 4 |
| — |
| 8 |
| — |
| | 5 |
| — |
| 9 |
| — |
|
Impaired loans without an allowance: | | | | | | | | | | | |
| Commercial real estate | — |
| — |
| — |
| — |
| 1 |
| — |
| | — |
| — |
| 1 |
| — |
|
| Financial institutions | — |
| — |
| — |
| — |
| 85 |
| — |
| | — |
| — |
| 128 |
| — |
|
| Wealth management loans and mortgages | 4 |
| — |
| 3 |
| — |
| 3 |
| — |
| | 3 |
| — |
| 2 |
| — |
|
Total impaired loans without an allowance (a) | 4 |
| — |
| 3 |
| — |
| 89 |
| — |
| | 3 |
| — |
| 131 |
| — |
|
| Total impaired loans | $ | 8 |
| $ | — |
| $ | 7 |
| $ | — |
| $ | 97 |
| $ | — |
| | $ | 8 |
| $ | — |
| $ | 140 |
| $ | — |
|
| |
(a) | When the discounted cash flows, collateral value or market price equals or exceeds the carrying value of the loan, then the loan does not require an allowance under the accounting standard related to impaired loans. |
|
|
Notes to Consolidated Financial Statements(continued)
|
|
|
| | | | | | | | | | | | | | | | | | | |
| Impaired loans | Sept. 30, 2017 | | Dec. 31, 2016 |
| (in millions) | Recorded investment |
| Unpaid principal balance |
| Related allowance (a) |
| | Recorded investment |
| Unpaid principal balance |
| Related allowance (a) |
|
| Impaired loans with an allowance: | | | | | | | |
| Commercial real estate | $ | — |
| $ | 3 |
| $ | — |
| | $ | — |
| $ | 3 |
| $ | — |
|
| Financial institutions | 2 |
| 2 |
| 2 |
| | — |
| — |
| — |
|
| Wealth management loans and mortgages | 1 |
| 1 |
| — |
| | 3 |
| 3 |
| 3 |
|
| Lease financings | — |
| — |
| — |
| | 4 |
| 4 |
| 2 |
|
| Total impaired loans with an allowance | 3 |
| 6 |
| 2 |
| | 7 |
| 10 |
| 5 |
|
Impaired loans without an allowance: | | | | | | | |
| Wealth management loans and mortgages | 4 |
| 4 |
| N/A |
| | 2 |
| 2 |
| N/A |
|
Total impaired loans without an allowance (b) | 4 |
| 4 |
| N/A |
| | 2 |
| 2 |
| N/A |
|
Total impaired loans (c) | $ | 7 |
| $ | 10 |
| $ | 2 |
| | $ | 9 |
| $ | 12 |
| $ | 5 |
|
| |
(a) | The allowance for impaired loans is included in the allowance for loan losses. |
| |
(b) | When the discounted cash flows, collateral value or market price equals or exceeds the carrying value of the loan, then the loan does not require an allowance under the accounting standard related to impaired loans. |
| |
(c) | Excludes an aggregate of less than $1 million of impaired loans in amounts individually less than $1 million at both Sept. 30, 2017 and Dec. 31, 2016, respectively. The allowance for loan losses associated with these loans totaled less than $1 million at both Sept. 30, 2017 and Dec. 31, 2016, respectively.
|
Past due loans
The table below presents our past due loans.
|
| | | | | | | | | | | | | | | | | | | | | | | | | |
| Past due loans and still accruing interest | Sept. 30, 2017 | | Dec. 31, 2016 |
| | Days past due | Total past due |
| | Days past due | Total past due |
|
| (in millions) | 30-59 |
| 60-89 |
| ≥90 |
| 30-59 |
| 60-89 |
| ≥90 |
|
| Commercial real estate | $ | 51 |
| $ | 60 |
| $ | — |
| $ | 111 |
| | $ | 78 |
| $ | — |
| $ | — |
| $ | 78 |
|
| Wealth management loans and mortgages | 86 |
| 15 |
| 1 |
| 102 |
| | 21 |
| 2 |
| — |
| 23 |
|
| Other residential mortgages | 20 |
| 3 |
| 5 |
| 28 |
| | 20 |
| 6 |
| 7 |
| 33 |
|
| Financial institutions | — |
| — |
| — |
| — |
| | 1 |
| 27 |
| — |
| 28 |
|
| Total past due loans | $ | 157 |
| $ | 78 |
| $ | 6 |
| $ | 241 |
|
| $ | 120 |
| $ | 35 |
| $ | 7 |
| $ | 162 |
|
Troubled debt restructurings (“TDRs”)
A modified loan is considered a TDR if the debtor is experiencing financial difficulties and the creditor grants a concession to the debtor that would not
otherwise be considered. A TDR may include a transfer of real estate or other assets from the debtor to the creditor, or a modification of the term of the loan. Not allWe modified loans are considered TDRs.
The following table presents our TDRs.
|
| | | | | | | | | | | | | | | | | | | | | | | | | | | | | | | | |
| TDRs | 3Q17 | | 2Q17 | | 3Q16 |
| | | Outstanding recorded investment | | | Outstanding recorded investment | | | Outstanding recorded investment |
| (dollars in millions) | Number of contracts |
| Pre-modification | | Post-modification | | | Number of contracts |
| Pre-modification | | Post-modification | | | Number of contracts |
| Pre-modification | | Post-modification | |
| Other residential mortgages | 19 |
| | $ | 5 |
| | $ | 5 |
| | 16 |
| | $ | 4 |
| | $ | 4 |
| | 17 |
| | $ | 4 |
| | $ | 4 |
|
| Wealth management loans and mortgages | 1 |
| | 2 |
| | 2 |
| | — |
| | — |
| | — |
| | — |
| | — |
| | — |
|
| Total TDRs | 20 |
| | $ | 7 |
| | $ | 7 |
| | 16 |
| | $ | 4 |
| | $ | 4 |
| | 17 |
| | $ | 4 |
| | $ | 4 |
|
|
|
Notes to Consolidated Financial Statements(continued)
|
|
Other residential mortgages
The modifications of the other residential mortgage loans$1 million in the thirdfirst quarter of 2017, second2018, $2 million in the fourth quarter of 2017 and third$6 million in the first quarter of 2016 consisted of reducing the stated interest rates and, in certain cases, a forbearance of default and extending the maturity dates. The modified loans are2017, primarily collateral dependent for which the value is based on the fair value of the collateral.
TDRs that subsequently defaulted
There were threeother residential mortgage loans that had been restructured in a TDR during the previous 12mortgages.
months and have subsequently defaulted in the third quarter of 2017. The total recorded investment of these loans was less than $1 million.
Credit quality indicators
Our credit strategy is to focus on investment gradeinvestment-grade clients that are active users of our non-credit services. Each customer is assigned an internal credit rating, which is mapped to an external rating agency grade equivalent, if possible, based upon a number of dimensions, which are continually evaluated and may change over time.
The following tables present information about credit quality indicators.
Commercial loan portfolio
| | Commercial loan portfolio – Credit risk profile by creditworthiness category | Commercial | | Commercial real estate | | Financial institutions | Commercial | | Commercial real estate | | Financial institutions |
| Sept. 30, 2017 |
| Dec. 31, 2016 |
| | Sept. 30, 2017 |
| Dec. 31, 2016 |
| | Sept. 30, 2017 |
| Dec. 31, 2016 |
| March 31,
2018 |
| Dec. 31, 2017 |
| | March 31,
2018 |
| Dec. 31, 2017 |
| | March 31,
2018 |
| Dec. 31, 2017 |
|
| (in millions) | | | | |
| Investment grade | $ | 2,857 |
| $ | 2,397 |
| | $ | 4,339 |
| $ | 3,823 |
| | $ | 9,217 |
| $ | 11,459 |
| $ | 2,427 |
| $ | 2,685 |
| | $ | 4,203 |
| $ | 4,277 |
| | $ | 9,716 |
| $ | 10,021 |
|
| Non-investment grade | 146 |
| 220 |
| | 588 |
| 831 |
| | 2,679 |
| 3,230 |
| 182 |
| 226 |
| | 690 |
| 623 |
| | 3,077 |
| 3,030 |
|
| Total | $ | 3,003 |
| $ | 2,617 |
| | $ | 4,927 |
| $ | 4,654 |
| | $ | 11,896 |
| $ | 14,689 |
| $ | 2,609 |
| $ | 2,911 |
| | $ | 4,893 |
| $ | 4,900 |
| | $ | 12,793 |
| $ | 13,051 |
|
The commercial loan portfolio is divided into investment grade and non-investment grade categories based on rating criteria largely consistent with those of the public rating agencies. Each customer in the portfolio is assigned an internal credit rating. These internal credit ratings are generally consistent with the ratings categories of the public rating agencies. Customers with ratings consistent with BBB- (S&P)/Baa3 (Moody’s) or better are considered to be investment grade. Those clients with ratings lower than this threshold are considered to be non-investment grade.
Wealth management loans and mortgages
| | Wealth management loans and mortgages – Credit risk profile by internally assigned grade | Wealth management loans and mortgages – Credit risk profile by internally assigned grade | Wealth management loans and mortgages – Credit risk profile by internally assigned grade |
| (in millions) | Sept. 30, 2017 |
| Dec. 31, 2016 |
| March 31,
2018 |
| Dec. 31, 2017 |
|
| Wealth management loans: | | |
| Investment grade | $ | 7,128 |
| $ | 7,127 |
| $ | 6,933 |
| $ | 7,042 |
|
| Non-investment grade | 135 |
| 260 |
| 117 |
| 185 |
|
| Wealth management mortgages | 9,002 |
| 8,267 |
| 9,351 |
| 9,301 |
|
| Total | $ | 16,265 |
| $ | 15,654 |
| $ | 16,401 |
| $ | 16,528 |
|
Wealth management non-mortgage loans are not typically rated by external rating agencies. A majority of the wealth management loans are secured by the customers’ investment management accounts or custody accounts. Eligible assets pledged for these loans are typically investment grade fixed-income
securities, equities and/or mutual funds. Internal ratings for this portion of the wealth management portfolio, therefore, would equate to investment gradeinvestment-grade external ratings. Wealth management loans are provided to select customers based on the pledge of other types of assets, including business assets, fixed assets or a modest amount of commercial real estate. For the loans collateralized by other assets, the credit quality of the obligor is carefully analyzed, but we do not consider this portfolio of loans to be investment grade.
Credit quality indicators for wealth management mortgages are not correlated to external ratings. Wealth management mortgages are typically loans to high-net-worth individuals, which are secured primarily by residential property. These loans are primarily interest-only, adjustable rate mortgages with a weighted-average loan-to-value ratio of 62% at origination. In the wealth management portfolio, less than 1% of the mortgages were past due at March 31, 2018.
At March 31, 2018, the wealth management mortgage portfolio consisted of the following geographic concentrations: California - 24%; New York - 18%; Massachusetts - 11%; Florida - 8%; and other - 39%.
|
|
Notes to Consolidated Financial Statements (continued) |
| |
than 1% of the mortgages were past due at Sept. 30, 2017.
At Sept. 30, 2017, the wealth management mortgage portfolio consisted of the following geographic concentrations: California - 24%; New York - 19%; Massachusetts - 11%; Florida - 8%; and other - 38%.
Other residential mortgages
The other residential mortgage portfolio primarily consists of 1-4 family residential mortgage loans and totaled $741$680 million at Sept. 30, 2017March 31, 2018 and $854$708 million at Dec. 31, 2016.2017. These loans are not typically correlated to external ratings. Included in this portfolio at Sept. 30, 2017March 31, 2018 are $181$160 million of mortgage loans purchased in 2005, 2006 and the first quarter of 2007 that are predominantly prime mortgage loans, with a small portion of Alt-A loans. As of Sept. 30, 2017,March 31, 2018, the purchased loans in this portfolio had a weighted-average loan-to-value ratio of 76% at origination, and 11%12% of the serviced loan balance was at least 60 days delinquent. The properties securing the prime and Alt-A mortgage loans were located (in order of concentration) in California, Florida, Virginia, the tri-state area (New York, New Jersey and Connecticut) and Maryland.
Overdrafts
Overdrafts primarily relate to custody and securities clearance clients and totaled $5.8 billion at Sept. 30,
2017March 31, 2018 and $5.5$5.1 billion at Dec. 31, 2016.2017. Overdrafts occur on a daily basis primarily in the custody and securities clearance business and are generally repaid within two business days.
Other loans
Other loans primarily include loans to consumers that are fully collateralized with equities, mutual funds and fixed incomefixed-income securities.
Margin loans
We had $13.9$15.1 billion of secured margin loans on our balance sheet at Sept. 30, 2017March 31, 2018 compared with $17.6$15.8 billion at Dec. 31, 2016.2017. Margin loans are collateralized with marketable securities, and borrowers are required to maintain a daily collateral margin in excess of 100% of the value of the loan. We have rarely suffered a loss on these types of loans and do not allocate any of our allowance for credit losses to margin loans.
Reverse repurchase agreements
Reverse repurchase agreements are transactions fully collateralized with high-quality liquid securities. These transactions carry minimal credit risk and therefore are not allocated an allowance for credit losses.
Note 6 - 6–Goodwill and intangible assets
Goodwill
The tables below provide a breakdown of goodwill by business.
| | Goodwill by business (in millions) | Investment
Management |
| Investment
Services |
| Other |
| Consolidated |
| Investment
Services |
| Investment
Management |
| Other |
| Consolidated |
|
| Balance at Dec. 31, 2016 | $ | 9,000 |
| $ | 8,269 |
| $ | 47 |
| $ | 17,316 |
| |
| Balance at Dec. 31, 2017 | | $ | 8,389 |
| $ | 9,128 |
| $ | 47 |
| $ | 17,564 |
|
| Disposition | | — |
| (52 | ) | — |
| (52 | ) |
| Foreign currency translation | 120 |
| 107 |
| — |
| 227 |
| 31 |
| 53 |
| — |
| 84 |
|
| Balance at Sept. 30, 2017 | $ | 9,120 |
| $ | 8,376 |
| $ | 47 |
| $ | 17,543 |
| |
| Balance at March 31, 2018 | | $ | 8,420 |
| $ | 9,129 |
| $ | 47 |
| $ | 17,596 |
|
|
| | | | | | | | | | | | |
Goodwill by business (in millions) | Investment
Management |
| Investment
Services |
| Other |
| Consolidated |
|
| Balance at Dec. 31, 2015 | $ | 9,207 |
| $ | 8,366 |
| $ | 45 |
| $ | 17,618 |
|
| Acquisitions | 29 |
| (1 | ) | — |
| 28 |
|
| Foreign currency translation | (167 | ) | (30 | ) | — |
| (197 | ) |
Other (a) | 2 |
| (4 | ) | 2 |
| — |
|
| Balance at Sept. 30, 2016 | $ | 9,071 |
| $ | 8,331 |
| $ | 47 |
| $ | 17,449 |
|
|
| | | | | | | | | | | | |
Goodwill by business (in millions) | Investment
Services |
| Investment
Management |
| Other |
| Consolidated |
|
| Balance at Dec. 31, 2016 | $ | 8,269 |
| $ | 9,000 |
| $ | 47 |
| $ | 17,316 |
|
| Foreign currency translation | 18 |
| 21 |
| — |
| 39 |
|
| Balance at March 31, 2017 | $ | 8,287 |
| $ | 9,021 |
| $ | 47 |
| $ | 17,355 |
|
| |
(a) | Other changes in goodwill include purchase price adjustments and certain other reclassifications. |
|
|
Notes to Consolidated Financial Statements (continued) |
| |
Intangible assets
The tables below provide a breakdown of intangible assets by business.
| | Intangible assets – net carrying amount by business
(in millions) | Investment
Management |
| Investment
Services |
| Other |
| Consolidated |
| Investment
Services |
| Investment
Management |
| Other |
| Consolidated |
|
| Balance at Dec. 31, 2016 | $ | 1,717 |
| $ | 1,032 |
| $ | 849 |
| $ | 3,598 |
| |
| Balance at Dec. 31, 2017 | | $ | 888 |
| $ | 1,674 |
| $ | 849 |
| $ | 3,411 |
|
| Amortization | (45 | ) | (112 | ) | — |
| (157 | ) | (36 | ) | (13 | ) | — |
| (49 | ) |
| Foreign currency translation | 16 |
| 4 |
| — |
| 20 |
| — |
| 8 |
| — |
| 8 |
|
| Balance at Sept. 30, 2017 | $ | 1,688 |
| $ | 924 |
| $ | 849 |
| $ | 3,461 |
| |
| Balance at March 31, 2018 | | $ | 852 |
| $ | 1,669 |
| $ | 849 |
| $ | 3,370 |
|
| | Intangible assets – net carrying amount by business
(in millions) | Investment
Management |
| Investment
Services |
| Other |
| Consolidated |
| Investment
Services |
| Investment
Management |
| Other |
| Consolidated |
|
| Balance at Dec. 31, 2015 | $ | 1,807 |
| $ | 1,186 |
| $ | 849 |
| $ | 3,842 |
| |
| Acquisitions | 30 |
| 2 |
| — |
| 32 |
| |
| Balance at Dec. 31, 2016 | | $ | 1,032 |
| $ | 1,717 |
| $ | 849 |
| $ | 3,598 |
|
| Amortization | (60 | ) | (117 | ) | — |
| (177 | ) | (37 | ) | (15 | ) | — |
| (52 | ) |
| Foreign currency translation | (27 | ) | 1 |
| — |
| (26 | ) | — |
| 3 |
| — |
| 3 |
|
| Balance at Sept. 30, 2016 | $ | 1,750 |
| $ | 1,072 |
| $ | 849 |
| $ | 3,671 |
| |
| Balance at March 31, 2017 | | $ | 995 |
| $ | 1,705 |
| $ | 849 |
| $ | 3,549 |
|
The table below provides a breakdown of intangible assets by type.
| | | Intangible assets | Sept. 30, 2017 | | Dec. 31, 2016 | March 31, 2018 | | Dec. 31, 2017 |
| (in millions) | Gross carrying amount |
| Accumulated amortization |
| Net carrying amount |
| Remaining weighted- average amortization period | | Gross
carrying
amount |
| Accumulated
amortization |
| Net carrying amount |
| Gross carrying amount |
| Accumulated amortization |
| Net carrying amount |
| Remaining weighted- average amortization period | | Gross
carrying
amount |
| Accumulated
amortization |
| Net carrying amount |
|
Subject to amortization: (a) | | | | | | |
| Customer contracts—Investment Services | | $ | 2,263 |
| $ | (1,781 | ) | $ | 482 |
| 10 years | | $ | 2,260 |
| $ | (1,744 | ) | $ | 516 |
|
| Customer relationships—Investment Management | $ | 1,483 |
| $ | (1,221 | ) | $ | 262 |
| 11 years | | $ | 1,439 |
| $ | (1,136 | ) | $ | 303 |
| 1,274 |
| (1,038 | ) | 236 |
| 11 years | | 1,262 |
| (1,015 | ) | 247 |
|
| Customer contracts—Investment Services | 2,257 |
| (1,705 | ) | 552 |
| 10 years | | 2,249 |
| (1,590 | ) | 659 |
| |
| Other | 25 |
| (22 | ) | 3 |
| 2 years | | 37 |
| (33 | ) | 4 |
| 41 |
| (24 | ) | 17 |
| 4 years | | 42 |
| (23 | ) | 19 |
|
| Total subject to amortization | 3,765 |
| (2,948 | ) | 817 |
| 10 years | | 3,725 |
| (2,759 | ) | 966 |
| 3,578 |
| (2,843 | ) | 735 |
| 10 years | | 3,564 |
| (2,782 | ) | 782 |
|
Not subject to amortization: (b) | | | | | | |
| Trade name | 1,350 |
| N/A |
| 1,350 |
| N/A | | 1,348 |
| N/A |
| 1,348 |
| |
| Tradenames | | 1,335 |
| N/A |
| 1,335 |
| N/A | | 1,334 |
| N/A |
| 1,334 |
|
| Customer relationships | 1,294 |
| N/A |
| 1,294 |
| N/A | | 1,284 |
| N/A |
| 1,284 |
| 1,300 |
| N/A |
| 1,300 |
| N/A | | 1,295 |
| N/A |
| 1,295 |
|
| Total not subject to amortization | 2,644 |
| N/A |
| 2,644 |
| N/A | | 2,632 |
| N/A |
| 2,632 |
| 2,635 |
| N/A |
| 2,635 |
| N/A | | 2,629 |
| N/A |
| 2,629 |
|
| Total intangible assets | $ | 6,409 |
| $ | (2,948 | ) | $ | 3,461 |
| N/A | | $ | 6,357 |
| $ | (2,759 | ) | $ | 3,598 |
| $ | 6,213 |
| $ | (2,843 | ) | $ | 3,370 |
| N/A | | $ | 6,193 |
| $ | (2,782 | ) | $ | 3,411 |
|
| |
| (a) | Excludes fully amortized intangible assets. |
| |
| (b) | Intangible assets not subject to amortization have an indefinite life. |
Estimated annual amortization expense for current intangibles for the next five years is as follows:
| | For the year ended
Dec. 31, | Estimated amortization expense (in millions) | | Estimated amortization expense (in millions) | |
| 2017 | | $ | 209 |
| |
| 2018 | | 180 |
| | $ | 181 |
|
| 2019 | | 109 |
| | 116 |
|
| 2020 | | 98 |
| | 102 |
|
| 2021 | | 75 |
| | 79 |
|
| 2022 | | | 60 |
|
Impairment testing
The goodwill impairment test is performed at least annually at the reporting unit level. Intangible assets not subject to amortization are tested for impairment annually or more often if events or circumstances indicate they may be impaired.
BNY Mellon’s three business segments include eight reporting units for which goodwill impairment testing is performed on an annual basis. In the second quarter of 2017, BNY Mellon conducted an annual goodwill impairment test on all eight reporting units.
|
|
Notes to Consolidated Financial Statements (continued) |
| |
As a result of the annual goodwill impairment test of the eight reporting units, no goodwill impairment was recognized.
Note 7 - 7–Other assets
The following table provides the components of other assets presented on the consolidated balance sheet.
| | | Other assets | Sept. 30, 2017 |
| Dec. 31, 2016 |
| March 31, 2018 |
| Dec. 31, 2017 |
|
| (in millions) |
| Corporate/bank-owned life insurance | $ | 4,824 |
| $ | 4,789 |
| $ | 4,866 |
| $ | 4,857 |
|
| Accounts receivable | 3,899 |
| 4,060 |
| 3,454 |
| 4,590 |
|
| Fails to deliver | 3,532 |
| 1,732 |
| 2,761 |
| 2,817 |
|
| Software | 1,513 |
| 1,451 |
| 1,515 |
| 1,499 |
|
| Prepaid pension assets | | 1,471 |
| 1,416 |
|
| Income taxes receivable | | 1,397 |
| 1,533 |
|
| Renewable energy investments | 1,344 |
| 1,282 |
| 1,354 |
| 1,368 |
|
| Equity in a joint venture and other investments | 1,153 |
| 1,063 |
| 1,080 |
| 1,083 |
|
| Income taxes receivable | 1,020 |
| 1,172 |
| |
Qualified affordable housing project investments
| 988 |
| 914 |
| 980 |
| 1,014 |
|
| Prepaid pension assets | 951 |
| 836 |
| |
| Prepaid expenses | 512 |
| 438 |
| |
| Federal Reserve Bank stock | 474 |
| 466 |
| 477 |
| 477 |
|
| Prepaid expense | | 472 |
| 395 |
|
| Seed capital | | 301 |
| 288 |
|
| Fair value of hedging derivatives | 344 |
| 784 |
| 56 |
| 323 |
|
| Due from customers on acceptances | 318 |
| 340 |
| |
| Seed capital | 302 |
| 395 |
| |
Other (a) | 1,113 |
| 1,232 |
| 1,454 |
| 1,369 |
|
| Total other assets | $ | 22,287 |
| $ | 20,954 |
| $ | 21,638 |
| $ | 23,029 |
|
| |
| (a) | At Sept. 30,March 31, 2018 and Dec. 31, 2017, other assets include $76$36 million and $82 million, respectively, of Federal Home Loan Bank stock, at cost. |
Qualified affordable housing project investments
We invest in affordable housing projects primarily to satisfy the Company’s requirements under the Community Reinvestment Act. Our total investment in qualified affordable housing projects totaled $988$980 million at Sept. 30, 2017March 31, 2018 and $914 million$1.0 billion at Dec. 31, 2016.2017. Commitments to fund future investments in qualified affordable housing projects totaled $439$455 million at Sept. 30, 2017March 31, 2018 and $369$486 million at Dec. 31, 2016.2017 and is recorded in other liabilities. A
summary of the commitments to fund future investments is as follows: 20172018 – $75 million; 2018 –
$161169 million; 2019 – $107119 million; 2020 – $79107 million; 2021 – $42 million; 2022 – $1 million; and 20222023 and thereafter – $1617 million.
Tax credits and other tax benefits recognized were $39$40 million in the thirdfirst quarter of 2018, $41 million in the fourth quarter of 2017 $39 million in the third quarter of 2016,and $38 million in the secondfirst quarter of 2017, $115 million in the first nine months of 2017 and $115 million in the first nine months of 2016.2017.
Amortization expense included in the provision for income taxes was $29 million in the third quarter of 2017, $30 million in the third quarter of 2016, $28 million in the second quarter of 2017, $84$33 million in the first nine monthsquarter of 2018, $69 million in the fourth quarter of 2017 and $86$27 million in the first nine monthsquarter of 2016.2017.
Certain seed capital and private equity investmentsInvestments valued using net asset value per share
In our Investment Management business, we manage investment assets, including equities, fixed income, money market and multi-asset and alternative investment funds for institutions and other investors. As part of that activity, we make seed capital investments in certain funds. BNY MellonWe also holdshold private equity investments, specifically in small business investment companies (“SBICs”), which are compliant with the Volcker Rule.Rule, and certain other corporate investments. Seed capital, and private equity and other corporate investments are generally included in other assets. Certain risk retention investments in our CLOs are classified as available-for-sale securities.
assets on the consolidated balance sheet. The fair value of certain of these investments has beenwas estimated using the NAVnet asset value (“NAV”) per share offor BNY Mellon’s ownership interest in the funds.
The table below presents information abouton our investments in seed capital and private equity investments that have been valued using NAV.
|
| | | | | | | | | | | | | | | | | | | |
| Seed capital and private equity investments valued using NAV |
| | Sept. 30, 2017 | | Dec. 31, 2016 |
(dollar amounts in millions) | Fair value |
| Unfunded commitments | | Redemption frequency | Redemption notice period | | Fair value |
| Unfunded commitments | | Redemption frequency | Redemption notice period |
Seed capital and other funds (a) | $ | 97 |
| | $ | 2 |
| Daily-quarterly | 1-95 days | | $ | 171 |
| | $ | 1 |
| Daily-quarterly | 1-180 days |
Private equity investments (SBICs) (b) | 54 |
| | 47 |
| N/A | N/A | | 43 |
| | 46 |
| N/A | N/A |
| Total | $ | 151 |
| | $ | 49 |
| | | | $ | 214 |
| | $ | 47 |
| | |
|
| | | | | | | | | | | | | | | | | | | |
| Other assets valued using NAV |
| | March 31, 2018 | | Dec. 31, 2017 |
(dollars in millions) | Fair value |
| Unfunded commitments | | Redemption frequency | Redemption notice period | | Fair value |
| Unfunded commitments | | Redemption frequency | Redemption notice period |
| Seed capital | $ | 42 |
| | $ | — |
| Daily-quarterly | 1-90 days | | $ | 40 |
| | $ | 1 |
| Daily-quarterly | 1-90 days |
Private equity investments (SBICs) (a) | 59 |
| | 39 |
| N/A | N/A | | 55 |
| | 42 |
| N/A | N/A |
Other (b) | 59 |
| | — |
| Daily-quarterly | 1-95 days | | 59 |
| | — |
| Daily-quarterly | 1-95 days |
| Total | $ | 160 |
| | $ | 39 |
| | | | $ | 154 |
| | $ | 43 |
| | |
| |
| (a) | Other funds include various leveraged loans, hedge funds and structured credit funds. Redemption notice periods vary by fund. |
| |
(b) | Private equity investments primarily include Volcker Rule-compliant investments in SBICs that invest in various sectors of the economy. Private equity investments do not have redemption rights. Distributions from such investments will be received as the underlying investments in the private equity investments, which have a life of 10 years, are liquidated. |
| |
| (b) | Primarily relates to investments in funds that relate to deferred compensation arrangements with employees. |
N/A - Not applicable.
|
|
Notes to Consolidated Financial Statements (continued) |
| |
Note 8 - Net interest8–Contract revenue
Significant accounting policy
Revenue is based on terms specified in a contract with a customer, and excludes any amounts collected on behalf of third parties. Revenue is recognized when, or as, a performance obligation is satisfied by transferring control of a good or service to a customer. A performance obligation may be satisfied over time or at a point in time. Revenue from a performance obligation satisfied over time is recognized by measuring our progress in satisfying the performance obligation in a manner that reflects the transfer of goods and services to the customer. Revenue from a performance obligation satisfied at a point in time is recognized at the point in time the customer obtains control of the promised good or service. The following table providesamount of revenue recognized reflects the componentsconsideration we expect to be entitled to in exchange for the promised goods and services. Taxes assessed by a governmental authority, that are both imposed on, and concurrent with, a specific revenue-producing transaction, are collected from a customer and are excluded from revenue.
Nature of net interestservices and revenue presentedrecognition
Fee revenue in Investment Services and Investment Management is primarily variable, based on levels of AUC/A, AUM and the level of client-driven transactions, as specified in fee schedules.
Investment Services fees are based primarily on the market value of AUC/A; client accounts, balances and the volume of transactions; securities lending volume and spreads; and fees for other services. Certain fees based on the market value of assets are calculated in arrears on a monthly or quarterly basis.
Substantially all services within the Investment Services business are provided over time. Revenue on these services is recognized using the time elapsed method, equal to the expected invoice amount, which typically represents the value provided to the customer for our performance completed to date.
Trade execution and clearing services are delivered at a point-in-time, based on customer actions. Revenue for trade execution and clearing services is recognized on trade date, which is consistent with the time that the service was provided. Customers are generally billed for services on a monthly or quarterly basis.
Investment management fees are dependent on the overall level and mix of AUM. The management fees, expressed in basis points, are charged for managing those assets. Management fees are typically subject to fee schedules based on the overall level of assets managed and products in which those assets are invested.
Investment management fee revenue also includes transactional- and account-based fees. These fees along with distribution and servicing fees are recognized when the services have been complete. Clients are generally billed for services performed on a monthly or quarterly basis.
Performance fees are generally calculated as a percentage of the applicable portfolio’s performance in excess of a benchmark index or a peer group’s performance. Performance fees are recognized at the end of the measurement period when they are determinable.
See Note 19 for additional information on our two principal businesses, Investment Services and Investment Management and the primary services provided.
Disaggregation of contract revenue
Contract revenue is included in fee revenue on the consolidated income statement. The following table presents fee revenue related to contracts with customers, disaggregated by type, for each business segment.
|
| | | | | | | | | | | | | | | | |
| Net interest revenue | Quarter ended | | Year-to-date |
| | Sept. 30, 2017 |
| June 30, 2017 |
| Sept. 30, 2016 |
| | Sept. 30, 2017 |
| Sept. 30, 2016 |
|
| (in millions) | |
| Interest revenue | | | | | | |
| Non-margin loans | $ | 283 |
| $ | 272 |
| $ | 218 |
| | $ | 800 |
| $ | 637 |
|
| Margin loans | 87 |
| 87 |
| 67 |
| | 249 |
| 194 |
|
| Securities: | | | | | | |
| Taxable | 510 |
| 476 |
| 434 |
| | 1,447 |
| 1,307 |
|
| Exempt from federal income taxes | 16 |
| 16 |
| 17 |
| | 49 |
| 53 |
|
| Total securities | 526 |
| 492 |
| 451 |
|
| 1,496 |
| 1,360 |
|
| Deposits with banks | 34 |
| 27 |
| 26 |
| | 83 |
| 76 |
|
| Deposits with the Federal Reserve and other central banks | 89 |
| 71 |
| 37 |
| | 217 |
| 170 |
|
| Federal funds sold and securities purchased under resale agreements | 119 |
| 86 |
| 62 |
| | 272 |
| 167 |
|
| Trading assets | 13 |
| 17 |
| 13 |
| | 46 |
| 43 |
|
| Total interest revenue | 1,151 |
| 1,052 |
| 874 |
|
| 3,163 |
| 2,647 |
|
| Interest expense | | | | | | |
| Deposits | 57 |
| 32 |
| (6 | ) | | 98 |
| 21 |
|
| Federal funds purchased and securities sold under repurchase agreements | 70 |
| 38 |
| 6 |
| | 132 |
| 28 |
|
| Trading liabilities | 2 |
| 2 |
| 2 |
| | 6 |
| 5 |
|
| Other borrowed funds | 7 |
| 4 |
| 1 |
| | 13 |
| 5 |
|
| Commercial paper | 8 |
| 5 |
| 1 |
| | 18 |
| 5 |
|
| Customer payables | 19 |
| 16 |
| 3 |
| | 42 |
| 9 |
|
| Long-term debt | 149 |
| 129 |
| 93 |
| | 397 |
| 267 |
|
| Total interest expense | 312 |
| 226 |
| 100 |
|
| 706 |
| 340 |
|
| Net interest revenue | 839 |
| 826 |
| 774 |
|
| 2,457 |
| 2,307 |
|
| Provision for credit losses | (6 | ) | (7 | ) | (19 | ) | | (18 | ) | (18 | ) |
| Net interest revenue after provision for credit losses | $ | 845 |
| $ | 833 |
| $ | 793 |
|
| $ | 2,475 |
| $ | 2,325 |
|
Note 9 - Employee benefit plans
The components of net periodic benefit (credit) cost are as follows.
|
| | | | | | | | | | | | | | | | | | | | | | | | | | | | | |
| Net periodic benefit (credit) cost | Quarter ended |
| Sept. 30, 2017 | | June 30, 2017 | | Sept. 30, 2016 |
| (in millions) | Domestic pension benefits |
| Foreign pension benefits |
| Health care benefits |
| | Domestic pension benefits |
| Foreign pension benefits |
| Health care benefits |
| | Domestic pension benefits |
| Foreign pension benefits |
| Health care benefits |
|
| Service cost | $ | — |
| $ | 7 |
| $ | — |
| | $ | — |
| $ | 7 |
| $ | — |
| | $ | — |
| $ | 8 |
| $ | 1 |
|
| Interest cost | 45 |
| 8 |
| 2 |
| | 45 |
| 8 |
| 2 |
| | 45 |
| 9 |
| 2 |
|
| Expected return on assets | (81 | ) | (12 | ) | (2 | ) | | (81 | ) | (12 | ) | (2 | ) | | (82 | ) | (13 | ) | (2 | ) |
| Other | 17 |
| 9 |
| (1 | ) | | 17 |
| 9 |
| (1 | ) | | 17 |
| 4 |
| (1 | ) |
| Net periodic benefit (credit) cost | $ | (19 | ) | $ | 12 |
| $ | (1 | ) | | $ | (19 | ) | $ | 12 |
| $ | (1 | ) | | $ | (20 | ) | $ | 8 |
| $ | — |
|
|
|
Notes to Consolidated Financial Statements (continued) |
| |
|
| | | | | | | | | | | | |
Disaggregation of contract revenue by business segment (a) |
| | Quarter ended March 31, 2018 |
| (in millions) | Investment Services |
| Investment Management |
| Other |
| Total |
|
| Fee revenue - contract revenue: | | | | |
| Investment services fees: | | | | |
| Asset servicing | $ | 1,117 |
| $ | 25 |
| $ | — |
| $ | 1,142 |
|
| Clearing services | 413 |
| — |
| 1 |
| 414 |
|
| Issuer services | 260 |
| — |
| — |
| 260 |
|
| Treasury services | 138 |
| — |
| — |
| 138 |
|
| Total investment services fees | 1,928 |
| 25 |
| 1 |
| 1,954 |
|
| Investment management and performance fees | 14 |
| 942 |
| — |
| 956 |
|
| Financing-related fees | 17 |
| — |
| — |
| 17 |
|
| Distribution and servicing | (14 | ) | 50 |
| — |
| 36 |
|
| Investment and other income | 69 |
| (51 | ) | — |
| 18 |
|
| Total fee revenue - contract revenue | 2,014 |
| 966 |
| 1 |
| 2,981 |
|
Fee and other revenue - not in scope of ASC 606 (b) | 236 |
| 46 |
| 7 |
| 289 |
|
| Total fee and other revenue | $ | 2,250 |
| $ | 1,012 |
| $ | 8 |
| $ | 3,270 |
|
| |
| (a) | Business segment data has been determined on an internal management basis of accounting, rather than the generally accepted accounting principles used for consolidated financial reporting. |
| |
| (b) | Primarily includes foreign exchange and other trading revenue, financing-related fees, investment and other income and net securities gains, all of which are accounted for using other accounting guidance. |
Contract balances
Our clients are billed based on fee schedules that are agreed upon in each customer contract. Receivables from customers were $3.9 billion at Jan. 1, 2018 and $2.9 billion at March 31, 2018. An allowance is maintained for accounts receivables which is generally based on the number of days outstanding. Adjustments to the allowance are recorded in other expense in the consolidated income statement. A provision of $2 million was recorded in the first quarter of 2018.
Contract assets represent accrued revenues that have not yet been billed to the customers due to certain contractual terms other than the passage of time and were $30 million at Jan. 1, 2018 and $45 million at March 31, 2018. Accrued revenues recorded as contract assets are usually billed on an annual basis. There were no impairments recorded on contract assets in the first quarter of 2018.
Both receivables from customers and contract assets are included in other assets on the consolidated balance sheet.
|
| | | | | | | | | | | | | | | | | | | |
| Net periodic benefit (credit) cost | | Year-to-date | | |
| | Sept. 30, 2017 | | Sept. 30, 2016 |
| (in millions) | Domestic pension benefits |
| Foreign pension benefits |
| Health care benefits |
| | Domestic pension benefits |
| Foreign pension benefits |
| Health care benefits |
|
| Service cost | $ | — |
| $ | 21 |
| $ | — |
| | $ | — |
| $ | 24 |
| $ | 3 |
|
| Interest cost | 135 |
| 24 |
| 6 |
| | 135 |
| 27 |
| 6 |
|
| Expected return on assets | (243 | ) | (36 | ) | (6 | ) | | (246 | ) | (39 | ) | (6 | ) |
| Other | 51 |
| 27 |
| (3 | ) | | 52 |
| 13 |
| (3 | ) |
| Net periodic benefit (credit) cost | $ | (57 | ) | $ | 36 |
| $ | (3 | ) | | $ | (59 | ) | $ | 25 |
| $ | — |
|
Contract liabilities represent payments received in advance of providing services under certain contracts and were $167 million at Jan. 1, 2018 and $190 million at March 31, 2018. Contract liabilities are included in other liabilities on the consolidated balance sheet. Revenue recognized in the first quarter of 2018 relating to contract liabilities as of Jan. 1, 2018 was $43 million.
Changes in contract assets and liabilities primarily relate to either party’s performance under the contracts.
Contract costs
Incremental costs for obtaining contracts subject to the scope of Accounting Standards Codification (“ASC”) 606, Revenue From Contracts With Customers that are deemed recoverable are capitalized as contract costs. Such costs result from the payment of sales incentives, primarily in the Wealth Management business, and totaled $109 million at March 31, 2018. Capitalized sales incentives are amortized based on the transfer of goods or services to which the assets relate and typically average nine years. The amortization of capitalized sales incentives, which is primarily included in staff expense, totaled $5 million in the first quarter of 2018.
Costs to fulfill a contract are capitalized when they relate directly to an existing contract or specific anticipated contract, generate or enhance resources that will be used to fulfill performance obligations and are recoverable. Such costs generally represent set-up costs, which include any direct cost incurred at inception of a contract which enables the fulfillment of the performance obligation and totaled $15 million at March 31, 2018. These capitalized costs are amortized on a straight line basis over the expected contract period which generally range from seven to nine years. The amortization is included in other expense and totaled $1 million in the first quarter of 2018.
There was no impairment recorded on capitalized contract costs in the first quarter of 2018.
Unsatisfied performance obligations
We do not have any unsatisfied performance obligations other than those that are subject to a practical expedient election under ASC 606, Revenue
|
|
Notes to Consolidated Financial Statements(continued) |
|
From Contracts With Customers. The practical expedient election applies to (i) contracts with an original expected length of one year or less, and (ii)
contracts for which we recognize revenue at the amount to which we have the right to invoice for services performed.
Note 9–Net interest revenue
The following table provides the components of net interest revenue presented on the consolidated income statement.
|
| | | | | | | | | |
| Net interest revenue | Quarter ended |
| | March 31, 2018 |
| Dec. 31, 2017 |
| March 31, 2017 |
|
| (in millions) |
| Interest revenue | | | |
| Non-margin loans | $ | 305 |
| $ | 277 |
| $ | 245 |
|
| Margin loans | 115 |
| 94 |
| 75 |
|
| Securities: | | | |
| Taxable | 581 |
| 530 |
| 461 |
|
| Exempt from federal income taxes | 15 |
| 15 |
| 17 |
|
| Total securities | 596 |
| 545 |
| 478 |
|
| Deposits with banks | 42 |
| 37 |
| 22 |
|
| Deposits with the Federal Reserve and other central banks | 126 |
| 102 |
| 57 |
|
| Federal funds sold and securities purchased under resale agreements | 170 |
| 151 |
| 67 |
|
| Trading assets | 27 |
| 13 |
| 16 |
|
| Total interest revenue | 1,381 |
| 1,219 |
| 960 |
|
| Interest expense | | | |
| Deposits | 117 |
| 64 |
| 9 |
|
| Federal funds purchased and securities sold under repurchase agreements | 107 |
| 93 |
| 24 |
|
| Trading liabilities | 9 |
| 1 |
| 2 |
|
| Other borrowed funds | 9 |
| 13 |
| 2 |
|
| Commercial paper | 12 |
| 11 |
| 5 |
|
| Customer payables | 31 |
| 22 |
| 7 |
|
| Long-term debt | 177 |
| 164 |
| 119 |
|
| Total interest expense | 462 |
| 368 |
| 168 |
|
| Net interest revenue | 919 |
| 851 |
| 792 |
|
| Provision for credit losses | (5 | ) | (6 | ) | (5 | ) |
| Net interest revenue after provision for credit losses | $ | 924 |
| $ | 857 |
| $ | 797 |
|
Note 10–Employee benefit plans
The components of net periodic benefit (credit) cost are as follows. The service cost component is reflected in staff expense, whereas the remaining components are reflected in other expense.
|
| | | | | | | | | | | | | | | | | | | |
| Net periodic benefit (credit) cost | Quarter ended |
| | March 31, 2018 | | March 31, 2017 |
| (in millions) | Domestic pension benefits |
| Foreign pension benefits |
| Health care benefits |
| | Domestic pension benefits |
| Foreign pension benefits |
| Health care benefits |
|
| Service cost | $ | — |
| $ | 7 |
| $ | — |
| | $ | — |
| $ | 7 |
| $ | — |
|
| Interest cost | 43 |
| 8 |
| 2 |
| | 45 |
| 8 |
| 2 |
|
| Expected return on assets | (85 | ) | (15 | ) | (2 | ) | | (81 | ) | (12 | ) | (2 | ) |
| Other | 17 |
| 6 |
| (1 | ) | | 17 |
| 9 |
| (1 | ) |
| Net periodic benefit (credit) cost | $ | (25 | ) | $ | 6 |
| $ | (1 | ) | | $ | (19 | ) | $ | 12 |
| $ | (1 | ) |
|
|
Notes to Consolidated Financial Statements(continued) |
|
Note 10 - 11–Income taxes
BNY Mellon recorded an income tax provision of $348$282 million (25.4%(19.5% effective tax rate) in the thirdfirst quarter of 2018 and $269 million (22.3% effective tax rate) in the first quarter of 2017. The income tax provision was $324benefit of $453 million (24.6% effective tax rate) in the thirdfourth quarter of 2016 and $3322017 included an estimated tax benefit of $710 million (25.4% effectiverelated to U.S. tax rate)legislation. There were no adjustments to this estimated tax benefit recorded in the secondfirst quarter of 2017.2018.
Our total tax reserves as of Sept. 30, 2017March 31, 2018 were $157$130 million compared with $143$128 million at June 30,Dec. 31, 2017. If these tax reserves were unnecessary, $157$130 million would affect the effective tax rate in future periods. We recognize accrued interest and penalties, if applicable, related to income taxes in income tax expense. Included in the balance sheet at Sept. 30, 2017March 31, 2018 is accrued interest, where applicable, of $24$18 million. The additional tax expense related to interest for the ninethree months ended Sept. 30, 2017March 31, 2018 was $7$1 million, compared with $2 million for the ninethree months ended Sept. 30, 2016.March 31, 2017.
It is reasonably possible the total reserve for uncertain tax positions could decrease within the next 12 months by approximately $57$38 million as a result of adjustments related to tax years that are still subject to examination.
Our federal income tax returns are closed to examination through 2013. Our New York State, New York City and UK income tax returns are closed to examination through 2012.
Note 11 - 12–Variable interest entities and securitization
BNY Mellon has variable interests in VIEs, which include investments in retail, institutional and alternative investment funds, including collateralized loan obligation (“CLO”)CLO structures in which we provide asset management services, some of which are consolidated. The investment funds are offered to our retail and institutional clients to provide them
with access to investment vehicles with specific investment objectives and strategies that address the client’s investment needs.
BNY Mellon earns management fees from these funds as well as performance fees in certain funds and may also provide start-up capital for its new funds. The funds are primarily financed by our customers’ investments in the funds’ equity or debt.
Additionally, BNY Mellon invests in qualified affordable housing and renewable energy projects, which are designed to generate a return primarily through the realization of tax credits by the Company. The projects, which are structured as limited partnerships and LLCs, are also VIEs, but are not consolidated.
The VIEs previously discussed above are included in the scope of ASU 2015-02 which was adopted effective Jan. 1, 2015, and are reviewed for consolidation based on the guidance in ASC 810, Consolidation.We reconsider and reassess whether or not we are the primary beneficiary of a VIE when governing documents or contractual arrangements are changed that would reallocate the obligation to absorb expected losses or receive expected residual returns between BNY Mellon and the other investors. This could occur when BNY Mellon disposes of its variable interests in the fund, when additional variable interests are issued to other investors or when we acquire additional variable interests in the VIE.
The following tables presenttable presents the incremental assets and liabilities included in BNY Mellon’s consolidated financial statements, after applying intercompany eliminations, as of Sept. 30, 2017March 31, 2018 and Dec. 31, 2016.2017. The net assets of any consolidated VIE are solely available to settle the liabilities of the VIE and to settle any investors’ ownership liquidation requests, including any seed capital invested in the VIE by BNY Mellon.
|
|
Notes to Consolidated Financial Statements (continued) |
| |
| | | Investments consolidated at Sept. 30, 2017 | |
| Consolidated investments | | Consolidated investments | | | | |
| | | March 31, 2018 | | Dec. 31, 2017 |
| (in millions) | Investment Management funds | Securitization |
| Total consolidated investments |
| Investment Management funds | Securitization |
| Total consolidated investments |
| | Investment Management funds | Securitization |
| Total consolidated investments |
|
| Securities - Available-for-sale | $ | — |
| | $ | 400 |
| $ | 400 |
| $ | — |
| | $ | — |
| $ | — |
| | $ | — |
| | $ | 400 |
| $ | 400 |
|
| Trading assets | 576 |
| | — |
| 576 |
| 353 |
| | 400 |
| 753 |
| | 516 |
| | — |
| 516 |
|
| Other assets | 226 |
| | — |
| 226 |
| 253 |
| | — |
| 253 |
| | 215 |
| | — |
| 215 |
|
| Total assets | $ | 802 |
| (a) | $ | 400 |
| $ | 1,202 |
| $ | 606 |
| (a) | $ | 400 |
| $ | 1,006 |
| | $ | 731 |
| (b) | $ | 400 |
| $ | 1,131 |
|
| Other liabilities | $ | 27 |
| | $ | 369 |
| $ | 396 |
| $ | 11 |
| | $ | 363 |
| $ | 374 |
| | $ | 2 |
| | $ | 367 |
| $ | 369 |
|
| Total liabilities | $ | 27 |
| (a) | $ | 369 |
| $ | 396 |
| $ | 11 |
| (a) | $ | 363 |
| $ | 374 |
| | $ | 2 |
| (b) | $ | 367 |
| $ | 369 |
|
| Nonredeemable noncontrolling interests | $ | 384 |
| (a) | $ | — |
| $ | 384 |
| $ | 212 |
| (a) | $ | — |
| $ | 212 |
| | $ | 316 |
| (b) | $ | — |
| $ | 316 |
|
| |
| (a) | Includes voting model entities (“VMEs”) with assets of $90$55 million, liabilities of $2less than $1 million and nonredeemable noncontrolling interests of $20less than $1 million. |
| |
| (b) | Includes VMEs with assets of $84 million, liabilities of $1 million and nonredeemable noncontrolling interests of $1 million. |
|
| | | | | | | | | | |
| Investments consolidated at Dec. 31, 2016 |
| (in millions) | Investment Management funds | Securitization |
| Total consolidated investments |
|
| Securities - Available-for-sale | $ | — |
| | $ | 400 |
| $ | 400 |
|
| Trading assets | 979 |
| | — |
| 979 |
|
| Other assets | 252 |
| | — |
| 252 |
|
| Total assets | $ | 1,231 |
| (a) | $ | 400 |
| $ | 1,631 |
|
| Trading liabilities | $ | 282 |
| | $ | — |
| $ | 282 |
|
| Other liabilities | 33 |
| | 363 |
| 396 |
|
| Total liabilities | $ | 315 |
| (a) | $ | 363 |
| $ | 678 |
|
| Nonredeemable noncontrolling interests | $ | 618 |
| (a) | $ | — |
| $ | 618 |
|
| |
(a) | Includes VMEs with assets of $114 million, liabilities of $3 million and nonredeemable noncontrolling interests of $25 million. |
BNY Mellon has not provided financial or other support that was not otherwise contractually required to be provided to our VIEs. Additionally, creditors of any consolidated VIEs do not have any recourse to the general credit of BNY Mellon.
Non-consolidated VIEs
As of Sept. 30, 2017March 31, 2018 and Dec. 31, 2016,2017, the following assets and liabilities related to the VIEs
where BNY Mellon is not the primary beneficiary are included in our consolidated financial statements and primarily relate to accounting for our investments in qualified affordable housing and renewable energy projects.
|
| | | | | | | | | |
| Non-consolidated VIEs at Sept. 30, 2017 |
| (in millions) | Assets |
| Liabilities |
| Maximum loss exposure |
|
Securities - Available-for-sale (a) | $ | 143 |
| $ | — |
| $ | 143 |
|
| Other | 2,559 |
| 439 |
| 3,321 |
|
| |
(a) | Investments in the Company’s sponsored CLOs. |
|
| | | | | | | | | |
| Non-consolidated VIEs at Dec. 31, 2016 |
| (in millions) | Assets |
| Liabilities |
| Maximum loss exposure |
|
Securities - Available-for-sale (a) | $ | 42 |
| $ | — |
| $ | 42 |
|
| Other | 2,400 |
| 369 |
| 2,769 |
|
| |
(a) | Investments in the Company’s sponsored CLOs. |
The maximum loss exposure indicated in the above tablestable below relates solely to BNY Mellon’s investments in, and unfunded commitments to, the VIEs.
|
| | | | | | | | | | | | | | | | | | | |
| Non-consolidated VIEs | | | | |
| | March 31, 2018 | | Dec. 31, 2017 |
| (in millions) | Assets |
| Liabilities |
| Maximum loss exposure |
| | Assets |
| Liabilities |
| Maximum loss exposure |
|
Securities - Available-for-sale (a) | $ | 231 |
| $ | — |
| $ | 231 |
| | $ | 203 |
| $ | — |
| $ | 203 |
|
| Other | 2,538 |
| 455 |
| 2,993 |
| | 2,592 |
| 486 |
| 3,078 |
|
| |
| (a) | Includes investments in the Company’s sponsored CLOs. |
|
|
Notes to Consolidated Financial Statements (continued) |
| |
Note 12 - 13–Preferred stock
Preferred stock
BNY Mellon has 100 million authorized shares of preferred stock with a par value of $0.01 per share. The following table summarizes BNY Mellon’s preferred stock issued and outstanding at Sept. 30, 2017March 31, 2018 and Dec. 31, 2016.2017.
| | Preferred stock summary (a) | Preferred stock summary (a) | Total shares issued and outstanding | | Carrying value (b) | Preferred stock summary (a) | Total shares issued and outstanding | | Carrying value (b) |
| | | (in millions) | | (in millions) |
| | Per annum dividend rate | Sept. 30, 2017 |
| Dec. 31, 2016 |
| Sept. 30, 2017 |
| Dec. 31, 2016 |
| Per annum dividend rate | March 31, 2018 |
| Dec. 31, 2017 |
| March 31, 2018 |
| Dec. 31, 2017 |
|
| Series A | Greater of (i) three-month LIBOR plus 0.565% for the related distribution period; or (ii) 4.000% | 5,001 |
| 5,001 |
| | $ | 500 |
| $ | 500 |
| Greater of (i) three-month LIBOR plus 0.565% for the related distribution period; or (ii) 4.000% | 5,001 |
| 5,001 |
| | $ | 500 |
| $ | 500 |
|
| Series C | 5.2% | 5,825 |
| 5,825 |
| | 568 |
| 568 |
| 5.2% | 5,825 |
| 5,825 |
| | 568 |
| 568 |
|
| Series D | 4.50% to but excluding June 20, 2023, then a floating rate equal to the three-month LIBOR plus 2.46% | 5,000 |
| 5,000 |
| | 494 |
| 494 |
| 4.50% to but excluding June 20, 2023, then a floating rate equal to the three-month LIBOR plus 2.46% | 5,000 |
| 5,000 |
| | 494 |
| 494 |
|
| Series E | 4.95% to and including June 20, 2020, then a floating rate equal to the three-month LIBOR plus 3.42% | 10,000 |
| 10,000 |
| | 990 |
| 990 |
| 4.95% to and including June 20, 2020, then a floating rate equal to the three-month LIBOR plus 3.42% | 10,000 |
| 10,000 |
| | 990 |
| 990 |
|
| Series F | 4.625% to and including Sept. 20, 2026, then a floating rate equal to the three-month LIBOR plus 3.131% | 10,000 |
| 10,000 |
| | 990 |
| 990 |
| 4.625% to and including Sept. 20, 2026, then a floating rate equal to the three-month LIBOR plus 3.131% | 10,000 |
| 10,000 |
| | 990 |
| 990 |
|
| Total | Total | 35,826 |
| 35,826 |
| | $ | 3,542 |
| $ | 3,542 |
| Total | 35,826 |
| 35,826 |
| | $ | 3,542 |
| $ | 3,542 |
|
| |
| (a) | All outstanding preferred stock is noncumulative perpetual preferred stock with a liquidation preference of $100,000 per share. |
| |
| (b) | The carrying value of the Series C, Series D, Series E and Series F preferred stock is recorded net of issuance costs. |
On Sept.March 20, 2017,2018, The Bank of New York Mellon Corporation paid the following dividends for the noncumulative perpetual preferred stock for the dividend period ending in September 2017March 2018 to holders of record as of the close of business on Sept.March 5, 2017:2018:
$1,022.221,000.00 per share on the Series A Preferred Stock (equivalent to $10.2222$10.0000 per Normal Preferred Capital Security of Mellon Capital IV, each representing a 1/100th interest in a share of the Series A Preferred Stock);
$1,300.00 per share on the Series C Preferred Stock (equivalent to $0.3250 per depositary share, each representing a 1/4,000th interest in a share of the Series C Preferred Stock); and
$2,312.50 per share on the Series F Preferred Stock (equivalent to $23.1250 per depositary share, each representing a 1/100th interest in a share of the Series F Preferred Stock).
For additional information on the preferred stock, see Note 13 of the Notes to Consolidated Financial Statements in our 20162017 Annual Report.
Terms of the Series A, Series C, Series D, Series E and Series F preferred stock are more fully described in each of their Certificates of Designations, each of which is filed as an Exhibit to this Form 10-Q.
|
|
Notes to Consolidated Financial Statements (continued) |
| |
Note 13 - 14–Other comprehensive income (loss)
| | | Components of other comprehensive income (loss) | Quarter ended | Quarter ended |
| Sept. 30, 2017 | | June 30, 2017 | | Sept. 30, 2016 | March 31, 2018 | | Dec. 31, 2017 | | March 31, 2017 |
| (in millions) | Pre-tax amount |
| Tax (expense) benefit |
| After-tax amount |
| | Pre-tax amount |
| Tax (expense) benefit |
| After-tax amount |
| | Pre-tax amount |
| Tax (expense) benefit |
| After-tax amount |
| Pre-tax amount |
| Tax (expense) benefit |
| After-tax amount |
| | Pre-tax amount |
| Tax (expense) benefit |
| After-tax amount |
| | Pre-tax amount |
| Tax (expense) benefit |
| After-tax amount |
|
| Foreign currency translation: | | | | | | | | | | |
Foreign currency translation adjustments arising during the period (a) | $ | 221 |
| $ | 65 |
| $ | 286 |
| | $ | 249 |
| $ | 81 |
| $ | 330 |
| | $ | (104 | ) | $ | (82 | ) | $ | (186 | ) | $ | 201 |
| $ | 43 |
| $ | 244 |
| | $ | 93 |
| $ | 19 |
| $ | 112 |
| | $ | 96 |
| $ | 29 |
| $ | 125 |
|
| Total foreign currency translation | 221 |
| 65 |
| 286 |
| | 249 |
| 81 |
| 330 |
| | (104 | ) | (82 | ) | (186 | ) | 201 |
| 43 |
| 244 |
| | 93 |
| 19 |
| 112 |
| | 96 |
| 29 |
| 125 |
|
| Unrealized gain (loss) on assets available-for-sale: | | | | | | |
| Unrealized gain (loss) arising during period | 47 |
| (19 | ) | 28 |
| | 146 |
| (55 | ) | 91 |
| | (87 | ) | 34 |
| (53 | ) | |
| Unrealized (loss) gain on assets available-for-sale: | | | | | | |
| Unrealized (loss) gain arising during period | | (342 | ) | 67 |
| (275 | ) | | (120 | ) | 60 |
| (60 | ) | | 164 |
| (70 | ) | 94 |
|
Reclassification adjustment (b) | (19 | ) | 7 |
| (12 | ) | | — |
| (1 | ) | (1 | ) | | (24 | ) | 9 |
| (15 | ) | 49 |
| (12 | ) | 37 |
| | 26 |
| (10 | ) | 16 |
| | (10 | ) | 4 |
| (6 | ) |
| Net unrealized gain (loss) on assets available-for-sale | 28 |
| (12 | ) | 16 |
| | 146 |
| (56 | ) | 90 |
| | (111 | ) | 43 |
| (68 | ) | |
| Net unrealized (loss) gain on assets available-for-sale | | (293 | ) | 55 |
| (238 | ) | | (94 | ) | 50 |
| (44 | ) | | 154 |
| (66 | ) | 88 |
|
| Defined benefit plans: | | | | | | | | | | |
| Net gain (loss) arising during the period | — |
| — |
| — |
| | — |
| — |
| — |
| | — |
| — |
| — |
| — |
| — |
| — |
| | 451 |
| (111 | ) | 340 |
| | 3 |
| (1 | ) | 2 |
|
| Foreign exchange adjustment | | — |
| — |
| — |
| | 1 |
| — |
| 1 |
| | — |
| — |
| — |
|
Amortization of prior service credit, net loss and initial obligation included in net periodic benefit cost (b) | 25 |
| (10 | ) | 15 |
| | 24 |
| (8 | ) | 16 |
| | 22 |
| (8 | ) | 14 |
| 22 |
| (5 | ) | 17 |
| | 26 |
| (7 | ) | 19 |
| | 25 |
| (7 | ) | 18 |
|
| Total defined benefit plans | 25 |
| (10 | ) | 15 |
| | 24 |
| (8 | ) | 16 |
| | 22 |
| (8 | ) | 14 |
| 22 |
| (5 | ) | 17 |
| | 478 |
| (118 | ) | 360 |
| | 28 |
| (8 | ) | 20 |
|
| Unrealized gain (loss) on cash flow hedges: | | | | | | | | | | |
| Unrealized hedge gain (loss) arising during period | (2 | ) | — |
| (2 | ) | | (8 | ) | 4 |
| (4 | ) | | (24 | ) | 7 |
| (17 | ) | 7 |
| (1 | ) | 6 |
| | 29 |
| (8 | ) | 21 |
| | 14 |
| (5 | ) | 9 |
|
Reclassification adjustment (b) | 3 |
| (1 | ) | 2 |
| | 9 |
| (4 | ) | 5 |
| | 28 |
| (9 | ) | 19 |
| |
| Net unrealized gain (loss) on cash flow hedges | 1 |
| (1 | ) | — |
| | 1 |
| — |
| 1 |
| | 4 |
| (2 | ) | 2 |
| |
| Total other comprehensive income (loss) | $ | 275 |
| $ | 42 |
| $ | 317 |
| | $ | 420 |
| $ | 17 |
| $ | 437 |
| | $ | (189 | ) | $ | (49 | ) | $ | (238 | ) | |
| Reclassification of net loss (gain) to net income: | | | | | | |
| FX contracts - other revenue | | (4 | ) | 1 |
| (3 | ) | | (8 | ) | 4 |
| (4 | ) | | — |
| — |
| — |
|
| FX contracts - salary expense | | (6 | ) | 1 |
| (5 | ) | | (25 | ) | 6 |
| (19 | ) | | 4 |
| (1 | ) | 3 |
|
| FX contracts - trading revenue | | — |
| — |
| — |
| | — |
| — |
| — |
| | (3 | ) | 1 |
| (2 | ) |
Total reclassifications to net income (b) | | (10 | ) | 2 |
| (8 | ) | | (33 | ) | 10 |
| (23 | ) | | 1 |
| — |
| 1 |
|
| Net unrealized (loss) gain on cash flow hedges | | (3 | ) | 1 |
| (2 | ) | | (4 | ) | 2 |
| (2 | ) | | 15 |
| (5 | ) | 10 |
|
| Total other comprehensive (loss) income | | $ | (73 | ) | $ | 94 |
| $ | 21 |
| | $ | 473 |
| $ | (47 | ) | $ | 426 |
| | $ | 293 |
| $ | (50 | ) | $ | 243 |
|
| |
| (a) | Includes the impact of hedges of net investments in foreign subsidiaries. See Note 1617 for additional information. |
| |
| (b) | The reclassification adjustment related to the unrealized gain (loss) on assets available-for-sale is recorded as net securities gains on the Consolidated Income Statement. The amortization of prior service credit, net loss and initial obligation included in net periodic benefit cost is recorded as staff expense on the Consolidated Income Statement. See Note 16 of the Notes to Consolidated Financial Statements for the location of the reclassification adjustment related to cash flow hedges on the Consolidated Income Statement. |
|
| | | | | | | | | | | | | | | | | | | |
| Components of other comprehensive income (loss) | Year-to-date |
| | Sept. 30, 2017 | | Sept. 30, 2016 |
| (in millions) | Pre-tax amount |
| Tax (expense) benefit |
| After-tax amount |
| | Pre-tax amount |
| Tax (expense) benefit |
| After-tax amount |
|
| Foreign currency translation: | | | | | | | |
Foreign currency translation adjustments arising during the period (a) | $ | 566 |
| $ | 175 |
| $ | 741 |
| | $ | (223 | ) | $ | (210 | ) | $ | (433 | ) |
| Total foreign currency translation | 566 |
| 175 |
| 741 |
| | (223 | ) | (210 | ) | (433 | ) |
| Unrealized gain (loss) on assets available-for-sale: | | | | | | | |
| Unrealized gain (loss) arising during period | 357 |
| (144 | ) | 213 |
| | 338 |
| (111 | ) | 227 |
|
Reclassification adjustment (b) | (29 | ) | 10 |
| (19 | ) | | (65 | ) | 22 |
| (43 | ) |
| Net unrealized gain (loss) on assets available-for-sale | 328 |
| (134 | ) | 194 |
| | 273 |
| (89 | ) | 184 |
|
| Defined benefit plans: | | | | | | | |
| Net gain (loss) arising during the period | 3 |
| (1 | ) | 2 |
| | 3 |
| (1 | ) | 2 |
|
Amortization of prior service credit, net loss and initial obligation included in net periodic benefit cost (b) | 74 |
| (25 | ) | 49 |
| | 65 |
| (22 | ) | 43 |
|
| Total defined benefit plans | 77 |
| (26 | ) | 51 |
| | 68 |
| (23 | ) | 45 |
|
| Unrealized gain (loss) on cash flow hedges: | | | | | | | |
| Unrealized hedge gain (loss) arising during period | 4 |
| (1 | ) | 3 |
| | (115 | ) | 38 |
| (77 | ) |
Reclassification adjustment (b) | 13 |
| (5 | ) | 8 |
| | 110 |
| (37 | ) | 73 |
|
| Net unrealized gain (loss) on cash flow hedges | 17 |
| (6 | ) | 11 |
| | (5 | ) | 1 |
| (4 | ) |
| Total other comprehensive income (loss) | $ | 988 |
| $ | 9 |
| $ | 997 |
| | $ | 113 |
| $ | (321 | ) | $ | (208 | ) |
| |
(a) | Includes the impact of hedges of net investments in foreign subsidiaries. See Note 16 for additional information. |
| |
(b) | The reclassification adjustment related to the unrealized gain (loss) on assets available-for-sale is recorded as net securities gains on the Consolidated Income Statement. The amortization of prior service credit, net loss and initial obligation included in net periodic benefit cost is recorded as staff expense on the Consolidated Income Statement. See Note 1617 of the Notes to Consolidated Financial Statements for the location of the reclassification adjustment related to cash flow hedges on the Consolidated Income Statement. |
|
|
Notes to Consolidated Financial Statements (continued) |
| |
Note 14 - 15–Fair value measurement
Fair value is defined as the price that would be received to sell an asset, or paid to transfer a liability, in an orderly transaction between market participants at the measurement date. A three-level hierarchy for fair value measurements is utilized based upon the transparency of inputs to the valuation of an asset or liability as of the measurement date. BNY Mellon’s own creditworthiness is considered when valuing liabilities. See Note 18 of the Notes to Consolidated Financial Statements into our 20162017 Annual Report for information on how we determine fair value and the fair value hierarchy.
The following tables present the financial instruments carried at fair value at Sept. 30, 2017March 31, 2018 and Dec. 31, 2016,2017, by caption on the consolidated balance sheet and by the three-level valuation hierarchy. We have included credit ratings information in certain of the tables because the information indicates the degree of credit risk to which we are exposed, and significant changes in ratings classifications could result in increased risk for us. There were no material transfers between Level 1 and Level 2 during the thirdfirst quarter of 2017.2018.
| | | Assets measured at fair value on a recurring basis at Sept. 30, 2017 | Total carrying
value |
| |
| (dollar amounts in millions) | Level 1 |
| Level 2 |
| Level 3 |
| Netting (a) |
| |
| Assets measured at fair value on a recurring basis at March 31, 2018 | | Assets measured at fair value on a recurring basis at March 31, 2018 | Total carrying
value |
|
| (dollars in millions) | | Level 1 |
| Level 2 |
| Level 3 |
| Netting (a) |
|
| Available-for-sale securities: | | |
| U.S. Treasury | $ | 15,502 |
| $ | — |
| $ | — |
| $ | — |
| $ | 15,502 |
| $ | 16,954 |
| $ | — |
| $ | — |
| $ | — |
| $ | 16,954 |
|
| U.S. government agencies | — |
| 864 |
| — |
| — |
| 864 |
| — |
| 1,154 |
| — |
| — |
| 1,154 |
|
| Sovereign debt/sovereign guaranteed | 74 |
| 12,491 |
| — |
| — |
| 12,565 |
| 10,418 |
| 2,816 |
| — |
| — |
| 13,234 |
|
| State and political subdivisions | — |
| 3,124 |
| — |
| — |
| 3,124 |
| — |
| 2,726 |
| — |
| — |
| 2,726 |
|
| Agency RMBS | — |
| 24,431 |
| — |
| — |
| 24,431 |
| — |
| 24,036 |
| — |
| — |
| 24,036 |
|
Non-agency RMBS | — |
| 525 |
| — |
| — |
| 525 |
| — |
| 1,476 |
| — |
| — |
| 1,476 |
|
| Other RMBS | — |
| 265 |
| — |
| — |
| 265 |
| — |
| 146 |
| — |
| — |
| 146 |
|
| Commercial MBS | — |
| 965 |
| — |
| — |
| 965 |
| — |
| 1,373 |
| — |
| — |
| 1,373 |
|
| Agency commercial MBS | — |
| 9,010 |
| — |
| — |
| 9,010 |
| — |
| 9,512 |
| — |
| — |
| 9,512 |
|
| CLOs | — |
| 2,550 |
| — |
| — |
| 2,550 |
| — |
| 3,129 |
| — |
| — |
| 3,129 |
|
| Other asset-backed securities | — |
| 1,157 |
| — |
| — |
| 1,157 |
| — |
| 278 |
| — |
| — |
| 278 |
|
| Equity securities | 4 |
| — |
| — |
| — |
| 4 |
| |
Money market funds (b) | 939 |
| — |
| — |
| — |
| 939 |
| |
| Corporate bonds | — |
| 1,275 |
| — |
| — |
| 1,275 |
| — |
| 1,222 |
| — |
| — |
| 1,222 |
|
| Other debt securities | — |
| 3,151 |
| — |
| — |
| 3,151 |
| — |
| 3,871 |
| — |
| — |
| 3,871 |
|
| Foreign covered bonds | 2,284 |
| 258 |
| — |
| — |
| 2,542 |
| — |
| 2,719 |
| — |
| — |
| 2,719 |
|
Non-agency RMBS (c) | — |
| 1,185 |
| — |
| — |
| 1,185 |
| |
| Total available-for-sale securities | 18,803 |
| 61,251 |
| — |
| — |
| 80,054 |
| 27,372 |
| 54,458 |
| — |
| — |
| 81,830 |
|
| Trading assets: | | |
Debt and equity instruments (b) | 433 |
| 1,016 |
| — |
| — |
| 1,449 |
| |
Debt instruments (c) | | 2,663 |
| 1,599 |
| — |
| — |
| 4,262 |
|
| Equity instruments | | 1,623 |
| — |
| — |
| — |
| 1,623 |
|
| Derivative assets not designated as hedging: | | |
| Interest rate | 3 |
| 6,731 |
| — |
| (5,301 | ) | 1,433 |
| 17 |
| 3,921 |
| — |
| (2,550 | ) | 1,388 |
|
| Foreign exchange | — |
| 4,879 |
| — |
| (3,120 | ) | 1,759 |
| — |
| 4,391 |
| — |
| (3,092 | ) | 1,299 |
|
| Equity and other contracts | 1 |
| 73 |
| — |
| (49 | ) | 25 |
| 1 |
| 100 |
| — |
| (77 | ) | 24 |
|
| Total derivative assets not designated as hedging | 4 |
| 11,683 |
| — |
| (8,470 | ) | 3,217 |
| 18 |
| 8,412 |
| — |
| (5,719 | ) | 2,711 |
|
| Total trading assets | 437 |
| 12,699 |
| — |
| (8,470 | ) | 4,666 |
| 4,304 |
| 10,011 |
| — |
| (5,719 | ) | 8,596 |
|
| Other assets: | | |
| Derivative assets designated as hedging: | | |
| Interest rate | — |
| 307 |
| — |
| — |
| 307 |
| — |
| 11 |
| — |
| — |
| 11 |
|
| Foreign exchange | — |
| 37 |
| — |
| — |
| 37 |
| — |
| 45 |
| — |
| — |
| 45 |
|
| Total derivative assets designated as hedging | — |
| 344 |
| — |
| — |
| 344 |
| — |
| 56 |
| — |
| — |
| 56 |
|
Other assets (d) | 148 |
| 184 |
| — |
| — |
| 332 |
| 139 |
| 206 |
| — |
| — |
| 345 |
|
Other assets measured at net asset value (d) | | | 151 |
| |
Other assets measured at NAV (d) | | | | 160 |
|
| Total other assets | 148 |
| 528 |
| — |
| — |
| 827 |
| 139 |
| 262 |
| — |
| — |
| 561 |
|
| Subtotal assets of operations at fair value | 19,388 |
| 74,478 |
| — |
| (8,470 | ) | 85,547 |
| 31,815 |
| 64,731 |
| — |
| (5,719 | ) | 90,987 |
|
| Percentage of assets of operations prior to netting | 21 | % | 79 | % | — | % | | 33 | % | 67 | % | — | % | |
| Assets of consolidated investment management funds | 398 |
| 404 |
| — |
| — |
| 802 |
| 340 |
| 266 |
| — |
| — |
| 606 |
|
| Total assets | $ | 19,786 |
| $ | 74,882 |
| $ | — |
| $ | (8,470 | ) | $ | 86,349 |
| $ | 32,155 |
| $ | 64,997 |
| $ | — |
| $ | (5,719 | ) | $ | 91,593 |
|
| Percentage of total assets prior to netting | 21 | % | 79 | % | — | % | | 33 | % | 67 | % | — | % | |
|
|
Notes to Consolidated Financial Statements (continued) |
| |
| | | Liabilities measured at fair value on a recurring basis at Sept. 30, 2017 | Total carrying
value |
| |
| (dollar amounts in millions) | Level 1 |
| Level 2 |
| Level 3 |
| Netting (a) |
| |
| Liabilities measured at fair value on a recurring basis at March 31, 2018 | | Liabilities measured at fair value on a recurring basis at March 31, 2018 | Total carrying
value |
|
| (dollars in millions) | | Level 1 |
| Level 2 |
| Level 3 |
| Netting (a) |
|
| Trading liabilities: | | |
| Debt and equity instruments | $ | 684 |
| $ | 159 |
| $ | — |
| $ | — |
| $ | 843 |
| |
| Debt instruments | | $ | 1,155 |
| $ | 104 |
| $ | — |
| $ | — |
| $ | 1,259 |
|
| Equity instruments | | 117 |
| — |
| — |
| — |
| 117 |
|
| Derivative liabilities not designated as hedging: | | |
| Interest rate | 3 |
| 6,681 |
| — |
| (5,705 | ) | 979 |
| 12 |
| 3,393 |
| — |
| (2,482 | ) | 923 |
|
| Foreign exchange | — |
| 4,463 |
| — |
| (3,095 | ) | 1,368 |
| — |
| 4,168 |
| — |
| (3,169 | ) | 999 |
|
| Equity and other contracts | 3 |
| 135 |
| — |
| (75 | ) | 63 |
| — |
| 138 |
| — |
| (71 | ) | 67 |
|
| Total derivative liabilities not designated as hedging | 6 |
| 11,279 |
| — |
| (8,875 | ) | 2,410 |
| 12 |
| 7,699 |
| — |
| (5,722 | ) | 1,989 |
|
| Total trading liabilities | 690 |
| 11,438 |
| — |
| (8,875 | ) | 3,253 |
| 1,284 |
| 7,803 |
| — |
| (5,722 | ) | 3,365 |
|
Long-term debt (b) | — |
| 369 |
| — |
| — |
| 369 |
| |
Long-term debt (c) | | — |
| 363 |
| — |
| — |
| 363 |
|
Other liabilities – derivative liabilities designated as hedging: | | |
| Interest rate | — |
| 494 |
| — |
| — |
| 494 |
| — |
| 95 |
| — |
| — |
| 95 |
|
| Foreign exchange | — |
| 318 |
| — |
| — |
| 318 |
| — |
| 284 |
| — |
| — |
| 284 |
|
| Total other liabilities – derivative liabilities designated as hedging | — |
| 812 |
| — |
| — |
| 812 |
| — |
| 379 |
| — |
| — |
| 379 |
|
| Subtotal liabilities of operations at fair value | 690 |
| 12,619 |
| — |
| (8,875 | ) | 4,434 |
| 1,284 |
| 8,545 |
| — |
| (5,722 | ) | 4,107 |
|
| Percentage of liabilities of operations prior to netting | 5 | % | 95 | % | — | % | | 13 | % | 87 | % | — | % | |
| Liabilities of consolidated investment management funds | 2 |
| 25 |
| — |
| — |
| 27 |
| — |
| 11 |
| — |
| — |
| 11 |
|
| Total liabilities | $ | 692 |
| $ | 12,644 |
| $ | — |
| $ | (8,875 | ) | $ | 4,461 |
| $ | 1,284 |
| $ | 8,556 |
| $ | — |
| $ | (5,722 | ) | $ | 4,118 |
|
| Percentage of total liabilities prior to netting | 5 | % | 95 | % | — | % | | 13 | % | 87 | % | — | % | |
| |
| (a) | ASC 815, Derivatives and Hedging, permits the netting of derivative receivables and derivative payables under legally enforceable master netting agreements and permits the netting of cash collateral. Netting is applicable to derivatives not designated as hedging instruments included in trading assets or trading liabilities and derivatives designated as hedging instruments included in other assets or other liabilities. Netting is allocated to the derivative products based on the net fair value of each product. |
| |
| (b) | Includes $1,019 million in Level 2 that was included in the former Grantor Trust. |
| |
| (c) | Includes certain interests in securitizations. |
| |
(c) | Previously included in the Grantor Trust. The Grantor Trust was dissolved in 2011. |
| |
| (d) | Includes seed capital, private equity investments and seed capital.other assets. |
|
|
Notes to Consolidated Financial Statements (continued) |
| |
| | | Assets measured at fair value on a recurring basis at Dec. 31, 2016 | Total carrying value |
| |
| (dollar amounts in millions) | Level 1 |
| Level 2 |
| Level 3 |
| Netting (a) |
| |
| Assets measured at fair value on a recurring basis at Dec. 31, 2017 | | Assets measured at fair value on a recurring basis at Dec. 31, 2017 | Total carrying value |
|
| (dollars in millions) | | Level 1 |
| Level 2 |
| Level 3 |
| Netting (a) |
|
| Available-for-sale securities: | | |
| U.S. Treasury | $ | 14,307 |
| $ | — |
| $ | — |
| $ | — |
| $ | 14,307 |
| $ | 15,263 |
| $ | — |
| $ | — |
| $ | — |
| $ | 15,263 |
|
| U.S. government agencies | — |
| 359 |
| — |
| — |
| 359 |
| — |
| 908 |
| — |
| — |
| 908 |
|
| Sovereign debt/sovereign guaranteed | 66 |
| 12,423 |
| — |
| — |
| 12,489 |
| 9,919 |
| 2,638 |
| — |
| — |
| 12,557 |
|
| State and political subdivisions | — |
| 3,378 |
| — |
| — |
| 3,378 |
| — |
| 2,957 |
| — |
| — |
| 2,957 |
|
| Agency RMBS | — |
| 22,736 |
| — |
| — |
| 22,736 |
| — |
| 23,819 |
| — |
| — |
| 23,819 |
|
Non-agency RMBS | — |
| 638 |
| — |
| — |
| 638 |
| — |
| 1,578 |
| — |
| — |
| 1,578 |
|
| Other RMBS | — |
| 513 |
| — |
| — |
| 513 |
| — |
| 149 |
| — |
| — |
| 149 |
|
| Commercial MBS | — |
| 928 |
| — |
| — |
| 928 |
| — |
| 1,360 |
| — |
| — |
| 1,360 |
|
| Agency commercial MBS | — |
| 6,449 |
| — |
| — |
| 6,449 |
| — |
| 8,762 |
| — |
| — |
| 8,762 |
|
| CLOs | — |
| 2,598 |
| — |
| — |
| 2,598 |
| — |
| 2,909 |
| — |
| — |
| 2,909 |
|
| Other asset-backed securities | — |
| 1,727 |
| — |
| — |
| 1,727 |
| — |
| 1,043 |
| — |
| — |
| 1,043 |
|
| Equity securities | 3 |
| — |
| — |
| — |
| 3 |
| |
Money market funds (b) | 842 |
| — |
| — |
| — |
| 842 |
| |
Money market funds (c) | | 963 |
| — |
| — |
| — |
| 963 |
|
| Corporate bonds | — |
| 1,396 |
| — |
| — |
| 1,396 |
| — |
| 1,255 |
| — |
| — |
| 1,255 |
|
| Other debt securities | — |
| 1,961 |
| — |
| — |
| 1,961 |
| — |
| 3,491 |
| — |
| — |
| 3,491 |
|
| Foreign covered bonds | 1,876 |
| 265 |
| — |
| — |
| 2,141 |
| — |
| 2,529 |
| — |
| — |
| 2,529 |
|
Non-agency RMBS (c) | — |
| 1,357 |
| — |
| — |
| 1,357 |
| |
| Total available-for-sale securities | 17,094 |
| 56,728 |
| — |
| — |
| 73,822 |
| 26,145 |
| 53,398 |
| — |
| — |
| 79,543 |
|
| Trading assets: | | |
Debt and equity instruments (b) | 240 |
| 2,013 |
| — |
| — |
| 2,253 |
| |
Debt and equity instruments (c) | | 1,344 |
| 1,910 |
| — |
| — |
| 3,254 |
|
| Derivative assets not designated as hedging: | | |
| Interest rate | 4 |
| 7,583 |
| — |
| (6,047 | ) | 1,540 |
| 9 |
| 6,430 |
| — |
| (5,075 | ) | 1,364 |
|
| Foreign exchange | — |
| 6,104 |
| — |
| (4,172 | ) | 1,932 |
| — |
| 5,104 |
| — |
| (3,720 | ) | 1,384 |
|
| Equity and other contracts | — |
| 46 |
| — |
| (38 | ) | 8 |
| — |
| 70 |
| — |
| (50 | ) | 20 |
|
| Total derivative assets not designated as hedging | 4 |
| 13,733 |
| — |
| (10,257 | ) | 3,480 |
| 9 |
| 11,604 |
| — |
| (8,845 | ) | 2,768 |
|
| Total trading assets | 244 |
| 15,746 |
| — |
| (10,257 | ) | 5,733 |
| 1,353 |
| 13,514 |
| — |
| (8,845 | ) | 6,022 |
|
Other assets: | | |
| Derivative assets designated as hedging: | | |
| Interest rate | — |
| 415 |
| — |
| — |
| 415 |
| — |
| 278 |
| — |
| — |
| 278 |
|
| Foreign exchange | — |
| 369 |
| — |
| — |
| 369 |
| — |
| 45 |
| — |
| — |
| 45 |
|
| Total derivative assets designated as hedging | — |
| 784 |
| — |
| — |
| 784 |
| — |
| 323 |
| — |
| — |
| 323 |
|
Other assets (d) | 268 |
| 73 |
| — |
| — |
| 341 |
| 144 |
| 170 |
| — |
| — |
| 314 |
|
Other assets measured at net asset value (d) | | 214 |
| |
Other assets measured at NAV (d) | | | 154 |
|
| Total other assets | 268 |
| 857 |
| — |
| — |
| 1,339 |
| 144 |
| 493 |
| — |
| — |
| 791 |
|
| Subtotal assets of operations at fair value | 17,606 |
| 73,331 |
| — |
| (10,257 | ) | 80,894 |
| 27,642 |
| 67,405 |
| — |
| (8,845 | ) | 86,356 |
|
| Percentage of assets of operations prior to netting | 19 | % | 81 | % | — | % | | 29 | % | 71 | % | — | % | |
| Assets of consolidated investment management funds | 464 |
| 767 |
| — |
| — |
| 1,231 |
| 322 |
| 409 |
| — |
| — |
| 731 |
|
| Total assets | $ | 18,070 |
| $ | 74,098 |
| $ | — |
| $ | (10,257 | ) | $ | 82,125 |
| $ | 27,964 |
| $ | 67,814 |
| $ | — |
| $ | (8,845 | ) | $ | 87,087 |
|
| Percentage of total assets prior to netting | 20 | % | 80 | % | — | % | | 29 | % | 71 | % | — | % | |
|
|
Notes to Consolidated Financial Statements (continued) |
| |
| | | Liabilities measured at fair value on a recurring basis at Dec. 31, 2016 | Total carrying value |
| |
| (dollar amounts in millions) | Level 1 |
| Level 2 |
| Level 3 |
| Netting (a) |
| |
| Liabilities measured at fair value on a recurring basis at Dec. 31, 2017 | | Liabilities measured at fair value on a recurring basis at Dec. 31, 2017 | Total carrying value |
|
| (dollars in millions) | | Level 1 |
| Level 2 |
| Level 3 |
| Netting (a) |
|
| Trading liabilities: | | |
| Debt and equity instruments | $ | 349 |
| $ | 236 |
| $ | — |
| $ | — |
| $ | 585 |
| $ | 1,128 |
| $ | 80 |
| $ | — |
| $ | — |
| $ | 1,208 |
|
| Derivative liabilities not designated as hedging: | | |
| Interest rate | 4 |
| 7,629 |
| — |
| (6,634 | ) | 999 |
| 4 |
| 6,349 |
| — |
| (5,495 | ) | 858 |
|
| Foreign exchange | — |
| 6,103 |
| — |
| (3,363 | ) | 2,740 |
| — |
| 5,067 |
| — |
| (3,221 | ) | 1,846 |
|
| Equity and other contracts | — |
| 115 |
| — |
| (50 | ) | 65 |
| — |
| 153 |
| — |
| (81 | ) | 72 |
|
| Total derivative liabilities not designated as hedging | 4 |
| 13,847 |
| — |
| (10,047 | ) | 3,804 |
| 4 |
| 11,569 |
| — |
| (8,797 | ) | 2,776 |
|
| Total trading liabilities | 353 |
| 14,083 |
| — |
| (10,047 | ) | 4,389 |
| 1,132 |
| 11,649 |
| — |
| (8,797 | ) | 3,984 |
|
Long-term debt (b) | — |
| 363 |
| — |
| — |
| 363 |
| |
Long-term debt (c) | | — |
| 367 |
| — |
| — |
| 367 |
|
Other liabilities – derivative liabilities designated as hedging: | | |
| Interest rate | — |
| 545 |
| — |
| — |
| 545 |
| — |
| 534 |
| — |
| — |
| 534 |
|
| Foreign exchange | — |
| 52 |
| — |
| — |
| 52 |
| — |
| 266 |
| — |
| — |
| 266 |
|
| Total other liabilities – derivative liabilities designated as hedging | — |
| 597 |
| — |
| — |
| 597 |
| — |
| 800 |
| — |
| — |
| 800 |
|
| Subtotal liabilities of operations at fair value | 353 |
| 15,043 |
| — |
| (10,047 | ) | 5,349 |
| 1,132 |
| 12,816 |
| — |
| (8,797 | ) | 5,151 |
|
| Percentage of liabilities of operations prior to netting | 2 | % | 98 | % | — | % | | 8 | % | 92 | % | — | % | |
| Liabilities of consolidated investment management funds | 3 |
| 312 |
| — |
| — |
| 315 |
| 1 |
| 1 |
| — |
| — |
| 2 |
|
| Total liabilities | $ | 356 |
| $ | 15,355 |
| $ | — |
| $ | (10,047 | ) | $ | 5,664 |
| $ | 1,133 |
| $ | 12,817 |
| $ | — |
| $ | (8,797 | ) | $ | 5,153 |
|
| Percentage of total liabilities prior to netting | 2 | % | 98 | % | — | % | | 8 | % | 92 | % | — | % | |
| |
| (a) | ASC 815, Derivatives and Hedging, permits the netting of derivative receivables and derivative payables under legally enforceable master netting agreements and permits the netting of cash collateral. Netting is applicable to derivatives not designated as hedging instruments included in trading assets or trading liabilities and derivatives designated as hedging instruments included in other assets or other liabilities. Netting is allocated to the derivative products based on the net fair value of each product. |
| |
| (b) | Includes certain interests$1,091 million in securitizations.Level 2 that was included in the former Grantor Trust. |
| |
| (c) | Previously includedIncludes certain interests in the Grantor Trust. The Grantor Trust was dissolved in 2011.securitizations. |
| |
| (d) | Includes private equity investments and seed capital. |
|
|
Notes to Consolidated Financial Statements (continued) |
| |
| | Details of certain items measured at fair value on a recurring basis | Sept. 30, 2017 | | Dec. 31, 2016 | March 31, 2018 | | Dec. 31, 2017 |
Total carrying value (b) |
| | Ratings (a) | | Total carrying value (b) |
| | Ratings (a) | Total carrying value (b) |
| | Ratings (a) | | Total carrying value (b) |
| | Ratings (a) |
AAA/ AA- |
| A+/ A- |
| BBB+/ BBB- |
| BB+ and lower |
| | AAA/ AA- |
| A+/ A- |
| BBB+/ BBB- |
| BB+ and lower | | AAA/ AA- |
| A+/ A- |
| BBB+/ BBB- |
| BB+ and lower |
| | | AAA/ AA- |
| A+/ A- |
| BBB+/ BBB- |
| BB+ and lower |
|
| (dollar amounts in millions) | | | |
| Non-agency RMBS, originated in: | | | | | | | |
| (dollars in millions) | | Total carrying value (b) |
| | AAA/ AA- |
| A+/ A- |
| BBB+/ BBB- |
| BB+ and lower |
| | Total carrying value (b) |
| | AAA/ AA- |
| A+/ A- |
| BBB+/ BBB- |
| BB+ and lower |
|
Non-agency RMBS (c), originated in: | | |
| 2007 | $ | 42 |
| | — | % | — | % | — | % | 100 | % | | $ | 58 |
| | — | % | — | % | — | % | 100 | % | | — | % | — | % | 5 | % | 95 | % | | — | % | — | % | — | % | 100 | % |
| 2006 | 85 |
| | — |
| — |
| — |
| 100 |
| | 98 |
| | — |
| — |
| — |
| 100 |
| 363 |
| | — |
| — |
| — |
| 100 |
| | 387 |
| | — |
| — |
| — |
| 100 |
|
| 2005 | 152 |
| | 20 |
| 3 |
| 18 |
| 59 |
| | 180 |
| | 23 |
| 5 |
| 9 |
| 63 |
| 486 |
| | 5 |
| 2 |
| 6 |
| 87 |
| | 507 |
| | 6 |
| 2 |
| 5 |
| 87 |
|
| 2004 and earlier | 246 |
| | 4 |
| 2 |
| 27 |
| 67 |
| | 302 |
| | 5 |
| 3 |
| 24 |
| 68 |
| 310 |
| | 3 |
| 3 |
| 32 |
| 62 |
| | 333 |
| | 3 |
| 3 |
| 30 |
| 64 |
|
| Total non-agency RMBS | $ | 525 |
| | 8 | % | 2 | % | 14 | % | 76 | % | | $ | 638 |
| | 9 | % | 3 | % | 14 | % | 74 | % | $ | 1,476 |
| | 3 | % | 1 | % | 9 | % | 87 | % | | $ | 1,578 |
| | 3 | % | 1 | % | 8 | % | 88 | % |
| Commercial MBS - Domestic, originated in: | | | | | | | | |
| Commercial MBS, originated in: | | | | | | | | |
| 2009-2017 | $ | 909 |
| | 89 | % | 11 | % | — | % | — | % | | $ | 674 |
| | 84 | % | 16 | % | — | % | — | % | $ | 1,321 |
| | 96 | % | 4 | % | — | % | — | % | | $ | 1,309 |
| | 94 | % | 6 | % | — | % | — | % |
| 2008 | 5 |
| | 100 |
| — |
| — |
| — |
| | 14 |
| | 100 |
| — |
| — |
| — |
| |
| 2007 | — |
| | — |
| — |
| — |
| — |
| | 190 |
| | 71 |
| 29 |
| — |
| — |
| |
| 2006 | — |
| | — |
| — |
| — |
| — |
| | 3 |
| | 7 |
| 93 |
| — |
| — |
| |
| Total commercial MBS - Domestic | $ | 914 |
| | 89 | % | 11 | % | — | % | — | % | | $ | 881 |
| | 81 | % | 19 | % | — | % | — | % | |
| 2005 | | 52 |
| | 100 |
| — |
| — |
| — |
| | 51 |
| | 100 |
| — |
| — |
| — |
|
| Total commercial MBS | | $ | 1,373 |
| | 96 | % | 4 | % | — | % | — | % | | $ | 1,360 |
| | 94 | % | 6 | % | — | % | — | % |
| Other RMBS, originated in: | | | | | | | | |
| 2007 and earlier | | $ | 146 |
| | 38 | % | 62 | % | — | % | — | % | | $ | 149 |
| | 37 | % | 63 | % | — | % | — | % |
| Total other RMBS | | $ | 146 |
| | 38 | % | 62 | % | — | % | — | % | | $ | 149 |
| | 37 | % | 63 | % | — | % | — | % |
| Foreign covered bonds: | | | | | | | | | | | | | | |
| Canada | $ | 1,648 |
| | 100 | % | — | % | — | % | — | % | | $ | 1,320 |
| | 100 | % | — | % | — | % | — | % | $ | 1,609 |
| | 100 | % | — | % | — | % | — | % | | $ | 1,659 |
| | 100 | % | — | % | — | % | — | % |
| Australia | 261 |
| | 100 |
| — |
| — |
| — |
| | 40 |
| | 100 |
| — |
| — |
| — |
| 347 |
| | 100 |
| — |
| — |
| — |
| | 265 |
| | 100 |
| — |
| — |
| — |
|
| Netherlands | 177 |
| | 100 |
| — |
| — |
| — |
| | 160 |
| | 100 |
| — |
| — |
| — |
| |
| United Kingdom | 136 |
| | 100 |
| — |
| — |
| — |
| | 280 |
| | 100 |
| — |
| — |
| — |
| 239 |
| | 100 |
| — |
| — |
| — |
| | 103 |
| | 100 |
| — |
| — |
| — |
|
| Sweden | | 204 |
| | 100 |
| — |
| — |
| — |
| | 136 |
| | 100 |
| — |
| — |
| — |
|
| Other | 320 |
| | 100 |
| — |
| — |
| — |
| | 341 |
| | 100 |
| — |
| — |
| — |
| 320 |
| | 100 |
| — |
| — |
| — |
| | 366 |
| | 100 |
| — |
| — |
| — |
|
| Total foreign covered bonds | $ | 2,542 |
| | 100 | % | — | % | — | % | — | % | | $ | 2,141 |
| | 100 | % | — | % | — | % | — | % | $ | 2,719 |
| | 100 | % | — | % | — | % | — | % | | $ | 2,529 |
| | 100 | % | — | % | — | % | — | % |
| European floating rate notes - available-for-sale: | | | | | | | | |
| United Kingdom | $ | 204 |
| | 87 | % | 13 | % | — | % | — | % | | $ | 379 |
| | 90 | % | 10 | % | — | % | — | % | |
| Netherlands | 113 |
| | 37 |
| 63 |
| — |
| — |
| | 125 |
| | 100 |
| — |
| — |
| — |
| |
| Ireland | — |
| | — |
| — |
| — |
| — |
| | 58 |
| | — |
| — |
| 100 |
| — |
| |
| Total European floating rate notes - available-for-sale | $ | 317 |
| | 69 | % | 31 | % | — | % | — | % | | $ | 562 |
| | 83 | % | 7 | % | 10 | % | — | % | |
| Sovereign debt/sovereign guaranteed: | | | | | | | | | | | | | | |
| United Kingdom | $ | 3,036 |
| | 100 | % | — | % | — | % | — | % | | $ | 3,209 |
| | 100 | % | — | % | — | % | — | % | $ | 3,140 |
| | 100 | % | — | % | — | % | — | % | | $ | 3,052 |
| | 100 | % | — | % | — | % | — | % |
| France | 1,993 |
| | 100 |
| — |
| — |
| — |
| | 1,998 |
| | 100 |
| — |
| — |
| — |
| 2,171 |
| | 100 |
| — |
| — |
| — |
| | 2,046 |
| | 100 |
| — |
| — |
| — |
|
| Germany | | 1,856 |
| | 100 |
| — |
| — |
| — |
| | 1,586 |
| | 100 |
| — |
| — |
| — |
|
| Spain | 1,740 |
| | — |
| — |
| 100 |
| — |
| | 1,749 |
| | — |
| — |
| 100 |
| — |
| 1,681 |
| | — |
| — |
| 100 |
| — |
| | 1,635 |
| | — |
| — |
| 100 |
| — |
|
| Germany | 1,688 |
| | 100 |
| — |
| — |
| — |
| | 1,347 |
| | 100 |
| — |
| — |
| — |
| |
| Italy | 1,169 |
| | — |
| — |
| 100 |
| — |
| | 1,130 |
| | — |
| — |
| 100 |
| — |
| 1,138 |
| | — |
| — |
| 100 |
| — |
| | 1,292 |
| | — |
| — |
| 100 |
| — |
|
| Netherlands | 1,016 |
| | 100 |
| — |
| — |
| — |
| | 1,061 |
| | 100 |
| — |
| — |
| — |
| 1,050 |
| | 100 |
| — |
| — |
| — |
| | 1,027 |
| | 100 |
| — |
| — |
| — |
|
| Ireland | 832 |
| | — |
| 100 |
| — |
| — |
| | 736 |
| | — |
| 100 |
| — |
| — |
| 857 |
| | — |
| 100 |
| — |
| — |
| | 843 |
| | — |
| 100 |
| — |
| — |
|
| Belgium | 809 |
| | 100 |
| — |
| — |
| — |
| | 1,005 |
| | 100 |
| — |
| — |
| — |
| 820 |
| | 100 |
| — |
| — |
| — |
| | 803 |
| | 100 |
| — |
| — |
| — |
|
Other (c) | 282 |
| | 48 |
| 3 |
| — |
| 49 |
| | 254 |
| | 71 |
| — |
| — |
| 29 |
| |
Other (d) | | 521 |
| | 75 |
| — |
| — |
| 25 |
| | 273 |
| | 50 |
| — |
| — |
| 50 |
|
| Total sovereign debt/sovereign guaranteed | $ | 12,565 |
| | 69 | % | 7 | % | 23 | % | 1 | % | | $ | 12,489 |
| | 70 | % | 6 | % | 23 | % | 1 | % | $ | 13,234 |
| | 71 | % | 7 | % | 21 | % | 1 | % | | $ | 12,557 |
| | 69 | % | 7 | % | 23 | % | 1 | % |
Non-agency RMBS (d), originated in: | | | | | | | | |
| 2007 | $ | 337 |
| | — | % | — | % | — | % | 100 | % | | $ | 387 |
| | — | % | — | % | — | % | 100 | % | |
| 2006 | 345 |
| | — |
| — |
| — |
| 100 |
| | 391 |
| | — |
| — |
| — |
| 100 |
| |
| 2005 | 387 |
| | 1 |
| 1 |
| 1 |
| 97 |
| | 437 |
| | — |
| 2 |
| 1 |
| 97 |
| |
| 2004 and earlier | 116 |
| | 2 |
| 2 |
| 22 |
| 74 |
| | 142 |
| | 2 |
| 2 |
| 17 |
| 79 |
| |
Total non-agency RMBS (d) | $ | 1,185 |
| | — | % | 1 | % | 3 | % | 96 | % | | $ | 1,357 |
| | — | % | 1 | % | 2 | % | 97 | % | |
| |
| (a) | Represents ratings by S&P or the equivalent. |
| |
| (b) | At Sept. 30, 2017March 31, 2018 and Dec. 31, 2016, foreign covered bonds and2017, sovereign debt/sovereign guaranteed securities were included in Level 1 and Level 2 in the valuation hierarchy. All other assets in the table are Level 2 assets in the valuation hierarchy. |
| |
| (c) | Includes noninvestment$1,019 million at March 31, 2018 and $1,091 million at Dec. 31, 2017 that were included in the former Grantor Trust. |
| |
| (d) | Includes non-investment grade sovereign debt/sovereign guaranteed securities related to Brazil of $140$133 million at Sept. 30, 2017March 31, 2018 and $73$136 million at Dec. 31, 2016. |
| |
(d) | Previously included in the Grantor Trust. The Grantor Trust was dissolved in 2011.2017. |
Changes in Level 3 fair value measurements
Our classification of a financial instrument in Level 3 of the valuation hierarchy is based on the significance of the unobservable factors to the overall fair value measurement. However, these instruments generally include other observable components that are actively quoted or validated to third-party sources; accordingly, the gains and losses in the table below include changes in fair value due to observable parameterssources as well as the unobservable parameters in our valuation methodologies. We also manage the
risks of Level 3 financial instruments using securities and derivatives positions that are Level 1 or Level 2 instruments which are not included in the table; accordingly, the gains or losses below do not reflect the effect of our risk management activities related to the Level 3 instruments.
The Company has a Level 3 Pricing Committee which evaluates the valuation techniques used in
|
|
Notes to Consolidated Financial Statements(continued)
|
|
determining the fair value of Level 3 assets and liabilities.
There were no financial instruments recorded at fair value on a recurring basis classified in Level 3 of the
valuation hierarchy in the first nine monthsquarter of 2018 and first quarter of 2017.
The table below includes a roll forward of the balance sheet amount for the three and nine months ended Sept. 30, 2016 (including the change in fair value), for financial instruments classified in Level 3 of the valuation hierarchy.
|
| | | | | | |
| Fair value measurements for assets using significant unobservable inputs | Loans |
| (in millions) | 3Q16 |
| YTD16 |
|
| Fair value at the beginning of the period | $ | 101 |
| $ | — |
|
| Transfers into Level 3 | — |
| 19 |
|
Total gains for the period included in earnings (a) | — |
| 2 |
|
| Purchases and sales: | | |
| Purchases | — |
| 113 |
|
| Issuances | 1 |
| 1 |
|
| Sales | (102 | ) | (135 | ) |
| Fair value at Sept. 30, 2016 | $ | — |
| $ | — |
|
| Change in unrealized gains for the period included in earnings for assets held at the end of the reporting period | $ | — |
| $ | — |
|
| |
(a) | Reported in investment and other income. |
Assets and liabilities measured at fair value on a nonrecurring basis
Under certain circumstances, we make adjustments to fair value our assets, liabilities and unfunded lending-related commitments although they are not measured at fair value on an ongoing basis. An exampleExamples would be the recording of an impairment of an asset.asset and non-readily marketable equity securities carried at cost with upward or downward adjustments.
The following tables present the financial instruments carried on the consolidated balance sheet by caption and by level in the fair value hierarchy as of Sept. 30, 2017March 31, 2018 and Dec. 31, 2016,2017, for which a nonrecurring change in fair value has been recorded during the quarters ended Sept. 30, 2017March 31, 2018 and Dec. 31, 2016.2017.
|
| | | | | | | | | | | | |
| Assets measured at fair value on a nonrecurring basis at Sept. 30, 2017 | Total carrying value |
|
| (in millions) | Level 1 |
| Level 2 |
| Level 3 |
|
Loans (a) | $ | — |
| $ | 75 |
| $ | 7 |
| $ | 82 |
|
Other assets (b) | — |
| 4 |
| — |
| 4 |
|
| Total assets at fair value on a nonrecurring basis | $ | — |
| $ | 79 |
| $ | 7 |
| $ | 86 |
|
BNY Mellon 77
|
|
Notes to Consolidated Financial Statements(continued) |
|
|
| | | | | | | | | | | | |
| Assets measured at fair value on a nonrecurring basis at March 31, 2018 | Total carrying value |
|
| | | | |
| (in millions) | Level 1 |
| Level 2 |
| Level 3 |
|
Loans (a) | $ | — |
| $ | 70 |
| $ | 5 |
| $ | 75 |
|
Other assets (b) | — |
| 30 |
| — |
| 30 |
|
| Total assets at fair value on a nonrecurring basis | $ | — |
| $ | 100 |
| $ | 5 |
| $ | 105 |
|
|
| | | | | | | | | | | | |
| Assets measured at fair value on a nonrecurring basis at Dec. 31, 2017 | Total carrying value |
|
| | | | |
| (in millions) | Level 1 |
| Level 2 |
| Level 3 |
|
Loans (a) | $ | — |
| $ | 73 |
| $ | 6 |
| $ | 79 |
|
Other assets (b) | — |
| 4 |
| — |
| 4 |
|
| Total assets at fair value on a nonrecurring basis | $ | — |
| $ | 77 |
| $ | 6 |
| $ | 83 |
|
|
| | | | | | | | | | | | |
| Assets measured at fair value on a nonrecurring basis at Dec. 31, 2016 | Total carrying value |
|
| (in millions) | Level 1 |
| Level 2 |
| Level 3 |
|
Loans (a) | $ | — |
| $ | 84 |
| $ | 7 |
| $ | 91 |
|
Other assets (b) | — |
| 4 |
| — |
| 4 |
|
| Total assets at fair value on a nonrecurring basis | $ | — |
| $ | 88 |
| $ | 7 |
| $ | 95 |
|
| |
| (a) | During the quarters ended Sept. 30, 2017March 31, 2018 and Dec. 31, 2016,2017, the fair value of these loans decreased less than $1 million and less than $1 million, respectively, based on the fair value of the underlying collateral based on guidance in ASC 310, Receivables, with an offset to the allowance for credit losses. |
| |
| (b) | Includes other assets received in satisfaction of debt. |
Estimated fair value of financial instruments
The following tables present the estimated fair value and the carrying amount of financial instruments not carried at fair value on the consolidated balance sheet at Sept. 30, 2017March 31, 2018 and Dec. 31, 2016,2017, by caption on the consolidated balance sheet and by the valuation
hierarchy. See Note 18 of the Notes to Consolidated Financial Statements in our 20162017 Annual Report for additional information regarding the financial instruments within the scope of this disclosure, and the methods and significant assumptions used to estimate their fair value.
|
| | | | | | | | | | | | | | | |
| Summary of financial instruments | March 31, 2018 |
| (in millions) | Level 1 |
| Level 2 |
| Level 3 |
| Total estimated fair value |
| Carrying amount |
|
| Assets: | | | | | |
| Interest-bearing deposits with the Federal Reserve and other central banks | $ | — |
| $ | 91,431 |
| $ | — |
| $ | 91,431 |
| $ | 91,431 |
|
| Interest-bearing deposits with banks | — |
| 15,194 |
| — |
| 15,194 |
| 15,186 |
|
| Federal funds sold and securities purchased under resale agreements | — |
| 28,784 |
| — |
| 28,784 |
| 28,784 |
|
| Securities held-to-maturity | 8,037 |
| 28,098 |
| — |
| 36,135 |
| 36,959 |
|
Loans (a) | — |
| 59,312 |
| — |
| 59,312 |
| 59,371 |
|
| Other financial assets | 4,636 |
| 1,208 |
| — |
| 5,844 |
| 5,844 |
|
| Total | $ | 12,673 |
| $ | 224,027 |
| $ | — |
| $ | 236,700 |
| $ | 237,575 |
|
| Liabilities: | | | | | |
| Noninterest-bearing deposits | $ | — |
| $ | 76,880 |
| $ | — |
| $ | 76,880 |
| $ | 76,880 |
|
| Interest-bearing deposits | — |
| 163,158 |
| — |
| 163,158 |
| 164,964 |
|
| Federal funds purchased and securities sold under repurchase agreements | — |
| 21,600 |
| — |
| 21,600 |
| 21,600 |
|
| Payables to customers and broker-dealers | — |
| 20,172 |
| — |
| 20,172 |
| 20,172 |
|
| Commercial paper | — |
| 3,936 |
| — |
| 3,936 |
| 3,936 |
|
| Borrowings | — |
| 1,432 |
| — |
| 1,432 |
| 1,432 |
|
| Long-term debt | — |
| 27,150 |
| — |
| 27,150 |
| 27,576 |
|
| Total | $ | — |
| $ | 314,328 |
| $ | — |
| $ | 314,328 |
| $ | 316,560 |
|
| |
| (a) | Does not include the leasing portfolio. |
|
|
Notes to Consolidated Financial Statements (continued) |
| |
|
| | | | | | | | | | | | | | | |
| Summary of financial instruments | Sept. 30, 2017 |
| (in millions) | Level 1 |
| Level 2 |
| Level 3 |
| Total estimated fair value |
| Carrying amount |
|
| Assets: | | | | | |
| Interest-bearing deposits with the Federal Reserve and other central banks | $ | — |
| $ | 75,808 |
| $ | — |
| $ | 75,808 |
| $ | 75,808 |
|
| Interest-bearing deposits with banks | — |
| 15,254 |
| — |
| 15,254 |
| 15,256 |
|
| Federal funds sold and securities purchased under resale agreements | — |
| 27,883 |
| — |
| 27,883 |
| 27,883 |
|
| Securities held-to-maturity | 9,943 |
| 29,985 |
| — |
| 39,928 |
| 39,995 |
|
Loans (a) | — |
| 57,709 |
| — |
| 57,709 |
| 57,562 |
|
| Other financial assets | 5,557 |
| 1,169 |
| — |
| 6,726 |
| 6,726 |
|
| Total | $ | 15,500 |
| $ | 207,808 |
| $ | — |
| $ | 223,308 |
| $ | 223,230 |
|
| Liabilities: | | | | | |
| Noninterest-bearing deposits | $ | — |
| $ | 80,380 |
| $ | — |
| $ | 80,380 |
| $ | 80,380 |
|
| Interest-bearing deposits | — |
| 148,967 |
| — |
| 148,967 |
| 150,616 |
|
| Federal funds purchased and securities sold under repurchase agreements | — |
| 10,314 |
| — |
| 10,314 |
| 10,314 |
|
| Payables to customers and broker-dealers | — |
| 21,176 |
| — |
| 21,176 |
| 21,176 |
|
| Commercial paper | — |
| 2,501 |
| — |
| 2,501 |
| 2,501 |
|
| Borrowings | — |
| 3,544 |
| — |
| 3,544 |
| 3,544 |
|
| Long-term debt | — |
| 28,335 |
| — |
| 28,335 |
| 28,039 |
|
| Total | $ | — |
| $ | 295,217 |
| $ | — |
| $ | 295,217 |
| $ | 296,570 |
|
| |
(a) | Does not include the leasing portfolio. |
| | | Summary of financial instruments | Dec. 31, 2016 | Dec. 31, 2017 |
| (in millions) | Level 1 |
| Level 2 |
| Level 3 |
| Total estimated
fair value |
| Carrying
amount |
| Level 1 |
| Level 2 |
| Level 3 |
| Total estimated
fair value |
| Carrying
amount |
|
| Assets: | | |
| Interest-bearing deposits with the Federal Reserve and other central banks | $ | — |
| $ | 58,041 |
| $ | — |
| $ | 58,041 |
| $ | 58,041 |
| $ | — |
| $ | 91,510 |
| $ | — |
| $ | 91,510 |
| $ | 91,510 |
|
| Interest-bearing deposits with banks | — |
| 15,091 |
| — |
| 15,091 |
| 15,086 |
| — |
| 11,982 |
| — |
| 11,982 |
| 11,979 |
|
| Federal funds sold and securities purchased under resale agreements | — |
| 25,801 |
| — |
| 25,801 |
| 25,801 |
| — |
| 28,135 |
| — |
| 28,135 |
| 28,135 |
|
| Securities held-to-maturity | 11,173 |
| 29,496 |
| — |
| 40,669 |
| 40,905 |
| 11,365 |
| 29,147 |
| — |
| 40,512 |
| 40,827 |
|
Loans (a) | — |
| 62,829 |
| — |
| 62,829 |
| 62,564 |
| — |
| 60,219 |
| — |
| 60,219 |
| 60,082 |
|
| Other financial assets | 4,822 |
| 1,112 |
| — |
| 5,934 |
| 5,934 |
| 5,382 |
| 1,244 |
| — |
| 6,626 |
| 6,626 |
|
| Total | $ | 15,995 |
| $ | 192,370 |
| $ | — |
| $ | 208,365 |
| $ | 208,331 |
| $ | 16,747 |
| $ | 222,237 |
| $ | — |
| $ | 238,984 |
| $ | 239,159 |
|
| Liabilities: | | |
| Noninterest-bearing deposits | $ | — |
| $ | 78,342 |
| $ | — |
| $ | 78,342 |
| $ | 78,342 |
| $ | — |
| $ | 82,716 |
| $ | — |
| $ | 82,716 |
| $ | 82,716 |
|
| Interest-bearing deposits | — |
| 141,418 |
| — |
| 141,418 |
| 143,148 |
| — |
| 160,042 |
| — |
| 160,042 |
| 161,606 |
|
| Federal funds purchased and securities sold under repurchase agreements | — |
| 9,989 |
| — |
| 9,989 |
| 9,989 |
| — |
| 15,163 |
| — |
| 15,163 |
| 15,163 |
|
| Payables to customers and broker-dealers | — |
| 20,987 |
| — |
| 20,987 |
| 20,987 |
| — |
| 20,184 |
| — |
| 20,184 |
| 20,184 |
|
| Commercial paper | | — |
| 3,075 |
| — |
| 3,075 |
| 3,075 |
|
| Borrowings | — |
| 960 |
| — |
| 960 |
| 960 |
| — |
| 2,931 |
| — |
| 2,931 |
| 2,931 |
|
| Long-term debt | — |
| 24,184 |
| — |
| 24,184 |
| 24,100 |
| — |
| 27,789 |
| — |
| 27,789 |
| 27,612 |
|
| Total | $ | — |
| $ | 275,880 |
| $ | — |
| $ | 275,880 |
| $ | 277,526 |
| $ | — |
| $ | 311,900 |
| $ | — |
| $ | 311,900 |
| $ | 313,287 |
|
| |
| (a) | Does not include the leasing portfolio. |
The table below summarizes the carrying amount of the hedged financial instruments, the notional amount of the hedge and the unrealized gain (loss) (estimated fair value) of the derivatives.
| | | Hedged financial instruments | Carrying amount |
| Notional amount of hedge |
| | Carrying amount |
| Notional amount of hedge |
| |
| | Unrealized | Unrealized |
| (in millions) | Gain |
| (Loss) |
| Gain |
| (Loss) |
|
| Sept. 30, 2017 | | |
| March 31, 2018 | | |
| Securities available-for-sale | $ | 12,416 |
| $ | 12,333 |
| $ | 56 |
| $ | (337 | ) | $ | 13,522 |
| $ | 13,411 |
| $ | 8 |
| $ | (87 | ) |
| Long-term debt | 24,249 |
| 24,200 |
| 249 |
| (157 | ) | 24,089 |
| 24,600 |
| — |
| (8 | ) |
| Dec. 31, 2016 | | |
| Dec. 31, 2017 | | Dec. 31, 2017 | |
| Securities available-for-sale | $ | 9,184 |
| $ | 9,233 |
| $ | 83 |
| $ | (342 | ) | $ | 12,307 |
| $ | 12,365 |
| $ | 102 |
| $ | (301 | ) |
| Long-term debt | 20,511 |
| 20,450 |
| 330 |
| (203 | ) | 23,821 |
| 23,950 |
| 175 |
| (233 | ) |
|
|
Notes to Consolidated Financial Statements(continued)
|
|
Note 15 - 16–Fair value option
We elected fair value as an alternative measurement for selected financial assets and financial liabilities.
The following table presents the assets and liabilities by type, of consolidated investment management funds, recorded at fair value.
|
| | | | | | |
| Assets and liabilities of consolidated investment management funds, at fair value | | |
| March 31, 2018 |
| Dec. 31, 2017 |
|
| (in millions) |
| Assets of consolidated investment management funds: | | |
| Trading assets | $ | 353 |
| $ | 516 |
|
| Other assets | 253 |
| 215 |
|
| Total assets of consolidated investment management funds | $ | 606 |
| $ | 731 |
|
| Liabilities of consolidated investment management funds: | | |
| Other liabilities | $ | 11 |
| $ | 2 |
|
| Total liabilities of consolidated investment management funds | $ | 11 |
| $ | 2 |
|
|
| | | | | | |
| Assets and liabilities of consolidated investment management funds, at fair value |
| | Sept. 30, 2017 |
| Dec. 31, 2016 |
|
| (in millions) |
| Assets of consolidated investment management funds: | | |
| Trading assets | $ | 576 |
| $ | 979 |
|
| Other assets | 226 |
| 252 |
|
| Total assets of consolidated investment management funds | $ | 802 |
| $ | 1,231 |
|
| Liabilities of consolidated investment management funds: | | |
| Trading liabilities | $ | — |
| $ | 282 |
|
| Other liabilities | 27 |
| 33 |
|
| Total liabilities of consolidated investment management funds | $ | 27 |
| $ | 315 |
|
BNY Mellon values the assets and liabilities of its consolidated investment management funds using quoted prices for identical assets or liabilities in active markets or observable inputs such as quoted prices for similar assets or liabilities. Quoted prices for either identical or similar assets or liabilities in inactive markets may also be used. Accordingly, fair value best reflects the interests BNY Mellon holds in the economic performance of the consolidated investment management funds. Changes in the value of the assets and liabilities are recorded in the consolidated income statement as investment income of consolidated investment management funds and in the interest of investment management fund note holders, respectively.
We have elected the fair value option on $240 million of long-term debt. The fair value of this long-term debt was $369363 million at Sept. 30, 2017March 31, 2018 and $363$367 million at Dec. 31, 2016.2017. The long-term debt is
|
|
Notes to Consolidated Financial Statements(continued) |
|
valued using observable market inputs and is included in Level 2 of the valuation hierarchy.
The following table presents the changeschange in fair value of long-term debt recorded in foreign exchange and certain loans for which we elected the fair value option that we previously held in 2016, and the location of the changesother trading revenue in the consolidated income statement.
|
| | | | | | | | | | | | | | | |
Impact of changes in fair value in the income statement (a) |
| (in millions) | 3Q17 |
| 2Q17 |
| 3Q16 |
| YTD17 |
| YTD16 |
|
| Loans: | | | | | |
| Investment and other income | $ | — |
| $ | — |
| $ | (1 | ) | $ | — |
| $ | 13 |
|
| Long-term debt: | | | | | |
| Foreign exchange and other trading revenue | $ | (1 | ) | $ | (4 | ) | $ | 2 |
| $ | (6 | ) | $ | (17 | ) |
|
| | | | | | | | | |
| Foreign exchange and other trading revenue |
| | Quarter ended |
| | March 31, 2018 |
| Dec. 31, 2017 |
| March 31, 2017 |
|
| (in millions) |
Long-term debt (a) | $ | 4 |
| $ | 2 |
| $ | (1 | ) |
| |
| (a) | The changeschange in fair value of the loans and long-term debt areis approximately offset by an economic hedgeshedge included in foreign exchange and other trading revenue. |
Note 16 - 17–Derivative instruments
We use derivatives to manage exposure to market risk, including interest rate risk, equity price risk and foreign currency risk, as well as credit risk. Our trading activities are focused on acting as a market-maker for our customers and facilitating customer trades in compliance with the Volcker Rule.
The notional amounts for derivative financial instruments express the dollar volume of the transactions; however, credit risk is much smaller. We perform credit reviews and enter into netting agreements and collateral arrangements to minimize the credit risk of derivative financial instruments. We enter into offsetting positions to reduce exposure to foreign currency, interest rate and equity price risk.
Use of derivative financial instruments involves reliance on counterparties. Failure of a counterparty to honor its obligation under a derivative contract is a risk we assume whenever we engage in a derivative contract. There were no counterparty default losses recorded in the thirdfirst quarter of 20172018 or the thirdfirst quarter of 2016.2017.
Hedging derivatives
We utilize interest rate swap agreements to manage our exposure to interest rate fluctuations. ForWe enter into fair value hedges ofas an interest rate risk management strategy to reduce fair value variability by converting certain fixed rate interest payments associated with available-for-sale investment securities, deposits and long-term debt the hedge documentation specifies the terms of the hedged items and the interest rate swaps and indicates that the derivative is hedging a fixed rate item and is a fair value hedge, that the hedge exposure is to the changes in the fair value of the hedged item due to changes in benchmark interest rates, and that the strategy is to eliminate fair value variability by converting fixed rate interest payments to LIBOR.
|
|
Notes to Consolidated Financial Statements(continued)
|
|
The available-for-sale investment securities hedged consist of U.S. Treasury bonds, agency and non-agency commercial MBS, sovereign debt and covered bonds that had original maturities of 30 years or less at initial purchase. The swaps on all of these investment securities are not callable. All of these securities are hedged with “pay fixed rate, receive variable rate” swaps of similar maturity, repricing and fixed rate coupon. At Sept. 30, 2017, $12.4March 31, 2018, $13.3 billion face amount of available-for-sale securities were hedged with interest rate swaps designated as fair value hedges that had notional values of $12.3$13.3 billion.
The fixed rate long-term debt instruments hedged generally have original maturities of five to 30 years. We issue both callable and non-callable debt. The non-callable debt is hedged with “receive fixed rate, pay variable rate” swaps with similar maturity, repricing and fixed rate coupon. Callable debt is hedged with callable swaps where the call dates of the swaps exactly match the call dates of the debt.swaps. At Sept. 30, 2017, $24.2March 31, 2018, $24.6 billion par value of debt was hedged with interest rate swaps that had notional values of $24.2$24.6 billion.
In addition, we enter intoutilize forward foreign exchange hedges.contracts as hedges to mitigate foreign exchange exposures. We use forward foreign exchange contracts as cash flow hedges to convert certain forecasted non-U.S. dollar revenue and expenses into U.S. dollars. We use forward foreign exchange contracts with maturities of nine15 months or less as cash flow hedges to hedge our foreign exchange exposure to Indian rupee, British pound, Hong Kong dollar, Singapore dollar, Polish zloty and Canadian dollar and Japanese yen foreign exchange exposure with respect to foreign currency forecasted revenue and expense transactions in entities that have the U.S. dollar as their functional currency. As of Sept. 30, 2017,March 31, 2018, the hedged forecasted foreign currency transactions and designated forward foreign exchange contract hedges were $539$415 million (notional), with a pre-tax lossgain of $9 million recorded in accumulated other comprehensive income. This lossgain will be reclassified to income or expenseearnings over the next nine12 months.
Forward foreign exchange contracts are also used to hedge the value of our net investments in foreign subsidiaries. These forward foreign exchange contracts have maturities of less than two years.one year. The derivatives employed are designated as hedges of changes in value of our foreign investments due to exchange rates. Changes in the value of the forward foreign exchange contracts offset the changes in value of the foreign investments due to changes in foreign exchange rates. The change in fair market value of these forward foreign exchange contracts is deferred and reported within foreign currency translation adjustments in shareholders’ equity, net of tax. At Sept. 30, 2017,March 31, 2018, forward foreign exchange contracts with notional amounts totaling $7.8$7.4 billion were designated as hedges.
|
|
Notes to Consolidated Financial Statements(continued) |
|
In addition to forward foreign exchange contracts, we also designate non-derivative financial instruments as hedges of our net investments in foreign subsidiaries. Those non-derivative financial instruments designated as hedges of our net investments in
foreign subsidiaries were all long-term liabilities of BNY Mellon in various currencies, and, at Sept. 30, 2017,March 31, 2018, had a combined U.S. dollar equivalent value of $181$188 million.
IneffectivenessThe following table presents the gains (losses) related to derivatives andour hedging relationships was recordedderivative portfolio recognized in the income as follows:statement.
|
| | | | | | |
| Ineffectiveness | Nine months ended |
| (in millions) | Sept. 30, 2017 |
| Sept. 30, 2016 |
|
| Fair value hedges of securities | $ | (13.3 | ) | $ | (5.4 | ) |
| Fair value hedges of long-term debt | 0.1 |
| (23.0 | ) |
| Cash flow hedges | — |
| — |
|
Other (a) | — |
| — |
|
| Total | $ | (13.2 | ) | $ | (28.4 | ) |
|
| | | | | | | | | | | |
| Income statement impact of fair value and cash flow hedges | Quarter ended |
| (in millions) | Location of gains (losses) | March 31, 2018 |
| Dec. 31, 2017 |
| March 31, 2017 |
|
| Fair value hedges of available-for-sale securities | | | | |
| | Derivative | Interest income | $ | 397 |
| $ | 91 |
| $ | 82 |
|
| | Hedged item | Interest income | (383 | ) | (93 | ) | (81 | ) |
| Fair value hedges of long-term debt | | | | |
| | Derivative | Interest expense | (378 | ) | (185 | ) | (72 | ) |
| | Hedged item | Interest expense | 377 |
| 178 |
| 67 |
|
| Cash flow hedges of forecasted FX exposures | | | | |
| | Gain reclassified from OCI into income | Trading revenue | — |
| — |
| 3 |
|
| | Gain (loss) reclassified from OCI into income | Salary expense | 6 |
| 25 |
| (4 | ) |
| | Gain reclassified from OCI into income | Other revenue | 4 |
| 8 |
| — |
|
| | Gains (losses) recognized in the consolidated income statement due to fair value and cash flow hedging relationships | | $ | 23 |
| $ | 24 |
| $ | (5 | ) |
The following table presents the impact of hedging derivatives used in net investment hedging relationships in the income statement.
|
| | | | | | | | | | | | | | | | | | | | | |
Impact of derivative instruments used in net investment hedging relationships in the income statement (in millions) |
| Derivatives in net investment hedging relationships | Gain or (loss) recognized in accumulated OCI on derivatives | | Location of gain or (loss) reclassified from accumulated OCI into income | | Gain or (loss) reclassified from accumulated OCI into income |
| 1Q18 |
| 4Q17 |
| 1Q17 |
| | | 1Q18 |
| 4Q17 |
| 1Q17 |
|
| FX contracts | $ | (158 | ) | $ | (49 | ) | $ | (96 | ) | | Net interest revenue | | $ | — |
| $ | — |
| $ | — |
|
The following table presents information on the hedged items in fair value hedging relationships.
|
| | | | | | | | | |
| Hedged items in fair value hedging relationships at March 31, 2018 | Carrying amount of hedged asset or liability | | Hedge accounting basis adjustment increase (decrease) | | |
| (in millions) | |
| Available-for-sale investment securities | | $ | 13,522 |
| | $ | (238 | ) | |
| Long-term debt | | 24,089 |
| | (511 | ) | (a) |
| |
| (a) | Includes ineffectiveness recorded$14 million of basis adjustment (reduction) on foreign exchange hedges.long-term debt associated with terminated hedges, whereby the long-term debt instrument has been subsequently re-designated in new hedge relationships existing as of the balance sheet date. |
|
|
Notes to Consolidated Financial Statements (continued) |
| |
The following table summarizes the notional amount and credit exposure of our total derivative portfolio at Sept. 30, 2017March 31, 2018 and Dec. 31, 2016.2017.
| | | Impact of derivative instruments on the balance sheet | Notional value | | Asset derivatives fair value | | Liability derivatives fair value | Notional value | | Asset derivatives fair value | | Liability derivatives fair value |
| (in millions) | Sept. 30, 2017 |
| Dec. 31, 2016 |
| | Sept. 30, 2017 |
| Dec. 31, 2016 |
| | Sept. 30, 2017 |
| Dec. 31, 2016 |
| March 31, 2018 |
| Dec. 31, 2017 |
| | March 31, 2018 |
| Dec. 31, 2017 |
| | March 31, 2018 |
| Dec. 31, 2017 |
|
Derivatives designated as hedging instruments: (a) | | | | | | | | | | |
| Interest rate contracts | $ | 36,533 |
| $ | 29,683 |
| | $ | 307 |
| $ | 415 |
| | $ | 494 |
| $ | 545 |
| $ | 38,011 |
| $ | 36,315 |
| | $ | 11 |
| $ | 278 |
| | $ | 95 |
| $ | 534 |
|
| Foreign exchange contracts | 8,399 |
| 7,796 |
| | 37 |
| 369 |
| | 318 |
| 52 |
| 8,212 |
| 8,923 |
| | 45 |
| 45 |
| | 284 |
| 266 |
|
| Total derivatives designated as hedging instruments | | | $ | 344 |
| $ | 784 |
| | $ | 812 |
| $ | 597 |
| | | $ | 56 |
| $ | 323 |
| | $ | 379 |
| $ | 800 |
|
Derivatives not designated as hedging instruments: (b) | | | | | | | | | | |
| Interest rate contracts | $ | 283,384 |
| $ | 325,412 |
| | $ | 6,734 |
| $ | 7,587 |
| | $ | 6,684 |
| $ | 7,633 |
| $ | 286,222 |
| $ | 267,485 |
| | $ | 3,938 |
| $ | 6,439 |
| | $ | 3,405 |
| $ | 6,353 |
|
| Foreign exchange contracts | 639,336 |
| 530,729 |
| | 4,879 |
| 6,104 |
| | 4,463 |
| 6,103 |
| 793,758 |
| 767,999 |
| | 4,391 |
| 5,104 |
| | 4,168 |
| 5,067 |
|
| Equity contracts | 1,354 |
| 1,167 |
| | 74 |
| 46 |
| | 134 |
| 112 |
| 1,615 |
| 1,698 |
| | 101 |
| 70 |
| | 135 |
| 149 |
|
| Credit contracts | 180 |
| 160 |
| | — |
| — |
| | 4 |
| 3 |
| 180 |
| 180 |
| | — |
| — |
| | 3 |
| 4 |
|
| Total derivatives not designated as hedging instruments | | | $ | 11,687 |
| $ | 13,737 |
| | $ | 11,285 |
| $ | 13,851 |
| | | $ | 8,430 |
| $ | 11,613 |
| | $ | 7,711 |
| $ | 11,573 |
|
Total derivatives fair value (c) | | | $ | 12,031 |
| $ | 14,521 |
| | $ | 12,097 |
| $ | 14,448 |
| | | $ | 8,486 |
| $ | 11,936 |
| | $ | 8,090 |
| $ | 12,373 |
|
Effect of master netting agreements (d) | | | (8,470 | ) | (10,257 | ) | | (8,875 | ) | (10,047 | ) | | | (5,719 | ) | (8,845 | ) | | (5,722 | ) | (8,797 | ) |
| Fair value after effect of master netting agreements | | | $ | 3,561 |
| $ | 4,264 |
| | $ | 3,222 |
| $ | 4,401 |
| | | $ | 2,767 |
| $ | 3,091 |
| | $ | 2,368 |
| $ | 3,576 |
|
| |
| (a) | The fair value of asset derivatives and liability derivatives designated as hedging instruments is recorded as other assets and other liabilities, respectively, on the balance sheet. |
| |
| (b) | The fair value of asset derivatives and liability derivatives not designated as hedging instruments is recorded as trading assets and trading liabilities, respectively, on the balance sheet. |
| |
| (c) | Fair values are on a gross basis, before consideration of master netting agreements, as required by ASC 815, Derivatives and Hedging. |
| |
| (d) | Effect of master netting agreements includes cash collateral received and paid of $834$808 million and $1,239$811 million, respectively, at Sept. 30, 2017March 31, 2018, and $1,119$925 million and $909$877 million, respectively, at Dec. 31, 20162017. |
The following tables present the impact of derivative instruments used in fair value, cash flow and net investment hedging relationships in the income statement.
|
| | | | | | | | | | | | | | | | | | | | | | | | | | | |
Impact of derivative instruments in the income statement (in millions) | | |
| Derivatives in fair value hedging relationships | Location of gain or (loss) recognized in income on derivatives | | Gain or (loss) recognized in income on derivatives | | Location of gain or (loss) recognized in income on hedged item | | Gain or (loss) recognized in hedged item |
| 3Q17 |
| | 2Q17 |
| | 3Q16 |
| | 3Q17 |
| | 2Q17 |
| | 3Q16 |
|
| Interest rate contracts | Net interest revenue | | $ | (33 | ) | | $ | 2 |
| | $ | (174 | ) | | Net interest revenue | | $ | 31 |
| | $ | (9 | ) | | $ | 168 |
|
|
| | | | | | | | | | | | | | | | | | | | | | | | | | | | | | | | | |
Derivatives in cash flow hedging relationships | Gain or (loss) recognized in accumulated OCI on derivatives (effective portion) | | Location of gain or (loss) reclassified from accumulated OCI into income (effective portion) | | Gain or (loss) reclassified from accumulated OCI into income (effective portion) | | Location of gain or (loss) recognized in income on derivatives (ineffective portion and amount excluded from effectiveness testing) | | Gain or (loss) recognized in income on derivatives (ineffectiveness portion and amount excluded from effectiveness testing) |
| 3Q17 |
| 2Q17 |
| 3Q16 |
| | | 3Q17 |
| 2Q17 |
| 3Q16 |
| | | 3Q17 |
| 2Q17 |
| 3Q16 |
|
| FX contracts | $ | — |
| $ | — |
| $ | (7 | ) | | Net interest revenue | | $ | — |
| $ | — |
| $ | (6 | ) | | Net interest revenue | | $ | — |
| $ | — |
| $ | — |
|
| FX contracts | 3 |
| (1 | ) | — |
| | Other revenue | | — |
| — |
| — |
| | Other revenue | | — |
| — |
| — |
|
| FX contracts | (1 | ) | — |
| (19 | ) | | Trading revenue | | (1 | ) | — |
| (19 | ) | | Trading revenue | | — |
| — |
| — |
|
| FX contracts | (4 | ) | (7 | ) | 2 |
| | Salary expense | | (2 | ) | (9 | ) | (3 | ) | | Salary expense | | — |
| — |
| — |
|
| Total | $ | (2 | ) | $ | (8 | ) | $ | (24 | ) | | | | $ | (3 | ) | $ | (9 | ) | $ | (28 | ) | | | | $ | — |
| $ | — |
| $ | — |
|
|
|
Notes to Consolidated Financial Statements(continued)
|
|
|
| | | | | | | | | | | | | | | | | | | | | | | | | | | | | | | | | |
Derivatives in net investment hedging relationships | Gain or (loss) recognized in accumulated OCI on derivatives (effective portion) | | Location of gain or (loss) reclassified from accumulated OCI into income (effective portion) | | Gain or (loss) reclassified from accumulated OCI into income (effective portion) | | Location of gain or (loss) recognized in income on derivatives (ineffective portion and amount excluded from effectiveness testing) | | Gain or (loss) recognized in income on derivatives (ineffectiveness portion and amount excluded from effectiveness testing) |
| 3Q17 |
| 2Q17 |
| 3Q16 |
| | | 3Q17 |
| 2Q17 |
| 3Q16 |
| | | 3Q17 |
| 2Q17 |
| 3Q16 |
|
| FX contracts | $ | (206 | ) | $ | (274 | ) | $ | 47 |
| | Net interest revenue | | $ | — |
| $ | — |
| $ | — |
| | Other revenue | | $ | — |
| $ | — |
| $ | — |
|
|
| | | | | | | | | | | | | | | | | | | |
Impact of derivative instruments in the income statement (in millions) | |
| Derivatives in fair value hedging relationships | Location of gain or (loss) recognized in income on derivatives | | Gain or (loss) recognized in income on derivatives | | Location of gain or (loss) recognized in income on hedged item | | Gain or (loss) recognized in hedged item |
| YTD17 |
| | YTD16 |
| YTD17 |
| | YTD16 |
|
| Interest rate contracts | Net interest revenue | | $ | (21 | ) | | $ | (445 | ) | | Net interest revenue | | $ | 8 |
| | $ | 417 |
|
|
| | | | | | | | | | | | | | | | | | | | | | | | |
Derivatives in cash flow hedging relationships | Gain or (loss) recognized in accumulated OCI on derivatives (effective portion) | | Location of gain or (loss) reclassified from accumulated OCI into income (effective portion) | | Gain or (loss) reclassified from accumulated OCI into income (effective portion) | | Location of gain or (loss) recognized in income on derivatives (ineffective portion and amount excluded from effectiveness testing) | | Gain or (loss) recognized in income on derivatives (ineffectiveness portion and amount excluded from effectiveness testing) |
| YTD17 |
| YTD16 |
| | | YTD17 |
| YTD16 |
| | | YTD17 |
| YTD16 |
|
| FX contracts | $ | — |
| $ | (16 | ) | | Net interest revenue | | $ | — |
| $ | (16 | ) | | Net interest revenue | | $ | — |
| $ | — |
|
| FX contracts | 2 |
| — |
| | Other revenue | | — |
| — |
| | Other revenue | | — |
| — |
|
| FX contracts | 2 |
| (89 | ) | | Trading revenue | | 2 |
| (89 | ) | | Trading revenue | | — |
| — |
|
| FX contracts | — |
| (10 | ) | | Salary expense | | (15 | ) | (5 | ) | | Salary expense | | — |
| — |
|
| Total | $ | 4 |
| $ | (115 | ) | | | | $ | (13 | ) | $ | (110 | ) | | | | $ | — |
| $ | — |
|
|
| | | | | | | | | | | | | | | | | | | | | | | | |
Derivatives in net investment hedging relationships | Gain or (loss) recognized in accumulated OCI on derivatives (effective portion) | | Location of gain or (loss) reclassified from accumulated OCI into income (effective portion) | | Gain or (loss) reclassified from accumulated OCI into income (effective portion) | | Location of gain or (loss) recognized in income on derivatives (ineffective portion and amount excluded from effectiveness testing) | | Gain or (loss) recognized in income on derivatives (ineffectiveness portion and amount excluded from effectiveness testing) |
| YTD17 |
| YTD16 |
| | | YTD17 |
| YTD16 |
| | | YTD17 |
| YTD16 |
|
| FX contracts | $ | (576 | ) | $ | 320 |
| | Net interest revenue | | $ | — |
| $ | — |
| | Other revenue | | $ | — |
| $ | — |
|
Trading activities (including trading derivatives)
We manage trading risk through a system of position limits, a VaR methodology based on historical simulation and other market sensitivity measures. Risk is monitored and reported to senior management by a separate unit, independent from trading, on a daily basis. Based on certain assumptions, the VaR methodology is designed to capture the potential overnight pre-tax dollar loss from adverse changes in fair values of all trading positions. The calculation assumes a one-day holding period, utilizes a 99% confidence level and incorporates non-linear product characteristics. The VaR model is one of several statistical models used to develop economic capital results, which are allocated to lines of business for computing risk-adjusted performance.
As the VaR methodology does not evaluate risk attributable to extraordinary financial, economic or other occurrences,occurrences. As a result, the risk assessment process includes a number of stress scenarios based upon the risk factors in the portfolio and management’s assessment of market conditions. Additional stress scenarios based upon historical market events are also performed. Stress tests may incorporate the impact of reduced market liquidity and the breakdown of historically observed correlations and extreme
scenarios. VaR and other statistical measures, stress testing and sensitivity analysis are incorporated in other risk management materials.
|
|
Notes to Consolidated Financial Statements(continued)
|
|
The following table presents our foreign exchange and other trading revenue.
| | Foreign exchange and other trading revenue | | (in millions) | 3Q17 |
| 2Q17 |
| 3Q16 |
| YTD17 |
| YTD16 |
| 1Q18 |
| 4Q17 |
| 1Q17 |
|
| Foreign exchange | $ | 158 |
| $ | 151 |
| $ | 175 |
| $ | 463 |
| $ | 512 |
| $ | 183 |
| $ | 175 |
| $ | 154 |
|
| Other trading revenue | 15 |
| 14 |
| 8 |
| 39 |
| 28 |
| |
| Other trading revenue (loss) | | 26 |
| (9 | ) | 10 |
|
| Total foreign exchange and other trading revenue | $ | 173 |
| $ | 165 |
| $ | 183 |
| $ | 502 |
| $ | 540 |
| $ | 209 |
| $ | 166 |
| $ | 164 |
|
Foreign exchange revenue includes income from purchasing and selling foreign currencies and currency forwards, futures and options. Other trading revenue reflects results from futures and forward contracts, interest rate swaps, structured foreign currency swaps, options, equity derivatives andtrading in cash instruments including fixed income and equity securities.securities and non-foreign exchange derivatives.
Counterparty credit risk and collateral
We assess credit risk of our counterparties through regular examination of their financial statements, confidential communication with the management of those counterparties and regular monitoring of
|
|
Notes to Consolidated Financial Statements(continued) |
|
publicly available credit rating information. This and other information is used to develop proprietary credit rating metrics used to assess credit quality.
Collateral requirements are determined after a comprehensive review of the credit quality of each counterparty. Collateral is generally held or pledged in the form of cash or highly liquid government securities. Collateral requirements are monitored and adjusted daily.
Additional disclosures concerning derivative financial instruments are provided in Note 1415 of the Notes to Consolidated Financial Statements.
Disclosure of contingent features in OTC derivative instruments
Certain OTC derivative contracts and/or collateral agreements of The Bank of New York Mellon, our largest banking subsidiary and the subsidiary through which BNY Mellon enters into the substantial majority of its OTC derivative contracts and/or collateral agreements, contain provisions that may require us to take certain actions if The Bank of New York Mellon’s public debt rating fell to a certain level. Early termination provisions, or “close-out”
agreements, in those contracts could trigger immediate payment of outstanding contracts that are in net liability positions. Certain collateral agreements would require The Bank of New York Mellon to immediately post additional collateral to
cover some or all of The Bank of New York Mellon’s liabilities to a counterparty.
The following table shows the fair value of contracts falling under early termination provisions that were in net liability positions as of Sept. 30, 2017March 31, 2018 for three key ratings triggers.
| | | If The Bank of New York Mellon’s rating was changed to (Moody’s/S&P) | Potential close-out exposures (fair value) (a) | | Potential close-out exposures (fair value) (a) | |
| A3/A- | | $ | 92 | million | | $ | 16 | million |
| Baa2/BBB | | $ | 430 | million | | $ | 232 | million |
| Ba1/BB+ | | $ | 1,899 | million | | $ | 1,419 | million |
| |
| (a) | The amounts represent potential total close-out values if The Bank of New York Mellon’s rating were to immediately drop to the indicated levels. |
The aggregated fair value of contracts impacting potential trade close-out amounts and collateral obligations can fluctuate from quarter to quarter due to changes in market conditions, changes in the composition of counterparty trades, new business or changes to the agreement definitions establishing close-out or collateral obligations.
Additionally, ifIf The Bank of New York Mellon’s debt rating had fallen below investment grade on Sept. 30, 2017,March 31, 2018, existing collateral arrangements would have required us to post an additional $151$144 million of collateral.
|
|
Notes to Consolidated Financial Statements(continued)
|
|
The following tables present derivative instruments and financial instruments that are either subject to an enforceable netting agreement or offset by collateral arrangements. There were no derivative instruments or financial instruments subject to a legally enforceable netting agreement for which we are not currently netting.
| | | Offsetting of derivative assets and financial assets at Sept. 30, 2017 | | |
| Offsetting of derivative assets and financial assets at March 31, 2018 | | Offsetting of derivative assets and financial assets at March 31, 2018 | |
| | Gross assets recognized |
| Gross amounts offset in the balance sheet |
| | Net assets recognized on the balance sheet |
| Gross amounts not offset in the balance sheet | | Gross assets recognized |
| Gross amounts offset in the balance sheet |
| | Net assets recognized in the balance sheet |
| Gross amounts not offset in the balance sheet | |
| (in millions) | (a) | Financial instruments |
| Cash collateral received |
| Net amount |
| (a) | Financial instruments |
| Cash collateral received |
| Net amount |
|
| Derivatives subject to netting arrangements: | | | | | | |
| Interest rate contracts | $ | 6,182 |
| $ | 5,301 |
| | $ | 881 |
| $ | 189 |
| $ | — |
| $ | 692 |
| $ | 3,270 |
| $ | 2,550 |
| | $ | 720 |
| $ | 140 |
| $ | — |
| $ | 580 |
|
| Foreign exchange contracts | 4,281 |
| 3,120 |
| | 1,161 |
| 82 |
| — |
| 1,079 |
| 3,885 |
| 3,092 |
| | 793 |
| 137 |
| — |
| 656 |
|
| Equity and other contracts | 69 |
| 49 |
| | 20 |
| — |
| — |
| 20 |
| 98 |
| 77 |
| | 21 |
| — |
| — |
| 21 |
|
| Total derivatives subject to netting arrangements | 10,532 |
| 8,470 |
| | 2,062 |
| 271 |
| — |
| 1,791 |
| 7,253 |
| 5,719 |
| | 1,534 |
| 277 |
| — |
| 1,257 |
|
| Total derivatives not subject to netting arrangements | 1,499 |
| — |
| | 1,499 |
| — |
| — |
| 1,499 |
| 1,233 |
| — |
| | 1,233 |
| — |
| — |
| 1,233 |
|
| Total derivatives | 12,031 |
| 8,470 |
| | 3,561 |
| 271 |
| — |
| 3,290 |
| 8,486 |
| 5,719 |
| | 2,767 |
| 277 |
| — |
| 2,490 |
|
| Reverse repurchase agreements | 36,118 |
| 19,171 |
| (b) | 16,947 |
| 16,890 |
| — |
| 57 |
| 36,755 |
| 18,763 |
| (b) | 17,992 |
| 17,981 |
| — |
| 11 |
|
| Securities borrowing | 10,936 |
| — |
| | 10,936 |
| 10,627 |
| — |
| 309 |
| 10,792 |
| — |
| | 10,792 |
| 10,546 |
| — |
| 246 |
|
| Total | $ | 59,085 |
| $ | 27,641 |
| | $ | 31,444 |
| $ | 27,788 |
| $ | — |
| $ | 3,656 |
| $ | 56,033 |
| $ | 24,482 |
| | $ | 31,551 |
| $ | 28,804 |
| $ | — |
| $ | 2,747 |
|
|
|
Notes to Consolidated Financial Statements(continued) |
|
|
| | | | | | | | | | | | | | | | | | | |
| Offsetting of derivative assets and financial assets at Dec. 31, 2017 | | | | |
| | Gross assets recognized |
| Gross amounts offset in the balance sheet |
| | Net assets recognized in the balance sheet |
| Gross amounts not offset in the balance sheet | |
| (in millions) | (a) | Financial instruments |
| Cash collateral received |
| Net amount |
|
| Derivatives subject to netting arrangements: | | | | | | | |
| Interest rate contracts | $ | 5,915 |
| $ | 5,075 |
| | $ | 840 |
| $ | 178 |
| $ | — |
| $ | 662 |
|
| Foreign exchange contracts | 4,666 |
| 3,720 |
| | 946 |
| 116 |
| — |
| 830 |
|
| Equity and other contracts | 67 |
| 50 |
| | 17 |
| — |
| — |
| 17 |
|
| Total derivatives subject to netting arrangements | 10,648 |
| 8,845 |
| | 1,803 |
| 294 |
| — |
| 1,509 |
|
| Total derivatives not subject to netting arrangements | 1,288 |
| — |
| | 1,288 |
| — |
| — |
| 1,288 |
|
| Total derivatives | 11,936 |
| 8,845 |
| | 3,091 |
| 294 |
| — |
| 2,797 |
|
| Reverse repurchase agreements | 42,784 |
| 25,848 |
| (b) | 16,936 |
| 16,923 |
| — |
| 13 |
|
| Securities borrowing | 11,199 |
| — |
| | 11,199 |
| 10,858 |
| — |
| 341 |
|
| Total | $ | 65,919 |
| $ | 34,693 |
| | $ | 31,226 |
| $ | 28,075 |
| $ | — |
| $ | 3,151 |
|
| |
| (a) | Includes the effect of netting agreements and net cash collateral received. The offset related to the OTC derivatives was allocated to the various types of derivatives based on the net positions. |
| |
| (b) | Offsetting of reverse repurchase agreements relates to our involvement in the Fixed Income Clearing Corporation, where we settle government securities transactions on a net basis for payment and delivery through the Fedwire system. |
|
| | | | | | | | | | | | | | | | | | | |
| Offsetting of derivative assets and financial assets at Dec. 31, 2016 | | | | |
| | Gross assets recognized |
| Gross amounts offset in the balance sheet |
| | Net assets recognized on the balance sheet |
| Gross amounts not offset in the balance sheet | |
| (in millions) | (a) | Financial instruments |
| Cash collateral received |
| Net amount |
|
| Derivatives subject to netting arrangements: | | | | | | | |
| Interest rate contracts | $ | 7,205 |
| $ | 6,047 |
| | $ | 1,158 |
| $ | 321 |
| $ | — |
| $ | 837 |
|
| Foreign exchange contracts | 5,265 |
| 4,172 |
| | 1,093 |
| 202 |
| — |
| 891 |
|
| Equity and other contracts | 44 |
| 38 |
| | 6 |
| — |
| — |
| 6 |
|
| Total derivatives subject to netting arrangements | 12,514 |
| 10,257 |
| | 2,257 |
| 523 |
| — |
| 1,734 |
|
| Total derivatives not subject to netting arrangements | 2,007 |
| — |
| | 2,007 |
| — |
| — |
| 2,007 |
|
| Total derivatives | 14,521 |
| 10,257 |
| | 4,264 |
| 523 |
| — |
| 3,741 |
|
| Reverse repurchase agreements | 17,588 |
| 481 |
| (b) | 17,107 |
| 17,104 |
| — |
| 3 |
|
| Securities borrowing | 8,694 |
| — |
| | 8,694 |
| 8,425 |
| — |
| 269 |
|
| Total | $ | 40,803 |
| $ | 10,738 |
| | $ | 30,065 |
| $ | 26,052 |
| $ | — |
| $ | 4,013 |
|
| |
(a) | Includes the effect of netting agreements and net cash collateral received. The offset related to the OTC derivatives was allocated to the various types of derivatives based on the net positions. |
| |
(b) | Offsetting of reverse repurchase agreements relates to our involvement in the Fixed Income Clearing Corporation, where we settle government securities transactions on a net basis for payment and delivery through the Fedwire system. |
|
| | | | | | | | | | | | | | | | | | | |
| Offsetting of derivative liabilities and financial liabilities at March 31, 2018 | Net liabilities recognized in the balance sheet |
| | | |
| | Gross liabilities recognized |
| Gross amounts offset in the balance sheet |
| | Gross amounts not offset in the balance sheet | |
| (in millions) | (a) | Financial instruments |
| Cash collateral pledged |
| Net amount |
|
| Derivatives subject to netting arrangements: | | | | | | | |
| Interest rate contracts | $ | 3,424 |
| $ | 2,482 |
| | $ | 942 |
| $ | 834 |
| $ | — |
| $ | 108 |
|
| Foreign exchange contracts | 3,964 |
| 3,168 |
| | 796 |
| 185 |
| — |
| 611 |
|
| Equity and other contracts | 128 |
| 72 |
| | 56 |
| 53 |
| — |
| 3 |
|
| Total derivatives subject to netting arrangements | 7,516 |
| 5,722 |
| | 1,794 |
| 1,072 |
| — |
| 722 |
|
| Total derivatives not subject to netting arrangements | 574 |
| — |
| | 574 |
| — |
| — |
| 574 |
|
| Total derivatives | 8,090 |
| 5,722 |
| | 2,368 |
| 1,072 |
| — |
| 1,296 |
|
| Repurchase agreements | 27,763 |
| 18,763 |
| (b) | 9,000 |
| 9,000 |
| — |
| — |
|
| Securities lending | 1,332 |
| — |
| | 1,332 |
| 1,278 |
| — |
| 54 |
|
| Total | $ | 37,185 |
| $ | 24,485 |
| | $ | 12,700 |
| $ | 11,350 |
| $ | — |
| $ | 1,350 |
|
|
|
Notes to Consolidated Financial Statements(continued)
|
|
| | | Offsetting of derivative liabilities and financial liabilities at Sept. 30, 2017 | Net liabilities recognized on the balance sheet |
| | |
| Offsetting of derivative liabilities and financial liabilities at Dec. 31, 2017 | | Offsetting of derivative liabilities and financial liabilities at Dec. 31, 2017 | Net liabilities recognized in the balance sheet |
| |
| | Gross liabilities recognized |
| Gross amounts offset in the balance sheet |
| | Gross amounts not offset in the balance sheet | | Gross liabilities recognized |
| Gross amounts offset in the balance sheet |
| | Gross amounts not offset in the balance sheet | |
| (in millions) | (a) | Financial instruments |
| Cash collateral pledged |
| Net liabilities recognized on the balance sheet |
| Net amount |
| (a) | Cash collateral pledged |
| Net liabilities recognized in the balance sheet |
| Net amount |
|
| Derivatives subject to netting arrangements: | | | | | | |
| Interest rate contracts | $ | 7,103 |
| $ | 5,705 |
| | $ | 1,398 |
| $ | 1,311 |
| $ | 87 |
| $ | 6,810 |
| $ | 5,495 |
| | $ | 1,315 |
| $ | 1,222 |
| $ | 93 |
|
| Foreign exchange contracts | 4,074 |
| 3,095 |
| | 979 |
| 234 |
| — |
| 745 |
| 4,765 |
| 3,221 |
| | 1,544 |
| 177 |
| — |
| 1,367 |
|
| Equity and other contracts | 130 |
| 75 |
| | 55 |
| 49 |
| — |
| 6 |
| 143 |
| 81 |
| | 62 |
| 58 |
| — |
| 4 |
|
| Total derivatives subject to netting arrangements | 11,307 |
| 8,875 |
| | 2,432 |
| 1,594 |
| — |
| 838 |
| 11,718 |
| 8,797 |
| | 2,921 |
| 1,457 |
| — |
| 1,464 |
|
| Total derivatives not subject to netting arrangements | 790 |
| — |
| | 790 |
| — |
| — |
| 790 |
| 655 |
| — |
| | 655 |
| — |
| — |
| 655 |
|
| Total derivatives | 12,097 |
| 8,875 |
| | 3,222 |
| 1,594 |
| — |
| 1,628 |
| 12,373 |
| 8,797 |
| | 3,576 |
| 1,457 |
| — |
| 2,119 |
|
| Repurchase agreements | 27,321 |
| 19,171 |
| (b) | 8,150 |
| 8,149 |
| — |
| 1 |
| 33,908 |
| 25,848 |
| (b) | 8,060 |
| 8,059 |
| — |
| 1 |
|
| Securities lending | 1,904 |
| — |
| | 1,904 |
| 1,812 |
| — |
| 92 |
| 2,186 |
| — |
| | 2,186 |
| 2,091 |
| — |
| 95 |
|
| Total | $ | 41,322 |
| $ | 28,046 |
| | $ | 13,276 |
| $ | 11,555 |
| $ | — |
| $ | 1,721 |
| $ | 48,467 |
| $ | 34,645 |
| | $ | 13,822 |
| $ | 11,607 |
| $ | — |
| $ | 2,215 |
|
| |
| (a) | Includes the effect of netting agreements and net cash collateral paid. The offset related to the OTC derivatives was allocated to the various types of derivatives based on the net positions. |
| |
| (b) | Offsetting of repurchase agreements relates to our involvement in the Fixed Income Clearing Corporation, where we settle government securities transactions on a net basis for payment and delivery through the Fedwire system. |
|
| | | | | | | | | | | | | | | | | | | |
| Offsetting of derivative liabilities and financial liabilities at Dec. 31, 2016 | Net liabilities recognized on the balance sheet |
| | | |
| | Gross liabilities recognized |
| Gross amounts offset in the balance sheet |
| | Gross amounts not offset in the balance sheet | |
| (in millions) | (a) | Financial instruments |
| Cash collateral pledged |
| Net amount |
|
| Derivatives subject to netting arrangements: | | | | | | | |
| Interest rate contracts | $ | 8,116 |
| $ | 6,634 |
| | $ | 1,482 |
| $ | 1,266 |
| $ | — |
| $ | 216 |
|
| Foreign exchange contracts | 4,957 |
| 3,363 |
| | 1,594 |
| 355 |
| — |
| 1,239 |
|
| Equity and other contracts | 104 |
| 50 |
| | 54 |
| 54 |
| — |
| — |
|
| Total derivatives subject to netting arrangements | 13,177 |
| 10,047 |
| | 3,130 |
| 1,675 |
| — |
| 1,455 |
|
| Total derivatives not subject to netting arrangements | 1,271 |
| — |
| | 1,271 |
| — |
| — |
| 1,271 |
|
| Total derivatives | 14,448 |
| 10,047 |
| | 4,401 |
| 1,675 |
| — |
| 2,726 |
|
| Repurchase agreements | 8,703 |
| 481 |
| (b) | 8,222 |
| 8,222 |
| — |
| — |
|
| Securities lending | 1,615 |
| — |
| | 1,615 |
| 1,522 |
| — |
| 93 |
|
| Total | $ | 24,766 |
| $ | 10,528 |
| | $ | 14,238 |
| $ | 11,419 |
| $ | — |
| $ | 2,819 |
|
| |
(a) | Includes the effect of netting agreements and net cash collateral paid. The offset related to the OTC derivatives was allocated to the various types of derivatives based on the net positions. |
| |
(b) | Offsetting of repurchase agreements relates to our involvement in the Fixed Income Clearing Corporation, where we settle government securities transactions on a net basis for payment and delivery through the Fedwire system. |
|
|
Notes to Consolidated Financial Statements (continued) |
| |
Secured borrowings
The following tables presenttable presents the contract value of repurchase agreements and securities lending transactions accounted for as secured borrowings by the type of collateral provided to counterparties.
|
| | | | | | | | | | | | |
| Repurchase agreements and securities lending transactions accounted for as secured borrowings at Sept. 30, 2017 |
| | Remaining contractual maturity of the agreements |
| (in millions) | Overnight and continuous |
| Up to 30 days |
| 30 days or more |
| Total |
|
| Repurchase agreements: | | | | |
| U.S. Treasury | $ | 21,432 |
| $ | — |
| $ | — |
| $ | 21,432 |
|
| U.S. government agencies | 489 |
| 110 |
| — |
| 599 |
|
| Agency RMBS | 1,798 |
| 190 |
| — |
| 1,988 |
|
| Corporate bonds | 282 |
| — |
| 940 |
| 1,222 |
|
| Other debt securities | 254 |
| — |
| 871 |
| 1,125 |
|
| Equity securities | 466 |
| — |
| 489 |
| 955 |
|
| Total | $ | 24,721 |
| $ | 300 |
| $ | 2,300 |
| $ | 27,321 |
|
| Securities lending: | | | | |
| U.S. government agencies | $ | 15 |
| $ | — |
| $ | — |
| $ | 15 |
|
| Other debt securities | 477 |
| — |
| — |
| 477 |
|
| Equity securities | 1,412 |
| — |
| — |
| 1,412 |
|
| Total | $ | 1,904 |
| $ | — |
| $ | — |
| $ | 1,904 |
|
| Total borrowings | $ | 26,625 |
| $ | 300 |
| $ | 2,300 |
| $ | 29,225 |
|
| | | Repurchase agreements and securities lending transactions accounted for as secured borrowings at Dec. 31, 2016 | |
| Repurchase agreements and securities lending transactions accounted for as secured borrowings | | Repurchase agreements and securities lending transactions accounted for as secured borrowings |
| | | March 31, 2018 | | Dec. 31, 2017 |
| | Remaining contractual maturity of the agreements | Remaining contractual maturity | Total |
| | Remaining contractual maturity | Total |
|
| (in millions) | Overnight and continuous |
| Up to 30 days |
| 30 days or more |
| Total |
| Overnight and continuous |
| Up to 30 days |
| 30 days or more |
| | Overnight and continuous |
| Up to 30 days |
| 30 days or more |
|
| Repurchase agreements: | | | | |
| U.S. Treasury | $ | 2,488 |
| $ | 4 |
| $ | — |
| $ | 2,492 |
| $ | 19,858 |
| $ | 1 |
| $ | — |
| $ | 19,859 |
| | $ | 26,883 |
| $ | 11 |
| $ | — |
| $ | 26,894 |
|
| U.S. government agencies | 396 |
| 10 |
| — |
| 406 |
| 719 |
| 118 |
| — |
| 837 |
| | 570 |
| 180 |
| — |
| 750 |
|
| Agency RMBS | 3,294 |
| 386 |
| — |
| 3,680 |
| 1,808 |
| 181 |
| 1,032 |
| 3,021 |
| | 2,574 |
| 109 |
| — |
| 2,683 |
|
| Corporate bonds | 304 |
| — |
| 694 |
| 998 |
| 712 |
| — |
| 1,132 |
| 1,844 |
| | 373 |
| — |
| 1,052 |
| 1,425 |
|
| Other debt securities | 146 |
| — |
| 563 |
| 709 |
| 655 |
| — |
| 930 |
| 1,585 |
| | 253 |
| — |
| 731 |
| 984 |
|
| Equity securities | 375 |
| — |
| 43 |
| 418 |
| 411 |
| — |
| 206 |
| 617 |
| | 655 |
| — |
| 517 |
| 1,172 |
|
| Total | $ | 7,003 |
| $ | 400 |
| $ | 1,300 |
| $ | 8,703 |
| $ | 24,163 |
| $ | 300 |
| $ | 3,300 |
| $ | 27,763 |
| | $ | 31,308 |
| $ | 300 |
| $ | 2,300 |
| $ | 33,908 |
|
| Securities lending: | | | | |
| U.S. government agencies | $ | 39 |
| $ | — |
| $ | — |
| $ | 39 |
| $ | 20 |
| $ | — |
| $ | — |
| $ | 20 |
| | $ | 72 |
| $ | — |
| $ | — |
| $ | 72 |
|
| Other debt securities | 477 |
| — |
| — |
| 477 |
| 369 |
| — |
| — |
| 369 |
| | 316 |
| — |
| — |
| 316 |
|
| Equity securities | 1,099 |
| — |
| — |
| 1,099 |
| 943 |
| — |
| — |
| 943 |
| | 1,798 |
| — |
| — |
| 1,798 |
|
| Total | $ | 1,615 |
| $ | — |
| $ | — |
| $ | 1,615 |
| $ | 1,332 |
| $ | — |
| $ | — |
| $ | 1,332 |
| | $ | 2,186 |
| $ | — |
| $ | — |
| $ | 2,186 |
|
| Total borrowings | $ | 8,618 |
| $ | 400 |
| $ | 1,300 |
| $ | 10,318 |
| $ | 25,495 |
| $ | 300 |
| $ | 3,300 |
| $ | 29,095 |
| | $ | 33,494 |
| $ | 300 |
| $ | 2,300 |
| $ | 36,094 |
|
BNY Mellon’s repurchase agreements and securities lending transactions primarily encounter risk associated with liquidity. We are required to pledge collateral based on predetermined terms within the agreements. If we were to experience a decline in the fair value of the collateral pledged for these transactions, we could be required to provide
additional collateral to the counterparty, therefore decreasing the amount of assets available for other liquidity needs that may arise. BNY Mellon also offers tri-party collateral agency services in the tri-party repo market where we are exposed to credit risk. In order to mitigate this risk, we require dealers to fully secure intraday credit.
|
|
Notes to Consolidated Financial Statements(continued)
|
|
Note 17 - 18–Commitments and contingent liabilities
Off-balance sheet arrangements
In the normal course of business, various commitments and contingent liabilities are outstanding that are not reflected in the accompanying consolidated balance sheets.
Our significant trading and off-balance sheet risks are securities, foreign currency and interest rate risk management products, commercial lending commitments, letters of credit and securities lending indemnifications. We assume these risks to reduce
interest rate and foreign currency risks, to provide customers with the ability to meet credit and liquidity needs and to hedge foreign currency and interest rate risks. These items involve, to varying degrees, credit, foreign currency and interest rate riskrisks not recognized on the balance sheet. Our off-balance sheet risks are managed and monitored in manners similar to those used for on-balance sheet risks.
The following table presents a summary of our off-balance sheet credit risks.
| | | Off-balance sheet credit risks | Sept. 30, 2017 |
| Dec. 31, 2016 |
| March 31, 2018 |
| Dec. 31, 2017 |
|
| (in millions) |
| Lending commitments | $ | 49,983 |
| $ | 51,270 |
| $ | 51,312 |
| $ | 51,467 |
|
Standby letters of credit (a) | 3,619 |
| 4,185 |
| 3,367 |
| 3,531 |
|
| Commercial letters of credit | 265 |
| 339 |
| 191 |
| 122 |
|
Securities lending indemnifications (b)(c) | 406,434 |
| 317,690 |
| 462,900 |
| 432,084 |
|
| |
| (a) | Net of participations totaling $681$605 million at Sept. 30, 2017March 31, 2018 and $662$672 million at Dec. 31, 2016.2017. |
| |
| (b) | Excludes the indemnification for securities for which BNY Mellon acts as an agent on behalf of CIBC Mellon clients, which totaled $65$70 billion at Sept. 30, 2017March 31, 2018 and $61$69 billion at Dec. 31, 2016.2017. |
| |
| (c) | Includes cash collateral, invested in indemnified repurchase agreements, held by us as securities lending agent of $36 billion at March 31, 2018 and $33 billion at Dec. 31, 2017. |
|
|
Notes to Consolidated Financial Statements(continued) |
|
The total potential loss on undrawn lending commitments, standby and commercial letters of credit, and securities lending indemnifications is equal to the total notional amount if drawn upon, which does not consider the value of any collateral.
Since many of the lending commitments are expected to expire without being drawn upon, the total amount does not necessarily represent future cash requirements. A summary of lending commitment maturities is as follows: $29.8$30.5 billion in less than one year, $20.0$20.6 billion in one to five years and $158$165 million over five years.
Standby letters of credit (“SBLC”)SBLCs principally support obligations of corporate obligationsclients and were collateralized with cash and securities of $178$141 million at Sept. 30, 2017March 31, 2018 and $293$160 million at Dec. 31, 2016.2017. At Sept. 30, 2017,March 31, 2018, $2.3 billion of the SBLCs will expire within one year and $1.2$1.1 billion in one to five years and $48 million in over five years.
We must recognize, at the inception of an SBLC and foreign and other guarantees, a liability for the fair value of the obligation undertaken in issuing the guarantee. The fair value of the liability, which was recorded with a corresponding asset in other assets, was estimated as the present value of contractual customer fees. The estimated liability for losses related to SBLCs and foreign and other guarantees, if any, is included in the allowance for lending-related commitments. The allowance for lending-related commitments was $104$100 million at Sept. 30, 2017March 31, 2018 and $112$102 million at Dec. 31, 2016.2017.
Payment/performance risk of SBLCs is monitored using both historical performance and internal ratings criteria. BNY Mellon’s historical experience is that SBLCs typically expire without being funded. SBLCs below investment grade are monitored closely for payment/performance risk. The table below shows SBLCs by investment grade:
| | | Standby letters of credit | Sept. 30, 2017 |
| Dec. 31, 2016 |
| March 31, 2018 |
| Dec. 31, 2017 |
|
| |
| Investment grade | 86 | % | 89 | % | 86 | % | 84 | % |
| Non-investment grade | 14 | % | 11 | % | 14 | % | 16 | % |
A commercial letter of credit is normally a short-term instrument used to finance a commercial contract for the shipment of goods from a seller to a buyer. Although the commercial letter of credit is contingent upon the satisfaction of specified conditions, it
represents a credit exposure if the buyer defaults on the underlying transaction. As a result, the total contractual amounts do not necessarily represent future cash requirements. Commercial letters of credit totaled $265$191 million at Sept. 30, 2017March 31, 2018 and $339$122 million at Dec. 31, 2016.2017.
We expect many of the lending commitments and letters of credit to expire without the need to advance any cash. The revenue associated with guarantees frequently depends on the credit rating of the obligor and the structure of the transaction, including collateral, if any.
|
|
Notes to Consolidated Financial Statements(continued)
|
|
A securities lending transaction is a fully collateralized transaction in which the owner of a security agrees to lend the security (typically through an agent, in our case, The Bank of New York Mellon), to a borrower, usually a broker-dealer or bank, on an open, overnight or term basis, under the terms of a prearranged contract, which normally matures in less than 90 days.contract.
We typically lend securities with indemnification against borrower default. We generally require the borrower to provide collateral with a minimum value of 102% of the fair value of the securities borrowed, which is monitored on a daily basis, thus reducing credit risk. Market risk can also arise in securities lending transactions. These risks are controlled through policies limiting the level of risk that can be undertaken. Securities lending transactions are generally entered into only with highly rated counterparties. Securities lending indemnifications were secured by collateral of $424483 billion at Sept. 30, 2017March 31, 2018 and $331451 billion at Dec. 31, 2016.2017.
CIBC Mellon, a joint venture between BNY Mellon and the Canadian Imperial Bank of Commerce (“CIBC”), engages in securities lending activities. CIBC Mellon, BNY Mellon and CIBC jointly and severally indemnify securities lenders against specific types of borrower default. At Sept. 30, 2017March 31, 2018 and Dec. 31, 2016, $652017, $70 billion and $61$69 billion, respectively, of borrowings at CIBC Mellon, for which BNY Mellon acts as agent on behalf of CIBC Mellon clients, were secured by collateral of $69$74 billion and $64$73 billion, respectively. If, upon a default, a borrower’s collateral was not sufficient to cover its related obligations, certain losses related to the indemnification could be covered by the indemnitors.
|
|
Notes to Consolidated Financial Statements(continued) |
|
Industry concentrations
We have significant industry concentrations related to credit exposure at Sept. 30, 2017.March 31, 2018. The tables below present our credit exposure in the financial institutions and commercial portfolios.
| | Financial institutions portfolio exposure (in billions) | Sept. 30, 2017 | March 31, 2018 |
| Loans |
| Unfunded commitments |
| Total exposure |
| Loans |
| Unfunded commitments |
| Total exposure |
|
| Securities industry | $ | 2.9 |
| $ | 19.0 |
| $ | 21.9 |
| $ | 3.6 |
| $ | 19.2 |
| $ | 22.8 |
|
| Banks | | 6.9 |
| 1.3 |
| 8.2 |
|
| Asset managers | 1.6 |
| 6.5 |
| 8.1 |
| 1.3 |
| 6.5 |
| 7.8 |
|
| Banks | 6.3 |
| 1.4 |
| 7.7 |
| |
| Insurance | 0.1 |
| 3.4 |
| 3.5 |
| 0.1 |
| 3.5 |
| 3.6 |
|
| Government | — |
| 1.0 |
| 1.0 |
| 0.1 |
| 0.9 |
| 1.0 |
|
| Other | 1.0 |
| 1.4 |
| 2.4 |
| 0.8 |
| 1.3 |
| 2.1 |
|
| Total | $ | 11.9 |
| $ | 32.7 |
| $ | 44.6 |
| $ | 12.8 |
| $ | 32.7 |
| $ | 45.5 |
|
| | Commercial portfolio exposure (in billions) | Sept. 30, 2017 | March 31, 2018 |
| Loans |
| Unfunded commitments |
| Total exposure |
| Loans |
| Unfunded commitments |
| Total exposure |
|
| Manufacturing | $ | 1.4 |
| $ | 6.3 |
| $ | 7.7 |
| $ | 1.3 |
| $ | 6.1 |
| $ | 7.4 |
|
| Services and other | 0.9 |
| 4.4 |
| 5.3 |
| 0.7 |
| 5.8 |
| 6.5 |
|
| Energy and utilities | 0.6 |
| 4.5 |
| 5.1 |
| 0.6 |
| 4.4 |
| 5.0 |
|
| Media and telecom | 0.1 |
| 1.4 |
| 1.5 |
| — |
| 1.4 |
| 1.4 |
|
| Total | $ | 3.0 |
| $ | 16.6 |
| $ | 19.6 |
| $ | 2.6 |
| $ | 17.7 |
| $ | 20.3 |
|
Major concentrations in securities lending are primarily to broker-dealers and are generally collateralized with cash and/or securities.
Exposure for certain administrative errors
In connection with certain offshore tax-exempt funds that we manage, we may be liable to the funds for certain administrative errors. The errors relate to the resident status of such funds, potentially exposing the Company to a tax liability related to the funds’ earnings. The Company is in discussions with tax authorities regarding the funds. We believe we are appropriately accrued and the additional reasonably possible exposure is not significant.
Indemnification arrangements
We have provided standard representations for underwriting agreements, acquisition and divestiture agreements, sales of loans and commitments, and other similar types of arrangements and customary indemnification for claims and legal proceedings related to providing financial services that are not otherwise included above. Insurance has been purchased to mitigate certain of these risks. Generally, there are no stated or notional amounts
included in these indemnifications and the contingencies triggering the obligation for indemnification are not expected to occur. Furthermore, often counterparties to these transactions provide us with comparable indemnifications. We are unable to develop an estimate of the maximum payout under these
|
|
Notes to Consolidated Financial Statements(continued)
|
|
indemnifications for several reasons. In addition to the lack of a stated or notional amount in a majority of such indemnifications, we are unable to predict the nature of events that would trigger indemnification or the level of indemnification for a certain event. We believe, however, that the possibility that we will have to make any material payments for these indemnifications is remote. At Sept. 30, 2017March 31, 2018 and Dec. 31, 2016,2017, we have not recorded any material liabilities under these arrangements.
Clearing and settlement exchanges
We are a noncontrolling equity investor in, and/or member of, several industry clearing or settlement exchanges through which foreign exchange, securities, derivatives or other transactions settle. Certain of these industry clearing and settlement exchanges require their members to guarantee their obligations and liabilities and/or to provide liquidity support in the event other members do not honor their obligations. We believe the likelihood that a clearing or settlement exchange (of which we are a member) would become insolvent is remote. Additionally, certain settlement exchanges have implemented loss allocation policies that enable the exchange to allocate settlement losses to the members of the exchange. It is not possible to quantify such mark-to-market loss until the loss occurs. Any ancillary costs that occur as a result of any mark-to-market loss cannot be quantified. In addition, we also sponsor clients as members on clearing and settlement exchanges and guarantee their obligations. At Sept. 30, 2017March 31, 2018 and Dec. 31, 2016,2017, we have not recorded any material liabilities under these arrangements.
Legal proceedings
In the ordinary course of business, BNY Mellon and its subsidiaries are routinely named as defendants in or made parties to pending and potential legal actions. We also are subject to governmental and regulatory examinations, information-gathering requests, investigations and proceedings (both formal and informal). Claims for significant monetary damages
|
|
Notes to Consolidated Financial Statements(continued) |
|
are often asserted in many of these legal actions, while claims for disgorgement, restitution, penalties and/or other remedial actions or sanctions may be sought in governmental and regulatory matters. It is inherently difficult to predict the eventual outcomes of such matters given their complexity and the particular facts and circumstances at issue in each of these matters. However, on the basis of our current
knowledge and understanding, we do not believe that judgments, settlements or orders, if any, arising from these matters (either individually or in the aggregate, after giving effect to applicable reserves and insurance coverage) will have a material adverse effect on the consolidated financial position or liquidity of BNY Mellon, although they could have a material effect on net income in a given period.
In view of the inherent unpredictability of outcomes in litigation and governmental and regulatory matters, particularly where (i) the damages sought are substantial or indeterminate, (ii) the proceedings are in the early stages, or (iii) the matters involve novel legal theories or a large number of parties, as a matter of course there is considerable uncertainty surrounding the timing or ultimate resolution of litigation and governmental and regulatory matters, including a possible eventual loss, fine, penalty or business impact, if any, associated with each such matter. In accordance with applicable accounting guidance, BNY Mellon establishes accruals for litigation and governmental and regulatory matters when those matters proceed to a stage where they present loss contingencies that are both probable and reasonably estimable. In such cases, there may be a possible exposure to loss in excess of any amounts accrued. BNY Mellon will continue to monitor such matters for developments that could affect the amount of the accrual, and will adjust the accrual amount as appropriate. If the loss contingency in question is not both probable and reasonably estimable, BNY Mellon does not establish an accrual and the matter will continue to be monitored for any developments that would make the loss contingency both probable and reasonably estimable. BNY Mellon believes that its accruals for legal proceedings are appropriate and, in the aggregate, are not material to the consolidated financial position of BNY Mellon, although future accruals could have a material effect on net income in a given period.
For certain of those matters described here for which a loss contingency may, in the future, be reasonably possible (whether in excess of a related accrued
liability or where there is no accrued liability), BNY Mellon is currently unable to estimate a range of reasonably possible loss. For those matters described here where BNY Mellon is able to estimate a reasonably possible loss, the aggregate range of such reasonably possible loss is up to $940$860 million in excess of the accrued liability (if any) related to those matters.
|
|
Notes to Consolidated Financial Statements(continued)
|
|
The following describes certain judicial, regulatory and arbitration proceedings involving BNY Mellon:
Mortgage-Securitization Trusts Proceedings
The Bank of New York Mellon has been named as a defendant in a number of legal actions brought by MBS investors alleging that the trustee has expansive duties under the governing agreements, including the duty to investigate and pursue breach of representation and warranty claims against other parties to the MBS transactions. These actions include a lawsuit brought in New York State court on June 18, 2014, and later re-filed in federal court, by a group of institutional investors who purport to sue on behalf of 253249 MBS trusts.
Matters Related to R. Allen Stanford
In late December 2005, Pershing LLC (“Pershing”) became a clearing firm for Stanford Group Co. (“SGC”), a registered broker-dealer that was part of a group of entities ultimately controlled by R. Allen Stanford (“Stanford”). Stanford International Bank (“SIB”), also controlled by Stanford, issued certificates of deposit (“CDs”). Some investors allegedly wired funds from their SGC accounts to purchase CDs. In 2009, the SEC charged Stanford with operating a Ponzi scheme in connection with the sale of CDs, and SGC was placed into receivership. Alleged purchasers of CDs have filed 15 lawsuits against Pershing that are pending in Texas, including two putative class actions. The purchasers allege that Pershing, as SGC’s clearing firm, assisted Stanford in a fraudulent scheme and assert contractual, statutory and common law claims. The remainingIn addition, a series of FINRA action hasarbitration proceedings have been resolved and dismissed.initiated by alleged purchasers asserting similar claims.
Brazilian Postalis Litigation
BNY Mellon Servicos Financeiros DTVM S.A. (“DTVM”), a subsidiary that provides a number of asset services in Brazil, acts as administrator for certain investment funds in which the exclusive investor is a public pension fund for postal workers called Postalis-Instituto de Seguridade Social dos
|
|
Notes to Consolidated Financial Statements(continued) |
|
Correios e Telégrafos (“Postalis”). On Aug. 22, 2014, Postalis sued DTVM in Rio de Janeiro, Brazil for losses related to a Postalis investment fund for which DTVM serves as fund administrator. Postalis alleges that DTVM failed to properly perform alleged duties, including duties to conduct due diligence of and exert control over the fund manager, Atlântica Administração de Recursos (“Atlântica”), and Atlântica’s investments. On March 12, 2015, Postalis filed a lawsuit in Rio de Janeiro against DTVM and
BNY Mellon Administração de Ativos Ltda. (“Ativos”) alleging failure to properly perform alleged duties relating to another fund of which DTVM is administrator and Ativos is investment manager. On Dec. 14, 2015, AssociaceãAssociacão Dosdos Profissionais Dosdos Correiros (“ADCAP”), a Brazilian postal workers association, filed a lawsuit in São Paulo against DTVM and other defendants alleging that DTVM improperly contributed to investment losses in the Postalis portfolio. On March 20, 2017, the lawsuit was dismissed without prejudice, and ADCAP has appealed that decision. On Dec. 17, 2015, Postalis filed three additional lawsuits in Rio de Janeiro against DTVM and Ativos alleging failure to properly perform alleged duties and liabilities for losses with respect to investments in several other funds. On Feb. 4, 2016, Postalis filed another lawsuit in Brasilia against DTVM, Ativos and BNY Mellon Alocação de Patrimônio Ltda., an investment management subsidiary, alleging failure to properly perform duties and liability for losses with respect to investments in various other funds of which the defendants were administrator and/or manager. The lawsuit has beenwas transferred to São Paulo.Paulo and then returned to Brasilia. On Jan. 16, 2018, the Brazilian Federal Prosecutor’s Office filed a civil lawsuit in São Paulo against DTVM alleging liability for Postalis losses based on alleged failures by DTVM to properly perform certain duties while acting as administrator to certain funds in which Postalis invested or controller of Postalis’s own investment portfolio. On April 18, 2018, the court dismissed the lawsuit without prejudice.
Depositary Receipt Litigation
Between late December 2015 and February 2016, four putative class action lawsuits were filed against BNY Mellon asserting claims relating to BNY Mellon’s foreign exchange pricing when converting dividends and other distributions from non-U.S. companies in its role as depositary bank to Depositary Receipt issuers. The claims are for breach of contract and violations of ERISA. The lawsuits have been
consolidated into two suits that are pending in federal court in the Southern District of New York.
Brazilian Silverado Litigation
DTVM acts as administrator for the Fundo de Investimento em Direitos Creditórios Multisetorial Silverado Maximum (“Silverado Maximum Fund”), which invests in commercial credit receivables. On June 2, 2016, the Silverado Maximum Fund sued DTVM in its capacity as administrator, along with Deutsche Bank S.A. - Banco Alemão in its capacity as custodian and Silverado Gestão e Investimentos Ltda. in its capacity as investment manager. The Fund alleges that each of the defendants failed to fulfill its respective duty, and caused losses to the Fund for which the defendants are jointly and severally liable.
|
|
Notes to Consolidated Financial Statements(continued)
|
|
Depositary Receipt Pre-Release Inquiry
In March 2014, the Staff of the U.S. Securities and Exchange Commission’s Enforcement Division (the “Staff”) commenced an investigation into certain issuers of American Depositary Receipts (“ADRs”), including BNY Mellon, for the period of 2011 to 2015. The Staff has issued several requests to BNY Mellon for information relating to the pre-release of ADRs. In May 2017, BNY Mellon began discussions with the Staff about a possible resolution of the investigation. BNY Mellon has fully cooperated with this matter.
Note 18 - 19–Lines of business
We have an internal information system that produces performance data along product and service lines for our two principal businesses and the Other segment.
Business accounting principles
Our business data has been determined on an internal management basis of accounting, rather than the generally accepted accounting principles used for consolidated financial reporting. These measurement principles are designed so that reported results of the businesses will track their economic performance.
Business results are subject to reclassification when organizational changes are made or when improvements are mademade. There were no significant organizational changes in the measurement principles.first quarter of 2018. The results are also subject to refinements in revenue and expense allocation methodologies, which are typically reflected on a prospective basis.
|
|
Notes to Consolidated Financial Statements(continued) |
|
The accounting policies of the businesses are the same as those described in Note 1 of the Notes to
Consolidated Financial Statements in our 20162017 Annual Report.
The primary products and services and types of revenue for our two principal businesses and a description of the Other segment are presented below.
|
| | | | |
BusinessInvestment Services business |
| | | | |
| Line of business | | Primary products and services | | Primary types of revenue |
| Asset Servicing | | Custody, accounting, ETF services, middle-office solutions, transfer agency, services for private equity and real estate funds, foreign exchange, securities lending, liquidity/lending services, prime brokerage and data analytics | | - Asset servicing fees (includes securities lending revenue) - Foreign exchange revenue - Net interest revenue - Financing-related fees |
| | | | |
| Pershing | | Clearing and custody, investment, wealth and retirement solutions, technology and enterprise data management, trading services and prime brokerage
| | - Clearing services fees
- Net interest revenue
|
| | | | |
| Issuer Services | | Corporate Trust (trustee, administration and agency services and reporting and transparency) and Depositary Receipts (issuer services and support for brokers and investors) | | - Issuer services fees - Net interest revenue - Foreign exchange revenue |
| | | | |
| Treasury Services | | Integrated cash management solutions including payments, foreign exchange, liquidity management, receivables processing and payables management and trade finance and processing
| | - Treasury services fees
- Net interest revenue |
| | | | |
| Clearance and Collateral Management | | U.S. government clearing, global collateral management and tri-party repo | | - Asset servicing fees - Net interest revenue
|
| | | | |
| Investment Management business |
| •
| | | |
| Line of business | | Primary products and services | | Primary types of revenue |
| Asset Management | | Diversified investment management strategies and distribution of investment products | | - Investment management and performance fees from:Mutual funds
Institutional clients
Private clients
High-net-worth individuals and families, endowments and foundations and related entities
•
- Performance fees
- Distribution and servicing fees
• Other revenue from seed capital investments
|
| | | | |
| Wealth Management | | Investment Servicesmanagement, custody, wealth and estate planning and private banking services | • Asset servicing
| - Investment management fees including custody fees, fund services, broker-dealer services, securities finance and collateral and liquidity services• Issuer services fees, including Depositary Receipts and Corporate Trust
• Clearing services fees
• Treasury services fees, including global payments, trade finance and cash management
• Foreign exchange revenue
• Financing-related fees and net
- Net interest revenue from credit-related activities
|
| | | | |
| Other segment | • Net interest
| Description | | Primary types of revenue and lease-related gains (losses) from |
| | Includes leasing operations• Gain (loss) on securities and net interest revenue fromportfolio, corporate treasury activity
• Other trading revenue fromactivities, including our investment securities portfolio, derivatives and other trading activity, corporate and bank-owned life insurance, renewable energy investments and business exits.
| | - Net interest revenue • Results of business exits- Investment and other income
- Net gain (loss) on securities - Other trading revenue |
|
|
Notes to Consolidated Financial Statements(continued) |
|
The results of our businesses are presented and analyzed on an internal management reporting basis.
Revenue amounts reflect fee and other revenue generated by each business. Fee and other revenue transferred between businesses under revenue transfer agreements is included within other revenue in each business.
Revenues and expenses associated with specific client bases are included in those businesses. For example, foreign exchange activity associated
with clients using custody products is included in Investment Services.
Net interest revenue is allocated to businesses based on the yields on the assets and liabilities generated by each business. We employ a funds transfer pricing system that matches funds with the specific assets and liabilities of each business based on their interest sensitivity and maturity characteristics.
The provision for credit losses associated with the respective credit portfolios is reflected in each business segment.
|
|
Notes to Consolidated Financial Statements(continued)
|
|
Incentives expense related to restricted stock is allocated to the businesses.
Support and other indirect expenses are allocated to businesses based on internally developed methodologies.
Recurring FDIC expense is allocated to the businesses based on average deposits generated within each business.
Litigation expense is generally recorded in the business in which the charge occurs.
Management of the investment securities portfolio is a shared service contained in the Other segment. As a result, gains and losses associated with the valuation of the securities portfolio are included in the Other segment.
Client deposits serve as the primary funding source for our investment securities portfolio.
We typically allocate all interest revenue to the businesses generating the deposits. Accordingly, accretion related to the portion of the investment securities portfolio restructured in 2009 has been included in the results of the businesses.
M&I expense is a corporate level item and is recorded in the Other segment.
Restructuring charges relate to corporate-level initiatives and were therefore recorded in the Other segment.
Balance sheet assets and liabilities and their related income or expense are specifically assigned to each business. Businesses with a net liability position have been allocated assets.
Goodwill and intangible assets are reflected within individual businesses.
The following consolidating schedules presentspresent the contribution of our businesses to our overall profitability.
| | | For the quarter ended Sept. 30, 2017 | Investment
Management |
| | Investment
Services |
| | Other |
| | Consolidated |
| | |
| (dollar amounts in millions) | |
| Fee and other revenue | $ | 918 |
| (a) | $ | 2,187 |
| | $ | 69 |
| | $ | 3,174 |
| (a) | |
| For the quarter ended March 31, 2018 | | Investment
Services |
| | Investment
Management |
| | Other |
| | Consolidated |
| |
| (dollars in millions) | |
| Total fee and other revenue | | $ | 2,250 |
| | $ | 1,012 |
| (a) | $ | 8 |
| | $ | 3,270 |
| (a) |
| Net interest revenue (expense) | 82 |
| | 777 |
| | (20 | ) | | 839 |
| | 844 |
| | 76 |
| | (1 | ) | | 919 |
| |
| Total revenue | 1,000 |
| (a) | 2,964 |
| | 49 |
| | 4,013 |
| (a) | 3,094 |
| | 1,088 |
| (a) | 7 |
| | 4,189 |
| (a) |
| Provision for credit losses | (2 | ) | | (2 | ) | | (2 | ) | | (6 | ) | | (7 | ) | | 2 |
| | — |
| | (5 | ) | |
| Noninterest expense | 702 |
| | 1,874 |
| | 77 |
| | 2,653 |
| (b) | 1,949 |
| | 705 |
| | 87 |
| | 2,741 |
| (b) |
| Income (loss) before taxes | $ | 300 |
| (a) | $ | 1,092 |
| | $ | (26 | ) | | $ | 1,366 |
| (a)(b) | $ | 1,152 |
| | $ | 381 |
| (a) | $ | (80 | ) | | $ | 1,453 |
| (a)(b) |
Pre-tax operating margin (c) | 30 | % | | 37 | % | | N/M |
| | 34 | % | | 37 | % | | 35 | % | | N/M |
| | 35 | % | |
| Average assets | $ | 31,689 |
| | $ | 252,461 |
| | $ | 61,559 |
| | $ | 345,709 |
| | $ | 278,095 |
| | $ | 31,963 |
| | $ | 48,117 |
| | $ | 358,175 |
| |
| |
| (a) | Both total fee and other revenue and total revenue include the net income from consolidated investment management funds of $7less than $1 million, representing $10$11 million of incomelosses and a loss attributable to noncontrolling interests of $3 million. $11 million. Income before taxes is net of a loss attributable to noncontrolling interests of $3 million. $11 million. |
| |
| (b) | Noninterest expense includes a lossincome attributable to noncontrolling interestinterests of $1$2 million related to other consolidated subsidiaries. |
| |
| (c) | Income before taxes divided by total revenue. |
N/M - Not meaningful.
|
| | | | | | | | | | | | | | | | |
| For the quarter ended June 30, 2017 | Investment Management |
| | Investment Services |
| | Other |
| | Consolidated |
| |
| (dollar amounts in millions) |
| Fee and other revenue | $ | 899 |
| (a) | $ | 2,115 |
| | $ | 113 |
| | $ | 3,127 |
| (a) |
| Net interest revenue (expense) | 87 |
| | 761 |
| | (22 | ) | | 826 |
| |
| Total revenue | 986 |
| (a) | 2,876 |
| | 91 |
| | 3,953 |
| (a) |
| Provision for credit losses | — |
| | (3 | ) | | (4 | ) | | (7 | ) | |
| Noninterest expense | 698 |
| | 1,927 |
| | 28 |
| | 2,653 |
| (b) |
| Income before taxes | $ | 288 |
| (a) | $ | 952 |
| | $ | 67 |
| | $ | 1,307 |
| (a)(b) |
Pre-tax operating margin (c) | 29 | % | | 33 | % | | N/M |
| | 33 | % | |
| Average assets | $ | 31,355 |
| | $ | 254,724 |
| | $ | 56,436 |
| | $ | 342,515 |
| |
| |
(a) | Both fee and other revenue and total revenue include the net income from consolidated investment management funds of $7 million, representing $10 million of income and noncontrolling interests of $3 million. Income before taxes is net of noncontrolling interests of $3 million. |
| |
(b) | Noninterest expense includes a loss attributable to noncontrolling interest of $2 millionrelated to other consolidated subsidiaries.
|
| |
(c) | Income before taxes divided by total revenue. |
N/M - Not meaningful.
|
|
Notes to Consolidated Financial Statements (continued) |
| |
| | | For the quarter ended Sept. 30, 2016 | Investment
Management |
| | Investment
Services |
| | Other |
| | Consolidated |
| | |
| (dollar amounts in millions) | |
| Fee and other revenue | $ | 876 |
| (a) | $ | 2,183 |
| | $ | 100 |
| | $ | 3,159 |
| (a) | |
| For the quarter ended Dec. 31, 2017 | | Investment
Services |
| | Investment
Management |
| | Other |
| | Consolidated |
| |
| (dollars in millions) | |
| Total fee and other revenue | | $ | 2,141 |
| | $ | 974 |
| (a) | $ | (247 | ) | | $ | 2,868 |
| (a) |
| Net interest revenue (expense) | 82 |
| | 715 |
| | (23 | ) | | 774 |
| | 813 |
| | 74 |
| | (36 | ) | | 851 |
| |
| Total revenue | 958 |
| (a) | 2,898 |
| | 77 |
| | 3,933 |
| (a) | |
| Total revenue (loss) | | 2,954 |
| | 1,048 |
| (a) | (283 | ) | | 3,719 |
| (a) |
| Provision for credit losses | — |
| | 1 |
| | (20 | ) | | (19 | ) | | (2 | ) | | 1 |
| | (5 | ) | | (6 | ) | |
| Noninterest expense | 702 |
| | 1,851 |
| | 88 |
| | 2,641 |
| (b) | 2,097 |
| | 771 |
| | 135 |
| | 3,003 |
| (b) |
| Income before taxes | $ | 256 |
| (a) | $ | 1,046 |
| | $ | 9 |
| | $ | 1,311 |
| (a)(b) | |
| Income (loss) before taxes | | $ | 859 |
| | $ | 276 |
| (a) | $ | (413 | ) | | $ | 722 |
| (a)(b) |
Pre-tax operating margin (c) | 27 | % | | 36 | % | | N/M |
| | 33 | % | | 29 | % | | 26 | % | | N/M |
| | 20 | % | |
| Average assets | $ | 30,392 |
| | $ | 275,714 |
| | $ | 45,124 |
| | $ | 351,230 |
| | $ | 260,494 |
| | $ | 31,681 |
| | $ | 58,611 |
| | $ | 350,786 |
| |
| |
| (a) | Both total fee and other revenue and total revenue (loss) include net income from consolidated investment management funds of $8 million, representing $17 million of income and noncontrolling interests of $9 million. Income before taxes is net of noncontrolling interests of $9 million. |
| |
| (b) | Noninterest expense includes a loss attributable to noncontrolling interest of $2 millionrelated to other consolidated subsidiaries. |
| |
(c) | Income before taxes divided by total revenue. |
N/M - Not meaningful.
|
| | | | | | | | | | | | | | | | |
| For the nine months ended Sept. 30, 2017 | Investment
Management |
| | Investment
Services |
| | Other |
| | Consolidated |
| |
| (dollar amounts in millions) |
| Fee and other revenue | $ | 2,694 |
| (a) | $ | 6,386 |
| | $ | 254 |
| | $ | 9,334 |
| (a) |
| Net interest revenue (expense) | 255 |
| | 2,245 |
| | (43 | ) | | 2,457 |
| |
| Total revenue | 2,949 |
| (a) | 8,631 |
| | 211 |
| | 11,791 |
| (a) |
| Provision for credit losses | 1 |
| | (5 | ) | | (14 | ) | | (18 | ) | |
| Noninterest expense | 2,083 |
| | 5,650 |
| | 212 |
| | 7,945 |
| (b) |
| Income before taxes | $ | 865 |
| (a) | $ | 2,986 |
| | $ | 13 |
| | $ | 3,864 |
| (a)(b) |
Pre-tax operating margin (c) | 29 | % | | 35 | % | | N/M |
| | 33 | % | |
| Average assets | $ | 31,372 |
| | $ | 252,675 |
| | $ | 57,463 |
| | $ | 341,510 |
| |
| |
(a) | Both total fee and other revenue and total revenue include net income from consolidated investment management funds of $29 million, representing $53 million of income and noncontrolling interests of $24 million. Income before taxes is net of noncontrolling interests of $24 million. |
| |
(b) | Noninterest expense includes a loss attributable to noncontrolling interest of $6$3 million related to other consolidated subsidiaries. |
| |
| (c) | Income before taxes divided by total revenue. |
N/M - Not meaningful.
| | | For the nine months ended Sept. 30, 2016 | Investment
Management |
| | Investment
Services |
| | Other |
| | Consolidated |
| | |
| (dollar amounts in millions) | |
| Fee and other revenue | $ | 2,544 |
| (a) | $ | 6,267 |
| | $ | 324 |
| | $ | 9,135 |
| (a) | |
| For the quarter ended March 31, 2017 | | Investment
Services |
| | Investment
Management |
| | Other |
| | Consolidated |
| |
| (dollars in millions) | |
| Total fee and other revenue | | $ | 2,084 |
| | $ | 877 |
| (a) | $ | 72 |
| | $ | 3,033 |
| (a) |
| Net interest revenue (expense) | 247 |
| | 2,084 |
| | (24 | ) | | 2,307 |
| | 707 |
| | 86 |
| | (1 | ) | | 792 |
| |
| Total revenue | 2,791 |
| (a) | 8,351 |
| | 300 |
| | 11,442 |
| (a) | 2,791 |
| | 963 |
| (a) | 71 |
| | 3,825 |
| (a) |
| Provision for credit losses | — |
| | 8 |
| | (26 | ) | | (18 | ) | | — |
| | 3 |
| | (8 | ) | | (5 | ) | |
| Noninterest expense | 2,084 |
| | 5,518 |
| | 284 |
| | 7,886 |
| (b) | 1,849 |
| | 683 |
| | 107 |
| | 2,639 |
| (b) |
| Income before taxes | $ | 707 |
| (a) | $ | 2,825 |
| | $ | 42 |
| | $ | 3,574 |
| (a)(b) | |
| Income (loss) before taxes | | $ | 942 |
| | $ | 277 |
| (a) | $ | (28 | ) | | $ | 1,191 |
| (a)(b) |
Pre-tax operating margin (c) | 25 | % | | 34 | % | | N/M |
| | 31 | % | | 34 | % | | 29 | % | | N/M |
| | 31 | % | |
| Average assets | $ | 30,048 |
| | $ | 275,410 |
| | $ | 57,832 |
| | $ | 363,290 |
| | $ | 251,027 |
| | $ | 31,067 |
| | $ | 54,106 |
| | $ | 336,200 |
| |
| |
| (a) | Both total fee and other revenue and total revenue include net income from consolidated investment management funds of $15 million, representing $21$33 million of income and noncontrolling interests of $6$18 million. Income before taxes is net of a loss attributable to noncontrolling interests of $6$18 million. |
| |
| (b) | Noninterest expense includes a loss attributable to noncontrolling interestinterests of $6$3 million related to other consolidated subsidiaries. |
| |
| (c) | Income before taxes divided by total revenue. |
N/M - Not meaningful.
|
|
Notes to Consolidated Financial Statements(continued)
|
|
Note 19 - 20–Supplemental information to the Consolidated Statement of Cash Flows
NoncashNon-cash investing and financing transactions that, appropriately, are not reflected in the Consolidated Statementconsolidated statement of Cash Flowscash flows are listed below.
| | | Noncash investing and financing transactions | Nine months ended Sept. 30, | |
| Non-cash investing and financing transactions | | Three months ended March 31, |
| (in millions) | 2017 |
| | 2016 |
| 2018 |
| | 2017 |
|
| Transfers from loans to other assets for other real estate owned (“OREO”) | $ | 3 |
| | $ | 4 |
| |
| Transfers from loans to other assets for other real estate owned | | $ | 1 |
| | $ | 1 |
|
| Change in assets of consolidated VIEs | 429 |
| | 392 |
| 125 |
| | 204 |
|
| Change in liabilities of consolidated VIEs | 288 |
| | 14 |
| 9 |
| | 106 |
|
| Change in nonredeemable noncontrolling interests of consolidated investment management funds | 234 |
| | 238 |
| 104 |
| | 84 |
|
| Securities purchased not settled | 1,277 |
| | 229 |
| 414 |
| | 580 |
|
| Securities sales not settled | — |
| | 218 |
| |
| Securities matured not settled | 350 |
| | — |
| |
| Securities sold not settled | | 30 |
| | 81 |
|
| Available-for-sale securities transferred to trading assets | | 963 |
| | — |
|
| Held-to-maturity securities transferred to available-for-sale | 74 |
| | 10 |
| 1,087 |
| | — |
|
| Premises and equipment/capitalized software funded by capital lease obligations | 347 |
| | 12 |
| 15 |
| | 1 |
|
|
|
| Item 4. Controls and Procedures |
| |
Disclosure controls and procedures
Our management, including the Chief Executive Officer and Chief Financial Officer, with participation by the members of the Disclosure Committee, has responsibility for ensuring that there is an adequate and effective process for establishing, maintaining, and evaluating disclosure controls and procedures that are designed to ensure that information required to be disclosed by us in our SEC reports is timely recorded, processed, summarized and reported and that information required to be disclosed by BNY Mellon is accumulated and communicated to BNY Mellon’s management to allow timely decisions regarding the required disclosure. In addition, our ethics hotline can also be used by employees and others for the anonymous communication of concerns about financial controls or reporting matters. There are inherent limitations to the effectiveness of any system of disclosure controls and procedures, including the possibility of human error and the circumvention or overriding of the controls and procedures. Accordingly, even effective disclosure controls and procedures can only provide reasonable assurance of achieving their control objectives.
As of the end of the period covered by this report, an evaluation was carried out under the supervision and with the participation of our management, including the Chief Executive Officer and Chief Financial Officer, of the effectiveness of our disclosure controls and procedures as defined in Rule 13a-15(e) under the Securities Exchange Act of 1934, as amended (the “Exchange Act”). Based on that evaluation, the Chief Executive Officer and Chief Financial Officer concluded that our disclosure controls and procedures were effective.
Changes in internal control over financial reporting
In the ordinary course of business, we may routinely modify, upgrade or enhance our internal controls and procedures for financial reporting. There have not been any changes in our internal control over financial reporting as defined in Rule 13a-15(f) of the Exchange Act during the thirdfirst quarter of 20172018 that have materially affected, or are reasonably likely to materially affect, our internal control over financial reporting.
|
|
| Forward-looking Statements |
| |
Some statements in this document are forward-looking. These include all statements about the usefulness of Non-GAAP measures, the future results of BNY Mellon, our businesses, financial, liquidity and capital condition, results of operations, liquidity, risk and capital management and processes, goals, strategies, outlook, objectives, expectations (including those regarding our performance results, increased expenses, seasonality in our businesses, impacts of currency fluctuations, impacts of trends on our businesses, regulatory, technology, market, economic or accounting developments, legal proceedings and other contingencies,contingencies), effective tax rate, estimates (including those regarding capital ratios)ratios and the tax benefit related to U.S. tax legislation), intentions (including those regarding our resolutionreal estate strategy), targets, opportunities and initiatives.
In this report, any other report, any press release or any written or oral statement that BNY Mellon or its executives may make, words, such as “estimate,” “forecast,” “project,” “anticipate,” “likely,” “target,” “expect,” “intend,” “continue,” “seek,” “believe,” “plan,” “goal,” “could,” “should,” “would,” “may,” “might,” “will,” “strategy,” “synergies,” “opportunities,” “trends”“trends,” “future” and words of similar meaning, may signify forward-looking statements.
Actual results may differ materially from those expressed or implied as a result of a number of factors, including those discussed in the “Risk Factors” section of our 20162017 Annual Report and this Form 10-Q, such as: an information security eventa communications or technology disruption or failure that results in a loss of information or impacts our ability to provide services to our clients may materially adversely affect our business, financial condition and anyresults of operations; a cybersecurity incident, or a failure to protect our computer systems, networks and information and our clients’ information against cybersecurity threats, could result in a loss of information, adversely impact our ability to conduct our businesses, and damage our reputation and cause losses; our business may be materially adversely affected by operational risk; failure to satisfy regulatory standards, including “well capitalized” and “well managed” status or capital adequacy and liquidity rules more generally, could result in limitations on our activities and adversely affect our business and financial condition; we are subject to extensive government rulemaking, regulation and
supervision; these rules and regulations have, and in the future may, compel us to change how we manage our businesses, which could have a material adverse effect on our business, financial condition and results of operations; rules and regulations have increased our compliance and operational risk and costs; our risk management framework may not be effective in mitigating risk and reducing the potential for losses; afailure or circumvention of our technology or that ofcontrols and procedures could have a third party or vendor, or if we neglect to update our technology, develop and market new technology to meet clients’ needs or protect our intellectual property and any material adverse effect on our business; a determination that our resolution plan is not credible and any material negative impact on our business, reputation, results of operations and financial condition; if our resolution plan is determined not to be credible or not to facilitate an orderly resolution under the U.S. Bankruptcy Code, our business, reputation, results of operations and financial condition andcould be materially negatively impacted; the application of our Title I preferred resolution strategy or resolution under the Title II orderly liquidation authority and any adverse effects oncould adversely affect our liquidity and financial condition and our security holders; extensive government rulemaking regulation, and supervision, which have, and in the future may, compel us to change how we manage our businesses, could have a material adverse effect on our business, financial condition and results of operations and have increased our compliance and operational risks and costs; failure to satisfy regulatory standards, including “well capitalized” and
“well managed” status or capital adequacy and liquidity rules, and any resulting limitations on our activities, or adverse effects on our business and financial condition; regulatory or enforcement actions or litigation and any material adverse effect oncould materially adversely affect our results of operations or harm to our businesses or reputation; our businesses may be negatively affected by adverse events, publicity, government scrutiny or other reputational harm and any negative effect on our businesses; operational risk and any material adverse effect on our business; failure or circumvention of our controls and procedures and any material adverse effect on our business, reputation, results of operations and financial condition; failure of our risk management framework to be effective in mitigating risk and reducing the potential for losses; change or uncertainty in monetary, tax and other governmental policies and the impact on our businesses, profitability and ability to compete; political, economic, legal, operational and other risks inherent in operating globally and any adverse effect on our business;harm; acts of terrorism, natural disasters, pandemics, and global conflicts and anyother geopolitical events may have a negative impact on our business and operations; ongoing concerns about the financial stability of certain countries, the failure or instability of any of our significant global counterparties, new barriers to global trade or a breakup of the EU or Eurozone and any material adverse effect on our business and results of operations; the United Kingdom’s referendum decision to leave the EU and any negative effects on global economic conditions, global financial markets, and our business and results of operations; weakness and volatility in financial markets and the economy generally and any material adverse effect on our business, results of operations and financial condition; changes in interest rates and any material adverse effect on our profitability; write-downs of securities that we own and other losses related to volatile and illiquid market conditions and any reduction in our earnings or impact on our financial condition; our dependenceare dependent on fee-based business for a substantial majority of our revenue and the adverse effects of aour fee-based revenues could be adversely affected by slowing in market activity, weak financial markets, underperformance and/or negative trends in savings rates or in investment preferences; anyweakness and volatility in financial markets and the economy generally may materially adversely affect our business, results of operations and financial condition; the United Kingdom’s referendum decision to leave the EU has had and may continue to have negative effects on global economic conditions, global financial markets, and our business and results of operations; changes in interest rates and yield curves could have a material adverse effect on our foreign exchange revenues from decreasedprofitability; we may experience write-downs of securities that we own and other losses related to volatile and illiquid market conditions, reducing our earnings and impacting our financial condition; ongoing concerns about the financial stability of certain countries, new barriers to global trade or a breakup of the EU or Eurozone could have a material adverse effect on our business and results of operations; our FX revenue may be adversely affected by decreases in market volatility orand the cross-border investment activity of our clients; the failure or perceived weakness of any of our significant counterparties, and our assumption of credit and counterparty risk, which could expose us to loss and adversely affect our business; any material reduction in our credit ratings or the credit ratings of
|
|
Forward-looking Statements (continued) |
| |
investment activity of our clients; the failure or perceived weakness of any of our significant counterparties, many of whom are major financial institutions and sovereign entities, and our assumption of credit and counterparty risk, could expose us to loss and adversely affect our business; our business, financial condition and results of operations could be adversely affected if we do not effectively manage our liquidity; any material reduction in our credit ratings or the credit ratings of our principal bank subsidiaries, whichThe Bank of New York Mellon or BNY Mellon, N.A., could increase the cost of funding and borrowing to us and our rated subsidiaries and have a material adverse effect on our results of operations and financial condition and on the value of the securities we issue; any adverse effect on our business, financial condition and results of operations of not effectively managing our liquidity; the potential towe could incur losses if our allowance for credit losses, including loan and lending related commitments reserves, is inadequate; the risks relating to new lines of business, new products and services or transformational or strategic project initiatives may subject us to additional risks, and the failure to implement these initiatives which could affect our results of operations; thewe are subject to competition in all aspects of our business, which could negatively affect our ability to maintain or increase our profitability; our business may be adversely affected if we are unable to attract and retain employees; our strategic transactions present risks and uncertainties relating to our strategic transactions and anycould have an adverse effect on our business, results of operations and financial condition; competition in all aspects of our business and any negative effect on our ability to maintain or increase our profitability; failure to attract and retain employees and any adverse effect on our business; tax law changes, including the recent enactment of the Tax Act, or challenges to our tax positions and any adverse effect onwith respect to historical transactions may adversely affect our net income, effective tax rate and our overall results of operations and financial condition; changes in accounting standardsour ability to return capital to shareholders is subject to the discretion of our board of directors and any material impact on our reported financial condition, results of operations,
cash flows and other financial data; risks associated with being a non-operating holding company, including our dependence on dividends from our subsidiaries to meet obligations, to provide funds for payment of dividends and for stock repurchases; and the impact of provisions ofmay be limited by U.S. banking laws and regulations, including those governing capital and the approval of our capital plan, applicable provisions of Delaware law or our failure to pay full and timely dividends on our preferred stock,stock; changes in the method pursuant to which the LIBOR and other benchmark rates are determined could adversely impact our business and results of operations; the Parent is a non-operating holding company, and as a result, is dependent on dividends from its subsidiaries and extensions of credit from its IHC to meet its obligations, including with respect to its securities, and to provide funds for share repurchases and payment of dividends to its stockholders; changes in accounting standards governing the preparation of our ability to return capital to shareholders.financial statements and future events could have a material impact on our
reported financial condition, results of operations, cash flows and other financial data.
Investors should consider all risk factors discussed in our 20162017 Annual Report this Form 10-Q and any subsequent reports filed with the SEC by BNY Mellon pursuant to the Exchange Act. All forward-looking statements speak only as of the date on which such statements are made, and BNY Mellon undertakes no obligation to update any statement to reflect events or circumstances after the date on which such forward-looking statement is made or to reflect the occurrence of unanticipated events. The contents of BNY Mellon’s website or any other websites referenced herein are not part of this report.
|
|
| Part II - Other Information |
| |
Item 1. Legal ProceedingsProceedings.
The information required by this Item is set forth in the “Legal proceedings” section in Note 1718 of the Notes to Consolidated Financial Statements, which portion is incorporated herein by reference in response to this item.
Item 1A. Risk Factors
The following discussion supplements the discussion of risk factors that could affect our business, financial condition or results of operations set forth in Part I, Item 1A, Risk Factors, on pages 90 through 116 of our 2016 Annual Report. The discussion of Risk Factors, as so supplemented, sets forth our most significant risk factors that could affect our business, financial condition or results of operations. However, other factors, besides that discussed below or in our 2016 Annual Report or other of our reports filed with or furnished to the SEC, also could adversely affect our business or results. We cannot assure you that the risk factors described below or elsewhere in this report and such other reports address all potential risks that we may face. These risk factors also serve to describe factors which may cause our results to differ materially from those described in forward-looking statements included herein or in other documents or statements that make reference to this Form 10-Q. See Forward-looking Statements.
If our resolution plan is determined not to be credible or not to facilitate an orderly resolution under the U.S. Bankruptcy Code, our business, reputation, results of operations and financial condition could be materially negatively impacted. The application of our Title I preferred resolution strategy or resolution under the Title II orderly liquidation authority could adversely affect our liquidity and financial condition and our security holders.
Large BHCs must develop and submit to the Federal Reserve and the FDIC for review plans for their rapid and orderly resolution in the event of material financial distress or failure. BNY Mellon and The Bank of New York Mellon each file periodic complementary resolution plans. In April 2016, the Federal Reserve and the FDIC jointly determined that our 2015 resolution plan was not credible or would not facilitate an orderly resolution under the U.S. Bankruptcy Code. The agencies issued a joint notice of deficiencies and shortcomings and the actions that
must be taken to address them, which we responded to in an Oct. 1, 2016 submission. In December 2016, the agencies jointly determined that our Oct. 1, 2016 submission adequately remedied the identified deficiencies. If the agencies determine that our future submissions are not credible or would not facilitate an orderly resolution under the U.S. Bankruptcy Code, and we fail to address the deficiencies in a timely manner, the agencies may jointly impose more stringent capital, leverage or liquidity requirements or restrictions on our growth, activities or operations. If we continue to fail to adequately remedy any deficiencies identified in future submissions, we could be required to divest assets or operations that the agencies determine necessary to facilitate our orderly resolution.
Following the receipt of feedback from the Federal Reserve and the FDIC in April 2016 on our 2015 resolution plan, we determined that, in the event of our material financial distress or failure, our preferred resolution strategy under Title I of the Dodd-Frank Act is a single point of entry strategy.
In connection with our single point of entry resolution strategy, we have established the IHC to facilitate the provision of capital and liquidity resources to certain key subsidiaries in the event of material financial distress or failure. In the second quarter of 2017, we entered into a binding support agreement that required the IHC to provide that support. The support agreement required the Parent to transfer its intercompany loans and most of its cash to the IHC, and requires the Parent to continue to transfer cash and other liquid financial assets to the IHC.
If our projected liquidity resources deteriorate so severely that resolution of the Parent becomes imminent, the committed line of credit the IHC provided to the Parent will automatically terminate, with all amounts outstanding becoming due and payable, and the support agreement will require the Parent to transfer most of its remaining assets (other than stock in subsidiaries and a cash reserve to fund bankruptcy expenses) to the IHC. As a result, during a period of severe financial stress the Parent might commence bankruptcy proceedings at an earlier time than it otherwise would if the support agreement had not been implemented.
If the Parent were to become subject to a bankruptcy proceeding and our single point of entry strategy is successful, creditors of some or all of our material
|
|
Part II - Other Information (continued)
|
|
entities would receive full recoveries on their claims, while the Parent’s security holders, including unsecured debt holders, could face significant losses, potentially including the loss of their entire investment. It is possible that the application of the single point of entry strategy – in which the Parent would be the only legal entity to enter resolution proceedings – could result in greater losses to holders of our unsecured debt securities and other securities than the losses that could result from the application of a different resolution strategy. Further, if the single point of entry strategy is not successful, our liquidity and financial condition would be adversely affected and our security holders may, as a consequence, be in a worse position than if the strategy had not been implemented.
In addition, Title II of the Dodd-Frank Act established an orderly liquidation process in the event of the failure of a large systemically important financial institution, such as BNY Mellon, in order to avoid or mitigate serious adverse effects on the U.S. financial system. Specifically, when a U.S. G-SIB, such as BNY Mellon is in default or danger of default, and certain specified conditions are met, the FDIC may be appointed receiver under the orderly liquidation authority, and BNY Mellon would be resolved under that authority instead of the U.S. Bankruptcy Code.
U.S. supervisors have indicated that a single point of entry strategy may be a desirable strategy to resolve a large financial institution such as BNY Mellon under Title II in a manner that would, similar to our preferred strategy under our Title I resolution plan, impose losses on shareholders, unsecured debt holders and other unsecured creditors of the top-tier holding company (in our case, the Parent), while permitting the holding company’s subsidiaries to continue to operate and remain solvent. Under such a strategy, assuming the Parent entered resolution proceedings and its subsidiaries remained solvent, losses at the subsidiary level could be transferred to the Parent and ultimately borne by the Parent’s security holders (including holders of the Parent’s unsecured debt securities), while third-party creditors of the Parent’s subsidiaries would receive full recoveries on their claims. Accordingly, the Parent’s security holders (including holders of unsecured debt securities and other unsecured creditors) could face losses in excess of what otherwise would have been the case.
|
|
Part II - Other Information (continued)
|
|
Item 2. Unregistered Sales of Equity Securities and Use of ProceedsProceeds.
| |
| (c) | The following table discloses repurchases of our common stock made in the thirdfirst quarter of 2017.2018. All of the Company’s preferred stock outstanding has preference over the Company’s common stock with respect to the payment of dividends. |
Issuer purchases of equity securities
|
| | | | | | | | | | | | | | |
| Share repurchases - third quarter of 2017 | | | | | Total shares repurchased as part of a publicly announced plan or program |
| Maximum approximate dollar value of shares that may yet be purchased under the publicly announced plans or programs at Sept. 30, 2017 | | |
| (dollars in millions, except per share information; common shares in thousands) | Total shares
repurchased |
| | Average price
per share |
| | |
| July 2017 | 7 |
| | $ | 51.08 |
| | 7 |
| | $ | 2,600 |
| |
| August 2017 | 12,300 |
| | 52.74 |
| | 12,300 |
| | 1,951 |
| |
| September 2017 | 9 |
| | 52.29 |
| | 9 |
| | 1,950 |
| |
Third quarter of 2017 (a) | 12,316 |
| | $ | 52.74 |
| | 12,316 |
| | $ | 1,950 |
| (b) |
|
| | | | | | | | | | | | | | |
| Share repurchases - first quarter of 2018 | | | | | Total shares repurchased as part of a publicly announced plan or program |
| Maximum approximate dollar value of shares that may yet be purchased under the publicly announced plans or programs at March 31, 2018 | | |
| (dollars in millions, except per share information; common shares in thousands) | Total shares
repurchased |
| | Average price
per share |
| | |
| January 2018 | 4,886 |
| | $ | 56.21 |
| | 4,886 |
| | $ | 1,024 |
| |
| February 2018 | 4,840 |
| | 56.06 |
| | 4,840 |
| | 753 |
| |
| March 2018 | 1,734 |
| | 56.76 |
| | 1,734 |
| | 655 |
| |
First quarter of 2018 (a) | 11,460 |
| | $ | 56.23 |
| | 11,460 |
| | $ | 655 |
| (b) |
| |
| (a) | Includes 322,533 thousand shares repurchased at a purchase price of $2$143 million from employees, primarily in connection with the employees’ payment of taxes upon the vesting of restricted stock. The average price per share of open market purchases was $52.74.$56.14. |
| |
| (b) | Represents the maximum value of the shares authorized to be repurchased through the second quarter of 2018, including employee benefit plan repurchases, in connection with the Federal Reserve’s non-objection to our 2017 capital plan. |
On June 28, 2017, in connection with the Federal Reserve’s non-objection to our 2017 capital plan, BNY Mellon announced a share repurchase plan providing for the repurchase of up to $2.6 billion of common stock and up to an additional $500 million of common stock contingent on a prior issuance of $500 million of noncumulative perpetual preferred stock. The 2017 capital plan began in the third quarter of 2017 and continues through the second quarter of 2018. This new share repurchase plan replaces all previously authorized share repurchase plans.
Share repurchases may be executed through repurchase plans designed to comply with Rule 10b5-1 and through derivative, accelerated share repurchase and other structured transactions. The timing and exact amount of any common stock repurchases will depend on various factors, including market conditions and the common stock trading price; the Company’s capital position, liquidity and financial performance; alternative uses of capital; and legal and regulatory considerations.
Item 6. ExhibitsExhibits.
The list of exhibits required to be filed as exhibits to this report appears below.
|
| | | | |
| Exhibit No. | | Description | | Method of Filing |
| 3.1 | | | | Previously filed as Exhibit 3.1 to the Company’s Current Report on Form 8-K (File No. 000-52710) as filed with the Commission on July 2, 2007, and incorporated herein by reference. |
| 3.2 | | | | Previously filed as Exhibit 4.1 to the Company’s Current Report on Form 8-K (File No. 000-52710) as filed with the Commission on July 5, 2007, and incorporated herein by reference. |
| 3.3 | | | | Previously filed as Exhibit 3.2 to the Company’s Registration Statement on Form 8A12B (File No. 001-35651) as filed with the Commission on Sept. 14, 2012, and incorporated herein by reference. |
| 3.4 | | | | Previously filed as Exhibit 3.1 to the Company’s Current Report on Form 8-K (File No. 001-35651) as filed with the Commission on May 16, 2013, and incorporated herein by reference.
|
| 3.5 | |
| | Previously filed as Exhibit 3.1 to the Company’s Current Report on Form 8-K (File No. 001-35651) as filed with the Commission on April 28, 2015, and incorporated herein by reference.
|
| 3.6 | | | | Previously filed as Exhibit 3.1 to the Company’s Current Report on Form 8-K (File No. 001-35651) as filed with the Commission on Aug. 1, 2016, and incorporated herein by reference. |
| 3.7 | | | | Previously filed as Exhibit 3.1 to the Company’s Current Report on Form 8-K (File No. 001-35651) as filed with the Commission on Oct. 19, 2015,Feb. 13, 2018, and incorporated herein by reference. |
| 4.1 | | None of the instruments defining the rights of holders of long-term debt of the Parent or any of its subsidiaries represented long-term debt in excess of 10% of the total assets of the Company as of Sept. 30, 2017.March 31, 2018. The Company hereby agrees to furnish to the Commission, upon request, a copy of any such instrument. | | N/A |
|
|
Index to Exhibits (continued) |
| |
|
| | | | |
| Exhibit No. | | Description | | Method of Filing |
| 10.1 | | | | Previously filed as Exhibit 10.1 to the Company’s Current Report on Form 8-K (File No. 001-35651) as filed with the Commission on Feb. 13, 2018, and incorporated herein by reference.
|
| 12.1 | | | | Filed herewith. |
| 31.1 | | | | Filed herewith. |
| 31.2 | | | | Filed herewith. |
| 32.1 | | | | Furnished herewith. |
| 32.2 | | | | Furnished herewith. |
| 101.INS | | XBRL Instance Document. | | Filed herewith. |
| 101.SCH | | XBRL Taxonomy Extension Schema Document. | | Filed herewith. |
| 101.CAL | | XBRL Taxonomy Extension Calculation Linkbase Document. | | Filed herewith. |
| 101.DEF | | XBRL Taxonomy Extension Definition Linkbase Document. | | Filed herewith. |
| 101.LAB | | XBRL Taxonomy Extension Label Linkbase Document. | | Filed herewith. |
| 101.PRE | | XBRL Taxonomy Extension Presentation Linkbase Document. | | Filed herewith. |
SIGNATURE
Pursuant to the requirements of the Securities Exchange Act of 1934, the registrant has duly caused this report to be signed on its behalf by the undersigned thereunto duly authorized.
|
| |
| | THE BANK OF NEW YORK MELLON CORPORATION |
| | (Registrant) |
|
| | | |
| | | | |
Date: November 7, 2017May 8, 2018 | By: | | /s/ Kurtis R. Kurimsky |
| | | | Kurtis R. Kurimsky |
| | | | Corporate Controller |
| | | | (Duly Authorized Officer and |
| | | | Principal Accounting Officer of |
| | | | the Registrant) |