0001390777 us-gaap:OperatingSegmentsMember bk:InvestmentandWealthManagementSegmentMember 2020-01-01 2020-06-30 0001390777 us-gaap:SovereignDebtMember country:BE bk:PlusAndMinusCreditRatingMember us-gaap:FairValueMeasurementsRecurringMember 2019-12-31
UNITED STATES
SECURITIES AND EXCHANGE COMMISSION
Washington, D.C. 20549
FORM 10-Q
[ X ] ☒Quarterly Report Pursuant Toto Section 13 or 15(d) of the Securities Exchange Act of 1934
For the Quarterly Period Ended Sept.June 30, 20172020
or
[ ]☐ Transition Report Pursuant to Section 13 or 15(d) of the Securities Exchange Act of 1934
Commission File No. 001-35651
THE BANK OF NEW YORK MELLON CORPORATION
(Exact name of registrant as specified in its charter)
|
| |
| Delaware | 13-2614959 |
| (State or other jurisdiction of incorporation or organization) | (I.R.S. Employer Identification No.) |
incorporation or organization) | |
225 Liberty240 Greenwich Street
New York, New York 10286
(Address of principal executive offices) (Zip Code)
Registrant’s telephone number, including area code --– (212) 495-1784
Not Applicable
(Former name, former address and former fiscal year, if changed since last report)
|
| | |
Securities registered pursuant to Section 12(b) of the Act:
Title of each class | Trading symbol(s) | Name of each exchange on which registered |
| Common Stock, $0.01 par value | BK | New York Stock Exchange |
| Depositary Shares, each representing 1/4,000th of a share of Series C Noncumulative Perpetual Preferred Stock | BK PrC | New York Stock Exchange |
| 6.244% Fixed-to-Floating Rate Normal Preferred Capital Securities of Mellon Capital IV | BK/P | New York Stock Exchange |
| (fully and unconditionally guaranteed by The Bank of New York Mellon Corporation) | | |
Indicate by check mark whether the registrant (1) has filed all reports required to be filed by Section 13 or 15(d) of the Securities Exchange Act of 1934 during the preceding 12 months (or for such shorter period that the registrant was required to file such reports), and (2) has been subject to such filing requirements for the past 90 days. Yes X☒No ___☐
Indicate by check mark whether the registrant has submitted electronically and posted on its corporate Web site, if any, every Interactive Data File required to be submitted and posted pursuant to Rule 405 of Regulation S-T (§232.405 of this chapter) during the preceding 12 months (or for such shorter period that the registrant was required to submit and post such files). Yes X☒No ___☐
Indicate by check mark whether the registrant is a large accelerated filer, an accelerated filer, a non-accelerated filer, a smaller reporting company, or an emerging growth company. See the definitions of “large accelerated filer,” “accelerated filer,” “smaller reporting company,” and “emerging growth company” in Rule 12b-2 of the Exchange Act.
|
| | | | | | |
| Large accelerated filer [ X ] | ☒ | | Accelerated filer | ☐ | |
| Non-accelerated filer | ☐ | | Smaller reporting company [ ] | ☐ | |
Accelerated filer [ ] | | | | Emerging growth company [ ] |
Non-accelerated filer [ ] (Do not check if a smaller reporting company)☐ | |
If an emerging growth company, indicate by check mark if the registrant has elected not to use the extended transition period for complying with any new or revised financial accounting standards provided pursuant to Section 13(a) of the Exchange Act. [ ]☐
Indicate by check mark whether the registrant is a shell company (as defined in Rule 12b-2 of the Exchange Act).Yes ___☐No X☒
Indicate the numberAs of June 30, 2020, 885,861,714 shares outstanding of each of the issuer’s classes ofregistrant’s common stock, as of the latest practicable date.$0.01 par value per share, were outstanding.
|
| | | | |
| Class | Outstanding as of |
| |
| | Sept. 30, 2017 |
| |
| Common Stock, $0.01 par value | 1,024,022,353 |
| |
THE BANK OF NEW YORK MELLON CORPORATION
ThirdSecond Quarter 20172020 Form 10-Q
Table of Contents
|
| |
| | Page |
| |
| | |
| Part I - Financial Information | |
| Items 2. and 3. Management’s Discussion and Analysis of Financial Condition and Results of Operations; Quantitative and Qualitative Disclosures about Market Risk: | |
| |
| |
Key thirdsecond quarter 20172020 and subsequent events | |
| |
| Impact of coronavirus pandemic on our business | |
| |
| |
| |
| |
| |
| |
| |
| |
| |
| |
| |
| |
| |
| |
| |
| |
| |
| |
| | |
| Item 1. Financial Statements: | |
| |
| |
| |
| |
| |
|
| |
| | Page |
| Notes to Consolidated Financial Statements: | |
| |
| |
| |
| |
| |
| |
| |
| |
| |
| |
| |
| |
| |
| |
| |
| |
| |
| |
| |
| |
| |
| |
| | |
| |
| |
| | |
| Part II - Other Information | |
| |
| |
| |
| |
| | |
| Index to Exhibits | |
| Signature | |
The Bank of New York Mellon Corporation (and its subsidiaries)
Consolidated Financial Highlights (unaudited)
| | | | Quarter ended | | Year-to-date | Quarter ended | | Year-to-date |
| (dollar amounts in millions, except per share amounts and unless otherwise noted) | Sept. 30, 2017 |
| June 30, 2017 |
| Sept. 30, 2016 |
| | Sept. 30, 2017 |
| Sept. 30, 2016 |
| |
(dollars in millions, except per share amounts and unless otherwise noted) | | June 30, 2020 |
| March 31, 2020 |
| June 30, 2019 |
| | June 30, 2020 |
| June 30, 2019 |
|
| Results applicable to common shareholders of The Bank of New York Mellon Corporation: | | | | | | |
| Net income | $ | 983 |
| $ | 926 |
| $ | 974 |
| | $ | 2,789 |
| $ | 2,603 |
| $ | 901 |
| $ | 944 |
| $ | 969 |
| | $ | 1,845 |
| $ | 1,879 |
|
| Basic earnings per share | 0.94 |
| 0.88 |
| 0.90 |
| | 2.66 |
| 2.39 |
| $ | 1.01 |
| $ | 1.05 |
| $ | 1.01 |
| | $ | 2.06 |
| $ | 1.95 |
|
| Diluted earnings per share | 0.94 |
| 0.88 |
| 0.90 |
| | 2.64 |
| 2.38 |
| $ | 1.01 |
| $ | 1.05 |
| $ | 1.01 |
| | $ | 2.06 |
| $ | 1.95 |
|
| | | | | | | |
| Fee and other revenue | $ | 3,167 |
| $ | 3,120 |
| $ | 3,150 |
| | $ | 9,305 |
| $ | 9,119 |
| $ | 3,176 |
| $ | 3,332 |
| $ | 3,112 |
| | $ | 6,508 |
| $ | 6,144 |
|
| Income from consolidated investment management funds | 10 |
| 10 |
| 17 |
| | 53 |
| 21 |
| |
| Income (loss) from consolidated investment management funds | | 54 |
| (38 | ) | 10 |
| | 16 |
| 36 |
|
| Net interest revenue | 839 |
| 826 |
| 774 |
| | 2,457 |
| 2,307 |
| 780 |
| 814 |
| 802 |
| | 1,594 |
| 1,643 |
|
| Total revenue | $ | 4,016 |
| $ | 3,956 |
| $ | 3,941 |
| | $ | 11,815 |
| $ | 11,447 |
| $ | 4,010 |
| $ | 4,108 |
| $ | 3,924 |
| | $ | 8,118 |
| $ | 7,823 |
|
| | | | | | | |
Return on common equity (annualized) (a) | 10.6 | % | 10.4 | % | 10.8 | % | | 10.4 | % | 9.8 | % | 9.4 | % | 10.1 | % | 10.4 | % | | 9.7 | % | 10.2 | % |
Adjusted return on common equity (annualized) – Non-GAAP (a)(b) | 11.0 | % | 10.8 | % | 11.3 | % | | 10.9 | % | 10.3 | % | |
| | | | | |
Return on tangible common equity (annualized) – Non-GAAP (a)(c) | 21.9 | % | 21.9 | % | 23.5 | % | | 22.0 | % | 21.5 | % | |
Adjusted return on tangible common equity (annualized) – Non-GAAP (a)(b)(c) | 22.0 | % | 22.1 | % | 23.6 | % | | 22.1 | % | 21.7 | % | |
Return on tangible common equity (annualized) – Non-GAAP (a) | | 18.5 | % | 20.4 | % | 21.2 | % | | 19.4 | % | 20.9 | % |
| | | | | | | |
Return on average assets (annualized) | 1.13 | % | 1.09 | % | 1.10 | % | | 1.09 | % | 0.96 | % | 0.87 | % | 0.99 | % | 1.13 | % | | 0.93 | % | 1.12 | % |
| | | | | | | |
| Fee revenue as a percentage of total revenue | 78 | % | 79 | % | 79 | % | | 79 | % | 79 | % | 79 | % | 81 | % | 79 | % | | 80 | % | 78 | % |
| | | | | | | |
| Percentage of non-U.S. total revenue | 36 | % | 35 | % | 36 | % | | 35 | % | 34 | % | |
| Non-U.S. revenue as a percentage of total revenue | | 36 | % | 36 | % | 36 | % | | 36 | % | 36 | % |
| | | | | | | |
Pre-tax operating margin (a) | 34 | % | 33 | % | 33 | % | | 33 | % | 31 | % | |
Adjusted pre-tax operating margin – Non-GAAP (a)(b) | 35 | % | 35 | % | 35 | % | | 34 | % | 33 | % | |
| Pre-tax operating margin | | 29 | % | 30 | % | 33 | % | | 30 | % | 32 | % |
| | | | | | | |
| Net interest margin | 1.15 | % | 1.14 | % | 1.05 | % | | 1.14 | % | 1.00 | % | 0.88 | % | 1.01 | % | 1.12 | % | | 0.94 | % | 1.16 | % |
Net interest margin on a fully taxable equivalent (“FTE”) basis – Non-GAAP (d) | 1.16 | % | 1.16 | % | 1.06 | % | | 1.16 | % | 1.02 | % | |
Net interest margin on a fully taxable equivalent (“FTE”) basis – Non-GAAP (b) | | 0.88 | % | 1.01 | % | 1.12 | % | | 0.94 | % | 1.16 | % |
| | | | | | | |
Assets under management (“AUM”) at period end (in billions) (e) | $ | 1,824 |
| $ | 1,771 |
| $ | 1,715 |
| | $ | 1,824 |
| $ | 1,715 |
| |
Assets under custody and/or administration (“AUC/A”) at period end (in trillions) (f) | $ | 32.2 |
| $ | 31.1 |
| $ | 30.5 |
| | $ | 32.2 |
| $ | 30.5 |
| |
Market value of securities on loan at period end (in billions) (g) | $ | 382 |
| $ | 336 |
| $ | 288 |
| | $ | 382 |
| $ | 288 |
| |
Assets under custody and/or administration (“AUC/A”) at period end (in trillions) (c) | | $ | 37.3 |
| $ | 35.2 |
| $ | 35.5 |
| | $ | 37.3 |
| $ | 35.5 |
|
Assets under management (“AUM”) at period end (in billions) (d) | | $ | 1,961 |
| $ | 1,796 |
| $ | 1,843 |
| | $ | 1,961 |
| $ | 1,843 |
|
Market value of securities on loan at period end (in billions) (e) | | $ | 384 |
| $ | 389 |
| $ | 369 |
| | $ | 384 |
| $ | 369 |
|
| | | | | | | |
Average common shares and equivalents outstanding (in thousands): (h) | | | | |
Average common shares and equivalents outstanding (in thousands): | | | | |
| Basic | 1,035,337 |
| 1,035,829 |
| 1,062,248 |
| | 1,037,431 |
| 1,071,457 |
| 889,020 |
| 894,122 |
| 951,281 |
| | 891,642 |
| 956,887 |
|
| Diluted | 1,041,138 |
| 1,041,879 |
| 1,067,682 |
| | 1,043,585 |
| 1,077,150 |
| 890,561 |
| 896,689 |
| 953,928 |
| | 893,603 |
| 959,957 |
|
| | | | | | | |
| Selected average balances: | | | | | | |
| Interest-earning assets | $ | 291,841 |
| $ | 289,496 |
| $ | 296,703 |
| | $ | 288,283 |
| $ | 308,560 |
| $ | 357,562 |
| $ | 323,936 |
| $ | 287,417 |
| | $ | 340,749 |
| $ | 284,816 |
|
| Assets of operations | $ | 344,966 |
| $ | 341,607 |
| $ | 350,190 |
| | $ | 340,588 |
| $ | 362,092 |
| |
| Total assets | $ | 345,709 |
| $ | 342,515 |
| $ | 351,230 |
| | $ | 341,510 |
| $ | 363,290 |
| $ | 415,359 |
| $ | 385,278 |
| $ | 342,384 |
| | $ | 400,318 |
| $ | 339,292 |
|
| Interest-bearing deposits | $ | 142,490 |
| $ | 142,336 |
| $ | 155,109 |
| | $ | 141,558 |
| $ | 160,728 |
| $ | 210,643 |
| $ | 197,632 |
| $ | 167,545 |
| | $ | 204,138 |
| $ | 163,734 |
|
| Noninterest-bearing deposits | | $ | 72,411 |
| $ | 60,577 |
| $ | 52,956 |
| | $ | 66,494 |
| $ | 53,765 |
|
| Long-term debt | $ | 28,138 |
| $ | 27,398 |
| $ | 23,930 |
| | $ | 27,148 |
| $ | 22,779 |
| $ | 28,122 |
| $ | 27,231 |
| $ | 27,681 |
| | $ | 27,677 |
| $ | 27,966 |
|
| Noninterest-bearing deposits | $ | 70,168 |
| $ | 73,886 |
| $ | 81,619 |
| | $ | 72,524 |
| $ | 82,861 |
| |
| Preferred stock | $ | 3,542 |
| $ | 3,542 |
| $ | 3,284 |
| | $ | 3,542 |
| $ | 2,798 |
| $ | 4,010 |
| $ | 3,542 |
| $ | 3,542 |
| | $ | 3,776 |
| $ | 3,542 |
|
| Total The Bank of New York Mellon Corporation common shareholders’ equity | $ | 36,780 |
| $ | 35,862 |
| $ | 35,767 |
| | $ | 35,876 |
| $ | 35,616 |
| $ | 38,476 |
| $ | 37,664 |
| $ | 37,487 |
| | $ | 38,070 |
| $ | 37,287 |
|
| | | | | | | |
| Other information at period end: | | | | | | |
| Cash dividends per common share | $ | 0.24 |
| $ | 0.19 |
| $ | 0.19 |
| | $ | 0.62 |
| $ | 0.53 |
| $ | 0.31 |
| $ | 0.31 |
| $ | 0.28 |
| | $ | 0.62 |
| $ | 0.56 |
|
| Common dividend payout ratio | 26 | % | 22 | % | 21 | % | | 23 | % | 22 | % | 31 | % | 30 | % | 28 | % | | 30 | % | 29 | % |
Common dividend yield (annualized) | 1.8 | % | 1.5 | % | 1.9 | % | | 1.6 | % | 1.8 | % | 3.2 | % | 3.7 | % | 2.5 | % | | 3.2 | % | 2.6 | % |
| Closing stock price per common share | $ | 53.02 |
| $ | 51.02 |
| $ | 39.88 |
| | $ | 53.02 |
| $ | 39.88 |
| $ | 38.65 |
| $ | 33.68 |
| $ | 44.15 |
| | $ | 38.65 |
| $ | 44.15 |
|
| Market capitalization | $ | 54,294 |
| $ | 52,712 |
| $ | 42,167 |
| | $ | 54,294 |
| $ | 42,167 |
| $ | 34,239 |
| $ | 29,822 |
| $ | 41,619 |
| | $ | 34,239 |
| $ | 41,619 |
|
Book value per common share (a) | $ | 36.11 |
| $ | 35.26 |
| $ | 34.19 |
| | $ | 36.11 |
| $ | 34.19 |
| |
Tangible book value per common share – Non-GAAP (a)(c) | $ | 18.19 |
| $ | 17.53 |
| $ | 16.67 |
| | $ | 18.19 |
| $ | 16.67 |
| |
| Book value per common share | | $ | 44.21 |
| $ | 42.47 |
| $ | 40.30 |
| | $ | 44.21 |
| $ | 40.30 |
|
Tangible book value per common share – Non-GAAP (a) | | $ | 23.31 |
| $ | 21.53 |
| $ | 20.45 |
| | $ | 23.31 |
| $ | 20.45 |
|
| Full-time employees | 52,900 |
| 52,800 |
| 52,300 |
| | 52,900 |
| 52,300 |
| 48,300 |
| 47,900 |
| 49,100 |
| | 48,300 |
| 49,100 |
|
Common shares outstanding (in thousands) | 1,024,022 |
| 1,033,156 |
| 1,057,337 |
| | 1,024,022 |
| 1,057,337 |
| 885,862 |
| 885,443 |
| 942,662 |
| | 885,862 |
| 942,662 |
|
Consolidated Financial Highlights (unaudited)(continued)
|
| | | | | | |
| Regulatory and Capital ratios | Sept. 30, 2017 |
| June 30, 2017 |
| Dec. 31, 2016 |
|
Average liquidity coverage ratio (“LCR”) (i) | 119 | % | 116 | % | 114 | % |
| | | | |
Regulatory capital ratios: (j) | | | |
| Standardized: | | | |
| Common equity Tier 1 (“CET1”) ratio | 12.3 | % | 12.0 | % | 12.3 | % |
| Tier 1 capital ratio | 14.6 |
| 14.3 |
| 14.5 |
|
| Total (Tier 1 plus Tier 2) capital ratio | 15.6 |
| 14.8 |
| 15.2 |
|
| Advanced: | | | |
| CET1 ratio | 11.1 |
| 10.8 |
| 10.6 |
|
| Tier 1 capital ratio | 13.2 |
| 12.9 |
| 12.6 |
|
| Total (Tier 1 plus Tier 2) capital ratio | 14.0 |
| 13.2 |
| 13.0 |
|
| | | | |
Leverage capital ratio (j) | 6.8 |
| 6.7 |
| 6.6 |
|
Supplementary leverage ratio (“SLR”) (j) | 6.3 |
| 6.2 |
| 6.0 |
|
| | | | |
| BNY Mellon shareholders’ equity to total assets ratio – GAAP | 11.4 |
| 11.3 |
| 11.6 |
|
| BNY Mellon common shareholders’ equity to total assets ratio – GAAP | 10.4 |
| 10.3 |
| 10.6 |
|
| | | | |
Selected regulatory capital ratios – fully phased-in – Non-GAAP: (k) | | | |
| Estimated CET1 ratio: | | | |
| Standardized Approach | 11.9 | % | 11.5 | % | 11.3 | % |
| Advanced Approach | 10.7 |
| 10.4 |
| 9.7 |
|
| | | | |
| Estimated SLR | 6.1 |
| 6.0 |
| 5.6 |
|
|
| | | | | | |
| Regulatory capital and other ratios | June 30, 2020 |
| March 31, 2020 |
| Dec. 31, 2019 |
|
| Average liquidity coverage ratio (“LCR”) | 112 | % | 115 | % | 120 | % |
| | | | |
Regulatory capital ratios: (f) | | | |
| Advanced: | | | |
| Common Equity Tier 1 (“CET1”) ratio | 12.6 | % | 11.4 | % | 11.5 | % |
| Tier 1 capital ratio | 15.4 |
| 13.5 |
| 13.7 |
|
| Total capital ratio | 16.3 |
| 14.3 |
| 14.4 |
|
| Standardized: | | | |
| CET1 ratio | 12.7 | % | 11.3 | % | 12.5 | % |
| Tier 1 capital ratio | 15.6 |
| 13.5 |
| 14.8 |
|
| Total capital ratio | 16.6 |
| 14.4 |
| 15.8 |
|
| | | | |
| Tier 1 leverage ratio | 6.2 | % | 6.0 | % | 6.6 | % |
Supplementary leverage ratio (“SLR”) (g) | 8.2 |
| 5.6 |
| 6.1 |
|
| | | | |
| BNY Mellon shareholders’ equity to total assets ratio | 9.9 | % | 8.8 | % | 10.9 | % |
| BNY Mellon common shareholders’ equity to total assets ratio | 8.9 |
| 8.0 |
| 9.9 |
|
| |
| (a) | See “Supplemental information – Explanation of GAAP and Non-GAAP financial measures” beginningReturn on page 49 for a reconciliation of Non-GAAP measures. |
| |
(b) | Non-GAAP information for all periods presented excludes the amortization of intangible assets and merger and integration (“M&I”), litigation and restructuring charges. Non-GAAP information for the third quarter of 2016 and for the first nine months of 2016 also excludes a recovery of the previously impaired loan to Sentinel Management Group, Inc. (“Sentinel”). Additionally, the pre-tax operating margin (Non-GAAP) excludes the net income attributable to noncontrolling interests of consolidated investment management funds. |
| |
(c) | Tangibletangible common equity – Non-GAAP and tangible book value per common share, – Non-GAAP measures, exclude goodwill and intangible assets, net of deferred tax liabilities. See “Supplemental information – Explanation of GAAP and Non-GAAP financial measures” beginning on page 4945 for the reconciliation of Non-GAAP measures. |
| |
(d)(b) | See “Average balances and“Net interest rates”revenue” on page 1110 for a reconciliation of this Non-GAAP measures.measure. |
| |
(e) | Excludes securities lending cash management assets and assets managed in the Investment Services business. |
| |
(f)(c) | Includes the AUC/A of CIBC Mellon Global Securities Services Company (“CIBC Mellon”), a joint venture with the Canadian Imperial Bank of Commerce, of $1.3 trillion at Sept.June 30, 2017 and2020, $1.2 trillion at bothMarch 31, 2020 and $1.4 trillion at June 30, 2017 and Sept. 30, 2016.2019. |
| |
(g)(d) | Excludes securities lending cash management assets and assets managed in the Investment Services business. |
| |
| (e) | Represents the total amount of securities on loan in our agency securities lending program managed by the Investment Services business. Excludes securities for which BNY Mellon acts as an agent on behalf of CIBC Mellon clients, which totaled $68 billion at Sept. 30, 2017, $66$62 billion at June 30, 20172020, $59 billion at March 31, 2020 and $64 billion at Sept.June 30, 2016.2019. |
| |
(h) | Beginning in the third quarter of 2017, vested stock awards to retirement eligible employees are included in common shares outstanding for earnings per share purposes. This change increased both average basic and average diluted shares outstanding by approximately 6 million for the quarter, which resulted in a de minimis impact to both basic and diluted earnings per share. For additional information, see the “Consolidated Income Statement” beginning on page 57. |
| |
(i) | For additional information on our LCR, see “Liquidity and dividends” beginning on page 33. |
| |
(j)(f) | For our CET1, Tier 1 capital and Total capital ratios, our effective capital ratios under U.S. capital rules are the lower of the ratios as calculated under the Standardized and Advanced Approaches. The leverage capital ratio is based on Tier I capital, as phased-in, and quarterly average total assets. The SLR is based on Tier 1 capital, as phased-in, and average quarterly assets and certain off-balance sheet exposures. For additional information on our capital ratios, see “Capital” beginning on page 37. |
| |
(k)(g) | The estimated fully phased-in CET1SLR at June 30, 2020 reflects the exclusion of certain central bank placements and the temporary exclusion of U.S. Treasury securities from the leverage exposure. This temporary exclusion increased our consolidated SLR ratios (Non-GAAP) are based on our interpretation of the U.S. capital rules, which are being gradually phased-in over a multi-year period. For additional information on these Non-GAAP ratios, seeby 40 basis points. See “Capital” beginning on page 37.37 for additional information. |
|
|
Part I - Financial Information
|
|
|
| Items 2. and 3. Management’s Discussion and Analysis of Financial Condition and Results of Operations; Quantitative and Qualitative Disclosures about Market Risk |
General
In this Quarterly Report on Form 10-Q, references to “our,” “we,” “us,” “BNY Mellon,” the “Company” and similar terms refer to The Bank of New York Mellon Corporation and its consolidated subsidiaries. The term “Parent” refers to The Bank of New York Mellon Corporation but not its subsidiaries.
Certain business terms used in this report are defined in the Glossary included in our Annual Report on Form 10-K for the year ended Dec. 31, 20162019 (“20162019 Annual Report”).
The following should be read in conjunction with the Consolidated Financial Statements included in this report. Investors should also read the sectionsections titled “Forward-looking Statements.Statements” and “Risk Factors.”
How we reported results
Throughout this Form 10-Q, certain measures, which are noted as “Non-GAAP financial measures,” exclude certain items or otherwise include components that differ from U.S. generally accepted accounting principles (“GAAP”). BNY Mellon believes that these measures are useful to investors because they permit a focus on period-to-period comparisons using measures that relate to our ability to enhance revenues and limit expenses in circumstances where such matters are within our control or because they provide additional information about our ability to meet fully phased-in capital requirements. Certain immaterial reclassifications have been made to prior periods to place them on a basis comparable with the current period presentation. See “Supplemental information - Explanation of GAAP and Non-GAAP financial measures” beginning on page 49 for a reconciliation of financial measures presented in accordance with GAAP to adjusted Non-GAAP financial measures. See “Net interest revenue,” including the “Average balances and interest rates” beginning on page 10 for information on measures presented on a fully taxable equivalent basis. Also see “Capital” beginning on page 37 for information on our fully phased-in capital requirements.
Overview
The Bank of New York Mellon Corporation wasEstablished in 1784 by Alexander Hamilton, we were the first company listed on the New York Stock Exchange (NYSE: BK). With a rich history ofmaintaining our financial strength and stability through all business cycles, more than 235 years, BNY Mellon is a global investments company dedicated to improving lives through investing.
We managethat manages and serviceservices assets for financial institutions, corporations and individual investors in 35 countries and more than 100 markets. As of Sept. 30, 2017, countries.
BNY Mellon had $32.2 trillion in assets under custody and/or administration (“AUC/A”)has two business segments, Investment Services and Investment and Wealth Management (formerly Investment Management), which offer a comprehensive set of capabilities and $1.8 trillion in assets under management (“AUM”).
BNY Mellon is focused on enhancing our clients’ experience by leveraging our scale anddeep expertise across the investment lifecycle, enabling the Company to deliver innovative and strategicprovide solutions for our clients, and building trusted relationships that drive value. We hold a unique position in the global financial services industry. We service both theto buy-side and sell-side providing usmarket participants, as well as leading institutional and wealth management clients globally.
The diagram below presents our two business segments and lines of business, with distinctive marketplace insights that enable us to support our clients’ success.the remaining operations in the Other segment.
BNY Mellon’s businesses benefit from global growth in financial assets, the globalization of the investment process, changes in demographics and the continued evolution of the regulatory landscape—each providing us with opportunities to advise and service clients.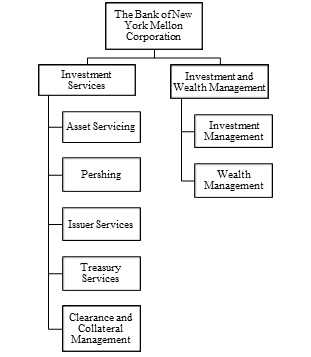
Key thirdsecond quarter 20172020 and subsequent events
Definitive agreement to sell CenterSquare Investment ManagementEmily Portney named Chief Financial Officer
In September 2017, we announced that we entered into a definitive agreement to sell CenterSquare Investment Management (“CenterSquare”), one of our Investment Management boutiques. CenterSquare had approximately $9 billion in AUM in U.S. and global real estate and infrastructure investments. The transaction is subject to standard regulatory and other required approvals and is expected to be completed in the fourth quarter of 2017 or first quarter of 2018.
Charles W. Scharf named chief executive officer; Gerald L. Hassell, chairman, to retire
In July 2017, Charles W. Scharf2020, Emily Portney was appointed chief executive officerChief Financial Officer, succeeding Michael P. Santomassimo, and memberjoined the Company’s Executive Committee. Ms. Portney previously led the client management, sales and services teams for the Asset Servicing business globally and oversaw the Americas region for the Asset Servicing business. She has also previously held senior financial roles.
CCAR and common stock repurchases
In March 2020, we and the other members of the boardFinancial Services Forum announced the temporary suspension of directors of the Company. Mr. Scharf succeeds Gerald L. Hassell, who will continue as the Company’s chairman of the board of directorsshare repurchases until his retirement at the end of the year. After Mr. Hassell’s retirement, Mr. Scharf will become chairman, effective Jan. 1, 2018.second quarter of 2020 to preserve capital and liquidity in order to further the objective of using capital and liquidity to support clients and customers.
Resolution plan
4 BNY Mellon
As required by the Dodd-Frank Act, the Parent must submit annually to the Board of Governors ofOn June 25, 2020, the Federal Reserve System (“Federal Reserve”)released the results of its annual stress tests for 2020 and the Federal Deposit Insurance Corporation (“FDIC”) a plan for its rapid and orderly resolution in the event of material financial distress or failure. The Parent filed its most recent resolution plan on July 1, 2017. We believe the 2017 resolution plan addresses all shortcomings and deficiencies identified by the FDIC andadditional sensitivity analyses that the Federal Reserve conducted in light of the Company’s 2015 resolution plan.coronavirus pandemic. The public portion of our 2017 resolution plan is available on the Federal Reserve’s and FDIC’s websites.
In September 2017, the Federal Reserve and FDIC extendedalso notified BNY Mellon that its stress capital buffer (“SCB”) requirement will be 2.5%, which equals the filing deadline by one year to Julyregulatory floor. The SCB will be effective on Oct. 1, 2019 for the Parent’s next resolution plan. 2020.
Increase in cash dividend on common stock
BNY Mellon’s 2017 capital plan submitted in connection with ourThe Federal Reserve also announced that it has required participating Comprehensive Capital Analysis and Review (“CCAR”) includedfirms, including us, to update and resubmit their capital plans and that, as a 26%result, unless otherwise approved by the Federal Reserve, participating firms would not be permitted, during the third quarter of 2020, to conduct open market common stock repurchases, to increase intheir common stock dividends or to pay common stock dividends that exceed average net income for the quarterly cash dividend to $0.24 per common share.preceding four quarters. The first payment of the increased quarterly cash dividend was made on Aug. 11, 2017.Federal Reserve also stated that it may extend these limitations quarter-by-quarter.
Highlights of thirdsecond quarter 20172020 results
We reported net income applicable to common shareholders of $983 million, or $0.94 per diluted common share, in the third quarter of 2017. Net income applicable to common shareholders was $974$901 million, or $0.90 per diluted common share, in the third quarter of 2016 and $926 million, or $0.88$1.01 per diluted common share, in the second quarter of 2017.
Highlights of2020. Net income applicable to common shareholders was $969 million, or $1.01 per diluted common share, in the thirdsecond quarter of 2017 include:
AUC/A totaled a record $32.2 trillion at Sept. 30, 20172019. The highlights below are based on the second quarter of 2020 compared with $30.5 trillion at Sept. 30, 2016. The 6% increasethe second quarter of 2019, unless otherwise noted.
Total revenue of $4.0 billion increased 2% primarily reflectsreflecting:
Fee revenue increased 2% primarily reflecting higher fees in Pershing and Asset Servicing, partially offset by money market values,fee waivers, lower investment management fees and the favorableunfavorable impact of a weakerstronger U.S. dollar and net new business. (See “Investment Services business” beginning on page 19.)
AUM totaled a record $1.82 trillion at Sept. 30, 2017 compared with $1.72 trillion at Sept. 30, 2016. The 6% increase primarily reflects higher market values, net inflows and the favorable impact of a weaker U.S. dollar (principally versus the British pound). AUM excludes securities lending cash management assets and assets managed in the Investment Services business. (See “Investment Management business” beginning on page 16.)
Investment services fees totaled $1.92 billion, an increase of 1% compared with $1.89 billion in the third quarter of 2016. The increase primarily reflects higher money market fees, higher equity market values and net new business, partially offset by lower Depositary Receipts revenue. (See “Investment Services business” beginning on page 19.)
Investment management and performance fees totaled $901 million, an increase of 5% compared with $860 million in the third quarter of 2016. The increase primarily reflects higher equity market values and money market fees. (See “Investment Management business” beginning on page 16.)
Foreign exchange and other trading revenue totaled $173 million compared with $183 million in the third quarter of 2016. Foreign exchange revenue totaled $158 million, a decrease of 10% compared with $175 million in the third quarter of 2016, primarily reflecting lower volatility and lower Depositary Receipt-related foreign exchange activity, partially offset by higher volumes.dollar. (See “Fee and other revenue” beginning on page 7.)
Investment and other income totaled $63 million compared with $92 million in the third quarter of 2016. The decrease primarily reflects lower other income driven by our investments in renewable energy and lower seed capital gains. (See “Fee and other revenue” beginning on page 7.)
Net interest revenue totaled $839 million compared with $774 million in the third quarter of 2016. The 8% increase wasdecreased 3% primarily driven by higherreflecting lower interest rates on interest-earning assets, partially offset by the benefit of lower averagedeposit and funding rates and higher deposits, securities portfolio and loans. Net interest margin was 1.15% in the third quarter of 2017 compared with 1.05% in the third quarter of 2016. The net interest margin (FTE) (Non-GAAP) was 1.16% in the third quarter of 2017 compared with 1.06% in the third quarter of 2016.loans. (See “Net interest revenue” on page 10.)
The provisionProvision for credit losses was a credit$143 million primarily reflecting increased downgrades and the continuation of $6 million in the third quarter of 2017 and a credit of $19 million in the third quarter of 2016.challenging
macroeconomic outlook. (See “Asset quality and allowance“Consolidated balance sheet review - Allowance for credit losses” beginning on page 29.)
Noninterest expense totaled $2.65 billion compared with $2.64 billionincreased 1% primarily reflecting the continued investments in the third quarter of 2016. The increase primarily reflects technology and higher softwarestaff and professional, legal and other purchased servicespension expenses,, partially offset by lower litigationbusiness development (travel and marketing) expense and bank assessment charges.the favorable impact of a stronger U.S. dollar. (See “Noninterest expense” beginning on page 13.)
The provision for income taxes was $348 million and the effective rate was 25.4% in the third quarter of 2017 compared with an income tax provision of $324 million and an effectiveEffective tax rate of 24.6% in the third quarter of 2016.18.3%. (See “Income taxes” on page 14.13.)
Capital and liquidity
The net unrealized pre-tax gain onCET1 ratio was 12.6% under the total investment securities portfolio was $257 million at Sept. 30, 2017 compared with a pre-tax gain of $151 millionAdvanced Approaches at June 30, 2017. The increase was primarily driven by a decrease in long-term interest rates. (See “Investment securities” beginning on page 25.)
Our CET1 ratio under the Advanced Approach was 11.1% at Sept. 30, 2017 and 10.8% at June 30, 2017. The increase was primarily driven by CET1 generation. Our CET1 ratio2020, compared with 11.3% under the Standardized Approach was 12.3% at Sept. 30, 2017March 31, 2020. The increase in the CET1 ratio primarily reflects capital generated through earnings and 12.0% at June 30, 2017.unrealized gains on assets available-for-sale, partially offset by capital deployed through dividend payments. (See “Capital” beginning on page 37.)
Our estimated CET1 ratio (Non-GAAP) calculated underTier 1 capital increased $2.55 billion, including the Advanced Approach on a fully phased-in basis was 10.7% at Sept. 30, 2017 and 10.4% at June 30, 2017. The increase primarily reflects CET1 generation. Our estimated CET1 ratio (Non-GAAP) calculated under the Standardized Approach on a fully phased-in basis was 11.9% at Sept. 30, 2017 and 11.5% at June 30, 2017.issuance of $1 billion of preferred stock. (See “Capital” beginning on page 37.)
Highlights of our principal businesses
Investment Services
Total revenue increased 3%.
Fee revenue increased 5%.
Income before income taxes decreased 8%.
AUC/A of $37.3 trillion, increased 5%, primarily reflecting higher client inflows, market values and net new business, partially offset by the unfavorable impact of a stronger U.S. dollar.
Investment and Wealth Management
Total revenue decreased 3%.
Income before income taxes decreased 15%.
AUM of $2.0 trillion, increased 6%, primarily reflecting higher market values and net inflows, partially offset by the unfavorable impact of a stronger U.S. dollar (principally versus the British pound).
See “Review of businesses” and Note 19 of the Notes to Consolidated Financial Statements for additional information on our businesses.
Impact of coronavirus pandemic on our business
The coronavirus pandemic has had a significant effect on the global macroeconomic environment. The following discusses the areas of our business that have been impacted and could continue to be impacted by the current environment.
At the end of June 2020, approximately 95% of our employees continued to work from home and be fully operational with minimal disruption to servicing our clients. However, our continued reliance on work-from-home arrangements may result in increased operational risks.
Market volatility associated with the performance of global equity and fixed income markets and lower interest rates has had, and may continue to have, a considerable impact on all of our businesses. Our lower-risk diversified fee-based business model benefits from heightened volatility and a flight-to-quality on a relative basis compared with other credit-focused financial institutions.
Our Investment Services businesses were favorably impacted by higher client volumes in the first and second quarters of 2020 compared with the prior year. The significant increases in market volatility also resulted in increased client activity in foreign exchange, and higher asset servicing, clearing services in Pershing, as well as clearance and collateral management fee revenue. However, the heightened volumes and volatility were lower in the second quarter compared with the first quarter of 2020.
This volatility coupled with the interest rate environment also led to an increase in deposit levels from the prior year as our clients increased the levels of cash placed with us. This favorably impacted net interest revenue. However, the low interest rate environment has begun to more than offset that benefit and is expected to continue to reduce our net interest revenue and margin.
Given the recent levels of short-term interest rates, money market mutual funds have begun to waive fees, which reduced fee revenue in the second quarter of 2020. See further discussion of money market fee waivers in “Fee and other revenue.”
As discussed above under “Key second quarter 2020 and subsequent events,” we and the other members of the Financial Services Forum announced in March 2020 that we would suspend share repurchases through the second quarter of 2020. Additionally, in connection with the Federal Reserve’s release of the CCAR results in June 2020, BNY Mellon announced that it will not conduct open market common stock repurchases in the third quarter of 2020, as required of all participating CCAR firms, and will continue the current quarterly common stock dividend of $0.31 per share. See “Recent regulatory developments” for additional information related to the 2020 CCAR results.
The significant changes in market values during 2020 have impacted revenue related to seed capital investments (net of hedges) in our Investment and Wealth Management business, which benefited the second quarter of 2020 and negatively impacted the first quarter of 2020. Also, in the second quarter, the Investment and Wealth Management business was negatively impacted by higher money market fee waivers.
During the first quarter of 2020, we purchased $2.2 billion of commercial paper and certificates of deposit (“CDs”) from affiliated money market mutual funds in order to provide liquidity support to the funds. We also purchased $650 million in the first quarter of 2020 and $1.1 billion in the second quarter of 2020 of commercial paper and CDs from third-party money market mutual funds and funded this purchase through the Federal Reserve Bank of Boston’s Money Market Mutual Fund Liquidity Facility (“MMLF”) program. See “Recent regulatory developments” in the First Quarter 2020 Form 10-Q for additional information on the MMLF.
The need to apply macroeconomic forecasting in the current environment in conjunction with the new expected credit loss accounting guidance has resulted in and may continue to result in heightened levels of credit loss provisioning. The continuing effects of the pandemic could also result in increased credit losses and charge offs.
In addition, a prolonged economic downturn may result in other asset write-downs and impairments, including, but not limited to, equity investments, goodwill and intangibles.
It is difficult to forecast the impact of the coronavirus, together with related public health measures, on our results with certainty because so much depends on how the health crisis evolves, its impact on the global economy as well as actions taken by central banks and governments to support the economy.
The current macroeconomic environment has also resulted in responses by governmental and regulatory bodies. See “Recent regulatory developments” for additional information on legislative and regulatory
developments in response to the coronavirus pandemic.
For further discussion of the current and potential impact of the coronavirus pandemic see Item 1A. Risk Factors “The coronavirus pandemic is adversely affecting us and creates significant risks and uncertainties for our business, and the ultimate impact of the pandemic on us will depend on future developments, which are highly uncertain and cannot be predicted.”
Fee and other revenue
| | | Fee and other revenue | | | | | YTD17 |
| | | | | YTD20 |
|
| | | 3Q17 vs. | | | vs. | | 2Q20 vs. | | | vs. |
| (dollars in millions, unless otherwise noted) | 3Q17 |
| 2Q17 |
| 3Q16 |
| 2Q17 |
| 3Q16 |
| | YTD17 |
| YTD16 |
| YTD16 |
| 2Q20 |
| 1Q20 |
| 2Q19 |
| 1Q20 |
| 2Q19 |
| | YTD20 |
| YTD19 |
| YTD19 |
|
| Investment services fees: | | | | | | | | | | |
Asset servicing (a) | $ | 1,105 |
| $ | 1,085 |
| $ | 1,067 |
| 2 | % | 4 | % | | $ | 3,253 |
| $ | 3,176 |
| 2 | % | |
| Clearing services | 383 |
| 394 |
| 349 |
| (3 | ) | 10 |
| | 1,153 |
| 1,049 |
| 10 |
| |
| Issuer services | 288 |
| 241 |
| 337 |
| 20 |
| (15 | ) | | 780 |
| 815 |
| (4 | ) | |
| Treasury services | 141 |
| 140 |
| 137 |
| 1 |
| 3 |
| | 420 |
| 407 |
| 3 |
| |
Asset servicing fees (a) | | $ | 1,173 |
| $ | 1,159 |
| $ | 1,141 |
| 1 | % | 3 | % | | $ | 2,332 |
| $ | 2,263 |
| 3 | % |
Clearing services fees (b) | | 431 |
| 470 |
| 410 |
| (8 | ) | 5 |
| | 901 |
| 808 |
| 12 |
|
| Issuer services fees | | 277 |
| 263 |
| 291 |
| 5 |
| (5 | ) | | 540 |
| 542 |
| — |
|
| Treasury services fees | | 144 |
| 149 |
| 140 |
| (3 | ) | 3 |
| | 293 |
| 272 |
| 8 |
|
| Total investment services fees | 1,917 |
| 1,860 |
| 1,890 |
| 3 |
| 1 |
| | 5,606 |
| 5,447 |
| 3 |
| 2,025 |
| 2,041 |
| 1,982 |
| (1 | ) | 2 |
| | 4,066 |
| 3,885 |
| 5 |
|
| Investment management and performance fees | 901 |
| 879 |
| 860 |
| 3 |
| 5 |
| | 2,622 |
| 2,502 |
| 5 |
| 786 |
| 862 |
| 833 |
| (9 | ) | (6 | ) | | 1,648 |
| 1,674 |
| (2 | ) |
| Foreign exchange and other trading revenue | 173 |
| 165 |
| 183 |
| 5 |
| (5 | ) | | 502 |
| 540 |
| (7 | ) | 166 |
| 319 |
| 166 |
| (48 | ) | — |
| | 485 |
| 336 |
| 44 |
|
| Financing-related fees | 54 |
| 53 |
| 58 |
| 2 |
| (7 | ) | | 162 |
| 169 |
| (4 | ) | 58 |
| 59 |
| 50 |
| (2 | ) | 16 |
| | 117 |
| 101 |
| 16 |
|
| Distribution and servicing | 40 |
| 41 |
| 43 |
| (2 | ) | (7 | ) | | 122 |
| 125 |
| (2 | ) | 27 |
| 31 |
| 31 |
| (13 | ) | (13 | ) | | 58 |
| 62 |
| (6 | ) |
| Investment and other income | 63 |
| 122 |
| 92 |
| N/M |
| N/M |
| | 262 |
| 271 |
| N/M |
| 105 |
| 11 |
| 43 |
| N/M | | 116 |
| 78 |
| N/M |
| Total fee revenue | 3,148 |
| 3,120 |
| 3,126 |
| 1 |
| 1 |
| | 9,276 |
| 9,054 |
| 2 |
| 3,167 |
| 3,323 |
| 3,105 |
| (5 | ) | 2 |
| | 6,490 |
| 6,136 |
| 6 |
|
| Net securities gains | 19 |
| — |
| 24 |
| N/M |
| N/M |
| | 29 |
| 65 |
| N/M | 9 |
| 9 |
| 7 |
| N/M | | 18 |
| 8 |
| N/M |
| Total fee and other revenue | $ | 3,167 |
| $ | 3,120 |
| $ | 3,150 |
| 2 | % | 1 | % | | $ | 9,305 |
| $ | 9,119 |
| 2 | % | $ | 3,176 |
| $ | 3,332 |
| $ | 3,112 |
| (5 | )% | 2 | % | | $ | 6,508 |
| $ | 6,144 |
| 6 | % |
| | | | | | | | | | | |
| Fee revenue as a percentage of total revenue | 78 | % | 79 | % | 79 | % | | | 79 | % | 79 | % | | 79 | % | 81 | % | 79 | % | | | 80 | % | 78 | % | |
| | | | | | | | | | | |
AUM at period end (in billions) (b) | $ | 1,824 |
| $ | 1,771 |
| $ | 1,715 |
| 3 | % | 6 | % | | $ | 1,824 |
| $ | 1,715 |
| 6 | % | |
AUC/A at period end (in trillions) (c) | $ | 32.2 |
| $ | 31.1 |
| $ | 30.5 |
| 4 | % | 6 | % | | $ | 32.2 |
| $ | 30.5 |
| 6 | % | $ | 37.3 |
| $ | 35.2 |
| $ | 35.5 |
| 6 | % | 5 | % | | $ | 37.3 |
| $ | 35.5 |
| 5 | % |
AUM at period end (in billions) (d) | | $ | 1,961 |
| $ | 1,796 |
| $ | 1,843 |
| 9 | % | 6 | % | | $ | 1,961 |
| $ | 1,843 |
| 6 | % |
| |
| (a) | Asset servicing fees include the fees from the Clearance and Collateral Management business and also include securities lending revenue of $47 million in the third quarter of 2017, $48$56 million in the second quarter of 2017,2020, $51 million in the thirdfirst quarter of 2016, $1442020, $44 million in the second quarter of 2019, $107 million in the first ninesix months of 20172020 and $153$92 million in the first ninesix months of 2016.2019. |
| |
| (b) | Clearing services fees are almost entirely earned by our Pershing business. |
| |
| (c) | Consists of AUC/A primarily from the Asset Servicing business and, to a lesser extent, the Clearance and Collateral Management, Issuer Services, Pershing and Wealth Management businesses. Includes the AUC/A of CIBC Mellon of $1.3 trillion at June 30, 2020, $1.2 trillion at March 31, 2020 and $1.4 trillion at June 30, 2019. |
| |
| (d) | Excludes securities lending cash management assets and assets managed in the Investment Services business. |
| |
(c) | Includes the AUC/A of CIBC Mellon of $1.3 trillion at Sept. 30, 2017 and $1.2 trillion at both June 30, 2017 and Sept. 30, 2016.
|
N/M - Not meaningful.
Fee and other revenue increased 1%2% compared with the thirdsecond quarter of 20162019 and 2% (unannualized)decreased 5% compared with the secondfirst quarter of 2017.2020. The increase compared with the thirdsecond quarter of 20162019 primarily reflects higher investment management and performance fees,other income, asset servicing fees and clearing services fees, partially offset by lower issuer services fees, investment management and other income andperformance fees. The decrease compared with the first quarter of 2020 primarily reflects lower foreign exchange and other trading revenue.revenue, investment management and performance fees and clearing
services fees, partially offset by higher investment and other income.
Money market fee waivers
Given the recent levels of short-term interest rates, money market mutual fund fees and other similar fees have begun to be waived to protect investors from negative returns. The fee waivers are initially primarily impacting clearing services fees in Pershing, and to a lesser extent revenue in our other
businesses including investment management fees and distribution and servicing revenue in Investment Management (formerly Asset Management) and fees in other Investment Services businesses, but also result in lower distribution and servicing expense. Money market fee waivers are highly sensitive to changes in short-term interest rates and are difficult to predict, but are expected to grow over the coming quarters.
The following table presents the impact of money market fee waivers on our consolidated fee revenue, net of distribution and servicing expense. A majority of the money market fee waivers were driven by low short-term interest rates. An increase in money market balances in the second quarter 2020 compared with the first quarter 2020 resulted in an approximate $50 million increase in total fee and other revenue which partially offset the increase in money market fee waivers.
|
| | | | | | |
| Money market fee waivers | | |
| (in millions) | 2Q20 |
| 1Q20 |
|
| Investment services fees: | | |
| Clearing services fees | $ | (50 | ) | $ | (9 | ) |
| Issuer services fees | (1 | ) | — |
|
| Treasury services fees | (2 | ) | — |
|
| Total investment services fees | (53 | ) | (9 | ) |
| Investment management and performance fees | (30 | ) | (14 | ) |
| Distribution and servicing revenue | (3 | ) | — |
|
| Total fee and other revenue | (86 | ) | (23 | ) |
| Less: Distribution and servicing expense | 7 |
| — |
|
| Net impact of money market fee waivers | $ | (79 | ) | $ | (23 | ) |
| | | |
| Impact to revenue by line of business: | | |
| Asset Servicing | $ | (1 | ) | $ | — |
|
| Pershing | (60 | ) | (9 | ) |
| Issuer Services | (1 | ) | — |
|
| Investment Management | (24 | ) | (14 | ) |
| Total impact to revenue by line of business | $ | (86 | ) | $ | (23 | ) |
Note: The line of business revenue for management reporting purposes reflects the impact of revenue transferred between the businesses.
Assuming quarter-end money market balances, we expect the impact from fee waivers, net of lower distribution and servicing expense, to increase in the third quarter of 2020 by approximately $30 million to $45 million and to increase an incremental $25 million in the fourth quarter of 2020, for a full run rate of approximately $135 million to $150 million. This impact may be partially offset depending on the levels of money market balances.
Investment services fees
Investment services fees increased 2% compared with the second quarter of 2019 and decreased 1% compared with the first quarter of 2020 reflecting the following:
Asset servicing fees increased 3% compared with the second quarter of 2019 and 1% compared with the first quarter of 2020. Both increases primarily reflect higher volumes from existing clients.
Clearing services fees increased 5% compared with the second quarter of 2019 and decreased 8% compared with the first quarter of 2020. The increase compared with the second quarter of 20172019 primarily reflects seasonally higher issuer services fees, investment managementmoney market balances and performance fees, asset servicing fees and net securities gains,clearing volumes, partially offset by lower investment and other income.
Investment services fees
Investment services fees were impacted by the followingimpact of rate-driven money market fee waivers. The decrease compared with the thirdfirst quarter of 20162020 primarily reflects the impact of rate-driven money market fee waivers and the second quarter of 2017:lower clearing volumes, partially offset by higher money market balances.
Asset servicingIssuer services fees increased 4% compared with the third quarter of 2016 and 2% (unannualized)decreased 5% compared with the second quarter of 2017.2019 and increased 5% compared with the first quarter of 2020. The
decrease compared with the second quarter of 2019 primarily reflects lower Depositary Receipts and Corporate Trust fees. The increase compared with the thirdfirst quarter of 20162020 primarily reflects higher equity market valuesDepositary Receipts fees.
Treasury services fees increased 3% compared with the second quarter of 2019 and net new business, including growth in collateral management, partially offset bydecreased 3% compared with the impactfirst quarter of downsizing the retail UK transfer agency business.2020. The increase compared with the second quarter of 2017 was2019 primarily driven by the favorable impact of a weaker U.S. dollar andreflects higher equity market values.
Clearing services fees increased 10%liquidity fees. The decrease compared with the thirdfirst quarter of 2016 and decreased 3% (unannualized) compared with the second quarter of 2017. The increase was primarily driven by higher money market fees and growth in long-term mutual fund assets. The decrease2020 primarily reflects lower clearance volumes.
Issuer services fees decreased 15% compared with the third quarter of 2016 and increased 20% (unannualized) compared with the second quarter of 2017. The decrease primarily reflects fewer corporate actions, lost business and lower fees due to a reduction in shares outstanding in certain depositary receipts programs, partially offset by higher Corporate Trust revenue. The increase
compared with the second quarter of 2017 primarily reflects seasonality in Depositary Receipts revenue and higher Corporate Trust revenue.
Treasury services fees increased 3% compared with the third quarter of 2016 and 1% (unannualized) compared with the second quarter of 2017. Both increases primarily reflect higher payment volumes partially offset by higher compensating balance credits provided to clients, which reduces fee revenue and increases net interest revenue.
other fees.
See the “Investment Services business” in “Review of businesses” for additional details.
Investment management and performance fees
Investment management and performance fees increased 5% compared with the third quarter of 2016 and 3% (unannualized)decreased 6% compared with the second quarter of 2017, primarily reflecting higher equity market values2019 and money market fees. The increase9% compared with the thirdfirst quarter of 2016 also reflects higher performance fees.2020. The increasedecrease compared with the second quarter of 2017 also2019 primarily reflects money market fee waivers, the favorable impact of a weaker U.S. dollar. Changes in currency rates had an insignificant impact on the growth rate of investment management and performance fees compared with the third quarter of 2016. Performance fees were $15 millionunfavorable change in the third quartermix of 2017, $8 million in the third quarter of 2016 and $17 million inAUM since the second quarter of 2017.
Total AUM for the Investment Management business increased 6% compared with Sept. 30, 2016 and 3% compared with June 30, 2017. The increase compared with Sept. 30, 2016 primarily reflects higher market values, net inflows2019 and the favorableunfavorable impact of
a weakerstronger U.S. dollar (principally versus the British pound). The decrease compared with the first quarter of 2020 primarily reflects the timing of performance fees and money market fee waivers. On a constant currency basis (Non-GAAP), investment management and performance fees decreased 5% compared with the second quarter of 2019. Performance fees were $5 million in the second quarter of 2020, $2 million in the second quarter of 2019 and $50 million in the first quarter of 2020.
AUM was $2.0 trillion at June 30, 2020, an increase of 6% compared with June 30, 20172019, primarily reflectsreflecting higher market values and net inflows, partially offset by the favorableunfavorable impact of a weakerstronger U.S. dollar (principally versus the British pound), higher market values.
See “Investment and net inflows. Net long-term inflows of fixed income and multi-asset and alternative investments were offset by outflows of index, equity and liability-driven investments in the third quarter of 2017. Net short-term inflows of $10 billion in the third quarter of 2017 were a result of increased distribution through our liquidity portals.
See the “InvestmentWealth Management business” in “Review of businesses” for additional details regarding the drivers of investment management and performance fees.fees, AUM and AUM flows.
Foreign exchange and other trading revenue
| | | Foreign exchange and other trading revenue | Foreign exchange and other trading revenue | | Foreign exchange and other trading revenue |
| (in millions) | 3Q17 |
| 2Q17 |
| 3Q16 |
| YTD17 |
| YTD16 |
| 2Q20 |
| 1Q20 |
| 2Q19 |
| YTD20 |
| YTD19 |
|
| Foreign exchange | $ | 158 |
| $ | 151 |
| $ | 175 |
| $ | 463 |
| $ | 512 |
| $ | 174 |
| $ | 253 |
| $ | 150 |
| $ | 427 |
| $ | 310 |
|
| Other trading revenue | 15 |
| 14 |
| 8 |
| 39 |
| 28 |
| |
| Other trading (loss) revenue | | (8 | ) | 66 |
| 16 |
| 58 |
| 26 |
|
| Total foreign exchange and other trading revenue | $ | 173 |
| $ | 165 |
| $ | 183 |
| $ | 502 |
| $ | 540 |
| $ | 166 |
| $ | 319 |
| $ | 166 |
| $ | 485 |
| $ | 336 |
|
Foreign exchange and other trading revenue decreased 5% compared with the third quarter of 2016 and increased 5% (unannualized)was unchanged compared with the second quarter of 2017.2019 and decreased 48% compared with the first quarter of 2020.
Foreign exchange revenue is primarily driven by the volume of client transactions and the spread realized on these transactions, both of which are impacted by market volatility, and the impact of foreign currency hedging activities. ForeignIn the second quarter of 2020, foreign exchange revenue decreased 10% compared with the third quartertotaled $174 million, an increase of 2016, primarily reflecting lower volatility and lower Depositary Receipt-related foreign exchange activity, partially offset by higher volumes. Foreign exchange revenue increased 5% (unannualized)16% compared with the second quarter of 2017 reflecting2019 and a decrease of 31% compared with the first quarter of 2020. The increase compared with the second quarter of 2019 reflects higher volatility partially offset by the negative impact of foreign currency translation hedging (mostly offset in investment and other income). The decrease compared with the first quarter of 2020 reflects lower volumes. and volatility and the negative impact of
foreign currency translation hedging. Foreign exchange revenue is primarily reported in the Investment Services business and, to a lesser extent, the Investment and Wealth Management business and the Other segment.
Our custody clients may enter into foreign exchange transactionsOther trading losses totaled $8 million in a number of ways, including through our standing instruction programs. While the shift of custody clients from our standing instruction programs to other trading options has abated, our foreign exchange revenue continues to be impacted by changes in volume and volatility. For the quarter ended Sept. 30, 2017, our total revenue for all types of foreign exchange trading transactions was $158 million, or 4% of our total revenue, and approximately 28% of our foreign exchange revenue was generated by transactions in our standing instruction programs.
Financing-related fees
Financing-related fees, which are primarily reported in the Investment Services business and the Other segment, include capital markets fees, loan commitment fees and credit-related fees. Financing-related fees decreased compared with the third quarter of 2016 primarily reflecting lower syndication fees. Financing-related fees increased compared with the second quarter of 2017 primarily reflecting higher underwriting fees.
Distribution and servicing fees
Distribution and servicing fees decreased2020 compared with other trading revenue of $16 million in the thirdsecond quarter of 20162019 and other trading revenue of $66 million in the first quarter of 2020. Both decreases primarily reflecting fees paid to introducing brokers, partially offset by higher money market fees.reflect the impact of Investment Management seed capital hedging activities. Other trading revenue is reported in all three business segments.
Investment and other income
The following table provides the components of investment and other income.
| | | Investment and other income | Investment and other income | | Investment and other income |
| (in millions) | 3Q17 |
| 2Q17 |
| 3Q16 |
| YTD17 |
| YTD16 |
| 2Q20 |
| 1Q20 |
| 2Q19 |
| YTD20 |
| YTD19 |
|
| Corporate/bank-owned life insurance | $ | 37 |
| $ | 43 |
| $ | 34 |
| $ | 110 |
| $ | 96 |
| $ | 36 |
| $ | 36 |
| $ | 32 |
| $ | 72 |
| $ | 62 |
|
| Lease-related gains | — |
| 51 |
| — |
| 52 |
| 44 |
| |
| Expense reimbursements from joint venture | 18 |
| 17 |
| 18 |
| 49 |
| 52 |
| 19 |
| 21 |
| 19 |
| 40 |
| 38 |
|
| Equity investment income (loss) | — |
| 7 |
| (1 | ) | 33 |
| (8 | ) | |
Seed capital gains (a) | 6 |
| 10 |
| 16 |
| 25 |
| 38 |
| |
| Asset-related gains (losses) | 1 |
| (5 | ) | 8 |
| (1 | ) | 9 |
| |
| Asset-related gains | | 3 |
| 4 |
| 1 |
| 7 |
| 2 |
|
Seed capital gains (losses) (a) | | 23 |
| (31 | ) | 8 |
| (8 | ) | 10 |
|
| Other income (loss) | 1 |
| (1 | ) | 17 |
| (6 | ) | 40 |
| 24 |
| (19 | ) | (17 | ) | 5 |
| (34 | ) |
| Total investment and other income | $ | 63 |
| $ | 122 |
| $ | 92 |
| $ | 262 |
| $ | 271 |
| $ | 105 |
| $ | 11 |
| $ | 43 |
| $ | 116 |
| $ | 78 |
|
| |
| (a) | Excludes the gains (losses) on seed capital investments ingains related to consolidated investment management funds, which are reflected in operations of consolidated investment management funds, net of noncontrolling interests. The gains on seed capital investments in consolidated investment management funds were $7 million in the third quarter of 2017, $7 million in the second quarter of 2017, $8 million in the third quarter of 2016, $29 million in the first nine months of 2017 and $15 million in the first nine months of 2016.funds. |
Investment and other income decreasedincreased compared with both the third quarter of 2016 and second quarter of 2017.2019 and first quarter of 2020. Both increases primarily reflect equity investment gains, including seed capital investments, foreign currency translation gains and a one-time fee in the Asset Servicing business. The decreaseincrease compared with the thirdfirst quarter of 2016 primarily reflects lower other income driven by increased pre-tax losses on our investments in renewable energy and lower seed capital gains. The pre-tax losses on the renewable energy investments are2020 was partially offset by corresponding tax benefits and credits recorded as a reduction toone-time fee in the provision for income taxes. The decrease compared with the second quarter of 2017 primarily reflects lease-related gainsPershing business recorded in the secondfirst quarter of 2017 and lower income from corporate/bank-owned life insurance.2020.
Year-to-date 20172020 compared with year-to-date 20162019
Fee and other revenue increased 2%6% compared with the first ninesix months of 2016,2019, primarily reflecting higher investment management and performance fees, clearing services fees and asset servicing fees, partially offset by lower foreign exchange and other trading revenue, net securities gains and issuer services fees. The 5% increase in investment management and performance fees primarily reflects higher market values, money market fees and performance fees, partially offset by the unfavorable impact of a stronger U.S. dollar (principally versus the British pound). The 10% increase in clearing services fees, primarily reflects higher money market fees and growth in long-term mutual fund assets. The 2% increase in asset servicing fees primarily reflects net new business, including growth in collateral management and higher equity market values, partially offset by the unfavorable impact of a stronger U.S. dollarinvestment and the impact of downsizing the retail UK transfer agency business.other income. The 7% decrease44% increase in foreign exchange and other trading revenue primarily reflects lowerhigher volatility and lower Depositary Receipts-related foreign exchange activity.volumes. The 4% decrease12% increase in issuerclearing services fees primarily reflects lower Depositary Receipts revenue.
higher transaction fees and money market balances, partially offset by money market fee waivers. The 3% increase in asset servicing fees primarily reflects higher volumes from existing clients. The increase in
investment and other income revenue primarily reflects one-time fees in the Pershing and Asset Servicing businesses.
Net interest revenue
| | | Net interest revenue | | | | | YTD17 |
| | | | | YTD20 |
|
| | | 3Q17 vs. | | | vs. | | 2Q20 vs. | | | vs. |
| (dollars in millions) | 3Q17 |
| 2Q17 |
| 3Q16 |
| 2Q17 |
| 3Q16 |
| | YTD17 |
| YTD16 |
| YTD16 |
| 2Q20 |
| 1Q20 |
| 2Q19 |
| 1Q20 |
| 2Q19 |
| | YTD20 |
| YTD19 |
| YTD19 |
|
| Net interest revenue | $ | 839 |
| $ | 826 |
| $ | 774 |
| 2 | % | 8 | % | | $ | 2,457 |
| $ | 2,307 |
| 7 | % | |
| Tax equivalent adjustment | 12 |
| 12 |
| 12 |
| N/M | | 36 |
| 39 |
| N/M | |
| Net interest revenue – GAAP | | $ | 780 |
| $ | 814 |
| $ | 802 |
| (4 | )% | (3 | )% | | $ | 1,594 |
| $ | 1,643 |
| (3 | )% |
| Add: Tax equivalent adjustment | | 2 |
| 2 |
| 4 |
| N/M | | 4 |
| 8 |
| N/M |
Net interest revenue (FTE) – Non-GAAP (a) | $ | 851 |
| $ | 838 |
| $ | 786 |
| 2 | % | 8 | % | | $ | 2,493 |
| $ | 2,346 |
| 6 | % | $ | 782 |
| $ | 816 |
| $ | 806 |
| (4 | )% | (3 | )% | | $ | 1,598 |
| $ | 1,651 |
| (3 | )% |
| | | | | | | | | | | |
| Average interest-earning assets | $ | 291,841 |
| $ | 289,496 |
| $ | 296,703 |
| 1 | % | (2 | )% | | $ | 288,283 |
| $ | 308,560 |
| (7 | )% | $ | 357,562 |
| $ | 323,936 |
| $ | 287,417 |
| 10 | % | 24 | % | | $ | 340,749 |
| $ | 284,816 |
| 20 | % |
| | | | | | | | | | | |
| Net interest margin | 1.15 | % | 1.14 | % | 1.05 | % | 1 | bps | 10 | bps | | 1.14 | % | 1.00 | % | 14 | bps | |
| Net interest margin – GAAP | | 0.88 | % | 1.01 | % | 1.12 | % | (13 | ) bps | (24 | ) bps | | 0.94 | % | 1.16 | % | (22 | ) bps |
Net interest margin (FTE) – Non-GAAP (a) | 1.16 | % | 1.16 | % | 1.06 | % | — |
| 10 | bps | | 1.16 | % | 1.02 | % | 14 | bps | 0.88 | % | 1.01 | % | 1.12 | % | (13 | ) bps | (24 | ) bps | | 0.94 | % | 1.16 | % | (22 | ) bps |
| |
| (a) | Net interest revenue (FTE) – Non-GAAP and net interest margin (FTE) – Non-GAAP include the tax equivalent adjustments on tax-exempt income which allows for comparisons of amounts arising from both taxable and tax-exempt sources and is consistent with industry practice. The adjustment to an FTE basis has no impact on net income. |
FTE - fully taxable equivalent.
N/M - Not meaningful.
bps - basis points.
Net interest revenue increased 8% compared with the third quarter of 2016 and 2% (unannualized)decreased 3% compared with the second quarter of 20172019 and 4% compared with the first quarter of 2020. The decrease compared with the second quarter of 2019 primarily reflecting higherreflects lower interest rates on interest-earning assets, partially offset by the benefit of lower averagedeposit and funding rates and higher deposits, securities portfolio and loans. The sequential increase also reflects an additionaldecrease compared with the first quarter of 2020 was primarily driven by lower interest rates on interest-earning day duringassets. This was partially offset by the quarter.benefit of lower deposit and funding rates, higher securities portfolio and the impact of hedging activities (primarily offset in foreign exchange and other trading revenue).
Net interest margin increased 10decreased 24 basis points compared with the thirdsecond quarter of 2016,2019 and 13 basis points compared with the first quarter of 2020. Both decreases primarily reflectingreflect lower asset yields and higher interest-earning assets, partially offset by lower deposit rates.
Average interest-earning assets of $358 billion in the factors listed above.second quarter of 2020 increased 24% compared with the second quarter of 2019 and 10% compared with the first quarter of 2020. Both increases primarily reflect higher interest-bearing deposits with the Federal Reserve and other central banks and securities portfolio.
Average non-U.S. dollar deposits comprised approximately 30%25% of our average total deposits in the thirdsecond quarter of 2017. 2020. Approximately 45%40% of the average non-U.S. dollar deposits in the thirdsecond quarter of 20172020 were euro-denominated.euro denominated.
Year-to-date 2017 compared with year-to-date 2016
Net interest revenue increased 7%in future quarters will depend on the level and mix of client deposits, deposit rates, as well as the level and shape of the yield curve, which may result in lower yields on interest-earning assets.
Year-to-date 2020 compared with year-to-date 2019
Net interest revenue decreased 3% compared with the first ninesix months of 2016,2019, primarily driven by higherlower interest rates on interest-earning assets, partially offset by the benefit of lower deposit and funding rates and higher deposits, securities portfolio and loans. The decrease in net interest margin primarily reflects lower premium amortization,asset yields and higher interest-earning assets, partially offset by lower averagedeposit and funding rates and higher deposits and securities portfolio.
Average interest-earning assets.assets of $341 billion in the first six months of 2020 increased 20% compared with the first six months of 2019. The increase inprimarily reflects higher interest-bearing deposits with the net interest margin was primarily driven by the factors listed above.Federal Reserve and other central banks, securities portfolio and loans.
| | | Average balances and interest rates | Quarter ended | Quarter ended |
| | Sept. 30, 2017 | | June 30, 2017 | | Sept. 30, 2016 | June 30, 2020 | | March 31, 2020 | | June 30, 2019 |
| (dollar amounts in millions, presented on an FTE basis) | Average balance |
| Interest |
| Average rates |
| | Average balance |
| Interest |
| Average rates |
| | Average balance |
| Interest |
| Average rates |
| |
| (dollars in millions; average rates annualized) | | Average balance |
| Interest |
| Average rates |
| | Average balance |
| Interest |
| Average rates |
| | Average balance |
| Interest |
| Average rates |
|
| Assets | | | | | | | | | | | | | | | | |
| Interest-earning assets: | | | | | | | | | | | | | | | | |
| Interest-bearing deposits with the Federal Reserve and other central banks | | $ | 94,229 |
| $ | (7 | ) | (0.03 | )% | | $ | 80,403 |
| $ | 80 |
| 0.39 | % | | $ | 61,756 |
| $ | 113 |
| 0.72 | % |
| Interest-bearing deposits with banks (primarily foreign banks) | $ | 15,899 |
| $ | 34 |
| 0.86 | % | | $ | 14,832 |
| $ | 27 |
| 0.73 | % | | $ | 14,066 |
| $ | 26 |
| 0.74 | % | 21,093 |
| 40 |
| 0.76 |
| | 17,081 |
| 58 |
| 1.37 |
| | 13,666 |
| 64 |
| 1.87 |
|
| Interest-bearing deposits held at the Federal Reserve and other central banks | 70,430 |
| 89 |
| 0.50 |
| | 69,316 |
| 71 |
| 0.41 |
| | 74,102 |
| 37 |
| 0.20 |
| |
Federal funds sold and securities purchased under resale agreements | 28,120 |
| 119 |
| 1.67 |
| | 26,873 |
| 86 |
| 1.29 |
| | 26,376 |
| 62 |
| 0.93 |
| 30,265 |
| 61 |
| 0.82 |
| | 34,109 |
| 396 |
| 4.67 |
| | 38,038 |
| 568 |
| 5.99 |
|
| Margin loans | 13,206 |
| 87 |
| 2.60 |
| | 15,058 |
| 87 |
| 2.32 |
| | 18,132 |
| 67 |
| 1.48 |
| 12,791 |
| 40 |
| 1.28 |
| | 12,984 |
| 87 |
| 2.69 |
| | 10,920 |
| 119 |
| 4.36 |
|
| Non-margin loans: | | | | | | | | | | | | | | | | |
| Domestic offices | 29,950 |
| 216 |
| 2.87 |
| | 30,734 |
| 207 |
| 2.70 |
| | 30,534 |
| 171 |
| 2.22 |
| 31,185 |
| 172 |
| 2.21 |
| | 31,720 |
| 238 |
| 3.02 |
| | 29,492 |
| 284 |
| 3.86 |
|
| Foreign offices | 12,788 |
| 67 |
| 2.09 |
| | 13,001 |
| 65 |
| 1.99 |
| | 12,912 |
| 47 |
| 1.45 |
| 12,743 |
| 58 |
| 1.84 |
| | 11,170 |
| 71 |
| 2.55 |
| | 9,961 |
| 81 |
| 3.29 |
|
| Total non-margin loans | 42,738 |
| 283 |
| 2.64 |
| | 43,735 |
| 272 |
| 2.49 |
| | 43,446 |
| 218 |
| 1.99 |
| 43,928 |
| 230 |
| 2.10 |
| | 42,890 |
| 309 |
| 2.89 |
| | 39,453 |
| 365 |
| 3.71 |
|
| Securities: | | | | | | | | | | | | | | | | |
| U.S. Government obligations | 25,349 |
| 106 |
| 1.67 |
| | 25,928 |
| 106 |
| 1.64 |
| | 25,279 |
| 94 |
| 1.49 |
| |
| U.S. Government agency obligations | 61,710 |
| 309 |
| 2.00 |
| | 59,533 |
| 290 |
| 1.95 |
| | 56,464 |
| 240 |
| 1.70 |
| |
| State and political subdivisions – tax-exempt | 3,226 |
| 25 |
| 3.06 |
| | 3,298 |
| 26 |
| 3.09 |
| | 3,598 |
| 27 |
| 2.98 |
| |
| U.S. government obligations | | 27,901 |
| 105 |
| 1.52 |
| | 23,175 |
| 108 |
| 1.87 |
| | 18,870 |
| 103 |
| 2.19 |
|
| U.S. government agency obligations | | 74,583 |
| 358 |
| 1.92 |
| | 69,046 |
| 400 |
| 2.32 |
| | 66,445 |
| 428 |
| 2.58 |
|
State and political subdivisions (b) | | 1,025 |
| 7 |
| 2.98 |
| | 1,033 |
| 8 |
| 3.06 |
| | 1,735 |
| 13 |
| 2.89 |
|
Other securities | 28,804 |
| 98 |
| 1.34 |
| | 28,468 |
| 81 |
| 1.15 |
| | 33,064 |
| 102 |
| 1.23 |
| 45,511 |
| 93 |
| 0.82 |
| | 36,375 |
| 86 |
| 0.95 |
| | 30,770 |
| 157 |
| 2.04 |
|
Trading securities | 2,359 |
| 13 |
| 2.26 |
| | 2,455 |
| 18 |
| 2.85 |
| | 2,176 |
| 13 |
| 2.62 |
| 6,236 |
| 18 |
| 1.13 |
| | 6,840 |
| 40 |
| 2.36 |
| | 5,764 |
| 39 |
| 2.72 |
|
Total securities | 121,448 |
| 551 |
| 1.81 |
| | 119,682 |
| 521 |
| 1.74 |
| | 120,581 |
| 476 |
| 1.58 |
| 155,256 |
| 581 |
| 1.50 |
| | 136,469 |
| 642 |
| 1.88 |
| | 123,584 |
| 740 |
| 2.40 |
|
Total interest-earning assets (a)(b) | $ | 291,841 |
| $ | 1,163 |
| 1.59 | % | | $ | 289,496 |
| $ | 1,064 |
| 1.47 | % | | $ | 296,703 |
| $ | 886 |
| 1.19 | % | $ | 357,562 |
| $ | 945 |
| 1.06 | % | | $ | 323,936 |
| $ | 1,572 |
| 1.95 | % | | $ | 287,417 |
| $ | 1,969 |
| 2.74 | % |
| Allowance for loan losses | (165 | ) | | | | (164 | ) | | | | (165 | ) | | | |
| Cash and due from banks | 4,961 |
| | | | 4,972 |
| | | | 4,189 |
| | | |
| Other assets | 48,329 |
| | | | 47,303 |
| | | | 49,463 |
| | | |
| Assets of consolidated investment management funds | 743 |
| | | | 908 |
| | | | 1,040 |
| | | |
| Noninterest-earning assets | | 57,797 |
| | | | 61,342 |
| | | | 54,967 |
| | |
| Total assets | $ | 345,709 |
| | | | $ | 342,515 |
| | | | $ | 351,230 |
| | | $ | 415,359 |
| | | | $ | 385,278 |
| | | | $ | 342,384 |
| | |
| Liabilities | | | | | | | | | | | | | | | | |
| Interest-bearing liabilities: | | | | | | | | | | | | | | | | |
| Interest-bearing deposits: | | | | | | | | | | | | | | | | |
| Money market rate accounts | $ | 7,509 |
| $ | 1 |
| 0.06 | % | | $ | 7,379 |
| $ | 1 |
| 0.04 | % | | $ | 7,346 |
| $ | 1 |
| 0.06 | % | |
| Savings | 837 |
| 1 |
| 0.76 |
| | 1,014 |
| 2 |
| 0.75 |
| | 1,201 |
| 1 |
| 0.41 |
| |
| Demand deposits | 5,932 |
| 5 |
| 0.27 |
| | 5,659 |
| 2 |
| 0.14 |
| | 2,681 |
| 3 |
| 0.36 |
| |
| Time deposits | 29,934 |
| 24 |
| 0.32 |
| | 34,757 |
| 15 |
| 0.18 |
| | 45,186 |
| 7 |
| 0.07 |
| |
| Domestic offices | | $ | 102,135 |
| $ | 15 |
| 0.06 | % | | $ | 99,915 |
| $ | 170 |
| 0.69 | % | | $ | 74,180 |
| $ | 251 |
| 1.36 | % |
| Foreign offices | 98,278 |
| 26 |
| 0.10 |
| | 93,527 |
| 12 |
| 0.05 |
| | 98,695 |
| (18 | ) | (0.08 | ) | 108,508 |
| (32 | ) | (0.12 | ) | | 97,717 |
| 70 |
| 0.29 |
| | 93,365 |
| 181 |
| 0.78 |
|
| Total interest-bearing deposits | 142,490 |
| 57 |
| 0.16 |
| | 142,336 |
| 32 |
| 0.09 |
| | 155,109 |
| (6 | ) | (0.02 | ) | 210,643 |
| (17 | ) | (0.03 | ) | | 197,632 |
| 240 |
| 0.49 |
| | 167,545 |
| 432 |
| 1.04 |
|
| Federal funds purchased and securities sold under repurchase agreements | 21,403 |
| 70 |
| 1.30 |
| | 17,970 |
| 38 |
| 0.84 |
| | 9,585 |
| 6 |
| 0.24 |
| |
Federal funds purchased and securities sold under repurchase agreements (a) | | 14,209 |
| 1 |
| 0.03 |
| | 13,919 |
| 275 |
| 7.96 |
| | 11,809 |
| 372 |
| 12.64 |
|
| Trading liabilities | 1,434 |
| 2 |
| 0.54 |
| | 1,216 |
| 2 |
| 0.61 |
| | 735 |
| 2 |
| 1.11 |
| 1,974 |
| 2 |
| 0.39 |
| | 1,626 |
| 7 |
| 1.61 |
| | 1,735 |
| 11 |
| 2.47 |
|
| Other borrowed funds | 2,197 |
| 7 |
| 1.38 |
| | 1,193 |
| 4 |
| 1.24 |
| | 874 |
| 1 |
| 0.76 |
| 2,272 |
| 7 |
| 1.30 |
| | 719 |
| 4 |
| 2.27 |
| | 2,455 |
| 20 |
| 3.36 |
|
| Commercial paper | 2,736 |
| 8 |
| 1.15 |
| | 2,215 |
| 5 |
| 0.95 |
| | 1,173 |
| 1 |
| 0.35 |
| 191 |
| 1 |
| 1.02 |
| | 1,581 |
| 6 |
| 1.56 |
| | 2,957 |
| 18 |
| 2.43 |
|
| Payables to customers and broker-dealers | 18,516 |
| 19 |
| 0.42 |
| | 20,609 |
| 16 |
| 0.30 |
| | 16,873 |
| 3 |
| 0.07 |
| 18,742 |
| (1 | ) | (0.01 | ) | | 16,386 |
| 30 |
| 0.73 |
| | 15,666 |
| 69 |
| 1.76 |
|
| Long-term debt | 28,138 |
| 149 |
| 2.07 |
| | 27,398 |
| 129 |
| 1.87 |
| | 23,930 |
| 93 |
| 1.54 |
| 28,122 |
| 170 |
| 2.42 |
| | 27,231 |
| 194 |
| 2.83 |
| | 27,681 |
| 241 |
| 3.45 |
|
| Total interest-bearing liabilities | $ | 216,914 |
| $ | 312 |
| 0.57 | % | | $ | 212,937 |
| $ | 226 |
| 0.42 | % | | $ | 208,279 |
| $ | 100 |
| 0.19 | % | $ | 276,153 |
| $ | 163 |
| 0.24 | % | | $ | 259,094 |
| $ | 756 |
| 1.17 | % | | $ | 229,848 |
| $ | 1,163 |
| 2.03 | % |
| Total noninterest-bearing deposits | 70,168 |
| | | | 73,886 |
| | | | 81,619 |
| | | 72,411 |
| | | | 60,577 |
| | | | 52,956 |
| | |
| Other liabilities | 17,728 |
| | | | 15,545 |
| | | | 21,343 |
| | | |
| Liabilities and obligations of consolidated investment management funds | 35 |
| | | | 111 |
| | | | 238 |
| | | |
| Other noninterest-bearing liabilities | | 24,121 |
| | | | 24,229 |
| | | | 18,362 |
| | |
| Total liabilities | 304,845 |
| | | | 302,479 |
| | | | 311,479 |
| | | 372,685 |
| | | | 343,900 |
| | | | 301,166 |
| | |
| Temporary equity | | | | | | | | | | | | | | | | |
| Redeemable noncontrolling interests | 188 |
| | | | 172 |
| | | | 179 |
| | | 74 |
| | | | 66 |
| | | | 53 |
| | |
| Permanent equity | | | | | | | | | | | | | | | | |
| Total BNY Mellon shareholders’ equity | 40,322 |
| | | | 39,404 |
| | | | 39,051 |
| | | |
| Total The Bank of New York Mellon Corporation shareholders’ equity | | 42,486 |
| | | | 41,206 |
| | | | 41,029 |
| | |
| Noncontrolling interests | 354 |
| | | | 460 |
| | | | 521 |
| | | 114 |
| | | | 106 |
| | | | 136 |
| | |
| Total permanent equity | 40,676 |
| | | | 39,864 |
| | | | 39,572 |
| | | 42,600 |
| | | | 41,312 |
| | | | 41,165 |
| | |
| Total liabilities, temporary equity and permanent equity | $ | 345,709 |
| | | | $ | 342,515 |
| | | | $ | 351,230 |
| | | $ | 415,359 |
| | | | $ | 385,278 |
| | | | $ | 342,384 |
| | |
| Net interest revenue (FTE) – Non-GAAP | | $ | 851 |
| | | | $ | 838 |
| | | | $ | 786 |
| | |
| Net interest margin (FTE) – Non-GAAP | | 1.16 | % | | | 1.16 | % | | | 1.06 | % | |
Net interest revenue (FTE) – Non-GAAP (c) | | | $ | 782 |
| | | | $ | 816 |
| | | | $ | 806 |
| |
Net interest margin (FTE) – Non-GAAP (b)(c) | | | 0.88 | % | | | 1.01 | % | | | 1.12 | % |
Less: Tax equivalent adjustment (b) | | 12 |
| | | | 12 |
| | | | 12 |
| | | 2 |
| | | | 2 |
| | | | 4 |
| |
| Net interest revenue – GAAP | | $ | 839 |
| | | | $ | 826 |
| | | | $ | 774 |
| | | $ | 780 |
| | | | $ | 814 |
| | | | $ | 802 |
| |
| Net interest margin – GAAP | | 1.15 | % | | | 1.14 | % | | | 1.05 | % | | 0.88 | % | | | 1.01 | % | | | 1.12 | % |
| |
Note: | Interest and average rates were calculated on a taxable equivalent basis using dollar amounts in thousands and actual number of days in the year. |
| |
| (a) | Interest incomeIncludes the average impact of offsetting under enforceable netting agreements of approximately $67 billion for the second quarter of 2020, $80 billion for the first quarter of 2020 and average$51 billion for the second quarter of 2019. On a Non-GAAP basis, excluding the impact of offsetting, the yield are presented on an FTEfederal funds sold and securities purchased under resale agreements would have been 0.26% for the second quarter of 2020, 1.39% for the first quarter of 2020 and 2.57% for the second quarter of 2019. On a Non-GAAP basis, (Non-GAAP).excluding the impact of offsetting, the rate on federal funds purchased and securities sold under repurchase agreements would have been 0.00% for the second quarter of 2020, 1.18% for the first quarter of 2020 and 2.39% for the second quarter of 2019. We believe providing the rates excluding the impact of netting is useful to investors as it is more reflective of the actual rates earned and paid. |
| |
| (b) | Based on the applicable tax rate of 35%. |
|
| | | | | | | | | | | | | | | | | |
| Average balances and interest rates | Year-to-date |
| | Sept. 30, 2017 | | Sept. 30, 2016 |
| (dollar amounts in millions, presented on an FTE basis) | Average balance |
| Interest |
| Average rates |
| | Average balance |
| Interest |
| Average rates |
|
| Assets | | | | | | | |
| Interest-earning assets: | | | | | | | |
| Interest-bearing deposits with banks (primarily foreign banks) | $ | 15,153 |
| $ | 83 |
| 0.73 | % | | $ | 14,455 |
| $ | 76 |
| 0.70 | % |
| Interest-bearing deposits held at the Federal Reserve and other central banks | 68,613 |
| 217 |
| 0.42 |
| | 86,947 |
| 170 |
| 0.26 |
|
| Federal funds sold and securities purchased under resale agreements | 26,779 |
| 272 |
| 1.36 |
| | 25,275 |
| 167 |
| 0.88 |
|
| Margin loans | 14,663 |
| 249 |
| 2.27 |
| | 18,420 |
| 194 |
| 1.41 |
|
| Non-margin loans: | | | | | | | |
| Domestic offices | 30,545 |
| 611 |
| 2.67 |
| | 29,488 |
| 493 |
| 2.23 |
|
| Foreign offices | 13,126 |
| 189 |
| 1.93 |
| | 13,112 |
| 144 |
| 1.47 |
|
| Total non-margin loans | 43,671 |
| 800 |
| 2.45 |
| | 42,600 |
| 637 |
| 2.00 |
|
| Securities: | | | | | | | |
| U.S. Government obligations | 25,835 |
| 316 |
| 1.64 |
| | 24,778 |
| 278 |
| 1.50 |
|
| U.S. Government agency obligations | 59,384 |
| 870 |
| 1.95 |
| | 56,161 |
| 727 |
| 1.73 |
|
| State and political subdivisions – tax-exempt | 3,298 |
| 77 |
| 3.09 |
| | 3,784 |
| 83 |
| 2.92 |
|
| Other securities | 28,531 |
| 267 |
| 1.25 |
| | 33,592 |
| 309 |
| 1.23 |
|
| Trading securities | 2,356 |
| 48 |
| 2.74 |
| | 2,548 |
| 45 |
| 2.37 |
|
| Total securities | 119,404 |
| 1,578 |
| 1.76 |
| | 120,863 |
| 1,442 |
| 1.59 |
|
Total interest-earning assets (a) | $ | 288,283 |
| $ | 3,199 |
| 1.48 | % | | $ | 308,560 |
| $ | 2,686 |
| 1.16 | % |
| Allowance for loan losses | (166 | ) | | | | (162 | ) | | |
| Cash and due from banks | 5,010 |
| | | | 4,070 |
| | |
| Other assets | 47,461 |
| | | | 49,624 |
| | |
| Assets of consolidated investment management funds | 922 |
| | | | 1,198 |
| | |
| Total assets | $ | 341,510 |
| | | | $ | 363,290 |
| | |
| Liabilities | | | | | | | |
| Interest-bearing liabilities: | | | | | | | |
| Interest-bearing deposits: | | | | | | | |
| Money market rate accounts | $ | 7,466 |
| $ | 3 |
| 0.05 | % | | $ | 7,337 |
| $ | 3 |
| 0.06 | % |
| Savings | 980 |
| 5 |
| 0.70 |
| | 1,203 |
| 3 |
| 0.36 |
|
| Demand deposits | 5,656 |
| 8 |
| 0.18 |
| | 1,782 |
| 5 |
| 0.40 |
|
| Time deposits | 33,354 |
| 50 |
| 0.20 |
| | 44,832 |
| 19 |
| 0.06 |
|
| Foreign offices | 94,102 |
| 32 |
| 0.05 |
| | 105,574 |
| (9 | ) | (0.01 | ) |
| Total interest-bearing deposits | 141,558 |
| 98 |
| 0.09 |
| | 160,728 |
| 21 |
| 0.02 |
|
| Federal funds purchased and securities sold under repurchase agreements | 19,465 |
| 132 |
| 0.90 |
| | 15,471 |
| 28 |
| 0.24 |
|
| Trading liabilities | 1,188 |
| 6 |
| 0.65 |
| | 650 |
| 5 |
| 1.05 |
|
| Other borrowed funds | 1,409 |
| 13 |
| 1.26 |
| | 827 |
| 5 |
| 0.90 |
|
| Commercial paper | 2,374 |
| 18 |
| 1.01 |
| | 1,657 |
| 5 |
| 0.37 |
|
| Payables to customers and broker-dealers | 19,360 |
| 42 |
| 0.29 |
| | 16,870 |
| 9 |
| 0.07 |
|
| Long-term debt | 27,148 |
| 397 |
| 1.93 |
| | 22,779 |
| 267 |
| 1.55 |
|
| Total interest-bearing liabilities | $ | 212,502 |
| $ | 706 |
| 0.44 | % | | $ | 218,982 |
| $ | 340 |
| 0.21 | % |
| Total noninterest-bearing deposits | 72,524 |
| | | | 82,861 |
| | |
| Other liabilities | 16,299 |
| | | | 21,993 |
| | |
| Liabilities and obligations of consolidated investment management funds | 129 |
| | | | 250 |
| | |
| Total liabilities | 301,454 |
| | | | 324,086 |
| | |
| Temporary equity | | | | | | | |
| Redeemable noncontrolling interests | 174 |
| | | | 183 |
| | |
| Permanent equity | | | | | | | |
| Total BNY Mellon shareholders’ equity | 39,418 |
| | | | 38,414 |
| | |
| Noncontrolling interests | 464 |
| | | | 607 |
| | |
| Total permanent equity | 39,882 |
| | | | 39,021 |
| | |
| Total liabilities, temporary equity and permanent equity | $ | 341,510 |
| | | | $ | 363,290 |
| | |
| Net interest revenue (FTE) – Non-GAAP | | $ | 2,493 |
| | | | $ | 2,346 |
| |
| Net interest margin (FTE) – Non-GAAP | | | 1.16 | % | | | | 1.02 | % |
Less: Tax equivalent adjustment (b) | | 36 |
| | | | 39 |
| |
| Net interest revenue – GAAP | | $ | 2,457 |
| | | | $ | 2,307 |
| |
| Net interest margin – GAAP | | | 1.14 | % | | | | 1.00 | % |
| |
Note: | Interest and averageAverage rates were calculated on a taxable equivalentan FTE basis, using dollar amounts in thousands and actual numberat tax rates of days in the year.approximately 21%. |
| |
| (c) | See “Net interest revenue” on page 10 for a reconciliation of this Non-GAAP measure. |
|
| | | | | | | | | | | | | | | | | |
| Average balances and interest rates | Year-to-date |
| | June 30, 2020 | | June 30, 2019 |
| (dollars in millions; average rates annualized) | Average balance |
| Interest |
| Average rates |
| | Average balance |
| Interest |
| Average rates |
|
| Assets | | | | | | | |
| Interest-earning assets: | | | | | | | |
| Interest-bearing deposits with the Federal Reserve and other central banks | $ | 87,316 |
| $ | 73 |
| 0.16 | % | | $ | 62,665 |
| $ | 252 |
| 0.80 | % |
| Interest-bearing deposits with banks (primarily foreign banks) | 19,087 |
| 98 |
| 1.03 |
| | 13,761 |
| 127 |
| 1.86 |
|
Federal funds sold and securities purchased under resale agreements (a) | 32,187 |
| 457 |
| 2.86 |
| | 33,528 |
| 1,042 |
| 6.26 |
|
| Margin loans | 12,887 |
| 127 |
| 1.99 |
| | 11,790 |
| 254 |
| 4.35 |
|
| Non-margin loans: | | | | | | | |
| Domestic offices | 31,453 |
| 410 |
| 2.62 |
| | 28,838 |
| 553 |
| 3.85 |
|
| Foreign offices | 11,956 |
| 129 |
| 2.17 |
| | 10,235 |
| 167 |
| 3.30 |
|
| Total non-margin loans | 43,409 |
| 539 |
| 2.49 |
| | 39,073 |
| 720 |
| 3.71 |
|
| Securities: | | | | | | | |
| U.S. government obligations | 25,538 |
| 213 |
| 1.68 |
| | 21,220 |
| 232 |
| 2.21 |
|
| U.S. government agency obligations | 71,815 |
| 758 |
| 2.11 |
| | 65,660 |
| 855 |
| 2.60 |
|
State and political subdivisions (b) | 1,029 |
| 15 |
| 3.02 |
| | 1,969 |
| 28 |
| 2.80 |
|
Other securities (b) | 40,943 |
| 179 |
| 0.88 |
| | 29,715 |
| 308 |
| 2.08 |
|
Trading securities (b) | 6,538 |
| 58 |
| 1.77 |
| | 5,435 |
| 75 |
| 2.81 |
|
Total securities (b) | 145,863 |
| 1,223 |
| 1.68 |
| | 123,999 |
| 1,498 |
| 2.42 |
|
Total interest-earning assets (b) | $ | 340,749 |
| $ | 2,517 |
| 1.48 | % | | $ | 284,816 |
| $ | 3,893 |
| 2.75 | % |
| Noninterest-earning assets | 59,569 |
| | | | 54,476 |
| | |
| Total assets | $ | 400,318 |
| | | | $ | 339,292 |
| | |
| Liabilities | | | | | | | |
| Interest-bearing liabilities: | | | | | | | |
| Interest-bearing deposits: | | | | | | | |
| Domestic offices | $ | 101,025 |
| $ | 185 |
| 0.37 | % | | $ | 72,381 |
| $ | 475 |
| 1.32 | % |
| Foreign offices | 103,113 |
| 38 |
| 0.07 |
| | 91,353 |
| 348 |
| 0.77 |
|
| Total interest-bearing deposits | 204,138 |
| 223 |
| 0.22 |
| | 163,734 |
| 823 |
| 1.01 |
|
Federal funds purchased and securities sold under repurchase agreements (a) | 14,064 |
| 276 |
| 3.95 |
| | 11,865 |
| 703 |
| 11.95 |
|
| Trading liabilities | 1,800 |
| 9 |
| 0.94 |
| | 1,521 |
| 18 |
| 2.37 |
|
| Other borrowed funds | 1,495 |
| 11 |
| 1.53 |
| | 2,878 |
| 44 |
| 3.08 |
|
| Commercial paper | 886 |
| 7 |
| 1.50 |
| | 2,171 |
| 26 |
| 2.43 |
|
| Payables to customers and broker-dealers | 17,564 |
| 29 |
| 0.33 |
| | 15,887 |
| 139 |
| 1.76 |
|
| Long-term debt | 27,677 |
| 364 |
| 2.62 |
| | 27,966 |
| 489 |
| 3.48 |
|
| Total interest-bearing liabilities | $ | 267,624 |
| $ | 919 |
| 0.69 | % | | $ | 226,022 |
| $ | 2,242 |
| 2.00 | % |
| Total noninterest-bearing deposits | 66,494 |
| | | | 53,765 |
| | |
| Other noninterest-bearing liabilities | 24,174 |
| | | | 18,494 |
| | |
| Total liabilities | 358,292 |
| | | | 298,281 |
| | |
| Temporary equity | | | | | | | |
| Redeemable noncontrolling interests | 70 |
| | | | 65 |
| | |
| Permanent equity | | | | | | | |
| Total The Bank of New York Mellon Corporation shareholders’ equity | 41,846 |
| | | | 40,829 |
| | |
| Noncontrolling interests | 110 |
| | | | 117 |
| | |
| Total permanent equity | 41,956 |
| | | | 40,946 |
| | |
| Total liabilities, temporary equity and permanent equity | $ | 400,318 |
| | | | $ | 339,292 |
| | |
Net interest revenue (FTE) – Non-GAAP (c) | | $ | 1,598 |
| | | | $ | 1,651 |
| |
Net interest margin (FTE) – Non-GAAP (b)(c) | | | 0.94 | % | | | | 1.16 | % |
Less: Tax equivalent adjustment (b) | | 4 |
| | | | 8 |
| |
| Net interest revenue – GAAP | | $ | 1,594 |
| | | | $ | 1,643 |
| |
| Net interest margin – GAAP | | | 0.94 | % | | | | 1.16 | % |
| |
| (a) | Interest incomeIncludes the average impact of offsetting under enforceable netting agreements of approximately $73 billion for the first six months of 2020 and average$47 billion for the first six months of 2019. On a Non-GAAP basis, excluding the impact of offsetting, the yield are presented on an FTEfederal funds sold and securities purchased under resale agreements would have been 0.87% for the first six months of 2020 and 2.59% for the first six months of 2019. On a Non-GAAP basis, (Non-GAAP).excluding the impact of offsetting, the rate on federal funds purchased and securities sold under repurchase agreements would have been 0.64% for the first six months of 2020 and 2.39% for the first six months of 2019. We believe providing the rates excluding the impact of netting is useful to investors as it is more reflective of the actual rates earned and paid. |
| |
| (b) | BasedAverage rates were calculated on the applicablean FTE basis, at tax raterates of 35%approximately 21%. |
Noninterest expense
|
| | | | | | | | | | | | | | | | | | | | | | |
| Noninterest expense | | | | | | | | | YTD17 |
|
| | | | | 3Q17 vs. | | | | vs. |
| (dollars in millions) | 3Q17 |
| 2Q17 |
| 3Q16 |
| 2Q17 |
| 3Q16 |
| | YTD17 |
| YTD16 |
| YTD16 |
|
| Staff | $ | 1,469 |
| $ | 1,417 |
| $ | 1,467 |
| 4 | % | — | % | | $ | 4,358 |
| $ | 4,338 |
| — | % |
| Professional, legal and other purchased services | 305 |
| 319 |
| 292 |
| (4 | ) | 4 |
| | 936 |
| 860 |
| 9 |
|
| Software | 175 |
| 173 |
| 156 |
| 1 |
| 12 |
| | 514 |
| 470 |
| 9 |
|
| Net occupancy | 141 |
| 139 |
| 143 |
| 1 |
| (1 | ) | | 416 |
| 437 |
| (5 | ) |
| Distribution and servicing | 109 |
| 104 |
| 105 |
| 5 |
| 4 |
| | 313 |
| 307 |
| 2 |
|
| Sub-custodian | 62 |
| 65 |
| 59 |
| (5 | ) | 5 |
| | 191 |
| 188 |
| 2 |
|
| Furniture and equipment | 58 |
| 59 |
| 59 |
| (2 | ) | (2 | ) | | 174 |
| 187 |
| (7 | ) |
Bank assessment charges (a) | 51 |
| 59 |
| 61 |
| (14 | ) | (16 | ) | | 167 |
| 166 |
| 1 |
|
| Business development | 49 |
| 63 |
| 52 |
| (22 | ) | (6 | ) | | 163 |
| 174 |
| (6 | ) |
Other (a) | 177 |
| 192 |
| 170 |
| (8 | ) | 4 |
| | 536 |
| 546 |
| (2 | ) |
| Amortization of intangible assets | 52 |
| 53 |
| 61 |
| (2 | ) | (15 | ) | | 157 |
| 177 |
| (11 | ) |
| M&I, litigation and restructuring charges | 6 |
| 12 |
| 18 |
| N/M | N/M | | 26 |
| 42 |
| N/M |
| Total noninterest expense – GAAP | $ | 2,654 |
| $ | 2,655 |
| $ | 2,643 |
| — | % | — | % | | $ | 7,951 |
| $ | 7,892 |
| 1 | % |
| | | | | | | | | | |
| Staff expense as a percentage of total revenue | 37 | % | 36 | % | 37 | % | | | | 37 | % | 38 | % | |
| | | | | | | | | | |
| Full-time employees at period end | 52,900 |
| 52,800 |
| 52,300 |
| — | % | 1 | % | | 52,900 |
| 52,300 |
| 1 | % |
| | | | | | | | | | |
| Memo: | | | | | | | | | |
| Adjusted total noninterest expense excluding amortization of intangible assets and M&I, litigation and restructuring charges – Non-GAAP | $ | 2,596 |
| $ | 2,590 |
| $ | 2,564 |
| — | % | 1 | % | | $ | 7,768 |
| $ | 7,673 |
| 1 | % |
| |
(a)(c) | In the first quarterSee “Net interest revenue” on page 10 for a reconciliation of 2017, we began disclosing bank assessment charges on a quarterly basis. The bank assessment charges were previously included in other expense. All prior periods were reclassified.this Non-GAAP measure. |
N/M - Not meaningful.
Noninterest expense
|
| | | | | | | | | | | | | | | | | | | | | | |
| Noninterest expense | | | | | | | | | YTD20 |
|
| | | | | 2Q20 vs. | | | | vs. |
|
| (dollars in millions) | 2Q20 |
| 1Q20 |
| 2Q19 |
| 1Q20 |
| 2Q19 |
| | YTD20 |
| YTD19 |
| YTD19 |
|
| Staff | $ | 1,464 |
| $ | 1,482 |
| $ | 1,421 |
| (1 | )% | 3 | % | | $ | 2,946 |
| $ | 2,945 |
| — | % |
| Software and equipment | 345 |
| 326 |
| 304 |
| 6 |
| 13 |
| | 671 |
| 587 |
| 14 |
|
| Professional, legal and other purchased services | 337 |
| 330 |
| 337 |
| 2 |
| — |
| | 667 |
| 662 |
| 1 |
|
| Net occupancy | 137 |
| 135 |
| 138 |
| 1 |
| (1 | ) | | 272 |
| 275 |
| (1 | ) |
| Sub-custodian and clearing | 120 |
| 105 |
| 115 |
| 14 |
| 4 |
| | 225 |
| 220 |
| 2 |
|
| Distribution and servicing | 85 |
| 91 |
| 94 |
| (7 | ) | (10 | ) | | 176 |
| 185 |
| (5 | ) |
| Bank assessment charges | 35 |
| 35 |
| 31 |
| — |
| 13 |
| | 70 |
| 62 |
| 13 |
|
| Business development | 20 |
| 42 |
| 56 |
| (52 | ) | (64 | ) | | 62 |
| 101 |
| (39 | ) |
| Amortization of intangible assets | 26 |
| 26 |
| 30 |
| — |
| (13 | ) | | 52 |
| 59 |
| (12 | ) |
| Other | 117 |
| 140 |
| 121 |
| (16 | ) | (3 | ) | | 257 |
| 250 |
| 3 |
|
| Total noninterest expense | $ | 2,686 |
| $ | 2,712 |
| $ | 2,647 |
| (1 | )% | 1 | % | | $ | 5,398 |
| $ | 5,346 |
| 1 | % |
| | | | | |
| | | |
|
|
| Full-time employees at period end | 48,300 |
| 47,900 |
| 49,100 |
| 1 | % | (2 | )% | | | |
|
|
Total noninterest expense increased less than 1% compared with the third quarter of 2016 and decreased slightly compared with the second quarter of 2017.2019 and decreased 1% compared with the first quarter of 2020. The increase compared with the second quarter of 2019 primarily reflects the continued investments in technology and higher staff and pension expenses, partially offset by lower business development (travel and marketing) expense and the favorable impact of a stronger U.S. dollar. The investments in technology are included in staff, software and equipment, and professional, legal and other purchased services expenses, partially offset by lower litigation expense and bank assessment charges.expenses. The decrease compared with the first quarter of 2020 primarily reflects lower other professional, legal and other purchased services and business development (travel and marketing) expenses as well as lower bank assessment charges,and the favorable impact of a stronger U.S. dollar, partially offset by higher staff expense. Excluding amortization of intangible assetssoftware and M&I, litigationequipment and restructuring charges, total noninterest expense, as adjusted (Non-GAAP), increased 1% compared with the third quarter of 2016sub-custodian and less than 1% (unannualized) compared with the second quarter of 2017.clearing expenses.
We continueOur investments in technology infrastructure and platforms are expected to invest in our risk management, regulatory compliance and other control functions to improve our safety and soundness and in light of increased global regulatory requirements.continue. As a result, we expect to incur higher technology-related expenses in 2020 than in 2019 and higher pension expense as a result of the submissiona lower expected rate of our 2017 resolutionreturn on plan assets. These increases are expected to be offset by decreases in other expenses as we begancontinue to experience a modest decrease in the expenses relating to these functions in the third quarter of 2017.manage overall expenses.
Staff expense
Given our mix of fee-based businesses, which are staffed with high-quality professionals, staff expense comprised 55% of total noninterest expense in the third quarter of 2017, 56% in the third quarter of 2016 and 53%in the second quarter of 2017.
Staff expense increased slightly compared with the third quarter of 2016 as the annual employee merit increase was offset by lower severance. Staff expense increased 4% (unannualized) compared with the second quarter of 2017, primarily due to higher incentives expense reflecting stronger performance and the annual employee merit increase.
Non-staff expense
Non-staff expense includes certain expenses that vary with the levels of business activity and levels of expensed business investments, fixed infrastructure costs and expenses associated with corporate activities related to technology, compliance, legal, productivity initiatives and business development.
Non-staff expense totaled $1.2 billion, an increase of 1% compared with the third quarter of 2016 and a decrease of 4% (unannualized) compared with the second quarter of 2017. The increase primarily reflects higher software and professional, legal and other purchased services expenses, partially offset by lower litigation expense and bank assessment charges. The decrease primarily reflects lower other, professional, legal and other purchases services and business development expenses as well as lower bank assessment charges. The decrease in professional, legal and other purchased services was driven by lower consulting expense related to resolution planning.
Year-to-date 20172020 compared with year-to-date 20162019
Noninterest expense increased 1% compared with the first ninesix months of 2016,2019, primarily reflecting the continued investments in technology and higher consultingsoftware and softwareequipment, staff and pension expenses, partially offset by the favorable impact of a stronger U.S. dollar and lower net occupancy. The increase in consulting expense primarily reflects higher regulatorybusiness development (travel and compliance costs. Net occupancy expense decreased as we continue to benefit from the savings generated by the business improvement process.marketing) expense.
Income taxes
BNY Mellon recorded an income tax provision of $348$216 million (25.4% (18.3% effective tax rate) in the thirdsecond quarter of 2017. The income tax provision was $3242020, $264 million (24.6% (20.5% effective tax rate) in the thirdsecond quarter of 20162019 and $332$265 million (25.4% (21.6% effective tax rate) in the secondfirst quarter of 2017.2020. For additional information, see Note 1011 of the Notes to Consolidated Financial Statements.
We expect the effective tax rate to be approximately 25-26% in 2017 based on current income tax rates. Based on our expected revenue growth as well as the mix of earnings we project for next year, we expect our effective tax rate may rise approximately 100 basis points in 2018.
Any legislation affecting income tax rates could have an impact on our future effective tax rate, the significance of which would depend on the timing, nature and scope of any such legislation, as well as the level and composition of our earnings.
Review of businesses
We have an internal information system that produces performance data along product and service lines for our two principal businesses, Investment Services and Investment and Wealth Management (formerly Investment Management), and the Other segment.
Business accounting principles
Our business data has been determined on an internal management basis of accounting, rather than the generally accepted accounting principles used for consolidated financial reporting. These measurement principles are designed so that reported results of the businesses will track their economic performance.
For information on the accounting principles of our businesses, see Note 19 of the Notes to Consolidated Financial Statements. For information on the primary products and services in each line of business, the primary types of revenue by business and how our businesses are presented and analyzed, see Note 1824 of the Notes to Consolidated Financial Statements.Statements in our 2019 Annual Report.
Business results are subject to reclassification when organizational changes are made or when improvements are mademade. There were no significant organizational changes in the measurement principles.second quarter of 2020. The results are also subject to refinements in revenue and expense allocation methodologies, which are typically reflected on a prospective basis.
In the first quarter of 2020, we reclassified the results of certain services provided between the segments from noninterest expense to fee and other revenue. This activity is offset in the Other segment and relates to services that are also provided to third parties and provides consistency with the reporting of the revenues. This adjustment had no impact on income before taxes of the businesses. Also in the first quarter of 2020, we reclassified the results related to certain lending activities from the Wealth Management business to the Pershing business. These loans were originated by the Wealth Management business as a service to Pershing clients. This resulted in an increase in total revenue, noninterest expense and income before taxes in the Pershing business and corresponding decrease in the Wealth Management business. Prior periods were restated in the first quarter of 2020 for both reclassifications.
The results of our businesses may be influenced by client and other activities that vary by quarter. In the first quarter, incentivesstaff expense typically increases reflecting the vesting of long-term stock awards for retirement-eligible employees. In the third quarter, Depositary Receipts revenue is typically higher due to an increased level of client dividend payments. Also in the third quarter, volume-related fees may decline due to reduced client activity. In the third quarter, staff expense typically increases reflecting the annual employee merit increase. In the fourth quarter, we typically incur higher business development and marketing expenses.expenses; however, 2020 is expected to be different given the impact of the coronavirus pandemic. In our Investment and Wealth Management business, performance fees are typically higher in the fourth quarter,and first quarters, as the fourth quarter representsthose quarters represent the end of the measurement period for many of the performance fee-eligible relationships.
The results of our businesses may also be impacted by the translation of financial results denominated in foreign currencies to the U.S. dollar. We are primarily impacted by activities denominated in the British pound and the euro. On a consolidated basis and in our Investment Services business, we typically have more foreign currency denominatedcurrency-denominated expenses than revenues. However, our Investment
and Wealth Management business typically has more foreign currency denominatedcurrency-denominated revenues than expenses. Overall, currency fluctuations impact the year-over-year growth rate in the Investment and Wealth Management
business more than the Investment Services business. However, currency fluctuations, in isolation, are not expected to significantly impact net income on a consolidated basis.
The following table presents key market metrics at period end and on an average basis.
|
| | | | | | | | | | | | | | | | | | | | | | | | | | | | |
| Key market metrics | | | | | | | | | | | YTD17 |
|
| | | | | | | 3Q17 vs. | | | | vs. |
| | 3Q17 |
| 2Q17 |
| 1Q17 |
| 4Q16 |
| 3Q16 |
| 2Q17 |
| 3Q16 |
| | YTD17 |
| YTD16 |
| YTD16 |
|
Standard & Poor’s (“S&P”) 500 Index (a) | 2519 |
| 2423 |
| 2363 |
| 2239 |
| 2168 |
| 4 | % | 16 | % | | 2519 |
| 2168 |
| 16 | % |
| S&P 500 Index – daily average | 2467 |
| 2398 |
| 2326 |
| 2185 |
| 2162 |
| 3 |
| 14 |
| | 2397 |
| 2065 |
| 16 |
|
FTSE 100 Index (a) | 7373 |
| 7313 |
| 7323 |
| 7143 |
| 6899 |
| 1 |
| 7 |
| | 7373 |
| 6899 |
| 7 |
|
| FTSE 100 Index – daily average | 7380 |
| 7391 |
| 7274 |
| 6923 |
| 6765 |
| — |
| 9 |
| | 7348 |
| 6326 |
| 16 |
|
MSCI EAFE (a) | 1974 |
| 1883 |
| 1793 |
| 1684 |
| 1702 |
| 5 |
| 16 |
| | 1974 |
| 1702 |
| 16 |
|
| MSCI EAFE – daily average | 1934 |
| 1856 |
| 1749 |
| 1660 |
| 1677 |
| 4 |
| 15 |
| | 1847 |
| 1640 |
| 13 |
|
Barclays Capital Global Aggregate BondSM Index (a)(b) | 480 |
| 471 |
| 459 |
| 451 |
| 486 |
| 2 |
| (1 | ) | | 480 |
| 486 |
| (1 | ) |
NYSE and NASDAQ share volume (in billions) | 179 |
| 199 |
| 186 |
| 189 |
| 186 |
| (10 | ) | (4 | ) | | 565 |
| 608 |
| (7 | ) |
JPMorgan G7 Volatility Index – daily average (c) | 8.17 |
| 7.98 |
| 10.10 |
| 10.24 |
| 10.19 |
| 2 |
| (20 | ) | | 8.75 |
| 10.63 |
| (18 | ) |
| Average interest on excess reserves paid by the Federal Reserve | 1.25 | % | 1.04 | % | 0.79 | % | 0.55 | % | 0.50 | % | 21 | bps | 75 | bps | | 1.03 | % | 0.50 | % | 53 | bps |
| | | | | | | | | | | | |
| Foreign exchange rates vs. U.S. dollar: | | | | | |
| | | | | |
British pound (a) | $ | 1.34 |
| $ | 1.30 |
| $ | 1.25 |
| $ | 1.23 |
| $ | 1.30 |
| 3 | % | 3 | % | | $ | 1.34 |
| $ | 1.30 |
| 3 | % |
| British pound – average rate | 1.31 |
| 1.28 |
| 1.24 |
| 1.24 |
| 1.31 |
| 2 |
| — |
| | 1.28 |
| 1.39 |
| (8 | ) |
Euro (a) | 1.18 |
| 1.14 |
| 1.07 |
| 1.05 |
| 1.12 |
| 4 |
| 5 |
| | 1.18 |
| 1.12 |
| 5 |
|
| Euro – average rate | 1.17 |
| 1.10 |
| 1.07 |
| 1.08 |
| 1.12 |
| 6 |
| 4 |
| | 1.13 |
| 1.12 |
| 1 |
|
| |
(b) | Unhedged in U.S. dollar terms. |
| |
(c) | The JPMorgan G7 Volatility Index is based on the implied volatility in 3-month currency options. |
bps - basis points.
Fee revenue in Investment and Wealth Management, and to a lesser extent in Investment Services, is impacted by the value of market indices. At Sept.June 30, 2017,2020, we estimate that a 5% change in global equity markets, spread evenly throughout the year, would impact fee revenue by less than 1% and diluted earnings per common share by $0.02$0.03 to $0.04.
$0.06.
See Note 1819 of the Notes to Consolidated Financial Statements for the consolidating schedules which show the contribution of our businesses to our overall profitability.
Investment ManagementServices business
|
| | | | | | | | | | | | | | | | | | | | | | | | | | | | |
| | | | | | | | | | | | YTD17 |
|
| | | | | | | 3Q17 vs. | | | | vs. |
| (dollars in millions) | 3Q17 |
| 2Q17 |
| 1Q17 |
| 4Q16 |
| 3Q16 |
| 2Q17 |
| 3Q16 |
| | YTD17 |
| YTD16 |
| YTD16 |
|
| Revenue: | | | | | | | | | | | |
| Investment management fees: | | | | | | | | | | | |
| Mutual funds | $ | 332 |
| $ | 314 |
| $ | 299 |
| $ | 297 |
| $ | 309 |
| 6 | % | 7 | % | | $ | 945 |
| $ | 913 |
| 4 | % |
| Institutional clients | 367 |
| 362 |
| 348 |
| 340 |
| 362 |
| 1 |
| 1 |
| | 1,077 |
| 1,040 |
| 4 |
|
| Wealth management | 172 |
| 169 |
| 167 |
| 164 |
| 166 |
| 2 |
| 4 |
| | 508 |
| 478 |
| 6 |
|
Investment management fees (a) | 871 |
| 845 |
| 814 |
| 801 |
| 837 |
| 3 |
| 4 |
| | 2,530 |
| 2,431 |
| 4 |
|
| Performance fees | 15 |
| 17 |
| 12 |
| 32 |
| 8 |
| N/M |
| 88 |
| | 44 |
| 28 |
| 57 |
|
| Investment management and performance fees | 886 |
| 862 |
| 826 |
| 833 |
| 845 |
| 3 |
| 5 |
| | 2,574 |
| 2,459 |
| 5 |
|
| Distribution and servicing | 51 |
| 53 |
| 52 |
| 48 |
| 49 |
| (4 | ) | 4 |
| | 156 |
| 144 |
| 8 |
|
Other (a) | (19 | ) | (16 | ) | (1 | ) | (1 | ) | (18 | ) | N/M |
| N/M |
| | (36 | ) | (59 | ) | N/M |
|
Total fee and other revenue (a) | 918 |
| 899 |
| 877 |
| 880 |
| 876 |
| 2 |
| 5 |
| | 2,694 |
| 2,544 |
| 6 |
|
| Net interest revenue | 82 |
| 87 |
| 86 |
| 80 |
| 82 |
| (6 | ) | — |
| | 255 |
| 247 |
| 3 |
|
| Total revenue | 1,000 |
| 986 |
| 963 |
| 960 |
| 958 |
| 1 |
| 4 |
| | 2,949 |
| 2,791 |
| 6 |
|
| Provision for credit losses | (2 | ) | — |
| 3 |
| 6 |
| — |
| N/M |
| N/M |
| | 1 |
| — |
| N/M |
|
| Noninterest expense (ex. amortization of intangible assets) | 687 |
| 683 |
| 668 |
| 672 |
| 680 |
| 1 |
| 1 |
| | 2,038 |
| 2,024 |
| 1 |
|
| Amortization of intangible assets | 15 |
| 15 |
| 15 |
| 22 |
| 22 |
| — |
| (32 | ) | | 45 |
| 60 |
| (25 | ) |
| Total noninterest expense | 702 |
| 698 |
| 683 |
| 694 |
| 702 |
| 1 |
| — |
| | 2,083 |
| 2,084 |
| — |
|
| Income before taxes | $ | 300 |
| $ | 288 |
| $ | 277 |
| $ | 260 |
| $ | 256 |
| 4 | % | 17 | % | | $ | 865 |
| $ | 707 |
| 22 | % |
Income before taxes (ex. amortization of intangible assets) – Non-GAAP | $ | 315 |
| $ | 303 |
| $ | 292 |
| $ | 282 |
| $ | 278 |
| 4 | % | 13 | % | | $ | 910 |
| $ | 767 |
| 19 | % |
| | | | | | | | | | | | |
| Pre-tax operating margin | 30 | % | 29 | % | 29 | % | 27 | % | 27 | % | | | | 29 | % | 25 | % | |
Adjusted pre-tax operating margin – Non-GAAP (b) | 35 | % | 34 | % | 34 | % | 33 | % | 33 | % | | | | 35 | % | 31 | % | |
| | | | | | | | | | | | |
| Average balances: | | | | | | | | | | | |
| Average loans | $ | 16,724 |
| $ | 16,560 |
| $ | 16,153 |
| $ | 15,673 |
| $ | 15,308 |
| 1 | % | 9 | % | | $ | 16,481 |
| $ | 14,795 |
| 11 | % |
| Average deposits | $ | 12,374 |
| $ | 14,866 |
| $ | 15,781 |
| $ | 15,511 |
| $ | 15,600 |
| (17 | )% | (21 | )% | | $ | 14,283 |
| $ | 15,696 |
| (9 | )% |
|
| | | | | | | | | | | | | | | | | | | | | | | | | | | | |
| | | | | | | | | | | | YTD20 |
|
| (dollars in millions) | | | | | | 2Q20 vs. | | | | vs. |
| 2Q20 |
| 1Q20 |
| 4Q19 |
| 3Q19 |
| 2Q19 |
| 1Q20 |
| 2Q19 |
| | YTD20 |
| YTD19 |
| YTD19 |
|
| Revenue: | | | | | | | | | | | |
| Investment services fees: | | | | | | | | | | | |
Asset servicing fees (a) | $ | 1,164 |
| $ | 1,147 |
| $ | 1,138 |
| $ | 1,138 |
| $ | 1,126 |
| 1 | % | 3 | % | | $ | 2,311 |
| $ | 2,237 |
| 3 | % |
Clearing services fees (b) | 431 |
| 470 |
| 421 |
| 419 |
| 411 |
| (8 | ) | 5 |
| | 901 |
| 809 |
| 11 |
|
| Issuer services fees | 277 |
| 263 |
| 264 |
| 324 |
| 291 |
| 5 |
| (5 | ) | | 540 |
| 542 |
| — |
|
| Treasury services fees | 144 |
| 149 |
| 147 |
| 139 |
| 140 |
| (3 | ) | 3 |
| | 293 |
| 272 |
| 8 |
|
| Total investment services fees | 2,016 |
| 2,029 |
| 1,970 |
| 2,020 |
| 1,968 |
| (1 | ) | 2 |
| | 4,045 |
| 3,860 |
| 5 |
|
| Foreign exchange and other trading revenue | 178 |
| 261 |
| 151 |
| 160 |
| 153 |
| (32 | ) | 16 |
| | 439 |
| 310 |
| 42 |
|
Other (c) | 145 |
| 146 |
| 115 |
| 116 |
| 112 |
| (1 | ) | 29 |
| | 291 |
| 224 |
| 30 |
|
| Total fee and other revenue | 2,339 |
| 2,436 |
| 2,236 |
| 2,296 |
| 2,233 |
| (4 | ) | 5 |
| | 4,775 |
| 4,394 |
| 9 |
|
| Net interest revenue | 768 |
| 806 |
| 778 |
| 761 |
| 783 |
| (5 | ) | (2 | ) | | 1,574 |
| 1,587 |
| (1 | ) |
| Total revenue | 3,107 |
| 3,242 |
| 3,014 |
| 3,057 |
| 3,016 |
| (4 | ) | 3 |
| | 6,349 |
| 5,981 |
| 6 |
|
| Provision for credit losses | 145 |
| 149 |
| (5 | ) | (15 | ) | (4 | ) | N/M | N/M | | 294 |
| 4 |
| N/M |
| Noninterest expense (excluding amortization of intangible assets) | 1,971 |
| 1,969 |
| 2,160 |
| 1,952 |
| 1,943 |
| — |
| 1 |
| | 3,940 |
| 3,904 |
| 1 |
|
| Amortization of intangible assets | 18 |
| 18 |
| 19 |
| 21 |
| 20 |
| — |
| (10 | ) | | 36 |
| 40 |
| (10 | ) |
| Total noninterest expense | 1,989 |
| 1,987 |
| 2,179 |
| 1,973 |
| 1,963 |
| — |
| 1 |
| | 3,976 |
| 3,944 |
| 1 |
|
| Income before income taxes | $ | 973 |
| $ | 1,106 |
| $ | 840 |
| $ | 1,099 |
| $ | 1,057 |
| (12 | )% | (8 | )% | | $ | 2,079 |
| $ | 2,033 |
| 2 | % |
| | | | | | |
| | | | |
|
| Pre-tax operating margin | 31 | % | 34 | % | 28 | % | 36 | % | 35 | % |
|
| | | 33 | % | 34 | % |
|
|
| | | | | | |
|
| | | | |
|
|
| Securities lending revenue | $ | 51 |
| $ | 46 |
| $ | 40 |
| $ | 39 |
| $ | 40 |
| 11 | % | 28 | % | | $ | 97 |
| $ | 84 |
| 15 | % |
| | | | | | |
|
|
|
| | | |
|
|
Total revenue by line of business: | | | | | |
|
|
|
| | | |
|
|
| Asset Servicing | $ | 1,463 |
| $ | 1,531 |
| $ | 1,411 |
| $ | 1,411 |
| $ | 1,397 |
| (4 | )% | 5 | % | | $ | 2,994 |
| $ | 2,812 |
| 6 | % |
| Pershing | 578 |
| 653 |
| 579 |
| 575 |
| 572 |
| (11 | ) | 1 |
| | 1,231 |
| 1,133 |
| 9 |
|
| Issuer Services | 431 |
| 419 |
| 415 |
| 466 |
| 446 |
| 3 |
| (3 | ) | | 850 |
| 842 |
| 1 |
|
| Treasury Services | 340 |
| 339 |
| 329 |
| 312 |
| 317 |
| — |
| 7 |
| | 679 |
| 634 |
| 7 |
|
| Clearance and Collateral Management | 295 |
| 300 |
| 280 |
| 293 |
| 284 |
| (2 | ) | 4 |
| | 595 |
| 560 |
| 6 |
|
| Total revenue by line of business | $ | 3,107 |
| $ | 3,242 |
| $ | 3,014 |
| $ | 3,057 |
| $ | 3,016 |
| (4 | )% | 3 | % | | $ | 6,349 |
| $ | 5,981 |
| 6 | % |
| | | | | | | | | | | |
|
Average balances: | | | | | |
| | | | |
|
| Average loans | $ | 43,113 |
| $ | 41,789 |
| $ | 38,721 |
| $ | 37,005 |
| $ | 36,404 |
| 3 | % | 18 | % | | $ | 42,451 |
| $ | 36,818 |
| 15 | % |
| Average deposits | $ | 268,467 |
| $ | 242,187 |
| $ | 215,388 |
| $ | 208,044 |
| $ | 201,146 |
| 11 | % | 33 | % | | $ | 255,327 |
| $ | 198,131 |
| 29 | % |
| |
| (a) | Total feeAsset servicing fees include the fees from the Clearance and other revenue includes the impact of the consolidated investment management funds, net of noncontrolling interests. See page 52 for a breakdown of the revenue line items in the InvestmentCollateral Management business impacted by the consolidated investment management funds. Additionally, other revenue includes asset servicing, treasury services, foreign exchange and other trading revenue and investment and other income.business.
|
| |
| (b) | Excludes amortization of intangible assets, provision for credit lossesClearing services fees are almost entirely earned by our Pershing business.
|
| |
| (c) | Other revenue includes investment management and performance fees, financing-related fees, distribution and servicing expense. See “Supplemental information – Explanation of GAAPrevenue, securities gains and Non-GAAP financial measures” beginning on page 49 for the reconciliation of this Non-GAAP measure.losses and investment and other income. |
N/M - Not meaningful.
|
| | | | | | | | | | | | | | | | | | | |
AUM trends (a) | | | | | | 3Q17 vs. |
| (dollars in billions) | 3Q17 |
| 2Q17 |
| 1Q17 |
| 4Q16 |
| 3Q16 |
| 2Q17 |
| 3Q16 |
|
| AUM at period end, by product type: | | | | | | | |
| Equity | $ | 158 |
| $ | 163 |
| $ | 158 |
| $ | 153 |
| $ | 156 |
| (3 | )% | 1 | % |
| Fixed income | 206 |
| 198 |
| 191 |
| 186 |
| 194 |
| 4 |
| 6 |
|
| Index | 333 |
| 324 |
| 330 |
| 312 |
| 302 |
| 3 |
| 10 |
|
Liability-driven investments (b) | 622 |
| 607 |
| 584 |
| 554 |
| 607 |
| 2 |
| 2 |
|
| Multi-asset and alternative investments | 207 |
| 192 |
| 188 |
| 181 |
| 189 |
| 8 |
| 10 |
|
| Cash | 298 |
| 287 |
| 276 |
| 262 |
| 267 |
| 4 |
| 12 |
|
| Total AUM | $ | 1,824 |
| $ | 1,771 |
| $ | 1,727 |
| $ | 1,648 |
| $ | 1,715 |
| 3 | % | 6 | % |
| | | | | | | | |
| AUM at period end, by client type: | | | | | | | |
| Institutional | $ | 1,285 |
| $ | 1,265 |
| $ | 1,243 |
| $ | 1,182 |
| $ | 1,234 |
| 2 | % | 4 | % |
| Mutual funds | 447 |
| 418 |
| 397 |
| 381 |
| 396 |
| 7 |
| 13 |
|
| Private client | 92 |
| 88 |
| 87 |
| 85 |
| 85 |
| 5 |
| 8 |
|
| Total AUM | $ | 1,824 |
| $ | 1,771 |
| $ | 1,727 |
| $ | 1,648 |
| $ | 1,715 |
| 3 | % | 6 | % |
| | | | | | | | |
| Changes in AUM: | | | | | | | |
| Beginning balance of AUM | $ | 1,771 |
| $ | 1,727 |
| $ | 1,648 |
| $ | 1,715 |
| $ | 1,664 |
| | |
| Net inflows (outflows): | | | | | | | |
| Long-term strategies: | | | | | | | |
| Equity | (2 | ) | (2 | ) | (4 | ) | (5 | ) | (6 | ) | | |
| Fixed income | 4 |
| 2 |
| 2 |
| (1 | ) | (1 | ) | | |
Liability-driven investments (b) | (2 | ) | 15 |
| 14 |
| (7 | ) | 4 |
| | |
| Multi-asset and alternative investments | 3 |
| 1 |
| 2 |
| 3 |
| 7 |
| | |
| Total long-term active strategies inflows (outflows) | 3 |
| 16 |
| 14 |
| (10 | ) | 4 |
| | |
| Index | (3 | ) | (13 | ) | — |
| (1 | ) | (3 | ) | | |
| Total long-term strategies inflows (outflows) | — |
| 3 |
| 14 |
| (11 | ) | 1 |
| | |
| Short term strategies: | | | | | | | |
| Cash | 10 |
| 11 |
| 13 |
| (3 | ) | (1 | ) | | |
| Total net inflows (outflows) | 10 |
| 14 |
| 27 |
| (14 | ) | — |
| | |
| Net market impact/other | 17 |
| 1 |
| 41 |
| (11 | ) | 80 |
| | |
| Net currency impact | 26 |
| 29 |
| 11 |
| (42 | ) | (29 | ) | | |
| Ending balance of AUM | $ | 1,824 |
| $ | 1,771 |
| $ | 1,727 |
| $ | 1,648 |
| $ | 1,715 |
| 3 | % | 6 | % |
|
| | | | | | | | | | | | | | | | | | | |
| Investment Services business metrics | | | | | | | |
| (dollars in millions, unless otherwise noted) | | | | | | 2Q20 vs. |
| 2Q20 |
| 1Q20 |
| 4Q19 |
| 3Q19 |
| 2Q19 |
| 1Q20 |
| 2Q19 |
|
AUC/A at period end (in trillions) (a) | $ | 37.3 |
| $ | 35.2 |
| $ | 37.1 |
| $ | 35.8 |
| $ | 35.5 |
| 6 | % | 5 | % |
Market value of securities on loan at period end (in billions) (b) | $ | 384 |
| $ | 389 |
| $ | 378 |
| $ | 362 |
| $ | 369 |
| (1 | )% | 4 | % |
| | | | | | | | |
Pershing: | | | | | | | |
Net new assets (U.S. platform) (in billions) (c) | $ | 11 |
| $ | 31 |
| $ | 33 |
| $ | 19 |
| $ | 21 |
| N/M | N/M |
Average active clearing accounts (U.S. platform) (in thousands) | 6,507 |
| 6,437 |
| 6,340 |
| 6,283 |
| 6,254 |
| 1 | % | 4 | % |
| Average long-term mutual fund assets (U.S. platform) | $ | 547,579 |
| $ | 549,206 |
| $ | 573,475 |
| $ | 547,522 |
| $ | 532,384 |
| — | % | 3 | % |
| Average investor margin loans (U.S. platform) | $ | 9,235 |
| $ | 9,419 |
| $ | 9,420 |
| $ | 9,222 |
| $ | 9,440 |
| (2 | )% | (2 | )% |
| | | | | | | | |
Clearance and Collateral Management: | | | | | | | |
Average tri-party collateral management balances (in billions) | $ | 3,573 |
| $ | 3,724 |
| $ | 3,562 |
| $ | 3,550 |
| $ | 3,400 |
| (4 | )% | 5 | % |
| |
| (a) | Excludes securities lending cash management assetsConsists of AUC/A primarily from the Asset Servicing business and, assets managed into a lesser extent, the InvestmentClearance and Collateral Management, Issuer Services business.and Pershing businesses. Includes the AUC/A of CIBC Mellon of $1.3 trillion at June 30, 2020, $1.2 trillion at March 31, 2020, $1.5 trillion at Dec. 31, 2019and$1.4 trillion at Sept. 30, 2019 and June 30, 2019.
|
| |
| (b) | Includes currency overlay AUM.
|
Business description
Our Investment Management business consists of our affiliated investment management boutiques, Wealth Management business and global distribution companies. See pages 19 and 20 of our 2016 Annual Report for additional information on our Investment Management business.
Review of financial results
AUM increased 6% compared with Sept. 30, 2016 primarily reflecting higher market values, net inflows and the favorable impact of the weaker U.S. dollar (principally versus the British pound). The increase compared with June 30, 2017 primarily reflects the favorable impact of the weaker U.S. dollar (principally versus the British pound), higher market values and net inflows.
Net long-term inflows of fixed income and multi-asset and alternative investments were offset by outflows of index, equity and liability-driven investments in the third quarter of 2017. Net short-term inflows of $10 billion in the third quarter of 2017 were a result of increased distribution through our liquidity portals. Market and regulatory trends have driven investable assets toward investments in lower fee asset management products, which negatively impacted our investment management fees.
Total revenue increased 4% compared with the third quarter of 2016 and 1% (unannualized) compared with the second quarter of 2017. Both increases primarily reflect higher investment management and performance fees.
Revenue generated in the Investment Management business included 41% from non-U.S. sources in the
third quarter of 2017, compared with 40% in both the third quarter of 2016 and second quarter of 2017.
Investment management fees in the Investment Management business increased 4% compared with the third quarter of 2016 and 3% (unannualized) compared with the second quarter of 2017. Both increases primarily reflect higher equity market values and money market fees. The increase compared with the second quarter of 2017 also reflects the favorable impact of a weaker U.S. dollar.
Distribution and servicing fees increased compared with the third quarter of 2016 primarily reflecting higher money market fees.
Other revenue decreased compared with the third quarter of 2016 primarily reflecting higher payments to Investment Services related to higher money market fees.
Net interest revenue was unchanged compared with the third quarter of 2016 and decreased 6% (unannualized) compared with the second quarter of 2017. The decrease primarily reflects lower average deposits. Average loans increased 9% compared with the third quarter of 2016 and 1% compared with the second quarter of 2017. Average deposits decreased 21% compared with the third quarter of 2016 and 17% compared with the second quarter of 2017.
Noninterest expense, excluding amortization of intangible assets, increased 1% compared with the third quarter of 2016 and 1% (unannualized) compared with the second quarter of 2017. The increase compared with the third quarter of 2016 primarily reflects higher other and distribution and servicing expenses, partially offset by lower severance expense. The increase compared with the second quarter of 2017 primarily reflects higher distribution and servicing expense.
Year-to-date 2017 compared with year-to-date 2016
Income before taxes increased 22% compared with the first nine months of 2016, primarily reflecting revenue growth of 6%, partially offset by a 1% increase in noninterest expense, excluding amortization of intangible assets. Fee and other revenue increased 6% primarily reflecting higher investment management and performance fees. The increase in investment management and performance fees primarily reflects higher market values, money market fees and performance fees, partially offset by the unfavorable impact of a stronger U.S. dollar (principally versus the British pound). Net interest revenue increased 3% primarily due to higher interest rates and average loans, partially offset by lower average deposits. Noninterest expense, excluding amortization of intangible assets, increased 1% primarily reflecting higher incentives expense, driven by stronger performance, partially offset by the favorable impact of a stronger U.S. dollar (principally versus the British pound).
Investment Services business
|
| | | | | | | | | | | | | | | | | | | | | | | | | | | | |
| | | | | | | | | | | | YTD17 |
| (dollar amounts in millions, unless otherwise noted) | | | | | | 3Q17 vs. | | | | vs. |
| 3Q17 |
| 2Q17 |
| 1Q17 |
| 4Q16 |
| 3Q16 |
| 2Q17 |
| 3Q16 |
| | YTD17 |
| YTD16 |
| YTD16 |
|
| Revenue: | | | | | | | | | | | |
| Investment services fees: | | | | | | | | | | | |
| Asset servicing | $ | 1,081 |
| $ | 1,061 |
| $ | 1,038 |
| $ | 1,043 |
| $ | 1,039 |
| 2 | % | 4 | % | | $ | 3,180 |
| $ | 3,098 |
| 3 | % |
| Clearing services | 381 |
| 393 |
| 375 |
| 354 |
| 347 |
| (3 | ) | 10 |
| | 1,149 |
| 1,045 |
| 10 |
|
| Issuer services | 288 |
| 241 |
| 250 |
| 211 |
| 336 |
| 20 |
| (14 | ) | | 779 |
| 813 |
| (4 | ) |
| Treasury services | 141 |
| 139 |
| 139 |
| 139 |
| 136 |
| 1 |
| 4 |
| | 419 |
| 402 |
| 4 |
|
| Total investment services fees | 1,891 |
| 1,834 |
| 1,802 |
| 1,747 |
| 1,858 |
| 3 |
| 2 |
| | 5,527 |
| 5,358 |
| 3 |
|
| Foreign exchange and other trading revenue | 154 |
| 145 |
| 153 |
| 157 |
| 177 |
| 6 |
| (13 | ) | | 452 |
| 506 |
| (11 | ) |
Other (a) | 142 |
| 136 |
| 129 |
| 128 |
| 148 |
| 4 |
| (4 | ) | | 407 |
| 403 |
| 1 |
|
| Total fee and other revenue | 2,187 |
| 2,115 |
| 2,084 |
| 2,032 |
| 2,183 |
| 3 |
| — |
| | 6,386 |
| 6,267 |
| 2 |
|
| Net interest revenue | 777 |
| 761 |
| 707 |
| 713 |
| 715 |
| 2 |
| 9 |
| | 2,245 |
| 2,084 |
| 8 |
|
| Total revenue | 2,964 |
| 2,876 |
| 2,791 |
| 2,745 |
| 2,898 |
| 3 |
| 2 |
| | 8,631 |
| 8,351 |
| 3 |
|
| Provision for credit losses | (2 | ) | (3 | ) | — |
| — |
| 1 |
| N/M | N/M | | (5 | ) | 8 |
| N/M |
| Noninterest expense (ex. amortization of intangible assets) | 1,837 |
| 1,889 |
| 1,812 |
| 1,786 |
| 1,812 |
| (3 | ) | 1 |
| | 5,538 |
| 5,401 |
| 3 |
|
| Amortization of intangible assets | 37 |
| 38 |
| 37 |
| 38 |
| 39 |
| (3 | ) | (5 | ) | | 112 |
| 117 |
| (4 | ) |
| Total noninterest expense | 1,874 |
| 1,927 |
| 1,849 |
| 1,824 |
| 1,851 |
| (3 | ) | 1 |
| | 5,650 |
| 5,518 |
| 2 |
|
| Income before taxes | $ | 1,092 |
| $ | 952 |
| $ | 942 |
| $ | 921 |
| $ | 1,046 |
| 15 | % | 4 | % | | $ | 2,986 |
| $ | 2,825 |
| 6 | % |
Income before taxes (ex. amortization of intangible assets) – Non-GAAP | $ | 1,129 |
| $ | 990 |
| $ | 979 |
| $ | 959 |
| $ | 1,085 |
| 14 | % | 4 | % | | $ | 3,098 |
| $ | 2,942 |
| 5 | % |
| | | | | | | | | | | |
|
| Pre-tax operating margin | 37 | % | 33 | % | 34 | % | 34 | % | 36 | % | | | | 35 | % | 34 | % |
|
|
Adjusted pre-tax operating margin (ex. provision for credit losses and amortization of intangible assets) – Non-GAAP | 38 | % | 34 | % | 35 | % | 35 | % | 37 | % | | | | 36 | % | 35 | % |
|
|
| | | | | | | | | | | |
|
| Investment services fees as a percentage of noninterest expense (ex. amortization of intangible assets) | 103 | % | 97 | % | 99 | % | 98 | % | 103 | % | | | | 100 | % | 99 | % |
|
|
| | | | | | | | | | | |
|
|
| Securities lending revenue | $ | 41 |
| $ | 42 |
| $ | 40 |
| $ | 44 |
| $ | 42 |
| (2 | )% | (2 | )% | | $ | 123 |
| $ | 126 |
| (2 | )% |
| | | | | | | | | | | |
|
| Metrics: | | | | | | | | | | |
|
| Average loans | $ | 38,038 |
| $ | 40,931 |
| $ | 42,818 |
| $ | 45,832 |
| $ | 44,329 |
| (7 | )% | (14 | )% | | $ | 40,578 |
| $ | 44,373 |
| (9 | )% |
| Average deposits | $ | 198,299 |
| $ | 200,417 |
| $ | 197,690 |
| $ | 213,531 |
| $ | 220,316 |
| (1 | )% | (10 | )% | | $ | 198,796 |
| $ | 219,344 |
| (9 | )% |
| | | | | | | | | | | |
|
|
AUC/A at period end (in trillions) (b) | $ | 32.2 |
| $ | 31.1 |
| $ | 30.6 |
| $ | 29.9 |
| $ | 30.5 |
| 4 | % | 6 | % | | $ | 32.2 |
| $ | 30.5 |
| 6 | % |
Market value of securities on loan at period end (in billions) (c) | $ | 382 |
| $ | 336 |
| $ | 314 |
| $ | 296 |
| $ | 288 |
| 14 | % | 33 | % | | $ | 382 |
| $ | 288 |
| 33 | % |
| | | | | | | | | | | |
|
|
| Asset servicing: | | | | | | | | | | |
|
|
Estimated new business wins (AUC/A) (in billions) | $ | 166 |
| $ | 152 |
| $ | 109 |
| $ | 141 |
| $ | 150 |
| | | | | | |
| | | | | | | | | | | | |
| Clearing services: | | | | | | | | | | | |
Average active clearing accounts (U.S. platform) (in thousands) | 6,203 |
| 6,159 |
| 6,058 |
| 5,960 |
| 5,942 |
| 1 | % | 4 | % | | | | |
| Average long-term mutual fund assets (U.S. platform) | $ | 500,998 |
| $ | 480,532 |
| $ | 460,977 |
| $ | 438,460 |
| $ | 443,112 |
| 4 | % | 13 | % | | | | |
| Average investor margin loans (U.S. platform) | $ | 8,886 |
| $ | 9,812 |
| $ | 10,740 |
| $ | 10,562 |
| $ | 10,834 |
| (9 | )% | (18 | )% | | | | |
| | | | | | |
|
|
|
| | | | |
| Depositary Receipts: | | | | | |
|
|
|
| | | | |
| Number of sponsored programs | 938 |
| 1,025 |
| 1,050 |
| 1,062 |
| 1,094 |
| (8 | )% | (14 | )% | | | | |
| | | | | | | | | | | | |
| Broker-Dealer: | | | | | | | | | | | |
Average tri-party repo balances (in billions) | $ | 2,534 |
| $ | 2,498 |
| $ | 2,373 |
| $ | 2,307 |
| $ | 2,212 |
| 1 | % | 15 | % | | | | |
| |
(a) | Other revenue includes investment management fees, financing-related fees, distribution and servicing revenue and investment and other income.
|
| |
(b) | Includes the AUC/A of CIBC Mellon of $1.3 trillion at Sept. 30, 2017 and $1.2 trillion at June 30, 2017, March 31, 2017, Dec. 31, 2016 and Sept. 30, 2016. |
| |
(c) | Represents the total amount of securities on loan in our agency securities lending program managed by the Investment Services business. Excludes securities for which BNY Mellon acts as agent on behalf of CIBC Mellon clients, which totaled $68$62 billion at June 30, 2020, $59 billion at March 31, 2020, $60 billion at Dec. 31, 2019, $66 billion at Sept. 30, 2017, $662019 and $64 billion at June 30, 2017, $65 billion at March 31, 2017, $63 billion at Dec. 31, 20162019. |
| |
| (c) | Net new assets represent net flows of assets (e.g., net cash deposits and $64 billion at Sept. 30, 2016.net securities transfers) in customer accounts in Pershing LLC, a U.S. broker-dealer. |
N/M - Not meaningful.
Business description
BNY Mellon Investment Services provides business services and technology solutions across the investments process to entities including financial institutions, corporations, foundations and endowments, public funds and government agencies. Our lines of business include: Asset Servicing, Pershing, Issuer Services, Treasury Services and Clearance and Collateral Management. For information on the drivers of the Investment Services fee revenue, see Note 10 of the Notes to Consolidated Financial Statements in our 2019 Annual Report.
We are one of the leading global investment services providers with $32.2$37.3 trillion of AUC/A at Sept.June 30, 2017.2020.
We areThe Asset Servicing business provides a comprehensive suite of solutions. As one of the primary provider of U.S. government securities clearancelargest global custody and fund accounting providers and a providertrusted partner, we offer services for the safekeeping of non-U.S. government securities clearance.assets in capital markets globally as well as alternative investment and structured product strategies. We provide custody and foreign exchange services, support exchange-traded funds and unit investment trusts and provide our clients outsourcing capabilities. Our robust digital and data offerings enable us to settleprovide fully integrated technology solutions for our clients. We deliver securities transactions in approximately 100 markets.
We are a leading provider of tri-party repo collateral services with approximately $2.5 trillion serviced globallylending and approximately $1.6 trillion of the U.S. tri-party repo market.
financing solutions on both an agency and principal basis. Our agency securities lending program is one of the largest lenders of U.S. and non-U.S. securities, servicing a lendable asset pool of approximately $3.3 trillion in 33 separate markets.
We serve as trustee and/or paying agent on more than 50,000 debt-related issuances globally.
As one of the largest providers of depositary receipts services in the world, we served as depositary for 938 sponsored American and global depositary receipts programs at Sept. 30, 2017, acting in partnership with leading companies from 59 countries.
We offer asset servicing, clearing services, issuer services and treasury services to our clients. BNY Mellon’s comprehensive suite of asset servicing solutions includes: custody, foreign exchange, fund services, securities finance, investment manager outsourcing, performance and risk analytics, alternative investment services, broker-dealer services, and collateral and liquidity services.
As one of the largest fund accounting providers and a trusted partner, we offer services to ensure the safekeeping of assets in capital markets globally. These services include financial reporting, tax reporting services, calculating and reporting net asset values (“NAV”), computing yields, maintaining brokerage account records, and providing
administrative support to clients so they may meet their Securities and Exchange Commission (“SEC”) and other compliance requirements.
approximately $4.0 trillion in 34 separate markets. Our alternative investment services and structured products business provides a full range of solutions for alternative investment managers, including prime custody, fund accounting, and client and regulatory reporting services. We also support exchange-traded funds and unit investment trusts, providing fund administration, custody, basket creation and dissemination, authorized participant interaction and order processing, among other services.
Securities finance delivers solutions on both an agency and principal basis. The principal finance program supports a diverse group of client segments, including hedge and liquid alternative funds and other institutional clients.
Inmarket-leading liquidity services our market leading portal enables cash investments for institutional clients via money market funds, deposit products, and direct investments in money market securities, and includes fund research and analytics.
Our broker-dealer services business clears and settles equity and fixed-income transactions globally and serves as custodian for tri-party repo collateral worldwide.
Clearing services, primarily Pershing LLC, an indirect subsidiary of BNY Mellon (“Pershing”) and its affiliates, provides execution, clearing, custody, business and technology solutions, to financial organizations globally, delivering dependable operational support robust trading services, flexible technology, an expansive array ofto broker-dealers, wealth managers and registered investment advisors (RIAs) globally.
The Issuer Services business includes Corporate Trust and retirement solutions, practice management support and service excellence.
Depositary Receipts. Our collateral services include collateral management, administration and segregation. We offer innovative solutions, like new collateral types and transaction structures, automation and efficiency, access to global markets, and industry expertise, to help financial institutions and institutional investors mine opportunities from liquidity, financing, risk and balance sheet challenges.
Our corporate trustCorporate Trust business delivers a full range of issuer and related investor services, including trustee, paying agency, fiduciary, escrow and other financial services.
Our treasury services include customizable solutions and innovative technology that deliver high-quality cash management, payment and trade support for corporate and institutional global treasury needs. We are a leading provider to the debt capital markets, providing customized and market-driven solutions to investors, bondholders and lenders. Our Depositary Receipts business drives global investing by providing servicing and value-added solutions that enable, facilitate and enhance cross-border trading, clearing, settlement and ownership. We are one of the largest providers of depositary receipts services in the world, partnering with leading companies from more than 50 countries.
We also provide credit facilitiesOur Treasury Services business provides global payments, liquidity management and solutions to support our clients globally.trade finance services for financial institutions, corporations and the public sector.
Role of
Our Clearance and Collateral Management business clears and settles equity and fixed-income transactions globally and serves as a trustee, for mortgage-backed securitizations
BNY Mellon acts as trustee and document custodian for certain mortgage-backed security (“MBS”) securitization trusts. The roletri-party repo collateral worldwide. We are the primary provider of trustee for MBS securitizations is limited; our primary role as trustee is to calculateU.S. government securities clearance and distribute monthly bond payments to bondholders. As a document custodian, we hold the mortgage, note,provider of non-U.S. government securities clearance. Our collateral services include collateral management, administration and related documents provided to us by the loan originator or sellersegregation. We offer innovative solutions and provide periodic reporting to these parties. BNY Mellon, either as document custodian or trustee, does not receive mortgage underwriting files (the files that contain information related to the creditworthinessindustry expertise which help financial institutions and institutional investors with their liquidity, financing, risk and balance sheet challenges. We are a leading provider of tri-party collateral management services with an average of $3.6 trillion serviced globally including approximately $2.6 trillion of the borrower). As trustee or custodian, we have no responsibility or liability for the quality of the portfolio; we are liable only for performance of our limited duties as described above and in the trust documents. BNY Mellon is indemnified by the servicers or directly from trust assets under the governing agreements. BNY Mellon may appear as the named plaintiff in legal actions brought by servicers in foreclosure and other related proceedings because the trustee is the nominee owner of the mortgage loans within the trusts.U.S. tri-party repo market.
BNY Mellon also has been named as a defendant in legal actions brought by MBS investors alleging that the trustee has expansive duties under the governing agreements, including to investigate and pursue claims against other parties to the MBS transaction. For additional information on our legal proceedings related to this matter, see Note 17 of the Notes to Consolidated Financial Statements.
Review of financial results
AUC/A of $37.3 trillion increased 6%5% compared with Sept.June 30, 2016 to a record $32.2 trillion,2019, primarily reflecting higher client inflows, market values and net new business, partially offset by the favorableunfavorable impact of a weakerstronger U.S. dollar and net new business.dollar. AUC/A consisted of
37% 33% equity securities and 63% fixed income67% fixed-income securities at Sept.June 30, 2017, compared with 34%2020 and 35% equity securities and 66% fixed income65% fixed-income securities at Sept.June 30, 2016.2019.
Investment services feesTotal revenue of $3.1 billion increased 2% compared with the third quarter of 2016 and 3% (unannualized) compared with the second quarter of 2017, reflecting the following factors:
Asset servicing fees (custody, fund services, broker-dealer services, securities finance, collateral2019 and liquidity services) increaseddecreased 4% compared with the thirdfirst quarter of 2016 and 2% (unannualized)2020. The drivers of total revenue by line of business are indicated below.
Asset Servicing revenue of $1.5 billion increased 5% compared with the second quarter of 2017. The increase2019 and decreased 4% compared with the thirdfirst quarter of 2016 primarily reflects higher equity market values and net new business, including growth in collateral management, partially offset by the impact of downsizing the retail UK transfer agency business.2020. The increase compared with the second quarter of 2017 was primarily driven2019 reflects higherforeign exchange and other trading revenue, partially offset by the favorable impact of a weaker U.S. dollar and higher equity market values.
Clearing services fees increased 10%lower net interest revenue. The decrease compared with the thirdfirst quarter of 2016 primarily driven by2020 reflects lower foreign exchange and other trading revenue and net interest revenue. Total revenue in the second quarter of 2020 also benefited from higher money market feesvolumes from existing clients and growth in long-term mutual fund assets. Clearing services fees decreased 3% (unannualized)a one-time fee.
Pershing revenue of $578 million increased 1% compared with the second quarter of 2017 primarily reflecting lower clearance volumes.
Issuer services fees (Depositary Receipts2019 and Corporate Trust) decreased 14%11% compared with the thirdfirst quarter of 2016 and increased 20% (unannualized) compared with the second quarter of 2017. The decrease compared with the third quarter of 2016 primarily reflects fewer corporate actions, lost business and lower fees due to a reduction in shares outstanding in certain depositary receipts programs, partially offset by higher Corporate Trust revenue.2020. The increase compared with the second quarter of 20172019 primarily reflects seasonality in Depositary Receipts revenuehigher money market balances and higher Corporate Trust revenue.clearing volumes, partially offset by the impact of rate-driven money market fee waivers. The
Treasury services fees (global payments, trade finance and cash management) increased 4%decrease compared with the thirdfirst quarter of 20162020 primarily reflects the impact of rate-driven money market fee waivers, a one-time fee recorded in the first quarter of 2020 and 1% (unannualized)lower clearing volumes, partially offset by higher money market balances.
Issuer Services revenue of $431 million decreased 3% compared with the second quarter of 20172019 and increased 3% compared with the first quarter of 2020. The decrease compared with the second quarter of 2019 reflects lower Depositary Receipts and Corporate Trust fees. The increase compared with the first quarter of 2020 primarily reflectingreflects higher payment volumes, partially offsetDepositary Receipts fees.
Treasury Services revenue of $340 million increased 7% compared with the second quarter of 2019 and increased slightly compared with the first quarter of 2020. The increase compared with the second quarter of 2019 primarily reflects higher net interest revenue driven by deposit growth and higher compensating
balance credits provided to clients, which reduces feeClearance and Collateral Management revenue of $295 million increased 4% compared with the second quarter of 2019 and decreased 2% compared with the first quarter of 2020. The increase compared with the second quarter of 2019 primarily reflects higher net interest revenue and increases net interest revenue.growth in collateral management and clearance volumes, mostly from non-U.S. clients. The decrease compared with the first quarter of 2020 primarily reflects lower collateral management fees.
Market and regulatory trends are driving investable assets toward lower fee asset management products at reduced margins for our clients. These dynamics are also negatively impacting our investment services fees. However, at the same time, these trends are providing additional outsourcing opportunities as clients and other market participants seek to comply with new regulations and reduce their operating costs.
Foreign exchange and other trading revenue decreased 13% compared withThe provision for credit losses of $145 million in the thirdsecond quarter of 20162020 primarily reflecting lower volatilityreflects increased downgrades and lower Depositary Receipt-related foreign exchange activity, partially offset by higher volumes. Foreign exchange and other trading revenuethe continuation of the challenging macroeconomic outlook.
Noninterest expense of $2.0 billion increased 6% (unannualized)1% compared with the second quarter of 2017 primarily reflecting higher volumes.
Other revenue decreased 4%2019 and slightly compared with the thirdfirst quarter of 2016 and increased 4% (unannualized)2020. The increase compared with the second quarter of 2017. The third quarter of 2016 results include termination fees related to the clearing services business. Both comparisons reflect higher payments from Investment Management related to higher money market fees.
Net interest revenue increased 9% compared with the third quarter of 20162019 was primarily reflecting the impact of the higher interest rates,driven by continued investments in technology, partially offset by lower average depositsbusiness development and loans. Net interest revenue increased 2% (unannualized)staff expenses. The slight increase compared with the secondfirst quarter of 2017 primarily reflecting higher interest rates.2020 reflects
Noninterest expense, excluding amortization of intangible assets, increased 1% compared with the third quarter of 2016 and decreased 3% (unannualized) compared with the second quarter of 2017. The increase primarily reflects additional
BNY Mellon 17
continued investments in technology, related-costs, partially offset by lower staff expense. The decrease primarily reflects lower consulting expense, volume-related clearing and sub-custodian expenses and lower business development expense.
Year-to-date 20172020 compared with year-to-date 20162019
Income before taxesTotal revenue of $6.3 billion increased 6% compared with the first ninesix months of 2016, primarily driven by2019. Asset Servicing revenue growth of 3%, partially offset by a 3% increase in noninterest expense, excluding amortization of intangible assets. Fee and other revenue$3.0 billion increased 2%6%, primarily reflecting higher clearing services and asset servicing fees, partially offset by lower foreign exchange and other trading revenue and higher volumes from existing clients, partially offset by lower net interest revenue. The increase inPershing revenue of $1.2 billion increased 9%, primarily reflecting higher clearing services fees primarily reflects highervolumes and money market fees and growth in long-term mutual fund assets. The increase in asset servicing fees primarily reflects net new business, including growth in collateral management and higher equity market values,balances, partially offset by the impact of downsizingrate-driven money market fee waivers.
Issuer Services revenue of $850 million increased 1%, primarily reflecting higher Depositary Receipts and Corporate Trust fees. Treasury Services revenue of $679 million increased 7%, primarily reflecting higher fees and net interest revenue. Clearance and Collateral Management revenue of $595 million increased 6%, primarily reflecting growth in collateral management and clearance volumes and higher net interest revenue.
Noninterest expense of $4.0 billion increased 1% compared with the first six months of 2019 primarily reflecting continued investments in technology, partially offset by lower business development (travel and marketing) and staff expenses.
Investment and Wealth Management business (formerly Investment Management business)
|
| | | | | | | | | | | | | | | | | | | | | | | | | | | | |
| | | | | | | | | | | | YTD20 |
|
| | | | | | | 2Q20 vs. | | | | vs. |
| (dollars in millions) | 2Q20 |
| 1Q20 |
| 4Q19 |
| 3Q19 |
| 2Q19 |
| 1Q20 |
| 2Q19 |
| | YTD20 |
| YTD19 |
| YTD19 |
|
| Revenue: | | | | | | | | | | | |
Investment management fees (a) | $ | 782 |
| $ | 812 |
| $ | 836 |
| $ | 830 |
| $ | 831 |
| (4 | )% | (6 | )% | | $ | 1,594 |
| $ | 1,641 |
| (3 | )% |
| Performance fees | 5 |
| 50 |
| 48 |
| 2 |
| 2 |
| N/M |
| 150 |
| | 55 |
| 33 |
| 67 |
|
Investment management and performance fees (b) | 787 |
| 862 |
| 884 |
| 832 |
| 833 |
| (9 | ) | (6 | ) | | 1,649 |
| 1,674 |
| (1 | ) |
| Distribution and servicing | 34 |
| 43 |
| 44 |
| 45 |
| 44 |
| (21 | ) | (23 | ) | | 77 |
| 89 |
| (13 | ) |
Other (a) | 17 |
| (59 | ) | (4 | ) | (39 | ) | (23 | ) | N/M |
| N/M |
| | (42 | ) | (40 | ) | N/M |
|
Total fee and other revenue (a) | 838 |
| 846 |
| 924 |
| 838 |
| 854 |
| (1 | ) | (2 | ) | | 1,684 |
| 1,723 |
| (2 | ) |
| Net interest revenue | 48 |
| 52 |
| 47 |
| 49 |
| 59 |
| (8 | ) | (19 | ) | | 100 |
| 126 |
| (21 | ) |
| Total revenue | 886 |
| 898 |
| 971 |
| 887 |
| 913 |
| (1 | ) | (3 | ) | | 1,784 |
| 1,849 |
| (4 | ) |
| Provision for credit losses | 7 |
| 9 |
| — |
| — |
| (2 | ) | N/M |
| N/M |
| | 16 |
| (1 | ) | N/M |
|
| Noninterest expense (excluding amortization of intangible assets) | 650 |
| 687 |
| 722 |
| 582 |
| 646 |
| (5 | ) | 1 |
| | 1,337 |
| 1,306 |
| 2 |
|
| Amortization of intangible assets | 8 |
| 8 |
| 9 |
| 10 |
| 9 |
| — |
| (11 | ) | | 16 |
| 18 |
| (11 | ) |
| Total noninterest expense | 658 |
| 695 |
| 731 |
| 592 |
| 655 |
| (5 | ) | — |
| | 1,353 |
| 1,324 |
| 2 |
|
| Income before income taxes | $ | 221 |
| $ | 194 |
| $ | 240 |
| $ | 295 |
| $ | 260 |
| 14 | % | (15 | )% | | $ | 415 |
| $ | 526 |
| (21 | )% |
| | | | | | | | | | | |
|
| Pre-tax operating margin | 25 | % | 22 | % | 25 | % | 33 | % | 29 | % | | | | 23 | % | 28 | % |
|
|
Adjusted pre-tax operating margin – Non-GAAP (c) | 28 | % | 24 | % | 27 | % | 37 | % | 32 | % | | | | 26 | % | 32 | % |
|
|
| | | | | | | | | | | |
|
Total revenue by line of business: | | | | | | | | | | |
|
| Investment Management (formerly Asset Management) | $ | 621 |
| $ | 620 |
| $ | 692 |
| $ | 608 |
| $ | 622 |
| — | % | — | % | | $ | 1,241 |
| $ | 1,262 |
| (2 | )% |
| Wealth Management | 265 |
| 278 |
| 279 |
| 279 |
| 291 |
| (5 | ) | (9 | ) | | 543 |
| 587 |
| (7 | ) |
| Total revenue by line of business | $ | 886 |
| $ | 898 |
| $ | 971 |
| $ | 887 |
| $ | 913 |
| (1 | )% | (3 | )% | | $ | 1,784 |
| $ | 1,849 |
| (4 | )% |
| | | | | | | | | | | | |
Average balances: | | | | | | | | | | | |
| Average loans | $ | 11,791 |
| $ | 12,124 |
| $ | 12,022 |
| $ | 12,013 |
| $ | 12,205 |
| (3 | )% | (3 | )% | | $ | 11,958 |
| $ | 12,271 |
| (3 | )% |
| Average deposits | $ | 17,491 |
| $ | 16,144 |
| $ | 15,195 |
| $ | 14,083 |
| $ | 14,615 |
| 8 | % | 20 | % | | $ | 16,817 |
| $ | 15,211 |
| 11 | % |
| |
| (a) | Total fee and other revenue includes the impact of the consolidated investment management funds, net of noncontrolling interests. Additionally, other revenue includes asset servicing fees, treasury services fees, foreign exchange and other trading revenue and investment and other income. |
| |
| (b) | On a constant currency basis, investment management and performance fees decreased 4% (Non-GAAP) compared with the second quarter of 2019. See “Supplemental information – Explanation of GAAP and Non-GAAP financial measures” beginning on page 45 for the reconciliation of this Non-GAAP measure. |
| |
| (c) | Net of distribution and servicing expense. See “Supplemental information – Explanation of GAAP and Non-GAAP financial measures” beginning on page 45 for the reconciliation of this Non-GAAP measure. |
N/M - Not meaningful.
|
| | | | | | | | | | | | | | | | | | | |
| AUM trends | | | | | | 2Q20 vs. |
| (dollars in billions) | 2Q20 |
| 1Q20 |
| 4Q19 |
| 3Q19 |
| 2Q19 |
| 1Q20 |
| 2Q19 |
|
AUM at period end, by product type: (a) | | | | | | | |
| Equity | $ | 141 |
| $ | 120 |
| $ | 154 |
| $ | 147 |
| $ | 152 |
| 18 | % | (7 | )% |
| Fixed income | 224 |
| 211 |
| 224 |
| 211 |
| 209 |
| 6 |
| 7 |
|
| Index | 333 |
| 274 |
| 339 |
| 321 |
| 322 |
| 22 |
| 3 |
|
| Liability-driven investments | 752 |
| 705 |
| 728 |
| 742 |
| 709 |
| 7 |
| 6 |
|
| Multi-asset and alternative investments | 185 |
| 171 |
| 192 |
| 182 |
| 184 |
| 8 |
| 1 |
|
| Cash | 326 |
| 315 |
| 273 |
| 278 |
| 267 |
| 3 |
| 22 |
|
| Total AUM by product type | $ | 1,961 |
| $ | 1,796 |
| $ | 1,910 |
| $ | 1,881 |
| $ | 1,843 |
| 9 | % | 6 | % |
| | | | | | |
|
|
Changes in AUM: (a) | | | | | | | |
| Beginning balance of AUM | $ | 1,796 |
| $ | 1,910 |
| $ | 1,881 |
| $ | 1,843 |
| $ | 1,841 |
| | |
| Net inflows (outflows): | | | | | | | |
| Long-term strategies: | | | | | | | |
| Equity | (2 | ) | (2 | ) | (6 | ) | (4 | ) | (2 | ) | | |
| Fixed income | 4 |
| — |
| 5 |
| 2 |
| (4 | ) | | |
| Liability-driven investments | (2 | ) | (5 | ) | (3 | ) | (4 | ) | 1 |
| | |
| Multi-asset and alternative investments | — |
| (1 | ) | 3 |
| (1 | ) | 1 |
| | |
| Total long-term active strategies (outflows) | — |
| (8 | ) | (1 | ) | (7 | ) | (4 | ) | | |
| Index | 9 |
| 3 |
| (5 | ) | (3 | ) | (22 | ) | | |
| Total long-term strategies inflows (outflows) | 9 |
| (5 | ) | (6 | ) | (10 | ) | (26 | ) | | |
| Short-term strategies: | | | | | | | |
| Cash | 11 |
| 43 |
| (7 | ) | 11 |
| 2 |
| | |
| Total net inflows (outflows) | 20 |
| 38 |
| (13 | ) | 1 |
| (24 | ) | | |
| Net market impact | 143 |
| (91 | ) | (20 | ) | 66 |
| 42 |
| | |
| Net currency impact | 2 |
| (61 | ) | 62 |
| (29 | ) | (16 | ) | | |
| Ending balance of AUM | $ | 1,961 |
| $ | 1,796 |
| $ | 1,910 |
| $ | 1,881 |
| $ | 1,843 |
| 9 | % | 6 | % |
| | | | | | |
|
|
|
|
Wealth Management client assets (b) | $ | 254 |
| $ | 236 |
| $ | 266 |
| $ | 259 |
| $ | 257 |
| 8 | % | (1 | )% |
(a) Excludes securities lending cash management assets and assets managed in the Investment Services business.
(b) Includes AUM and AUC/A in the Wealth Management business.
Business description
Our Investment and Wealth Management business consists of two lines of business, Investment Management and Wealth Management. Our investment firms deliver a highly diversified portfolio of investment strategies independently, and through our global distribution network, to institutional and retail UK transfer agency businessclients globally. BNY Mellon Wealth Management provides investment management, custody, wealth and estate planning and private banking services. See pages 16 and 17 of our 2019 Annual Report for additional information on our Investment and Wealth Management business.
Review of financial results
AUM increased 6% compared with June 30, 2019 primarily reflecting higher market values and net inflows, partially offset by the unfavorable impact of a stronger U.S. dollar.dollar (principally versus the British pound).
Net long-term strategy inflows were $9 billion in the second quarter of 2020, primarily resulting from inflows of index funds. Short-term strategy inflows were $11 billion in the second quarter of 2020. Market and regulatory trends have resulted in increased demand for lower fee asset management products and for performance-based fees.
Total revenue of $886 million decreased 3% compared with the second quarter of 2019 and 1% compared with the first quarter of 2020.
Investment Management revenue of $621 million decreased slightly compared with the second quarter of 2019 and increased slightly compared with the first quarter of 2020. The decrease compared with the second quarter of 2019 primarily reflects the unfavorable change in foreign exchangethe mix of AUM since the second quarter of 2019 and other tradingthe impact of money market fee waivers, partially offset by equity investment gains (net of hedges), including seed capital. The increase compared with the first quarter of 2020 primarily reflects equity investment gains (net of hedges), including seed capital, partially offset
by the timing of performance fees and the impact of money market fee waivers.
Wealth Management revenue of $265 million decreased 9% compared with the second quarter of 2019 and 5% compared with the first quarter of 2020. Both decreases primarily reflect lower net interest revenue and a shift within portfolios to lower fee asset classes.
Revenue generated in the Investment and Wealth Management business included 40% from non-U.S. sources in the second quarter of 2020, compared with 38% in the second quarter of 2019 and 42% in the first quarter of 2020.
Noninterest expense of $658 million increased slightly compared with the second quarter of 2019 and decreased 5% compared with the first quarter of 2020. The increase compared with the second quarter of 2019 primarily reflects higher continued investments in technology. The decrease compared with the first quarter of 2020 primarily reflects lower volatilitystaff and lower Depositary Receipt-related foreign exchange activity. Net interestother expenses.
Year-to-date 2020 compared with year-to-date 2019
Total revenue increased 8%of $1.8 billion decreased 4% compared with the first six months of 2019. Investment Management revenue of $1.2 billion decreased 2% primarily due to higher interest rates,reflecting an unfavorable change in the mix of AUM, equity investment losses (net of hedges), including seed capital, and the impact of fee waivers, partially offset by higher performance fees and market values. Wealth Management revenue of $543 million decreased 7% reflecting lower average deposits. net interest revenue.
Noninterest expense excluding amortization of intangible assets,$1.4 billion increased 3%2% compared with the first six months of 2019, primarily reflecting higher expenses from regulatoryprofessional, legal and compliance costsother purchased services expense and additionalhigher investments in technology, investments, partially offset by lower litigation expense and the favorable impact of a stronger U.S. dollar.dollar (principally versus the British pound).
Other segment
|
| | | | | | | | | | | | | | | | | | | | | |
| | | | | | | | |
| (in millions) | 3Q17 |
| 2Q17 |
| 1Q17 |
| 4Q16 |
| 3Q16 |
| YTD17 |
| YTD16 |
|
| Revenue: | | | | | | | |
| Fee and other revenue | $ | 69 |
| $ | 113 |
| $ | 72 |
| $ | 42 |
| $ | 100 |
| $ | 254 |
| $ | 324 |
|
| Net interest (expense) revenue | (20 | ) | (22 | ) | (1 | ) | 38 |
| (23 | ) | (43 | ) | (24 | ) |
| Total revenue | 49 |
| 91 |
| 71 |
| 80 |
| 77 |
| 211 |
| 300 |
|
| Provision for credit losses | (2 | ) | (4 | ) | (8 | ) | 1 |
| (20 | ) | (14 | ) | (26 | ) |
| Noninterest expense (ex. M&I and restructuring charges) | 77 |
| 28 |
| 106 |
| 108 |
| 88 |
| 211 |
| 282 |
|
| M&I and restructuring charges | — |
| — |
| 1 |
| 2 |
| — |
| 1 |
| 2 |
|
| Total noninterest expense | 77 |
| 28 |
| 107 |
| 110 |
| 88 |
| 212 |
| 284 |
|
| (Loss) income before taxes | $ | (26 | ) | $ | 67 |
| $ | (28 | ) | $ | (31 | ) | $ | 9 |
| $ | 13 |
| $ | 42 |
|
(Loss) income before taxes (ex. M&I and restructuring charges) – Non-GAAP | $ | (26 | ) | $ | 67 |
| $ | (27 | ) | $ | (29 | ) | $ | 9 |
| $ | 14 |
| $ | 44 |
|
| | | | | | | | |
| Average loans and leases | $ | 1,182 |
| $ | 1,302 |
| $ | 1,341 |
| $ | 2,142 |
| $ | 1,941 |
| $ | 1,275 |
| $ | 1,853 |
|
|
| | | | | | | | | | | | | | | | | | | | | |
| | | | | | | | |
| (in millions) | 2Q20 |
| 1Q20 |
| 4Q19 |
| 3Q19 |
| 2Q19 |
| YTD20 |
| YTD19 |
|
| Fee revenue (loss) | $ | 29 |
| $ | 21 |
| $ | 817 |
| $ | (5 | ) | $ | 24 |
| $ | 50 |
| $ | 41 |
|
| Net securities gains (losses) | 9 |
| 9 |
| (23 | ) | (1 | ) | 7 |
| 18 |
| 8 |
|
| Total fee and other revenue (loss) | 38 |
| 30 |
| 794 |
| (6 | ) | 31 |
| 68 |
| 49 |
|
| Net interest (expense) | (36 | ) | (44 | ) | (10 | ) | (80 | ) | (40 | ) | (80 | ) | (70 | ) |
| Total revenue (loss) | 2 |
| (14 | ) | 784 |
| (86 | ) | (9 | ) | (12 | ) | (21 | ) |
| Provision for credit losses | (9 | ) | 11 |
| (3 | ) | (1 | ) | (2 | ) | 2 |
| (4 | ) |
| Noninterest expense | 39 |
| 30 |
| 54 |
| 25 |
| 29 |
| 69 |
| 78 |
|
| (Loss) income before income taxes | $ | (28 | ) | $ | (55 | ) | $ | 733 |
| $ | (110 | ) | $ | (36 | ) | $ | (83 | ) | $ | (95 | ) |
| | | | | | | | |
| Average loans and leases | $ | 1,815 |
| $ | 1,961 |
| $ | 1,974 |
| $ | 1,817 |
| $ | 1,764 |
| $ | 1,887 |
| $ | 1,774 |
|
See page 2618 of our 20162019 Annual Report for additional information on the Other segment.
Review of financial results
Total feeFee revenue, net securities gains (losses) and net interest expense include corporate treasury and other investment activity, including hedging activity which offsets between fee revenue decreased $31 million compared with the third quarter of 2016 and $44net interest expense.
Fee revenue increased $5 million compared with the second quarter of 2017. The decrease2019 and $8 million compared with the thirdfirst quarter of 20162020, primarily reflects lower otherreflecting higher
equity investment income, driven by increased losses on our investments in renewable energy, and lower asset-related and net securities gains. The decrease compared with the second quarter of 2017 primarily reflects lease-related gains recorded in the second quarter of 2017 and lower income from corporate/bank-owned life insurance, partially offset by higher net securitiessequentially lower foreign currency translation gains.
Net interest expense decreased $3 million compared with the third quarter of 2016 and $2$4 million compared with the second quarter of 2017. Both decreases primarily reflect higher interest rates.
Noninterest expense, excluding M&I2019 and restructuring charges, decreased $11$8 million compared with the thirdfirst quarter of 2016 and2020, primarily reflecting corporate treasury activity.
Noninterest expense increased $49$10 million compared with the second quarter of 2017. The decrease was2019 and $9 million compared to the first quarter of 2020, primarily driven by lower litigation and other expenses. The increase was primarily driven byreflecting higher staff expense resulting from a methodology change inexpense.
Year-to-date 2020 compared with year-to-date 2019
Losses before taxes decreased $12 million compared with the second quarterfirst six months of 2017 for allocating employee benefits expense to the business segments with no impact to consolidated results. The increase was2019. Total loss decreased $9 million, primarily reflecting higher foreign currency translation gains and net securities gains, partially offset by lower other and professional, legal and other purchased services expenses.
corporate treasury activity.Year-to-date 2017 compared with year-to-date 2016
Income before taxes decreased $29 million compared with the first nine months of 2016. Fee and other revenue decreased $70 million primarily reflecting lower net securities gains and lower other income driven by increased pre-tax losses on our investments in renewable energy. Net interest expense increased $19 million reflecting the impact of higher crediting rates to the businesses. Noninterest expense, excluding M&I and restructuring charges, decreased $71 million primarily reflecting lower staff, other and litigation expenses.
Critical accounting estimates
Our significant accounting policies are described in Note 1 of the Notes to Consolidated Financial Statements in our 20162019 Annual Report.Report and in Note 2 of the Notes to Consolidated Financial Statements in this Form 10-Q. Our critical accounting estimates are those related to the allowance for loancredit losses, and allowance for lending-related commitments, fair value of financial instruments and derivatives, other-than-temporary impairment (“OTTI”), goodwill and other intangibles and pension accounting,litigation and regulatory contingencies, as referenced below.
|
| |
Critical policyaccounting estimates | Reference |
Allowance for loancredit losses and allowance for lending-related commitments | 2016 Annual Report,First quarter 2020 Form 10-Q, pages 29-31.19-20. |
| Fair value of financial instruments and derivatives | 20162019 Annual Report, pages 31-32. |
OTTI | 2016 Annual Report, page 33.23-24. |
| Goodwill and other intangibles | Second quarter 2017 Form 10-Q, page 24. |
Pension accounting | 20162019 Annual Report, pages 34-36.24-25 and First quarter 2020 Form 10-Q, pages 20-21. Also, see below. |
| Litigation and regulatory contingencies | “Legal proceedings” in Note 18 of the Notes to Consolidated Financial Statements. |
Goodwill and other intangible assets
BNY Mellon’s business segments include six reporting units for which goodwill impairment testing is performed on an annual basis. The Investment Services segment is comprised of four reporting units and the Investment and Wealth Management segment is comprised of two reporting units.
In the second quarter of 2020, we performed our annual goodwill impairment test on all six reporting units using an income approach to estimate fair values of each reporting unit. Estimated cash flows used in the income approach were based on management’s projections as of March 31, 2020. The discount rate applied to these cash flows was 10% and incorporated a 7% market equity risk premium. Estimated cash flows extend far into the future, and, by their nature, are difficult to estimate over such an extended time frame.
As a result of the annual goodwill impairment test of the six reporting units, no goodwill impairment was recognized. The fair values of five of the Company’s reporting units were substantially in excess of the respective reporting units’ carrying value. The Investment Management (formerly Asset Management) reporting unit, with $7.2 billion of allocated goodwill, which is one of the two reporting units in the Investment and Wealth Management segment, exceeded its carrying value by approximately 5%. For the Investment Management reporting unit, in the future, small changes in the assumptions, such as changes in the level of AUM and operating margin, could produce a non-cash goodwill impairment. See “Critical accounting estimates” in our 2019 Annual Report for additional information on the annual goodwill impairment test.
BNY Mellon 23
As of June 30, 2020, if the discount rate applied to the estimated cash flows was increased or decreased by 25 basis points, the fair value of the Investment Management reporting unit would decrease or increase by 4%, respectively. Similarly, if the long-term growth rate was increased or decreased by 10 basis points, the fair value of the Investment Management reporting unit would increase or decrease by approximately 1%, respectively.
Consolidated balance sheet review
One of our key risk management objectives is to maintain a balance sheet that remains strong throughout market cycles to meet the expectations of our major stakeholders, including our shareholders, clients, creditors and regulators.
We also seek to ensure that theundertake overall liquidity risk, including intra-dayintraday liquidity risk, that we undertake stays within our risk appetite. The objective of our balance sheet management strategy is to maintain a balance sheet that is characterized by strong liquidity and asset quality, ready access to external funding sources at competitive rates and a strong capital structure that supports our risk-taking activities and is adequate to absorb potential losses. In managing the balance sheet, appropriate consideration is given to balancing the competing needs of maintaining sufficient levels of liquidity and complying with applicable regulations and supervisory expectations while optimizing profitability.
At Sept.June 30, 2017,2020, total assets were $354$442 billion, compared with $333$382 billion at Dec. 31, 2016.2019. The increase in total assets was primarily driven by higher
securities and interest-bearing deposits with the Federal Reserve and other central banks, partially offset by lower loans.resulting from significant deposit inflows. Deposits totaled $231$305 billion at Sept.June 30, 2017 and $2212020, compared with $259 billion at Dec. 31, 2016, and were driven by higher2019. The increase reflects the current macroeconomic environment. Total interest-bearing deposits in non-U.S. offices. At Sept. 30, 2017, total interest-bearing deposits were 50%as a percentage of total interest-earning assets compared with 51%were 59% at June 30, 2020 and 62% at Dec. 31, 2016.2019. The higher level of client deposits received in the first six months of 2020 was primarily placed in the securities portfolio or with the Federal Reserve and other central banks.
At Sept.June 30, 2017, we had $432020, available funds totaled $172 billion of liquid funds (whichwhich include cash and due from banks, interest-bearing deposits with the Federal Reserve and other central banks, interest-bearing deposits with banks and federal funds sold and securities purchased under resale agreements) and $82 billion of cash (including $76 billion of overnight deposits with the Federal Reserve and other central banks) for a total of $125 billion of available funds.agreements. This compares with available funds of $104$145 billion at Dec. 31, 2016.2019. Total available funds as a percentage of total assets were 35%39% at Sept.June 30, 2017 compared with 31%2020 and 38% at Dec. 31, 2016.2019. For additional information on our liquid funds and available funds, see “Liquidity and dividends.”
Investment securitiesSecurities were $120.0$155 billion, or 34%35% of total assets, at Sept.June 30, 2017,2020, compared with $114.7$123 billion, or 34%32% of total assets, at Dec. 31, 2016.2019. The increase in investment securities primarily reflects additional investments in commercial mortgage-
backedU.S. Treasury securities, (“MBS”) andagency residential mortgage-backed securities (“RMBS”), partially offset by fewer investmentssovereign debt/sovereign guaranteed securities, commercial paper/CDs and an increase in consumer asset-backed securities (“ABS”).unrealized pre-tax gain. For additional information on our investment securities portfolio, see “Investment securities”“Securities” and Note 4 of the Notes to Consolidated Financial Statements.
Loans were $59.1$55.4 billion, or 17%13% of total assets, at Sept.June 30, 2017,2020, compared with $64.5$55.0 billion, or 19%14% of total assets, at Dec. 31, 2016.2019. The decrease in loansincrease was
primarily driven by higher overdrafts and higher loans in the commercial portfolio, partially offset by lower margin loans and loans toin the financial institutions.institutions portfolio. For additional information on our loan portfolio, see “Loans” and Note 5 of the Notes to Consolidated Financial Statements.
Long-term debt totaled $28.4$27.6 billion at Sept.June 30, 20172020 and $24.5$27.5 billion at Dec. 31, 2016. The2019. Issuances of $2.25 billion and an increase reflects issuancesin the fair value of $4.75 billion,hedged long-term debt were partially offset by the maturity of $500 millionmaturities and the redemption of trust preferred securities.a redemption. For additional information on long-term debt, see “Liquidity and dividends.”
The Bank of New York Mellon Corporation total shareholders’ equity increased to $40.5 billion from $38.8$43.7 billion at June 30, 2020 from $41.5 billion at Dec. 31, 2016.2019. For additional information, on our capital, see “Capital.”
Country risk exposure
We have exposure toThe following table presents BNY Mellon’s top 10 exposures by country (excluding the U.S.) as of June 30, 2020, as well as certain countries with higherhigher-risk profiles, and is presented on an internal risk profiles. Exposure described below reflects the country of operations and risk of the immediate counterparty.management basis. We continue to monitor our exposure to these and other countries as part of our internal country risk management process. See “Risk management”
The country risk exposure below reflects the Company’s risk to an immediate default of the counterparty or obligor based on the country of residence of the entity which incurs the liability. If there is credit risk mitigation, the country of residence of the entity providing the risk mitigation is the country of risk. The country of risk for securities is generally based on the domicile of the issuer of the security.
|
| | | | | | | | | | | | | | | | | | | | | | | |
| Country risk exposure at June 30, 2020 | Interest-bearing deposits | | | | | | | | Total exposure |
| |
| (in billions) | Central banks |
| Banks |
| | Lending (a) |
| | Securities (b) |
| | Other (c) |
| | |
| Top 10 country exposure: | | | | | | | | | | | |
| United Kingdom (“UK”) | $ | 15.0 |
| $ | 0.5 |
| | $ | 1.4 |
| | $ | 5.6 |
| | $ | 2.3 |
| | $ | 24.8 |
| |
| Germany | 16.7 |
| 0.7 |
| | 0.7 |
| | 4.3 |
| | 0.3 |
| | 22.7 |
| |
| Japan | 19.2 |
| 0.9 |
| | 0.2 |
| | 0.7 |
| | 0.1 |
| | 21.1 |
| |
| Canada | — |
| 2.3 |
| | 0.2 |
| | 4.4 |
| | 0.9 |
| | 7.8 |
| |
| Belgium | 5.9 |
| 0.5 |
| | 0.2 |
| | 0.5 |
| | — |
| | 7.1 |
| |
| China | — |
| 2.9 |
| | 1.5 |
| | — |
| | 0.1 |
| | 4.5 |
| |
| France | — |
| 0.1 |
| | — |
| | 3.1 |
| | 0.3 |
| | 3.5 |
| |
| Ireland | 0.7 |
| 0.1 |
| | 0.3 |
| | 0.7 |
| | 1.5 |
| | 3.3 |
| |
| Luxembourg | 0.8 |
| — |
| | 0.1 |
| | 0.1 |
| | 1.8 |
| | 2.8 |
| |
| Spain | — |
| 0.2 |
| | — |
| | 2.4 |
| | 0.1 |
| | 2.7 |
| |
| Total Top 10 country exposure | $ | 58.3 |
| $ | 8.2 |
|
| $ | 4.6 |
|
| $ | 21.8 |
|
| $ | 7.4 |
|
| $ | 100.3 |
| (d) |
| | | | | | | | | | | | |
| Select country exposure: | | | | | | | | | | | |
| Italy | $ | 0.1 |
| $ | 0.4 |
| | $ | — |
| | $ | 1.1 |
| | $ | — |
| | $ | 1.6 |
| |
| Brazil | — |
| — |
| | 1.2 |
| | 0.1 |
| | 0.1 |
| | 1.4 |
| |
| Total select country exposure | $ | 0.1 |
| $ | 0.4 |
|
| $ | 1.2 |
|
| $ | 1.2 |
|
| $ | 0.1 |
|
| $ | 3.0 |
| |
| |
| (a) | Lending includes loans, acceptances, issued letters of credit, net of participations, and lending-related commitments. |
| |
| (b) | Securities include both the available-for-sale and held-to-maturity portfolios. |
| |
| (c) | Other exposures include over-the-counter (“OTC”) derivative and securities financing transactions, net of collateral. |
| |
| (d) | The top 10 country exposures comprise approximately 80% of our total non-U.S. exposure. |
Based on our internal country risk management process at June 30, 2020, our largest country risk exposure was to the UK, which withdrew from the European Union (“EU”) on Jan. 31, 2020. For additional information, see “Other Matters - UK’s Withdrawal from the EU (“Brexit”)” and“Risk Factors - The UK’s withdrawal from the EU may have negative effects on global economic conditions, global financial markets, and our business and results of operations” both included in our 20162019 Annual Report for additional information on how our exposures are managed.Report.
BNY Mellon has a limited economic interest in the performance of assets of consolidated investment management funds, and therefore they are excluded from this disclosure.
Italy and Spain
Events in recent years have resulted in increased focus on Italy and Spain. We had net exposure of $1.3 billion to Italy and $2.0 billion to Spain at Sept. 30, 2017. We had net exposure of $1.2 billion to Italy and $2.0 billion to Spain at Dec. 31, 2016. At both Sept. 30, 2017 and Dec. 31, 2016,Brazil. The country risk exposure to Italy and Spain primarily consistedconsists of investment grade
sovereign debt. Investment securitiesThe country risk exposure totaled $1.2 billion in Italy and $1.7 billion in Spain at Sept. 30, 2017 and $1.1 billion in Italy and $1.8 billion in Spain at Dec. 31, 2016.to Brazil
Brazil
Current conditions in Brazil have resulted in increased focus on its economic and political stability.is primarily short-term trade finance loans extended to large financial institutions. We also have operations in Brazil providing investment services and investment management services. In addition, at Sept. 30, 2017 and Dec. 31, 2016, we had total net exposure to Brazil of $1.4 billion and $1.3 billion, respectively. This included $1.2 billion and $1.3 billion, respectively, in loans, which are primarily short-term trade finance loans extended to large financial institutions. At Sept. 30, 2017 and Dec. 31, 2016, we held $140 million and $73 million, respectively, of noninvestment grade sovereign debt.
Turkey
Events in recent years have resulted in increased focus on exposure to Turkey. We mainly provide treasury and issuer services, as well as foreign exchange products primarily to the top-10 largest financial institutions in the country. As of Sept. 30, 2017 and Dec. 31, 2016, our exposure totaled $780 million and $713 million, respectively, consisting primarily of syndicated credit facilities and trade finance loans.
Investment securitiesSecurities
In the discussion of our investment securities portfolio, we have included certain credit ratings information because the information can indicate the degree of credit risk to which we are exposed. Significant changes in ratings classifications for our investment securities portfolio could indicate increased credit risk for us and could be accompanied by a reduction in the fair value of our investment securities portfolio.
The following table shows the distribution of our total investment securities portfolio.
|
| | | | | | | | | | | | | | | | | | | | | | | | | | | | | | |
Investment securities portfolio
(dollars in millions) | June 30, 2017 |
| | 3Q17 change in unrealized gain (loss) |
| Sept. 30, 2017 | Fair value as a % of amortized cost (a) |
| Unrealized gain (loss) |
| | Ratings (b) |
| | | | | BB+ and lower | |
Fair value |
| | Amortized cost |
| Fair value |
| | | AAA/ AA- | A+/ A- | BBB+/ BBB- | Not rated |
| Agency RMBS | $ | 49,544 |
| | $ | 81 |
| $ | 50,121 |
| $ | 49,917 |
| | 100 | % | $ | (204 | ) | | 100 | % | — | % | — | % | — | % | — | % |
| U.S. Treasury | 25,325 |
| | (5 | ) | 25,256 |
| 25,159 |
| | 100 |
| (97 | ) | | 100 |
| — |
| — |
| — |
| — |
|
Sovereign debt/sovereign guaranteed (c) | 14,025 |
| | 6 |
| 13,951 |
| 14,102 |
| | 101 |
| 151 |
| | 72 |
| 6 |
| 21 |
| 1 |
| — |
|
Non-agency RMBS (d) | 1,239 |
| | 9 |
| 885 |
| 1,185 |
| | 84 |
| 300 |
| | — |
| 1 |
| 3 |
| 87 |
| 9 |
|
| Non-agency RMBS | 627 |
| | 9 |
| 555 |
| 594 |
| | 97 |
| 39 |
| | 7 |
| 4 |
| 17 |
| 71 |
| 1 |
|
European floating rate notes (e) | 523 |
| | (1 | ) | 393 |
| 387 |
| | 98 |
| (6 | ) | | 63 |
| 37 |
| — |
| — |
| — |
|
| Commercial MBS | 10,574 |
| | 5 |
| 11,051 |
| 11,033 |
| | 100 |
| (18 | ) | | 99 |
| 1 |
| — |
| — |
| — |
|
| State and political subdivisions | 3,299 |
| | 1 |
| 3,109 |
| 3,141 |
| | 101 |
| 32 |
| | 80 |
| 17 |
| — |
| — |
| 3 |
|
Foreign covered bonds (f) | 2,471 |
| | 1 |
| 2,612 |
| 2,626 |
| | 101 |
| 14 |
| | 100 |
| — |
| — |
| — |
| — |
|
| Corporate bonds | 1,318 |
| | 4 |
| 1,262 |
| 1,275 |
| | 101 |
| 13 |
| | 17 |
| 69 |
| 14 |
| — |
| — |
|
| CLOs | 2,642 |
| | 1 |
| 2,542 |
| 2,550 |
| | 100 |
| 8 |
| | 99 |
| — |
| — |
| 1 |
| — |
|
| U.S. government agencies | 2,210 |
| | 2 |
| 2,480 |
| 2,496 |
| | 101 |
| 16 |
| | 100 |
| — |
| — |
| — |
| — |
|
| Consumer ABS | 1,330 |
| | 1 |
| 1,152 |
| 1,157 |
| | 100 |
| 5 |
| | 89 |
| 4 |
| 5 |
| 2 |
| — |
|
Other (g) | 3,758 |
| | (8 | ) | 4,118 |
| 4,122 |
| | 100 |
| 4 |
| | 81 |
| 17 |
| — |
| — |
| 2 |
|
| Total investment securities | $ | 118,885 |
| (h) | $ | 106 |
| $ | 119,487 |
| $ | 119,744 |
| (h) | 100 | % | $ | 257 |
| (h)(i) | 93 | % | 3 | % | 3 | % | 1 | % | — | % |
|
| | | | | | | | | | | | | | | | | | | | | | | | | | | | | | | | |
| Securities portfolio | March 31, 2020 |
| | 2Q20 change in unrealized gain (loss) |
| June 30, 2020 | | Fair value as a % of amortized cost (a) |
| Unrealized gain (loss) |
| | Ratings (b) |
| | | | | | BBB+/ BBB- | BB+ and lower | A1+/A2 & SP-1+ | |
| (dollars in millions) | Fair value |
| | Amortized cost |
| Fair value |
| | | AAA/ AA- | A+/ A- | Not rated |
| Agency RMBS | $ | 57,074 |
| | $ | 455 |
| $ | 58,874 |
| $ | 60,401 |
| | 103 | % | $ | 1,527 |
| | 100 | % | — | % | — | % | — | % | — | % | — | % |
| U.S. Treasury | 24,825 |
| | (31 | ) | 28,224 |
| 28,651 |
| | 102 |
| 427 |
| | 100 |
| — |
| — |
| — |
| — |
| — |
|
Sovereign debt/sovereign guaranteed (c) | 13,833 |
| | 47 |
| 16,698 |
| 16,868 |
| | 101 |
| 170 |
| | 75 |
| 6 |
| 18 |
| 1 |
| — |
| — |
|
| Agency commercial mortgage-backed securities (“MBS”) | 11,416 |
| | 159 |
| 11,339 |
| 11,731 |
| | 103 |
| 392 |
| | 100 |
| — |
| — |
| — |
| — |
| — |
|
Foreign covered bonds (d) | 5,349 |
| | 62 |
| 5,548 |
| 5,598 |
| | 101 |
| 50 |
| | 100 |
| — |
| — |
| — |
| — |
| — |
|
| Supranational | 4,339 |
| | 27 |
| 5,434 |
| 5,484 |
| | 101 |
| 50 |
| | 100 |
| — |
| — |
| — |
| — |
| — |
|
| U.S. government agencies | 3,346 |
| | 29 |
| 4,984 |
| 5,056 |
| | 101 |
| 72 |
| | 100 |
| — |
| — |
| — |
| — |
| — |
|
| Collateralized loan obligations (“CLOs”) | 4,098 |
| | 149 |
| 4,526 |
| 4,432 |
| | 98 |
| (94 | ) | | 99 |
| — |
| — |
| — |
| — |
| 1 |
|
Foreign government agencies (e) | 2,761 |
| | 14 |
| 3,536 |
| 3,575 |
| | 101 |
| 39 |
| | 95 |
| 5 |
| — |
| — |
| — |
| — |
|
| Commercial paper/CDs | 3,465 |
| | 5 |
| 3,386 |
| 3,392 |
| | 100 |
| 6 |
| | — |
| — |
| — |
| — |
| 100 |
| — |
|
| Other asset-backed securities (“ABS”) | 2,220 |
| | 56 |
| 2,724 |
| 2,743 |
| | 101 |
| 19 |
| | 99 |
| — |
| 1 |
| — |
| — |
| — |
|
| Non-agency commercial MBS | 2,446 |
| | 140 |
| 2,517 |
| 2,602 |
| | 103 |
| 85 |
| | 100 |
| — |
| — |
| — |
| — |
| — |
|
Non-agency RMBS (f) | 1,548 |
| | 66 |
| 1,537 |
| 1,672 |
| | 109 |
| 135 |
| | 50 |
| 8 |
| 2 |
| 24 |
| — |
| 16 |
|
| State and political subdivisions | 1,001 |
| | 12 |
| 1,166 |
| 1,196 |
| | 103 |
| 30 |
| | 76 |
| 22 |
| — |
| — |
| 1 |
| 1 |
|
| Corporate bonds | 818 |
| | 28 |
| 789 |
| 831 |
| | 105 |
| 42 |
| | 19 |
| 68 |
| 13 |
| — |
| — |
| — |
|
| Other | 1 |
| | — |
| 1 |
| 1 |
| | 100 |
| — |
| | — |
| — |
| — |
| — |
| — |
| 100 |
|
| Total securities | $ | 138,540 |
| (g) | $ | 1,218 |
| $ | 151,283 |
| $ | 154,233 |
| (g) | 102 | % | $ | 2,950 |
| (g)(h) | 94 | % | 2 | % | 2 | % | — | % | 2 | % | — | % |
| |
| (a) | Amortized cost beforereflects historical impairments. |
| |
| (b) | Represents ratings by Standard & Poor’s (“S&P,&P”) or the equivalent. |
| |
| (c) | Primarily consists of exposure to UK, France, Germany, Spain, Italy and the Netherlands.Singapore. |
| |
| (d) | ThesePrimarily consists of exposure to Canada, UK, Australia and Norway. |
| |
| (e) | Primarily consists of exposure to Germany, the Netherlands and Sweden. |
| |
| (f) | Includes RMBS that were included in the former Grantor Trust of $535 million at March 31, 2020 and were marked-to-market in 2009. We believe these RMBS would receive higher credit ratings if these ratings incorporated, as additional credit enhancements, the difference between the written-down amortized cost and the current face amount of each of these securities. |
| |
(e) | Includes RMBS and commercial MBS. Primarily consists of exposure to UK and the Netherlands. |
| |
(f) | Primarily consists of exposure to Canada, Australia, the Netherlands, Norway and UK.$538 million at June 30, 2020. |
| |
| (g) | Includes commercial paper with a fair value of $700 million and $700 million and money market funds with a fair value of $896 million and $939 million at June 30, 2017 and Sept. 30, 2017, respectively.
|
| |
(h) | Includes net unrealized losses on derivatives hedging securities available-for-sale (including terminated hedges) of $251$1,846 million at March 31, 2020 and $1,817 million at June 30, 2017 and $238 million at Sept. 30, 2017. 2020. |
| |
(i)(h) | UnrealizedIncludes unrealized gains of $324$1,582 million at Sept.June 30, 20172020 related to available-for-sale securities, net of hedges.
|
The fair value of our investment securities portfolio, including related hedges, was $119.7$154.2 billion at Sept.June 30, 2017,2020, compared with $114.3$122.7 billion at Dec. 31, 2016. 2019. The higher level of securitiesincrease primarily reflects additional investments in commercial MBS andU.S. Treasury securities, agency RMBS, partially offsetsovereign debt/ sovereign guaranteed securities, commercial paper/CDs and an increase in unrealized pre-tax gain. At June 30, 2020, the securities portfolio, including the impact of interest rate swap hedges, is 74% fixed rate and 26% floating rate.
Included in the securities portfolio at June 30, 2020 were $1.2 billion of commercial paper and $697 million of CDs purchased from affiliated money market mutual funds in order to provide liquidity support to the funds. Additionally, at June 30, 2020, the securities portfolio included $1.5 billion of commercial paper and CDs purchased from money market mutual funds managed by a decrease in consumer ABS.third parties and funded through the MMLF program.
At Sept.June 30, 2017,2020, the total investment securities portfolio had a net unrealized pre-tax gain, of $257 million compared with a pre-tax loss of $221 million at Dec. 31, 2016, including the impact of related hedges.hedges, of $3.0 billion, compared with $796 million at Dec. 31, 2019. The increase in the net unrealized pre-tax gain was primarily driven by a decrease in long-termlower market interest rates.
The unrealized gain net of tax,(after-tax) on our available-for-sale investment securities portfolio, net of hedges, included in accumulated other comprehensive income (“OCI”) was $226 million$1.2 billion at Sept.June 30, 2017,2020, compared with $45361 million at Dec. 31, 2016.2019. The increase in the unrealized gain, net of tax, was primarily driven by lower market interest rates.
At Sept.June 30, 2017, 93%2020, 94% of the securities in our portfolio were rated AAA/AA-, unchanged compared with 95% at Dec. 31, 2016. 2019.
We routinely test our investment securities for OTTI. See “Critical accounting estimates” for additional information regarding OTTI.
See Note 4 of the Notes to Consolidated Financial Statements for the pre-tax net securities gains (losses) by security type. See Note 15 of the Notes to
Consolidated Financial Statements for details of securities by level in the fair value hierarchy.
The following table presents the amortizable purchase premium (net of discount) related to the investment securities portfolio and accretable discount related to the 2009 restructuring of the investment securities portfolio.
| | Net premium amortization and discount accretion of investment securities (a) | | |
Net premium amortization and discount accretion of securities (a) | | |
| (dollars in millions) | 3Q17 |
| 2Q17 |
| 1Q17 |
| 4Q16 |
| 3Q16 |
| 2Q20 |
| 1Q20 |
| 4Q19 |
| 3Q19 |
| 2Q19 |
|
| Amortizable purchase premium (net of discount) relating to investment securities: | | |
| Amortizable purchase premium (net of discount) relating to securities: | | |
| Balance at period end | $ | 2,053 |
| $ | 2,111 |
| $ | 2,058 |
| $ | 2,188 |
| $ | 2,267 |
| $ | 1,693 |
| $ | 1,555 |
| $ | 1,319 |
| $ | 1,308 |
| $ | 1,315 |
|
Estimated average life remaining at period end (in years) | 5.0 |
| 5.0 |
| 4.9 |
| 4.9 |
| 4.5 |
| 3.7 |
| 3.8 |
| 4.3 |
| 4.2 |
| 4.5 |
|
| Amortization | $ | 140 |
| $ | 134 |
| $ | 138 |
| $ | 146 |
| $ | 163 |
| $ | 125 |
| $ | 101 |
| $ | 100 |
| $ | 95 |
| $ | 91 |
|
| Accretable discount related to the prior restructuring of the investment securities portfolio: | | |
| Accretable discount related to the prior restructuring of the securities portfolio: | | |
| Balance at period end | $ | 302 |
| $ | 279 |
| $ | 299 |
| $ | 315 |
| $ | 331 |
| $ | 145 |
| $ | 159 |
| $ | 163 |
| $ | 171 |
| $ | 181 |
|
Estimated average life remaining at period end (in years) | 6.5 |
| 6.3 |
| 6.2 |
| 6.2 |
| 5.9 |
| 5.8 |
| 6.1 |
| 6.3 |
| 6.3 |
| 6.3 |
|
| Accretion | $ | 24 |
| $ | 25 |
| $ | 25 |
| $ | 25 |
| $ | 24 |
| $ | 10 |
| $ | 11 |
| $ | 12 |
| $ | 13 |
| $ | 13 |
|
| |
| (a) | Amortization of purchase premium decreases net interest revenue while accretion of discount increases net interest revenue. Both were recorded on a level yield basis. |
The following table presents pre-tax net securities gains (losses) by type.
|
| | | | | | | | | | | | | | | |
| Net securities gains (losses) | | | |
| (in millions) | 3Q17 |
| 2Q17 |
| 3Q16 |
| YTD17 |
| YTD16 |
|
| Agency RMBS | $ | 4 |
| $ | — |
| $ | 9 |
| $ | 5 |
| $ | 22 |
|
| U.S. Treasury | 1 |
| (1 | ) | (1 | ) | — |
| 4 |
|
| Foreign covered bonds | — |
| — |
| — |
| — |
| 10 |
|
| Non-agency RMBS | (1 | ) | — |
| (1 | ) | (2 | ) | 1 |
|
| Other | 15 |
| 1 |
| 17 |
| 26 |
| 28 |
|
| Total net securities gains | $ | 19 |
| $ | — |
| $ | 24 |
| $ | 29 |
| $ | 65 |
|
On a quarterly basis, we perform our impairment analysis using several factors, including projected loss severities and default rates. In the third quarter of 2017, this analysis resulted in other-than-temporary credit losses of $1 million primarily in our non-agency RMBS portfolio. At Sept. 30, 2017, if we were to increase or decrease each of our projected loss severity and default rates by 100 basis points on each of the positions in our non-agency RMBS
portfolio, including the securities previously held by the Grantor Trust, credit-related impairment charges on these securities would have increased or decreased by less than $1 million (pre-tax). See Note 4 of the Notes to Consolidated Financial Statements for the projected weighted-average default rates and loss severities.
The following table shows the fair value of the European floating rate notes by geographical location at Sept. 30, 2017. The net unrealized loss on these securities was $6 million at Sept. 30, 2017, compared with $11 million at Dec. 31, 2016.
|
| | | | | | | | | |
European floating rate notes at Sept. 30, 2017 (a) |
| (in millions) | RMBS |
| Other |
| Total fair value |
|
| United Kingdom | $ | 169 |
| $ | 58 |
| $ | 227 |
|
| Netherlands | 160 |
| — |
| 160 |
|
| Total fair value | $ | 329 |
| $ | 58 |
| $ | 387 |
|
| |
(a) | Sixty-three percent of these securities are in the AAA to AA- ratings category. |
See Note 14 of the Notes to Consolidated Financial Statements for details of securities by level in the fair value hierarchy.
Loans
Loans
| | | Total exposure – consolidated | Sept. 30, 2017 | | Dec. 31, 2016 | June 30, 2020 | | Dec. 31, 2019 |
| (in billions) | Loans |
| Unfunded commitments |
| Total exposure |
| | Loans |
| Unfunded commitments |
| Total exposure |
| Loans |
| Unfunded commitments |
| Total exposure |
| | Loans |
| Unfunded commitments |
| Total exposure |
|
| Non-margin loans: | | | | | | |
| Financial institutions | $ | 11.9 |
| $ | 32.7 |
| $ | 44.6 |
| | $ | 14.7 |
| $ | 33.7 |
| $ | 48.4 |
| $ | 10.8 |
| $ | 35.5 |
| $ | 46.3 |
| | $ | 12.5 |
| $ | 34.4 |
| $ | 46.9 |
|
| Commercial | 3.0 |
| 16.6 |
| 19.6 |
| | 2.6 |
| 17.5 |
| 20.1 |
| 2.4 |
| 11.8 |
| 14.2 |
| | 1.8 |
| 12.6 |
| 14.4 |
|
| Subtotal institutional | 14.9 |
| 49.3 |
| 64.2 |
| | 17.3 |
| 51.2 |
| 68.5 |
| 13.2 |
| 47.3 |
| 60.5 |
| | 14.3 |
| 47.0 |
| 61.3 |
|
| Wealth management loans and mortgages | 16.3 |
| 1.1 |
| 17.4 |
| | 15.6 |
| 1.3 |
| 16.9 |
| 15.9 |
| 0.9 |
| 16.8 |
| | 16.2 |
| 0.8 |
| 17.0 |
|
| Commercial real estate | 4.9 |
| 3.5 |
| 8.4 |
| | 4.7 |
| 3.2 |
| 7.9 |
| 6.2 |
| 3.2 |
| 9.4 |
| | 5.6 |
| 3.6 |
| 9.2 |
|
| Lease financings | 1.3 |
| — |
| 1.3 |
| | 1.7 |
| — |
| 1.7 |
| 1.0 |
| — |
| 1.0 |
| | 1.1 |
| — |
| 1.1 |
|
| Other residential mortgages | 0.7 |
| — |
| 0.7 |
| | 0.9 |
| — |
| 0.9 |
| 0.5 |
| — |
| 0.5 |
| | 0.5 |
| — |
| 0.5 |
|
| Overdrafts | 5.8 |
| — |
| 5.8 |
| | 5.5 |
| — |
| 5.5 |
| 4.2 |
| — |
| 4.2 |
| | 2.7 |
| — |
| 2.7 |
|
| Other | 1.3 |
| — |
| 1.3 |
| | 1.2 |
| — |
| 1.2 |
| 1.5 |
| — |
| 1.5 |
| | 1.2 |
| — |
| 1.2 |
|
| Subtotal non-margin loans | 45.2 |
| 53.9 |
| 99.1 |
| | 46.9 |
| 55.7 |
| 102.6 |
| 42.5 |
| 51.4 |
| 93.9 |
| | 41.6 |
| 51.4 |
| 93.0 |
|
| Margin loans | 13.9 |
| — |
| 13.9 |
| | 17.6 |
| 0.1 |
| 17.7 |
| 12.9 |
| 0.1 |
| 13.0 |
| | 13.4 |
| 0.1 |
| 13.5 |
|
| Total | $ | 59.1 |
| $ | 53.9 |
| $ | 113.0 |
| | $ | 64.5 |
| $ | 55.8 |
| $ | 120.3 |
| $ | 55.4 |
| $ | 51.5 |
| $ | 106.9 |
| | $ | 55.0 |
| $ | 51.5 |
| $ | 106.5 |
|
At Sept.June 30, 2017,2020, total exposures of $113.0$106.9 billion decreased 6%increased slightly compared with Dec. 31, 2016, 2019, primarily reflecting lower margin loans and exposure to financial institutions,higher overdrafts, partially offset by higher wealth management loanslower financial institutions exposure and mortgages.margin loans.
Our financial institutions and commercial portfolios comprise our largest concentrated risk. These portfolios comprised 57% of our total exposure at both Sept.June 30, 20172020 and 58% at Dec. 31, 2016.2019. Additionally, most of our overdrafts relate to financial institutions.
Financial institutions
The financial institutions portfolio is shown below.
| | Financial institutions portfolio exposure (dollar amounts in billions) | Sept. 30, 2017 | | Dec. 31, 2016 | |
| Loans |
| Unfunded commitments |
| Total exposure |
| % Inv. grade |
| % due <1 yr. |
| | Loans |
| Unfunded commitments |
| Total exposure |
| |
Financial institutions portfolio exposure (dollars in billions) | | June 30, 2020 | | Dec. 31, 2019 |
| Loans |
| Unfunded commitments |
| Total exposure |
| % Inv. grade |
| % due <1 yr. |
| | Loans |
| Unfunded commitments |
| Total exposure |
|
| Securities industry | $ | 2.9 |
| $ | 19.0 |
| $ | 21.9 |
| 99 | % | 99 | % | | $ | 3.8 |
| $ | 19.2 |
| $ | 23.0 |
| $ | 1.6 |
| $ | 24.5 |
| $ | 26.1 |
| 98 | % | 99 | % | | $ | 2.9 |
| $ | 23.4 |
| $ | 26.3 |
|
| Banks | | 7.0 |
| 1.1 |
| 8.1 |
| 82 |
| 98 |
| | 7.4 |
| 1.1 |
| 8.5 |
|
| Asset managers | 1.6 |
| 6.5 |
| 8.1 |
| 97 |
| 87 |
| | 1.5 |
| 6.2 |
| 7.7 |
| 1.3 |
| 6.3 |
| 7.6 |
| 99 |
| 84 |
| | 1.3 |
| 6.4 |
| 7.7 |
|
| Banks | 6.3 |
| 1.4 |
| 7.7 |
| 68 |
| 94 |
| | 7.9 |
| 2.0 |
| 9.9 |
| |
| Insurance | 0.1 |
| 3.4 |
| 3.5 |
| 99 |
| 17 |
| | 0.1 |
| 3.8 |
| 3.9 |
| 0.1 |
| 2.7 |
| 2.8 |
| 100 |
| 16 |
| | — |
| 2.7 |
| 2.7 |
|
| Government | — |
| 1.0 |
| 1.0 |
| 91 |
| 46 |
| | 0.1 |
| 0.9 |
| 1.0 |
| 0.1 |
| 0.2 |
| 0.3 |
| 100 |
| 64 |
| | 0.1 |
| 0.3 |
| 0.4 |
|
| Other | 1.0 |
| 1.4 |
| 2.4 |
| 98 |
| 45 |
| | 1.3 |
| 1.6 |
| 2.9 |
| 0.7 |
| 0.7 |
| 1.4 |
| 96 |
| 55 |
| | 0.8 |
| 0.5 |
| 1.3 |
|
| Total | $ | 11.9 |
| $ | 32.7 |
| $ | 44.6 |
| 93 | % | 86 | % | | $ | 14.7 |
| $ | 33.7 |
| $ | 48.4 |
| $ | 10.8 |
| $ | 35.5 |
| $ | 46.3 |
| 95 | % | 90 | % | | $ | 12.5 |
| $ | 34.4 |
| $ | 46.9 |
|
The financial institutions portfolio exposure was $44.6$46.3 billion at Sept.June 30, 2017,2020, a decrease of 1% compared with $48.4 billion at Dec. 31, 2016. The decrease2019, primarily reflectsreflecting lower exposure in theto banks and the securities industry portfolios.industry.
Financial institution exposures are high-quality,high quality, with 93%95% of the exposures meeting the investment grade equivalent criteria of our internal credit rating classification at Sept.June 30, 2017.2020. Each customer is assigned an internal credit rating, which is mapped to
an equivalent external rating agency grade based upon a number of dimensions, which are continually evaluated and may change over time. The exposure to financial institutions is generally short-term. Of these exposures, 86% expire within one year and 61% expire within 90 days. In addition, 80% of the financial institutions exposure is secured. For example, securities industry clients and asset managers often borrow against marketable securities held in custody.
For ratings of non-U.S. counterparties, our internal credit rating is generally capped at a rating equivalent to the sovereign rating of the country where the counterparty resides, regardless of the internal credit rating assigned to the counterparty or the underlying collateral.
In addition, 75% of the financial institutions exposure is secured. For example, securities industry clients and asset managers often borrow against marketable securities held in custody.
The exposure to financial institutions is generally short-term with 90% of the exposures expiring within one year. At June 30, 2020, 14% of the exposure to
financial institutions had an expiration within 90 days, compared with 18% at Dec. 31, 2019.
At Sept.June 30, 2017,2020, the secured intraday credit provided to dealers in connection with their tri-party repo activity totaled $18.5$20.6 billion and was primarily included in the securities industry portfolio. Dealers secure the outstanding intraday credit with high-quality liquid collateral having a market value in excess of the amount of the outstanding credit.
Secured intraday credit facilities represent nearly half of the exposure in the financial institutions portfolio and are reviewed and reapproved annually.
Our bankbanks exposure primarily relates to our global trade finance. These exposures are short-term in nature, with 94%98% due in less than one year. The investment grade percentage of our bank exposure was 68%82% at Sept.June 30, 2017,2020, compared with 69%77% at Dec. 31, 2016.2019. Our non-investment grade exposures are primarily trade finance loans in Brazil.
The asset managermanagers portfolio exposure wasis high-quality, with 97%99% of the exposures meeting our investment grade equivalent ratings criteria as of Sept.June 30, 2017.2020. These exposures are generally short-term liquidity facilities, with the vast majority to regulated mutual funds.
Commercial
The commercial portfolio is presented below.
| | | Commercial portfolio exposure | Sept. 30, 2017 | | Dec. 31, 2016 | June 30, 2020 | | Dec. 31, 2019 |
| (dollar amounts in billions) | Loans |
| Unfunded commitments |
| Total exposure |
| % Inv. grade |
| % due <1 yr. |
| | Loans |
| Unfunded commitments |
| Total exposure |
| |
| (dollars in billions) | | Loans |
| Unfunded commitments |
| Total exposure |
| % Inv. grade |
| % due <1 yr. |
| | Loans |
| Unfunded commitments |
| Total exposure |
|
| Manufacturing | $ | 1.4 |
| $ | 6.3 |
| $ | 7.7 |
| 96 | % | 22 | % | | $ | 1.1 |
| $ | 6.7 |
| $ | 7.8 |
| $ | 1.1 |
| $ | 3.5 |
| $ | 4.6 |
| 94 | % | 15 | % | | $ | 0.9 |
| $ | 4.2 |
| $ | 5.1 |
|
| Services and other | 0.9 |
| 4.4 |
| 5.3 |
| 95 |
| 28 |
| | 0.6 |
| 4.3 |
| 4.9 |
| 1.1 |
| 3.3 |
| 4.4 |
| 94 |
| 33 |
| | 0.6 |
| 3.7 |
| 4.3 |
|
| Energy and utilities | 0.6 |
| 4.5 |
| 5.1 |
| 95 |
| 7 |
| | 0.6 |
| 4.7 |
| 5.3 |
| 0.1 |
| 4.1 |
| 4.2 |
| 89 |
| 4 |
| | 0.3 |
| 3.7 |
| 4.0 |
|
| Media and telecom | 0.1 |
| 1.4 |
| 1.5 |
| 95 |
| 15 |
| | 0.3 |
| 1.8 |
| 2.1 |
| 0.1 |
| 0.9 |
| 1.0 |
| 93 |
| — |
| | — |
| 1.0 |
| 1.0 |
|
| Total | $ | 3.0 |
| $ | 16.6 |
| $ | 19.6 |
| 95 | % | 19 | % | | $ | 2.6 |
| $ | 17.5 |
| $ | 20.1 |
| $ | 2.4 |
| $ | 11.8 |
| $ | 14.2 |
| 92 | % | 16 | % | | $ | 1.8 |
| $ | 12.6 |
| $ | 14.4 |
|
The commercial portfolio exposure decreased to $19.6was $14.2 billion at Sept.June 30, 2017,2020, a decrease of 1% from $20.1 billion at Dec. 31, 2016,2019, primarily reflectingdriven by lower manufacturing exposure, partially offset by increased exposure in the media and telecom portfolio.
Utilities-related exposure represents approximately 78% of the energy and utilities portfolio. The remainingutilities.
We have $741 million of total direct exposure to the oil and gas industry, most of which is reflected in the energy and utilities portfolio which includesin the table above. This exposure is to exploration and production, companies, refining pipelines and integrated companies and was 76%65% investment grade at both Sept.June 30, 20172020 and 91% at Dec. 31, 2016.2019.
The following table summarizes the percentage of the financial institutions and commercial portfolio exposures that are investment grade.
|
| | | | | | | | | | |
| Percentage of the portfolios that are investment grade | |
| | Sept. 30, 2017 |
| June 30, 2017 |
| March 31, 2017 |
| Dec. 31, 2016 |
| Sept. 30, 2016 |
|
| |
| Financial institutions | 93 | % | 93 | % | 93 | % | 92 | % | 93 | % |
| Commercial | 95 | % | 96 | % | 95 | % | 94 | % | 94 | % |
Our credit strategy is to focus on investment grade clients that are active users of our non-credit services. The executionfollowing table summarizes the percentage of our strategy has resulted in 93% of ourthe financial institutions portfolio and 95% of our commercial portfolio rated asexposures that are investment grade at Sept. 30, 2017.grade.
|
| | | | | | | | | | |
| Percentage of the portfolios that are investment grade | |
| | Quarter ended |
| | June 30, 2020 |
| March 31,
2020 |
| Dec. 31, 2019 |
| Sept. 30, 2019 |
| June 30,
2019 |
|
| Financial institutions | 95 | % | 96 | % | 95 | % | 95 | % | 95 | % |
| Commercial | 92 | % | 94 | % | 96 | % | 95 | % | 95 | % |
Wealth management loans and mortgages
Our wealth management exposure was $17.4$16.8 billion at Sept.June 30, 2017,2020, compared with $16.9$17.0 billion at Dec. 31, 2016.2019. Wealth management loans and mortgages primarily consist of loans to high-net-worth individuals, which are secured by marketable securities and/or residential property. Wealth management mortgages are primarily interest-only, adjustable-rate mortgages with a weighted-average loan-to-value ratio of 62% at origination. In the wealth management portfolio, lessLess than 1% of the mortgages were past due at Sept.June 30, 2017.2020.
At Sept.June 30, 2017,2020, the wealth management mortgage portfolio consisted of the following geographic concentrations: California - 24%23%; New York - 19%17%; Massachusetts - 11%10%; Florida - 8%; and other - 38%42%.
The composition of the commercial real estate portfolio by asset class, including percentage secured, is presented below.
|
| | | | | | | | | | | |
| Composition of commercial real estate portfolio by asset class | June 30, 2020 | | Dec. 31, 2019 |
| | Total exposure |
| Percentage secured |
| | Total exposure |
| Percentage secured |
|
| (in billions) | |
| Office | $ | 3.2 |
| 40 | % | | $ | 3.1 |
| 40 | % |
| Residential | 3.1 |
| 44 |
| | 3.1 |
| 44 |
|
| Retail | 1.0 |
| 9 |
| | 1.0 |
| 8 |
|
| Hotels | 0.6 |
| 2 |
| | 0.6 |
| 2 |
|
| Mixed-use | 0.6 |
| 2 |
| | 0.6 |
| 2 |
|
| Healthcare | 0.3 |
| 1 |
| | 0.3 |
| — |
|
| Other | 0.6 |
| 2 |
| | 0.5 |
| 4 |
|
| Total commercial real estate | $ | 9.4 |
| 65 | % | | $ | 9.2 |
| 65 | % |
Our commercial real estate exposure totaled $8.4$9.4 billion at Sept.June 30, 2017,2020, compared with $7.9$9.2 billion at Dec. 31, 2016.2019. Our income-producing commercial real estate facilities are focused on experienced owners and are structured with moderate leverage based on existing cash flows. Our commercial real estate lending activities also include construction and renovation facilities. Our client base consists of experienced developers and long-term holders of real estate assets. Loans are approved on the basis of existing or projected cash flows and supported by appraisals and knowledge of local market conditions. Development loans are structured with moderate leverage, and in many instances, involve some level of recourse to the developer.
At Sept.June 30, 2017, 59% of our commercial real estate portfolio was secured. The secured portfolio is diverse by project type, with 45% secured by residential buildings, 35% secured by office buildings, 12% secured by retail properties and 8% secured by other categories. Approximately 97% of2020, the unsecured portfolio consists of real estate investment trusts (“REITs”) and real estate operating companies, which are both predominantlyprimarily investment grade.
At Sept.June 30, 2017,2020, our commercial real estate portfolio consistsconsisted of the following concentrations: New York metro - 40%41%; REITs and real estate operating companies - 40%35%; and other - 20%24%.
Lease financings
The leasinglease financings portfolio exposure totaled $1.3$1.0 billion at Sept.June 30, 2017 compared with $1.72020 and $1.1 billion at Dec. 31, 2016.2019. At Sept.June 30, 2017,2020, approximately 94%98% of the leasing portfolio exposure was investment grade, or investment grade equivalent.
At Sept. 30, 2017, the lease financings portfolioequivalent and consisted of exposures backed by well-diversified assets, includingprimarily large-ticket transportation equipment.equipment and real estate. The largest component of our lease residual value exposure is freight-related rail cars. Assets are both domestic and
foreign-based, with primary concentrations in the U.S. and Germany.
Other residential mortgages
The other residential mortgages portfolio primarily consists of 1-4 family residential mortgage loans and totaled $741$450 million at Sept.June 30, 20172020 and $854$494 million at Dec. 31, 2016.2019. Included in this portfolio at Sept.June 30, 2017 are $1812020 were $81 million of mortgage loans
purchased in 2005, 2006 and the first quarter of 2007, that are predominantly prime mortgage loans, with a small portion of Alt-A loans. As of Sept. 30, 2017, the purchased loans in this portfolio had a weighted-average loan-to-value ratio of 76% at origination and 11%which 25% of the serviced loan balance was at least 60 days delinquent. The properties securing the prime and Alt-A mortgage loans were located (in order of concentration) in California, Florida, Virginia, the tri-state area (New York, New Jersey and Connecticut) and Maryland.
To determine the projected loss on the prime and Alt-A mortgage portfolios, we calculate the total estimated defaults of these mortgages and multiply that amount by an estimate of realizable value upon sale in the marketplace (severity).
Overdrafts
Overdrafts primarily relate to custody and securities clearance clients. Overdrafts occur on a daily basis in the custody and securities clearance businessclients and are generally repaid within two business days.
Other loans
Other loans primarily include loans to consumers that are fully collateralized with equities, mutual funds and fixed incomefixed-income securities.
Margin loans
Margin loans areloan exposure of $13.0 billion at June 30, 2020 and $13.5 billion at Dec. 31, 2019 was collateralized with marketable securities, and borrowerssecurities. Borrowers are required to maintain a daily collateral margin in excess of 100% of the value of the loan. Margin loans included $4.2$3.6 billion at Sept.June 30, 20172020 and $6.3 billion at Dec. 31, 20162019 related to a term loan program that offers fully collateralized loans to broker-dealers.
Asset quality and allowance
Allowance for credit losses
Our credit strategy is to focus on investment grade clients who are active users of our non-credit services. Our primary exposure to the credit risk of a
customer consists of funded loans, unfunded contractual commitments to lend, standby letters of credit (“SBLC”) and overdrafts associated with our custody and securities clearance businesses.
The following table details changes in our allowance for credit losses.
BNY Mellon 29
| | | Allowance for credit losses activity | Sept. 30, 2017 |
| June 30, 2017 |
| Dec. 31, 2016 |
| Sept. 30, 2016 |
| June 30, 2020 |
| | March 31, 2020 |
| | Dec. 31, 2019 |
| June 30, 2019 |
|
| (dollar amounts in millions) |
| (dollars in millions) | | June 30, 2020 |
| | March 31, 2020 |
| | Dec. 31, 2019 |
| June 30, 2019 |
|
| Beginning balance of allowance for credit losses | |
| Impact of adopting ASU 2016-13 | | N/A |
| | (55 | ) | (a) | N/A |
| N/A |
|
| Provision for credit losses | | 143 |
| | 169 |
| (a) | (8 | ) | (8 | ) |
| Net recoveries (charge-offs): | | | | | | |
| Loans: | | | | | | |
| Other residential mortgages | | 3 |
| | — |
| | — |
| 2 |
|
| Wealth management loans and mortgages | | — |
| | — |
| | — |
| (1 | ) |
| Other financial instruments | | — |
| | (1 | ) | | N/A |
| N/A |
|
| Net recoveries (charge-offs) | | 3 |
| | (1 | ) | | — |
| 1 |
|
| Ending balance of allowance for credit losses | | $ | 475 |
| | $ | 329 |
| | $ | 216 |
| $ | 241 |
|
| | | | | | | |
| Allowance for loan losses | | $ | 302 |
| | $ | 140 |
| | $ | 122 |
| $ | 146 |
|
| Allowance for lending-related commitments | | 152 |
| | 148 |
| | 94 |
| 95 |
|
| Allowance for financial instruments | | 21 |
| (b) | 41 |
| (b) | N/A |
| N/A |
|
| Total allowance for credit losses | | $ | 475 |
| | $ | 329 |
| | $ | 216 |
| $ | 241 |
|
| | | | | | | |
| Non-margin loans | $ | 45,196 |
| $ | 47,516 |
| $ | 46,868 |
| $ | 48,411 |
| $ | 42,488 |
| | $ | 49,253 |
| | $ | 41,567 |
| $ | 41,794 |
|
| Margin loans | 13,872 |
| 14,157 |
| 17,590 |
| 17,557 |
| 12,909 |
| | 13,115 |
| | 13,386 |
| 10,602 |
|
| Total loans | $ | 59,068 |
| $ | 61,673 |
| $ | 64,458 |
| $ | 65,968 |
| $ | 55,397 |
| | $ | 62,368 |
| | $ | 54,953 |
| $ | 52,396 |
|
| Beginning balance of allowance for credit losses | $ | 270 |
| $ | 276 |
| $ | 274 |
| $ | 280 |
| |
| Provision for credit losses | (6 | ) | (7 | ) | 7 |
| (19 | ) | |
| Net recoveries: | | |
| Other residential mortgages | 1 |
| 1 |
| — |
| — |
| |
| Financial institutions | — |
| — |
| — |
| 13 |
| |
| Net recoveries | 1 |
| 1 |
| — |
| 13 |
| |
| Ending balance of allowance for credit losses | $ | 265 |
| $ | 270 |
| $ | 281 |
| $ | 274 |
| |
| Allowance for loan losses | $ | 161 |
| $ | 165 |
| $ | 169 |
| $ | 148 |
| |
| Allowance for lending-related commitments | 104 |
| 105 |
| 112 |
| 126 |
| |
| Allowance for loan losses as a percentage of total loans | 0.27 | % | 0.27 | % | 0.26 | % | 0.22 | % | 0.55 | % | | 0.22 | % | | 0.22 | % | 0.28 | % |
| Allowance for loan losses as a percentage of non-margin loans | 0.36 |
| 0.35 |
| 0.36 |
| 0.31 |
| 0.71 |
| | 0.28 |
| | 0.29 |
| 0.35 |
|
| Total allowance for credit losses as a percentage of total loans | 0.45 |
| 0.44 |
| 0.44 |
| 0.42 |
| |
| Total allowance for credit losses as a percentage of non-margin loans | 0.59 |
| 0.57 |
| 0.60 |
| 0.57 |
| |
| Allowance for loan losses and lending-related commitments as a percentage of total loans | | 0.82 |
| | 0.46 |
|
| 0.39 |
| 0.46 |
|
| Allowance for loan losses and lending-related commitments as a percentage of non-margin loans | | 1.07 |
| | 0.58 |
|
| 0.52 |
| 0.58 |
|
| |
| (a) | In the first quarter of 2020, we adopted new accounting guidance included in ASU 2016-13, Financial Instruments – Credit Losses: Measurement of Credit Losses On Financial Instruments, on a prospective basis. See Note 2 of the Notes to Consolidated Financial Statement for additional information. Includes the reclassification of credit-related reserves on accounts receivable of $4 million. |
| |
| (b) | Includes allowance for credit losses on federal funds sold and securities purchased under resale agreements, available-for-sale securities, held-to-maturity securities, accounts receivable, cash and due from banks and interest-bearing deposits with banks. |
N/A - Not applicable.
Net recoveries were $1 million in the third quarter of 2017 and second quarter of 2017. Net recoveries in the third quarter of 2016 of $13 million were recorded in the financial institutions portfolio.
The provision for credit losses was a credit of $6 million in the third quarter of 2017, a credit of $7$143 million in the second quarter of 20172020, primarily driven by our commercial real estate portfolio and a credit of $19 million inreflecting increased downgrades and the third quarter of 2016.
The total allowance for credit losses was $265 million at Sept. 30, 2017, $281 million at Dec. 31, 2016 and $274 million at Sept. 30, 2016. The ratiocontinuation of the total allowance for credit losses to non-margin loans was 0.59% at Sept. 30, 2017, 0.60% at Dec. 31, 2016 and 0.57% at Sept. 30, 2016. The ratio of the allowance for loan losses to non-margin loans was 0.36% at Sept. 30, 2017, 0.36% at Dec. 31, 2016 and 0.31% at Sept. 30, 2016.challenging macroeconomic outlook.
We had $13.9$12.9 billion of secured margin loans on our balance sheet at Sept.June 30, 20172020 compared with $17.6$13.4 billion at Dec. 31, 2016 and $17.6 billion at Sept. 30, 2016.2019. We have rarely suffered a loss on these types of loans and do not allocate any of our allowance for credit losses to them.loans. As a result, we believe that the ratio of total allowance for creditloan losses and lending-related commitments as a percentage of non-margin loans is a more appropriate metric to measure the adequacy of the reserve.
Reverse repurchase agreements at June 30, 2020 were fully secured with high quality collateral. As a result, there was no allowance for credit losses related to these assets at June 30, 2020. This compares to an $18 million allowance at March 31, 2020. The decrease is driven by a reduction in exposure and improvement in collateral liquidity and values related to reverse repurchase agreements collateralized by non-agency debt securities.
The allowance for loan losses and allowance for lending-related commitments represent management’s estimate of probablelifetime expected losses inherent in our credit portfolio. This evaluation process is subject to numerous estimates and judgments. For additional information on this process, see “Critical
accounting estimates” in our 2016 Annual Report. To the extent actual results differ from forecasts or
management’s judgment, the allowance for credit losses may be greater or less than future charge-offs.
Based on an evaluation of the allowance for credit losses as discussed in “Critical accounting estimates” and Note 12 of the Notes to Consolidated Financial Statements, both in our 2016 Annual Report, we have allocated our allowance for credit lossesloans and lending-related commitments as follows.presented below.
|
| | | | | | | | | |
| | Allocation of allowance | Sept. 30, 2017 |
| June 30, 2017 |
| Dec. 31, 2016 |
| Sept. 30, 2016 |
|
| |
| | Commercial | 31 | % | 30 | % | 29 | % | 33 | % |
| | Commercial real estate | 28 |
| 28 |
| 26 |
| 23 |
|
| | Foreign | 13 |
| 13 |
| 13 |
| 11 |
|
| | Financial institutions | 9 |
| 8 |
| 9 |
| 11 |
|
| | Wealth management (a) | 8 |
| 9 |
| 8 |
| 7 |
|
| | Other residential mortgages | 8 |
| 8 |
| 10 |
| 10 |
|
| | Lease financing | 3 |
| 4 |
| 5 |
| 5 |
|
| | Total | 100 | % | 100 | % | 100 | % | 100 | % |
|
| | | | | | | | | | |
| | Allocation of allowance for loan losses and lending-related commitments | | | | | |
| | June 30, 2020 |
| March 31, 2020 |
| (a) | Dec. 31, 2019 |
| June 30, 2019 |
|
| |
| | Commercial real estate | 81 | % | 72 | % | | 35 | % | 30 | % |
| | Commercial | 9 |
| 9 |
| | 28 |
| 32 |
|
| | Foreign | — |
| — |
| (b) | 11 |
| 13 |
|
| | Financial institutions | 4 |
| 6 |
| | 9 |
| 9 |
|
| | Wealth management (c) | 2 |
| 3 |
| | 9 |
| 8 |
|
| | Other residential mortgages | 3 |
| 5 |
| | 6 |
| 6 |
|
| | Lease financings | 1 |
| 5 |
| | 2 |
| 2 |
|
| | Total | 100 | % | 100 | % | | 100 | % | 100 | % |
| |
| (a) | In the first quarter of 2020, we adopted new accounting guidance included in ASU 2016-13, Financial Instruments – Credit Losses: Measurement of Credit Losses on Financial Instruments, on a prospective basis. See Note 2 of the Notes to Consolidated Financial Statement for additional information. |
| |
| (b) | The allowance related to foreign exposure has been reclassified to the respective classes of financing receivables. |
| |
| (c) | Includes the allowance for credit losses on wealth management mortgages. |
The allocation of the allowance for credit losses is inherently judgmental, and the entire allowance for credit losses is available to absorb credit losses regardless of the nature of the loss.losses.
TheOur allowance for credit ratinglosses is sensitive to a number of inputs, most notably the credit ratings assigned to each borrower as well as macroeconomic forecast assumptions that are incorporated in our estimate of credit is a significant variablelosses through the expected life of the loan portfolio. Thus, as the macroeconomic environment and related forecasts change, the allowance for credit losses may change materially. The following sensitivity analyses do not represent management’s expectations of the deterioration of our portfolios or the economic environment, but are provided as hypothetical scenarios to assess the sensitivity of the allowance for credit losses to changes in determining the allowance.key inputs. If each credit were rated one grade better, the allowance would have decreased by $65$125 million, whileand if each credit were rated one grade worse, the allowance would have increased by $109$202 million. Similarly,Our multi-scenario based macroeconomic forecast used in determining the June 30, 2020
allowance for credit losses consisted of three recessionary scenarios, each of varying severity and duration. The baseline scenario reflects moderate recovery across most key variables, whereas the upside scenario is principally a V-shaped recovery, and the downside scenario is reflective of W-shaped recovery in GDP and unemployment and deeper reductions in asset prices compared to the baseline. We placed the most weight on our baseline scenario, with the remaining weighting resulting in slightly more weight placed on the downside scenario than the upside scenario. From a sensitivity perspective, at June 30, 2020, if we had applied 100% weighting to the loss given default were one rating worse,downside scenario, the allowance for credit losses would have been approximately $245 million higher.
Nonperforming assets
The table below presents our nonperforming assets.
|
| | | | | | |
| Nonperforming assets | June 30, 2020 |
| Dec. 31, 2019 |
|
| (dollars in millions) |
| Nonperforming loans: | | |
| Other residential mortgages | $ | 58 |
| $ | 62 |
|
| Wealth management loans and mortgages | 28 |
| 24 |
|
| Total nonperforming loans | 86 |
| 86 |
|
| Other assets owned | 2 |
| 3 |
|
| Total nonperforming assets | $ | 88 |
| $ | 89 |
|
| Nonperforming assets ratio | 0.16 | % | 0.16 | % |
Nonperforming assets ratio, excluding margin loans | 0.21 |
| 0.21 |
|
Allowance for loan losses/nonperforming loans (a) | 351.2 |
| 141.9 |
|
Allowance for loan losses/nonperforming assets (a) | 343.2 |
| 137.1 |
|
Allowance for loan losses and lending-related commitments/nonperforming loans (a)(b) | 527.9 |
| 251.2 |
|
Allowance for loan losses and lending-related commitments/nonperforming assets (a)(b) | 515.9 |
| 242.7 |
|
| |
| (a) | In the first quarter of 2020, we adopted new accounting guidance included in ASU 2016-13, Financial Instruments – Credit Losses: Measurement of Credit Losses on Financial Instruments, on a prospective basis. See Note 2 of the Notes to Consolidated Financial Statement for additional information. |
| |
| (b) | Total allowance for credit losses includes both the allowance for credit losses on loans and lending-related commitments. |
Lost interest
allowanceInterest revenue would have increased by $41$1 million whilein the second quarter of 2020 and first quarter of 2020, $4 million in the second quarter of 2019, $3 million in the first six months of 2020 and $7 million in the first six months of 2019, if the loss given default were one rating better, the allowance would have decreased by $29 million. For impaired credits, if the net carrying value of thenonperforming
loans was 10% higherat period-end had been performing for the entire respective periods.
Loan modifications
Due to the coronavirus pandemic, there have been two forms of relief provided for classifying loans as troubled debt restructurings (“TDRs”): The Coronavirus Aid, Relief, and Economic Security Act (the “CARES Act”) and the Interagency Guidance. See Note 2 of the Notes to Consolidated Financial Statements for additional details on this guidance. Financial institutions may account for eligible loan modifications either under the CARES Act or lower, the allowance wouldInteragency Guidance and we have decreasedelected to apply both, as applicable, in providing borrowers with loan modification relief in response to the coronavirus pandemic. We modified loans totaling $282 million in the second quarter of 2020 by providing short-term loan payment forbearances or increased bymodified principal and/or interest payments. We did not identify these modifications as TDRs. These loans were primarily residential mortgage and commercial real estate loans. During the loan modification period, these loans are not reported as nonperforming or past due. We modified other residential mortgage loans totaling less than $1 million respectively.in both the second quarter of 2019 and first quarter of 2020.
Nonperforming assets
The following table shows the distribution of nonperforming assets.
|
| | | | | | | | | |
| Nonperforming assets | Sept. 30, 2017 |
| June 30, 2017 |
| Dec. 31, 2016 |
|
| (dollars in millions) |
| Nonperforming loans: | | | |
| Other residential mortgages | $ | 80 |
| $ | 84 |
| $ | 91 |
|
| Wealth management loans and mortgages | 8 |
| 10 |
| 8 |
|
| Financial institutions | 2 |
| 2 |
| — |
|
| Lease financings | — |
| — |
| 4 |
|
| Total nonperforming loans | 90 |
| 96 |
| 103 |
|
| Other assets owned | 4 |
| 4 |
| 4 |
|
| Total nonperforming assets | $ | 94 |
| $ | 100 |
| $ | 107 |
|
| Nonperforming assets ratio | 0.16 | % | 0.16 | % | 0.17 | % |
| Nonperforming assets ratio, excluding margin loans | 0.21 |
| 0.21 |
| 0.23 |
|
| Allowance for loan losses/nonperforming loans | 178.9 |
| 171.9 |
| 164.1 |
|
| Allowance for loan losses/nonperforming assets | 171.3 |
| 165.0 |
| 157.9 |
|
| Total allowance for credit losses/nonperforming loans | 294.4 |
| 281.3 |
| 272.8 |
|
| Total allowance for credit losses/nonperforming assets | 281.9 |
| 270.0 |
| 262.6 |
|
|
| | | | | | | | | |
| Nonperforming assets activity | Sept. 30, 2017 |
| June 30, 2017 |
| Dec. 31, 2016 |
|
| (in millions) |
| Balance at beginning of quarter | $ | 100 |
| $ | 107 |
| $ | 109 |
|
| Additions | 3 |
| 2 |
| 4 |
|
| Return to accrual status | (1 | ) | — |
| — |
|
| Charge-offs | — |
| — |
| — |
|
| Paydowns/sales | (8 | ) | (9 | ) | (6 | ) |
| Balance at end of quarter | $ | 94 |
| $ | 100 |
| $ | 107 |
|
Nonperforming assets decreased $13 million compared with Dec. 31, 2016, primarily reflecting lower other residential mortgages and lease financings.
The nonperforming assets ratio was 0.16% at Sept. 30, 2017, 0.16% at June 30, 2017 and 0.17% at Dec. 31, 2016. The ratio of the allowance for loan losses to nonperforming loans was 178.9% at Sept. 30, 2017, 171.9% at June 30, 2017 and 164.1% at Dec. 31, 2016. The ratio of the total allowance for credit losses to nonperforming loans was 294.4% at Sept. 30, 2017, 281.3% at June 30, 2017 and 272.8% at Dec. 31, 2016.
Deposits
Increased volatility coupled with the interest rate environment led to an increase in deposit levels as our clients increased the levels of cash placed with us. Total deposits were $231.0$305.5 billion at Sept.June 30, 2017,2020, an increase of 4%18%, compared with $221.5$259.5 billion at
Dec. 31, 2016. The increase in deposits primarily reflects higher interest-bearing deposits in non-U.S. offices and noninterest-bearing deposits in U.S. offices, partially offset by lower interest-bearing deposits in U.S. offices.2019.
Noninterest-bearing deposits were $80.4$78.1 billion at Sept.June 30, 20172020 compared with $78.3$57.6 billion at Dec. 31, 2016.2019. Interest-bearing deposits were $150.6$227.4 billion at Sept.June 30, 20172020 compared with $143.2$201.9 billion at Dec. 31, 2016.2019. See “Impact of coronavirus pandemic on our business” for additional information.
Short-term borrowings
We fund ourselves primarily through deposits and, to a lesser extent, other short-term borrowings and long-term debt. Short-term borrowings consist of federal funds purchased and securities sold under repurchase agreements, payables to customers and broker-dealers,broker-
dealers, commercial paper and other borrowed funds. Certain othershort-term borrowings, for example, securities sold under repurchase agreements, require the delivery of securities as collateral.
See “Liquidity and dividends” for a discussion of long-term debt and liquidity metrics that we monitor.
Information related to federal funds purchased and securities sold under repurchase agreements is presented below.
| | Federal funds purchased and securities sold under repurchase agreements | Federal funds purchased and securities sold under repurchase agreements | Federal funds purchased and securities sold under
repurchase agreements |
| | Quarter ended | Quarter ended |
| (dollars in millions) | Sept. 30, 2017 |
| June 30, 2017 |
| Sept. 30, 2016 |
| June 30, 2020 |
| March 31, 2020 |
| June 30, 2019 |
|
| Maximum month-end balance during the quarter | $ | 21,850 |
| $ | 19,786 |
| $ | 11,184 |
| $ | 14,512 |
| $ | 16,644 |
| $ | 12,127 |
|
Average daily balance | $ | 21,403 |
| $ | 17,970 |
| $ | 9,585 |
| $ | 14,209 |
| $ | 13,919 |
| $ | 11,809 |
|
Weighted-average rate during the quarter | 1.30 | % | 0.84 | % | 0.24 | % | 0.03 | % | 7.96 | % | 12.64 | % |
Ending balance | $ | 10,314 |
| $ | 10,934 |
| $ | 8,052 |
| $ | 14,512 |
| $ | 13,128 |
| $ | 11,757 |
|
Weighted-average rate at period end | 1.35 | % | 0.93 | % | 0.25 | % | 0.00 | % | 3.93 | % | 14.43 | % |
| |
| (a) | Includes the average impact of offsetting under enforceable netting agreements of $66,606 million in the second quarter of 2020, $80,216 million in the first quarter of 2020 and $50,710 million in the second quarter of 2019. On a Non-GAAP basis, excluding the impact of offsetting, the weighted-average rates would have been 0.00% for the second quarter of 2020, 1.18% for the first quarter of 2020 and 2.39% for the second quarter of 2019. We believe providing the rates excluding the impact of netting is useful to investors as it is more reflective of the actual rates paid. |
| |
| (b) | Includes the impact of offsetting under enforceable netting agreements of $48,615 million at June 30, 2020, $80,203 million at March 31, 2020 and $78,433 million at June 30, 2019. |
Fluctuations of federal funds purchased and securities sold under repurchase agreements between periods resulted fromreflect changes in overnight borrowing opportunities. The increasedecreases in the weighted-average rates compared with Sept.June 30, 2016,2019and March 31, 2020 primarily reflects increases inreflect lower interest rates and repurchase agreement activity with the Fed Funds effective rate.Fixed Income Clearing Corporation (“FICC”), where we record interest expense gross, but the ending and average balances reflect the impact of offsetting under enforceable netting agreements. This activity primarily relates to government securities collateralized resale and repurchase agreements executed with clients that are novated to and settle with the FICC.
Information related to payables to customers and broker-dealers is presented below.
| | Payables to customers and broker-dealers | | | Quarter ended | Quarter ended |
| (dollars in millions) | Sept. 30, 2017 |
| June 30, 2017 |
| Sept. 30, 2016 |
| June 30, 2020 |
| March 31, 2020 |
| June 30, 2019 |
|
| Maximum month-end balance during the quarter | $ | 21,563 |
| $ | 21,622 |
| $ | 21,162 |
| $ | 25,012 |
| $ | 24,016 |
| $ | 19,149 |
|
Average daily balance (a) | $ | 21,280 |
| $ | 21,078 |
| $ | 20,616 |
| $ | 23,944 |
| $ | 20,629 |
| $ | 18,679 |
|
Weighted-average rate during the quarter (a) | 0.42 | % | 0.30 | % | 0.07 | % | (0.01 | )% | 0.73 | % | 1.76 | % |
| Ending balance | $ | 21,176 |
| $ | 21,622 |
| $ | 21,162 |
| $ | 25,012 |
| $ | 24,016 |
| $ | 18,946 |
|
| Weighted-average rate at period end | 0.43 | % | 0.34 | % | 0.07 | % | (0.01 | )% | 0.28 | % | 1.73 | % |
| |
| (a) | The weighted-average rate is calculated based on, and is applied to, the average interest-bearing payables to customers and broker-dealers, which were $18,516 million in the third quarter of 2017, $20,609$18,742 million in the second quarter of 2017 and $16,8732020, $16,386 million in the thirdfirst quarter of 2016. 2020 and $15,666 million in the second quarter of 2019. |
Payables to customers and broker-dealers represent funds awaiting re-investment and short sale proceeds payable on demand. Payables to customers and broker-dealers are driven by customer trading activity levels and market volatility.
Information related to commercial paper is presented below.
| | | Commercial paper | Quarter ended | |
| | | Quarter ended |
| (dollars in millions) | Sept. 30, 2017 |
| June 30, 2017 |
| Sept. 30, 2016 |
| June 30, 2020 |
| March 31, 2020 |
| June 30, 2019 |
|
| Maximum month-end balance during the quarter | $ | 4,277 |
| $ | 2,193 |
| $ | 1,000 |
| $ | 665 |
| $ | 3,379 |
| $ | 8,894 |
|
| Average daily balance | $ | 2,736 |
| $ | 2,215 |
| $ | 1,173 |
| $ | 191 |
| $ | 1,581 |
| $ | 2,957 |
|
| Weighted-average rate during the quarter | 1.15 | % | 0.95 | % | 0.35 | % | 1.02 | % | 1.56 | % | 2.43 | % |
| Ending balance | $ | 2,501 |
| $ | 876 |
| $ | — |
| $ | 665 |
| $ | 1,121 |
| $ | 8,894 |
|
| Weighted-average rate at period end | 1.18 | % | 0.98 | % | — | % | 0.02 | % | 1.57 | % | 2.35 | % |
The Bank of New York Mellon our largest bank subsidiary, issues commercial paper that matures within 397 days from the date of issue and is not redeemable prior to maturity or subject to voluntary prepayment. The increasefluctuations in the commercial paper balances compared with prior periods, primarily reflects managementreflect funding of overall liquidity. The increaseinvestments in weighted-average rates, compared with prior periods, primarily reflects increases in the Fed Funds effective rate and the issuance of higher-yielding term commercial paper.short-term assets.
Information related to other borrowed funds is presented below.
| | | Other borrowed funds | Quarter ended | |
| | | Quarter ended |
| (dollars in millions) | Sept. 30, 2017 |
| June 30, 2017 |
| Sept. 30, 2016 |
| June 30, 2020 |
| March 31, 2020 |
| June 30, 2019 |
|
| Maximum month-end balance during the quarter | $ | 3,353 |
| $ | 2,379 |
| $ | 993 |
| $ | 2,451 |
| $ | 1,544 |
| $ | 2,732 |
|
| Average daily balance | $ | 2,197 |
| $ | 1,193 |
| $ | 874 |
| $ | 2,272 |
| $ | 719 |
| $ | 2,455 |
|
| Weighted-average rate during the quarter | 1.38 | % | 1.24 | % | 0.76 | % | 1.30 | % | 2.27 | % | 3.36 | % |
| Ending balance | $ | 3,353 |
| $ | 1,338 |
| $ | 993 |
| $ | 1,628 |
| $ | 1,544 |
| $ | 1,921 |
|
| Weighted-average rate at period end | 1.56 | % | 1.69 | % | 0.75 | % | 1.37 | % | 2.01 | % | 3.84 | % |
Other borrowed funds primarily include borrowings from the Federal Home Loan Bank, (“FHLB”),the Federal Reserve Bank of Boston under the MMLF program, overdrafts of sub-custodian account balances in our Investment Services businesses, capitalfinance lease obligationsliabilities and borrowings under lines of credit by our Pershing subsidiaries. Overdrafts typically relate to timing differences for settlements. The decrease in other borrowed funds compared with June 30, 2019 primarily reflects a decrease in borrowings from the Federal Home Loan Bank, partially offset by borrowings from the Federal Reserve Bank of Boston under the MMLF program. The increase in other borrowed funds balances compared with both prior periodsMarch 31, 2020 primarily reflects higher borrowings from the FHLB. The increase compared with Sept. 30, 2016 also reflects an increaseFederal Reserve Bank of Boston under the MMLF program, partially offset by lower overdrafts of sub-custodian account balances in capital lease obligations as a result of converting an operating lease to a capital lease.
our Investment Services businesses and borrowings from the Federal Home Loan Bank.
Liquidity and dividends
BNY Mellon defines liquidity as the ability of the Parent and its subsidiaries to access funding or convert assets to cash quickly and efficiently, or to rolloverroll over or issue new debt, especially during periods of market stress, at a reasonable cost, and in order to meet its short-term (up to one year) obligations. Funding liquidity risk is the risk that BNY Mellon cannot meet its cash and collateral obligations at a reasonable cost for both expected and unexpected cash flow and collateral needs without adversely affecting daily operations or our financial condition. Funding liquidity risk can arise from funding mismatches, market constraints from the inability to convert assets tointo cash, the inability to hold or raise
cash, low overnight deposits, deposit run-off or contingent liquidity events.
We also manage liquidity risks on an intra-day basis. Intraday liquidity risk is the risk that BNY Mellon cannot access funds during the business day to make payments or settle immediate obligations, usually in real time. Intraday liquidity risk can arise from timing mismatches, market constraints from an inability to convert assets to cash, an inability to raise cash intraday, low overnight deposits and/or adverse stress events.
Changes in economic conditions or exposure to credit, market, operational, legal and reputational risks also can affect BNY Mellon’s liquidity risk profile and are considered in our liquidity risk framework. See “Impact of coronavirus pandemic on our business” for additional information.
The Parent’s policy is to have access to sufficient unencumbered cash and cash equivalents at each quarter-end to cover maturities and other forecasted debt redemptions, net interest payments and net tax payments for the following 18-month period, and to provide sufficient collateral to satisfy transactions subject to Section 23A of the Federal Reserve Act. As of Sept.June 30, 2017,2020, the Parent was in compliance with this policy.
For additional information on our liquidity policy, see “Risk Management - Liquidity risk”Risk” in our 2016 Annual Report. Our overall approach to liquidity management is further described in “Liquidity and dividends” in our 20162019 Annual Report.
We monitor and control liquidity exposures and funding needs within and across significant legal entities, branches, currencies and business lines, taking into account, among other factors, any applicable restrictions on the transfer of liquidity among entities.
BNY Mellon also manages potential intraday liquidity risks. We monitor and manage intraday liquidity against existing and expected intraday liquid resources (such as cash balances, remaining intraday credit capacity, intraday contingency funding and available collateral) to enable BNY Mellon to meet its intraday obligations under normal and reasonably severe stressed conditions.
We define available funds for internal liquidity management purposes as liquid funds (which includecash and due from banks, interest-bearing deposits with the Federal Reserve and other central banks, interest-bearing deposits with banks and federal funds sold and securities purchased under resale agreements), cash and due from banks, and interest-bearing deposits with the Federal Reserve and other central banks.agreements. The following table presents our total available funds, including liquid funds at period end and on an average basis.
| | | Available and liquid funds | Sept. 30, 2017 |
| Dec. 31, 2016 |
| Average | |
| Available funds | | June 30, 2020 |
| Dec. 31, 2019 |
| Average |
| (dollars in millions) | Sept. 30, 2017 |
| Dec. 31, 2016 |
| 3Q17 |
| 2Q17 |
| 3Q16 |
| 2Q20 |
| 1Q20 |
| 2Q19 |
| YTD20 |
| YTD19 |
|
| Available funds: | | |
| Liquid funds: | | |
| Cash and due from banks | | $ | 4,776 |
| $ | 4,830 |
| $ | 4,102 |
| $ | 4,595 |
| $ | 5,083 |
| $ | 4,348 |
| $ | 4,969 |
|
| Interest-bearing deposits with the Federal Reserve and other central banks | | 112,728 |
| 95,042 |
| 94,229 |
| 80,403 |
| 61,756 |
| 87,316 |
| 62,665 |
|
| Interest-bearing deposits with banks | $ | 15,256 |
| $ | 15,086 |
| $ | 15,899 |
| $ | 14,832 |
| $ | 14,066 |
| 18,045 |
| 14,811 |
| 21,093 |
| 17,081 |
| 13,666 |
| 19,087 |
| 13,761 |
|
| Federal funds sold and securities purchased under resale agreements | 27,883 |
| 25,801 |
| 28,120 |
| 26,873 |
| 26,376 |
| 36,638 |
| 30,182 |
| 30,265 |
| 34,109 |
| 38,038 |
| 32,187 |
| 33,528 |
|
| Total liquid funds | 43,139 |
| 40,887 |
| 44,019 |
| 41,705 |
| 40,442 |
| |
| Cash and due from banks | 5,557 |
| 4,822 |
| 4,961 |
| 4,972 |
| 4,189 |
| |
| Interest-bearing deposits with the Federal Reserve and other central banks | 75,808 |
| 58,041 |
| 70,430 |
| 69,316 |
| 74,102 |
| |
| Total available funds | $ | 124,504 |
| $ | 103,750 |
| $ | 119,410 |
| $ | 115,993 |
| $ | 118,733 |
| $ | 172,187 |
| $ | 144,865 |
| $ | 149,689 |
| $ | 136,188 |
| $ | 118,543 |
| $ | 142,938 |
| $ | 114,923 |
|
| Total available funds as a percentage of total assets | 35 | % | 31 | % | 35 | % | 34 | % | 34 | % | 39 | % | 38 | % | 36 | % | 35 | % | 35 | % | 36 | % | 34 | % |
We had $43 billion of liquid funds at Sept. 30, 2017 and $41 billionatDec. 31, 2016. Of the $43 billion in liquid funds held at Sept. 30, 2017, $15 billion was placed in interest-bearing deposits with large, highly rated global financial institutions with a weighted-average life to maturity of approximately nine days. Of the $15 billion, $3 billion was placed with banks in the Eurozone.
Total available funds were $125$172.2 billion at Sept.June 30, 2017,2020, compared with $104$144.9 billion at Dec. 31, 2016.
2019. The increase was primarily due to an increase inhigher interest-bearing deposits with the Federal Reserve and other central banks.
On an average basis for the nine months ended Sept. 30, 2017 and the nine months ended Sept. 30, 2016,Average non-core sources of funds, such as money market rate accounts, federal funds purchased and securities sold under repurchase agreements, trading liabilities, commercial paper and other borrowings,borrowed funds, were $31.9$18.2 billion for the six months ended June 30, 2020 and $25.9$18.4 billion respectively.for the six months ended June 30, 2019. The increase
decrease primarily reflects a decrease in other borrowed funds and commercial paper, partially offset by an increase in federal funds purchased and securities sold under repurchase agreements.
Average foreign deposits, primarily from our European-based Investment Services business,businesses, were $94.1$103.1 billion for the ninesix months ended Sept.June 30, 2017,2020, compared with $105.6$91.4 billion for the ninesix months ended Sept.June 30, 2016. Domestic savings,2019. Average interest-bearing demand and timedomestic deposits averaged $40.0were $101.0 billion for the ninesix months ended Sept.June 30, 20172020 and $47.8$72.4 billion for the ninesix months ended Sept.June 30, 2016.2019. The decreaseincrease primarily reflects a decrease in time deposits, partially offset by an increase in demand deposits.increased client activity.
Average payables to customers and broker-dealers were $19.4$17.6 billion for the ninesix months ended Sept.June 30, 20172020 and $16.9$15.9 billion for the ninesix months ended Sept.June 30, 2016.2019. Payables to customers and broker-dealers are driven by customer trading activity and market volatility.
Long-term
Average long-term debt averaged $27.1was $27.7 billion for the ninesix months ended Sept.June 30, 20172020 and $22.8$28.0 billion for the ninesix months ended Sept.June 30, 2016, reflecting issuances of long-term debt.2019.
Average noninterest-bearing deposits decreasedincreased to $72.5$66.5 billion for the ninesix months ended Sept.June 30, 20172020 from $82.9$53.8 billion for the ninesix months ended Sept.June 30, 2016,2019, primarily reflecting a decrease in client deposits.activity.
A significant reduction in our Investment Services business would reduce our access to deposits. See
“Asset/liability management” for additional factors that could impact our deposit balances.
Sources of liquidity
In the second quarter of 2017, we entered into a support agreement with certain key subsidiaries to facilitate the provision of capital and liquidity resources in the event of material financial distress or failure. Pursuant to the support agreement, the Parent transferred its intercompany loans and most of its cash to our intermediate holding company (“IHC”), and will continue to transfer cash and other liquid financial assets to the IHC, subject to certain amounts retained by the Parent to meet its near-term cash needs. In connection with the initial transfer, the IHC issued unsecured subordinated funding notes to the Parent. The IHC has also provided the Parent with a committed line of credit that allows the Parent to draw funds necessary to service near-term obligations. The Parent’s and the IHC’s obligations under the support agreement are secured.
The Parent’s three major sources of liquidity are access to the debt and equity markets, dividends from its subsidiaries, and cash on hand and cash otherwise made available in business-as-usual circumstances to the Parent through a committed credit facility with our IHC.
The Parent had cash of $416 million at Sept. 30, 2017, compared with $8.7 billion at Dec. 31, 2016, a decrease of $8.3 billion, primarily reflecting the transfer of cash to the IHC pursuant to the support agreement.intermediate holding company (“IHC”).
Our ability to access the capital markets on favorable terms, or at all, is partially dependent on our credit ratings, which are as follows:
|
| | | | | | | |
Credit ratings at Sept.June 30, 20172020 | | | | | | | |
| | Moody’s | | S&P | | Fitch | | DBRS |
| Parent: | | | | | | | |
| Long-term senior debt | A1 | | A | | AA- | | AA (low) |
| Subordinated debt | A2 | | A- | | A+A | | A (high)AA (low) |
| Preferred stock | Baa1 | | BBB | | BBBBBB+ | | A (low) |
Outlook - Parent:Parent | Stable | | Stable | | Stable | | Stable |
| |
| The Bank of New York Mellon: | | | | | | | |
| Long-term senior debt | Aa2 | | AA- | | AA | | AA (high) |
| Subordinated debt | Aa3NR | | A | | A+NR | | NR |
| Long-term deposits | Aa1 | | AA- | | AA+ | | AA (high) |
| Short-term deposits | P1 | | A-1+ | | F1+ | | R-1 (high) |
| Commercial paper | P1 | | A-1+ | | F1+ | | R-1 (high) |
| | | | | | | | |
| BNY Mellon, N.A.: | | | | | | | |
| Long-term senior debt | Aa2 | (a) | AA- | | AA | (a) | AA (high) |
| Long-term deposits | Aa1 | | AA- | | AA+ | | AA (high) |
| Short-term deposits | P1 | | A-1+ | | F1+ | | R-1 (high) |
| | | | | | | | |
Outlook - Banks:Banks | Stable | | Stable | | Stable | | Stable |
| |
| (a) | Represents senior debt issuer default rating. |
NR - Not rated.
Long-term debt totaled $28.4$27.6 billion at Sept. June 30, 2017 2020 and $24.5 $27.5 billion at Dec. 31, 2016. The2019. Issuances of $2.25 billion and an increase reflects issuancesin the fair value of $4.75 billion,hedged long-term debt were partially offset by the maturitymaturities of $500 million$1.75 billion and thea redemption of trust preferred securities.$1.25 billion. The Parent has $250 million$2.2 billion of long-term debt that will mature in the remainder of 2017.2020.
In July 2020, the Parent redeemed $1.1 billion of 2.6% senior notes due in August 2017, we2020 at par plus accrued and unpaid interest.
In May 2020, the Parent issued $750 million1,000,000 depositary shares, each representing a 1/100th interest in a share of fixed rate senior subordinated notes maturing in 2029the Parent’s Series G Noncumulative Perpetual Preferred Stock (the “Series G Preferred Stock”). The Series G Preferred Stock has an aggregate
liquidation preference of $1 billion. The Parent will pay dividends on the Series G Preferred Stock, if declared by its board of directors on each March 20 and September 20, at an annual interest rate equal to 4.70% from the original issue date to but excluding, Sept. 20, 2025; and at a floating rate equal to the five-year treasury rate (as defined in the certificate of 3.30%.designation) on the date that is three business days prior to the reset date plus 4.358% for each reset period, from and including Sept. 20, 2025. The floating rate will initially reset on Sept. 20, 2025 and subsequently on each date falling on the fifth anniversary of the preceding reset date.
The Bank of New York Mellon our largest bank subsidiary,may issue notes and CDs. There were no CDs outstanding at June 30, 2020. At Dec. 31, 2019, $1.1 billion of CDs were
outstanding. At June 30, 2020 and Dec. 31, 2019, $32 million and $1.3 billion, respectively, of notes were outstanding.
The Bank of New York Mellon also issues commercial paper that matures within 397 days from the date of issue and is not redeemable prior to maturity or subject to voluntary prepayment. The average commercial paper borrowings were $2.7outstanding was $886 million for the six months ended June 30, 2020 and $2.2 billion infor the third quarter of 2017 and $1.2 billion in the third quarter of 2016.six months ended June 30, 2019. Commercial paper outstanding was $2.5$665 million at June 30, 2020 and $4.0 billion at Sept. 30, 2017. There was no commercial paper outstanding at Dec. 31, 2016.2019.
Subsequent to Sept.June 30, 2017,2020, our U.S. bank subsidiaries could declare dividends to the Parent of approximately $6.2 billion,$796 million, without the need for a regulatory waiver. In addition, at Sept.June 30, 2017,2020, non-bank subsidiaries of the Parent had liquid assets of approximately $1.6 billion.$1.6 billion. Restrictions on our ability to obtain funds from our subsidiaries are
discussed in more detail in “Supervision and Regulation - Capital Planning and Stress Testing - Payment of Dividends, Stock Repurchases and Other Capital Distributions” and in Note 1719 of the Notes to Consolidated Financial Statements in our 20162019 Annual Report.
Pershing LLC has uncommitted lines of credit in place for liquidity purposes which are guaranteed by the Parent. Pershing LLC has eightthree separate uncommitted lines of credit amounting to $1.5 billion$750 million in aggregate. There were no borrowings under these lines in the thirdsecond quarter of 2017.2020. Pershing Limited, an indirect UK-based subsidiary of BNY Mellon, has twothree separate uncommitted lines of credit amounting to $250$350 million in aggregate. Average borrowings under these lines were $6$31 million, in aggregate, in the thirdsecond quarter of 2017.2020.
BNY Mellon Capital Markets, LLC also has an uncommitted line of credit in place for $100 million for liquidity purposes. There were no borrowings under this line in the second quarter of 2020.
The double leverage ratio is the ratio of our equity investment in subsidiaries divided by our consolidated parentParent company equity, which includes our noncumulative perpetual preferred stock. In short, the double leverage ratio measures the extent to which equity in subsidiaries is financed by Parent company debt. As the double leverage ratio increases, this can reflect greater demands on a company’s cash flows in order to service interest
payments and debt maturities. BNY Mellon’s double leverage ratio is managed in a range considering the
high level of unencumbered available liquid assets held in its principal subsidiaries (such as central bank depositsdeposit placements and government securities), the Company’s cash generating fee-based business model, with feesfee revenue representing approximately 80%79% of total revenue in the second quarter of 2020, and the dividend capacity of our banking subsidiaries. Our double leverage ratio was 123.2%116.6% at Sept.June 30, 20172020 and 119.1%116.9% at Dec. 31, 2016,2019, and within the range targeted by management.
Uses of funds
The Parent’s major uses of funds are payment of dividends, repurchases of common stock, payment of dividends, principal and interest payments on its borrowings, acquisitions and additional investments in its subsidiaries.
In August 2017,May 2020, a quarterly cash dividend of $0.31 per common share was paid to common shareholders of $0.24 per common share.shareholders. Our common stock dividend payout ratio was 23%31% for the first nine monthssecond quarter of 2017. The Federal Reserve’s instructions for2020.
In March 2020, we and the 2017 CCAR provided that, for large bank holding companies like us, dividend payout ratios exceeding 30%other members of after-tax net income would receive particularly close scrutiny.
the Financial Services Forum announced the temporary suspension of share repurchases until the end of the second quarter of 2020 to preserve capital and liquidity in order to further the objective of using capital and liquidity to support clients and customers.In the thirdsecond quarter of 2017,2020, we repurchased 12 million61.2 thousand common shares from employees, primarily in connection with the employees’ payment of taxes upon the vesting of restricted stock, at an average price of $52.74$43.59 per common share for a total cost of $650$3 million.
In connection with the Federal Reserve’s release of the CCAR results in June 2020, BNY Mellon announced that it will not conduct open market common stock repurchases in the third quarter of 2020 and will resume the common stock repurchase program as early as possible, depending on factors such as prevailing market conditions, our outlook for the economic environment, the additional capital analysis required by the Federal Reserve, and whether the Federal Reserve keeps the limitations for the third quarter of 2020 in place for subsequent quarters. The Federal Reserve has announced that it will conduct additional analysis for all participating CCAR firms, including us, later this year and will not allow participating firms to make open market common
stock repurchases during the third quarter of 2020. See “Recent regulatory developments” for additional information related to the 2020 CCAR results.
Liquidity coverage ratio (“LCR”)
U.S. regulators have established an LCR that requires certain banking organizations, including BNY Mellon, to maintain a minimum amount of unencumbered high qualityhigh-quality liquid assets (“HQLA”) sufficient to withstand the net cash outflow under a hypothetical standardized acute liquidity stress scenario for a 30-day time horizon.
The following table presents theBNY Mellon’s consolidated HQLA at Sept.June 30, 2017,2020, and the average HQLA and average LCR for the thirdsecond quarter of 2017.2020.
| | | Consolidated HQLA and LCR | Sept. 30, 2017 |
| June 30, 2020 |
|
| (dollars in billions) |
Securities (a) | $ | 105 |
| $ | 125 |
|
Cash (b) | 70 |
| 107 |
|
Total consolidated HQLA (c) | $ | 175 |
| $ | 232 |
|
| | | |
Total consolidated HQLA - average (c) | $ | 162 |
| |
Total consolidated HQLA – average (c) | | $ | 210 |
|
| Average LCR | 119 | % | 112 | % |
| |
| (a) | Primarily includes U.S. Treasury, U.S. agency, sovereign securities, securities of U.S. government-sponsored enterprises, U.S. Treasury, sovereign securities, U.S. agency and investment-grade corporate debt and publicly traded common equity.debt. |
| |
| (b) | Primarily includes cash on deposit with central banks. |
| |
| (c) | Consolidated HQLA presented before adjustments. After haircuts and the impact of trapped liquidity, consolidated HQLA totaled $137$167 billion at Sept.June 30, 20172020 and averaged $126$156 billion for the thirdsecond quarter of 2017.2020. |
The U.S. LCR rule became fully phased-in on Jan. 1, 2017 and requires BNY Mellon and each of our affected domestic bank subsidiaries to meet an LCR of at least 100%. The LCR for BNY Mellon and each of our domestic bank subsidiaries waswere compliant with the U.S. LCR requirements forof at least 100% throughout the thirdsecond quarter of 2017. For additional information on the LCR, see “Supervision and Regulation - Liquidity Standards - Basel III and U.S. Rules and Proposals” in our 2016 Annual Report.2020.
We also perform liquidity stress tests to evaluate whether the Company maintains sufficient liquidity resources under multiple stress scenarios. Stress tests are based on scenarios that measure liquidity risks under unlikely but plausible conditions. We perform these tests under various time horizons ranging from one day to one year in a base case, as well as supplemental tests to determine whether the Company’s liquidity is sufficient for severe market events and firm-specific events. Under our scenario testing program, the results of the tests indicate that the Company has sufficient liquidity.
As part of our resolution planning, we monitor, among other measures, our Resolution Liquidity Adequacy and Positioning (“RLAP”). The RLAP methodologies are designed to ensure that the liquidity needs of certain key subsidiaries in a stress environment can be met by available resources held at the entity or at the Parent or IHC, as applicable.
Statement of cash flows
The following summarizes the activity reflected on the consolidated statement of cash flows. While this information may be helpful to highlight certain macro trends and business strategies, the cash flow analysis may not be as relevant when analyzing changes in our
net earnings and net assets. We believe that in addition to the traditional cash flow analysis, the discussion related to liquidity and dividends and asset/liability management herein may provide more useful context in evaluating our liquidity position and related activity.
Net cash provided by operating activities was $3.4$5.1 billion in the ninesix months ended Sept.June 30, 2017,2020, compared with $1.6net cash used for operating activities of $2.5 billion in the ninesix months ended Sept.June 30, 2016.2019. In the first ninesix months of 2017,ended June 30, 2020, cash flows provided by operations were principally the result of earnings. In the first nine months of 2016, cash flows provided by operations were principally the result ofprimarily resulted from earnings and changes in accruals. In the six months ended June 30, 2019, cash flows used for operations primarily resulted from changes in accruals and trading activities, partially offset by changes in accruals.earnings.
Net cash used for investing activities was $14.0$58.7 billion in the ninesix months ended Sept.June 30, 2017,2020, compared with cash provided by investing activities
of $21.1$11.4 billion in the ninesix months ended Sept.June 30, 2016.2019. In the first ninesix months of 2017,ended June 30, 2020, net cash used for investing activities primarily reflects net changes in securities, change in interest-bearing deposits with the Federal Reserve and other central banks was a significant use of funds. In the first nine months of 2016, changes in interest-bearing deposits with the Federal Reserve and other central banks was a significant source of funds, partially offset by changes in federal funds sold and securities purchased under resale agreements. In the six months ended June 30, 2019, net cash used for investing activities primarily reflects changes in federal funds sold and securities purchased under resale agreements, partially offset by changes in loans.
Net cash provided by financing activities was $11.2$53.4 billion in the ninesix months ended Sept.June 30, 2017,2020, compared with cash used for financing activities of $24.2$13.2 billion in the ninesix months ended Sept.June 30, 2016.2019. In the first ninesix months of 2017, the proceeds from the issuance of long-term debt,ended June 30, 2020, net cash provided by financing activity reflects changes in deposits and increasespayables to customers and broker-dealers, partially offset by changes in commercial paper. In the six months ended June 30, 2019, net cash provided by financing activities primarily reflects changes in deposits and changes in commercial paper, and other borrowed funds were significant sources of funds, partially offset by common stock repurchased. In the first nine monthsrepayment of 2016, changes in deposits,long-term debt, changes in federal funds purchased and securities sold under repurchase agreements repayment of long-term debt and treasury stock repurchases were significant uses of funds, partially offset by the issuance of long-term debt.changes in other borrowed funds.
Capital
| | Capital data (dollar amounts in millions except per share amounts; common shares in thousands) | Sept. 30, 2017 |
| June 30, 2017 |
| Dec. 31, 2016 |
| |
Capital data (dollars in millions, except per share amounts; common shares in thousands) | | June 30, 2020 |
| March 31, 2020 |
| Dec. 31, 2019 |
|
| Average common equity to average assets | 10.6 | % | 10.5 | % | 10.2 | % | 9.3 | % | 9.8 | % | 10.7 | % |
| | | |
| At period end: | | |
| BNY Mellon shareholders’ equity to total assets ratio | 11.4 | % | 11.3 | % | 11.6 | % | 9.9 | % | 8.8 | % | 10.9 | % |
| BNY Mellon common shareholders’ equity to total assets ratio | 10.4 | % | 10.3 | % | 10.6 | % | 8.9 | % | 8.0 | % | 9.9 | % |
| Total BNY Mellon shareholders’ equity | $ | 40,523 |
| $ | 39,974 |
| $ | 38,811 |
| $ | 43,697 |
| $ | 41,145 |
| $ | 41,483 |
|
| Total BNY Mellon common shareholders’ equity | $ | 36,981 |
| $ | 36,432 |
| $ | 35,269 |
| $ | 39,165 |
| $ | 37,603 |
| $ | 37,941 |
|
BNY Mellon tangible common shareholders’ equity – Non-GAAP (a) | $ | 18,630 |
| $ | 18,106 |
| $ | 16,957 |
| $ | 20,650 |
| $ | 19,068 |
| $ | 19,216 |
|
Book value per common share (a) | $ | 36.11 |
| $ | 35.26 |
| $ | 33.67 |
| $ | 44.21 |
| $ | 42.47 |
| $ | 42.12 |
|
Tangible book value per common share – Non-GAAP (a) | $ | 18.19 |
| $ | 17.53 |
| $ | 16.19 |
| $ | 23.31 |
| $ | 21.53 |
| $ | 21.33 |
|
| Closing stock price per common share | $ | 53.02 |
| $ | 51.02 |
| $ | 47.38 |
| $ | 38.65 |
| $ | 33.68 |
| $ | 50.33 |
|
| Market capitalization | $ | 54,294 |
| $ | 52,712 |
| $ | 49,630 |
| $ | 34,239 |
| $ | 29,822 |
| $ | 45,331 |
|
| Common shares outstanding | 1,024,022 |
| 1,033,156 |
| 1,047,488 |
| 885,862 |
| 885,443 |
| 900,683 |
|
| | | |
| Cash dividends per common share | $ | 0.24 |
| $ | 0.19 |
| $ | 0.19 |
| $ | 0.31 |
| $ | 0.31 |
| $ | 0.31 |
|
| Common dividend payout ratio | 26 | % | 22 | % | 25 | % | 31 | % | 30 | % | 20 | % |
| Common dividend yield | 1.8 | % | 1.5 | % | 1.6 | % | 3.2 | % | 3.7 | % | 2.4 | % |
| |
| (a) | See “Supplemental information – Explanation of GAAP and Non-GAAP financial measures” beginning on page 4945 for a reconciliation of GAAP to Non-GAAP. |
The Bank of New York Mellon Corporation total shareholders’ equity increased to $40.5$43.7 billion at Sept.June 30, 20172020 from $38.8$41.5 billion at Dec. 31, 2016.2019. The increase primarily reflects earnings, foreign currency translation adjustments, $638 million resulting fromthe issuance of preferred stock awards, the exercise of stock options and stock issued for employee benefit plans, and the unrealized gain in our investmenton securities portfolio,available-for-sale, partially offset by sharecommon stock repurchases and dividends.dividend payments.
In May 2020, the Parent issued 1,000,000 depositary shares, each representing a 1/100th interest in a share of the Parent’s Series G Preferred Stock. The Series G Preferred Stock has an aggregate liquidation preference of $1 billion. The Parent will pay dividends on the Series G Preferred Stock, if declared by its board of directors on each March 20 and September 20, at an annual rate equal to 4.70% from the original issue date to but excluding, Sept. 20, 2025; and at a floating rate equal to the five-year treasury rate (as defined in the certificate of designation) on the date that is three business days prior to the reset date plus 4.358% for each reset period, from and including Sept. 20, 2025. The floating rate will initially reset on Sept. 20, 2025 and subsequently on each date falling on the fifth anniversary of the preceding reset date.
The unrealized gain net of tax,(after-tax) on our available-for-sale investment securities portfolio, recordednet of hedges, included in accumulated other comprehensive incomeOCI was $226 million$1.2 billion at Sept.June 30, 2017,2020, compared with $45$361 million at Dec. 31, 2016.2019. The increase in the unrealized gain, net of tax, was primarily driven by a decrease in long-termlower market interest rates.
Our 2017 capital plan, submitted in connection with our CCAR, included the authorization to repurchase an average of $650 million of common stock each quarter starting in the third quarter of 2017 and continuing through the second quarter of 2018.
In the third quarter of 2017,six months ended June 30, 2020, we repurchased 1221.7 million common shares at an average price of $52.74$45.43 per common share for a total cost of $650 million.$988 million under the current program prior to the temporary suspension of share repurchases in March 2020.
Also includedIn connection with the Federal Reserve’s release of the CCAR results in June 2020, BNY Mellon announced that it will not conduct open market common stock repurchases in the 2017third quarter of 2020 and will resume the common stock repurchase program as early as possible, depending on factors such as prevailing market conditions, our outlook for the economic environment, the additional capital plan was a 26% increaseanalysis required by the Federal Reserve, and whether the Federal Reserve keeps the limitations for the third quarter of 2020 in place for subsequent quarters. The Federal Reserve has announced that it will conduct additional analysis for all participating CCAR firms, including us, later this year and will not allow participating firms to make open market common stock repurchases during the quarterly cash dividend to $0.24 per common share. The first paymentthird quarter of the increased quarterly cash dividend was made on Aug. 11, 2017.2020. For additional information, see “Recent Regulatory Developments.”
Capital adequacy
Regulators establish certain levels of capital for bank holding companies (“BHCs”) and banks, including BNY Mellon and our bank subsidiaries, in accordance with established quantitative measurements. For the
Parent to maintain its status as a financial holding company (“FHC”), our U.S. bank subsidiaries and BNY Mellon must, among other things, qualify as “well capitalized.”
As of Sept.June 30, 20172020 and Dec. 31, 2016, 2019,BNY Mellon and our U.S. bank subsidiaries were “well capitalized.”
Failure to satisfy regulatory standards, including “well capitalized” status or capital adequacy rules more generally, could result in limitations on our activities and adversely affect our financial condition. See the discussion of these matters in “Supervision and Regulation - Regulated Entities of BNY Mellon and Ancillary Regulatory Requirements” and “Risk Factors - Operational Risk - Failure to satisfy
regulatory standards, including “well capitalized” and “well managed” status or capital adequacy and liquidity rules more generally, could result in limitations on our activities and adversely affect our
business and financial condition”condition,” both of which are in our 20162019 Annual Report.
The “well capitalized” and other capital categories (where applicable), as established by applicable regulations for bank holding companies and depository institutions, have been established by those regulations solely for purposes of implementing their respective requirements (for example, eligibility for financial holding company status in the case of bank holding companies and prompt corrective action measures in the case of depository institutions). A bank holding company’s or depository institution’s qualification for a capital category may not constitute an accurate representation of the entity’s overall financial condition or prospects.
The U.S. banking agencies’ capital rules are based on the framework adopted by the Basel Committee on Banking Supervision (“BCBS”), as amended from time to time. For additional information on these capital requirements, see “Supervision and Regulation” in our 20162019 Annual Report. BNY Mellon is subject to the U.S. capital rules, which are being gradually phased-in over a multi-year period through 2018.
Our estimated CET1Report and SLR ratios on a fully phased-in basis are based on our current interpretation of the U.S. capital rules. Our risk-based capital adequacy is determined using the higher of risk-weighted assets (“RWAs”) determined using the Advanced Approach and Standardized Approach.
“Recent regulatory developments” in this Form 10-Q.
The table below presents our consolidated and largest bank subsidiary regulatory capital ratios.
38 BNY Mellon
The transitional capital ratios for Sept. 30, 2017 and June 30, 2017 included in the following table were negatively impacted by the additional phase-in requirements that became effective on Jan. 1, 2017.
|
| | | | | | | | | | | | | | |
| Consolidated and largest bank subsidiary regulatory capital ratios | Sept. 30, 2017 | | | | |
| Well capitalized |
| | Minimum
required |
| | Capital ratios |
| | June 30, 2017 |
| | Dec. 31, 2016 |
|
| | (a) | | |
Consolidated regulatory capital ratios: (b) | | | | | | | | | |
| Standardized Approach: | | | | | | | | | |
| CET1 ratio | N/A |
| (c) | 6.5 | % | | 12.3 | % | | 12.0 | % | | 12.3 | % |
| Tier 1 capital ratio | 6 | % | | 8 |
| | 14.6 |
| | 14.3 |
| | 14.5 |
|
| Total (Tier 1 plus Tier 2) capital ratio | 10 |
| | 10 |
| | 15.6 |
| | 14.8 |
| | 15.2 |
|
| Advanced Approach: | | | | | | | | | |
| CET1 ratio | N/A |
| (c) | 6.5 | % | | 11.1 | % | | 10.8 | % | | 10.6 | % |
| Tier 1 capital ratio | 6 | % | | 8 |
| | 13.2 |
| | 12.9 |
| | 12.6 |
|
| Total (Tier 1 plus Tier 2) capital ratio | 10 |
| | 10 |
| | 14.0 |
| | 13.2 |
| | 13.0 |
|
Leverage capital ratio (b) | N/A |
| (c) | 4 |
| | 6.8 |
| | 6.7 |
| | 6.6 |
|
SLR (d) | 5 |
| (c)(e) | 3 |
| | 6.3 |
| | 6.2 |
| | 6.0 |
|
| | | | | | | | | | |
Selected regulatory capital ratios – fully phased-in – Non-GAAP: (c) | | | | | | | | | |
| Estimated CET1 ratio: | | | | | | | | | |
| Standardized Approach | 8.5 | % | (e) | 6.5 | % | | 11.9 | % | | 11.5 | % | | 11.3 | % |
| Advanced Approach | 8.5 |
| (e) | 6.5 |
| | 10.7 |
| | 10.4 |
| | 9.7 |
|
| Estimated SLR | 5 |
| (e) | 3 |
| | 6.1 |
| | 6.0 |
| | 5.6 |
|
| | | | | | | | | | |
The Bank of New York Mellon regulatory capital ratios: (b) | | | | | | | | | |
| Advanced Approach: | | | | | | | | | |
| CET1 ratio | 6.5 | % | | 5.75 | % | | 14.8 | % | | 14.1 | % | | 13.6 | % |
| Tier 1 capital ratio | 8 |
| | 7.25 |
| | 15.1 |
| | 14.4 |
| | 13.9 |
|
| Total (Tier 1 plus Tier 2) capital ratio | 10 |
| | 9.25 |
| | 15.5 |
| | 14.8 |
| | 14.2 |
|
| Leverage capital ratio | 5 |
| | 4 |
| | 7.8 |
| | 7.6 |
| | 7.2 |
|
SLR (d) | 6 |
| | 3 |
| | 7.1 |
| | 6.9 |
| | 6.5 |
|
| | | | | | | | | | |
Selected regulatory capital ratios – fully phased-in – Non-GAAP: | | | | | | | | | |
| Estimated SLR | 6 | % | | 3 | % | | 6.8 | % | | 6.7 | % | | 6.1 | % |
|
| | | | | | | | | | | | | | |
| Consolidated and largest bank subsidiary regulatory capital ratios | June 30, 2020 | | March 31, 2020 |
| | Dec. 31, 2019 |
|
| Well capitalized |
| | Minimum required |
| | Capital ratios |
| | Capital
ratios |
| | Capital ratios |
|
| | (a) |
Consolidated regulatory capital ratios: (b) | | | | | | | | | |
| Advanced Approaches: | | | | | | | | | |
| CET1 ratio | N/A |
| (c) | 8.5 | % | | 12.6 | % | | 11.4 | % | | 11.5 | % |
| Tier 1 capital ratio | 6 | % | | 10 |
| | 15.4 |
| | 13.5 |
| | 13.7 |
|
| Total capital ratio | 10 | % | | 12 |
| | 16.3 |
| | 14.3 |
| | 14.4 |
|
| Standardized Approach: | | | | | | | | | |
| CET1 ratio | N/A |
| (c) | 8.5 | % | | 12.7 | % | | 11.3 | % | | 12.5 | % |
| Tier 1 capital ratio | 6 | % | | 10 |
| | 15.6 |
| | 13.5 |
| | 14.8 |
|
| Total capital ratio | 10 | % | | 12 |
| | 16.6 |
| | 14.4 |
| | 15.8 |
|
| Tier 1 leverage ratio | N/A |
| (c) | 4 |
| | 6.2 |
| | 6.0 |
| | 6.6 |
|
SLR (d)(e) | N/A |
| (c) | 5 |
| | 8.2 |
| | 5.6 |
| | 6.1 |
|
| | | | | | | | | | |
The Bank of New York Mellon regulatory capital ratios: (b) | | | | | | | | | |
| Advanced Approaches: | | | | | | | | | |
| CET1 ratio | 6.5 | % | | 7 | % | | 17.1 | % | | 15.5 | % | | 15.1 | % |
| Tier 1 capital ratio | 8 |
| | 8.5 |
| | 17.1 |
| | 15.5 |
| | 15.1 |
|
| Total capital ratio | 10 |
| | 10.5 |
| | 17.2 |
| | 15.6 |
| | 15.2 |
|
| Tier 1 leverage ratio | 5 |
| | 4 |
| | 6.7 |
| | 6.7 |
| | 6.9 |
|
SLR (d) | 6 |
| | 3 |
| | 8.4 |
| | 6.2 |
| | 6.4 |
|
| |
| (a) | Minimum requirements for Sept.June 30, 20172020 include Basel III minimum thresholds plus currently applicable buffers. |
| |
| (b) | For our CET1, Tier 1 capital and Total capital ratios, our effective capital ratios under U.S. capital rules are the lower of the ratios as calculated under the Standardized and Advanced Approaches. The Tier 1 leverage capital ratio is based on Tier 1 capital as phased-in and quarterly average total assets. The U.S. global systemically important banks (“G-SIB”) surcharge of 1.5% is subject to change. The countercyclical capital buffer is currently set to 0%. |
| |
| (c) | The Federal Reserve’s regulations do not establish well capitalized thresholds for these measures for bank holding companies.BHCs. |
| |
| (d) | The SLR does not become a binding measure until the first quarter of 2018. The SLR is based on Tier 1 capital as phased-in, and average quarterly assets andtotal leverage exposure, which includes certain off-balance sheet exposures. The SLR at June 30, 2020 reflects the exclusion of certain central bank placements from leverage exposure.
|
| |
| (e) | Fully phased-in Basel III minimum with expected buffers. See page 41 forThe SLR at June 30, 2020 reflects the capital ratios withtemporary exclusion of U.S. Treasury securities from the phase-in of the capital conservation buffer and the U.S. G-SIB surcharge, as well as the introduction of theleverage exposure which increased our consolidated SLR buffer.
by 40 basis points. |
Our CET1 ratio determined under the Advanced ApproachApproaches was 11.1%12.6% at Sept.June 30, 20172020 and 10.6%11.5% at Dec. 31, 2016.2019. The increase primarily reflects CET1 generation,capital generated through earnings and unrealized gains on assets available-for-sale, partially offset by capital deployed through common stock repurchased, prior to the additional phase-in requirements under the U.S. capital rules that became effective Jan. 1, 2017.temporary suspension of share repurchases in March 2020, and dividend payments.
Our estimated CET1 ratio (Non-GAAP) calculated under the Advanced Approach on a fully phased-in basis was 10.7% at Sept. 30, 2017 and 9.7% at Dec. 31, 2016. The increase primarily reflects CET1 generation. Our estimated CET1 ratio (Non-GAAP) calculated under the Standardized Approach on a
fully phased-in basis was 11.9% at Sept. 30, 2017 and 11.3% at Dec. 31, 2016.
The estimated fully phased-in SLR (Non-GAAP) of 6.1% at Sept. 30, 2017 and 5.6% at Dec. 31, 2016 was based on our interpretation of the U.S. capital rules, as supplemented by the Federal Reserve’s final rules on the SLR. BNY Mellon will be subject to an enhanced SLR, which will require a buffer in excess of 2% over the minimum SLR of 3%. The insured depository institution subsidiaries of the U.S. global systemically important banks (“G-SIBs”), including
those of BNY Mellon, must maintain a 6% SLR to be considered “well capitalized.”
For additional information on the U.S. capital rules, see “Supervision and Regulation - Capital Requirements - Generally” in our 2016 Annual Report.
The Advanced Approach capital ratios are significantly impacted by RWAs for operational risk. Our operational loss risk model is informed by external losses, including fines and penalties levied against institutions in the financial services industry, particularly those that relate to businesses in which we operate, and as a result external losses have impacted and could in the future impact the amount of capital that we are required to hold.
Management views the estimated fully phased-in CET1 and other risk-based capital ratios and SLR as key measures in monitoring BNY Mellon’s capital position and progress against future regulatory capital standards. Additionally, the presentation of the estimated fully phased-in CET1 and other risk-based capital ratios and SLR are intended to allow investors to compare these ratios with estimates presented by other companies.
Our capital ratios are necessarily subject to, among other things, anticipated compliance with all necessary enhancements to model calibration, approval by regulators of certain models used as part of RWA calculations, other refinements, further implementation guidance from regulators, market practices and standards and any changes BNY Mellon may make to its businesses. As a consequence of these factors, our capital ratios may materially change, and may be volatile over time and from period to period.
Minimum capital ratios and capital buffers
The U.S. capital rules include a series of buffers and surcharges over required minimums that apply to bank holding companies, including BNY Mellon, which are being phased-in over time. Banking organizations with a risk-based ratio or SLR above the minimum required level, but with a risk-based ratio or SLR below the minimum level with buffers
will face constraints on dividends, equity repurchases and discretionary executive compensation based on the amount of the shortfall. Different regulatory capital minimums, buffers and surcharges apply to our banking subsidiaries.
The U.S. capital rules introduced a capital conservation buffer and countercyclical capital buffer that add to the minimum regulatory capital ratios. The capital conservation buffer–1.25% for 2017 and 2.5% when fully phased-in on Jan. 1, 2019–is designed to absorb losses during periods of economic stress and applies to all banking organizations. During periods of excessive growth, the capital conservation buffer may be expanded through the imposition of a countercyclical capital buffer that may be as high as an additional 2.5%. The countercyclical capital buffer, when applicable, applies only to Advanced Approach banking organizations. The countercyclical capital buffer is currently set to zero with respect to U.S. exposures, but it could increase if the banking agencies determine that systemic vulnerabilities are meaningfully above normal.
BNY Mellon is subject to an additional G-SIB surcharge, which is implemented as an extension of the capital conservation buffer and must be satisfied with CET1 capital. For 2017, the G-SIB surcharge applicable to BNY Mellon is 0.75%, and, when fully phased-in on Jan. 1, 2019, as calculated, applying metrics as currently applicable to BNY Mellon, would be 1.5%.
The following table presents the principal minimumour capital ratio requirements with bufferscomponents and surcharges, as phased-in, applicable to the Parent and The Bank of New York Mellon. This table does not include the imposition of a countercyclical capital buffer. The U.S. capital rules also provide for transitional arrangements for qualifying instruments, deductions and adjustments, which are not reflected in this table. Buffers and surcharges are not applicable to the leverage capital ratio. These buffers, other than the SLR buffer, and surcharge began to phase-in on Jan. 1, 2016 and will be fully implemented on Jan. 1, 2019.
|
| | | | | | | | | | | | | | | |
| Capital ratio requirements | Well capitalized |
| | Minimum ratios |
| | Minimum ratios with buffers, as phased-in (a) |
| | | | 2017 |
| | 2018 |
| | 2019 |
| |
| Capital conservation buffer (CET1) | | | | | 1.25 | % | | 1.875 | % | | 2.5 | % | |
U.S. G-SIB surcharge (CET1) (b)(c) | | | | | 0.75 | % | | 1.125 | % | | 1.5 | % | |
| | | | | | | | | | | |
| Consolidated: | | | | | | | | | | |
| CET1 ratio | N/A |
| | 4.5 | % | | 6.5 | % | | 7.5 | % | | 8.5 | % | |
| Tier 1 capital ratio | 6.0 | % | | 6.0 | % | | 8.0 | % | | 9.0 | % | | 10.0 | % | |
| Total capital ratio | 10.0 | % | | 8.0 | % | | 10.0 | % | | 11.0 | % | | 12.0 | % | |
| | | | | | | | | | | |
| Enhanced SLR buffer (Tier 1 capital) | N/A |
| | | | N/A |
| | 2.0 | % | | 2.0 | % | |
| SLR | N/A |
| | 3.0 | % | | N/A |
| | 5.0 | % | | 5.0 | % | |
| | | | | | | | | | | |
Bank subsidiaries: (c) | | | | | | | | | | |
| CET1 ratio | 6.5 | % | | 4.5 | % | | 5.75 | % | | 6.375 | % | | 7.0 | % | |
| Tier 1 capital ratio | 8.0 | % | | 6.0 | % | | 7.25 | % | | 7.875 | % | | 8.5 | % | |
| Total capital ratio | 10.0 | % | | 8.0 | % | | 9.25 | % | | 9.875 | % | | 10.5 | % | |
| | | | | | | | | | | |
| SLR | 6.0 | % | | 3.0 | % | | N/A |
| | 6.0 | % | (d) | 6.0 | % | (d) |
|
| | | | | | | | | |
| Capital components and risk-weighted assets | June 30, 2020 |
| March 31, 2020 |
| Dec. 31, 2019 |
|
| (in millions) |
| CET1: | | | |
| Common shareholders’ equity | $ | 39,165 |
| $ | 37,603 |
| $ | 37,941 |
|
| Adjustments for: | | | |
Goodwill and intangible assets (a) | (18,515 | ) | (18,535 | ) | (18,725 | ) |
| Net pension fund assets | (270 | ) | (269 | ) | (272 | ) |
| Equity method investments | (297 | ) | (290 | ) | (311 | ) |
| Deferred tax assets | (48 | ) | (46 | ) | (46 | ) |
| Other | — |
| 2 |
| (47 | ) |
| Total CET1 | 20,035 |
| 18,465 |
| 18,540 |
|
| Other Tier 1 capital: | | | |
| Preferred stock | 4,532 |
| 3,542 |
| 3,542 |
|
| Other | (89 | ) | (74 | ) | (86 | ) |
| Total Tier 1 capital | $ | 24,478 |
| $ | 21,933 |
| $ | 21,996 |
|
| Tier 2 capital: | | | |
| Subordinated debt | $ | 1,248 |
| $ | 1,248 |
| $ | 1,248 |
|
| Allowance for credit losses | 463 |
| 314 |
| 216 |
|
| Other | (6 | ) | (1 | ) | (11 | ) |
| Total Tier 2 capital – Standardized Approach | 1,705 |
| 1,561 |
| 1,453 |
|
| Excess of expected credit losses | 217 |
| 101 |
| — |
|
| Less: Allowance for credit losses | 463 |
| 314 |
| 216 |
|
| Total Tier 2 capital – Advanced Approaches | $ | 1,459 |
| $ | 1,348 |
| $ | 1,237 |
|
| Total capital: | | | |
| Standardized Approach | $ | 26,183 |
| $ | 23,494 |
| $ | 23,449 |
|
| Advanced Approaches | $ | 25,937 |
| $ | 23,281 |
| $ | 23,233 |
|
| | | | |
| Risk-weighted assets: | | | |
| Standardized Approach | $ | 157,290 |
| $ | 163,006 |
| $ | 148,695 |
|
| Advanced Approaches: | | | |
| Credit Risk | $ | 95,647 |
| $ | 97,093 |
| $ | 95,490 |
|
| Market Risk | 2,793 |
| 3,630 |
| 4,020 |
|
| Operational Risk | 60,900 |
| 61,838 |
| 61,388 |
|
| Total Advanced Approaches | $ | 159,340 |
| $ | 162,561 |
| $ | 160,898 |
|
| | | | |
| Average assets for Tier 1 leverage ratio | $ | 394,394 |
| $ | 366,058 |
| $ | 334,869 |
|
| Total leverage exposure for SLR | $ | 297,300 |
| $ | 392,807 |
| $ | 362,452 |
|
| |
| (a) | Countercyclical capital buffer currently set to 0%.
Reduced by deferred tax liabilities associated with intangible assets and tax-deductible goodwill. |
| |
(b) | The fully phased-in U.S. G-SIB surcharge of 1.5% applicable to BNY Mellon is subject to change.
|
| |
(c) | The U.S. G-SIB surcharge is not applicable to the regulatory capital ratios of the bank subsidiaries.
|
| |
(d) | Well capitalized threshold.
|
The table below presents the factors that impacted the transitional and fully phased-in CET1.CET1 capital.
| | | Estimated CET1 generation | Quarter ended Sept. 30, 2017 | |
| CET1 generation | | 2Q20 |
|
| (in millions) | Transitional basis (a) |
| Fully phased-in - Non-GAAP (b) |
|
| CET1 – Beginning of period | $ | 18,371 |
| $ | 17,629 |
| $ | 18,465 |
|
| Net income applicable to common shareholders of The Bank of New York Mellon Corporation | 983 |
| 983 |
| 901 |
|
| Goodwill and intangible assets, net of related deferred tax liabilities | (33 | ) | (26 | ) | 20 |
|
| Gross CET1 generated | 950 |
| 957 |
| 921 |
|
| Capital deployed: | | |
| Common stock dividends | (253 | ) | (253 | ) | |
| Common stock repurchased | (650 | ) | (650 | ) | |
| Common stock dividend payments | | (278 | ) |
| Common stock repurchases | | (3 | ) |
| Total capital deployed | (903 | ) | (903 | ) | (281 | ) |
| Other comprehensive income: | | |
| Foreign currency translation | 281 |
| 281 |
| 115 |
|
| Unrealized loss on assets available-for-sale | 13 |
| 16 |
| |
| Unrealized gain on assets available-for-sale | | 746 |
|
| Defined benefit plans | 12 |
| 15 |
| 19 |
|
| Unrealized gain on cash flow hedges | | 4 |
|
| Total other comprehensive income | 306 |
| 312 |
| 884 |
|
Additional paid-in capital (c) | 156 |
| 156 |
| |
| Other additions (deductions): | | |
Additional paid-in capital (a) | | 58 |
|
| Other (deductions): | | |
| Embedded goodwill | | (7 | ) |
| Net pension fund assets | | (1 | ) |
| Deferred tax assets | (1 | ) | (2 | ) | (2 | ) |
| Embedded goodwill | (9 | ) | (8 | ) | |
| Other | | (2 | ) |
| Total other deductions | (10 | ) | (10 | ) | (12 | ) |
| Net CET1 generated | 499 |
| 512 |
| 1,570 |
|
| CET1 – End of period | $ | 18,870 |
| $ | 18,141 |
| $ | 20,035 |
|
| |
| (a) | Reflects transitional adjustments to CET1 required under the U.S. capital rules. |
| |
(c) | Primarily related to stock awards, the exercise of stock options and stock issued for employee benefit plans. |
The following table presents the components of our transitional and fully phased-in CET1, Tier 1 and Tier 2 capital, the RWAs determined under both the Standardized and Advanced Approaches, the average assets used for leverage capital purposes and the total leverage exposure for estimated SLR purposes.
|
| | | | | | | | | | | | | | | | | | | | |
| Capital components and ratios | Sept. 30, 2017 | | June 30, 2017 | | Dec. 31, 2016 |
| (dollars in millions) | Transitional Approach (a) |
| Fully phased-in - Non-GAAP (b) |
| | Transitional
Approach (a) |
| Fully phased-in - Non-GAAP (b) |
| | Transitional
Approach (a) |
| Fully phased-in - Non-GAAP (b) |
|
| CET1: | | | | | | | | |
| Common shareholders’ equity | $ | 37,195 |
| $ | 36,981 |
| | $ | 36,652 |
| $ | 36,432 |
| | $ | 35,794 |
| $ | 35,269 |
|
| Goodwill and intangible assets | (17,876 | ) | (18,351 | ) | | (17,843 | ) | (18,325 | ) | | (17,314 | ) | (18,312 | ) |
| Net pension fund assets | (72 | ) | (90 | ) | | (72 | ) | (90 | ) | | (55 | ) | (90 | ) |
| Equity method investments | (334 | ) | (348 | ) | | (325 | ) | (340 | ) | | (313 | ) | (344 | ) |
| Deferred tax assets | (31 | ) | (39 | ) | | (30 | ) | (37 | ) | | (19 | ) | (32 | ) |
| Other | (12 | ) | (12 | ) | | (11 | ) | (11 | ) | | — |
| (1 | ) |
| Total CET1 | 18,870 |
| 18,141 |
|
| 18,371 |
| 17,629 |
| | 18,093 |
| 16,490 |
|
| Other Tier 1 capital: | | | | | | | | |
| Preferred stock | 3,542 |
| 3,542 |
| | 3,542 |
| 3,542 |
| | 3,542 |
| 3,542 |
|
| Deferred tax assets | (8 | ) | — |
| | (7 | ) | — |
| | (13 | ) | — |
|
| Net pension fund assets | (19 | ) | — |
| | (18 | ) | — |
| | (36 | ) | — |
|
| Other | (34 | ) | (34 | ) | | (24 | ) | (24 | ) | | (121 | ) | (121 | ) |
| Total Tier 1 capital | $ | 22,351 |
| $ | 21,649 |
|
| $ | 21,864 |
| $ | 21,147 |
| | $ | 21,465 |
| $ | 19,911 |
|
| Tier 2 capital: | | | | | | | | |
| Subordinated debt | $ | 1,300 |
| $ | 1,250 |
| | $ | 550 |
| $ | 550 |
| | $ | 550 |
| $ | 550 |
|
| Allowance for credit losses | 265 |
| 265 |
| | 270 |
| 270 |
| | 281 |
| 281 |
|
| Trust preferred securities | — |
| — |
| | — |
| — |
| | 148 |
| — |
|
| Other | (7 | ) | (7 | ) | | (7 | ) | (7 | ) | | (12 | ) | (11 | ) |
| Total Tier 2 capital - Standardized Approach | 1,558 |
| 1,508 |
|
| 813 |
| 813 |
| | 967 |
| 820 |
|
| Excess of expected credit losses | 49 |
| 49 |
| | 59 |
| 59 |
| | 50 |
| 50 |
|
| Less: Allowance for credit losses | 265 |
| 265 |
| | 270 |
| 270 |
| | 281 |
| 281 |
|
| Total Tier 2 capital - Advanced Approach | $ | 1,342 |
| $ | 1,292 |
|
| $ | 602 |
| $ | 602 |
| | $ | 736 |
| $ | 589 |
|
| Total capital: | | | | | | | | |
| Standardized Approach | $ | 23,909 |
| $ | 23,157 |
| | $ | 22,677 |
| $ | 21,960 |
| | $ | 22,432 |
| $ | 20,731 |
|
| Advanced Approach | $ | 23,693 |
| $ | 22,941 |
| | $ | 22,466 |
| $ | 21,749 |
| | $ | 22,201 |
| $ | 20,500 |
|
| | | | | | | | |
| Risk-weighted assets: | | | | | | | | |
| Standardized Approach | $ | 153,494 |
| $ | 152,995 |
| | $ | 153,179 |
| $ | 152,645 |
| | $ | 147,671 |
| $ | 146,475 |
|
| Advanced Approach: | | | | | | | | |
| Credit Risk | $ | 98,201 |
| $ | 97,672 |
| | $ | 99,030 |
| $ | 98,465 |
| | $ | 97,659 |
| $ | 96,391 |
|
| Market Risk | 2,996 |
| 2,996 |
| | 3,225 |
| 3,225 |
| | 2,836 |
| 2,836 |
|
| Operational Risk | 68,625 |
| 68,625 |
| | 67,788 |
| 67,788 |
| | 70,000 |
| 70,000 |
|
| Total Advanced Approach | $ | 169,822 |
| $ | 169,293 |
|
| $ | 170,043 |
| $ | 169,478 |
| | $ | 170,495 |
| $ | 169,227 |
|
| | | | | | | | | |
| Standardized Approach: | | | | | | | | |
| CET1 ratio | 12.3 | % | 11.9 | % | | 12.0 | % | 11.5 | % | | 12.3 | % | 11.3 | % |
| Tier 1 capital ratio | 14.6 |
| 14.2 |
| | 14.3 |
| 13.9 |
| | 14.5 |
| 13.6 |
|
| Total (Tier 1 plus Tier 2) capital ratio | 15.6 |
| 15.1 |
| | 14.8 |
| 14.4 |
| | 15.2 |
| 14.2 |
|
| Advanced Approach: | | | | | | | | |
| CET1 ratio | 11.1 | % | 10.7 | % | | 10.8 | % | 10.4 | % | | 10.6 | % | 9.7 | % |
| Tier 1 capital ratio | 13.2 |
| 12.8 |
| | 12.9 |
| 12.5 |
| | 12.6 |
| 11.8 |
|
| Total (Tier 1 plus Tier 2) capital ratio | 14.0 |
| 13.6 |
| | 13.2 |
| 12.8 |
| | 13.0 |
| 12.1 |
|
| | | | | | | | | |
| Average assets for leverage capital purposes | $ | 327,555 |
| | | $ | 324,423 |
| | | $ | 326,809 |
| |
| Total leverage exposure for SLR purposes | | $ | 355,960 |
| | | $ | 352,448 |
| | | $ | 355,083 |
|
| |
(a) | Reflects transitional adjustments to CET1, Tier 1 capital and Tier 2 capital required in 2017 and 2016 under the U.S. capital rules. |
The following table shows the impact on the consolidated capital ratios at Sept.June 30, 20172020 of a $100 million increase or decrease in common equity, or a $1 billion increase or decrease in RWAs, quarterly average assets or total leverage exposure.
| | | Sensitivity of consolidated capital ratios at Sept. 30, 2017 | |
| Sensitivity of consolidated capital ratios at June 30, 2020 | | Sensitivity of consolidated capital ratios at June 30, 2020 |
| | Increase or decrease of | Increase or decrease of |
| (in basis points) | $100 million in common equity | $1 billion in RWA, quarterly average assets or total leverage exposure | $100 million in common equity | $1 billion in RWA, quarterly average assets or total leverage exposure |
| CET1: | | |
| Standardized Approach | 7 | bps | 8 | bps | 6 | bps | 8 | bps |
| Advanced Approach | 6 | | 7 | | |
| Advanced Approaches | | 6 | | 8 | |
| | | |
| Tier 1 capital: | | |
| Standardized Approach | 7 | | 10 | | 6 | | 10 | |
| Advanced Approach | 6 | | 8 | | |
| Advanced Approaches | | 6 | | 10 | |
| | | |
| Total capital: | | |
| Standardized Approach | 7 | | 10 | | 6 | | 11 | |
| Advanced Approach | 6 | | 8 | | |
| Advanced Approaches | | 6 | | 10 | |
| | | |
| Leverage capital | 3 | | 2 | | |
| Tier 1 leverage | | 3 | | 2 | |
| | | |
| SLR | 3 | | 2 | | 3 | | 3 | |
| | | |
| Estimated CET1 ratio, fully phased-in – Non-GAAP: | | |
| Standardized Approach | 7 | | 8 | | |
| Advanced Approach | 6 | | 6 | | |
| | | |
| Estimated SLR, fully phased-in – Non-GAAP | 3 | | 2 | | |
Capital ratios vary depending on the size of the balance sheet at quarter-endperiod end and the levels and types of investments in assets. The balance sheet size fluctuates from quarterperiod to quarterperiod based on levels of customer and market activity. In general, when servicing clients are more actively trading securities, deposit balances and the balance sheet as a whole are higher. In addition, when markets experience significant volatility or stress, our balance sheet size may increase considerably as client deposit levels increase.
Supplementary Leverage Ratio
BNY Mellon has presented its consolidated and largest bank subsidiary’s estimated fully phased-in SLRs based on its interpretation of the U.S. capital rules, which are being gradually phased-in over a multi-year period and on the application of such rules to BNY Mellon’s businesses as currently conducted.
The following table presents the components of our SLR on both the transitional and fully phased-in basis forEffective April 1, 2020, custody banks, including BNY Mellon and our largest bank subsidiary, The Bank of New York Mellon.Mellon, are permitted to exclude certain central bank placements from leverage exposure used in the SLR calculation. Also, effective April 1, 2020 and lasting through March 31, 2021, BHCs are permitted to exclude U.S. Treasury securities from the leverage exposure used in the SLR calculation. This temporary exclusion increased our consolidated SLR by 40 basis points. See “Supervision and Regulation” in our 2019 Annual Report and “Recent regulatory developments” in our First Quarter 2020 Form 10-Q for additional information.
Stress capital buffer
In June 2020, the Federal Reserve notified BNY Mellon that its stress capital buffer (“SCB”) requirement will be 2.5%, equal to the regulatory minimum, effective as of Oct. 1, 2020. The SCB replaces the current 2.5% capital conservation buffer for Standardized Approach capital ratios.
The SCB final rule generally eliminates the requirement for prior approval of common stock repurchases in excess of the distributions in a firm’s capital plan, provided that such distributions do not cause a breach of the firm’s capital ratios, including the applicable capital buffer. In conjunction with the release of the 2020 CCAR results, the Federal Reserve has imposed restrictions on capital distributions for the third quarter of 2020. For more detail regarding these restrictions, see “Recent regulatory developments - CCAR 2020 results” in this Quarterly Report on Form 10-Q.
Total Loss-Absorbing Capacity (“TLAC”)
The final TLAC rule establishing external TLAC, external long-term debt (“LTD”) and related requirements for U.S. G-SIBs, including BNY
Mellon, at the top-tier holding company level became effective on Jan. 1, 2019.The following summarizes the minimum requirements for BNY Mellon’s external TLAC and external LTD ratios, plus currently applicable buffers.
|
| | | | | | | | | | | | | | | | | | | | |
| SLR | Sept. 30, 2017 | | June 30, 2017 | | Dec. 31, 2016 |
| (dollars in millions) | Transitional basis |
| Fully phased-in - Non-GAAP (a) |
| | Transitional basis |
| Fully phased-in - Non-GAAP (a) |
| | Transitional basis |
| Fully phased-in - Non-GAAP (a) |
|
| Consolidated: | | | | | | | | |
| Total Tier 1 capital | $ | 22,351 |
| $ | 21,649 |
| | $ | 21,864 |
| $ | 21,147 |
| | $ | 21,465 |
| $ | 19,911 |
|
| | | | | | | | | |
| Total leverage exposure: | | | | | | | | |
| Quarterly average total assets | $ | 345,709 |
| $ | 345,709 |
| | $ | 342,515 |
| $ | 342,515 |
| | $ | 344,142 |
| $ | 344,142 |
|
| Less: Amounts deducted from Tier 1 capital | 18,154 |
| 18,856 |
| | 18,092 |
| 18,810 |
| | 17,333 |
| 18,887 |
|
| Total on-balance sheet assets, as adjusted | 327,555 |
| 326,853 |
|
| 324,423 |
| 323,705 |
| | 326,809 |
| 325,255 |
|
| Off-balance sheet exposures: | | | | | | | | |
| Potential future exposure for derivative contracts (plus certain other items) | 6,213 |
| 6,213 |
| | 6,014 |
| 6,014 |
| | 6,021 |
| 6,021 |
|
| Repo-style transaction exposures | 1,034 |
| 1,034 |
| | 631 |
| 631 |
| | 533 |
| 533 |
|
| Credit-equivalent amount of other off-balance sheet exposures (less SLR exclusions) | 21,860 |
| 21,860 |
| | 22,098 |
| 22,098 |
| | 23,274 |
| 23,274 |
|
| Total off-balance sheet exposures | 29,107 |
| 29,107 |
|
| 28,743 |
| 28,743 |
| | 29,828 |
| 29,828 |
|
| Total leverage exposure | $ | 356,662 |
| $ | 355,960 |
|
| $ | 353,166 |
| $ | 352,448 |
| | $ | 356,637 |
| $ | 355,083 |
|
| | | | | | | | | |
SLR - Consolidated (b) | 6.3 | % | 6.1 | % | | 6.2 | % | 6.0 | % | | 6.0 | % | 5.6 | % |
| | | | | | | | | |
| The Bank of New York Mellon, our largest bank subsidiary: | | | | | | | | |
| Tier 1 capital | $ | 20,718 |
| $ | 19,955 |
| | $ | 19,897 |
| $ | 19,125 |
| | $ | 19,011 |
| $ | 17,708 |
|
| Total leverage exposure | $ | 292,759 |
| $ | 292,421 |
| | $ | 286,983 |
| $ | 286,634 |
| | $ | 291,022 |
| $ | 290,230 |
|
| | | | | | | | | |
SLR - The Bank of New York Mellon (b) | 7.1 | % | 6.8 | % | | 6.9 | % | 6.7 | % | | 6.5 | % | 6.1 | % |
|
| | |
| As a % of RWAs (a) | As a % of total leverage exposure |
| Eligible external TLAC ratios | Regulatory minimum of 18% plus a buffer (b) equal to the sum of 2.5%, the method 1 G-SIB surcharge (currently 1%), and the countercyclical capital buffer, if any
| Regulatory minimum of 7.5% plus a buffer (c) equal to 2%
|
| Eligible external LTD ratios | Regulatory minimum of 6% plus the greater of the method 1 or method 2 G-SIB surcharge (currently 1.5%) | 4.5% |
(a) RWA is the greater of Standardized and Advanced Approaches.
(b) Buffer to be met using only CET1.
| |
(b) | The estimated fully phased-in SLR (Non-GAAP) is based on our interpretation of the U.S. capital rules. When the SLR is fully phased-in in 2018 as a required minimum ratio, we expect to maintain an SLR of over 5%. The minimum required SLR is 3% and there is a 2% buffer, in addition to the minimum, that is applicable to U.S. G-SIBs. The insured depository institution subsidiaries of the U.S. G-SIBs, including those of BNY Mellon, must maintain a 6% SLRBuffer to be considered “well-capitalized.”met using only Tier 1 capital. |
External TLAC consists of the Parent’s Tier 1 capital and eligible unsecured LTD issued by it that has a remaining term to maturity of at least one year and satisfies certain other conditions. Eligible LTD consists of the unpaid principal balance of eligible unsecured debt securities, subject to haircuts for amounts due to be paid within two years, that satisfy certain other conditions. Debt issued prior to Dec. 31, 2016 has been permanently grandfathered to the extent these instruments otherwise would be ineligible only due to containing impermissible acceleration rights or being governed by foreign law.
The following table presents our external TLAC and external LTD ratios.
|
| | | | | | |
| TLAC and LTD ratios | June 30, 2020 |
| | Minimum
required |
| Minimum ratios
with buffers |
| |
| | Ratios |
|
| Eligible external TLAC: | | | |
| As a percentage of RWA | 18.0 | % | 21.5 | % | 28.7 | % |
| As a percentage of total leverage exposure | 7.5 | % | 9.5 | % | 15.4 | % |
| | | | |
| Eligible external LTD: | | | |
| As a percentage of RWA | 7.5 | % | N/A | 12.5 | % |
| As a percentage of total leverage exposure | 4.5 | % | N/A | 6.7 | % |
If BNY Mellon maintains risk-based ratio or leverage TLAC measures above the minimum required level, but with a risk-based ratio or leverage below the minimum level with buffers, we will face constraints on dividends, equity repurchases and discretionary executive compensation based on the amount of the shortfall and eligible retained income.
Trading activities and risk management
Our trading activities are focused on acting as a market-maker for our customers, facilitating customer trades and risk mitigating hedging in compliance with the Volcker Rule. The risk from market-making activities for customers is managed by our traders and limited in total exposure through a system of position limits, value-at-risk (“VaR”) methodology and other market sensitivity measures. VaR is the potential loss in value due to adverse market movements over a defined time horizon with a specified confidence level. The calculation of our VaR used by management and presented below assumes a one-day holding period, utilizes a 99% confidence level and incorporates non-linear product characteristics. VaR facilitates comparisons across portfolios of different risk characteristics. VaR also captures the
diversification of aggregated risk at the firm widefirm-wide level.
VaR represents a key risk management measure and it is important to note the inherent limitations to VaR, which include:
VaR does not estimate potential losses over longer time horizons where moves may be extreme;
VaR does not take account of potential variability of market liquidity; and
Previous moves in market risk factors may not produce accurate predictions of all future market moves.
See Note 1617 of the Notes to Consolidated Financial Statements for additional information on the VaR methodology.
In an effort to improve our enterprise level risk management capabilities, we have changed our VaR model from Monte Carlo simulation to historical simulation for both management and RWA calculations. This change was effective as of Jan. 1, 2017. In addition to this model enhancement, the impact of credit valuation adjustment (“CVA”) is now included.
The following tables indicate the calculated VaR amounts for the trading portfolio for the designated periods using the newly implemented historical simulation VaR model. The impact of changes in methodology is not material.
|
| | | | | | | | | | | | |
VaR (a) | 2Q20 | June 30, 2020 |
|
| (in millions) | Average |
| Minimum |
| Maximum |
|
| Interest rate | $ | 3.0 |
| $ | 2.1 |
| $ | 4.9 |
| $ | 2.2 |
|
| Foreign exchange | 3.4 |
| 2.2 |
| 5.9 |
| 2.4 |
|
| Equity | 0.5 |
| 0.4 |
| 1.4 |
| 0.4 |
|
| Credit | 3.5 |
| 1.8 |
| 10.2 |
| 2.8 |
|
| Diversification | (5.7 | ) | N/M |
| N/M |
| (4.0 | ) |
| Overall portfolio | 4.7 |
| 3.1 |
| 11.4 |
| 3.8 |
|
| | VaR (a) | 3Q17 | Sept. 30, 2017 |
| 1Q20 | March 31, 2020 |
|
| (in millions) | Average |
| Minimum |
| Maximum |
| Average |
| Minimum |
| Maximum |
|
| Interest rate | $ | 3.3 |
| $ | 2.8 |
| $ | 4.2 |
| $ | 2.7 |
| $ | 4.9 |
| $ | 3.2 |
| $ | 11.3 |
| $ | 5.1 |
|
| Foreign exchange | 3.7 |
| 3.1 |
| 5.6 |
| 4.8 |
| 3.1 |
| 1.7 |
| 6.3 |
| 4.5 |
|
| Equity | 0.9 |
| 0.8 |
| 1.1 |
| 0.9 |
| 1.4 |
| 0.8 |
| 2.3 |
| 0.9 |
|
| Credit | 1.0 |
| 0.6 |
| 1.4 |
| 1.0 |
| 3.4 |
| 1.2 |
| 12.1 |
| 9.8 |
|
| Diversification | (5.1 | ) | N/M |
| N/M |
| (5.3 | ) | (6.4 | ) | N/M |
| N/M |
| (9.9 | ) |
| Overall portfolio | 3.8 |
| 3.2 |
| 5.3 |
| 4.1 |
| 6.4 |
| 3.5 |
| 14.3 |
| 10.4 |
|
| | VaR (a) | 2Q17 | June 30, 2017 |
| 2Q19 | June 30, 2019 |
|
| (in millions) | Average |
| Minimum |
| Maximum |
| Average |
| Minimum |
| Maximum |
|
| Interest rate | $ | 3.3 |
| $ | 2.8 |
| $ | 4.1 |
| $ | 4.0 |
| $ | 4.2 |
| $ | 3.3 |
| $ | 5.2 |
| $ | 3.8 |
|
| Foreign exchange | 4.3 |
| 3.4 |
| 5.8 |
| 4.6 |
| 2.7 |
| 1.9 |
| 4.2 |
| 2.3 |
|
| Equity | 0.2 |
| 0.1 |
| 1.1 |
| 1.1 |
| 0.8 |
| 0.6 |
| 0.9 |
| 0.7 |
|
| Credit | 1.1 |
| 0.5 |
| 1.4 |
| 0.8 |
| 0.8 |
| 0.5 |
| 1.2 |
| 0.9 |
|
| Diversification | (4.8 | ) | N/M |
| N/M |
| (5.8 | ) | (3.2 | ) | N/M |
| N/M |
| (3.2 | ) |
| Overall portfolio | 4.1 |
| 3.3 |
| 5.4 |
| 4.7 |
| 5.3 |
| 4.0 |
| 6.9 |
| 4.5 |
|
| | VaR (a) | YTD17 | YTD20 |
| (in millions) | Average |
| Minimum |
| Maximum |
| Average |
| Minimum |
| Maximum |
|
| Interest rate | $ | 3.5 |
| $ | 2.8 |
| $ | 4.9 |
| $ | 4.0 |
| $ | 2.1 |
| $ | 11.3 |
|
| Foreign exchange | 3.9 |
| 2.6 |
| 5.8 |
| 3.2 |
| 1.7 |
| 6.3 |
|
| Equity | 0.4 |
| 0.1 |
| 1.1 |
| 0.9 |
| 0.4 |
| 2.3 |
|
| Credit | 1.1 |
| 0.5 |
| 1.7 |
| 3.5 |
| 1.2 |
| 12.1 |
|
| Diversification | (4.9 | ) | N/M |
| N/M |
| (6.1 | ) | N/M |
| N/M |
|
| Overall portfolio | 4.0 |
| 3.2 |
| 5.4 |
| 5.5 |
| 3.1 |
| 14.3 |
|
|
| | | | | | | | | |
VaR (a) | YTD19 |
| (in millions) | Average |
| Minimum |
| Maximum |
|
| Interest rate | $ | 4.1 |
| $ | 3.2 |
| $ | 5.3 |
|
| Foreign exchange | 3.3 |
| 1.9 |
| 6.4 |
|
| Equity | 0.7 |
| 0.6 |
| 1.1 |
|
| Credit | 0.7 |
| 0.4 |
| 1.2 |
|
| Diversification | (3.1 | ) | N/M |
| N/M |
|
| Overall portfolio | 5.7 |
| 4.0 |
| 9.5 |
|
| |
| (a) | Beginning Jan. 1, 2017, the VaR figures reflect the impact of the CVA and hedges as per the guidance included in ASC 820, Fair Value Measurement. VaR exposure does not include the impact of the Company’s consolidated investment management funds and seed capital investments.
|
N/M - Because the minimum and maximum may occur on different days for different risk components, it is not meaningful to compute a minimum and maximum portfolio diversification effect.
The following tables indicate the calculated VaR amounts for the trading portfolio for the designated periods as previously reported under the former Monte Carlo simulation VaR model.
|
| | | | | | | | | | | | |
VaR (a) | 3Q16 | Sept. 30, 2016 |
|
| (in millions) | Average |
| Minimum |
| Maximum |
|
| Interest rate | $ | 7.3 |
| $ | 5.4 |
| $ | 8.9 |
| $ | 7.9 |
|
| Foreign exchange | 4.2 |
| 3.2 |
| 7.5 |
| 3.7 |
|
| Equity | 0.6 |
| 0.5 |
| 0.8 |
| 0.6 |
|
| Credit | 0.3 |
| 0.3 |
| 0.4 |
| 0.4 |
|
| Diversification | (5.8 | ) | N/M |
| N/M |
| (5.7 | ) |
| Overall portfolio | 6.6 |
| 5.0 |
| 7.7 |
| 6.9 |
|
|
| | | | | | | | | |
VaR (a) | YTD16 |
| (in millions) | Average |
| Minimum |
| Maximum |
|
| Interest rate | $ | 6.3 |
| $ | 4.3 |
| $ | 8.9 |
|
| Foreign exchange | 2.8 |
| 1.2 |
| 11.1 |
|
| Equity | 0.6 |
| 0.4 |
| 0.8 |
|
| Credit | 0.3 |
| 0.2 |
| 0.4 |
|
| Diversification | (4.0 | ) | N/M |
| N/M |
|
| Overall portfolio | 6.0 |
| 4.3 |
| 7.7 |
|
| |
(a) | VaR figures do not reflect the impact of the CVA guidance in ASC 820, Fair Value Measurement. This is consistent with the regulatory treatment. VaR exposure does not include the impact of the Company’s consolidated investment management funds and seed capital investments. |
N/M - Because the minimum and maximum may occur on different days for different risk components, it is not meaningful to compute a minimum and maximum portfolio diversification effect.
The decrease in VaR at June 30, 2020 compared with March 31, 2020 reflects lower market volatility in the second quarter of 2020.
The interest rate component of VaR represents instruments whose values are predominantly vary with the level or volatility ofdriven by U.S. Treasury securities interest rates.rate levels. These instruments include, but are not limited to: sovereign debt,to, U.S. Treasury securities, swaps, swaptions, forward rate agreements, exchange-traded futures and options, and other interest rate derivative products.
The foreign exchange component of VaR represents instruments whose values predominantly vary with the level or volatility of currency exchange rates or interest rates. These instruments include, but are not limited to:to, currency balances, spot and forward transactions, currency options exchange-traded futures and options, and other currency derivative products.
The equity component of VaR consists of instruments that represent an ownership interest in the form of domestic and foreign common stock or other equity-linked instruments. These instruments include, but are not limited to:to, common stock, exchange-traded funds, preferred stock, listed equity options (puts and calls), over-the-counter (“OTC”)OTC equity options, equity total return swaps, equity index futures and other equity derivative products.
The credit component of VaR represents instruments whose values are predominantly vary with thedriven by credit worthiness of counterparties.spread levels, i.e., idiosyncratic default risk. These instruments include, but are not limited to, credit derivatives (credit default swaps and exchange-traded credit index instruments) andsecurities with exposures from corporate and municipal credit spreads, and mortgage prepayments. Credit derivatives are used to hedge various credit exposures.spreads.
The diversification component of VaR is the risk reduction benefit that occurs when combining portfolios and offsetting positions, and from the correlated behavior of risk factor movements.
During the thirdsecond quarter of 2017,2020, interest rate risk generated 37%29% of average gross VaR, foreign exchange risk generated 42%33% of average gross VaR, equity risk accounted for 10%generated 5% of average gross VaR and credit risk generated 11%33% of average gross VaR. During the thirdsecond quarter of 2017,2020, our daily trading loss did not exceed our calculated VaR amount of the overall portfolio.
The following table of total daily trading revenue or loss illustrates the number of trading days in which our trading revenue or loss fell within particular ranges during the past five quarters.
|
| | | | | | | | | | |
Distribution of trading revenue (loss) (a) | | | |
| | Quarter ended |
| (dollars in millions) | Sept. 30, 2017 |
| June 30,
2017 |
| March 31,
2017 |
| Dec. 31, 2016 |
| Sept. 30, 2016 |
|
| Revenue range: | Number of days |
| Less than $(2.5) | — |
| — |
| — |
| — |
| — |
|
| $(2.5) – $0 | 1 |
| 2 |
| 1 |
| 3 |
| 6 |
|
| $0 – $2.5 | 29 |
| 31 |
| 31 |
| 28 |
| 22 |
|
| $2.5 – $5.0 | 29 |
| 27 |
| 26 |
| 23 |
| 25 |
|
| More than $5.0 | 4 |
| 4 |
| 4 |
| 7 |
| 11 |
|
|
| | | | | | | | | | | |
| | Distribution of trading revenue (loss) (a) | | | |
| | | Quarter ended |
| | (dollars in millions) | June 30,
2020 |
| March 31,
2020 |
| Dec. 31, 2019 |
| Sept. 30, 2019 |
| June 30, 2019 |
|
| |
| | Revenue range: | Number of days |
| | Less than $(2.5) | 6 |
| — |
| 3 |
| 2 |
| — |
|
| | $(2.5) – $0 | 12 |
| 3 |
| 5 |
| 7 |
| 4 |
|
| | $0 – $2.5 | 17 |
| 19 |
| 23 |
| 26 |
| 30 |
|
| | $2.5 – $5.0 | 15 |
| 19 |
| 24 |
| 22 |
| 23 |
|
| | More than $5.0 | 14 |
| 21 |
| 7 |
| 7 |
| 7 |
|
| |
| (a) | Trading revenue (loss) includes realized and unrealized gains and losses primarily related to spot and forward foreign exchange transactions, derivatives and securities trades for our customers and excludes any associated commissions, underwriting fees and net interest revenue. |
The number of days when revenue was generated decreased compared with the first quarter of 2020 driven by lower volumes and volatility in the second quarter of 2020.
Trading assets include debt and equity instruments and derivative assets, primarily interest rate and foreign exchange contracts, not designated as hedging instruments. Trading assets were $4.7$14.2 billion at Sept.June 30, 20172020 and $5.7$13.6 billion atDec. 31, 2016.2019.
Trading liabilities include debt and equity instruments and derivative liabilities, primarily interest rate and
foreign exchange contracts, not designated as hedging instruments. Trading liabilities were $3.3$5.6 billion at Sept.June 30, 20172020 and $4.4$4.8 billion at Dec. 31, 2016.2019.
Under our fair value methodology for derivative contracts, an initial “risk-neutral” valuation is performed on each position assuming time-discounting based on a AA credit curve. In addition, we consider credit risk in arriving at the fair value of our derivatives.derivatives.
We reflect external credit ratings as well as observable credit default swap spreads for both ourselves and our counterparties when measuring the fair value of our derivative positions. Accordingly, the valuation of our derivative positions is sensitive to the current changes in our own credit spreads, as well as those of our counterparties.
At Sept.June 30, 2017,2020, our OTC derivative assets, including those in hedging relationships, of $3.6$4.3 billion included a CVAcredit valuation adjustment (“CVA”) deduction of $30$41 million. Our OTC derivative liabilities, including those in hedging relationships, of $3.2$3.9 billion included a debit valuation adjustment (“DVA”) of $2$1 million related to our own credit spread. Net of hedges, the CVA decreasedincreased by $1$2 million and the DVA was unchanged in the third quarter of 2017. The net impact of these adjustments increased foreign exchange and other trading revenue by less than $1 million in the third quarter of 2017.
In the second quarter of 2017, net of hedges, the CVA2020, which decreased by $3 million and the DVA decreased by $1 million. The net impact of these adjustments increased foreign exchange and other trading revenue by $2 million in the second quarter of 2017.
In the third quarter of 2016, net of hedges, the CVA decreased by $8 million and the DVA decreased by $4 million. The net impact of these adjustments increased foreign exchange and other trading revenue by $4 million in the thirdfirst quarter of 2016.2020 and $1 million in the second quarter of 2019.
The table below summarizes the riskdistribution of credit ratings for our foreign exchange and interest rate derivative counterparty credit exposure duringcounterparties over the past five quarters. This informationquarters, which indicates the degreelevel of risk to which we are exposed.counterparty credit associated with these trading activities. Significant changes in counterparty credit ratings classifications for our foreign exchange and other trading activity could result in increasedalter the level of credit risk for us.faced by BNY Mellon.
| | Foreign exchange and other trading counterparty risk rating profile (a) | Foreign exchange and other trading counterparty risk rating profile (a) | Foreign exchange and other trading counterparty risk rating profile (a) | |
| | | Quarter ended |
| | Quarter ended | June 30, 2020 |
| March 31,
2020 |
| Dec. 31, 2019 |
| Sept. 30, 2019 |
| June 30,
2019 |
|
| | Sept. 30, 2017 |
| June 30,
2017 |
| March 31,
2017 |
| Dec. 31, 2016 |
| Sept. 30, 2016 |
|
| Rating: | | |
| AAA to AA- | 41 | % | 44 | % | 43 | % | 35 | % | 45 | % | 56 | % | 56 | % | 54 | % | 55 | % | 54 | % |
| A+ to A- | 30 |
| 27 |
| 36 |
| 39 |
| 32 |
| 18 |
| 24 |
| 24 |
| 24 |
| 26 |
|
| BBB+ to BBB- | 24 |
| 22 |
| 17 |
| 22 |
| 19 |
| 18 |
| 14 |
| 17 |
| 16 |
| 17 |
|
| Noninvestment grade (BB+ and lower) | 5 |
| 7 |
| 4 |
| 4 |
| 4 |
| |
BB+ and lower (b) | | 8 |
| 6 |
| 5 |
| 5 |
| 3 |
|
| Total | 100 | % | 100 | % | 100 | % | 100 | % | 100 | % | 100 | % | 100 | % | 100 | % | 100 | % | 100 | % |
| |
| (a) | Represents credit rating agency equivalent of internal credit ratings. |
Asset/liability management
Our diversified business activities include processing securities, accepting deposits, investing in securities, lending, raising money as needed to fund assets and other transactions. The market risks from these activities areinclude interest rate risk and foreign exchange risk. Our primary market risk is exposure to movements in U.S. dollar interest rates and certain foreign currency interest rates. We actively manage interest rate sensitivity and use earnings simulation and discounted cash flow models to identify interest rate exposures.
An earnings simulation model is the primary tool used to assess changes in pre-tax net interest revenue. The model incorporates management’s assumptions regarding interest rates, balance changes on core deposits, market spreads, changes in the prepayment behavior of loans and securities and the impact of
derivative financial instruments used for interest rate risk management purposes. These assumptions have been developed through a combination of historical analysis and future expected pricing behavior and are inherently uncertain. As a result, the earnings simulation model cannot precisely estimate net interest revenue or the impact of higher or lower interest rates on net interest revenue. Actual results may differ materially from projected results due to timing, magnitude and frequency of interest rate changes, and changes in market conditions and management’s strategies, among other factors.
TheIn the table below, relies on certain critical assumptions regardingwe use the balance sheet and depositors’ behavior relatedearnings simulation model to interest rate fluctuations and the prepayment and extension risk in certain of our assets. Generally, there has been an inverse relationship between interest rates and client deposit levels. To the extent that actual behavior is different from that assumed in the models, there could be a change in interest rate sensitivity.
We evaluate the effect on earnings by runningrun various interest rate ramp scenarios from a baseline scenario. The interest rate ramp scenarios are reviewed to examine the impact of large interest rate movements. In each scenario, all currenciescurrencies’ interest rates are shifted higher or lower. Interest rate sensitivity is quantified by calculating the change in pre-tax net interest revenue between the scenarios over a 12-month measurement period.
The following table shows net interest revenue sensitivity for BNY Mellon.
|
| | | | | | | | | | | | | | | |
Estimated changes in net interest revenue
(in millions) | Sept. 30, 2017 |
| June 30,
2017 |
| March 31,
2017 |
| Dec. 31, 2016 |
| Sept. 30, 2016 |
|
up 200 bps parallel rate ramp vs. baseline (a) | $ | (2 | ) | $ | (69 | ) | $ | (136 | ) | $ | 6 |
| $ | 62 |
|
up 100 bps parallel rate ramp vs. baseline (a) | 112 |
| 58 |
| 87 |
| 145 |
| 147 |
|
Long-term up 50 bps, short-term unchanged (b) | 113 |
| 92 |
| 92 |
| 81 |
| 116 |
|
Long-term down 50 bps, short-term unchanged (b) | (129 | ) | (85 | ) | (104 | ) | (88 | ) | (128 | ) |
| |
(a) | In the parallel rate ramp, both short-term and long-term rates move in four equal quarterly increments.
|
| |
(b) | Long-term is equal to or greater than one year. |
bps - basis points.
The baseline scenario used for the calculations in the estimated changes in net interest revenue table above as of Sept. 30, 2017, June 30, 2017, March 31, 2017 and Dec. 31, 2016 arebased on our quarter-end balance sheet and the spot yield curve. The baseline scenario used for Sept. 30, 2016 was based on implied forward yield curves. We revised the
methodology as of Dec. 31, 2016 as we believe using the spot yield curve forTypically, the baseline scenario providesuses the average deposit balances of the last month of the quarter. However, during the month of March we experienced a more accurate reflection of net interest revenue sensitivity given the recentsignificant increase in short-term interest ratesdeposits and a corresponding increase in central bank placements. To normalize the implied forward rates. Because interest rates andanalysis, we used the implied forward yield curves were lower in prior periods, the impact of using a
spot yield curve versus an implied forward yield curve was not as significant.first quarter average for these balances. The 100 basis point ramp scenario assumes rates increasechange 25 basis points above or below the yield curve in each of the next four quarters and the 200 basis point ramp scenario assumes a 50 basis point per quarter increase.
Ourchange. Interest rate sensitivity is quantified by calculating the change in pre-tax net interest revenue between the scenarios over a 12-month measurement period. The net interest revenue sensitivity table above incorporates assumptions aboutmethodology assumes static deposit levels and also assumes that no management actions will be taken to mitigate the impacteffects of changes in interest rates on depositor behavior based on historical experience. Given the current historically low interest rate environmentchanges.
The following table shows net interest revenue sensitivity for BNY Mellon.
|
| | | | | | | | | |
Estimated changes in net interest revenue
(in millions) | June 30, 2020 |
| March 31,
2020 |
| June 30,
2019 |
|
Up 200 bps parallel rate ramp vs. baseline (a) | $ | 591 |
| $ | 557 |
| $ | 380 |
|
Up 100 bps parallel rate ramp vs. baseline (a) | 349 |
| 334 |
| 200 |
|
Down 100 bps parallel rate ramp vs. baseline (a) | 315 |
| 100 |
| (179 | ) |
Long-term up 50 bps, short-term unchanged (b) | 153 |
| 166 |
| 171 |
|
Long-term down 50 bps, short-term unchanged (b) | (173 | ) | (158 | ) | (192 | ) |
| |
| (a) | In the parallel rate ramp, both short-term and long-term rates move in four equal quarterly increments. |
| |
| (b) | Long-term is equal to or greater than one year. |
The down 100 basis point scenario was impacted by a change in our deposit assumptions. Specifically, we increased the potential changeamount of deposit balances to which we would pass through negative central bank rates in the implementationscenario.
To illustrate the net interest revenue sensitivity to deposit runoff, we note that a $5 billion instantaneous reduction of monetary policy,U.S. dollar denominated noninterest-bearing deposits would reduce the impact of depositor behavior is highly uncertain. The lowernet interest revenue sensitivity results in the ramp up 100 basis point and 200 basis point scenario compared with the 100 basis point scenario is driven by the assumption of increased deposit runoff and forecasted changesscenarios in the deposit pricing.table above by approximately $35 million and approximately $65 million, respectively. The impact would be smaller if the runoff was assumed to be a mixture of interest-bearing and noninterest-bearing deposits.
GrowthFor a discussion of factors impacting the growth or contraction of deposits, see “Risk Factors - Our business, financial condition and results of operations could also be adversely affected by the following factors:if we do not effectively manage our liquidity,” in our 2019 Annual Report.
Global economic uncertainty;
Our ratings relative to other financial institutions’ ratings; and
Any of these events could change our assumptions about depositor behavior and have a significant impact on our balance sheet and net interest revenue.
Off-balance sheet arrangements
Off-balance sheet arrangements discussed in this section are limited to certain guarantees, retained or contingent interests and obligations arising out of unconsolidated variable interest entities (“VIEs”). For BNY Mellon, these items include certain credit guarantees and a securitization. Guarantees include lending-related guaranteesSBLCs issued as part of our corporate banking business and securities lending indemnifications issued as part of our Investment Services business. See Note 1718 of the Notes to Consolidated Financial Statements for a further discussion of our off-balance sheet arrangements.
Supplemental information - Explanation of GAAP and Non-GAAP financial measures
BNY Mellon has included in this Form 10-Q certain Non-GAAP financial measures based on estimated fully phased-in CET1 and other risk-based capital ratios, the estimated fully phased-in SLR and tangible common shareholders’ equity. BNY Mellon believes that the CET1 and other risk-based capital ratios, on a fully phased-intangible basis and the SLR, onas a fully phased-in basis, are measures of capital strength that provide additional usefulsupplement to generally accepted accounting principles (“GAAP”) information, to investors, supplementing the capital ratios which are, or were, required by regulatory authorities. The tangible common shareholders’ equity ratio, which excludesexclude goodwill and intangible assets, net of deferred tax liabilities, includes changes in investment securities valuations which are reflected in total shareholders’ equity. BNY Mellon believesliabilities. We believe that the return on tangible common equity measure is an additional useful measureinformation for investors because it presents a measure of those assets that can generate income. BNY Mellon has provided a measure ofincome, and the tangible book value per common share which it believes providesis additional useful information as tobecause it presents the level of tangible assets in relation to shares of common stock outstanding.
BNY Mellon has presented revenue measures, which exclude the effect of noncontrolling interests related to consolidated investment management funds, and expense measures, which exclude amortization of intangible assets and M&I, litigation and restructuring charges. Operating margin, operating leverage and return on equity measures, which
exclude some or all of these items, as well as the recovery related to Sentinel, are also presented. Operating margin measures may also exclude the provision for credit losses and distribution and servicing expense. BNY Mellon believes that these measures are useful to investors because they permit a focus on period-to-period comparisons, which relate to the ability of BNY Mellon to enhance revenues and limit expenses in circumstances where such matters are within BNY Mellon’s control. M&I expenses primarily relate to acquisitions and generally continue for approximately three years after the transaction. Litigation charges represent accruals for loss contingencies that are both probable and reasonably estimable, but exclude standard business-related legal fees. Restructuring charges relate to our streamlining actions and Operational Excellence Initiatives. Excluding the charges mentioned above permits investors to view expenses on a basis consistent with how management views the business.
The presentation of income from consolidatedthe growth rates of investment management funds, net of net income attributable to noncontrolling interests related to the consolidation of certain investment management funds,and performance fees on a constant currency basis permits investors to view revenueassess the significance of changes in foreign currency exchange
rates. Growth rates on a constant currency basis consistent with how management viewswere determined by applying the business. BNY Mellon believescurrent period foreign currency exchange rates to the prior period revenue. We believe that these presentations,this presentation, as a supplement to GAAP information, givegives investors a clearer picture of the related revenue results of its primary businesses.without the variability caused by fluctuations in foreign currency exchange rates.
Each of these measures as described above is used by management to monitor financial performance, both on a company-wide and on a business-level basis.
BNY Mellon 49has also included the adjusted pre-tax operating margin – Non-GAAP, which is the pre-tax operating margin for the Investment and Wealth Management business net of distribution and servicing expense that was passed to third parties who distribute or service our managed funds. We believe that this measure is useful when evaluating the performance of the Investment and Wealth Management business relative to industry competitors.
The following table presents the reconciliation of the pre-tax operating margin ratio.
|
| | | | | | | | | | | | | | | |
| Pre-tax operating margin | 3Q17 |
| 2Q17 |
| 3Q16 |
| YTD17 |
| YTD16 |
|
| (dollars in millions) |
| Income before income taxes – GAAP | $ | 1,368 |
| $ | 1,308 |
| $ | 1,317 |
| $ | 3,882 |
| $ | 3,573 |
|
| Less: Net income attributable to noncontrolling interests of consolidated investment management funds | 3 |
| 3 |
| 9 |
| 24 |
| 6 |
|
| Add: Amortization of intangible assets | 52 |
| 53 |
| 61 |
| 157 |
| 177 |
|
| M&I, litigation and restructuring charges | 6 |
| 12 |
| 18 |
| 26 |
| 42 |
|
| Recovery related to Sentinel | — |
| — |
| (13 | ) | — |
| (13 | ) |
Income before income taxes, as adjusted – Non-GAAP (a) | $ | 1,423 |
| $ | 1,370 |
| $ | 1,374 |
| $ | 4,041 |
| $ | 3,773 |
|
| | | | | | |
| Fee and other revenue – GAAP | $ | 3,167 |
| $ | 3,120 |
| $ | 3,150 |
| $ | 9,305 |
| $ | 9,119 |
|
| Income from consolidated investment management funds – GAAP | 10 |
| 10 |
| 17 |
| 53 |
| 21 |
|
| Net interest revenue – GAAP | 839 |
| 826 |
| 774 |
| 2,457 |
| 2,307 |
|
| Total revenue – GAAP | 4,016 |
| 3,956 |
| 3,941 |
| 11,815 |
| 11,447 |
|
| Less: Net income attributable to noncontrolling interests of consolidated investment management funds | 3 |
| 3 |
| 9 |
| 24 |
| 6 |
|
Total revenue, as adjusted – Non-GAAP (a) | $ | 4,013 |
| $ | 3,953 |
| $ | 3,932 |
| $ | 11,791 |
| $ | 11,441 |
|
| | | | | | |
Pre-tax operating margin – GAAP (b)(c) | 34 | % | 33 | % | 33 | % | 33 | % | 31 | % |
Adjusted pre-tax operating margin – Non-GAAP (a)(b)(c) | 35 | % | 35 | % | 35 | % | 34 | % | 33 | % |
| |
(a) | Non-GAAP information for all periods presented excludes the net income attributable to noncontrolling interests of consolidated investment management funds, amortization of intangible assets and M&I, litigation and restructuring charges. Non-GAAP information for the third quarter of 2016 and for the first nine months of 2016 also excludes a recovery of the previously impaired Sentinel loan. |
| |
(b) | Income before taxes divided by total revenue. |
| |
(c) | Our GAAP earnings include tax-advantaged investments such as low income housing, renewable energy, corporate/bank-owned life insurance and tax-exempt securities. The benefits of these investments are primarily reflected in tax expense. If reported on a tax-equivalent basis, these investments would increase revenue and income before taxes by $102 million for the third quarter of 2017, $106 million for the second quarter of 2017, $74 million for the third quarter of 2016, $309 million for the first nine months of 2017 and $225 million for the first nine months of 2016 and would increase our pre-tax operating margin by approximately 1.6% for the third quarter of 2017, 1.8% for the second quarter of 2017, 1.2% for the third quarter of 2016, 1.7% for the first nine months of 2017 and 1.3% for the first nine months of 2016.
|
The following table presents the reconciliation of operating leverage.
|
| | | | | | | | | | | | | |
| Operating leverage | 3Q17 |
| 2Q17 |
| 3Q16 |
| 3Q17 vs. |
| (dollars in millions) | 2Q17 |
| 3Q16 |
|
| Total revenue – GAAP | $ | 4,016 |
| $ | 3,956 |
| $ | 3,941 |
| 1.52 | % | 1.90 | % |
| Less: Net income attributable to noncontrolling interests of consolidated investment management funds | 3 |
| 3 |
| 9 |
| | |
| Total revenue, as adjusted – Non-GAAP | $ | 4,013 |
| $ | 3,953 |
| $ | 3,932 |
| 1.52 | % | 2.06 | % |
| | | | | | |
| Total noninterest expense – GAAP | $ | 2,654 |
| $ | 2,655 |
| $ | 2,643 |
| (0.04 | )% | 0.42 | % |
| Less: Amortization of intangible assets | 52 |
| 53 |
| 61 |
| | |
| M&I, litigation and restructuring charges | 6 |
| 12 |
| 18 |
| | |
| Total noninterest expense, as adjusted – Non-GAAP | $ | 2,596 |
| $ | 2,590 |
| $ | 2,564 |
| 0.23 | % | 1.25 | % |
| | | | | | |
Operating leverage – GAAP (a) | | | | 156 | bps | 148 | bps |
Adjusted operating leverage – Non-GAAP (a)(b) | | | | 129 | bps | 81 | bps |
| |
(a) | Operating leverage is the rate of increase (decrease) in total revenue less the rate of increase (decrease) in total noninterest expense. |
| |
(b) | Non-GAAP operating leverage for all periods presented excludes the net income attributable to noncontrolling interests of consolidated investment management funds, amortization of intangible assets and M&I, litigation and restructuring charges. |
bps - basis points.
The following table presents the reconciliation of the returnsreturn on common equity and tangible common equity.
|
| | | | | | | | | | | | | | | |
| Return on common equity and tangible common equity | 3Q17 |
| 2Q17 |
| 3Q16 |
| YTD17 |
| YTD16 |
|
| (dollars in millions) |
| Net income applicable to common shareholders of The Bank of New York Mellon Corporation – GAAP | $ | 983 |
| $ | 926 |
| $ | 974 |
| $ | 2,789 |
| $ | 2,603 |
|
| Add: Amortization of intangible assets | 52 |
| 53 |
| 61 |
| 157 |
| 177 |
|
| Less: Tax impact of amortization of intangible assets | 17 |
| 19 |
| 21 |
| 54 |
| 62 |
|
| Adjusted net income applicable to common shareholders of The Bank of New York Mellon Corporation excluding amortization of intangible assets – Non-GAAP | 1,018 |
| 960 |
| 1,014 |
| 2,892 |
| 2,718 |
|
| Add: M&I, litigation and restructuring charges | 6 |
| 12 |
| 18 |
| 26 |
| 42 |
|
| Recovery related to Sentinel | — |
| — |
| (13 | ) | — |
| (13 | ) |
| Less: Tax impact of M&I, litigation and restructuring charges | — |
| 3 |
| 5 |
| 5 |
| 13 |
|
| Tax impact of recovery related to Sentinel | — |
| — |
| (5 | ) | — |
| (5 | ) |
Adjusted net income applicable to common shareholders of The Bank of New York Mellon Corporation, as adjusted – Non-GAAP (a) | $ | 1,024 |
| $ | 969 |
| $ | 1,019 |
| $ | 2,913 |
| $ | 2,739 |
|
| | | | | | |
| Average common shareholders’ equity | $ | 36,780 |
| $ | 35,862 |
| $ | 35,767 |
| $ | 35,876 |
| $ | 35,616 |
|
| Less: Average goodwill | 17,497 |
| 17,408 |
| 17,463 |
| 17,415 |
| 17,549 |
|
| Average intangible assets | 3,487 |
| 3,532 |
| 3,711 |
| 3,532 |
| 3,770 |
|
Add: Deferred tax liability – tax deductible goodwill (b) | 1,561 |
| 1,542 |
| 1,477 |
| 1,561 |
| 1,477 |
|
Deferred tax liability – intangible assets (b) | 1,092 |
| 1,095 |
| 1,116 |
| 1,092 |
| 1,116 |
|
| Average tangible common shareholders’ equity – Non-GAAP | $ | 18,449 |
| $ | 17,559 |
| $ | 17,186 |
| $ | 17,582 |
| $ | 16,890 |
|
| | | | | | |
Return on common equity – GAAP (c) | 10.6 | % | 10.4 | % | 10.8 | % | 10.4 | % | 9.8 | % |
Adjusted return on common equity – Non-GAAP (a)(c) | 11.0 | % | 10.8 | % | 11.3 | % | 10.9 | % | 10.3 | % |
| | | | | | |
Return on tangible common equity – Non-GAAP (c) | 21.9 | % | 21.9 | % | 23.5 | % | 22.0 | % | 21.5 | % |
Adjusted return on tangible common equity – Non-GAAP (a)(c) | 22.0 | % | 22.1 | % | 23.6 | % | 22.1 | % | 21.7 | % |
| |
(a) | Non-GAAP information for all periods presented excludes the amortization of intangible assets and M&I, litigation and restructuring charges. Non-GAAP information for the third quarter of 2016 and for the first nine months of 2016 also excludes a recovery of the previously impaired Sentinel loan. |
| |
(b) | Deferred tax liabilities are based on fully phased-in Basel III capital rules. |
| |
(c) | Quarterly returns are annualized. |
The following table presents the reconciliation of book value per common share.
|
| | | | | | | | | | | | |
| Book value per common share | Sept. 30, 2017 |
| June 30,
2017 |
| Dec. 31, 2016 |
| Sept. 30, 2016 |
|
| (dollars in millions, unless otherwise noted) |
| BNY Mellon shareholders’ equity at period end – GAAP | $ | 40,523 |
| $ | 39,974 |
| $ | 38,811 |
| $ | 39,695 |
|
| Less: Preferred stock | 3,542 |
| 3,542 |
| 3,542 |
| 3,542 |
|
| BNY Mellon common shareholders’ equity at period end – GAAP | 36,981 |
| 36,432 |
| 35,269 |
| 36,153 |
|
| Less: Goodwill | 17,543 |
| 17,457 |
| 17,316 |
| 17,449 |
|
| Intangible assets | 3,461 |
| 3,506 |
| 3,598 |
| 3,671 |
|
Add: Deferred tax liability – tax deductible goodwill (a) | 1,561 |
| 1,542 |
| 1,497 |
| 1,477 |
|
Deferred tax liability – intangible assets (a) | 1,092 |
| 1,095 |
| 1,105 |
| 1,116 |
|
| BNY Mellon tangible common shareholders’ equity at period end – Non-GAAP | $ | 18,630 |
| $ | 18,106 |
| $ | 16,957 |
| $ | 17,626 |
|
| | | | | |
Period-end common shares outstanding (in thousands) | 1,024,022 |
| 1,033,156 |
| 1,047,488 |
| 1,057,337 |
|
| | | | | |
| Book value per common share – GAAP | $ | 36.11 |
| $ | 35.26 |
| $ | 33.67 |
| $ | 34.19 |
|
| Tangible book value per common share – Non-GAAP | $ | 18.19 |
| $ | 17.53 |
| $ | 16.19 |
| $ | 16.67 |
|
|
| | | | | | | | | | | | | | | |
| Return on common equity and tangible common equity reconciliation | 2Q20 |
| 1Q20 |
| 2Q19 |
| YTD20 |
| YTD19 |
|
| (dollars in millions) |
| Net income applicable to common shareholders of The Bank of New York Mellon Corporation – GAAP | $ | 901 |
| $ | 944 |
| $ | 969 |
| $ | 1,845 |
| $ | 1,879 |
|
| Add: Amortization of intangible assets | 26 |
| 26 |
| 30 |
| 52 |
| 59 |
|
| Less: Tax impact of amortization of intangible assets | 6 |
| 6 |
| 7 |
| 12 |
| 14 |
|
| Adjusted net income applicable to common shareholders of The Bank of New York Mellon Corporation, excluding amortization of intangible assets – Non-GAAP | $ | 921 |
| $ | 964 |
| $ | 992 |
| $ | 1,885 |
| $ | 1,924 |
|
| | | | | | |
| Average common shareholders’ equity | $ | 38,476 |
| $ | 37,664 |
| $ | 37,487 |
| $ | 38,070 |
| $ | 37,287 |
|
| Less: Average goodwill | 17,243 |
| 17,311 |
| 17,343 |
| 17,277 |
| 17,360 |
|
| Average intangible assets | 3,058 |
| 3,089 |
| 3,178 |
| 3,073 |
| 3,193 |
|
Add: Deferred tax liability – tax deductible goodwill (a) | 1,119 |
| 1,109 |
| 1,094 |
| 1,119 |
| 1,094 |
|
Deferred tax liability – intangible assets (a) | 664 |
| 666 |
| 687 |
| 664 |
| 687 |
|
| Average tangible common shareholders’ equity – Non-GAAP | $ | 19,958 |
| $ | 19,039 |
| $ | 18,747 |
| $ | 19,503 |
| $ | 18,515 |
|
| | | | | | |
Return on common shareholders’ equity – GAAP | 9.4 | % | 10.1 | % | 10.4 | % | 9.7 | % | 10.2 | % |
| Return on tangible common shareholders’ equity – Non-GAAP | 18.5 | % | 20.4 | % | 21.2 | % | 19.4 | % | 20.9 | % |
| |
| (a) | Deferred tax liabilities are based on fully phased-in Basel IIIU.S. capital rules. |
The following table presents income fromthe reconciliation of book value and tangible book value per common share.
|
| | | | | | | | | | | | |
| Book value and tangible book value per common share reconciliation | June 30, 2020 |
| March 31,
2020 |
| Dec. 31, 2019 |
| June 30,
2019 |
|
| (dollars in millions, except per share amounts and unless otherwise noted) |
| BNY Mellon shareholders’ equity at period end – GAAP | $ | 43,697 |
| $ | 41,145 |
| $ | 41,483 |
| $ | 41,533 |
|
| Less: Preferred stock | 4,532 |
| 3,542 |
| 3,542 |
| 3,542 |
|
| BNY Mellon common shareholders’ equity at period end – GAAP | 39,165 |
| 37,603 |
| 37,941 |
| 37,991 |
|
| Less: Goodwill | 17,253 |
| 17,240 |
| 17,386 |
| 17,337 |
|
| Intangible assets | 3,045 |
| 3,070 |
| 3,107 |
| 3,160 |
|
Add: Deferred tax liability – tax deductible goodwill (a) | 1,119 |
| 1,109 |
| 1,098 |
| 1,094 |
|
Deferred tax liability – intangible assets (a) | 664 |
| 666 |
| 670 |
| 687 |
|
| BNY Mellon tangible common shareholders’ equity at period end – Non-GAAP | $ | 20,650 |
| $ | 19,068 |
| $ | 19,216 |
| $ | 19,275 |
|
| | | | | |
Period-end common shares outstanding (in thousands) | 885,862 |
| 885,443 |
| 900,683 |
| 942,662 |
|
| | | | | |
| Book value per common share – GAAP | $ | 44.21 |
| $ | 42.47 |
| $ | 42.12 |
| $ | 40.30 |
|
| Tangible book value per common share – Non-GAAP | $ | 23.31 |
| $ | 21.53 |
| $ | 21.33 |
| $ | 20.45 |
|
| |
| (a) | Deferred tax liabilities are based on fully phased-in U.S. capital rules. |
The following table presents the impact of changes in foreign currency exchange rates on our consolidated investment management funds, net of noncontrolling interests.and performance fees.
|
| | | | | | | | | | | | | | | |
Income from consolidated investment management funds, net of noncontrolling interests | | YTD17 |
| YTD16 |
|
| (in millions) | 3Q17 |
| 2Q17 |
| 3Q16 |
|
| Income from consolidated investment management funds | $ | 10 |
| $ | 10 |
| $ | 17 |
| $ | 53 |
| $ | 21 |
|
| Less: Net income attributable to noncontrolling interests of consolidated investment management funds | 3 |
| 3 |
| 9 |
| 24 |
| 6 |
|
| Income from consolidated investment management funds, net of noncontrolling interests | $ | 7 |
| $ | 7 |
| $ | 8 |
| $ | 29 |
| $ | 15 |
|
|
| | | | | | | | |
| Constant currency reconciliation – Consolidated | 2Q20 |
| 2Q19 |
| 2Q20 vs. |
|
| (dollars in millions) | 2Q19 |
|
| Investment management and performance fees – GAAP | $ | 786 |
| $ | 833 |
| (6 | )% |
| Impact of changes in foreign currency exchange rates | — |
| (9 | ) | |
| Adjusted investment management and performance fees – Non-GAAP | $ | 786 |
| $ | 824 |
| (5 | )% |
The following table presents the revenue line itemsimpact of changes in foreign currency exchange rates on investment management and performance fees reported in the Investment and Wealth Management business impacted by the consolidated investment management funds.business.
|
| | | | | | | | | | | | | | | | | | | | | |
| Income from consolidated investment management funds, net of noncontrolling interests - Investment Management business |
| (in millions) | 3Q17 |
| 2Q17 |
| 1Q17 |
| 4Q16 |
| 3Q16 |
| YTD17 |
| YTD16 |
|
| Investment management fees | $ | 1 |
| $ | 2 |
| $ | 2 |
| $ | 4 |
| $ | 2 |
| $ | 5 |
| $ | 7 |
|
| Other (Investment income (loss)) | 6 |
| 5 |
| 13 |
| (3 | ) | 6 |
| 24 |
| 8 |
|
| Income from consolidated investment management funds, net of noncontrolling interests | $ | 7 |
| $ | 7 |
| $ | 15 |
| $ | 1 |
| $ | 8 |
| $ | 29 |
| $ | 15 |
|
|
| | | | | | | | |
Constant currency reconciliation – Investment and Wealth Management business | | | 2Q20 vs. |
|
| (dollars in millions) | 2Q20 |
| 2Q19 |
| 2Q19 |
|
Investment management and performance fees – GAAP | $ | 787 |
| $ | 833 |
| (6 | )% |
| Impact of changes in foreign currency exchange rates | — |
| (9 | ) | |
| Adjusted investment management and performance fees – Non-GAAP | $ | 787 |
| $ | 824 |
| (4 | )% |
The following table presents the reconciliation of the pre-tax operating margin for the Investment and Wealth Management business.
| | | Pre-tax operating margin - Investment Management business | | |
Pre-tax operating margin reconciliation – Investment and Wealth Management business | | Pre-tax operating margin reconciliation – Investment and Wealth Management business | |
| (dollars in millions) | 3Q17 |
| 2Q17 |
| 1Q17 |
| 4Q16 |
| 3Q16 |
| YTD17 |
| YTD16 |
| 2Q20 |
| 1Q20 |
| 4Q19 |
| 3Q19 |
| 2Q19 |
| YTD20 |
| YTD19 |
|
| Income before income taxes – GAAP | $ | 300 |
| $ | 288 |
| $ | 277 |
| $ | 260 |
| $ | 256 |
| $ | 865 |
| $ | 707 |
| $ | 221 |
| $ | 194 |
| $ | 240 |
| $ | 295 |
| $ | 260 |
| $ | 415 |
| $ | 526 |
|
| Add: Amortization of intangible assets | 15 |
| 15 |
| 15 |
| 22 |
| 22 |
| 45 |
| 60 |
| |
| Provision for credit losses | (2 | ) | — |
| 3 |
| 6 |
| — |
| 1 |
| — |
| |
| Adjusted income before income taxes, excluding amortization of intangible assets and provision for credit losses – Non-GAAP | $ | 313 |
| $ | 303 |
| $ | 295 |
| $ | 288 |
| $ | 278 |
| $ | 911 |
| $ | 767 |
| |
| | | |
| Total revenue – GAAP | $ | 1,000 |
| $ | 986 |
| $ | 963 |
| $ | 960 |
| $ | 958 |
| $ | 2,949 |
| $ | 2,791 |
| $ | 886 |
| $ | 898 |
| $ | 971 |
| $ | 887 |
| $ | 913 |
| $ | 1,784 |
| $ | 1,849 |
|
Less: Distribution and servicing expense | 110 |
| 104 |
| 101 |
| 98 |
| 104 |
| 315 |
| 306 |
| 86 |
| 91 |
| 93 |
| 98 |
| 94 |
| 177 |
| 185 |
|
| Adjusted total revenue, net of distribution and servicing expense – Non-GAAP | $ | 890 |
| $ | 882 |
| $ | 862 |
| $ | 862 |
| $ | 854 |
| $ | 2,634 |
| $ | 2,485 |
| $ | 800 |
| $ | 807 |
| $ | 878 |
| $ | 789 |
| $ | 819 |
| $ | 1,607 |
| $ | 1,664 |
|
| | | |
Pre-tax operating margin – GAAP (a) | 30 | % | 29 | % | 29 | % | 27 | % | 27 | % | 29 | % | 25 | % | 25 | % | 22 | % | 25 | % | 33 | % | 29 | % | 23 | % | 28 | % |
Adjusted pre-tax operating margin, excluding amortization of intangible assets, provision for credit losses and distribution and servicing expense – Non-GAAP (a) | 35 | % | 34 | % | 34 | % | 33 | % | 33 | % | 35 | % | 31 | % | |
Adjusted pre-tax operating margin, net of distribution and servicing expense – Non-GAAP (a) | | 28 | % | 24 | % | 27 | % | 37 | % | 32 | % | 26 | % | 32 | % |
| |
| (a) | Income before taxes divided by total revenue. |
Recent accounting and regulatory developments
Recently issuedRecent accounting standardsdevelopments
The following Accounting Standards Updates (“ASUs”)ASU issued by the Financial Accounting Standards Board (“FASB”) haveFASB had not yet been adopted.adopted as of June 30, 2020.
ASU 2017-12, Derivatives and Hedging: Targeted Improvements to Accounting for Hedging Activities2020-04, Reference Rate Reform: Facilitation of the Effects of Reference Rate Reform on Financial Reporting
In August 2017,March 2020, the FASB issued an ASUDerivatives, Reference Rate Reform: Facilitation of the Effects of Reference Rate Reform on Financial Reporting. This ASU provides temporary optional expedients and Hedging: Targeted Improvementsexceptions for applying U.S. GAAP to Accounting for Hedging Activities. The objective of this ASU is to improve the financial reporting ofcontracts, hedging relationships to better portray the economic results of an entity’s risk management activities and to simplify the application of hedge accounting guidance.
The most significant impact of the new guidance to the Company relates to the new accounting alternatives for fair value hedges of interestother transactions affected by reference rate risk, specifically, the ability to hedge only the benchmark component of the contractual cash flows, partial-term hedging and the introduction of the “last of layer” method for hedges of portfolios of prepayable financial assets. The guidance also changed presentation and disclosure requirements and made changes to how the shortcut method is applied which may result in the Company using that method going forward for certain hedging relationships.
reform. This ASU is effective for the first quarter of 2019, with early adoption permitted. Certain transition elections are available including the ability to reclassify a debt security from held-to-maturity to available-for-sale if it is eligible to be hedged under the last of layer method with any unrealized gain or loss at the transfer date being recorded in other comprehensive income. If this ASU is adopted early, the new guidance will be applicable as of the beginning of that year. BNY Mellon is currently assessing the impacts of the new standard.
ASU 2017-07, Compensation-Retirement Benefits - Improving the Presentation of Net Periodic Pension Cost and Net Periodic Postretirement Benefit Cost
In March 2017, the FASB issued an ASU, Compensation-Retirement Benefits - Improving the
Presentation of Net Periodic Pension Cost and Net Periodic Postretirement Benefit Cost. The ASU requires the disaggregation of the service cost component from the other components of the net benefit cost in the income statement. The ASU also permits only the service cost component of net benefit costan entity to be eligible for capitalization. The ASU is effective for the first quarter of 2018, with early adoption permitted.make a one-time election to sell and/or transfer held-to-maturity securities that are affected by reference rate reform and were classified as held-to-maturity on or before Jan. 1, 2020. The guidance in this ASU shouldcan be applied retrospectively for the presentationadopted as of the service cost component and the other components in the income statement, and prospectively for the capitalization of the service cost component in assets. BNY Mellon is assessing the impacts of the new standard. For information on the components of our pension and post-retirement health plan costs, see Note 9 of the Notes to Consolidated Financial Statements in this Form 10-Q and Note 16 of the Notes to Consolidated Financial Statements in our 2016 Annual Report. To the extent that our recent trend of having a net credit for pension and other post-retirement costs continues, the standard will result in an increase to staff expense and a reduction in other expense.
ASU 2016-18, Statement of Cash Flows – Restricted Cash
In November 2016, the FASB issued an ASU, Statement of Cash Flows – Restricted Cash. This ASU provides guidance on the presentation of restricted cash or restricted cash equivalents in the statement of cash flows and is effective for the first quarter of 2018. Earlier application is permitted. BNY Mellon isMarch 12, 2020 through Dec. 31, 2022. We are assessing the impacts of the new standard, and expects to include restricted cash (which totaled $4 billion as of Sept. 30, 2017) with cash and due from banks when reconciling the beginning-of-period and end-of-period total amounts shown on the statement of cash flows.
ASU 2016-15, Statement of Cash Flows – Classification of Certain Cash Receipts and Cash Payments
In August 2016, the FASB issued an ASU, Statement of Cash Flows – Classification of Certain Cash Receipts and Cash Payments. This ASU provides guidance on eight specific cash flow presentation issues and is effective for the first quarter of 2018. Earlier application is permitted, however all of the amendments must be adopted in the same period. BNY Mellon is assessing the impacts of the new
standard, and doesbut would not expect this ASU to materially affect the results of operations or financial condition.
ASU 2016-13, Financial Instruments – Credit Losses
In June 2016, the FASB issued an ASU, Financial Instruments – Credit Losses. This ASU introduces a new current expected credit losses model, which will apply to financial assets subject to credit losses and measured at amortized cost, including held-to-maturity securities and certain off-balance sheet credit exposures. The guidance will also change current practice for the impairment model for available-for-sale debt securities. The available-for-sale debt securities model will require the use of an allowance to record estimated credit losses and subsequent recoveries. This ASU is effective for the first quarter of 2020. Earlier application is permitted beginning with the first quarter of 2019. BNY Mellon has begun its implementation efforts and is currently identifying key interpretive issues, and will assess existing credit loss forecasting models and processes against the new guidance to determine what modifications may be required. The extent of the impact to our financial statements upon adoption depends on several factors including the remaining expected life of financial instruments at the time of adoption, the establishment of an allowance for expected credit loss on held-to-maturity securities, and the macroeconomic conditions and forecasts that exist at that date.
ASU 2014-09, Revenue from Contracts with Customers
In May 2014, the FASB issued ASU 2014-09, Revenue from Contracts with Customers. This ASU, as amended, provides guidance on the recognition of revenue related to the transfer of promised goods or services to customers, guidance on accounting for certain contract costs and additional disclosure requirements about revenue and contract costs. The standard supersedes most existing revenue recognition guidance and is effective for the first quarter of 2018 using either the retrospective or cumulative effect transition method upon adoption.
The Company has completed its evaluation of the potential impact of this guidance on our accounting policies, and based on that evaluation, the timing of most of our revenue recognition will remain the same and the impacts will not be material. The impacts primarily relate to deferring and amortizing certain
sales commission costs related to obtaining customer contracts and the timing of recognizing the contra revenue related to certain payments made to customers. The Company plans to adopt the guidance as of Jan. 1, 2018 using the cumulative effect transition method. The Company is currently developing the disclosures required about revenue and contract costs and finalizing changes to internal control.
ASU 2016-02, Leases
In February 2016, the FASB issued ASU 2016-02, Leases. The primary objective of this ASU is to increase transparency and comparability by recognizing lease assets and liabilities on the balance sheet and expand related disclosures. ASU 2016-02 requires a “right-of-use” asset and a payment obligation liability on the balance sheet for most leases and subleases. Additionally, depending on the lease classification under the standard, it may result in different expense recognition patterns and classification than under existing accounting principles. For leases classified as finance leases, it will result in higher expense recognition in the earlier periods and lower expense in the later periods of the lease.
The standard is effective for the first quarter of 2019, with early adoption permitted. We will utilize the modified retrospective transition approach as of the beginning of the earliest period presented, which will result in a cumulative effect recorded in the earliest period presented. Additionally, the standard allows for various optional practical expedients to assist with the implementation and reporting requirements. We are currently evaluating the potential impact of the leasing standard on our consolidated financial statements and evaluating the practical expedients that may be elected. Upon adoption, the implementation of the leasing standard is expected to result in an immaterial increase in both assets and liabilities.
ASU 2016-01, Recognition and Measurement of Financial Assets and Financial Liabilities
In January 2016, the FASB issued ASU 2016-01, Recognition and Measurement of Financial Assets and Financial Liabilities. The ASU requires investments in equity securities that do not result in consolidation and are not accounted for under the equity method to be measured at fair value with
changes in the fair value recognized through net income, unless one of two available exceptions apply. The first exception, a scope exception, allows Federal Reserve Bank stock, FHLB stock and other exchange memberships held by broker dealers to remain accounted for at cost, less impairment. The second exception, a practicability exception, will be available for equity investments that do not have readily determinable fair values and do not qualify for the practical expedient to estimate fair value under ASC 820, Fair Value Measurement. To the extent the practicability exception applies, such investments will be accounted for at cost adjusted for impairment, if any, plus or minus changes from observable price changes.
The amendments also require an entity to present separately in other comprehensive income the portion of the total change in the fair value of a liability resulting from the entity’s “own credit risk” when the entity has elected to measure the liability at fair value. The amendments also eliminate the requirement to disclose the methods and significant assumptions used to estimate the fair values of financial instruments measured at amortized cost that are on the balance sheet.
The Company plans to adopt this guidance in the first quarter of 2018 using the cumulative effect method of adoption. BNY Mellon does not expect the adoption of this ASU to have a material impact to the financial statements.on BNY Mellon.
Recent regulatory developments
For a summary of additional regulatory matters relevant to our operations, see Supervision and Regulation“Recent regulatory developments” in our 2016Form 10-Q for the quarter ended March 31, 2020 and “Supervision and Regulation” in our 2019 Annual Report. The following discussions summarize certain regulatory, legislative and other developments that may affect BNY Mellon, the impact of many of which we are still evaluating.
Final Rule on Qualified Financial ContractsCCAR 2020 results
On Sept. 1, 2017,June 25, 2020, the Federal Reserve adopted a final rule to require U.S. global systemically important banking organizations (“G-SIBs”)released the results of its stress tests for 2020 and additional sensitivity analyses that the U.S. operationsFederal Reserve conducted in light of foreign G-SIBs to amend their covered qualified financial contracts (“QFCs”).the coronavirus pandemic. The FDIC adopted a substantially equivalent proposalFederal Reserve also notified BNY Mellon that its SCB requirement will be 2.5%, which equals the regulatory floor. The SCB will be effective on Oct. 30, 20171, 2020. For additional information regarding the SCB, see “Recent regulatory developments - Changes to CCAR and the Office of the Comptroller of the Currency is expected to do soStress Capital Buffer” in the near future. QFCs generally include derivatives, repurchase agreements and securities lending arrangements, among others. The final rule includes two key requirements.our First the final rule generally requiresQuarter
2020 Form 10-Q and “Supervision and Regulation - Capital Planning and Stress Testing” in our 2019 Annual Report.
In light of the changes in the financial markets and the economy, the Federal Reserve announced that QFCsall banking institutions subject to CCAR, including BNY Mellon, will be required to resubmit their capital plans. In connection with the capital plan resubmission, the Federal Reserve may recalculate CCAR firms’ SCBs (including BNY Mellon’s). For the third quarter of G-SIBs explicitly provide2020, all CCAR firms, including BNY Mellon, will only be permitted to repurchase stock in connection with employee benefit plans, pay common stock dividends that any resolution stays applicabledo not exceed an amount equal to the exerciseaverage of default rightsthe firm’s net income for the four preceding calendar quarters provided that the amount of the common stock dividend is not increased, and pay scheduled dividends on additional Tier 1 and Tier 2 capital instruments. The Federal Reserve has stated that it may extend these limitations quarter-by-quarter. Consistent with these limitations, for the third quarter, BNY Mellon plans to maintain its quarterly common stock dividend of $0.31 per share and to suspend its open market common stock repurchases.
Volcker Covered Funds Regulations Revision
On June 25, 2020, the Federal Reserve, OCC, FDIC, Securities and Exchange Commission (“SEC”) and Commodity Futures Trading Commission (“CFTC”) finalized a second major set of amendments to the implementing regulations for the provisions of the Dodd-Frank Act commonly referred to as the “Volcker Rule”. This set of amendments, which follows revisions to the proprietary trading provisions of the Volcker Rule in 2019, contains a number of targeted amendments to the Volcker Rule regulations, principally focused on the restrictions on banking entities’ investments in, sponsorship of, and other relationships with covered funds. BNY Mellon’s preliminary assessment is that the changes are favorable and reduce certain compliance burdens; however, the general prohibitions and requirements with respect to such QFCsinvestment in, sponsoring of and to any resolution transfers under U.S. special resolution regimes apply to suchtransactions with covered QFCs. Second, the final rule requires that QFCs of G-SIBs be amended to neither permit the exercise of default or cross-default rights against entities covered by the final rule based on the resolution or bankruptcy of an affiliate of such entities, nor allow for any transfer restrictions with respect to such QFCs.funds would remain in place.
The final rule allows G-SIBsprovision that may have the most targeted benefits to complyBNY Mellon concerns transactions with covered funds which we sponsor or advise. The amendments exempt certain transactions from the
currently applicable prohibitions, including intraday credit extensions and certain payment, clearing and settlement transactions, subject to certain conditions. Additionally, the rule by adheringamendments narrow the definition of “ownership interest,” which may reduce the compliance burden on BNY Mellon investments. The amendments will become effective on Oct. 1, 2020.
CRR “Quick Fix”
On June 27, 2020, a so-called “quick fix” to the International Swaps and Derivatives Association 2015 Universal Resolution Stay Protocol (the “Protocol”Capital Requirements Regulation (“CRR Quick Fix”) orbecame applicable. Among other things, the CRR Quick Fix enables EU credit institutions, such as The Bank of New York Mellon SA/NV, to exclude central bank deposits from leverage ratio calculations under certain conditions, including a similar protocol that accomplishesdeclaration of “exceptional circumstances” from the contractual amendments required bycredit institution’s competent authority. The leverage ratio will become a binding requirement in the rule. BNY Mellon entities that engage in QFC activities covered by the Protocol have adhered to the Protocol. Compliance with the Federal Reserve’s final rule will be required on a phased-in basis beginning on Jan. 1, 2019. BNY Mellon is evaluating the impactEU, as part of the new regulationsCapital Requirements Regulation 2, on June 28, 2021. The extent to which the UK implements the leverage ratio exclusion of the CRR Quick Fix depends on its activities.policy stance after the end of the transition period under the EU withdrawal agreement.
Resolution plan
As required by the Dodd-Frank Act, BNY Mellon must submit annually to the Federal Reserve and the FDIC a plan for its rapid and orderly resolution in the event of material financial distress or failure. BNY Mellon filed its most recent resolution plan on July 1, 2017. We believe the 2017 resolution plan addresses all shortcomings and deficiencies identified by the FDIC and the Federal Reserve in the Company’s 2015 resolution plan. The public portion of our 2017 resolution plan is available on the Federal Reserve’s and FDIC’s websites.
In September 2017, the Federal Reserve and FDIC extended the filing deadline by one year to July 1, 2019 for the Parent’s next resolution plan.
Website information
Our website is www.bnymellon.com. We currently make available the following information under the Investor Relations portion of our website. With respect to filings with the SEC, filings, we post such information as soon as reasonably practicable after we electronically file such materials with, or furnish them to, the SEC.
All of our SEC filings, including annual reports on Form 10-K, quarterly reports on Form 10-Q, current reports on Form 8-K and all amendments to these reports, as well as proxy statements and SEC Forms 3, 4 and 5 and any proxy statement mailed by us in connection with the solicitation of proxies;5;
Financial statements and footnotes prepared using eXtensible Business Reporting Language (“XBRL”);
Our earnings materials and selected management conference calls and presentations;
Other regulatory disclosures, including: Pillar 3 Disclosures (and Market Risk Disclosure contained therein); Liquidity Coverage Ratio Disclosures; Federal Financial Institutions Examination Council - Consolidated Reports of Condition and Income for a Bank With Domestic and Foreign Offices; Consolidated Financial Statements for Bank Holding Companies; and the Dodd-Frank Act Stress Test Results for BNY Mellon and The Bank of New York Mellon; and
Our Corporate Governance Guidelines, Amended and Restated By-laws, DirectorsDirectors’ Code of Conduct and the Charters of the Audit, Finance, Corporate Governance, and Nominating Corporateand Social Responsibility, Human Resources and Compensation, Risk and Technology Committees of our Board of Directors.
We may use our website, our Twitter account (@BNYMellon) and other social media channels as additional means of disclosing information to the public. The information disclosed through those channels may be considered to be material. The contents of theour website listed above or any other websitessocial media channels referenced herein are not incorporated by reference into this Quarterly Report on Form 10-Q.
|
|
| Item 1. Financial Statements |
| |
| The Bank of New York Mellon Corporation (and its subsidiaries) |
| |
Consolidated Income Statement (unaudited)
|
| | | | | | | | | | | | | | | | |
| | Quarter ended | | Year-to-date |
| (in millions) | June 30, 2020 |
| March 31, 2020 |
| June 30, 2019 |
| | June 30, 2020 |
| June 30, 2019 |
|
| Fee and other revenue | | | | | | |
| Investment services fees: | | | | | | |
| Asset servicing fees | $ | 1,173 |
| $ | 1,159 |
| $ | 1,141 |
| | $ | 2,332 |
| $ | 2,263 |
|
| Clearing services fees | 431 |
| 470 |
| 410 |
| | 901 |
| 808 |
|
| Issuer services fees | 277 |
| 263 |
| 291 |
| | 540 |
| 542 |
|
| Treasury services fees | 144 |
| 149 |
| 140 |
| | 293 |
| 272 |
|
| Total investment services fees | 2,025 |
| 2,041 |
| 1,982 |
| | 4,066 |
| 3,885 |
|
| Investment management and performance fees | 786 |
| 862 |
| 833 |
| | 1,648 |
| 1,674 |
|
| Foreign exchange and other trading revenue | 166 |
| 319 |
| 166 |
| | 485 |
| 336 |
|
| Financing-related fees | 58 |
| 59 |
| 50 |
| | 117 |
| 101 |
|
| Distribution and servicing | 27 |
| 31 |
| 31 |
| | 58 |
| 62 |
|
| Investment and other income | 105 |
| 11 |
| 43 |
| | 116 |
| 78 |
|
| Total fee revenue | 3,167 |
| 3,323 |
| 3,105 |
| | 6,490 |
| 6,136 |
|
| Net securities gains | 9 |
| 9 |
| 7 |
| | 18 |
| 8 |
|
| Total fee and other revenue | 3,176 |
| 3,332 |
| 3,112 |
| | 6,508 |
| 6,144 |
|
| Operations of consolidated investment management funds | | | | | | |
| Investment income (loss) | 54 |
| (38 | ) | 10 |
| | 16 |
| 36 |
|
| Interest of investment management fund note holders | — |
| — |
| — |
| | — |
| — |
|
| Income (loss) from consolidated investment management funds | 54 |
| (38 | ) | 10 |
| | 16 |
| 36 |
|
| Net interest revenue | | | | | | |
| Interest revenue | 943 |
| 1,570 |
| 1,965 |
| | 2,513 |
| 3,885 |
|
| Interest expense | 163 |
| 756 |
| 1,163 |
| | 919 |
| 2,242 |
|
| Net interest revenue | 780 |
| 814 |
| 802 |
| | 1,594 |
| 1,643 |
|
| Total revenue | 4,010 |
| 4,108 |
| 3,924 |
| | 8,118 |
| 7,823 |
|
| Provision for credit losses | 143 |
| 169 |
| (8 | ) | | 312 |
| (1 | ) |
| Noninterest expense | | | | | | |
| Staff | 1,464 |
| 1,482 |
| 1,421 |
| | 2,946 |
| 2,945 |
|
| Software and equipment | 345 |
| 326 |
| 304 |
| | 671 |
| 587 |
|
| Professional, legal and other purchased services | 337 |
| 330 |
| 337 |
| | 667 |
| 662 |
|
| Net occupancy | 137 |
| 135 |
| 138 |
| | 272 |
| 275 |
|
| Sub-custodian and clearing | 120 |
| 105 |
| 115 |
| | 225 |
| 220 |
|
| Distribution and servicing | 85 |
| 91 |
| 94 |
| | 176 |
| 185 |
|
| Bank assessment charges | 35 |
| 35 |
| 31 |
| | 70 |
| 62 |
|
| Business development | 20 |
| 42 |
| 56 |
| | 62 |
| 101 |
|
| Amortization of intangible assets | 26 |
| 26 |
| 30 |
| | 52 |
| 59 |
|
| Other | 117 |
| 140 |
| 121 |
| | 257 |
| 250 |
|
| Total noninterest expense | 2,686 |
| 2,712 |
| 2,647 |
| | 5,398 |
| 5,346 |
|
| Income | | | | | | |
| Income before income taxes | 1,181 |
| 1,227 |
| 1,285 |
| | 2,408 |
| 2,478 |
|
| Provision for income taxes | 216 |
| 265 |
| 264 |
| | 481 |
| 501 |
|
| Net income | 965 |
| 962 |
| 1,021 |
| | 1,927 |
| 1,977 |
|
| Net (income) loss attributable to noncontrolling interests related to consolidated investment management funds | (15 | ) | 18 |
| (4 | ) | | 3 |
| (14 | ) |
| Net income applicable to shareholders of The Bank of New York Mellon Corporation | 950 |
| 980 |
| 1,017 |
| | 1,930 |
| 1,963 |
|
| Preferred stock dividends | (49 | ) | (36 | ) | (48 | ) | | (85 | ) | (84 | ) |
| Net income applicable to common shareholders of The Bank of New York Mellon Corporation | $ | 901 |
| $ | 944 |
| $ | 969 |
| | $ | 1,845 |
| $ | 1,879 |
|
|
| | | | | | | | | | | | | | | | |
| | Quarter ended | | Year-to-date |
| | Sept. 30, 2017 |
| June 30, 2017 |
| Sept. 30, 2016 |
| | Sept. 30, 2017 |
| Sept. 30, 2016 |
|
| (in millions) | |
| Fee and other revenue | | | | | | |
| Investment services fees: | | | | | | |
| Asset servicing | $ | 1,105 |
| $ | 1,085 |
| $ | 1,067 |
| | $ | 3,253 |
| $ | 3,176 |
|
| Clearing services | 383 |
| 394 |
| 349 |
| | 1,153 |
| 1,049 |
|
| Issuer services | 288 |
| 241 |
| 337 |
| | 780 |
| 815 |
|
| Treasury services | 141 |
| 140 |
| 137 |
| | 420 |
| 407 |
|
| Total investment services fees | 1,917 |
| 1,860 |
| 1,890 |
| | 5,606 |
| 5,447 |
|
| Investment management and performance fees | 901 |
| 879 |
| 860 |
| | 2,622 |
| 2,502 |
|
| Foreign exchange and other trading revenue | 173 |
| 165 |
| 183 |
| | 502 |
| 540 |
|
| Financing-related fees | 54 |
| 53 |
| 58 |
| | 162 |
| 169 |
|
| Distribution and servicing | 40 |
| 41 |
| 43 |
| | 122 |
| 125 |
|
| Investment and other income | 63 |
| 122 |
| 92 |
| | 262 |
| 271 |
|
| Total fee revenue | 3,148 |
| 3,120 |
| 3,126 |
| | 9,276 |
| 9,054 |
|
| Net securities gains — including other-than-temporary impairment | 18 |
| — |
| 27 |
| | 28 |
| 67 |
|
Noncredit-related portion of other-than-temporary impairment (recognized in other comprehensive income) | (1 | ) | — |
| 3 |
| | (1 | ) | 2 |
|
| Net securities gains | 19 |
| — |
| 24 |
| | 29 |
| 65 |
|
| Total fee and other revenue | 3,167 |
| 3,120 |
| 3,150 |
| | 9,305 |
| 9,119 |
|
| Operations of consolidated investment management funds | | | | | | |
| Investment income | 10 |
| 10 |
| 20 |
| | 57 |
| 27 |
|
| Interest of investment management fund note holders | — |
| — |
| 3 |
| | 4 |
| 6 |
|
| Income from consolidated investment management funds | 10 |
| 10 |
| 17 |
| | 53 |
| 21 |
|
| Net interest revenue | | | | | | |
| Interest revenue | 1,151 |
| 1,052 |
| 874 |
| | 3,163 |
| 2,647 |
|
| Interest expense | 312 |
| 226 |
| 100 |
| | 706 |
| 340 |
|
| Net interest revenue | 839 |
| 826 |
| 774 |
| | 2,457 |
| 2,307 |
|
| Total revenue | 4,016 |
| 3,956 |
| 3,941 |
| | 11,815 |
| 11,447 |
|
| Provision for credit losses | (6 | ) | (7 | ) | (19 | ) | | (18 | ) | (18 | ) |
| Noninterest expense | | | | | | |
| Staff | 1,469 |
| 1,417 |
| 1,467 |
| | 4,358 |
| 4,338 |
|
| Professional, legal and other purchased services | 305 |
| 319 |
| 292 |
| | 936 |
| 860 |
|
| Software | 175 |
| 173 |
| 156 |
| | 514 |
| 470 |
|
| Net occupancy | 141 |
| 139 |
| 143 |
| | 416 |
| 437 |
|
| Distribution and servicing | 109 |
| 104 |
| 105 |
| | 313 |
| 307 |
|
| Sub-custodian | 62 |
| 65 |
| 59 |
| | 191 |
| 188 |
|
| Furniture and equipment | 58 |
| 59 |
| 59 |
| | 174 |
| 187 |
|
Bank assessment charges (a) | 51 |
| 59 |
| 61 |
| | 167 |
| 166 |
|
| Business development | 49 |
| 63 |
| 52 |
| | 163 |
| 174 |
|
Other (a) | 177 |
| 192 |
| 170 |
| | 536 |
| 546 |
|
| Amortization of intangible assets | 52 |
| 53 |
| 61 |
| | 157 |
| 177 |
|
| Merger and integration, litigation and restructuring charges | 6 |
| 12 |
| 18 |
| | 26 |
| 42 |
|
| Total noninterest expense | 2,654 |
| 2,655 |
| 2,643 |
| | 7,951 |
| 7,892 |
|
| Income | | | | | | |
| Income before income taxes | 1,368 |
| 1,308 |
| 1,317 |
| | 3,882 |
| 3,573 |
|
| Provision for income taxes | 348 |
| 332 |
| 324 |
| | 949 |
| 897 |
|
| Net income | 1,020 |
| 976 |
| 993 |
| | 2,933 |
| 2,676 |
|
| Net (income) loss attributable to noncontrolling interests (includes $(3), $(3), $(9), $(24) and $(6) related to consolidated investment management funds, respectively) | (2 | ) | (1 | ) | (6 | ) | | (18 | ) | 1 |
|
| Net income applicable to shareholders of The Bank of New York Mellon Corporation | 1,018 |
| 975 |
| 987 |
| | 2,915 |
| 2,677 |
|
| Preferred stock dividends | (35 | ) | (49 | ) | (13 | ) | | (126 | ) | (74 | ) |
| Net income applicable to common shareholders of The Bank of New York Mellon Corporation | $ | 983 |
| $ | 926 |
| $ | 974 |
| | $ | 2,789 |
| $ | 2,603 |
|
| |
(a) | In the first quarter of 2017, we began disclosing bank assessment charges on a quarterly basis. The bank assessment charges were previously included in other expense. All prior periods were reclassified. |
|
|
| The Bank of New York Mellon Corporation (and its subsidiaries) |
Consolidated Income Statement (unaudited)(continued)
| | | Net income applicable to common shareholders of The Bank of New York Mellon Corporation used for the earnings per share calculation | Quarter ended | | Year-to-date | Quarter ended | | Year-to-date |
| Sept. 30, 2017 |
| June 30, 2017 |
| Sept. 30, 2016 |
| | Sept. 30, 2017 |
| Sept. 30, 2016 |
| |
| (in millions) | | June 30, 2020 |
| March 31, 2020 |
| June 30, 2019 |
| | June 30, 2020 |
| June 30, 2019 |
|
| Net income applicable to common shareholders of The Bank of New York Mellon Corporation | $ | 983 |
| $ | 926 |
| $ | 974 |
| | $ | 2,789 |
| $ | 2,603 |
| $ | 901 |
| $ | 944 |
| $ | 969 |
| | $ | 1,845 |
| $ | 1,879 |
|
Less: Earnings allocated to participating securities (a) | 8 |
| 13 |
| 15 |
| | 35 |
| 39 |
| |
| Less: Earnings allocated to participating securities | | 1 |
| 3 |
| 4 |
| | 4 |
| 9 |
|
| Net income applicable to common shareholders of The Bank of New York Mellon Corporation after required adjustment for the calculation of basic and diluted earnings per common share | $ | 975 |
| $ | 913 |
| $ | 959 |
|
| $ | 2,754 |
| $ | 2,564 |
| $ | 900 |
| $ | 941 |
| $ | 965 |
|
| $ | 1,841 |
| $ | 1,870 |
|
|
| | | | | | | | | | | |
Average common shares and equivalents outstanding of The Bank of New York Mellon Corporation (a) | Quarter ended | | Year-to-date |
| Sept. 30, 2017 |
| June 30, 2017 |
| Sept. 30, 2016 |
| | Sept. 30, 2017 |
| Sept. 30, 2016 |
|
| (in thousands) | |
| Basic | 1,035,337 |
| 1,035,829 |
| 1,062,248 |
| | 1,037,431 |
| 1,071,457 |
|
| Common stock equivalents | 9,226 |
| 15,598 |
| 15,406 |
| | 14,216 |
| 15,306 |
|
| Less: Participating securities | (3,425 | ) | (9,548 | ) | (9,972 | ) | | (8,062 | ) | (9,613 | ) |
| Diluted | 1,041,138 |
| 1,041,879 |
| 1,067,682 |
| | 1,043,585 |
| 1,077,150 |
|
| | | | | | | |
Anti-dilutive securities (b) | 8,059 |
| 16,256 |
| 32,232 |
| | 13,906 |
| 32,699 |
|
|
| | | | | | | | | | | | | | | | |
Earnings per share applicable to common shareholders of The Bank of New York Mellon Corporation (c) | Quarter ended | | Year-to-date |
| Sept. 30, 2017 |
| June 30, 2017 |
| Sept. 30, 2016 |
| | Sept. 30, 2017 |
| Sept. 30, 2016 |
|
| (in dollars) | |
| Basic | $ | 0.94 |
| $ | 0.88 |
| $ | 0.90 |
| | $ | 2.66 |
| $ | 2.39 |
|
| Diluted | $ | 0.94 |
| $ | 0.88 |
| $ | 0.90 |
| | $ | 2.64 |
| $ | 2.38 |
|
|
| | | | | | | | | | | |
| Average common shares and equivalents outstanding of The Bank of New York Mellon Corporation | Quarter ended | | Year-to-date |
| (in thousands) | June 30, 2020 |
| March 31, 2020 |
| June 30, 2019 |
| | June 30, 2020 |
| June 30, 2019 |
|
| Basic | 889,020 |
| 894,122 |
| 951,281 |
| | 891,642 |
| 956,887 |
|
| Common stock equivalents | 2,044 |
| 3,941 |
| 3,891 |
| | 2,866 |
| 4,894 |
|
| Less: Participating securities | (503 | ) | (1,374 | ) | (1,244 | ) | | (905 | ) | (1,824 | ) |
| Diluted | 890,561 |
| 896,689 |
| 953,928 |
| | 893,603 |
| 959,957 |
|
| | | | | | | |
Anti-dilutive securities (a) | 1,578 |
| 2,584 |
| 3,999 |
| | 2,052 |
| 4,704 |
|
| |
| (a) | Beginning in the third quarter of 2017, vested stock awards to retirement eligible employees are included in common shares outstanding for earnings per share purposes. This change increased both average basic and average diluted shares outstanding by approximately 6 million and reduced earnings allocated to participating securities by $6 million for the quarter, which resulted in a de minimis impact to both basic and diluted earnings per share. |
| |
(b) | Represents stock options, restricted stock, restricted stock units and participating securities outstanding but not included in the computation of diluted average common shares because their effect would be anti-dilutive. |
| |
(c) | Basic and diluted earnings per share under the two-class method are determined on the net income applicable to common shareholders of The Bank of New York Mellon Corporation reported on the income statement less earnings allocated to participating securities. |
|
| | | | | | | | | | | | | | | | |
| Earnings per share applicable to common shareholders of The Bank of New York Mellon Corporation | Quarter ended | | Year-to-date |
| (in dollars) | June 30, 2020 |
| March 31, 2020 |
| June 30, 2019 |
| | June 30, 2020 |
| June 30, 2019 |
|
| Basic | $ | 1.01 |
| $ | 1.05 |
| $ | 1.01 |
| | $ | 2.06 |
| $ | 1.95 |
|
| Diluted | $ | 1.01 |
| $ | 1.05 |
| $ | 1.01 |
| | $ | 2.06 |
| $ | 1.95 |
|
See accompanying unaudited Notes to Consolidated Financial Statements.
|
|
| The Bank of New York Mellon Corporation (and its subsidiaries) |
Consolidated Comprehensive Income Statement (unaudited)
|
| | | | | | | | | | | | | | | | |
| | Quarter ended | | Year-to-date |
| (in millions) | June 30, 2020 |
| March 31, 2020 |
| June 30, 2019 |
| | June 30, 2020 |
| June 30, 2019 |
|
| Net income | $ | 965 |
| $ | 962 |
| $ | 1,021 |
| | $ | 1,927 |
| $ | 1,977 |
|
| Other comprehensive income (loss), net of tax: | | | | | | |
| Foreign currency translation adjustments | 115 |
| (369 | ) | 10 |
| | (254 | ) | 39 |
|
| Unrealized gain on assets available-for-sale: | | | | | | |
| Unrealized gain arising during the period | 753 |
| 183 |
| 287 |
| | 936 |
| 526 |
|
| Reclassification adjustment | (7 | ) | (7 | ) | (5 | ) | | (14 | ) | (6 | ) |
| Total unrealized gain on assets available-for-sale | 746 |
| 176 |
| 282 |
| | 922 |
| 520 |
|
| Defined benefit plans: | | | | | | |
| Net (loss) arising during the period | — |
| — |
| — |
| | — |
| (9 | ) |
| Amortization of prior service credit, net loss and initial obligation included in net periodic benefit cost | 19 |
| 18 |
| 10 |
| | 37 |
| 20 |
|
| Total defined benefit plans | 19 |
| 18 |
| 10 |
| | 37 |
| 11 |
|
| Net unrealized gain (loss) on cash flow hedges | 4 |
| (11 | ) | — |
| | (7 | ) | 5 |
|
Total other comprehensive income (loss), net of tax (a) | 884 |
| (186 | ) | 302 |
| | 698 |
| 575 |
|
| Total comprehensive income | 1,849 |
| 776 |
| 1,323 |
| | 2,625 |
| 2,552 |
|
| Net (income) loss attributable to noncontrolling interests | (15 | ) | 18 |
| (4 | ) | | 3 |
| (14 | ) |
| Other comprehensive loss (income) attributable to noncontrolling interests | — |
| 2 |
| — |
| | 2 |
| (2 | ) |
| Comprehensive income applicable to shareholders of The Bank of New York Mellon Corporation | $ | 1,834 |
| $ | 796 |
| $ | 1,319 |
| | $ | 2,630 |
| $ | 2,536 |
|
|
| | | | | | | | | | | | | | | | |
| | Quarter ended | | Year-to-date |
| | Sept. 30, 2017 |
| June 30, 2017 |
| Sept. 30, 2016 |
| | Sept. 30, 2017 |
| Sept. 30, 2016 |
|
| (in millions) | |
| Net income | $ | 1,020 |
| $ | 976 |
| $ | 993 |
| | $ | 2,933 |
| $ | 2,676 |
|
| Other comprehensive income (loss), net of tax: | | | | | | |
| Foreign currency translation adjustments | 286 |
| 330 |
| (186 | ) | | 741 |
| (433 | ) |
| Unrealized gain on assets available-for-sale: | | | | | | |
| Unrealized gain (loss) arising during the period | 28 |
| 91 |
| (53 | ) | | 213 |
| 227 |
|
| Reclassification adjustment | (12 | ) | (1 | ) | (15 | ) | | (19 | ) | (43 | ) |
| Total unrealized gain (loss) on assets available-for-sale | 16 |
| 90 |
| (68 | ) | | 194 |
| 184 |
|
| Defined benefit plans: | | | | | | |
| Net gain arising during the period | — |
| — |
| — |
| | 2 |
| 2 |
|
| Amortization of prior service credit, net loss and initial obligation included in net periodic benefit cost | 15 |
| 16 |
| 14 |
| | 49 |
| 43 |
|
| Total defined benefit plans | 15 |
| 16 |
| 14 |
| | 51 |
| 45 |
|
| Net unrealized gain (loss) on cash flow hedges | — |
| 1 |
| 2 |
| | 11 |
| (4 | ) |
Total other comprehensive income (loss), net of tax (a) | 317 |
| 437 |
| (238 | ) | | 997 |
| (208 | ) |
| Total comprehensive income | 1,337 |
| 1,413 |
| 755 |
| | 3,930 |
| 2,468 |
|
| Net (income) loss attributable to noncontrolling interests | (2 | ) | (1 | ) | (6 | ) | | (18 | ) | 1 |
|
| Other comprehensive (income) loss attributable to noncontrolling interests | (5 | ) | (6 | ) | 5 |
| | (13 | ) | 23 |
|
| Comprehensive income applicable to shareholders of The Bank of New York Mellon Corporation | $ | 1,330 |
| $ | 1,406 |
| $ | 754 |
| | $ | 3,899 |
| $ | 2,492 |
|
| |
| (a) | Other comprehensive income (loss) attributable to The Bank of New York Mellon Corporation shareholders was $312 million for the quarter ended Sept. 30, 2017, $431$884 million for the quarter ended June 30, 2017, $(233)2020, $(184) million for the quarter ended Sept. 30, 2016, $984March 31, 2020, $302 million for the nine monthsquarter ended Sept.June 30, 2017 and $(185)2019, $700 million for the ninesix months ended Sept.June 30, 2016.2020 and $573 million for the six months ended June 30, 2019. |
See accompanying unaudited Notes to Consolidated Financial Statements.
|
|
| The Bank of New York Mellon Corporation (and its subsidiaries) |
Consolidated Balance Sheet (unaudited)
|
| | | | | | |
| | June 30, 2020 |
| Dec. 31, 2019 |
|
| (dollars in millions, except per share amounts) |
| Assets | | |
Cash and due from banks (including allowance for credit losses of $4 at June 30, 2020) (a) | $ | 4,776 |
| $ | 4,830 |
|
| Interest-bearing deposits with the Federal Reserve and other central banks | 112,728 |
| 95,042 |
|
Interest-bearing deposits with banks (including allowance for credit losses of $1 at June 30, 2020; $2,210 and $2,437 is restricted) (a) | 18,045 |
| 14,811 |
|
Federal funds sold and securities purchased under resale agreements (including allowance for credit losses of $- at June 30, 2020) (a) | 36,638 |
| 30,182 |
|
| Securities: | | |
Held-to-maturity (including allowance for credit losses of less than $1 at June 30, 2020; fair value of $45,983 and $34,805) (a) | 44,615 |
| 34,483 |
|
Available-for-sale (including allowance for credit losses of $12 at June 30, 2020; amortized cost of $106,668 and $87,435) (a) | 110,067 |
| 88,550 |
|
| Total securities | 154,682 |
| 123,033 |
|
| Trading assets | 14,150 |
| 13,571 |
|
| Loans | 55,397 |
| 54,953 |
|
Allowance for credit losses (a) | (302 | ) | (122 | ) |
| Net loans | 55,095 |
| 54,831 |
|
| Premises and equipment | 3,598 |
| 3,625 |
|
| Accrued interest receivable | 540 |
| 624 |
|
| Goodwill | 17,253 |
| 17,386 |
|
| Intangible assets | 3,045 |
| 3,107 |
|
Other assets (including allowance for credit losses on accounts receivable of $4 at June 30, 2020, also includes $529 and $419, at fair value) (a) | 21,306 |
| 20,221 |
|
| Subtotal assets of operations | 441,856 |
| 381,263 |
|
| Assets of consolidated investment management funds, at fair value | 460 |
| 245 |
|
| Total assets | $ | 442,316 |
| $ | 381,508 |
|
| Liabilities | | |
| Deposits: | | |
| Noninterest-bearing (principally U.S. offices) | $ | 78,100 |
| $ | 57,630 |
|
| Interest-bearing deposits in U.S. offices | 121,242 |
| 101,542 |
|
| Interest-bearing deposits in non-U.S. offices | 106,128 |
| 100,294 |
|
| Total deposits | 305,470 |
| 259,466 |
|
| Federal funds purchased and securities sold under repurchase agreements | 14,512 |
| 11,401 |
|
| Trading liabilities | 5,595 |
| 4,841 |
|
| Payables to customers and broker-dealers | 25,012 |
| 18,758 |
|
| Commercial paper | 665 |
| 3,959 |
|
| Other borrowed funds | 1,628 |
| 599 |
|
Accrued taxes and other expenses | 5,029 |
| 5,642 |
|
Other liabilities (including allowance for credit losses on lending-related commitments of $152 and $94, also includes $964 and $607, at fair value) (a) | 12,869 |
| 7,612 |
|
| Long-term debt (includes $399 and $387, at fair value) | 27,566 |
| 27,501 |
|
| Subtotal liabilities of operations | 398,346 |
| 339,779 |
|
| Liabilities of consolidated investment management funds, at fair value | 4 |
| 1 |
|
| Total liabilities | 398,350 |
| 339,780 |
|
| Temporary equity | | |
| Redeemable noncontrolling interests | 157 |
| 143 |
|
| Permanent equity | | |
| Preferred stock – par value $0.01 per share; authorized 100,000,000 shares; issued 45,826 and 35,826 shares | 4,532 |
| 3,542 |
|
| Common stock – par value $0.01 per share; authorized 3,500,000,000 shares; issued 1,381,361,699 and 1,374,443,376 shares | 14 |
| 14 |
|
| Additional paid-in capital | 27,702 |
| 27,515 |
|
| Retained earnings | 33,224 |
| 31,894 |
|
| Accumulated other comprehensive loss, net of tax | (1,943 | ) | (2,638 | ) |
| Less: Treasury stock of 495,499,985 and 473,760,338 common shares, at cost | (19,832 | ) | (18,844 | ) |
| Total The Bank of New York Mellon Corporation shareholders’ equity | 43,697 |
| 41,483 |
|
| Nonredeemable noncontrolling interests of consolidated investment management funds | 112 |
| 102 |
|
| Total permanent equity | 43,809 |
| 41,585 |
|
| Total liabilities, temporary equity and permanent equity | $ | 442,316 |
| $ | 381,508 |
|
| |
| (a) | In the first quarter of 2020, we adopted new accounting guidance included in ASU 2016-13, Financial Instruments – Credit Losses: Measurement of Credit Losses on Financial Instruments, on a prospective basis. See Note 2 of the Notes to Consolidated Financial Statements for additional information. |
|
| | | | | | |
| | Sept. 30, 2017 |
| Dec. 31, 2016 |
|
| (dollars in millions, except per share amounts) |
| Assets | | |
| Cash and due from: | | |
| Banks | $ | 5,557 |
| $ | 4,822 |
|
| Interest-bearing deposits with the Federal Reserve and other central banks | 75,808 |
| 58,041 |
|
| Interest-bearing deposits with banks | 15,256 |
| 15,086 |
|
| Federal funds sold and securities purchased under resale agreements | 27,883 |
| 25,801 |
|
| Securities: | |
|
|
| Held-to-maturity (fair value of $39,928 and $40,669) | 39,995 |
| 40,905 |
|
| Available-for-sale | 80,054 |
| 73,822 |
|
| Total securities | 120,049 |
| 114,727 |
|
| Trading assets | 4,666 |
| 5,733 |
|
| Loans | 59,068 |
| 64,458 |
|
| Allowance for loan losses | (161 | ) | (169 | ) |
| Net loans | 58,907 |
| 64,289 |
|
| Premises and equipment | 1,631 |
| 1,303 |
|
| Accrued interest receivable | 547 |
| 568 |
|
| Goodwill | 17,543 |
| 17,316 |
|
| Intangible assets | 3,461 |
| 3,598 |
|
| Other assets (includes $827 and $1,339, at fair value) | 22,287 |
| 20,954 |
|
| Subtotal assets of operations | 353,595 |
| 332,238 |
|
| Assets of consolidated investment management funds, at fair value | 802 |
| 1,231 |
|
| Total assets | $ | 354,397 |
| $ | 333,469 |
|
| Liabilities | |
|
|
| Deposits: | |
|
|
| Noninterest-bearing (principally U.S. offices) | $ | 80,380 |
| $ | 78,342 |
|
| Interest-bearing deposits in U.S. offices | 46,023 |
| 52,049 |
|
| Interest-bearing deposits in non-U.S. offices | 104,593 |
| 91,099 |
|
| Total deposits | 230,996 |
| 221,490 |
|
| Federal funds purchased and securities sold under repurchase agreements | 10,314 |
| 9,989 |
|
| Trading liabilities | 3,253 |
| 4,389 |
|
| Payables to customers and broker-dealers | 21,176 |
| 20,987 |
|
| Commercial paper | 2,501 |
| — |
|
| Other borrowed funds | 3,353 |
| 754 |
|
Accrued taxes and other expenses | 6,070 |
| 5,867 |
|
| Other liabilities (including allowance for lending-related commitments of $104 and $112, also includes $812 and $597, at fair value) | 7,195 |
| 5,635 |
|
| Long-term debt (includes $369 and $363, at fair value) | 28,408 |
| 24,463 |
|
| Subtotal liabilities of operations | 313,266 |
| 293,574 |
|
| Liabilities of consolidated investment management funds, at fair value | 27 |
| 315 |
|
| Total liabilities | 313,293 |
| 293,889 |
|
| Temporary equity | |
|
|
| Redeemable noncontrolling interests | 197 |
| 151 |
|
| Permanent equity | |
|
|
| Preferred stock – par value $0.01 per share; authorized 100,000,000 shares; issued 35,826 and 35,826 shares | 3,542 |
| 3,542 |
|
| Common stock – par value $0.01 per share; authorized 3,500,000,000 shares; issued 1,352,363,932 and 1,333,706,427 shares | 14 |
| 13 |
|
| Additional paid-in capital | 26,588 |
| 25,962 |
|
| Retained earnings | 24,757 |
| 22,621 |
|
| Accumulated other comprehensive loss, net of tax | (2,781 | ) | (3,765 | ) |
| Less: Treasury stock of 328,341,579 and 286,218,126 common shares, at cost | (11,597 | ) | (9,562 | ) |
| Total The Bank of New York Mellon Corporation shareholders’ equity | 40,523 |
| 38,811 |
|
| Nonredeemable noncontrolling interests of consolidated investment management funds | 384 |
| 618 |
|
| Total permanent equity | 40,907 |
| 39,429 |
|
| Total liabilities, temporary equity and permanent equity | $ | 354,397 |
| $ | 333,469 |
|
See accompanying unaudited Notes to Consolidated Financial Statements.
|
|
| The Bank of New York Mellon Corporation (and its subsidiaries) |
Consolidated Statement of Cash Flows (unaudited)
|
| | | | | | |
| | Six months ended June 30, |
| (in millions) | 2020 |
| 2019 |
|
| Operating activities | | |
| Net income | $ | 1,927 |
| $ | 1,977 |
|
| Net loss (income) attributable to noncontrolling interests | 3 |
| (14 | ) |
| Net income applicable to shareholders of The Bank of New York Mellon Corporation | 1,930 |
| 1,963 |
|
| Adjustments to reconcile net income to net cash provided by (used for) operating activities: | | |
Provision for credit losses (a) | 312 |
| (1 | ) |
| Pension plan contributions | (12 | ) | (22 | ) |
| Depreciation and amortization | 744 |
| 635 |
|
| Deferred tax (benefit) | (363 | ) | (110 | ) |
| Net securities (gains) | (18 | ) | (8 | ) |
| Change in trading assets and liabilities | 171 |
| (1,306 | ) |
| Change in accruals and other, net | 2,361 |
| (3,665 | ) |
| Net cash provided by (used for) operating activities | 5,125 |
| (2,514 | ) |
| Investing activities | | |
| Change in interest-bearing deposits with banks | (3,710 | ) | (1,618 | ) |
| Change in interest-bearing deposits with the Federal Reserve and other central banks | (18,117 | ) | (1,714 | ) |
| Purchases of securities held-to-maturity | (14,499 | ) | (3,739 | ) |
| Paydowns of securities held-to-maturity | 3,541 |
| 2,078 |
|
| Maturities of securities held-to-maturity | 1,836 |
| 1,380 |
|
| Purchases of securities available-for-sale | (44,865 | ) | (21,503 | ) |
| Sales of securities available-for-sale | 8,414 |
| 6,346 |
|
| Paydowns of securities available-for-sale | 4,416 |
| 3,226 |
|
| Maturities of securities available-for-sale | 12,241 |
| 14,143 |
|
| Net change in loans | (610 | ) | 4,116 |
|
| Sales of loans and other real estate | 2 |
| 52 |
|
| Change in federal funds sold and securities purchased under resale agreements | (6,516 | ) | (14,401 | ) |
| Net change in seed capital investments | 19 |
| 25 |
|
| Purchases of premises and equipment/capitalized software | (623 | ) | (717 | ) |
| Other, net | (275 | ) | 940 |
|
| Net cash (used for) investing activities | (58,746 | ) | (11,386 | ) |
| Financing activities | | |
| Change in deposits | 47,576 |
| 14,255 |
|
| Change in federal funds purchased and securities sold under repurchase agreements | 3,155 |
| (2,486 | ) |
| Change in payables to customers and broker-dealers | 6,260 |
| (778 | ) |
| Change in other borrowed funds | 1,036 |
| (1,328 | ) |
| Change in commercial paper | (3,294 | ) | 6,955 |
|
| Net proceeds from the issuance of long-term debt | 2,246 |
| 1,248 |
|
| Repayments of long-term debt | (3,000 | ) | (2,750 | ) |
| Proceeds from the exercise of stock options | 33 |
| 35 |
|
| Issuance of common stock | 6 |
| 16 |
|
| Issuance of preferred stock | 990 |
| — |
|
| Treasury stock acquired | (988 | ) | (1,305 | ) |
| Common cash dividends paid | (560 | ) | (540 | ) |
| Preferred cash dividends paid | (85 | ) | (84 | ) |
| Other, net | 15 |
| 7 |
|
| Net cash provided by financing activities | 53,390 |
| 13,245 |
|
| Effect of exchange rate changes on cash | (50 | ) | (11 | ) |
| Change in cash and due from banks and restricted cash | | |
| Change in cash and due from banks and restricted cash | (281 | ) | (666 | ) |
| Cash and due from banks and restricted cash at beginning of period | 7,267 |
| 8,258 |
|
| Cash and due from banks and restricted cash at end of period | $ | 6,986 |
| $ | 7,592 |
|
| Cash and due from banks and restricted cash | | |
| Cash and due from banks at end of period (unrestricted cash) | $ | 4,776 |
| $ | 5,556 |
|
| Restricted cash at end of period | 2,210 |
| 2,036 |
|
| Cash and due from banks and restricted cash at end of period | $ | 6,986 |
| $ | 7,592 |
|
| Supplemental disclosures | | |
| Interest paid | $ | 1,013 |
| $ | 2,238 |
|
| Income taxes paid | 756 |
| 461 |
|
| Income taxes refunded | 11 |
| 347 |
|
| |
| (a) | In the first quarter of 2020, we adopted new accounting guidance included in ASU 2016-13, Financial Instruments – Credit Losses: Measurement of Credit Losses on Financial Instruments, on a prospective basis. See Note 2 of the Notes to Consolidated Financial Statements for additional information. |
|
| | | | | | | |
| | Nine months ended Sept. 30, |
| (in millions) | 2017 |
| | 2016 |
|
| Operating activities | | | |
| Net income | $ | 2,933 |
| | $ | 2,676 |
|
| Net (income) loss attributable to noncontrolling interests | (18 | ) | | 1 |
|
| Net income applicable to shareholders of The Bank of New York Mellon Corporation | 2,915 |
| | 2,677 |
|
| Adjustments to reconcile net income to net cash provided by operating activities: | | | |
| Provision for credit losses | (18 | ) | | (18 | ) |
| Pension plan contributions | (12 | ) | | (17 | ) |
| Depreciation and amortization | 1,044 |
| | 1,118 |
|
| Deferred tax expense (benefit) | 272 |
| | (282 | ) |
| Net securities (gains) | (29 | ) | | (65 | ) |
| Change in trading assets and liabilities | (66 | ) | | 1,680 |
|
| Originations of loans held-for-sale | — |
| | (350 | ) |
| Proceeds from the sales of loans originated for sale | — |
| | 802 |
|
| Change in accruals and other, net | (756 | ) | | (3,988 | ) |
| Net cash provided by operating activities | 3,350 |
| | 1,557 |
|
| Investing activities | | | |
| Change in interest-bearing deposits with banks | 507 |
| | 880 |
|
| Change in interest-bearing deposits with the Federal Reserve and other central banks | (14,467 | ) | | 33,473 |
|
| Purchases of securities held-to-maturity | (5,878 | ) | | (4,169 | ) |
| Paydowns of securities held-to-maturity | 3,332 |
| | 3,577 |
|
| Maturities of securities held-to-maturity | 3,412 |
| | 2,933 |
|
| Purchases of securities available-for-sale | (18,974 | ) | | (21,491 | ) |
| Sales of securities available-for-sale | 3,531 |
| | 5,624 |
|
| Paydowns of securities available-for-sale | 7,047 |
| | 6,552 |
|
| Maturities of securities available-for-sale | 4,820 |
| | 7,610 |
|
| Net change in loans | 5,283 |
| | (2,884 | ) |
| Sales of loans and other real estate | 369 |
| | 172 |
|
| Change in federal funds sold and securities purchased under resale agreements | (2,082 | ) | | (10,456 | ) |
| Net change in seed capital investments | (52 | ) | | (57 | ) |
| Purchases of premises and equipment/capitalized software | (933 | ) | | (495 | ) |
| Proceeds from the sale of premises and equipment | — |
| | 65 |
|
| Acquisitions, net of cash | — |
| | (38 | ) |
| Dispositions, net of cash | — |
| | 1 |
|
| Other, net | 82 |
| | (239 | ) |
| Net cash (used for) provided by investing activities | (14,003 | ) | | 21,058 |
|
| Financing activities | | | |
| Change in deposits | 4,459 |
| | (18,378 | ) |
| Change in federal funds purchased and securities sold under repurchase agreements | 325 |
| | (6,950 | ) |
| Change in payables to customers and broker-dealers | 177 |
| | (743 | ) |
| Change in other borrowed funds | 2,187 |
| | 427 |
|
| Change in commercial paper | 2,501 |
| | — |
|
| Net proceeds from the issuance of long-term debt | 4,739 |
| | 4,982 |
|
| Repayments of long-term debt | (796 | ) | | (2,453 | ) |
| Proceeds from the exercise of stock options | 383 |
| | 129 |
|
| Issuance of common stock | 24 |
| | 20 |
|
| Issuance of preferred stock | — |
| | 990 |
|
| Treasury stock acquired | (2,035 | ) | | (1,550 | ) |
| Common cash dividends paid | (653 | ) | | (576 | ) |
| Preferred cash dividends paid | (126 | ) | | (74 | ) |
| Other, net | 46 |
| | (2 | ) |
| Net cash provided by (used for) financing activities | 11,231 |
| | (24,178 | ) |
| Effect of exchange rate changes on cash | 157 |
| | (17 | ) |
| Change in cash and due from banks | | | |
| Change in cash and due from banks | 735 |
| | (1,580 | ) |
| Cash and due from banks at beginning of period | 4,822 |
| | 6,537 |
|
| Cash and due from banks at end of period | $ | 5,557 |
| | $ | 4,957 |
|
| Supplemental disclosures | | | |
| Interest paid | $ | 721 |
| | $ | 371 |
|
| Income taxes paid | 316 |
| | 597 |
|
| Income taxes refunded | 19 |
| | 293 |
|
See accompanying unaudited Notes to Consolidated Financial Statements.
|
|
| The Bank of New York Mellon Corporation (and its subsidiaries) |
Consolidated Statement of Changes in Equity (unaudited)
| | | | The Bank of New York Mellon Corporation shareholders | Non- redeemable noncontrolling interests of consolidated investment management funds |
| Total permanent equity |
| | Redeemable non- controlling interests/ temporary equity |
| The Bank of New York Mellon Corporation shareholders | Nonredeemable
noncontrolling
interests of
consolidated
investment
management
funds |
| Total
permanent
equity |
| | Redeemable
non-
controlling
interests/
temporary
equity |
|
(in millions, except per
share amount) | Preferred stock |
| Common stock |
| Additional paid-in capital |
| Retained earnings |
| Accumulated
other
comprehensive (loss) income,
net of tax |
| Treasury stock |
| Preferred stock |
| Common
stock |
| Additional
paid-in
capital |
| Retained
earnings |
| Accumulated other comprehensive (loss), net
of tax |
| Treasury
stock |
|
| Balance at Dec. 31, 2016 | $ | 3,542 |
| $ | 13 |
| $ | 25,962 |
| $ | 22,621 |
| $ | (3,765 | ) | $ | (9,562 | ) | $ | 618 |
| $ | 39,429 |
| (a) | $ | 151 |
| |
| Balance at March 31, 2020 | | $ | 3,542 |
| $ | 14 |
| $ | 27,644 |
| $ | 32,601 |
| $ | (2,827 | ) | $ | (19,829 | ) | $ | 94 |
| $ | 41,239 |
| (a) | $ | 140 |
|
| Shares issued to shareholders of noncontrolling interests | — |
| — |
| — |
| — |
| — |
| — |
| — |
| — |
| | 40 |
| — |
| — |
| — |
| — |
| — |
| — |
| — |
| — |
| | 17 |
|
| Redemption of subsidiary shares from noncontrolling interests | — |
| — |
| — |
| — |
| — |
| — |
| — |
| — |
| | (16 | ) | |
| Other net changes in noncontrolling interests | — |
| — |
| (11 | ) | — |
| — |
| — |
| (258 | ) | (269 | ) | | 15 |
| — |
| — |
| — |
| — |
| — |
| — |
| 3 |
| 3 |
| | — |
|
| Net income (loss) | — |
| — |
| — |
| 2,915 |
| — |
| — |
| 24 |
| 2,939 |
| | (6 | ) | |
| Net income | | — |
| — |
| — |
| 950 |
| — |
| — |
| 15 |
| 965 |
| | — |
|
| Other comprehensive income | — |
| — |
| — |
| — |
| 984 |
| — |
| — |
| 984 |
| | 13 |
| — |
| — |
| — |
| — |
| 884 |
| — |
| — |
| 884 |
| | — |
|
| Dividends: | | | | | | |
Common stock at $0.62 per
share | — |
| — |
| — |
| (653 | ) | — |
| — |
| — |
| (653 | ) | | — |
| |
Common stock at $0.31 per
share | | — |
| — |
| — |
| (278 | ) | — |
| — |
| — |
| (278 | ) | | — |
|
| Preferred stock | — |
| — |
| — |
| (126 | ) | — |
| — |
| — |
| (126 | ) | | — |
| — |
| — |
| — |
| (49 | ) | — |
| — |
| — |
| (49 | ) | | — |
|
| Repurchase of common stock | — |
| — |
| — |
| — |
| — |
| (2,035 | ) | — |
| (2,035 | ) | | — |
| — |
| — |
| — |
| — |
| — |
| (3 | ) | — |
| (3 | ) | | — |
|
| Common stock issued under: | | | | |
| Employee benefit plans | — |
| — |
| 21 |
| — |
| — |
| — |
| — |
| 21 |
| | — |
| |
| Direct stock purchase and dividend reinvestment plan | — |
| — |
| 18 |
| — |
| — |
| — |
| — |
| 18 |
| | — |
| |
| Common stock issued under employee benefit plans | | — |
| — |
| 6 |
| — |
| — |
| — |
| — |
| 6 |
| | — |
|
| Preferred stock issued | | 990 |
| — |
| — |
| — |
| — |
| — |
| — |
| 990 |
| | — |
|
| Stock awards and options exercised | — |
| 1 |
| 598 |
| — |
| — |
| — |
| — |
| 599 |
| | — |
| — |
| — |
| 52 |
| — |
| — |
| — |
| — |
| 52 |
| | — |
|
| Balance at Sept. 30, 2017 | $ | 3,542 |
| $ | 14 |
| $ | 26,588 |
| $ | 24,757 |
| $ | (2,781 | ) | $ | (11,597 | ) | $ | 384 |
| $ | 40,907 |
| (a) | $ | 197 |
| |
| Balance at June 30, 2020 | | $ | 4,532 |
| $ | 14 |
| $ | 27,702 |
| $ | 33,224 |
| $ | (1,943 | ) | $ | (19,832 | ) | $ | 112 |
| $ | 43,809 |
| (a) | $ | 157 |
|
| |
| (a) | Includes total The Bank of New York Mellon Corporation common shareholders’ equity of $35,269$37,603 million at March 31, 2020 and $39,165 million at June 30, 2020. |
|
| | | | | | | | | | | | | | | | | | | | | | | | | | | | |
| | The Bank of New York Mellon Corporation shareholders | Nonredeemable
noncontrolling
interests of
consolidated
investment
management
funds |
| Total
permanent
equity |
| | Redeemable
non-
controlling
interests/
temporary
equity |
|
(in millions, except per
share amount) | Preferred stock |
| Common
stock |
| Additional
paid-in
capital |
| Retained
earnings |
| Accumulated other comprehensive (loss), net
of tax |
| Treasury
stock |
|
| Balance at Dec. 31, 2019 | $ | 3,542 |
| $ | 14 |
| $ | 27,515 |
| $ | 31,894 |
| $ | (2,638 | ) | $ | (18,844 | ) | $ | 102 |
| $ | 41,585 |
| (a) | $ | 143 |
|
Impact of adopting ASU 2016-13, Financial Instruments – Credit Losses | — |
| — |
| — |
| 45 |
| (5 | ) | — |
| — |
| 40 |
| | — |
|
| Adjusted balance at Jan. 1, 2020 | 3,542 |
| 14 |
| 27,515 |
| 31,939 |
| (2,643 | ) | (18,844 | ) | 102 |
| 41,625 |
| | 143 |
|
| Shares issued to shareholders of noncontrolling interests | — |
| — |
| — |
| — |
| — |
| — |
| — |
| — |
| | 17 |
|
| Redemption of subsidiary shares from noncontrolling interests | — |
| — |
| — |
| — |
| — |
| — |
| — |
| — |
| | (16 | ) |
| Other net changes in noncontrolling interests | — |
| — |
| (5 | ) | — |
| — |
| — |
| 10 |
| 5 |
| | (2 | ) |
| Net income (loss) | — |
| — |
| — |
| 980 |
| — |
| — |
| (18 | ) | 962 |
| | — |
|
| Other comprehensive (loss) | — |
| — |
| — |
| — |
| (184 | ) | — |
| — |
| (184 | ) | | (2 | ) |
| Dividends: | | | | | | | | | | |
Common stock at $0.31 per
share | — |
| — |
| — |
| (282 | ) | — |
| — |
| — |
| (282 | ) | | — |
|
| Preferred stock | — |
| — |
| — |
| (36 | ) | — |
| — |
| — |
| (36 | ) | | — |
|
| Repurchase of common stock | — |
| — |
| — |
| — |
| — |
| (985 | ) | — |
| (985 | ) | | — |
|
| Common stock issued under employee benefit plans | — |
| — |
| 9 |
| — |
| — |
| — |
| — |
| 9 |
| | — |
|
| Stock awards and options exercised | — |
| — |
| 125 |
| — |
| — |
| — |
| — |
| 125 |
| | — |
|
| Balance at March 31, 2020 | $ | 3,542 |
| $ | 14 |
| $ | 27,644 |
| $ | 32,601 |
| $ | (2,827 | ) | $ | (19,829 | ) | $ | 94 |
| $ | 41,239 |
| (a) | $ | 140 |
|
| |
| (a) | Includes total The Bank of New York Mellon Corporation common shareholders’ equity of $37,941 million at Dec. 31, 20162019 and $36,981$37,603 million at Sept. 30, 2017.March 31, 2020. |
|
|
| The Bank of New York Mellon Corporation (and its subsidiaries) |
Consolidated Statement of Changes in Equity (unaudited)(continued)
|
| | | | | | | | | | | | | | | | | | | | | | | | | | | | |
| | The Bank of New York Mellon Corporation shareholders | Nonredeemable
noncontrolling
interests of
consolidated
investment
management
funds |
| Total
permanent
equity |
| | Redeemable
non-
controlling
interests/
temporary
equity |
|
(in millions, except per
share amount) | Preferred stock |
| Common
stock |
| Additional
paid-in
capital |
| Retained
earnings |
| Accumulated other comprehensive (loss), net
of tax |
| Treasury
stock |
|
| Balance at March 31, 2019 | $ | 3,542 |
| $ | 14 |
| $ | 27,349 |
| $ | 29,382 |
| $ | (2,990 | ) | $ | (16,072 | ) | $ | 122 |
| $ | 41,347 |
| (a) | $ | 122 |
|
| Shares issued to shareholders of noncontrolling interests | — |
| — |
| — |
| — |
| — |
| — |
| — |
| — |
| | 16 |
|
| Other net changes in noncontrolling interests | — |
| — |
| 2 |
| — |
| — |
| — |
| 40 |
| 42 |
| | (2 | ) |
| Net income | — |
| — |
| — |
| 1,017 |
| — |
| — |
| 4 |
| 1,021 |
| | — |
|
| Other comprehensive income | — |
| — |
| — |
| — |
| 302 |
| — |
| — |
| 302 |
| | — |
|
| Dividends: | | | | | | | | | | |
Common stock at $0.28 per
share | — |
| — |
| — |
| (270 | ) | — |
| — |
| — |
| (270 | ) | | — |
|
| Preferred stock | — |
| — |
| — |
| (48 | ) | — |
| — |
| — |
| (48 | ) | | — |
|
| Repurchase of common stock | — |
| — |
| — |
| — |
| — |
| (750 | ) | — |
| (750 | ) | | — |
|
| Common stock issued under employee benefit plans | — |
| — |
| 6 |
| — |
| — |
| — |
| — |
| 6 |
| | — |
|
| Stock awards and options exercised | — |
| — |
| 49 |
| — |
| — |
| — |
| — |
| 49 |
| | — |
|
| Balance at June 30, 2019 | $ | 3,542 |
| $ | 14 |
| $ | 27,406 |
| $ | 30,081 |
| $ | (2,688 | ) | $ | (16,822 | ) | $ | 166 |
| $ | 41,699 |
| (a) | $ | 136 |
|
| |
| (a) | Includes total The Bank of New York Mellon Corporation common shareholders’ equity of $37,683 million at March 31, 2019 and $37,991 million at June 30, 2019. |
|
| | | | | | | | | | | | | | | | | | | | | | | | | | | | |
| | The Bank of New York Mellon Corporation shareholders | Nonredeemable
noncontrolling
interests of
consolidated
investment
management
funds |
| Total
permanent
equity |
| | Redeemable
non-
controlling
interests/
temporary
equity |
|
(in millions, except per
share amount) | Preferred stock |
| Common
stock |
| Additional
paid-in
capital |
| Retained
earnings |
| Accumulated other comprehensive (loss), net
of tax |
| Treasury
stock |
|
| Balance at Dec. 31, 2019 | $ | 3,542 |
| $ | 14 |
| $ | 27,515 |
| $ | 31,894 |
| $ | (2,638 | ) | $ | (18,844 | ) | $ | 102 |
| $ | 41,585 |
| (a) | $ | 143 |
|
Impact of adopting ASU 2016-13, Financial Instruments – Credit Losses | — |
| — |
| — |
| 45 |
| (5 | ) | — |
| — |
| 40 |
| | — |
|
| Adjusted balance at Jan. 1, 2020 | 3,542 |
| 14 |
| 27,515 |
| 31,939 |
| (2,643 | ) | (18,844 | ) | 102 |
| 41,625 |
| | 143 |
|
| Shares issued to shareholders of noncontrolling interests | — |
| — |
| — |
| — |
| — |
| — |
| — |
| — |
| | 34 |
|
| Redemption of subsidiary shares from noncontrolling interests | — |
| — |
| — |
| — |
| — |
| — |
| — |
| — |
| | (16 | ) |
| Other net changes in noncontrolling interests | — |
| — |
| (5 | ) | — |
| — |
| — |
| 13 |
| 8 |
| | (2 | ) |
| Net income (loss) | — |
| — |
| — |
| 1,930 |
| — |
| — |
| (3 | ) | 1,927 |
| | — |
|
| Other comprehensive income (loss) | — |
| — |
| — |
| — |
| 700 |
| — |
| — |
| 700 |
| | (2 | ) |
| Dividends: | | | | | | | | | | |
Common stock at $0.62 per
share | — |
| — |
| — |
| (560 | ) | — |
| — |
| — |
| (560 | ) | | — |
|
| Preferred stock | — |
| — |
| — |
| (85 | ) | — |
| — |
| — |
| (85 | ) | | — |
|
| Repurchase of common stock | — |
| — |
| — |
| — |
| — |
| (988 | ) | — |
| (988 | ) | | — |
|
| Common stock issued under employee benefit plans | — |
| — |
| 15 |
| — |
| — |
| — |
| — |
| 15 |
| | — |
|
| Preferred stock issued | 990 |
| — |
| — |
| — |
| — |
| — |
| — |
| 990 |
| | — |
|
| Stock awards and options exercised | — |
| — |
| 177 |
| — |
| — |
| — |
| — |
| 177 |
| | — |
|
| Balance at June 30, 2020 | $ | 4,532 |
| $ | 14 |
| $ | 27,702 |
| $ | 33,224 |
| $ | (1,943 | ) | $ | (19,832 | ) | $ | 112 |
| $ | 43,809 |
| (a) | $ | 157 |
|
| |
| (a) | Includes total The Bank of New York Mellon Corporation common shareholders’ equity of $37,941 million at Dec. 31, 2019 and $39,165 million at June 30, 2020. |
|
|
| The Bank of New York Mellon Corporation (and its subsidiaries) |
Consolidated Statement of Changes in Equity (unaudited)(continued)
|
| | | | | | | | | | | | | | | | | | | | | | | | | | | | |
| | The Bank of New York Mellon Corporation shareholders | Nonredeemable
noncontrolling
interests of
consolidated
investment
management
funds |
| Total
permanent
equity |
| | Redeemable
non-
controlling
interests/
temporary
equity |
|
(in millions, except per
share amount) | Preferred stock |
| Common
stock |
| Additional
paid-in
capital |
| Retained
earnings |
| Accumulated other comprehensive (loss), net of tax |
| Treasury
stock |
|
| Balance at Dec. 31, 2018 | $ | 3,542 |
| $ | 14 |
| $ | 27,118 |
| $ | 28,652 |
| $ | (3,171 | ) | $ | (15,517 | ) | $ | 101 |
| $ | 40,739 |
| (a) | $ | 129 |
|
Reclassification of certain tax effects related to adopting ASU 2018-02 | — |
| — |
| — |
| 90 |
| (90 | ) | — |
| — |
| — |
| | — |
|
| Adjusted balance at Jan. 1, 2019 | 3,542 |
| 14 |
| 27,118 |
| 28,742 |
| (3,261 | ) | (15,517 | ) | 101 |
| 40,739 |
| | 129 |
|
| Shares issued to shareholders of noncontrolling interests | — |
| — |
| — |
| — |
| — |
| — |
| — |
| — |
| | 36 |
|
| Redemption of subsidiary shares from noncontrolling interests | — |
| — |
| — |
| — |
| — |
| — |
| — |
| — |
| | (7 | ) |
| Other net changes in noncontrolling interests | — |
| — |
| 21 |
| — |
| — |
| — |
| 51 |
| 72 |
| | (24 | ) |
| Net income | — |
| — |
| — |
| 1,963 |
| — |
| — |
| 14 |
| 1,977 |
| | — |
|
| Other comprehensive income | — |
| — |
| — |
| — |
| 573 |
| — |
| — |
| 573 |
| | 2 |
|
| Dividends: | | | | | | | | | | |
Common stock at $0.56 per
share | — |
| — |
| — |
| (540 | ) | — |
| — |
| — |
| (540 | ) | | — |
|
| Preferred stock | — |
| — |
| — |
| (84 | ) | — |
| — |
| — |
| (84 | ) | | — |
|
| Repurchase of common stock | — |
| — |
| — |
| — |
| — |
| (1,305 | ) | — |
| (1,305 | ) | | — |
|
| Common stock issued under: | | | | | | | | | | |
| Employee benefit plans | — |
| — |
| 16 |
| — |
| — |
| — |
| — |
| 16 |
| | — |
|
| Direct stock purchase and dividend reinvestment plan | — |
| — |
| 11 |
| — |
| — |
| — |
| — |
| 11 |
| | — |
|
| Stock awards and options exercised | — |
| — |
| 240 |
| — |
| — |
| — |
| — |
| 240 |
| | — |
|
| Balance at June 30, 2019 | $ | 3,542 |
| $ | 14 |
| $ | 27,406 |
| $ | 30,081 |
| $ | (2,688 | ) | $ | (16,822 | ) | $ | 166 |
| $ | 41,699 |
| (a) | $ | 136 |
|
| |
| (a) | Includes total The Bank of New York Mellon Corporation common shareholders’ equity of $37,096 million at Dec. 31, 2018 and $37,991 million at June 30, 2019. |
See accompanying unaudited Notes to Consolidated Financial Statements.
|
|
| Notes to Consolidated Financial Statements |
| |
Note 1 - 1–Basis of presentation
In this Quarterly Report on Form 10-Q, references to “our,” “we,” “us,” “BNY Mellon,” the “Company” and similar terms refer to The Bank of New York Mellon Corporation and its consolidated subsidiaries. The term “Parent” refers to The Bank of New York Mellon Corporation but not its subsidiaries.
Basis of presentation
The accounting and financial reporting policies of BNY Mellon, a global financial services company, conform to U.S. generally accepted accounting principles (“GAAP”) and prevailing industry practices. For information on our significant accounting and reporting policies, see Note 1 in our 2019 Annual Report.
The accompanying consolidated financial statements are unaudited. In the opinion of management, all adjustments necessary for a fair presentation of financial position, results of operations and cash flows for the periods presented have been made. These financial statements should be read in conjunction with BNY Mellon’sour 2019 Annual Report on Form 10-K for the year ended Dec. 31, 2016.Report. Certain immaterial reclassifications have been made to prior periods to place them on a basis comparable with the current period presentation.
Use of estimates
The preparation of financial statements in conformity with U.S. GAAP requires management to make estimates based upon assumptions about future economic and market conditions which affect reported amounts and related disclosures in our financial statements. Although our current estimates contemplate current conditions and how we expect them to change in the future, it is reasonably possible that actual conditions could be worse than anticipated in those estimates, which could materially affect our results of operations and financial condition. Amounts subject to estimates are items such as the allowance for loan losses and lending-related commitments, the fair value of financial instruments and derivatives, other-than-temporary impairment, goodwill and other intangibles and pension accounting. Among other effects, such changes in estimates could result in future impairments of investment securities, goodwill and intangible assets and establishment of allowances for loan losses and lending-related commitments as well as changes in pension and post-retirement expense.
Note 2 - 2–Accounting changechanges and new accounting guidance
ASU 2017-04, Simplifying the Test for Goodwill Impairment
In January 2017, the FASB issued ASU 2017-04, Simplifying the Test for Goodwill Impairment. This ASU simplifies the annual goodwill impairment test by eliminating Step 2. The Step 2 calculation estimated the implied goodwill using the fair values of all assets, including previously unrecorded intangibles, and liabilities at the date of the test. Step 2following accounting guidance was required if the first step of the annual test indicated that the fair value of a reporting unit is less than its carrying value. After adopting this ASU, the amount of any goodwill impairment will be determined by the excess of the carrying value of a reporting unit over its fair value. The Company early adopted this ASU in the second quarter of 2017, in conjunction with its annual goodwill impairment test. The annual test did not result in any impairment.
ASU 2016-09, Compensation – Stock Compensation
In March 2016, the FASB issued ASU 2016-09, Compensation – Stock Compensation. This ASU simplifies several aspects of the accounting for share-based payment transactions, including income tax consequences, recognition of forfeitures and classification on the statement of cash flows. The Company adopted this ASU effective Jan. 1, 2017.
For the first nine months of 2017, we recorded an income tax benefit of $45 million related to the vesting of stock awards and option exercises in the provision for income taxes. Previously, this had been recorded directly to additional paid-in capital. The impact in future periods will vary depending on the number of restricted stock units vesting (which primarily occurs in the first quarter of each year),2020.
Accounting Standards Update (“ASU”) 2016-13, Financial Instruments – Credit Losses: Measurement of Credit Losses on Financial Instruments
In June 2016, the numberFinancial Accounting Standards Board (“FASB”) issued an ASU, Financial Instruments – Credit Losses: Measurement of stock options exercisedCredit Losses on Financial Instruments. This ASU introduces a new current expected credit losses model, which applies to financial assets subject to credit losses and measured at amortized cost, including held-to-maturity securities and certain off-balance sheet credit exposures. The guidance also changes current practice for the change in value sinceimpairment model for available-for-sale debt securities by requiring the grant date.
We continueuse of an allowance to apply our accounting policy election for estimating forfeitures. Additionally, beginning in the quarter ended March 31, 2017, we report excess tax benefits related to stock-based compensation as operating activities on the statementrecord estimated credit losses and subsequent recoveries. The standard requires a cumulative effect of cash flows and the employee taxes paid will continueinitial application to be reported as financing activities.recognized in retained earnings at the date of initial application.
In conjunction with adopting the new standard, we developed expected credit loss models and approaches that include consideration of multiple forecast scenarios and other methodologies. On Jan. 1, 2020, we adopted this new accounting guidance on a prospective basis and recognized a $45 million after-tax increase in retained earnings primarily attributable to a reduction to the allowance for credit losses for our commercial lending portfolios. The comparative financial information for prior periods has not been restated. See the Consolidated Balance Sheet and Notes 4 and 5 for the disclosures required by this ASU.
|
|
Notes to Consolidated Financial Statements(continued) |
| |
The table below presents the reconciliation of the allowance for credit losses (pre-tax).
|
| | | |
| Allowance for credit losses | |
| (in millions) | |
| Allowance for credit losses – Dec. 31, 2019 | $ | 216 |
|
| Impact of adopting ASU 2016-13: | |
| Securities | 7 |
|
Loans (a) | (69 | ) |
| Other | 3 |
|
| Total impact of adoption of ASU 2016-13 | (59 | ) |
| Reclassification of credit-related reserves on accounts receivable | 4 |
|
| Allowance for credit losses – Jan. 1, 2020 | $ | 161 |
|
| |
| (a) | Includes $48 million related to loans and $21 million for lending-related commitments. |
Significant accounting policies
Loans
Loans are reported at amortized cost, net of any unearned income and deferred fees and costs. Certain loan origination and upfront commitment fees, as well as certain direct loan origination and commitment costs, are deferred and amortized as a yield adjustment over the lives of the related loans. Loans held for sale are carried at the lower of cost or fair value.
Troubled debt restructuring/loan modifications
A modified loan is considered a troubled debt restructuring (“TDR”) if the debtor is experiencing financial difficulties and the creditor grants a concession to the debtor that would not otherwise be considered. A TDR may include a transfer of real estate or other assets from the debtor to the creditor, or a modification of the term of the loan. Credit losses related to TDRs are accounted for under an individual evaluation methodology (see “Allowance for credit losses” below). Credit losses for anticipated TDRs are accounted for similarly to TDRs and are identified when there is a reasonable expectation that a TDR will be executed with the borrower and when we expect the modification to affect the timing or amount of payments and/or the payment term.
Due to the coronavirus pandemic, there have been two forms of relief provided for classifying loans as TDRs: The Coronavirus Aid, Relief, and Economic Security Act (the “CARES Act”) and the Interagency Guidance (as defined below). Financial institutions
may account for eligible loan modifications either under the CARES Act or the Interagency Guidance. The Company has elected to apply both the CARES Act and the Interagency Guidance, as applicable, in providing borrowers with loan modification relief in response to the coronavirus pandemic.
The CARES Act, which became law on March 27, 2020, provides that financial institutions may, subject to certain conditions, elect to temporarily suspend the U.S. GAAP requirements with respect to loan modifications related to the coronavirus pandemic that were current as of Dec. 31, 2019 and that would otherwise be identified and treated as TDRs.
This TDR relief is applicable to modifications that were made from March 1, 2020 until the earlier of Dec. 31, 2020 or 60 days from the date the national emergency related to the coronavirus pandemic officially ends.
Various banking regulators issued guidance in the April 7, 2020 “Interagency Statement on Loan Modifications and Reporting for Financial Institutions Working with Customers Affected by the Coronavirus (revised)” (“Interagency Guidance”) on loan modification treatment pursuant to which financial institutions can apply the U.S. GAAP requirements for loan modifications. In accordance with this guidance, a loan modification is not considered a TDR if the modification is related to the coronavirus pandemic, the borrower had been current when the modification program was implemented, and the modification includes payment deferrals for not more than 6 months.
Nonperforming assets
Commercial loans are placed on nonaccrual status when principal or interest is past due 90 days or more, or when there is reasonable doubt that interest or principal will be collected.
When a first or second lien residential mortgage loan reaches 90 days delinquent, it is subject to an individual evaluation of credit loss and placed on nonaccrual status.
When a loan is placed on nonaccrual status, previously accrued and uncollected interest is reversed against current period interest revenue. Interest receipts on nonaccrual loans are recognized as interest revenue or are applied to principal when
|
|
Notes to Consolidated Financial Statements(continued) |
|
we believe the ultimate collectability of principal is in doubt. Nonaccrual loans generally are restored to an accrual basis when principal and interest become current and remain current for a specified period.
“Allowance for credit losses” below provides additional information regarding the individual evaluation of credit losses for nonperforming loans.
Allowance for credit losses
The accounting policy for estimating credit losses related to financial assets measured at amortized cost, including loans and lending-related commitments changed beginning in the first quarter of 2020 as a result of the adoption of ASU 2016-13, Financial Instruments – Credit Losses: Measurement of Credit Losses on Financial Instruments. This ASU also included targeted amendments with respect to credit losses for available-for-sale debt securities. The accounting policy for determining the allowances has been identified as a “critical accounting estimate” as it requires us to make numerous complex and subjective estimates and assumptions relating to amounts which are judgmental and inherently uncertain.
Credit quality is monitored by management and is reflected within the allowance for credit losses. The allowance represents management’s estimate of expected credit losses over the expected contractual life of the financial instruments as of the balance sheet date. The allowance methodology is designed to provide procedural discipline in assessing the appropriateness of the allowance.
A quantitative methodology and qualitative framework is used to estimate the allowance for credit losses. The qualitative framework is described in further detail within “Allowance for credit losses - Other” below. The quantitative component of our estimate uses models and methodologies that categorize financial assets based on product type, collateral type, and other credit trends and risk characteristics, including relevant information about past events, current conditions and reasonable and supportable forecasts of future economic conditions that affect the collectability of the recorded amounts. The allowance may be determined using various methods, including discounted cash flow methods, loss-rate methods, probability of default methods or other methods that we determine to be appropriate. We estimate our expected credit losses using the
probability of default method for the majority of our financial assets. We measure expected credit losses of financial assets on a collective (pool) basis when similar risk characteristics exist. For a financial asset that does not share risk characteristics with other assets, expected credit losses are measured based on an individual evaluation method.
In our estimate, with the exception of our small home equity line of credit portfolio, available-for-sale debt securities, and individually evaluated financial assets, we utilize a multi-scenario macroeconomic forecast which includes a weighting of baseline, stronger near-term growth and moderate recession scenarios. This approach allows us to develop our estimate using a wide span of economic input variables. Our baseline scenario reflects a view on likely performance of each global region and the other two scenarios are designed relative to the baseline scenario. The scenarios include both a reasonable and supportable forecast period as well as a reversion period. The reasonable and supportable forecast is typically over a two to three-year horizon, followed by a reversion period in which the economic data reverts to long-term historical experience. In general, the forecasts across the alternative economic scenarios tend to revert toward the long-term trends after the forecast period, which is the period in which the confidence interval is considered reasonable and supportable. The speed at which the scenario specific forecasts revert is based on observed historical patterns of mean reversion that are reflected in our model parameter estimates. Certain macroeconomic variables such as unemployment or home prices take longer to revert after a contraction, though specific recovery times are scenario-specific. Reversion will usually take longer the further away the scenario specific forecast is from the historical mean. On a quarterly basis, within a developed governance structure, we update these scenarios for current economic conditions and may adjust the scenario weighting based on our economic outlook.
Allowance for credit losses - Loans and lending-related commitments
The allowance for credit losses on loans is presented as a valuation allowance to loans, and the allowance for credit losses on lending-related commitments is recorded in other liabilities. The components of the allowance for credit losses on loans and lending-related commitments consist of the following three elements:
|
|
Notes to Consolidated Financial Statements(continued) |
|
a pooled allowance component for higher risk-rated and pass-rated commercial and institutional credits;
a pooled allowance component for residential mortgage loans; and
an asset-specific allowance component involving individually evaluated credits of $1 million or greater.
The first element, a pooled allowance component for higher risk-rated and pass-rated commercial and institutional credits, is based on our expected credit loss model. Individual credit analyses are performed on such loans before being assigned a credit rating. All borrowers are collectively evaluated based on their credit rating. The loss expected in each loan incorporates the borrower’s credit rating, facility rating and maturity. The loss given default, derived from the facility rating, incorporates a recovery expectation, and for unfunded lending exposures, an estimate of the use of the facility at default (usage given default). The borrower’s probability of default is derived from the associated credit rating. For each of the different parameters, specific credit models are developed for each segment of our portfolio, including commercial loans and lease financing, commercial real estate, financial institutions, and other. Segmentation is established based on risk characteristics of the loans and how risk is monitored. We use both internal and external data in the development of these parameters. In estimating the term of the exposures and resulting effect on the measurement of expected credit loss, we consider the impact of potential prepayments as well as the effect of borrower extension options. Borrower ratings are reviewed at least annually and are periodically mapped to third-party databases, including rating agency and default and recovery databases, to ensure ongoing consistency and validity. Higher risk-rated loans and lending-related commitments are reviewed quarterly.
The second element, a pooled allowance component for residential mortgage loans, is determined by first segregating our mortgage pools into two categories: (i) our wealth management mortgages and (ii) our legacy mortgage portfolio disclosed as other residential mortgages. We then apply models to each portfolio to predict prepayments, default rates and loss severity. We consider historical loss experience and use a loan-level, multi-period default model which further segments each portfolio by product
type including first lien fixed rate mortgages, first lien adjustable rate mortgages, second lien mortgages, and interest-only mortgages. We calculate the mortgage loss up to loan contractual maturity and embed a reasonable and supportable forecast and macroeconomic variable inputs which are described above. For home equity lines of credit, probability of default and loss given default are based on external data from third-party databases due to the small size of the portfolio and limited internal data. Our legacy mortgage portfolio and home equity line of credit portfolios represent small sub-segments of our mortgage loans.
The third element, individually evaluated credits, is based on individual analysis of loans of $1 million and greater which no longer share the risk characteristics with other loans. Factors we consider in measuring the extent of expected credit loss include the payment status, collateral value, the borrower’s financial condition, guarantor support, the probability of collecting scheduled principal and interest payments when due, anticipated modifications of payment structure or term for troubled borrowers, and recoveries if they can be reasonably estimated. We measure the expected credit loss as the difference between the amortized cost basis in the loan and the present value of the expected future cash flows from the borrower which is generally discounted at the loan’s effective interest rate, or the fair value of the collateral, if the loan is collateral dependent. We generally consider nonperforming loans as well as loans that have been or are anticipated to be modified under a troubled debt restructuring for individual evaluation given the risk characteristics of such loans.
Allowance for credit losses - Securities - Debt
When estimating expected credit losses, we segment our available-for-sale and held-to-maturity debt securities portfolios by major asset class. This is influenced by whether the security is structured or non-structured (i.e., direct obligation), as well as the issuer type.
Debt securities are classified as available-for-sale securities when we intend to hold the securities for an indefinite period of time or when the securities may be used for tactical asset/liability management purposes and may be sold from time to time to effectively manage interest rate exposure, prepayment risk and liquidity needs. Available-for-sale securities
|
|
Notes to Consolidated Financial Statements(continued) |
|
are measured at fair value. The difference between fair value and amortized cost represents the unrealized gains or losses on assets classified as available-for-sale, and is recorded net of tax as an addition to, or deduction from, other comprehensive income, unless we determine that this difference or a portion thereof represents an expected credit loss. If we determine that a credit loss exists, the amount is recognized as an allowance for credit losses in securities - available-for sale, with a corresponding adjustment to the provision for credit losses. We evaluate credit losses at the individual security level and do not recognize credit losses if the fair value exceeds amortized cost, and if we determine that a credit loss exists, we limit the recognition of the loss to the difference between fair value and amortized cost. In our determination of whether an expected credit loss exists, we routinely conduct periodic reviews and examine various quantitative and qualitative factors that are unique to each portfolio, including the severity of the unrealized loss position, agency rating, credit enhancement, cash flow deterioration and other factors. The measurement of an expected credit loss is then based on the best estimate of the present value of cash flows to be collected from the debt security. Generally, cash flows are discounted at the effective interest rate implicit in the debt security. Changes to the present value of cash flows due to the passage of time are recognized within the allowance for credit losses.
We estimate expected credit losses for held-to-maturity debt securities using a similar methodology as described in the first allowance element within “Allowance for credit losses - Loans and lending-related commitments” above. The allowance for credit losses on held-to-maturity debt securities are recorded in securities - held-to-maturity. The components of the credit loss calculation for each major portfolio or asset class include a probability of default and loss given default and their values depend on the forecast behavior of variables in the macroeconomic environment. For structured debt securities, we estimated expected credit losses at the individual security level and use a cash flow model to project principal losses. Generally, cash flows are discounted at the effective interest rate implicit in the debt security. The difference is reflected in the allowance for credit losses, and changes to the present value of cash flows due to the passage of time are recognized within the allowance for credit losses.
We currently do not require an estimate of expected credit losses to be measured and recorded for U.S. Treasury securities, agency debt securities, as well as other debt securities that meet certain conditions that are based on a combination of factors such as guarantees, credit ratings, and other credit quality factors. These assets are monitored within our established governance structure on a recurring basis to determine if any changes are warranted.
Allowance for credit losses – Other financial instruments
We also estimate expected credit losses associated with margin loans, reverse repurchase agreements, security lending indemnifications, and deposits with third-party financial institutions using a similar methodology as described in the first allowance element within “Allowance for credit losses - Loans and lending-related commitments” above. The allowance for credit losses on reverse repurchase agreements are recorded in federal funds sold and securities purchased under resale agreements; the allowance for credit losses on securities lending indemnifications is recorded in other liabilities and the allowance for credit losses on deposits with third party financial institutions is recorded in cash and due from banks or interest-bearing deposits with banks. Our reverse repurchase agreements are short term and subject to continuous overcollateralization by our counterparties and timely collateral replenishment, when necessary. As a result, we estimate the expected credit loss related to the uncollateralized portion of the asset at the balance sheet date, if any, and when there is a reasonable expectation that the counterparty will not replenish the collateral in compliance with the terms of the repurchase agreement. This method is also applied to margin lending arrangements and securities lending indemnifications.
Allowance for credit losses - Other
We do not apply our credit loss measurement methodologies to accrued interest receivable balances related to our loan, debt securities and deposits with third party financial institutions assets given our nonaccrual policy that requires charge-off of interest receivable when deemed uncollectible. Accrued interest receivable related to these instruments is presented in total with other interest-bearing instruments in the consolidated balance sheet. Accrued interest receivable related to each major loan
|
|
Notes to Consolidated Financial Statements(continued) |
|
class is disclosed within our credit quality disclosure in Note 3 - Acquisitions5.
Our policy for credit losses related to purchased financial assets requires an evaluation to be performed prior to the effective purchase date to determine if more than an insignificant decline in credit quality has occurred during the period between the origination and purchase date, or in the case of debt securities, the period between the issuance and purchase date. If we purchase a financial asset with more than insignificant deterioration in credit quality, the measurement of expected credit loss is performed using the methodologies described above, and the credit loss is recorded as an allowance for credit losses on the purchase date. Subsequent to purchase, changes (favorable and unfavorable) in expected cash flows are recognized immediately in net income by adjusting the allowance. We evaluate various factors in the determination of whether a more than an insignificant decline in credit quality has occurred and these factors vary depending upon the type of asset purchased. Such factors include changes in risk rating and/or agency rating, collateral deterioration, payment status, purchase price, credit spreads, and other factors. We did not purchase any such assets during the first six months of 2020 and did not own such assets as of June 30, 2020.
We apply a separate credit loss methodology to accounts receivables to estimate the expected credit losses associated with these short-term receivables which historically have not resulted in significant credit losses. The allowance for credit losses on accounts receivable is reflected in other assets.
The qualitative component of our estimate for the allowance for credit losses is intended to capture expected losses that may not have been fully captured in the quantitative component. Through an established governance structure, management determines the qualitative allowance each period based on an evaluation of various internal and environmental factors which include: scenario weighting and sensitivity risk, credit concentration risk, economic conditions and other considerations. We may also make adjustments for idiosyncratic
risks. Once determined in the aggregate, our qualitative allowance is then allocated to each of our financial instrument portfolios except for debt securities and those instruments carried in other assets based on the respective instruments’ quantitative allowance balances. The allocation of this additional allowance for credit losses is inherently judgmental, and the entire allowance for credit losses is available to absorb credit losses regardless of the nature of the loss.
Note 3–Acquisitions and dispositions
We sometimes structure our acquisitions with both an initial payment and later contingent payments tied to post-closing revenue or income growth. Contingent payments totaled $2$3 million in the thirdsecond quarter of 20172020 and the first ninesix months of 2017.2020.
At Sept.June 30, 2017,2020, we are potentially obligated to pay additional consideration which, using reasonable assumptions, could range from $0$5 million to $1610 millionover the nexttwo years, but could be higher as certain of the arrangements do not contain a contractual maximum.The acquisition described below did not have a material impact on BNY Mellon’s results of operations.
AcquisitionTransaction in 20162019
On April 1, 2016,Nov. 8, 2019, BNY Mellon, acquiredalong with the assetsother holders of Atherton Lane Advisers,Promontory Interfinancial Network, LLC a U.S.-based investment manager with approximately $2.45 billion(“PIN”), completed the sale of their interests in AUM and servicer for approximately 700 high-net-worth clients, for cashPIN. BNY Mellon recorded an after-tax gain of $38$622 million plus contingent payments measured at $22 million. Goodwill related toon the sale of this acquisition totaled $29 million and is included in the Investment Management business. The customer relationship intangible asset related to this acquisition is included in the Investment Management business, with an estimated life of 14 years, and totaled $30 million at acquisition.equity investment.
Note 4 - 4–Securities
On Jan. 1, 2020, we adopted ASU 2016-13, Financial Instruments – Credit Losses: Measurement of Credit Losses on Financial Instruments on a prospective basis. See Note 2 for the significant accounting policy related to securities.
The following tables present the amortized cost, the gross unrealized gains and losses and the fair value of securities at Sept.June 30, 20172020 and Dec. 31, 2016.2019.
|
| | | | | | | | | | | | |
| Securities at Sept. 30, 2017 | Gross unrealized | |
| | Amortized cost |
| Fair value |
|
| (in millions) | Gains |
| Losses |
|
| Available-for-sale: | | | | |
| U.S. Treasury | $ | 15,389 |
| $ | 236 |
| $ | 123 |
| $ | 15,502 |
|
| U.S. government agencies | 866 |
| 4 |
| 6 |
| 864 |
|
| State and political subdivisions | 3,091 |
| 57 |
| 24 |
| 3,124 |
|
| Agency RMBS | 24,546 |
| 135 |
| 250 |
| 24,431 |
|
| Non-agency RMBS | 491 |
| 37 |
| 3 |
| 525 |
|
| Other RMBS | 270 |
| 3 |
| 8 |
| 265 |
|
| Commercial MBS | 960 |
| 9 |
| 4 |
| 965 |
|
| Agency commercial MBS | 9,026 |
| 41 |
| 57 |
| 9,010 |
|
| CLOs | 2,542 |
| 9 |
| 1 |
| 2,550 |
|
| Other asset-backed securities | 1,152 |
| 5 |
| — |
| 1,157 |
|
| Foreign covered bonds | 2,529 |
| 20 |
| 7 |
| 2,542 |
|
| Corporate bonds | 1,262 |
| 21 |
| 8 |
| 1,275 |
|
| Sovereign debt/sovereign guaranteed | 12,393 |
| 195 |
| 23 |
| 12,565 |
|
| Other debt securities | 3,149 |
| 12 |
| 10 |
| 3,151 |
|
| Equity securities | 2 |
| 2 |
| — |
| 4 |
|
| Money market funds | 939 |
| — |
| — |
| 939 |
|
Non-agency RMBS (a) | 885 |
| 304 |
| 4 |
| 1,185 |
|
Total securities available-for-sale (b) | $ | 79,492 |
| $ | 1,090 |
| $ | 528 |
| $ | 80,054 |
|
| Held-to-maturity: | | | | |
| U.S. Treasury | $ | 9,867 |
| $ | 21 |
| $ | 29 |
| $ | 9,859 |
|
| U.S. government agencies | 1,614 |
| — |
| 6 |
| 1,608 |
|
| State and political subdivisions | 18 |
| — |
| 1 |
| 17 |
|
| Agency RMBS | 25,575 |
| 96 |
| 185 |
| 25,486 |
|
| Non-agency RMBS | 64 |
| 5 |
| — |
| 69 |
|
| Other RMBS | 65 |
| — |
| 1 |
| 64 |
|
| Commercial MBS | 6 |
| — |
| — |
| 6 |
|
| Agency commercial MBS | 1,118 |
| 5 |
| 5 |
| 1,118 |
|
| Foreign covered bonds | 83 |
| 1 |
| — |
| 84 |
|
| Sovereign debt/sovereign guaranteed | 1,558 |
| 32 |
| — |
| 1,590 |
|
| Other debt securities | 27 |
| — |
| — |
| 27 |
|
| Total securities held-to-maturity | $ | 39,995 |
| $ | 160 |
| $ | 227 |
| $ | 39,928 |
|
| Total securities | $ | 119,487 |
| $ | 1,250 |
| $ | 755 |
| $ | 119,982 |
|
| |
(a) | Previously included in the Grantor Trust. The Grantor Trust was dissolved in 2011. |
| |
(b) | Includes gross unrealized gains of $53 million and gross unrealized losses of $155 million recorded in accumulated other comprehensive income related to investment securities that were transferred from available-for-sale to held-to-maturity. The unrealized gains and losses are primarily related to Agency RMBS and will be amortized into net interest revenue over the contractual lives of the securities. |
|
|
Notes to Consolidated Financial Statements(continued) |
| |
| | | Securities at Dec. 31, 2016 | Gross
unrealized |
|
| |
| Securities at June 30, 2020 | | Securities at June 30, 2020 | Gross unrealized | Fair value |
|
| | Amortized cost |
| Gross
unrealized | Fair value |
| Amortized cost |
|
| (in millions) | Gains |
| Losses |
|
| Available-for-sale: | | |
| Agency RMBS | | $ | 26,005 |
| $ | 516 |
| $ | 84 |
| $ | 26,437 |
|
| U.S. Treasury | | 23,537 |
| 1,600 |
| — |
| 25,137 |
|
| Sovereign debt/sovereign guaranteed | | 15,724 |
| 165 |
| 2 |
| 15,887 |
|
| Agency commercial mortgage-backed securities (“MBS”) | | 9,357 |
| 633 |
| 2 |
| 9,988 |
|
| Foreign covered bonds | | 5,469 |
| 53 |
| 3 |
| 5,519 |
|
| Supranational | | 5,385 |
| 64 |
| 1 |
| 5,448 |
|
| Collateralized loan obligations (“CLOs”) | | 4,526 |
| 4 |
| 98 |
| 4,432 |
|
| Foreign government agencies | | 3,536 |
| 42 |
| — |
| 3,578 |
|
| U.S. government agencies | | 2,635 |
| 173 |
| 2 |
| 2,806 |
|
| Other asset-backed securities (“ABS”) | | 2,724 |
| 29 |
| 10 |
| 2,743 |
|
| Non-agency commercial MBS | | 2,517 |
| 129 |
| 16 |
| 2,630 |
|
| Commercial paper/certificates of deposit (“CDs”) | | 1,849 |
| 4 |
| — |
| 1,853 |
|
Non-agency RMBS (a) | | 1,464 |
| 149 |
| 15 |
| 1,598 |
|
| State and political subdivisions | | 1,150 |
| 31 |
| 2 |
| 1,179 |
|
| Corporate bonds | | 789 |
| 42 |
| — |
| 831 |
|
| Other debt securities | | 1 |
| — |
| — |
| 1 |
|
Total securities available-for-sale (b)(c) | | $ | 106,668 |
| $ | 3,634 |
| $ | 235 |
| $ | 110,067 |
|
| Held-to-maturity: | | |
| Agency RMBS | | $ | 32,869 |
| $ | 1,108 |
| $ | 9 |
| $ | 33,968 |
|
| U.S. Treasury | $ | 14,373 |
| $ | 115 |
| $ | 181 |
| $ | 14,307 |
| 4,687 |
| 114 |
| 1 |
| 4,800 |
|
| U.S. government agencies | 366 |
| 2 |
| 9 |
| 359 |
| 2,349 |
| 6 |
| 3 |
| 2,352 |
|
| Agency commercial MBS | | 1,982 |
| 108 |
| — |
| 2,090 |
|
| Commercial paper/CDs | | 1,537 |
| 2 |
| — |
| 1,539 |
|
| Sovereign debt/sovereign guaranteed | | 974 |
| 41 |
| — |
| 1,015 |
|
| Foreign covered bonds | | 79 |
| — |
| — |
| 79 |
|
| Non-agency RMBS | | 73 |
| 3 |
| 2 |
| 74 |
|
| Supranational | | 49 |
| — |
| — |
| 49 |
|
| State and political subdivisions | 3,392 |
| 38 |
| 52 |
| 3,378 |
| 16 |
| 1 |
| — |
| 17 |
|
| Agency RMBS | 22,929 |
| 148 |
| 341 |
| 22,736 |
| |
| Non-agency RMBS | 620 |
| 31 |
| 13 |
| 638 |
| |
| Other RMBS | 517 |
| 4 |
| 8 |
| 513 |
| |
| Commercial MBS | 931 |
| 8 |
| 11 |
| 928 |
| |
| Agency commercial MBS | 6,505 |
| 28 |
| 84 |
| 6,449 |
| |
| CLOs | 2,593 |
| 6 |
| 1 |
| 2,598 |
| |
| Other asset-backed securities | 1,729 |
| 4 |
| 6 |
| 1,727 |
| |
| Foreign covered bonds | 2,126 |
| 24 |
| 9 |
| 2,141 |
| |
| Corporate bonds | 1,391 |
| 22 |
| 17 |
| 1,396 |
| |
| Sovereign debt/sovereign guaranteed | 12,248 |
| 261 |
| 20 |
| 12,489 |
| |
| Other debt securities | 1,952 |
| 19 |
| 10 |
| 1,961 |
| |
| Equity securities | 2 |
| 1 |
| — |
| 3 |
| |
| Money market funds | 842 |
| — |
| — |
| 842 |
| |
Non-agency RMBS (a) | 1,080 |
| 286 |
| 9 |
| 1,357 |
| |
Total securities available-for-sale (b) | $ | 73,596 |
| $ | 997 |
| $ | 771 |
| $ | 73,822 |
| |
| Held-to-maturity: | | |
| U.S. Treasury | $ | 11,117 |
| $ | 22 |
| $ | 41 |
| $ | 11,098 |
| |
| U.S. government agencies | 1,589 |
| — |
| 6 |
| 1,583 |
| |
| State and political subdivisions | 19 |
| — |
| 1 |
| 18 |
| |
| Agency RMBS | 25,221 |
| 57 |
| 299 |
| 24,979 |
| |
| Non-agency RMBS | 78 |
| 4 |
| 2 |
| 80 |
| |
| Other RMBS | 142 |
| — |
| 4 |
| 138 |
| |
| Commercial MBS | 7 |
| — |
| — |
| 7 |
| |
| Agency commercial MBS | 721 |
| 1 |
| 10 |
| 712 |
| |
| Foreign covered bonds | 74 |
| 1 |
| — |
| 75 |
| |
| Sovereign debt/sovereign guaranteed | 1,911 |
| 42 |
| — |
| 1,953 |
| |
| Other debt securities | 26 |
| — |
| — |
| 26 |
| |
| Total securities held-to-maturity | $ | 40,905 |
| $ | 127 |
| $ | 363 |
| $ | 40,669 |
| $ | 44,615 |
| $ | 1,383 |
| $ | 15 |
| $ | 45,983 |
|
| Total securities | $ | 114,501 |
| $ | 1,124 |
| $ | 1,134 |
| $ | 114,491 |
| $ | 151,283 |
| $ | 5,017 |
| $ | 250 |
| $ | 156,050 |
|
| |
| (a) | PreviouslyIncludes $538 million that was included in the former Grantor Trust. The Grantor Trust was dissolved in 2011. |
| |
| (b) | In the first quarter of 2020, we adopted new accounting guidance included in ASU 2016-13, Financial Instruments – Credit Losses: Measurement of Credit Losses on Financial Instruments, on a prospective basis. The allowance for credit loss on available-for-sale securities of $12 millionprimarily relates to CLOs. See Note 2 for additional information. |
| |
| (c) | Includes gross unrealized gains of $62$28 million and gross unrealized losses of $190$55 million recorded in accumulated other comprehensive income related to investment securities that were transferred from available-for-sale to held-to-maturity. The unrealized gains and losses are primarily related to Agency RMBS and will be amortized into net interest revenue over the contractual lives of the securities. |
|
| | | | | | | | | | | | |
| Securities at Dec. 31, 2019 | Gross unrealized | |
| | Amortized cost |
| Fair value |
|
| (in millions) | Gains |
| Losses |
|
| Available-for-sale: | | | | |
| Agency RMBS | $ | 27,022 |
| $ | 164 |
| $ | 143 |
| $ | 27,043 |
|
| U.S. Treasury | 14,979 |
| 472 |
| 20 |
| 15,431 |
|
| Sovereign debt/sovereign guaranteed | 12,548 |
| 109 |
| 11 |
| 12,646 |
|
| Agency commercial MBS | 9,231 |
| 203 |
| 17 |
| 9,417 |
|
| Foreign covered bonds | 4,189 |
| 15 |
| 7 |
| 4,197 |
|
| CLOs | 4,078 |
| 1 |
| 16 |
| 4,063 |
|
| Supranational | 3,697 |
| 18 |
| 6 |
| 3,709 |
|
| Foreign government agencies | 2,638 |
| 7 |
| 2 |
| 2,643 |
|
| Non-agency commercial MBS | 2,134 |
| 46 |
| 2 |
| 2,178 |
|
| Other ABS | 2,141 |
| 7 |
| 5 |
| 2,143 |
|
| U.S. government agencies | 1,890 |
| 61 |
| 2 |
| 1,949 |
|
Non-agency RMBS (a) | 1,038 |
| 202 |
| 7 |
| 1,233 |
|
| State and political subdivisions | 1,017 |
| 27 |
| — |
| 1,044 |
|
| Corporate bonds | 832 |
| 21 |
| — |
| 853 |
|
| Other debt securities | 1 |
| — |
| — |
| 1 |
|
Total securities available-for-sale (b) | $ | 87,435 |
| $ | 1,353 |
| $ | 238 |
| $ | 88,550 |
|
| Held-to-maturity: | | | | |
| Agency RMBS | $ | 27,357 |
| $ | 292 |
| $ | 46 |
| $ | 27,603 |
|
| U.S. Treasury | 3,818 |
| 28 |
| 3 |
| 3,843 |
|
| Agency commercial MBS | 1,326 |
| 21 |
| 3 |
| 1,344 |
|
| U.S. government agencies | 1,023 |
| 1 |
| 2 |
| 1,022 |
|
| Sovereign debt/sovereign guaranteed | 756 |
| 31 |
| — |
| 787 |
|
| Non-agency RMBS | 80 |
| 4 |
| 1 |
| 83 |
|
| Foreign covered bonds | 79 |
| — |
| — |
| 79 |
|
| Supranational | 27 |
| — |
| — |
| 27 |
|
| State and political subdivisions | 17 |
| — |
| — |
| 17 |
|
| Total securities held-to-maturity | $ | 34,483 |
| $ | 377 |
| $ | 55 |
| $ | 34,805 |
|
| Total securities | $ | 121,918 |
| $ | 1,730 |
| $ | 293 |
| $ | 123,355 |
|
| |
| (a) | Includes $640 million that was included in the former Grantor Trust. |
| |
| (b) | Includes gross unrealized gains of $32 million and gross unrealized losses of $65 million recorded in accumulated other comprehensive income related to securities that were transferred from available-for-sale to held-to-maturity. The unrealized gains and losses are primarily related to Agency RMBS and will be amortized into net interest revenue over the contractual lives of the securities. |
The following table presents the gross securitiesrealized gains, losses and impairments.impairments, on a gross basis.
|
| | | | | | | | | | | | | | | |
| Net securities gains (losses) | | | | |
| (in millions) | 2Q20 |
| 1Q20 |
| 2Q19 |
| YTD20 |
| YTD19 |
|
| Realized gross gains | $ | 16 |
| $ | 12 |
| $ | 12 |
| $ | 28 |
| $ | 17 |
|
| Realized gross losses | (7 | ) | (3 | ) | (5 | ) | (10 | ) | (9 | ) |
| Recognized gross impairments | — |
| — |
| — |
| — |
| — |
|
| Total net securities gains | $ | 9 |
| $ | 9 |
| $ | 7 |
| $ | 18 |
| $ | 8 |
|
|
| | | | | | | | | | | | | | | |
| Net securities gains (losses) | | | |
| (in millions) | 3Q17 |
| 2Q17 |
| 3Q16 |
| YTD17 |
| YTD16 |
|
| Realized gross gains | $ | 20 |
| $ | 3 |
| $ | 26 |
| $ | 34 |
| $ | 71 |
|
| Realized gross losses | — |
| (2 | ) | (1 | ) | (2 | ) | (1 | ) |
| Recognized gross impairments | (1 | ) | (1 | ) | (1 | ) | (3 | ) | (5 | ) |
| Total net securities gains | $ | 19 |
| $ | — |
| $ | 24 |
| $ | 29 |
| $ | 65 |
|
|
|
Notes to Consolidated Financial Statements(continued) |
|
The following table presents pre-tax net securities gains by type.
|
| | | | | | | | | | | | | | | |
| Net securities gains | | | |
| (in millions) | 2Q20 |
| 1Q20 |
| 2Q19 |
| YTD20 |
| YTD19 |
|
| Supranational | $ | 6 |
| $ | — |
| $ | — |
| $ | 6 |
| $ | — |
|
| U.S. Treasury | 1 |
| 5 |
| 3 |
| 6 |
| 4 |
|
| Other | 2 |
| 4 |
| 4 |
| 6 |
| 4 |
|
| Total net securities gains | $ | 9 |
| $ | 9 |
| $ | 7 |
| $ | 18 |
| $ | 8 |
|
Allowance for credit losses - Securities
In September 2017, other residential mortgage-backedthe first quarter of 2020, we adopted new accounting guidance included in ASU 2016-13, Financial Instruments – Credit Losses: Measurement of Credit Losses on Financial Instruments, on a prospective basis. The allowance for credit losses related to securities with an aggregate amortized costwas $7 million on Jan. 1, 2020 and $12 million at June 30, 2020. The increase reflects additional credit deterioration in the available-for-sale CLO portfolio. For additional information about the review of $74 millionsecurities under previous other-than-temporary impairment guidance, refer to Notes 1 and fair value of $76 million were transferred from held-to-maturity securities4, both Notes to available-for-sale securities. Due to recent ratings downgrades, the Company no longer intends to hold these securities to maturity.Consolidated Financial Statements, in our 2019 Annual Report.
Temporarily impaired securities
Credit quality indicators - Securities
At Sept.June 30, 2017,2020, the gross unrealized losses on the investment securities portfolio were primarily attributable to an increase in interest ratescredit spreads from the date of purchase, and for certain securities that were transferred from available-for-sale to held-to-maturity, an increase in interest rates through the date they were transferred. Specifically, $155$55 million of the unrealized losses at Sept.June 30, 20172020 and $190$65 million at Dec. 31, 20162019 reflected in the available-for-sale sections of the tables below relate to certain securities (primarily Agency RMBS) that were transferred in prior periods from available-for-sale to held-to-maturity. The unrealized losses will be amortized into net interest revenue over the contractual lives of the securities. The transfer created a new cost basis for the securities. As a result, if these securities have experienced unrealized losses since the date of transfer, the corresponding fair value and unrealized losses would be reflected in the held-to-maturity sections of the following tables. We do not intend to sell these securities, and it is not more likely than not that we will have to sell these securities.
|
|
Notes to Consolidated Financial Statements(continued) |
| |
The following tables showtable shows the aggregate related fair value of investmentsavailable-for-sale securities with a continuous unrealized loss position for less than 12 months and those that have been in a continuous unrealized loss position for 12 months or more at Sept. 30, 2017 and Dec. 31, 2016.without an allowance for credit losses.
|
| | | | | | | | | | | | | | | | | | | | |
| Temporarily impaired securities at Sept. 30, 2017 | Less than 12 months | | 12 months or more | | Total |
| (in millions) | Fair
value |
| Unrealized
losses |
| | Fair
value |
| Unrealized
losses |
| | Fair
value |
| Unrealized
losses |
|
| Available-for-sale: | | | | | | | | |
| U.S. Treasury | $ | 7,900 |
| $ | 111 |
| | $ | 495 |
| $ | 12 |
| | $ | 8,395 |
| $ | 123 |
|
| U.S. government agencies | 399 |
| 6 |
| | — |
| — |
| | 399 |
| 6 |
|
| State and political subdivisions | 310 |
| 4 |
| | 384 |
| 20 |
| | 694 |
| 24 |
|
| Agency RMBS | 8,935 |
| 72 |
| | 4,145 |
| 178 |
| | 13,080 |
| 250 |
|
| Non-agency RMBS | 5 |
| — |
| | 156 |
| 3 |
| | 161 |
| 3 |
|
| Other RMBS | 72 |
| 4 |
| | 83 |
| 4 |
| | 155 |
| 8 |
|
| Commercial MBS | 193 |
| 2 |
| | 92 |
| 2 |
| | 285 |
| 4 |
|
| Agency commercial MBS | 3,610 |
| 47 |
| | 561 |
| 10 |
| | 4,171 |
| 57 |
|
| CLOs | 449 |
| 1 |
| | — |
| — |
| | 449 |
| 1 |
|
| Foreign covered bonds | 1,017 |
| 7 |
| | 28 |
| — |
| | 1,045 |
| 7 |
|
| Corporate bonds | 306 |
| 3 |
| | 144 |
| 5 |
| | 450 |
| 8 |
|
| Sovereign debt/sovereign guaranteed | 2,263 |
| 20 |
| | 137 |
| 3 |
| | 2,400 |
| 23 |
|
| Other debt securities | 1,347 |
| 9 |
| | 84 |
| 1 |
| | 1,431 |
| 10 |
|
Non-agency RMBS (a) | 8 |
| 2 |
| | 13 |
| 2 |
| | 21 |
| 4 |
|
Total securities available-for-sale (b) | $ | 26,814 |
| $ | 288 |
| | $ | 6,322 |
| $ | 240 |
| | $ | 33,136 |
| $ | 528 |
|
| Held-to-maturity: | | | | | | | | |
| U.S. Treasury | $ | 7,281 |
| $ | 29 |
| | $ | — |
| $ | — |
| | $ | 7,281 |
| $ | 29 |
|
| U.S. government agencies | 1,459 |
| 5 |
| | 99 |
| 1 |
| | 1,558 |
| 6 |
|
| State and political subdivisions | — |
| — |
| | 4 |
| 1 |
| | 4 |
| 1 |
|
| Agency RMBS | 17,125 |
| 172 |
| | 847 |
| 13 |
| | 17,972 |
| 185 |
|
| Other RMBS | 15 |
| — |
| | 35 |
| 1 |
| | 50 |
| 1 |
|
| Agency commercial MBS | 557 |
| 5 |
| | — |
| — |
| | 557 |
| 5 |
|
| Total securities held-to-maturity | $ | 26,437 |
| $ | 211 |
| | $ | 985 |
| $ | 16 |
| | $ | 27,422 |
| $ | 227 |
|
| Total temporarily impaired securities | $ | 53,251 |
| $ | 499 |
| | $ | 7,307 |
| $ | 256 |
| | $ | 60,558 |
| $ | 755 |
|
|
| | | | | | | | | | | | | | | | | | | | |
Available-for-sale securities in an unrealized loss position at June 30, 2020 (a) | Less than 12 months | | 12 months or more | | Total |
Fair value |
| Unrealized losses |
| | Fair value |
| Unrealized losses |
| | Fair value |
| Unrealized losses |
|
| (in millions) | | |
| Agency RMBS | $ | 2,809 |
| $ | 5 |
| | $ | 6,030 |
| $ | 79 |
| | $ | 8,839 |
| $ | 84 |
|
| Sovereign debt/sovereign guaranteed | 1,952 |
| 2 |
| | 110 |
| — |
| | 2,062 |
| 2 |
|
| Agency commercial MBS | 266 |
| — |
| | 350 |
| 2 |
| | 616 |
| 2 |
|
| Foreign covered bonds | 1,003 |
| 2 |
| | 281 |
| 1 |
| | 1,284 |
| 3 |
|
| Supranational | 931 |
| 1 |
| | 233 |
| — |
| | 1,164 |
| 1 |
|
| CLOs | 3,522 |
| 68 |
| | 575 |
| 19 |
| | 4,097 |
| 87 |
|
| U.S. government agencies | 79 |
| 2 |
| | — |
| — |
| | 79 |
| 2 |
|
| Other ABS | 760 |
| 6 |
| | 203 |
| 4 |
| | 963 |
| 10 |
|
| Non-agency commercial MBS | 476 |
| 15 |
| | 39 |
| 1 |
| | 515 |
| 16 |
|
Non-agency RMBS (b) | 508 |
| 7 |
| | 96 |
| 7 |
| | 604 |
| 14 |
|
| State and political subdivisions | 79 |
| 2 |
| | 2 |
| — |
| | 81 |
| 2 |
|
Total securities available-for-sale (c) | $ | 12,385 |
| $ | 110 |
| | $ | 7,919 |
| $ | 113 |
| | $ | 20,304 |
| $ | 223 |
|
| |
| (a) | Previously included in the Grantor Trust. The Grantor Trust was dissolved in 2011.Includes $530 million of securities with an unrealized loss of greater than $1 million. |
| |
| (b) | GrossIncludes $42 million of securities with an unrealized lossesloss of $1 million for less than 12 months and $1 million of securities with an unrealized loss of less than $1 million for 12 months or more that were included in the former Grantor Trust. |
| |
| (c) | Includes gross unrealized losses of $155$55 million werefor 12 months or more recorded in accumulated other comprehensive income and related to investment securities that were transferred from available-for-sale to held-to-maturity. The unrealized losses are primarily related to Agency RMBS and will be amortized into net interest revenue over the contractual lives of the securities. There were no0 gross unrealized losses for less than 12 months. |
The following table presents the temporarily impaired securities under the disclosure guidance that existed prior to the adoption of ASU 2016-13 and shows the aggregate fair value of available-for-sale securities with a continuous unrealized loss position for less than 12 months and those that have been in a continuous unrealized loss position for 12 months or more. |
|
Notes to Consolidated Financial Statements(continued)
|
|
| | | Temporarily impaired securities at Dec. 31, 2016 | Less than 12 months | | 12 months or more | | Total | |
| Temporarily impaired securities at Dec. 31, 2019 | | Less than 12 months | | 12 months or more | | Total |
| (in millions) | Fair value |
| Unrealized losses |
| | Fair value |
| Unrealized losses |
| | Fair value |
| Unrealized losses |
| Fair value |
| Unrealized losses |
| | Fair value |
| Unrealized losses |
| | Fair value |
| Unrealized losses |
|
| Available-for-sale: | | | | | | | | | | |
| Agency RMBS | | $ | 8,373 |
| $ | 33 |
| | $ | 5,912 |
| $ | 110 |
| | $ | 14,285 |
| $ | 143 |
|
| U.S. Treasury | $ | 8,489 |
| $ | 181 |
| | $ | — |
| $ | — |
| | $ | 8,489 |
| $ | 181 |
| 1,976 |
| 16 |
| | 766 |
| 4 |
| | 2,742 |
| 20 |
|
| Sovereign debt/sovereign guaranteed | | 4,045 |
| 10 |
| | 225 |
| 1 |
| | 4,270 |
| 11 |
|
| Agency commercial MBS | | 1,960 |
| 12 |
| | 775 |
| 5 |
| | 2,735 |
| 17 |
|
| Foreign covered bonds | | 1,009 |
| 4 |
| | 690 |
| 3 |
| | 1,699 |
| 7 |
|
| CLOs | | 1,066 |
| 2 |
| | 1,499 |
| 14 |
| | 2,565 |
| 16 |
|
| Supranational | | 1,336 |
| 6 |
| | 360 |
| — |
| | 1,696 |
| 6 |
|
| Foreign government agencies | | 1,706 |
| 2 |
| | 47 |
| — |
| | 1,753 |
| 2 |
|
| Non-agency commercial MBS | | 525 |
| 2 |
| | 45 |
| — |
| | 570 |
| 2 |
|
| Other ABS | | 456 |
| 3 |
| | 305 |
| 2 |
| | 761 |
| 5 |
|
| U.S. government agencies | 257 |
| 9 |
| | — |
| — |
| | 257 |
| 9 |
| 377 |
| 2 |
| | — |
| — |
| | 377 |
| 2 |
|
Non-agency RMBS (a) | | 101 |
| — |
| | 113 |
| 7 |
| | 214 |
| 7 |
|
| State and political subdivisions | 1,058 |
| 33 |
| | 131 |
| 19 |
| | 1,189 |
| 52 |
| — |
| — |
| | 16 |
| — |
| | 16 |
| — |
|
| Agency RMBS | 14,766 |
| 141 |
| | 1,673 |
| 200 |
| | 16,439 |
| 341 |
| |
| Non-agency RMBS | 21 |
| — |
| | 332 |
| 13 |
| | 353 |
| 13 |
| |
| Other RMBS | 26 |
| — |
| | 136 |
| 8 |
| | 162 |
| 8 |
| |
| Commercial MBS | 302 |
| 7 |
| | 163 |
| 4 |
| | 465 |
| 11 |
| |
| Agency commercial MBS | 3,570 |
| 78 |
| | 589 |
| 6 |
| | 4,159 |
| 84 |
| |
| CLOs | 443 |
| 1 |
| | 404 |
| — |
| | 847 |
| 1 |
| |
| Other asset-backed securities | 276 |
| 1 |
| | 357 |
| 5 |
| | 633 |
| 6 |
| |
| Foreign covered bonds | 712 |
| 9 |
| | — |
| — |
| | 712 |
| 9 |
| |
| Corporate bonds | 594 |
| 16 |
| | 7 |
| 1 |
| | 601 |
| 17 |
| 82 |
| — |
| | 21 |
| — |
| | 103 |
| — |
|
| Sovereign debt/sovereign guaranteed | 1,521 |
| 20 |
| | 63 |
| — |
| | 1,584 |
| 20 |
| |
| Other debt securities | 742 |
| 10 |
| | 50 |
| — |
| | 792 |
| 10 |
| |
Non-agency RMBS (a) | 25 |
| — |
| | 47 |
| 9 |
| | 72 |
| 9 |
| |
Total securities available-for-sale (b) | $ | 32,802 |
| $ | 506 |
|
| $ | 3,952 |
| $ | 265 |
|
| $ | 36,754 |
| $ | 771 |
| $ | 23,012 |
| $ | 92 |
| | $ | 10,774 |
| $ | 146 |
| | $ | 33,786 |
| $ | 238 |
|
| Held-to-maturity: | | | | | | |
| U.S. Treasury | $ | 6,112 |
| $ | 41 |
| | $ | — |
| $ | — |
| | $ | 6,112 |
| $ | 41 |
| |
| U.S. government agencies | 1,533 |
| 6 |
| | — |
| — |
| | 1,533 |
| 6 |
| |
| State and political subdivisions | — |
| — |
| | 4 |
| 1 |
| | 4 |
| 1 |
| |
| Agency RMBS | 19,498 |
| 297 |
| | 102 |
| 2 |
| | 19,600 |
| 299 |
| |
| Non-agency RMBS | 4 |
| — |
| | 48 |
| 2 |
| | 52 |
| 2 |
| |
| Other RMBS | 15 |
| — |
| | 123 |
| 4 |
| | 138 |
| 4 |
| |
| Agency commercial MBS | 621 |
| 10 |
| | — |
| — |
| | 621 |
| 10 |
| |
| Total securities held-to-maturity | $ | 27,783 |
| $ | 354 |
|
| $ | 277 |
| $ | 9 |
|
| $ | 28,060 |
| $ | 363 |
| |
| Total temporarily impaired securities | $ | 60,585 |
| $ | 860 |
|
| $ | 4,229 |
| $ | 274 |
|
| $ | 64,814 |
| $ | 1,134 |
| |
| |
| (a) | PreviouslyIncludes $2 million of securities with an unrealized loss of less than $1 million for less than 12 months and $2 million of securities with an unrealized loss of less than $1 million for 12 months or more that were included in the former Grantor Trust. The Grantor Trust was dissolved in 2011. |
| |
| (b) | Includes gross unrealized losses of $65 million for 12 months or more of $190 million recorded in accumulated other comprehensive income related to investment securities that were transferred from available-for-sale to held-to-maturity. The unrealized losses are primarily related to Agency RMBS and will be amortized into net interest revenue over the contractual lives of the securities. There were no0 gross unrealized losses for less than 12 months. |
|
|
Notes to Consolidated Financial Statements(continued) |
|
The following table shows the credit quality of the held-to-maturity securities. We have included certain credit ratings information because the information can indicate the degree of credit risk to which we are exposed. Significant changes in ratings classifications could indicate increased credit risk for us and could be accompanied by a reduction in the fair value of our securities portfolio.
|
| | | | | | | | | | | | | | | | | | | | |
Held-to-maturity securities portfolio at June 30, 2020 (a) | | | | Ratings (b) |
| | | | Net unrealized gain |
| | | | | BB+
and
lower | A1+/A2/SP-1+
| |
| (dollars in millions) | Amortized
cost |
| | | AAA/
AA- | A+/
A- | BBB+/
BBB- | Not
rated |
| Agency RMBS | $ | 32,869 |
| | $ | 1,099 |
| | 100 | % | — | % | — | % | — | % | — | % | — | % |
| U.S. Treasury | 4,687 |
| | 113 |
| | 100 |
| — |
| — |
| — |
| — |
| — |
|
| U.S. government agencies | 2,349 |
| | 3 |
| | 100 |
| — |
| — |
| — |
| — |
| — |
|
| Agency commercial MBS | 1,982 |
| | 108 |
| | 100 |
| — |
| — |
| — |
| — |
| — |
|
| Commercial paper/CDs | 1,537 |
| | 2 |
| | — |
| — |
| — |
| — |
| 100 |
| — |
|
Sovereign debt/sovereign guaranteed (c) | 974 |
| | 41 |
| | 100 |
| — |
| — |
| — |
| — |
| — |
|
Foreign covered bonds (d) | 79 |
| | — |
| | 100 |
| — |
| — |
| — |
| — |
| — |
|
| Non-agency RMBS | 73 |
| | 1 |
| | 42 |
| 43 |
| 2 |
| 12 |
| — |
| 1 |
|
| Supranational | 49 |
| | — |
| | 100 |
| — |
| — |
| — |
| — |
| — |
|
| State and political subdivisions | 16 |
| | 1 |
| | 6 |
| 2 |
| 6 |
| — |
| — |
| 86 |
|
| Total held-to-maturity securities | $ | 44,615 |
| | $ | 1,368 |
| | 96 | % | 1 | % | — | % | — | % | 3 | % | — | % |
| |
| (a) | In the first quarter of 2020, we adopted new accounting guidance included in ASU 2016-13, Financial Instruments – Credit Losses: Measurement of Credit Losses on Financial Instruments, on a prospective basis. See Note 2 for additional information. |
| |
| (b) | Represents ratings by Standard & Poor’s (“S&P”) or the equivalent. |
| |
| (c) | Primarily consists of exposure to France, UK and Germany. |
| |
| (d) | Primarily consists of exposure to Canada. |
Maturity distribution
The following table shows the maturity distribution by carrying amount and yield (on a tax equivalent basis) of our investment securities portfolio at Sept. 30, 2017.portfolio.
| | | Maturity distribution and yield on investment securities at Sept. 30, 2017 | U.S. Treasury | | U.S. government agencies | | State and political subdivisions | | Other bonds, notes and debentures | | Mortgage/ asset-backed and equity securities | | | |
| Maturity distribution and yields on securities at June 30, 2020 | | U.S. Treasury | | U.S. government agencies | | State and political subdivisions | | Other bonds, notes and debentures | | Mortgage/ asset-backed | | |
| (dollars in millions) | Amount |
| Yield (a) |
| | Amount |
| Yield (a) |
| | Amount |
| Yield (a) |
| | Amount |
| Yield (a) |
| | Amount |
| Yield (a) |
| | Total |
| Amount |
| Yield (a) |
| | Amount |
| Yield (a) |
| | Amount |
| Yield (a) |
| | Amount |
| Yield (a) |
| | Amount |
| Yield (a) |
| | Total |
|
| Securities available-for-sale: | | | | | | | | | | | | | | | | | | | | | | | | | | | | | | | | |
| One year or less | $ | 2,223 |
| 1.02 | % | | $ | — |
| — | % | | $ | 438 |
| 2.60 | % | | $ | 3,852 |
| 1.01 | % | | $ | — |
| — | % | | $ | 6,513 |
| $ | 5,348 |
| 0.50 | % | | $ | 25 |
| 2.55 | % | | $ | 178 |
| 2.92 | % | | $ | 13,826 |
| 0.71 | % | | $ | — |
| — | % | | $ | 19,377 |
|
| Over 1 through 5 years | 5,790 |
| 1.66 |
| | 174 |
| 1.29 |
| | 1,576 |
| 3.07 |
| | 12,648 |
| 0.99 |
| | — |
| — |
| | 20,188 |
| 10,350 |
| 1.52 |
| | 1,038 |
| 1.22 |
| | 646 |
| 3.29 |
| | 16,098 |
| 0.68 |
| | — |
| — |
| | 28,132 |
|
| Over 5 through 10 years | 4,002 |
| 1.90 |
| | 690 |
| 2.46 |
| | 912 |
| 3.34 |
| | 2,835 |
| 0.81 |
| | — |
| — |
| | 8,439 |
| 6,171 |
| 1.67 |
| | 1,623 |
| 2.56 |
| | 107 |
| 2.42 |
| | 2,838 |
| 0.53 |
| | — |
| — |
| | 10,739 |
|
| Over 10 years | 3,487 |
| 3.11 |
| | — |
| — |
| | 198 |
| 2.36 |
| | 198 |
| 1.64 |
| | — |
| — |
| | 3,883 |
| 3,268 |
| 3.11 |
| | 120 |
| 2.06 |
| | 248 |
| 2.37 |
| | 355 |
| 0.97 |
| | — |
| — |
| | 3,991 |
|
| Mortgage-backed securities | — |
| — |
| | — |
| — |
| | — |
| — |
| | — |
| — |
| | 36,381 |
| 2.78 |
| | 36,381 |
| — |
| — |
| | — |
| — |
| | — |
| — |
| | — |
| — |
| | 40,653 |
| 2.24 |
| | 40,653 |
|
| Asset-backed securities | — |
| — |
| | — |
| — |
| | — |
| — |
| | — |
| — |
| | 3,707 |
| 2.32 |
| | 3,707 |
| — |
| — |
| | — |
| — |
| | — |
| — |
| | — |
| — |
| | 7,175 |
| 2.18 |
| | 7,175 |
|
Equity securities (b) | — |
| — |
| | — |
| — |
| | — |
| — |
| | — |
| — |
| | 943 |
| — |
| | 943 |
| |
| Total | $ | 15,502 |
| 1.96 | % | | $ | 864 |
| 2.23 | % | | $ | 3,124 |
| 3.04 | % | | $ | 19,533 |
| 0.97 | % | | $ | 41,031 |
| 2.68 | % | | $ | 80,054 |
| $ | 25,137 |
| 1.54 | % | | $ | 2,806 |
| 2.04 | % | | $ | 1,179 |
| 2.96 | % | | $ | 33,117 |
| 0.69 | % | | $ | 47,828 |
| 2.23 | % | | $ | 110,067 |
|
| Securities held-to-maturity: | | | | | | | | | | | | | | | | | | | | | | | | | | | | | | | | |
| One year or less | $ | 4,943 |
| 0.97 | % | | $ | 731 |
| 0.99 | % | | $ | — |
| — | % | | $ | 700 |
| 0.60 | % | | $ | — |
| — | % | | $ | 6,374 |
| $ | 1,899 |
| 0.41 | % | | $ | — |
| — | % | | $ | — |
| — | % | | $ | 1,646 |
| 1.21 | % | | $ | — |
| — | % | | $ | 3,545 |
|
| Over 1 through 5 years | 3,517 |
| 1.67 |
| | 883 |
| 1.38 |
| | 2 |
| 6.88 |
| | 307 |
| 0.59 |
| | — |
| — |
| | 4,709 |
| 2,788 |
| 1.91 |
| | 1,696 |
| 1.12 |
| | 3 |
| 5.66 |
| | 919 |
| 0.66 |
| | — |
| — |
| | 5,406 |
|
| Over 5 through 10 years | 1,407 |
| 1.92 |
| | — |
| — |
| | 2 |
| 6.86 |
| | 661 |
| 0.73 |
| | — |
| — |
| | 2,070 |
| — |
| — |
| | 212 |
| 1.98 |
| | — |
| — |
| | 31 |
| 0.92 |
| | — |
| — |
| | 243 |
|
| Over 10 years | — |
| — |
| | — |
| — |
| | 14 |
| 5.32 |
| | — |
| — |
| | — |
| — |
| | 14 |
| — |
| — |
| | 441 |
| 2.33 |
| | 13 |
| 4.76 |
| | 43 |
| 0.35 |
| | — |
| — |
| | 497 |
|
| Mortgage-backed securities | — |
| — |
| | — |
| — |
| | — |
| — |
| | — |
| — |
| | 26,828 |
| 2.80 |
| | 26,828 |
| — |
| — |
| | — |
| — |
| | — |
| — |
| | — |
| — |
| | 34,924 |
| 2.87 |
| | 34,924 |
|
| Total | $ | 9,867 |
| 1.36 | % | | $ | 1,614 |
| 1.20 | % | | $ | 18 |
| 5.64 | % | | $ | 1,668 |
| 0.65 | % | | $ | 26,828 |
| 2.80 | % | | $ | 39,995 |
| $ | 4,687 |
| 1.32 | % | | $ | 2,349 |
| 1.42 | % | | $ | 16 |
| 4.91 | % | | $ | 2,639 |
| 1.00 | % | | $ | 34,924 |
| 2.87 | % | | $ | 44,615 |
|
| |
| (a) | Yields are based upon the amortized cost of securities. |
| |
(b) | Includes money market funds. |
|
|
Notes to Consolidated Financial Statements(continued) |
| |
Other-than-temporary impairment
We conduct periodic reviews of all securities to determine whether OTTI has occurred. Such reviews may incorporate the use of economic models. Various inputs to the economic models are used to determine if an unrealized loss on securities is other-than-temporary. For example, the most significant inputs related to non-agency RMBS are:
Default rate - the number of mortgage loans expected to go into default over the life of the transaction, which is driven by the roll rate of loans in each performance bucket that will ultimately migrate to default; and
Severity - the loss expected to be realized when a loan defaults.
To determine if an unrealized loss is other-than-temporary, we project total estimated defaults of the underlying assets (mortgages) and multiply that calculated amount by an estimate of realizable value upon sale of these assets in the marketplace (severity) in order to determine the projected collateral loss. In determining estimated default rate and severity assumptions, we review the performance of the underlying securities, industry studies and market forecasts, as well as our view of the economic outlook affecting collateral. We also evaluate the current credit enhancement underlying the bond to determine the impact on cash flows. If we determine that a given security will be subject to a write-down or loss, we record the expected credit loss as a charge to earnings.
The table below shows the projected weighted-average default rates and loss severities for the 2007, 2006 and late 2005 non-agency RMBS and the securities previously held in the Grantor Trust that we established in connection with the restructuring of our investment securities portfolio in 2009, at Sept. 30, 2017 and Dec. 31, 2016.
|
| | | | | | | | | |
| Projected weighted-average default rates and loss severities |
| | Sept. 30, 2017 | | Dec. 31, 2016 |
| | Default rate |
| Severity |
| | Default rate |
| Severity |
|
| Alt-A | 22 | % | 54 | % | | 30 | % | 54 | % |
| Subprime | 38 | % | 66 | % | | 49 | % | 70 | % |
| Prime | 13 | % | 39 | % | | 18 | % | 39 | % |
The following table presents pre-tax net securities gains (losses) by type.
|
| | | | | | | | | | | | | | | |
| Net securities gains (losses) | | | | |
| (in millions) | 3Q17 |
| 2Q17 |
| 3Q16 |
| YTD17 |
| YTD16 |
|
| Agency RMBS | $ | 4 |
| $ | — |
| $ | 9 |
| $ | 5 |
| $ | 22 |
|
| U.S. Treasury | 1 |
| (1 | ) | (1 | ) | — |
| 4 |
|
| Foreign covered bonds | — |
| — |
| — |
| — |
| 10 |
|
| Non-agency RMBS | (1 | ) | — |
| (1 | ) | (2 | ) | 1 |
|
| Other | 15 |
| 1 |
| 17 |
| 26 |
| 28 |
|
| Total net securities gains | $ | 19 |
| $ | — |
| $ | 24 |
| $ | 29 |
| $ | 65 |
|
The following tables reflect investment securities credit losses recorded in earnings. The beginning balance represents the credit loss component for which OTTI occurred on debt securities in prior periods. The additions represent the first time a debt security was credit impaired or when subsequent credit impairments have occurred. The deductions represent credit losses on securities that have been sold, are required to be sold, or for which it is our intention to sell.
|
| | | | | | |
| Debt securities credit loss roll forward | | |
| (in millions) | 3Q17 |
| 3Q16 |
|
| Beginning balance as of June 30 | $ | 85 |
| $ | 91 |
|
| Add: Initial OTTI credit losses | — |
| — |
|
| Subsequent OTTI credit losses | 1 |
| 1 |
|
| Less: Realized losses for securities sold | 2 |
| 5 |
|
| Ending balance as of Sept. 30 | $ | 84 |
| $ | 87 |
|
|
| | | | | | |
| Debt securities credit loss roll forward | | |
| (in millions) | YTD17 |
| YTD16 |
|
| Beginning balance as of Jan. 1 | $ | 88 |
| $ | 91 |
|
| Add: Initial OTTI credit losses | — |
| — |
|
| Subsequent OTTI credit losses | 3 |
| 5 |
|
| Less: Realized losses for securities sold | 7 |
| 9 |
|
| Ending balance as of Sept. 30 | $ | 84 |
| $ | 87 |
|
Pledged assets
At Sept.June 30, 2017,2020, BNY Mellon had pledged assets of $108$139 billion, including $87$109 billion pledged as collateral for potential borrowings at the Federal Reserve Discount Window and $4$6 billion pledged as collateral for borrowing at the Federal Home Loan Bank. The components of the assets pledged at Sept.June 30, 20172020 included $92$121 billion of securities, $13$12 billion of loans, $2$5 billion of trading assets and $1 billion of interest-bearing deposits with banks.
|
|
Notes to Consolidated Financial Statements(continued)
|
|
If there has been no borrowing at the Federal Reserve Discount Window, the Federal Reserve generally allows banks to freely move assets in and out of their pledged assets account to sell or repledge the assets for other purposes. BNY Mellon regularly moves assets in and out of its pledged assets account at the Federal Reserve.
At Dec. 31, 2016,2019, BNY Mellon had pledged assets of $102$118 billion, including $84$80 billion pledged as collateral for potential borrowing at the Federal Reserve Discount Window.Window and $6 billion pledged as collateral for borrowing at the Federal Home Loan Bank. The components of the assets pledged at Dec. 31, 20162019 included $87$98 billion of securities, $8$13 billion of loans, $4$7 billion of trading assets and less than $1 billion of interest-bearing deposits with banks and $3 billion of trading assets.banks.
At Sept.June 30, 20172020 and Dec. 31, 2016,2019, pledged assets included $13$21 billion and $6$29 billion, respectively, for which the recipients were permitted to sell or repledge the assets delivered.
At June 30, 2020, we pledged commercial paper and CDs totaling $1.5 billion as collateral to the Federal Reserve Bank of Boston to secure non-recourse borrowings under the Federal Reserve’s Money Market Mutual Fund Liquidity Facility (“MMLF”) program.
We also obtain securities as collateral, including receipts under resale agreements, securities borrowed, derivative contracts and custody agreements, on terms which permit us to sell or repledge the securities to others. At Sept.June 30, 20172020 and Dec. 31, 2016,2019, the market value of the securities received that can be sold or repledged was $68$107 billion and $50$153 billion, respectively. We routinely sell or repledge these securities through delivery to third parties. As of Sept.June 30, 20172020 and Dec. 31, 2016,2019, the market value
of securities collateral sold or repledged was $39$72 billion and $20$107 billion, respectively.
Restricted cash and securities
Cash and securities may also be segregated under federal and other regulations or requirements. At Sept.both June 30, 20172020 and Dec. 31, 2016,2019, cash segregated under federal and other regulations or requirements was $4 billion and $3 billion, respectively.$2 billion. Restricted cash is included in interest-bearing deposits with banks on the consolidated balance sheet. Securities segregated for these purposesunder federal and other regulations or requirements were $2$6 billion at Sept.June 30, 20172020 and $2$1 billion at Dec. 31, 2016.2019. Restricted securities were sourced from securities purchased under resale agreements at Sept. 30, 2017 and Dec. 31, 2016 and are included in federal funds sold and securities purchased under resale agreements on the consolidated balance sheet.
Note 5 - 5–Loans and asset quality
Loans
The table below provides the details of our loan portfolio and industry concentrations of credit risk at Sept. 30, 2017 and Dec. 31, 2016.portfolio.
| | | Loans | Sept. 30, 2017 |
| Dec. 31, 2016 |
| June 30, 2020 |
| Dec. 31, 2019 |
|
| (in millions) |
| Domestic: | | |
| Commercial | | $ | 2,192 |
| $ | 1,442 |
|
| Commercial real estate | | 6,217 |
| 5,575 |
|
| Financial institutions | $ | 5,155 |
| $ | 6,342 |
| 3,804 |
| 4,852 |
|
| Commercial | 2,698 |
| 2,286 |
| |
| Lease financings | | 439 |
| 537 |
|
| Wealth management loans and mortgages | 16,161 |
| 15,555 |
| 15,753 |
| 16,050 |
|
| Commercial real estate | 4,921 |
| 4,639 |
| |
| Lease financings | 823 |
| 989 |
| |
| Other residential mortgages | 741 |
| 854 |
| 450 |
| 494 |
|
| Overdrafts | 1,487 |
| 1,055 |
| 1,073 |
| 524 |
|
| Other | 1,159 |
| 1,202 |
| 1,489 |
| 1,167 |
|
| Margin loans | 13,720 |
| 17,503 |
| 11,476 |
| 11,907 |
|
| Total domestic | 46,865 |
| 50,425 |
| 42,893 |
| 42,548 |
|
| Foreign: | | |
| Commercial | | 253 |
| 347 |
|
| Commercial real estate | | 11 |
| 7 |
|
| Financial institutions | 6,741 |
| 8,347 |
| 6,949 |
| 7,626 |
|
| Commercial | 305 |
| 331 |
| |
| Lease financings | | 589 |
| 576 |
|
| Wealth management loans and mortgages | 104 |
| 99 |
| 122 |
| 140 |
|
| Commercial real estate | 6 |
| 15 |
| |
| Lease financings | 522 |
| 736 |
| |
| Other (primarily overdrafts) | 4,373 |
| 4,418 |
| 3,147 |
| 2,230 |
|
| Margin loans | 152 |
| 87 |
| 1,433 |
| 1,479 |
|
| Total foreign | 12,203 |
| 14,033 |
| 12,504 |
| 12,405 |
|
Total loans (a) | $ | 59,068 |
| $ | 64,458 |
| $ | 55,397 |
| $ | 54,953 |
|
| |
| (a) | Net of unearned income of $414292 million at Sept.June 30, 20172020 and $527313 million at Dec. 31, 20162019 primarily onrelated to domestic and foreign lease financings. |
|
|
Notes to Consolidated Financial Statements(continued) |
|
Our loan portfolio consists of three3 portfolio segments: commercial, lease financings and mortgages. We manage our portfolio at the class level, which consists of six6 classes of financing receivables: commercial, commercial real estate, financial institutions, lease financings, wealth
management loans and mortgages, and other residential mortgages.
The following tables are presented for each class of financing receivablereceivables and provide additional information about our credit risks andrisks.
Allowance for credit losses
On Jan. 1, 2020, we adopted ASU 2016-13, Financial Instruments – Credit Losses: Measurement of Credit Losses on Financial Instruments, on a prospective basis. See Note 2 for the adequacy of oursignificant accounting policy related to allowance for credit losses.losses on loans and lending-related commitments.
Activity in the allowance for credit losses on loans and lending-related commitments is presented below.
|
| | | | | | | | | | | | | | | | | | | | | | |
| Allowance for credit losses activity for the quarter ended June 30, 2020 | Wealth management loans and mortgages |
| | Other residential mortgages |
| |
| (in millions) | Commercial |
| Commercial real estate |
| Financial institutions |
| Lease financings |
| Total |
|
| Beginning balance | $ | 26 |
| $ | 208 |
| $ | 18 |
| $ | 13 |
| $ | 9 |
| | $ | 14 |
| $ | 288 |
|
| Charge-offs | — |
| — |
| — |
| — |
| — |
| | — |
| — |
|
| Recoveries | — |
| — |
| — |
| — |
| — |
| | 3 |
| 3 |
|
| Net recoveries | — |
| — |
| — |
| — |
| — |
| | 3 |
| 3 |
|
| Provision | 14 |
| 164 |
| (2 | ) | (10 | ) | 2 |
| | (5 | ) | 163 |
|
Ending balance (a) | $ | 40 |
| $ | 372 |
| $ | 16 |
| $ | 3 |
| $ | 11 |
| | $ | 12 |
| $ | 454 |
|
| Allowance for: | | | | | | | | |
| Loan losses | $ | 23 |
| $ | 244 |
| $ | 11 |
| $ | 3 |
| $ | 9 |
| | $ | 12 |
| $ | 302 |
|
| Lending-related commitments | 17 |
| 128 |
| 5 |
| — |
| 2 |
| | — |
| 152 |
|
| Individually evaluated for impairment: | | | | | | | | |
| Loan balance | $ | — |
| $ | — |
| $ | — |
| $ | — |
| $ | 18 |
| (b) | $ | — |
| $ | 18 |
|
| Allowance for loan losses | — |
| — |
| — |
| — |
| — |
| | — |
| — |
|
| |
| (a) | Includes $11 million of allowance for credit losses related to foreign loans, primarily financial institutions. |
| |
| (b) | Includes collateral dependent loans of $18 million with $26 million of collateral at fair value. |
|
| | | | | | | | | | | | | | | | | | | | | | | | | | |
| Allowance for credit losses activity for the quarter ended March 31, 2020 | Wealth management loans and mortgages |
| | Other residential mortgages |
| | | |
| (in millions) | Commercial |
| Commercial real estate |
| Financial institutions |
| Lease financings |
| Foreign |
| (a) | Total |
|
| Balance at Dec. 31, 2019 | $ | 60 |
| $ | 76 |
| $ | 20 |
| $ | 3 |
| $ | 20 |
| | $ | 13 |
| $ | 24 |
| | $ | 216 |
|
| Impact of adopting ASU 2016-13 | (43 | ) | 14 |
| (6 | ) | — |
| (12 | ) | | 2 |
| (24 | ) | | (69 | ) |
| Balance at Jan. 1, 2020 | 17 |
| 90 |
| 14 |
| 3 |
| 8 |
| | 15 |
| — |
| | 147 |
|
| Charge-offs | — |
| — |
| — |
| — |
| — |
| | — |
| — |
| | — |
|
| Recoveries | — |
| — |
| — |
| — |
| — |
| | — |
| — |
| | — |
|
| Net (charge-offs) recoveries | — |
| — |
| — |
| — |
| — |
| | — |
| — |
| | — |
|
| Provision | 9 |
| 118 |
| 4 |
| 10 |
| 1 |
| | (1 | ) | — |
| | 141 |
|
Ending balance (b) | $ | 26 |
| $ | 208 |
| $ | 18 |
| $ | 13 |
| $ | 9 |
| | $ | 14 |
| $ | — |
| | $ | 288 |
|
| Allowance for: | | | | | | | | | | |
| Loan losses | $ | 13 |
| $ | 83 |
| $ | 10 |
| $ | 13 |
| $ | 7 |
| | $ | 14 |
| $ | — |
| | $ | 140 |
|
| Lending-related commitments | 13 |
| 125 |
| 8 |
| — |
| 2 |
| | — |
| — |
| | 148 |
|
| Individually evaluated for impairment: | | | | | | | | | | |
| Loan balance | $ | — |
| $ | — |
| $ | — |
| $ | — |
| $ | 18 |
| (c) | $ | — |
| $ | — |
| | $ | 18 |
|
| Allowance for loan losses | — |
| — |
| — |
| — |
| — |
| | — |
| — |
| | — |
|
| |
| (a) | The allowance related to foreign exposure has been reclassified to financial institutions ($10 million), commercial ($10 million) and lease financings ($4 million). |
| |
| (b) | Includes $12 million of allowance for credit losses related to foreign loans, primarily financial institutions. |
| |
| (c) | Includes collateral dependent loans of $18 million with $26 million of collateral at fair value. |
|
|
Notes to Consolidated Financial Statements(continued) |
|
|
| | | | | | | | | | | | | | | | | | | | | | | | | | | | |
| Allowance for credit losses activity for the quarter ended June 30, 2019 | Wealth management loans and mortgages |
| Other residential mortgages |
| All other |
| | Foreign |
| Total |
|
| (in millions) | Commercial |
| Commercial real estate |
| Financial institutions |
| Lease financings |
| |
| Beginning balance | $ | 82 |
| $ | 74 |
| $ | 23 |
| $ | 4 |
| $ | 21 |
| $ | 15 |
| $ | — |
| | $ | 29 |
| $ | 248 |
|
| Charge-offs | — |
| — |
| — |
| — |
| (1 | ) | — |
| — |
| | — |
| (1 | ) |
| Recoveries | — |
| — |
| — |
| — |
| — |
| 2 |
| — |
| | — |
| 2 |
|
| Net (charge-offs) recoveries | — |
| — |
| — |
| — |
| (1 | ) | 2 |
| — |
| | — |
| 1 |
|
| Provision | (5 | ) | (2 | ) | (2 | ) | — |
| — |
| (3 | ) | — |
| | 4 |
| (8 | ) |
| Ending balance | $ | 77 |
| $ | 72 |
| $ | 21 |
| $ | 4 |
| $ | 20 |
| $ | 14 |
| $ | — |
| | $ | 33 |
| $ | 241 |
|
| Allowance for: | | | | | | | | | | |
| Loan losses | $ | 23 |
| $ | 57 |
| $ | 8 |
| $ | 4 |
| $ | 17 |
| $ | 14 |
| $ | — |
| | $ | 23 |
| $ | 146 |
|
| Lending-related commitments | 54 |
| 15 |
| 13 |
| — |
| 3 |
| — |
| — |
| | 10 |
| 95 |
|
| Individually evaluated for impairment: | | | | | | | | | | |
| Loan balance | $ | 96 |
| $ | — |
| $ | — |
| $ | — |
| $ | 16 |
| $ | — |
| $ | — |
| | $ | — |
| $ | 112 |
|
| Allowance for loan losses | 10 |
| — |
| — |
| — |
| — |
| — |
| — |
| | — |
| 10 |
|
| Collectively evaluated for impairment: | | | | | | | | | | |
| Loan balance | $ | 1,356 |
| $ | 5,192 |
| $ | 4,574 |
| $ | 662 |
| $ | 15,563 |
| $ | 549 |
| $ | 12,849 |
| (a) | $ | 11,539 |
| $ | 52,284 |
|
| Allowance for loan losses | 13 |
| 57 |
| 8 |
| 4 |
| 17 |
| 14 |
| — |
| | 23 |
| 136 |
|
| |
| (a) | Includes $1,575 million of domestic overdrafts, $10,152 million of margin loans and $1,122 million of other loans at June 30, 2019. |
|
| | | | | | | | | | | | | | | | | | | | | | | | |
| Allowance for credit losses activity for the six months ended June 30, 2020 | Wealth management loans and mortgages |
| Other
residential
mortgages |
| Foreign |
| Total |
|
| (in millions) | Commercial |
| Commercial
real estate |
| Financial
institutions |
| Lease
financings |
|
| Balance at Dec. 31, 2019 | $ | 60 |
| $ | 76 |
| $ | 20 |
| $ | 3 |
| $ | 20 |
| $ | 13 |
| $ | 24 |
| $ | 216 |
|
| Impact of adopting ASU 2016-13 | (43 | ) | 14 |
| (6 | ) | — |
| (12 | ) | 2 |
| (24 | ) | (69 | ) |
| Balance at Jan. 1, 2020 | 17 |
| 90 |
| 14 |
| 3 |
| 8 |
| 15 |
| — |
| 147 |
|
| Charge-offs | — |
| — |
| — |
| — |
| — |
| — |
| — |
| — |
|
| Recoveries | — |
| — |
| — |
| — |
| — |
| 3 |
| — |
| 3 |
|
| Net recoveries | — |
| — |
| — |
| — |
| — |
| 3 |
| — |
| 3 |
|
| Provision | 23 |
| 282 |
| 2 |
| — |
| 3 |
| (6 | ) | — |
| 304 |
|
| Ending balance | $ | 40 |
| $ | 372 |
| $ | 16 |
| $ | 3 |
| $ | 11 |
| $ | 12 |
| $ | — |
| $ | 454 |
|
|
| | | | | | | | | | | | | | | | | | | | | | | | | | | |
| Allowance for credit losses activity for the six months ended June 30, 2019 | Wealth management loans and mortgages |
| Other
residential
mortgages |
| All
other |
| Foreign |
| Total |
|
| (in millions) | Commercial |
| Commercial
real estate |
| Financial
institutions |
| Lease
financings |
|
| Beginning balance | $ | 81 |
| $ | 75 |
| $ | 22 |
| $ | 5 |
| $ | 21 |
| $ | 16 |
| $ | — |
| $ | 32 |
| $ | 252 |
|
| Charge-offs | (11 | ) | — |
| — |
| — |
| (1 | ) | — |
| — |
| — |
| (12 | ) |
| Recoveries | — |
| — |
| — |
| — |
| — |
| 2 |
| — |
| — |
| 2 |
|
| Net (charge-offs) recoveries | (11 | ) | — |
| — |
| — |
| (1 | ) | 2 |
| — |
| — |
| (10 | ) |
| Provision | 7 |
| (3 | ) | (1 | ) | (1 | ) | — |
| (4 | ) | — |
| 1 |
| (1 | ) |
| Ending balance | $ | 77 |
| $ | 72 |
| $ | 21 |
| $ | 4 |
| $ | 20 |
| $ | 14 |
| $ | — |
| $ | 33 |
| $ | 241 |
|
|
|
Notes to Consolidated Financial Statements(continued) |
| |
Allowance for credit losses
Transactions in the allowance for credit losses are summarized as follows.
|
| | | | | | | | | | | | | | | | | | | | | | | | | | | | |
| Allowance for credit losses activity for the quarter ended Sept. 30, 2017 | Wealth management loans and mortgages |
| Other residential mortgages |
| | | | |
| (in millions) | Commercial |
| Commercial real estate |
| Financial institutions |
| Lease financings |
| All other |
| | Foreign |
| Total |
|
| Beginning balance | $ | 80 |
| $ | 75 |
| $ | 23 |
| $ | 10 |
| $ | 25 |
| $ | 23 |
| $ | — |
| | $ | 34 |
| $ | 270 |
|
| Charge-offs | — |
| — |
| — |
| — |
| — |
| — |
| — |
| | — |
| — |
|
| Recoveries | — |
| — |
| — |
| — |
| — |
| 1 |
| — |
| | — |
| 1 |
|
| Net recoveries | — |
| — |
| — |
| — |
| — |
| 1 |
| — |
| | — |
| 1 |
|
| Provision | 1 |
| — |
| — |
| (1 | ) | (4 | ) | (3 | ) | — |
| | 1 |
| (6 | ) |
| Ending balance | $ | 81 |
| $ | 75 |
| $ | 23 |
| $ | 9 |
| $ | 21 |
| $ | 21 |
| $ | — |
| | $ | 35 |
| $ | 265 |
|
| Allowance for: | | | | | | | | | | |
| Loan losses | $ | 26 |
| $ | 57 |
| $ | 7 |
| $ | 9 |
| $ | 17 |
| $ | 21 |
| $ | — |
| | $ | 24 |
| $ | 161 |
|
| Lending-related commitments | 55 |
| 18 |
| 16 |
| — |
| 4 |
| — |
| — |
| | 11 |
| 104 |
|
| Individually evaluated for impairment: | | | | | | | | | | |
| Loan balance | $ | — |
| $ | — |
| $ | 2 |
| $ | — |
| $ | 5 |
| $ | — |
| $ | — |
| | $ | — |
| $ | 7 |
|
| Allowance for loan losses | — |
| — |
| 2 |
| — |
| — |
| — |
| — |
| | — |
| 2 |
|
| Collectively evaluated for impairment: | | | | | | | | | | |
| Loan balance | $ | 2,698 |
| $ | 4,921 |
| $ | 5,153 |
| $ | 823 |
| $ | 16,156 |
| $ | 741 |
| $ | 16,366 |
| (a) | $ | 12,203 |
| $ | 59,061 |
|
| Allowance for loan losses | 26 |
| 57 |
| 5 |
| 9 |
| 17 |
| 21 |
| — |
| | 24 |
| 159 |
|
| |
(a) | Includes $1,487 million of domestic overdrafts, $13,720 million of margin loans and $1,159 million of other loans at Sept. 30, 2017. |
|
| | | | | | | | | | | | | | | | | | | | | | | | | | | | |
| Allowance for credit losses activity for the quarter ended June 30, 2017 | Wealth management loans and mortgages |
| Other residential mortgages |
| | | | |
| (in millions) | Commercial |
| Commercial real estate |
| Financial institutions |
| Lease financings |
| All other |
| | Foreign |
| Total |
|
| Beginning balance | $ | 82 |
| $ | 73 |
| $ | 23 |
| $ | 10 |
| $ | 26 |
| $ | 25 |
| $ | — |
| | $ | 37 |
| $ | 276 |
|
| Charge-offs | — |
| — |
| — |
| — |
| — |
| — |
| — |
| | — |
| — |
|
| Recoveries | — |
| — |
| — |
| — |
| — |
| 1 |
| — |
| | — |
| 1 |
|
| Net recoveries | — |
| — |
| — |
| — |
| — |
| 1 |
| — |
| | — |
| 1 |
|
| Provision | (2 | ) | 2 |
| — |
| — |
| (1 | ) | (3 | ) | — |
| | (3 | ) | (7 | ) |
| Ending balance | $ | 80 |
| $ | 75 |
| $ | 23 |
| $ | 10 |
| $ | 25 |
| $ | 23 |
| $ | — |
| | $ | 34 |
| $ | 270 |
|
| Allowance for: | | | | | | | | | | |
| Loan losses | $ | 26 |
| $ | 55 |
| $ | 7 |
| $ | 10 |
| $ | 21 |
| $ | 23 |
| $ | — |
|
| $ | 23 |
| $ | 165 |
|
| Lending-related commitments | 54 |
| 20 |
| 16 |
| — |
| 4 |
| — |
| — |
|
| 11 |
| 105 |
|
| Individually evaluated for impairment: | | | | | | | | | | |
| Loan balance | $ | — |
| $ | — |
| $ | 2 |
| $ | — |
| $ | 7 |
| $ | — |
| $ | — |
|
| $ | — |
| $ | 9 |
|
| Allowance for loan losses | — |
| — |
| 2 |
| — |
| 3 |
| — |
| — |
|
| — |
| 5 |
|
| Collectively evaluated for impairment: | | | | | | | | | | |
| Loan balance | $ | 2,580 |
| $ | 5,017 |
| $ | 5,952 |
| $ | 847 |
| $ | 16,024 |
| $ | 780 |
| $ | 15,950 |
| (a) | $ | 14,514 |
| $ | 61,664 |
|
| Allowance for loan losses | 26 |
| 55 |
| 5 |
| 10 |
| 18 |
| 23 |
| — |
|
| 23 |
| 160 |
|
| |
(a) | Includes $855 million of domestic overdrafts, $13,973 million of margin loans and $1,122 million of other loans at June 30, 2017. |
|
|
Notes to Consolidated Financial Statements(continued)
|
|
|
| | | | | | | | | | | | | | | | | | | | | | | | | | | | |
| Allowance for credit losses activity for the quarter ended Sept. 30, 2016 | Wealth management loans and mortgages |
| Other residential mortgages |
| All other |
| | Foreign |
| Total |
|
| (in millions) | Commercial |
| Commercial real estate |
| Financial institutions |
| Lease financings |
| |
| Beginning balance | $ | 90 |
| $ | 63 |
| $ | 29 |
| $ | 14 |
| $ | 18 |
| $ | 29 |
| $ | — |
| | $ | 37 |
| $ | 280 |
|
| Charge-offs | — |
| — |
| — |
| — |
| — |
| (1 | ) | — |
| | — |
| (1 | ) |
| Recoveries | — |
| — |
| 13 |
| — |
| — |
| 1 |
| — |
| | — |
| 14 |
|
| Net recoveries | — |
| — |
| 13 |
| — |
| — |
| — |
| — |
| | — |
| 13 |
|
| Provision | 1 |
| — |
| (13 | ) | — |
| — |
| (1 | ) | — |
| | (6 | ) | (19 | ) |
| Ending balance | $ | 91 |
| $ | 63 |
| $ | 29 |
| $ | 14 |
| $ | 18 |
| $ | 28 |
| $ | — |
| | $ | 31 |
| $ | 274 |
|
| Allowance for: | | | | | | | | | | |
| Loan losses | $ | 22 |
| $ | 45 |
| $ | 9 |
| $ | 14 |
| $ | 14 |
| $ | 28 |
| $ | — |
| | $ | 16 |
| $ | 148 |
|
| Lending-related commitments | 69 |
| 18 |
| 20 |
| — |
| 4 |
| — |
| — |
| | 15 |
| 126 |
|
| Individually evaluated for impairment: | | | | | | | | | | |
| Loan balance | $ | — |
| $ | 1 |
| $ | — |
| $ | 4 |
| $ | 4 |
| $ | — |
| $ | — |
| | $ | — |
| $ | 9 |
|
| Allowance for loan losses | — |
| 1 |
| — |
| 2 |
| — |
| — |
| — |
| | — |
| 3 |
|
| Collectively evaluated for impairment: | | | | | | | | | | |
| Loan balance | $ | 2,292 |
| $ | 4,693 |
| $ | 6,783 |
| $ | 1,013 |
| $ | 15,027 |
| $ | 901 |
| $ | 20,189 |
| (a) | $ | 15,061 |
| $ | 65,959 |
|
| Allowance for loan losses | 22 |
| 44 |
| 9 |
| 12 |
| 14 |
| 28 |
| — |
| | 16 |
| 145 |
|
| |
(a) | Includes $1,580 million of domestic overdrafts, $17,487 million of margin loans and $1,122 million of other loans at Sept. 30, 2016. |
|
| | | | | | | | | | | | | | | | | | | | | | | | | | | |
| Allowance for credit losses activity for the nine months ended Sept. 30, 2017 | Wealth management loans and mortgages |
| Other
residential
mortgages |
| All
other |
| Foreign |
| Total |
|
| (in millions) | Commercial |
| Commercial
real estate |
| Financial
institutions |
| Lease
financings |
|
| Beginning balance | $ | 82 |
| $ | 73 |
| $ | 26 |
| $ | 13 |
| $ | 23 |
| $ | 28 |
| $ | — |
| $ | 36 |
| $ | 281 |
|
| Charge-offs | — |
| — |
| — |
| — |
| — |
| (1 | ) | — |
| — |
| (1 | ) |
| Recoveries | — |
| — |
| — |
| — |
| — |
| 3 |
| — |
| — |
| 3 |
|
| Net recoveries | — |
| — |
| — |
| — |
| — |
| 2 |
| — |
| — |
| 2 |
|
| Provision | (1 | ) | 2 |
| (3 | ) | (4 | ) | (2 | ) | (9 | ) | — |
| (1 | ) | (18 | ) |
| Ending balance | $ | 81 |
| $ | 75 |
| $ | 23 |
| $ | 9 |
| $ | 21 |
| $ | 21 |
| $ | — |
| $ | 35 |
| $ | 265 |
|
|
| | | | | | | | | | | | | | | | | | | | | | | | | | | |
| Allowance for credit losses activity for the nine months ended Sept. 30, 2016 | Wealth management loans and mortgages |
| Other
residential
mortgages |
| All
other |
| Foreign |
| Total |
|
| (in millions) | Commercial |
| Commercial
real estate |
| Financial
institutions |
| Lease
financings |
|
| Beginning balance | $ | 82 |
| $ | 59 |
| $ | 31 |
| $ | 15 |
| $ | 19 |
| $ | 34 |
| $ | — |
| $ | 35 |
| $ | 275 |
|
| Charge-offs | — |
| — |
| — |
| — |
| — |
| (1 | ) | — |
| — |
| (1 | ) |
| Recoveries | — |
| — |
| 13 |
| — |
| — |
| 4 |
| — |
| 1 |
| 18 |
|
| Net recoveries | — |
| — |
| 13 |
| — |
| — |
| 3 |
| — |
| 1 |
| 17 |
|
| Provision | 9 |
| 4 |
| (15 | ) | (1 | ) | (1 | ) | (9 | ) | — |
| (5 | ) | (18 | ) |
| Ending balance | $ | 91 |
| $ | 63 |
| $ | 29 |
| $ | 14 |
| $ | 18 |
| $ | 28 |
| $ | — |
| $ | 31 |
| $ | 274 |
|
|
|
Notes to Consolidated Financial Statements(continued)
|
|
Nonperforming assets
The table below presents our nonperforming assets.
|
| | | | | | | | | | | | |
| Nonperforming assets | June 30, 2020 | Dec. 31, 2019 |
|
| | Recorded investment |
| | With an allowance |
| Without an allowance |
| |
| (in millions) | Total |
|
| Nonperforming loans: | | | | |
| Other residential mortgages | $ | 58 |
| $ | — |
| $ | 58 |
| $ | 62 |
|
| Wealth management loans and mortgages | 10 |
| 18 |
| 28 |
| 24 |
|
| Total nonperforming loans | 68 |
| 18 |
| 86 |
| 86 |
|
| Other assets owned | — |
| 2 |
| 2 |
| 3 |
|
| Total nonperforming assets | $ | 68 |
| $ | 20 |
| $ | 88 |
| $ | 89 |
|
|
| | | | | | | |
| | Nonperforming assets (in millions) | Sept. 30, 2017 |
| Dec. 31, 2016 |
|
| |
| | Nonperforming loans: | | |
| | Other residential mortgages | $ | 80 |
| $ | 91 |
|
| | Wealth management loans and mortgages | 8 |
| 8 |
|
| | Financial institutions | 2 |
| — |
|
| | Lease financings | — |
| 4 |
|
| | Total nonperforming loans | 90 |
| 103 |
|
| | Other assets owned | 4 |
| 4 |
|
| | Total nonperforming assets | $ | 94 |
| $ | 107 |
|
At Sept.June 30, 2017,2020, undrawn commitments to borrowers whose loans were classified as nonaccrual or reduced rate were not material.
Lost interest
The table below presents the amount of lost interest income.
|
| | | | | | | | | | | | | | | |
| Lost interest | | | | | |
| (in millions) | 3Q17 |
| 2Q17 |
| 3Q16 |
| YTD17 |
| YTD16 |
|
| Amount by which interest income recognized on nonperforming loans exceeded reversals | $ | — |
| $ | — |
| $ | — |
| $ | — |
| $ | — |
|
| Amount by which interest income would have increased if nonperforming loans at period end had been performing for the entire period | $ | 1 |
| $ | 1 |
| $ | 1 |
| $ | 4 |
| $ | 4 |
|
Impaired loans
The tables below present information about our impaired loans. We use the discounted cash flow method as the primary method for valuing impaired loans.
|
| | | | | | | | | | | | | | | | | | | | | | | | | | | | | | | |
| Impaired loans | 3Q17 | 2Q17 | 3Q16 | | YTD17 | YTD16 |
| (in millions) | Average recorded investment |
| Interest
income
recognized |
| Average recorded investment |
| Interest income recognized |
| Average
recorded
investment |
| Interest
income
recognized |
| | Average
recorded
investment |
| Interest
income
recognized |
| Average
recorded
investment |
| Interest
income
recognized |
|
| Impaired loans with an allowance: | | | | | | | | | | | |
| Commercial real estate | $ | — |
| $ | — |
| $ | — |
| $ | — |
| $ | 1 |
| $ | — |
| | $ | — |
| $ | — |
| $ | 1 |
| $ | — |
|
| Financial institutions | 2 |
| — |
| 1 |
| — |
| — |
| — |
| | 1 |
| — |
| — |
| — |
|
| Wealth management loans and mortgages | 2 |
| — |
| 3 |
| — |
| 3 |
| — |
| | 3 |
| — |
| 5 |
| — |
|
| Lease financings | — |
| — |
| — |
| — |
| 4 |
| — |
| | 1 |
| — |
| 3 |
| — |
|
| Total impaired loans with an allowance | 4 |
| — |
| 4 |
| — |
| 8 |
| — |
| | 5 |
| — |
| 9 |
| — |
|
Impaired loans without an allowance: | | | | | | | | | | | |
| Commercial real estate | — |
| — |
| — |
| — |
| 1 |
| — |
| | — |
| — |
| 1 |
| — |
|
| Financial institutions | — |
| — |
| — |
| — |
| 85 |
| — |
| | — |
| — |
| 128 |
| — |
|
| Wealth management loans and mortgages | 4 |
| — |
| 3 |
| — |
| 3 |
| — |
| | 3 |
| — |
| 2 |
| — |
|
Total impaired loans without an allowance (a) | 4 |
| — |
| 3 |
| — |
| 89 |
| — |
| | 3 |
| — |
| 131 |
| — |
|
| Total impaired loans | $ | 8 |
| $ | — |
| $ | 7 |
| $ | — |
| $ | 97 |
| $ | — |
| | $ | 8 |
| $ | — |
| $ | 140 |
| $ | — |
|
| |
(a) | When the discounted cash flows, collateral value or market price equals or exceeds the carrying value of the loan, then the loan does not require an allowance under the accounting standard related to impaired loans. |
|
|
Notes to Consolidated Financial Statements(continued)
|
|
|
| | | | | | | | | | | | | | | | | | | |
| Impaired loans | Sept. 30, 2017 | | Dec. 31, 2016 |
| (in millions) | Recorded investment |
| Unpaid principal balance |
| Related allowance (a) |
| | Recorded investment |
| Unpaid principal balance |
| Related allowance (a) |
|
| Impaired loans with an allowance: | | | | | | | |
| Commercial real estate | $ | — |
| $ | 3 |
| $ | — |
| | $ | — |
| $ | 3 |
| $ | — |
|
| Financial institutions | 2 |
| 2 |
| 2 |
| | — |
| — |
| — |
|
| Wealth management loans and mortgages | 1 |
| 1 |
| — |
| | 3 |
| 3 |
| 3 |
|
| Lease financings | — |
| — |
| — |
| | 4 |
| 4 |
| 2 |
|
| Total impaired loans with an allowance | 3 |
| 6 |
| 2 |
| | 7 |
| 10 |
| 5 |
|
Impaired loans without an allowance: | | | | | | | |
| Wealth management loans and mortgages | 4 |
| 4 |
| N/A |
| | 2 |
| 2 |
| N/A |
|
Total impaired loans without an allowance (b) | 4 |
| 4 |
| N/A |
| | 2 |
| 2 |
| N/A |
|
Total impaired loans (c) | $ | 7 |
| $ | 10 |
| $ | 2 |
| | $ | 9 |
| $ | 12 |
| $ | 5 |
|
| |
(a) | The allowance for impaired loans is included in the allowance for loan losses. |
| |
(b) | When the discounted cash flows, collateral value or market price equals or exceeds the carrying value of the loan, then the loan does not require an allowance under the accounting standard related to impaired loans. |
| |
(c) | Excludes an aggregate of less than $1 million of impaired loans in amounts individually less than $1 million at both Sept. 30, 2017 and Dec. 31, 2016, respectively. The allowance for loan losses associated with these loans totaled less than $1 million at both Sept. 30, 2017 and Dec. 31, 2016, respectively.
|
Past due loans
The table below presents our past due loans.
| | | Past due loans and still accruing interest | Sept. 30, 2017 | | Dec. 31, 2016 | June 30, 2020 | | Dec. 31, 2019 |
| | Days past due | Total past due |
| | Days past due | Total past due |
| Days past due | Total past due |
| | Days past due | Total past due |
|
| (in millions) | 30-59 |
| 60-89 |
| ≥90 |
| 30-59 |
| 60-89 |
| ≥90 |
| 30-59 |
| 60-89 |
| ≥90 |
| 30-59 |
| 60-89 |
| ≥90 |
|
| Commercial real estate | $ | 51 |
| $ | 60 |
| $ | — |
| $ | 111 |
| | $ | 78 |
| $ | — |
| $ | — |
| $ | 78 |
| |
| Wealth management loans and mortgages | 86 |
| 15 |
| 1 |
| 102 |
| | 21 |
| 2 |
| — |
| 23 |
| $ | 31 |
| $ | 6 |
| $ | — |
| $ | 37 |
| | $ | 22 |
| $ | 5 |
| $ | — |
| $ | 27 |
|
| Other residential mortgages | 20 |
| 3 |
| 5 |
| 28 |
| | 20 |
| 6 |
| 7 |
| 33 |
| 5 |
| 1 |
| — |
| 6 |
| | 8 |
| 3 |
| — |
| 11 |
|
| Financial institutions | — |
| — |
| — |
| — |
| | 1 |
| 27 |
| — |
| 28 |
| — |
| — |
| — |
| — |
| | 1 |
| 30 |
| — |
| 31 |
|
| Commercial real estate | | — |
| — |
| — |
| — |
| | 6 |
| 12 |
| — |
| 18 |
|
| Total past due loans | $ | 157 |
| $ | 78 |
| $ | 6 |
| $ | 241 |
|
| $ | 120 |
| $ | 35 |
| $ | 7 |
| $ | 162 |
| $ | 36 |
| $ | 7 |
| $ | — |
| $ | 43 |
|
| $ | 37 |
| $ | 50 |
| $ | — |
| $ | 87 |
|
TroubledLoan modifications
Due to the coronavirus pandemic, there have been two forms of relief provided for classifying loans as TDRs: The Coronavirus Aid, Relief, and Economic Security Act (the “CARES Act”) and the Interagency Guidance. See Note 2 for additional details on the CARES Act and Interagency Guidance. Financial institutions may account for eligible loan modifications either under the CARES Act or the Interagency Guidance. The Company has elected to apply both the CARES Act and the Interagency Guidance, as applicable, in providing borrowers with loan modification relief in response to the coronavirus pandemic. We modified loans totaling $282 million in the second quarter of 2020 by providing short-term loan payment forbearances or modified principal and/or interest payments. We did
not identify these modifications as troubled debt restructurings (“TDRs”)
A modified loan is considered a TDR if the debtor is experiencing financial difficulties. These loans were primarily residential mortgage and the creditor grants a concession to the debtor that would not
otherwise be considered. A TDR may include a transfer ofcommercial real estate or other assets fromloans. During the debtor to the creditor, or aloan modification of the term of the loan. Not all modifiedperiod, these loans are considered TDRs.
The following table presents our TDRs.
|
| | | | | | | | | | | | | | | | | | | | | | | | | | | | | | | | |
| TDRs | 3Q17 | | 2Q17 | | 3Q16 |
| | | Outstanding recorded investment | | | Outstanding recorded investment | | | Outstanding recorded investment |
| (dollars in millions) | Number of contracts |
| Pre-modification | | Post-modification | | | Number of contracts |
| Pre-modification | | Post-modification | | | Number of contracts |
| Pre-modification | | Post-modification | |
| Other residential mortgages | 19 |
| | $ | 5 |
| | $ | 5 |
| | 16 |
| | $ | 4 |
| | $ | 4 |
| | 17 |
| | $ | 4 |
| | $ | 4 |
|
| Wealth management loans and mortgages | 1 |
| | 2 |
| | 2 |
| | — |
| | — |
| | — |
| | — |
| | — |
| | — |
|
| Total TDRs | 20 |
| | $ | 7 |
| | $ | 7 |
| | 16 |
| | $ | 4 |
| | $ | 4 |
| | 17 |
| | $ | 4 |
| | $ | 4 |
|
|
|
Notes to Consolidated Financial Statements(continued)
|
|
Other residential mortgages
The modifications of thenot reported as nonperforming or past due. We modified other residential mortgage loans totaling $1 million in both the third quarter of 2017, second quarter of 20172019 and thirdfirst quarter of 2016 consisted of reducing the stated interest rates and, in certain cases, a forbearance of default and extending the maturity dates. The modified loans are primarily collateral dependent for which the value is based on the fair value of the collateral.2020.
TDRs that subsequently defaulted
There were three residential mortgage loans that had been restructured in a TDR during the previous 12
months and have subsequently defaulted in the third quarter of 2017. The total recorded investment of these loans was less than $1 million.
Credit quality indicators
Our credit strategy is to focus on investment gradeinvestment-grade clients that are active users of our non-credit services. Each customer is assigned an internal credit rating, which is mapped to an external rating agency grade equivalent, if possible, based upon a number of dimensions, which are continually evaluated and may change over time.
|
|
Notes to Consolidated Financial Statements(continued) |
|
The following tables presenttable below provides information about the credit quality indicators.
Commercialprofile of the loan portfolio by the period of origination.
| | Commercial loan portfolio – Credit risk profile by creditworthiness category | Commercial | | Commercial real estate | | Financial institutions | |
| Sept. 30, 2017 |
| Dec. 31, 2016 |
| | Sept. 30, 2017 |
| Dec. 31, 2016 |
| | Sept. 30, 2017 |
| Dec. 31, 2016 |
| |
| Credit profile of the loan portfolio | | Credit profile of the loan portfolio |
| June 30, 2020 |
| |
|
|
|
|
|
|
|
|
|
|
|
| Revolving loans |
|
|
|
|
| | Originated, at amortized cost | Amortized cost |
| Converted to term loans - Amortized cost |
|
|
| Accrued
interest
receivable |
|
| (in millions) | Sept. 30, 2017 |
| Dec. 31, 2016 |
| | Sept. 30, 2017 |
| Dec. 31, 2016 |
| | Sept. 30, 2017 |
| Dec. 31, 2016 |
| YTD20 |
| 2019 |
| 2018 |
| 2017 |
| 2016 |
| Prior to 2016 |
| Total (a) |
|
| Commercial: | |
|
| Investment grade | $ | 2,857 |
| $ | 2,397 |
| | $ | 4,339 |
| $ | 3,823 |
| | $ | 9,217 |
| $ | 11,459 |
| $ | 107 |
| $ | 213 |
| $ | 106 |
| $ | 554 |
| $ | 57 |
| $ | — |
| $ | 1,054 |
| $ | — |
| $ | 2,091 |
| |
| Non-investment grade | 146 |
| 220 |
| | 588 |
| 831 |
| | 2,679 |
| 3,230 |
| 40 |
| 69 |
| 12 |
| — |
| 3 |
| — |
| 230 |
| — |
| 354 |
| |
| Total | $ | 3,003 |
| $ | 2,617 |
| | $ | 4,927 |
| $ | 4,654 |
| | $ | 11,896 |
| $ | 14,689 |
| |
| Total commercial | | 147 |
| 282 |
| 118 |
| 554 |
| 60 |
| — |
| 1,284 |
| — |
| 2,445 |
| $ | 3 |
|
| Commercial real estate: | | |
| Investment grade | | 500 |
| 1,212 |
| 806 |
| 550 |
| 431 |
| 422 |
| 292 |
| — |
| 4,213 |
| |
| Non-investment grade | | 77 |
| 410 |
| 459 |
| 179 |
| 421 |
| 212 |
| 228 |
| 29 |
| 2,015 |
| |
| Total commercial real estate | | 577 |
| 1,622 |
| 1,265 |
| 729 |
| 852 |
| 634 |
| 520 |
| 29 |
| 6,228 |
| 8 |
|
| Financial institutions: | | |
| Investment grade | | 27 |
| 247 |
| 133 |
| 125 |
| 14 |
| 181 |
| 7,934 |
| — |
| 8,661 |
| |
| Non-investment grade | | 53 |
| 29 |
| — |
| — |
| — |
| — |
| 2,010 |
| — |
| 2,092 |
| |
| Total financial institutions | | 80 |
| 276 |
| 133 |
| 125 |
| 14 |
| 181 |
| 9,944 |
| — |
| 10,753 |
| 25 |
|
| Wealth management loans and mortgages: | | |
| Investment grade | | 34 |
| 81 |
| 12 |
| 171 |
| 56 |
| 85 |
| 6,877 |
| — |
| 7,316 |
| |
| Non-investment grade | | — |
| — |
| — |
| — |
| — |
| 35 |
| 79 |
| — |
| 114 |
| |
| Wealth management mortgages | | 491 |
| 1,126 |
| 719 |
| 1,360 |
| 1,736 |
| 2,976 |
| 37 |
| — |
| 8,445 |
| |
| Total wealth management loans and mortgages | | 525 |
| 1,207 |
| 731 |
| 1,531 |
| 1,792 |
| 3,096 |
| 6,993 |
| — |
| 15,875 |
| 27 |
|
| Lease financings | | 45 |
| 20 |
| 20 |
| 12 |
| 29 |
| 902 |
| — |
| — |
| 1,028 |
| — |
|
| Other residential mortgages | | — |
| — |
| — |
| — |
| — |
| 450 |
| — |
| — |
| 450 |
| 2 |
|
| Other loans | | — |
| — |
| — |
| — |
| — |
| — |
| 1,530 |
| — |
| 1,530 |
| 1 |
|
| Margin loans | | 2,552 |
| 1,000 |
| — |
| — |
| — |
| — |
| 9,357 |
| — |
| 12,909 |
| 11 |
|
| Total loans | | $ | 3,926 |
| $ | 4,407 |
| $ | 2,267 |
| $ | 2,951 |
| $ | 2,747 |
| $ | 5,263 |
| $ | 29,628 |
| $ | 29 |
| $ | 51,218 |
| $ | 77 |
|
| |
| (a) | Excludes overdrafts of $4,179 million. Overdrafts occur on a daily basis primarily in the custody and securities clearance business and are generally repaid within two business days. |
Commercial loans
The commercial loan portfolio is divided into investment grade and non-investment grade categories based on rating criteria largely consistent with those of the public rating agencies. Each customer in the portfolio is assigned an internal credit rating. These internal credit ratings, which are generally consistent with the ratings categoriesthose of the public rating agencies. Customers with ratings consistent with BBB- (S&P)/Baa3 (Moody’s) or better are considered to be investment grade. Those clients with ratings lower than this threshold are considered to be non-investment grade.
Commercial real estate
Our income-producing commercial real estate facilities are focused on experienced owners and are structured with moderate leverage based on existing cash flows. Our commercial real estate lending activities also include construction and renovation facilities.
Financial institutions
Financial institution exposures are high quality, with 95% of the exposures meeting the investment grade equivalent criteria of our internal credit rating classification at June 30, 2020. In addition, 75% of the financial institutions exposure is secured. For example, securities industry clients and asset managers often borrow against marketable securities held in custody. The exposure to financial institutions is generally short-term with 90% expiring within one year.
Wealth management loans and mortgages
|
| | | | | | |
Wealth management loans and mortgages – Credit risk profile by internally assigned grade |
| (in millions) | Sept. 30, 2017 |
| Dec. 31, 2016 |
|
| Wealth management loans: | | |
| Investment grade | $ | 7,128 |
| $ | 7,127 |
|
| Non-investment grade | 135 |
| 260 |
|
| Wealth management mortgages | 9,002 |
| 8,267 |
|
| Total | $ | 16,265 |
| $ | 15,654 |
|
Wealth management non-mortgage loans are not typically rated by external rating agencies. A majority of the wealth management loans are secured by the customers’ investment management accounts or custody accounts. Eligible assets pledged for these loans are typically investment grade fixed-income securities, equities and/or mutual funds. Internal ratings for this portion of the wealth management
|
|
Notes to Consolidated Financial Statements(continued) |
|
portfolio, therefore, would equate to investment grade external ratings. Wealth management loans are provided to select customers based on the pledge of other types of assets, including business assets, fixed assets or a modest amount of commercial real estate. For the loans collateralized by other assets, the credit quality of the obligor is carefully analyzed, but we do not consider this portfolio of loans to be investment grade.
Credit quality indicators for wealth management mortgages are not correlated to external ratings. Wealth management mortgages are typically loans to high-net-worth individuals, which are secured primarily by residential property. These loans are primarily interest-only, adjustable rate mortgages with a weighted-average loan-to-value ratio of 62% at origination. InDelinquency rate is a key indicator of credit quality in the wealth management portfolio,portfolio. At June 30, 2020, less
|
|
Notes to Consolidated Financial Statements(continued)
|
|
than 1% of the mortgages were past due at Sept. 30, 2017.due.
At Sept.June 30, 2017,2020, the wealth management mortgage portfolio consisted of the following geographic concentrations: California - 24%23%; New York - 19%17%; Massachusetts - 11%10%; Florida - 8%; and other - 38%42%.
Lease financing
At June 30, 2020, the lease financings portfolio consisted of exposures backed by well-diversified assets, primarily large-ticket transportation equipment and real estate. The largest component of our lease residual value exposure is freight-related rail. Assets are both domestic and foreign-based, with primary concentrations in the U.S. and Germany.
Other residential mortgages
The other residential mortgage portfolio primarily consists of 1-4 family residential mortgage loans and totaled $741$450 million at Sept.June 30, 20172020 and $854$494 million at Dec. 31, 2016.2019. These loans are not
typically correlated to external ratings. Included in this portfolio at Sept.June 30, 2017 are $1812020 were $81 million of mortgage loans purchased in 2005, 2006 and the first quarter of 2007, that are predominantly prime mortgage loans, with a small portion of Alt-A loans. As of Sept. 30, 2017, the purchased loans in this portfolio had a weighted-average loan-to-value ratio of 76% at origination and 11%which 25% of the serviced loan balance was at least 60 days delinquent. The properties securing the prime and Alt-A mortgage loans were located (in order of concentration) in California, Florida, Virginia, the tri-state area (New York, New Jersey and Connecticut) and Maryland.
Overdrafts
Overdrafts primarily relate to custody and securities clearance clients and totaled $5.8$4.2 billion at Sept.June 30,
2017 2020 and $5.5$2.7 billion at Dec. 31, 2016.2019. Overdrafts occur on a daily basis in the custody and securities clearance business and are generally repaid within two business days.
Other loans
Other loans primarily include loans to consumers that are fully collateralized with equities, mutual funds and fixed incomefixed-income securities.
Margin loans
We had $13.9$12.9 billion of secured margin loans on our balance sheet at Sept.June 30, 20172020, compared with $17.6$13.4 billion at Dec. 31, 2016.2019. Margin loans are collateralized with marketable securities, and borrowers are required to maintain a daily collateral margin in excess of 100% of the value of the loan. We have rarely suffered a loss on these types of loans and do not allocate any of ourloans.
Reverse repurchase agreements
Reverse repurchase agreements at June 30, 2020 were fully secured with high quality collateral. As a result, there was 0 allowance for credit losses related to margin loans.
Reversethese assets at June 30, 2020. This compares to an $18 million allowance at March 31, 2020. The decrease is driven by a reduction in exposure and improvement in collateral liquidity and values related to reverse repurchase agreements collateralized by non-agency debt securities.
Reverse repurchase agreements are transactions fully collateralized with high-quality liquid securities. These transactions carry minimal credit risk and therefore are not allocated an allowance for credit losses.
|
|
Notes to Consolidated Financial Statements(continued) |
|
Note 6 - 6–Goodwill and intangible assets
Goodwill
The tables below provide a breakdown of goodwill by business.
|
| | | | | | | | | | | | |
Goodwill by business (in millions) | Investment
Management |
| Investment
Services |
| Other |
| Consolidated |
|
| Balance at Dec. 31, 2016 | $ | 9,000 |
| $ | 8,269 |
| $ | 47 |
| $ | 17,316 |
|
| Foreign currency translation | 120 |
| 107 |
| — |
| 227 |
|
| Balance at Sept. 30, 2017 | $ | 9,120 |
| $ | 8,376 |
| $ | 47 |
| $ | 17,543 |
|
| | Goodwill by business (in millions) | Investment
Management |
| Investment
Services |
| Other |
| Consolidated |
| Investment
Services |
| Investment and Wealth
Management |
| Other |
| Consolidated |
|
| Balance at Dec. 31, 2015 | $ | 9,207 |
| $ | 8,366 |
| $ | 45 |
| $ | 17,618 |
| |
| Acquisitions | 29 |
| (1 | ) | — |
| 28 |
| |
| Balance at Dec. 31, 2019 | | $ | 8,332 |
| $ | 9,007 |
| $ | 47 |
| $ | 17,386 |
|
| Foreign currency translation | (167 | ) | (30 | ) | — |
| (197 | ) | (24 | ) | (109 | ) | — |
| (133 | ) |
Other (a) | 2 |
| (4 | ) | 2 |
| — |
| 47 |
| — |
| (47 | ) | — |
|
| Balance at Sept. 30, 2016 | $ | 9,071 |
| $ | 8,331 |
| $ | 47 |
| $ | 17,449 |
| |
| Balance at June 30, 2020 | | $ | 8,355 |
| $ | 8,898 |
| $ | — |
| $ | 17,253 |
|
| |
| (a) | Other changes inReflects the transfer of goodwill include purchase price adjustments and certain other reclassifications.associated with the Capital Markets business. |
|
| | | | | | | | | | | | |
Goodwill by business
(in millions) | Investment
Services |
| Investment and Wealth Management |
| Other |
| Consolidated |
|
| Balance at Dec. 31, 2018 | $ | 8,333 |
| $ | 8,970 |
| $ | 47 |
| $ | 17,350 |
|
| Foreign currency translation | (6 | ) | (7 | ) | — |
| (13 | ) |
| Balance at June 30, 2019 | $ | 8,327 |
| $ | 8,963 |
| $ | 47 |
| $ | 17,337 |
|
BNY Mellon 75
|
|
Notes to Consolidated Financial Statements(continued)
|
|
Intangible assets
The tables below provide a breakdown of intangible assets by business.
| | Intangible assets – net carrying amount by business
(in millions) | Investment
Management |
| Investment
Services |
| Other |
| Consolidated |
| Investment
Services |
| Investment and Wealth Management |
| Other |
| Consolidated |
|
| Balance at Dec. 31, 2016 | $ | 1,717 |
| $ | 1,032 |
| $ | 849 |
| $ | 3,598 |
| |
| Balance at Dec. 31, 2019 | | $ | 678 |
| $ | 1,580 |
| $ | 849 |
| $ | 3,107 |
|
| Amortization | (45 | ) | (112 | ) | — |
| (157 | ) | (36 | ) | (16 | ) | — |
| (52 | ) |
| Foreign currency translation | 16 |
| 4 |
| — |
| 20 |
| — |
| (10 | ) | — |
| (10 | ) |
| Balance at Sept. 30, 2017 | $ | 1,688 |
| $ | 924 |
| $ | 849 |
| $ | 3,461 |
| |
| Balance at June 30, 2020 | | $ | 642 |
| $ | 1,554 |
| $ | 849 |
| $ | 3,045 |
|
|
| | | | | | | | | | | | |
Intangible assets – net carrying amount by business
(in millions) | Investment
Services |
| Investment and Wealth Management |
| Other |
| Consolidated |
|
| Balance at Dec. 31, 2018 | $ | 758 |
| $ | 1,613 |
| $ | 849 |
| $ | 3,220 |
|
| Amortization | (41 | ) | (18 | ) | — |
| (59 | ) |
| Foreign currency translation | — |
| (1 | ) | — |
| (1 | ) |
| Balance at June 30, 2019 | $ | 717 |
| $ | 1,594 |
| $ | 849 |
| $ | 3,160 |
|
|
| | | | | | | | | | | | |
Intangible assets – net carrying amount by business
(in millions) | Investment
Management |
| Investment
Services |
| Other |
| Consolidated |
|
| Balance at Dec. 31, 2015 | $ | 1,807 |
| $ | 1,186 |
| $ | 849 |
| $ | 3,842 |
|
| Acquisitions | 30 |
| 2 |
| — |
| 32 |
|
| Amortization | (60 | ) | (117 | ) | — |
| (177 | ) |
| Foreign currency translation | (27 | ) | 1 |
| — |
| (26 | ) |
| Balance at Sept. 30, 2016 | $ | 1,750 |
| $ | 1,072 |
| $ | 849 |
| $ | 3,671 |
|
|
|
Notes to Consolidated Financial Statements(continued) |
|
The table below provides a breakdown of intangible assets by type.
|
| | | | | | | | | | | | | | | | | | | | |
| Intangible assets | June 30, 2020 | | Dec. 31, 2019 |
| (in millions) | Gross carrying amount |
| Accumulated amortization |
| Net carrying amount |
| Remaining weighted- average amortization period | | Gross
carrying
amount |
| Accumulated
amortization |
| Net carrying amount |
|
Subject to amortization: (a) | | | | | | | | |
| Customer contracts—Investment Services | $ | 1,514 |
| $ | (1,244 | ) | $ | 270 |
| 10 years | | $ | 1,520 |
| $ | (1,214 | ) | $ | 306 |
|
| Customer relationships—Investment and Wealth Management | 709 |
| (554 | ) | 155 |
| 10 years | | 712 |
| (544 | ) | 168 |
|
| Other | 64 |
| (19 | ) | 45 |
| 14 years | | 64 |
| (16 | ) | 48 |
|
| Total subject to amortization | 2,287 |
| (1,817 | ) | 470 |
| 10 years | | 2,296 |
| (1,774 | ) | 522 |
|
Not subject to amortization: (b) | | | | | | | | |
| Tradenames | 1,291 |
| N/A |
| 1,291 |
| N/A | | 1,293 |
| N/A |
| 1,293 |
|
| Customer relationships | 1,284 |
| N/A |
| 1,284 |
| N/A | | 1,292 |
| N/A |
| 1,292 |
|
| Total not subject to amortization | 2,575 |
| N/A |
| 2,575 |
| N/A | | 2,585 |
| N/A |
| 2,585 |
|
| Total intangible assets | $ | 4,862 |
| $ | (1,817 | ) | $ | 3,045 |
| N/A | | $ | 4,881 |
| $ | (1,774 | ) | $ | 3,107 |
|
|
| | | | | | | | | | | | | | | | | | | | |
| Intangible assets | Sept. 30, 2017 | | Dec. 31, 2016 |
| (in millions) | Gross carrying amount |
| Accumulated amortization |
| Net carrying amount |
| Remaining weighted- average amortization period | | Gross
carrying
amount |
| Accumulated
amortization |
| Net carrying amount |
|
Subject to amortization: (a) | | | | | | | | |
| Customer relationships—Investment Management | $ | 1,483 |
| $ | (1,221 | ) | $ | 262 |
| 11 years | | $ | 1,439 |
| $ | (1,136 | ) | $ | 303 |
|
| Customer contracts—Investment Services | 2,257 |
| (1,705 | ) | 552 |
| 10 years | | 2,249 |
| (1,590 | ) | 659 |
|
| Other | 25 |
| (22 | ) | 3 |
| 2 years | | 37 |
| (33 | ) | 4 |
|
| Total subject to amortization | 3,765 |
| (2,948 | ) | 817 |
| 10 years | | 3,725 |
| (2,759 | ) | 966 |
|
Not subject to amortization: (b) | | | | | | | | |
| Trade name | 1,350 |
| N/A |
| 1,350 |
| N/A | | 1,348 |
| N/A |
| 1,348 |
|
| Customer relationships | 1,294 |
| N/A |
| 1,294 |
| N/A | | 1,284 |
| N/A |
| 1,284 |
|
| Total not subject to amortization | 2,644 |
| N/A |
| 2,644 |
| N/A | | 2,632 |
| N/A |
| 2,632 |
|
| Total intangible assets | $ | 6,409 |
| $ | (2,948 | ) | $ | 3,461 |
| N/A | | $ | 6,357 |
| $ | (2,759 | ) | $ | 3,598 |
|
| |
| (a) | Excludes fully amortized intangible assets. |
| |
| (b) | Intangible assets not subject to amortization have an indefinite life. |
Estimated annual amortization expense for current intangibles for the next five years is as follows:
|
| | | | |
For the year ended
Dec. 31, | Estimated amortization expense (in millions) | |
| 2020 | | $ | 104 |
|
| 2021 | | 81 |
|
| 2022 | | 63 |
|
| 2023 | | 52 |
|
| 2024 | | 45 |
|
|
| | | | |
For the year ended
Dec. 31, | Estimated amortization expense (in millions) | |
| 2017 | | $ | 209 |
|
| 2018 | | 180 |
|
| 2019 | | 109 |
|
| 2020 | | 98 |
|
| 2021 | | 75 |
|
Impairment testing
The goodwill impairment test is performed at least annually at the reporting unit level. Intangible assets not subject to amortization are tested for impairment annually or more often if events or circumstances indicate they may be impaired.
BNY Mellon’s three business segments include eight6 reporting units for which goodwill impairment testing is performed on an annual basis. InThe Investment Services segment is comprised of 4 reporting units and the second quarterInvestment and Wealth Management segment is comprised of 2017, BNY Mellon conducted an annual goodwill impairment test on all eight2 reporting units.
|
|
Notes to Consolidated Financial Statements(continued)
|
|
As a result of the annual goodwill impairment test of the eight6 reporting units noconducted in the second quarter of 2020, 0 goodwill impairment was recognized.
Note 7 - 7–Other assets
The following table provides the components of other assets presented on the consolidated balance sheet.
| | | Other assets | Sept. 30, 2017 |
| Dec. 31, 2016 |
| June 30, 2020 |
| Dec. 31, 2019 |
|
| (in millions) |
| Corporate/bank-owned life insurance | $ | 4,824 |
| $ | 4,789 |
| $ | 5,245 |
| $ | 5,219 |
|
| Accounts receivable | 3,899 |
| 4,060 |
| 3,404 |
| 3,802 |
|
| Fails to deliver | 3,532 |
| 1,732 |
| 3,201 |
| 1,671 |
|
| Software | 1,513 |
| 1,451 |
| 1,778 |
| 1,590 |
|
| Prepaid pension assets | | 1,545 |
| 1,464 |
|
| Equity in a joint venture and other investments | | 1,146 |
| 1,102 |
|
| Renewable energy investments | 1,344 |
| 1,282 |
| 1,083 |
| 1,144 |
|
| Equity in a joint venture and other investments | 1,153 |
| 1,063 |
| |
| Qualified affordable housing project investments | | 962 |
| 1,024 |
|
| Prepaid expense | | 544 |
| 491 |
|
| Federal Reserve Bank stock | | 477 |
| 466 |
|
| Income taxes receivable | 1,020 |
| 1,172 |
| 194 |
| 388 |
|
Qualified affordable housing project investments
| 988 |
| 914 |
| |
| Prepaid pension assets | 951 |
| 836 |
| |
| Prepaid expenses | 512 |
| 438 |
| |
| Federal Reserve Bank stock | 474 |
| 466 |
| |
| Seed capital | | 149 |
| 184 |
|
| Fair value of hedging derivatives | 344 |
| 784 |
| 137 |
| 21 |
|
| Due from customers on acceptances | 318 |
| 340 |
| |
| Seed capital | 302 |
| 395 |
| |
Other (a) | 1,113 |
| 1,232 |
| 1,441 |
| 1,655 |
|
| Total other assets | $ | 22,287 |
| $ | 20,954 |
| $ | 21,306 |
| $ | 20,221 |
|
| |
| (a) | At Sept.June 30, 2017,2020 and Dec. 31, 2019, other assets include $76$7 million and $22 million, respectively, of Federal Home Loan Bank stock, at cost. |
|
|
Notes to Consolidated Financial Statements(continued) |
|
Non-readily marketable equity securities
Non-readily marketable equity securities do not have readily determinable fair values. These investments are valued using a measurement alternative where the investments are carried at cost, less any impairment, and plus or minus changes resulting from observable price changes in orderly transactions for an identical or similar investment of the same issuer. The observable price changes are recorded in investment and other income on the consolidated income statement. Our non-readily marketable equity securities totaled $106 million at June 30, 2020 and $61 million at Dec. 31, 2019 and are included in equity in a joint venture and other investments in the table above.
The following table presents the adjustments on the non-readily marketable equity securities.
|
| | | | | | | | | | | | | | | | | | |
| Adjustments on non-readily marketable equity securities | Life-to-date |
|
| (in millions) | 2Q20 | 1Q20 | 2Q19 | YTD20 |
| YTD19 |
|
| Upward adjustments | $ | 2 |
| $ | 4 |
| $ | 2 |
| $ | 6 |
| $ | 2 |
| $ | 38 |
|
| Downward adjustments | — |
| — |
| (1 | ) | — |
| (1 | ) | (4 | ) |
| Net adjustments | $ | 2 |
| $ | 4 |
| $ | 1 |
| $ | 6 |
| $ | 1 |
| $ | 34 |
|
Qualified affordable housing project investments
We invest in affordable housing projects primarily to satisfy the Company’s requirements under the Community Reinvestment Act. Our total investment in qualified affordable housing projects totaled $988 million$1.0 billion at Sept.both June 30, 20172020 and $914 million at Dec. 31, 2016.2019. Commitments to fund future investments in qualified
affordable housing projects totaled $439$363 million at Sept.June 30, 20172020 and $369$422 million at Dec. 31, 2016.2019 and are recorded in other liabilities. A summary of the commitments to fund future investments is as follows: 20172020 – $75$72 million; 20182021 –
$161 $179 million; 20192022 – $107$82 million; 20202023 – $79$5 million; 20212024 – $1$1 million; and 20222025 and thereafter – $16$24 million.
Tax credits and other tax benefits recognized were $39 million in the third quarter of 2017, $39 million in the third quarter of 2016, $38 million in the second quarter of 2017, $1152020, $38 million in the first nine monthsquarter of 20172020 and $115$39 million in the second quarter of 2019, $76 million in the first ninesix months of 2016.2020 and $78 million in the first six months of 2019.
Amortization expense included in the provision for income taxes was $29 million in the third quarter of 2017, $30 million in the third quarter of 2016, $28$31 million in the second quarter of 2017, $842020, $31 million in the first nine monthsquarter of 20172020 and $86$32 million in the second quarter of 2019, $62 million in the first ninesix months of 2016.2020 and $64 million in the first six months of 2019.
Certain seed capital and private equity investmentsInvestments valued using net asset value (“NAV”) per share
In our Investment and Wealth Management business, we manage investment assets, including equities, fixed income, money market and alternative investment funds for institutions and other investors. As part of that activity, we make seed capital investments in certain funds. BNY Mellonfunds we manage. We also holdshold private equity investments, specifically in small business investment companies (“SBICs”), which are compliant with the Volcker Rule.Rule, and certain other corporate investments. Seed capital, and private equity and other corporate investments are generally included in other assets. Certain risk retention investments in our CLOs are classified as available-for-sale securities.
assets on the consolidated balance sheet. The fair value of certain of these investments has beenwas estimated using the NAV per share of BNY Mellon’sfor our ownership interest in the funds.
The table below presents information abouton our investments in seed capital and private equity investments that have been valued using NAV.
|
| | | | | | | | | | | | | | | |
| Investments valued using NAV | June 30, 2020 | | Dec. 31, 2019 |
| (in millions) | Fair value |
| Unfunded commitments | | | Fair value |
| Unfunded commitments | |
Seed capital (a) | $ | 56 |
| | $ | 12 |
| | $ | 59 |
| | $ | — |
|
Private equity investments (SBICs) (b) | 91 |
| | 58 |
| | 89 |
| | 55 |
|
Other (c) | 40 |
| | — |
| | 33 |
| | — |
|
| Total | $ | 187 |
| | $ | 70 |
| | $ | 181 |
| | $ | 55 |
|
|
| | | | | | | | | | | | | | | | | | | |
| Seed capital and private equity investments valued using NAV |
| | Sept. 30, 2017 | | Dec. 31, 2016 |
(dollar amounts in millions) | Fair value |
| Unfunded commitments | | Redemption frequency | Redemption notice period | | Fair value |
| Unfunded commitments | | Redemption frequency | Redemption notice period |
Seed capital and other funds (a) | $ | 97 |
| | $ | 2 |
| Daily-quarterly | 1-95 days | | $ | 171 |
| | $ | 1 |
| Daily-quarterly | 1-180 days |
Private equity investments (SBICs) (b) | 54 |
| | 47 |
| N/A | N/A | | 43 |
| | 46 |
| N/A | N/A |
| Total | $ | 151 |
| | $ | 49 |
| | | | $ | 214 |
| | $ | 47 |
| | |
| |
| (a) | Other funds include variousPrimarily includes leveraged loans hedge funds and structured credit funds. Redemption notice periods vary by fund.funds, which are generally not redeemable. Distributions from such investments will be received as the underlying investments in the funds, which have lives of six to 11 years at June 30, 2020 and lives of six years at Dec. 31, 2019, are liquidated. |
| |
| (b) | Private equity investments primarily include Volcker Rule-compliant investments in SBICs that invest in various sectors of the economy. Private equity investments do not have redemption rights. Distributions from such investments will be received as the underlying investments in the private equity investments, which have a life of 10 years, are liquidated. |
| |
| (c) | Primarily includes investments in funds that relate to deferred compensation arrangements with employees. Investments in funds can be redeemed on a monthly to quarterly basis with redemption notice periods of up to 95 days. |
|
|
Notes to Consolidated Financial Statements(continued) |
| |
Note 8–Contract revenue
Fee revenue in Investment Services and Investment and Wealth Management is primarily variable, based on levels of assets under custody and/or administration, assets under management and the level of client-driven transactions, as specified in fee schedules. See Note 10 of the Notes to Consolidated Financial Statements in our 2019 Annual Report for information on the nature of our services and revenue recognition. See Note 24 of the Notes to Consolidated Financial Statements in our 2019 Annual Report for additional information on our principal businesses, Investment
Services and Investment and Wealth Management, and the primary services provided.
Disaggregation of contract revenue
Contract revenue is included in fee revenue on the consolidated income statement. The following table presents fee revenue related to contracts with customers, disaggregated by type of fee revenue, for each business segment. Business segment data has been determined on an internal management basis of accounting, rather than the generally accepted accounting principles used for consolidated financial reporting.
|
| | | | | | | | | | | | | | | | | | | | | | | | | | | | | | | | | | | | | | |
| Disaggregation of contract revenue by business segment |
| | Quarter ended |
| | June 30, 2020 | | March 31, 2020 | | June 30, 2019 (a) |
| (in millions) | IS |
| IWM |
| Other |
| Total |
| | IS |
| IWM |
| Other |
| Total |
| | IS |
| IWM |
| Other |
| Total |
|
| Fee revenue - contract revenue: | | | | | | | | | | | | | | |
| Investment services fees: | | | | | | | | | | | | | | |
| Asset servicing fees | $ | 1,147 |
| $ | 25 |
| $ | (15 | ) | $ | 1,157 |
| | $ | 1,127 |
| $ | 23 |
| $ | (11 | ) | $ | 1,139 |
| | $ | 1,095 |
| $ | 20 |
| $ | (6 | ) | $ | 1,109 |
|
| Clearing services fees | 431 |
| — |
| — |
| 431 |
| | 470 |
| — |
| — |
| 470 |
| | 411 |
| — |
| (1 | ) | 410 |
|
| Issuer services fees | 277 |
| — |
| — |
| 277 |
| | 263 |
| — |
| — |
| 263 |
| | 291 |
| — |
| — |
| 291 |
|
| Treasury services fees | 144 |
| — |
| 1 |
| 145 |
| | 149 |
| — |
| — |
| 149 |
| | 140 |
| 1 |
| — |
| 141 |
|
| Total investment services fees | 1,999 |
| 25 |
| (14 | ) | 2,010 |
| | 2,009 |
| 23 |
| (11 | ) | 2,021 |
| | 1,937 |
| 21 |
| (7 | ) | 1,951 |
|
| Investment management and performance fees | 4 |
| 792 |
| (5 | ) | 791 |
| | 5 |
| 862 |
| (4 | ) | 863 |
| | 4 |
| 833 |
| (4 | ) | 833 |
|
| Financing-related fees | 23 |
| 1 |
| — |
| 24 |
| | 28 |
| — |
| — |
| 28 |
| | 16 |
| — |
| 1 |
| 17 |
|
| Distribution and servicing | (7 | ) | 34 |
| — |
| 27 |
| | (12 | ) | 43 |
| — |
| 31 |
| | (13 | ) | 44 |
| — |
| 31 |
|
| Investment and other income | 62 |
| (41 | ) | 3 |
| 24 |
| | 72 |
| (50 | ) | — |
| 22 |
| | 69 |
| (48 | ) | — |
| 21 |
|
| Total fee revenue - contract revenue | 2,081 |
| 811 |
| (16 | ) | 2,876 |
| | 2,102 |
| 878 |
| (15 | ) | 2,965 |
| | 2,013 |
| 850 |
| (10 | ) | 2,853 |
|
Fee and other revenue - not in scope of Accounting Standards Codification (“ASC”) 606 (b)(c) | 258 |
| 27 |
| 54 |
| 339 |
| | 334 |
| (32 | ) | 45 |
| 347 |
| | 220 |
| 4 |
| 41 |
| 265 |
|
| Total fee and other revenue | $ | 2,339 |
| $ | 838 |
| $ | 38 |
| $ | 3,215 |
| | $ | 2,436 |
| $ | 846 |
| $ | 30 |
| $ | 3,312 |
| | $ | 2,233 |
| $ | 854 |
| $ | 31 |
| $ | 3,118 |
|
| |
| (a) | Restated to reflect the first quarter 2020 business segment reclassifications. There was no impact on total revenue, by type or in aggregate. |
| |
| (b) | Primarily includes foreign exchange and other trading revenue, investment and other income (loss), financing-related fees, asset servicing fees, net securities gains (losses), all of which are accounted for using other accounting guidance. |
| |
| (c) | The Investment and Wealth Management business includes income (loss) from consolidated investment management funds, net of noncontrolling interests, of $39 millionin the second quarter of 2020, $(20) million in the first quarter of 2020 and $6 millionin the second quarter of 2019. |
IS - Investment Services segment.
IWM - Investment and Wealth Management segment.
|
|
Notes to Consolidated Financial Statements(continued) |
|
|
| | | | | | | | | | | | | | | | | | | | | | | | | |
| Disaggregation of contract revenue by business segment | Year-to-date |
| | June 30, 2020 | | June 30, 2019 (a) |
| (in millions) | IS |
| IWM |
| Other |
| Total |
| | IS |
| IWM |
| Other |
| Total |
|
| Fee revenue - contract revenue: | | | | | | | | | |
| Investment services fees: | | | | | | | | | |
| Asset servicing fees | $ | 2,274 |
| $ | 48 |
| $ | (26 | ) | $ | 2,296 |
| | $ | 2,176 |
| $ | 40 |
| $ | (14 | ) | $ | 2,202 |
|
| Clearing services fees | 901 |
| — |
| — |
| 901 |
| | 809 |
| — |
| (1 | ) | 808 |
|
| Issuer services fees | 540 |
| — |
| — |
| 540 |
| | 542 |
| — |
| — |
| 542 |
|
| Treasury services fees | 293 |
| — |
| 1 |
| 294 |
| | 272 |
| 1 |
| — |
| 273 |
|
| Total investment services fees | 4,008 |
| 48 |
| (25 | ) | 4,031 |
| | 3,799 |
| 41 |
| (15 | ) | 3,825 |
|
| Investment management and performance fees | 9 |
| 1,654 |
| (9 | ) | 1,654 |
| | 8 |
| 1,674 |
| (8 | ) | 1,674 |
|
| Financing-related fees | 51 |
| 1 |
| — |
| 52 |
| | 33 |
| — |
| 1 |
| 34 |
|
| Distribution and servicing | (19 | ) | 77 |
| — |
| 58 |
| | (27 | ) | 89 |
| — |
| 62 |
|
| Investment and other income | 134 |
| (91 | ) | 3 |
| 46 |
| | 138 |
| (97 | ) | — |
| 41 |
|
| Total fee revenue - contract revenue | 4,183 |
| 1,689 |
| (31 | ) | 5,841 |
| | 3,951 |
| 1,707 |
| (22 | ) | 5,636 |
|
Fee and other revenue - not in scope of ASC 606 (b)(c) | 592 |
| (5 | ) | 99 |
| 686 |
| | 443 |
| 16 |
| 71 |
| 530 |
|
| Total fee and other revenue | $ | 4,775 |
| $ | 1,684 |
| $ | 68 |
| $ | 6,527 |
| | $ | 4,394 |
| $ | 1,723 |
| $ | 49 |
| $ | 6,166 |
|
| |
| (a) | Restated to reflect the first quarter 2020 business segment reclassifications. There was no impact on total revenue, by type or in aggregate. |
| |
| (b) | Primarily includes foreign exchange and other trading revenue, investment and other income (loss), financing-related fees, asset servicing fees, net securities gains (losses), all of which are accounted for using other accounting guidance. |
| |
| (c) | The Investment and Wealth Management business includes income from consolidated investment management funds, net of noncontrolling interests, of $19 million in the first six months of 2020 and $22 million in the first six months of 2019. |
IS - Investment Services segment.
IWM - Investment and Wealth Management segment.
Contract balances
Our clients are billed based on fee schedules that are agreed upon in each customer contract. Receivables from customers were $2.4 billion at both June 30, 2020 and Dec. 31, 2019.
Contract assets represent accrued revenues that have not yet been billed to the customers due to certain contractual terms other than the passage of time and were $69 million at June 30, 2020 and $32 million at Dec. 31, 2019. Accrued revenues recorded as contract assets are usually billed on an annual basis.
Both receivables from customers and contract assets are included in other assets on the consolidated balance sheet.
Contract liabilities represent payments received in advance of providing services under certain contracts and were $195 million at June 30, 2020 and $168 million at Dec. 31, 2019. Contract liabilities are included in other liabilities on the consolidated balance sheet. Revenue recognized in the second quarter of 2020 relating to contract liabilities as of March 31, 2020 was $58 million. Revenue recognized in the first six months of 2020 relating to contract liabilities as of Dec. 31, 2019 was $78 million.
Changes in contract assets and liabilities primarily relate to either party’s performance under the contracts.
Contract costs
Incremental costs for obtaining contracts that are deemed recoverable are capitalized as contract costs. Such costs result from the payment of sales incentives, primarily in the Wealth Management business, and totaled $80 million at June 30, 2020 and $86 million at Dec. 31, 2019. Capitalized sales incentives are amortized based on the transfer of goods or services to which the assets relate and typically average nine years. The amortization of capitalized sales incentives, which is primarily included in staff expense on the consolidated income statement, totaled $5 million in the second quarter of 2020, second quarter of 2019 and first quarter of 2020 and $10 million in both the first six months of 2020 and first six months of 2019.
Costs to fulfill a contract are capitalized when they relate directly to an existing contract or a specific anticipated contract, generate or enhance resources that will be used to fulfill performance obligations, and are recoverable. Such costs generally represent set-up costs, which include any direct cost incurred at the inception of a contract which enables the fulfillment of the performance obligation, and totaled
|
|
Notes to Consolidated Financial Statements(continued) |
|
$14 million at June 30, 2020 and $16 million at Dec. 31, 2019. These capitalized costs are amortized on a straight-line basis over the expected contract period, which generally ranges from seven to nine years. The amortization is included in other expense on the consolidated income statement and totaled $2 million in the second quarter of 2020 and second quarter of 2019, $1 million in the first quarter of 2020 and $3 million in the first six months of 2020 and first six months of 2019. There were 0 impairments recorded on capitalized contract costs in the first six months of 2020.
Unsatisfied performance obligations
We do not have any unsatisfied performance obligations other than those that are subject to a practical expedient election under ASC 606, Revenue From Contracts With Customers. The practical expedient election applies to (i) contracts with an original expected length of one year or less, and (ii) contracts for which we recognize revenue at the amount to which we have the right to invoice for services performed.
Note 8 - 9–Net interest revenue
The following table provides the components of net interest revenue presented on the consolidated income statement.
|
| | | | | | | | | | | | | | | | |
| Net interest revenue | Quarter ended | | Year-to-date |
| (in millions) | June 30, 2020 |
| March 31, 2020 |
| June 30, 2019 |
| | June 30, 2020 |
| June 30, 2019 |
|
| Interest revenue | | | | | | |
| Deposits with the Federal Reserve and other central banks | $ | (7 | ) | $ | 80 |
| $ | 113 |
| | $ | 73 |
| $ | 252 |
|
| Deposits with banks | 40 |
| 58 |
| 64 |
| | 98 |
| 127 |
|
| Federal funds sold and securities purchased under resale agreements | 61 |
| 396 |
| 568 |
| | 457 |
| 1,042 |
|
| Margin loans | 40 |
| 87 |
| 119 |
| | 127 |
| 254 |
|
| Non-margin loans | 230 |
| 309 |
| 365 |
| | 539 |
| 720 |
|
| Securities: | | | | | | |
| Taxable | 556 |
| 594 |
| 687 |
| | 1,150 |
| 1,393 |
|
| Exempt from federal income taxes | 6 |
| 6 |
| 10 |
| | 12 |
| 22 |
|
| Total securities | 562 |
| 600 |
| 697 |
| | 1,162 |
| 1,415 |
|
| Trading securities | 17 |
| 40 |
| 39 |
| | 57 |
| 75 |
|
| Total interest revenue | 943 |
| 1,570 |
| 1,965 |
| | 2,513 |
| 3,885 |
|
| Interest expense | | | | | | |
| Deposits | (17 | ) | 240 |
| 432 |
| | 223 |
| 823 |
|
| Federal funds purchased and securities sold under repurchase agreements | 1 |
| 275 |
| 372 |
| | 276 |
| 703 |
|
| Trading liabilities | 2 |
| 7 |
| 11 |
| | 9 |
| 18 |
|
| Other borrowed funds | 7 |
| 4 |
| 20 |
| | 11 |
| 44 |
|
| Commercial paper | 1 |
| 6 |
| 18 |
| | 7 |
| 26 |
|
| Customer payables | (1 | ) | 30 |
| 69 |
| | 29 |
| 139 |
|
| Long-term debt | 170 |
| 194 |
| 241 |
| | 364 |
| 489 |
|
| Total interest expense | 163 |
| 756 |
| 1,163 |
| | 919 |
| 2,242 |
|
| Net interest revenue | 780 |
| 814 |
| 802 |
| | 1,594 |
| 1,643 |
|
| Provision for credit losses | 143 |
| 169 |
| (8 | ) | | 312 |
| (1 | ) |
| Net interest revenue after provision for credit losses | $ | 637 |
| $ | 645 |
| $ | 810 |
| | $ | 1,282 |
| $ | 1,644 |
|
|
| | | | | | | | | | | | | | | | |
| Net interest revenue | Quarter ended | | Year-to-date |
| | Sept. 30, 2017 |
| June 30, 2017 |
| Sept. 30, 2016 |
| | Sept. 30, 2017 |
| Sept. 30, 2016 |
|
| (in millions) | |
| Interest revenue | | | | | | |
| Non-margin loans | $ | 283 |
| $ | 272 |
| $ | 218 |
| | $ | 800 |
| $ | 637 |
|
| Margin loans | 87 |
| 87 |
| 67 |
| | 249 |
| 194 |
|
| Securities: | | | | | | |
| Taxable | 510 |
| 476 |
| 434 |
| | 1,447 |
| 1,307 |
|
| Exempt from federal income taxes | 16 |
| 16 |
| 17 |
| | 49 |
| 53 |
|
| Total securities | 526 |
| 492 |
| 451 |
|
| 1,496 |
| 1,360 |
|
| Deposits with banks | 34 |
| 27 |
| 26 |
| | 83 |
| 76 |
|
| Deposits with the Federal Reserve and other central banks | 89 |
| 71 |
| 37 |
| | 217 |
| 170 |
|
| Federal funds sold and securities purchased under resale agreements | 119 |
| 86 |
| 62 |
| | 272 |
| 167 |
|
| Trading assets | 13 |
| 17 |
| 13 |
| | 46 |
| 43 |
|
| Total interest revenue | 1,151 |
| 1,052 |
| 874 |
|
| 3,163 |
| 2,647 |
|
| Interest expense | | | | | | |
| Deposits | 57 |
| 32 |
| (6 | ) | | 98 |
| 21 |
|
| Federal funds purchased and securities sold under repurchase agreements | 70 |
| 38 |
| 6 |
| | 132 |
| 28 |
|
| Trading liabilities | 2 |
| 2 |
| 2 |
| | 6 |
| 5 |
|
| Other borrowed funds | 7 |
| 4 |
| 1 |
| | 13 |
| 5 |
|
| Commercial paper | 8 |
| 5 |
| 1 |
| | 18 |
| 5 |
|
| Customer payables | 19 |
| 16 |
| 3 |
| | 42 |
| 9 |
|
| Long-term debt | 149 |
| 129 |
| 93 |
| | 397 |
| 267 |
|
| Total interest expense | 312 |
| 226 |
| 100 |
|
| 706 |
| 340 |
|
| Net interest revenue | 839 |
| 826 |
| 774 |
|
| 2,457 |
| 2,307 |
|
| Provision for credit losses | (6 | ) | (7 | ) | (19 | ) | | (18 | ) | (18 | ) |
| Net interest revenue after provision for credit losses | $ | 845 |
| $ | 833 |
| $ | 793 |
|
| $ | 2,475 |
| $ | 2,325 |
|
|
|
Notes to Consolidated Financial Statements(continued) |
|
Note 9 - 10–Employee benefit plans
The components of net periodic benefit (credit) cost are as follows.presented below. The service cost component is reflected in staff expense, whereas the remaining components are reflected in other expense.
| | | Net periodic benefit (credit) cost | Quarter ended | Quarter ended |
| Sept. 30, 2017 | | June 30, 2017 | | Sept. 30, 2016 | June 30, 2020 | | March 31, 2020 | | June 30, 2019 |
| (in millions) | Domestic pension benefits |
| Foreign pension benefits |
| Health care benefits |
| | Domestic pension benefits |
| Foreign pension benefits |
| Health care benefits |
| | Domestic pension benefits |
| Foreign pension benefits |
| Health care benefits |
| Domestic pension benefits |
| Foreign pension benefits |
| Health care benefits |
| | Domestic pension benefits |
| Foreign pension benefits |
| Health care benefits |
| | Domestic pension benefits |
| Foreign pension benefits |
| Health care benefits |
|
| Service cost | $ | — |
| $ | 7 |
| $ | — |
| | $ | — |
| $ | 7 |
| $ | — |
| | $ | — |
| $ | 8 |
| $ | 1 |
| $ | — |
| $ | 3 |
| $ | — |
| | $ | — |
| $ | 3 |
| $ | — |
| | $ | — |
| $ | 3 |
| $ | — |
|
| Interest cost | 45 |
| 8 |
| 2 |
| | 45 |
| 8 |
| 2 |
| | 45 |
| 9 |
| 2 |
| 39 |
| 6 |
| 1 |
| | 39 |
| 7 |
| 1 |
| | 45 |
| 8 |
| 1 |
|
| Expected return on assets | (81 | ) | (12 | ) | (2 | ) | | (81 | ) | (12 | ) | (2 | ) | | (82 | ) | (13 | ) | (2 | ) | (79 | ) | (9 | ) | (2 | ) | | (80 | ) | (10 | ) | (1 | ) | | (84 | ) | (12 | ) | (2 | ) |
| Other | 17 |
| 9 |
| (1 | ) | | 17 |
| 9 |
| (1 | ) | | 17 |
| 4 |
| (1 | ) | 21 |
| 3 |
| — |
| | 22 |
| 3 |
| (1 | ) | | 13 |
| 1 |
| — |
|
| Net periodic benefit (credit) cost | $ | (19 | ) | $ | 12 |
| $ | (1 | ) | | $ | (19 | ) | $ | 12 |
| $ | (1 | ) | | $ | (20 | ) | $ | 8 |
| $ | — |
| $ | (19 | ) | $ | 3 |
| $ | (1 | ) | | $ | (19 | ) | $ | 3 |
| $ | (1 | ) | | $ | (26 | ) | $ | — |
| $ | (1 | ) |
|
| | | | | | | | | | | | | | | | | | | |
| Net periodic benefit (credit) cost | Year-to-date |
| | June 30, 2020 | | June 30, 2019 |
| (in millions) | Domestic pension benefits |
| Foreign pension benefits |
| Health care benefits |
| | Domestic pension benefits |
| Foreign pension benefits |
| Health care benefits |
|
| Service cost | $ | — |
| $ | 6 |
| $ | — |
| | $ | — |
| $ | 6 |
| $ | — |
|
| Interest cost | 78 |
| 13 |
| 2 |
| | 89 |
| 16 |
| 3 |
|
| Expected return on assets | (159 | ) | (19 | ) | (3 | ) | | (168 | ) | (23 | ) | (4 | ) |
| Other | 43 |
| 6 |
| (1 | ) | | 26 |
| 1 |
| (1 | ) |
| Net periodic benefit (credit) cost | $ | (38 | ) | $ | 6 |
| $ | (2 | ) | | $ | (53 | ) | $ | — |
| $ | (2 | ) |
78 BNY Mellon
|
|
Notes to Consolidated Financial Statements(continued)
|
|
|
| | | | | | | | | | | | | | | | | | | |
| Net periodic benefit (credit) cost | | Year-to-date | | |
| | Sept. 30, 2017 | | Sept. 30, 2016 |
| (in millions) | Domestic pension benefits |
| Foreign pension benefits |
| Health care benefits |
| | Domestic pension benefits |
| Foreign pension benefits |
| Health care benefits |
|
| Service cost | $ | — |
| $ | 21 |
| $ | — |
| | $ | — |
| $ | 24 |
| $ | 3 |
|
| Interest cost | 135 |
| 24 |
| 6 |
| | 135 |
| 27 |
| 6 |
|
| Expected return on assets | (243 | ) | (36 | ) | (6 | ) | | (246 | ) | (39 | ) | (6 | ) |
| Other | 51 |
| 27 |
| (3 | ) | | 52 |
| 13 |
| (3 | ) |
| Net periodic benefit (credit) cost | $ | (57 | ) | $ | 36 |
| $ | (3 | ) | | $ | (59 | ) | $ | 25 |
| $ | — |
|
Note 10 - 11–Income taxes
BNY Mellon recorded an income tax provision of $348$216 million (25.4% (18.3% effective tax rate) in the thirdsecond quarter of 2017. The income tax provision was $3242020, $264 million (24.6% (20.5% effective tax rate) in the thirdsecond quarter of 20162019 and $332$265 million (25.4% (21.6% effective tax rate) in the secondfirst quarter of 2017.2020.
Our total tax reserves as of Sept.June 30, 20172020 were $157$178 million compared with $143$173 million at June 30, 2017.Dec. 31, 2019. If these tax reserves were unnecessary, $157$178 million would affect the effective tax rate in future periods. We recognize accrued interest and penalties, if applicable, related to income taxes in income tax expense. Included in the balance sheet at Sept.June 30, 20172020 is accrued interest, where applicable, of $24
$34 million. The additional tax expense related to interest for the ninesix months ended Sept.June 30, 20172020 was $7$3 million, compared with $2$6 million for the ninesix months ended Sept.June 30, 2016.2019.
It is reasonably possible the total reserve for uncertain tax positions could decrease within the next 12 months by approximately $57$100 million as a result of adjustments related to tax years that are still subject to examination.
Our federal income tax returns are closed to examination through 2013.2016. Our New York State,New York City and UK income tax returns are closed to examination through 2012.
|
|
Notes to Consolidated Financial Statements(continued) |
|
Note 11 - 12–Variable interest entities and securitization
BNY Mellon hasWe have variable interests in VIEs,variable interest entities (“VIEs”), which include investments in retail, institutional and alternative investment funds, including collateralized loan obligation (“CLO”)CLO structures in which we provide asset management services, some of which are consolidated. The investment funds are offered to our retail and institutional clients to provide them
with access to investment vehicles with specific investment objectives and strategies that address the client’s investment needs.
BNY Mellon earnsWe earn management fees from these funds as well as performance fees in certain funds and may also provide start-up capital for its new funds. The funds are primarily financed by our customers’ investments in the funds’ equity or debt.
Additionally, BNY Mellon investswe invest in qualified affordable housing and renewable energy projects, which are designed to generate a return primarily through the realization of tax credits by the Company.credits. The projects, which are structured as limited partnerships and LLCs,limited liability companies, are also VIEs, but are not consolidated.
The VIEs discussed above are included in the scope of ASU 2015-02, which was adopted effective Jan. 1, 2015, and are reviewed for consolidation based on the guidance in ASC 810, Consolidation.We reconsider and reassess whether or not we are the primary beneficiary of a VIE when governing documents or contractual arrangements are changed that would reallocate the obligation to absorb expected losses or receive expected residual returns between BNY Mellon and the other investors. This could occur when BNY Mellon disposes of its variable interests in the fund, when additional variable interests are issued to other investors or when we acquire additional variable interests in the VIE.
The following tables presenttable presents the incremental assets and liabilities included in BNY Mellon’sthe consolidated financial statements, after applying intercompany eliminations,balance sheet as of Sept.June 30, 20172020 and Dec. 31, 2016. 2019. The net assets of any consolidated VIE are solely available to settle the liabilities of the VIE and to settle any investors’ ownership liquidation requests, including any seed capital we invested in the VIE by BNY Mellon.
VIE.
|
| | | | | | | | | | | | | | | | | | | | | |
| Consolidated investments | June 30, 2020 | | Dec. 31, 2019 |
| (in millions) | Investment Management funds | Securitization |
| Total consolidated investments |
| | Investment Management funds | Securitization |
| Total consolidated investments |
|
| Trading assets | $ | 450 |
| | $ | 400 |
| $ | 850 |
| | $ | 229 |
| | $ | 400 |
| $ | 629 |
|
| Other assets | 10 |
| | — |
| 10 |
| | 16 |
| | — |
| 16 |
|
| Total assets | $ | 460 |
| (a) | $ | 400 |
| $ | 860 |
| | $ | 245 |
| (b) | $ | 400 |
| $ | 645 |
|
| Other liabilities | $ | 4 |
| | $ | 399 |
| $ | 403 |
| | $ | 1 |
| | $ | 387 |
| $ | 388 |
|
| Total liabilities | $ | 4 |
| (a) | $ | 399 |
| $ | 403 |
| | $ | 1 |
| (b) | $ | 387 |
| $ | 388 |
|
| Nonredeemable noncontrolling interests | $ | 112 |
| (a) | $ | — |
| $ | 112 |
| | $ | 102 |
| (b) | $ | — |
| $ | 102 |
|
BNY Mellon 79
|
|
Notes to Consolidated Financial Statements(continued)
|
|
|
| | | | | | | | | | |
| Investments consolidated at Sept. 30, 2017 |
| (in millions) | Investment Management funds | Securitization |
| Total consolidated investments |
|
| Securities - Available-for-sale | $ | — |
| | $ | 400 |
| $ | 400 |
|
| Trading assets | 576 |
| | — |
| 576 |
|
| Other assets | 226 |
| | — |
| 226 |
|
| Total assets | $ | 802 |
| (a) | $ | 400 |
| $ | 1,202 |
|
| Other liabilities | $ | 27 |
| | $ | 369 |
| $ | 396 |
|
| Total liabilities | $ | 27 |
| (a) | $ | 369 |
| $ | 396 |
|
| Nonredeemable noncontrolling interests | $ | 384 |
| (a) | $ | — |
| $ | 384 |
|
| |
| (a) | Includes voting model entities (“VMEs”) with assets of $90$283 million, liabilities of $2$1 million and nonredeemable noncontrolling interests of $20$37 million. |
|
| | | | | | | | | | |
| Investments consolidated at Dec. 31, 2016 |
| (in millions) | Investment Management funds | Securitization |
| Total consolidated investments |
|
| Securities - Available-for-sale | $ | — |
| | $ | 400 |
| $ | 400 |
|
| Trading assets | 979 |
| | — |
| 979 |
|
| Other assets | 252 |
| | — |
| 252 |
|
| Total assets | $ | 1,231 |
| (a) | $ | 400 |
| $ | 1,631 |
|
| Trading liabilities | $ | 282 |
| | $ | — |
| $ | 282 |
|
| Other liabilities | 33 |
| | 363 |
| 396 |
|
| Total liabilities | $ | 315 |
| (a) | $ | 363 |
| $ | 678 |
|
| Nonredeemable noncontrolling interests | $ | 618 |
| (a) | $ | — |
| $ | 618 |
|
| |
(a)(b) | Includes VMEs with assets of $114$50 million, liabilities of $3$1 million and nonredeemable noncontrolling interests of $25$1 million. |
BNY Mellon hasWe have not provided financial or other support that was not otherwise contractually required to be provided to our VIEs. Additionally, creditors of any consolidated VIEs do not have any recourse to the general credit of BNY Mellon.
Non-consolidated VIEs
As of Sept.June 30, 20172020 and Dec. 31, 2016,2019, the following assets and liabilities related to the VIEs where BNY Mellon is we are
not the primary beneficiary arewere included in our consolidated financial statementsbalance sheets and primarily relaterelated to accounting for our investments in qualified affordable housing and renewable energy projects.
|
| | | | | | | | | |
| Non-consolidated VIEs at Sept. 30, 2017 |
| (in millions) | Assets |
| Liabilities |
| Maximum loss exposure |
|
Securities - Available-for-sale (a) | $ | 143 |
| $ | — |
| $ | 143 |
|
| Other | 2,559 |
| 439 |
| 3,321 |
|
| |
(a) | Investments in the Company’s sponsored CLOs. |
|
| | | | | | | | | |
| Non-consolidated VIEs at Dec. 31, 2016 |
| (in millions) | Assets |
| Liabilities |
| Maximum loss exposure |
|
Securities - Available-for-sale (a) | $ | 42 |
| $ | — |
| $ | 42 |
|
| Other | 2,400 |
| 369 |
| 2,769 |
|
| |
(a) | Investments in the Company’s sponsored CLOs. |
The maximum loss exposure indicated in the above tablestable below relates solely to BNY Mellon’sour investments in, and unfunded commitments to, the VIEs.
|
| | | | | | | | | | | | | | | | | | | |
| Non-consolidated VIEs | June 30, 2020 | | Dec. 31, 2019 |
| (in millions) | Assets |
| Liabilities |
| Maximum loss exposure |
| | Assets |
| Liabilities |
| Maximum loss exposure |
|
Securities - Available-for-sale (a) | $ | 199 |
| $ | — |
| $ | 199 |
| | $ | 208 |
| $ | — |
| $ | 208 |
|
| Other | 2,237 |
| 363 |
| 2,609 |
| | 2,400 |
| 422 |
| 2,822 |
|
| |
| (a) | Includes investments in the Company’s sponsored CLOs. |
|
|
Notes to Consolidated Financial Statements(continued) |
| |
Note 12 - 13–Preferred stock
BNY MellonThe Parent has 100 million authorized shares of preferred stock with a par value of $0.01 per share. The following table summarizes BNY Mellon’sthe Parent’s preferred stock issued and outstanding at Sept.June 30, 20172020 and Dec. 31, 2016.2019.
| | Preferred stock summary (a) | Preferred stock summary (a) | Total shares issued and outstanding | | Carrying value (b) | Preferred stock summary (a) | Total shares issued and outstanding | | Carrying value (b) |
| | | | (in millions) |
| | | Total shares issued and outstanding | (in millions) | | June 30, 2020 |
| Dec. 31, 2019 |
| June 30, 2020 |
| Dec. 31, 2019 |
|
| | Per annum dividend rate | | Sept. 30, 2017 |
| Dec. 31, 2016 |
| Per annum dividend rate |
| Series A | Greater of (i) three-month LIBOR plus 0.565% for the related distribution period; or (ii) 4.000% | 5,001 |
| 5,001 |
| $ | 500 |
| $ | 500 |
| Greater of (i) three-month LIBOR plus 0.565% for the related distribution period; or (ii) 4.000% | 5,001 |
| 5,001 |
| | $ | 500 |
| $ | 500 |
|
| Series C | 5.2% | 5,825 |
| 5,825 |
| 568 |
| 568 |
| 5.2% | 5,825 |
| 5,825 |
| | 568 |
| 568 |
|
| Series D | 4.50% to but excluding June 20, 2023, then a floating rate equal to the three-month LIBOR plus 2.46% | 5,000 |
| 5,000 |
| | 494 |
| 494 |
| 4.50% to but excluding June 20, 2023, then a floating rate equal to the three-month LIBOR plus 2.46% | 5,000 |
| 5,000 |
| | 494 |
| 494 |
|
| Series E | 4.95% to and including June 20, 2020, then a floating rate equal to the three-month LIBOR plus 3.42% | 10,000 |
| 10,000 |
| | 990 |
| 990 |
| 4.95% to but excluding June 20, 2020, then a floating rate equal to the three-month LIBOR plus 3.42% | 10,000 |
| 10,000 |
| | 990 |
| 990 |
|
| Series F | 4.625% to and including Sept. 20, 2026, then a floating rate equal to the three-month LIBOR plus 3.131% | 10,000 |
| 10,000 |
| | 990 |
| 990 |
| 4.625% to but excluding Sept. 20, 2026, then a floating rate equal to the three-month LIBOR plus 3.131% | 10,000 |
| 10,000 |
| | 990 |
| 990 |
|
| Series G | | 4.70% to but excluding Sept. 20, 2025, then a floating rate equal to the five-year treasury rate plus 4.358% | 10,000 |
| — |
| | 990 |
| — |
|
| Total | Total | 35,826 |
| 35,826 |
| | $ | 3,542 |
| $ | 3,542 |
| Total | 45,826 |
| 35,826 |
| | $ | 4,532 |
| $ | 3,542 |
|
| |
| (a) | All outstanding preferred stock is noncumulative perpetual preferred stock with a liquidation preference of $100,000 per share. |
| |
| (b) | The carrying value of the Series C, Series D, Series E, Series F and Series FG preferred stock is recorded net of issuance costs. |
On Sept. 20, 2017, The Bank of New York Mellon Corporation paidIn May 2020, the following dividends for the noncumulative perpetual preferred stock for the dividend period ending in September 2017 to holders of record as of the close of business on Sept. 5, 2017:
$1,022.22 per share on the Series A Preferred Stock (equivalent to $10.2222 per Normal Preferred Capital Security of Mellon Capital IV,Parent issued 1,000,000 depositary shares, each representing a 1/100th interest in a share of the Parent’s Series AG Noncumulative Perpetual Preferred Stock);
$1,300.00 per shareStock (the “Series G Preferred Stock”). The Parent will pay dividends on the Series CG Preferred Stock, (equivalentif declared by its board of directors on each March 20 and September 20, at an annual rate of 4.70%, from the original issue date to $0.3250 per depositary share, each representing a 1/4,000th interest in a share of the Series C Preferred Stock); andbut
$2,312.50 per shareexcluding Sept. 20, 2025; and at a floating rate equal to the five-year treasury rate on the Series F Preferred Stock (equivalentdate that is three business days prior to $23.1250 per depositary share,the reset date plus 4.358% for each representing a 1/100th interest in a sharereset period, from and including Sept. 20, 2025. The floating rate will initially reset on Sept. 20, 2025 and subsequently on each date falling on the fifth anniversary of the Series F Preferred Stock).preceding reset date.
The table below presents the dividends paid on the Parent’s preferred stock.
|
| | | | | | | | | | | | | | | | | | | | | | | | | | | | | | | | | | | | | | | |
| Preferred dividends paid | | | | | | | | | | | | |
| (dollars in millions, except per share amounts) | Depositary shares per share | | 2Q20 | | 1Q20 | | 2Q19 | | YTD20 | | YTD19 |
| | Per share |
| Total
dividend |
| | Per share |
| Total
dividend |
| | Per share |
| Total
dividend |
| | Per share |
| Total
dividend |
| | Per share |
| Total
dividend |
|
| Series A | | 100 |
| (a) | | $ | 1,022.22 |
| $ | 5 |
| | $ | 1,011.11 |
| $ | 5 |
| | $ | 1,022.22 |
| $ | 5 |
| | $ | 2,033.33 |
| $ | 10 |
| | $ | 2,022.22 |
| $ | 10 |
|
| Series C | | 4,000 |
| | | 1,300.00 |
| 8 |
| | 1,300.00 |
| 8 |
| | 1,300.00 |
| 7 |
| | 2,600.00 |
| 16 |
| | 2,600.00 |
| 15 |
|
| Series D | | 100 |
| | | 2,250.00 |
| 11 |
| | N/A |
| — |
| | 2,250.00 |
| 11 |
| | 2,250.00 |
| 11 |
| | 2,250.00 |
| 11 |
|
| Series E | | 100 |
| | | 2,475.00 |
| 25 |
| | N/A |
| — |
| | 2,475.00 |
| 25 |
| | 2,475.00 |
| 25 |
| | 2,475.00 |
| 25 |
|
| Series F | | 100 |
| | | N/A |
| — |
| | 2,312.50 |
| 23 |
| | N/A |
| — |
| | 2,312.50 |
| 23 |
| | 2,312.50 |
| 23 |
|
| Total | | | | | | $ | 49 |
| | | $ | 36 |
| | | $ | 48 |
| | | $ | 85 |
| | | $ | 84 |
|
| |
| (a) | Represents Normal Preferred Capital Securities. |
N/A - Not applicable.
For additional information on the preferred stock, see Note 1315 of the Notes to Consolidated Financial Statements in our 20162019 Annual Report.
Terms of the Series A, Series C, Series D, Series E and Series F preferred stock are more fully described in each of their Certificates of Designations, each of which is filed as an Exhibit to this Form 10-Q.
|
|
Notes to Consolidated Financial Statements(continued) |
| |
Note 13 - 14–Other comprehensive income (loss)
|
| | | | | | | | | | | | | | | | | | | | | | | | | | | | | |
| Components of other comprehensive income (loss) | Quarter ended |
| June 30, 2020 | | March 31, 2020 | | June 30, 2019 |
| (in millions) | Pre-tax
amount |
| Tax
(expense)
benefit |
| After-tax
amount |
| | Pre-tax
amount |
| Tax
(expense)
benefit |
| After-tax
amount |
| | Pre-tax
amount |
| Tax
(expense)
benefit |
| After-tax
amount |
|
| Foreign currency translation: | | | | | | | | | | | |
Foreign currency translation adjustments arising during the period (a) | $ | 104 |
| $ | 11 |
| $ | 115 |
| | $ | (265 | ) | $ | (104 | ) | $ | (369 | ) | | $ | 29 |
| $ | (19 | ) | $ | 10 |
|
| Total foreign currency translation | 104 |
| 11 |
| 115 |
| | (265 | ) | (104 | ) | (369 | ) | | 29 |
| (19 | ) | 10 |
|
| Unrealized gain (loss) on assets available-for-sale: | | | | | | | | | | | |
| Unrealized gain (loss) arising during period | 989 |
| (236 | ) | 753 |
| | 243 |
| (60 | ) | 183 |
| | 384 |
| (97 | ) | 287 |
|
Reclassification adjustment (b) | (9 | ) | 2 |
| (7 | ) | | (9 | ) | 2 |
| (7 | ) | | (7 | ) | 2 |
| (5 | ) |
| Net unrealized gain (loss) on assets available-for-sale | 980 |
| (234 | ) | 746 |
| | 234 |
| (58 | ) | 176 |
| | 377 |
| (95 | ) | 282 |
|
| Defined benefit plans: | | | | | | | | | | | |
Amortization of prior service credit, net loss and initial obligation included in net periodic benefit cost (b) | 24 |
| (5 | ) | 19 |
| | 24 |
| (6 | ) | 18 |
| | 12 |
| (2 | ) | 10 |
|
| Total defined benefit plans | 24 |
| (5 | ) | 19 |
| | 24 |
| (6 | ) | 18 |
| | 12 |
| (2 | ) | 10 |
|
| Unrealized gain (loss) on cash flow hedges: | | | | | | | | | | | |
| Unrealized hedge gain (loss) arising during period | 3 |
| (1 | ) | 2 |
| | (13 | ) | 3 |
| (10 | ) | | 2 |
| (2 | ) | — |
|
| Reclassification of net (gain) loss to net income: | | | | | | | | | | | |
| Foreign exchange (“FX”) contracts - staff expense | 3 |
| (1 | ) | 2 |
| | (1 | ) | — |
| (1 | ) | | — |
| — |
| — |
|
| Total reclassifications to net income | 3 |
| (1 | ) | 2 |
| | (1 | ) | — |
| (1 | ) | | — |
| — |
| — |
|
| Net unrealized gain (loss) on cash flow hedges | 6 |
| (2 | ) | 4 |
| | (14 | ) | 3 |
| (11 | ) | | 2 |
| (2 | ) | — |
|
| Total other comprehensive income (loss) | $ | 1,114 |
| $ | (230 | ) | $ | 884 |
| | $ | (21 | ) | $ | (165 | ) | $ | (186 | ) | | $ | 420 |
| $ | (118 | ) | $ | 302 |
|
|
| | | | | | | | | | | | | | | | | | | | | | | | | | | | | |
| Components of other comprehensive income (loss) | Quarter ended |
| Sept. 30, 2017 | | June 30, 2017 | | Sept. 30, 2016 |
| (in millions) | Pre-tax amount |
| Tax (expense) benefit |
| After-tax amount |
| | Pre-tax amount |
| Tax (expense) benefit |
| After-tax amount |
| | Pre-tax amount |
| Tax (expense) benefit |
| After-tax amount |
|
| Foreign currency translation: | | | | | | | | | | | |
Foreign currency translation adjustments arising during the period (a) | $ | 221 |
| $ | 65 |
| $ | 286 |
| | $ | 249 |
| $ | 81 |
| $ | 330 |
| | $ | (104 | ) | $ | (82 | ) | $ | (186 | ) |
| Total foreign currency translation | 221 |
| 65 |
| 286 |
| | 249 |
| 81 |
| 330 |
| | (104 | ) | (82 | ) | (186 | ) |
| Unrealized gain (loss) on assets available-for-sale: | | | | | | | | | | | |
| Unrealized gain (loss) arising during period | 47 |
| (19 | ) | 28 |
| | 146 |
| (55 | ) | 91 |
| | (87 | ) | 34 |
| (53 | ) |
Reclassification adjustment (b) | (19 | ) | 7 |
| (12 | ) | | — |
| (1 | ) | (1 | ) | | (24 | ) | 9 |
| (15 | ) |
| Net unrealized gain (loss) on assets available-for-sale | 28 |
| (12 | ) | 16 |
| | 146 |
| (56 | ) | 90 |
| | (111 | ) | 43 |
| (68 | ) |
| Defined benefit plans: | | | | | | | | | | | |
| Net gain (loss) arising during the period | — |
| — |
| — |
| | — |
| — |
| — |
| | — |
| — |
| — |
|
Amortization of prior service credit, net loss and initial obligation included in net periodic benefit cost (b) | 25 |
| (10 | ) | 15 |
| | 24 |
| (8 | ) | 16 |
| | 22 |
| (8 | ) | 14 |
|
| Total defined benefit plans | 25 |
| (10 | ) | 15 |
| | 24 |
| (8 | ) | 16 |
| | 22 |
| (8 | ) | 14 |
|
| Unrealized gain (loss) on cash flow hedges: | | | | | | | | | | | |
| Unrealized hedge gain (loss) arising during period | (2 | ) | — |
| (2 | ) | | (8 | ) | 4 |
| (4 | ) | | (24 | ) | 7 |
| (17 | ) |
Reclassification adjustment (b) | 3 |
| (1 | ) | 2 |
| | 9 |
| (4 | ) | 5 |
| | 28 |
| (9 | ) | 19 |
|
| Net unrealized gain (loss) on cash flow hedges | 1 |
| (1 | ) | — |
| | 1 |
| — |
| 1 |
| | 4 |
| (2 | ) | 2 |
|
| Total other comprehensive income (loss) | $ | 275 |
| $ | 42 |
| $ | 317 |
| | $ | 420 |
| $ | 17 |
| $ | 437 |
| | $ | (189 | ) | $ | (49 | ) | $ | (238 | ) |
| |
| (a) | Includes the impact of hedges of net investments in foreign subsidiaries. See Note 1617 for additional information. |
| |
| (b) | The reclassification adjustment related to the unrealized gain (loss) on assets available-for-sale is recorded as net securities gains on the Consolidated Income Statement.consolidated income statement. The amortization of prior service credit, net loss and initial obligation included in net periodic benefit cost is recorded as staff expense on the Consolidated Income Statement. See Note 16 of the Notes to Consolidated Financial Statements for the location of the reclassification adjustment related to cash flow hedges on the Consolidated Income Statement.consolidated income statement. |
| | | Components of other comprehensive income (loss) | Year-to-date | Year-to-date |
| | Sept. 30, 2017 | | Sept. 30, 2016 | June 30, 2020 | | June 30, 2019 |
| (in millions) | Pre-tax amount |
| Tax (expense) benefit |
| After-tax amount |
| | Pre-tax amount |
| Tax (expense) benefit |
| After-tax amount |
| Pre-tax amount |
| Tax (expense) benefit |
| After-tax amount |
| | Pre-tax amount |
| Tax (expense) benefit |
| After-tax amount |
|
| Foreign currency translation: | | | | | | |
Foreign currency translation adjustments arising during the period (a) | $ | 566 |
| $ | 175 |
| $ | 741 |
| | $ | (223 | ) | $ | (210 | ) | $ | (433 | ) | $ | (161 | ) | $ | (93 | ) | $ | (254 | ) | | $ | 56 |
| $ | (17 | ) | $ | 39 |
|
| Total foreign currency translation | 566 |
| 175 |
| 741 |
| | (223 | ) | (210 | ) | (433 | ) | (161 | ) | (93 | ) | (254 | ) | | 56 |
| (17 | ) | 39 |
|
| Unrealized gain (loss) on assets available-for-sale: | | | | | | |
| Unrealized gain (loss) arising during period | 357 |
| (144 | ) | 213 |
| | 338 |
| (111 | ) | 227 |
| 1,232 |
| (296 | ) | 936 |
| | 706 |
| (180 | ) | 526 |
|
Reclassification adjustment (b) | (29 | ) | 10 |
| (19 | ) | | (65 | ) | 22 |
| (43 | ) | (18 | ) | 4 |
| (14 | ) | | (8 | ) | 2 |
| (6 | ) |
| Net unrealized gain (loss) on assets available-for-sale | 328 |
| (134 | ) | 194 |
| | 273 |
| (89 | ) | 184 |
| 1,214 |
| (292 | ) | 922 |
| | 698 |
| (178 | ) | 520 |
|
| Defined benefit plans: | | | | | | |
| Net gain (loss) arising during the period | 3 |
| (1 | ) | 2 |
| | 3 |
| (1 | ) | 2 |
| — |
| — |
| — |
| | (11 | ) | 2 |
| (9 | ) |
Amortization of prior service credit, net loss and initial obligation included in net periodic benefit cost (b) | 74 |
| (25 | ) | 49 |
| | 65 |
| (22 | ) | 43 |
| 48 |
| (11 | ) | 37 |
| | 25 |
| (5 | ) | 20 |
|
| Total defined benefit plans | 77 |
| (26 | ) | 51 |
| | 68 |
| (23 | ) | 45 |
| 48 |
| (11 | ) | 37 |
| | 14 |
| (3 | ) | 11 |
|
| Unrealized gain (loss) on cash flow hedges: | | | | |
| Unrealized hedge gain (loss) arising during period | 4 |
| (1 | ) | 3 |
| | (115 | ) | 38 |
| (77 | ) | |
Reclassification adjustment (b) | 13 |
| (5 | ) | 8 |
| | 110 |
| (37 | ) | 73 |
| |
| Net unrealized gain (loss) on cash flow hedges | 17 |
| (6 | ) | 11 |
| | (5 | ) | 1 |
| (4 | ) | |
| Unrealized (loss) gain on cash flow hedges: | | | | |
| Unrealized hedge (loss) gain arising during period | | (10 | ) | 2 |
| (8 | ) | | 8 |
| (6 | ) | 2 |
|
Reclassification of net loss (gain) to net income: | | | | |
| FX contracts - staff expense | | 2 |
| (1 | ) | 1 |
| | 1 |
| 2 |
| 3 |
|
| Total reclassifications to net income | | 2 |
| (1 | ) | 1 |
| | 1 |
| 2 |
| 3 |
|
| Net unrealized (loss) gain on cash flow hedges | | (8 | ) | 1 |
| (7 | ) | | 9 |
| (4 | ) | 5 |
|
| Total other comprehensive income (loss) | $ | 988 |
| $ | 9 |
| $ | 997 |
| | $ | 113 |
| $ | (321 | ) | $ | (208 | ) | $ | 1,093 |
| $ | (395 | ) | $ | 698 |
| | $ | 777 |
| $ | (202 | ) | $ | 575 |
|
| |
| (a) | Includes the impact of hedges of net investments in foreign subsidiaries. See Note 1617 for additional information. |
| |
| (b) | The reclassification adjustment related to the unrealized gain (loss) on assets available-for-sale is recorded as net securities gains on the Consolidated Income Statement.consolidated income statement. The amortization of prior service credit, net loss and initial obligation included in net periodic benefit cost is recorded as staff expense on the Consolidated Income Statement. See Note 16 of the Notes to Consolidated Financial Statements for the location of the reclassification adjustment related to cash flow hedges on the Consolidated Income Statement.consolidated income statement. |
|
|
Notes to Consolidated Financial Statements(continued) |
| |
Note 14 - 15–Fair value measurement
Fair value is defined as the price that would be received to sell an asset, or paid to transfer a liability, in an orderly transaction between market participants at the measurement date. A three-level hierarchy for fair value measurements is utilized based upon the transparency of inputs to the valuation of an asset or liability as of the measurement date. BNY Mellon’s own creditworthiness is considered when valuing liabilities. See Note 1820 of the Notes to Consolidated Financial Statements in our 20162019 Annual Report for
information on how we determine fair value and the fair value hierarchy.
The following tables present the financial instruments carried at fair value at Sept.June 30, 20172020 and Dec. 31, 2016,2019, by caption on the consolidated balance sheet and by the three-level valuation hierarchy. We have included credit ratings information in certain of the tables because the information indicates the degree of credit risk to which we are exposed, and significant changes in ratings classifications could result in increased risk for us. There were no material transfers between Level 1 and Level 2 during the third quarter of 2017.
| | | Assets measured at fair value on a recurring basis at Sept. 30, 2017 | Total carrying
value |
| |
| (dollar amounts in millions) | Level 1 |
| Level 2 |
| Level 3 |
| Netting (a) |
| |
| Assets measured at fair value on a recurring basis at June 30, 2020 | | Assets measured at fair value on a recurring basis at June 30, 2020 | Total carrying
value |
|
| (dollars in millions) | | Level 1 |
| Level 2 |
| Level 3 |
| Netting (a) |
|
| Available-for-sale securities: | | |
| Agency RMBS | | $ | — |
| $ | 26,437 |
| $ | — |
| $ | — |
| $ | 26,437 |
|
| U.S. Treasury | $ | 15,502 |
| $ | — |
| $ | — |
| $ | — |
| $ | 15,502 |
| 25,137 |
| — |
| — |
| — |
| 25,137 |
|
| Sovereign debt/sovereign guaranteed | | 8,570 |
| 7,317 |
| — |
| — |
| 15,887 |
|
| Agency commercial MBS | | — |
| 9,988 |
| — |
| — |
| 9,988 |
|
| Foreign covered bonds | | — |
| 5,519 |
| — |
| — |
| 5,519 |
|
| Supranational | | — |
| 5,448 |
| — |
| — |
| 5,448 |
|
| CLOs | | — |
| 4,432 |
| — |
| — |
| 4,432 |
|
| Foreign government agencies | | — |
| 3,578 |
| — |
| — |
| 3,578 |
|
| U.S. government agencies | — |
| 864 |
| — |
| — |
| 864 |
| — |
| 2,806 |
| — |
| — |
| 2,806 |
|
| Sovereign debt/sovereign guaranteed | 74 |
| 12,491 |
| — |
| — |
| 12,565 |
| |
| Other ABS | | — |
| 2,743 |
| — |
| — |
| 2,743 |
|
| Non-agency commercial MBS | | — |
| 2,630 |
| — |
| — |
| 2,630 |
|
| Commercial paper/CDs | | — |
| 1,853 |
| — |
| — |
| 1,853 |
|
Non-agency RMBS (b) | | — |
| 1,598 |
| — |
| — |
| 1,598 |
|
| State and political subdivisions | — |
| 3,124 |
| — |
| — |
| 3,124 |
| — |
| 1,179 |
| — |
| — |
| 1,179 |
|
| Agency RMBS | — |
| 24,431 |
| — |
| — |
| 24,431 |
| |
| Non-agency RMBS | — |
| 525 |
| — |
| — |
| 525 |
| |
| Other RMBS | — |
| 265 |
| — |
| — |
| 265 |
| |
| Commercial MBS | — |
| 965 |
| — |
| — |
| 965 |
| |
| Agency commercial MBS | — |
| 9,010 |
| — |
| — |
| 9,010 |
| |
| CLOs | — |
| 2,550 |
| — |
| — |
| 2,550 |
| |
| Other asset-backed securities | — |
| 1,157 |
| — |
| — |
| 1,157 |
| |
| Equity securities | 4 |
| — |
| — |
| — |
| 4 |
| |
Money market funds (b) | 939 |
| — |
| — |
| — |
| 939 |
| |
| Corporate bonds | — |
| 1,275 |
| — |
| — |
| 1,275 |
| — |
| 831 |
| — |
| — |
| 831 |
|
| Other debt securities | — |
| 3,151 |
| — |
| — |
| 3,151 |
| — |
| 1 |
| — |
| — |
| 1 |
|
| Foreign covered bonds | 2,284 |
| 258 |
| — |
| — |
| 2,542 |
| |
Non-agency RMBS (c) | — |
| 1,185 |
| — |
| — |
| 1,185 |
| |
| Total available-for-sale securities | 18,803 |
| 61,251 |
| — |
| — |
| 80,054 |
| 33,707 |
| 76,360 |
| — |
| — |
| 110,067 |
|
| Trading assets: | | |
Debt and equity instruments (b) | 433 |
| 1,016 |
| — |
| — |
| 1,449 |
| |
| Debt instruments | | 4,782 |
| 2,775 |
| — |
| — |
| 7,557 |
|
Equity instruments (c) | | 2,397 |
| — |
| — |
| — |
| 2,397 |
|
| Derivative assets not designated as hedging: | | |
| Interest rate | 3 |
| 6,731 |
| — |
| (5,301 | ) | 1,433 |
| 5 |
| 5,496 |
| — |
| (2,436 | ) | 3,065 |
|
| Foreign exchange | — |
| 4,879 |
| — |
| (3,120 | ) | 1,759 |
| — |
| 4,322 |
| — |
| (3,204 | ) | 1,118 |
|
| Equity and other contracts | 1 |
| 73 |
| — |
| (49 | ) | 25 |
| 2 |
| 11 |
| — |
| — |
| 13 |
|
| Total derivative assets not designated as hedging | 4 |
| 11,683 |
| — |
| (8,470 | ) | 3,217 |
| 7 |
| 9,829 |
| — |
| (5,640 | ) | 4,196 |
|
| Total trading assets | 437 |
| 12,699 |
| — |
| (8,470 | ) | 4,666 |
| 7,186 |
| 12,604 |
| — |
| (5,640 | ) | 14,150 |
|
| Other assets: | | |
| Derivative assets designated as hedging: | | |
| Interest rate | — |
| 307 |
| — |
| — |
| 307 |
| |
| Foreign exchange | — |
| 37 |
| — |
| — |
| 37 |
| — |
| 137 |
| — |
| — |
| 137 |
|
| Total derivative assets designated as hedging | — |
| 344 |
| — |
| — |
| 344 |
| — |
| 137 |
| — |
| — |
| 137 |
|
Other assets (d) | 148 |
| 184 |
| — |
| — |
| 332 |
| 52 |
| 153 |
| — |
| — |
| 205 |
|
Other assets measured at net asset value (d) | | | 151 |
| |
| Total other assets | 148 |
| 528 |
| — |
| — |
| 827 |
| |
Assets measured at NAV (d) | | | 187 |
|
| Subtotal assets of operations at fair value | 19,388 |
| 74,478 |
| — |
| (8,470 | ) | 85,547 |
| 40,945 |
| 89,254 |
| — |
| (5,640 | ) | 124,746 |
|
| Percentage of assets of operations prior to netting | 21 | % | 79 | % | — | % | | 31 | % | 69 | % | — | % | |
| Assets of consolidated investment management funds | 398 |
| 404 |
| — |
| — |
| 802 |
| 416 |
| 44 |
| — |
| — |
| 460 |
|
| Total assets | $ | 19,786 |
| $ | 74,882 |
| $ | — |
| $ | (8,470 | ) | $ | 86,349 |
| $ | 41,361 |
| $ | 89,298 |
| $ | — |
| $ | (5,640 | ) | $ | 125,206 |
|
| Percentage of total assets prior to netting | 21 | % | 79 | % | — | % | | 32 | % | 68 | % | — | % | |
|
|
Notes to Consolidated Financial Statements(continued) |
| |
| | | Liabilities measured at fair value on a recurring basis at Sept. 30, 2017 | Total carrying
value |
| |
| (dollar amounts in millions) | Level 1 |
| Level 2 |
| Level 3 |
| Netting (a) |
| |
| Liabilities measured at fair value on a recurring basis at June 30, 2020 | | Liabilities measured at fair value on a recurring basis at June 30, 2020 | Total carrying
value |
|
| (dollars in millions) | | Level 1 |
| Level 2 |
| Level 3 |
| Netting (a) |
|
| Trading liabilities: | | |
| Debt and equity instruments | $ | 684 |
| $ | 159 |
| $ | — |
| $ | — |
| $ | 843 |
| |
| Debt instruments | | $ | 2,589 |
| $ | 75 |
| $ | — |
| $ | — |
| $ | 2,664 |
|
| Equity instruments | | 20 |
| — |
| — |
| — |
| 20 |
|
| Derivative liabilities not designated as hedging: | | |
| Interest rate | 3 |
| 6,681 |
| — |
| (5,705 | ) | 979 |
| 7 |
| 4,661 |
| — |
| (2,680 | ) | 1,988 |
|
| Foreign exchange | — |
| 4,463 |
| — |
| (3,095 | ) | 1,368 |
| — |
| 4,036 |
| — |
| (3,134 | ) | 902 |
|
| Equity and other contracts | 3 |
| 135 |
| — |
| (75 | ) | 63 |
| 1 |
| 23 |
| — |
| (3 | ) | 21 |
|
| Total derivative liabilities not designated as hedging | 6 |
| 11,279 |
| — |
| (8,875 | ) | 2,410 |
| 8 |
| 8,720 |
| — |
| (5,817 | ) | 2,911 |
|
| Total trading liabilities | 690 |
| 11,438 |
| — |
| (8,875 | ) | 3,253 |
| 2,617 |
| 8,795 |
| — |
| (5,817 | ) | 5,595 |
|
Long-term debt (b) | — |
| 369 |
| — |
| — |
| 369 |
| |
Long-term debt (c) | | — |
| 399 |
| — |
| — |
| 399 |
|
Other liabilities – derivative liabilities designated as hedging: | | |
| Interest rate | — |
| 494 |
| — |
| — |
| 494 |
| — |
| 915 |
| — |
| — |
| 915 |
|
| Foreign exchange | — |
| 318 |
| — |
| — |
| 318 |
| — |
| 49 |
| — |
| — |
| 49 |
|
| Total other liabilities – derivative liabilities designated as hedging | — |
| 812 |
| — |
| — |
| 812 |
| — |
| 964 |
| — |
| — |
| 964 |
|
| Subtotal liabilities of operations at fair value | 690 |
| 12,619 |
| — |
| (8,875 | ) | 4,434 |
| 2,617 |
| 10,158 |
| — |
| (5,817 | ) | 6,958 |
|
| Percentage of liabilities of operations prior to netting | 5 | % | 95 | % | — | % | | 20 | % | 80 | % | — | % | |
| Liabilities of consolidated investment management funds | 2 |
| 25 |
| — |
| — |
| 27 |
| — |
| 4 |
| — |
| — |
| 4 |
|
| Total liabilities | $ | 692 |
| $ | 12,644 |
| $ | — |
| $ | (8,875 | ) | $ | 4,461 |
| $ | 2,617 |
| $ | 10,162 |
| $ | — |
| $ | (5,817 | ) | $ | 6,962 |
|
| Percentage of total liabilities prior to netting | 5 | % | 95 | % | — | % | | 20 | % | 80 | % | — | % | |
| |
| (a) | ASC 815, Derivatives and Hedging, permits the netting of derivative receivables and derivative payables under legally enforceable master netting agreements and permits the netting of cash collateral. Netting is applicable to derivatives not designated as hedging instruments included in trading assets or trading liabilities and derivatives designated as hedging instruments included in other assets or other liabilities. Netting is allocated to the derivative products based on the net fair value of each product. |
| |
| (b) | Includes $538 million in Level 2 that was included in the former Grantor Trust. |
| |
| (c) | Includes certain interests in securitizations. |
| |
(c) | Previously included in the Grantor Trust. The Grantor Trust was dissolved in 2011. |
| |
| (d) | Includes seed capital, private equity investments and seed capital.other assets. |
|
|
Notes to Consolidated Financial Statements(continued) |
| |
|
| | | | | | | | | | | | | | | |
| Assets measured at fair value on a recurring basis at Dec. 31, 2019 | Total carrying value |
|
| (dollars in millions) | Level 1 |
| Level 2 |
| Level 3 |
| Netting (a) |
|
| Available-for-sale securities: | | | | | |
| Agency RMBS | $ | — |
| $ | 27,043 |
| $ | — |
| $ | — |
| $ | 27,043 |
|
| U.S. Treasury | 15,431 |
| — |
| — |
| — |
| 15,431 |
|
| Sovereign debt/sovereign guaranteed | 7,784 |
| 4,862 |
| — |
| — |
| 12,646 |
|
| Agency commercial MBS | — |
| 9,417 |
| — |
| — |
| 9,417 |
|
| Foreign covered bonds | — |
| 4,197 |
| — |
| — |
| 4,197 |
|
| CLOs | — |
| 4,063 |
| — |
| — |
| 4,063 |
|
| Supranational | — |
| 3,709 |
| — |
| — |
| 3,709 |
|
| Foreign government agencies | — |
| 2,643 |
| — |
| — |
| 2,643 |
|
| Non-agency commercial MBS | — |
| 2,178 |
| — |
| — |
| 2,178 |
|
| Other ABS | — |
| 2,143 |
| — |
| — |
| 2,143 |
|
| U.S. government agencies | — |
| 1,949 |
| — |
| — |
| 1,949 |
|
Non-agency RMBS (b) | — |
| 1,233 |
| — |
| — |
| 1,233 |
|
| State and political subdivisions | — |
| 1,044 |
| — |
| — |
| 1,044 |
|
| Corporate bonds | — |
| 853 |
| — |
| — |
| 853 |
|
| Other debt securities | — |
| 1 |
| — |
| — |
| 1 |
|
| Total available-for-sale securities | 23,215 |
| 65,335 |
| — |
| — |
| 88,550 |
|
| Trading assets: | | | | | |
| Debt instruments | 1,568 |
| 4,243 |
| — |
| — |
| 5,811 |
|
Equity instruments (c) | 4,539 |
| — |
| — |
| — |
| 4,539 |
|
| Derivative assets not designated as hedging: | | | | | |
| Interest rate | 4 |
| 3,686 |
| — |
| (1,792 | ) | 1,898 |
|
| Foreign exchange | — |
| 5,331 |
| — |
| (4,021 | ) | 1,310 |
|
| Equity and other contracts | — |
| 19 |
| — |
| (6 | ) | 13 |
|
| Total derivative assets not designated as hedging | 4 |
| 9,036 |
| — |
| (5,819 | ) | 3,221 |
|
| Total trading assets | 6,111 |
| 13,279 |
| — |
| (5,819 | ) | 13,571 |
|
Other assets: | | | | | |
| Derivative assets designated as hedging: | | | | | |
| Foreign exchange | — |
| 21 |
| — |
| — |
| 21 |
|
| Total derivative assets designated as hedging | — |
| 21 |
| — |
| — |
| 21 |
|
Other assets (d) | 38 |
| 179 |
| — |
| — |
| 217 |
|
Assets measured at NAV (d) | | | | | 181 |
|
| Subtotal assets of operations at fair value | 29,364 |
| 78,814 |
| — |
| (5,819 | ) | 102,540 |
|
| Percentage of assets of operations prior to netting | 27 | % | 73 | % | — | % | | |
| Assets of consolidated investment management funds | 212 |
| 33 |
| — |
| — |
| 245 |
|
| Total assets | $ | 29,576 |
| $ | 78,847 |
| $ | — |
| $ | (5,819 | ) | $ | 102,785 |
|
| Percentage of total assets prior to netting | 27 | % | 73 | % | — | % | | |
|
| | | | | | | | | | | | | | | |
| Assets measured at fair value on a recurring basis at Dec. 31, 2016 | Total carrying value |
|
| (dollar amounts in millions) | Level 1 |
| Level 2 |
| Level 3 |
| Netting (a) |
|
| Available-for-sale securities: | | | | | |
| U.S. Treasury | $ | 14,307 |
| $ | — |
| $ | — |
| $ | — |
| $ | 14,307 |
|
| U.S. government agencies | — |
| 359 |
| — |
| — |
| 359 |
|
| Sovereign debt/sovereign guaranteed | 66 |
| 12,423 |
| — |
| — |
| 12,489 |
|
| State and political subdivisions | — |
| 3,378 |
| — |
| — |
| 3,378 |
|
| Agency RMBS | — |
| 22,736 |
| — |
| — |
| 22,736 |
|
| Non-agency RMBS | — |
| 638 |
| — |
| — |
| 638 |
|
| Other RMBS | — |
| 513 |
| — |
| — |
| 513 |
|
| Commercial MBS | — |
| 928 |
| — |
| — |
| 928 |
|
| Agency commercial MBS | — |
| 6,449 |
| — |
| — |
| 6,449 |
|
| CLOs | — |
| 2,598 |
| — |
| — |
| 2,598 |
|
| Other asset-backed securities | — |
| 1,727 |
| — |
| — |
| 1,727 |
|
| Equity securities | 3 |
| — |
| — |
| — |
| 3 |
|
Money market funds (b) | 842 |
| — |
| — |
| — |
| 842 |
|
| Corporate bonds | — |
| 1,396 |
| — |
| — |
| 1,396 |
|
| Other debt securities | — |
| 1,961 |
| — |
| — |
| 1,961 |
|
| Foreign covered bonds | 1,876 |
| 265 |
| — |
| — |
| 2,141 |
|
Non-agency RMBS (c) | — |
| 1,357 |
| — |
| — |
| 1,357 |
|
| Total available-for-sale securities | 17,094 |
| 56,728 |
| — |
| — |
| 73,822 |
|
| Trading assets: | | | | | |
Debt and equity instruments (b) | 240 |
| 2,013 |
| — |
| — |
| 2,253 |
|
| Derivative assets not designated as hedging: | | | | | |
| Interest rate | 4 |
| 7,583 |
| — |
| (6,047 | ) | 1,540 |
|
| Foreign exchange | — |
| 6,104 |
| — |
| (4,172 | ) | 1,932 |
|
| Equity and other contracts | — |
| 46 |
| — |
| (38 | ) | 8 |
|
| Total derivative assets not designated as hedging | 4 |
| 13,733 |
| — |
| (10,257 | ) | 3,480 |
|
| Total trading assets | 244 |
| 15,746 |
| — |
| (10,257 | ) | 5,733 |
|
Other assets: | | | | | |
| Derivative assets designated as hedging: | | | | | |
| Interest rate | — |
| 415 |
| — |
| — |
| 415 |
|
| Foreign exchange | — |
| 369 |
| — |
| — |
| 369 |
|
| Total derivative assets designated as hedging | — |
| 784 |
| — |
| — |
| 784 |
|
Other assets (d) | 268 |
| 73 |
| — |
| — |
| 341 |
|
Other assets measured at net asset value (d) | | | | | 214 |
|
| Total other assets | 268 |
| 857 |
| — |
| — |
| 1,339 |
|
| Subtotal assets of operations at fair value | 17,606 |
| 73,331 |
| — |
| (10,257 | ) | 80,894 |
|
| Percentage of assets of operations prior to netting | 19 | % | 81 | % | — | % | | |
| Assets of consolidated investment management funds | 464 |
| 767 |
| — |
| — |
| 1,231 |
|
| Total assets | $ | 18,070 |
| $ | 74,098 |
| $ | — |
| $ | (10,257 | ) | $ | 82,125 |
|
| Percentage of total assets prior to netting | 20 | % | 80 | % | — | % | | |
|
|
Notes to Consolidated Financial Statements(continued) |
| |
| | | Liabilities measured at fair value on a recurring basis at Dec. 31, 2016 | Total carrying value |
| |
| (dollar amounts in millions) | Level 1 |
| Level 2 |
| Level 3 |
| Netting (a) |
| |
| Liabilities measured at fair value on a recurring basis at Dec. 31, 2019 | | Liabilities measured at fair value on a recurring basis at Dec. 31, 2019 | Total carrying value |
|
| (dollars in millions) | | Level 1 |
| Level 2 |
| Level 3 |
| Netting (a) |
|
| Trading liabilities: | | |
| Debt and equity instruments | $ | 349 |
| $ | 236 |
| $ | — |
| $ | — |
| $ | 585 |
| |
| Debt instruments | | $ | 1,477 |
| $ | 107 |
| $ | — |
| $ | — |
| $ | 1,584 |
|
| Equity instruments | | 73 |
| — |
| — |
| — |
| 73 |
|
| Derivative liabilities not designated as hedging: | | |
| Interest rate | 4 |
| 7,629 |
| — |
| (6,634 | ) | 999 |
| 6 |
| 3,244 |
| — |
| (1,986 | ) | 1,264 |
|
| Foreign exchange | — |
| 6,103 |
| — |
| (3,363 | ) | 2,740 |
| — |
| 5,340 |
| — |
| (3,428 | ) | 1,912 |
|
| Equity and other contracts | — |
| 115 |
| — |
| (50 | ) | 65 |
| 3 |
| 6 |
| — |
| (1 | ) | 8 |
|
| Total derivative liabilities not designated as hedging | 4 |
| 13,847 |
| — |
| (10,047 | ) | 3,804 |
| 9 |
| 8,590 |
| — |
| (5,415 | ) | 3,184 |
|
| Total trading liabilities | 353 |
| 14,083 |
| — |
| (10,047 | ) | 4,389 |
| 1,559 |
| 8,697 |
| — |
| (5,415 | ) | 4,841 |
|
Long-term debt (b) | — |
| 363 |
| — |
| — |
| 363 |
| |
Long-term debt (c) | | — |
| 387 |
| — |
| — |
| 387 |
|
Other liabilities – derivative liabilities designated as hedging: | | |
| Interest rate | — |
| 545 |
| — |
| — |
| 545 |
| — |
| 350 |
| — |
| — |
| 350 |
|
| Foreign exchange | — |
| 52 |
| — |
| — |
| 52 |
| — |
| 257 |
| — |
| — |
| 257 |
|
| Total other liabilities – derivative liabilities designated as hedging | — |
| 597 |
| — |
| — |
| 597 |
| — |
| 607 |
| — |
| — |
| 607 |
|
| Subtotal liabilities of operations at fair value | 353 |
| 15,043 |
| — |
| (10,047 | ) | 5,349 |
| 1,559 |
| 9,691 |
| — |
| (5,415 | ) | 5,835 |
|
| Percentage of liabilities of operations prior to netting | 2 | % | 98 | % | — | % | | 14 | % | 86 | % | — | % | |
| Liabilities of consolidated investment management funds | 3 |
| 312 |
| — |
| — |
| 315 |
| 1 |
| — |
| — |
| — |
| 1 |
|
| Total liabilities | $ | 356 |
| $ | 15,355 |
| $ | — |
| $ | (10,047 | ) | $ | 5,664 |
| $ | 1,560 |
| $ | 9,691 |
| $ | — |
| $ | (5,415 | ) | $ | 5,836 |
|
| Percentage of total liabilities prior to netting | 2 | % | 98 | % | — | % | | 14 | % | 86 | % | — | % | |
| |
| (a) | ASC 815, Derivatives and Hedging, permits the netting of derivative receivables and derivative payables under legally enforceable master netting agreements and permits the netting of cash collateral. Netting is applicable to derivatives not designated as hedging instruments included in trading assets or trading liabilities and derivatives designated as hedging instruments included in other assets or other liabilities. Netting is allocated to the derivative products based on the net fair value of each product. |
| |
| (b) | Includes $640 million in Level 2 that was included in the former Grantor Trust. |
| |
| (c) | Includes certain interests in securitizations. |
| |
(c) | Previously included in the Grantor Trust. The Grantor Trust was dissolved in 2011. |
| |
| (d) | Includes seed capital, private equity investments and seed capital.other assets. |
|
|
Notes to Consolidated Financial Statements(continued) |
| |
| | Details of certain items measured at fair value on a recurring basis | Sept. 30, 2017 | | Dec. 31, 2016 | |
Total carrying value (b) |
| | Ratings (a) | | Total carrying value (b) |
| | Ratings (a) | |
AAA/ AA- |
| A+/ A- |
| BBB+/ BBB- |
| BB+ and lower |
| | AAA/ AA- |
| A+/ A- |
| BBB+/ BBB- |
| BB+ and lower |
| |
| (dollar amounts in millions) | | | |
| Non-agency RMBS, originated in: | | | | | | | |
| 2007 | $ | 42 |
| | — | % | — | % | — | % | 100 | % | | $ | 58 |
| | — | % | — | % | — | % | 100 | % | |
| Details of certain available-for-sale securities measured at fair value on a recurring basis | | June 30, 2020 | | Dec. 31, 2019 |
| Total carrying value (b) |
| | Ratings (a) | | Total carrying value |
| | Ratings (a) |
| AAA/ AA- |
| A+/ A- |
| BBB+/ BBB- |
| BB+ and lower |
| | AAA/ AA- |
| A+/ A- |
| BBB+/ BBB- |
| BB+ and lower |
|
| (dollars in millions) | | (b) |
|
Non-agency RMBS (c), originated in: | | | | | | | |
| 2007-2020 | | $ | 938 |
| | 82 | % | 1 | % | — | % | 17 | % | | $ | 464 |
| 55 | % | 1 | % | — | % | 44 | % |
| 2006 | 85 |
| | — |
| — |
| — |
| 100 |
| | 98 |
| | — |
| — |
| — |
| 100 |
| 250 |
| | — |
| 22 |
| — |
| 78 |
| | 291 |
| | — |
| 21 |
| — |
| 79 |
|
| 2005 | 152 |
| | 20 |
| 3 |
| 18 |
| 59 |
| | 180 |
| | 23 |
| 5 |
| 9 |
| 63 |
| 262 |
| | 5 |
| 2 |
| 7 |
| 86 |
| | 305 |
| | 5 |
| 2 |
| 8 |
| 85 |
|
| 2004 and earlier | 246 |
| | 4 |
| 2 |
| 27 |
| 67 |
| | 302 |
| | 5 |
| 3 |
| 24 |
| 68 |
| 148 |
| | 21 |
| 22 |
| 8 |
| 49 |
| | 173 |
| | 22 |
| 24 |
| 4 |
| 50 |
|
| Total non-agency RMBS | $ | 525 |
| | 8 | % | 2 | % | 14 | % | 76 | % | | $ | 638 |
| | 9 | % | 3 | % | 14 | % | 74 | % | $ | 1,598 |
| | 51 | % | 6 | % | 2 | % | 41 | % | | $ | 1,233 |
| | 25 | % | 9 | % | 3 | % | 63 | % |
| Commercial MBS - Domestic, originated in: | | | | | | | | |
| 2009-2017 | $ | 909 |
| | 89 | % | 11 | % | — | % | — | % | | $ | 674 |
| | 84 | % | 16 | % | — | % | — | % | |
| 2008 | 5 |
| | 100 |
| — |
| — |
| — |
| | 14 |
| | 100 |
| — |
| — |
| — |
| |
| 2007 | — |
| | — |
| — |
| — |
| — |
| | 190 |
| | 71 |
| 29 |
| — |
| — |
| |
| 2006 | — |
| | — |
| — |
| — |
| — |
| | 3 |
| | 7 |
| 93 |
| — |
| — |
| |
| Total commercial MBS - Domestic | $ | 914 |
| | 89 | % | 11 | % | — | % | — | % | | $ | 881 |
| | 81 | % | 19 | % | — | % | — | % | |
| Non-agency commercial MBS originated in: | | | | | | | | |
| 2009-2020 | | $ | 2,630 |
| | 100 | % | — | % | — | % | — | % | | $ | 2,178 |
| | 98 | % | 2 | % | — | % | — | % |
| Foreign covered bonds: | | | | | | | | | | | | | | |
| Canada | $ | 1,648 |
| | 100 | % | — | % | — | % | — | % | | $ | 1,320 |
| | 100 | % | — | % | — | % | — | % | $ | 2,241 |
| | 100 | % | — | % | — | % | — | % | | $ | 1,798 |
| | 100 | % | — | % | — | % | — | % |
| UK | | 1,093 |
| | 100 |
| — |
| — |
| — |
| | 984 |
| | 100 |
| — |
| — |
| — |
|
| Australia | 261 |
| | 100 |
| — |
| — |
| — |
| | 40 |
| | 100 |
| — |
| — |
| — |
| 750 |
| | 100 |
| — |
| — |
| — |
| | 431 |
| | 100 |
| — |
| — |
| — |
|
| Netherlands | 177 |
| | 100 |
| — |
| — |
| — |
| | 160 |
| | 100 |
| — |
| — |
| — |
| |
| United Kingdom | 136 |
| | 100 |
| — |
| — |
| — |
| | 280 |
| | 100 |
| — |
| — |
| — |
| |
| Norway | | 533 |
| | 100 |
| — |
| — |
| — |
| | 287 |
| | 100 |
| — |
| — |
| — |
|
| Germany | | 407 |
| | 100 |
| — |
| — |
| — |
| | 357 |
| | 100 |
| — |
| — |
| — |
|
| Other | 320 |
| | 100 |
| — |
| — |
| — |
| | 341 |
| | 100 |
| — |
| — |
| — |
| 495 |
| | 100 |
| — |
| — |
| — |
| | 340 |
| | 100 |
| — |
| — |
| — |
|
| Total foreign covered bonds | $ | 2,542 |
| | 100 | % | — | % | — | % | — | % | | $ | 2,141 |
| | 100 | % | — | % | — | % | — | % | $ | 5,519 |
| | 100 | % | — | % | — | % | — | % | | $ | 4,197 |
| | 100 | % | — | % | — | % | — | % |
| European floating rate notes - available-for-sale: | | | | | | | | |
| United Kingdom | $ | 204 |
| | 87 | % | 13 | % | — | % | — | % | | $ | 379 |
| | 90 | % | 10 | % | — | % | — | % | |
| Netherlands | 113 |
| | 37 |
| 63 |
| — |
| — |
| | 125 |
| | 100 |
| — |
| — |
| — |
| |
| Ireland | — |
| | — |
| — |
| — |
| — |
| | 58 |
| | — |
| — |
| 100 |
| — |
| |
| Total European floating rate notes - available-for-sale | $ | 317 |
| | 69 | % | 31 | % | — | % | — | % | | $ | 562 |
| | 83 | % | 7 | % | 10 | % | — | % | |
| Sovereign debt/sovereign guaranteed: | | | | | | | | | | | | | | |
| United Kingdom | $ | 3,036 |
| | 100 | % | — | % | — | % | — | % | | $ | 3,209 |
| | 100 | % | — | % | — | % | — | % | |
| UK | | $ | 3,773 |
| | 100 | % | — | % | — | % | — | % | | $ | 3,318 |
| | 100 | % | — | % | — | % | — | % |
| Germany | | 2,346 |
| | 100 |
| — |
| — |
| — |
| | 1,997 |
| | 100 |
| — |
| — |
| — |
|
| France | 1,993 |
| | 100 |
| — |
| — |
| — |
| | 1,998 |
| | 100 |
| — |
| — |
| — |
| 2,238 |
| | 100 |
| — |
| — |
| — |
| | 1,272 |
| | 100 |
| — |
| — |
| — |
|
| Spain | 1,740 |
| | — |
| — |
| 100 |
| — |
| | 1,749 |
| | — |
| — |
| 100 |
| — |
| 1,961 |
| | — |
| 4 |
| 96 |
| — |
| | 1,453 |
| | — |
| 6 |
| 94 |
| — |
|
| Italy | | 1,069 |
| | — |
| — |
| 100 |
| — |
| | 1,260 |
| | — |
| — |
| 100 |
| — |
|
| Singapore | | 931 |
| | 100 |
| — |
| — |
| — |
| | 742 |
| | 100 |
| — |
| — |
| — |
|
| Ireland | | 676 |
| | 29 |
| 71 |
| — |
| — |
| | 301 |
| | — |
| 100 |
| — |
| — |
|
| Netherlands | | 564 |
| | 100 |
| — |
| — |
| — |
| | 791 |
| | 100 |
| — |
| — |
| — |
|
| Canada | | 502 |
| | 100 |
| — |
| — |
| — |
| | 271 |
| | 100 |
| — |
| — |
| — |
|
| Japan | | 434 |
| | — |
| 100 |
| — |
| — |
| | 274 |
| | — |
| 100 |
| — |
| — |
|
| Belgium | | 411 |
| | 100 |
| — |
| — |
| — |
| | 79 |
| | 100 |
| — |
| — |
| — |
|
| Austria | | 331 |
| | 100 |
| — |
| — |
| — |
| | 240 |
| | 100 |
| — |
| — |
| — |
|
| Hong Kong | | 330 |
| | 100 |
| — |
| — |
| — |
| | 411 |
| | 100 |
| — |
| — |
| — |
|
Other (d) | | 321 |
| | 45 |
| — |
| 21 |
| 34 |
| | 237 |
| | 39 |
| 4 |
| — |
| 57 |
|
| Total sovereign debt/sovereign guaranteed | | $ | 15,887 |
| | 74 | % | 6 | % | 19 | % | 1 | % | | $ | 12,646 |
| | 73 | % | 5 | % | 21 | % | 1 | % |
| Foreign government agencies: | | | | | | | | |
| Germany | 1,688 |
| | 100 |
| — |
| — |
| — |
| | 1,347 |
| | 100 |
| — |
| — |
| — |
| $ | 1,398 |
| | 100 | % | — | % | — | % | — | % | | $ | 1,131 |
| | 100 | % | — | % | — | % | — | % |
| Italy | 1,169 |
| | — |
| — |
| 100 |
| — |
| | 1,130 |
| | — |
| — |
| 100 |
| — |
| |
| Netherlands | 1,016 |
| | 100 |
| — |
| — |
| — |
| | 1,061 |
| | 100 |
| — |
| — |
| — |
| 730 |
| | 100 |
| — |
| — |
| — |
| | 678 |
| | 100 |
| — |
| — |
| — |
|
| Ireland | 832 |
| | — |
| 100 |
| — |
| — |
| | 736 |
| | — |
| 100 |
| — |
| — |
| |
| Belgium | 809 |
| | 100 |
| — |
| — |
| — |
| | 1,005 |
| | 100 |
| — |
| — |
| — |
| |
Other (c) | 282 |
| | 48 |
| 3 |
| — |
| 49 |
| | 254 |
| | 71 |
| — |
| — |
| 29 |
| |
| Total sovereign debt/sovereign guaranteed | $ | 12,565 |
| | 69 | % | 7 | % | 23 | % | 1 | % | | $ | 12,489 |
| | 70 | % | 6 | % | 23 | % | 1 | % | |
Non-agency RMBS (d), originated in: | | | | | | | | |
| 2007 | $ | 337 |
| | — | % | — | % | — | % | 100 | % | | $ | 387 |
| | — | % | — | % | — | % | 100 | % | |
| 2006 | 345 |
| | — |
| — |
| — |
| 100 |
| | 391 |
| | — |
| — |
| — |
| 100 |
| |
| 2005 | 387 |
| | 1 |
| 1 |
| 1 |
| 97 |
| | 437 |
| | — |
| 2 |
| 1 |
| 97 |
| |
| 2004 and earlier | 116 |
| | 2 |
| 2 |
| 22 |
| 74 |
| | 142 |
| | 2 |
| 2 |
| 17 |
| 79 |
| |
Total non-agency RMBS (d) | $ | 1,185 |
| | — | % | 1 | % | 3 | % | 96 | % | | $ | 1,357 |
| | — | % | 1 | % | 2 | % | 97 | % | |
| Canada | | 321 |
| | 62 |
| 38 |
| — |
| — |
| | 71 |
| | — |
| 100 |
| — |
| — |
|
| France | | 281 |
| | 100 |
| — |
| — |
| — |
| | 42 |
| | 100 |
| — |
| — |
| — |
|
| Sweden | | 276 |
| | 100 |
| — |
| — |
| — |
| | 202 |
| | 100 |
| — |
| — |
| — |
|
| Finland | | 241 |
| | 100 |
| — |
| — |
| — |
| | 245 |
| | 100 |
| — |
| — |
| — |
|
| Other | | 331 |
| | 84 |
| 16 |
| — |
| — |
| | 274 |
| | 79 |
| 21 |
| — |
| — |
|
| Total foreign government agencies | | $ | 3,578 |
| | 95 | % | 5 | % | — | % | — | % | | $ | 2,643 |
| | 95 | % | 5 | % | — | % | — | % |
| |
| (a) | Represents ratings by S&P or the equivalent. |
| |
| (b) | At Sept.June 30, 20172020 and Dec. 31, 2016, foreign covered bonds and2019, sovereign debt/sovereign guaranteed securities were included in Level 1 and Level 2 in the valuation hierarchy. All other assets in the table are Level 2 assets in the valuation hierarchy. |
| |
| (c) | Includes noninvestment$538 million at June 30, 2020 and $640 million at Dec. 31, 2019 that were included in the former Grantor Trust. |
| |
| (d) | Includes non-investment grade sovereign debt/sovereign guaranteed securities related to Brazil of $140$109 million at Sept.June 30, 20172020 and $73$134 million at Dec. 31, 2016. |
| |
(d) | Previously included in the Grantor Trust. The Grantor Trust was dissolved in 2011.2019. |
Changes in Level 3 fair value measurements
Our classification of a financial instrument in Level 3 of the valuation hierarchy is based on the significance of the unobservable factors to the overall fair value measurement. However, these instruments generally include other observable components that are actively quoted or validated to third-party sources; accordingly, the gains and losses in the table below include changes in fair value due to observable parameters as well as the unobservable parameters in our valuation methodologies. We also manage the
risks of Level 3 financial instruments using securities and derivatives positions that are Level 1 or Level 2 instruments which are not included in the table; accordingly, the gains or losses below do not reflect the effect of our risk management activities related to the Level 3 instruments.
The Company has a Level 3 Pricing Committee which evaluates the valuation techniques used in
|
|
Notes to Consolidated Financial Statements(continued) |
| |
determining the fair value of Level 3 assets and liabilities.
There were no financial instruments recorded at fair value on a recurring basis classified in Level 3 of the valuation hierarchy in the first nine months of 2017.
The table below includes a roll forward of the balance sheet amount for the three and nine months ended Sept. 30, 2016 (including the change in fair value), for financial instruments classified in Level 3 of the valuation hierarchy.
|
| | | | | | |
| Fair value measurements for assets using significant unobservable inputs | Loans |
| (in millions) | 3Q16 |
| YTD16 |
|
| Fair value at the beginning of the period | $ | 101 |
| $ | — |
|
| Transfers into Level 3 | — |
| 19 |
|
Total gains for the period included in earnings (a) | — |
| 2 |
|
| Purchases and sales: | | |
| Purchases | — |
| 113 |
|
| Issuances | 1 |
| 1 |
|
| Sales | (102 | ) | (135 | ) |
| Fair value at Sept. 30, 2016 | $ | — |
| $ | — |
|
| Change in unrealized gains for the period included in earnings for assets held at the end of the reporting period | $ | — |
| $ | — |
|
| |
(a) | Reported in investment and other income. |
Assets and liabilities measured at fair value on a nonrecurring basis
Under certain circumstances, we make adjustments to the fair value of our assets, liabilities and unfunded lending-related commitments although they are not measured at fair value on an ongoing basis. An example
Examples would be the recording of an impairment of an asset.asset and non-readily marketable equity securities carried at cost with upward or downward adjustments.
The following tables presenttable presents the financial instruments carried on the consolidated balance sheet by caption and by level in the fair value hierarchy as of Sept.June 30, 20172020 and Dec. 31, 2016, for which a nonrecurring change in fair value has been recorded during the quarters ended Sept. 30, 2017 and Dec. 31, 2016.
| | | Assets measured at fair value on a nonrecurring basis at Sept. 30, 2017 | Total carrying value |
| |
| Assets measured at fair value on a nonrecurring basis | | June 30, 2020 | | Dec. 31, 2019 |
| | | Total carrying value |
| | | Total carrying value |
|
| (in millions) | Level 1 |
| Level 2 |
| Level 3 |
| Total carrying value |
| Level 1 |
| Level 2 |
| Level 3 |
| | Level 1 |
| Level 2 |
| Level 3 |
|
Loans (a) | $ | — |
| $ | 75 |
| $ | 7 |
| $ | — |
| $ | 53 |
| $ | — |
| $ | 53 |
| | $ | — |
| $ | 58 |
| $ | — |
| $ | 58 |
|
Other assets (b) | — |
| 4 |
| — |
| 4 |
| — |
| 107 |
| — |
| 107 |
| | — |
| 64 |
| — |
| 64 |
|
| Total assets at fair value on a nonrecurring basis | $ | — |
| $ | 79 |
| $ | 7 |
| $ | 86 |
| $ | — |
| $ | 160 |
| $ | — |
| $ | 160 |
| | $ | — |
| $ | 122 |
| $ | — |
| $ | 122 |
|
|
| | | | | | | | | | | | |
| Assets measured at fair value on a nonrecurring basis at Dec. 31, 2016 | Total carrying value |
|
| (in millions) | Level 1 |
| Level 2 |
| Level 3 |
|
Loans (a) | $ | — |
| $ | 84 |
| $ | 7 |
| $ | 91 |
|
Other assets (b) | — |
| 4 |
| — |
| 4 |
|
| Total assets at fair value on a nonrecurring basis | $ | — |
| $ | 88 |
| $ | 7 |
| $ | 95 |
|
| |
| (a) | During the quarters ended Sept. 30, 2017 and Dec. 31, 2016, theThe fair value of these loans decreased less than $1 million in the second quarter of 2020 and $1 million, respectively,the fourth quarter of 2019, based on the fair value of the underlying collateral, based onas required by guidance in ASC 310, Receivables,326, Financial Instruments – Credit Losses, with an offset to the allowance for credit losses. |
| |
| (b) | Includes non-readily marketable equity securities carried at cost with upward or downward adjustments and other assets received in satisfaction of debt. |
Estimated fair value of financial instruments
The following tables present the estimated fair value and the carrying amount of financial instruments not carried at fair value on the consolidated balance sheet at Sept.June 30, 20172020 and Dec. 31, 2016,2019, by caption on the consolidated balance sheet and by the valuation
hierarchy.hierarchy. See Note 18 of the Notes to Consolidated Financial Statements in our 2016 Annual Report for additional information regarding the financial instruments within the scope of this disclosure, and the methods and significant assumptions used to estimate their fair value.
|
|
Notes to Consolidated Financial Statements(continued)
|
|
| | | Summary of financial instruments | Sept. 30, 2017 | June 30, 2020 |
| (in millions) | Level 1 |
| Level 2 |
| Level 3 |
| Total estimated fair value |
| Carrying amount |
| Level 1 |
| Level 2 |
| Level 3 |
| Total
estimated
fair value |
| Carrying
amount |
|
| Assets: | | |
| Interest-bearing deposits with the Federal Reserve and other central banks | $ | — |
| $ | 75,808 |
| $ | — |
| $ | 75,808 |
| $ | 75,808 |
| $ | — |
| $ | 112,728 |
| $ | — |
| $ | 112,728 |
| $ | 112,728 |
|
| Interest-bearing deposits with banks | — |
| 15,254 |
| — |
| 15,254 |
| 15,256 |
| — |
| 18,063 |
| — |
| 18,063 |
| 18,045 |
|
| Federal funds sold and securities purchased under resale agreements | — |
| 27,883 |
| — |
| 27,883 |
| 27,883 |
| — |
| 36,638 |
| — |
| 36,638 |
| 36,638 |
|
| Securities held-to-maturity | 9,943 |
| 29,985 |
| — |
| 39,928 |
| 39,995 |
| 5,815 |
| 40,168 |
| — |
| 45,983 |
| 44,615 |
|
Loans (a) | — |
| 57,709 |
| — |
| 57,709 |
| 57,562 |
| — |
| 54,377 |
| — |
| 54,377 |
| 54,067 |
|
| Other financial assets | 5,557 |
| 1,169 |
| — |
| 6,726 |
| 6,726 |
| 4,776 |
| 1,165 |
| — |
| 5,941 |
| 5,941 |
|
| Total | $ | 15,500 |
| $ | 207,808 |
| $ | — |
| $ | 223,308 |
| $ | 223,230 |
| $ | 10,591 |
| $ | 263,139 |
| $ | — |
| $ | 273,730 |
| $ | 272,034 |
|
| Liabilities: | | |
| Noninterest-bearing deposits | $ | — |
| $ | 80,380 |
| $ | — |
| $ | 80,380 |
| $ | 80,380 |
| $ | — |
| $ | 78,100 |
| $ | — |
| $ | 78,100 |
| $ | 78,100 |
|
| Interest-bearing deposits | — |
| 148,967 |
| — |
| 148,967 |
| 150,616 |
| — |
| 226,917 |
| — |
| 226,917 |
| 227,370 |
|
| Federal funds purchased and securities sold under repurchase agreements | — |
| 10,314 |
| — |
| 10,314 |
| 10,314 |
| — |
| 14,512 |
| — |
| 14,512 |
| 14,512 |
|
| Payables to customers and broker-dealers | — |
| 21,176 |
| — |
| 21,176 |
| 21,176 |
| — |
| 25,012 |
| — |
| 25,012 |
| 25,012 |
|
| Commercial paper | — |
| 2,501 |
| — |
| 2,501 |
| 2,501 |
| — |
| 665 |
| — |
| 665 |
| 665 |
|
| Borrowings | — |
| 3,544 |
| — |
| 3,544 |
| 3,544 |
| — |
| 1,852 |
| — |
| 1,852 |
| 1,852 |
|
| Long-term debt | — |
| 28,335 |
| — |
| 28,335 |
| 28,039 |
| — |
| 28,875 |
| — |
| 28,875 |
| 27,167 |
|
| Total | $ | — |
| $ | 295,217 |
| $ | — |
| $ | 295,217 |
| $ | 296,570 |
| $ | — |
| $ | 375,933 |
| $ | — |
| $ | 375,933 |
| $ | 374,678 |
|
| |
| (a) | Does not include the leasing portfolio. |
|
| | | | | | | | | | | | | | | |
| Summary of financial instruments | Dec. 31, 2016 |
| (in millions) | Level 1 |
| Level 2 |
| Level 3 |
| Total estimated
fair value |
| Carrying
amount |
|
| Assets: | | | | | |
| Interest-bearing deposits with the Federal Reserve and other central banks | $ | — |
| $ | 58,041 |
| $ | — |
| $ | 58,041 |
| $ | 58,041 |
|
| Interest-bearing deposits with banks | — |
| 15,091 |
| — |
| 15,091 |
| 15,086 |
|
| Federal funds sold and securities purchased under resale agreements | — |
| 25,801 |
| — |
| 25,801 |
| 25,801 |
|
| Securities held-to-maturity | 11,173 |
| 29,496 |
| — |
| 40,669 |
| 40,905 |
|
Loans (a) | — |
| 62,829 |
| — |
| 62,829 |
| 62,564 |
|
| Other financial assets | 4,822 |
| 1,112 |
| — |
| 5,934 |
| 5,934 |
|
| Total | $ | 15,995 |
| $ | 192,370 |
| $ | — |
| $ | 208,365 |
| $ | 208,331 |
|
| Liabilities: | | | | | |
| Noninterest-bearing deposits | $ | — |
| $ | 78,342 |
| $ | — |
| $ | 78,342 |
| $ | 78,342 |
|
| Interest-bearing deposits | — |
| 141,418 |
| — |
| 141,418 |
| 143,148 |
|
| Federal funds purchased and securities sold under repurchase agreements | — |
| 9,989 |
| — |
| 9,989 |
| 9,989 |
|
| Payables to customers and broker-dealers | — |
| 20,987 |
| — |
| 20,987 |
| 20,987 |
|
| Borrowings | — |
| 960 |
| — |
| 960 |
| 960 |
|
| Long-term debt | — |
| 24,184 |
| — |
| 24,184 |
| 24,100 |
|
| Total | $ | — |
| $ | 275,880 |
| $ | — |
| $ | 275,880 |
| $ | 277,526 |
|
|
|
Notes to Consolidated Financial Statements(continued) |
|
|
| | | | | | | | | | | | | | | |
| Summary of financial instruments | Dec. 31, 2019 |
| (in millions) | Level 1 |
| Level 2 |
| Level 3 |
| Total estimated
fair value |
| Carrying
amount |
|
| Assets: | | | | | |
| Interest-bearing deposits with the Federal Reserve and other central banks | $ | — |
| $ | 95,042 |
| $ | — |
| $ | 95,042 |
| $ | 95,042 |
|
| Interest-bearing deposits with banks | — |
| 14,832 |
| — |
| 14,832 |
| 14,811 |
|
| Federal funds sold and securities purchased under resale agreements | — |
| 30,182 |
| — |
| 30,182 |
| 30,182 |
|
| Securities held-to-maturity | 4,630 |
| 30,175 |
| — |
| 34,805 |
| 34,483 |
|
Loans (a) | — |
| 54,194 |
| — |
| 54,194 |
| 53,718 |
|
| Other financial assets | 4,830 |
| 1,233 |
| — |
| 6,063 |
| 6,063 |
|
| Total | $ | 9,460 |
| $ | 225,658 |
| $ | — |
| $ | 235,118 |
| $ | 234,299 |
|
| Liabilities: | | | | | |
| Noninterest-bearing deposits | $ | — |
| $ | 57,630 |
| $ | — |
| $ | 57,630 |
| $ | 57,630 |
|
| Interest-bearing deposits | — |
| 200,846 |
| — |
| 200,846 |
| 201,836 |
|
| Federal funds purchased and securities sold under repurchase agreements | — |
| 11,401 |
| — |
| 11,401 |
| 11,401 |
|
| Payables to customers and broker-dealers | — |
| 18,758 |
| — |
| 18,758 |
| 18,758 |
|
| Commercial paper | — |
| 3,959 |
| — |
| 3,959 |
| 3,959 |
|
| Borrowings | — |
| 917 |
| — |
| 917 |
| 917 |
|
| Long-term debt | — |
| 27,858 |
| — |
| 27,858 |
| 27,114 |
|
| Total | $ | — |
| $ | 321,369 |
| $ | — |
| $ | 321,369 |
| $ | 321,615 |
|
| |
| (a) | Does not include the leasing portfolio. |
The table below summarizes the carrying amount of the hedged financial instruments, the notional amount of the hedge and the unrealized gain (loss) (estimated fair value) of the derivatives.
|
| | | | | | | | | | | | |
| Hedged financial instruments | Carrying amount |
| Notional amount of hedge |
| | |
| | Unrealized |
| (in millions) | Gain |
| (Loss) |
|
| Sept. 30, 2017 | | | | |
| Securities available-for-sale | $ | 12,416 |
| $ | 12,333 |
| $ | 56 |
| $ | (337 | ) |
| Long-term debt | 24,249 |
| 24,200 |
| 249 |
| (157 | ) |
| Dec. 31, 2016 | |
| Securities available-for-sale | $ | 9,184 |
| $ | 9,233 |
| $ | 83 |
| $ | (342 | ) |
| Long-term debt | 20,511 |
| 20,450 |
| 330 |
| (203 | ) |
|
|
Notes to Consolidated Financial Statements(continued)
|
|
Note 15 - 16–Fair value option
We elected fair value as an alternative measurement for selected financial assets and financial liabilities.
liabilities that are not otherwise required to be measured at fair value, including the assets and liabilities of consolidated investment management funds and certain long-term debt. The following table presents the assets and liabilities by type, of consolidated investment management funds, recorded at fair value.
|
| | | | | | |
Assets and liabilities of consolidated investment management funds, at fair value | |
| | June 30, 2020 |
| Dec. 31, 2019 |
|
| (in millions) |
| Assets of consolidated investment management funds: | | |
| Trading assets | $ | 450 |
| $ | 229 |
|
| Other assets | 10 |
| 16 |
|
| Total assets of consolidated investment management funds | $ | 460 |
| $ | 245 |
|
| Liabilities of consolidated investment management funds: | | |
| Other liabilities | 4 |
| 1 |
|
| Total liabilities of consolidated investment management funds | $ | 4 |
| $ | 1 |
|
|
| | | | | | |
| Assets and liabilities of consolidated investment management funds, at fair value |
| | Sept. 30, 2017 |
| Dec. 31, 2016 |
|
| (in millions) |
| Assets of consolidated investment management funds: | | |
| Trading assets | $ | 576 |
| $ | 979 |
|
| Other assets | 226 |
| 252 |
|
| Total assets of consolidated investment management funds | $ | 802 |
| $ | 1,231 |
|
| Liabilities of consolidated investment management funds: | | |
| Trading liabilities | $ | — |
| $ | 282 |
|
| Other liabilities | 27 |
| 33 |
|
| Total liabilities of consolidated investment management funds | $ | 27 |
| $ | 315 |
|
BNY Mellon values the assets and liabilities of its consolidated investment management funds using quoted prices for identical assets or liabilities in active markets or observable inputs such as quoted
prices for similar assets or liabilities. Quoted prices for either identical or similar assets or liabilities in inactive markets may also be used. Accordingly, fair value best reflects the interests BNY Mellon holds in the economic performance of the consolidated investment management funds. Changes in the value of the assets and liabilities are recorded in the consolidated income statement as investment income of consolidated investment management funds and in the interest of investment management fund note holders, respectively.
We have elected the fair value option on $240 million of long-term debt. The fair value of this long-term debt was $369399 million at Sept.June 30, 20172020 and $363$387 million at Dec. 31, 2016.2019. The long-term debt is valued using observable market inputs and is included in Level 2 of the valuation hierarchy.
The following table presents the changes in fair value of long-term debt recorded in foreign exchange and certain loans for which we elected the fair value option that we previously held in 2016, and the location of the changesother trading revenue in the consolidated income statement.
|
| | | | | | | | | | | | | | | |
Impact of changes in fair value in the income statement (a) |
| (in millions) | 3Q17 |
| 2Q17 |
| 3Q16 |
| YTD17 |
| YTD16 |
|
| Loans: | | | | | |
| Investment and other income | $ | — |
| $ | — |
| $ | (1 | ) | $ | — |
| $ | 13 |
|
| Long-term debt: | | | | | |
| Foreign exchange and other trading revenue | $ | (1 | ) | $ | (4 | ) | $ | 2 |
| $ | (6 | ) | $ | (17 | ) |
|
| | | | | | | | | | | | | | | |
Change in fair value of long-term debt (a) |
| (in millions) | 2Q20 |
| 1Q20 |
| 2Q19 |
| YTD20 |
| YTD19 |
|
| Foreign exchange and other trading revenue | $ | (2 | ) | $ | (10 | ) | $ | (7 | ) | $ | (12 | ) | $ | (12 | ) |
| |
| (a) | The changes in fair value of the loans and long-term debt are approximately offset by an economic hedgeshedge included in foreign exchange and other trading revenue. |
|
|
Notes to Consolidated Financial Statements(continued) |
|
Note 16 - 17–Derivative instruments
We use derivatives to manage exposure to market risk, including interest rate risk, equity price risk and foreign currency risk, as well as credit risk. Our trading activities are focused on acting as a market-maker for our customers and facilitating customer trades in compliance with the Volcker Rule.
The notional amounts for derivative financial instruments express the dollar volume of the transactions; however, credit risk is much smaller. We perform credit reviews and enter into netting agreements and collateral arrangements to minimize the credit risk of derivative financial instruments. We enter into offsetting positions to reduce exposure to foreign currency, interest rate and equity price risk.
Use of derivative financial instruments involves reliance on counterparties. Failure of a counterparty to honor its obligation under a derivative contract is a risk we assume whenever we engage in a derivative contract. There were no0 counterparty default losses recorded in the thirdsecond quarter of 2017 or the third quarter of 2016.2020.
Hedging derivatives
We utilize interest rate swap agreements to manage our exposure to interest rate fluctuations. ForWe enter into fair value hedges of available-for-sale investment securities, deposits and long-term debt, the hedge documentation specifies the terms of the hedged items and theas an interest rate swaps and indicates that the derivative is hedging a fixed rate item and is a fair value hedge, that the hedge exposure isrisk management strategy to the changes in the fair value of the hedged item due to changes in benchmark interest rates, and that the strategy is to eliminatereduce fair value variability by converting certain fixed rate interest payments associated with available-for-sale securities and long-term debt to LIBOR.floating interest rates. We also utilize interest rate swaps and forward exchange contracts as cash flow hedges to manage our exposure to interest rate and foreign exchange rate changes.
|
|
Notes to Consolidated Financial Statements(continued)
|
|
The available-for-sale investment securities hedged consist of U.S. Treasury, bonds, agency and non-agency commercial MBS, sovereign debtdebt/sovereign guaranteed, corporate bonds and foreign covered bonds that had original maturitiesbonds. At June 30, 2020, $13.9 billion par value of 30 years or less at initial purchase. The swaps on all of these investment securities are not callable. All of these securities are hedged with “pay fixed rate, receive variable rate” swaps of similar maturity, repricing and fixed rate coupon. At Sept. 30, 2017, $12.4 billion face amount ofavailable-for-sale securities were hedged with interest rate swaps designated as fair value hedges that had notional values of $12.3$13.9 billion.
The fixed rate long-term debt instruments hedged generally have original maturities of five to 30 years. We issue both callable and non-callable debt. The non-callableIn fair value hedging relationships, debt is hedged with “receive fixed rate, pay variable rate” swaps with similar maturity, repricing and fixed rate coupon. Callable debt is hedged with callable swaps where the call dates of the swaps exactly match the call dates of the debt.swaps. At Sept.June 30, 2017, $24.22020, $13.9 billion par value of debt was
hedged with interest rate swaps designated as fair value hedges that had notional values of $24.2$13.9 billion.
In addition, we enter intoutilize forward foreign exchange hedges.contracts as hedges to mitigate foreign exchange exposures. We use forward foreign exchange contracts as cash flow hedges to convert certain forecasted non-U.S. dollar revenue and expenses into U.S. dollars. We use forward foreign exchange contracts with maturities of nine12 months or less as cash flow hedges to hedge our foreign exchange exposure to currencies such as Indian rupee, British pound, Hong Kong dollar, Singapore dollar and Polish zloty Canadian dollar and Japanese yen foreign exchange exposure with respect to foreign currency forecastedused in revenue and expense transactions infor entities that have the U.S. dollar as their functional currency. As of Sept.June 30, 2017,2020, the hedged forecasted foreign currency transactions and designated forward foreign exchange contract hedges were $539$312 million (notional), with a pre-tax loss of $9$3 million recorded in accumulated other comprehensive income.OCI. This loss will be reclassified to income or expenseearnings over the next nine12 months.
We also utilize forward foreign exchange contracts as fair value hedges of the foreign exchange risk associated with available-for-sale securities. Forward points are designated as an excluded component and amortized into earnings over the hedge period. The unamortized derivative value associated with the excluded component is recognized in accumulated OCI. At June 30, 2020, $131 million par value of available-for-sale securities was hedged with foreign currency forward contracts that had a notional value of $131 million.
Forward foreign exchange contracts are also used to hedge the value of our net investments in foreign subsidiaries. These forward foreign exchange contracts have maturities of less than two years.one year. The derivatives employed are designated as hedges of changes in value of our foreign investments due to exchange rates. Changes in the value of the forward foreign exchange contracts offset the changes in value of the foreign investments due to changes in foreign exchange rates. The change in fair market value of these forward foreign exchange contracts is deferred and reported within foreign currency translation adjustments in shareholders’ equity, net of tax. At Sept.June 30, 2017,2020, forward foreign exchange contracts with notional amounts totaling $7.8$7.6 billion were designated as net investment hedges.
In addition to forward foreign exchange contracts, we also designate non-derivative financial instruments as hedges of our net investments in foreign subsidiaries. Those non-derivative financial instruments designated as hedges of our net investments in foreign subsidiaries were all long-term liabilities of
90 BNY Mellon in various currencies, and, at Sept. 30, 2017, had a combined U.S. dollar equivalent value of $181 million.
Ineffectiveness related to derivatives and hedging relationships was recorded in income as follows:
|
| | | | | | |
| Ineffectiveness | Nine months ended |
| (in millions) | Sept. 30, 2017 |
| Sept. 30, 2016 |
|
| Fair value hedges of securities | $ | (13.3 | ) | $ | (5.4 | ) |
| Fair value hedges of long-term debt | 0.1 |
| (23.0 | ) |
| Cash flow hedges | — |
| — |
|
Other (a) | — |
| — |
|
| Total | $ | (13.2 | ) | $ | (28.4 | ) |
| |
(a) | Includes ineffectiveness recorded on foreign exchange hedges. |
|
|
Notes to Consolidated Financial Statements(continued) |
| |
foreign subsidiaries were all long-term liabilities of BNY Mellon and, at June 30, 2020, had a combined U.S. dollar equivalent carrying value of $172 million.
The following table presents the pre-tax gains (losses) related to our fair value and cash flow hedging activities recognized in the consolidated income statement.
|
| | | | | | | | | | | | | | | | |
| Income statement impact of fair value and cash flow hedges | | | |
| (in millions) | Location of gains (losses) | 2Q20 |
| 1Q20 |
| 2Q19 |
| YTD20 |
| YTD19 |
|
| Interest rate fair value hedges of available-for-sale securities | | | | | | |
| Derivative | Interest revenue | $ | 19 |
| $ | (1,033 | ) | $ | (486 | ) | $ | (1,014 | ) | $ | (869 | ) |
| Hedged item | Interest revenue | (15 | ) | 1,011 |
| 480 |
| 996 |
| 856 |
|
| Interest rate fair value hedges of long-term debt | | | | | | |
| Derivative | Interest expense | 47 |
| 714 |
| 300 |
| 761 |
| 485 |
|
| Hedged item | Interest expense | (49 | ) | (708 | ) | (298 | ) | (757 | ) | (482 | ) |
| Foreign exchange fair value hedges of available-for-sale securities | | | | | | |
Derivative (a) | Other revenue | 5 |
| 7 |
| (5 | ) | 12 |
| 1 |
|
| Hedged item | Other revenue | (5 | ) | (7 | ) | 5 |
| (12 | ) | — |
|
| Cash flow hedges of forecasted FX exposures | | | | | | |
| (Loss) gain reclassified from OCI into income | Staff expense | (3 | ) | 1 |
| — |
| (2 | ) | (1 | ) |
| (Loss) recognized in the consolidated income statement due to fair value and cash flow hedging relationships | | $ | (1 | ) | $ | (15 | ) | $ | (4 | ) | $ | (16 | ) | $ | (10 | ) |
| |
| (a) | Includes gains of less than $1 million in the second quarter of 2020 and first quarter of 2020, a de minimis gain in the second quarter of 2019, a gain of less than $1 million in the first six months of 2020 and a gain of $1 million in the first six months of 2019 associated with the amortization of the excluded component. At June 30, 2020 and Dec. 31, 2019, the remaining accumulated OCI balance associated with the excluded component was de minimis. |
The following table presents the impact of hedging derivatives used in net investment hedging relationships.
|
| | | | | | | | | | | | | | | | | | | | | | | | | | | | | | | | |
| Impact of derivative instruments used in net investment hedging relationships | |
| (in millions) | | | | |
| Derivatives in net investment hedging relationships | Gain or (loss) recognized in accumulated OCI on derivatives | | Location of gain or (loss) reclassified from accumulated OCI into income | Gain or (loss) reclassified from accumulated OCI into income |
| 2Q20 |
| 1Q20 |
| 2Q19 |
| YTD20 |
| YTD19 |
| | 2Q20 |
| 1Q20 |
| 2Q19 |
| YTD20 |
| YTD19 |
|
| FX contracts | $ | (45 | ) | $ | 437 |
| $ | 76 |
| $ | 392 |
| $ | 70 |
| | Net interest revenue | $ | — |
| $ | — |
| $ | — |
| $ | — |
| $ | — |
|
The following table presents information on the hedged items in fair value hedging relationships.
|
| | | | | | | | | | | | | |
| Hedged items in fair value hedging relationships | Carrying amount of hedged asset or liability | | Hedge accounting basis adjustment increase (decrease) (a) |
| |
| (in millions) | June 30, 2020 |
| Dec. 31, 2019 |
| | June 30, 2020 |
| Dec. 31, 2019 |
|
Available-for-sale securities (b)(c) | $ | 13,952 |
| $ | 13,792 |
| | $ | 1,817 |
| $ | 687 |
|
| Long-term debt | $ | 14,956 |
| $ | 13,945 |
| | $ | 919 |
| $ | 116 |
|
| |
| (a) | Includes $196 million and $53 million of basis adjustment increases on discontinued hedges associated with available-for-sale securities at June 30, 2020 and Dec. 31, 2019, respectively, and $156 million and $200 million of basis adjustment decreases on discontinued hedges associated with long-term debt at June 30, 2020 and Dec. 31, 2019, respectively. |
| |
| (b) | Excludes hedged items where only foreign currency risk is the designated hedged risk, as the basis adjustments related to foreign currency hedges will not reverse through the consolidated income statement in future periods. The carrying amount excluded for available-for-sale securities was $131 million at June 30, 2020 and $142 million at Dec. 31, 2019. |
| |
| (c) | Carrying amount represents the amortized cost. |
|
|
Notes to Consolidated Financial Statements(continued) |
|
The following table summarizes the notional amount and credit exposurecarrying values of our total derivative portfolio at Sept.June 30, 20172020 and Dec. 31, 2016.2019.
|
| | | | | | | | | | | | | | | | | | | | |
| Impact of derivative instruments on the balance sheet | Notional value | | Asset derivatives fair value | | Liability derivatives fair value |
| | June 30, 2020 |
| Dec. 31, 2019 |
| | June 30, 2020 |
| Dec. 31, 2019 |
| | June 30, 2020 |
| Dec. 31, 2019 |
|
| (in millions) | | |
Derivatives designated as hedging instruments: (a)(b) | | | | | | | | |
| Interest rate contracts | $ | 27,775 |
| $ | 28,365 |
| | $ | — |
| $ | — |
| | $ | 915 |
| $ | 350 |
|
| Foreign exchange contracts | 8,040 |
| 8,390 |
| | 137 |
| 21 |
| | 49 |
| 257 |
|
| Total derivatives designated as hedging instruments | | | | $ | 137 |
| $ | 21 |
| | $ | 964 |
| $ | 607 |
|
Derivatives not designated as hedging instruments: (b)(c) | | | | | | | | |
| Interest rate contracts | $ | 217,613 |
| $ | 306,790 |
| | $ | 5,501 |
| $ | 3,690 |
| | $ | 4,668 |
| $ | 3,250 |
|
| Foreign exchange contracts | 781,991 |
| 848,961 |
| | 4,322 |
| 5,331 |
| | 4,036 |
| 5,340 |
|
| Equity contracts | 1,657 |
| 3,189 |
| | 13 |
| 19 |
| | 22 |
| 5 |
|
| Credit contracts | 165 |
| 165 |
| | — |
| — |
| | 2 |
| 4 |
|
| Total derivatives not designated as hedging instruments | | | | $ | 9,836 |
| $ | 9,040 |
| | $ | 8,728 |
| $ | 8,599 |
|
Total derivatives fair value (d) | | | | $ | 9,973 |
| $ | 9,061 |
| | $ | 9,692 |
| $ | 9,206 |
|
Effect of master netting agreements (e) | | | | (5,640 | ) | (5,819 | ) | | (5,817 | ) | (5,415 | ) |
| Fair value after effect of master netting agreements | | | | $ | 4,333 |
| $ | 3,242 |
| | $ | 3,875 |
| $ | 3,791 |
|
|
| | | | | | | | | | | | | | | | | | | | |
| Impact of derivative instruments on the balance sheet | Notional value | | Asset derivatives fair value | | Liability derivatives fair value |
| (in millions) | Sept. 30, 2017 |
| Dec. 31, 2016 |
| | Sept. 30, 2017 |
| Dec. 31, 2016 |
| | Sept. 30, 2017 |
| Dec. 31, 2016 |
|
Derivatives designated as hedging instruments: (a) | | | | | | | | |
| Interest rate contracts | $ | 36,533 |
| $ | 29,683 |
| | $ | 307 |
| $ | 415 |
| | $ | 494 |
| $ | 545 |
|
| Foreign exchange contracts | 8,399 |
| 7,796 |
| | 37 |
| 369 |
| | 318 |
| 52 |
|
| Total derivatives designated as hedging instruments | | | | $ | 344 |
| $ | 784 |
| | $ | 812 |
| $ | 597 |
|
Derivatives not designated as hedging instruments: (b) | | | | | | | | |
| Interest rate contracts | $ | 283,384 |
| $ | 325,412 |
| | $ | 6,734 |
| $ | 7,587 |
| | $ | 6,684 |
| $ | 7,633 |
|
| Foreign exchange contracts | 639,336 |
| 530,729 |
| | 4,879 |
| 6,104 |
| | 4,463 |
| 6,103 |
|
| Equity contracts | 1,354 |
| 1,167 |
| | 74 |
| 46 |
| | 134 |
| 112 |
|
| Credit contracts | 180 |
| 160 |
| | — |
| — |
| | 4 |
| 3 |
|
| Total derivatives not designated as hedging instruments | | | | $ | 11,687 |
| $ | 13,737 |
| | $ | 11,285 |
| $ | 13,851 |
|
Total derivatives fair value (c) | | | | $ | 12,031 |
| $ | 14,521 |
| | $ | 12,097 |
| $ | 14,448 |
|
Effect of master netting agreements (d) | | | | (8,470 | ) | (10,257 | ) | | (8,875 | ) | (10,047 | ) |
| Fair value after effect of master netting agreements | | | | $ | 3,561 |
| $ | 4,264 |
| | $ | 3,222 |
| $ | 4,401 |
|
| |
| (a) | The fair value of asset derivatives and liability derivatives designated as hedging instruments is recorded as other assets and other liabilities, respectively, on the consolidated balance sheet. |
| |
| (b) | For derivative transactions settled at clearing organizations, cash collateral exchanged is deemed a settlement of the derivative each day. The settlement reduces the gross fair value of derivative assets and liabilities and results in a corresponding decrease in the effect of master netting agreements, with no impact to the consolidated balance sheet. |
| |
| (c) | The fair value of asset derivatives and liability derivatives not designated as hedging instruments is recorded as trading assets and trading liabilities, respectively, on the consolidated balance sheet. |
| |
(c)(d) | Fair values are on a gross basis, before consideration of master netting agreements, as required by ASC 815, Derivatives and Hedging. |
| |
(d)(e) | Effect of master netting agreements includes cash collateral received and paid of $834$869 million and $1,239$1,046 million, respectively, at Sept.June 30, 20172020, and $1,119$1,022 million and $909$618 million, respectively, at Dec. 31, 20162019. |
Trading activities (including trading derivatives)
Our trading activities are focused on acting as a market-maker for our customers, facilitating customer trades and risk mitigating economic hedging in compliance with the Volcker Rule. The change in the fair value of the derivatives utilized in our trading activities is recorded in foreign exchange and other trading revenue on the consolidated income statement.
The following tables presenttable presents our foreign exchange and other trading revenue.
|
| | | | | | | | | | | | | | | |
| Foreign exchange and other trading revenue | |
| (in millions) | 2Q20 |
| 1Q20 |
| 2Q19 |
| YTD20 |
| YTD19 |
|
| Foreign exchange | $ | 174 |
| $ | 253 |
| $ | 150 |
| $ | 427 |
| $ | 310 |
|
| Other trading (loss) revenue | (8 | ) | 66 |
| 16 |
| 58 |
| 26 |
|
| Total foreign exchange and other trading revenue | $ | 166 |
| $ | 319 |
| $ | 166 |
| $ | 485 |
| $ | 336 |
|
Foreign exchange revenue includes income from purchasing and selling foreign currencies and
currency forwards, futures and options. Other trading revenue reflects results from trading in cash instruments, including fixed income and equity securities and non-foreign exchange derivatives.
We also use derivative financial instruments as risk mitigating economic hedges, which are not formally designated as accounting hedges. This includes hedging the impactforeign currency, interest rate or market risks inherent in some of derivative instruments usedour balance sheet exposures, such as seed capital investments and deposits, as well as certain investment management fee revenue streams. We also use total return swaps to economically hedge obligations arising from the Company’s deferred compensation plan whereby the participants defer compensation and earn a return linked to the performance of investments they select. The gains or losses on these total return swaps are recorded in fair value, cash flowstaff expense on the consolidated income statement and net investment hedging relationshipswere gains of $28 million in the income statement.second quarter of 2020 and $5 million in the second quarter of 2019, losses of $41 million in the first quarter of 2020 and $13 million in the first six months of 2020 and a gain of $23 million in the first six months of 2019.
|
| | | | | | | | | | | | | | | | | | | | | | | | | | | |
Impact of derivative instruments in the income statement (in millions) | | |
| Derivatives in fair value hedging relationships | Location of gain or (loss) recognized in income on derivatives | | Gain or (loss) recognized in income on derivatives | | Location of gain or (loss) recognized in income on hedged item | | Gain or (loss) recognized in hedged item |
| 3Q17 |
| | 2Q17 |
| | 3Q16 |
| | 3Q17 |
| | 2Q17 |
| | 3Q16 |
|
| Interest rate contracts | Net interest revenue | | $ | (33 | ) | | $ | 2 |
| | $ | (174 | ) | | Net interest revenue | | $ | 31 |
| | $ | (9 | ) | | $ | 168 |
|
|
| | | | | | | | | | | | | | | | | | | | | | | | | | | | | | | | | |
Derivatives in cash flow hedging relationships | Gain or (loss) recognized in accumulated OCI on derivatives (effective portion) | | Location of gain or (loss) reclassified from accumulated OCI into income (effective portion) | | Gain or (loss) reclassified from accumulated OCI into income (effective portion) | | Location of gain or (loss) recognized in income on derivatives (ineffective portion and amount excluded from effectiveness testing) | | Gain or (loss) recognized in income on derivatives (ineffectiveness portion and amount excluded from effectiveness testing) |
| 3Q17 |
| 2Q17 |
| 3Q16 |
| | | 3Q17 |
| 2Q17 |
| 3Q16 |
| | | 3Q17 |
| 2Q17 |
| 3Q16 |
|
| FX contracts | $ | — |
| $ | — |
| $ | (7 | ) | | Net interest revenue | | $ | — |
| $ | — |
| $ | (6 | ) | | Net interest revenue | | $ | — |
| $ | — |
| $ | — |
|
| FX contracts | 3 |
| (1 | ) | — |
| | Other revenue | | — |
| — |
| — |
| | Other revenue | | — |
| — |
| — |
|
| FX contracts | (1 | ) | — |
| (19 | ) | | Trading revenue | | (1 | ) | — |
| (19 | ) | | Trading revenue | | — |
| — |
| — |
|
| FX contracts | (4 | ) | (7 | ) | 2 |
| | Salary expense | | (2 | ) | (9 | ) | (3 | ) | | Salary expense | | — |
| — |
| — |
|
| Total | $ | (2 | ) | $ | (8 | ) | $ | (24 | ) | | | | $ | (3 | ) | $ | (9 | ) | $ | (28 | ) | | | | $ | — |
| $ | — |
| $ | — |
|
|
|
Notes to Consolidated Financial Statements(continued) |
| |
|
| | | | | | | | | | | | | | | | | | | | | | | | | | | | | | | | | |
Derivatives in net investment hedging relationships | Gain or (loss) recognized in accumulated OCI on derivatives (effective portion) | | Location of gain or (loss) reclassified from accumulated OCI into income (effective portion) | | Gain or (loss) reclassified from accumulated OCI into income (effective portion) | | Location of gain or (loss) recognized in income on derivatives (ineffective portion and amount excluded from effectiveness testing) | | Gain or (loss) recognized in income on derivatives (ineffectiveness portion and amount excluded from effectiveness testing) |
| 3Q17 |
| 2Q17 |
| 3Q16 |
| | | 3Q17 |
| 2Q17 |
| 3Q16 |
| | | 3Q17 |
| 2Q17 |
| 3Q16 |
|
| FX contracts | $ | (206 | ) | $ | (274 | ) | $ | 47 |
| | Net interest revenue | | $ | — |
| $ | — |
| $ | — |
| | Other revenue | | $ | — |
| $ | — |
| $ | — |
|
|
| | | | | | | | | | | | | | | | | | | |
Impact of derivative instruments in the income statement (in millions) | |
| Derivatives in fair value hedging relationships | Location of gain or (loss) recognized in income on derivatives | | Gain or (loss) recognized in income on derivatives | | Location of gain or (loss) recognized in income on hedged item | | Gain or (loss) recognized in hedged item |
| YTD17 |
| | YTD16 |
| YTD17 |
| | YTD16 |
|
| Interest rate contracts | Net interest revenue | | $ | (21 | ) | | $ | (445 | ) | | Net interest revenue | | $ | 8 |
| | $ | 417 |
|
|
| | | | | | | | | | | | | | | | | | | | | | | | |
Derivatives in cash flow hedging relationships | Gain or (loss) recognized in accumulated OCI on derivatives (effective portion) | | Location of gain or (loss) reclassified from accumulated OCI into income (effective portion) | | Gain or (loss) reclassified from accumulated OCI into income (effective portion) | | Location of gain or (loss) recognized in income on derivatives (ineffective portion and amount excluded from effectiveness testing) | | Gain or (loss) recognized in income on derivatives (ineffectiveness portion and amount excluded from effectiveness testing) |
| YTD17 |
| YTD16 |
| | | YTD17 |
| YTD16 |
| | | YTD17 |
| YTD16 |
|
| FX contracts | $ | — |
| $ | (16 | ) | | Net interest revenue | | $ | — |
| $ | (16 | ) | | Net interest revenue | | $ | — |
| $ | — |
|
| FX contracts | 2 |
| — |
| | Other revenue | | — |
| — |
| | Other revenue | | — |
| — |
|
| FX contracts | 2 |
| (89 | ) | | Trading revenue | | 2 |
| (89 | ) | | Trading revenue | | — |
| — |
|
| FX contracts | — |
| (10 | ) | | Salary expense | | (15 | ) | (5 | ) | | Salary expense | | — |
| — |
|
| Total | $ | 4 |
| $ | (115 | ) | | | | $ | (13 | ) | $ | (110 | ) | | | | $ | — |
| $ | — |
|
|
| | | | | | | | | | | | | | | | | | | | | | | | |
Derivatives in net investment hedging relationships | Gain or (loss) recognized in accumulated OCI on derivatives (effective portion) | | Location of gain or (loss) reclassified from accumulated OCI into income (effective portion) | | Gain or (loss) reclassified from accumulated OCI into income (effective portion) | | Location of gain or (loss) recognized in income on derivatives (ineffective portion and amount excluded from effectiveness testing) | | Gain or (loss) recognized in income on derivatives (ineffectiveness portion and amount excluded from effectiveness testing) |
| YTD17 |
| YTD16 |
| | | YTD17 |
| YTD16 |
| | | YTD17 |
| YTD16 |
|
| FX contracts | $ | (576 | ) | $ | 320 |
| | Net interest revenue | | $ | — |
| $ | — |
| | Other revenue | | $ | — |
| $ | — |
|
Trading activities (including trading derivatives)
We manage trading risk through a system of position limits, a VaRvalue-at-risk (“VaR”) methodology based on historical simulation and other market sensitivity measures. Risk is monitored and reported to senior management by a separate unit, independent from trading, on a daily basis. Based on certain assumptions, the VaR methodology is designed to capture the potential overnight pre-tax dollar loss from adverse changes in fair values of all trading positions. The calculation assumes a one-day holding period, utilizes a 99% confidence level and incorporates non-linear product characteristics. The VaR model is one of several statistical models used to develop economic capital results, which are allocated to lines of business for computing risk-adjusted performance.
As the VaR methodology does not evaluate risk attributable to extraordinary financial, economic or other occurrences,occurrences. As a result, the risk assessment process includes a number of stress scenarios based upon the risk factors in the portfolio and management’s assessment of market conditions. Additional stress scenarios based upon historical market events are also performed. Stress tests may incorporate the impact of reduced market liquidity and the breakdown of historically observed correlations and extreme scenarios. VaR and other statistical measures, stress testing and sensitivity analysis are incorporated ininto other risk management materials.
|
|
Notes to Consolidated Financial Statements(continued)
|
|
The following table presents our foreign exchange and other trading revenue.
|
| | | | | | | | | | | | | | | |
| Foreign exchange and other trading revenue |
| (in millions) | 3Q17 |
| 2Q17 |
| 3Q16 |
| YTD17 |
| YTD16 |
|
| Foreign exchange | $ | 158 |
| $ | 151 |
| $ | 175 |
| $ | 463 |
| $ | 512 |
|
| Other trading revenue | 15 |
| 14 |
| 8 |
| 39 |
| 28 |
|
| Total foreign exchange and other trading revenue | $ | 173 |
| $ | 165 |
| $ | 183 |
| $ | 502 |
| $ | 540 |
|
Foreign exchange revenue includes income from purchasing and selling foreign currencies and currency forwards, futures and options. Other trading revenue reflects results from futures and forward contracts, interest rate swaps, structured foreign currency swaps, options, equity derivatives and fixed income and equity securities.
Counterparty credit risk and collateral
We assess the credit risk of our counterparties through regular examination of their financial statements, confidential communication with the management of those counterparties and regular monitoring of publicly available credit rating information. This and other information is used to develop proprietary credit rating metrics used to assess credit quality.
Collateral requirements are determined after a comprehensive review of the credit quality of each counterparty. Collateral is generally held or pledged in the form of cash and/or highly liquid government securities. Collateral requirements are monitored and adjusted daily.
Additional disclosures concerning derivative financial instruments are provided in Note 14 of the Notes to Consolidated Financial Statements.15.
Disclosure of contingent features in OTCover-the-counter (“OTC”) derivative instruments
Certain OTC derivative contracts and/or collateral agreements contain credit-risk contingent features triggered upon a rating downgrade in which the counterparty has the right to request additional collateral or the right to terminate the contracts in a net liability position.
The following table shows the aggregate fair value of OTC derivative contracts in net liability positions that contained credit-risk contingent features and the value of collateral that has been posted.
|
| | | | | | |
| | June 30, 2020 |
| Dec. 31, 2019 |
|
| (in millions) |
Aggregate fair value of OTC derivatives in net liability positions (a) | $ | 5,951 |
| $ | 3,442 |
|
| Collateral posted | $ | 6,372 |
| $ | 3,671 |
|
| |
| (a) | Before consideration of cash collateral. |
The aggregate fair value of OTC derivative contracts containing credit-risk contingent features can fluctuate from quarter to quarter due to changes in market conditions, composition of counterparty trades, new business or changes to the contingent features.
The Bank of New York Mellon, our largest banking subsidiary, and the subsidiary through which BNY Mellon enters into the substantial majority of itsour OTC derivative contracts and/or collateral agreements, contain provisions thatagreements. As such, the contingent features may require us to take certain actionsbe triggered if The Bank of New York Mellon’s public debtlong-term issuer rating fell to a certain level. Early termination provisions, or “close-out”
was downgraded.agreements, in those contracts could trigger immediate payment of outstanding contracts that are in net liability positions. Certain collateral agreements would require The Bank of New York Mellon to immediately post additional collateral to cover some or all of The Bank of New York Mellon’s liabilities to a counterparty.
The following table shows the fair value of contracts falling under early termination provisions that were in net liability positions as of Sept. 30, 2017 for three key ratings triggers.
| | | If The Bank of New York Mellon’s rating was changed to (Moody’s/S&P) | Potential close-out exposures (fair value) (a) | | |
Potential close-out exposures (fair value) (a) | | Potential close-out exposures (fair value) (a) | |
| | | June 30, 2020 |
| Dec. 31, 2019 |
|
| (in millions) | |
If The Bank of New York Mellon’s rating changed to: (b) | | |
| A3/A- | | $ | 92 | million | $ | 31 |
| $ | 56 |
|
| Baa2/BBB | | $ | 430 | million | $ | 558 |
| $ | 608 |
|
| Ba1/BB+ | | $ | 1,899 | million | $ | 2,981 |
| $ | 2,084 |
|
| |
| (a) | The amounts represent potential total close-out values if The Bank of New York Mellon’s long-term issuer rating were to immediately drop to the indicated levels.levels, and do not reflect collateral posted. |
| |
| (b) | Represents ratings by Moody’s/S&P. |
The aggregated fair value of contracts impacting potential trade close-out amounts and collateral obligations can fluctuate from quarter to quarter due to changes in market conditions, changes in the composition of counterparty trades, new business or changes to the agreement definitions establishing close-out or collateral obligations.
Additionally, ifBNY Mellon 93
|
|
Notes to Consolidated Financial Statements(continued) |
|
If The Bank of New York Mellon’s debt rating had fallen below investment grade on Sept.June 30, 2017,2020 and Dec. 31, 2019, existing collateral arrangements would
have required us to post an additional $151collateral of $31 million of collateral.
and $63 million, respectively.
|
|
Notes to Consolidated Financial Statements(continued)
|
|
The following tables present derivative instruments and financial instruments that are either subject to an enforceable netting agreement or offset by collateral arrangements.and their related offsets. There were no derivative instruments or financial instruments subject to a legally enforceable netting agreement for which we are not currently netting.
| | | Offsetting of derivative assets and financial assets at Sept. 30, 2017 | | |
| Offsetting of derivative assets and financial assets at June 30, 2020 | | Offsetting of derivative assets and financial assets at June 30, 2020 | |
| | Gross assets recognized |
| Gross amounts offset in the balance sheet |
| | Net assets recognized on the balance sheet |
| Gross amounts not offset in the balance sheet | | Gross assets recognized |
| Gross amounts offset in the balance sheet |
| | Net assets recognized in the balance sheet |
| Gross amounts not offset in the balance sheet | |
| (in millions) | (a) | Financial instruments |
| Cash collateral received |
| Net amount |
| (a) | Financial instruments |
| Cash collateral received |
| Net amount |
|
| Derivatives subject to netting arrangements: | | | | | | |
| Interest rate contracts | $ | 6,182 |
| $ | 5,301 |
| | $ | 881 |
| $ | 189 |
| $ | — |
| $ | 692 |
| $ | 3,549 |
| $ | 2,436 |
| | $ | 1,113 |
| $ | 384 |
| $ | — |
| $ | 729 |
|
| Foreign exchange contracts | 4,281 |
| 3,120 |
| | 1,161 |
| 82 |
| — |
| 1,079 |
| 4,026 |
| 3,204 |
| | 822 |
| 7 |
| — |
| 815 |
|
| Equity and other contracts | 69 |
| 49 |
| | 20 |
| — |
| — |
| 20 |
| 9 |
| — |
| | 9 |
| 1 |
| — |
| 8 |
|
| Total derivatives subject to netting arrangements | 10,532 |
| 8,470 |
| | 2,062 |
| 271 |
| — |
| 1,791 |
| 7,584 |
| 5,640 |
| | 1,944 |
| 392 |
| — |
| 1,552 |
|
| Total derivatives not subject to netting arrangements | 1,499 |
| — |
| | 1,499 |
| — |
| — |
| 1,499 |
| 2,389 |
| — |
| | 2,389 |
| — |
| — |
| 2,389 |
|
| Total derivatives | 12,031 |
| 8,470 |
| | 3,561 |
| 271 |
| — |
| 3,290 |
| 9,973 |
| 5,640 |
| | 4,333 |
| 392 |
| — |
| 3,941 |
|
| Reverse repurchase agreements | 36,118 |
| 19,171 |
| (b) | 16,947 |
| 16,890 |
| — |
| 57 |
| 72,781 |
| 48,615 |
| (b) | 24,166 |
| 24,140 |
| — |
| 26 |
|
| Securities borrowing | 10,936 |
| — |
| | 10,936 |
| 10,627 |
| — |
| 309 |
| 12,472 |
| — |
| | 12,472 |
| 11,843 |
| — |
| 629 |
|
| Total | $ | 59,085 |
| $ | 27,641 |
| | $ | 31,444 |
| $ | 27,788 |
| $ | — |
| $ | 3,656 |
| $ | 95,226 |
| $ | 54,255 |
| | $ | 40,971 |
| $ | 36,375 |
| $ | — |
| $ | 4,596 |
|
| |
| (a) | Includes the effect of netting agreements and net cash collateral received. The offset related to the OTC derivatives was allocated to the various types of derivatives based on the net positions. |
| |
| (b) | Offsetting of reverse repurchase agreements relates to our involvement in the Fixed Income Clearing Corporation (“FICC”), where we settle government securities transactions on a net basis for payment and delivery through the Fedwire system. |
|
| | | | | | | | | | | | | | | | | | | |
| Offsetting of derivative assets and financial assets at Dec. 31, 2019 | | | | |
| | Gross assets recognized |
| Gross amounts offset in the balance sheet |
| | Net assets recognized in the balance sheet |
| Gross amounts not offset in the balance sheet | |
| (in millions) | (a) | Financial instruments |
| Cash collateral received |
| Net amount |
|
| Derivatives subject to netting arrangements: | | | | | | | |
| Interest rate contracts | $ | 2,394 |
| $ | 1,792 |
| | $ | 602 |
| $ | 207 |
| $ | — |
| $ | 395 |
|
| Foreign exchange contracts | 4,861 |
| 4,021 |
| | 840 |
| 44 |
| — |
| 796 |
|
| Equity and other contracts | 9 |
| 6 |
| | 3 |
| — |
| — |
| 3 |
|
| Total derivatives subject to netting arrangements | 7,264 |
| 5,819 |
| | 1,445 |
| 251 |
| — |
| 1,194 |
|
| Total derivatives not subject to netting arrangements | 1,797 |
| — |
| | 1,797 |
| — |
| — |
| 1,797 |
|
| Total derivatives | 9,061 |
| 5,819 |
| | 3,242 |
| 251 |
| — |
| 2,991 |
|
| Reverse repurchase agreements | 112,355 |
| 93,794 |
| (b) | 18,561 |
| 18,554 |
| — |
| 7 |
|
| Securities borrowing | 11,621 |
| — |
| | 11,621 |
| 11,278 |
| — |
| 343 |
|
| Total | $ | 133,037 |
| $ | 99,613 |
| | $ | 33,424 |
| $ | 30,083 |
| $ | — |
| $ | 3,341 |
|
|
| | | | | | | | | | | | | | | | | | | |
| Offsetting of derivative assets and financial assets at Dec. 31, 2016 | | | | |
| | Gross assets recognized |
| Gross amounts offset in the balance sheet |
| | Net assets recognized on the balance sheet |
| Gross amounts not offset in the balance sheet | |
| (in millions) | (a) | Financial instruments |
| Cash collateral received |
| Net amount |
|
| Derivatives subject to netting arrangements: | | | | | | | |
| Interest rate contracts | $ | 7,205 |
| $ | 6,047 |
| | $ | 1,158 |
| $ | 321 |
| $ | — |
| $ | 837 |
|
| Foreign exchange contracts | 5,265 |
| 4,172 |
| | 1,093 |
| 202 |
| — |
| 891 |
|
| Equity and other contracts | 44 |
| 38 |
| | 6 |
| — |
| — |
| 6 |
|
| Total derivatives subject to netting arrangements | 12,514 |
| 10,257 |
| | 2,257 |
| 523 |
| — |
| 1,734 |
|
| Total derivatives not subject to netting arrangements | 2,007 |
| — |
| | 2,007 |
| — |
| — |
| 2,007 |
|
| Total derivatives | 14,521 |
| 10,257 |
| | 4,264 |
| 523 |
| — |
| 3,741 |
|
| Reverse repurchase agreements | 17,588 |
| 481 |
| (b) | 17,107 |
| 17,104 |
| — |
| 3 |
|
| Securities borrowing | 8,694 |
| — |
| | 8,694 |
| 8,425 |
| — |
| 269 |
|
| Total | $ | 40,803 |
| $ | 10,738 |
| | $ | 30,065 |
| $ | 26,052 |
| $ | — |
| $ | 4,013 |
|
| |
| (a) | Includes the effect of netting agreements and net cash collateral received. The offset related to the OTC derivatives was allocated to the various types of derivatives based on the net positions. |
| |
| (b) | Offsetting of reverse repurchase agreements relates to our involvement in the Fixed Income Clearing Corporation,FICC, where we settle government securities transactions on a net basis for payment and delivery through the Fedwire system. |
|
|
Notes to Consolidated Financial Statements(continued) |
| |
|
| | | | | | | | | | | | | | | | | | | |
| Offsetting of derivative liabilities and financial liabilities at June 30, 2020 | Net liabilities recognized in the balance sheet |
| | | |
| | Gross liabilities recognized |
| Gross amounts offset in the balance sheet |
| | Gross amounts not offset in the balance sheet | |
| (in millions) | (a) | Financial instruments |
| Cash collateral pledged |
| Net amount |
|
| Derivatives subject to netting arrangements: | | | | | | | |
| Interest rate contracts | $ | 5,563 |
| $ | 2,680 |
| | $ | 2,883 |
| $ | 2,849 |
| $ | — |
| $ | 34 |
|
| Foreign exchange contracts | 3,690 |
| 3,134 |
| | 556 |
| 150 |
| — |
| 406 |
|
| Equity and other contracts | 22 |
| 3 |
| | 19 |
| — |
| — |
| 19 |
|
| Total derivatives subject to netting arrangements | 9,275 |
| 5,817 |
| | 3,458 |
| 2,999 |
| — |
| 459 |
|
| Total derivatives not subject to netting arrangements | 417 |
| — |
| | 417 |
| — |
| — |
| 417 |
|
| Total derivatives | 9,692 |
| 5,817 |
| | 3,875 |
| 2,999 |
| — |
| 876 |
|
| Repurchase agreements | 59,794 |
| 48,615 |
| (b) | 11,179 |
| 11,175 |
| — |
| 4 |
|
| Securities lending | 982 |
| — |
| | 982 |
| 962 |
| — |
| 20 |
|
| Total | $ | 70,468 |
| $ | 54,432 |
| | $ | 16,036 |
| $ | 15,136 |
| $ | — |
| $ | 900 |
|
|
| | | | | | | | | | | | | | | | | | | |
| Offsetting of derivative liabilities and financial liabilities at Sept. 30, 2017 | Net liabilities recognized on the balance sheet |
| | | |
| | Gross liabilities recognized |
| Gross amounts offset in the balance sheet |
| | Gross amounts not offset in the balance sheet | |
| (in millions) | (a) | Financial instruments |
| Cash collateral pledged |
| Net amount |
|
| Derivatives subject to netting arrangements: | | | | | | | |
| Interest rate contracts | $ | 7,103 |
| $ | 5,705 |
| | $ | 1,398 |
| $ | 1,311 |
| $ | — |
| $ | 87 |
|
| Foreign exchange contracts | 4,074 |
| 3,095 |
| | 979 |
| 234 |
| — |
| 745 |
|
| Equity and other contracts | 130 |
| 75 |
| | 55 |
| 49 |
| — |
| 6 |
|
| Total derivatives subject to netting arrangements | 11,307 |
| 8,875 |
| | 2,432 |
| 1,594 |
| — |
| 838 |
|
| Total derivatives not subject to netting arrangements | 790 |
| — |
| | 790 |
| — |
| — |
| 790 |
|
| Total derivatives | 12,097 |
| 8,875 |
| | 3,222 |
| 1,594 |
| — |
| 1,628 |
|
| Repurchase agreements | 27,321 |
| 19,171 |
| (b) | 8,150 |
| 8,149 |
| — |
| 1 |
|
| Securities lending | 1,904 |
| — |
| | 1,904 |
| 1,812 |
| — |
| 92 |
|
| Total | $ | 41,322 |
| $ | 28,046 |
| | $ | 13,276 |
| $ | 11,555 |
| $ | — |
| $ | 1,721 |
|
| |
| (a) | Includes the effect of netting agreements and net cash collateral paid. The offset related to the OTC derivatives was allocated to the various types of derivatives based on the net positions. |
| |
| (b) | Offsetting of repurchase agreements relates to our involvement in the Fixed Income Clearing Corporation,FICC, where we settle government securities transactions on a net basis for payment and delivery through the Fedwire system. |
| | | Offsetting of derivative liabilities and financial liabilities at Dec. 31, 2016 | Net liabilities recognized on the balance sheet |
| | |
| Offsetting of derivative liabilities and financial liabilities at Dec. 31, 2019 | | Offsetting of derivative liabilities and financial liabilities at Dec. 31, 2019 | Net liabilities recognized in the balance sheet |
| |
| | Gross liabilities recognized |
| Gross amounts offset in the balance sheet |
| | Gross amounts not offset in the balance sheet | | Gross liabilities recognized |
| Gross amounts offset in the balance sheet |
| | Gross amounts not offset in the balance sheet | |
| (in millions) | (a) | Financial instruments |
| Cash collateral pledged |
| Net liabilities recognized on the balance sheet |
| Net amount |
| (a) | Cash collateral pledged |
| Net liabilities recognized in the balance sheet |
| Net amount |
|
| Derivatives subject to netting arrangements: | | | | | | |
| Interest rate contracts | $ | 8,116 |
| $ | 6,634 |
| | $ | 1,482 |
| $ | 1,266 |
| $ | 216 |
| $ | 3,550 |
| $ | 1,986 |
| | $ | 1,564 |
| $ | 1,539 |
| $ | 25 |
|
| Foreign exchange contracts | 4,957 |
| 3,363 |
| | 1,594 |
| 355 |
| — |
| 1,239 |
| 4,873 |
| 3,428 |
| | 1,445 |
| 74 |
| — |
| 1,371 |
|
| Equity and other contracts | 104 |
| 50 |
| | 54 |
| 54 |
| — |
| — |
| 5 |
| 1 |
| | 4 |
| 2 |
| — |
| 2 |
|
| Total derivatives subject to netting arrangements | 13,177 |
| 10,047 |
| | 3,130 |
| 1,675 |
| — |
| 1,455 |
| 8,428 |
| 5,415 |
| | 3,013 |
| 1,615 |
| — |
| 1,398 |
|
| Total derivatives not subject to netting arrangements | 1,271 |
| — |
| | 1,271 |
| — |
| — |
| 1,271 |
| 778 |
| — |
| | 778 |
| — |
| — |
| 778 |
|
| Total derivatives | 14,448 |
| 10,047 |
| | 4,401 |
| 1,675 |
| — |
| 2,726 |
| 9,206 |
| 5,415 |
| | 3,791 |
| 1,615 |
| — |
| 2,176 |
|
| Repurchase agreements | 8,703 |
| 481 |
| (b) | 8,222 |
| 8,222 |
| — |
| — |
| 104,451 |
| 93,794 |
| (b) | 10,657 |
| 10,657 |
| — |
| — |
|
| Securities lending | 1,615 |
| — |
| | 1,615 |
| 1,522 |
| — |
| 93 |
| 718 |
| — |
| | 718 |
| 694 |
| — |
| 24 |
|
| Total | $ | 24,766 |
| $ | 10,528 |
| | $ | 14,238 |
| $ | 11,419 |
| $ | — |
| $ | 2,819 |
| $ | 114,375 |
| $ | 99,209 |
| | $ | 15,166 |
| $ | 12,966 |
| $ | — |
| $ | 2,200 |
|
| |
| (a) | Includes the effect of netting agreements and net cash collateral paid. The offset related to the OTC derivatives was allocated to the various types of derivatives based on the net positions. |
| |
| (b) | Offsetting of repurchase agreements relates to our involvement in the Fixed Income Clearing Corporation,FICC, where we settle government securities transactions on a net basis for payment and delivery through the Fedwire system. |
|
|
Notes to Consolidated Financial Statements(continued) |
| |
Secured borrowings
The following tables presenttable presents the contract value of repurchase agreements and securities lending transactions accounted for as secured borrowings by the type of collateral provided to counterparties.
|
| | | | | | | | | | | | | | | | | | | | | | | | | |
| Repurchase agreements and securities lending transactions accounted for as secured borrowings |
| | June 30, 2020 | | Dec. 31, 2019 |
| | Remaining contractual maturity | Total |
| | Remaining contractual maturity | Total |
|
| (in millions) | Overnight and continuous |
| Up to 30 days |
| 30 days or more |
| | Overnight and continuous |
| Up to 30 days |
| 30 days or more |
|
| Repurchase agreements: | | | | | | | | | |
| U.S. Treasury | $ | 52,950 |
| $ | 300 |
| $ | 109 |
| $ | 53,359 |
| | $ | 94,788 |
| $ | 10 |
| $ | — |
| $ | 94,798 |
|
| U.S. government agencies | 642 |
| — |
| — |
| 642 |
| | 594 |
| 16 |
| — |
| 610 |
|
| Agency RMBS | 1,384 |
| — |
| 149 |
| 1,533 |
| | 4,234 |
| 774 |
| — |
| 5,008 |
|
| Corporate bonds | 195 |
| 23 |
| 1,272 |
| 1,490 |
| | 266 |
| 236 |
| 1,617 |
| 2,119 |
|
| Other debt securities | 93 |
| 79 |
| 1,749 |
| 1,921 |
| | 40 |
| 188 |
| 1,079 |
| 1,307 |
|
| Equity securities | — |
| 98 |
| 751 |
| 849 |
| | 31 |
| 99 |
| 479 |
| 609 |
|
| Total | $ | 55,264 |
| $ | 500 |
| $ | 4,030 |
| $ | 59,794 |
| | $ | 99,953 |
| $ | 1,323 |
| $ | 3,175 |
| $ | 104,451 |
|
| Securities lending: | | | | | | | | | |
| U.S. government agencies | $ | 21 |
| $ | — |
| $ | — |
| $ | 21 |
| | $ | 19 |
| $ | — |
| $ | — |
| $ | 19 |
|
| Other debt securities | 191 |
| — |
| — |
| 191 |
| | 201 |
| — |
| — |
| 201 |
|
| Equity securities | 770 |
| — |
| — |
| 770 |
| | 498 |
| — |
| — |
| 498 |
|
| Total | $ | 982 |
| $ | — |
| $ | — |
| $ | 982 |
| | $ | 718 |
| $ | — |
| $ | — |
| $ | 718 |
|
| Total secured borrowings | $ | 56,246 |
| $ | 500 |
| $ | 4,030 |
| $ | 60,776 |
| | $ | 100,671 |
| $ | 1,323 |
| $ | 3,175 |
| $ | 105,169 |
|
|
| | | | | | | | | | | | |
| Repurchase agreements and securities lending transactions accounted for as secured borrowings at Sept. 30, 2017 |
| | Remaining contractual maturity of the agreements |
| (in millions) | Overnight and continuous |
| Up to 30 days |
| 30 days or more |
| Total |
|
| Repurchase agreements: | | | | |
| U.S. Treasury | $ | 21,432 |
| $ | — |
| $ | — |
| $ | 21,432 |
|
| U.S. government agencies | 489 |
| 110 |
| — |
| 599 |
|
| Agency RMBS | 1,798 |
| 190 |
| — |
| 1,988 |
|
| Corporate bonds | 282 |
| — |
| 940 |
| 1,222 |
|
| Other debt securities | 254 |
| — |
| 871 |
| 1,125 |
|
| Equity securities | 466 |
| — |
| 489 |
| 955 |
|
| Total | $ | 24,721 |
| $ | 300 |
| $ | 2,300 |
| $ | 27,321 |
|
| Securities lending: | | | | |
| U.S. government agencies | $ | 15 |
| $ | — |
| $ | — |
| $ | 15 |
|
| Other debt securities | 477 |
| — |
| — |
| 477 |
|
| Equity securities | 1,412 |
| — |
| — |
| 1,412 |
|
| Total | $ | 1,904 |
| $ | — |
| $ | — |
| $ | 1,904 |
|
| Total borrowings | $ | 26,625 |
| $ | 300 |
| $ | 2,300 |
| $ | 29,225 |
|
|
| | | | | | | | | | | | |
| Repurchase agreements and securities lending transactions accounted for as secured borrowings at Dec. 31, 2016 |
| | Remaining contractual maturity of the agreements |
| (in millions) | Overnight and continuous |
| Up to 30 days |
| 30 days or more |
| Total |
|
| Repurchase agreements: | | | | |
| U.S. Treasury | $ | 2,488 |
| $ | 4 |
| $ | — |
| $ | 2,492 |
|
| U.S. government agencies | 396 |
| 10 |
| — |
| 406 |
|
| Agency RMBS | 3,294 |
| 386 |
| — |
| 3,680 |
|
| Corporate bonds | 304 |
| — |
| 694 |
| 998 |
|
| Other debt securities | 146 |
| — |
| 563 |
| 709 |
|
| Equity securities | 375 |
| — |
| 43 |
| 418 |
|
| Total | $ | 7,003 |
| $ | 400 |
| $ | 1,300 |
| $ | 8,703 |
|
| Securities lending: | | | | |
| U.S. government agencies | $ | 39 |
| $ | — |
| $ | — |
| $ | 39 |
|
| Other debt securities | 477 |
| — |
| — |
| 477 |
|
| Equity securities | 1,099 |
| — |
| — |
| 1,099 |
|
| Total | $ | 1,615 |
| $ | — |
| $ | — |
| $ | 1,615 |
|
| Total borrowings | $ | 8,618 |
| $ | 400 |
| $ | 1,300 |
| $ | 10,318 |
|
BNY Mellon’s repurchase agreements and securities lending transactions primarily encounter risk associated with liquidity. We are required to pledge collateral based on predetermined terms within the agreements. If we were to experience a decline in the fair value of the collateral pledged for these transactions, we could be required to provide
additional collateral to the counterparty, therefore decreasing the amount of assets available for other liquidity needs that may arise. BNY Mellon also offers tri-party collateral agency services in the tri-party repo market where we are exposed to credit risk. In order to mitigate this risk, we require dealers to fully secure intraday credit.
|
|
Notes to Consolidated Financial Statements(continued)
|
|
Note 17 - 18–Commitments and contingent liabilities
Off-balance sheet arrangements
In the normal course of business, various commitments and contingent liabilities are outstanding that are not reflected in the accompanying consolidated balance sheets.
Our significant trading and off-balance sheet risks are securities, foreign currency and interest rate risk management products, commercial lending commitments, letters of credit and securities lending
indemnifications. We assume these risks to reduce interest rate and foreign currency risks, to provide customers with the ability to meet credit and liquidity needs and to hedge foreign currency and interest rate risks. These items involve, to varying degrees, credit, foreign currency and interest rate riskrisks not recognized on the balance sheet. Our off-balance sheet risks are managed and monitored in manners similar to those used for on-balance sheet risks.
The following table presents a summary of our off-balance sheet credit risks.
| | | Off-balance sheet credit risks | Sept. 30, 2017 |
| Dec. 31, 2016 |
| June 30, 2020 |
| Dec. 31, 2019 |
|
| (in millions) |
| Lending commitments | $ | 49,983 |
| $ | 51,270 |
| $ | 49,147 |
| $ | 49,119 |
|
Standby letters of credit (a) | 3,619 |
| 4,185 |
| |
Standby letters of credit (“SBLC”) (a) | | 2,291 |
| 2,298 |
|
| Commercial letters of credit | 265 |
| 339 |
| 59 |
| 74 |
|
Securities lending indemnifications (b)(c) | 406,434 |
| 317,690 |
| 417,924 |
| 408,378 |
|
| |
| (a) | Net of participations totaling $681$145 million at Sept.June 30, 20172020 and $662$146 million at Dec. 31, 2016.2019. |
| |
| (b) | Excludes the indemnification for securities for which BNY Mellon acts as an agent on behalf of CIBC Mellon clients, which totaled $65$58 billion at Sept.June 30, 20172020 and $61$57 billion at Dec. 31, 2016.2019. |
| |
| (c) | Includes cash collateral, invested in indemnified repurchase agreements, held by us as securities lending agent of $40 billion at June 30, 2020 and $37 billion at Dec. 31, 2019. |
|
|
Notes to Consolidated Financial Statements(continued) |
|
The total potential loss on undrawn lending commitments, standby and commercial letters of credit, and securities lending indemnifications is equal to the total notional amount if drawn upon, which does not consider the value of any collateral.
Since many of the lending commitments are expected to expire without being drawn upon, the total amount does not necessarily represent future cash requirements. A summary of lending commitment maturities is as follows: $29.8$32.6 billion in less than one year, $20.0$16.2 billion in one to five years and $158$319 million over five years.
Standby letters of credit (“SBLC”)SBLCs principally support obligations of corporate obligationsclients and were collateralized with cash and securities of $178$185 million at Sept.June 30, 20172020 and $293$184 million at Dec. 31, 2016.2019. At Sept.June 30, 2017, $2.32020, $1.7 billion of the SBLCs will expire within one year, and $1.2 billion$545 million in one to five years and $48$7 million in over five years.
We must recognize, at the inception of an SBLC and foreign and other guarantees, a liability for the fair value of the obligation undertaken in issuing the guarantee. The fair value of the liability, which was recorded with a corresponding asset in other assets, was estimated as the present value of contractual customer fees. The estimated liability for losses related to SBLCs and foreign and other guarantees, if any, is included in the allowance for lending-related commitments. The allowance for lending-related commitments was $104 million at Sept. 30, 2017 and $112 million at Dec. 31, 2016.
Payment/performance risk of SBLCs is monitored using both historical performance and internal ratings criteria. BNY Mellon’s historical experience is that SBLCs typically expire without being funded. SBLCs below investment grade are monitored closely for payment/performance risk. The table below shows SBLCs by investment grade:
|
| | | | |
| Standby letters of credit | June 30, 2020 |
| Dec. 31, 2019 |
|
| |
| Investment grade | 89 | % | 90 | % |
| Non-investment grade | 11 | % | 10 | % |
|
| | | | |
| Standby letters of credit | Sept. 30, 2017 |
| Dec. 31, 2016 |
|
| |
| Investment grade | 86 | % | 89 | % |
| Non-investment grade | 14 | % | 11 | % |
A commercial letter of credit is normally a short-term instrument used to finance a commercial contract for the shipment of goods from a seller to a buyer. Although the commercial letter of credit is contingent upon the satisfaction of specified conditions, it represents a credit exposure if the buyer defaults on
the underlying transaction. As a result, the total contractual amounts do not necessarily represent future cash requirements. Commercial letters of credit totaled $265$59 million at Sept.June 30, 20172020 and $339$74 million at Dec. 31, 2016.2019.
We expect many of the lending commitments and letters of credit to expire without the need to advance any cash. The revenue associated with guarantees frequently depends on the credit rating of the obligor and the structure of the transaction, including collateral, if any.
|
|
Notes to Consolidated Financial Statements(continued)
|
|
A securities lending transaction is a fully collateralized transaction in which the owner of a security agrees to lend the security (typically through an agent, in our case, The Bank of New York Mellon), to a borrower, usually a broker-dealer or bank, on an open, overnight or term basis, under the terms of a prearranged contract, which normally matures in less than 90 days.contract.
We typically lend securities with indemnification against borrower default. We generally require the borrower to provide collateral with a minimum value of102%of the fair value of the securities borrowed, which is monitored on a daily basis, thus reducing credit risk. Market risk can also arise in securities lending transactions. These risks are controlled through policies limiting the level of risk that can be undertaken. Securities lending transactions are generally entered into only with highly rated counterparties.Securities lending indemnifications were secured by collateral of$424438 billionatJune 30, 2020 and $428 billion at Sept. 30, 2017 and $331 billion at Dec. 31, 2016.2019.
CIBC Mellon, a joint venture between BNY Mellon and the Canadian Imperial Bank of Commerce (“CIBC”), engages in securities lending activities. CIBC Mellon, BNY Mellon and CIBC jointly and severally indemnify securities lenders against specific types of borrower default. At Sept. June 30, 20172020 and Dec. 31, 2016, $652019, $58 billion and $61$57 billion, respectively, of borrowings at CIBC Mellon, for which BNY Mellon acts as agent on behalf of CIBC Mellon clients, were secured by collateral of $69 $62 billion and $64$61 billion, respectively. If, upon a default, a borrower’s collateral was not sufficient to cover its related obligations, certain losses related to the indemnification could be covered by the indemnitors.
|
|
Notes to Consolidated Financial Statements(continued) |
|
Unsettled repurchase and reverse repurchase agreements
In the normal course of business, we enter into repurchase agreements and reverse repurchase agreements that settle at a future date. In repurchase agreements, BNY Mellon receives cash from and provides securities as collateral to a counterparty at settlement. In reverse repurchase agreements, BNY Mellon advances cash to and receives securities as collateral from the counterparty at settlement. These transactions are recorded on the consolidated balance sheet on the settlement date. At June 30, 2020, we had 0 unsettled repurchase agreements and 0 unsettled reverse repurchase agreements.
Industry concentrations
We have significant industry concentrations related to credit exposure at Sept.June 30, 2017.2020. The tables below present our credit exposure in the financial institutions and commercial portfolios.
| | Financial institutions portfolio exposure (in billions) | Sept. 30, 2017 | June 30, 2020 |
| Loans |
| Unfunded commitments |
| Total exposure |
| Loans |
| Unfunded commitments |
| Total exposure |
|
| Securities industry | $ | 2.9 |
| $ | 19.0 |
| $ | 21.9 |
| $ | 1.6 |
| $ | 24.5 |
| $ | 26.1 |
|
| Banks | | 7.0 |
| 1.1 |
| 8.1 |
|
| Asset managers | 1.6 |
| 6.5 |
| 8.1 |
| 1.3 |
| 6.3 |
| 7.6 |
|
| Banks | 6.3 |
| 1.4 |
| 7.7 |
| |
| Insurance | 0.1 |
| 3.4 |
| 3.5 |
| 0.1 |
| 2.7 |
| 2.8 |
|
| Government | — |
| 1.0 |
| 1.0 |
| 0.1 |
| 0.2 |
| 0.3 |
|
| Other | 1.0 |
| 1.4 |
| 2.4 |
| 0.7 |
| 0.7 |
| 1.4 |
|
| Total | $ | 11.9 |
| $ | 32.7 |
| $ | 44.6 |
| $ | 10.8 |
| $ | 35.5 |
| $ | 46.3 |
|
|
| | | | | | | | | |
Commercial portfolio exposure (in billions) | June 30, 2020 |
| Loans |
| Unfunded commitments |
| Total exposure |
|
| Manufacturing | $ | 1.1 |
| $ | 3.5 |
| $ | 4.6 |
|
| Services and other | 1.1 |
| 3.3 |
| 4.4 |
|
| Energy and utilities | 0.1 |
| 4.1 |
| 4.2 |
|
| Media and telecom | 0.1 |
| 0.9 |
| 1.0 |
|
| Total | $ | 2.4 |
| $ | 11.8 |
| $ | 14.2 |
|
|
| | | | | | | | | |
Commercial portfolio exposure (in billions) | Sept. 30, 2017 |
| Loans |
| Unfunded commitments |
| Total exposure |
|
| Manufacturing | $ | 1.4 |
| $ | 6.3 |
| $ | 7.7 |
|
| Services and other | 0.9 |
| 4.4 |
| 5.3 |
|
| Energy and utilities | 0.6 |
| 4.5 |
| 5.1 |
|
| Media and telecom | 0.1 |
| 1.4 |
| 1.5 |
|
| Total | $ | 3.0 |
| $ | 16.6 |
| $ | 19.6 |
|
Major concentrations in securities lending are primarily to broker-dealers and are generally collateralized with cash and/or securities.
ExposureSponsored Member Repo Program
BNY Mellon is a sponsoring member in the FICC sponsored member program, where we submit eligible overnight repurchase and reverse repurchase transactions in U.S. Treasury securities (“Sponsored
Member Transactions”) between BNY Mellon and our sponsored member clients for certain administrative errors
Innovation and clearing through FICC pursuant to the FICC Government Securities Division rulebook (the “FICC Rules”). We also guarantee to FICC the prompt and full payment and performance of our sponsored member clients’ respective obligations under the FICC Rules in connection with certain offshore tax-exempt funds that we manage, we may be liable to the fundssuch clients’ Sponsored Member Transactions. We minimize our credit exposure under this guaranty by obtaining a security interest in our sponsored member clients’ collateral and rights under Sponsored Member Transactions. See “Offsetting assets and liabilities” in Note 17 for certain administrative errors. The errors relate to the resident status of such funds, potentially exposing the Company to a tax liability related to the funds’ earnings. The Company is in discussions with tax authorities regarding the funds. We believe we are appropriately accruedadditional information on our repurchase and the additional reasonably possible exposure is not significant.reverse repurchase agreements.
Indemnification arrangements
We have provided standard representations for underwriting agreements, acquisition and divestiture agreements, sales of loans and commitments, and other similar types of arrangements and customary indemnification for claims and legal proceedingsrelated to providing financial services that are not otherwise included above. Insurance has been purchased to mitigate certain of these risks. Generally, there are no stated or notional amounts included in these indemnifications and the contingencies triggering the obligation for indemnification are not expected to occur. Furthermore, often counterparties to these transactions provide us with comparable indemnifications. We are unable to develop an estimate of the maximum payout under these
|
|
Notes to Consolidated Financial Statements(continued)
|
|
indemnifications for several reasons. In addition to the lack of a stated or notional amount in a majority of such indemnifications, we are unable to predict the nature of events that would trigger indemnification or the level of indemnification for a certain event. We believe, however, that the possibility that we will have to make any material payments for these indemnifications is remote. At Sept.June 30, 20172020 and Dec. 31, 2016,2019, we have not recorded any material liabilities under these arrangements.
Clearing and settlement exchanges
We are a noncontrolling equity investor in, and/or member of, several industry clearing or settlement exchanges through which foreign exchange, securities, derivatives or other transactions settle. Certain of these industry clearing and settlement exchanges require their members to guarantee their
|
|
Notes to Consolidated Financial Statements(continued) |
|
obligations and liabilities and/or to provide liquidity support in the event other members do not honor their obligations. We believe the likelihood that a clearing or settlement exchange (of which we are a member) would become insolvent is remote. Additionally, certain settlement exchanges have implemented loss allocation policies that enable the exchange to allocate settlement losses to the members of the exchange. It is not possible to quantify such mark-to-market loss until the loss occurs. Any ancillary costs that occur as a result of any mark-to-market loss cannot be quantified. In addition, we also sponsor clients as members on clearing and settlement exchanges and guarantee their obligations. At Sept.June 30, 20172020 and Dec. 31, 2016,2019, we havedid not recordedrecord any material liabilities under these arrangements.
Legal proceedings
In the ordinary course of business, BNYThe Bank of New York Mellon Corporation and its subsidiaries are routinely named as defendants in or made parties to pending and potential legal actions. We also are subject to governmental and regulatory examinations, information-gathering requests, investigations and proceedings (both formal and informal). Claims for significant monetary damages are often asserted in many of these legal actions, while claims for disgorgement, restitution, penalties and/or other remedial actions or sanctions may be sought in governmental and regulatory matters. It is inherently difficult to predict the eventual outcomes of such matters given their complexity and the particular facts and circumstances at issue in each of these matters. However, on the basis of our current
knowledge and understanding, we do not believe that judgments, settlements or orders, if any, arising from these matters (either individually or in the aggregate, after giving effect to applicable reserves and insurance coverage) will have a material adverse effect on the consolidated financial position or liquidity of BNY Mellon, although they could have a material effect on net incomeour results of operations in a given period.
In view of the inherent unpredictability of outcomes in litigation and governmental and regulatory matters, particularly where (i) the damages sought are substantial or indeterminate, (ii) the proceedings are in the early stages, or (iii) the matters involve novel legal theories or a large number of parties, as a matter of course there is considerable uncertainty surrounding the timing or ultimate resolution of litigation and governmental and regulatory matters, including a possible eventual loss,
fine, penalty or business impact, if any, associated with each such matter. In accordance with applicable accounting guidance, BNY Mellon establisheswe establish accruals for litigation and governmental and regulatory matters when those matters proceed to a stage where they present loss contingencies that are both probable and reasonably estimable. In such cases, there may be a possible exposure to loss in excess of any amounts accrued. BNY Mellon will continue toWe regularly monitor such matters for developments that could affect the amount of the accrual, and will adjust the accrual amount as appropriate. If the loss contingency in question is not both probable and reasonably estimable, BNY Mellon doeswe do not establish an accrual and the matter will continuecontinues to be monitored for any developments that would make the loss contingency both probable and reasonably estimable. BNY Mellon believesWe believe that itsour accruals for legal proceedings are appropriate and, in the aggregate, are not material to the consolidated financial position of BNY Mellon, although future accruals could have a material effect on net incomethe results of operations in a given period. In addition, if we have the potential to recover a portion of an estimated loss from a third party, we record a receivable up to the amount of the accrual that is probable of recovery.
For certain of those matters described here for which a loss contingency may, in the future, be reasonably possible (whether in excess of a related accrued liability or where there is no accrued liability), BNY Mellon is currently unable to estimate a range of reasonably possible loss. For those matters described here where BNY Mellon is able to estimate a reasonably possible loss, the aggregate range of such reasonably possible loss is up to $940$730 million in excess of the accrued liability (if any) related to those matters.
|
|
Notes to Consolidated Financial Statements(continued)
|
|
The following describes certain judicial, regulatory and arbitration proceedings involving BNY Mellon:
Mortgage-Securitization Trusts Proceedings
The Bank of New York Mellon has been named as a defendant in a number of legal actions brought by MBS investors alleging that the trustee has expansive duties under the governing agreements, including the duty to investigate and pursue breach of representation and warranty claims against other parties to the MBS transactions. TheseNaN actions include a lawsuit brought
|
|
Notes to Consolidated Financial Statements(continued) |
|
commenced in August 2014, December 2014, December 2015 and February 2017 are pending in New York State court on June 18, 2014,federal court; and later re-filed1 action commenced in federal court, by a group of institutional investors who purport to sue on behalf of 253 MBS trusts.May 2016 is pending in New York state court.
Matters Related to R. Allen Stanford
In late December 2005, Pershing LLC (“Pershing”) became a clearing firm for Stanford Group Co. (“SGC”), a registered broker-dealer that was part of a group of entities ultimately controlled by R. Allen Stanford (“Stanford”). Stanford International Bank (“SIB”), also controlled by Stanford, issued certificates of deposit (“CDs”). Some investors allegedly wired funds from their SGC accounts to purchase CDs. In 2009, the SECSecurities and Exchange Commission (“SEC”) charged Stanford with operating a Ponzi scheme in connection with the sale of CDs, and SGC was placed into receivership. Alleged purchasers of CDs have filed 152 putative class action proceedings against Pershing: one in November 2009 in Texas federal court, and one in May 2016 in New Jersey federal court. NaN lawsuits have been filed against Pershing that are pending in Texas, including two putative class actions.Louisiana, Florida and New Jersey federal courts in January 2010, January and February 2015, October 2015 and May 2016. The purchasers allege that Pershing, as SGC’s clearing firm, assisted Stanford in a fraudulent scheme and assert contractual, statutory and common law claims. In March 2019, a group of investors filed a putative class action against The remaining FINRA action hasBank of New York Mellon in New Jersey federal court, making the same allegations as in the prior actions brought against Pershing. All of the cases that have been resolvedbrought in federal court against Pershing and dismissed.the case brought against The Bank of New York Mellon have been consolidated in Texas federal court for discovery purposes. On Dec. 19, 2019, the Court of Appeals for the Fifth Circuit affirmed the dismissal of 6 individual federal lawsuits brought under Florida law, which will also apply to four other similarly situated cases. On March 18, 2020, the plaintiffs in those lawsuits filed a Petition for Writ of Certiorari seeking permission to appeal to the United States Supreme Court. Financial Industry Regulatory Authority, Inc. (“FINRA”) arbitration proceedings also have been initiated by alleged purchasers asserting similar claims.
Brazilian Postalis Litigation
BNY Mellon Servicos Financeiros DTVM S.A. (“DTVM”), a subsidiary that provides a number of asset services in Brazil, acts as administrator for certain investment funds in which the exclusive investor is a public pension fund for postal
workers called Postalis-Instituto de Seguridade Social dos Correios e Telégrafos (“Postalis”). invested. On Aug. 22, 2014, Postalis sued DTVM in Rio de Janeiro, Brazil for losses related to a Postalis investment fund for which DTVM serves as fundis administrator. Postalis alleges that DTVM failed to properly perform alleged duties, including duties to conduct due diligence of and exert control over the fund manager, Atlântica Administração de Recursos (“Atlântica”), and Atlântica’s investments.manager. On March 12, 2015, Postalis filed a lawsuit in Rio de Janeiro against DTVM and
BNY Mellon Administração de Ativos Ltda. (“Ativos”) alleging failure to properly perform alleged duties relating to another fund of which DTVM is administrator and Ativos is investment manager. On Dec. 14, 2015, AssociaceãAssociacão Dosdos Profissionais Dos Correirosdos Correios (“ADCAP”), a Brazilian postal workers association, filed a lawsuit in São Paulo against DTVM and other defendants alleging that DTVM improperly contributed to Postalis investment losses in the Postalis portfolio.losses. On March 20, 2017, the lawsuit was dismissed without prejudice, and ADCAP has appealed that decision. On Dec. 17, 2015, Postalis filed three additional3 lawsuits in Rio de Janeiro against DTVM and Ativos alleging failure to properly perform alleged duties and liabilities for losses with respect to investments in several other funds. On Feb. 4, 2016, Postalis filed anothera lawsuit in Brasilia against DTVM, Ativos and BNY Mellon Alocação de Patrimônio Ltda. (“Alocação de Patrimônio”), an investment management subsidiary, alleging failure to properly perform duties and liability for losses with respect to investments in various other funds of which the defendants were administrator and/or manager. TheOn Jan. 16, 2018, the Brazilian Federal Prosecution Service (“MPF”) filed a civil lawsuit has been transferred toin São Paulo.Paulo against DTVM alleging liability for Postalis losses based on alleged failures to properly perform certain duties as administrator to certain funds in which Postalis invested or as controller of Postalis’s own investment portfolio. On April 18, 2018, the court dismissed the lawsuit without prejudice, and the MPF has appealed that decision. In addition, the Tribunal de Contas da Uniao, an administrative tribunal, has initiated two proceedings with the purpose of determining liability for losses to two investment funds administered by DTVM in which Postalis was the exclusive investor. On Oct. 4, 2019, Postalis and another pension fund filed a request for arbitration in São Paulo against DTVM and Ativos alleging liability for losses to an investment fund for which DTVM was administrator and Ativos was manager. On Oct. 25, 2019, Postalis filed a lawsuit in Rio de Janeiro against DTVM and Alocação de Patrimônio, alleging liability for losses in another fund for which DTVM was administrator and Alocação de Patrimônio and Ativos were managers.
Depositary Receipt Litigation
Between late December 2015 and February 2016, four putative class action lawsuits were filed against100 BNY Mellon asserting claims relating to BNY Mellon’s foreign exchange pricing when converting dividends and other distributions from non-U.S. companies in its role as depositary bank to Depositary Receipt issuers. The claims are for breach of contract and violations of ERISA. The lawsuits have been consolidated into two suits that are pending in federal court in the Southern District of New York.
|
|
Notes to Consolidated Financial Statements(continued) |
|
Brazilian Silverado Litigation
DTVM acts as administrator for the Fundo de Investimento em Direitos Creditórios Multisetorial Silverado Maximum (“Silverado Maximum Fund”), which invests in commercial credit receivables. On June 2, 2016, the Silverado Maximum Fund sued DTVM in its capacity as administrator, along with Deutsche Bank S.A. - Banco Alemão in its capacity as custodian and Silverado Gestão e Investimentos Ltda. in its capacity as investment manager. The Fund alleges that each of the defendants failed to fulfill its respective duty, and caused losses to the Fund for which the defendants are jointly and severally liable.
German Tax Matters
German authorities are investigating past “cum/ex” trading, which involved the purchase of equity securities on or shortly before the dividend date, but settled after that date, potentially resulting in an unwarranted refund of withholding tax. German authorities have taken the view that past cum/ex trading may have resulted in tax avoidance or evasion. European subsidiaries of BNY Mellon 101
|
|
Notes to Consolidated Financial Statements(continued)
|
|
Depositary Receipt Pre-Release Inquiry
have been informed by German authorities about investigations into potential cum/ex trading by certain third-party investment funds, where one of the subsidiaries had acquired entities that served as depositary and/or fund manager for those third-party investment funds. We have received information requests from the authorities relating to pre-acquisition activity and are cooperating fully with those requests. We have not received any tax demand concerning cum/ex trading. In August 2019, the District Court of Bonn ordered that one of these subsidiaries be joined as a secondary party in connection with the prosecution of unrelated individual defendants. Trial commenced in September 2019. In March 2014,2020, the Staffcourt stated that it would refrain from taking action against the subsidiary in order to expedite the conclusion of the U.S. Securitiestrial. The court convicted the unrelated individual defendants, and Exchange Commission’s Enforcement Division (the “Staff”) commenced an investigation into certain issuersdetermined that the cum/ex trading activities of American Depositary Receipts (“ADRs”), including BNY Mellon, for the period of 2011 to 2015. The Staff has issued several requests to BNY Mellon for information relating to the pre-release of ADRs.relevant third-party investment funds were unlawful. In May 2017, BNY Mellon began discussionsconnection with the Staff about a possible resolutionacquisition of the investigation. BNY Mellon has fully cooperated with this matter.subject entities, we obtained an indemnity for liabilities from the sellers that we intend to pursue as necessary.
Note 18 - 19–Lines of business
We have an internal information system that produces performance data along product and service lines for our two2 principal businesses and the Other segment. The primary products and services and types of revenue for our principal businesses and a description of the Other segment are presented in Note 24 of the Notes to Consolidated Financial Statements in our 2019 Annual Report.
Business accounting principles
Our business data has been determined on an internal management basis of accounting, rather than the generally accepted accounting principles used for consolidated financial reporting. These measurement principles are designed so that reported results of the businesses will track their economic performance.
Business results are subject to reclassification when organizational changes are made or when improvements are mademade. There were no significant organizational changes in the measurement principles.second quarter of 2020. The results are also subject to refinements in revenue and expense allocation methodologies, which are typically reflected on a prospective basis.
In the first quarter of 2020, we reclassified the results of certain services provided between the segments from noninterest expense to fee and other revenue. This activity is offset in the Other segment and relates to services that are also provided to third parties and provides consistency with the reporting of the revenues. This adjustment had no impact on income before taxes of the businesses. Also in the first quarter of 2020, we reclassified the results related to certain lending activities from the Wealth Management business to the Pershing business. These loans were originated by the Wealth Management business as a service to Pershing clients. This resulted in an increase in total revenue, noninterest expense and income before taxes in the Pershing business and corresponding decrease in the Wealth Management business. Prior periods were restated in the first quarter of 2020 for both reclassifications.
|
|
Notes to Consolidated Financial Statements(continued) |
|
The accounting policies of the businesses are the same as those described in Note 1 of the Notes to Consolidated Financial Statements in our 20162019 Annual Report.
The primary types of revenue for our two principal businesses and the Other segment are presented below.
|
| |
Business | Primary types of revenue |
Investment Management | • Investment management and performance fees from:
Mutual funds
Institutional clients
Private clients
High-net-worth individuals and families, endowments and foundations and related entities
• Distribution and servicing fees
• Other revenue from seed capital investments
|
Investment Services | • Asset servicing fees, including custody fees, fund services, broker-dealer services, securities finance and collateral and liquidity services
• Issuer services fees, including Depositary Receipts and Corporate Trust
• Clearing services fees
• Treasury services fees, including global payments, trade finance and cash management
• Foreign exchange revenue
• Financing-related fees and net interest revenue from credit-related activities
|
Other segment | • Net interest revenue and lease-related gains (losses) from leasing operations
• Gain (loss) on securities and net interest revenue from corporate treasury activity
• Other trading revenue from derivatives and other trading activity
• Results of business exits
|
The results of our businesses are presented and analyzed on an internal management reporting basis.
Revenue amounts reflect fee and other revenue generated by each business.business and include revenue for services provided between the segments that are also provided to third parties. Fee and other revenue transferred between businesses under revenue transfer agreements is included within other revenue in each business.
Revenues and expenses associated with specific client bases are included in those businesses. For example, foreign exchange activity associated
with clients using custody products is included in Investment Services.
Net interest revenue is allocated to businesses based on the yields on the assets and liabilities generated by each business. We employ a funds transfer pricing system that matches funds with the specific assets and liabilities of each business based on their interest sensitivity and maturity characteristics.
The provision for credit losses associated with the respective credit portfolios is reflected in each business segment.
|
|
Notes to Consolidated Financial Statements(continued)
|
|
Incentives expense related to restricted stock is allocated to the businesses.
Support and other indirect expenses, including services provided between segments that are not provided to third parties or not subject to a revenue transfer agreement, are allocated to businesses based on internally developed methodologies.methodologies and reflected in noninterest expense.
Recurring FDIC expense is allocated to the businesses based on average deposits generated within each business.
Litigation expense is generally recorded in the business in which the charge occurs.
Management of the investment securities portfolio is a shared service contained in the Other segment. As a result, gains and losses associated with the valuation of the securities portfolio are generally included in the Other segment.
Client deposits serve as the primary funding source for our investment securities portfolio.
We typically allocate all interest revenue to the businesses generating the deposits. Accordingly, accretion related to the portion of the investment securities portfolio restructured in 2009 has been included in the results of the businesses.
M&I expense is a corporate level item and is recorded in the Other segment.
Restructuring charges relate to corporate-level initiatives and were therefore recorded in the Other segment.
Balance sheet assets and liabilities and their related income or expense are specifically assigned to each business. Businesses with a net liability position have been allocated assets.
Goodwill and intangible assets are reflected within individual businesses.
The following consolidating schedules presentspresent the contribution of our businesses to our overall profitability.
| | | For the quarter ended Sept. 30, 2017 | Investment
Management |
| | Investment
Services |
| | Other |
| | Consolidated |
| | |
| (dollar amounts in millions) | |
| Fee and other revenue | $ | 918 |
| (a) | $ | 2,187 |
| | $ | 69 |
| | $ | 3,174 |
| (a) | |
| For the quarter ended June 30, 2020 | | Investment
Services |
| | Investment and Wealth
Management |
| | Other |
| | Consolidated |
| |
| (dollars in millions) | |
| Total fee and other revenue | | $ | 2,339 |
| | $ | 838 |
| (a) | $ | 38 |
| | $ | 3,215 |
| (a) |
| Net interest revenue (expense) | 82 |
| | 777 |
| | (20 | ) | | 839 |
| | 768 |
| | 48 |
| | (36 | ) | | 780 |
| |
| Total revenue | 1,000 |
| (a) | 2,964 |
| | 49 |
| | 4,013 |
| (a) | 3,107 |
| | 886 |
| (a) | 2 |
| | 3,995 |
| (a) |
| Provision for credit losses | (2 | ) | | (2 | ) | | (2 | ) | | (6 | ) | | 145 |
| | 7 |
| | (9 | ) | | 143 |
| |
| Noninterest expense | 702 |
| | 1,874 |
| | 77 |
| | 2,653 |
| (b) | 1,989 |
| | 658 |
| | 39 |
| | 2,686 |
| |
| Income (loss) before taxes | $ | 300 |
| (a) | $ | 1,092 |
| | $ | (26 | ) | | $ | 1,366 |
| (a)(b) | |
| Income (loss) before income taxes | | $ | 973 |
| | $ | 221 |
| (a) | $ | (28 | ) | | $ | 1,166 |
| (a) |
Pre-tax operating margin (c)(b) | 30 | % | | 37 | % | | N/M |
| | 34 | % | | 31 | % | | 25 | % | | N/M |
| | 29 | % | |
| Average assets | $ | 31,689 |
| | $ | 252,461 |
| | $ | 61,559 |
| | $ | 345,709 |
| | $ | 335,288 |
| | $ | 30,327 |
| | $ | 49,744 |
| | $ | 415,359 |
| |
| |
| (a) | BothTotal fee and other revenue and total revenue include theincludes net income from consolidated investment management funds of $7$39 million, representing $10$54 million of income and noncontrolling interests of $3 million. Income$15 million. Total revenue and income before income taxes isare net of noncontrolling interests of $3 million.
$15 million. |
| |
| (b) | Noninterest expense includes a loss attributable to noncontrolling interest of $1 million related to other consolidated subsidiaries. |
| |
(c) | Income before income taxes divided by total revenue. |
N/M - Not meaningful.
|
|
Notes to Consolidated Financial Statements(continued) |
|
| | | For the quarter ended June 30, 2017 | Investment Management |
| | Investment Services |
| | Other |
| | Consolidated |
| | |
| (dollar amounts in millions) | |
| Fee and other revenue | $ | 899 |
| (a) | $ | 2,115 |
| | $ | 113 |
| | $ | 3,127 |
| (a) | |
| For the quarter ended March 31, 2020 | | Investment
Services |
| | Investment and Wealth
Management |
| | Other |
| | Consolidated |
| |
| (dollars in millions) | |
| Total fee and other revenue | | $ | 2,436 |
| | $ | 846 |
| (a) | $ | 30 |
| | $ | 3,312 |
| (a) |
| Net interest revenue (expense) | 87 |
| | 761 |
| | (22 | ) | | 826 |
| | 806 |
| | 52 |
| | (44 | ) | | 814 |
| |
| Total revenue | 986 |
| (a) | 2,876 |
| | 91 |
| | 3,953 |
| (a) | |
| Total revenue (loss) | | 3,242 |
| | 898 |
| (a) | (14 | ) | | 4,126 |
| (a) |
| Provision for credit losses | — |
| | (3 | ) | | (4 | ) | | (7 | ) | | 149 |
| | 9 |
| | 11 |
| | 169 |
| |
| Noninterest expense | 698 |
| | 1,927 |
| | 28 |
| | 2,653 |
| (b) | 1,987 |
| | 695 |
| | 30 |
| | 2,712 |
| |
| Income before taxes | $ | 288 |
| (a) | $ | 952 |
| | $ | 67 |
| | $ | 1,307 |
| (a)(b) | |
| Income (loss) before income taxes | | $ | 1,106 |
| | $ | 194 |
| (a) | $ | (55 | ) | | $ | 1,245 |
| (a) |
Pre-tax operating margin (c)(b) | 29 | % | | 33 | % | | N/M |
| | 33 | % | | 34 | % | | 22 | % | | N/M |
| | 30 | % | |
| Average assets | $ | 31,355 |
| | $ | 254,724 |
| | $ | 56,436 |
| | $ | 342,515 |
| | $ | 304,089 |
| | $ | 30,543 |
| | $ | 50,646 |
| | $ | 385,278 |
| |
| |
| (a) | BothTotal fee and other revenue includes net loss from consolidated investment management funds of $20 million, representing $38 million of losses and a loss attributable to noncontrolling interests of $18 million. Total revenue and income before income taxes are net of a loss attributable to noncontrolling interests of $18 million. |
| |
| (b) | Income before income taxes divided by total revenue. |
N/M - Not meaningful.
|
| | | | | | | | | | | | | | | | |
| For the quarter ended June 30, 2019 | Investment
Services |
| | Investment and Wealth
Management |
| | Other |
| | Consolidated |
| |
| (dollars in millions) |
| Total fee and other revenue | $ | 2,233 |
| | $ | 854 |
| (a) | $ | 31 |
| | $ | 3,118 |
| (a) |
| Net interest revenue (expense) | 783 |
| | 59 |
| | (40 | ) | | 802 |
| |
| Total revenue (loss) | 3,016 |
| | 913 |
| (a) | (9 | ) | | 3,920 |
| (a) |
| Provision for credit losses | (4 | ) | | (2 | ) | | (2 | ) | | (8 | ) | |
| Noninterest expense | 1,963 |
| | 655 |
| | 29 |
| | 2,647 |
| |
| Income (loss) before income taxes | $ | 1,057 |
| | $ | 260 |
| (a) | $ | (36 | ) | | $ | 1,281 |
| (a) |
Pre-tax operating margin (b) | 35 | % | | 29 | % | | N/M |
| | 33 | % | |
| Average assets | $ | 264,781 |
| | $ | 29,793 |
| | $ | 47,810 |
| | $ | 342,384 |
| |
| |
| (a) | Total fee and other revenue include theincludes net income from consolidated investment management funds of $7$6 million, representing $10 million of income and noncontrolling interests of $4 million. Total revenue and income before income taxes are net of noncontrolling interests of $4 million. |
| |
| (b) | Income before income taxes divided by total revenue. |
N/M - Not meaningful.
|
| | | | | | | | | | | | | | | | |
| For the six months ended June 30, 2020 | Investment
Services |
| | Investment and Wealth
Management |
| | Other |
| | Consolidated |
| |
| (dollars in millions) |
| Total fee and other revenue | $ | 4,775 |
| | $ | 1,684 |
| (a) | $ | 68 |
| | $ | 6,527 |
| (a) |
| Net interest revenue (expense) | 1,574 |
| | 100 |
| | (80 | ) | | 1,594 |
| |
| Total revenue (loss) | 6,349 |
| | 1,784 |
| (a) | (12 | ) | | 8,121 |
| (a) |
| Provision for credit losses | 294 |
| | 16 |
| | 2 |
| | 312 |
| |
| Noninterest expense | 3,976 |
| | 1,353 |
| | 69 |
| | 5,398 |
| |
| Income (loss) before income taxes | $ | 2,079 |
| | $ | 415 |
| (a) | $ | (83 | ) | | $ | 2,411 |
| (a) |
Pre-tax operating margin (b) | 33 | % | | 23 | % | | N/M |
| | 30 | % | |
| Average assets | $ | 319,689 |
| | $ | 30,435 |
| | $ | 50,194 |
| | $ | 400,318 |
| |
| |
| (a) | Total fee and other revenue includes net income from consolidated investment management funds of $19 million, representing $16 million of income and a loss attributable to noncontrolling interests of $3 million. IncomeTotal revenue and income before income taxes isare net of a loss attributable to noncontrolling interests of $3 million. |
| |
| (b) | Noninterest expense includes a loss attributable to noncontrolling interest of $2 millionrelated to other consolidated subsidiaries.
|
| |
(c) | Income before income taxes divided by total revenue. |
N/M - Not meaningful.
|
|
Notes to Consolidated Financial Statements(continued) |
| |
| | | For the quarter ended Sept. 30, 2016 | Investment
Management |
| | Investment
Services |
| | Other |
| | Consolidated |
| | |
| (dollar amounts in millions) | |
| Fee and other revenue | $ | 876 |
| (a) | $ | 2,183 |
| | $ | 100 |
| | $ | 3,159 |
| (a) | |
| For the six months ended June 30, 2019 | | Investment
Services |
| | Investment and Wealth
Management |
| | Other |
| | Consolidated |
| |
| (dollars in millions) | |
| Total fee and other revenue | | $ | 4,394 |
| | $ | 1,723 |
| (a) | $ | 49 |
| | $ | 6,166 |
| (a) |
| Net interest revenue (expense) | 82 |
| | 715 |
| | (23 | ) | | 774 |
| | 1,587 |
| | 126 |
| | (70 | ) | | 1,643 |
| |
| Total revenue | 958 |
| (a) | 2,898 |
| | 77 |
| | 3,933 |
| (a) | |
| Total revenue (loss) | | 5,981 |
| | 1,849 |
| (a) | (21 | ) | | 7,809 |
| (a) |
| Provision for credit losses | — |
| | 1 |
| | (20 | ) | | (19 | ) | | 4 |
| | (1 | ) | | (4 | ) | | (1 | ) | |
| Noninterest expense | 702 |
| | 1,851 |
| | 88 |
| | 2,641 |
| (b) | 3,944 |
| | 1,324 |
| | 78 |
| | 5,346 |
| |
| Income before taxes | $ | 256 |
| (a) | $ | 1,046 |
| | $ | 9 |
| | $ | 1,311 |
| (a)(b) | |
| Income (loss) before income taxes | | $ | 2,033 |
| | $ | 526 |
| (a) | $ | (95 | ) | | $ | 2,464 |
| (a) |
Pre-tax operating margin (c)(b) | 27 | % | | 36 | % | | N/M |
| | 33 | % | | 34 | % | | 28 | % | | N/M |
| | 32 | % | |
| Average assets | $ | 30,392 |
| | $ | 275,714 |
| | $ | 45,124 |
| | $ | 351,230 |
| | $ | 260,432 |
| | $ | 30,819 |
| | $ | 48,041 |
| | $ | 339,292 |
| |
| |
| (a) | BothTotal fee and other revenue and total revenue includeincludes net income from consolidated investment management funds of $8$22 million, representing $17$36 million of income and noncontrolling interests of $9$14 million. IncomeTotal revenue and income before income taxes isare net of noncontrolling interests of $9$14 million. |
| |
| (b) | Noninterest expense includes a loss attributable to noncontrolling interest of $2 millionrelated to other consolidated subsidiaries.
|
| |
(c) | Income before income taxes divided by total revenue. |
N/M - Not meaningful.
|
| | | | | | | | | | | | | | | | |
| For the nine months ended Sept. 30, 2017 | Investment
Management |
| | Investment
Services |
| | Other |
| | Consolidated |
| |
| (dollar amounts in millions) |
| Fee and other revenue | $ | 2,694 |
| (a) | $ | 6,386 |
| | $ | 254 |
| | $ | 9,334 |
| (a) |
| Net interest revenue (expense) | 255 |
| | 2,245 |
| | (43 | ) | | 2,457 |
| |
| Total revenue | 2,949 |
| (a) | 8,631 |
| | 211 |
| | 11,791 |
| (a) |
| Provision for credit losses | 1 |
| | (5 | ) | | (14 | ) | | (18 | ) | |
| Noninterest expense | 2,083 |
| | 5,650 |
| | 212 |
| | 7,945 |
| (b) |
| Income before taxes | $ | 865 |
| (a) | $ | 2,986 |
| | $ | 13 |
| | $ | 3,864 |
| (a)(b) |
Pre-tax operating margin (c) | 29 | % | | 35 | % | | N/M |
| | 33 | % | |
| Average assets | $ | 31,372 |
| | $ | 252,675 |
| | $ | 57,463 |
| | $ | 341,510 |
| |
| |
(a) | Both total fee and other revenue and total revenue include net income from consolidated investment management funds of $29 million, representing $53 million of income and noncontrolling interests of $24 million. Income before taxes is net of noncontrolling interests of $24 million. |
| |
(b) | Noninterest expense includes a loss attributable to noncontrolling interest of $6 million related to other consolidated subsidiaries. |
| |
(c) | Income before taxes divided by total revenue. |
N/M - Not meaningful.
|
| | | | | | | | | | | | | | | | |
| For the nine months ended Sept. 30, 2016 | Investment
Management |
| | Investment
Services |
| | Other |
| | Consolidated |
| |
| (dollar amounts in millions) |
| Fee and other revenue | $ | 2,544 |
| (a) | $ | 6,267 |
| | $ | 324 |
| | $ | 9,135 |
| (a) |
| Net interest revenue (expense) | 247 |
| | 2,084 |
| | (24 | ) | | 2,307 |
| |
| Total revenue | 2,791 |
| (a) | 8,351 |
| | 300 |
| | 11,442 |
| (a) |
| Provision for credit losses | — |
| | 8 |
| | (26 | ) | | (18 | ) | |
| Noninterest expense | 2,084 |
| | 5,518 |
| | 284 |
| | 7,886 |
| (b) |
| Income before taxes | $ | 707 |
| (a) | $ | 2,825 |
| | $ | 42 |
| | $ | 3,574 |
| (a)(b) |
Pre-tax operating margin (c) | 25 | % | | 34 | % | | N/M |
| | 31 | % | |
| Average assets | $ | 30,048 |
| | $ | 275,410 |
| | $ | 57,832 |
| | $ | 363,290 |
| |
| |
(a) | Both total fee and other revenue and total revenue include net income from consolidated investment management funds of $15 million, representing $21 million of income and noncontrolling interests of $6 million. Income before taxes is net of a loss attributable to noncontrolling interests of $6 million. |
| |
(b) | Noninterest expense includes a loss attributable to noncontrolling interest of $6 million related to other consolidated subsidiaries. |
| |
(c) | Income before taxes divided by total revenue. |
N/M - Not meaningful.
|
|
Notes to Consolidated Financial Statements(continued)
|
|
Note 19 - 20–Supplemental information to the Consolidated Statement of Cash Flows
NoncashNon-cash investing and financing transactions that, appropriately, are not reflected in the Consolidated Statementconsolidated statement of Cash Flowscash flows are listed below.
|
| | | | | | | |
| Noncash investing and financing transactions | Nine months ended Sept. 30, |
| (in millions) | 2017 |
| | 2016 |
|
| Transfers from loans to other assets for other real estate owned (“OREO”) | $ | 3 |
| | $ | 4 |
|
| Change in assets of consolidated VIEs | 429 |
| | 392 |
|
| Change in liabilities of consolidated VIEs | 288 |
| | 14 |
|
| Change in nonredeemable noncontrolling interests of consolidated investment management funds | 234 |
| | 238 |
|
| Securities purchased not settled | 1,277 |
| | 229 |
|
| Securities sales not settled | — |
| | 218 |
|
| Securities matured not settled | 350 |
| | — |
|
| Held-to-maturity securities transferred to available-for-sale | 74 |
| | 10 |
|
| Premises and equipment/capitalized software funded by capital lease obligations | 347 |
| | 12 |
|
|
| | | | | | | | |
| Non-cash investing and financing transactions | Six months ended June 30, |
| (in millions) | 2020 |
| | 2019 |
| |
| Change in assets of consolidated investment management funds | $ | 215 |
| | $ | 76 |
| |
| Change in liabilities of consolidated investment management funds | 3 |
| | 4 |
| |
| Change in nonredeemable noncontrolling interests of consolidated investment management funds | 10 |
| | 65 |
| |
| Securities purchased not settled | 1,730 |
| | 1,113 |
| |
| Securities matured not settled | — |
| | 10 |
| |
| Premises and equipment/capitalized software funded by finance lease obligations | — |
| | 14 |
| |
| Premises and equipment/operating lease obligations | 66 |
| | 1,272 |
| (a) |
| Investment redemptions not settled | — |
| | — |
| |
| |
| (a) | Includes $1,244 million related to the adoption of ASU 2016-02, Leases, and $28 million related to new or modified leases. |
|
|
| Item 4. Controls and Procedures |
| |
Disclosure controls and procedures
Our management, including the Chief Executive Officer and Chief Financial Officer, with participation by the members of the Disclosure Committee, has responsibility for ensuring that there is an adequate and effective process for establishing, maintaining, and evaluating disclosure controls and procedures that are designed to ensure that information required to be disclosed by us in our SEC reports is timely recorded, processed, summarized and reported and that information required to be disclosed by BNY Mellon is accumulated and communicated to BNY Mellon’s management to allow timely decisions regarding the required disclosure. In addition, our ethics hotline can also be used by employees and others for the anonymous communication of concerns about financial controls or reporting matters. There are inherent limitations to the effectiveness of any system of disclosure controls and procedures, including the possibility of human error and the circumvention or overriding of the controls and procedures. Accordingly, even effective disclosure controls and procedures can only provide reasonable assurance of achieving their control objectives.
As of the end of the period covered by this report, an evaluation was carried out under the supervision and with the participation of our management, including the Chief Executive Officer and Chief Financial Officer, of the effectiveness of our disclosure controls and procedures as defined in Rule 13a-15(e) under the Securities Exchange Act of 1934, as amended (the “Exchange Act”). Based on that evaluation, the Chief Executive Officer and Chief Financial Officer concluded that our disclosure controls and procedures were effective.
Changes in internal control over financial reporting
In the ordinary course of business, we may routinely modify, upgrade or enhance our internal controls and procedures for financial reporting. There have not been any changes in our internal control over financial reporting as defined in Rule 13a-15(f) of the Exchange Act during the thirdsecond quarter of 20172020 that have materially affected, or are reasonably likely to materially affect, our internal control over financial reporting.
|
|
| Forward-looking Statements |
| |
Some statements in this documentQuarterly Report are forward-looking. These include all statements about the usefulness of Non-GAAP measures, the future results of BNY Mellon, our businesses, financial, liquidity and capital condition, results of operations, liquidity, risk and capital management and processes, goals, strategies, outlook, objectives, expectations (including those regarding our performance results, expenses, nonperforming assets, products, impacts of currency fluctuations, impacts of money market fee waivers, impacts of trends on our businesses, regulatory, technology, market, economic or accounting developments and the impacts of such developments on our businesses, legal proceedings and other contingencies,contingencies), effective tax rate, net interest revenue, estimates (including those regarding expenses, losses inherent in our credit portfolios and capital ratios), intentions (including those regarding our resolution strategy)capital returns and expenses, including our investments in technology and pension expense), targets, opportunities, potential actions, growth and initiatives.initiatives, including the potential effects of the coronavirus pandemic on any of the foregoing.
In this report, any other report, any press release or any written or oral statement that BNY Mellon or its executives may make, words, such as “estimate,” “forecast,” “project,” “anticipate,” “likely,” “target,” “expect,” “intend,” “continue,” “seek,” “believe,” “plan,” “goal,” “could,” “should,” “would,” “may,” “might,” “will,” “strategy,” “synergies,” “opportunities,” “trends”“trends,” “future,” “potentially,” “outlook” and words of similar meaning, may signify forward-looking statements.
Actual results may differ materially from those expressed or implied as a result of a number of factors, including those discussed in the “Risk Factors” section ofin this Quarterly Report and our 20162019 Annual Report, and this Form 10-Q, such as: an information security event
a communications or technology disruption or failure within our infrastructure or the infrastructure of third parties that results in a loss of information, delays our ability to access information or impacts our ability to provide services to our clients may materially adversely affect our business, financial condition and results of operations;
a cybersecurity incident, or a failure to protect our computer systems, networks and information and our clients’ information against cybersecurity threats, could result in the theft, loss, unauthorized access to, disclosure, use or
alteration of information, system or network failures, or loss of access to information; any such incident or failure could adversely impact our ability to conduct our businesses, damage our reputation and cause losses;
our business may be materially adversely affected by operational risk;
the coronavirus pandemic is adversely affecting us and creates significant risks and uncertainties for our business, and the ultimate impact of the pandemic on us will depend on future developments, which are highly uncertain and cannot be predicted;
our risk management framework may not be effective in mitigating risk and reducing the potential for losses;
we are subject to extensive government rulemaking, policies, regulation and supervision; these rules and regulations have, and in the future may, compel us to change how we manage our businesses, which could have a material adverse effect on our business, financial condition and results of operations;
regulatory or enforcement actions or litigation could materially adversely affect our results of operations or harm our businesses or reputation;
our businesses may be negatively affected by adverse events, publicity, government scrutiny or other reputational harm;
failure to satisfy regulatory standards, including “well capitalized” and “well managed” status or capital adequacy and liquidity rules more generally, could result in limitations on our activities and adversely affect our business and financial condition;
a failure or circumvention of our technology or that ofcontrols and procedures could have a third party or vendor, or if we neglect to update our technology, develop and market new technology to meet clients’ needs or protect our intellectual property and any material adverse effect on our business; a determination that our resolution plan is not credible and any material negative impact on our business, reputation, results of operations and financial condition and condition;
the application of our Title I preferred resolution strategy or resolution under the Title II orderly liquidation authority could adversely affect the Parent’s liquidity and any adverse effects on our liquidity, financial condition and the Parent’s security holders; extensive government rulemaking regulation,
impacts from climate change, natural disasters, acts of terrorism, pandemics, global conflicts and supervision, whichother geopolitical events may have a negative impact on our business and operations;
we are dependent on fee-based business for a substantial majority of our revenue and our fee-based revenues could be adversely affected by slowing in market activity, weak financial markets, underperformance and/or negative
|
|
Forward-looking Statements (continued) |
|
trends in savings rates or in investment preferences;
weakness and volatility in financial markets and the futureeconomy generally may compel us to change how we managematerially adversely affect our businesses,business, results of operations and financial condition;
changes in interest rates and yield curves could have a material adverse effect on our business, financial conditionprofitability;
transitions away from and resultsthe anticipated replacement of operations and have increased our compliance and operational risks and costs; failure to satisfy regulatory standards, including “well capitalized” and
“well managed” status or capital adequacy and liquidity rules, and any resulting limitations on our activities, or adverse effects on our business and financial condition; regulatory or enforcement actions or litigation and any material adverse effect on our results of operations or harm to our businesses or reputation; adverse events, publicity, government scrutiny or other reputational harm and any negative effect on our businesses; operational risk and any material adverse effect on our business; failure or circumvention of our controls and procedures and any material adverse effect on our business, reputation, results of operations and financial condition; failure of our risk management framework to be effective in mitigating risk and reducing the potential for losses; change or uncertainty in monetary, taxLIBOR and other governmental policies and theIBORs could adversely impact on our businesses, profitability and ability to compete; political, economic, legal, operational and other risks inherent in operating globally and any adverse effect on our business; acts of terrorism, natural disasters, pandemics and global conflicts and any negative impact on our business and operations; ongoing concerns about the financial stability of certain countries, the failure or instability of any of our significant global counterparties, new barriers to global trade or a breakup of the EU or Eurozone and any material adverse effect on our business and results of operations;
the United Kingdom’s referendum decision to leaveUK’s withdrawal from the EU and anymay have negative effects on global economic conditions, global financial markets, and our business and results of operations; weakness and volatility in financial markets and the economy generally and any material adverse effect
we may experience losses on our business, results of operations and financial condition; changes in interest rates and any material adverse effect on our profitability; write-downs of securities that we own and other losses related to volatile and illiquid market conditions, and any reduction inreducing our earnings or impact onand impacting our financial condition; our dependence on fee-based business for a substantial majority of our revenue and the adverse effects of a slowing in market activity, weak financial markets, underperformance and/or negative trends in savings rates or in investment preferences; any adverse effect on our foreign exchange revenues from decreased market volatility or cross-border investment activity of our clients;
the failure or perceived weakness of any of our significant clients or counterparties, many of whom are major financial institutions and sovereign entities, and our assumption of credit and counterparty risk, which could expose us to loss and adversely affect our business;
our business, financial condition and results of operations could be adversely affected if we do not effectively manage our liquidity;
we could incur losses if our allowance for credit losses, including loan and lending-related commitments reserves, is inadequate;
any material reduction in our credit ratings or the credit ratings of
|
|
Forward-looking Statements (continued)
|
|
our principal bank subsidiaries, whichThe Bank of New York Mellon or BNY Mellon, N.A., could increase the cost of funding and borrowing to us and our rated subsidiaries and have a material adverse effect on our results of operations and financial condition and on the value of the securities we issue; any adverse effect on our business, financial condition and results of operations of not effectively managing our liquidity; the potential to incur losses if our allowance for credit losses is inadequate; the risks relating to
new lines of business, new products and services or transformational or strategic project initiatives may subject us to additional risks, and the failure to implement these initiatives which could affect our results of operations; the
we are subject to competition in all aspects of our business, which could negatively affect our ability to maintain or increase our profitability;
our business may be adversely affected if we are unable to attract and retain employees;
our strategic transactions present risks and uncertainties relating to our strategic transactions and anycould have an adverse effect on our business, results of operations and financial condition; competition in all aspects of our business and any negative effect on our ability to maintain or increase our profitability; failure to attract and retain employees and any adverse effect on our business;
tax law changes or challenges to our tax positions and any adverse effect onwith respect to historical transactions may adversely affect our net income, effective tax rate and our overall results of operations and financial condition; changes in accounting standards
our ability to return capital to shareholders is subject to the discretion of our Board of Directors and any material impact on our reported financial condition, results of operations,
cash flows and other financial data; risks associated with being a non-operating holding company, including our dependence on dividends from our subsidiaries to meet obligations, to provide funds for payment of dividends and for stock repurchases; and the impact of provisions ofmay be limited by U.S. banking laws and regulations, including those governing capital and the approval of our capital plan, applicable provisions of Delaware law or our failure to pay full and timely dividends on our preferred stock,stock;
the Parent is a non-operating holding company, and as a result, is dependent on dividends from its subsidiaries and extensions of credit from its IHC to meet its obligations, including with respect to its securities, and to provide funds for share repurchases and payment of dividends to its stockholders; and
changes in accounting standards governing the preparation of our financial statements and future events could have a material impact on our ability to return capital to shareholders.reported financial condition, results of operations, cash flows and other financial data.
Investors should consider all risk factors discussed in this Quarterly Report and our 20162019 Annual Report this Form 10-Q and any subsequent reports filed with the SEC by BNY Mellon pursuant to the Exchange Act. All forward-looking statements speak only as of the date on which such statements are made, and BNY Mellon undertakes no obligation to update any statement to reflect events or circumstances after the date on which such forward-looking statement is made or to reflect the occurrence of unanticipated events. The contents of BNY Mellon’s website or any other websiteswebsite referenced herein are not part of this report.
|
|
| Part II - Other Information |
| |
Item 1. Legal ProceedingsProceedings.
The information required by this Item is set forth in the “Legal proceedings” section in Note 1718 of the Notes to Consolidated Financial Statements, which portion is incorporated herein by reference in response to this item.
Item 1A. Risk FactorsFactors.
The following discussion supplements the discussion of risk factors that could affect our business, financial condition or results of operations set forth in Part I, Item 1A,1A., Risk Factors, on pages 9075 through 11699 of our 20162019 Annual Report. The discussion of Risk Factors, as so supplemented, sets forth our most significant risk factors that could affect our business, financial condition or results of operations. However, other factors, besides thatthose discussed below or in our 20162019 Annual Report or other of our reports filed with or furnished to the SEC, also could adversely affect our business, financial condition or results.results of operations. We cannot assure you that the risk factors described below or elsewhere in this report and such other reports address all potential risks that we may face. These risk factors also serve to describe factors which may cause our results to differ materially from those described in forward-looking statements included herein or in other documents or statements that make reference to this Form 10-Q. See Forward-looking“Forward-looking Statements.”
If our resolution planThe coronavirus pandemic is determined not to be credible or not to facilitate an orderly resolution under the U.S. Bankruptcy Code,adversely affecting us and creates significant risks and uncertainties for our business, reputation, resultsand the ultimate impact of operationsthe pandemic on us will depend on future developments, which are highly uncertain and cannot be predicted.
The coronavirus pandemic has negatively affected the global economy, decreased liquidity in fixed income markets, created significant volatility and disruption in financial condition could be materially negatively impacted. The applicationand equity markets, increased unemployment levels and disrupted businesses in many industries. This has resulted in increased demand on our transaction processing and clearance capabilities in many of our Title I preferred resolution strategy or resolutionInvestment Services businesses and volatility in the levels and mix of the assets under the Title II orderly liquidation authority could adversely affectmanagement of our liquidityInvestment and financial condition and our security holders.
Large BHCs must develop and submitWealth Management business. Moreover, governmental actions in response to the Federal Reservepandemic are meaningfully influencing the interest rate environment, which has reduced, and the FDIC for review plans for their rapid and orderly resolution in the event of material financial distress or failure. BNY Mellon and The Bank of New York Mellon each file periodic complementary resolution plans. In April 2016, the Federal Reserve and the FDIC jointly determined that our 2015 resolution plan was not credible or would not facilitate an orderly resolution under the U.S. Bankruptcy Code. The agencies issued a joint notice of deficiencies and shortcomings and the actions thatis expected to
must be takencontinue to address them, whichreduce, our net interest margin. As a result, we respondedhave granted and may continue to grant money market fee waivers. The effects of the pandemic have resulted, and could continue to result, in higher and more volatile provisions for credit losses for financial instruments subject to ASU 2016-13, Financial Instruments – Credit Losses: Measurement of Credit Losses on Financial Instruments, held by us. The continuing effects of the pandemic could also result in increased credit losses and charge-offs, particularly if our credit exposures continue to increase and as more clients and customers experience credit deterioration, as well as increased risk of other asset write-downs and impairments, including, but not limited to, equity investments, goodwill and intangibles. Any of these events could potentially result in a material adverse impact on our business and results of operations.
In addition, reliance on work-from-home capabilities by us, our clients and other industry participants, as well as the potential inability to maintain critical staff in operational facilities due to stay-at-home orders across jurisdictions, illness and quarantines present heightened cybersecurity, information security and operational risks. Any disruption to our ability to deliver services to our clients and customers could result in potential liability to our clients and customers, regulatory fines, penalties or other sanctions, increased operational costs or harm to our reputation.
The pandemic has resulted in an Oct. 1, 2016 submission. In December 2016,increase in our balance sheet and volatility in risk-weighted assets, as we experience elevated deposit levels. Moreover, on March 15, 2020, we, along with the agencies jointly determined that our Oct. 1, 2016 submission adequately remedied the identified deficiencies. If the agencies determine that our future submissions are not credible or would not facilitate an orderly resolution under the U.S. Bankruptcy Code, and we fail to address the deficiencies in a timely manner, the agencies may jointly impose more stringent capital, leverage or liquidity requirements or restrictions on our growth, activities or operations. If we continue to fail to adequately remedy any deficiencies identified in future submissions, we could be required to divest assets or operations that the agencies determine necessary to facilitate our orderly resolution.
Following the receipt of feedback from the Federal Reserve and the FDIC in April 2016 on our 2015 resolution plan, we determined that, in the event of our material financial distress or failure, our preferred resolution strategy under Title Iother member banks of the Dodd-Frank Act is a single point of entry strategy.
In connection with our single point of entry resolution strategy,Financial Services Forum, announced that we have established the IHC to facilitate the provision of capital and liquidity resources to certain key subsidiaries in the event of material financial distress or failure. Inwould temporarily suspend share repurchases through the second quarter of 2017, we entered into a binding2020 to preserve capital and liquidity in order to further our objective of using our capital and liquidity to support agreementour clients and customers. Further, in June 2020, the Federal Reserve announced that it has required the IHCparticipating CCAR firms, including us, to provideupdate and resubmit their capital plans and that, support. The support agreement required the Parent to transfer its intercompany loans and most of its cash to the IHC, and requires the Parent to continue to transfer cash and other liquid financial assets to the IHC.
If our projected liquidity resources deteriorate so severely that resolution of the Parent becomes imminent, the committed line of credit the IHC provided to the Parent will automatically terminate, with all amounts outstanding becoming due and payable, and the support agreement will require the Parent to transfer most of its remaining assets (other than stock in subsidiaries and a cash reserve to fund bankruptcy expenses) to the IHC. Asas a result, unless otherwise approved by the Federal Reserve, participating firms would not be permitted, during a periodthe third quarter of severe financial stress2020, to conduct open market common stock repurchases, to increase their common stock dividends or to pay common stock dividends that exceed average net income for the Parent might commence bankruptcy proceedings at an earlier time thanpreceding four quarters. The Federal Reserve also stated that it otherwise would if the support agreement had not been implemented.
If the Parent were to become subject to a bankruptcy proceeding and our single point of entry strategy is successful, creditors of some or all of our materialmay extend these limitations quarter-by-quarter. Our
|
|
Part II - Other Information (continued) |
| |
entities would receive full recoveriesability to resume our common stock repurchase program and maintain our common stock dividend depends on their claims, whilefactors such as prevailing market conditions, our outlook for the Parent’s security holders, including unsecured debt holders, could face significant losses, potentially includingeconomic environment, the lossperformance of their entire investment. It is possible thatour business, the applicationadditional capital analysis required by the Federal Reserve, and whether the Federal Reserve keeps the limitations for the third quarter of the single point of entry strategy –2020 in place for subsequent quarters.
The extent to which the Parent would be the only legal entity to enter resolution proceedings – could result in greater losses to holders ofpandemic impacts our unsecured debt securities and other securities than the losses that could result from the application of a different resolution strategy. Further, if the single point of entry strategy is not successful, ourbusiness, financial condition, liquidity and financial condition would be adversely affected andresults of operations, as well as our security holders may, as a consequence, be in a worse position than if the strategy had not been implemented.
In addition, Title II of the Dodd-Frank Act established an orderly liquidation process in the event of the failure of a large systemically important financial institution, such as BNY Mellon, in order to avoid or mitigate serious adverse effectsregulatory capital, will depend on the U.S. financial system. Specifically, when a U.S. G-SIB, such as BNY Mellon is in default or danger of default, and certain specified conditionsfuture developments, which are met, the FDIC may be appointed receiver under the orderly liquidation authority, and BNY Mellon would be resolved under that authority instead of the U.S. Bankruptcy Code.
highly
U.S. supervisors have indicated that a single point of entry strategy mayuncertain and cannot be a desirable strategy to resolve a large financial institution such as BNY Mellon under Title II in a manner that would, similar to our preferred strategy under our Title I resolution plan, impose losses on shareholders, unsecured debt holderspredicted, including the scope and other unsecured creditorsduration of the top-tier holding company (inpandemic, the effectiveness of our case, the Parent), while permitting the holding company’s subsidiaries to continue to operate and remain solvent. Under such a strategy, assuming the Parent entered resolution proceedings and its subsidiaries remained solvent, losses at the subsidiary level could be transferredwork-from-home arrangements, actions taken by governmental authorities in response to the Parentpandemic, as well as the direct and ultimately borne byindirect impact on us, our clients and customers, and third parties. As the Parent’s security holders (including holderspandemic adversely affects the United States or the global economy, or our business, financial condition, liquidity or results of operations, it may also have the effect of heightening many of the Parent’s unsecured debt securities), while third-party creditors ofother risks described in the Parent’s subsidiaries would receive full recoveriessection entitled “Risk Factors” in our most recent Annual Report on their claims. Accordingly, the Parent’s security holders (including holders of unsecured debt securitiesForm 10-K and other unsecured creditors) could face losses in excess of what otherwise would have been the case.any subsequent Quarterly Reports on Form 10-Q.
|
|
Part II - Other Information (continued)
|
|
Item 2. Unregistered Sales of Equity Securities and Use of ProceedsProceeds.
| |
| (c) | The following table discloses repurchases of our common stock made in the thirdsecond quarter of 2017.2020. All of the Company’s preferred stock outstanding has preference over the Company’s common stock with respect to the payment of dividends. |
Issuer purchases of equity securities
|
| | | | | | | | | | | | | | |
| Share repurchases - third quarter of 2017 | | | | | Total shares repurchased as part of a publicly announced plan or program |
| Maximum approximate dollar value of shares that may yet be purchased under the publicly announced plans or programs at Sept. 30, 2017 | | |
| (dollars in millions, except per share information; common shares in thousands) | Total shares
repurchased |
| | Average price
per share |
| | |
| July 2017 | 7 |
| | $ | 51.08 |
| | 7 |
| | $ | 2,600 |
| |
| August 2017 | 12,300 |
| | 52.74 |
| | 12,300 |
| | 1,951 |
| |
| September 2017 | 9 |
| | 52.29 |
| | 9 |
| | 1,950 |
| |
Third quarter of 2017 (a) | 12,316 |
| | $ | 52.74 |
| | 12,316 |
| | $ | 1,950 |
| (b) |
|
| | | | | | | | | | | | | | |
| Share repurchases – second quarter of 2020 | | | | | Total shares repurchased as part of a publicly announced plan or program |
| Maximum approximate dollar value of shares that may yet be purchased under the publicly announced plans or programs at June 30, 2020 | | |
| (dollars in millions, except per share amounts; common shares in thousands) | Total shares
repurchased |
| | Average price
per share |
| | |
| April 2020 | 48 |
| | $ | 45.41 |
| | 48 |
| | $ | 931 |
| |
| May 2020 | 7 |
| | 35.66 |
| | 7 |
| | 931 |
| |
| June 2020 | 6 |
| | 38.28 |
| | 6 |
| | N/A |
| |
Second quarter of 2020 (a) | 61 |
| | $ | 43.59 |
| | 61 |
| | N/A |
| (b) |
| |
| (a) | Includes 32 thousandReflects shares repurchased at a purchase price of $2 million from employees, primarily in connection with the employees’ payment of taxes upon the vesting of restricted stock. The average price per share of open market purchases was $52.74. |
| |
| (b) | RepresentsThe Federal Reserve has announced that it will conduct additional analysis for all participating CCAR firms later this year and will not allow participating firms to make open market common stock repurchases during the maximum value of the shares authorized to be repurchased through the secondthird quarter of 2018, including employee benefit plan repurchases,2020. We are permitted to continue to repurchase shares from employees, primarily in connection with the Federal Reserve’s non-objection to our 2017 capital plan.employees’ payment of taxes upon the vesting of restricted stock. |
N/A - Not applicable.
OnIn June 28, 2017,2019, in connection with the Federal Reserve’s non-objection to our 20172019 capital plan, BNY Mellon announced a share repurchase plan providing for the repurchase of up to $2.6$3.94 billion of common stock and up to an additional $500 million of common stock contingent on a prior issuance of $500 million of noncumulative perpetual preferred stock. The 2017 capital plan beganstarting in the third quarter of 20172019 and continuescontinuing through the second quarter of 2018.2020. This new share repurchase plan replacesreplaced all previously authorized share repurchase plans.
In March 2020, we and the other members of the Financial Services Forum announced the temporary suspension of share repurchases until the end of the second quarter of 2020 to preserve capital and liquidity in order to further the objective of using capital and liquidity to support clients and customers.
In connection with the Federal Reserve’s release of the CCAR results in June 2020, BNY Mellon announced that it will not conduct open market common stock repurchases in the third quarter of 2020 and will resume the common stock repurchase program as early as possible, depending on factors such as prevailing market conditions, our outlook for the economic environment, the additional capital analysis required by the Federal Reserve, and whether the Federal Reserve keeps the limitations for the third quarter of 2020 in place for subsequent quarters. The Federal Reserve has announced that it will conduct additional analysis for all participating CCAR firms later this year and will not allow participating firms to
|
|
Part II - Other Information (continued) |
|
make open market common stock repurchases during the third quarter of 2020.
Share repurchases may be executed through open market repurchases, in privately negotiated transactions or by other means, including through repurchase plans designed to comply with Rule 10b5-1 and throughother derivative, accelerated share
repurchase and other structured transactions. The timing and exact amount of any common stock repurchases will depend on various factors, including market conditions and the common stock trading price; the Company’s capital position, liquidity and financial performance; alternative uses of capital; and legal and regulatory considerations.
Item 6. ExhibitsExhibits.
The list of exhibits required to be filed as exhibits to this report appears below.
|
| | | | |
| Exhibit No. | | Description | | Method of Filing |
| 3.1 | | | | Previously filed as Exhibit 3.1 to the Company’s Current Report on Form 8-K (File No. 000-52710) as filed with the Commission on July 2, 2007, and incorporated herein by reference. |
| 3.2 | | | | Previously filed as Exhibit 4.1 to the Company’s Current Report on Form 8-K (File No. 000-52710) as filed with the Commission on July 5, 2007, and incorporated herein by reference. |
| 3.3 | | | | Previously filed as Exhibit 3.2 to the Company’s Registration Statement on Form 8A12B (File No. 001-35651) as filed with the Commission on Sept. 14, 2012, and incorporated herein by reference. |
| 3.4 | | | | Previously filed as Exhibit 3.1 to the Company’s Current Report on Form 8-K (File No. 001-35651) as filed with the Commission on May 16, 2013, and incorporated herein by reference.
|
| 3.5 | |
| | Previously filed as Exhibit 3.1 to the Company’s Current Report on Form 8-K (File No. 001-35651) as filed with the Commission on April 28, 2015, and incorporated herein by reference.
|
| 3.6 | | | | Previously filed as Exhibit 3.1 to the Company’s Current Report on Form 8-K (File No. 001-35651) as filed with the Commission on Aug. 1, 2016, and incorporated herein by reference. |
| 3.7 | | | | Previously filed as Exhibit 3.1 to the Company’s Current Report on Form 8-K (File No. 001-35651) as filed with the Commission on Oct.May 19, 2015,2020, and incorporated herein by reference. |
| 3.8 | | | | Previously filed as Exhibit 3.1 to the Company’s Current Report on Form 8-K (File No. 001-35651) as filed with the Commission on April 10, 2019, and incorporated herein by reference. |
|
|
Index to Exhibits (continued) |
|
|
| | | | |
| Exhibit No. | | Description | | Method of Filing |
| 3.9 | | | | Previously filed as Exhibit 3.1 to the Company’s Current Report on Form 8-K (File No. 001-35651) as filed with the Commission on Feb. 13, 2018, and incorporated herein by reference. |
| 4.1 | | None of the instruments defining the rights of holders of long-term debt of the Parent or any of its subsidiaries represented long-term debt in excess of 10% of the total assets of the Company as of Sept.June 30, 2017.2020. The Company hereby agrees to furnish to the Commission, upon request, a copy of any such instrument. | | N/A |
|
|
Index to Exhibits (continued)
|
|
|
| | | | |
Exhibit No. | | Description | | Method of Filing |
12.1 | | | | Filed herewith. |
| 31.1 | | | | Filed herewith. |
| 31.2 | | | | Filed herewith. |
| 32.1 | | | | Furnished herewith. |
| 32.2 | | | | Furnished herewith. |
| 101.INS | | Inline XBRL Instance Document. | | Filed herewith.The instance document does not appear in the interactive data file because its XBRL tags are embedded within the inline XBRL document. |
| 101.SCH | | Inline XBRL Taxonomy Extension Schema Document. | | Filed herewith. |
| 101.CAL | | Inline XBRL Taxonomy Extension Calculation Linkbase Document. | | Filed herewith. |
| 101.DEF | | Inline XBRL Taxonomy Extension Definition Linkbase Document. | | Filed herewith. |
| 101.LAB | | Inline XBRL Taxonomy Extension Label Linkbase Document. | | Filed herewith. |
| 101.PRE | | Inline XBRL Taxonomy Extension Presentation Linkbase Document. | | Filed herewith. |
| 104 | | The cover page of the Company’s Quarterly Report on Form 10-Q for the quarter ended June 30, 2020, formatted in inline XBRL. | | The cover page interactive data file is embedded within the inline XBRL document and included in Exhibit 101. |
SIGNATURE
Pursuant to the requirements of the Securities Exchange Act of 1934, the registrant has duly caused this report to be signed on its behalf by the undersigned thereunto duly authorized.
|
| |
| | THE BANK OF NEW YORK MELLON CORPORATION |
| | (Registrant) |
|
| | | |
| | | | |
Date: November 7, 2017August 6, 2020 | By: | | /s/ Kurtis R. Kurimsky |
| | | | Kurtis R. Kurimsky |
| | | | Corporate Controller |
| | | | (Duly Authorized Officer and |
| | | | Principal Accounting Officer of |
| | | | the Registrant) |