RESOLUTE FOREST PRODUCTS INC.
CONSOLIDATED STATEMENTS OF CHANGES IN EQUITY
(Unaudited, in millions of U.S. dollars)
| Three Months Ended March 31, 2021 | |||||||||||||||||||||||||||||||||||||||||||||||||||||||||||||||||
| Resolute Forest Products Inc. Shareholders’ Equity | |||||||||||||||||||||||||||||||||||||||||||||||||||||||||||||||||
| Common Stock | Additional Paid-In Capital | Deficit | Accumulated Other Comprehensive Loss | Treasury Stock | Non-controlling Interest | Total Equity | |||||||||||||||||||||||||||||||||||||||||||||||||||||||||||
| Balance as of December 31, 2020 | $ | 0 | $ | 3,804 | $ | (1,235) | $ | (1,314) | $ | (174) | $ | 1 | $ | 1,082 | |||||||||||||||||||||||||||||||||||||||||||||||||||
| Share-based compensation, net of withholding taxes | — | (2) | — | — | — | — | (2) | ||||||||||||||||||||||||||||||||||||||||||||||||||||||||||
| Net income | — | — | 87 | — | — | 1 | 88 | ||||||||||||||||||||||||||||||||||||||||||||||||||||||||||
| Purchases of treasury stock (1.7 million shares) (Note 12) | — | — | — | — | (17) | — | (17) | ||||||||||||||||||||||||||||||||||||||||||||||||||||||||||
| Stock unit awards vested (0.4 million shares), net of shares forfeited for employee withholding taxes | — | — | — | — | — | — | — | ||||||||||||||||||||||||||||||||||||||||||||||||||||||||||
| Other comprehensive income, net of tax | — | — | — | 36 | — | 0 | 36 | ||||||||||||||||||||||||||||||||||||||||||||||||||||||||||
| Balance as of March 31, 2021 | $ | 0 | $ | 3,802 | $ | (1,148) | $ | (1,278) | $ | (191) | $ | 2 | $ | 1,187 | |||||||||||||||||||||||||||||||||||||||||||||||||||
| Three Months Ended June 30, 2020 | ||||||||||||||||||||||||||||
| Resolute Forest Products Inc. Shareholders’ Equity | ||||||||||||||||||||||||||||
Common Stock | Additional Paid-In Capital | Deficit | Accumulated Other Comprehensive Loss | Treasury Stock | Non-controlling Interest | Total Equity | ||||||||||||||||||||||
| Balance as of March 31, 2020 | $ | — | $ | 3,804 | $ | (1,246 | ) | $ | (1,181 | ) | $ | (144 | ) | $ | 1 | $ | 1,234 | |||||||||||
| Share-based compensation, net of withholding taxes | — | 1 | — | — | — | — | 1 | |||||||||||||||||||||
| Net income | — | — | 6 | — | — | — | 6 | |||||||||||||||||||||
| Purchases of treasury stock (0.3 shares) (Note 12) | — | — | — | — | (1 | ) | — | (1 | ) | |||||||||||||||||||
| Other comprehensive income, net of tax | — | — | — | 10 | — | — | 10 | |||||||||||||||||||||
| Balance as of June 30, 2020 | $ | — | $ | 3,805 | $ | (1,240 | ) | $ | (1,171 | ) | $ | (145 | ) | $ | 1 | $ | 1,250 | |||||||||||
| Six Months Ended June 30, 2020 | ||||||||||||||||||||||||||||
| Resolute Forest Products Inc. Shareholders’ Equity | ||||||||||||||||||||||||||||
Common Stock | Additional Paid-In Capital | Deficit | Accumulated Other Comprehensive Loss | Treasury Stock | Non-controlling Interest | Total Equity | ||||||||||||||||||||||
| Balance as of December 31, 2019 | $ | — | $ | 3,802 | $ | (1,245 | ) | $ | (1,179 | ) | $ | (144 | ) | $ | 1 | $ | 1,235 | |||||||||||
| Share-based compensation, net of withholding taxes | — | 3 | — | — | — | — | 3 | |||||||||||||||||||||
| Net income | — | — | 5 | — | — | — | 5 | |||||||||||||||||||||
| Purchases of treasury stock (0.3 shares) (Note 12) | — | — | — | — | (1 | ) | — | (1 | ) | |||||||||||||||||||
| Stock unit awards vested (0.7 shares), net of shares forfeited for employee withholding taxes | — | — | — | — | — | — | — | |||||||||||||||||||||
| Other comprehensive income, net of tax | — | — | — | 8 | — | — | 8 | |||||||||||||||||||||
| Balance as of June 30, 2020 | $ | — | $ | 3,805 | $ | (1,240 | ) | $ | (1,171 | ) | $ | (145 | ) | $ | 1 | $ | 1,250 | |||||||||||
| Three Months Ended June 30, 2019 | ||||||||||||||||||||||||||||
| Resolute Forest Products Inc. Shareholders’ Equity | ||||||||||||||||||||||||||||
| Common Stock | Additional Paid-In Capital | Deficit | Accumulated Other Comprehensive Loss | Treasury Stock | Non- controlling Interest | Total Equity | ||||||||||||||||||||||
| Balance as of March 31, 2019 | $ | — | $ | 3,802 | $ | (1,156 | ) | $ | (947 | ) | $ | (120 | ) | $ | 1 | $ | 1,580 | |||||||||||
| Share-based compensation, net of withholding taxes | — | 1 | — | — | — | — | 1 | |||||||||||||||||||||
| Net income | — | — | 25 | — | — | — | 25 | |||||||||||||||||||||
| Purchases of treasury stock (0.7 shares) (Note 12) | — | — | — | — | (5 | ) | — | (5 | ) | |||||||||||||||||||
| Other comprehensive loss, net of tax | — | — | — | (1 | ) | — | — | (1 | ) | |||||||||||||||||||
| Balance as of June 30, 2019 | $ | — | $ | 3,803 | $ | (1,131 | ) | $ | (948 | ) | $ | (125 | ) | $ | 1 | $ | 1,600 | |||||||||||
| Six Months Ended June 30, 2019 | ||||||||||||||||||||||||||||
| Resolute Forest Products Inc. Shareholders’ Equity | ||||||||||||||||||||||||||||
Common Stock | Additional Paid-In Capital | Deficit | Accumulated Other Comprehensive Loss | Treasury Stock | Non- controlling Interest | Total Equity | ||||||||||||||||||||||
| Balance as of December 31, 2018 | $ | — | $ | 3,802 | $ | (1,198 | ) | $ | (950 | ) | $ | (120 | ) | $ | 1 | $ | 1,535 | |||||||||||
| Share-based compensation, net of withholding taxes | — | 1 | — | — | — | — | 1 | |||||||||||||||||||||
| Net income | — | — | 67 | — | — | — | 67 | |||||||||||||||||||||
| Purchases of treasury stock (0.7 shares) (Note 12) | — | — | — | — | (5 | ) | — | (5 | ) | |||||||||||||||||||
| Stock unit awards vested (0.3 shares), net of shares forfeited for employee withholding taxes | — | — | — | — | — | — | — | |||||||||||||||||||||
| Other comprehensive income, net of tax | — | — | — | 2 | — | — | 2 | |||||||||||||||||||||
| Balance as of June 30, 2019 | $ | — | $ | 3,803 | $ | (1,131 | ) | $ | (948 | ) | $ | (125 | ) | $ | 1 | $ | 1,600 | |||||||||||
| Three Months Ended March 31, 2020 | |||||||||||||||||||||||||||||||||||||||||||||||||||||||||||||||||
| Resolute Forest Products Inc. Shareholders’ Equity | |||||||||||||||||||||||||||||||||||||||||||||||||||||||||||||||||
| Common Stock | Additional Paid-In Capital | Deficit | Accumulated Other Comprehensive Loss | Treasury Stock | Non- controlling Interest | Total Equity | |||||||||||||||||||||||||||||||||||||||||||||||||||||||||||
| Balance as of December 31, 2019 | $ | 0 | $ | 3,802 | $ | (1,245) | $ | (1,179) | $ | (144) | $ | 1 | $ | 1,235 | |||||||||||||||||||||||||||||||||||||||||||||||||||
| Share-based compensation, net of withholding taxes | — | 2 | — | — | — | — | 2 | ||||||||||||||||||||||||||||||||||||||||||||||||||||||||||
| Net loss | — | — | (1) | — | — | 0 | (1) | ||||||||||||||||||||||||||||||||||||||||||||||||||||||||||
| Stock unit awards vested (0.7 million shares), net of shares forfeited for employee withholding taxes | — | — | — | — | — | — | — | ||||||||||||||||||||||||||||||||||||||||||||||||||||||||||
| Other comprehensive loss, net of tax | — | — | — | (2) | — | 0 | (2) | ||||||||||||||||||||||||||||||||||||||||||||||||||||||||||
| Balance as of March 31, 2020 | $ | 0 | $ | 3,804 | $ | (1,246) | $ | (1,181) | $ | (144) | $ | 1 | $ | 1,234 | |||||||||||||||||||||||||||||||||||||||||||||||||||
See accompanying notes to unaudited interim Consolidated Financial Statements.
4
RESOLUTE FOREST PRODUCTS INC.
CONSOLIDATED STATEMENTS OF CASH FLOWS
(Unaudited, in millions of U.S. dollars)
| Three Months Ended March 31, | ||||||||||||||||||||||||||||
| 2021 | 2020 | |||||||||||||||||||||||||||
| Cash flows from operating activities: | Cash flows from operating activities: | |||||||||||||||||||||||||||
| Net income (loss) including noncontrolling interest | Net income (loss) including noncontrolling interest | $ | 88 | $ | (1) | |||||||||||||||||||||||
| Adjustments to reconcile net income (loss) including noncontrolling interest to net cash provided by (used in) operating activities: | Adjustments to reconcile net income (loss) including noncontrolling interest to net cash provided by (used in) operating activities: | |||||||||||||||||||||||||||
| Share-based compensation | Share-based compensation | 2 | 3 | |||||||||||||||||||||||||
| Depreciation and amortization | Depreciation and amortization | 41 | 42 | |||||||||||||||||||||||||
| Deferred income taxes | Deferred income taxes | 40 | 27 | |||||||||||||||||||||||||
| Net pension contributions and other postretirement benefit payments | Net pension contributions and other postretirement benefit payments | (23) | (33) | |||||||||||||||||||||||||
| (Gain) loss on translation of foreign currency denominated deferred income taxes | (Gain) loss on translation of foreign currency denominated deferred income taxes | (12) | 69 | |||||||||||||||||||||||||
| Loss (gain) on translation of foreign currency denominated pension and other postretirement benefit obligations | Loss (gain) on translation of foreign currency denominated pension and other postretirement benefit obligations | 16 | (82) | |||||||||||||||||||||||||
| Loss on commodity contracts | Loss on commodity contracts | 14 | 0 | |||||||||||||||||||||||||
| Net planned major maintenance (payments) amortization | Net planned major maintenance (payments) amortization | (3) | 6 | |||||||||||||||||||||||||
| Changes in working capital: | Changes in working capital: | |||||||||||||||||||||||||||
| Accounts receivable | Accounts receivable | (51) | (20) | |||||||||||||||||||||||||
| Inventories | Inventories | (50) | (29) | |||||||||||||||||||||||||
| Other current assets | Other current assets | 0 | (6) | |||||||||||||||||||||||||
| Accounts payable and other | Accounts payable and other | 2 | (18) | |||||||||||||||||||||||||
| Other, net | Other, net | 10 | (7) | |||||||||||||||||||||||||
| Net cash provided by (used in) operating activities | Net cash provided by (used in) operating activities | 74 | (49) | |||||||||||||||||||||||||
| Cash flows from investing activities: | Cash flows from investing activities: | |||||||||||||||||||||||||||
| Cash invested in fixed assets | Cash invested in fixed assets | (14) | (21) | |||||||||||||||||||||||||
| Acquisition of business, net of cash acquired | Acquisition of business, net of cash acquired | 0 | (174) | |||||||||||||||||||||||||
| Increase in countervailing and anti-dumping duty cash deposits on softwood lumber | Increase in countervailing and anti-dumping duty cash deposits on softwood lumber | (32) | (15) | |||||||||||||||||||||||||
| Six Months Ended June 30, | ||||||||||||||||||||||||||||
| 2020 | 2019 | |||||||||||||||||||||||||||
| Cash flows from operating activities: | ||||||||||||||||||||||||||||
| Net income including noncontrolling interest | $ | 5 | $ | 67 | ||||||||||||||||||||||||
| Adjustments to reconcile net income including noncontrolling interest to net cash provided by operating activities: | ||||||||||||||||||||||||||||
| Share-based compensation | 4 | 3 | ||||||||||||||||||||||||||
| Depreciation and amortization | 82 | 82 | ||||||||||||||||||||||||||
| Deferred income taxes | 32 | 40 | ||||||||||||||||||||||||||
| Net pension contributions and other postretirement benefit payments | (48 | ) | (57 | ) | ||||||||||||||||||||||||
| Net gain on disposition of assets | (9 | ) | — | |||||||||||||||||||||||||
| Loss (gain) on translation of foreign currency denominated deferred income taxes | 39 | (35 | ) | |||||||||||||||||||||||||
| (Gain) loss on translation of foreign currency denominated pension and other postretirement benefit obligations | (47 | ) | 37 | |||||||||||||||||||||||||
| Net planned major maintenance (payments) amortization | (2 | ) | 7 | |||||||||||||||||||||||||
| Changes in working capital: | ||||||||||||||||||||||||||||
| Accounts receivable | 50 | 38 | ||||||||||||||||||||||||||
| Inventories | 25 | (21 | ) | |||||||||||||||||||||||||
| Other current assets | (7 | ) | (3 | ) | ||||||||||||||||||||||||
| Accounts payable and accrued liabilities | (49 | ) | (64 | ) | ||||||||||||||||||||||||
| Other, net | 1 | 1 | ||||||||||||||||||||||||||
| Net cash provided by operating activities | 76 | 95 | ||||||||||||||||||||||||||
| Cash flows from investing activities: | ||||||||||||||||||||||||||||
| Cash invested in fixed assets | (37 | ) | (45 | ) | ||||||||||||||||||||||||
| Acquisition of business, net of cash acquired | (172 | ) | — | |||||||||||||||||||||||||
| Disposition of assets | 9 | 2 | ||||||||||||||||||||||||||
| Decrease in countervailing duty cash deposits on supercalendered paper | — | 1 | ||||||||||||||||||||||||||
| Increase in countervailing and anti-dumping duty cash deposits on softwood lumber | (32 | ) | (33 | ) | ||||||||||||||||||||||||
| Decrease in countervailing duty cash deposits on uncoated groundwood paper | — | 6 | ||||||||||||||||||||||||||
| Other investing activities, net | 5 | — | Other investing activities, net | 3 | 4 | |||||||||||||||||||||||
| Net cash used in investing activities | (227 | ) | (69 | ) | Net cash used in investing activities | (43) | (206) | |||||||||||||||||||||
| Cash flows from financing activities: | Cash flows from financing activities: | |||||||||||||||||||||||||||
| Net repayments under revolving credit facilities | (2 | ) | — | |||||||||||||||||||||||||
| Net borrowings under revolving credit facilities | Net borrowings under revolving credit facilities | 0 | 189 | |||||||||||||||||||||||||
| Issuance of long-term debt | Issuance of long-term debt | 300 | 0 | |||||||||||||||||||||||||
| Proceeds from long-term debt | 180 | — | Proceeds from long-term debt | 0 | 180 | |||||||||||||||||||||||
| Repayments of debt | (1 | ) | (225 | ) | Repayments of debt | (376) | (1) | |||||||||||||||||||||
| Purchases of treasury stock | (1 | ) | (5 | ) | Purchases of treasury stock | (17) | 0 | |||||||||||||||||||||
| Payments of financing and credit facility fees | — | (2 | ) | |||||||||||||||||||||||||
| Net cash provided by (used in) financing activities | 176 | (232 | ) | |||||||||||||||||||||||||
| Payments of financing fees | Payments of financing fees | (6) | 0 | |||||||||||||||||||||||||
| Net cash (used in) provided by financing activities | Net cash (used in) provided by financing activities | (99) | 368 | |||||||||||||||||||||||||
| Effect of exchange rate changes on cash and cash equivalents, and restricted cash | (1 | ) | 1 | Effect of exchange rate changes on cash and cash equivalents, and restricted cash | 0 | (3) | ||||||||||||||||||||||
| Net increase (decrease) in cash and cash equivalents, and restricted cash | $ | 24 | $ | (205 | ) | |||||||||||||||||||||||
| Net (decrease) increase in cash and cash equivalents, and restricted cash | Net (decrease) increase in cash and cash equivalents, and restricted cash | $ | (68) | $ | 110 | |||||||||||||||||||||||
| Cash and cash equivalents, and restricted cash: | Cash and cash equivalents, and restricted cash: | |||||||||||||||||||||||||||
| Beginning of period | $ | 42 | $ | 345 | Beginning of period | $ | 159 | $ | 42 | |||||||||||||||||||
| End of period | $ | 66 | $ | 140 | End of period | $ | 91 | $ | 152 | |||||||||||||||||||
| Cash and cash equivalents, and restricted cash at end of period: | Cash and cash equivalents, and restricted cash at end of period: | |||||||||||||||||||||||||||
| Cash and cash equivalents | $ | 27 | $ | 98 | Cash and cash equivalents | $ | 33 | $ | 116 | |||||||||||||||||||
| Restricted cash (included in “Other current assets”) | Restricted cash (included in “Other current assets”) | $ | 18 | $ | 0 | |||||||||||||||||||||||
| Restricted cash (included in “Other assets”) | $ | 39 | $ | 42 | Restricted cash (included in “Other assets”) | $ | 40 | $ | 36 | |||||||||||||||||||
See accompanying notes to unaudited interim Consolidated Financial Statements.
5
RESOLUTE FOREST PRODUCTS INC.
Notes to Unaudited Interim Consolidated Financial Statements
Note 1. Organization and Basis of Presentation
Nature of operations
Resolute Forest Products Inc. (with its subsidiaries, either individually or collectively, unless otherwise indicated, referred to as “Resolute Forest Products,” “we,” “our,” “us,” “Parent,” or the “Company”) is incorporated in Delaware. We are a global leader in the forest products industry with a diverse range of products, including market pulp, tissue, wood products, and paper, which are marketed in close to 70over 50 countries. We own or operate some 40 facilities, as well as power generation assets, in the U.S. and Canada.
Financial statements
Our interim consolidated financial statements and accompanying notes (or, the “Consolidated Financial Statements”) are unaudited and have been prepared in accordance with the requirements of the U.S. Securities and Exchange Commission (or, the “SEC”) for interim reporting. Under those rules, certain footnotes and other financial information that are normally required by U.S. generally accepted accounting principles (or, “GAAP”) may be condensed or omitted. In our opinion, all adjustments (consisting of normal recurring adjustments) necessary for the fair statement of the unaudited interim Consolidated Financial Statements have been made. All amounts are expressed in U.S. dollars, unless otherwise indicated. The results for the interim period ended June 30, 2020,March 31, 2021, are not necessarily indicative of the results to be expected for the full year. These unaudited interim Consolidated Financial Statements should be read in conjunction with our Annual Report on Form 10-K for the year ended December 31, 2019,2020, filed with the SEC on March 2, 2020.1, 2021. Certain prior period amounts in the notes to our Consolidated Financial Statements have been reclassified to conform to the 20202021 presentation.
New accounting pronouncementspronouncement adopted in 20202021
ASU 2016-13 “Measurement of Credit Losses on Financial Instruments”2019-12 “Simplifying the Accounting for Income Taxes”
Effective January 1, 2020,2021, we adopted on a modified retrospective basisASU 2019-12, “Simplifying the Accounting Standards Update (or, “ASU”) 2016-13, “Measurement of Credit Losses on Financial Instruments,for Income Taxes,” issued by the Financial Accounting Standards Board (or, the “FASB”) in 20162019, which removes the specific exceptions to the general principles in ASC 740, “Income Taxes,” and amended in 2018 by ASU 2018-19, “Codification Improvements to Topic 326, Financial Instruments – Credit Losses,” which introduces the current expected credit losses model in the estimation of credit losses on financial instruments. The adoption of this new accounting guidance did not impact the opening deficit balance as of January 1, 2020. As a resultclarifies certain aspects of the adoption of ASU 2016-13, our accounts receivable accounting policy was updated as follows:
Accounting pronouncement not yet adopted as of June 30, 2020March 31, 2021
ASU 2020-04 “Reference Rate Reform”
In March 2020, the FASB issued ASU 2020-04, “Reference Rate Reform,” amended in January by ASU 2021-01, “Reference Rate Reform - Scope,” which provides optional guidance for a limited period of time to ease the potential burden in accounting for (or recognizing the effects of) reference rate reform on financial reporting. This update provides optional expedients and exceptions for applying GAAP to contracts, hedging relationships, and other transactions that reference the London Interbank Offered Rate or another reference rate expected to be discontinued because of reference rate reform. This update is effective as of March 12, 2020, through December 31, 2022. We are currently evaluating this accounting guidance and have not elected an adoption date. We do not expect this accounting guidance to materially impact our results of operations or financial position.
Note 2. Other (Expense) Income, Net
Other (expense) income, net for the three months ended March 31, 2021 and 2020, was comprised of the following:
| Three Months Ended March 31, | |||||||||||||||||||||||||||||||||||||||||
| (Unaudited, in millions) | 2021 | 2020 | |||||||||||||||||||||||||||||||||||||||
| Foreign exchange (loss) gain | $ | (5) | $ | 23 | |||||||||||||||||||||||||||||||||||||
(Loss) gain on commodity contracts (1) | (37) | 4 | |||||||||||||||||||||||||||||||||||||||
| Miscellaneous (expense) income | (3) | 1 | |||||||||||||||||||||||||||||||||||||||
| $ | (45) | $ | 28 | ||||||||||||||||||||||||||||||||||||||
(1) Principally related to lumber futures contracts, of which a $14 million loss was unrealized for the three months ended March 31, 2021.
6
RESOLUTE FOREST PRODUCTS INC.
Notes to Unaudited Interim Consolidated Financial Statements
| (Unaudited, in millions) | |||
Current assets (1) | $ | 19 | |
Fixed assets (2) | 114 | ||
Amortizable intangible assets (3) | 21 | ||
| Operating lease right-of-use assets | 2 | ||
Goodwill (4) | 31 | ||
| Total assets acquired and goodwill | $ | 187 | |
| Current liabilities | $ | 11 | |
| Long-term debt, net of current portion | 2 | ||
| Operating lease liabilities, net of current portion | 1 | ||
| Total liabilities assumed | $ | 14 | |
| Net assets acquired | $ | 173 | |
| Fair value of consideration transferred | $ | 173 | |
| Three Months Ended June 30, | Six Months Ended June 30, | ||||||||||||||||
| (Unaudited, in millions) | 2020 | 2019 | 2020 | 2019 | |||||||||||||
| Sales | $ | 612 | $ | 781 | $ | 1,309 | $ | 1,597 | |||||||||
| Net income attributable to Resolute Forest Products Inc. | $ | 6 | $ | 25 | $ | 5 | $ | 67 | |||||||||
| Three Months Ended June 30, | Six Months Ended June 30, | ||||||||||||||||
| (Unaudited, in millions) | 2020 | 2019 | 2020 | 2019 | |||||||||||||
| Foreign exchange (loss) gain | $ | (9 | ) | $ | (6 | ) | $ | 14 | $ | (10 | ) | ||||||
Insurance recovery (1) | 15 | — | 15 | — | |||||||||||||
| Miscellaneous income | 4 | 5 | 9 | 5 | |||||||||||||
| $ | 10 | $ | (1 | ) | $ | 38 | $ | (5 | ) | ||||||||
Note 4.3. Accumulated Other Comprehensive Loss
The change in our accumulated other comprehensive loss by component (net of tax) for the three and six months ended June 30,March 31, 2021 and 2020, and 2019, was as follows:
| (Unaudited, in millions) | Unamortized Prior Service Cost | Unamortized Actuarial Losses | Foreign Currency Translation | Total | ||||||||||||||||||||||||||||||||||
| Balance as of December 31, 2020 | $ | (1) | $ | (1,307) | $ | (6) | $ | (1,314) | ||||||||||||||||||||||||||||||
Other comprehensive income before reclassifications (1) | 0 | 22 | 0 | 22 | ||||||||||||||||||||||||||||||||||
| Amounts reclassified from accumulated other comprehensive loss | (1) | 15 | 0 | 14 | ||||||||||||||||||||||||||||||||||
| Net current period other comprehensive (loss) income | (1) | 37 | 0 | 36 | ||||||||||||||||||||||||||||||||||
| Balance as of March 31, 2021 | $ | (2) | $ | (1,270) | $ | (6) | $ | (1,278) | ||||||||||||||||||||||||||||||
| (Unaudited, in millions) | Unamortized Prior Service Credits | Unamortized Actuarial Losses | Foreign Currency Translation | Total | ||||||||||||
| Balance as of March 31, 2020 | $ | 1 | $ | (1,175 | ) | $ | (7 | ) | $ | (1,181 | ) | |||||
| Amounts reclassified from accumulated other comprehensive loss | (1 | ) | 11 | — | 10 | |||||||||||
| Balance as of June 30, 2020 | $ | — | $ | (1,164 | ) | $ | (7 | ) | $ | (1,171 | ) | |||||
| (Unaudited, in millions) | Unamortized Prior Service Credit | Unamortized Actuarial Losses | Foreign Currency Translation | Total | ||||||||||||||||||||||||||||||||||
| Balance as of December 31, 2019 | $ | 16 | $ | (1,189) | $ | (6) | $ | (1,179) | ||||||||||||||||||||||||||||||
| Other comprehensive loss before reclassifications | 0 | 0 | (1) | (1) | ||||||||||||||||||||||||||||||||||
| Amounts reclassified from accumulated other comprehensive loss | (15) | 14 | 0 | (1) | ||||||||||||||||||||||||||||||||||
| Net current period other comprehensive (loss) income | (15) | 14 | (1) | (2) | ||||||||||||||||||||||||||||||||||
| Balance as of March 31, 2020 | $ | 1 | $ | (1,175) | $ | (7) | $ | (1,181) | ||||||||||||||||||||||||||||||
| (Unaudited, in millions) | Unamortized Prior Service Credits | Unamortized Actuarial Losses | Foreign Currency Translation | Total | ||||||||||||
| Balance as of December 31, 2019 | $ | 16 | $ | (1,189 | ) | $ | (6 | ) | $ | (1,179 | ) | |||||
| Other comprehensive loss before reclassifications | — | — | (1 | ) | (1 | ) | ||||||||||
| Amounts reclassified from accumulated other comprehensive loss | (16 | ) | 25 | — | 9 | |||||||||||
| Net current period other comprehensive (loss) income | (16 | ) | 25 | (1 | ) | 8 | ||||||||||
| Balance as of June 30, 2020 | $ | — | $ | (1,164 | ) | $ | (7 | ) | $ | (1,171 | ) | |||||
| Three Months Ended March 31, | |||||||||||||||||||||||||||||||||||||||||
| (Unaudited, in millions) | 2021 | 2020 | Affected Line in the Consolidated Statements of Operations | ||||||||||||||||||||||||||||||||||||||
| Unamortized Prior Service Costs or Credits | |||||||||||||||||||||||||||||||||||||||||
| Amortization of prior service costs or credits | $ | 0 | $ | (1) | Non-operating pension and other postretirement benefit credits (1) | ||||||||||||||||||||||||||||||||||||
| Curtailment gain | (1) | (14) | Non-operating pension and other postretirement benefit credits (1) | ||||||||||||||||||||||||||||||||||||||
| 0 | 0 | Income tax provision | |||||||||||||||||||||||||||||||||||||||
| Net of tax | (1) | (15) | |||||||||||||||||||||||||||||||||||||||
| Unamortized Actuarial Losses | |||||||||||||||||||||||||||||||||||||||||
| Amortization of actuarial losses | 19 | 14 | Non-operating pension and other postretirement benefit credits (1) | ||||||||||||||||||||||||||||||||||||||
| Other items | 0 | 3 | |||||||||||||||||||||||||||||||||||||||
| (4) | (3) | Income tax provision | |||||||||||||||||||||||||||||||||||||||
| Net of tax | 15 | 14 | |||||||||||||||||||||||||||||||||||||||
| Total Reclassifications | $ | 14 | $ | (1) | |||||||||||||||||||||||||||||||||||||
7
| (Unaudited, in millions) | Unamortized Prior Service Credits | Unamortized Actuarial Losses | Foreign Currency Translation | Total | ||||||||||||
| Balance as of March 31, 2019 | $ | 25 | $ | (965 | ) | $ | (7 | ) | $ | (947 | ) | |||||
| Other comprehensive loss before reclassifications | — | (3 | ) | — | (3 | ) | ||||||||||
| Amounts reclassified from accumulated other comprehensive loss | (4 | ) | 6 | — | 2 | |||||||||||
| Net current period other comprehensive (loss) income | (4 | ) | 3 | — | (1 | ) | ||||||||||
| Balance as of June 30, 2019 | $ | 21 | $ | (962 | ) | $ | (7 | ) | $ | (948 | ) | |||||
| (Unaudited, in millions) | Unamortized Prior Service Credits | Unamortized Actuarial Losses | Foreign Currency Translation | Total | ||||||||||||
| Balance as of December 31, 2018 | $ | 28 | $ | (971 | ) | $ | (7 | ) | $ | (950 | ) | |||||
| Other comprehensive loss before reclassifications | — | (3 | ) | — | (3 | ) | ||||||||||
| Amounts reclassified from accumulated other comprehensive loss | (7 | ) | 12 | — | 5 | |||||||||||
| Net current period other comprehensive (loss) income | (7 | ) | 9 | — | 2 | |||||||||||
| Balance as of June 30, 2019 | $ | 21 | $ | (962 | ) | $ | (7 | ) | $ | (948 | ) | |||||
RESOLUTE FOREST PRODUCTS INC.
Notes to Unaudited Interim Consolidated Financial Statements
| Three Months Ended June 30, | Six Months Ended June 30, | ||||||||||||||||
| (Unaudited, in millions) | 2020 | 2019 | 2020 | 2019 | Affected Line in the Consolidated Statements of Operations | ||||||||||||
| Unamortized Prior Service Credits | |||||||||||||||||
| Amortization of prior service credits | $ | (1 | ) | $ | (3 | ) | $ | (2 | ) | $ | (6 | ) | Non-operating pension and other postretirement benefit credits (1) | ||||
| Other items | — | (1 | ) | (14 | ) | (1 | ) | ||||||||||
| — | — | — | — | Income tax provision | |||||||||||||
| Net of tax | (1 | ) | (4 | ) | (16 | ) | (7 | ) | |||||||||
| Unamortized Actuarial Losses | |||||||||||||||||
| Amortization of actuarial losses | 15 | 7 | 29 | 15 | Non-operating pension and other postretirement benefit credits (1) | ||||||||||||
| Other items | — | — | 3 | — | |||||||||||||
| (4 | ) | (1 | ) | (7 | ) | (3 | ) | Income tax provision | |||||||||
| Net of tax | 11 | 6 | 25 | 12 | |||||||||||||
| Total Reclassifications | $ | 10 | $ | 2 | $ | 9 | $ | 5 | |||||||||
Note 5.4. Net Income (Loss) Per Share
The reconciliation of the basic and diluted net income (loss) per share for the three and six months ended June 30,March 31, 2021 and 2020, and 2019, was as follows:
| Three Months Ended June 30, | Six Months Ended June 30, | ||||||||||||||||
| (Unaudited, in millions, except per share amounts) | 2020 | 2019 | 2020 | 2019 | |||||||||||||
| Numerator: | |||||||||||||||||
| Net income attributable to Resolute Forest Products Inc. | $ | 6 | $ | 25 | $ | 5 | $ | 67 | |||||||||
| Denominator: | |||||||||||||||||
| Weighted-average number of Resolute Forest Products Inc. common shares outstanding | 88.1 | 92.4 | 88.1 | 92.4 | |||||||||||||
| Dilutive impact of nonvested stock unit awards | 0.1 | 1.2 | 0.1 | 1.4 | |||||||||||||
| Diluted weighted-average number of Resolute Forest Products Inc. common shares outstanding | 88.2 | 93.6 | 88.2 | 93.8 | |||||||||||||
| Net income per share attributable to Resolute Forest Products Inc. common shareholders: | |||||||||||||||||
| Basic | $ | 0.07 | $ | 0.27 | $ | 0.06 | $ | 0.73 | |||||||||
| Diluted | $ | 0.07 | $ | 0.27 | $ | 0.06 | $ | 0.71 | |||||||||
| Three Months Ended March 31, | |||||||||||||||||||||||||||||||||||||||||
| (Unaudited, in millions, except per share amounts) | 2021 | 2020 | |||||||||||||||||||||||||||||||||||||||
| Numerator: | |||||||||||||||||||||||||||||||||||||||||
| Net income (loss) attributable to Resolute Forest Products Inc. | $ | 87 | $ | (1) | |||||||||||||||||||||||||||||||||||||
| Denominator: | |||||||||||||||||||||||||||||||||||||||||
| Weighted-average number of Resolute Forest Products Inc. common shares outstanding | 81.2 | 88.1 | |||||||||||||||||||||||||||||||||||||||
| Dilutive impact of nonvested stock unit awards | 0.7 | 0 | |||||||||||||||||||||||||||||||||||||||
| Diluted weighted-average number of Resolute Forest Products Inc. common shares outstanding | 81.9 | 88.1 | |||||||||||||||||||||||||||||||||||||||
Net income (loss) per share attributable to Resolute Forest Products Inc. common shareholders: | |||||||||||||||||||||||||||||||||||||||||
| Basic | $ | 1.07 | $ | (0.01) | |||||||||||||||||||||||||||||||||||||
| Diluted | $ | 1.06 | $ | (0.01) | |||||||||||||||||||||||||||||||||||||
The weighted-average number of outstanding stock options and nonvested equity-classified restricted stock units, deferred stock units and performance stock units (collectively, “stock unit awards”) that were excluded from the calculation of diluted net income (loss) per share, as their impact would have been antidilutive, for the three and six months ended June 30,March 31, 2021 and 2020, and 2019, was as follows:
| Three Months Ended June 30, | Six Months Ended June 30, | ||||||||||||
| (Unaudited, in millions) | 2020 | 2019 | 2020 | 2019 | |||||||||
| Stock options | 0.9 | 1.0 | 0.9 | 1.0 | |||||||||
| Stock unit awards | 0.9 | — | 0.9 | — | |||||||||
| Three Months Ended March 31, | |||||||||||||||||||||||||||||
| (Unaudited, in millions) | 2021 | 2020 | |||||||||||||||||||||||||||
| Stock options | 0.8 | 1.0 | |||||||||||||||||||||||||||
| Stock unit awards | 0 | 1.5 | |||||||||||||||||||||||||||
Note 6.5. Inventories, Net
Inventories, net as of June 30, 2020March 31, 2021 and December 31, 2019,2020, were comprised of the following:
| (Unaudited, in millions) | March 31, 2021 | December 31, 2020 | ||||||||||||||||||
| Raw materials | $ | 157 | $ | 132 | ||||||||||||||||
| Work in process | 53 | 46 | ||||||||||||||||||
| Finished goods | 137 | 120 | ||||||||||||||||||
| Mill stores and other supplies | 165 | 164 | ||||||||||||||||||
| $ | 512 | $ | 462 | |||||||||||||||||
Note 6. Other Assets
Other assets include countervailing and anti-dumping duty cash deposits on softwood lumber of $224 million and $51 million, respectively, as of March 31, 2021, and of $194 million and $49 million, respectively, as of December 31, 2020. See Note 11, “Commitments and Contingencies” for more information.
| (Unaudited, in millions) | June 30, 2020 | December 31, 2019 | ||||||
| Raw materials | $ | 107 | $ | 128 | ||||
| Work in process | 52 | 46 | ||||||
| Finished goods | 155 | 164 | ||||||
| Mill stores and other supplies | 192 | 184 | ||||||
| $ | 506 | $ | 522 | |||||
8
RESOLUTE FOREST PRODUCTS INC.
Notes to Unaudited Interim Consolidated Financial Statements
Note 7. Accounts Payable and Accrued LiabilitiesOther
Accounts payable and accrued liabilitiesother as of June 30, 2020March 31, 2021 and December 31, 2019,2020, were comprised of the following:
| (Unaudited, in millions) | March 31, 2021 | December 31, 2020 | ||||||||||||||||||
| Trade accounts payable | $ | 275 | $ | 251 | ||||||||||||||||
| Accrued compensation | 63 | 76 | ||||||||||||||||||
| Accrued interest | 3 | 4 | ||||||||||||||||||
| Pension and other postretirement benefit obligations | 15 | 14 | ||||||||||||||||||
| Income and other taxes payable | 3 | 5 | ||||||||||||||||||
Derivative financial instruments (1) | 14 | 0 | ||||||||||||||||||
| Other | 25 | 19 | ||||||||||||||||||
| $ | 398 | $ | 369 | |||||||||||||||||
| (Unaudited, in millions) | June 30, 2020 | December 31, 2019 | ||||||
| Trade accounts payable | $ | 226 | $ | 255 | ||||
| Accrued compensation | 42 | 52 | ||||||
| Accrued interest | 4 | 3 | ||||||
| Pension and other postretirement benefit obligations | 14 | 15 | ||||||
| Income and other taxes payable | 4 | 4 | ||||||
| Other | 10 | 13 | ||||||
| $ | 300 | $ | 342 | |||||
Note 8. Long-Term Debt
Overview
Long-term debt, including current portion, as of June 30, 2020March 31, 2021 and December 31, 2019,2020, was comprised of the following:
| (Unaudited, in millions) | March 31, 2021 | December 31, 2020 | ||||||||||||||||||
| 4.875% senior unsecured notes due 2026: | ||||||||||||||||||||
| Principal amount | $ | 300 | $ | 0 | ||||||||||||||||
| Deferred financing costs | (6) | 0 | ||||||||||||||||||
| Total 4.875% senior unsecured notes due 2026 | 294 | 0 | ||||||||||||||||||
| 5.875% senior unsecured notes due 2023: | ||||||||||||||||||||
| Principal amount | 0 | 375 | ||||||||||||||||||
| Deferred financing costs | 0 | (2) | ||||||||||||||||||
| Unamortized discount | 0 | (1) | ||||||||||||||||||
| Total 5.875% senior unsecured notes due 2023 | 0 | 372 | ||||||||||||||||||
| Senior secured credit facility - Term loans due 2030 | 180 | 180 | ||||||||||||||||||
| Finance lease obligations | 8 | 9 | ||||||||||||||||||
| Total debt | 482 | 561 | ||||||||||||||||||
| Less: Current portion of finance lease obligations | (2) | (2) | ||||||||||||||||||
| Long-term debt, net of current portion | $ | 480 | $ | 559 | ||||||||||||||||
Senior Unsecured Notes
2026 Notes
On February 2, 2021, we issued $300 million aggregate principal amount of 4.875% senior unsecured notes due 2026 (or, the “2026 Notes”) at an issue price of 100%, pursuant to an indenture as of that date (or, the “indenture”). Upon their issuance, the 2026 Notes were recorded at their fair value of $300 million. Interest on the 2026 Notes is payable semi-annually on March 1 and September 1 of each year, beginning on September 1, 2021, until their maturity date of March 1, 2026. In connection with the issuance of the 2026 Notes, we incurred financing costs of $6 million, which were deferred and recorded as a reduction of the principal. Deferred financing costs are amortized to “Interest expense” in our Consolidated Statements of Operations using the interest method over the term of the notes.
| (Unaudited, in millions) | June 30, 2020 | December 31, 2019 | ||||||
| 5.875% senior unsecured notes due 2023: | ||||||||
| Principal amount | $ | 375 | $ | 375 | ||||
| Deferred financing costs | (2 | ) | (3 | ) | ||||
| Unamortized discount | (1 | ) | (1 | ) | ||||
| Total 5.875% senior unsecured notes due 2023 | 372 | 371 | ||||||
| Term loans due 2030 | 180 | — | ||||||
| Borrowings under revolving credit facilities | 69 | 71 | ||||||
| Finance lease obligations | 9 | 7 | ||||||
| Total debt | 630 | 449 | ||||||
| Less: Current portion of finance lease obligations | (2 | ) | (1 | ) | ||||
| Long-term debt, net of current portion | $ | 628 | $ | 448 | ||||
9
RESOLUTE FOREST PRODUCTS INC.
Notes to Unaudited Interim Consolidated Financial Statements
The 2026 Notes are guaranteed by current and future wholly-owned U.S. subsidiaries that guarantee the ABL Credit Facility and the Senior Secured Credit Facility (each, as defined and discussed below). The notes are unsecured and effectively junior to indebtedness under each of the ABL Credit Facility, the Senior Secured Credit Facility, the Loan Facility and future secured indebtedness to the extent of the value of the collateral that secures such indebtedness. In addition, the notes are structurally subordinated to all existing and future indebtedness (including the Loan Facility) and other liabilities of our subsidiaries that do not guarantee the notes, including all our non-U.S. subsidiaries.
The terms of the indenture impose certain restrictions, subject to a number of exceptions and qualifications, including limits on our ability to: incur additional indebtedness or issue certain preferred shares; make dividend payments on or make other distributions in respect of our capital stock or make other restricted payments; make certain investments; sell certain assets; create liens on assets; consolidate, merge, sell or otherwise dispose of all or substantially all of our assets; and enter into certain transactions with our affiliates.
In the event of specified change of control triggering events, we shall be required to offer to repurchase the 2026 Notes at 101% of the principal amount, plus accrued and unpaid interest.
On or after March 1, 2023, we may redeem the notes at our option, in whole at any time or in part from time to time, at redemption prices equal to a percentage of the principal amount plus accrued and unpaid interest, as follows:
| Year (beginning March 1) | Redemption Price | ||||
| 2023 | 102.438 | % | |||
| 2024 | 101.219 | % | |||
| 2025 and thereafter | 100.000 | % | |||
The fair value of the 2026 Notes (Level 1) was $301 million as of March 31, 2021.
2023 Notes
We issued $600 million in aggregate principal amount of 5.875% senior unsecured notes due 2023 (or, the “2023 Notes”) on May 8, 2013. Upon their issuance, the 2023 Notes were recorded at their fair value of $594 million, which reflected a discount of $6 million that iswas being amortized to “Interest expense” in our Consolidated Statements of Operations using the interest method over the term of the 2023 Notes, resulting in an effective interest rate of 6%. Interest on the 2023 Notes iswas payable semi-annually beginning November 15, 2013, until their maturity date of May 15, 2023.2013. In connection with the issuance of the 2023 Notes, we incurred financing costs of $9 million, which were deferred and recorded as a reduction of the 2023 Notes. Deferred financing costs arewere amortized to “Interest expense” in our Consolidated Statements of Operations using the interest method over the term of the 2023 Notes.
On January 3, 2019, we repurchased $225 million in aggregate principal amount of the 2023 Notes, pursuant to a notes purchase agreement entered into on December 21, 2018, with certain noteholders, at a purchase price equal to 100% of the principal amount thereof, plus accrued and unpaid interest.
On February 2, 2021, we placed the net proceeds from the issuance of the 2026 Notes together with additional cash, into trust for the benefit of the holders of the 2023 Notes to redeem all of the $375 million aggregate principal amount of the 2023 Notes (or, the “Redemption”) at a price of 100% of the aggregate principal amount thereof, plus accrued and unpaid interest to, but not including, the redemption date. The Redemption occurred on February 18, 2021. As a result of the repurchase, we recorded a net loss on extinguishment of debt of $3 million in “Other (expense) income, (expense), net” in our Consolidated Statement of Operations for the sixthree months ended June 30, 2019.March 31, 2021.
The fair value of the 2023 Notes (Level 1) was $341 million and $380$375 million as of June 30, 2020 and December 31, 2019, respectively.
Senior Secured Credit Facility
On September 7, 2016, we entered into a senior secured credit facility for up to $185 million. This senior secured credit facility provided a term loan of $46 million with a maturity date of September 7, 2025, and a revolving credit facility of up to $139 million with a maturity date of September 7, 2022. On October 28, 2019, we entered into an amended and restated senior secured credit facility (or, the “Senior Secured Credit Facility”) for up to $360 million, replacing our existing $185 million senior secured credit facility. The Senior Secured Credit Facility providesprovided a term loan facility of up to $180 million with a delayed draw period of up to three years, and the choice of maturities of six to 10ten years from the date of drawing (or, the “Term Loan Facility”), and a six-year revolving credit facility of up to $180 million with a maturity date of October 28, 2025 (or, the
10
RESOLUTE FOREST PRODUCTS INC.
Notes to Unaudited Interim Consolidated Financial Statements
“Revolving Credit Facility”). On October 28, 2019, we repaid our $46 million term loan by borrowing under the Revolving Credit Facility. In March 2020, we borrowed $180 million in term loans under the Term Loan Facility for ten years, maturing in March 2030. There is also an uncommitted option to increase the Senior Secured Credit Facility by up to an additional $360 million, subject to certain terms and conditions. On October 28, 2019, we repaid our $46 million term loan by borrowingThe obligations under the RevolvingSenior Secured Credit Facility.Facility are guaranteed by certain of our material U.S. subsidiaries.
On April 19, 2021, we entered into a first amendment to the amended and restated Senior Secured Credit Facility. For more information, see Note 14, “Subsequent Event,” to our consolidated Financial Statements.
ABL Credit Facility
On May 14, 2019, we entered into an amended senior secured asset-based revolving credit facility (or, the “ABL Credit Facility”) with an aggregate lender commitment of up to $500 million at any time outstanding, subject to borrowing base availability based on specified advance rates, eligibility criteria and customary reserves. The amended credit agreement provides for an extension of the maturity date to May 14, 2024.
Effective January 21, 2021, we reduced the commitment under the Canadian tranche of our senior secured asset-based revolving credit facility by $50 million, to $250 million, resulting in an aggregate commitment of $450 million, subject to borrowing base limitations. The obligations under the ABL Credit Facility are guaranteed by certain of our material subsidiaries.
As of June 30, 2020,March 31, 2021, we had $241$293 million of availability under the ABL Credit Facility, net of $17 million of borrowings and $48which was undrawn except for $67 million of ordinary course letters of credit outstanding. The fair value
Loan Facility
On November 4, 2020, our Canadian subsidiary, Resolute FP Canada Inc., entered into a secured delayed draw term loan facility (or, the “Loan Facility”) with Investissement Québec as lender for up to C$220 million ($175 million as of March 31, 2021), subject to borrowing base availability based on 75% of the ABL Credit Facility (Level 2) approximatedcountervailing and anti-dumping duty deposits imposed by the U.S. Department of Commerce and collected by Customs and Border Protection Agency on U.S. imports of applicable softwood lumber products produced at sawmills of the Borrower and its carrying value asaffiliates located in the province of both June 30, 2020 andQuebec, Canada from April 28, 2017 to December 31, 2019.2022. The Loan Facility will bear interest at a floating rate equal to 1.45% above the one month Canadian banker’s acceptance rate. The principal shall be repayable in monthly installments over a period of eight years after an interest only period of two years from the date of the first draw. The Loan Facility is subject to prepayment requirements under certain conditions and may be repaid earlier without premium or penalty, but subject to prepayment of accrued and unpaid interest. The Loan Facility provides for a maximum of 10 draws and the fulfillment of certain conditions upon each draw. Borrowings are subject to certain restrictions.
11
RESOLUTE FOREST PRODUCTS INC.
Notes to Unaudited Interim Consolidated Financial Statements
Note 9. Employee Benefit Plans
Pension and other postretirement benefit plans
The components of net periodic benefit cost (credit)costs (credits) relating to our pension and OPEB plans for the three and six months ended June 30,March 31, 2021 and 2020, and 2019, were as follows:
Pension Plans:
| Three Months Ended June 30, | Six Months Ended June 30, | Three Months Ended March 31, | ||||||||||||||||||||||||||||||||||||||||||||||||||||||||
| (Unaudited, in millions) | 2020 | 2019 | 2020 | 2019 | (Unaudited, in millions) | 2021 | 2020 | |||||||||||||||||||||||||||||||||||||||||||||||||||
| Interest cost | $ | 36 | $ | 45 | $ | 74 | $ | 90 | Interest cost | $ | 33 | $ | 38 | |||||||||||||||||||||||||||||||||||||||||||||
| Expected return on plan assets | (55 | ) | (61 | ) | (111 | ) | (124 | ) | Expected return on plan assets | (54) | (56) | |||||||||||||||||||||||||||||||||||||||||||||||
| Amortization of actuarial losses | 17 | 9 | 32 | 18 | Amortization of actuarial losses | 21 | 15 | |||||||||||||||||||||||||||||||||||||||||||||||||||
| Amortization of prior service credits | — | (1 | ) | — | (1 | ) | ||||||||||||||||||||||||||||||||||||||||||||||||||||
| Non-operating pension credits | (2 | ) | (8 | ) | (5 | ) | (17 | ) | Non-operating pension credits | 0 | (3) | |||||||||||||||||||||||||||||||||||||||||||||||
| Service cost | 3 | 3 | 7 | 7 | Service cost | 4 | 4 | |||||||||||||||||||||||||||||||||||||||||||||||||||
| Net periodic benefit costs (credits) before special events | 1 | (5 | ) | 2 | (10 | ) | ||||||||||||||||||||||||||||||||||||||||||||||||||||
| Other (gains) losses | — | (1 | ) | 3 | (1 | ) | ||||||||||||||||||||||||||||||||||||||||||||||||||||
| Net periodic benefit costs before special events | Net periodic benefit costs before special events | 4 | 1 | |||||||||||||||||||||||||||||||||||||||||||||||||||||||
| Other (gain) loss | Other (gain) loss | (1) | 3 | |||||||||||||||||||||||||||||||||||||||||||||||||||||||
| $ | 1 | $ | (6 | ) | $ | 5 | $ | (11 | ) | $ | 3 | $ | 4 | |||||||||||||||||||||||||||||||||||||||||||||
OPEB Plans:
| Three Months Ended June 30, | Six Months Ended June 30, | ||||||||||||||||
| (Unaudited, in millions) | 2020 | 2019 | 2020 | 2019 | |||||||||||||
| Interest cost | $ | 1 | $ | 1 | $ | 2 | $ | 2 | |||||||||
| Amortization of actuarial gains | (2 | ) | (2 | ) | (3 | ) | (3 | ) | |||||||||
| Amortization of prior service credits | (1 | ) | (2 | ) | (2 | ) | (5 | ) | |||||||||
| Non-operating other postretirement benefit credits | (2 | ) | (3 | ) | (3 | ) | (6 | ) | |||||||||
| Service cost | 1 | — | 1 | — | |||||||||||||
| Net periodic benefit credits before special events | (1 | ) | (3 | ) | (2 | ) | (6 | ) | |||||||||
| Curtailment gain | — | — | (14 | ) | — | ||||||||||||
| $ | (1 | ) | $ | (3 | ) | $ | (16 | ) | $ | (6 | ) | ||||||
| Three Months Ended March 31, | |||||||||||||||||||||||||||||||||||||||||
| (Unaudited, in millions) | 2021 | 2020 | |||||||||||||||||||||||||||||||||||||||
| Interest cost | $ | 1 | $ | 1 | |||||||||||||||||||||||||||||||||||||
| Amortization of actuarial gains | (2) | (1) | |||||||||||||||||||||||||||||||||||||||
| Amortization of prior service credits | 0 | (1) | |||||||||||||||||||||||||||||||||||||||
| Non-operating other postretirement benefit credits | (1) | (1) | |||||||||||||||||||||||||||||||||||||||
| Service cost | 0 | 0 | |||||||||||||||||||||||||||||||||||||||
| Net periodic benefit credits before special events | (1) | (1) | |||||||||||||||||||||||||||||||||||||||
| Curtailment gain | 0 | (14) | |||||||||||||||||||||||||||||||||||||||
| $ | (1) | $ | (15) | ||||||||||||||||||||||||||||||||||||||
Defined contribution plans
Our expense for the defined contribution plans totaled $5 million and $4 million for both the three months ended June 30,March 31, 2021 and 2020, and 2019, and $8 million and $9 millionrespectively.
U.S. pension funding
The recently passed American Rescue Plan Act of 2021 includes provisions that allow for interest rate smoothing of pension funding deficits to minimize the six months ended June 30, 2020 and 2019, respectively.
12
RESOLUTE FOREST PRODUCTS INC.
Notes to Unaudited Interim Consolidated Financial Statements
Note 10. Income Taxes
The income tax provision attributable to income before income taxes differs from the amounts computed by applying the U.S. federal statutory income tax rate of 21% for the three and six months ended June 30,March 31, 2021 and 2020, and 2019, as a result of the following:
| Three Months Ended June 30, | Six Months Ended June 30, | ||||||||||||||||
| (Unaudited, in millions) | 2020 | 2019 | 2020 | 2019 | |||||||||||||
| Income before income taxes | $ | 11 | $ | 44 | $ | 37 | $ | 107 | |||||||||
| Income tax provision: | |||||||||||||||||
| Expected income tax provision | (3 | ) | (9 | ) | (8 | ) | (22 | ) | |||||||||
| Changes resulting from: | |||||||||||||||||
Valuation allowance (1) | (7 | ) | (4 | ) | (16 | ) | (11 | ) | |||||||||
| Foreign exchange | 2 | 1 | (10 | ) | 4 | ||||||||||||
U.S. tax on non-U.S. earnings (2) | — | (5 | ) | — | (5 | ) | |||||||||||
| State income taxes, net of federal income tax benefit | — | 1 | 2 | 2 | |||||||||||||
| Foreign tax rate differences | (2 | ) | (4 | ) | (5 | ) | (9 | ) | |||||||||
Other, net (3) | 5 | 1 | 5 | 1 | |||||||||||||
| $ | (5 | ) | $ | (19 | ) | $ | (32 | ) | $ | (40 | ) | ||||||
| Three Months Ended March 31, | |||||||||||||||||||||||||||||||||||||||||
| (Unaudited, in millions) | 2021 | 2020 | |||||||||||||||||||||||||||||||||||||||
| Income before income taxes | $ | 128 | $ | 26 | |||||||||||||||||||||||||||||||||||||
| Income tax provision: | |||||||||||||||||||||||||||||||||||||||||
| Expected income tax provision | (27) | (5) | |||||||||||||||||||||||||||||||||||||||
| Changes resulting from: | |||||||||||||||||||||||||||||||||||||||||
| Valuation allowance on our U.S. operations | 8 | (9) | |||||||||||||||||||||||||||||||||||||||
| Foreign exchange | 2 | (12) | |||||||||||||||||||||||||||||||||||||||
| U.S. tax on non-U.S. earnings | (18) | — | |||||||||||||||||||||||||||||||||||||||
| State income taxes, net of federal income tax benefit | 2 | 2 | |||||||||||||||||||||||||||||||||||||||
| Foreign tax rate differences | (8) | (3) | |||||||||||||||||||||||||||||||||||||||
| Other, net | 1 | 0 | |||||||||||||||||||||||||||||||||||||||
| $ | (40) | $ | (27) | ||||||||||||||||||||||||||||||||||||||
Note 11. Commitments and Contingencies
Legal matters
We become involved in various legal proceedings, claims and governmental inquiries, investigations, and other disputes in the normal course of business, including matters related to contracts, commercial and trade disputes, taxes, environmental issues, activist damages, employment and workers’ compensation claims, grievances, human rights complaints, pension and benefit plans and obligations, health and safety, product safety and liability, asbestos exposure, financial reporting and disclosure obligations, corporate governance, First NationsIndigenous peoples’ claims, antitrust, governmental regulations, and other matters. Although the final outcome is subject to many variables and cannot be predicted with any degree of certainty, we regularly assess the status of the matters and establish provisions (including legal costs expected to be incurred) when we believe an adverse outcome is probable, and the amount can be reasonably estimated. Except as described below and for claims that cannot be assessed due to their preliminary nature, we believe that the ultimate disposition of these matters outstanding or pending as of June 30, 2020,March 31, 2021, will not have a material adverse effect on our Consolidated Financial Statements.
Asbestos-related lawsuits
We are involved in a number of asbestos-related lawsuits filed primarily in U.S. state courts, including certain cases involving multiple defendants. These lawsuits principally allege direct or indirect personal injury or death resulting from exposure to asbestos-containing premises. While we dispute the plaintiffs’ allegations and intend to vigorously defend these claims, the ultimate resolution of these matters cannot be determined at this time. These lawsuits frequently involve claims for unspecified compensatory and punitive damages, and we are unable to reasonably estimate a range of possible losses. However, unfavorable rulings, judgments or settlement terms could materially impact our Consolidated Financial Statements. Hearings for certain of these matters are scheduled to occur in the next twelve months.2021.
Countervailing duty and anti-dumping investigations on softwood lumber
On November 25, 2016, countervailing duty and anti-dumping petitions were filed with the U.S. Department of Commerce (or, “Commerce”) and the U.S. International Trade Commission (or, “ITC”) by certain U.S. softwood lumber products producers and forest landowners, requesting that the U.S. government impose countervailing and anti-dumping duties on Canadian-origin softwood lumber products exported to the U.S. One of our subsidiaries was identified in the petitions as being a Canadian exporting producer of softwood lumber products to the U.S. and was selected as a mandatory respondent to be investigated by Commerce in both the countervailing duty and anti-dumping investigations.
On April 24, 2017, Commerce announced its preliminary determination in the countervailing duty investigation and, as a result, after April 28, 2017, we were required to pay cash deposits to the U.S. Customs and Border Protection agency (or, “U.S.
13
RESOLUTE FOREST PRODUCTS INC.
Notes to Unaudited Interim Consolidated Financial Statements
Customs”) at a rate of 12.82% for estimated countervailing duties on the vast majority of our U.S. imports of softwood lumber products produced at our Canadian sawmills. The preliminary rate remained in effect until August 26, 2017. Commerce changed the rate in its final affirmative determination on November 2, 2017, but the new rate did not take effect until December 28, 2017, following the ITC’s final affirmative determination and the publication by Commerce of a countervailing duty order. Since that date,Until November 30, 2020, we have been required to resume paying cash deposits to U.S. Customs at a rate of 14.70% for the vast majority of our U.S. imports of Canadian-produced softwood lumber products. On December 1, 2020, Commerce issued its final results in the countervailing duties first administrative review and established our new rate at 19.10% for countervailing duties. This rate will apply until Commerce sets a new duty rate in ansubsequent administrative review,reviews, or a new rate may be set through a remand determination by a binational panel formed pursuant to the North American Free Trade Agreement binational panelor United States-Mexico-Canada Agreement, as the case may be (or, “Panel”) on appeal. Through June 30, 2020, ourDuring the three months ended March 31, 2021, we made additional cash deposits totaled $154of $30 million, and, based on the 14.70% rate andbringing our current operating parameters, could be as high as $50 million per year. Commerce issued on January 31, 2020, its preliminary results in the countervailing duties administrative review, and on May 15, 2020, and July 10, 2020, post-preliminary results establishing our new preliminary rates at 17.57% for the period of review from April 28, 2017,total to December 31, 2017, and at 17.11% for the period of review from January 1, 2018, to December 31, 2018, which are not yet effective. The new rate to be established in the final results for the period of review from January 1, 2018, to December 31, 2018, will be used as the basis for cash deposits to U.S. Customs from the publication of the final results.$224 million.
On June 26, 2017, Commerce announced its preliminary determination in the anti-dumping investigation and, as a result, after June 30, 2017, we were required to pay cash deposits to U.S. Customs at a rate of 4.59% for estimated anti-dumping duties on the vast majority of our U.S. imports of softwood lumber products produced at our Canadian sawmills. On November 2, 2017, Commerce announced its final affirmative determination in the anti-dumping investigation and, as a result, sincefrom November 8, 2017 to November 29, 2020, we have been required to pay cash deposits to U.S. Customs, at a rate of 3.20% for the vast majority of our U.S. imports of Canadian-produced softwood lumber products. On November 30, 2020, Commerce issued its final results in the anti-dumping first administrative review and established our new rate at 1.15% for anti-dumping duties. This rate will apply until Commerce sets a duty rate in ansubsequent administrative review,reviews, or a new rate may be set through a remand determination by a Panel on appeal. Through June 30, 2020, ourDuring the three months ended March 31, 2021, we made additional cash deposits totaled $40of $2 million, and,
On April 1, 2019, Commerce published a notice initiating the administrative reviews of the countervailing duty and anti-dumping orders on softwood lumber products from Canada. WeCanada and we were selected as a mandatory respondent in these administrative reviews and we are in the process of responding to Commerce with the information requested.reviews. On March 10, 2020, Commerce published a notice initiating the second administrative review of the countervailing duty and anti-dumping orders on softwood lumber products from Canada. We were selected as a mandatory respondent for the second administrative review of the countervailing duty order and we are acting asin the process of responding to Commerce with the information required. On March 4, 2021, Commerce published a voluntary respondent fornotice initiating the secondthird administrative review of the countervailing duty and anti-dumping orders on softwood lumber products from Canada and we were selected as a mandatory respondent for the third administrative review of the countervailing duty order.
In parallel, on September 4, 2019, a Panel issued an interim decision upholding the affirmative final injury determinations of the ITC in both investigations of softwood lumber products from Canada. The Panel remanded the ITC to reconsider several findings and ordered the ITC to submit its redetermination on remand within 90 days from the date of the Panel interim decision. On December 19, 2019, the ITC issued its redetermination on remand that maintained the affirmative final injury determinations, and on May 22, 2020, the Panel issued its final decision and affirmed in its entirety the ITC’s injury determination on remand. On January 6, 2021, and January 19, 2021, we filed our complaints supporting Panel reviews of the final results in the countervailing and anti-dumping first administrative reviews.
In addition, on August 24, 2020, the World Trade Organization’s (or, “WTO”) dispute panel issued a report (or, the “Panel Report”) in the case brought by the government of Canada in “United States — Countervailing Measures on Softwood Lumber from Canada” (DS533), concluding, among other things, that Commerce acted inconsistently with the Agreement on Subsidies and Countervailing Measures on most of the matters. On September 28, 2020, the United States notified the WTO’s dispute settlement body of its decision to appeal the Panel Report.
We are not presently able to determine the ultimate resolution of these matters, but we believe it is not probable that we will ultimately be assessed with significant duties, if any, on our U.S. imports of Canadian-produced softwood lumber products. Accordingly, 0 contingent loss was recorded in respect of these petitions in our Consolidated Statements of Operations, and our cash deposits were recorded in “Other assets” in our Consolidated Balance Sheets. Cash deposits for the countervailing duty and anti-dumping investigations through December 31, 2019, totaled $128 million and $34 million, respectively.
Fibrek acquisition
Effective July 31, 2012, we completed the final step of the transaction pursuant to which we acquired the remaining 25.4%25.40% of the outstanding Fibrek Inc. (or, “Fibrek”) shares, following the approval of Fibrek’s shareholders on July 23, 2012, and the issuance of a final order by the Quebec Superior Court in Canada (or, “Quebec Superior Court”) approving the arrangement on July 27, 2012. Certain former shareholders of Fibrek exercised rights of dissent in respect of the transaction, asking for a judicial determination of the fair value of their claim under the Canada Business Corporations Act. On September 26, 2019, the Quebec
14
RESOLUTE FOREST PRODUCTS INC.
Notes to Unaudited Interim Consolidated Financial Statements
Superior Court rendered a decision fixing the fair value of the shares of the dissenting shareholders at C$1.99 per share, or C$31 million in aggregate, plus interest and an additional indemnity, for a total then estimated at C$44 million payable in cash. AsWe had previously reported, we had accrued C$14 million for the payment of the dissenting shareholders’ claims andclaims. Following the court decision, we accrued an additional C$30 million following the court decision.($23 million). Of the total amount ofC$44 million, C$19 million ($14 million) was payable immediately and paid on October 2, 2019, bringing the2019. The remaining balance toof C$25 million ($18 million and $1926 million as of June 30, 2020March 31, 2021 and December 31, 2019,2020 ($21 million and $20 million as of March 31, 2021 and December 31, 2020, respectively), which wasincludes accrued interest, is recorded in “Other liabilities” in our Consolidated Balance Sheets as of June 30, 2020 and December 31, 2019.Sheets. We are appealing the decision, therefore the payment of any additional consideration and its timing will depend on the outcome of the appeal. On November 13, 2019, a legal hypothec in the amount of C$30 million was registered on our Saint-Félicien (Quebec) immovable and movable property to secure the payment of any additional amounts following the outcome of the appeal. The hearing in this matter has not yet been scheduled but is expected to occur in 2021.
Partial wind-ups of pension plans
On June 12, 2012, we filed a motion for directives with the Quebec Superior Court, the court with jurisdiction in the creditor protection proceedings under the Companies’ Creditors Arrangement Act (Canada) (or, the “CCAA Creditor Protection Proceedings”), seeking an order to prevent pension regulators in each of Quebec, New Brunswick, and Newfoundland and Labrador from declaring partial wind-ups of pension plans relating to employees of former operations in New Brunswick, and Newfoundland and Labrador, or a declaration that any claim for accelerated reimbursements of deficits arising from a partial wind-up is a barred claim under the CCAA Creditor Protection Proceedings. We contend, among other things, that any such declaration, if issued, would be inconsistent with the Quebec Superior Court’s sanction order confirming the CCAA debtors’ CCAA Plan of Reorganization and Compromise, as amended, and the terms of our emergence from the CCAA Creditor Protection Proceedings. A partial wind-up would likely shorten the period in which any deficit within those plans, which could reach up to C$150 million ($110119 million), would have to be funded if we do not obtain the relief sought. The hearing in this matter has not yet been scheduled but could occur in the next twelve months.2021.
Environmental matters
We are subject to a number of federal or national, state, provincial, and local environmental laws, regulations, and orders in various jurisdictions. We believe our operations are in material compliance with current applicable environmental laws and regulations. Environmental regulations promulgated and orders issued in the future could require substantial additional expenditures for compliance and could have a material impact on us, in particular, and the industry in general.
We may be a “potentially responsible party” with respect to a hazardous waste site that is being addressed pursuant to the Comprehensive Environmental Response, Compensation and Liability Act of 1980 (commonly known as Superfund). We believe we will not be liable for any significant amounts at this site.
We also have asset retirement obligations of $26 million and $25 million recorded as of both June 30, 2020March 31, 2021 and December 31, 2019,2020, respectively, primarily consisting of liabilities associated with landfills, sludge basins and the dismantling of retired assets. These liabilities are included in “Accounts payable and accrued liabilities”other” and “Other liabilities” in our Consolidated Balance Sheets.
Note 12. Share Capital
On March 2, 2020, our board of directors authorized a share repurchase program of up to 15% of our common stock, for an aggregate consideration of up to $100 million. During the three and six months ended June 30, 2020,March 31, 2021, we repurchased 253,8981.7 million shares at a cost of $1$17 million. DuringNaN shares were repurchased during the three and six months ended June 30, 2019, we repurchased 720,000 shares, at a cost of $5 million under our $150 million share repurchase program, which was completed in 2019.
15
RESOLUTE FOREST PRODUCTS INC.
Notes to Unaudited Interim Consolidated Financial Statements
Note 13. Segment Information
We manage our business based on the products we manufacture. Accordingly, our reportable segments correspond to our principal product lines: market pulp, tissue, wood products, and paper. As of the second quarter of 2020, the results from our newsprint and specialty papers operations have been combined to form the paper reportable segment. This better reflects management’s internal analysis, given the diminishing percentage newsprint and specialty papers represent in our product portfolio. Comparative year information has been modified to conform to this revised segment presentation.
None of the income or loss items following “Operating income (loss)” in our Consolidated Statements of Operations are allocated to our segments, since those items are reviewed separately by management. For the same reason, closure costs, impairment and other related charges, gains and losses on disposition of assets, as well as other discretionary charges or credits are not allocated to our segments. We allocate depreciation and amortization expense to our segments, although the related fixed assets and amortizable intangible assets are not allocated to segment assets. Additionally, all selling, general and administrative expenses are allocated to our segments, with the exception of certain discretionary charges and credits, which we present under “corporate and other.”
Information about certain segment data for the three and six months ended June 30,March 31, 2021 and 2020, and 2019, was as follows:
| (Unaudited, in millions) | Market Pulp (1) | Tissue | Wood Products (2) | Paper | Segment Total | Corporate and Other | Total | ||||||||||||||||||||||||||||||||||||||||||||||||||||||||||
| Sales | |||||||||||||||||||||||||||||||||||||||||||||||||||||||||||||||||
| First three months | |||||||||||||||||||||||||||||||||||||||||||||||||||||||||||||||||
| 2021 | $ | 176 | $ | 42 | $ | 430 | $ | 225 | $ | 873 | $ | — | $ | 873 | |||||||||||||||||||||||||||||||||||||||||||||||||||
| 2020 | $ | 177 | $ | 49 | $ | 174 | $ | 289 | $ | 689 | $ | 0 | $ | 689 | |||||||||||||||||||||||||||||||||||||||||||||||||||
| Depreciation and amortization | |||||||||||||||||||||||||||||||||||||||||||||||||||||||||||||||||
| First three months | |||||||||||||||||||||||||||||||||||||||||||||||||||||||||||||||||
| 2021 | $ | 6 | $ | 5 | $ | 11 | $ | 15 | $ | 37 | $ | 4 | $ | 41 | |||||||||||||||||||||||||||||||||||||||||||||||||||
| 2020 | $ | 6 | $ | 4 | $ | 11 | $ | 17 | $ | 38 | $ | 4 | $ | 42 | |||||||||||||||||||||||||||||||||||||||||||||||||||
| Operating income (loss) | |||||||||||||||||||||||||||||||||||||||||||||||||||||||||||||||||
| First three months | |||||||||||||||||||||||||||||||||||||||||||||||||||||||||||||||||
| 2021 | $ | 4 | $ | (2) | $ | 221 | $ | (24) | $ | 199 | $ | (22) | $ | 177 | |||||||||||||||||||||||||||||||||||||||||||||||||||
| 2020 | $ | (3) | $ | 2 | $ | 5 | $ | (3) | $ | 1 | $ | (9) | $ | (8) | |||||||||||||||||||||||||||||||||||||||||||||||||||
(1)Inter-segment sales of $7 million for both the three months ended March 31, 2021 and 2020, which were transacted either at the lowest market price of the previous month or cost, were excluded from market pulp sales.
(2)Wood products sales to our joint ventures, which are transacted at arm’s length negotiated prices, were $13 million and $5 million for the three months ended March 31, 2021 and 2020, respectively.
Note 14. Subsequent Event
(Unaudited, in millions) | Market Pulp (1) | Tissue | Wood Products (2) | Paper | Segment Total | Corporate and Other | Total | |||||||||||||||||||||
| Sales | ||||||||||||||||||||||||||||
| Second quarter | ||||||||||||||||||||||||||||
| 2020 | $ | 161 | $ | 44 | $ | 199 | $ | 208 | $ | 612 | $ | — | $ | 612 | ||||||||||||||
| 2019 | $ | 189 | $ | 43 | $ | 168 | $ | 355 | $ | 755 | $ | — | $ | 755 | ||||||||||||||
| First six months | ||||||||||||||||||||||||||||
| 2020 | $ | 338 | $ | 93 | $ | 373 | $ | 497 | $ | 1,301 | $ | — | $ | 1,301 | ||||||||||||||
| 2019 | $ | 420 | $ | 82 | $ | 329 | $ | 719 | $ | 1,550 | $ | — | $ | 1,550 | ||||||||||||||
| Depreciation and amortization | ||||||||||||||||||||||||||||
| Second quarter | ||||||||||||||||||||||||||||
| 2020 | $ | 6 | $ | 5 | $ | 10 | $ | 16 | $ | 37 | $ | 3 | $ | 40 | ||||||||||||||
| 2019 | $ | 5 | $ | 4 | $ | 9 | $ | 19 | $ | 37 | $ | 5 | $ | 42 | ||||||||||||||
| First six months | ||||||||||||||||||||||||||||
| 2020 | $ | 12 | $ | 9 | $ | 21 | $ | 33 | $ | 75 | $ | 7 | $ | 82 | ||||||||||||||
| 2019 | $ | 10 | $ | 9 | $ | 17 | $ | 36 | $ | 72 | $ | 10 | $ | 82 | ||||||||||||||
| Operating income (loss) | ||||||||||||||||||||||||||||
| Second quarter | ||||||||||||||||||||||||||||
| 2020 | $ | 10 | $ | (2 | ) | $ | 15 | $ | (12 | ) | $ | 11 | $ | (5 | ) | $ | 6 | |||||||||||
| 2019 | $ | 27 | $ | (4 | ) | $ | (3 | ) | $ | 32 | $ | 52 | $ | (12 | ) | $ | 40 | |||||||||||
| First six months | ||||||||||||||||||||||||||||
| 2020 | $ | 7 | $ | — | $ | 20 | $ | (15 | ) | $ | 12 | $ | (14 | ) | $ | (2 | ) | |||||||||||
| 2019 | $ | 69 | $ | (12 | ) | $ | 3 | $ | 75 | $ | 135 | $ | (31 | ) | $ | 104 | ||||||||||||
•On April 19, 2021 (or, the “Effective Date”), we entered into a first amendment to the amended and restated senior secured credit facility (or, the “Senior Secured Credit Facility”) entered into on October 28, 2019. The amount available under the Senior Secured Credit Facility remains unchanged for up to $360 million and is comprised of a term loan facility of up to $180 million with a delayed draw period of up to three years and the choice of maturities of six to ten years from the date of drawing (or, the “Term Loan Facility”); and a six-year revolving credit facility of up to $180 million (or, the “Revolving Credit Facility”). On the Effective Date, we repaid our $180 million of term loans under the pre-amended Senior Secured Credit Facility with a combination of proceeds of borrowings under the Revolving Credit Facility and cash on hand. The amendment then reinstated the full amount of the Term Loan Facility. There is also an uncommitted option to increase the Senior Secured Credit Facility by up to an additional $360 million, subject to certain terms and conditions. |
16
RESOLUTE FOREST PRODUCTS INC.
Notes to Unaudited Interim Consolidated Financial Statements
The obligations under the Senior Secured Credit Facility continue to be guaranteed by certain material U.S. subsidiaries of the Company and remain secured by first priority liens on assets of our Calhoun (Tennessee) facility. Interest rates under the Amended Senior Secured Credit Facility are based, at the Company’s election, on either a floating rate based on the LIBOR, or a base rate, in each case plus a spread over the index. For loans under the Term Loan Facility, the applicable spread ranges from 0.5% to 1.4% for base rate loans, from 1.5% to 2.4% for LIBOR rate loans, and from 1.7% to 2.1% for fixed rate loans. For the Revolving Credit Facility, the applicable spread ranges from 0.5% to 1.0% for base rate loans, and from 1.5% to 2.0% for LIBOR rate loans. The amended credit agreement contains customary covenants, representations and warranties, and events of default.
17
ITEM 2. MANAGEMENT’S DISCUSSION AND ANALYSIS OF FINANCIAL CONDITION AND RESULTS OF OPERATIONS
The following management’s discussion and analysis is intended to help the reader understand Resolute Forest Products, our results of operations, cash flows and financial condition. The discussion is provided as a supplement to, and should be read in conjunction with, our consolidated financial statements and the accompanying notes (or, the “Consolidated Financial Statements”) contained in Item 1, “Financial Statements,” of this Quarterly Report on Form 10-Q (or, “Form 10-Q”).
When we refer to “Resolute Forest Products,” “Resolute,” “we,” “our,” “us” or the “Company,” we mean Resolute Forest Products Inc. with its subsidiaries, either individually or collectively, unless otherwise indicated.
CAUTIONARY STATEMENTS REGARDING FORWARD-LOOKING INFORMATION AND USE OF THIRD-PARTY DATA
Statements in this Form 10-Q that are not reported financial results or other historical information of Resolute Forest Products are “forward-looking statements” within the meaning of the Private Securities Litigation Reform Act of 1995. They include, for example, statements relating to the impact of the novel coronavirus (or, “COVID-19”) pandemic and resulting economic conditions on our business, results of operations and market price of our securities, and to our: efforts and initiatives to reduce costs, increase revenues, and improve profitability; business and operating outlook; future pension obligations; assessment of market conditions; growth strategies and prospects, and the growth potential of the Company and the industry in which we operate; liquidity; future cash flows, including as a result of the changes to our pension funding obligations; estimated capital expenditures; and strategies for achieving our goals generally. Forward-looking statements may be identified by the use of forward-looking terminology such as the words “should,” “would,” “could,” “will,” “may,” “expect,” “believe,” “see,” “anticipate,” “continue,” “attempt,” “project,” “progress,” “build,” “pursue,” “plan,” “grow”“grow,” “allow,” “look” and other terms with similar meaning indicating possible future events or potential impact on our business or Resolute Forest Products’ shareholders.
The reader is cautioned not to place undue reliance on these forward-looking statements, which are not guarantees of future performance. These statements are based on management’s current assumptions, beliefs, and expectations, all of which involve a number of business risks and uncertainties that could cause actual results to differ materially. The potential risks and uncertainties that could cause our actual future financial condition, results of operations, and performance to differ materially from those expressed or implied in this Form 10-Q include, but are not limited to, the impact of: the COVID-19 pandemic on our business and resulting economic conditions; developments in non-print media, including changes in consumer habits, and the effectiveness of our responses to these developments; intense competition in the forest products industry; any inability to offer products certified to globally recognized forestry management and chain of custody standards; any inability to successfully implement our strategies to increase our earnings power; the possible failure to successfully integrate acquired businesses with ours or to realize the anticipated benefits of acquisitions, such as our entry into wood manufacturing in the U.S., and tissue production and sales, or divestitures or other strategic transactions or projects, including loss of synergies following business divestitures; uncertainty or changes in political or economic conditions in the U.S., Canada or other countries in which we sell our products, including the effects of pandemics; global economic conditions; the highly cyclical nature of the forest products industry; any difficulties in obtaining timber or wood fiber at favorable prices, or at all; changes in the cost of purchased energy and other raw materials; physical, financial and financialregulatory risks associated with global, regional, and local weather conditions, and climate change; any disruption in operations or increased labor costs due to labor disputes or occupational health and safety issues; difficulties in our employee relations or in employee attraction or retention; disruptions to our supply chain, operations, or the delivery of our products, including due to public health epidemics; disruptions to our information technology systems including cybersecurity and privacy incidents; risks related to the operation and transition of legacy system applications; negative publicity, even if unjustified; currency fluctuations; any increase in the level of required contributions to our pension plans, including as a result of any increase in the amount by which they are underfunded; our ability to maintain adequate capital resources to provide for all of our substantial capital requirements; the terms of our outstanding indebtedness, which could restrict our current and future operations; changes relating to the London Interbank Offered Rate (or, the “LIBOR”), which could impact our borrowings under our credit facilities; losses that are not covered by insurance; any shutdown of machines or facilities, restructuring of operations or sale of assets resulting in any additional closure costs and long-lived asset or goodwill impairment or accelerated depreciation charges; any need to record additional valuation allowances against our recorded deferred income tax assets; our exports from one country to another country becoming or remaining subject to duties, cash deposit requirements, border taxes, quotas, or other trade remedies or restrictions; countervailing and anti-dumping duties on imports to the U.S. of the vast majority of our softwood lumber products produced at our Canadian sawmills; any failure to comply with laws or regulations generally; any additional environmental or health and safety liabilities; any violation of trade laws, export controls, or other laws relating to our international sales and operations; adverse outcomes of legal proceedings, claims and governmental inquiries, investigations, and other disputes in which we are involved; the actions of holders of a significant percentage of our common stock; and the potential risks and uncertainties set
18
forth under Part I, Item 1A, “Risk Factors,” of our annual report on Form 10-K for the year ended December 31, 2019,2020, filed with the U.S. Securities and Exchange Commission (or, the “SEC”“SEC”) on March 2, 20201, 2021 (or, the
“2019 2020Annual Report”), which have been heightened by the COVID-19 pandemic, including related governmental responses and economic impacts, market disruptions and resulting changes in consumer habits, and which should be read in conjunction with the COVID-19 pandemic risk factor update further set forth in Part II, Item 1A, “Risk Factors,” in this Form 10-Q.habits.
All forward-looking statements in this Form 10-Q are expressly qualified by the cautionary statements contained or referred to in this section and in our other filings with the SEC and the Canadian securities regulatory authorities. We disclaim any obligation to publicly update or revise any forward-looking information, whether as a result of new information, future events or otherwise, except as required by law.
Market and industry data
The information on industry and general economic conditions in this Form 10-Q was derived from third-party sources and trade publications we believe to be widely accepted and accurate. We have not independently verified the information and cannot assure you of its accuracy.
OVERVIEW
Resolute Forest Products is a global leader in the forest products industry with a diverse range of products, including market pulp, tissue, wood products, and paper, which are marketed in close to 70over 50 countries. The Company owns or operates some 40 facilities, as well as power generation assets, in the U.S. and Canada. We produce lumber in the U.S. and Canada, and we are the largest Canadian producer of wood products east of the Canadian Rockies, the largest producer of uncoated mechanical papers in North America, and a competitive pulp producer in North America. We are also a leading global producer of newsprint and an emerging tissue producer. Resolute has third-party certified 100% of its managed woodlands to internationally recognized sustainable forest management standards.
We report our activities in four business segments: market pulp, tissue, wood products, and paper. We believe an integrated approach across these segments maximizes value creation for our Company and stakeholders.
We are guided by our vision and values, focusing on safety, sustainability, profitability, accountability, and teamwork. We believe we can be distinguished by the following competitive strengths:
•Competitive cost structure combined with diversified and integrated asset base
–large-scale and cost-effective operations, including significant internal energy production from cogeneration and hydroelectric facilities, which support our value proposition;
–control over fiber transformation chain from standing timber to end-product for the majority of our offering;
–nearly 100% of our products sourced from high-quality virgin fiber;
–harvesting rights for the majority of fiber needs in Canada; and
–sophisticated logistics capabilities to meet demanding customer expectations.
•Solid balance sheet
–favorable pricing and flexibility under borrowing agreements together with our liquidity levels support our ability to weather challenging market cycles and to execute our transformation strategy;
–significant tax assets to defer cash income taxes and provide synergies to execute this strategy; and
–customers benefit from a financially stable and reliable business partner in a challenging industry.
•Seasoned management team
–culture of accountability, encouraging transparency and straightforwardness; and
–core identity tied to renewable resources we harvest in a truly sustainable manner.
19
Our Business
For information relating to our products, strategy and highlights, sustainable development and performance, and power generation assets, refer to Part II, Item 7, “Management’s Discussion and Analysis of Financial Condition and Results of Operations – Overview – Our Business” in our 20192020 Annual Report.
Impact of the COVID-19 pandemic
We have sustained operations across all of our business segments through the COVID-19 pandemic, but we had to take certain measures in the face of the dramatic reduction in economic activity, particularly for marketing-dependent products like newspapers, inserts, flyers and commercial paper. In particular, we continue to focus on key short-term priorities, including: operating under rigorous protocols aroundDuring the healthquarter, the Company announced the indefinite idling of its Amos and safetyBaie-Comeau (Quebec) paper mills, which were temporarily idled since spring 2020, as a result of our employees, contractorsmarket conditions and suppliers;the impacts of the pandemic, reducing our paper production consistent with the dramatic decrease in economic activity affecting demand; maintaining disciplined liquidity management; monitoring customer credit risk; and controlling spending around selling, general and administrative (or, “run-rate newsprint capacity bSG&A”) expenses and capital expenditures.
On February 1, 2020,2, 2021, we acquired from Conifex Timber Inc.issued $300 million aggregate principal amount of 4.875% senior unsecured notes due 2026 (or, the “2026 Notes”) at an issue price of 100% pursuant to an indenture as of that date. We used the net proceeds of the 2026 Notes, together with cash on hand, to redeem all of the equity securities and membership interests in certainoutstanding $375 million aggregate principal amount of its subsidiaries, the businessour 5.875% senior notes due 2023, at a price of which consists mainly in the operation of three sawmills and related assets in Cross City (Florida) and in Glenwood and El Dorado (Arkansas) (or, the “U.S. Sawmill Business”). The U.S. Sawmill Business acquired produces construction-grade dimensional lumber and decking products from locally-sourced southern yellow pine for distribution within the U.S.
See below under “Liquidity and Capital Resources – Capital Resources” for more information
Amendment to Senior Secured Credit Facility
On April 19, 2021, we amended the Senior Secured Credit Facility agreement in cash, fororder to repay the U.S. Sawmill Business acquired was $173 million.$180 million of pre-amended term loans, extend the maturity date of the revolving credit facility from 2025 to 2027, reduce the spread on the term loan facility by up to 10 basis points, and reinstate in full the $180 million Term Loan Facility. For more information, see Note 2, “Business Acquisition,14, “Subsequent Event,” to our Consolidated Financial Statements.
Three months ended June 30,March 31, 2021 vs. March 31, 2020 vs. June 30, 2019
Our operating income was $6$177 million in the quarter, compared to operating income of $40 million in the second quarter of 2019. Excluding special items, we incurred an operating loss of $3$8 million in the first quarter of 2020. Excluding special items, our operating income was $180 million, compared to an operating incomeloss of $40$10 million in the year-ago period. Special items are described below.
Our net income in the quarter was $6$87 million, or $0.07$1.06 per diluted share, compared to a net incomeloss of $25$1 million, or $0.27$0.01 per diluted share, in the year-ago period. Our net lossincome in the quarter, excluding special items, was $22$119 million, or $0.25$1.45 per diluted share, compared to a net incomeloss of $11$29 million, or $0.12$0.33 per diluted share, in the year-ago period.
| Three Months Ended June 30, 2020 | Operating Income (Loss) | Net Income (Loss) | EPS | |||||||||
| (Unaudited, in millions, except per share amounts) | ||||||||||||
| GAAP, as reported | $ | 6 | $ | 6 | $ | 0.07 | ||||||
| Adjustments for special items: | ||||||||||||
| Net gain on disposition of assets | (9 | ) | (9 | ) | (0.10 | ) | ||||||
| Non-operating pension and other postretirement benefit credits | — | (4 | ) | (0.05 | ) | |||||||
| Other income, net | — | (10 | ) | (0.11 | ) | |||||||
| Income tax effect of special items | — | (5 | ) | (0.06 | ) | |||||||
Adjusted for special items (1) | $ | (3 | ) | $ | (22 | ) | $ | (0.25 | ) | |||
| Three Months Ended March 31, 2021 | Operating Income | Net Income | EPS | ||||||||||||||||||||||||||
| (Unaudited, in millions, except per share amounts) | |||||||||||||||||||||||||||||
| GAAP, as reported | $ | 177 | $ | 87 | $ | 1.06 | |||||||||||||||||||||||
| Adjustments for special items: | |||||||||||||||||||||||||||||
| Closure costs, impairment and other related charges | 3 | 3 | 0.03 | ||||||||||||||||||||||||||
| Non-operating pension and other postretirement benefit credits | — | (2) | (0.02) | ||||||||||||||||||||||||||
| Other expense, net | — | 45 | 0.55 | ||||||||||||||||||||||||||
| Income tax effect of special items | — | (14) | (0.17) | ||||||||||||||||||||||||||
Adjusted for special items (1) | $ | 180 | $ | 119 | $ | 1.45 | |||||||||||||||||||||||
20
| Three Months Ended March 31, 2020 | Operating Loss | Net Loss | EPS | ||||||||||||||||||||||||||
| (Unaudited, in millions, except per share amounts) | |||||||||||||||||||||||||||||
| GAAP, as reported | $ | (8) | $ | (1) | $ | (0.01) | |||||||||||||||||||||||
| Adjustments for special items: | |||||||||||||||||||||||||||||
| Closure costs, impairment and other related charges | (2) | (2) | (0.02) | ||||||||||||||||||||||||||
| Non-operating pension and other postretirement benefit credits | — | (15) | (0.17) | ||||||||||||||||||||||||||
| Other income, net | — | (28) | (0.32) | ||||||||||||||||||||||||||
| Income tax effect of special items | — | 17 | 0.19 | ||||||||||||||||||||||||||
Adjusted for special items (1) | $ | (10) | $ | (29) | $ | (0.33) | |||||||||||||||||||||||
| Three Months Ended June 30, 2019 | Operating Income | Net Income | EPS | |||||||||
| (Unaudited, in millions, except per share amounts) | ||||||||||||
| GAAP, as reported | $ | 40 | $ | 25 | $ | 0.27 | ||||||
| Adjustments for special items: | ||||||||||||
| Non-operating pension and other postretirement benefit credits | — | (12 | ) | (0.13 | ) | |||||||
| Other expense, net | — | 1 | 0.01 | |||||||||
| Income tax effect of special items | — | (3 | ) | (0.03 | ) | |||||||
Adjusted for special items (1) | $ | 40 | $ | 11 | $ | 0.12 | ||||||
(1) | Operating income (loss), net income (loss) and net income (loss) per share (or, “EPS”), in each case as adjusted for special items, are not financial measures recognized under U.S. generally accepted accounting principles (or, “GAAP”). We calculate operating income (loss), as adjusted for special items, as operating income (loss) from our Consolidated Statements of Operations, adjusted for items such as closure costs, impairment, and other related charges |
21
| Six Months Ended June 30, 2020 | Operating Loss | Net Income (Loss) | EPS | |||||||||
| (Unaudited, in millions, except per share amounts) | ||||||||||||
| GAAP, as reported | $ | (2 | ) | $ | 5 | $ | 0.06 | |||||
| Adjustments for special items: | ||||||||||||
| Closure costs, impairment and other related charges | (2 | ) | (2 | ) | (0.02 | ) | ||||||
| Net gain on disposition of assets | (9 | ) | (9 | ) | (0.10 | ) | ||||||
| Non-operating pension and other postretirement benefit credits | — | (19 | ) | (0.22 | ) | |||||||
| Other income, net | — | (38 | ) | (0.43 | ) | |||||||
| Income tax effect of special items | — | 12 | 0.14 | |||||||||
Adjusted for special items (1) | $ | (13 | ) | $ | (51 | ) | $ | (0.57 | ) | |||
| Six Months Ended June 30, 2019 | Operating Income | Net Income | EPS | |||||||||
| (Unaudited, in millions, except per share amounts) | ||||||||||||
| GAAP, as reported | $ | 104 | $ | 67 | $ | 0.71 | ||||||
| Adjustments for special items: | ||||||||||||
| Non-operating pension and other postretirement benefit credits | — | (24 | ) | (0.26 | ) | |||||||
| Other expense, net | — | 5 | 0.06 | |||||||||
| Income tax effect of special items | — | (7 | ) | (0.07 | ) | |||||||
Adjusted for special items (1) | $ | 104 | $ | 41 | $ | 0.44 | ||||||
RESULTS OF OPERATIONS
Consolidated Results
Selected financial information
| Three Months Ended March 31, | |||||||||||||||||||||||||||||||||||||||||
| (Unaudited, in millions, except per share amounts) | 2021 | 2020 | |||||||||||||||||||||||||||||||||||||||
| Sales | $ | 873 | $ | 689 | |||||||||||||||||||||||||||||||||||||
| Operating income (loss) per segment: | |||||||||||||||||||||||||||||||||||||||||
| Market pulp | $ | 4 | $ | (3) | |||||||||||||||||||||||||||||||||||||
| Tissue | (2) | 2 | |||||||||||||||||||||||||||||||||||||||
| Wood products | 221 | 5 | |||||||||||||||||||||||||||||||||||||||
| Paper | (24) | (3) | |||||||||||||||||||||||||||||||||||||||
| Segment total | 199 | 1 | |||||||||||||||||||||||||||||||||||||||
| Corporate and other | (22) | (9) | |||||||||||||||||||||||||||||||||||||||
| Operating income (loss) | $ | 177 | $ | (8) | |||||||||||||||||||||||||||||||||||||
| Net income (loss) attributable to Resolute Forest Products Inc. | $ | 87 | $ | (1) | |||||||||||||||||||||||||||||||||||||
| Net income (loss) per common share attributable to Resolute Forest Products Inc. common shareholders: | |||||||||||||||||||||||||||||||||||||||||
| Basic | $ | 1.07 | $ | (0.01) | |||||||||||||||||||||||||||||||||||||
| Diluted | $ | 1.06 | $ | (0.01) | |||||||||||||||||||||||||||||||||||||
Adjusted EBITDA (1) | $ | 221 | $ | 32 | |||||||||||||||||||||||||||||||||||||
| Three Months Ended June 30, | Six Months Ended June 30, | ||||||||||||||||
| (Unaudited, in millions, except per share amounts) | 2020 | 2019 | 2020 | 2019 | |||||||||||||
| Sales | $ | 612 | $ | 755 | $ | 1,301 | $ | 1,550 | |||||||||
| Operating income (loss) per segment: | |||||||||||||||||
| Market pulp | $ | 10 | $ | 27 | $ | 7 | $ | 69 | |||||||||
| Tissue | (2 | ) | (4 | ) | — | (12 | ) | ||||||||||
| Wood products | 15 | (3 | ) | 20 | 3 | ||||||||||||
| Paper | (12 | ) | 32 | (15 | ) | 75 | |||||||||||
| Segment total | 11 | 52 | 12 | 135 | |||||||||||||
| Corporate and other | (5 | ) | (12 | ) | (14 | ) | (31 | ) | |||||||||
| Operating income (loss) | $ | 6 | $ | 40 | $ | (2 | ) | $ | 104 | ||||||||
| Net income attributable to Resolute Forest Products Inc. | $ | 6 | $ | 25 | $ | 5 | $ | 67 | |||||||||
| Net income per common share attributable to Resolute Forest Products Inc. common shareholders: | |||||||||||||||||
| Basic | $ | 0.07 | $ | 0.27 | $ | 0.06 | $ | 0.73 | |||||||||
| Diluted | $ | 0.07 | $ | 0.27 | $ | 0.06 | $ | 0.71 | |||||||||
Adjusted EBITDA (1) | $ | 37 | $ | 82 | $ | 69 | $ | 186 | |||||||||
| (Unaudited, in millions) | March 31, 2021 | December 31, 2020 | ||||||||||||||||||
| Cash and cash equivalents | $ | 33 | $ | 113 | ||||||||||||||||
| Total assets | $ | 3,728 | $ | 3,730 | ||||||||||||||||
(1)Earnings before interest expense, income taxes, and depreciation and amortization (or, “EBITDA”) and adjusted EBITDA are not financial measures recognized under GAAP. EBITDA is calculated as net income (loss) including noncontrolling interest from the Consolidated Statements of Operations, adjusted for interest expense, income taxes, and depreciation and amortization. Adjusted EBITDA means EBITDA, excluding special items, such as closure costs, impairment and other related charges, non-operating pension and OPEB costs and credits, and other income and expense, net. We believe that using non-GAAP measures such as EBITDA and adjusted EBITDA is useful because they are consistent with the indicators management uses internally to measure the Company’s performance and it allows the reader to compare our operations and financial performance from period to period. EBITDA and adjusted EBITDA are internal measures, and therefore may not be comparable to those of other companies. These non-GAAP measures should not be viewed as substitutes to financial measures determined under GAAP.
| (Unaudited, in millions) | June 30, 2020 | December 31, 2019 | ||||||
| Cash and cash equivalents | $ | 27 | $ | 3 | ||||
| Total assets | $ | 3,667 | $ | 3,626 | ||||
| Three Months Ended March 31, | |||||||||||||||||||||||||||||||||||||||||
| (Unaudited, in millions) | 2021 | 2020 | |||||||||||||||||||||||||||||||||||||||
| Net income (loss) including noncontrolling interest | $ | 88 | $ | (1) | |||||||||||||||||||||||||||||||||||||
| Interest expense | 6 | 9 | |||||||||||||||||||||||||||||||||||||||
| Income tax provision | 40 | 27 | |||||||||||||||||||||||||||||||||||||||
| Depreciation and amortization | 41 | 42 | |||||||||||||||||||||||||||||||||||||||
| EBITDA | $ | 175 | $ | 77 | |||||||||||||||||||||||||||||||||||||
| Closure costs, impairment and other related charges | 3 | (2) | |||||||||||||||||||||||||||||||||||||||
| Non-operating pension and other postretirement benefit credits | (2) | (15) | |||||||||||||||||||||||||||||||||||||||
| Other expense (income), net | 45 | (28) | |||||||||||||||||||||||||||||||||||||||
| Adjusted EBITDA | $ | 221 | $ | 32 | |||||||||||||||||||||||||||||||||||||
22
| Three Months Ended June 30, | Six Months Ended June 30, | ||||||||||||||||
| (Unaudited, in millions) | 2020 | 2019 | 2020 | 2019 | |||||||||||||
| Net income including noncontrolling interest | $ | 6 | $ | 25 | $ | 5 | $ | 67 | |||||||||
| Interest expense | 9 | 7 | 18 | 16 | |||||||||||||
| Income tax provision | 5 | 19 | 32 | 40 | |||||||||||||
| Depreciation and amortization | 40 | 42 | 82 | 82 | |||||||||||||
| EBITDA | $ | 60 | $ | 93 | 137 | 205 | |||||||||||
| Closure costs, impairment and other related charges | — | — | (2 | ) | — | ||||||||||||
| Net gain on disposition of assets | (9 | ) | — | (9 | ) | — | |||||||||||
| Non-operating pension and other postretirement benefit credits | (4 | ) | (12 | ) | (19 | ) | (24 | ) | |||||||||
| Other (income) expense, net | (10 | ) | 1 | (38 | ) | 5 | |||||||||||
| Adjusted EBITDA | $ | 37 | $ | 82 | $ | 69 | $ | 186 | |||||||||
Three months ended June 30,March 31, 2021 vs. March 31, 2020 vs. June 30, 2019
Operating income (loss) variance analysis
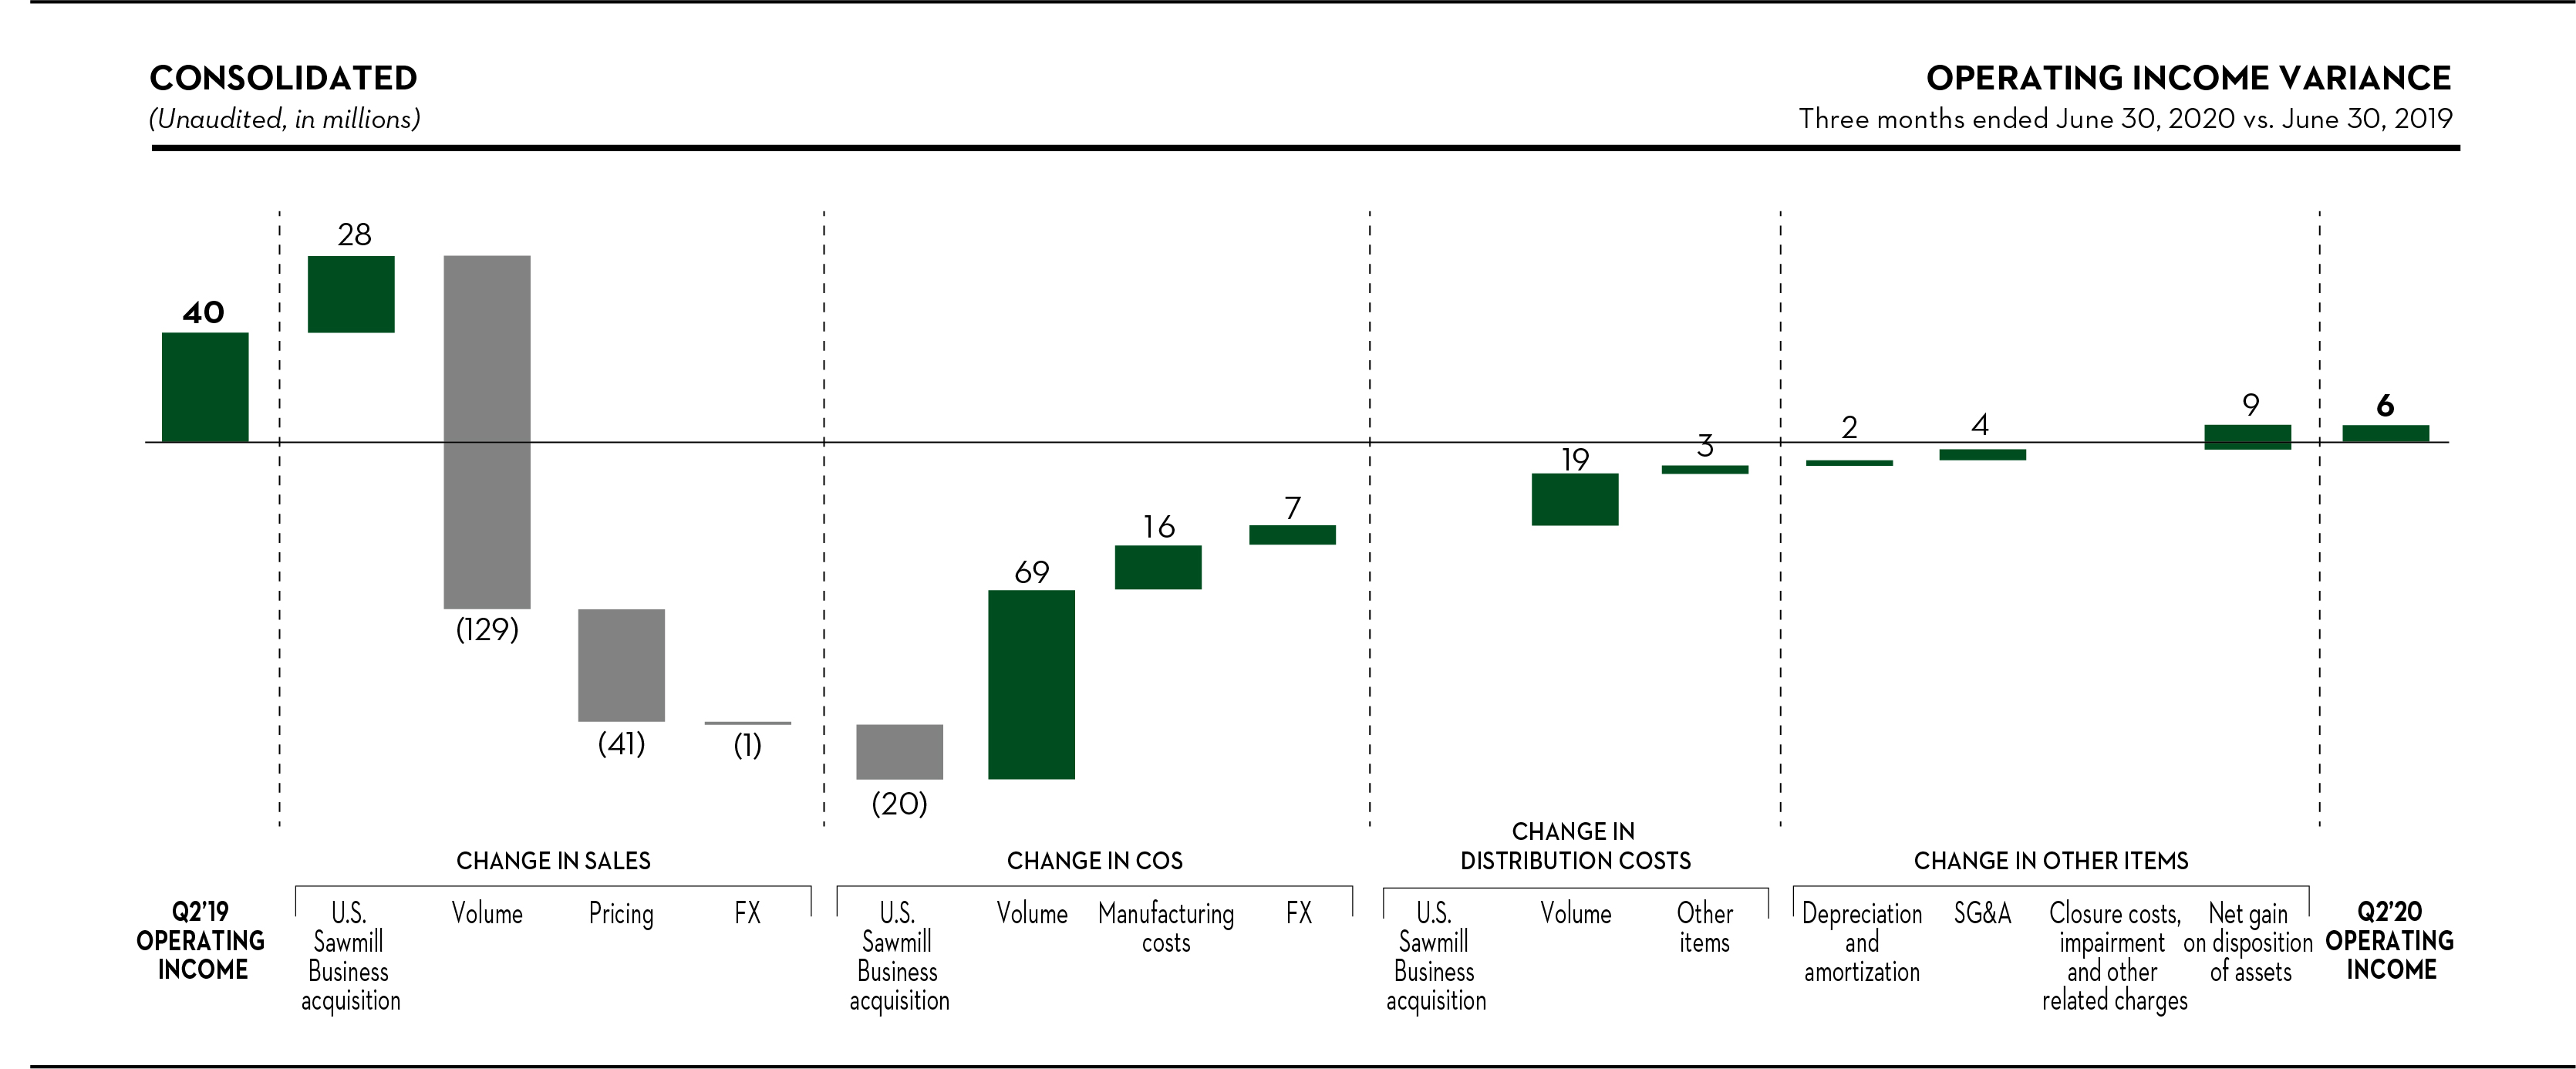
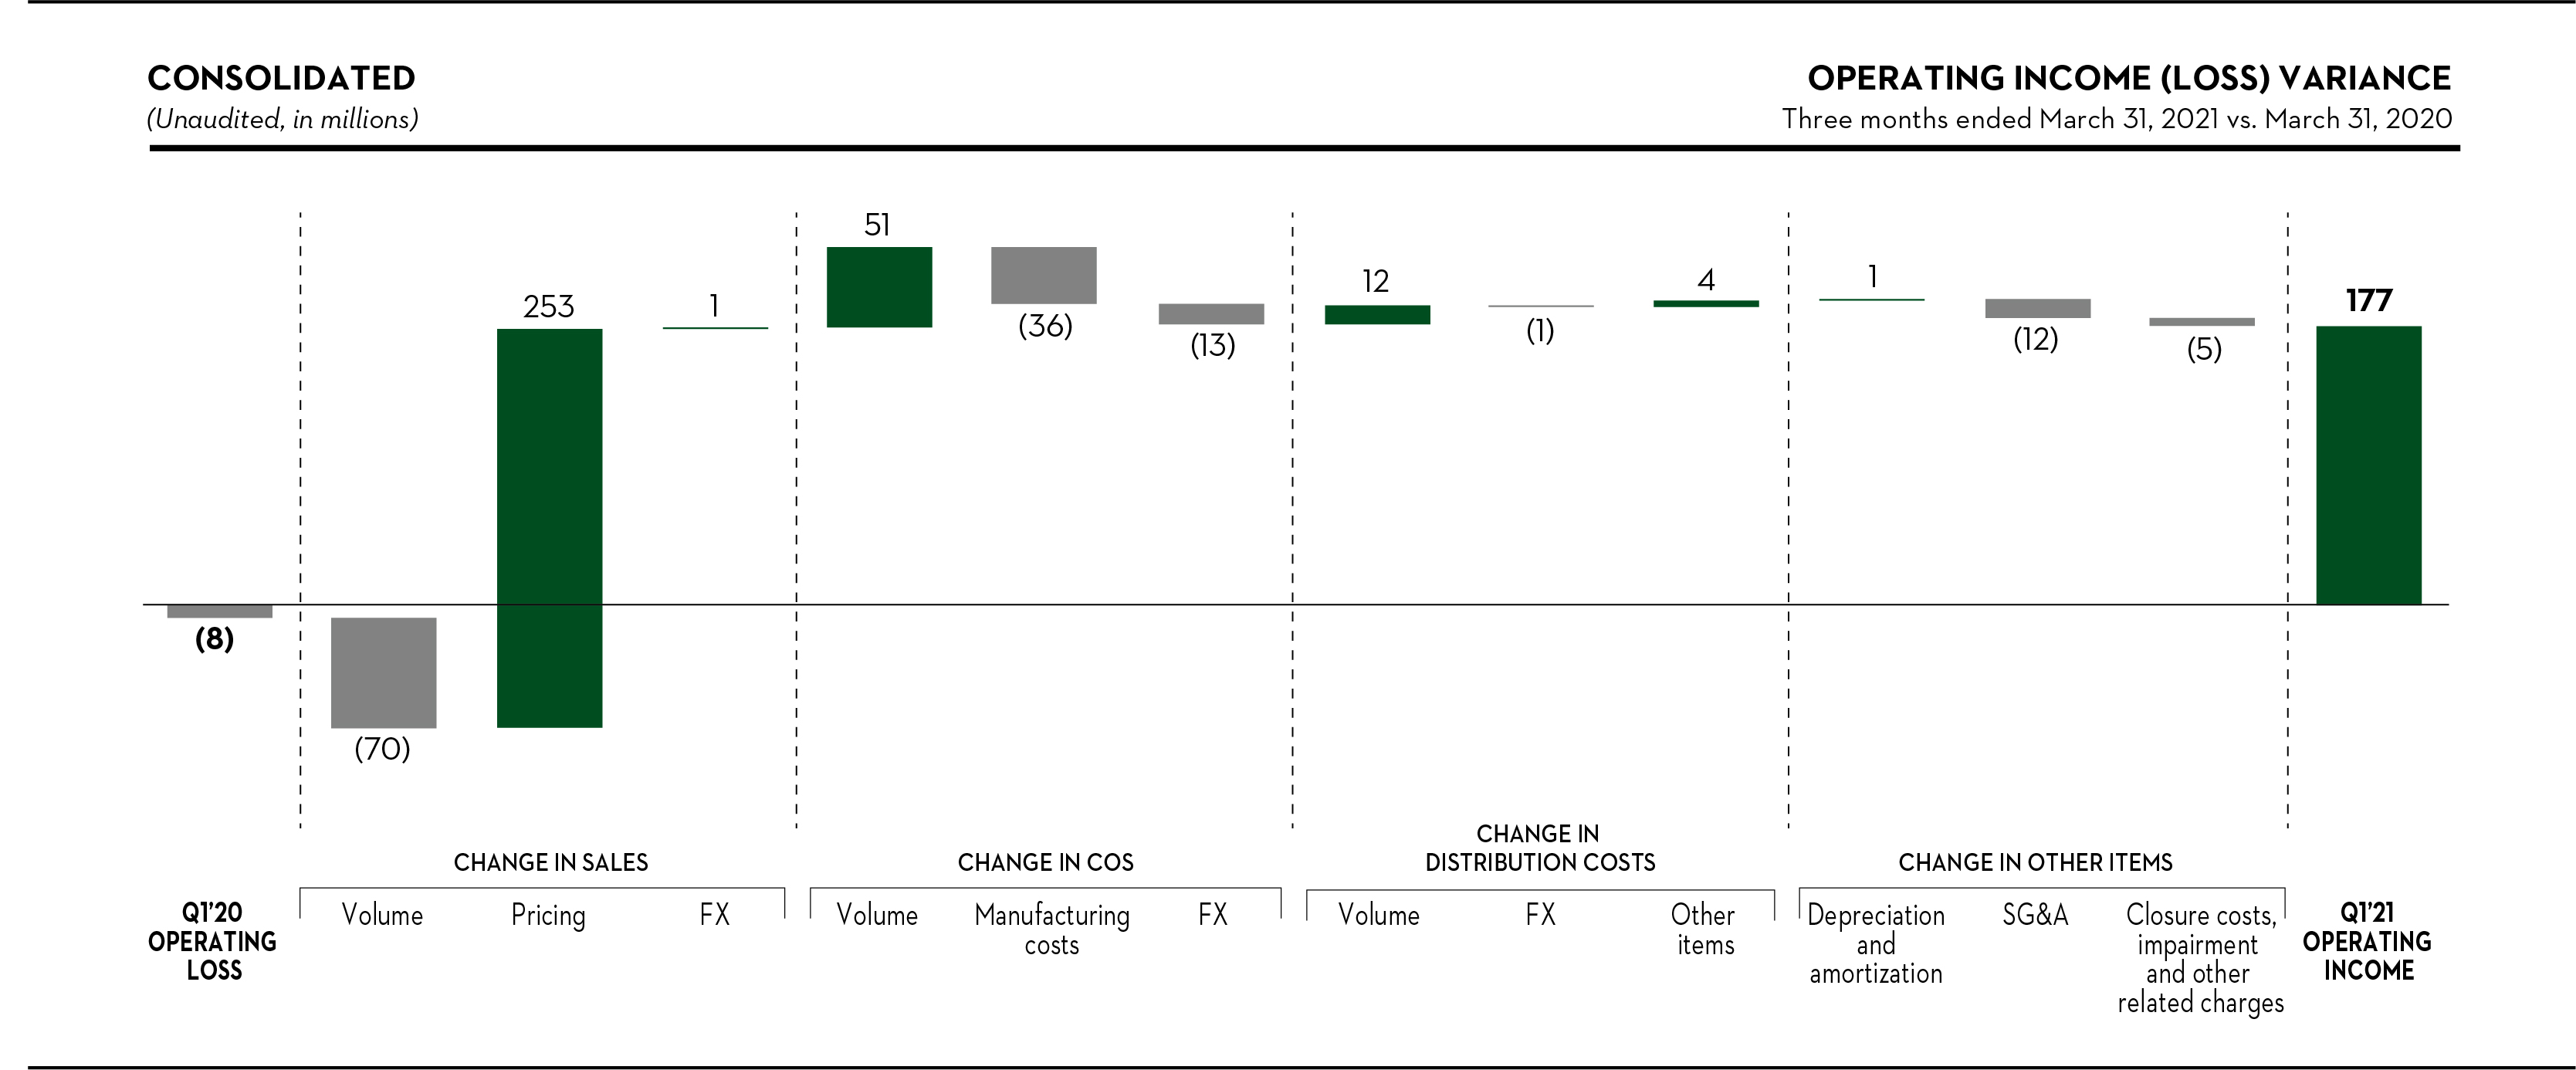
Sales
Sales decreasedincreased by $143$184 million compared to the year-ago period, to $612$873 million. After removing the sales related to the acquisition of the U.S. Sawmill Business in the first quarter of 2020, sales declined by $171 million. Lower volume reduced sales by $129 million, mainly due to the paper segment ($122 million). Pricing had an unfavorablea favorable impact of $41$253 million, mainly as a result of a dropan increase in the average transaction price for wood products and market pulp, up by 123% and 11%, respectively. Lower volume reduced sales by $70 million, mainly reflecting lower shipments of paper respectively 16% and 12%,market pulp, partly offset by an increase in average transaction price for tissue andhigher shipments of wood products, respectively 8% and 10%.products.
Cost of sales, excluding depreciation, amortization and distribution costs
Cost of sales, excluding depreciation, amortization and distribution costs (or, “COS”) decreased by $72$2 million incompared to the quarter.year-ago period. After removing the COS related to the acquisitioneffects of the U.S. Sawmill Business,lower volume and the effects of the weakerstronger Canadian dollar, and lower volume, COS improvedincreased by $16$36 million, largely reflecting:
•an expense related to a process improvement project ($12 million);
•higher labor costs ($6 million); and
•unfavorable maintenance costs ($115 million), as a result of reduced spending, the mainly related to timing of scheduled outagesoutages.
Distribution costs
After removing the effect of lower volume and the indefinite idling of our Augusta (Georgia) mill in November 2019, partly offsetstronger Canadian dollar, distribution costs decreased by the temporary idling of the Baie-Comeau (Quebec) and Amos (Quebec) paper mills; and
Selling, general and administrative expenses
SG&A expenses decreasedincreased by $4$12 million in the quarter compared to the same period last year, mainly due to lower headcount.higher incentive plan expense, which is based on company performance, and higher stock-based compensation expense.
In the first quarter of assets2021, we recorded closure costs, impairment and other related charges of $3 million, related to the
indefinite idling of our Amos and Baie-Comeau paper mills. This compares to the reversal of $2 million of closure costs, impairment and other related charges in the year-ago period, related to the indefinite idling of our paper mill at Augusta (Georgia).
23
Net income (loss) variance analysis
Non-operating pension and other postretirement benefit credits
We recorded non-operating pension and OPEB credits of $4$2 million in the quarter, compared to $12$15 million in the year-ago period. The difference mainly reflects: lower interestan OPEB curtailment gain ($14 million) and pension special termination benefit cost ($93 million) related to the indefinite idling of our Augusta mill in the prior period, and higher amortization of actuarial losses in the current period ($5 million); partly offset by higher amortization of actuarial losseslower interest cost ($85 million) and lower amortization of prior service credits ($2 million); and lower expected return on plan assets ($6 million).in the current period.
Other (expense) income, (expense), net
We recorded other income,expense, net of $10$45 million in the quarter, compared to other expense,income, net of $1$28 million in the year-ago period. The difference mostlymainly reflects a loss on commodity contracts of $37 million principally related to lumber futures contracts and a foreign exchange loss of $5 million, compared to a foreign exchange gain of $23 million in the current period, a favorable insurance claim settlement of $15 million relatedyear-ago period. See Note 2, “Other (Expense) Income, Net,” and Note 7, “Accounts Payable and Other” to our acquisition of Atlas Paper Holdings Inc. (or “Atlas”) in 2015.Consolidated Financial Statements for more information on the loss on commodity contracts and outstanding contracts that remain subject to potential fair value changes.
Income taxes
We recorded an income tax provision of $5$40 million in the quarter on income before income taxes of $11$128 million, compared to an expected income tax provision of $3$27 million based on the U.S. federal statutory income tax rate of 21%. The difference mainly reflects: an increaseU.S. tax on non-U.S. earnings ($18 million); foreign tax rate differences ($8 million); partly offset by a valuation allowance reversal related to our U.S. operations ($8 million) where we recognize a full valuation allowance against our net deferred income tax assets.
In the first quarter of 2020, we recorded an income tax provision of $27 million, on income before income taxes of $26 million, compared to an expected income tax provision of $5 million based on the U.S. federal statutory income tax rate of 21%. The difference mainly reflects: foreign exchange items ($12 million); and a valuation allowance related to our U.S. operations ($79 million) where we recognize a valuation allowance against virtually all of our net deferred income tax assets; partially offset by other items ($5 million), mainly related to the settlement of an insurance claim in connection with our acquisition of Atlas.
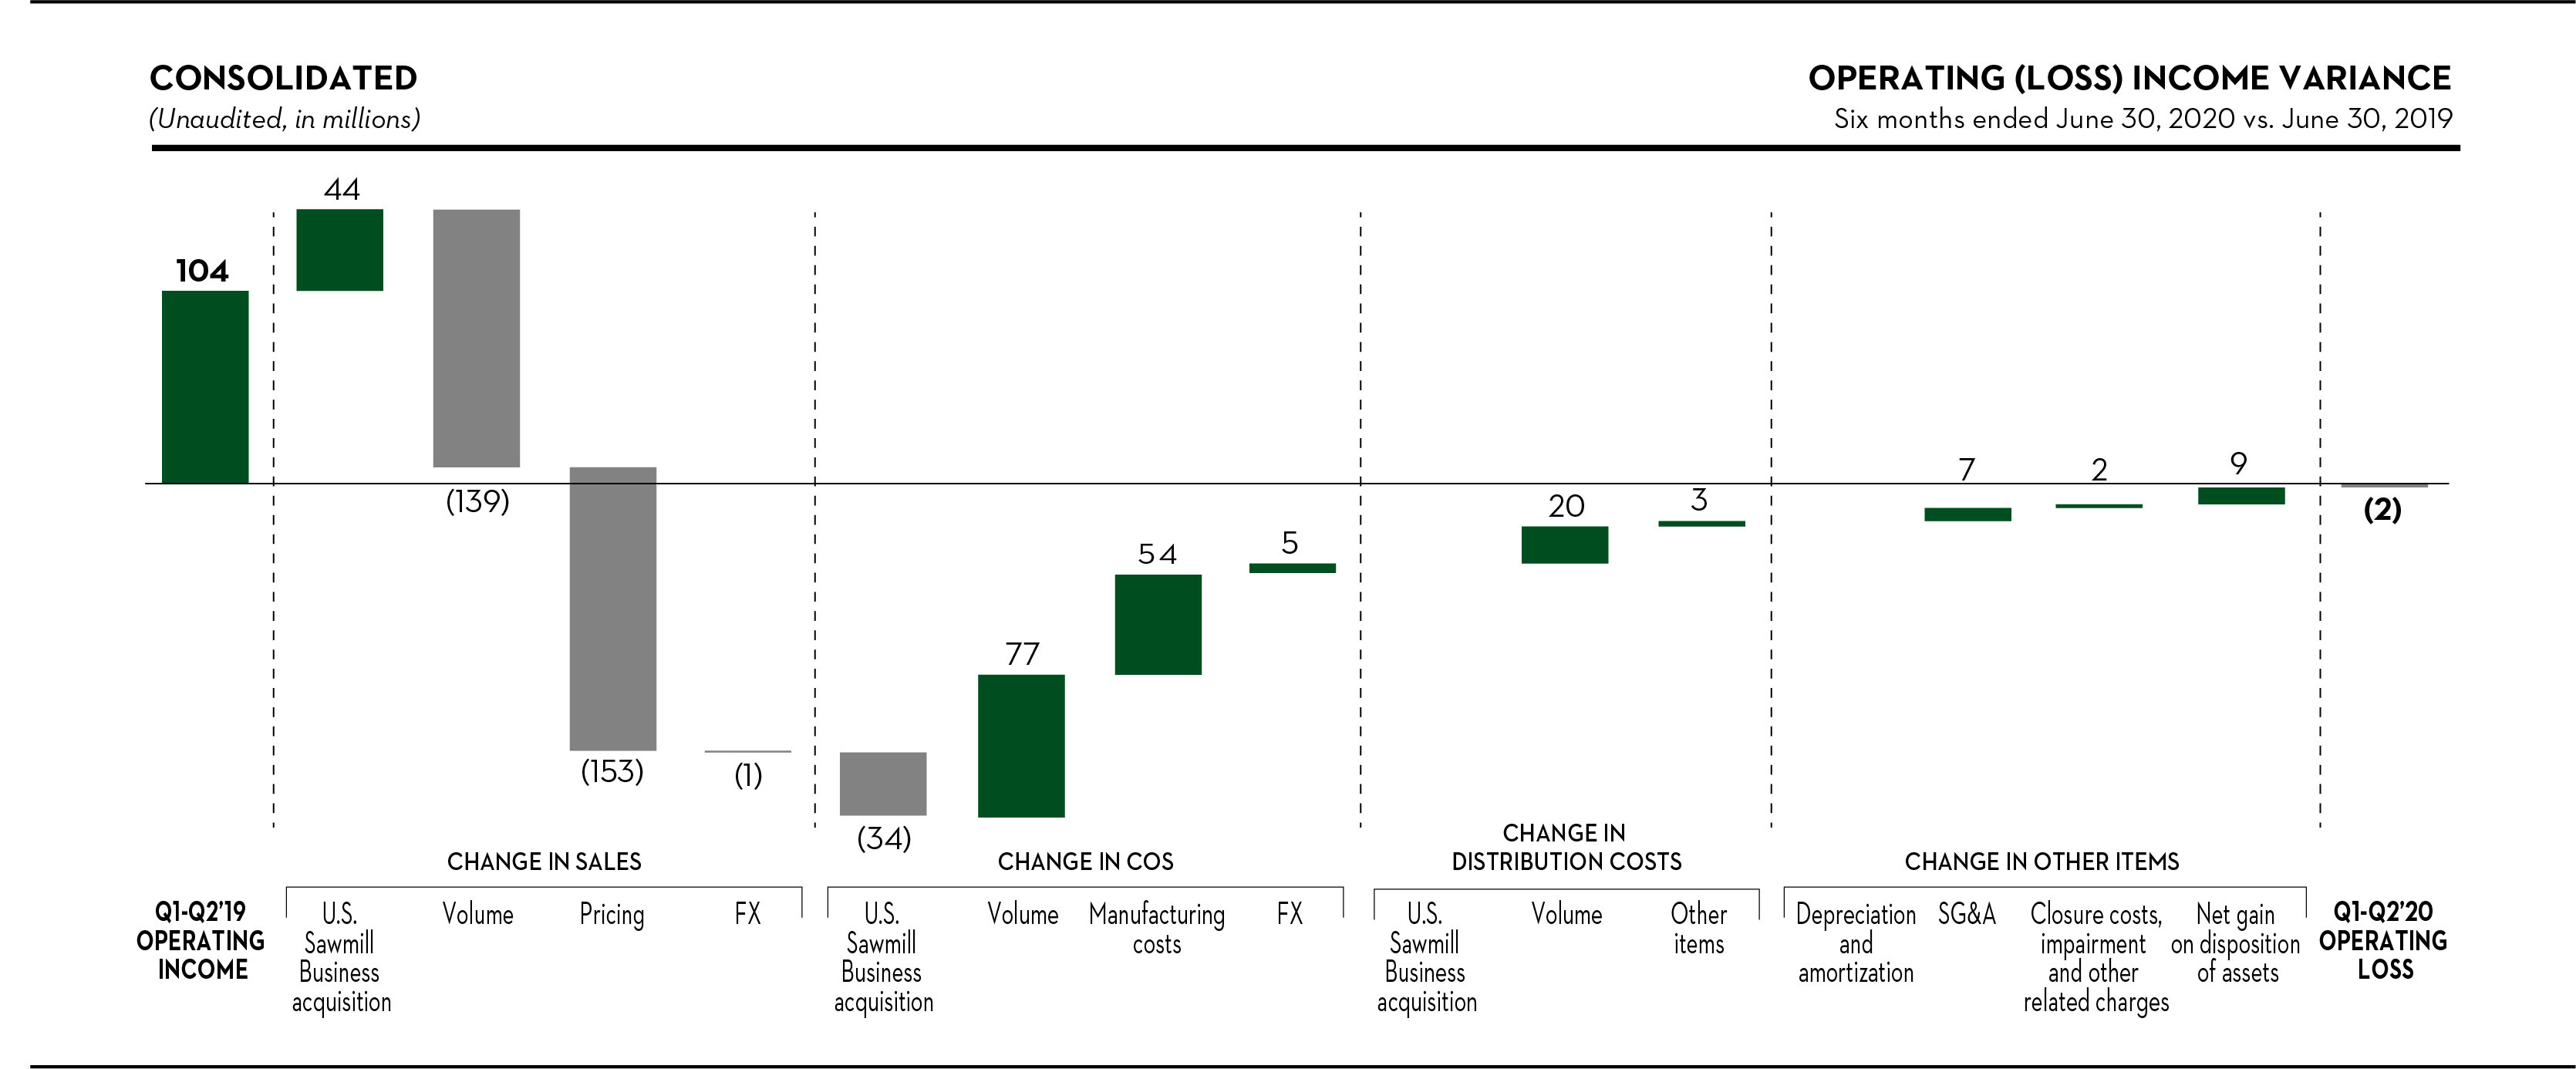
Segment Earnings
We manage our business based on the products we manufacture. Our reportable segments correspond to our principal product lines: market pulp, tissue, wood products, and paper. As of the second quarter of 2020, the results from our newsprint and specialty papers operations have been combined to form the paper reportable segment. This better reflects management’s internal analysis, given the diminishing percentage newsprint and specialty papers represent in our product portfolio. Comparative information has been modified to conform to this revised segment presentation.
We do not allocate any of the income or loss items following “operating income (loss)” in our Consolidated Statements of Operations to our segments because those items are reviewed separately by management. Similarly, we do not allocate to the segments: closure costs, impairment and other related charges; gains and losses on disposition of assets; as well as other discretionary charges or credits.
We allocate depreciation and amortization expense to our segments, although the related fixed assets and amortizable intangible assets are not allocated to segment assets. Additionally, all SG&A expenses are allocated to our segments, with the exception of certain discretionary charges and credits, which we present under “corporate and other.”
24
MARKET PULP
Highlights
| Three Months Ended March 31, | |||||||||||||||||||||||||||||||||||||||||
| (Unaudited, in millions, except where otherwise stated) | 2021 | 2020 | |||||||||||||||||||||||||||||||||||||||
| Sales | $ | 176 | $ | 177 | |||||||||||||||||||||||||||||||||||||
Operating income (loss) (1) | $ | 4 | $ | (3) | |||||||||||||||||||||||||||||||||||||
EBITDA (2) | $ | 10 | $ | 3 | |||||||||||||||||||||||||||||||||||||
| (In thousands of metric tons) | |||||||||||||||||||||||||||||||||||||||||
| Shipments | 272 | 303 | |||||||||||||||||||||||||||||||||||||||
| Downtime | 25 | — | |||||||||||||||||||||||||||||||||||||||
| Three Months Ended June 30, | Six Months Ended June 30, | ||||||||||||||||
| (Unaudited, in millions, except where otherwise stated) | 2020 | 2019 | 2020 | 2019 | |||||||||||||
| Sales | $ | 161 | $ | 189 | $ | 338 | $ | 420 | |||||||||
Operating income (1) | $ | 10 | $ | 27 | $ | 7 | $ | 69 | |||||||||
EBITDA (2) | $ | 16 | $ | 32 | $ | 19 | $ | 79 | |||||||||
| (In thousands of metric tons) | |||||||||||||||||
| Shipments | 258 | 257 | 561 | 543 | |||||||||||||
| Downtime | 33 | 15 | 33 | 23 | |||||||||||||
| March 31, | ||||||||||||||||||||
| (Unaudited, in thousands of metric tons) | 2021 | 2020 | ||||||||||||||||||
| Finished goods inventory | 46 | 69 | ||||||||||||||||||
(1)Net income (loss) including noncontrolling interest is equal to operating income (loss) in this segment.
| June 30, | ||||||||
| (Unaudited, in thousands of metric tons) | 2020 | 2019 | ||||||
| Finished goods inventory | 87 | 110 | ||||||
| Three Months Ended June 30, | Six Months Ended June 30, | Three Months Ended March 31, | ||||||||||||||||||||||||||||||||||||||||||||||||||||||||
| (Unaudited, in millions) | 2020 | 2019 | 2020 | 2019 | (Unaudited, in millions) | 2021 | 2020 | |||||||||||||||||||||||||||||||||||||||||||||||||||
| Net income including noncontrolling interest | $ | 10 | $ | 27 | $ | 7 | $ | 69 | ||||||||||||||||||||||||||||||||||||||||||||||||||
| Net income (loss) including noncontrolling interest | Net income (loss) including noncontrolling interest | $ | 4 | $ | (3) | |||||||||||||||||||||||||||||||||||||||||||||||||||||
| Depreciation and amortization | 6 | 5 | 12 | 10 | Depreciation and amortization | 6 | 6 | |||||||||||||||||||||||||||||||||||||||||||||||||||
| EBITDA | $ | 16 | $ | 32 | $ | 19 | $ | 79 | EBITDA | $ | 10 | $ | 3 | |||||||||||||||||||||||||||||||||||||||||||||
Industry trends
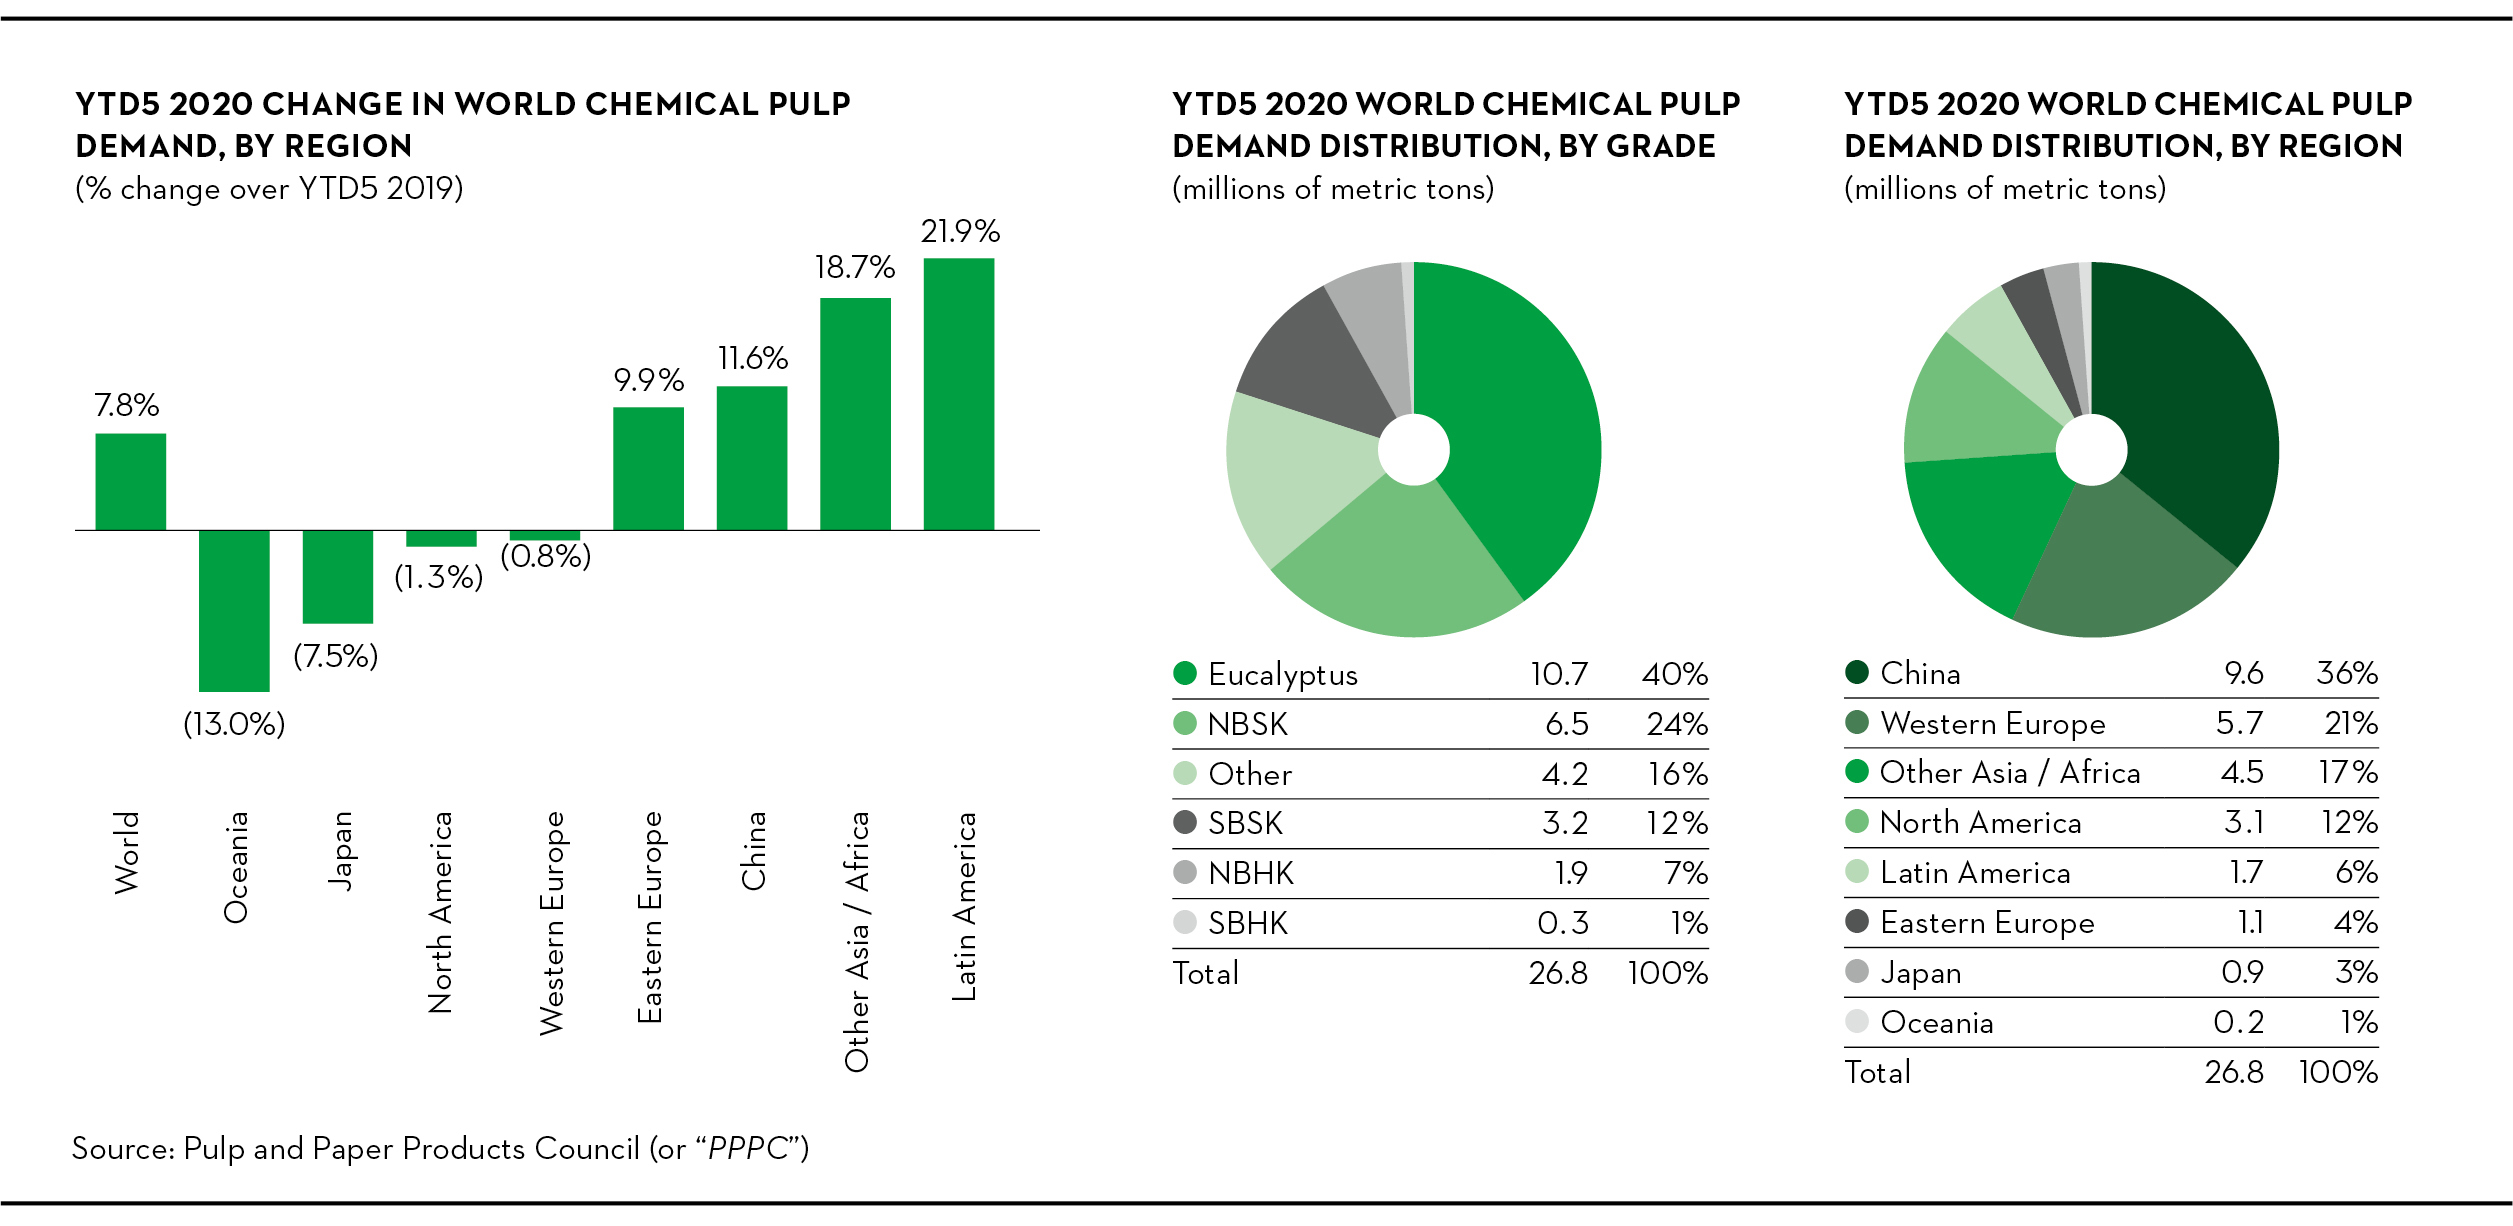
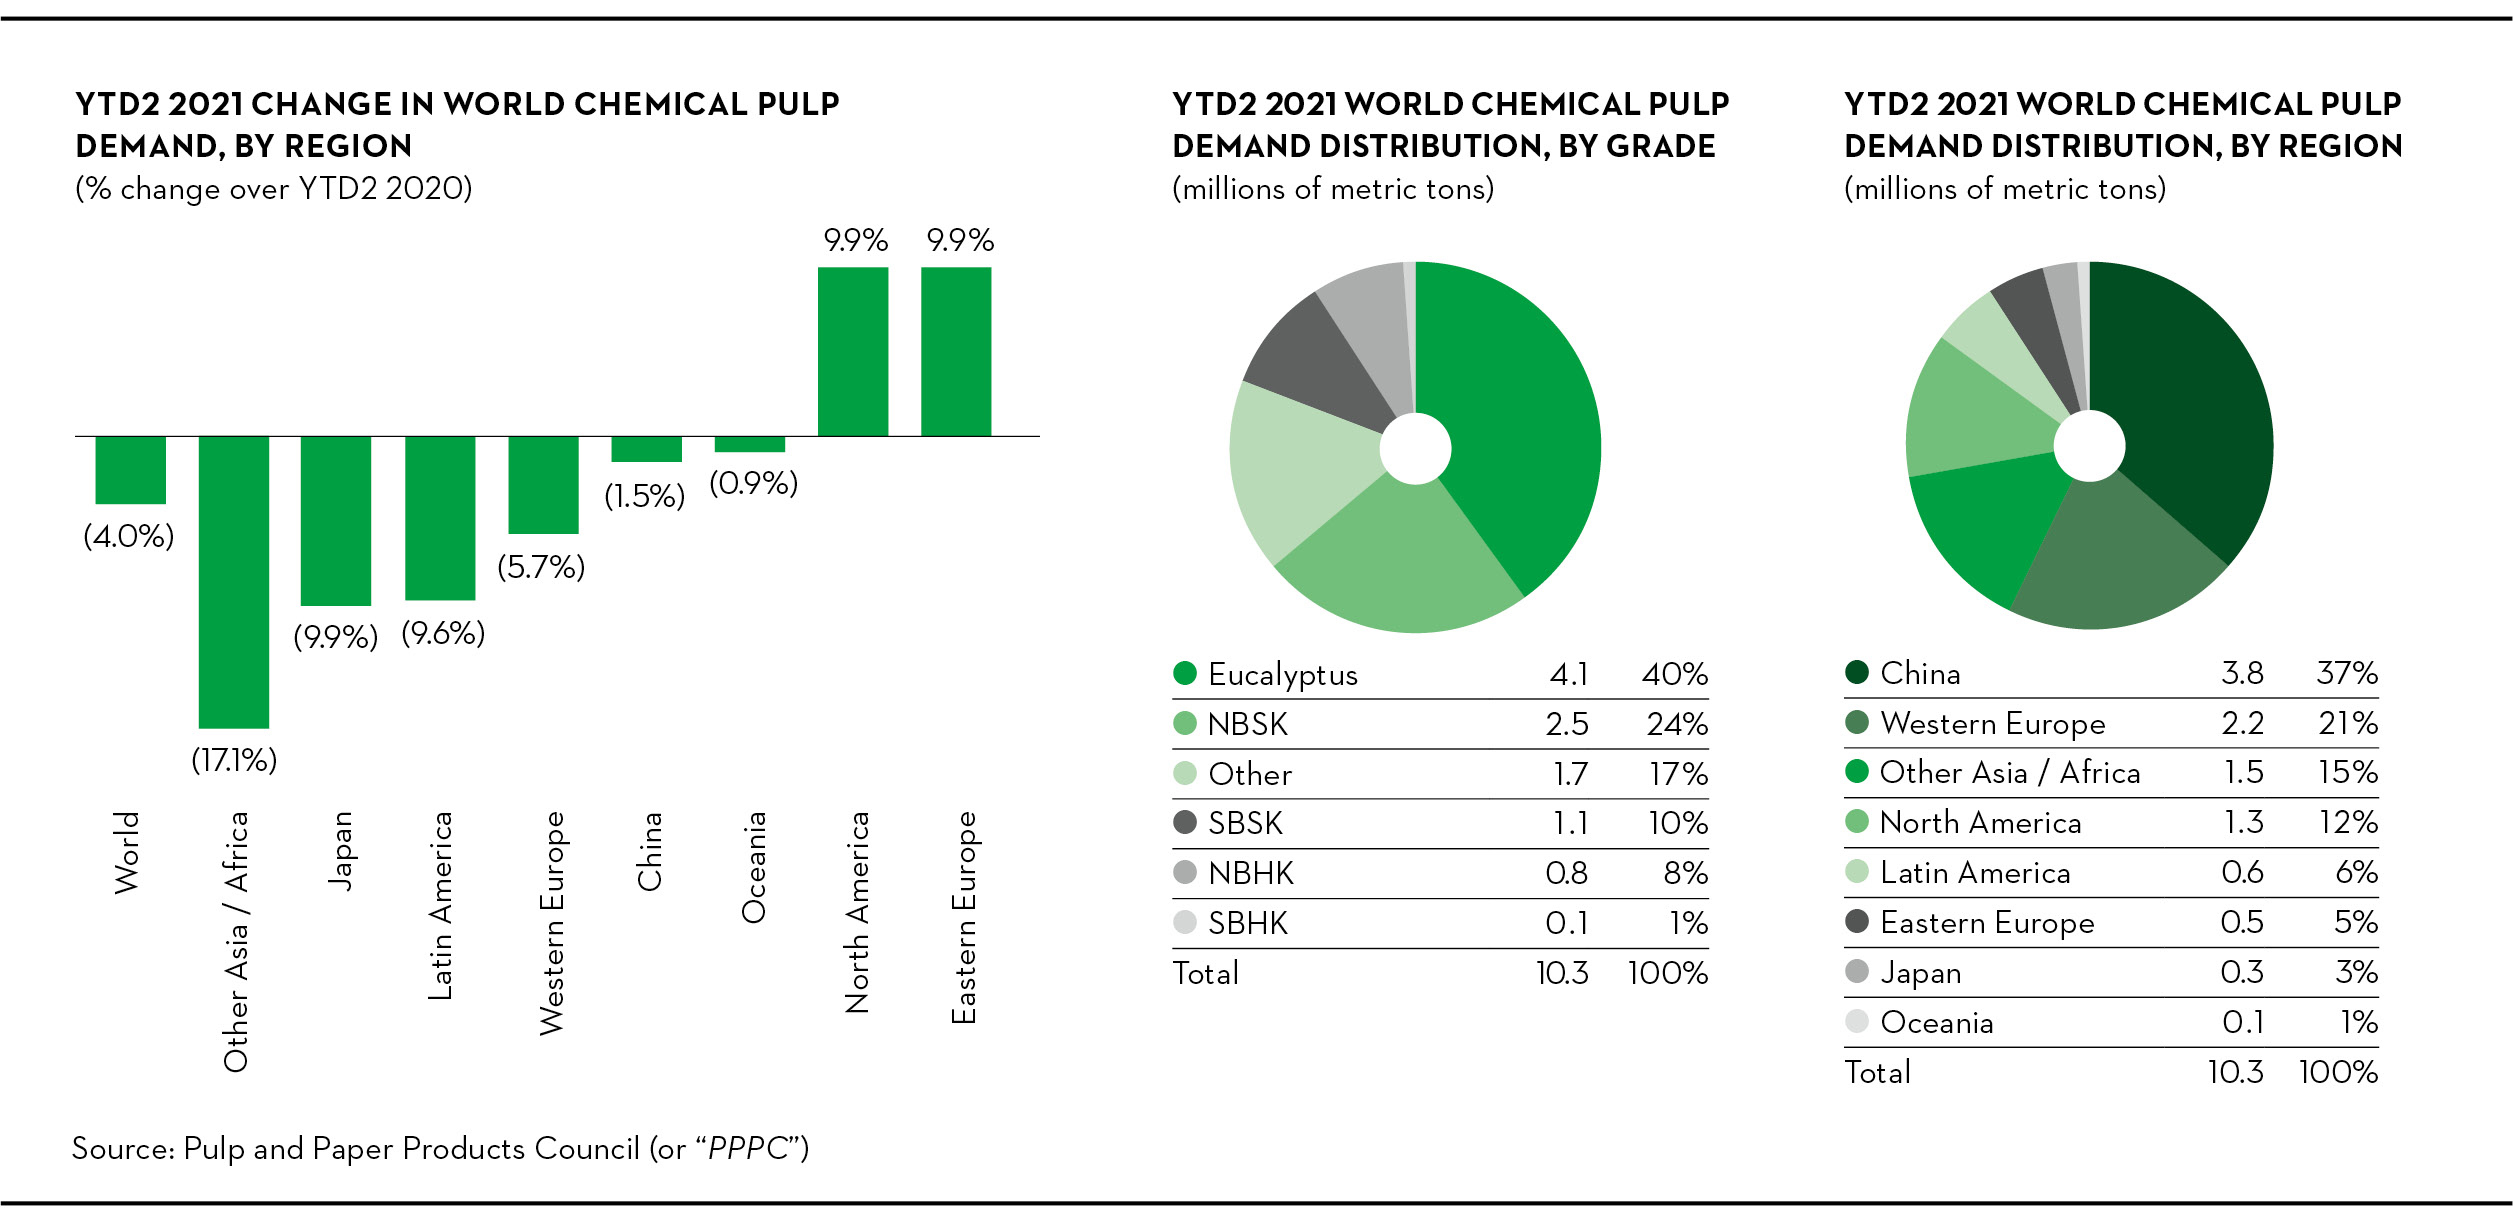
World demand for chemical pulp grewdecreased by 7.8%4.0% in the first fivetwo months of 20202021 compared to the year-ago period, reflecting an increasea decrease in Western Europe and China of 11.6%5.7% and 1.5%, respectively, while North America was downincreased by 1.3%, and Western Europe was essentially flat.9.9%. World capacity grewdecreased by 0.2% over the same1.5% compared to last period.
25
World demand for softwood pulp grewfell by 1.4%8.4% in the first fivetwo months of 2020,2021, reflecting an increasea decrease of 5.8%13.4% and 3.4% in China and Western Europe, respectively, while North America while Western Europe and China were down by 6.4% and 1.3%, respectively.stayed stable. The operating rate was 93%87%.
In the same period, world demand for hardwood pulp rosefell by 13.1%2.5%, with shipments to China and Western Europe down by 8.1%, while shipments to North America and China were up by 19.9%23.7% and 3.7%, respectively, while North America was down by 9.8%4.5%. The operating rate was 91%89%.
Three months ended June 30,March 31, 2021 vs. March 31, 2020 vs. June 30, 2019
Operating income (loss) variance analysis

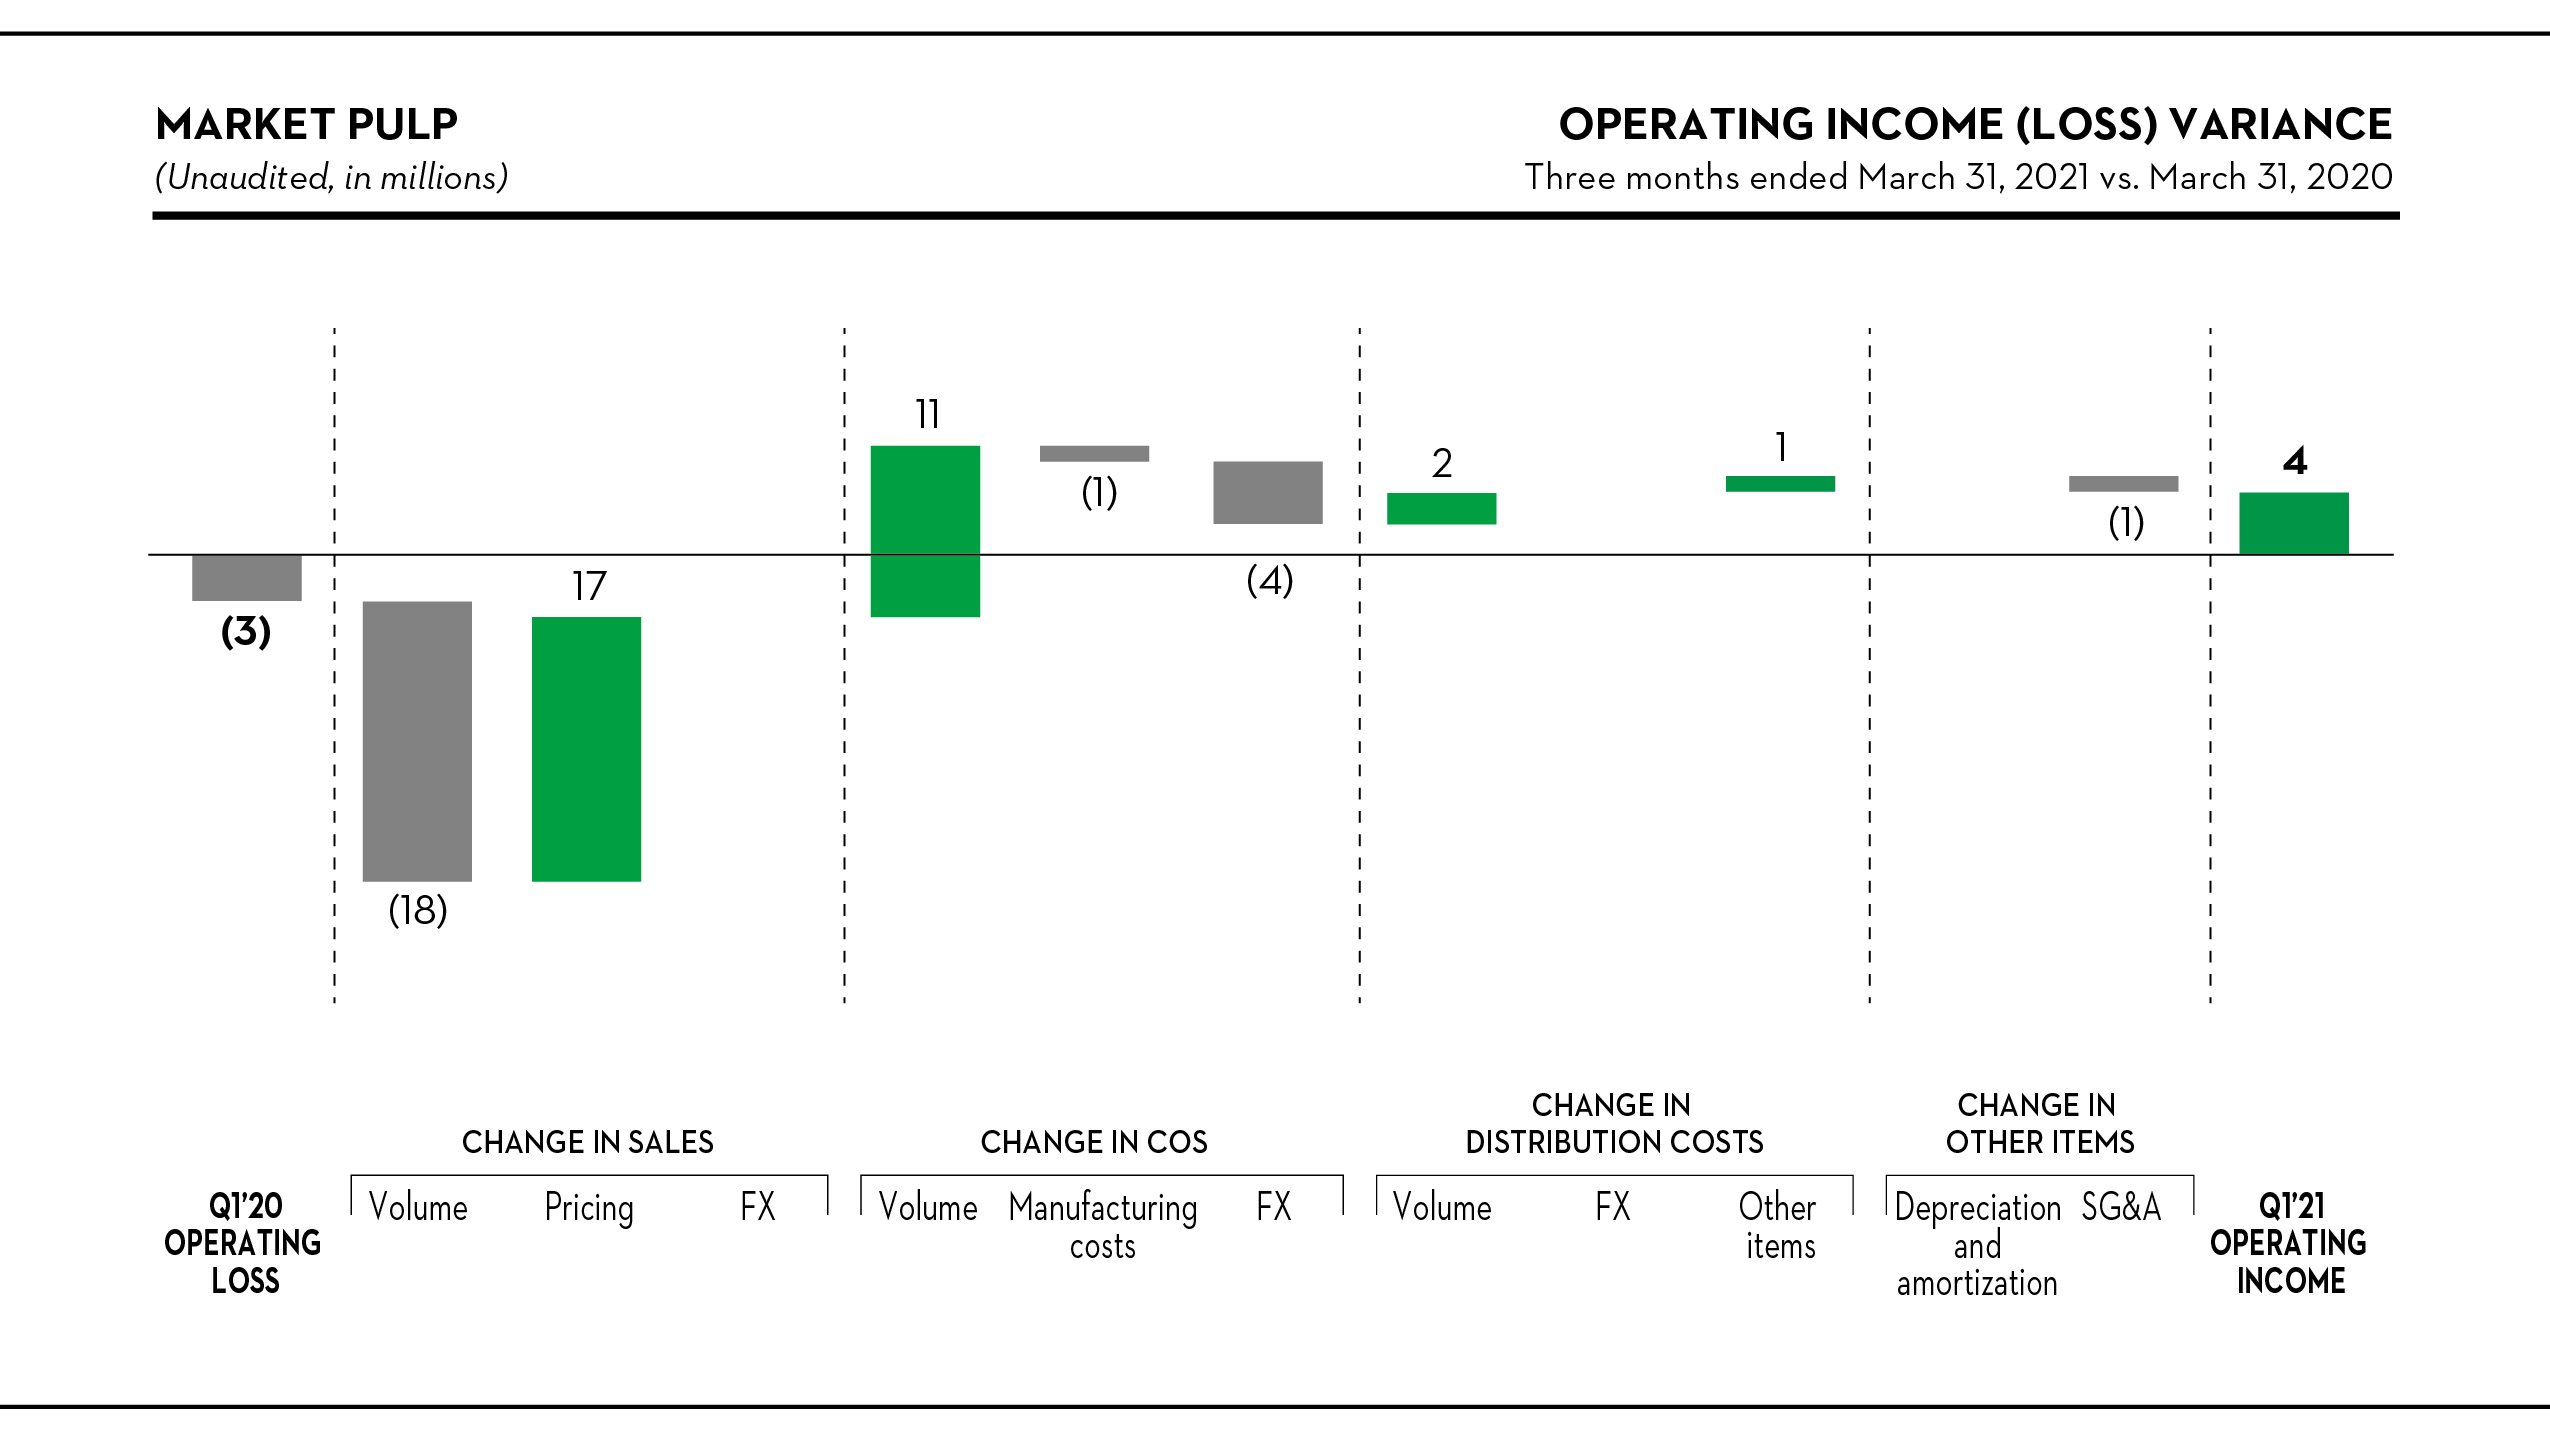
Sales
Sales were $28 million lower, or 15%, to $161 millionremained essentially unchanged in the quarter. Salesquarter at $176 million. Lower sales volume of $18 million was $3 million higher, butoffset by an increase in pricing reduced sales by $31of $17 million, reflecting a declinean increase in the average transaction price of $120 per metric ton, mostly in virgin pulp grades due to softer market conditions.
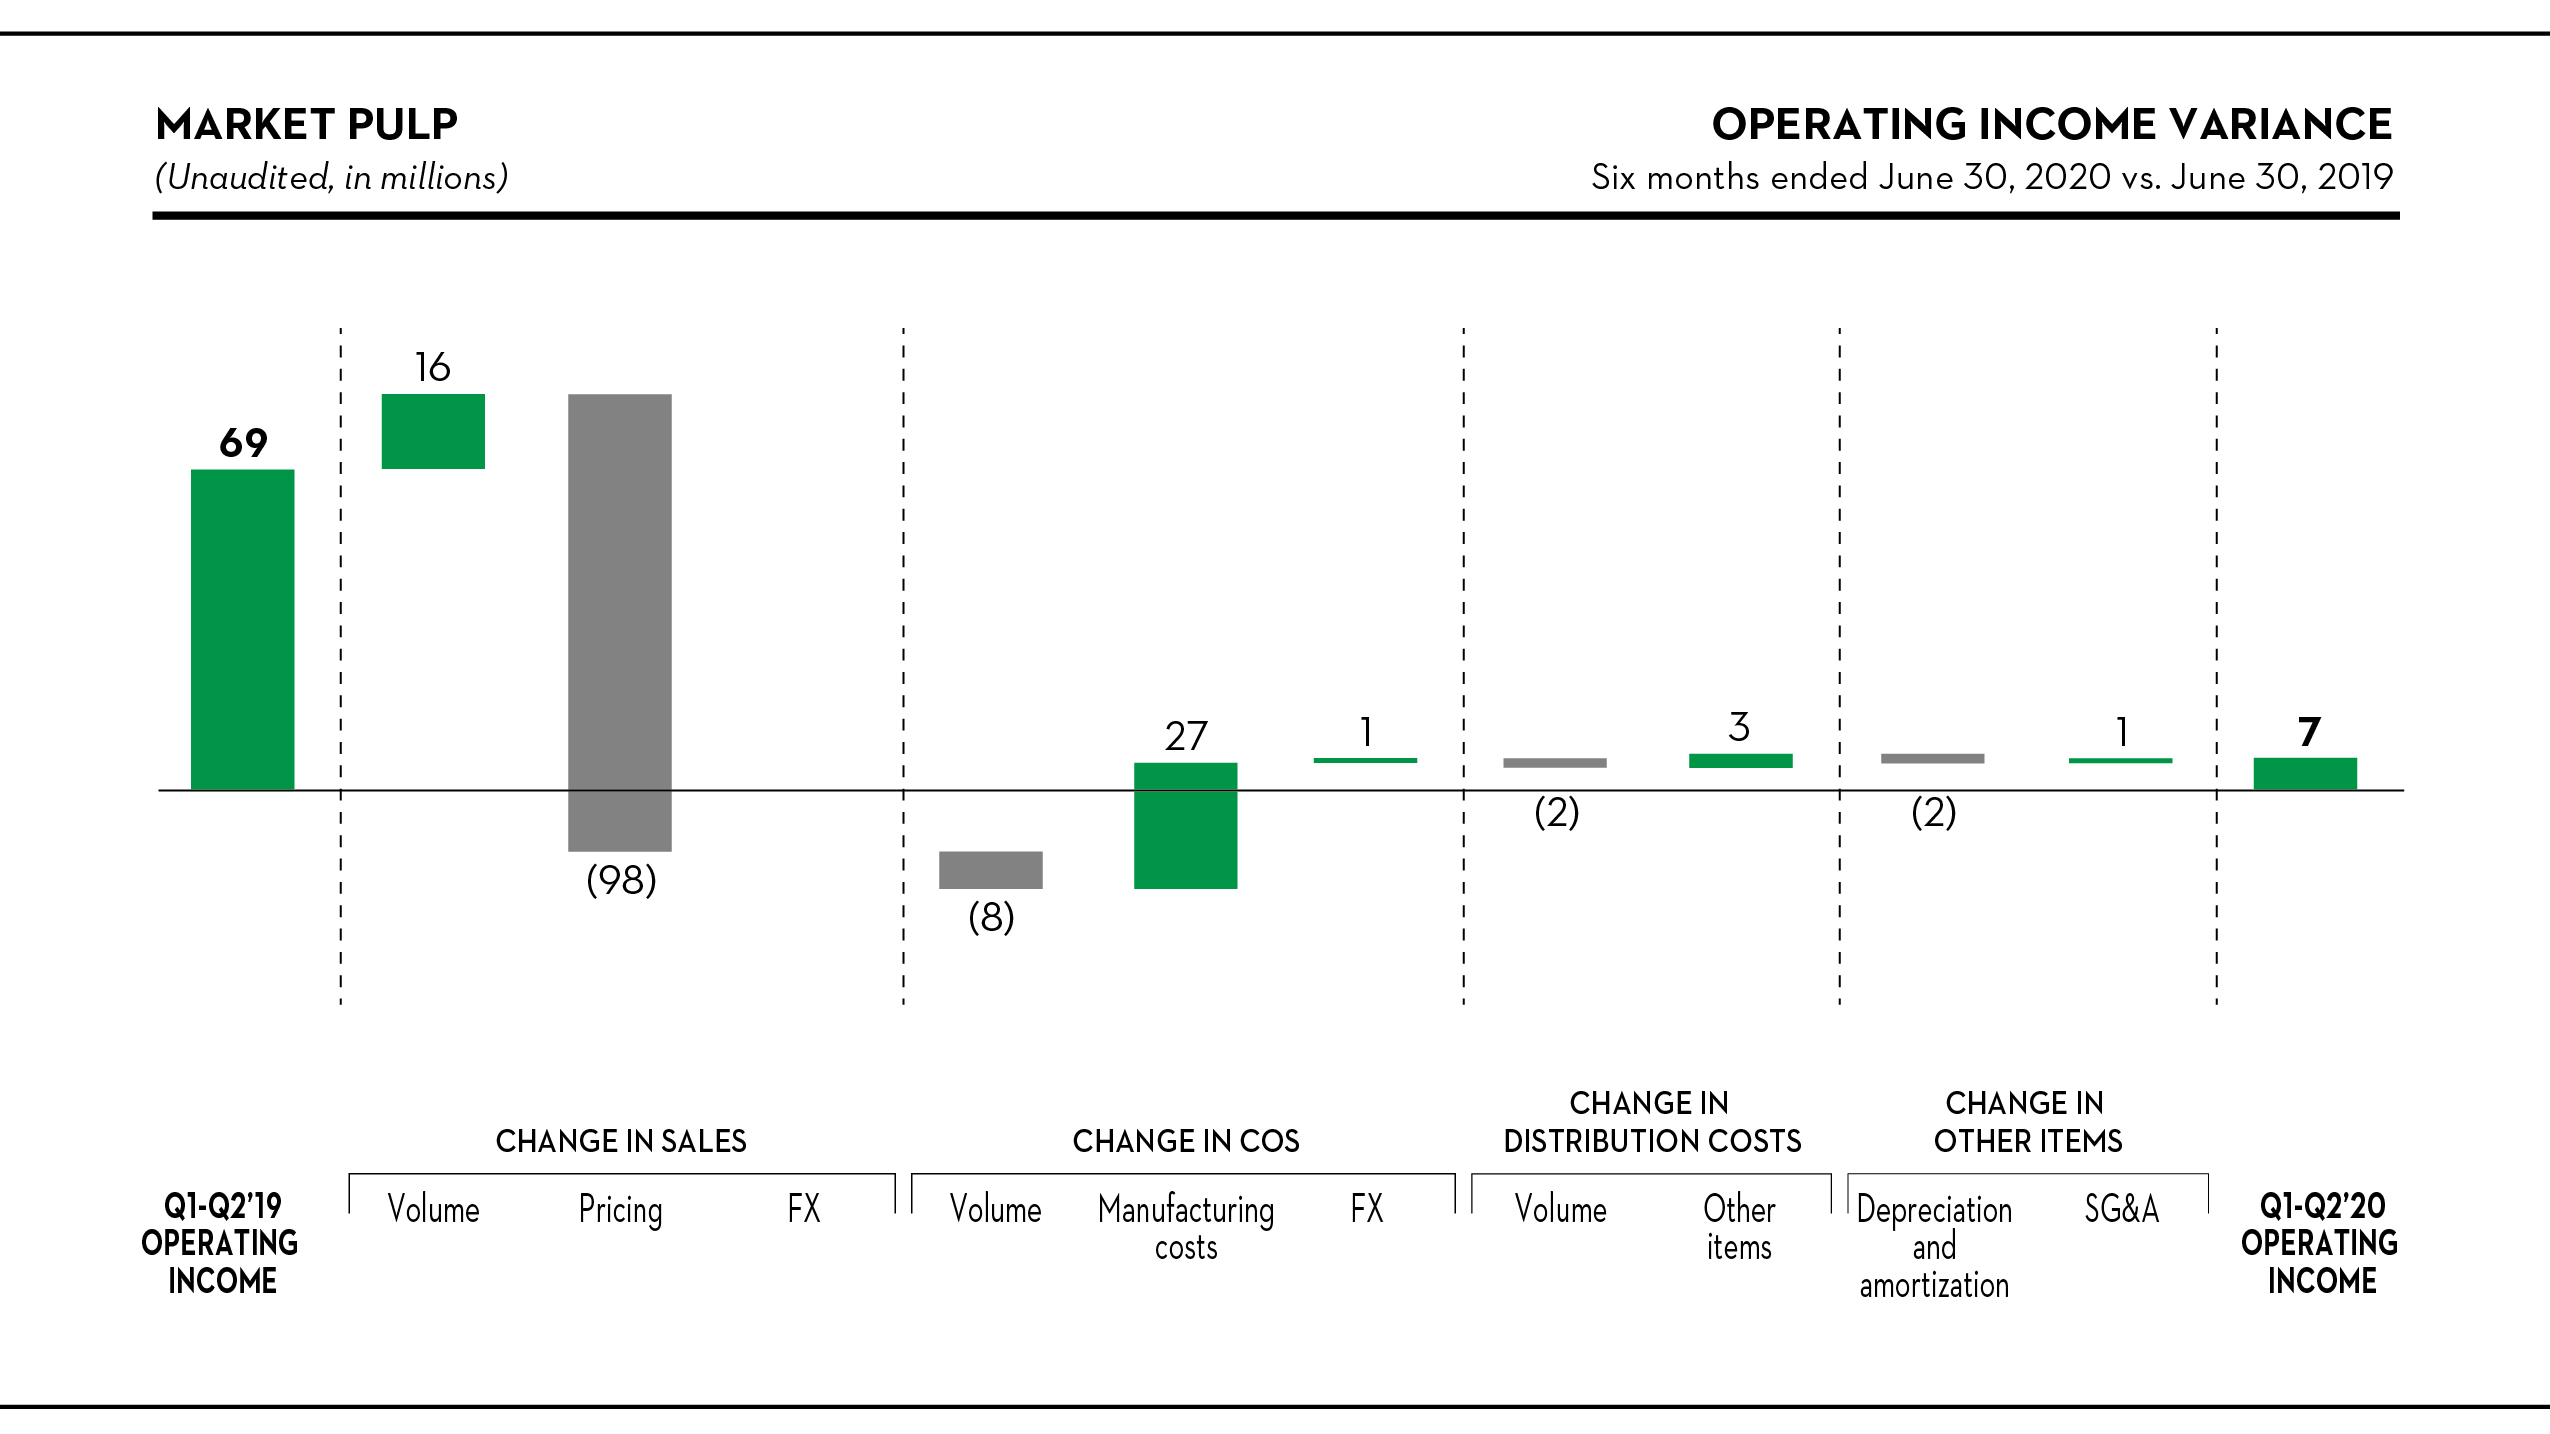
Cost of sales, excluding depreciation, amortization and distribution costs
After adjusting forremoving the effectseffect of higherlower volume and the weakerstronger Canadian dollar, our manufacturing costs improved by $27 million, reflecting:
26
TISSUE
Highlights
| Three Months Ended March 31, | |||||||||||||||||||||||||||||||||||||||||
| (Unaudited, in millions, except where otherwise stated) | 2021 | 2020 | |||||||||||||||||||||||||||||||||||||||
| Sales | $ | 42 | $ | 49 | |||||||||||||||||||||||||||||||||||||
Operating (loss) income (1) | $ | (2) | $ | 2 | |||||||||||||||||||||||||||||||||||||
EBITDA (2) | $ | 3 | $ | 6 | |||||||||||||||||||||||||||||||||||||
| (In thousands of short tons) | |||||||||||||||||||||||||||||||||||||||||
Shipments (3) | 23 | 28 | |||||||||||||||||||||||||||||||||||||||
| Downtime | — | — | |||||||||||||||||||||||||||||||||||||||
| Three Months Ended June 30, | Six Months Ended June 30, | ||||||||||||||||
| (Unaudited, in millions, except where otherwise stated) | 2020 | 2019 | 2020 | 2019 | |||||||||||||
| Sales | $ | 44 | $ | 43 | $ | 93 | $ | 82 | |||||||||
Operating loss (1) | $ | (2 | ) | $ | (4 | ) | $ | — | $ | (12 | ) | ||||||
EBITDA (2) | $ | 3 | $ | — | $ | 9 | $ | (3 | ) | ||||||||
| (In thousands of short tons) | |||||||||||||||||
Shipments (3) | 24 | 25 | 52 | 49 | |||||||||||||
| Downtime | 2 | — | 2 | 1 | |||||||||||||
| March 31, | ||||||||||||||||||||
| (Unaudited, in thousands of short tons) | 2021 | 2020 | ||||||||||||||||||
Finished goods inventory (3) | 8 | 5 | ||||||||||||||||||
(1)Net (loss) income including noncontrolling interest is equal to operating (loss) income in this segment.
| June 30, | ||||||||
| (Unaudited, in thousands of short tons) | 2020 | 2019 | ||||||
Finished goods inventory (3) | 5 | 7 | ||||||
| Three Months Ended June 30, | Six Months Ended June 30, | ||||||||||||||||
| (Unaudited, in millions) | 2020 | 2019 | 2020 | 2019 | |||||||||||||
| Net loss including noncontrolling interest | $ | (2 | ) | $ | (4 | ) | $ | — | $ | (12 | ) | ||||||
| Depreciation and amortization | 5 | 4 | 9 | 9 | |||||||||||||
| EBITDA | $ | 3 | $ | — | $ | 9 | $ | (3 | ) | ||||||||
| Three Months Ended March 31, | |||||||||||||||||||||||||||||||||||||||||
| (Unaudited, in millions) | 2021 | 2020 | |||||||||||||||||||||||||||||||||||||||
| Net (loss) income including noncontrolling interest | $ | (2) | $ | 2 | |||||||||||||||||||||||||||||||||||||
| Depreciation and amortization | 5 | 4 | |||||||||||||||||||||||||||||||||||||||
| EBITDA | $ | 3 | $ | 6 | |||||||||||||||||||||||||||||||||||||
Industry trends
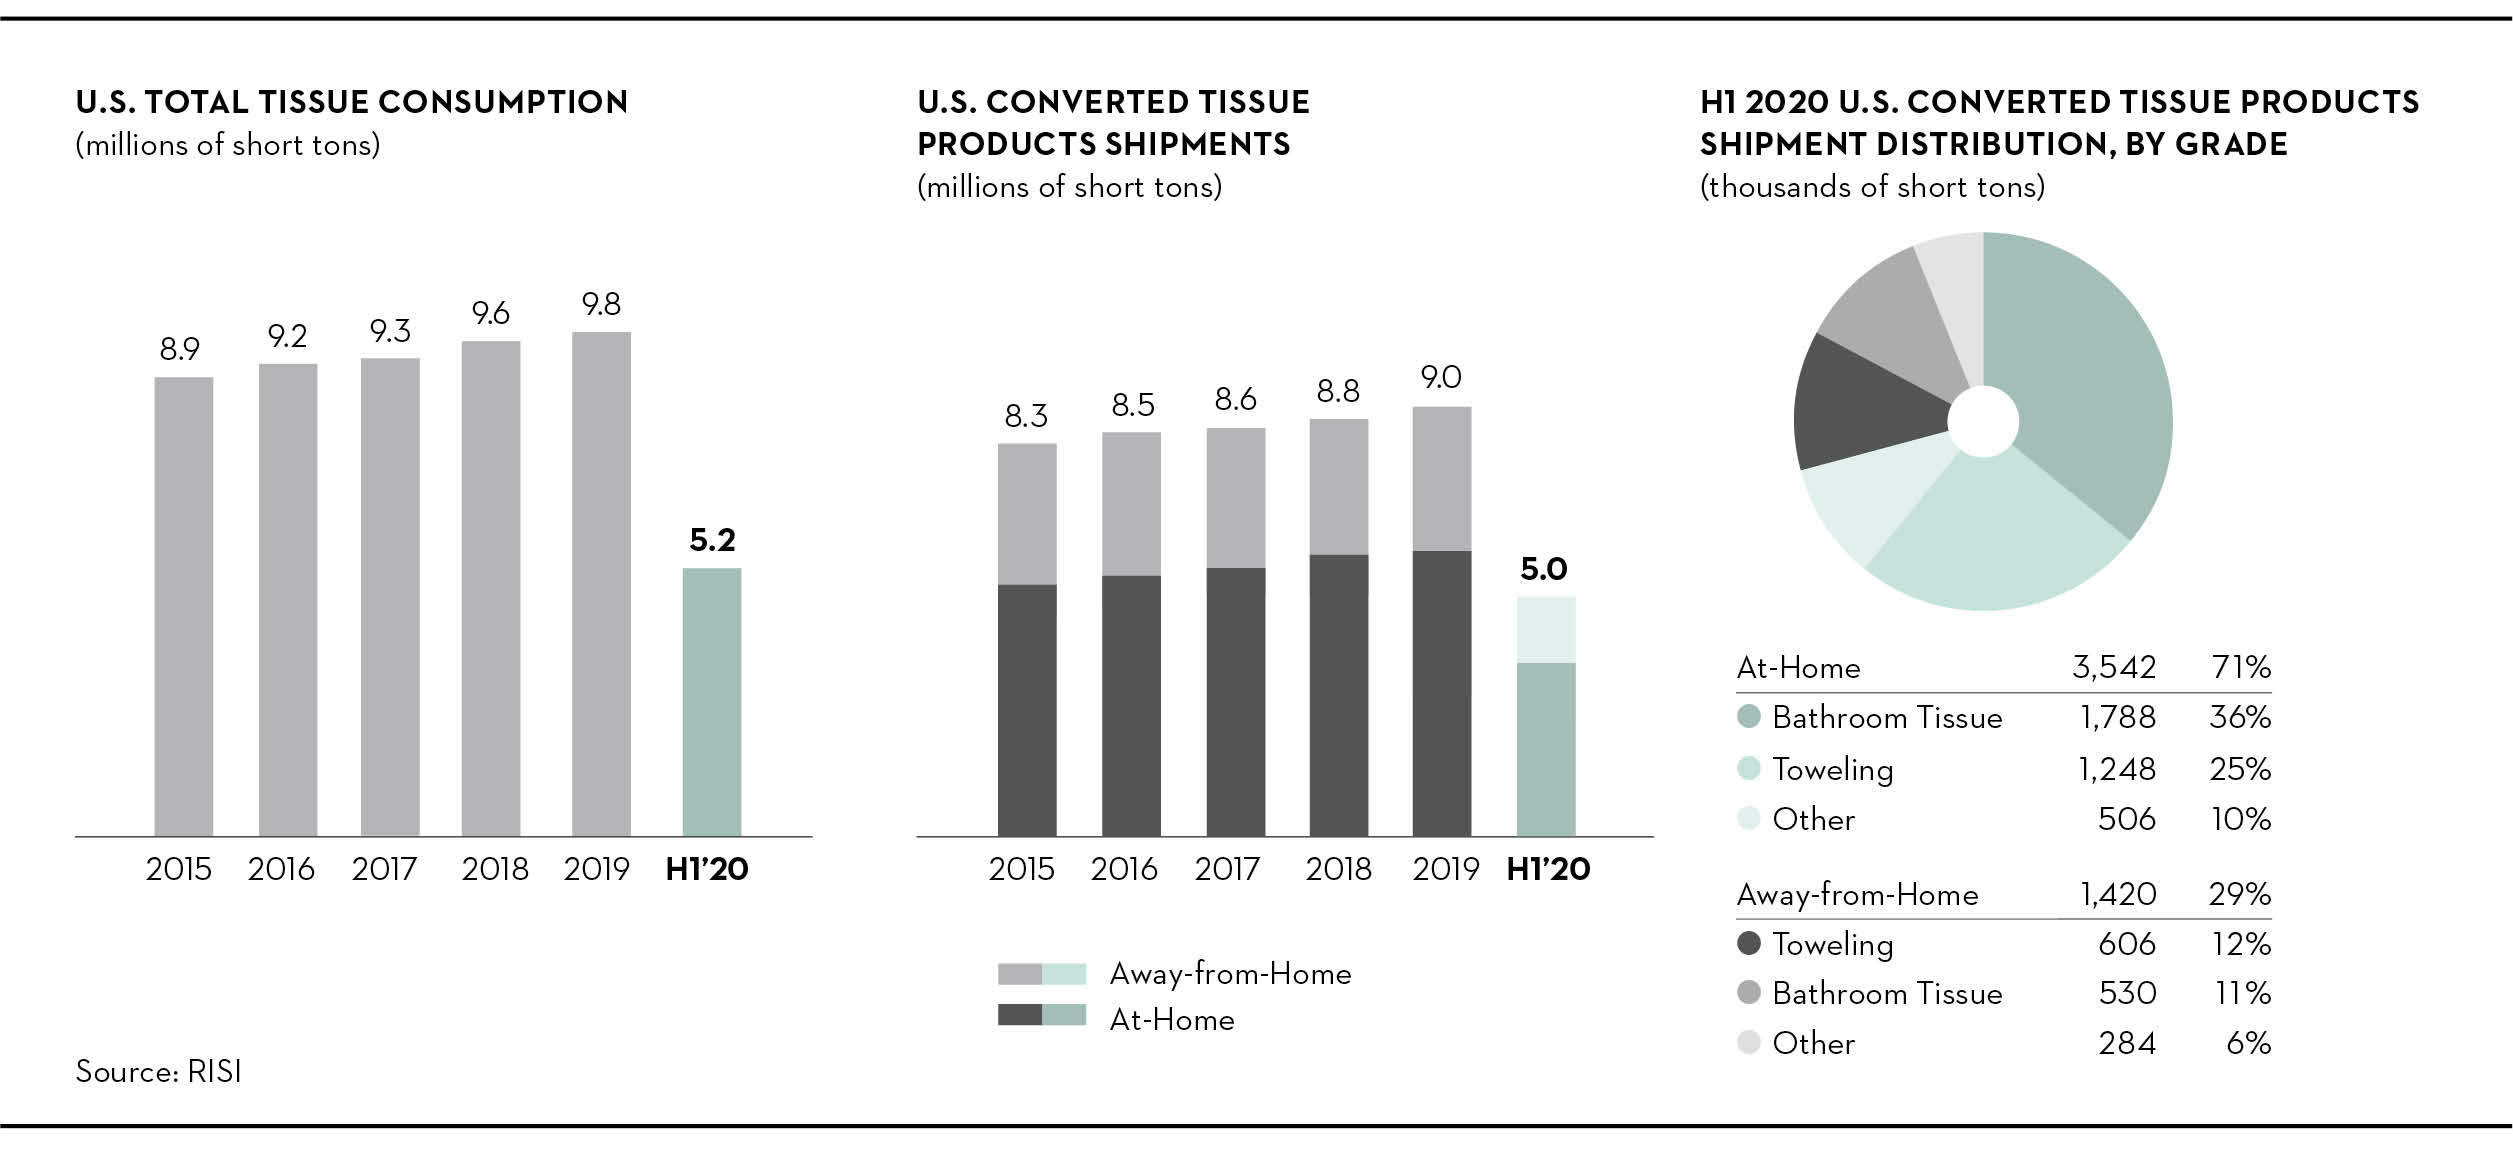
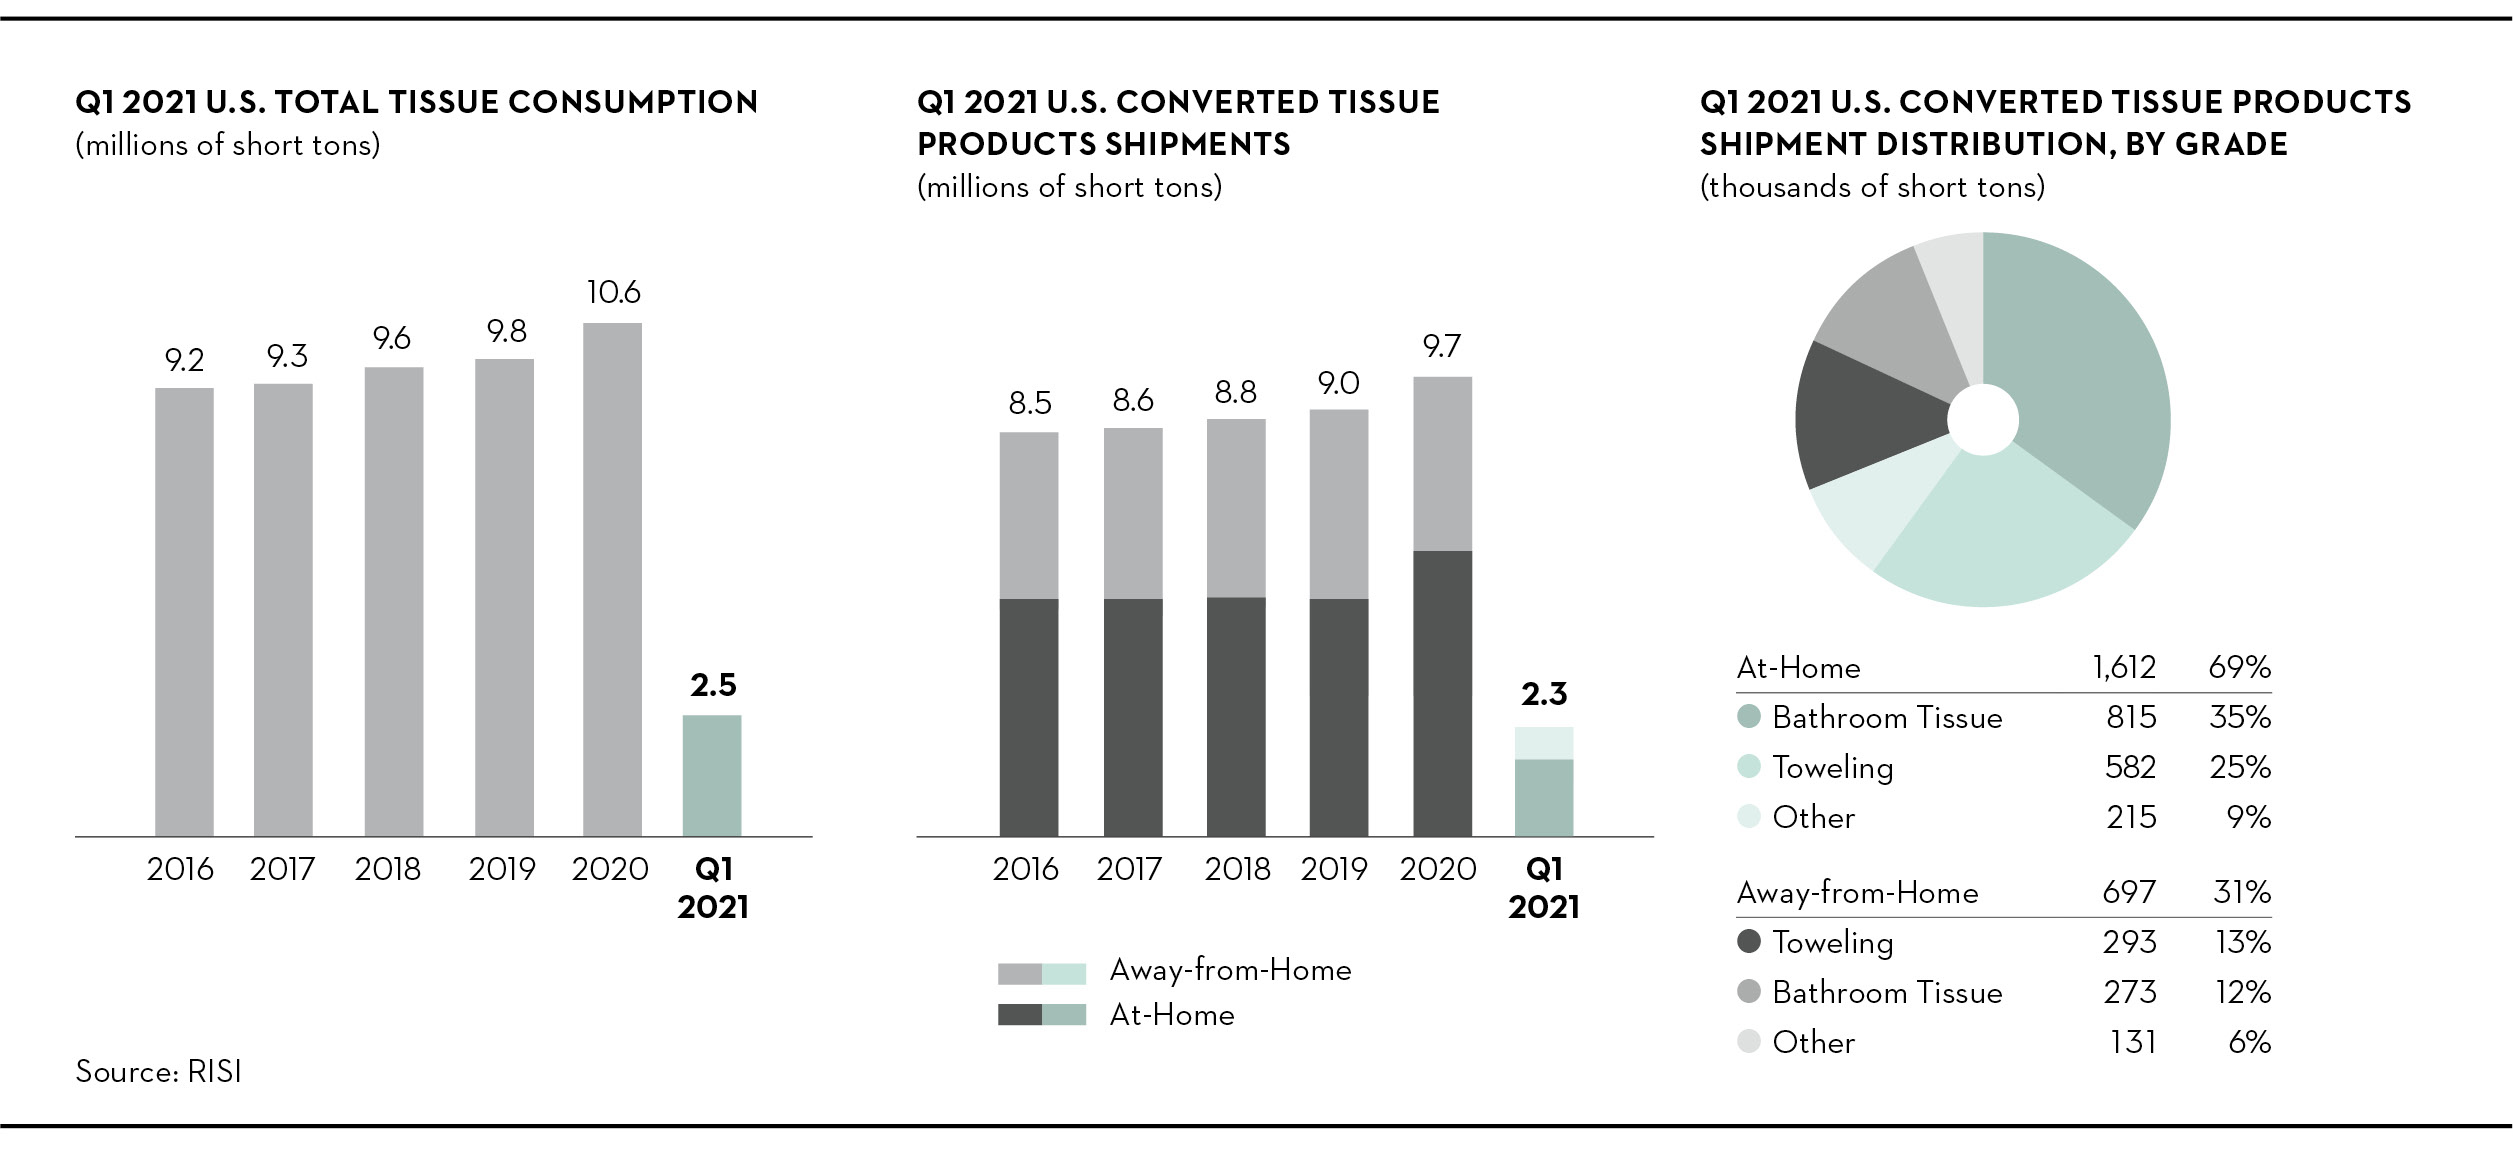
Total U.S. tissue consumption grew by 6.4%1.3% in the first halfthree months of 20202021 compared to the year-ago period. Converted product shipments increaseddecreased by 10.2%5.6%, led bywhere at-home shipments updecreased by 18.4%5.1%, whileand away-from-home shipments decreased by 6.0%6.7%.
U.S. parent roll production rosefell by 5.8%0.4% in the first sixthree months, contributing to a 97%and the average industry production-to-capacity ratio updecreased to 93%, down from 93%94% in the year-ago period.
Three months ended June 30,March 31, 2021 vs. March 31, 2020 vs. June 30, 2019
Operating loss(loss) income variance analysis
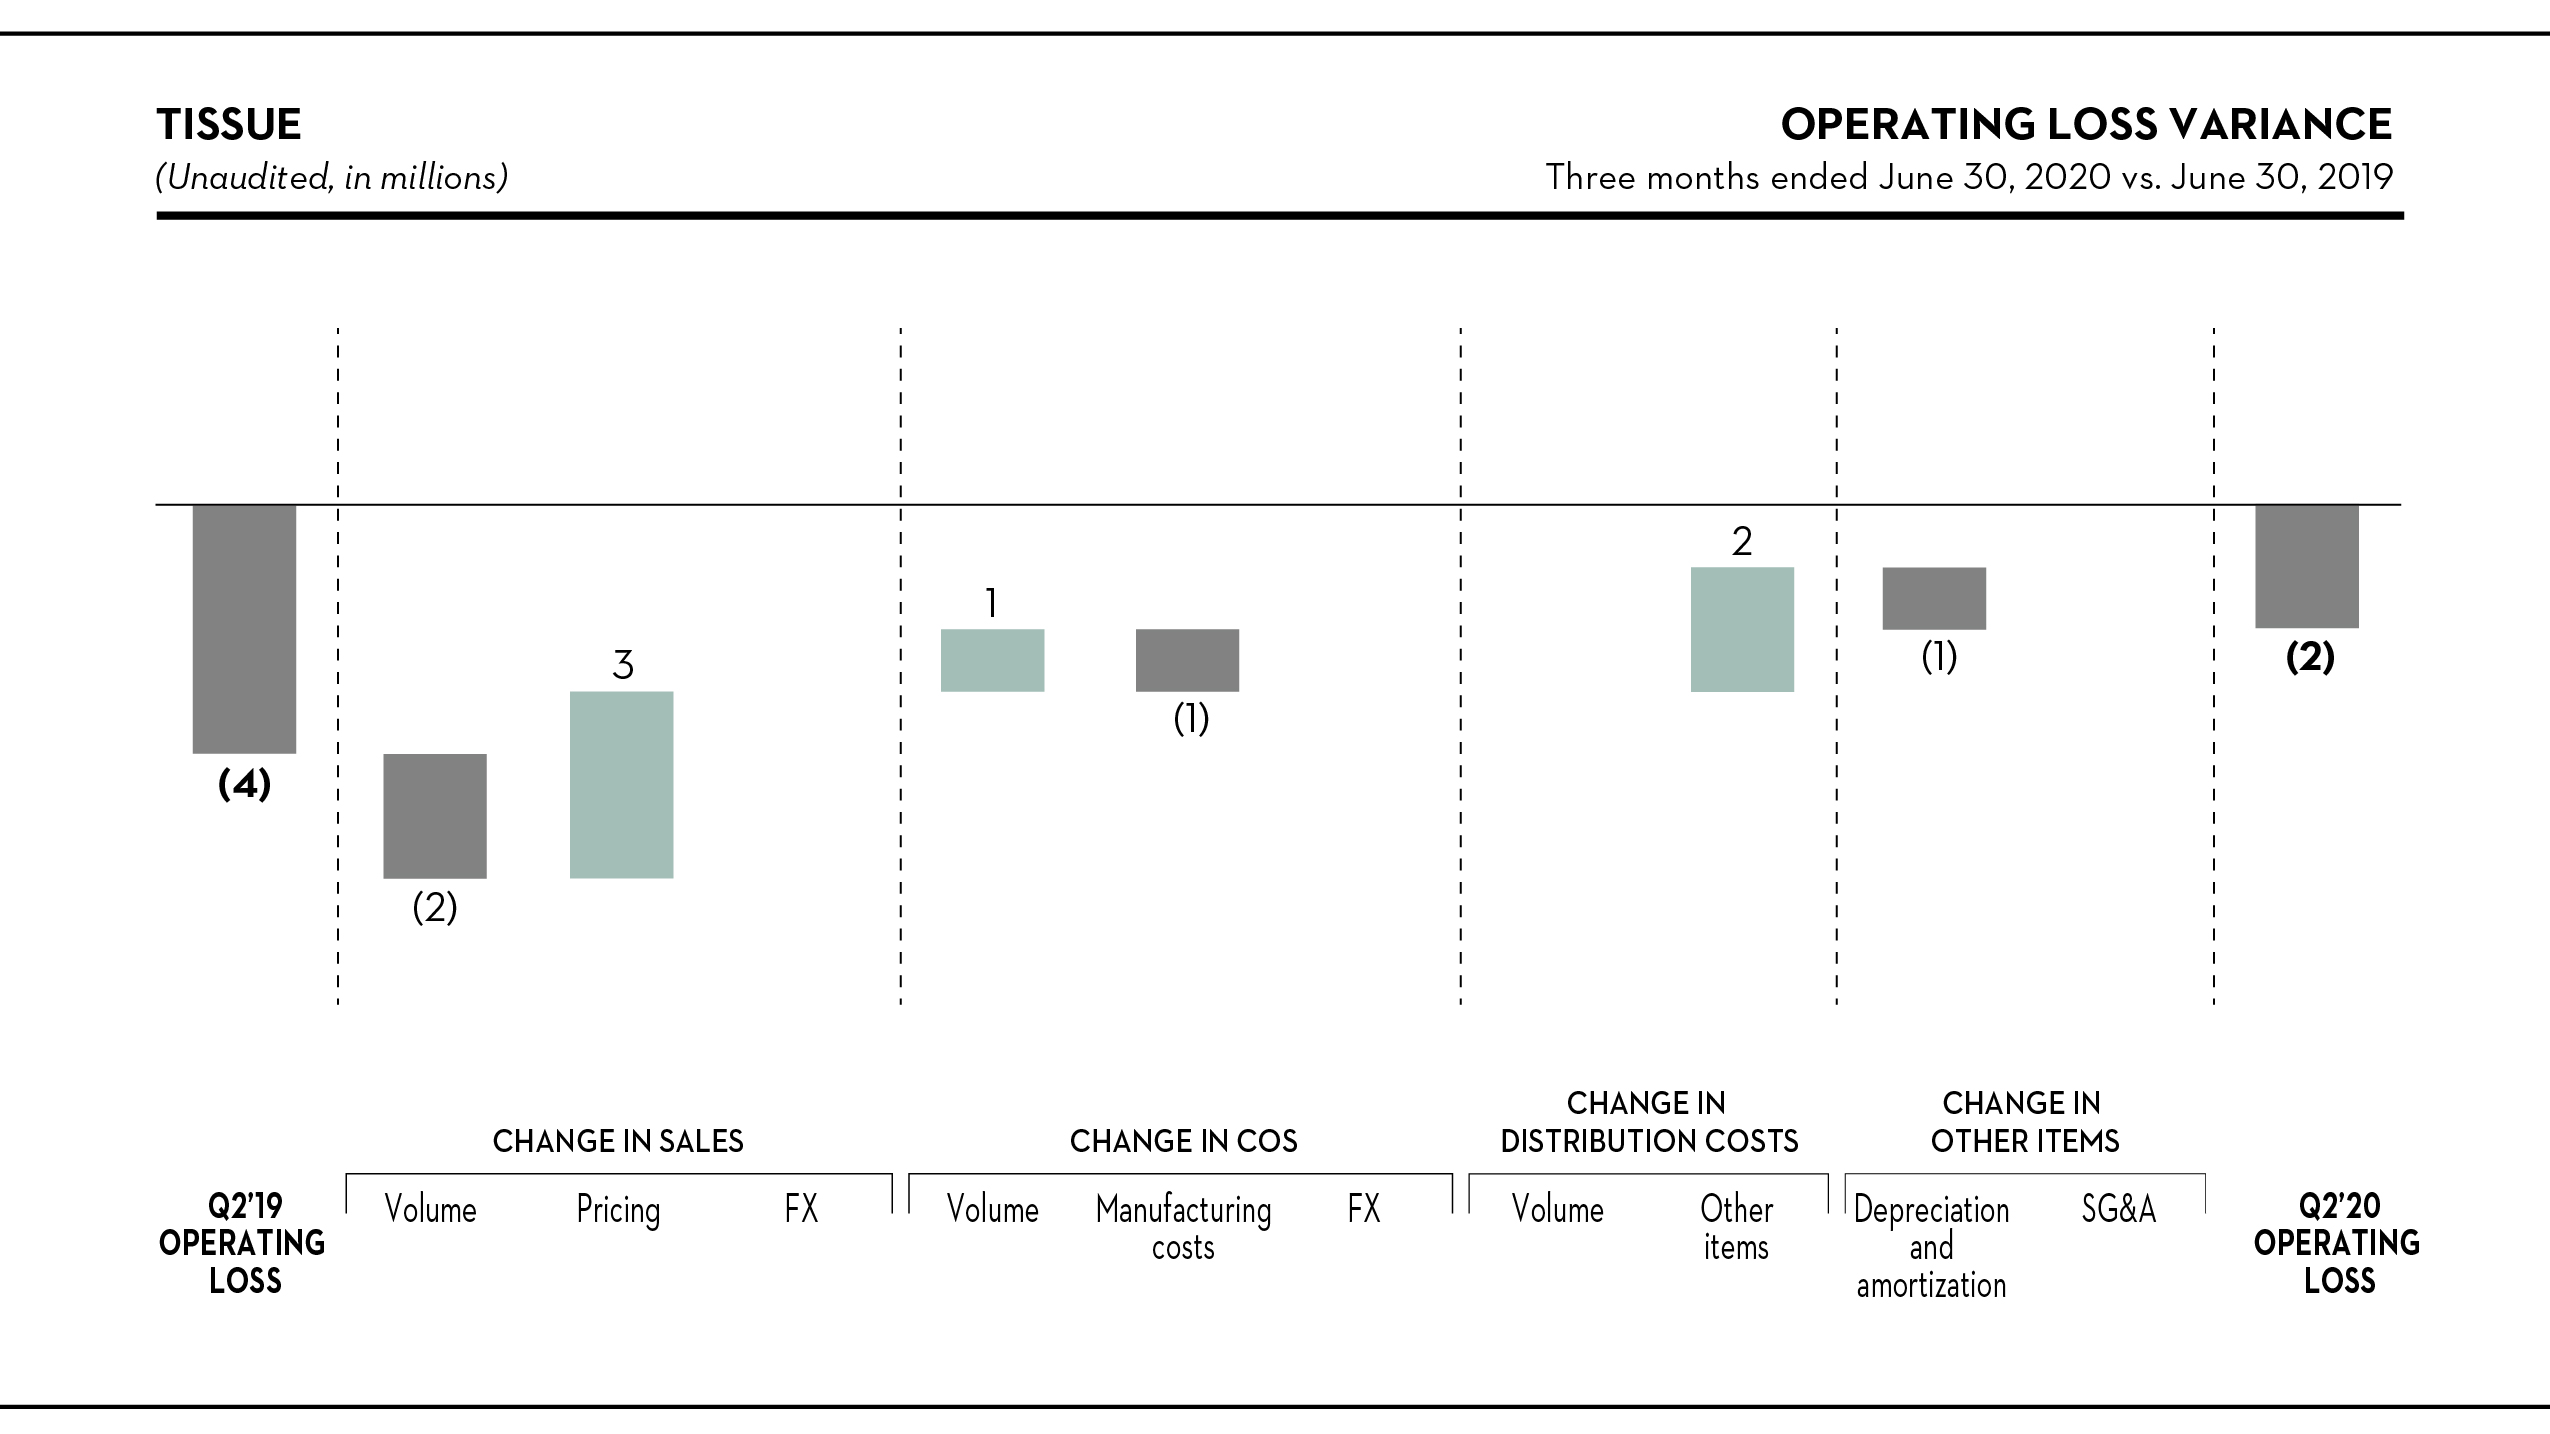
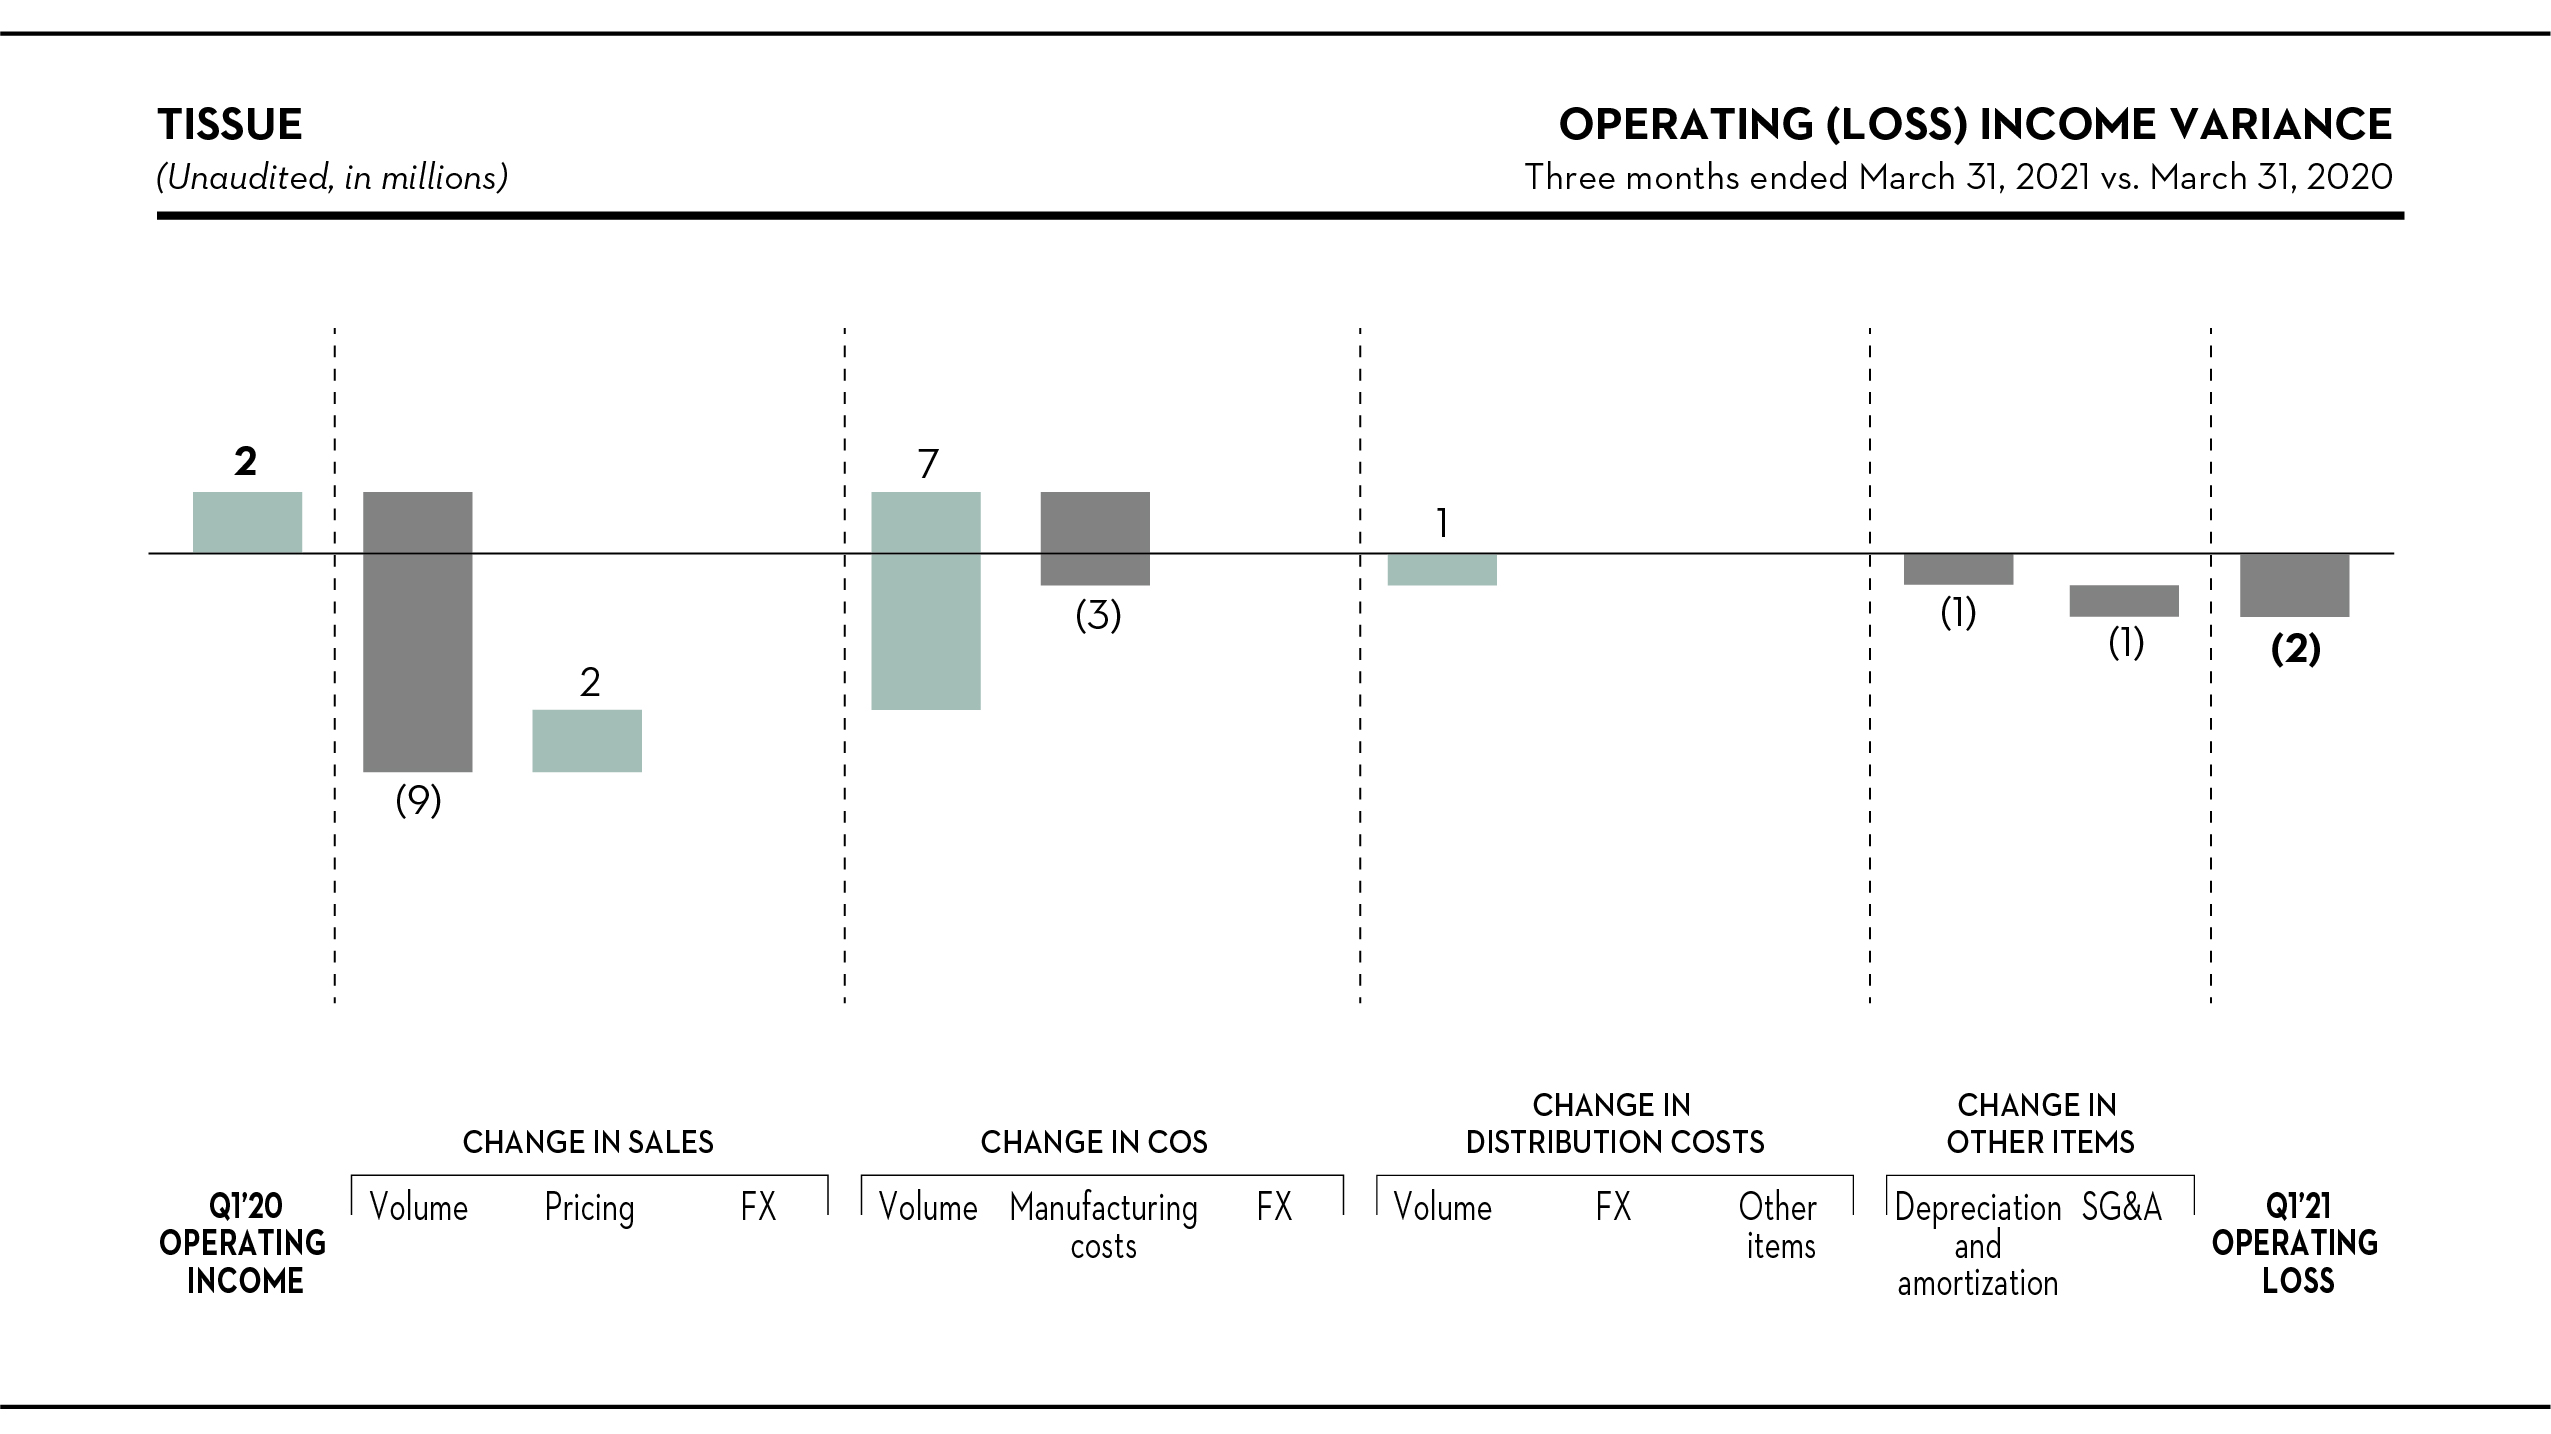
Sales
Sales were $1$7 million higher,lower, or 2%14%, to $44$42 million in the quarter. Shipments decreased by 5,000 short tons mainly in away-from-home products, due to the ongoing pandemic. The average transaction price was $128$80 per short ton higher, due to favorable product mix and price increases. Shipments decreased by 1,000 short tons.pricing on converted products.
Cost of sales, excluding depreciation, amortization and distribution costs
After removing the effect of lower volume, our manufacturing costs increased by $1$3 million compared to the year-ago period, mainly due to an expense related to a process improvement project ($2 million) and costs to ramp-up the timingHagerstown (Maryland) converting facility acquired in the fourth quarter of annual outages.2020 ($1 million).
28
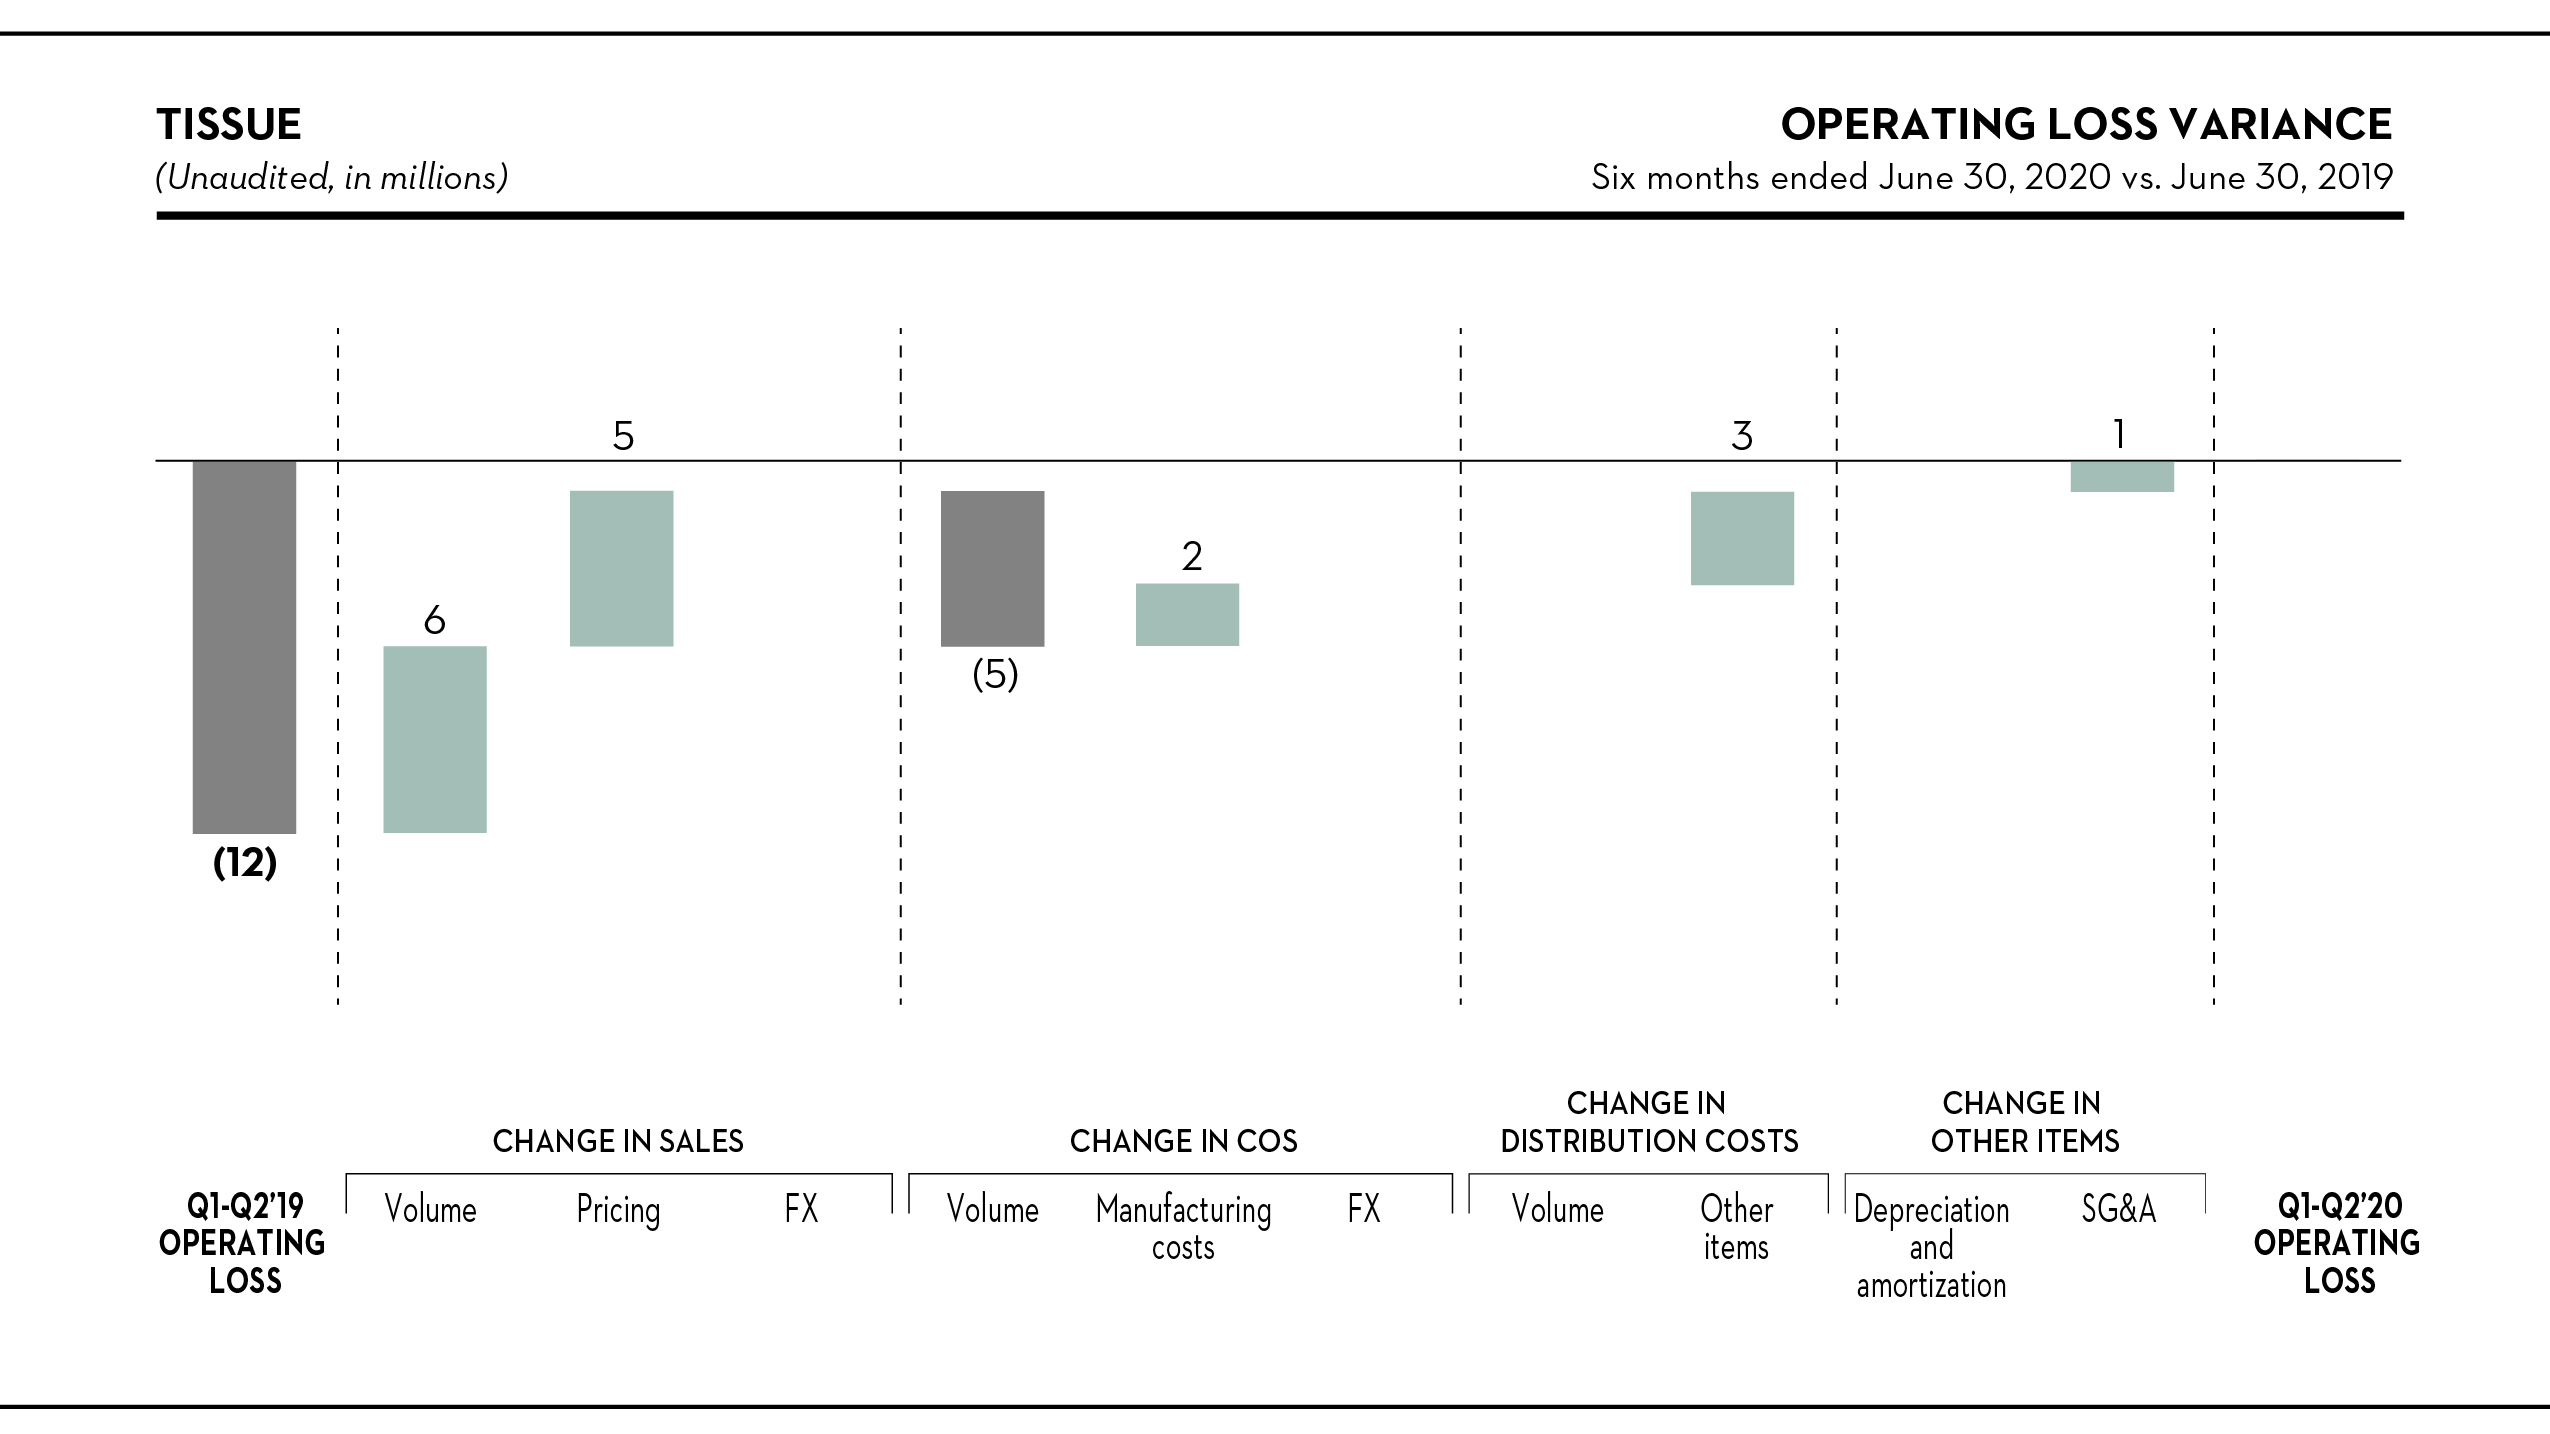
WOOD PRODUCTS
Highlights
| Three Months Ended March 31, | |||||||||||||||||||||||||||||||||||||||||
| (Unaudited, in millions, except where otherwise stated) | 2021 | 2020 | |||||||||||||||||||||||||||||||||||||||
| Sales | $ | 430 | $ | 174 | |||||||||||||||||||||||||||||||||||||
Operating income (1) | $ | 221 | $ | 5 | |||||||||||||||||||||||||||||||||||||
EBITDA (2) | $ | 232 | $ | 16 | |||||||||||||||||||||||||||||||||||||
| (In millions board feet) | |||||||||||||||||||||||||||||||||||||||||
Shipments (3) | 492 | 443 | |||||||||||||||||||||||||||||||||||||||
| Downtime | 30 | 95 | |||||||||||||||||||||||||||||||||||||||
| Three Months Ended June 30, | Six Months Ended June 30, | ||||||||||||||||
| (Unaudited, in millions, except where otherwise stated) | 2020 | 2019 | 2020 | 2019 | |||||||||||||
| Sales | $ | 199 | $ | 168 | $ | 373 | $ | 329 | |||||||||
Operating income (loss) (1) | $ | 15 | $ | (3 | ) | $ | 20 | $ | 3 | ||||||||
EBITDA (2) | $ | 25 | $ | 6 | $ | 41 | $ | 20 | |||||||||
| (In millions board feet) | |||||||||||||||||
Shipments (3) | 521 | 484 | 964 | 912 | |||||||||||||
| Downtime | 73 | 53 | 168 | 94 | |||||||||||||
| March 31, | ||||||||||||||||||||
| (Unaudited, in millions board feet) | 2021 | 2020 | ||||||||||||||||||
Finished goods inventory (3) | 143 | 148 | ||||||||||||||||||
(1)Net income including noncontrolling interest is equal to operating income in this segment.
| June 30, | ||||||||
| (Unaudited, in millions board feet) | 2020 | 2019 | ||||||
Finished goods inventory (3) | 119 | 122 | ||||||
| Three Months Ended June 30, | Six Months Ended June 30, | ||||||||||||||||
| (Unaudited, in millions) | 2020 | 2019 | 2020 | 2019 | |||||||||||||
| Net income (loss) including noncontrolling interest | $ | 15 | $ | (3 | ) | $ | 20 | $ | 3 | ||||||||
| Depreciation and amortization | 10 | 9 | 21 | 17 | |||||||||||||
| EBITDA | $ | 25 | $ | 6 | $ | 41 | $ | 20 | |||||||||
| Three Months Ended March 31, | |||||||||||||||||||||||||||||||||||||||||
| (Unaudited, in millions) | 2021 | 2020 | |||||||||||||||||||||||||||||||||||||||
| Net income including noncontrolling interest | $ | 221 | $ | 5 | |||||||||||||||||||||||||||||||||||||
| Depreciation and amortization | 11 | 11 | |||||||||||||||||||||||||||||||||||||||
| EBITDA | $ | 232 | $ | 16 | |||||||||||||||||||||||||||||||||||||
Industry trends
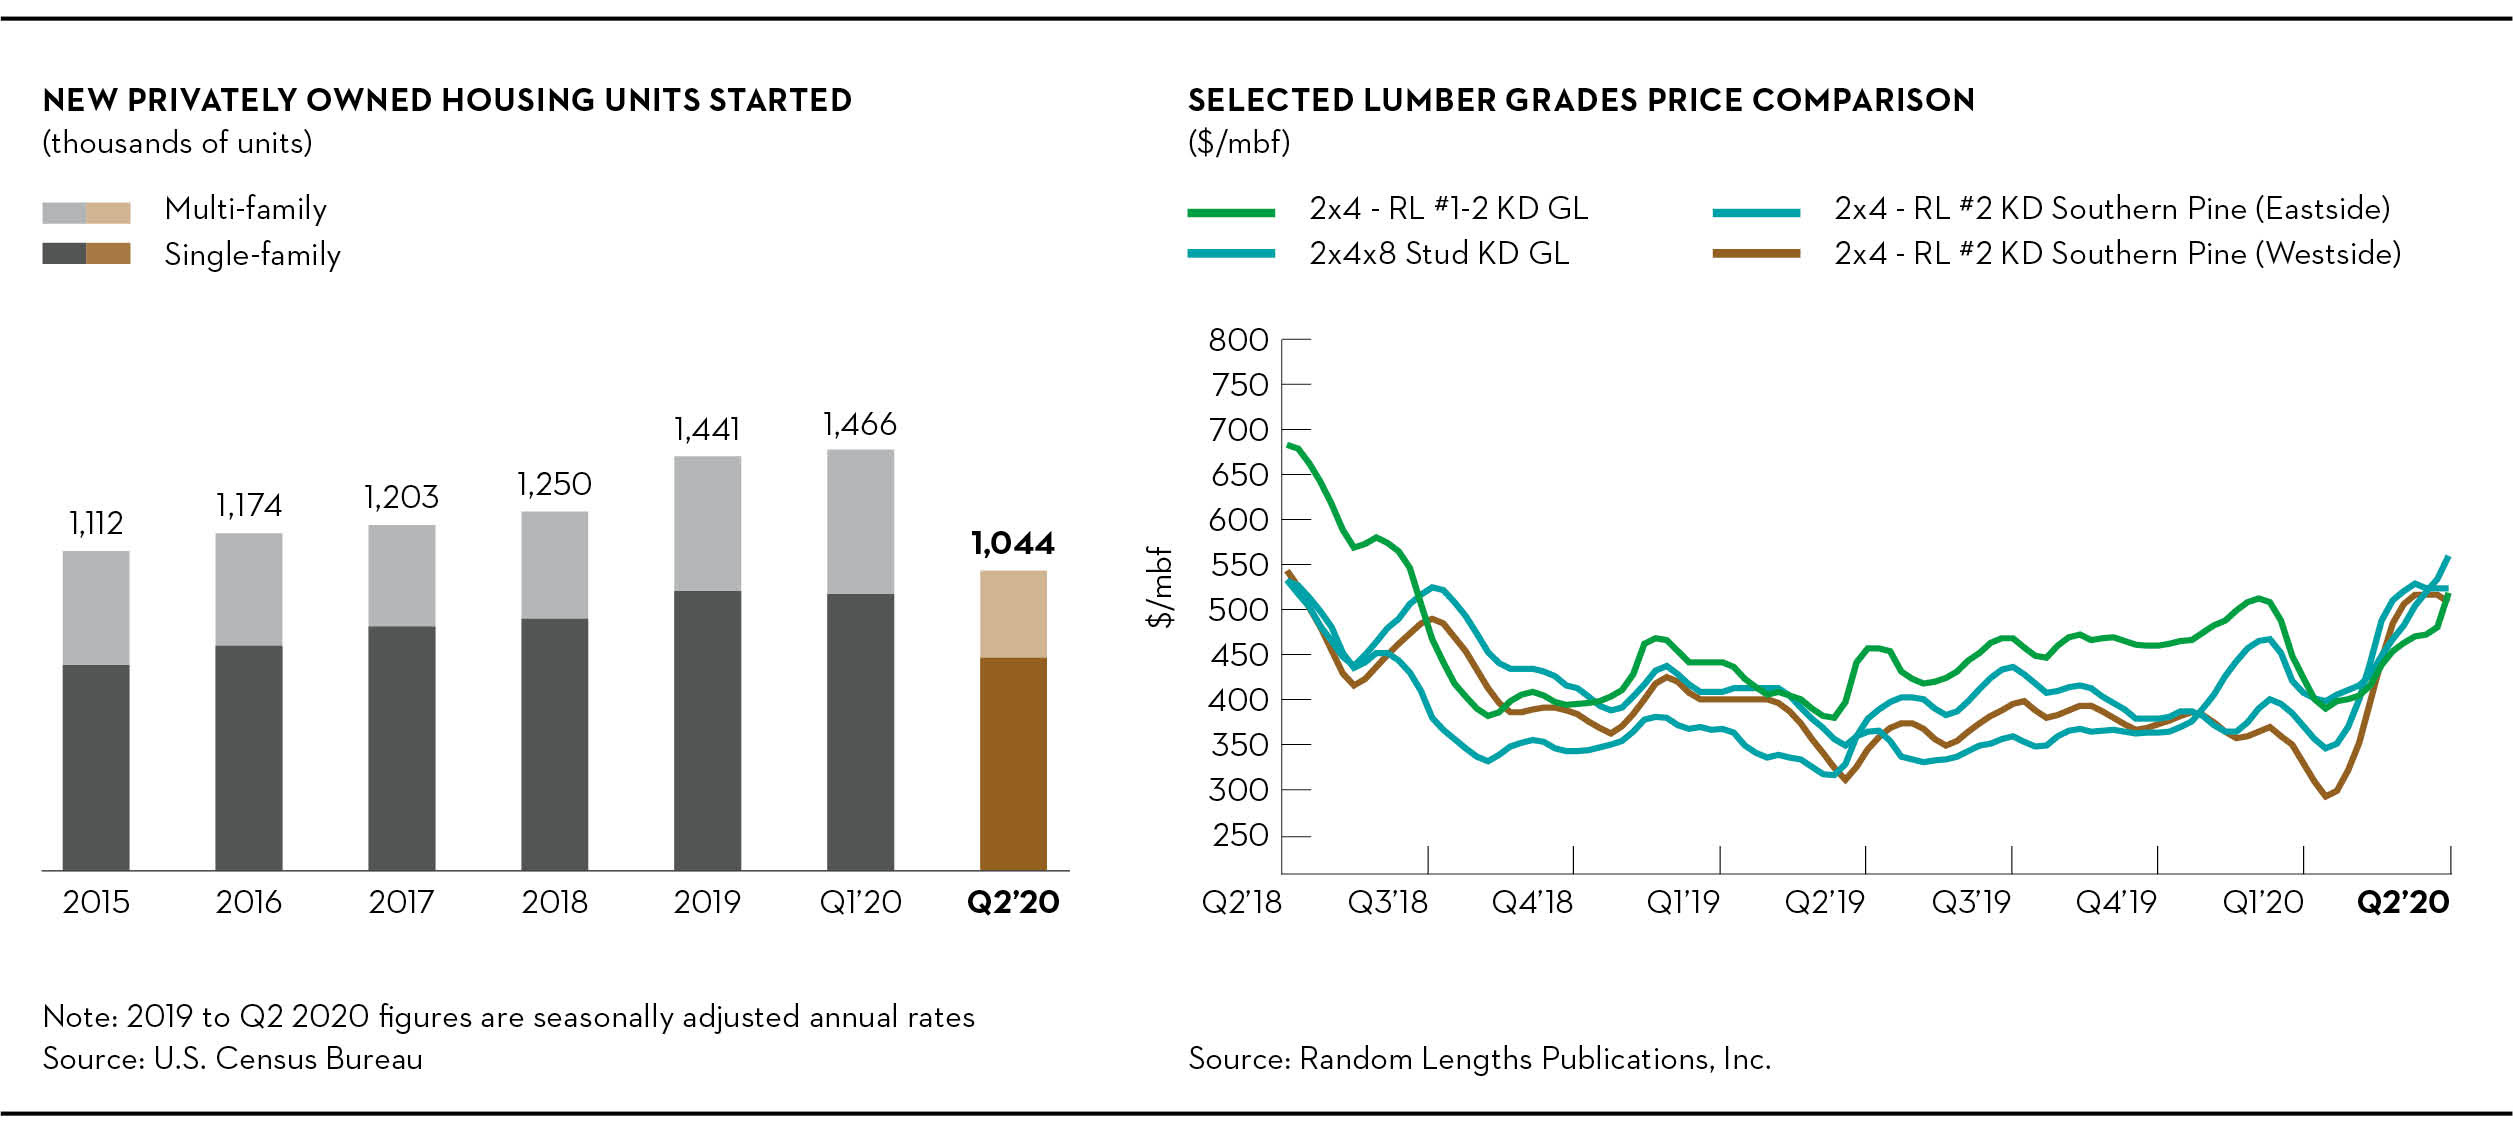
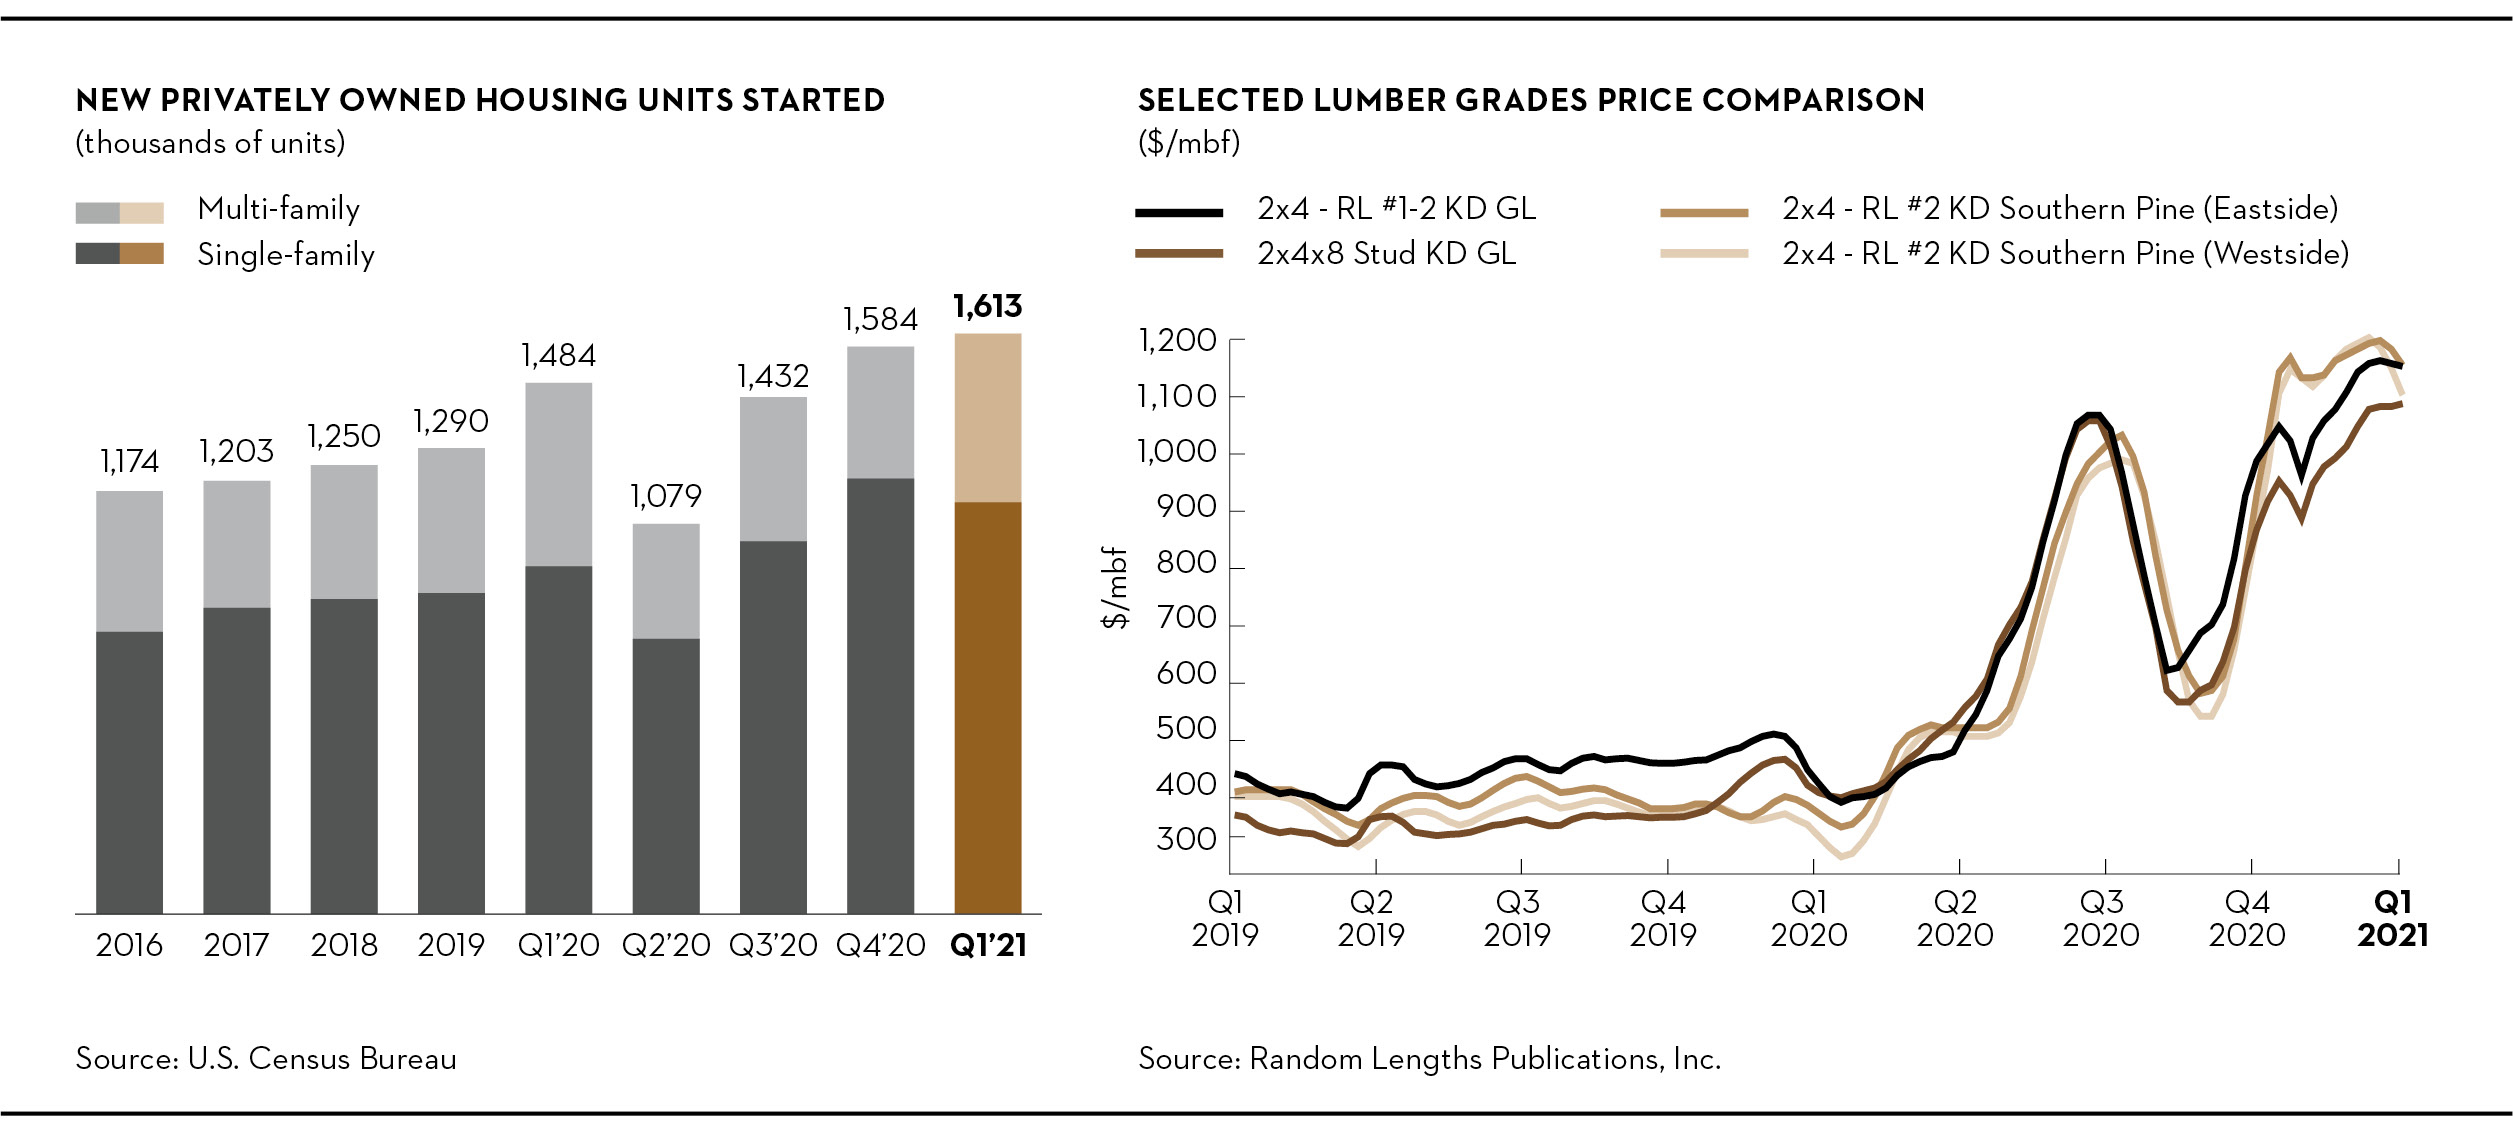
29
Three months ended June 30,March 31, 2021 vs. March 31, 2020 vs. June 30, 2019
Operating income (loss) variance analysis
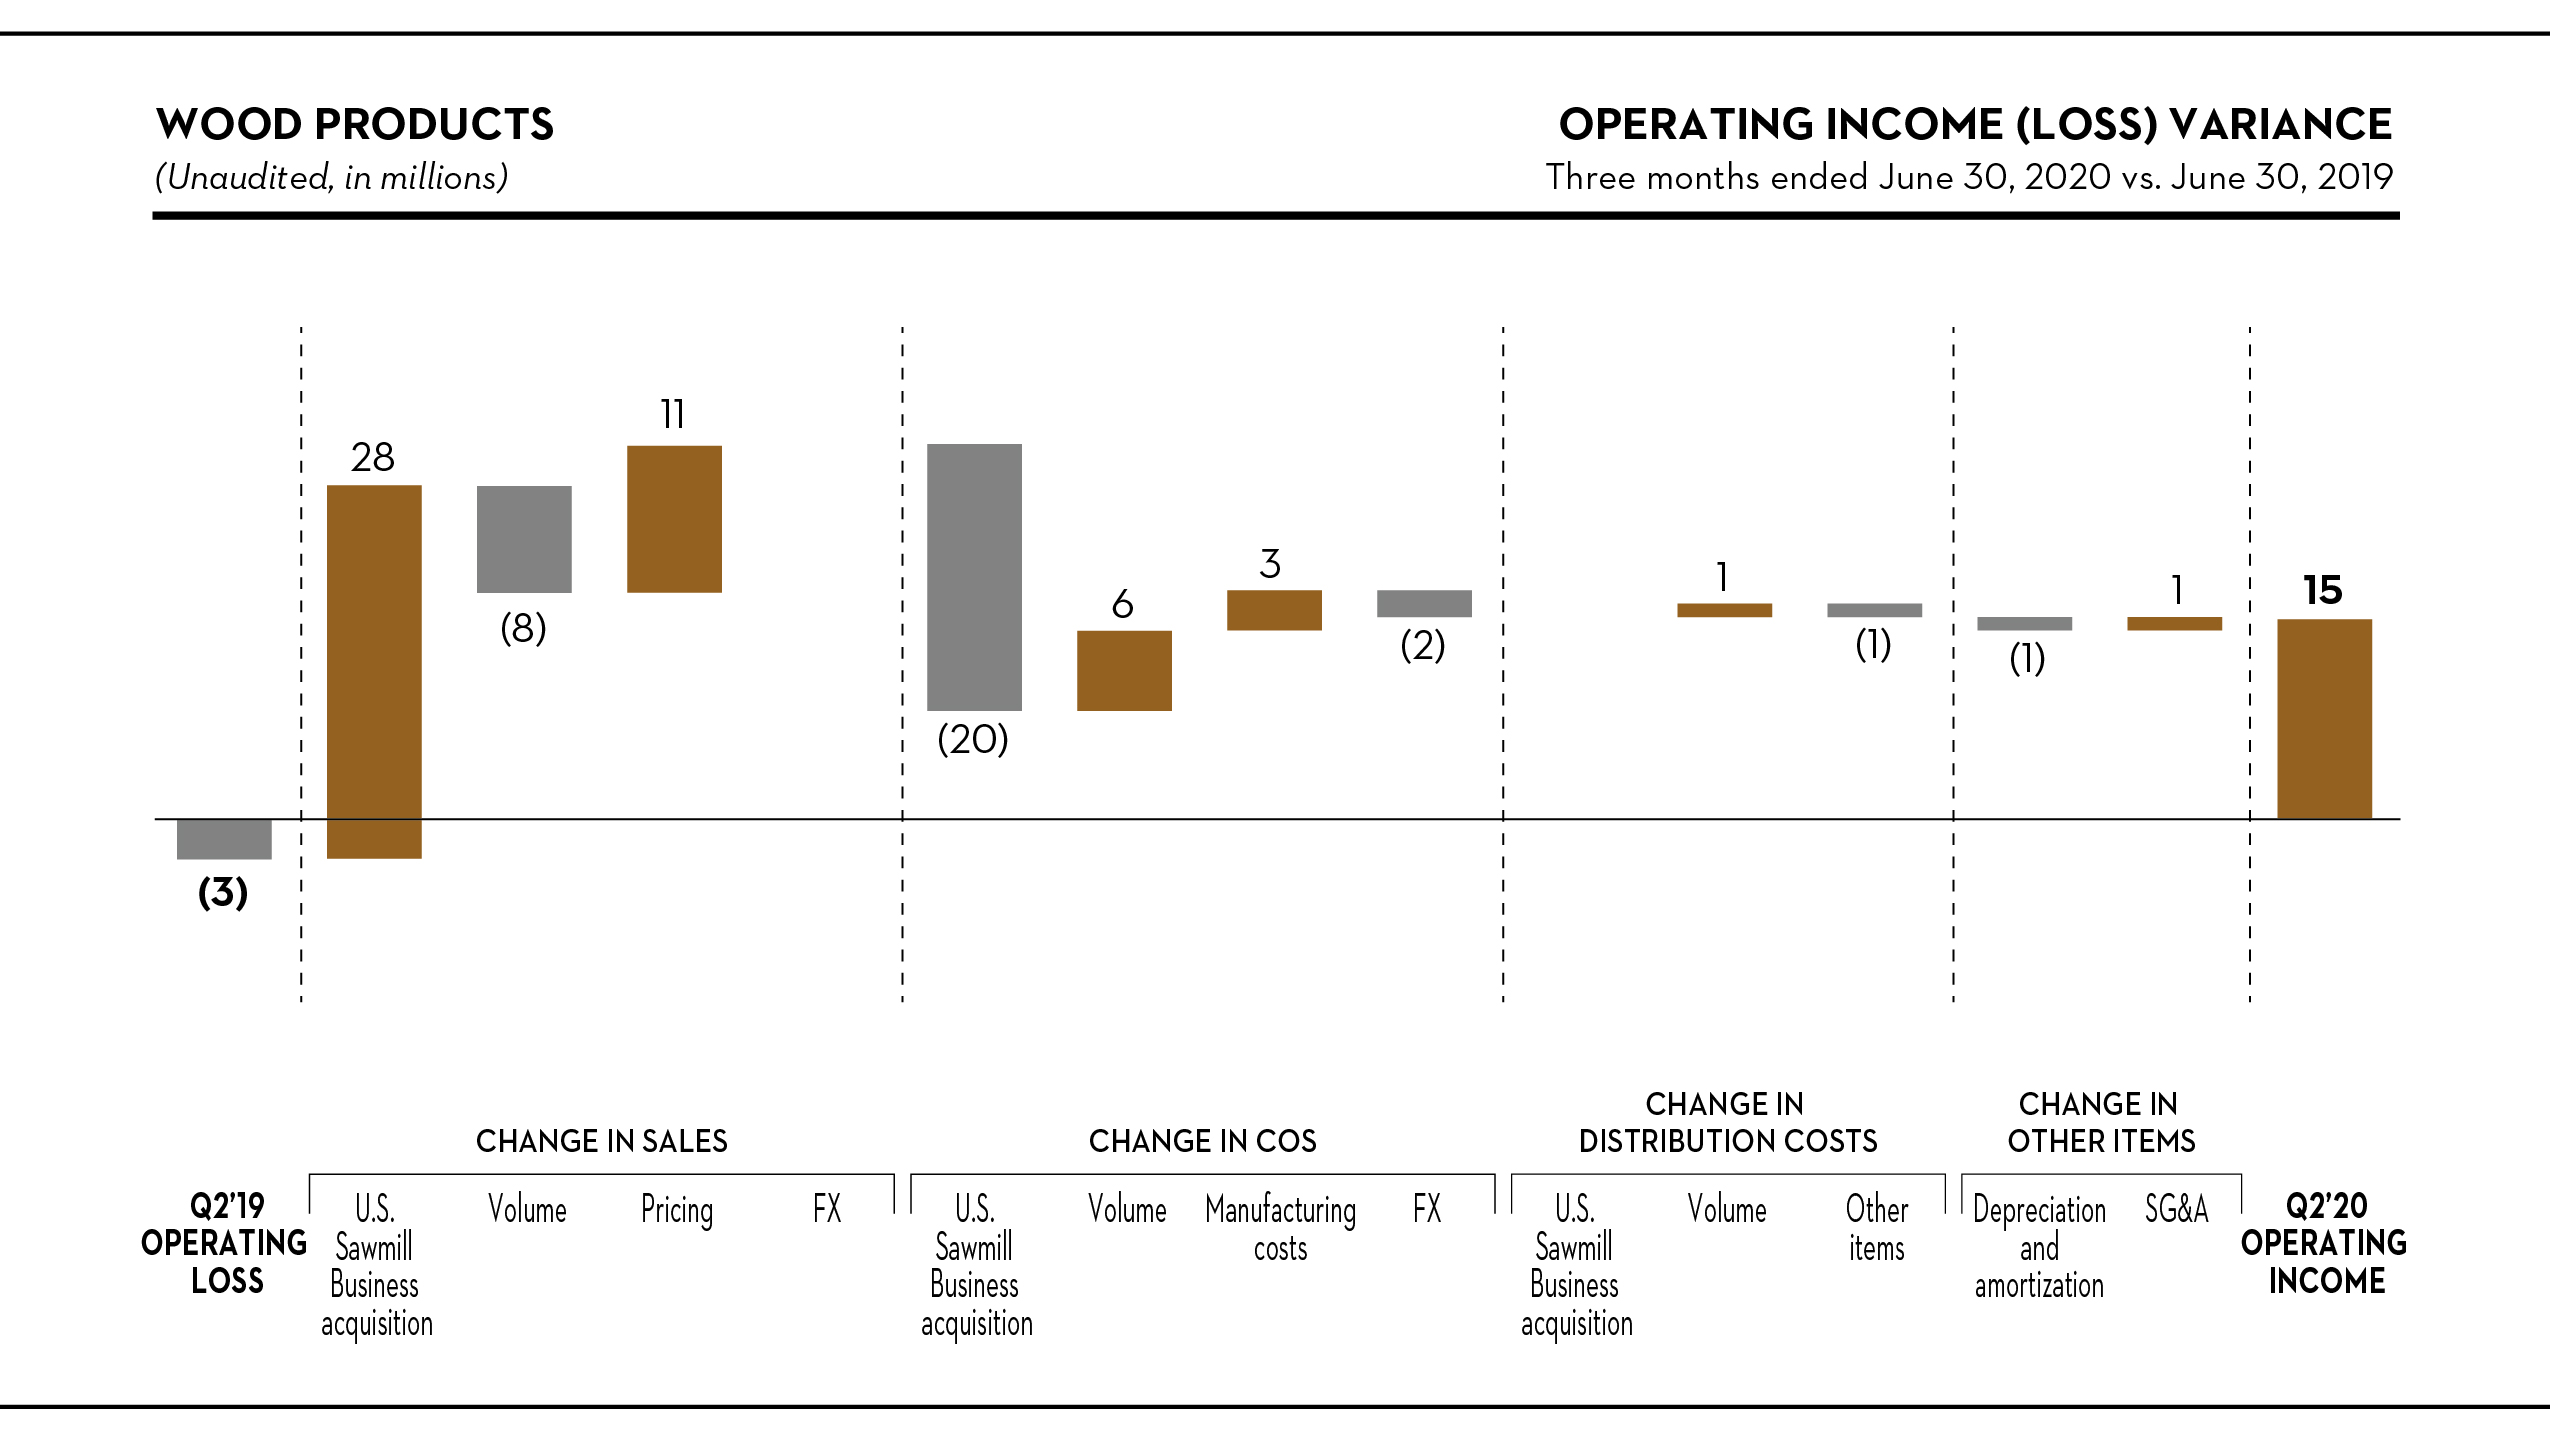
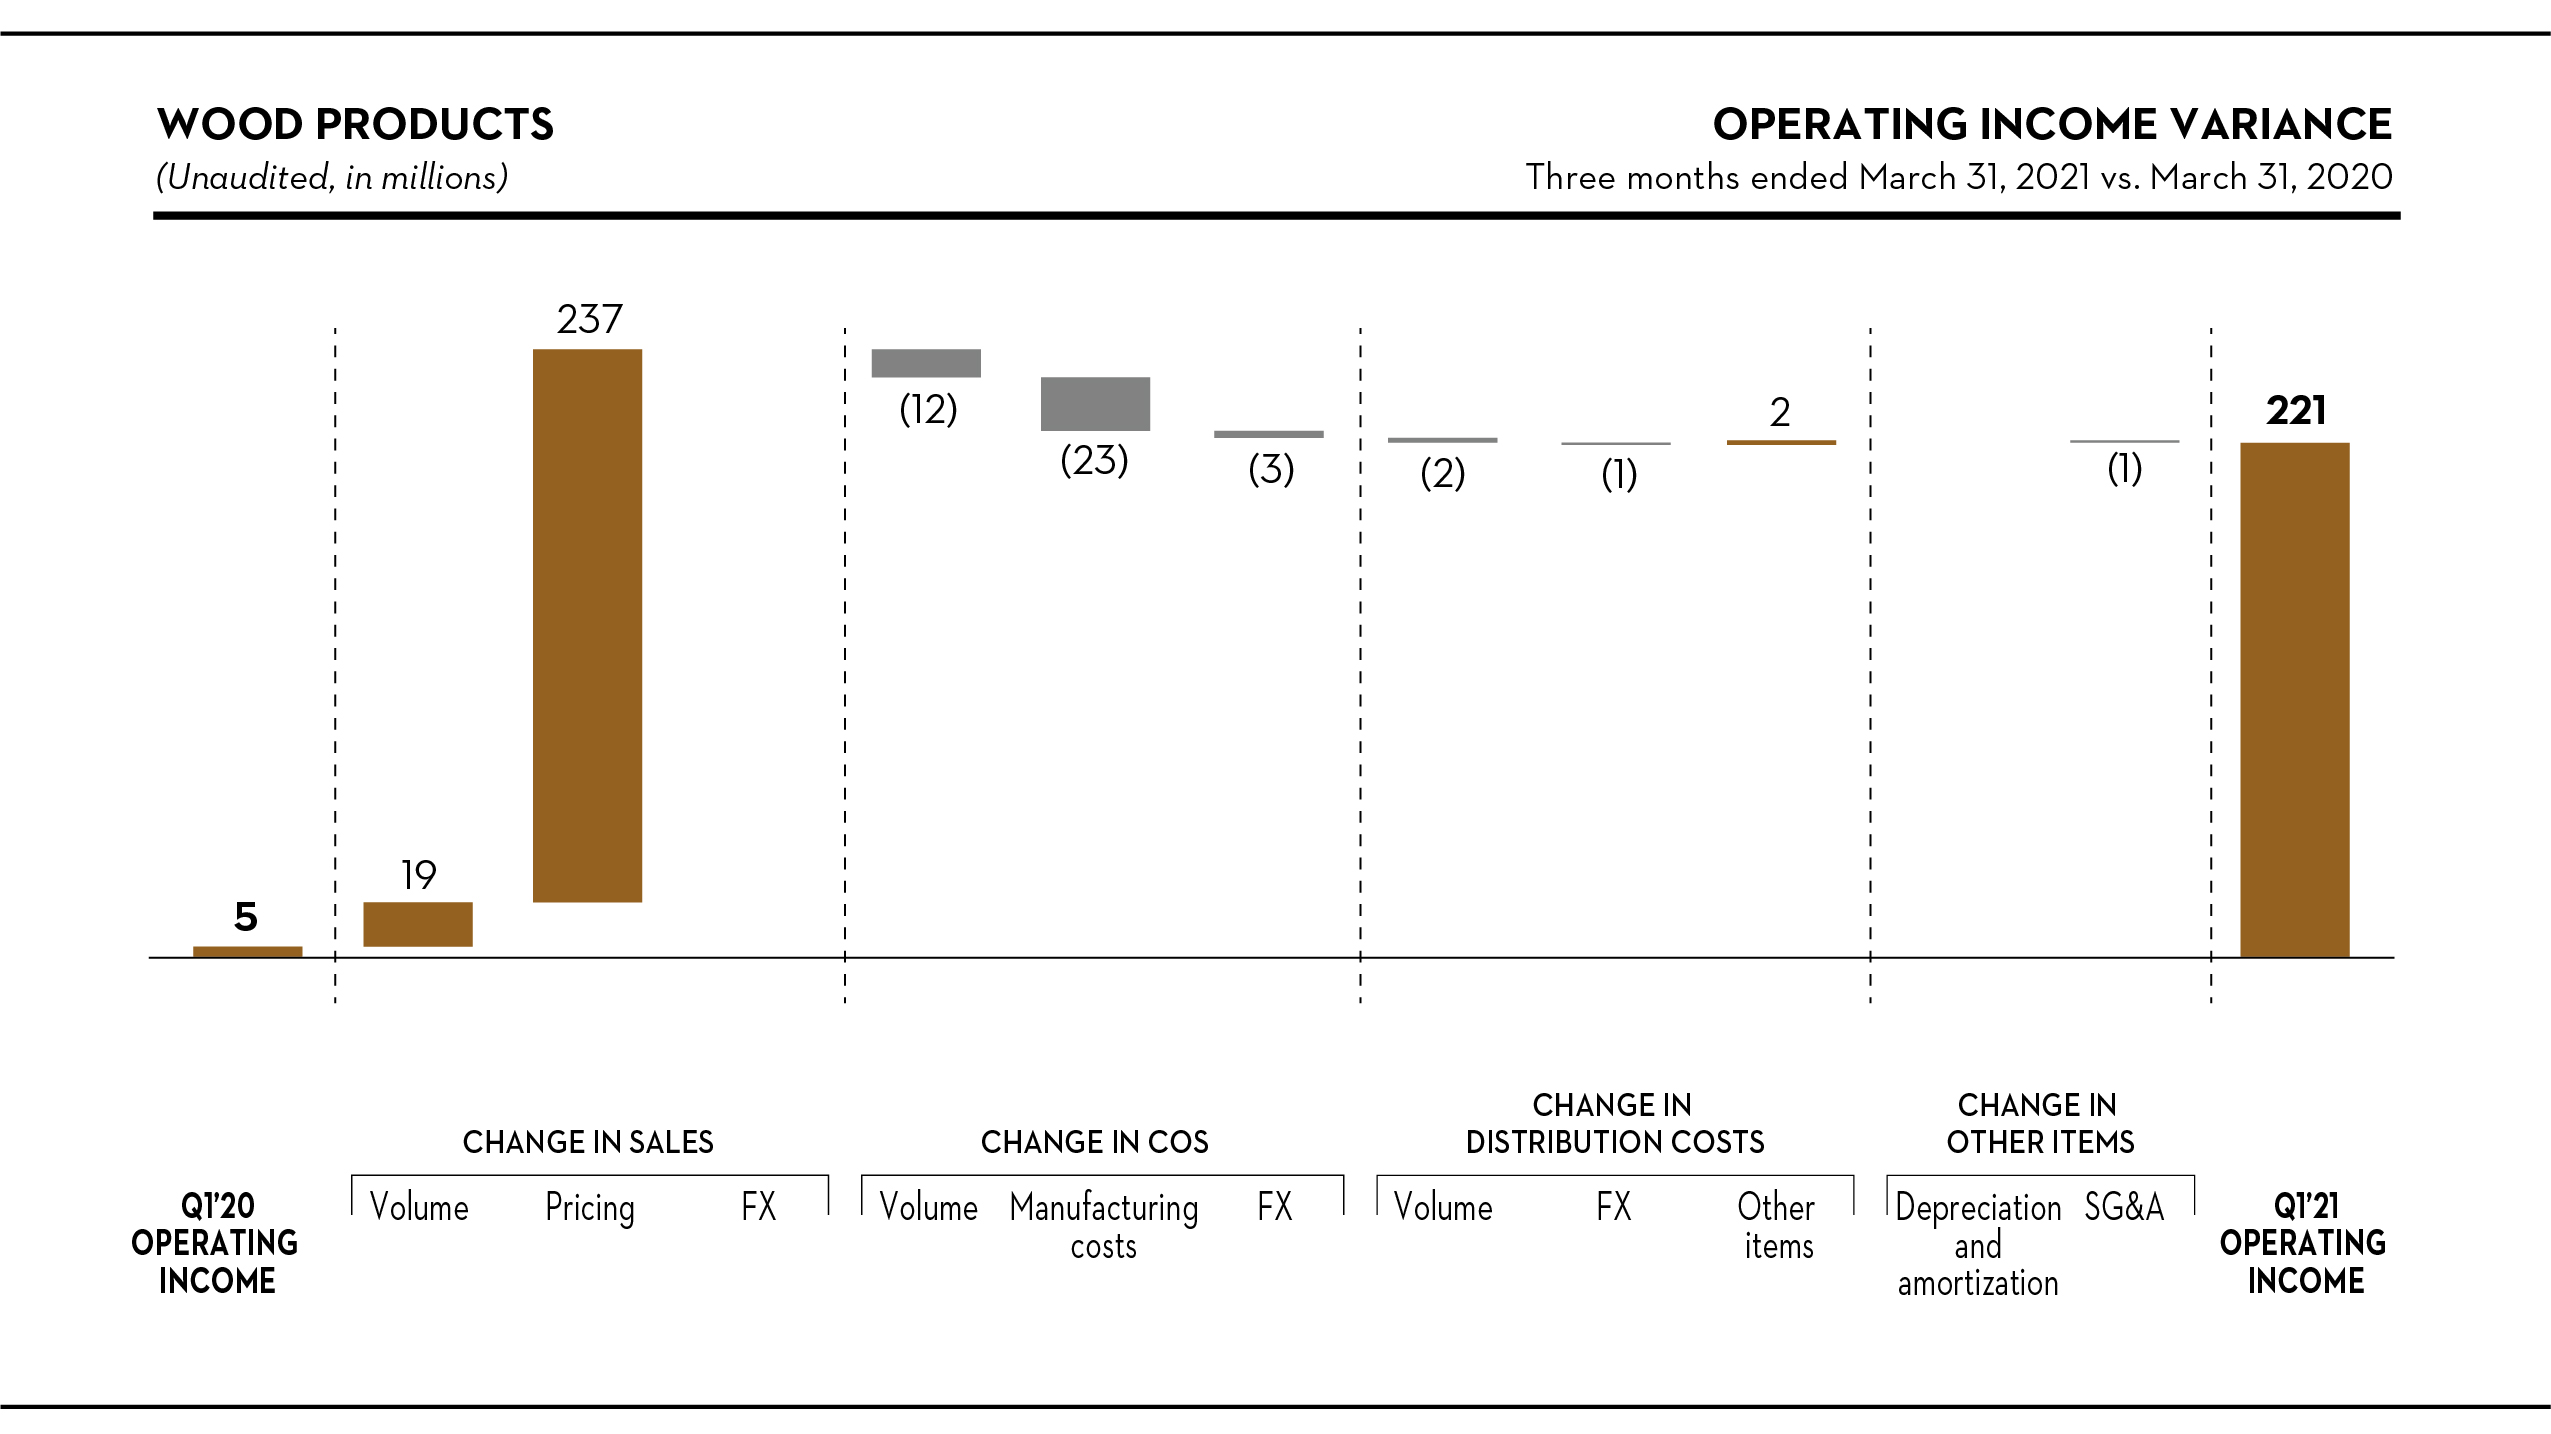
Sales
Sales were $31$256 million higher, or 18%147%, to $199$430 million in the quarter, primarily due to the sales related to the acquisition of the U.S. Sawmill Business ($28 million). After removing the sales related to the acquisition, sales volume was $8 million lower, mainly due to a strong second quarter of 2019 and reduced demand related to the COVID-19 pandemic.stronger market conditions. Pricing contributed to an $11a $237 million increase in sales, reflecting a rise inthe increase of the average transaction price of $35by $482 per thousand board feet.feet, or 123%, and volume increased sales by $19 million due to an increase in shipments of 49 million board feet, or 11%.
Cost of sales, excluding depreciation, amortization and distribution costs
After adjusting for the effect of lower volume,removing the COS related to the acquisition of the U.S. Sawmill Business,higher volume and thestronger Canadian dollar, fluctuation, manufacturing costs decreased by $3 million, mainly reflecting lower wood fiber costs.
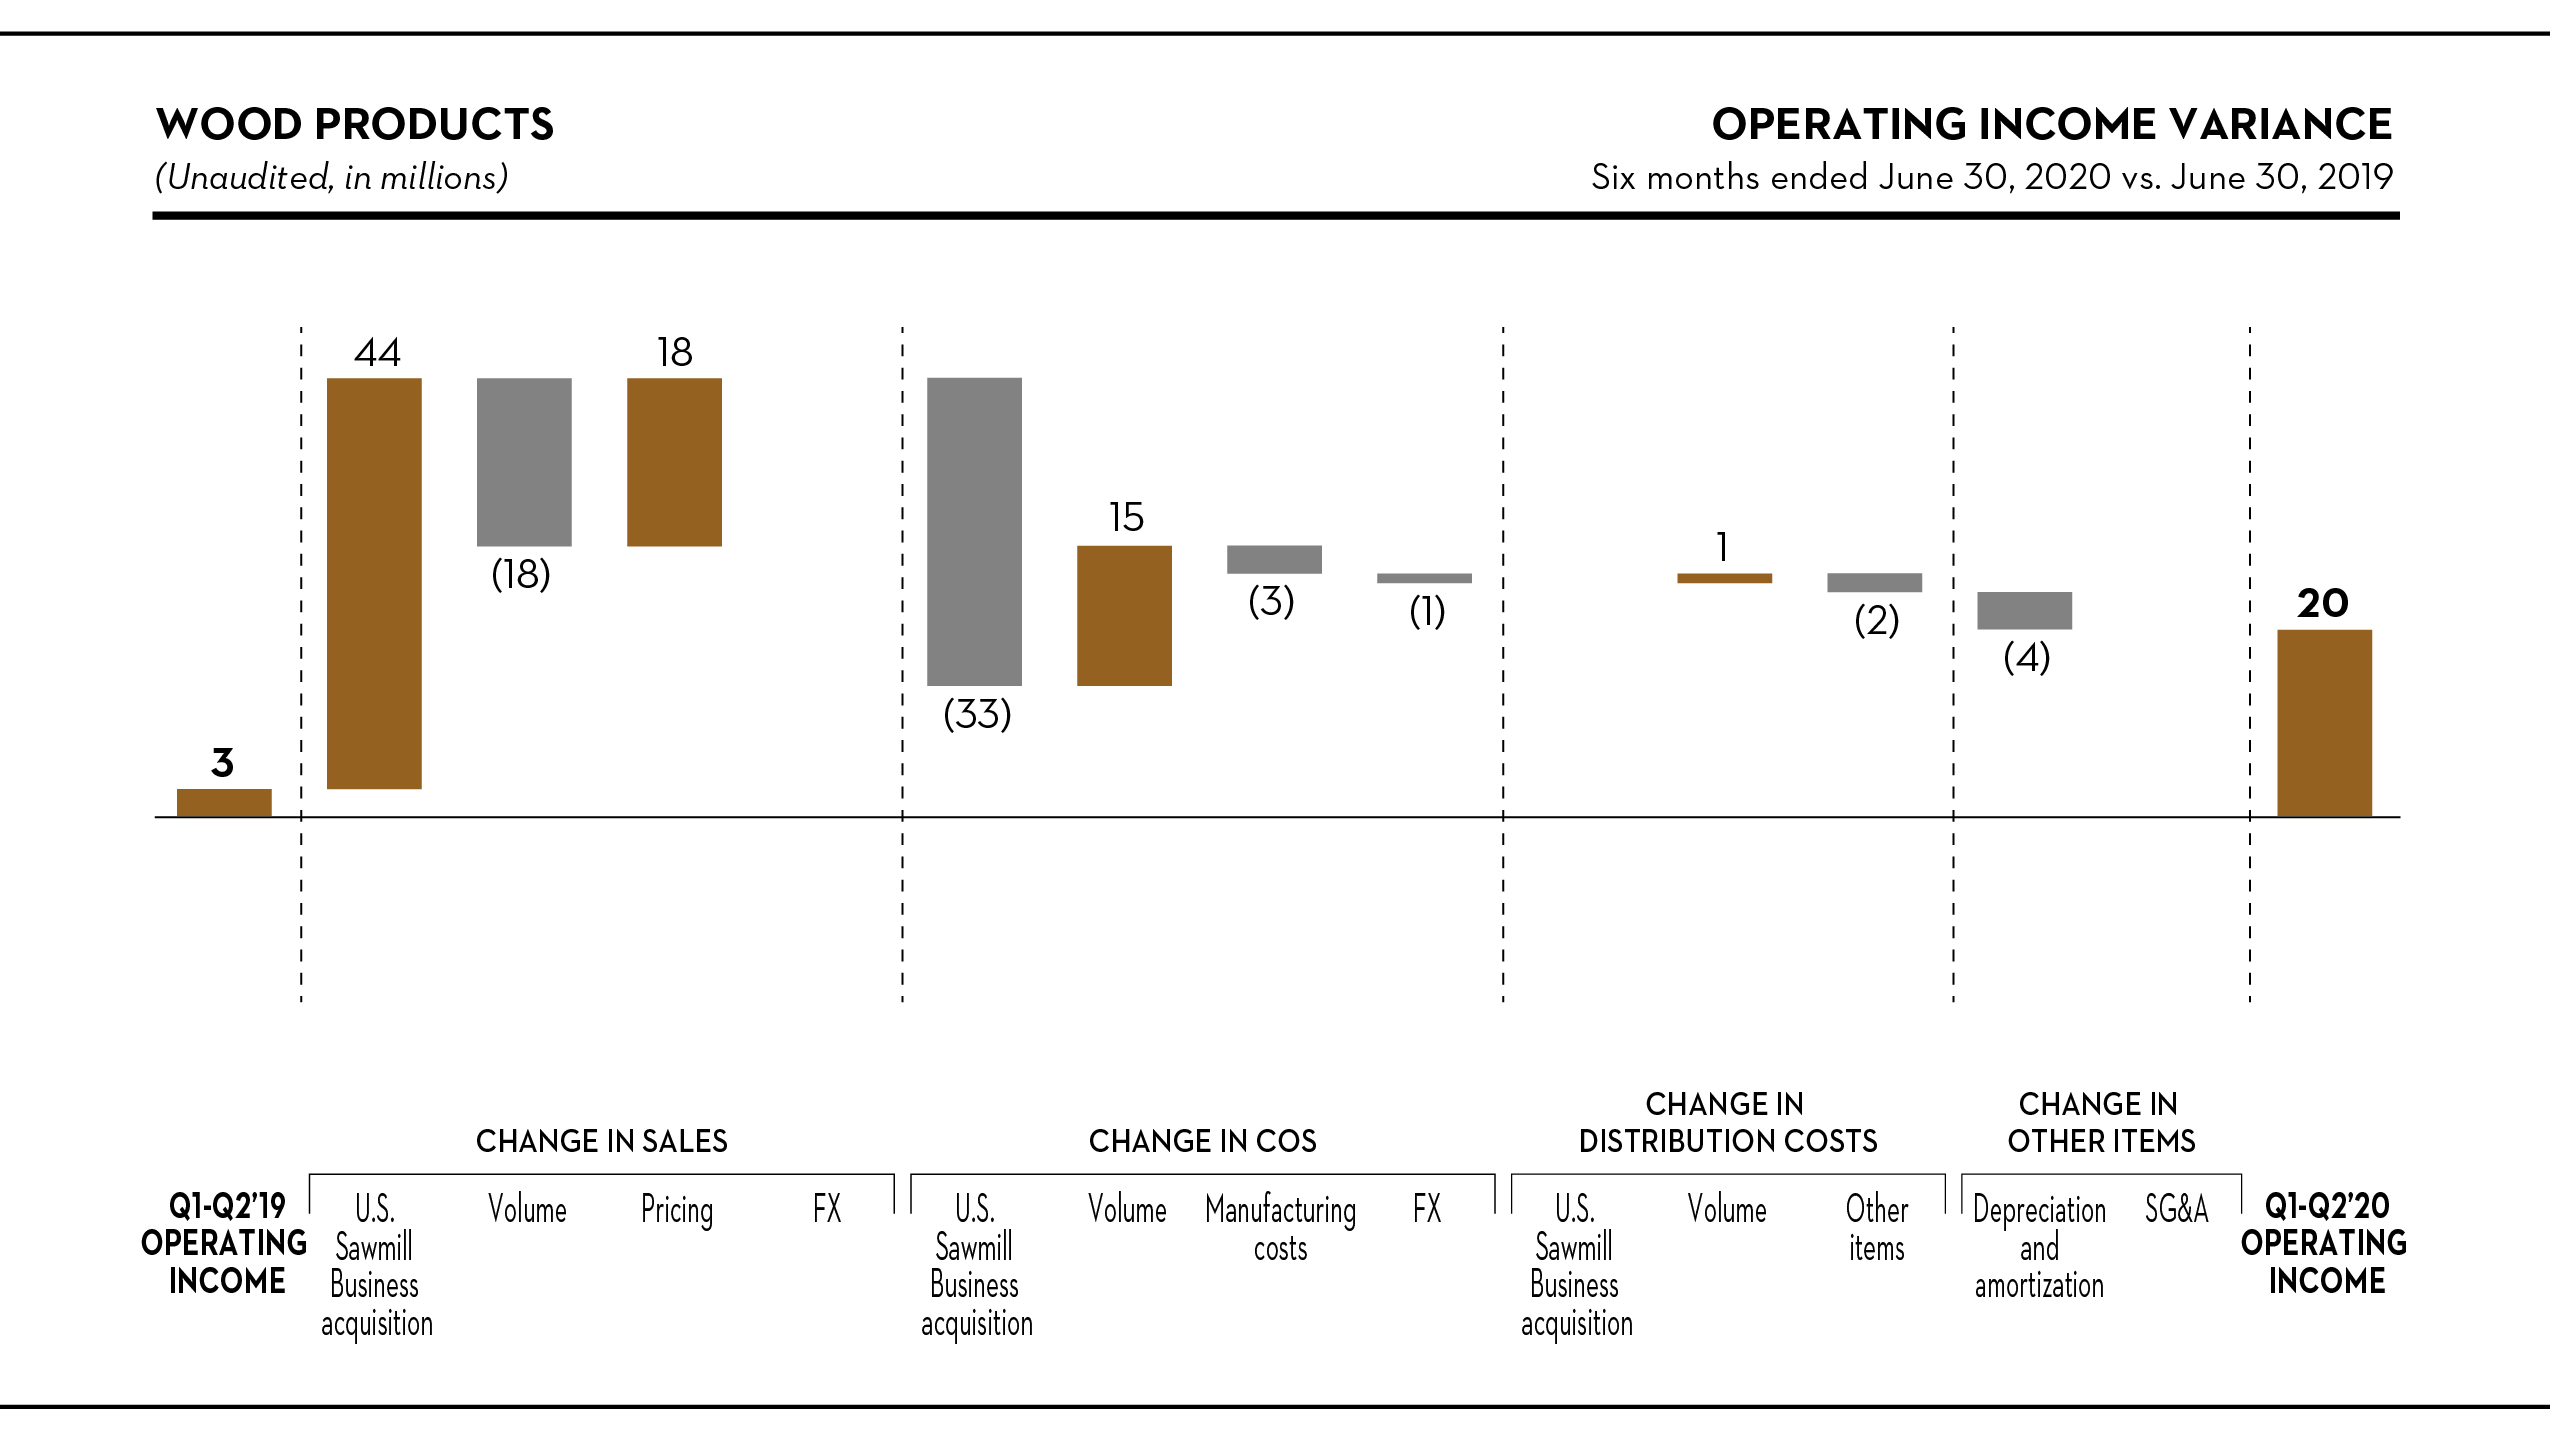
30
PAPER
Highlights
| Three Months Ended March 31, | |||||||||||||||||||||||||||||||||||||||||
| (Unaudited, in millions, except where otherwise stated) | 2021 | 2020 | |||||||||||||||||||||||||||||||||||||||
| Sales | $ | 225 | $ | 289 | |||||||||||||||||||||||||||||||||||||
Operating loss (1) | $ | (24) | $ | (3) | |||||||||||||||||||||||||||||||||||||
EBITDA (2) | $ | (9) | $ | 14 | |||||||||||||||||||||||||||||||||||||
| (In thousands of metric tons) | |||||||||||||||||||||||||||||||||||||||||
| Shipments | 378 | 482 | |||||||||||||||||||||||||||||||||||||||
| Downtime | 158 | 22 | |||||||||||||||||||||||||||||||||||||||
| Three Months Ended June 30, | Six Months Ended June 30, | ||||||||||||||||
| (Unaudited, in millions, except where otherwise stated) | 2020 | 2019 | 2020 | 2019 | |||||||||||||
| Sales | $ | 208 | $ | 355 | $ | 497 | $ | 719 | |||||||||
Operating (loss) income (1) | $ | (12 | ) | $ | 32 | $ | (15 | ) | $ | 75 | |||||||
EBITDA (2) | $ | 4 | $ | 51 | $ | 18 | $ | 111 | |||||||||
| (In thousands of metric tons) | |||||||||||||||||
| Shipments | 350 | 525 | 832 | 1,040 | |||||||||||||
| Downtime | 178 | 65 | 200 | 77 | |||||||||||||
| March 31, | ||||||||||||||||||||
| (Unaudited, in thousands of metric tons) | 2021 | 2020 | ||||||||||||||||||
| Finished goods inventory | 87 | 150 | ||||||||||||||||||
(1)Net loss including noncontrolling interest is equal to operating loss in this segment.
| June 30, | ||||||||
| (Unaudited, in thousands of metric tons) | 2020 | 2019 | ||||||
| Finished goods inventory | 130 | 154 | ||||||
| Three Months Ended June 30, | Six Months Ended June 30, | Three Months Ended March 31, | ||||||||||||||||||||||||||||||||||||||||||||||||||||||||
| (Unaudited, in millions) | 2020 | 2019 | 2020 | 2019 | (Unaudited, in millions) | 2021 | 2020 | |||||||||||||||||||||||||||||||||||||||||||||||||||
| Net (loss) income including noncontrolling interest | $ | (12 | ) | $ | 32 | $ | (15 | ) | $ | 75 | ||||||||||||||||||||||||||||||||||||||||||||||||
| Net loss including noncontrolling interest | Net loss including noncontrolling interest | $ | (24) | $ | (3) | |||||||||||||||||||||||||||||||||||||||||||||||||||||
| Depreciation and amortization | 16 | 19 | 33 | 36 | Depreciation and amortization | 15 | 17 | |||||||||||||||||||||||||||||||||||||||||||||||||||
| EBITDA | $ | 4 | $ | 51 | $ | 18 | $ | 111 | EBITDA | $ | (9) | $ | 14 | |||||||||||||||||||||||||||||||||||||||||||||
Industry trends
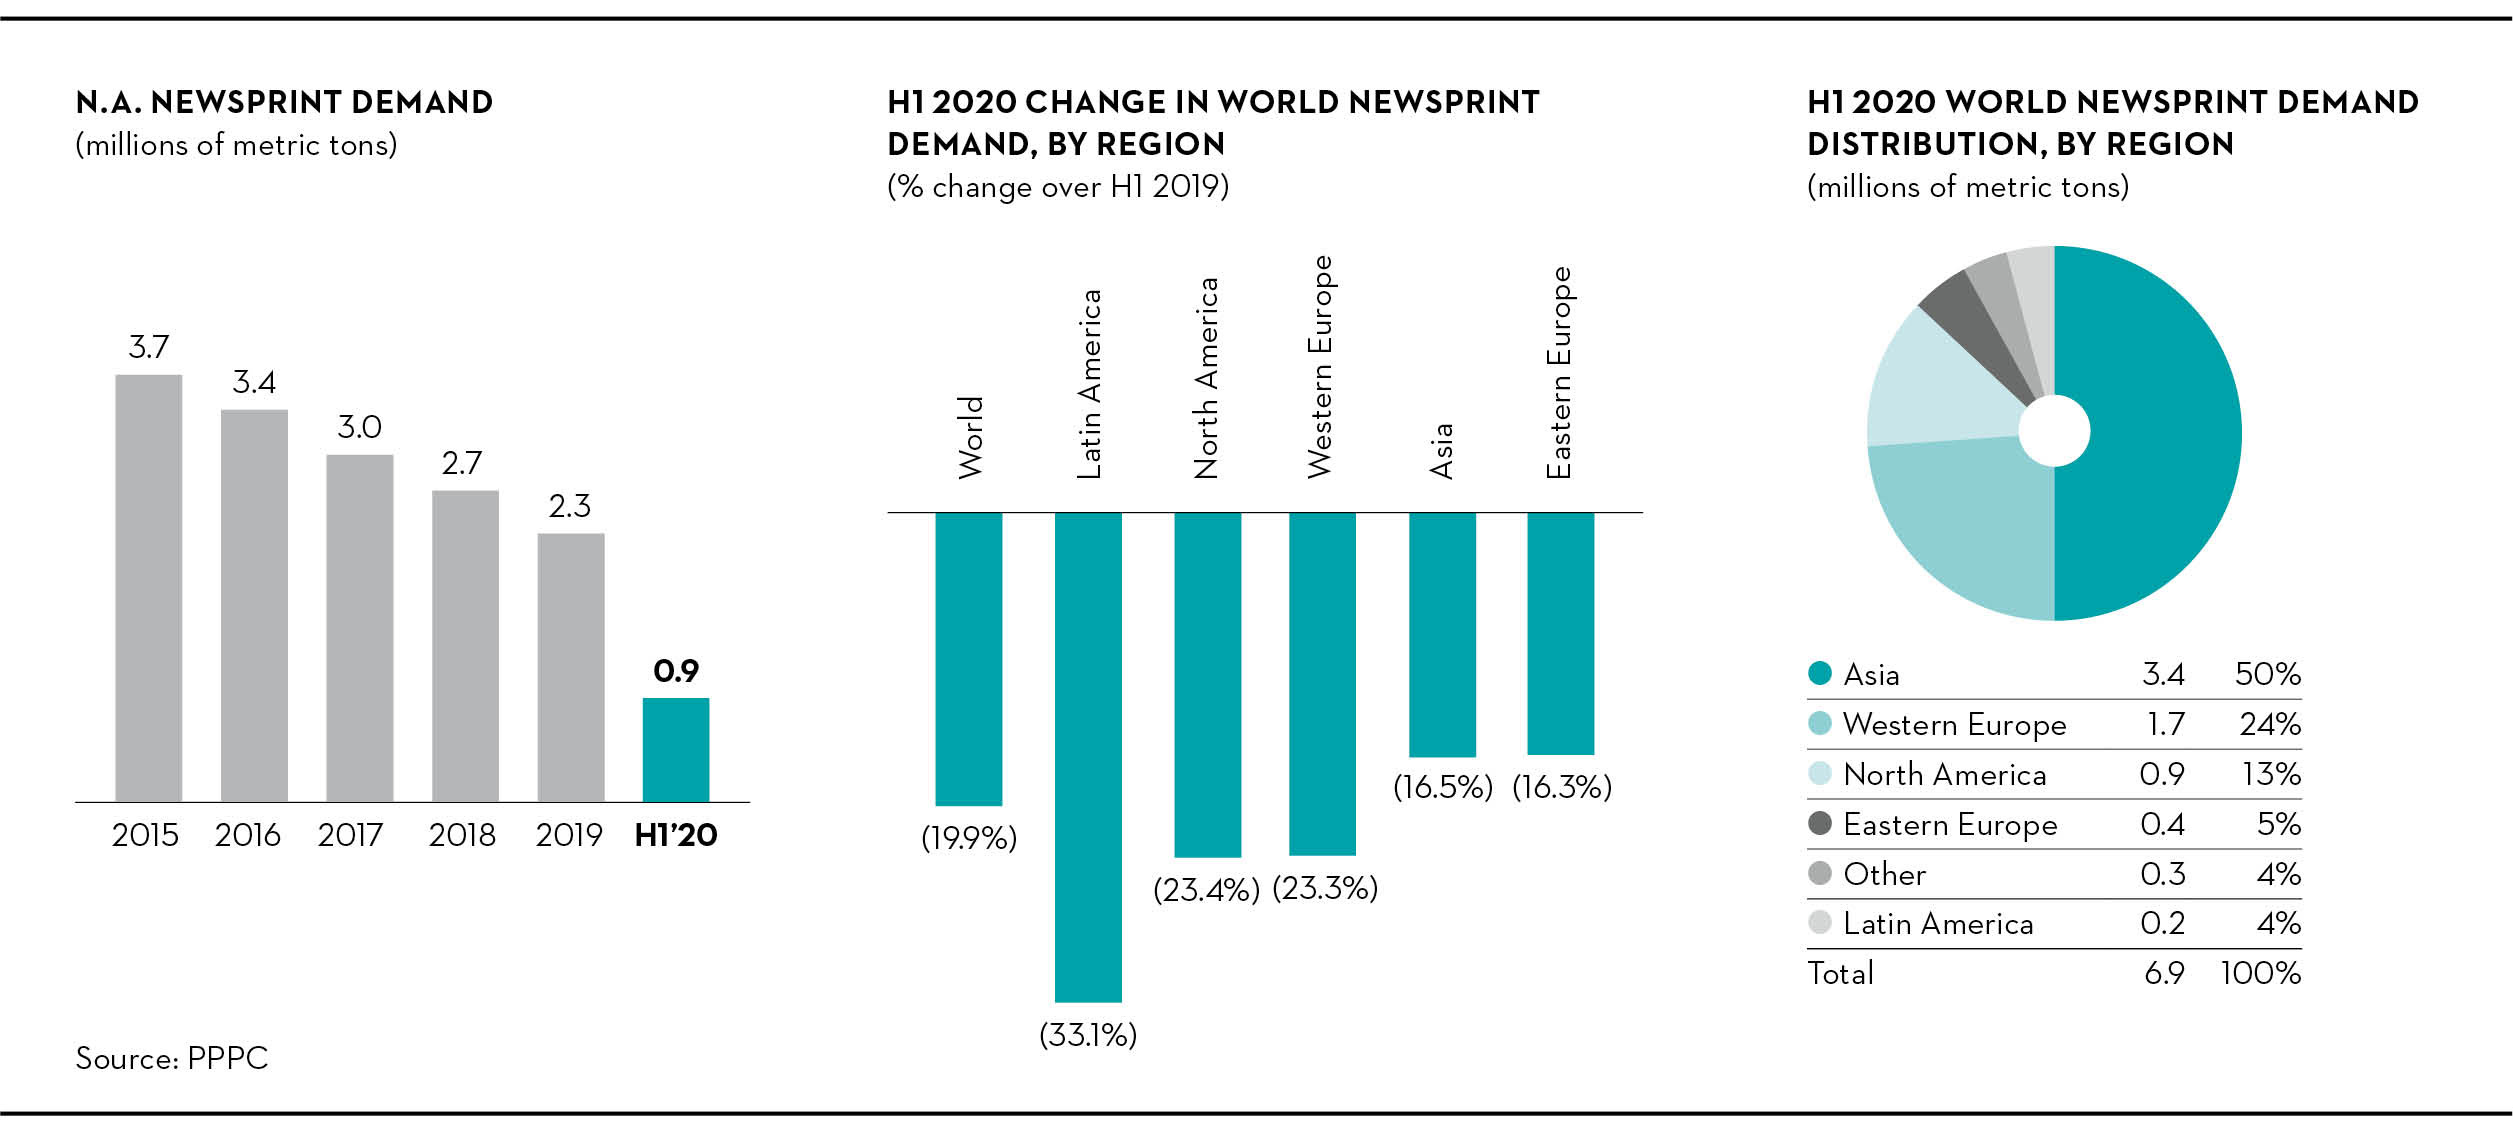
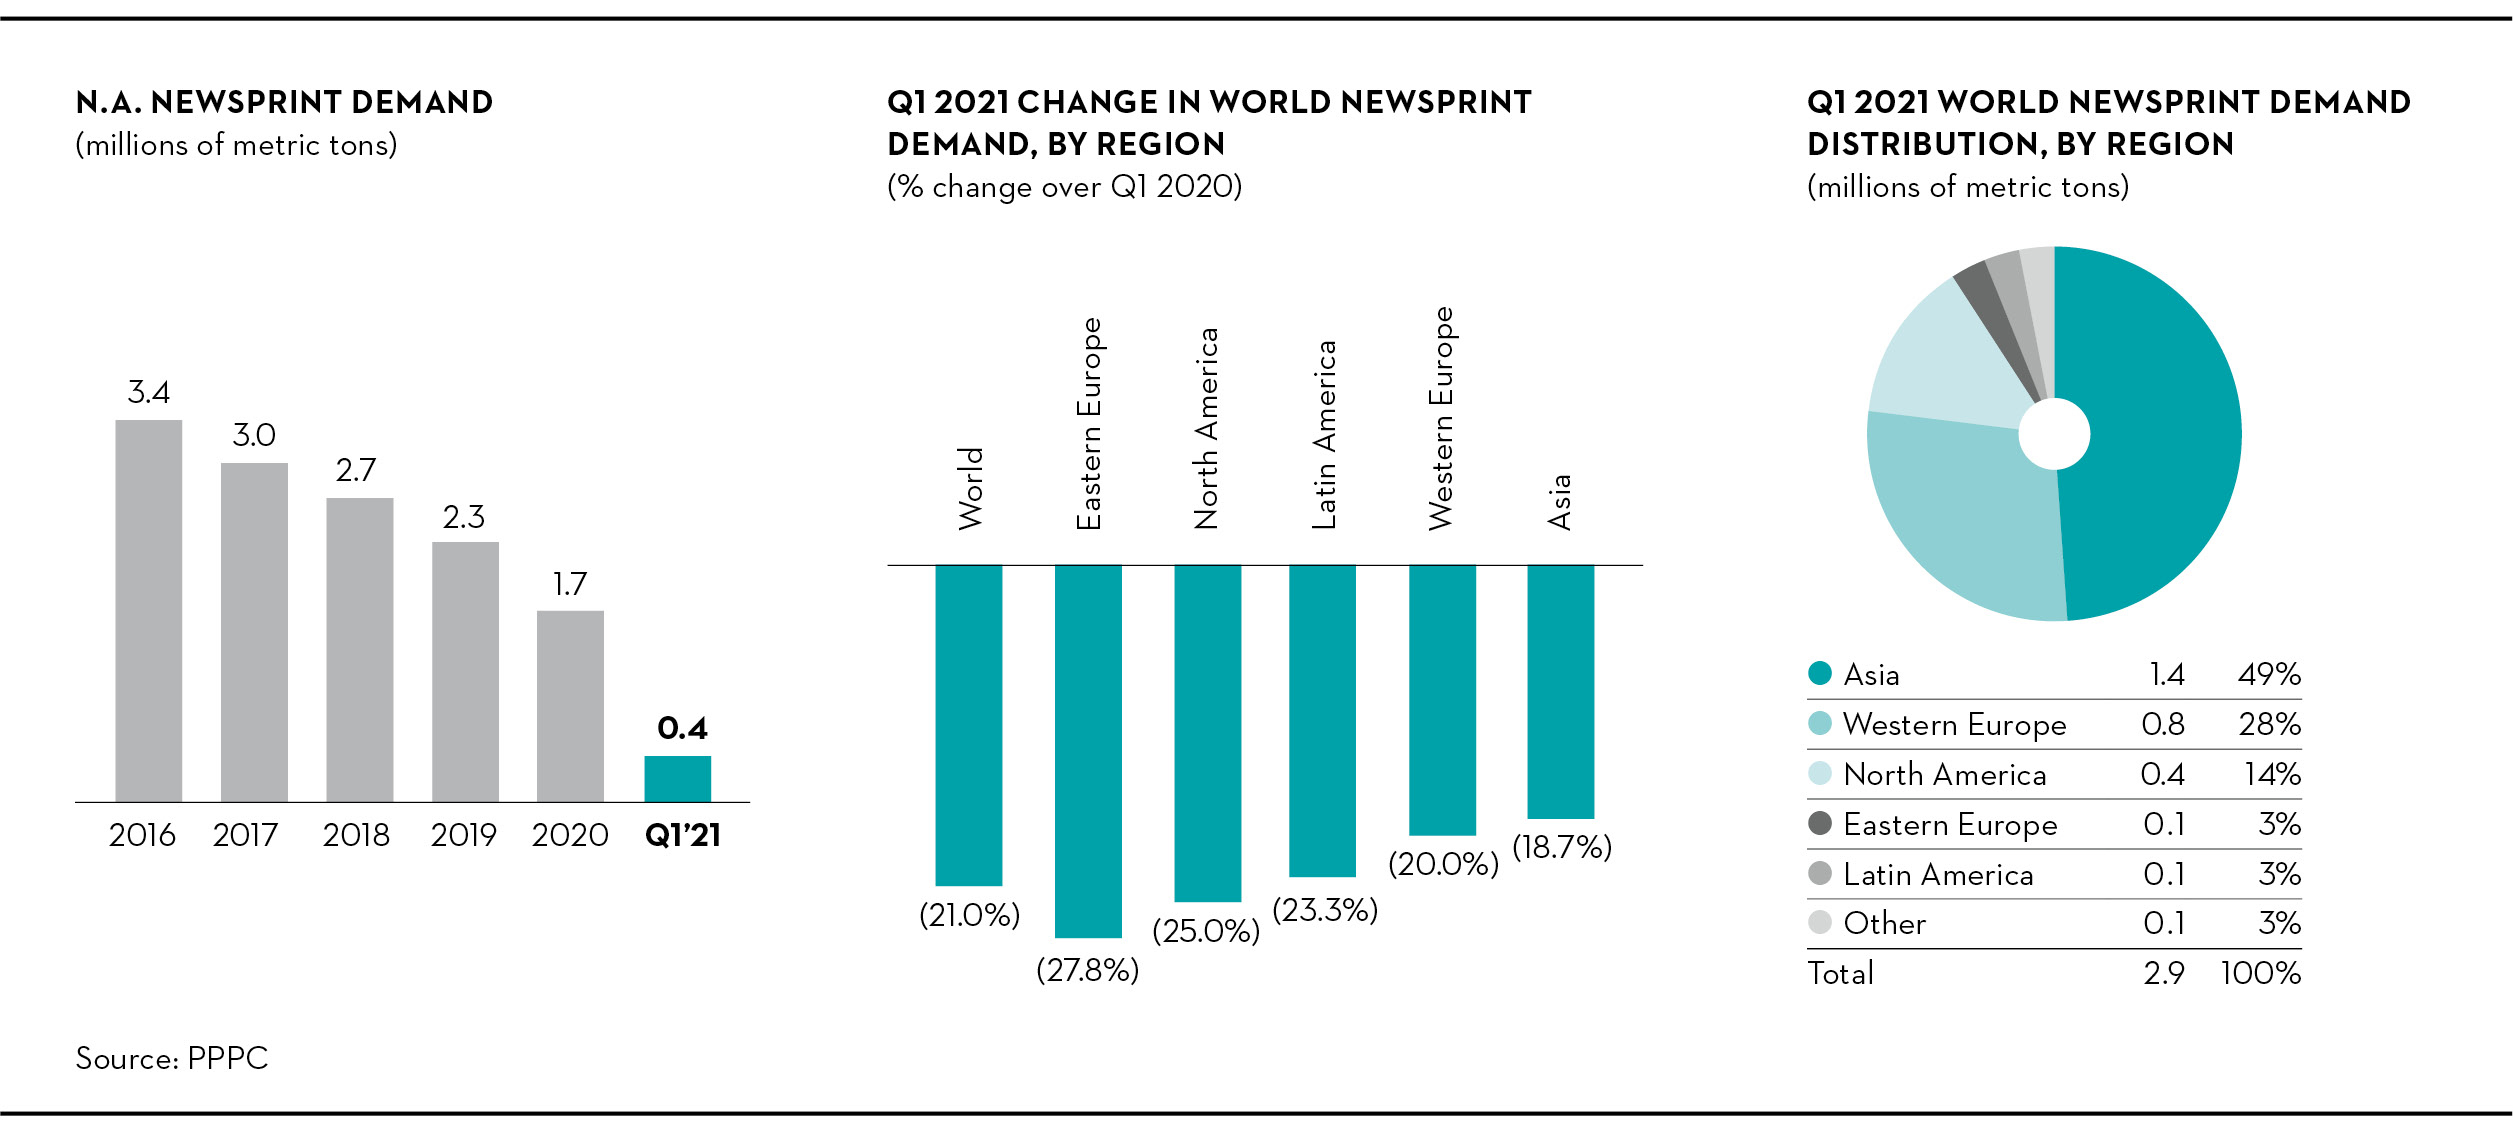
North American newsprint demand fell by 23.4%25.0% in the first halfthree months of the year compared to the same period last year. Demand from newspaper publishers fell by 23.0%31.4%, while demand from commercial printers also decreased,declined by 24.0%14.6%. The North American shipment-to-capacity ratio was 79%93%, compared to 85%87% in the year-ago period.
31
Global demand for newsprint fell by 19.9%21.0% in the first halfthree months of 2020,2021, with North America down by 25.0%, Western Europe down by 23.3%, North America down by 23.4%20.0%, and Asia down by 16.5%18.7%. Accordingly, the global operating rate decreasedincreased to 73%81%, downup from 85%79% in the year-ago period.
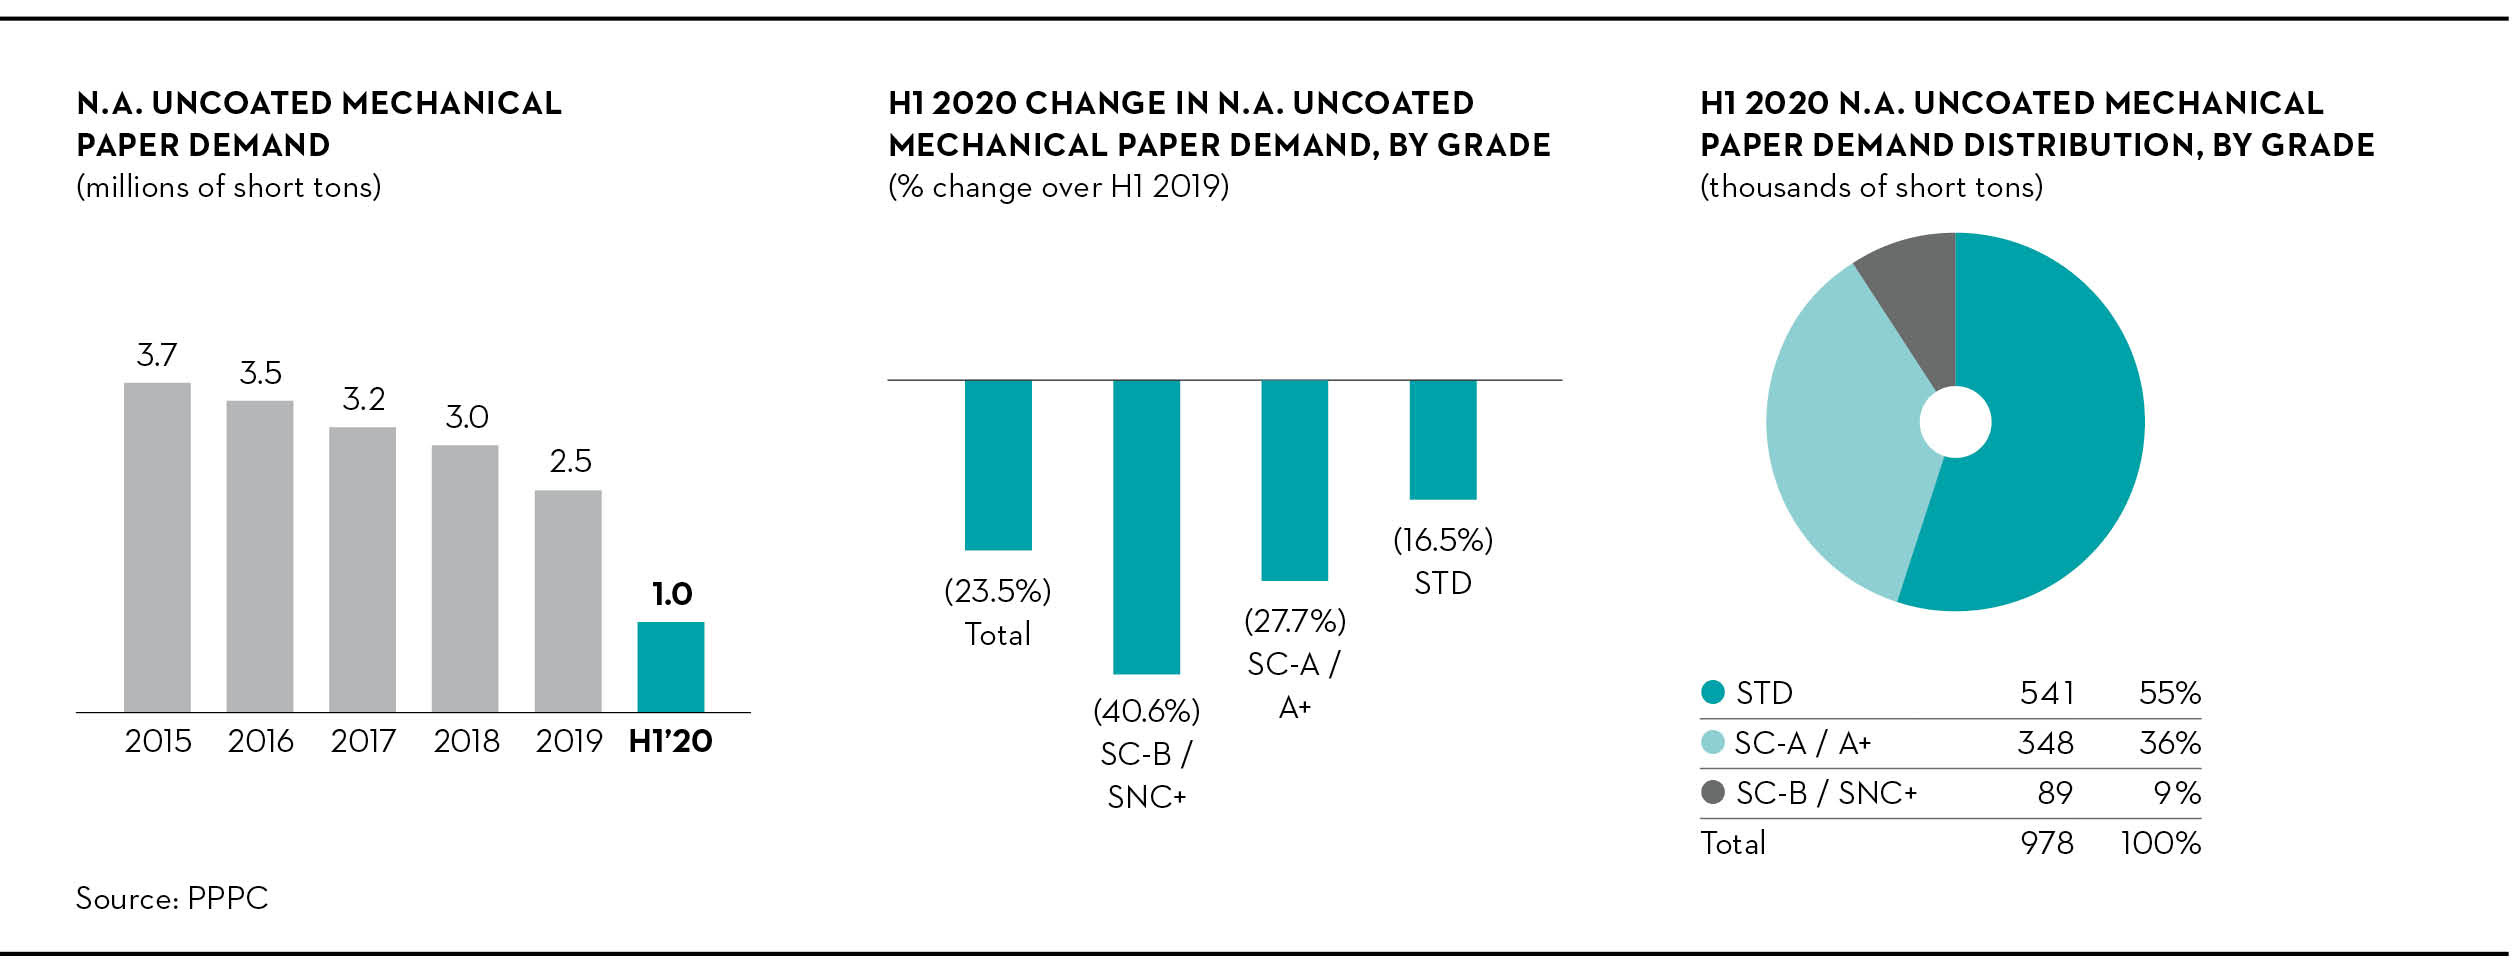
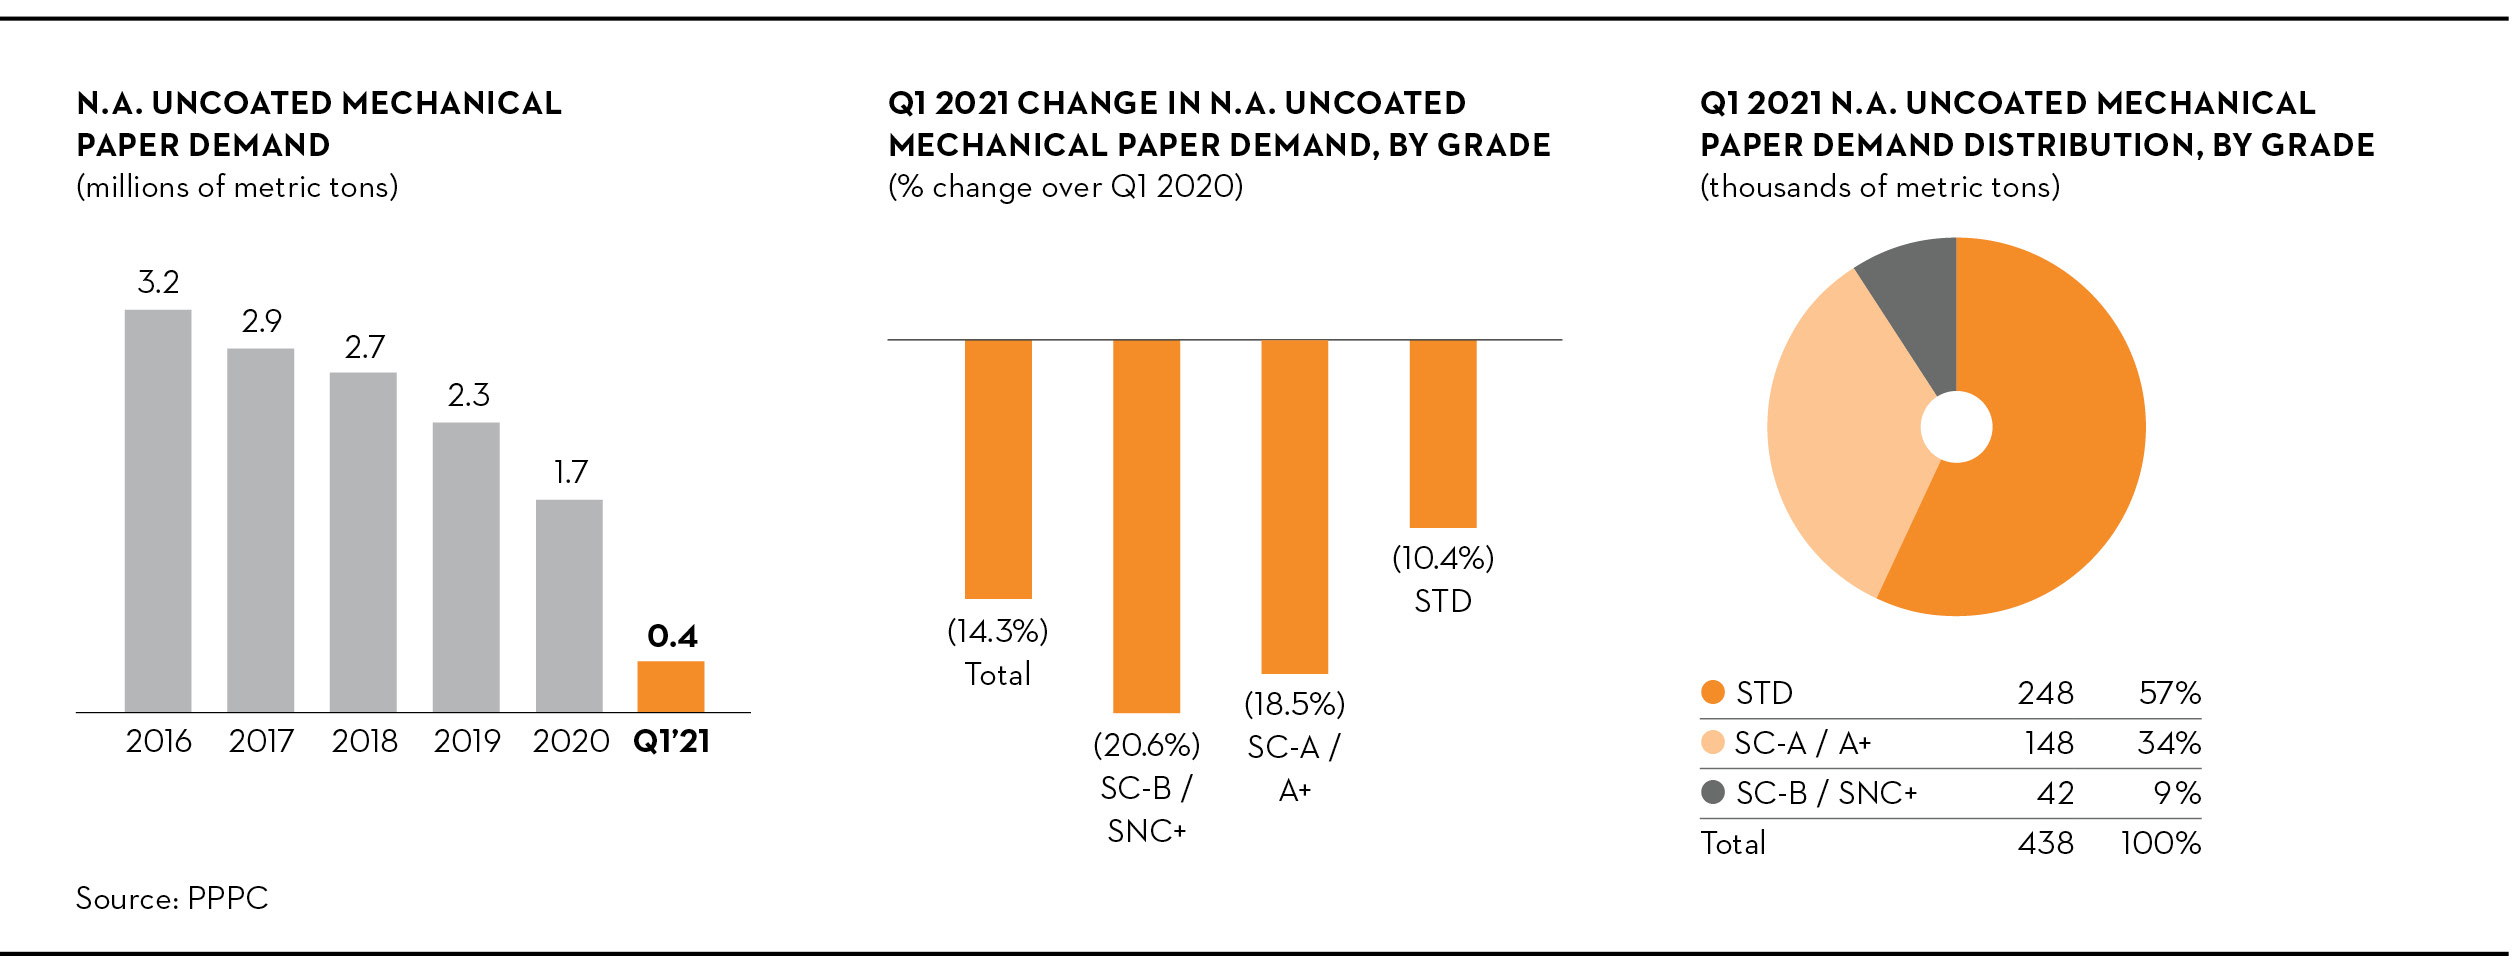
North American demand for uncoated mechanical papers was downcontracted by 23.5%14.3% in the first halfquarter of 20202021, compared to the year-ago period, reflecting a 30.8% decline19.0% drop in supercalendered grades, and a 16.5%10.4% decrease in standard grades. Accordingly,Compared to the first quarter of 2020, the shipment-to-capacity ratio for all uncoated mechanical papers decreasedincreased to 72%, compared to 84% in the year-ago period.
32
Three months ended June 30,March 31, 2021 vs. March 31, 2020 vs. June 30, 2019
Operating (loss) incomeloss variance analysis
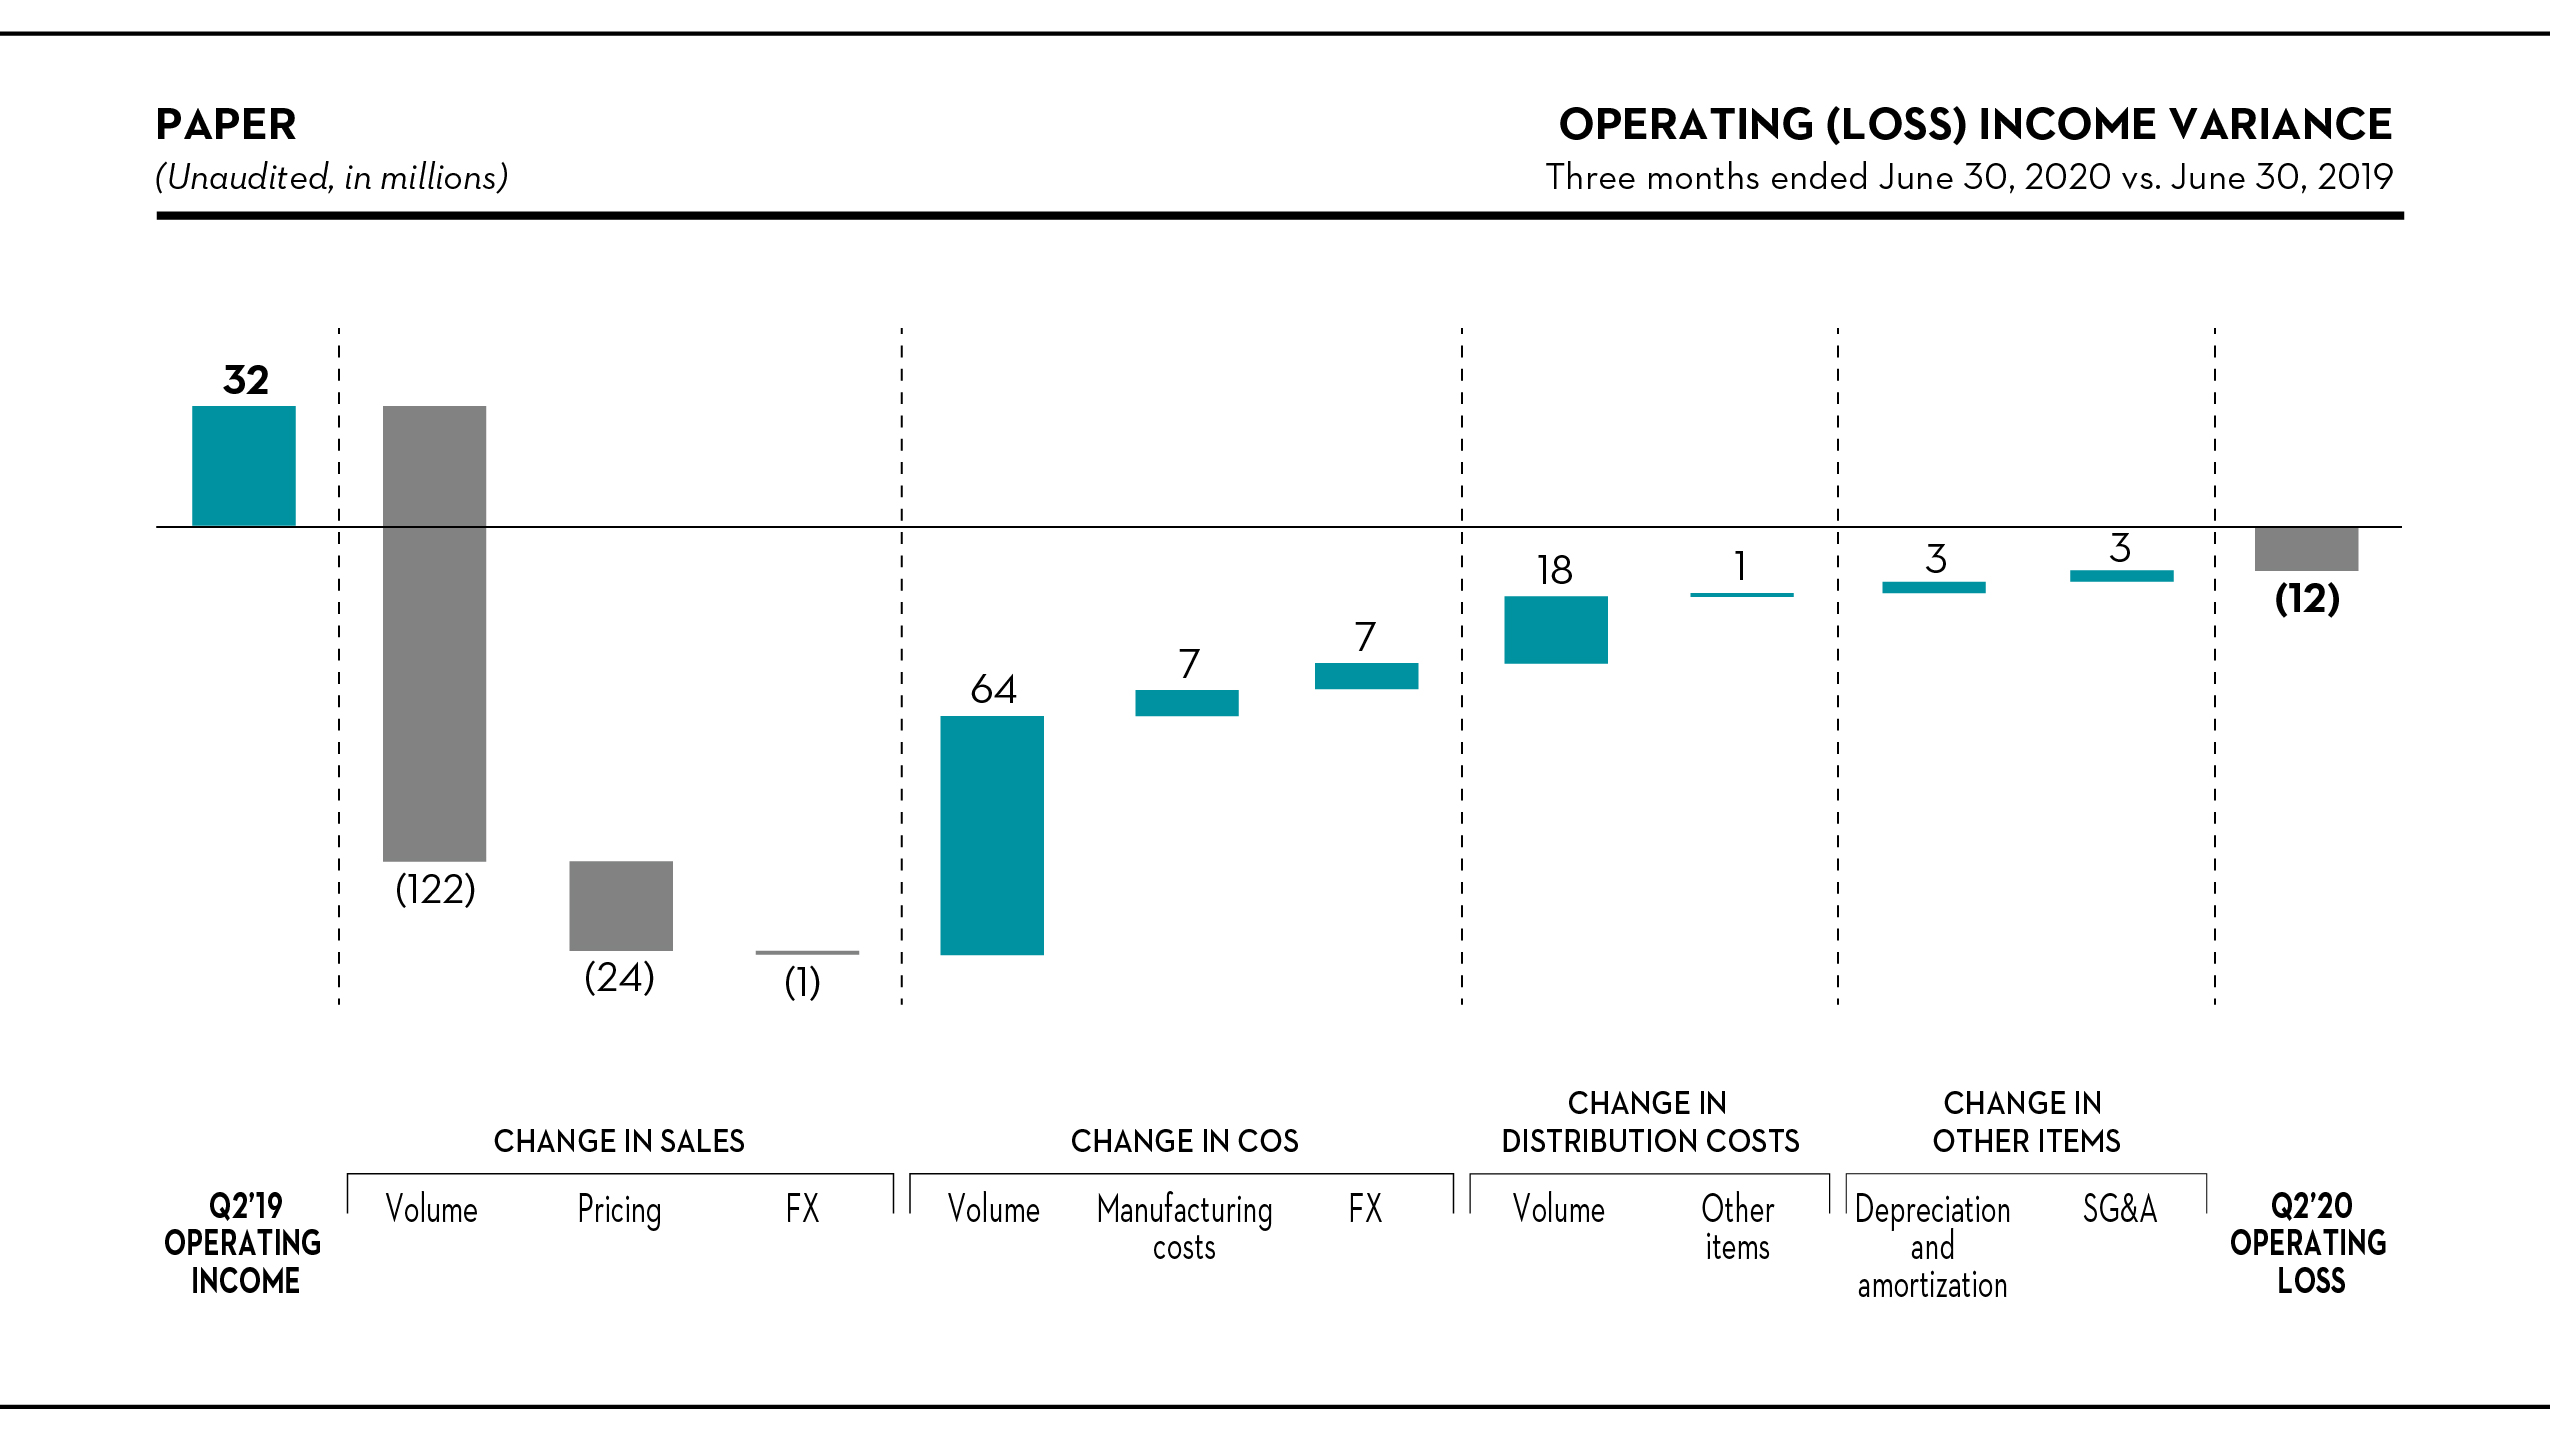

Sales
Sales felldecreased by $147$64 million, or 41%22%, to $208$225 million in the quarter. Shipments decreased by 175,000104,000 metric tons, or 22%, largely reflecting much lower demand levels since the onset of the pandemic and our resulting capacity adjustments. The average transaction price declined by $84 per metric ton due to weaker market fundamentals.
Cost of sales, excluding depreciation, amortization and distribution costs
•higher labor costs ($73 million), due to reduced spending;; and
33
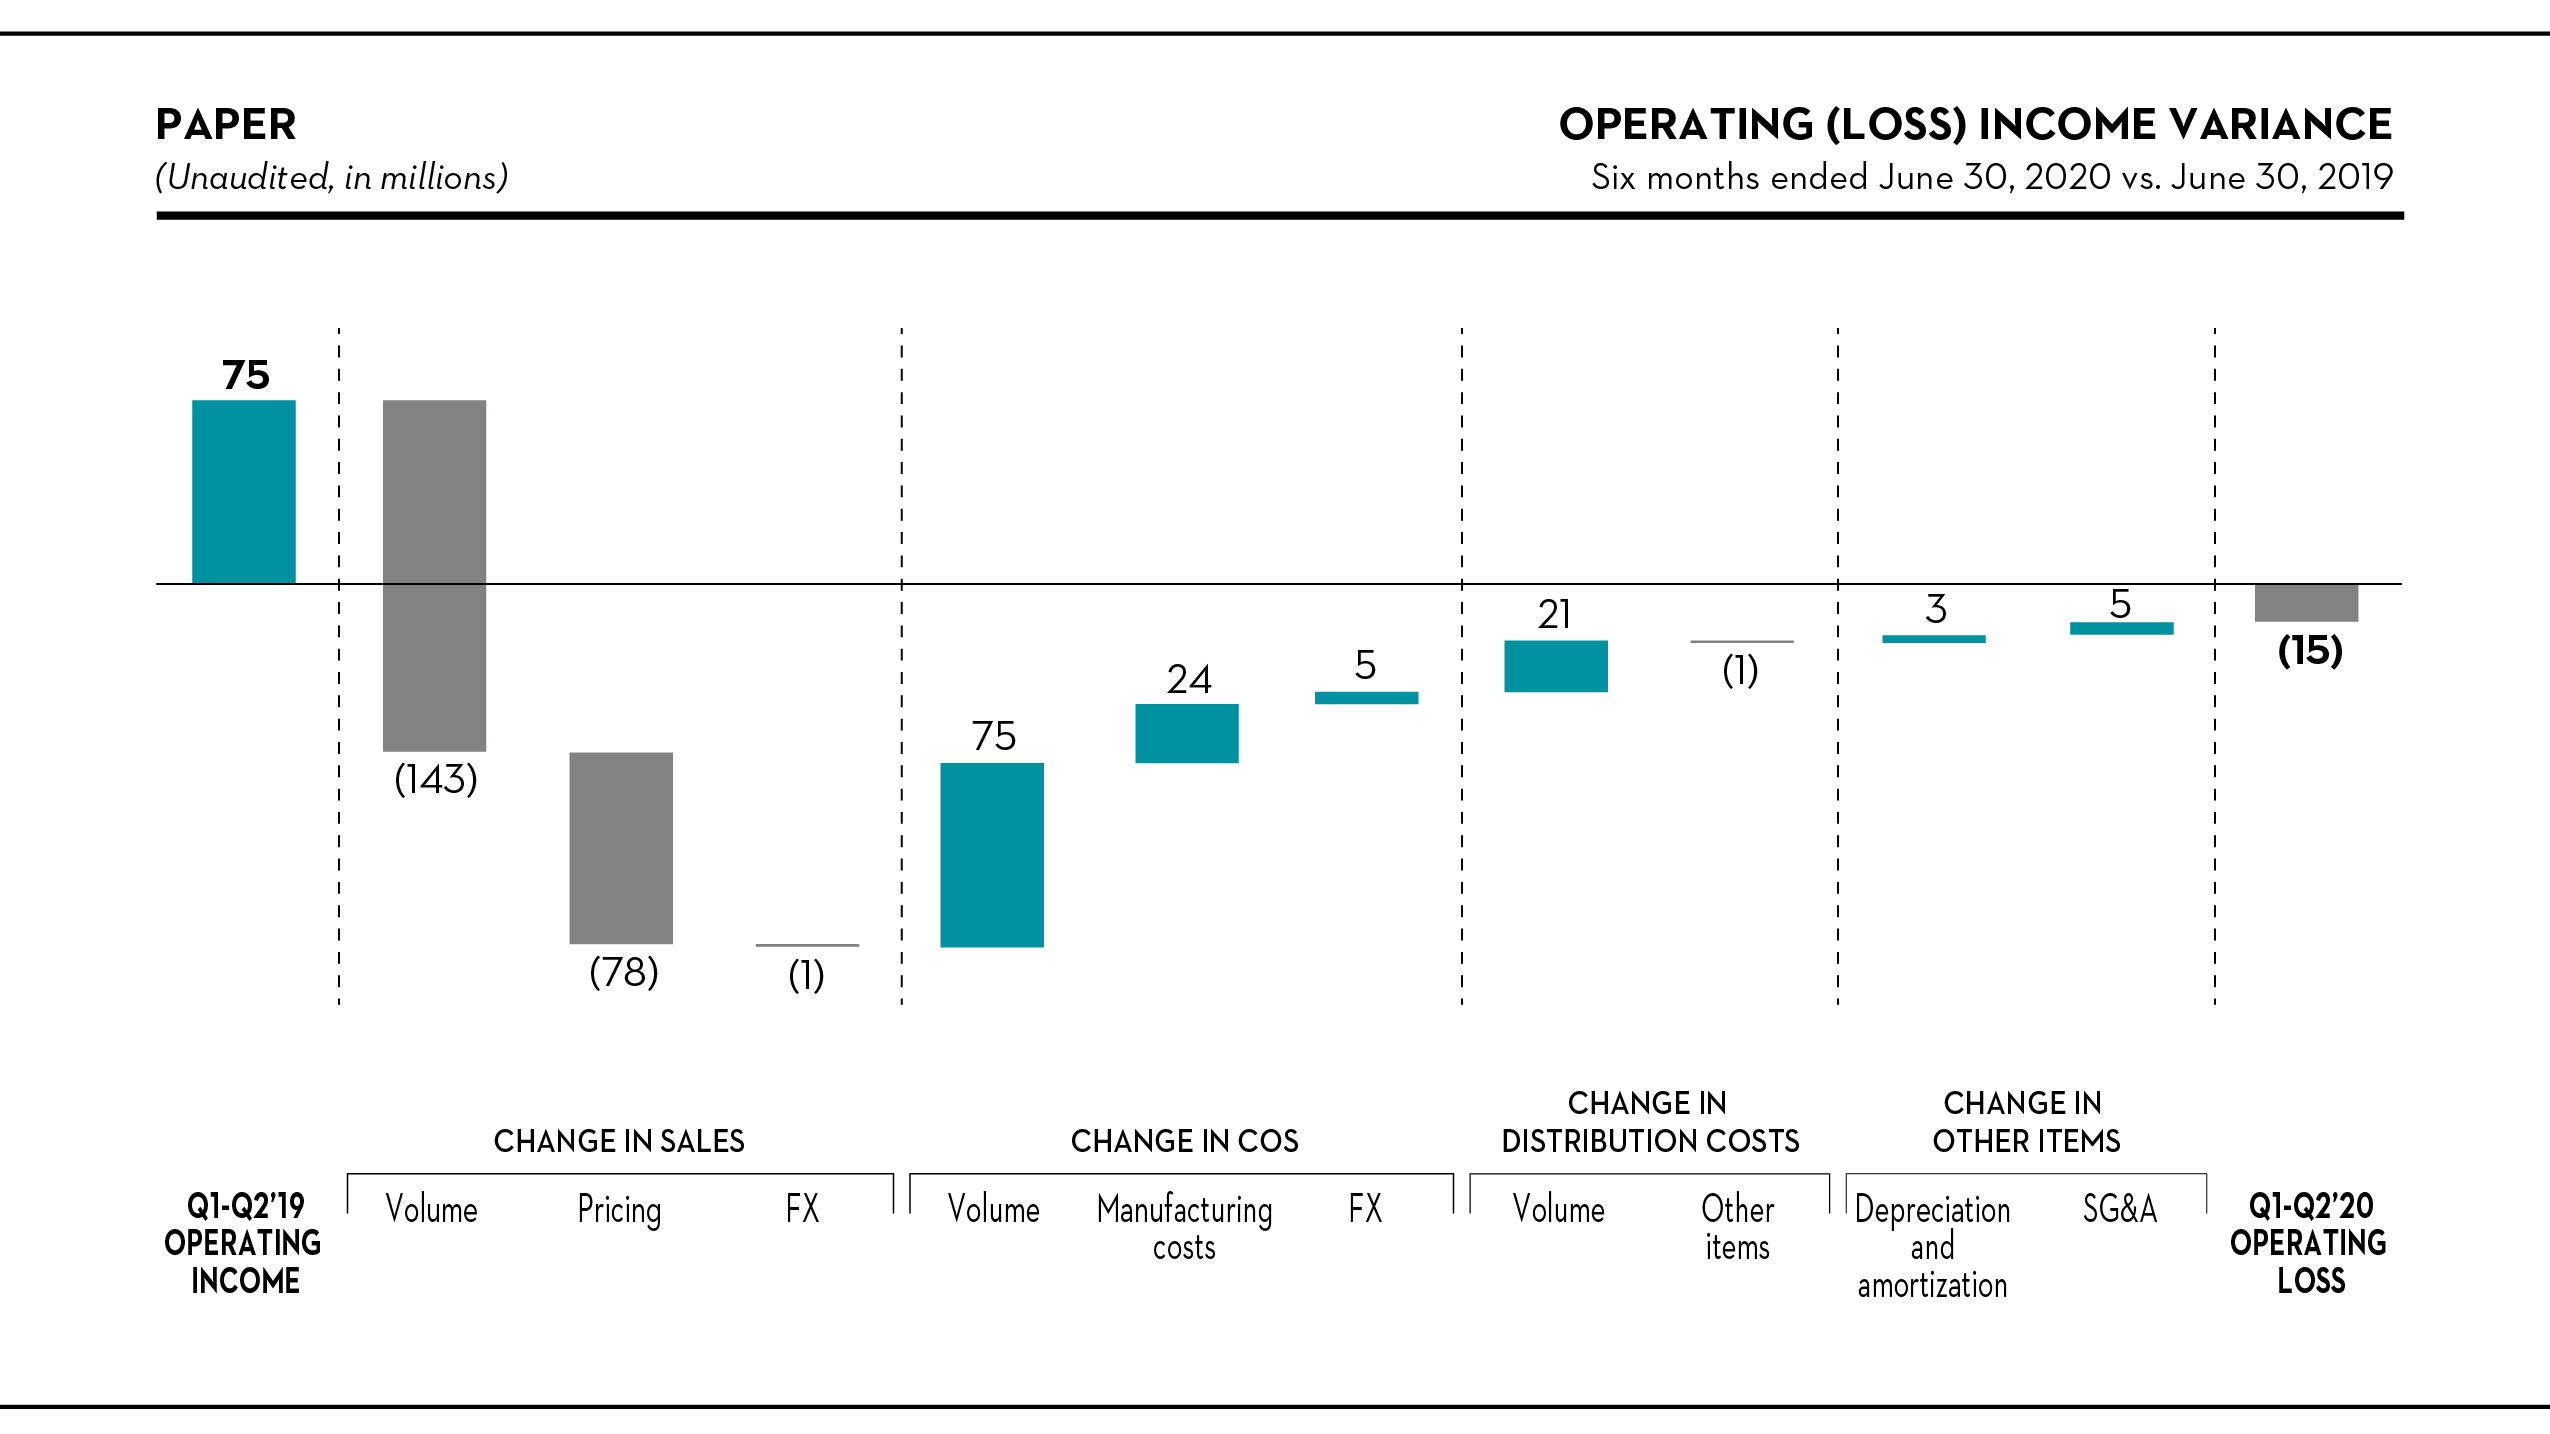
Corporate and Other
Highlights
| Three Months Ended March 31, | |||||||||||||||||||||||||||||||||||||||||
| (Unaudited, in millions) | 2021 | 2020 | |||||||||||||||||||||||||||||||||||||||
| Cost of sales, excluding depreciation, amortization and distribution costs | $ | — | $ | (2) | |||||||||||||||||||||||||||||||||||||
| Depreciation and amortization | (4) | (4) | |||||||||||||||||||||||||||||||||||||||
| Selling, general and administrative expenses | (15) | (5) | |||||||||||||||||||||||||||||||||||||||
| Closure costs, impairment and other related charges | (3) | 2 | |||||||||||||||||||||||||||||||||||||||
| Operating loss | (22) | (9) | |||||||||||||||||||||||||||||||||||||||
| Interest expense | (6) | (9) | |||||||||||||||||||||||||||||||||||||||
| Non-operating pension and other postretirement benefit credits | 2 | 15 | |||||||||||||||||||||||||||||||||||||||
| Other (expense) income, net | (45) | 28 | |||||||||||||||||||||||||||||||||||||||
| Income tax provision | (40) | (27) | |||||||||||||||||||||||||||||||||||||||
| Net loss including noncontrolling interest | $ | (111) | $ | (2) | |||||||||||||||||||||||||||||||||||||
| Three Months Ended June 30, | Six Months Ended June 30, | ||||||||||||||||
| (Unaudited, in millions) | 2020 | 2019 | 2020 | 2019 | |||||||||||||
| Cost of sales, excluding depreciation, amortization and distribution costs | $ | (2 | ) | $ | — | $ | (4 | ) | $ | (7 | ) | ||||||
| Depreciation and amortization | (3 | ) | (5 | ) | (7 | ) | (10 | ) | |||||||||
| Selling, general and administrative expenses | (9 | ) | (7 | ) | (14 | ) | (14 | ) | |||||||||
| Closure costs, impairment and other related charges | — | — | 2 | — | |||||||||||||
| Net gain on disposition of assets | 9 | — | 9 | — | |||||||||||||
| Operating loss | (5 | ) | (12 | ) | (14 | ) | (31 | ) | |||||||||
| Interest expense | (9 | ) | (7 | ) | (18 | ) | (16 | ) | |||||||||
| Non-operating pension and other postretirement benefit credits | 4 | 12 | 19 | 24 | |||||||||||||
| Other income (expense), net | 10 | (1 | ) | 38 | (5 | ) | |||||||||||
| Income tax provision | (5 | ) | (19 | ) | (32 | ) | (40 | ) | |||||||||
| Net loss including noncontrolling interest | $ | (5 | ) | $ | (27 | ) | $ | (7 | ) | $ | (68 | ) | |||||
The table below shows the reconciliation of net loss including noncontrolling interest to EBITDA and adjusted EBITDA, which are non-GAAP financial measures. For more information on the calculation and reasons we include these measures, see note 1 under “Results of Operations – Consolidated Results – Selected financial information”information” above.
| Three Months Ended March 31, | |||||||||||||||||||||||||||||||||||||||||
| (Unaudited, in millions) | 2021 | 2020 | |||||||||||||||||||||||||||||||||||||||
| Net loss including noncontrolling interest | $ | (111) | $ | (2) | |||||||||||||||||||||||||||||||||||||
| Interest expense | 6 | 9 | |||||||||||||||||||||||||||||||||||||||
| Income tax provision | 40 | 27 | |||||||||||||||||||||||||||||||||||||||
| Depreciation and amortization | 4 | 4 | |||||||||||||||||||||||||||||||||||||||
| EBITDA | (61) | 38 | |||||||||||||||||||||||||||||||||||||||
| Closure costs, impairment and other related charges | 3 | (2) | |||||||||||||||||||||||||||||||||||||||
| Non-operating pension and other postretirement benefit credits | (2) | (15) | |||||||||||||||||||||||||||||||||||||||
| Other expense (income), net | 45 | (28) | |||||||||||||||||||||||||||||||||||||||
| Adjusted EBITDA | $ | (15) | $ | (7) | |||||||||||||||||||||||||||||||||||||
34
| Three Months Ended June 30, | Six Months Ended June 30, | ||||||||||||||||
| (Unaudited, in millions) | 2020 | 2019 | 2020 | 2019 | |||||||||||||
| Net loss including noncontrolling interest | $ | (5 | ) | $ | (27 | ) | $ | (7 | ) | $ | (68 | ) | |||||
| Interest expense | 9 | 7 | 18 | 16 | |||||||||||||
| Income tax provision | 5 | 19 | 32 | 40 | |||||||||||||
| Depreciation and amortization | 3 | 5 | 7 | 10 | |||||||||||||
| EBITDA | 12 | 4 | 50 | (2 | ) | ||||||||||||
| Closure costs, impairment and other related charges | — | — | (2 | ) | — | ||||||||||||
| Net gain on disposition of assets | (9 | ) | — | (9 | ) | — | |||||||||||
| Non-operating pension and other postretirement benefit credits | (4 | ) | (12 | ) | (19 | ) | (24 | ) | |||||||||
| Other (income) expense, net | (10 | ) | 1 | (38 | ) | 5 | |||||||||||
| Adjusted EBITDA | $ | (11 | ) | $ | (7 | ) | $ | (18 | ) | $ | (21 | ) | |||||
LIQUIDITY AND CAPITAL RESOURCES
Capital Resources
We rely on cash and cash equivalents, cash flows provided by operations, and our credit facilities toto: fund our operations,operations; make pension contributions,contributions; and to finance our working capital, capital expenditures, and duty cash deposits.deposits and opportunities for our growth and transformation strategy. In addition, from time to time we may use available cash to reduce debt and to return capital to shareholders, including through share repurchases or special dividends. As of June 30, 2020,March 31, 2021, we had cash and cash equivalents of $27$33 million and availability of $369$620 million under our credit facilities.
Based on our current projections, we expect to have sufficient financial resources available to finance our business plan, make pension contributions, meet working capital and duty cash deposit requirements, and maintain an appropriate level of capital spending.
Based on market conditions, we may seek to repay or refinance our outstanding indebtedness including under the 5.875% senior unsecured notes due 2023 (or, the “2023 Notes”) and credit facilities, as we continue to focus on reducing costs and enhancing our flexibility.
Senior Unsecured Notes
On February 2, 2021, we issued $300 million aggregate principal amount of 4.875% senior notes due 2026 (or, the “2026 Notes”) at an issue price of 100%, pursuant to an indenture as of that date (or, the “indenture”). The 2026 notes are unsecured and are guaranteed by current and future wholly-owned U.S. subsidiaries that guarantee the ABL Credit Facility. Interest on the 2026 Notes is payable semi-annually on March 1 and September 1 of each year, beginning on September 1, 2021, until their maturity date of March 1, 2026. In connection with the issuance of the 2026 Notes, we incurred financing costs of $6 million, which were deferred and recorded as a reduction of the principal. These costs are amortized to “Interest expense” in our Consolidated Statements of Operations using the interest method over the term of the notes.
On February 2, 2021, we placed the net proceeds from the issuance of the 2026 Notes together with additional cash, into trust for the benefit of the holders of the 2023 Notes to redeem all of the $375 million aggregate principal amount of the 2023 Notes (or, the “Redemption”) at a price of 100% of the aggregate principal amount thereof, plus accrued and unpaid interest to, but not including, the redemption date. The Redemption occurred on February 18, 2021. As a result of the repurchase, we recorded a net loss on extinguishment of debt of $3 million in “Other income, net” in our Consolidated Statement of Operations for the three months ended March 31, 2021.
For more information, see Note 8, “Long-Term Debt – Senior Unsecured Notes,” to our Consolidated Financial Statements.
Senior Secured Credit rating risk
On April 20, 2020, Moody’s Investors Service revised:19, 2021, we entered into a first amendment to the amended and restated senior secured credit facility entered into on October 28, 2019. The amount available remains unchanged for up to $360 million. For more information, see Note 14, “Subsequent Event,” to our Consolidated Financial Statements.
ABL Credit Facility
Effective January 21, 2021, we reduced the commitment under the Canadian tranche of our senior unsecured debt rating from B1secured asset-based revolving credit facility by $50 million, to B2;$250 million, resulting in an aggregate commitment of $450 million, subject to borrowing base limitations.
For more information, see Note 8, “Long-Term Debt – ABL Credit Facility,” to our corporate family rating from Ba3 to B1;Consolidated Financial Statements.
35
Flow of Funds
Summary of cash flows
A summary of cash flows for the sixthree months ended June 30,March 31, 2021 and 2020, and 2019, was as follows:
| Three Months Ended March 31, | ||||||||||||||||||||
| (Unaudited, in millions) | 2021 | 2020 | ||||||||||||||||||
| Net cash provided by (used in) operating activities | $ | 74 | $ | (49) | ||||||||||||||||
| Net cash used in investing activities | (43) | (206) | ||||||||||||||||||
| Net cash (used in) provided by financing activities | (99) | 368 | ||||||||||||||||||
| Effect of exchange rate changes on cash and cash equivalents, and restricted cash | — | (3) | ||||||||||||||||||
| Net (decrease) increase in cash and cash equivalents, and restricted cash | $ | (68) | $ | 110 | ||||||||||||||||
| Six Months Ended June 30, | ||||||||
| (Unaudited, in millions) | 2020 | 2019 | ||||||
| Net cash provided by operating activities | $ | 76 | $ | 95 | ||||
| Net cash used in investing activities | (227 | ) | (69 | ) | ||||
| Net cash provided by (used in) financing activities | 176 | (232 | ) | |||||
| Effect of exchange rate changes on cash and cash equivalents, and restricted cash | (1 | ) | 1 | |||||
| Net increase (decrease) in cash and cash equivalents, and restricted cash | $ | 24 | $ | (205 | ) | |||
Net cash provided by (used in) operating activities
We generated $76$74 million of cash from operating activities in the first halfquarter of 2020,2021, compared to $95$49 million of cash generatedused in the year-ago period. The decreaseincrease is primarily due to lower profitability offsetdriven by a favorable working capital variance in the current period, and lower pension contributions.higher profitability.
Net cash used in investing activities
We used $227$43 million of cash in investing activities in the current period, compared to $69$206 million in the year-ago period. The difference primarily reflects the acquisition of the U.S. Sawmill Business, net of cash acquired, in the currentyear-ago period ($172174 million), and; partly offset by higher net countervailing and anti-dumping duty cash deposits ($6 million); partly offset by lower capital expenditures ($8 million) and higher proceeds fromin the disposition of assetscurrent period ($717 million).
Net cash (used in) provided by (used in) financing activities
Net cash used in financing activities was $99 million in the first quarter of 2021, compared to cash provided by financing activities was $176of $368 million in the first halfyear-ago period. The difference mostly reflects the repayment of 2020,the 2023 Notes of $375 million partly offset by the issuance of the 2026 Notes of $300 million, compared to cash usednet borrowings under our revolving credit facilities of $189 million and drawing of $180 million in financing activities of $232 millionterm loans in the year-ago period. In the current period, we drew $180also repurchased $17 million in 10-year term loans under our existing senior secured credit facility (or, the “Senior Secured Credit Facility”) to finance the acquisition of the U.S. Sawmill Business, whereas in the year-ago period we repurchased of $225 million in aggregate principal amount of our 2023 Notes.shares.
Employee Benefit Plans
The recently passed American Rescue Plan Act of 2021 includes provisions that allow for interest rate smoothing of pension funding deficits to minimize the impact of lower interest rates on liabilities. It also extends the amortization period for funding shortfalls from seven years to 15 years under the current rules. While the implementing guidance should be issued later this year, the company expects the net impact of these provisions to provide approximately $30 million of U.S. pension contribution relief per year for at least the next three years. At this time, we expectare not in a position to postponedetermine the remaining $26 million, to the end of the fourth quarter of 2020.impact on our 2021 funding.
Share Repurchase Program
On March 2, 2020, our board of directors authorized a share repurchase program of up to 15% of our common stock, for an aggregate consideration of up to $100 million. For more information, see Note 12, “Share Capital,” toDuring the three months ended March 31, 2021, we repurchased 1.7 million shares at a cost of $17 million. Since the beginning of this share repurchase program, we have repurchased 8.7 million shares for a total cost of $47 million, representing 10% of our Consolidated Financial Statements.
36
| (Unaudited, in millions) | Six Months Ended June 30, 2020 | Year Ended December 31, 2019 | |||||||
Sales (1) | $ | 1,076 | $ | 2,379 | |||||
| Operating loss | $ | (57 | ) | $ | (203 | ) | |||
| Net loss | $ | (49 | ) | $ | (207 | ) | |||
| (Unaudited, in millions) | June 30, 2020 | December 31, 2019 | |||||||
Total current assets (1) | $ | 425 | $ | 414 | |||||
Total long-term assets (2) | $ | 907 | $ | 833 | |||||
Total current liabilities (3) | $ | 885 | $ | 913 | |||||
| Total long-term liabilities | $ | 1,043 | $ | 872 | |||||
ITEM 3. QUANTITATIVE AND QUALITATIVE DISCLOSURES ABOUT MARKET RISK
Information relating to quantitative and qualitative disclosures about market risk is disclosed in Part II, Item 7A, “Quantitative and Qualitative Disclosures About Market Risk,” in our 20192020 Annual Report. There have been no material changes inWe are supplementing our exposure to market risk as previously disclosed in our 20192020 Annual Report except that our exposure towith the additional information on market risk has been heightened by the COVID-19 pandemic, including related governmental responses and economic impacts,set forth below. This supplemental market disruptions and changes in consumer habits, and such prior disclosurerisk information should be read in conjunction with the COVID-19 pandemic risk factor update furtherother market risks described in Part II, Item 1A, “Risk Factors,our 2020 Annual Report.
Prices, sales volume and margins for our products have historically been cyclical and subject to changes as a result of economic and market shifts, fluctuations in capacity, and movements in foreign currency exchange rates. In order to mitigate these risks and to protect the Company’s earnings and cash flows from adverse fluctuations of market risks, from time to time, we enter into derivative financial transactions, in compliance with our financial risk management policy, which forbids speculative purposes.
For more information on loss related to lumber futures contracts recorded during the current quarter and outstanding contracts that remain subject to potential fair value changes, please see Note 2, “Other (Expense) Income, Net,” in this Form 10-Q.and Note 7, “Accounts Payable and Other” to our Consolidated Financial Statements.
ITEM 4. CONTROLS AND PROCEDURES
(a) Evaluation of Disclosure Controls and Procedures:
We have evaluated the effectiveness of the design and operation of our disclosure controls and procedures, as defined in Rules 13a–15(e) and 15d–15(e) of the Securities Exchange Act of 1934, as of June 30, 2020.March 31, 2021. Based on that evaluation, the President and Chief Executive Officer and the Senior Vice President and Chief Financial Officer concluded that our disclosure controls and procedures were effective as of such date in recording, processing, summarizing and timely reporting information required to be disclosed in our reports to the SEC.
(b) Changes in Internal Control over Financial Reporting:
In connection with the evaluation of internal control over financial reporting, there were no changes during the period covered by this report that have materially affected, or are reasonably likely to materially affect, our internal control over financial reporting.
37
ITEM 1. LEGAL PROCEEDINGS
In addition to the legal proceedings presented under Part I, Item 3, “Legal Proceedings,” in our 20192020 Annual Report, see the description of our material pending legal proceedings in Note 11, “Commitments and Contingencies – Legal matters,,” to our Consolidated Financial Statements, which is incorporated in this “Item 1 – Legal Proceedings” by reference.
In addition to the other information set forth in this Form 10-Q, you should carefully consider the risk factors describedset forth under Part I, Item 1A, “Risk Factors” in our 20192020 Annual Report, and Part II, Item 1A, “Risk Factors” of our Quarterly Report on Form 10-Q for the period ended March 31, 2020, with the additional risk factor set forth below. This supplemental risk factor should be read in conjunction with the other risk factors described in our 2019 Annual Report,which have been heightened by this additional risk factor.
ITEM 2. UNREGISTERED SALES OF EQUITY SECURITIES AND USE OF PROCEEDS
The following table sets forth information about our stock repurchases for the three months ended June 30, 2020:March 31, 2021:
| Period | Total Number of Shares Purchased | Average Price Paid per Share | Total Number of Shares Purchased as Part of Publicly Announced Plans or Programs | Approximate Dollar Value of Shares That May Yet Be Purchased Under the Plans or Programs (1) | ||||||||||||||||||||||||||||||||||
| January 1 to January 31 | — | $ | — | — | $ | 70,460,359 | ||||||||||||||||||||||||||||||||
| February 1 to February 28 | 291,202 | 9.36 | 291,202 | 67,734,708 | ||||||||||||||||||||||||||||||||||
| March 1 to March 31 | 1,457,252 | 9.52 | 1,457,252 | 53,861,669 | ||||||||||||||||||||||||||||||||||
| Total | 1,748,454 | $ | 9.50 | 1,748,454 | $ | 53,861,669 | ||||||||||||||||||||||||||||||||
| Period | Total Number of Shares Purchased | Average Price Paid per Share | Total Number of Shares Purchased as Part of Publicly Announced Plans or Programs | Approximate Dollar Value of Shares That May Yet Be Purchased Under the Plans or Programs (1) | ||||||||||||
| April 1 to April 30 | — | $ | — | — | $ | 100,000,000 | ||||||||||
| May 1 to May 31 | — | — | — | 100,000,000 | ||||||||||||
| June 1 to June 30 | 253,898 | 2.09 | 253,898 | 99,469,293 | ||||||||||||
| Total | 253,898 | $ | 2.09 | 253,898 | $ | 99,469,293 | ||||||||||
As of July 31, 2020,April 30, 2021, we repurchased 1,035,249343,894 additional shares at an average price per share of $2.47$11.21 for a total cost of $3$4 million.
38
ITEM 6. EXHIBITS
| Exhibit No. | Description | |||||||
| Indenture, dated as of February 2, 2021, among Resolute Forest Products Inc., the guarantors party thereto and Wells Fargo Bank, National Association, as trustee (incorporated by reference from Exhibit 4.2 to the Company’s Annual Report on Form 10-K for the year ended December 31, 2020, filed March 1, 2021, SEC File No. 001-33776). | ||||||||
| Change in control agreement between Remi G. Lalonde and Resolute Forest Products Inc. | ||||||||
| Special Advisor Employment Agreement between Yves Laflamme and Resolute Forest Products Inc., dated April 9, 2021. | ||||||||
| First Amendment effective April 19, 2021, to the Amended and Restated Credit Agreement, dated as of October 28, 2019, among Resolute Forest Products Inc., certain U.S. subsidiaries of Resolute Forest Products Inc. as borrowers and guarantors, various lenders, and American AgCredit, FLCA, as administrative agent and collateral agent. | ||||||||
| Amendment No 3 dated January 28, 2021, to the Credit Agreement dated May 22, 2015, as amended by the First Amendment dated as of December 22, 2017 and by the Second Amendment dated as of May 14, 2019, with certain lenders and Bank of America, N.A., as U.S. administrative agent and collateral agent, and Bank of America, N.A. (through its Canada branch) as the Canadian administrative agent. | ||||||||
| Certification of President and Chief Executive Officer Pursuant to Section 302 of the Sarbanes-Oxley Act of 2002. | ||||||||
| Certification of Senior Vice President and Chief Financial Officer Pursuant to Section 302 of the Sarbanes-Oxley Act of 2002. | ||||||||
| Certification of President and Chief Executive Officer Pursuant to Section 906 of the Sarbanes-Oxley Act of 2002. | ||||||||
| Certification of Senior Vice President and Chief Financial Officer Pursuant to Section 906 of the Sarbanes-Oxley Act of 2002. | ||||||||
| 101.INS* | XBRL Instance Document. | |||||||
| 101.SCH* | XBRL Taxonomy Extension Schema Document. | |||||||
| 101.CAL* | XBRL Taxonomy Extension Calculation Linkbase Document. | |||||||
| 101.LAB* | XBRL Taxonomy Extension Label Linkbase Document. | |||||||
| 101.PRE* | XBRL Taxonomy Extension Presentation Linkbase Document. | |||||||
| 101.DEF* | XBRL Taxonomy Extension Definition Linkbase Document. | |||||||
| † | This is a management contract or compensatory plan or arrangement. | ||||
| * | Interactive data files furnished with this Form 10-Q, which represent the following materials from this Form 10-Q formatted in XBRL (eXtensible Business Reporting Language): (i) the Consolidated Statements of Operations, (ii) the Consolidated Statements of Comprehensive Income (Loss), (iii) the Consolidated Balance Sheets, (iv) the Consolidated Statements of Changes in Equity, (v) the Consolidated Statements of Cash Flows and (vi) the Notes to Unaudited Interim Consolidated Financial Statements. The instance document does not appear in the Interactive Data File because its XBRL tags are embedded within the inline XBRL document. | ||||
39
SIGNATURES
Pursuant to the requirements of the Securities Exchange Act of 1934, the Registrant has duly caused this Report to be signed on its behalf by the undersigned thereunto duly authorized.
| RESOLUTE FOREST PRODUCTS INC. | ||||||||
| By | /s/ | |||||||
| Senior Vice President and Chief Financial Officer | ||||||||
| By | /s/ | |||||||
| Vice President and Chief Accounting Officer | ||||||||
Date: AugustMay 10, 2020
40