
1
UNITED STATES
SECURITIES AND EXCHANGE COMMISSION
Washington, DC 20549
FORM 10-Q
|
|
| |
|
|
| |
|
Interlink Plus, Inc.Washington, D.C. 20549
FORM 10-Q
(Mark One)
☒QUARTERLY REPORT PURSUANT TO SECTION 13 OR 15(d) OF THE SECURITIES EXCHANGE ACT OF 1934
For the quarterly period ended March 31, 2024
OR
☐TRANSITION REPORT PURSUANT TO SECTION 13 OR 15(d) OF THE SECURITIES EXCHANGE ACT OF 1934
For the transition period from to
Commission File Number: 001-41508
LOOP MEDIA, INC.
(Exact name of registrant as specified in its charter)
| ||
Nevada | | 47-3975872 |
(State or other jurisdiction of incorporation) |
| (IRS Employer Identification |
2600 West Olive Avenue, Suite 5470, Burbank, CA91505 | ||
(Address of principal executive offices) (Zip Code) | ||
| ||
(213)436-2100 | ||
(Registrant’s telephone number, including area code) N/A (Former Name, Former Address and Former Fiscal Year, | ||
4952 S Rainbow Blvd, Suite 326Securities registered pursuant to Section 12(b) of the Act:
Title of each class | Trading Symbol(s) | Name of each exchange on which registered | ||
Common stock, $0.0001 par value per share | LPTV | The NYSE American, LLC |
Las Vegas, NV 89118
(Address of principal executive offices)
702-824-7047
(Registrant’s telephone number)
(Former name, former address and former fiscal year, if changed since last report)
Indicate by check mark whether the registrantregistrant: (1) has filed all reports required to be filed by Section 13 or 15(d) of the Securities Exchange Act of 1934 during the preceding 12 months (or for such shorter period that the registrant was required to file such reports), and (2) has been subject to such filing requirements for the past 90 daysdays. ☒ Yes ☐ No
[X] Yes [ ] No
Indicate by check mark whether the registrant has submitted electronically and posted on its corporate Web site, if any, every Interactive Data File required to be submitted and posted pursuant to Rule 405 of Regulation S-T (§232.405 of this chapter) during the preceding 12 months (or for such shorter period that the registrant was required to submit and post such files). [X]☒ Yes [ ]☐ No
Indicate by check mark whether the registrant is a large accelerated filer, an accelerated filer, a non-accelerated filer, a smaller reporting company, or an emerging growth company. See the definitions of “large accelerated filer,” “accelerated filer,” “smaller reporting company,” and “emerging growth company” in Rule 12b-2 of the Exchange Act.
Large accelerated filer ☐ | Accelerated filer ☐ |
|
|
|
If an emerging growth company, indicate by check mark if the registrant has elected not to use the extended transition period for complying with any new or revised financial accounting standards provided pursuant to Section 13(a) of the Exchange Act. [ ]☐
StateIndicate by check mark whether the number of shares outstanding of eachregistrant is a shell company (as defined in Rule 12b-2 of the issuer’s classesExchange Act). ☐Yes ☒No
As of May 2, 2024, the registrant had 71,173,736 shares of common stock asissued and outstanding.
![[itrk10q2.gif]](https://capedge.com/proxy/10-Q/0001393905-18-000065/itrk10q2.gif)
TABLE OF CONTENTS
| |||
| | ||
2 | |||
|
| ||
Management’s Discussion and Analysis of Financial Condition and Results of |
| ||
Quantitative and Qualitative |
| ||
| |||
| | | |
57 | |||
| | | |
| |||
| |||
Unregistered Sales of Equity Securities and Use of |
| ||
| |||
| |||
| |||
| |||
2
PART I - FINANCIAL INFORMATION
Item 1. Financial Statements
Our financial statements included in this Form 10-Q are as follows:
| ||
| ||
| ||
| ||
These
PART I — FINANCIAL INFORMATION
Item 1.Financial Statements.
LOOP MEDIA, INC. AND SUBSIDIARIES
CONDENSED CONSOLIDATED BALANCE SHEETS
| | | | | |
| March 31, |
| September 30, | ||
| 2024 | | 2023 | ||
ASSETS | (UNAUDITED) |
| |
| |
Current assets | |
|
| |
|
Cash | $ | 2,197,359 | | $ | 3,068,696 |
Accounts receivable, net |
| 3,572,222 | |
| 6,211,815 |
Prepaid expenses and other current assets |
| 667,124 | |
| 987,605 |
Content assets, current | | 1,749,683 | | | 2,218,894 |
Total current assets |
| 8,186,388 | |
| 12,487,010 |
Non-current assets |
|
| |
|
|
Deposits |
| 9,968 | |
| 12,054 |
Content assets, non-current | | 257,921 | | | 448,726 |
Deferred costs, non-current | | 698,570 | | | 744,408 |
Property and equipment, net |
| 2,290,284 | |
| 2,711,558 |
Operating lease right-of-use assets |
| 205,545 | |
| — |
Intangible assets, net |
| 421,667 | |
| 477,889 |
Total non-current assets |
| 3,883,955 | |
| 4,394,635 |
Total assets | $ | 12,070,343 | | $ | 16,881,645 |
LIABILITIES AND STOCKHOLDERS’ EQUITY (DEFICIT) |
|
| |
| |
Current liabilities |
|
| |
|
|
Accounts payable | $ | 7,942,137 | | $ | 4,978,920 |
Accrued liabilities | | 1,494,278 | | | 3,546,338 |
Accrued royalties and revenue share | | 5,256,608 | | | 4,930,329 |
License content liabilities, current | | 865,572 | | | 489,157 |
Equipment financing liability, current | | 32,998 | | | — |
Deferred Income |
| 52,983 | |
| — |
Lease liability, current | | 66,024 | | | — |
Revolving line of credit, current | | 1,824,560 | | | 2,985,298 |
Non-revolving line of credit, current | | 994,033 | | | 2,124,720 |
Non-revolving line of credit - related party, current |
| 1,000,000 | |
| — |
Total current liabilities |
| 19,529,193 | |
| 19,054,762 |
Non-current liabilities |
|
| |
|
|
License content liabilities, non-current | | 153,000 | | | 208,000 |
Equipment financing liability, non-current | | 79,381 | | | — |
Lease liability, non-current | | 139,521 | | | — |
Revolving line of credit - related party, non-current | | 1,595,620 | | | — |
Non-revolving line of credit, non-current |
| 537,831 | |
| 475,523 |
Non-revolving line of credit - related party, non-current | | — | | | 1,959,693 |
Total non-current liabilities |
| 2,505,353 | |
| 2,643,216 |
Total liabilities |
| 22,034,546 | |
| 21,697,978 |
| | | | | |
Commitments and contingencies (Note 9) | | — | | | — |
| | | | | |
Stockholders’ equity (deficit) | | | | | |
Common Stock, $0.0001 par value, 150,000,000 shares authorized, 71,173,736 and 65,620,151 shares issued and outstanding as of March 31, 2024 and September 30, 2023, respectively |
| 7,117 | | | 6,562 |
Additional paid in capital |
| 131,170,258 | | | 123,462,648 |
Accumulated deficit |
| (141,141,578) | | | (128,285,543) |
Total stockholders' equity (deficit) |
| (9,964,203) | |
| (4,816,333) |
Total liabilities and stockholders' equity (deficit) | $ | 12,070,343 | | $ | 16,881,645 |
See the accompanying notes to the consolidated financial statements
2
LOOP MEDIA, INC. AND SUBSIDIARIES
CONDENSED CONSOLIDATED STATEMENTS OF OPERATIONS
(UNAUDITED)
| | | | | | | | | | | | |
| | | Three months ended March 31, | | | Six months ended March 31, | ||||||
| |
| 2024 | 2023 | |
| 2024 | 2023 | ||||
| | | | | | | | | | | | |
Revenue | | $ | 4,002,463 | | $ | 5,393,231 | | $ | 14,173,719 | | $ | 20,219,062 |
Cost of revenue | | | | |
| | | | | |
| |
Cost of revenue - Advertising and Legacy and other revenue | | | 2,833,024 | | | 3,177,607 | | | 8,572,733 | | | 11,635,240 |
Cost of revenue - depreciation and amortization | | | 751,276 | | | 630,543 | | | 1,558,284 | | | 1,312,710 |
Total cost of revenue | | | 3,584,300 | | | 3,808,150 | | | 10,131,017 | | | 12,947,950 |
Gross profit | | | 418,163 | |
| 1,585,081 | | | 4,042,702 | |
| 7,271,112 |
| | | | | | | | | | | | |
Operating expenses | | |
| |
|
| | |
| |
|
|
Sales, general and administrative | | | 5,735,694 | |
| 7,769,314 | | | 11,906,671 | |
| 15,727,448 |
Stock-based compensation | | | 1,112,137 | | | 2,475,807 | | | 2,440,362 | | | 4,266,614 |
Depreciation and amortization | | | 413,197 | | | 235,009 | | | 795,072 | | | 422,725 |
Restructuring costs | | | — | | | — | | | — | | | — |
Impairment of goodwill and intangible assets | | | — | | | — | | | — | | | — |
Total operating expenses | | | 7,261,028 | |
| 10,480,130 | | | 15,142,105 | |
| 20,416,787 |
| | | | | | | | | | | | |
Loss from operations | | | (6,842,865) | |
| (8,895,049) | | | (11,099,403) | |
| (13,145,675) |
| | | | | | | | | | | | |
Other income (expense) | | |
| |
|
| | |
| |
|
|
Interest income | | | — | |
| — | | | | |
| — |
Interest expense | | | (729,274) | |
| (919,444) | | | (1,731,464) | |
| (1,927,027) |
Loss on extinguishment of debt | | | — | |
| — | | | | |
| — |
Gain on extinguishment of debt | | | — | | | — | | | | | | — |
Change in fair value of derivatives | | | — | |
| — | | | | |
| — |
Employee retention credits | | | — | | | — | | | | | | — |
Other expense | | | 1,506 | | | (2,624) | | | (25,168) | | | (2,624) |
Total other income (expense) | | | (727,768) | |
| (922,068) | | | (1,756,632) | |
| (1,929,651) |
Loss before income taxes | | | (7,570,633) | | | (9,817,117) | | | (12,856,035) | | | (15,075,326) |
Income tax (expense)/benefit | | | — | |
| — | | | — | |
| (1,230) |
Net loss | | $ | (7,570,633) | | $ | (9,817,117) | | $ | (12,856,035) | | $ | (15,076,556) |
| | | | | | | | | | | | |
Basic and diluted net loss per common share (Note 2) | | $ | (0.11) | | $ | (0.17) | | $ | (0.19) | | $ | (0.27) |
| | | | | | | | | | | | |
Weighted average number of basic and diluted common shares outstanding | | | 71,010,998 | |
| 56,381,209 | | | 68,887,644 | |
| 56,381,209 |
See the accompanying notes to the consolidated financial statements
3
LOOP MEDIA, INC. AND SUBSIDIARIES
CONDENSED CONSOLIDATED STATEMENT OF CHANGES IN STOCKHOLDERS’ EQUITY
FOR THE SIX MONTHS ENDED MARCH 31, 2024, and 2023
(UNAUDITED)
| | | | | | | | | | | | | | |
| | Common Stock | | Additional Paid | | Accumulated | | | | |||||
| | Shares | | Amount | | in Capital | | Deficit | | Total | ||||
Balances, September 30, 2023 |
| 65,620,151 |
| $ | 6,562 |
| $ | 123,462,648 |
| $ | (128,285,543) |
| $ | (4,816,333) |
Stock-based compensation | | — | | | — | | | 1,287,390 | | | — | | | 1,287,390 |
Warrants issued for debt | | — | | | — | | | 1,003,269 | | | — | | | 1,003,269 |
Warrants issued for consulting fees | | — | | | — | | | 40,835 | | | — | | | 40,835 |
Shares issued for consulting fees | | 311,889 | | | 31 | | | 124,101 | | | — | | | 124,132 |
Shares issued for debt conversion | | 3,037,895 | | | 304 | | | 2,455,437 | | | — | | | 2,455,741 |
Shares issued for capital raise costs | | 30,405 | | | 3 | | | 22,497 | | | — | | | 22,500 |
Shares issued upon warrant exercises | | 1,850,874 | | | 185 | | | 1,480,514 | | | — | | | 1,480,699 |
Net loss |
| — | |
| — | |
| — | |
| (5,285,402) | |
| (5,285,402) |
Balances, December 31, 2023 |
| 70,851,214 | | $ | 7,085 | | $ | 129,876,691 | | $ | (133,570,945) | | $ | (3,687,169) |
Stock-based compensation | | — | | | — | | | 1,271,070 | | | — | | | 1,271,070 |
Shares issued for vested RSUs | | 292,117 | | | 29 | | | (29) | | | — | | | — |
Shares issued for capital raise costs | | 30,405 | | | 3 | | | 22,526 | | | — | | | 22,529 |
Net loss | | — | | | — | | | — | | | (7,570,633) | | | (7,570,633) |
Balances, March 31, 2024 |
| 71,173,736 | | $ | 7,117 | | $ | 131,170,258 | | $ | (141,141,578) | | $ | (9,964,203) |
| | | | | | | | | | | | | | |
| | | | | | | | | | | | | | |
| | | | | | | | | | | | | | |
| | Common Stock | | Additional Paid | | Accumulated | | | | |||||
| | Shares | | Amount | | in Capital | | Deficit | | Total | ||||
Balances, September 30, 2022 |
| 56,381,209 |
| $ | 5,638 |
| $ | 101,970,318 |
| $ | (96,321,864) |
| $ | 5,654,092 |
Stock-based compensation | | — | | | — | | | 1,790,807 | | | — | | | 1,790,807 |
Net loss |
| — | |
| — | |
| — | |
| (5,259,439) | |
| (5,259,439) |
Balances, December 31, 2022 | | 56,381,209 | | $ | 5,638 | | $ | 103,761,125 | | $ | (101,581,303) | | $ | 2,185,460 |
Stock-based compensation | | — | | | — | | | 2,475,807 | | | — | | | 2,475,807 |
Short swing profit recovery | | — | | | — | | | 1,201 | | | — | | | 1,201 |
Issuance costs from uplist of stock | | — | | | — | | | (86,330) | | | — | | | (86,330) |
Net loss | | — | | | — | | | — | | | (9,817,117) | | | (9,817,117) |
Balances, March 31, 2023 |
| 56,381,209 | | $ | 5,638 | | $ | 106,151,803 | | $ | (111,398,420) | | $ | (5,240,979) |
See the accompanying notes to the consolidated financial statements
4
LOOP MEDIA, INC. AND SUBSIDIARIES
CONDENSED CONSOLIDATED STATEMENTS OF CASH FLOWS
(UNAUDITED)
| | | | | |
| Six months ended March 31, | ||||
| 2024 |
| 2023 | ||
CASH FLOWS FROM OPERATING ACTIVITIES | |
|
| |
|
Net loss | $ | (12,856,035) | | $ | (15,076,556) |
Adjustments to reconcile net loss to net cash used in operating activities: |
|
| |
| |
Amortization of debt discount |
| 924,766 | | | 1,244,329 |
Depreciation and amortization expense |
| 795,072 | | | 422,725 |
Amortization of content assets | | 1,558,283 | | | 1,312,710 |
Amortization of right-of-use assets |
| (205,545) | | | 59,511 |
Bad debt expense | | 677,882 | | | — |
Extinguishment of debt converted to equity | | 338,858 | | | — |
Loss on extinguishment of debt converted to equity | | 25,424 | | | — |
Stock-based compensation |
| 2,599,295 | | | 4,266,614 |
Shares issued for capital raise costs | | 44,997 | | | — |
Shares issued for consulting fees | | 124,135 | | | — |
Shares issued for vested RSUs | | 29 | | | — |
Change in operating assets and liabilities: |
| | |
| |
Accounts receivable |
| 1,961,711 | | | 6,896,649 |
Inventory |
| 7,604 | | | 10,252 |
Prepaid expenses |
| 312,880 | | | 568,138 |
Deposit |
| 2,086 | | | (201) |
Accounts payable |
| 3,509,252 | | | (1,181,952) |
Accrued liabilities | | (2,054,235) | | | (2,207,835) |
Accrued royalties and revenue share | | 326,279 | | | (1,374,484) |
License content liability |
| (751,100) | | | (3,457,477) |
Operating lease liabilities |
| 205,545 | | | (57,046) |
Equipment financing liability | | 112,379 | | | — |
Deferred income |
| 52,983 | | | (140,764) |
NET CASH USED IN OPERATING ACTIVITIES |
| (2,287,455) | |
| (8,715,387) |
| | | | | |
CASH FLOWS FROM INVESTING ACTIVITIES |
|
| |
|
|
Purchase of property and equipment |
| (473,562) | | | (1,046,876) |
NET CASH USED IN INVESTING ACTIVITIES |
| (473,562) | |
| (1,046,876) |
| | | | | |
CASH FLOWS FROM FINANCING ACTIVITIES |
|
| |
|
|
Proceeds from lines of credit | | 19,793,104 | | | 28,087,249 |
Repayments on lines of credit | | (19,001,212) | | | (27,326,600) |
Proceeds from exercise of warrants | | 1,480,699 | | | — |
Issuance costs for stock uplist | | — | | | (86,330) |
Deferred costs | | (167,789) | | | (61,983) |
Payment of acquisition related consideration | | — | | | (250,125) |
Debt issuance costs | | (215,122) | | | (22,300) |
Short swing profit recovery | | — | | | 1,201 |
NET CASH PROVIDED BY FINANCING ACTIVITIES |
| 1,889,680 | |
| 341,112 |
| | | | | |
Change in cash and cash equivalents |
| (871,337) | |
| (9,421,151) |
Cash, beginning of period |
| 3,068,696 | |
| 14,071,914 |
Cash, end of period | $ | 2,197,359 | | $ | 4,650,763 |
| | | | | |
SUPPLEMENTAL DISCLOSURES OF CASH FLOW STATEMENTS |
|
| |
|
|
Cash paid for interest | $ | 511,738 | | $ | 665,309 |
Cash paid for income taxes | $ | — | | $ | 1,230 |
SUPPLEMENTAL DISCLOSURES OF NON CASH INVESTING AND FINANCING ACTIVITIES |
|
| |
|
|
Shares issued for debt conversion | $ | 2,455,741 | | $ | — |
Deferred costs for warrants issued for debt | $ | — | | $ | — |
Unpaid additions to licensed content and internally developed content | $ | 200,167 | | $ | 52,916 |
Unpaid deferred costs | $ | 36,625 | | $ | 170,862 |
Unpaid additions to property and equipment | $ | 30,820 | | $ | 387,588 |
See the accompanying notes to the consolidated financial statements
5
LOOP MEDIA, INC. AND SUBSIDIARIES
NOTES TO CONDENSED CONSOLIDATED FINANCIAL STATEMENTS
MARCH 31, 2024
(UNAUDITED)
NOTE 1 – BUSINESS
Loop Media, Inc., a Nevada corporation, (collectively, “Loop Media,” the “Company,” “we,” “us” or “our”) is a multichannel digital video platform media company that uses marketing technology, or “MarTech,” to generate our revenue and offer our services. Our technology and vast library of videos and licensed content enable us to curate and distribute short-form videos to connected televisions (“CTV”) in out-of-home (“OOH”) dining, hospitality and retail establishments, convenience stores and other locations and venues to enable them to inform, entertain and engage their customers. Our technology also provides businesses the ability to promote and advertise their products via digital signage and provides third-party advertisers with a targeted marketing and promotional tool for their products and services. We also allow our business clients to access our service without advertisements by paying a monthly subscription fee.
We offer hand-curated music video content licensed from major and independent record labels, including Universal Music Group (“Universal”), Sony Music Entertainment (“Sony”), and Warner Music Group (“Warner” and collectively with Universal and Sony, the “Music Labels”), as well as non-music video content. Our non-music video content is predominantly licensed or acquired from third parties, including action sports clips, drone and nature footage, trivia, news headlines, lifestyle channels and kid-friendly videos, as well as movie, television and video game trailers, amongst other content. We distribute our content and advertising inventory to digital screens located in OOH locations primarily through (i) our owned and operated platform (the “O&O Platform”) of Loop Media-designed “small-box” streaming Android media players (“Loop Players”) and legacy ScreenPlay (as defined below) computers and (ii) through screens (“Partner Screens”) on digital platforms owned and operated by third parties (each a “Partner Platform” and collectively, the “Partner Platforms,” and together with the O&O Platform, the “Loop Platform”).
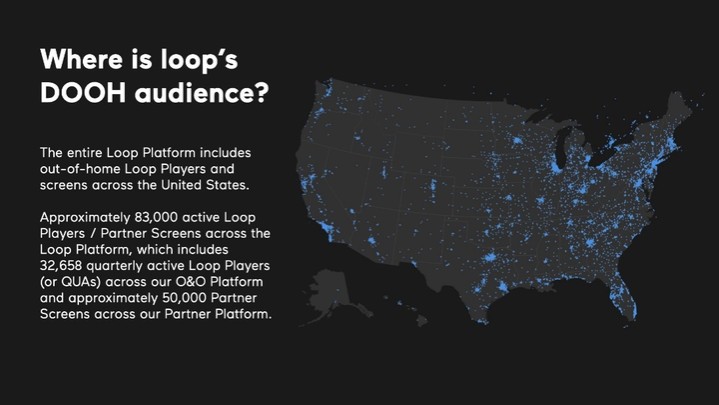
As of March 31, 2024, we had approximately 83,000 active Loop Players and Partner Screens across the Loop Platform, which include 32,658 quarterly active Loop Players, or QAUs (as defined below) across our O&O Platform, a decrease of 1,125 over the quarter ended December 31, 2023, and approximately 50,000 Partner Screens across our Partner Platforms, an increase of approximately 7,000 Partner Screens over the quarter ended December 31, 2023.
We define an “active unit” as (i) an ad-supported Loop Player or digital out-of-home (“DOOH”) location using our ad- supported service through our “Loop for Business” application or using a DOOH venue-owned computer screening our content, that is online, used on our O&O Platform, playing content and has checked into the Loop Media analytics system at least once in the 90-day period ending on the date of measurement, or (ii) a DOOH location customer using our subscription service on our O&O Platform at any time during the 90-day period. We use “QAU” to refer to the number of such active units during such period. We do not count towards our QAUs any Loop Players or screens used on our Partner Platform.
Liquidity and management’s plan
As shown in the accompanying consolidated financial statements, we have incurred recurring losses resulting in an accumulated deficit. We anticipate further losses in the foreseeable future. We also had negative cash flows used in operations. These factors raise substantial doubt about our ability to continue as a going concern. Our primary source of operating funds since inception has been cash proceeds from the sale of our Common Stock and debt and equity financing transactions. Our ability to continue as a going concern is dependent upon our ability to generate sufficient revenue and our ability to raise additional funds by way of our debt and equity financing efforts.
The accompanying consolidated financial statements have been prepared on a going concern basis, which contemplates the realization of assets and satisfaction of liabilities in the ordinary course of business. These unaudited
6
consolidated financial statements do not include any adjustments relating to the recoverability and classification of recorded asset amounts or the amounts and classification of liabilities that might be necessary if we are unable to continue as a going concern. Our ability to continue as a going concern is dependent on our ability to supplement our cash from revenues with additional cash raised from equity investment or debt transactions while maintaining reduced spending levels.
On December 22, 2022, we filed a Shelf Registration Statement on Form S-3 that has been declared effective by the Securities and Exchange Commission (“SEC”). On May 12, 2023, we entered into an At Market Issuance Sales Agreement (the “ATM Sales Agreement”) with B. Riley Securities, Inc. (the “Agent”) pursuant to which we may offer and sell, from time to time through the Agent, shares of our common stock, par value $0.0001 per share (“Common Stock”), for aggregate gross proceeds of up to $50,000,000. As of the date of this Report, however, we are now subject to the limitations of General Instruction I.B.6. of Form S-3, and in accordance with the terms of the ATM Sales Agreement, the number of shares of our Common Stock available for sale thereunder is now limited to one-third of the aggregate market value of our Common Stock held by non-affiliates of the Company, as calculated pursuant to General Instruction I.B.6. of Form S-3. On January 8, 2024, we filed a Prospectus Supplement to the Prospectus filed on January 11, 2023, to decrease the amount of our Common Stock that is available to be sold under the ATM Sales Agreement, such that we registered the offer and sale of our Common Stock having an aggregate sales price of up to $18,200,000, from time to time. During the six months ended March 31, 2024, and from April 1, 2024, through the date of this Report, we have not raised any funds through sales under our ATM Sales Agreement.
Effective as of July 29, 2022, we entered into a Loan and Security Agreement with Industrial Funding Group, Inc. (the “Initial Lender”), which was subsequently assigned to GemCap Solutions, LLC (“GemCap”) for a revolving loan credit facility for the initial principal sum of up to $4,000,000, which was subsequently increased to $6,000,000, and through the exercise of an accordion feature, a total sum of up to $10,000,000 (the “GemCap Revolving Line of Credit Agreement”). As of March 31, 2024, the GemCap Revolving Line of Credit had a balance, including accrued interest, amounting to $2,147,821. See “Note 8 – Debt.”
NOTE 2 – SUMMARY OF SIGNIFICANT ACCOUNTING POLICIES
Interim Financial Statements
The following (a) condensed consolidated balance sheet as of September 30, 2023, which has been derived from our audited financial statements, and (b) our unaudited condensed consolidated interim financial statements for the six months ended March 31, 2024, have been prepared in accordance with accounting principles generally accepted in the United States of America("US GAAP") for interim financial information and the SEC instructions to Form 10-Q.10-Q and Rule 8-03 of Regulation S-X of the Securities Act of 1933. Accordingly, they do not include all of the information and footnotes required by US GAAP for complete financial statements. In the opinion of management, all adjustments (consisting of normal recurring accruals) considered necessary for a fair presentation have been included. Operating results for the interim periodsix months ended DecemberMarch 31, 20172024, are not necessarily indicative of the results that canmay be expected for the full year.year ending September 30, 2024.
3
INTERLINK PLUS, INC.
BALANCE SHEETS
(unaudited)
|
| December 31, |
| June 30, | ||
|
| 2017 |
| 2017 | ||
|
|
|
|
| ||
ASSETS |
|
|
|
| ||
|
|
|
|
| ||
Current assets: |
|
|
|
| ||
Cash |
| $ | 25,618 |
| $ | 12,201 |
Accounts receivable |
|
| 3,463 |
|
| 11,121 |
Prepaid expenses |
|
| 181,857 |
|
| 58,693 |
Total current assets |
|
| 210,938 |
|
| 82,015 |
|
|
|
|
|
|
|
Other assets: |
|
|
|
|
|
|
Fixed assets, net |
|
| 1,078 |
|
| - |
Website, net |
|
| 1,618 |
|
| 2,201 |
Total other assets |
|
| 2,696 |
|
| 2,201 |
|
|
|
|
|
|
|
Total assets |
| $ | 213,634 |
| $ | 84,216 |
|
|
|
|
|
|
|
|
|
|
|
|
|
|
LIABILITIES AND STOCKHOLDERS' EQUITY (DEFICIT) |
|
|
|
|
|
|
|
|
|
|
|
|
|
Current liabilities: |
|
|
|
|
|
|
Accounts payable |
| $ | 9,074 |
| $ | 15,891 |
Accounts payable - related party |
|
| 45,312 |
|
| 57,000 |
Customer deposits |
|
| 210,893 |
|
| 60,559 |
Notes payable |
|
| 15,000 |
|
| - |
Notes payable - related party |
|
| - |
|
| 6,000 |
Accrued interest payable |
|
| 4,535 |
|
| 1,521 |
Accrued interest payable - related party |
|
| 1,687 |
|
| 1,759 |
Convertible debt, net |
|
| 15,000 |
|
| 14,167 |
Convertible debt - related party, net |
|
| 6,658 |
|
| 4,000 |
Total current liabilities |
|
| 308,159 |
|
| 160,897 |
|
|
|
|
|
|
|
Total liabilities |
|
| 308,159 |
|
| 160,897 |
|
|
|
|
|
|
|
Stockholders' equity (deficit): |
|
|
|
|
|
|
Series A Convertible Preferred stock, $0.0001 par value, 25,000,000 shares authorized, 2,700,000 and 2,700,000 shares issued and outstanding as of December 31, 2017 and June 30, 2017, respectively |
|
| 270 |
|
| 270 |
Common stock, $0.0001 par value, 475,000,000 shares authorized, 67,373,008 and 67,373,008 shares issued and outstanding as of December 31, 2017 and June 30, 2017, respectively |
|
| 6,737 |
|
| 6,737 |
Additional paid-in capital |
|
| 70,179 |
|
| 62,862 |
Retained deficit |
|
| (171,711) |
|
| (146,550) |
Total stockholders' equity (deficit) |
|
| (94,525) |
|
| (76,681) |
|
|
|
|
|
|
|
Total liabilities and stockholders' equity (deficit) |
| $ | 213,634 |
| $ | 84,216 |
See accompanying notes to financial statements.
F-1
INTERLINK PLUS, INC.
STATEMENTS OF OPERATIONS
(unaudited)
|
| For the |
| For the |
| For the |
| For the | ||||
|
| three months |
| three months |
| six months |
| six months | ||||
|
| ended |
| ended |
| ended |
| ended | ||||
|
| December 31, |
| December 31, |
| December 31, |
| December 31, | ||||
|
| 2017 |
| 2016 |
| 2017 |
| 2016 | ||||
|
|
|
|
|
|
|
|
| ||||
Revenue |
| $ | 34,718 |
| $ | 3,998 |
| $ | 51,812 |
| $ | 9,537 |
|
|
|
|
|
|
|
|
|
|
|
|
|
Costs and expenses: |
|
|
|
|
|
|
|
|
|
|
|
|
Cost of goods sold |
|
| - |
|
| - |
|
| - |
|
| 109 |
General and administrative |
|
| 5,654 |
|
| 1,014 |
|
| 11,862 |
|
| 1,287 |
Depreciation and amortization |
|
| 389 |
|
| 125 |
|
| 681 |
|
| 250 |
Professional fees |
|
| 26,463 |
|
| 8,697 |
|
| 39,046 |
|
| 13,960 |
Professional fees - related party |
|
| 9,000 |
|
| 9,000 |
|
| 18,000 |
|
| 18,000 |
|
|
|
|
|
|
|
|
|
|
|
|
|
Total costs and expenses |
|
| 41,506 |
|
| 18,836 |
|
| 69,589 |
|
| 33,606 |
|
|
|
|
|
|
|
|
|
|
|
|
|
Operating loss |
|
| (6,788) |
|
| (14,838) |
|
| (17,777) |
|
| (24,069) |
|
|
|
|
|
|
|
|
|
|
|
|
|
Other income (expenses): |
|
|
|
|
|
|
|
|
|
|
|
|
Interest expense |
|
| (2,632) |
|
| (4,239) |
|
| (3,848) |
|
| (11,569) |
Interest expense - related party |
|
| (1,995) |
|
| (267) |
|
| (3,536) |
|
| (535) |
|
|
|
|
|
|
|
|
|
|
|
|
|
Total other expenses |
|
| (4,627) |
|
| (4,506) |
|
| (7,384) |
|
| (12,104) |
|
|
|
|
|
|
|
|
|
|
|
|
|
Net loss |
| $ | (11,415) |
| $ | (19,344) |
| $ | (25,161) |
| $ | (36,173) |
|
|
|
|
|
|
|
|
|
|
|
|
|
|
|
|
|
|
|
|
|
|
|
|
|
|
Net loss per common share - basic |
| $ | (0.00) |
| $ | (0.00) |
| $ | (0.00) |
| $ | (0.00) |
|
|
|
|
|
|
|
|
|
|
|
|
|
Net loss per common share - diluted |
| $ | (0.00) |
| $ | (0.00) |
| $ | (0.00) |
| $ | (0.00) |
|
|
|
|
|
|
|
|
|
|
|
|
|
Weighted average number of common shares outstanding - basic and diluted |
|
| 67,373,008 |
|
| 63,242,573 |
|
| 67,373,008 |
|
| 59,827,755 |
See accompanying notes to financial statements.
F-2
INTERLINK PLUS, INC.
STATEMENTS OF CASH FLOWS
(unaudited)
|
| For the |
| For the | ||
|
| six months |
| six months | ||
|
| ended |
| ended | ||
|
| December 31, |
| December 31, | ||
|
| 2017 |
| 2016 | ||
CASH FLOWS FROM OPERATING ACTIVITIES |
|
|
|
| ||
Net loss |
| $ | (25,161) |
| $ | (36,173) |
Adjustments to reconcile to net loss to net cash used in operating activities: |
|
|
|
|
|
|
Depreciation and amortization |
|
| 681 |
|
| 250 |
Amortization of debt discount |
|
| 4,441 |
|
| 10,774 |
Changes in operating assets and liabilities: |
|
|
|
|
|
|
(Increase) in accounts receivable |
|
| 7,658 |
|
| (1,589) |
(Increase) decrease in prepaid expenses |
|
| (123,164) |
|
| (375) |
(Decrease) in accounts payable |
|
| (6,817) |
|
| 187 |
Increase (decrease) in accounts payable - related party |
|
| (11,688) |
|
| 18,000 |
Increase in accrued interest payable - related party |
|
| (72) |
|
| 535 |
Increase (decrease) in accrued interest payable |
|
| 3,014 |
|
| 796 |
Increase in customer deposits |
|
| 150,334 |
|
| 8,757 |
|
|
|
|
|
|
|
Net cash used in operating activities |
|
| (774) |
|
| 1,162 |
|
|
|
|
|
|
|
CASH FLOWS FROM INVESTING ACTIVITIES |
|
|
|
|
|
|
Purchase fixed assets |
|
| (1,176) |
|
| - |
|
|
|
|
|
|
|
Net cash used in operating activities |
|
| (1,176) |
|
| - |
|
|
|
|
|
|
|
CASH FLOWS FROM FINANCING ACTIVITIES |
|
|
|
|
|
|
Proceeds from notes payable |
|
| 15,000 |
|
| - |
Proceeds from convertible debt |
|
| - |
|
| 10,000 |
Donated capital |
|
| 367 |
|
| - |
|
|
|
|
|
|
|
Net cash provided by financing activities |
|
| 15,367 |
|
| 10,000 |
|
|
|
|
|
|
|
|
|
|
|
|
|
|
NET CHANGE IN CASH |
|
| 13,417 |
|
| 11,162 |
|
|
|
|
|
|
|
CASH AT BEGINNING OF PERIOD |
|
| 12,201 |
|
| 1,909 |
|
|
|
|
|
|
|
CASH AT END OF PERIOD |
| $ | 25,618 |
| $ | 13,071 |
|
|
|
|
|
|
|
SUPPLEMENTAL INFORMATION: |
|
|
|
|
|
|
Interest paid |
| $ | - |
| $ | - |
Income taxes paid |
| $ | - |
| $ | - |
|
|
|
|
|
|
|
Non-cash investing and financing activities: |
|
|
|
|
|
|
Amortization of debt discount |
| $ | 4,441 |
| $ | 7,024 |
See accompanying notes to financial statements.
F-3
INTERLINK PLUS, INC.
NOTES TO FINANCIAL STATEMENTS
(UNAUDITED)
NOTE 1 - SUMMARY OF SIGNIFICANT ACCOUNTING POLICIES
Basis of presentation
The interimThese unaudited condensed consolidated financial statements included herein, presented in accordance with United States generally accepted accounting principles and stated in US dollars, have been prepared by the Company, without audit, pursuant to the rules and regulations of the Securities and Exchange Commission. Certain information and footnote disclosures normally included in financial statements prepared in accordance with generally accepted accounting principles have been condensed or omitted pursuant to such rules and regulations, although the Company believes that the disclosures are adequate to make the information presented not misleading.
These statements reflect all adjustments, consisting of normal recurring adjustments, which in the opinion of management, are necessary for fair presentation of the information contained therein. It is suggested that these interim financial statementsshould be read in conjunction with the audited consolidated financial statements of the Companyand notes thereto for the year ended JuneSeptember 30, 2017 and notes thereto2023, included in our Annual Report on Form 10-K filed with the Company’s annual report. SEC on December 19, 2023.
Basis of presentation
The Company followsconsolidated financial statements include our accounts and our wholly-owned subsidiaries, EON Media Group Pte. Ltd. and Retail Media TV, Inc. The unaudited condensed consolidated financial statements are prepared using the sameaccrual basis of accounting policiesin accordance with US GAAP. All inter-company transactions and balances have been eliminated on consolidation.
7
Use of estimates
The preparation of the unaudited condensed consolidated financial statements in conformity with US GAAP requires management to make estimates and assumptions that affect the reported amounts of assets and liabilities and disclosure of contingent assets and liabilities at the date of the financial statements and the reported amounts of revenue and expenses during the reporting period. Actual results could differ from those estimates. Significant estimates include assumptions used in the preparationrevenue recognition of performance obligations, allowance for doubtful accounts, fair value of stock-based compensation awards, income taxes and going concern.
Segment reporting
We report as one reportable segment. Our business activities, revenues and expenses are evaluated by management as one reportable segment.
In November 2023, the Financial Accounting Standards Board (“FASB”) issued Accounting Standards Update (“ASU”) 2023-07, Segment Reporting (Topic 280): Improvements to Reportable Segment Disclosures, that would enhance disclosures for significant segment expenses for all public entities required to report segment information in accordance with ASC 280. ASC 280 requires a public entity to report for each reportable segment a measure of segment profit or loss that its chief operating decision maker (“CODM”) uses to assess segment performance and to make decisions about resource allocations. The amendments in ASU 2023-07 improve financial reporting by requiring disclosure of incremental segment information on an annual and interim reports.basis for all public entities to enable investors to develop more useful financial analyses. Currently, Topic 280 requires that a public entity disclose certain information about its reportable segments. For example, a public entity is required to report a measure of segment profit or loss that the CODM uses to assess segment performance and make decisions about allocating resources. ASC 280 also requires other specified segment items and amounts such as depreciation, amortization and depletion expense to be disclosed under certain circumstances. The amendments in ASU 2023-07 do not change or remove those disclosure requirements. The amendments in ASU 2023-07 also do not change how a public entity identifies its operating segments, aggregates those operating segments, or applies the quantitative thresholds to determine its reportable segments. The amendments in ASU 2023-07 are effective for fiscal years beginning after December 15, 2023, and interim periods within fiscal years beginning after December 15, 2024. Early adoption is permitted. A public entity should apply the amendments in ASU 2023-07 retrospectively to all prior periods presented in the financial statements. We are currently evaluating the impact of this standard on our condensed consolidated financial statements and related disclosures.
Results of operations for the interim period are not indicative of annual results.Cash
Organization
The Company was incorporated on May 11, 2015 (Date of Inception) under the laws of the State of Nevada, as Interlink Plus, Inc.
Nature of operations
The Company will provide services for oversea travel agents on hotel price quotation and negotiation, contract reviewing, detailed guests’ arrangements, hotel check-in assistance, as well as tradeshow services to domestic and international businesses. Additionally, the Company is offering marketing materials and other products for the tradeshows.
Year end
The Company’s year-end is June 30.
Cash and cash equivalents
For the purpose of the statements of cash flows, include all highly liquid investmentsmonetary instruments with an original maturitymaturities of three months or less when purchased. These investments are consideredcarried at cost, which approximates fair value. Financial instruments that potentially subject us to concentrations of credit risk consist primarily of cash deposits. We maintain our cash in institutions insured by the Federal Deposit Insurance Corporation (“FDIC”). At times, our cash and cash equivalent balances may be uninsured or in amounts that exceed the FDIC insurance limits. We have not experienced any losses on such accounts. On March 31, 2024, and September 30, 2023, we had no cash equivalents.
As of March 31, 2024, and September 30, 2023, approximately $1,947,359 and $2,818,696 of cash exceeded the FDIC insurance limits, respectively.
Accounts receivable
Accounts receivable represent amounts due from customers. We assess the collectability of receivables on an ongoing basis. A provision for the impairment of receivables involves significant management judgment and includes the review of individual receivables based on individual customers, current economic trends and analysis of historical bad debts. As of March 31, 2024, and September 30, 2023, we had recorded an allowance for doubtful accounts of $677,882 and $630,629, respectively.
8
Concentration of credit risk
During the six months ended March 31, 2024, we had two customers which each individually comprised greater than 10% of net revenue. These customers represented 24% and 16% respectively. No other customer accounted for more than 10% of net revenue during the periods presented.
During the six months ended March 31, 2023, we had two customers which each individually comprised greater than 10% of net revenue. These customers represented 17% and 15% respectively. No other customer accounted for more than 10% of net revenue during the periods presented.
As of March 31, 2024, two customers accounted for a total of 22% of our accounts receivable balance or 12% and 10%, respectively. No other customer accounted for more than 10% of total accounts receivable.
As of March 31, 2023, three customers accounted for a total of 45% of our accounts receivable balance or 20%, 15% and 10%, respectively. No other customer accounted for more than 10% of total accounts receivable.
We grant credit in the normal course of business to our customers. Periodically, we review past due accounts and make decisions about future credit on a customer-by-customer basis. Credit risk is the risk that one party to a financial instrument will cause a loss for the other party by failing to discharge an obligation.
Prepaid expenses
Expenditures paid in one accounting period which will not be consumed until a future period such as insurance premiums and annual subscription fees are accounted for on the balance sheet as a prepaid expense. When the asset is eventually consumed, it is charged to expense.
Content Assets
We capitalize the fixed content fees and corresponding liability when the license period begins, the cost of the content is known, and the content is accepted and available for streaming. If the licensing fee is not determinable or reasonably estimable, no asset or liability is recorded, and licensing costs are expensed as incurred. We amortize licensed content assets into cost of revenue, using the straight-line method over the contractual period of availability. The liability is paid in accordance with the contractual terms of the arrangement. Internally-developed content costs are capitalized in the same manner as licensed content costs, when the cost of the content is known and the content is ready and available for streaming. We amortize internally-developed content assets into cost of revenue, using the straight-line method over the estimated period of streaming.
Long-lived assets
We evaluate the recoverability of long-lived assets, including intangible assets, for impairment when events or changes in circumstances indicate that the carrying amount of an asset may not be recoverable. Conditions that would necessitate an impairment assessment include a significant decline in the observable market value of an asset, a significant change in the extent or manner that an asset is used, or a significant adverse change that would indicate that the carrying amount of an asset or group of assets is not recoverable. For long-lived assets to be held and used, we recognize an impairment loss only if their carrying amount is not recoverable through the undiscounted cash equivalents.flows. The carrying value of these investments approximates fair value.
Accounts receivable
The allowance for uncollectible accounts receivablesimpairment loss is determined principallybased on the difference between the carrying amount and estimated fair value as determined by discounted future cash flows. Our finite long-lived intangible assets are amortized on a straight-line basis of past collection experience as well as consideration of current economic conditions and changes in our customer collection trends. Since the inception of the Company through today, the Company has had no material bad debt write offs and believes its current policy is reasonable.over their estimated useful lives, which range from two to nine years.
Fixed assets
The Company records all propertyProperty and equipment, net
Property and equipment are stated at cost, less accumulated depreciation. Improvements are capitalized while repairs and maintenance costs are expensed as incurred. Depreciation is calculated using the straight-line method over the asset’s estimated useful lifelife. Our capitalization policy is to capitalize property and equipment purchases greater than $3,000, as well as internally-developed software enhancements. Expenditures for maintenance and
9
Computer equipment: 3 years
F-4
INTERLINK PLUS, INC.
NOTES TO FINANCIAL STATEMENTS
(UNAUDITED)
NOTE 1 - SUMMARY OF SIGNIFICANT ACCOUNTING POLICIES (CONTINUED)
Website
The Company capitalizes the costs associated with the development of the Company’s website pursuant to ASC Topic 350. Other costs related to the maintenance of the websiterepairs are expensed as incurred. AmortizationWhen retired or otherwise disposed, the related carrying value and accumulated depreciation are removed from the respective accounts and the net difference less any amount realized from disposition is providedreflected in earnings.
Loop Players are capitalized as fixed assets and depreciated over the estimated period of use.
See below for estimated useful lives of 3 years usinglives:
| | |
Loop Players | | 3 years |
Equipment | 3-5 years | |
Software | | 3 years |
Operating leases
We determine if an arrangement is a lease at inception. Operating lease right-of-use assets (“ROU assets”) and short-term and long-term lease liabilities are included on the straight-line method for financial statement purposes. The Company plans to commence amortization upon completion and releaseface of the Company’s fully operational website.consolidated balance sheet.
Revenue recognition
We recognize revenue when allROU assets represent the right to use an underlying asset for the lease term and lease liabilities represent our obligation to make lease payments arising from the lease. Operating lease ROU assets and liabilities are recognized at commencement date based on the present value of lease payments over the following conditions are satisfied: (1) there is persuasive evidence of an arrangement; (2) the product or service has been provided to the customer; (3) the amount of fees to be paid by the customer is fixed or determinable; and (4) the collectionlease term. As most of our fees is probable.
The Company will record revenueleases do not provide an implicit rate, we use an incremental borrowing rate based on the information available at commencement date in determining the present value of lease payments. Our lease terms may include options to extend or terminate the lease when it is realizablereasonably certain that we will exercise that option. Lease expense for lease payments is recognized on a straight-line basis over the lease term. We have lease agreements with lease and earnednon-lease components, which are accounted for as a single lease component. For lease agreements with terms less than twelve months, we have elected the short-term lease measurement and recognition exemption, and we recognize such lease payments on a straight-line basis over the services are completed as part of the service contract.lease term.
Advertising costs
Advertising costs are anticipated to be expensed as incurred; however there were no advertising costs included in general and administrative expenses for the six months ended December 31, 2017.
Fair value of financial instrumentsmeasurement
Fair value estimates discussed herein are based upon certain market assumptions and pertinent information available to management as of December 31, 2017. The respective carryingWe determine the fair value of certain on-balance-sheet financial instruments approximated their fair values. These financial instruments include cash, prepaid expensesour assets and accounts payable. Fair values were assumed to approximate carrying values for cash and payables because they are short term in nature and their carrying amounts approximate fair values or they are payable on demand.
Level 1:
The preferredliabilities using a hierarchy established by the accounting guidance that prioritizes the inputs to valuation efforts are “quotedtechniques used to measure fair value. The hierarchy gives the highest priority to valuations based upon unadjusted quoted prices in active markets for identical assets or liabilities” with (Level 1 measurements) and the caveatlowest priority to valuations based upon unobservable inputs that are significant to the reporting entity mustvaluation (Level 3 measurements). The three levels of valuation hierarchy are defined as follows:
| ● | Level 1 inputs to the valuation methodology are quoted prices for identical assets or liabilities in active markets. |
| ● | Level 2 inputs to the valuation methodology included quoted prices for similar assets and liabilities in active markets, quoted prices for identical or similar assets in inactive markets, and inputs that are observable for the asset or liability, either directly or indirectly, for substantially the full term of the financial instrument. |
| ● | Level 3 inputs to the valuation methodology is one or more unobservable inputs which are significant to the fair value measurement. |
The carrying amount of our financial instruments, including cash, accounts receivable, deposits, short-term portion of notes receivable and notes payable, and current liabilities approximate fair value due to their short-term nature. We do not have accessfinancial assets or liabilities that are required under US GAAP to that market. Informationbe measured at this levelfair value on a recurring basis. We have not elected to use fair value measurement option for any assets or liabilities for which fair value measurement is based on direct observations of transactions involving the samenot presently required.
We record assets and liabilities not assumptions, and thus offers superior reliability. However, relatively few items, especially physical assets, actually trade in active markets.
Level 2:
FASB acknowledged that active markets for identical assets and liabilities are relatively uncommon and, even when they do exist, they may be too thin to provide reliable information. To deal with this shortage of direct data, the board provided a second level of inputs that can be applied in three situations.
Level 3:
If inputs from levels 1 and 2 are not available, FASB acknowledges thatat fair value measures of many assets and liabilities are less precise. The board describes Level 3 inputson a nonrecurring basis as “unobservable,” and limits their userequired by saying they “shall be used to measureUS GAAP. Assets recognized or disclosed at fair value to the extent that observable inputs are not available.” This category allows “for situations in which there is little, if any, market activity for the asset or liability at the measurement date”. Earlier in the standard, FASB explains that “observable inputs”condensed consolidated financial statements on a nonrecurring basis include items such as
10
property and equipment, operating lease assets, goodwill, and other intangible assets, which are gathered from sources other than the reporting companymeasured at fair value if determined to be impaired.
On September 26, 2022, our convertible debentures converted to Common Stock as part of our public offering and that they are expecteduplist to reflect assumptions made by market participants.
F-5
INTERLINK PLUS, INC.
NOTES TO FINANCIAL STATEMENTS
(UNAUDITED)
NOTE 1 - SUMMARY OF SIGNIFICANT ACCOUNTING POLICIES (CONTINUED)
Stock-based compensation
The Company records stock based compensationNYSE American, LLC, in accordance with the guidance in ASC Topic 505 and 718 which requiresterms of the Companyoriginal debt agreements. As of September 30, 2022, the remaining balance of the Derivative Liability was written off as part of the conversion to recognize expenses related to theequity. Thus, there is no fair value of its employee stock option awards. This eliminates accounting for share-based compensation transactions using the intrinsic value and requires instead that such transactions be accounted for using a fair-value-based method. The Company recognizes the cost of all share-based awards on a graded vesting basis over the vesting periodmeasurement of the award.Derivative Liability balance as of March 31, 2024.
The Company accountsAdvertising costs
We expense all advertising costs as incurred.
Advertising and marketing costs for equity instruments issuedthe three months ended March 31, 2024, and 2023, were $1,747,971 and $2,779,517, respectively.
Advertising and marketing costs for the six months ended March 31, 2024, and 2023, were $3,926,219 and $5,904,544, respectively.
Revenue recognition
We recognize revenue in accordance with ASC 606, Revenue from Contracts with Customers, when it satisfies a performance obligation by transferring control over a product to a customer. Revenue is measured based on the consideration we expect to receive in exchange for those products. In instances where final acceptance of the receiptproduct is specified by the client, revenue is deferred until all acceptance criteria have been met. For example, we bill subscription services in advance of goods when the service is performed and revenue is treated as deferred revenue until the service is performed and/or the performance obligation is satisfied. Revenues are recognized under Topic 606 in a manner that reasonably reflects the delivery of our products and services to clients in return for expected consideration and includes the following elements:
| ● | executed contracts with our customers that we believe are legally enforceable; |
| ● | identification of performance obligations in the respective contract; |
| ● | determination of the transaction price for each performance obligation in the respective contract; |
| ● | allocation of the transaction price to each performance obligation; and |
| ● | recognition of revenue only when we satisfy each performance obligation. |
Our revenue can be categorized into two revenue streams: Advertising revenue and Legacy and other revenue.
The following table disaggregates our revenue by major type for each of the periods indicated:
| | | | | | | | | | | | |
| | Three months ended March 31, | | Six months ended March 31, | ||||||||
| | | 2024 | | | 2023 | | | 2024 | | | 2023 |
Advertising revenue | | $ | 3,544,992 | | $ | 4,648,390 | | $ | 12,939,756 | | $ | 18,607,895 |
Legacy and other revenue | | | 457,471 | | | 744,841 | | | 1,233,963 | | | 1,611,167 |
Total | | $ | 4,002,463 | | $ | 5,393,231 | | $ | 14,173,719 | | $ | 20,219,062 |
11
Performance obligations and significant judgments
Our performance obligations and recognition patterns for each revenue stream are as follows:
Advertising revenue
For the three months ended March 31, 2024, and 2023, advertising revenue accounts for 89% and 86%, respectively, of our revenue and includes revenue from direct programmatic and local advertising as well as sponsorships.
For the six months ended March 31, 2024, and 2023, advertising revenue accounts for 91% and 92%, respectively, of our revenue and includes revenue from direct programmatic and local advertising as well as sponsorships.
For all advertising revenue sources, we evaluate whether we should be considered the principal (i.e., report revenues on a gross basis) or an agent (i.e., report revenues on a net basis). Our role as principal or agent differs based on our performance obligation for each revenue share arrangement.
For both the O&O and Partner Platforms businesses, advertising inventory provided to advertisers through the use of an advertising demand partner or agency, with whose fees or commission is calculated based on a stated percentage of gross advertising spending, we are considered the agent and our revenues are reported net of agency fees and commissions. We are considered the agent because the demand partner or agency controls all aspects of the transaction (pricing risk, inventory risk, obligation for fulfillment) except for the devices used to show the advertisements, therefore we report this advertising revenue net of agency fees and commissions.
We are considered the principal in our arrangements with content providers in our O&O Platform business and with our arrangements with our third-party partners in our Partner Platforms business and thus report revenues on a gross basis (net of agency fees and commissions), wherein the amounts billed to our advertising demand partners, advertising agencies, and direct advertisers and sponsors are recorded as revenues, and amounts paid to content providers and third-party partners are recorded as expenses. We are considered the principal because we control the advertising space, are primarily responsible to our advertising demand partners and other parties filling our advertising inventory, have discretion in pricing and advertising fill rates and typically have an inventory risk.
For advertising revenue, we recognize revenue at the time the digital advertising impressions are filled and the advertisements are played and, for sponsorship revenue, we generally recognize revenue ratably over the term of the sponsorship arrangement as the sponsored advertisements are played.
Legacy and other business revenue
For the three months ended March 31, 2024, and 2023, legacy and other business revenue accounts for the remaining 11% and 14%, respectively, of total revenue and includes streaming services, subscription content services, and hardware delivery, as described below.
For the six months ended March 31, 2024, and 2023, legacy and other business revenue accounts for the remaining 9% and 8%, respectively, of total revenue and includes streaming services, subscription content services, and hardware delivery, as described below:
| ● | Delivery of streaming services including content encoding and hosting. We recognize revenue over the term of the service based on bandwidth usage. Revenue from streaming services is insignificant. |
| ● | Delivery of subscription content services in customized formats. We recognize revenue straight-line over the term of the service. |
| ● | Delivery of hardware for ongoing subscription content delivery through software. We recognize revenue at the point of hardware delivery. Revenue from hardware sales is insignificant. |
12
Transaction prices for performance obligations are explicitly outlined in relevant agreements; therefore, we do not believe that significant judgments are required with respect to the determination of the transaction price, including any variable consideration identified.
Customer acquisition costs
Customer acquisition costs consist of marketing costs and affiliate fees associated with the O&O Platform business. They are included in operating expenses and expensed as incurred.
Cost of revenue
Cost of revenue for the O&O Platform and legacy businesses represents the amortized cost of ongoing licensing and hosting fees, which is recognized over time based on usage patterns. The depreciation expense associated with the Loop Players is not included in cost of sales.
Cost of revenue for the Partner Platform business represents hosting fees, amortized costs of internally-developed content, and the revenue share with third party partners (after deduction of allocated infrastructure costs). The cost of revenue is higher with partners within the Partner Platform versus those within the O&O Platform because we leverage our Partner Platform partners’ network of customers and their screens to deliver content and advertising inventory, rather than employeesusing our own Loop Players.
Deferred income
Deferred income represents our accounting for the timing difference between when fees are received and when the performance obligation is satisfied.
Net loss per share
We account for net loss per share in accordance with FASB ASC 718-10subtopic 260-10, Earnings Per Share (“ASC 260-10”), which requires presentation of basic and the conclusions reached by the FASB ASC 505-50. Costs are measured at the estimated fair market value of the consideration received or the estimated fair value of the equity instruments issued, whichever is more reliably measurable. The value of equity instruments issued for consideration other than employee services is determined on the earliest of a performance commitment or completion of performance by the provider of goods or services as defined by FASB ASC 505-50.
Earnings per share
The Company follows ASC Topic 260 to account for thediluted earnings per share. Basic earning per common share (“EPS”) calculations are determinedon the face of the statement of operations for all entities with complex capital structures and requires a reconciliation of the numerator and denominator of the basic EPS computation to the numerator and denominator of the diluted EPS.
Basic net loss per share is computed by dividing net incomeloss attributable to common stockholders by the weighted average number of shares of Common Stock outstanding during each period. It excludes the dilutive effects of any potentially issuable common shares.
Diluted net loss per share is calculated by including any potentially dilutive share issuances in the denominator.
The following securities are excluded from the calculation of weighted average diluted shares at March 31, 2024, and September 30, 2023, respectively, because their inclusion would have been anti-dilutive.
| | | | |
|
| March 31, | | September 30, |
| | 2024 | | 2023 |
Options to purchase common stock |
| 8,213,763 |
| 8,849,305 |
Warrants to purchase common stock |
| 6,866,699 |
| 5,592,573 |
Restricted Stock Units (RSUs) | | 4,443,473 | | 1,156,397 |
Series A preferred stock |
| — |
| — |
Series B preferred stock |
| — |
| — |
Convertible debentures |
| — |
| — |
Total common stock equivalents |
| 19,523,935 |
| 15,598,275 |
13
On December 14, 2023, we entered into Warrant Reprice Letter Agreements with certain holders to amend the exercise price of existing exercisable warrants to $0.80 per share and to exercise an aggregate of 1,850,874 shares of our Common Stock for an aggregate exercise price of $1,480,699. The impact of the amendment resulted in a deemed dividend in the amount of $419,939, which was calculated based on the change in fair value.
For the six months ended March 31, 2024, a reconciliation of the numerator and denominator used in the calculation of basic and diluted net loss per share of our Common Stock is as follows:
| | | | | | |
| | Six months ended March 31, | ||||
| | 2024 | | 2023 | ||
Numerator: | | | | | | |
Net loss | | $ | (12,856,035) | | $ | (15,076,556) |
Plus: Deemed dividend on warrants | | | (419,939) | | | — |
Net loss attributable to common stockholders | | $ | (13,275,974) | | $ | (15,076,556) |
| | | | | | |
Denominator: | | | | | | |
Weighted average number of common shares outstanding | | | 68,887,644 | |
| 56,381,209 |
| | | | |
| |
Basic and diluted net loss per common share | | $ | (0.19) | | $ | (0.27) |
Shipping and handling costs
Loop Players are provided free to our customers. Loop Media absorbs any associated costs of shipping and handling and records as an operational expense at the time of service.
Income taxes
We account for income taxes in accordance with ASC Topic 740, Income Taxes (“ASC 740”). ASC 740 requires a company to use the asset and liability method of accounting for income taxes, whereby deferred tax assets are recognized for deductible temporary differences, and deferred tax liabilities are recognized for taxable temporary differences. Temporary differences are the differences between the reported amounts of assets and liabilities and their tax bases. Deferred tax assets are reduced by a valuation allowance when, in the opinion of management, it is more likely than not that some portion, or all of, the deferred tax assets will not be realized. Deferred tax assets and liabilities are adjusted for the effect of changes in tax laws and rates on the date of enactment.
Under ASC 740, a tax position is recognized as a benefit only if it is “more likely than not” that the tax position would be sustained in a tax examination, with a tax examination being presumed to occur. The amount recognized is the largest amount of tax benefit that is greater than 50% likely of being realized on examination. For tax positions not meeting the “more likely than not” test, no tax benefit is recorded. We have no material uncertain tax positions for any of the reporting periods presented.
We recognize accrued interest and penalties related to unrecognized tax benefits as part of income tax expense. We have also made a policy election to treat the income tax with respect to global intangible low-tax income as a period expense when incurred.
In December 2019, the FASB issued ASU No. 2019-12, Simplifying the Accounting for Income Taxes, as part of its initiative to reduce complexity in accounting standards. The amendments in the ASU are effective for fiscal years beginning after December 15, 2020, including interim periods therein. The adoption of this standard in the first quarter of 2022 had no impact on our consolidated financial statements.
In December 2023, the FASB issued ASU 2023-09, Income Taxes (Topic 740): Improvements to Income Tax Disclosures (“ASU 2023-09”). ASU 2023-09 is intended to enhance the transparency and decision usefulness of income tax disclosures. The amendments in ASU 2023-09 address investor requests for enhanced income tax information primarily
14
through changes to the rate reconciliation and income taxes paid information. ASU 2023-09 will be effective for us in the annual period beginning October 1, 2025, though early adoption is permitted. We are still evaluating the presentational effect that ASU 2023-09 will have on our consolidated financial statements, but we expect considerable changes to our income tax footnote.
Stock-based compensation
Stock-based compensation issued to employees is measured at the grant date, based on the fair value of the award, and is recognized as an expense over the requisite service period. We measure the fair value of the stock-based compensation issued to non-employees using the stock price observed in the trading market (for stock transactions) or the fair value of the award (for non-stock transactions), which were more reliably determinable measures of fair value than the value of the services being rendered.
Deferred financing costs
Deferred financing costs represent legal, accounting and other direct costs related to our efforts to raise capital through a public or private sale of our Common Stock. Costs related to the public sale of our Common Stock are deferred until the completion of the applicable offering, at which time such costs are reclassified to additional paid-in-capital as a reduction of the proceeds. Costs related to the private sale of our Common Stock are deferred until the completion of the applicable offering, at which time such costs are amortized over the term of the applicable purchase agreement.
Employee retention credits
In March 2020, the Coronavirus Aid, Relief, and Economic Security Act was signed into law, providing numerous tax provisions and other stimulus measures, including the Employee Retention Credit (“ERC”): a refundable tax credit against certain employment taxes. The Taxpayer Certainty and Disaster Tax Relief Act of 2020 and the American Rescue Plan Act of 2021 extended and expanded the availability of the ERC. We qualified for the ERC in the third and fourth quarters of 2020 and the first, second and third quarters of 2021. During the six months ended March 31, 2024, we recorded no aggregate benefit in our condensed combined income statement to reflect the ERC.
Restructuring costs
We undertook initiatives in fiscal year 2023 to increase efficiency and cut costs, while still maintaining our focus on, and dedication to, the continued growth of our business. During fiscal year 2023, we made cuts and adjustments across several aspects of our business. We completed a plan to reduce our overall SG&A costs including labor and various other operating costs. Part of this reduction included eliminating some non-revenue generating headcount, while continuing to invest in expansion of our revenue and ad sales team.
Recently adopted accounting pronouncements
In September 2016, the FASB issued ASU 2016-13, Financial Instruments - Credit Losses (Topic 326): Measurement of Credit Losses on Financial Instruments. This guidance requires the measurement of all expected credit losses for financial assets held at the reporting date based on historical experience, current conditions and reasonable and supportable forecasts. This guidance also requires enhanced disclosures regarding significant estimates and judgments used in estimating credit losses. The new guidance is effective for fiscal years beginning after December 15, 2022. We are currently evaluating the impact of this standard on our condensed consolidated financial statements and related disclosures. We adopted this ASU as of October 1, 2023, and there is no material impact to our financial statements as of March 31, 2024.
Recent accounting pronouncements
In November 2023, the FASB issued ASU 2023-07, Segment Reporting (Topic 280): Improvements to Reportable Segment Disclosures, that would enhance disclosures for significant segment expenses for all public entities required to report segment information in accordance with ASC 280. ASC 280 requires a public entity to report for each
15
reportable segment a measure of segment profit or loss that its chief operating decision maker (“CODM”) uses to assess segment performance and to make decisions about resource allocations. The amendments in ASU 2023-07 improve financial reporting by requiring disclosure of incremental segment information on an annual and interim basis for all public entities to enable investors to develop more useful financial analyses. Currently, Topic 280 requires that a public entity disclose certain information about its reportable segments. For example, a public entity is required to report a measure of segment profit or loss that the CODM uses to assess segment performance and make decisions about allocating resources. ASC 280 also requires other specified segment items and amounts such as depreciation, amortization and depletion expense to be disclosed under certain circumstances. The amendments in ASU 2023-07 do not change or remove those disclosure requirements. The amendments in ASU 2023-07 also do not change how a public entity identifies its operating segments, aggregates those operating segments, or applies the quantitative thresholds to determine its reportable segments. The amendments in ASU 2023-07 are effective for fiscal years beginning after December 15, 2023, and interim periods within fiscal years beginning after December 15, 2024. Early adoption is permitted. A public entity should apply the amendments in ASU 2023-07 retrospectively to all prior periods presented in the financial statements. We are currently evaluating the impact of this standard on our condensed consolidated financial statements and related disclosures.
In December 2023, the FASB issued ASU 2023-09, Income Taxes (Topic 740): Improvements to Income Tax Disclosures (“ASU 2023-09”). ASU 2023-09 is intended to enhance the transparency and decision usefulness of income tax disclosures. The amendments in ASU 2023-09 address investor requests for enhanced income tax information primarily through changes to the rate reconciliation and income taxes paid information. ASU 2023-09 will be effective for us in the annual period beginning October 1, 2025, though early adoption is permitted. We are still evaluating the presentational effect that ASU 2023-09 will have on our consolidated financial statements, but we expect considerable changes to our income tax footnote.
NOTE 3 – CONTENT ASSETS
Content Assets
The content we stream to our users is generally acquired by securing the intellectual property rights to the content through licenses from, and paying royalties or other consideration to, rights holders or their agents. The licensing can be for a fixed fee or can be a revenue sharing arrangement. The licensing arrangements specify the period when the content is available for streaming, the territories, the platforms, the fee structure and other standard content licensing terms defining the rights and/or restrictions for how the licensed content can be used by Loop Media. We also develop original content internally, which is capitalized when the content is ready and available for streaming, and generally amortized over a period of two to three years.
As of March 31, 2024, content assets were $1,749,683 recorded as Content asset, net – current and $257,921 recorded as Content asset, net – noncurrent, of which $104,432 was internally-developed content asset, net.
We recorded amortization expense in cost of revenue, in the consolidated statements of operations, related to capitalized content assets:
| | | | | | | | | | | | |
| | Three months ended March 31, |
| Six months ended March 31, | ||||||||
| | 2024 | | 2023 | | 2024 | | 2023 | ||||
Licensed Content Assets | | $ | 733,061 | | $ | 615,165 | | $ | 1,521,853 | | $ | 1,284,843 |
Internally-Developed Assets | | | 18,215 | | | 15,378 | | | 36,430 | | | 27,867 |
Total | | $ | 751,276 | | $ | 630,543 | | $ | 1,558,283 | | $ | 1,312,710 |
16
Our content license contracts are typically two to three years. The amortization expense for the next three years for capitalized content assets as of March 31, 2024:
| | | | | | | | | |
| | Remaining in Fiscal Year 2024 | | Fiscal Year 2025 | | Fiscal Year 2026 | |||
Licensed Content Assets | | $ | 1,335,308 | | $ | 470,463 | | $ | 97,401 |
Internally-Developed Assets | |
| 36,430 | |
| 59,440 | |
| 8,562 |
Total | | $ | 1,371,738 | | $ | 529,903 | | $ | 105,963 |
License Content Liabilities
As of March 31, 2024, we had $1,218,738 of obligations comprised of $865,572 in License content liability – current, $153,000 in License content liability - noncurrent and $200,167 in accounts payable on our consolidated balance sheets. Payments for content liabilities for the six months ended March 31, 2024, were $468,307. The expected timing of payments for these content obligations is $550,071 payable in fiscal year 2024, $365,500 payable in fiscal year 2025 and $110,000 payable in fiscal year 2026.
NOTE 4. PROPERTY AND EQUIPMENT
Our property and equipment, net consisted of the following as of March 31, 2024, and September 30, 2023:
| | | | | | |
|
| March 31, | | September 30, | ||
| | 2024 | | 2023 | ||
Loop Players | | $ | 3,050,604 | | $ | 2,536,937 |
Equipment | | | 466,156 | | | 801,301 |
Software | |
| 874,966 | |
| 854,966 |
| |
| 4,391,726 | |
| 4,193,204 |
Less: accumulated depreciation | |
| (2,101,442) | |
| (1,481,646) |
Total property and equipment, net | | $ | 2,290,284 | | $ | 2,711,558 |
For the three months ended March 31, 2024, and 2023, depreciation expense, calculated using straight line method, charged to operations amounted to $322,706 and $206,897, respectively.
For the six months ended March 31, 2024, and 2023, depreciation expense, calculated using straight line method, charged to operations amounted to $619,796 and $366,502, respectively.
17
NOTE 5. INTANGIBLE ASSETS
Our intangible assets, each definite lived assets, consisted of the following as of March 31, 2024, and September 30, 2023:
| | | | | | | | |
| | | | March 31, | | September 30, | ||
|
| Useful life |
| 2024 |
| 2023 | ||
Customer relationships | | nine years | | $ | 1,012,000 | | $ | 1,012,000 |
Content library | | two years | |
| 198,000 | |
| 198,000 |
Total intangible assets, gross | | | |
| 1,210,000 | |
| 1,210,000 |
| | | | | | | | |
Less: accumulated amortization | | | |
| (788,333) | |
| (732,111) |
Total | | | |
| (788,333) | |
| (732,111) |
Total intangible assets, net | | | | $ | 421,667 | | $ | 477,889 |
Amortization expense charged to operations amounted to $28,111 and $28,111, for the three months ended March 31, 2024, and 2023, respectively.
Amortization expense charged to operations amounted to $56,222 and $56,222, for the six months ended March 31, 2024, and 2023, respectively.
Annual amortization expense for the next five years and thereafter is estimated to be $56,222 (remaining in fiscal year 2024), $112,444, $112,444, $112,444, and $28,113, respectively. The weighted average life of the intangible assets subject to amortization is 3.7 years as of March 31, 2024.
NOTE 6 – OPERATING LEASES
Operating leases
We have operating leases for office space and office equipment. Many of our leases include one or more options to renew, some of which included options to extend the leases for a long-term period, and some leases included options to terminate the leases within 30 days. In certain of our lease agreements, the rental payments were adjusted periodically to reflect actual charges incurred for capital area maintenance, utilities, inflation and/or changes in other indexes.
Our lease liability consisted of the following as of March 31, 2024, and September 30, 2023:
| | | | | | |
|
| March 31, | | September 30, | ||
| | 2024 | | 2023 | ||
Short term portion | | $ | 66,024 | | $ | — |
Long term portion | |
| 139,521 | |
| — |
Total lease liability | | $ | 205,545 | | $ | — |
Maturity analysis under these lease agreements are as follows:
| | | |
2024 | | $ | 41,804 |
2025 | | | 83,607 |
2026 | | | 83,607 |
2027 | | | 17,082 |
Total undiscounted cash flows | |
| 226,100 |
Less: 10% Present value discount | |
| (20,555) |
Lease liability | | $ | 205,545 |
18
| | | | | | |
We recorded lease expense in sales, general and administration expenses in the consolidated statement of operations:
| | | | | | | | | | | | |
| | Three months ended March 31, | | Six months ended March 31, | ||||||||
| | 2024 |
| 2023 |
| 2024 |
| 2023 | ||||
Operating lease expense | | $ | 13,935 | | $ | 17,495 | | $ | 13,935 | | $ | 61,939 |
Short-term lease expense | |
| 2,400 | |
| 32,431 | |
| 39,243 | |
| 34,831 |
Total lease expense | | $ | 16,335 | | $ | 49,926 | | $ | 53,178 | | $ | 96,770 |
For the three months ended March 31, 2024, and 2023, cash payments against lease liabilities totaled $13,935 and $18,792 and accretion on lease liability of $3,556 and $763.
For the six months ended March 31, 2024, and 2023, cash payments against lease liabilities totaled $13,935 and $59,138 and accretion on lease liability of $3,556 and $2,428.
NOTE 7 – ACCOUNTS PAYABLE AND ACCRUED EXPENSES
Accounts payable and accrued expenses consisted of the following as of March 31, 2024, and September 30, 2023:
| | | | | | |
|
| March 31, | | September 30, | ||
| | 2024 | | 2023 | ||
Accounts payable | | $ | 7,942,137 | | $ | 4,978,920 |
| | | | | | |
Performance bonuses | |
| 300,000 | | | 1,262,000 |
Interest payable | |
| 113,217 | |
| 175,094 |
Professional fees | | | 460,247 | | | 449,944 |
Marketing | | | 282,550 | | | 800,165 |
Insurance liabilities | | | 104,707 | | | 552,000 |
Other accrued liabilities | | | 233,557 | | | 307,135 |
Accrued liabilities | |
| 1,494,278 | |
| 3,546,338 |
| | | | | | |
Accrued royalties and revenue share | | | 5,256,608 | | | 4,930,329 |
| | | | | | |
Total accounts payable and accrued expenses | | $ | 14,693,023 | | $ | 13,455,587 |
19
NOTE 8 – DEBT
| | | | | | | | | | | | | | | |
Lines of Credit as of March 31, 2024: | | | | | | | | | | | | | | | |
| | | | | | | | Unpaid | | Contractual | | | | | |
| | Net Carrying Value | | Principal | | Interest Rates | | Contractual | | Warrants | |||||
Related party lines of credit: | | Current | | Long Term | | Balance | | Cash | | Maturity Date | | issued | |||
$2,500,000 revolving line of credit, December 14, 2023 | | $ | — | | $ | 1,595,620 | | $ | 2,500,000 | | 10% | | 12 months prior written notice | | 3,125,000 |
$1,000,000 non- revolving line of credit, March 28, 2024 | | | 1,000,000 | | | — | | | 1,000,000 | | 12% | | 9/24/2024 | | — |
Total related party lines of credit, net | | $ | 1,000,000 | | $ | 1,595,620 | | $ | 3,500,000 | | | | | | |
| | | | | | | | | | | | | | | |
Lines of credit: | | | | | | | | | | | | | | | |
$2,200,000 non-revolving line of credit, May 13, 2022 | | $ | 994,033 | | $ | — | | $ | 1,100,000 | | 12% | | 8/13/2024 | | 314,286 |
$6,000,000 revolving line of credit, July 29, 2022 | | | 1,824,560 | | | — | | | 2,122,807 | | Greater of 4% or Prime | | 7/29/2024 | | — |
$4,000,000 non-revolving line of credit, May 10, 2023 | | | — | | | 537,831 | | | 800,000 | | 12% | | 5/10/2025 | | 83,142 |
Total lines of credit, net | | $ | 2,818,593 | | $ | 537,831 | | $ | 4,022,807 | | | | | | |
| | | | | | | | | | | | | | | |
| | | | | | | | | | | | | | | |
Lines of Credit as of September 30, 2023: | | | | | | | | | | | | | | | |
| | | | | | | | Unpaid | | Contractual | | | | | |
| | Net Carrying Value | | Principal | | Interest Rates | | Contractual | | Warrants | |||||
Related party lines of credit: | | Current | | Long Term | | Balance | | Cash | | Maturity Date | | issued | |||
$4,000,000 non-revolving line of credit, May 10, 2023 | | $ | — | | $ | 1,959,693 | | $ | 2,266,733 | | 12% | | 5/10/2025 | | 209,398 |
Total related party lines of credit, net | | $ | — | | $ | 1,959,693 | | $ | 2,266,733 | | | | | | |
| | | | | | | | | | | | | | | |
Lines of credit: | | | | | | | | | | | | | | | |
$2,200,000 non-revolving line of credit, May 13, 2022 | | $ | 2,124,720 | | $ | — | | $ | 2,200,000 | | 12% | | 11/13/2023 | | 314,286 |
$6,000,000 revolving line of credit, July 29, 2022 | | | 2,985,298 | | | — | | | 3,730,914 | | Greater of 4% or Prime | | 7/29/2024 | | — |
$4,000,000 revolving line of credit, May 10, 2023 | | | — | | | 475,523 | | | 900,000 | | 12% | | 5/10/2025 | | 83,142 |
Total lines of credit, net | | $ | 5,110,018 | | $ | 475,523 | | $ | 6,830,914 | | | | | | |
20
The following table presents the interest expense related to the contractual interest coupon and the amortization of debt discounts on the lines of credit:
| | | | | |
| | | | | | | | | | | |
| | Three months ended March 31, | | Six months ended March 31, | |||||||
| | 2024 | | | 2023 | | | 2024 | | | 2023 |
Interest expense | $ | 194,922 | | $ | 332,516 | | $ | 513,444 | | $ | 672,895 |
Amortization of debt discounts | | 528,168 | | | 582,994 | | | 1,200,041 | | | 1,244,329 |
Total | $ | 723,090 | | $ | 915,510 | | $ | 1,713,485 | | $ | 1,917,224 |
| | | |
Maturity analysis under the line of credit agreements for the fiscal years ended September 30, | | | |
2024 | | $ | 4,222,807 |
2025 | | | 3,300,000 |
2026 | | | — |
2027 | | | — |
2028 | |
| — |
Lines of credit, related and non-related party | |
| 7,522,807 |
Less: Debt discount on lines of credit payable | |
| (1,570,763) |
Total Lines of credit payable, related and non-related party, net | | $ | 5,952,044 |
Revolving Lines of Credit
Excel Revolving Line of Credit
Effective as of December 14, 2023, we entered into a Revolving Line of Credit Loan Agreement with Excel Family Partners, LLLP, an entity managed by Bruce Cassidy, Chairman of our Board of Directors, (“Excel” and the “Excel Revolving Line of Credit Agreement”) for up to a principal sum of $2,500,000, under which we may pay down and re-borrow up to the maximum amount of the $2,500,000 limit (the “Excel Revolving Line of Credit”). Our drawdown on the Excel Revolving Line of Credit is limited to no more than twenty-five percent (25%) of the last three full months’ revenue, not to exceed $1,250,000 in any quarter, and not to exceed in aggregate the outstanding debt amount of $2,500,000.The Excel Revolving Line of Credit is a perpetual loan, with a maturity date that is twelve (12) months from the date of formal notice of termination by Excel, and accrues interest, payable semi-annually in arrears, at a fixed rate of interest equal to ten percent (10%) per year. Under the Excel Revolving Line of Credit Agreement, we granted to Excel a security interest in all of our present and future assets and properties, real or personal, tangible or intangible, wherever located, including products and proceeds thereof, which security interest is pari passu with the RAT Non-Revolving Line of Credit Agreement and the May 2023 Secured Line of Credit (each as described below), but is subordinate in rights to GemCap under the GemCap Revolving Line of Credit Agreement (as described below).
21
Under the terms of the Excel Revolving Line of Credit Agreement, on December 14, 2023, we issued to Excel a warrant to purchase up to an aggregate of 3,125,000 shares of our Common Stock. The warrant has an exercise price of $0.80 per share, which was the closing price of our Common Stock on December 14, 2023, expires on December 14, 2026, and is exercisable at any time prior to such date, to the extent that after giving effect to such exercise, Excel and its affiliates would beneficially own, for purposes of Section 13(d) of the Exchange Act, no more than 29.99% of the outstanding shares of our Common Stock.
The Excel Revolving Line of Credit had a balance, including accrued interest, amounting to $2,519,396 and $0 as of March 31, 2024, and September 30, 2023, respectively. We incurred interest expense for the Excel Revolving Line of Credit in the amount of $118,284 and $0 for the six months ended March 31, 2024, and 2023, respectively.
GemCap Revolving Line of Credit Agreement
Effective as of July 29, 2022, we entered into a Loan and Security Agreement with Industrial Funding Group, Inc. (the “Initial Lender”) for a revolving loan credit facility for the initial principal sum of up to $4,000,000, and through the exercise of an accordion feature, a total sum of up to $10,000,000 (the “GemCap Revolving Line of Credit Agreement”), evidenced by a Revolving Loan Secured Promissory Note, also effective as of July 29, 2022 (the “GemCap Revolving Line of Credit”). Shortly after the effective date of the GemCap Revolving Line of Credit, the Initial Lender assigned the GemCap Revolving Line of Credit Agreement, and the loan documents related thereto, to GemCap Solutions, LLC (“GemCap” or “Senior Lender.”) Availability for borrowing under the GemCap Revolving Line of Credit is dependent upon our assets in certain eligible accounts and measures of revenue, subject to reduction for reserves that the Senior Lender may require in its discretion, and the accordion feature is a provision whereby we may request that the Senior Lender increase availability under the GemCap Revolving Line of Credit, subject to its sole discretion. Effective as of October 27, 2022, we entered into Amendment Number 1 to the Loan and Security Agreement and to the Revolving Loan Agreement Schedule, and the Amended and Restated Secured Promissory Note (Revolving Loans) with the Senior Lender to increase the principal sum available under the GemCap Revolving Line of Credit Agreement from $4,000,000 to $6,000,000. The GemCap Revolving Line of Credit matures on July 29, 2024, and began accruing interest on the unpaid principal balance of advances, payable monthly in arrears, on September 7, 2022, at an annual rate equal to the greater of (I) the sum of (i) the “Prime Rate” as reported in the “Money Rates” column of The Wall Street Journal, adjusted as and when such Prime Rate changes, plus (ii) zero percent (0.00%), and (II) four percent (4.00%).
Under the GemCap Revolving Line of Credit Agreement, we have granted to the Senior Lender a first-priority security interest in all of our present and future property and assets, including products and proceeds thereof. In connection with the loan, our existing secured lenders, some of whom are the RAT Lenders under our RAT Non-Revolving Line of Credit (each as defined below) (collectively, the “Subordinated Lenders”) delivered subordination agreements (the “GemCap Subordination Agreements”) to the Senior Lender. We are permitted to make regularly scheduled payments, including payments upon maturity, to such subordinated lenders and potentially other payments subject to a measure of cash flow and receiving certain financing activity proceeds, in accordance with the terms of the GemCap Subordination Agreements. In connection with the delivery of the GemCap Subordination Agreements by the Subordinated Lenders, on July 29, 2022, we issued warrants to each Subordinated Lender on identical terms for an aggregate of up to 296,329 shares of our Common Stock (each, a “Subordination Agreement Warrant”). Each Subordination Agreement Warrant has an exercise price of $5.25 per share, expires on July 29, 2025, and is exercisable at any time prior to such date. One warrant for 191,570 warrant shares was issued to Eagle Investment Group, LLC, an entity managed by Bruce Cassidy, Chairman of our Board of Directors (“Mr. Cassidy”), as directed by its affiliate, Excel Family Partners, LLLP (“Excel”), an entity also managed by Mr. Cassidy, one of the Subordinated Lenders. The Subordinated Lenders receiving warrants for the remaining 104,759 warrant shares were also entitled to receive a cash payment of $22,000 six months from the date of the GemCap Subordination Agreements, representing one percent (1.00%) of the outstanding principal amount of the loan held by such Subordinated Lenders. This cash payment was made to those Subordinated Lenders on January 25, 2023.
22
The GemCap Revolving Line of Credit had a balance, including accrued interest, amounting to $2,147,821 and $3,757,074 as of March 31, 2024, and September 30, 2023, respectively. We incurred interest expense for the GemCap Revolving Line of Credit in the amount of $707,962 and $714,740 for the six months ended March 31, 2024, and 2023, respectively.
Non-Revolving Lines of Credit
RAT Non-Revolving Line of Credit
Effective as of May 13, 2022, we entered into a Secured Non-Revolving Line of Credit Loan Agreement (the “RAT Non-Revolving Line of Credit Agreement”) with several institutions and individuals (each a “RAT Lender” and collectively, the “RAT Lenders”) and RAT Investment Holdings, LP, as administrator of the loan (the “Loan Administrator”) for an aggregate principal amount of $2,200,000 (the “RAT Non-Revolving Line of Credit”), evidenced by a Non-Revolving Line of Credit Promissory Note (the “RAT Note”), also effective as of May 13, 2022. Pursuant to the terms of the RAT Non-Revolving Line of Credit Agreement, the RAT Non-Revolving Line of Credit matured eighteen (18) months from the effective date of the RAT Non-Revolving Line of Credit (the “Original RAT Line of Credit Maturity Date”) and accrues interest, payable semi-annually in arrears, at a fixed rate of interest equal to twelve percent (12%) per year. Under the RAT Non-Revolving Line of Credit Agreement, we granted to the RAT Lenders a security interest in all of our present and future assets and properties, real or personal, tangible or intangible, wherever located, including products and proceeds thereof, which security interest is pari passu with the Excel Revolving Line of Credit Agreement (as defined above) and the May 2023 Secured Line of Credit Agreement (as defined below) and (each of which are subordinated in connection with our GemCap Revolving Line of Credit Agreement (as defined above)).
In connection with the RAT Non-Revolving Line of Credit Agreement, on May 13, 2022, we issued a warrant (collectively, the “RAT Loan Warrants”) to each RAT Lender for an aggregate of up to 209,522 shares of our Common Stock. Each RAT Loan Warrant had an exercise price of $5.25 per share, expires on May 13, 2025, and is exercisable at any time prior to the expiration date.
Effective as of November 13, 2023, we entered into a Non-Revolving Line of Credit Loan Agreement Amendment (the “RAT Non-Revolving Line of Credit Agreement Amendment”) with the RAT Lenders to: (i) extend the RAT Line of Credit Maturity Date from eighteen (18) months to twenty-seven (27) months from the date of the RAT Non-Revolving Line of Credit Agreement, or August 13, 2024 (the “First Extended RAT Line of Credit Maturity Date”); and (ii) amend the payment terms of the RAT Non-Revolving Line of Credit such that payments of interest or principal under the RAT Non-Revolving Line of Credit Agreement and the RAT Note will be due and payable from November 13, 2023, to the First Extended RAT Line of Credit Maturity Date, as follows (a) one payment of $374,000 (comprised of accrued interest of $132,000 due through November 13, 2023, an initial payment of principal of $220,000 and $22,000 as consideration to extend the Original RAT Line of Credit Maturity Date) due on November 13, 2023; and (b) nine (9) monthly payments of principal of $220,000 plus accrued interest, commencing December 13, 2023. In consideration for the extension of the Original RAT Line of Credit Maturity Date, we agreed to amend the terms of the RAT Loan Warrants as well as the Subordination Agreement Warrants issued to the RAT Lenders in connection with the GemCap Subordination Agreements described above to reduce the warrant exercise price to $1.00. See “—GemCap Revolving Line of Credit.” We also agreed to apply one-third (1/3) of the net proceeds of any capital raise that takes place subsequent to the date of the RAT Non-Revolving Line of Credit Agreement Amendment, other than proceeds from an equity offering under our ATM Sales Agreement (as defined below) or from an affiliate or insider, toward paying down the then outstanding principal amount due under the RAT Non-Revolving Line of Credit. Pursuant to the RAT Non-Revolving Line of CreditAgreement Amendment #1, each RAT Lender agreed to enter into a lock-up agreement restricting the disposal of any shares of our Common Stock that are issued in connection with the exercise of the RAT Loan Warrants or the Subordination Agreement Warrants for a period of twelve (12)
23
months from the date of the RAT Non-Revolving Line of Credit Agreement Amendment #1. Effective as of November 13, 2023, we issued an Amended and Restated Non-Revolving Line of Credit Promissory Note Amendment to the Lenders reflecting the extension of the Original Line of Credit Maturity Date.
The RAT Non-Revolving Line of Credit had a balance, including accrued interest, amounting to $1,106,473 and $2,300,899 as of March 31, 2024, and September 30, 2023, respectively. We incurred interest expense for the RAT Non-Revolving Line of Credit in the amount of $310,009 and $446,764 for the six months ended March 31, 2024, and 2023, respectively.
May 2023 Secured Loan
Effective as of May 10, 2023, we entered into a Secured Non-Revolving Line of Credit Loan Agreement (the “May 2023 Secured Line of Credit Agreement”) with several individuals and institutional lenders for aggregate loans of up to $4.0 million (the “May 2023 Secured Line of Credit”), evidenced by Secured Non-Revolving Line of Credit Promissory Notes (each a “May 2023 Secured Note” and collectively, the “May 2023 Secured Notes”), also effective as of May 10, 2023. The May 2023 Secured Line of Credit matures twenty-four (24) months from the date of the May 2023 Secured Line of Credit Agreement and accrues interest, payable semi-annually in arrears, at a fixed rate of interest equal to twelve percent (12%) per year. We granted to the lenders under the May 2023 Secured Line of Credit Agreement a security interest in all of our present and future assets and properties, real or personal, tangible or intangible, wherever located, including products and proceeds thereof, which security interest is pari passu with the RAT Non-Revolving Line of Credit Agreement and the Excel Revolving Line of Credit Agreement, but is subordinate in rights to GemCap under the GemCap Revolving Line of Credit Agreement. See “— GemCap Revolving Line of Credit Agreement.”
In connection with the May 2023 Secured Line of Credit, on May 10, 2023, we agreed to issue to each lender under the May 2023 Secured Line of Credit Agreement, upon drawdown, a warrant to purchase up to an aggregate of 369,517 shares of our Common Stock. The warrants have an exercise price of $4.33 per share, expire on May 10, 2026, and is exercisable at any time prior to such date.
As of May 10, 2023, Excel, an entity managed by Mr. Cassidy, had committed to be a lender under the May 2023 Secured Line of Credit Agreement for an aggregate loan of $2.65 million, and as of September 11, 2023, Excel had not loaned any funds under the May 2023 Secured Line of Credit. On May 31, 2023, we entered into a Secured Non-Revolving Line of Credit Loan Agreement (the “Excel $2.2M Secured Line of Credit Agreement”) with Excel for an aggregate principal amount of up to $2,200,000 (the “Excel $2.2M Line of Credit”), evidenced by a Non-Revolving Line of Credit Promissory Note (the “Excel $2.2M Note”). Pursuant to the terms of a Pay Off Letter Agreement with Excel dated September 12, 2023, we refinanced the outstanding principal and interest of the Excel $2.2M Line of Credit to be included as part of the obligations of the May 2023 Secured Line of Credit Agreement. As a result of such refinancing, as of September 12, 2023, no principal or interest remained outstanding under the Excel $2.2M Secured Line of Credit, and the Excel $2.2M Secured Line of Credit Agreement was terminated, and as of September 12, 2023, Excel had loaned $2,266,733 under the May 2023 Secured Line of Credit Agreement and received a warrant to purchase 209,398 shares of our Common Stock.
As of December 14, 2023, the outstanding principal and interest on Excel’s portion of the May 2023 Secured Line of Credit was $2,328,617 (the “Excel May 2023 Secured Line of Credit Pay Off-Amount”), of the total aggregate principal and interest outstanding under the May 2023 Secured Line of Credit of $3,262,817. On December 14, 2023, Excel agreed to convert the Excel May 2023 Secured Line of Credit Pay-Off Amount owed under the May 2023 Secured Line of Credit Agreement into 2,910,771 shares of our Common Stock at a conversion price per share of $0.80. In addition, in connection with the Warrant Repricing (as defined below), on December 14, 2023, Excel agreed to the reprice the per share warrant exercise price of the warrant for 209,398 shares of our Common Stock to $0.80 per warrant share and immediately exercised the warrant, delivering the net proceeds of $167,518.40 to us. See “—Repricing and Exercise of Certain Warrants.”
24
On December 31, 2023, one of the remaining lenders under the May 2023 Secured Line of Credit converted $101,699.83 in outstanding principal and interest into 127,124 shares of our Common Stock at a conversion price per share of $0.80. As of March 31, 2024, a total principal amount of $800,000 remained outstanding on the May 2023 Secured Line of Credit and warrants for a total of 83,142 warrant shares had been issued to the remaining lenders in connection with the May 2023 Secured Line of Credit and remained outstanding.
The May 2023 Secured Loan had a principal balance, including accrued interest, amounting to $861,333 and $3,214,769 as of March 31, 2024, and September 30, 2023, respectively. We incurred interest expense for the 2023 Secured Loan in the amount of $576,229 and $0 for the six months ended March 31, 2024, and 2023, respectively.
Excel $1.0M Line of Credit
On March 28, 2024, we entered into a Secured Non-Revolving Line of Credit Loan Agreement with Excel (“Excel $1.0M Secured Line of Credit Agreement”) for an aggregate principal amount of up to $1,000,000 (the “Excel $1.0M Line of Credit”), evidenced by a Secured Non-Revolving Line of Credit Promissory Note (the “Excel $1.0M Note”). The Excel $1.0M Line of Credit matures one hundred eighty (180) days from the date of the Excel $1.0M Secured Line of Credit Agreement (the “Excel $1.0M Line of Maturity Date”) and accrues interest, payable in arrears on the Excel $1.0M Line of Credit Maturity Date, at a fixed rate of interest equal to twelve percent (12%) per year.
Under the Excel $1.0M Secured Line of Credit Agreement, we granted to Excel a security interest in all of our present and future assets and properties, real or personal, tangible or intangible, wherever located, including products and proceeds thereof, which security interest is subordinate in rights to GemCap under the GemCap Revolving Line of Credit Agreement.
The Excel $1.0M Line of Credit had a balance, including accrued interest, amounting to $1,001,000 and $0 as of March 31, 2024, and September 30, 2023, respectively. We incurred interest expense for the Excel $1.0M Line of Credit in the amount of $1,000 and $0 for the six months ended March 31, 2024, and 2023, respectively.
See Note 12 – Stock Options, Restricted Stock Units (RSUs) and Warrants for discussion on the repricing and exercise of certain existing warrants.
25
NOTE 9 – COMMITMENTS AND CONTINGENCIES
We may be involved in legal proceedings, claims and assessments arising in the ordinary course of business. Such matters are subject to many uncertainties, and outcomes are not predictable with assurance. There are no such loss contingencies that are included in the financial statements as of March 31, 2024.
NOTE 10 – RELATED PARTY TRANSACTIONS
Related parties are natural persons or other entities that have the ability, directly or indirectly, to control another party or exercise significant influence over the party making financial and operating decisions. Related parties include other parties that are subject to common control or that are subject to common significant influences.
500 Limited
For the six months ended March 31, 2024, and 2023, we paid 500 Limited $145,500 and $219,400, respectively, for programming services provided to Loop Media. 500 Limited is an entity controlled by Liam McCallum, our Chief Product and Technology Officer.
See Note 8 – Debt for discussion on the following:
| ● | GemCap Revolving Line of Credit Agreement and Warrants |
| ● | Excel Revolving Line of Credit |
| ● | May 2023 Secured Loan |
| ● | Excel $1.0M Line of Credit |
See Note 12 – Stock Options, Restricted Stock Units (RSUs) and Warrants for discussion on the repricing and exercise of certain existing warrants.
NOTE 11 –STOCKHOLDERS’ EQUITY (DEFICIT)
Change in Number of Authorized and Outstanding Shares
On August 15, 2023, the Loop stockholders voted at our 2023 Annual Meeting of Stockholders to approve an amendment to our Restated Articles of Incorporation to increase the number of shares of common stock, par value of $0.0001 per share (“Common Stock”), authorized for issuance thereunder from 105,555,556 shares to 150,000,000 shares.
On September 21, 2022, a 1 for 3 reverse stock split of our Common Stock became effective. All share and per share information in the accompanying consolidated financial statements and footnotes has been retroactively adjusted for the effects of the reverse split for all periods presented.
Common Stock
Our authorized capital stock consists of 150,000,000 shares of Common Stock, $0.0001 par value per share, and 3,333,334 shares of preferred stock, $0.0001 par value per share.
As of March 31, 2024, and 2023, there were 71,173,736 and 56,381,209, respectively, shares of Common Stock issued and outstanding.
26
Six months ended March 31, 2024
During the six months ended March 31, 2024, we issued 1,850,874 shares of common stock upon the exercise of warrants.
During the six months ended March 31, 2024, we issued 2,910,771 shares of common stock to a board member upon the conversion of non-revolving line of credit plus accrued interest in the amount of $2,328,617.
During the six months ended March 31, 2024, we issued 127,124 shares of common stock upon the conversion of non-revolving line of credit plus accrued interest in the amount of $101,699.83.
During the six months ended March 31, 2024, we issued 60,810 shares of common stock for capital raise costs.
During the six months ended March 31, 2024, we issued 311,889 shares of common stock for consulting fees.
During the six months ended March 31, 2024, we issued 292,117 shares of common stock for vested RSUs.
See Note 12 – Stock Options and Warrants for stock compensation discussion.
Six months ended March 31, 2023
There was no activity during the year. Diluted earningsix months ended March 31, 2023.
See Note 12 – Stock Options and Warrants for stock compensation discussion.
NOTE 12 – STOCK OPTIONS, RESTRICTED STOCK UNITS (RSUs) AND WARRANTS
Options
Option valuation models require the input of highly subjective assumptions. The fair value of stock-based payment awards was estimated using the Black-Scholes option model with a volatility figure derived from using our historical stock prices. We account for the expected life of options based on the contractual life of options for non-employees. For employees, we account for the expected life of options in accordance with the “simplified” method, which is used for “plain-vanilla” options, as defined in the accounting standards codification. The risk-free interest rate was determined from the implied yields of U.S. Treasury zero-coupon bonds with a remaining life consistent with the expected term of the options.
The following table summarizes the stock option activity for the six months ended March 31, 2024:
| | | | | | | | | | |
| | Number of | | Weighted Average | | Weighted Average | | Aggregate | ||
|
| Options |
| Exercise Price |
| Remaining Contractual Term |
| Intrinsic Value | ||
Outstanding at September 30, 2023 |
| 8,849,305 | | $ | 3.84 |
| 6.35 | | $ | — |
Grants |
| 66,666 | | | 0.36 |
| | | | 360 |
Exercised |
| — | |
| — |
| | |
| |
Expired |
| (346,297) | |
| 4.73 |
| | |
| |
Forfeited |
| (355,911) | |
| 2.70 |
| | |
| 72 |
Outstanding at March 31, 2024 |
| 8,213,763 | | $ | 3.82 |
| 5.67 | | $ | 288 |
Exercisable at March 31, 2024 |
| 7,419,609 | | $ | 3.67 |
| 5.36 | | $ | — |
The aggregate intrinsic value in the preceding tables represents the total pretax intrinsic value, based on options with an exercise price less than our stock price of $0.37 as of March 31, 2024, and $5.75 as of March 31, 2023, which would have been received by the option holders had those option holders exercised their options as of that date.
27
We recognize compensation expense for all stock options granted using the fair value-based method of accounting. During the six months ended March 31, 2024, we issued 66,666 options valued at $0.36 per common share calculations are determined by dividing net income byoption. As of March 31, 2024, the total compensation cost related to nonvested awards not yet recognized is $2,382,770 and the weighted average period over which expense is expected to be recognized is 26.5 months.
We calculated the fair value of options issued using the Black-Scholes option pricing model, with the following assumptions:
| | | | |
|
| March 31, 2024 | ||
| | | | |
Weighted average fair value of options granted | | $ | 0.36 | |
Expected life | |
| 6.08 | years |
Risk-free interest rate | |
| 4.67 | % |
Expected volatility | |
| 52.35 | % |
Expected dividends yield | |
| — | % |
Forfeiture rate | |
| — | % |
The stock-based compensation expense related to option grants was $1,658,417 and $3,298,273, for the six months ended March 31, 2024, and 2023, respectively.
Restricted Stock Units
On September 18, 2022, the Compensation Committee of our Board of Directors approved Restricted Stock Unit (“RSU”) awards to certain officers and key employees pursuant to the terms of the Loop Media, Inc. Amended and Restated 2020 Equity Incentive Compensation Plan (the “2020 Plan”).
On September 22, 2022, we granted an aggregate of 890,000 RSUs, which vest over time subject to continued service. Each RSU was valued at the public offering price during our initial public offering of $5.00 per share, and twenty-five percent (25%) of the RSUs vest on the one-year anniversary of the grant date and the remainder in equal quarterly installments over the following three-year period.
On January 3, 2023, the Compensation Committee of our Board of Directors approved RSU awards as compensation to members of our Board of Directors pursuant to the 2020 Plan.
On January 3, 2023, we granted an aggregate of 212,004 RSUs which vest over time subject to continued service. Each RSU was valued at $6.23 per share. Twenty-five percent (25%) of 130,464 RSUs vest on the one-year anniversary of the grant date and the remainder in equal quarterly installments over the following three-year period. One hundred percent (100%) of 81,540 RSUs vested on the day after the end of the fiscal year in which the grant was made.
On July 1, 2023, we granted an aggregate of 54,393 RSUs which vested one hundred percent (100%) on the grant date. Each RSU was valued at $2.39 per share.
On January 1, 2024, we granted an aggregate of 140,000 RSUs which will vest in equal semi-annual installments over a two-year term, beginning on the six (6) month anniversary of the grant date until all RSUs are fully vested. Each RSU was valued at $1.00 per share.
On March 15, 2024, we granted an aggregate of 3,065,000 RSUs which will vest over a two-year period with fifty percent (50%) vesting on the one (1) year anniversary of the grant date and the remainder at twelve and a half percent (12.5%) on a quarterly basis thereafter until all RSUs are fully vested. Each RSU was valued at $0.50 per share.
On March 15, 2024, we granted 600,000 RSUs, which will vest over a four-year period, with one quarter (1/4) of the shares subject to the RSUs vesting on the one (1) year anniversary of the grant date and the remaining shares vesting
28
equally on a quarterly basis beginning three (3) months after the one-year anniversary until all RSUs are fully vested. Each RSU was valued at $0.50 per share.
The following table summarizes the RSU activity for the six months ended March 31, 2024:
| | | | | | | | |
| | Number of | | Weighted Average | | Aggregate | ||
| | RSUs |
| Fair Value |
| Intrinsic Value | ||
Outstanding at September 30, 2023 | | 860,754 | | $ | 5.30 |
| $ | 427,795 |
Granted | | 3,805,000 | |
| |
| | |
Vested | | (222,281) | |
| |
|
| |
Expired | | — | |
| |
|
| |
Forfeited | | — | |
| |
|
| |
Outstanding at March 31, 2024 | | 4,443,473 | | $ | 1.23 |
| $ | 1,647,897 |
| | | | | | | | | | | |
The aggregate intrinsic value in the preceding tables represents the total pretax intrinsic value, based on our stock price of $0.37 as of March 31, 2024, and $5.75 as of March 31, 2023, which would have been received by the RSU holders as of that date.
The stock-based compensation expense related to RSU grants was $702,979 and $766,418, for the six months ended March 31, 2024, and 2023, respectively.
As of March 31, 2024, the total compensation cost related to nonvested RSU awards not yet recognized was $5,137,630 and the weighted average period over which expense is expected to be recognized in months was 29.1.
Warrants
The following table summarizes the warrant activity for the six months ended March 31, 2024:
| | | | | |
| | Number of | | Weighted average exercise | |
| | shares | | price per share | |
Outstanding at September 30, 2023 | | 5,592,573 | | $ | 5.74 |
Issued | | 3,125,000 | | | 0.80 |
Exercised | | (1,850,874) | | | 0.80 |
Expired | | — | | | — |
Outstanding at March 31, 2024 |
| 6,866,699 | | $ | 3.96 |
We record all warrants granted using the fair value-based method of accounting.
During the six months ended March 31, 2024, we issued 3,125,000 warrants in conjunction with a revolving line of credit. We allocated the fair value of the warrants at inception as deferred costs.
During the six months ended March 31, 2024, we recorded debt discount of $1,003,125 for the warrants issued in conjunction with lines of credit and recorded the straight-line amortization ratably over the life of the debt as interest expense.
During the six months ended March 31, 2024, we recorded consulting expense of $78,966 as a result of current period vesting of previously issued warrants to various companies for consulting services.
29
We calculated the fair value of warrants issued using the Black-Scholes option pricing model, with the following assumptions:
| | | | |
|
| March 31, 2024 | ||
| | | | |
Weighted average fair value of warrants granted | | $ | 0.80 | |
Expected life | |
| 3.00 | years |
Risk-free interest rate | |
| 4.09 | % |
Expected volatility | |
| 46.56 | % |
Expected dividends yield | |
| — | % |
Forfeiture rate | |
| — | % |
Repricing and Exercise of Certain Existing Warrants
On December 14, 2023, we agreed to offer to amend certain existing warrants exercisable for an aggregate of up to 4,055,240 shares of our Common Stock (each such warrant an “Existing Warrant”) to reduce the respective exercise prices thereof to $0.80 per share (such new price being referred to as the “Amended Warrant Exercise Price”), which was the closing price per share of our common stock as quoted on the NYSE American on December 13, 2023, on the condition that the holder of each Existing Warrant would commit to exercise the Existing Warrant within a certain period of time, paying the aggregate Amended Warrant Exercise Price of each respective Existing Warrant in cash to us (the “Warrant Repricing”). As of December 14, 2023, Existing Warrants exercisable for an aggregate of up to 786,482 shares of our common stock were held by Excel and Eagle Investment Group, LLC, entities managed by Bruce Cassidy, Sr., Executive Chairman of our Board of Directors, and Existing Warrants exercisable for an aggregate of up to 443,332 shares of our Common Stock were held by Denise Penz, a member of our Board of Directors. In connection with the Warrant Repricing, each of Mr. Cassidy and Ms. Penz exercised their Existing Warrants, resulting in net proceeds to us of $983,851.
As of March 31, 2024, holders of Existing Warrants (including those held by Mr. Cassidy and Ms. Penz) had exercised an aggregate of 1,850,874 shares for an aggregate exercise price of $1,480,699. No other Existing Warrants have been repriced or exercised under the Warrant Repricing.
NOTE 13 – SUBSEQUENT EVENTS
We have evaluated all subsequent events through the date of this quarterly report on Form 10-Q with the SEC, to ensure that this filing includes appropriate disclosure of events both recognized in the financial statements as of March 31, 2024, and events that occurred after March 31, 2024, but which were not recognized in the financial statements.
On April 18, 2024, we entered into a Non-Revolving Line of Credit Loan Agreement Amendment #2 (the “RAT Non-Revolving Line of Credit Agreement Amendment #2”) with the RAT Lenders to: (i) extend the Original RAT Line of Credit Maturity Date from eighteen (18) months to thirty-two (32) months from the date of the RAT Non-Revolving Line of Credit Agreement, or January 13, 2025 (the “Second Extended RAT Line of Credit Maturity Date”); and (ii) amend the payment terms of the RAT Non-Revolving Line of Credit such that payments of interest and principal under the RAT Non-Revolving Line of Credit Agreement and the RAT Note will be due and payable from April 13, 2024, to the Second Extended RAT Line of Credit Maturity Date, as follows: (a) one payment of $121,000, comprised of accrued interest of $11,000 through April 13, 2024, and an initial payment of principal of $110,000, due on April 13, 2024; and (b) nine (9) monthly payments of principal of $110,000, plus accrued interest, commencing May 13, 2024. We issued a Second Amended and Restated Non-Revolving Line of Credit Promissory Note Amendment, effective April 13, 2024, to the RAT Lenders reflecting the extension of the Original RAT Line of Credit Maturity Date.
30
Item 2.Management’s Discussion and Analysis of Financial Condition and Results of Operations.
STATEMENT ON FORWARD-LOOKING INFORMATION
This report (“Report”) on Form 10-Q contains certain forward-looking statements. All statements other than statements of historical fact are “forward-looking statements” for purposes of these provisions, including any projections of earnings, revenues, or other financial items; any statements of the plans, strategies, and objectives of management for future operations; any statements concerning proposed new products, services, or developments; any statements regarding future economic conditions or performance; statements of belief; and any statement of assumptions underlying any of the foregoing. Such forward-looking statements are subject to inherent risks and uncertainties, and actual results could differ materially from those anticipated by the forward-looking statements.
These forward-looking statements involve significant risks and uncertainties, including, but not limited to, the following: competition, promotional costs and risk of declining revenues. Our actual results could differ materially from those anticipated in such forward-looking statements as a result of a number of common factors. These forward-looking statements are made as of the date of this filing, and we assume no obligation to update such forward-looking statements. The following discusses our financial condition and results of operations based upon our financial statements which have been prepared in conformity with accounting principles generally accepted in the United States of America. It should be read in conjunction with our financial statements and the notes thereto included elsewhere herein.
The following discussion and analysis provides information which our management believes to be relevant to an assessment and understanding of our results of operations and financial condition. The discussion should be read together with our financial statements and the notes to the financial statements, which are included in this Report.
Overview
We are a multichannel digital video platform media company that uses marketing technology, or “MarTech,” to generate our revenue and offer our services. Our technology and vast library of videos and licensed content enable us to curate and distribute short-form videos to connected televisions (“CTV”) and other screens; in out-of-home (“OOH”) dining, hospitality and retail establishments, convenience stores and other locations and venues to enable the operators of those locations to inform, entertain and engage their customers. Our technology also provides businesses the ability to promote and advertise their products via digital signage and provides third-party advertisers with a targeted marketing and promotional tool for their products and services. We also allow our business clients to access our service without advertisements by paying a monthly subscription fee.
We offer hand-curated music video content licensed from major and independent record labels, including Universal Music Group (“Universal”), Sony Music Entertainment (“Sony”), and Warner Music Group (“Warner” and collectively with Universal and Sony, the “Music Labels”), as well as non-music video content. Our non-music video content is predominantly licensed or acquired from third parties, including action sports clips, drone and nature footage, trivia, news headlines, lifestyle channels and kid-friendly videos, as well as movie, television and video game trailers, amongst other content. We distribute our content and advertising inventory to digital screens located in OOH locations primarily through (i) our owned and operated platform (the “O&O Platform”) of Loop Media-designed “small-box” streaming Android media players (“Loop Players”) and legacy ScreenPlay (as defined below) computers and (ii) through screens (“Partner Screens”) on digital platforms owned and operated by third parties (each a “Partner Platform” and collectively the “Partner Platforms,” and together with the O&O Platform, the “Loop Platform”).
As of March 31, 2024, we had approximately 83,000 active Loop Players and Partner Screens across the Loop Platform, which include 32,658 quarterly active Loop Players, or QAUs (as defined below) across our O&O Platform, a decrease of 0.23% (or 76 QAUs) from the 32,734 QAUs for the quarter ended March 31, 2023, and a decrease of 1,125 from the 33,783 QAUs for the quarter ended December 31, 2023, and approximately 50,000 Partner Screens across our Partner Platforms, an increase of 108% (or approximately 26,000) over approximately 24,000 Partner Screens for the quarter ended March 31, 2023, and an increase of approximately 7,000 Partner Screens over approximately 43,000 Partner Screens for quarter ended December 31, 2023. See “— Key Performance Indicators.”
31
We have two primary constituents that are included in our customer base: the OOH locations we service and the advertisers who purchase advertising inventory on the Loop Platform. We earn revenue from these customers primarily by selling advertising inventory on the Loop Platform and by collecting subscription fees from our O&O Platform owners and operators that are streaming advertising-free content.
The O&O Platform
The foundation of our business model is built around the OOH experience, with a focus on distributing licensed music videos and other content to public-facing business venues and locations. Our OOH offering has supported hospitality and retail businesses for over 20 years, originally through ScreenPlay, Inc. (“ScreenPlay”), which we fully acquired in 2019. Since the acquisition of ScreenPlay, we have primarily focused on acquiring OOH clients throughout the United States. We have sought very limited expansion into Canada, New Zealand and Australia.
We deliver content across our O&O Platform to the owners and operators of OOH locations who sign up for our media service. We sell advertising impressions contained in the content streams to demand sources, including demand-side platforms (“DSPs”), supply-side platforms (“SSPs”) and advertisers, who pay us to fill those impressions and have their ads delivered into the OOH locations that utilize our services. We also allow OOH locations on our O&O Platform to access our content without advertisements by paying a monthly subscription fee.
From a business operations standpoint, for the O&O Platform business, we view our customers as the owners and operators of the OOH locations that use our content services to engage and entertain the customers that visit the OOH locations. Our customer services team works with the owners and operators of OOH locations in our O&O Platform business to ensure our customers are being properly serviced and addressing any questions about the service, content, advertising performance and other matters.
From an accounting standpoint, for the O&O Platform business, our customers are considered to be those persons that provide revenue to us, which includes the owners and operators of the OOH locations that utilize a subscription-based service, and the advertising demand sources (including DSPs, SSPs and advertisers) that purchase our advertising inventory on the O&O Platform. From an accounting standpoint, the owners and operators of the OOH locations utilizing a free advertising-based service on our O&O Platform are not our customers. Instead, it is the advertising demand sources that are our customers because they are providing revenue to us (by way of purchasing advertising inventory) for the streaming of content to those OOH locations utilizing an ad-free service.
We record as cost of revenue in the O&O Platform business certain costs and expenses associated with operating such business, including the cost of content, streaming costs, and content hosting fees. We procure content from third parties though licensing fees or by purchasing the content outright. Certain of our content, including our music video and certain third-party non-music content, are under licenses that contain a revenue share arrangement. We and the licensor of the content negotiate and pre-agree the percentage of revenue to which each party is entitled. The cost of content, including any payments to licenses under a revenue share license, is the single largest component of the cost of revenue associated with the O&O Platform business.
The Partner Platform
The screens in our Partner Platform business may deliver content that we curate and deliver or content that is provided by the owners and operators of third-party digital platforms. We make available to our Partner Platforms clients’ channels of original content developed using licensed or purchased content that is then reformatted into short-form content suitable for commercial use.
We provide advertising demand services to third parties by selling ad impressions available on the Partner Platform to advertising demand sources (including DSPs, SSPs and advertisers) who pay us to fill those impressions and have ads delivered across the Partner Platform. If the advertising impressions are filled with advertisements, we will fulfill our obligation and be paid as the publisher of the advertisement. If advertising impressions are not purchased, the content will play without advertisements and no revenue will be earned by us.
32
From a business operations standpoint, for our Partner Platform services, we view as our customers the owners and operators of the third-party digital platforms that utilize our content and advertising services and enable such third parties to better monetize the screens on their digital platforms. We may, in certain instances, also provide content across the Partner Platform.
Our customer services team works with the owners and operators of the third-party digital platforms in our Partner Platform business to ensure our customers are being properly serviced and address any questions about the service, content, advertising performance and other matters.
From an accounting standpoint, for the Partner Platform business, our customers are the advertising demand sources (including DSPs, SSPs and advertisers) because they are providing revenue to us (by way of purchasing advertising inventory) for the streaming of content across the Partner Platform. The Partner Platform business operates a free ad-supported business model and has no subscription fees.
The revenue share arrangements in the O&O Platform business are included in the cost of revenue. The content streamed on the Partner Platforms is content we procure on licenses that do not contain an element of revenue share or content provided by the third-party partner who owns and operates the screens on the Partner Platform. As such, there are no content partner revenue share arrangements on the Partner Platform. There is, however, a revenue share arrangement with the third-party partner who owns and operates the screens on the Partner Platform. We deduct from the revenue we generate in the Partner Platform business certain costs and expenses associated with operating such business (including streaming costs and content hosting) and then allocate the remaining revenue between us and the third-party digital platform provider, based on pre-agreed negotiated percentages. The percentage of revenue we pass along to third-party digital platform providers is recorded as cost of revenue and is our single largest cost of revenue component for the Partner Platform business.
Recent Developments
Operational and Cost-Cutting Review
Our Executive Chairman (as defined below – see “—Leadership Changes and Restructuring”) and members of our senior management team recently conducted an operational and cost-cutting review across the Company which it believes will provide the framework to making us more competitive in the CTV for business/DOOH industry and will accelerate our potential path to break even and operating profitability.
As a result of this review, we have, since March 31, 2024:
| ● | implemented leadership changes. See “ – Leadership Changes and Restructuring” below: |
| ● | laid off or furloughed nine (9) full-time employees, with additional furloughs and terminations being considered in the near term; |
| ● | implemented temporary salary reductions, including an additional 20% salary reduction by the senior executive team, in addition to the 20% temporary salary reduction by the executive team in October 2023 (the leadership changes, laid off and furloughed employees, and latest salary reductions are expected to result in an annual aggregate cash payroll reduction of approximately $2 million); |
| ● | reviewed existing third-party vendor products and services with a view to eliminating approximately $750,000 in ongoing yearly costs and expenses beginning in the first quarter of fiscal year 2025; |
| ● | eliminated our “Loop Rewards” monthly incentive payments to venue operators for maintaining target hours of activation for Loop Players, eliminating one of the most significant expenses contributing to sales, general and administrative expenses. Our Loop Rewards program incurred costs of $3.0 million for our fiscal year 2023 and $0.41 million for our first quarter of fiscal year 2024; |
| ● | initiated discussions with certain of our third-party content providers and other licensors, with a view to restructuring existing or new license agreements, and eliminating certain fixed fee content licenses, to more closely align payments to content licensors with related content revenue; |
33
| ● | continued to develop and promote lower cost channels to reduce or eliminate third party content license fees, where possible; |
| ● | initiated discussions with one of our significant Loop Player affiliate distribution partners with a view to better incentivize them to increase distribution and activation of our Loop Players across their marketing network; |
| ● | planned the introduction of a two-tier music video service offering, which will include a “basic tier” consisting of fewer than ten music video channels provided under a free ad-based service, and a “premium tier” of the full library of curated music video channels provided under a subscription service; |
| ● | explored and continue to explore potential strategic alternatives to maximize shareholder value, as well as evaluated and continue to evaluate potential financing opportunities; and |
| ● | extended the payment terms of one of our debt facilities to ease short-term cash requirements. See “– Future Capital Requirements – Non-Revolving Lines of Credit – RAT Non-Revolving Line of Credit.” |
These cost-cutting measures are expected to result in material reductions in the cost of revenue and selling general and administrative expenses if and when they are implemented. As the above initiatives and changes take effect, we expect to see improved margins for the business. There can be no assurances that we will be able to effect all changes that we have identified or that any such changes will achieve the desired results.
Deficiency Letter
On April 23, 2024, we received a deficiency letter (the “Deficiency Letter”) from the NYSE American indicating that the Company is not in compliance with the NYSE American continued listing standards set forth in Sections 1003(a)(i), (ii) and (iii) of the NYSE American Company Guide. Section 1003(a)(i) of the NYSE American Company Guide requires a listed company’s stockholders’ equity be at least $2.0 million if it has reported losses from continuing operations and/or net losses in two of its three most recent fiscal years. Section 1003(a)(ii) of the NYSE American Company Guide requires a listed company’s stockholders’ equity be at least $4.0 million if it has reported losses from continuing operations and/or net losses in three of its four most recent fiscal years. Section 1003(a)(iii) of the NYSE American Company Guide requires a listed company’s stockholders’ equity be at least $6.0 million if it has reported losses from continuing operations and/or net losses in its five most recent fiscal years. The Deficiency Letter noted that we reported stockholders’ deficit of $(3.7) million as of December 31, 2023, and losses from continuing operations and/or net losses in its five most recent fiscal years ended September 30, 2023. The Deficiency Letter also noted that we are not currently eligible for any exemption set forth in Section 1003(a) of the NYSE American Company Guide.
As a result, we are now subject to the procedures and requirements set forth in Section 1009 of the NYSE American Company Guide. In order to maintain our listing on the NYSE American, we are required to submit a plan of compliance (the “Plan”) by May 23, 2024, addressing how the Company intends to regain compliance with Sections 1003(a)(i), (ii) and (iii) of the NYSE American Company Guide by October 23, 2025.
We intend to submit the Plan by the May 23, 2024 deadline. If the NYSE American accepts the Plan, we will be able to continue our listing during the Plan period and will be subject to continued periodic review by the NYSE American staff. If the Plan is not submitted, or not accepted, or is accepted but we do not make progress consistent with the Plan during the Plan period, we will be subject to delisting procedures as set forth in the NYSE American Company Guide.
Although we are committed to considering all available options to regain compliance with the NYSE American’s stockholders’ equity requirements, there can be no assurance that we will be able to achieve compliance with the NYSE American’s continued listing standards within the required time frame.
Leadership Changes and Restructuring
Effective March 17, 2024, Jon Niermann stepped down as Chief Executive Officer and the Board of Directors unanimously appointed Justis Kao, previously our Chief Content Officer, as Interim Chief Executive Officer. Mr.
34
Niermann remains a member of our Board of Directors and management team, maintaining a strategic focus on revenue and distribution. Effective as of the same day, Mr. Bruce Cassidy, previously the Chairman of our Board of Directors, was appointed Executive Chairman of the Board. In addition, Bob Gruters, who served as our Chief Revenue Officer, resigned after three years to pursue another business opportunity outside of the Company, but remains an advisor to the Company, and Randy Greenberg, who served as our Chief Operating Officer and Chief Marketing Officer, stepped down from those roles and left the Company to pursue other business opportunities.
Key Performance Indicators
We review our quarterly active units (“QAUs”) and average revenue per unit player (“ARPU”), among other key performance indicators, to evaluate our business, measure our performance, identify trends affecting our business, formulate financial projections and make strategic decisions.
Quarterly Active Units
We define an “active unit” as (i) an ad-supported Loop Player or DOOH (defined below) location using our ad- supported service through our “Loop for Business” application or using a DOOH venue-owned computer screening our content that is online, used on our O&O Platform, playing content and has checked into the Loop Media analytics system at least once in the 90-day period ending on the date of measurement, or (ii) a DOOH location customer using our subscription service on our O&O Platform at any time during the 90-day period. We use “QAU” to refer to the number of such active units during such period. We do not count towards our QAUs any Loop Players or screens used on our Partner Platform.
Digital out-of-home (“DOOH”) is a form of media that is delivered digitally outside of the home on billboards, signage, displays, televisions, and other devices in OOH locations, including restaurants, retail shops, healthcare facilities, sports and entertainment venues, and other public or non-residential spaces.
As of March 31, 2024, we had approximately 83,000 active Loop Players and Partner Screens across the Loop Platform, which includes 32,658 QAUs across our O&O Platform, a decrease of 0.2% (or 76 QAUs) from the 32,734 QAUs for the quarter ended March 31, 2023, and a decrease of 3% (or 1,125 QAUs) from the 33,783 QAUs for the quarter ended December 31, 2023, and approximately 50,000 Partner Screens across our Partner Platforms, an increase of 108% (or approximately 26,000 Partner Screens) over approximately 24,000 Partner Screens for the quarter ended March 31, 2023, and an increase of 16% (or 7,000 Partner Screens) over approximately 43,000 Partner Screens for the quarter ended December 31, 2023.
Our QAU footprint for the second quarter of fiscal 2024 was reduced from the prior periods as a result of natural attrition of Loop Players that were not immediately replaced, as we continued to transition to a more targeted distribution model, pivoting our focus to certain designated advertising markets and geographies, as well as more desirable out-of-home locations and venues, including convenience stores, restaurants, bars, and other retail establishments. We believe this targeted distribution plan will, over time, allow us to grow our QAUs quarter on quarter and provide a more robust distribution platform for our advertising partners.
Many of the more desirable advertising markets and geographies generally experience greater competition, resulting in slower distribution growth in those markets, as compared to the less desirable markets. As such, we expect the primary drivers of revenue growth going forward to be a combination of increased QAUs, as well as higher CPMs and advertising impression fill rates associated with more desirable advertising markets and geographies.
Average Revenue Per Unit
We define a “unit player” as (i) an ad-supported Loop Player (or a DOOH location using our ad- supported service through our “Loop for Business” application or using a DOOH location-owned computer screening our content) that is online, used on our O&O Platform, playing content and has checked into the Loop Media analytics system at least once in the 90-day period or (ii) a DOOH location customer using our paid subscription service on our O&O Platform at any time
35
during the 90-day period. A unit player that is supported by our advertising-based revenue model is an ad-supported unit player and a unit player that is supported by a subscription-based revenue model is a subscription unit player. We calculate advertising ARPU (“AD ARPU”) by dividing quarterly revenues from our DOOH ad-supported service on our O&O Platform for the period by QAUs for our ad-supported unit players on our O&O Platform. We calculate subscription ARPU (“SUB ARPU”) by dividing quarterly revenues from our DOOH subscription-supported service on our O&O Platform for the period by QAUs for our subscription-supported unit players on our O&O Platform. We do not include in our unit players count, AD ARPU or SUB ARPU any Loop Players or screens used on our Partner Platform.
Our AD ARPU fluctuates based on a number of factors, including the length of time in a quarter that a unit player is activated and operating, the cost-per-thousand ad impressions (“CPMs”) we are able to achieve for our advertising impressions, and the advertising fill rates that we are able to achieve. Our SUB ARPU fluctuates based on a number of factors, including the timing of the start of a customer subscription for a subscription-supported unit player, the number of ad-supported unit players we have, and the price clients pay for those subscriptions. An increase in the number of unit players over the course of a quarterly period may have the effect of decreasing quarterly ARPU, particularly if such players are added towards the end of the quarterly period. Increases or decreases in ARPU may not correspond with increases or decreases in our revenue, and ARPU may be calculated in a manner different than any similar key performance indicator used by other companies.
For the quarter ended March 31, 2024, AD ARPU was $64, compared to $142 for the quarter ended December 31, 2023, a 55% decrease. AD ARPU was $90 for the quarter ended September 30, 2023, $114 for the quarter ended June 30, 2023, and $99 for the quarter ended March 31, 2023.
For the quarter ended March 31, 2024, SUB ARPU was $554, compared to $426 for the quarter ended December 31, 2023, a 30% increase. SUB ARPU was $353 for the quarter ended September 30, 2023, $222 for the quarter ended June 30, 2023, and $260 for the quarter ended March 31, 2023.
Components of Results of Operations
Revenue
The majority of our revenue is generated from ad sales, which is recognized at the time the digital advertising impressions are filled and the advertisements are played. Revenue generated from content subscription services in customized formats is recognized over the term of the service. The revenue generated from hardware for ongoing subscription content delivery is recognized at the point of the hardware delivery. Revenue generated from content and streaming services, including content encoding and hosting, are recognized over the term of the service based on bandwidth usage.
Cost of Revenue
Cost of revenue for the O&O Platform and legacy businesses represents the amortized cost of ongoing licensing and hosting fees, which is recognized over time based on usage patterns. Licensing fees include fees paid under both our revenue share and fixed-fee arrangements. The depreciation expense associated with the Loop players is not included in cost of sales.
Cost of revenue for the Partner Platforms business represents hosting fees, amortized costs of internally-developed content, and the revenue share with third party partners (after deduction of allocated infrastructure costs). The cost of revenue is higher with partners within the Partner Platform versus those within the O&O Platform because we leverage our Partner Platforms clients’ network of customers and their screens to deliver content and advertising inventory, rather than using our own Loop players.
36
Total Operating Expenses
Operating expenses are attributable to the general overhead related to all the products and services that we provide to our clients and, as a result, they are presented in an aggregate total. Our operating expenses include sales, general and administrative expenses and restructuring costs.
Sales, General and Administrative Expenses
Sales and marketing expenses consist primarily of employee compensation and related costs associated with our sales and marketing staff, including salaries, benefits, bonuses and commissions as well as costs relating to our marketing and business development. We intend to continue to invest resources in our sales and marketing initiatives to drive growth and extend our market position.
General and administrative expenses consist of employee compensation and related costs for executive, finance/accounting, legal, human resources, recruiting, and employee-related information technology and administrative personnel, including salaries, benefits, and bonuses, as well as depreciation, facilities, recruiting and other corporate services.
Restructuring Costs
As previously disclosed, we undertook initiatives in fiscal year 2023 to increase efficiency and cut costs, while still maintaining our focus on, and dedication to, the continued growth of our business. We made cuts and adjustments across several aspects of our business. During fiscal year 2023, we completed a plan to reduce our overall SG&A costs by approximately 20% including labor and various other operating costs. Part of this reduction included eliminating some non-revenue generating headcount, while continuing to invest in expansion of our revenue and ad sales team. In addition, during the second quarter of fiscal year 2024, we have implemented further cost-cutting measures as discussed under “—Recent Developments” above.
Other Income/Expense
Interest Expense
Interest expense consists of interest expense on our outstanding indebtedness and amortization of debt issuance costs.
Other Income (Expense)
Other income consists of employee retention credits, foreign currency translation adjustment, realized foreign current gains/losses and unrealized gains/losses.
Income Taxes
We account for income taxes in accordance with ASC Topic 740, Income Taxes (“ASC 740”). ASC 740 requires a company to use the asset and liability method of accounting for income taxes, whereby deferred tax assets are recognized for deductible temporary differences, and deferred tax liabilities are recognized for taxable temporary differences. Temporary differences are the differences between the reported amounts of assets and liabilities and their tax bases. Deferred tax assets are reduced by a valuation allowance when, in the opinion of management, it is more likely than not that some portion, or all of, the deferred tax assets will not be realized. Deferred tax assets and liabilities are adjusted for the effect of changes in tax laws and rates on the date of enactment.
Under ASC 740, a tax position is recognized as a benefit only if it is “more likely than not” that the tax position would be sustained in a tax examination, with a tax examination being presumed to occur. The amount recognized is the largest amount of tax benefit that is greater than 50% likely of being realized on examination.
37
For tax positions not meeting the “more likely than not” test, no tax benefit is recorded. We have no material uncertain tax positions for any of the reporting periods presented.
We recognize accrued interest and penalties related to unrecognized tax benefits as part of income tax expense. We have also made a policy election to treat the income tax with respect to global intangible low-tax income as a period expense when incurred.
In December 2019, the Financial Accounting Standards Board (“FASB”) issued Accounting Standards Update (“ASU”) No. 2019-12, Simplifying the Accounting for Income Taxes, as part of its initiative to reduce complexity in accounting standards. The amendments in the ASU are effective for fiscal years beginning after December 15, 2020, including interim periods therein. The adoption of this standard in the first quarter of 2022 had no impact on our consolidated financial statements.
In December 2023, the FASB issued ASU 2023-09, Income Taxes (Topic 740): Improvements to Income Tax Disclosures (“ASU 2023-09”). ASU 2023-09 is intended to enhance the transparency and decision usefulness of income tax disclosures. The amendments in ASU 2023-09 address investor requests for enhanced income tax information primarily through changes to the rate reconciliation and income taxes paid information. ASU 2023-09 will be effective for us in the annual period beginning October 1, 2025, though early adoption is permitted. We are still evaluating the presentational effect that ASU 2023-09 will have on our consolidated financial statements, but we expect considerable changes to our income tax footnote.
Consolidated Results of Operations
The following tables set forth our results of operations for the periods presented. The period-to-period comparison of financial results is not necessarily indicative of future results.
For the three months ended March 31, 2024, compared to the three months ended March 31, 2023:
| | | | | | | | | | | | |
| | Three months ended March 31, | | | | | | | ||||
|
| 2024 |
| | 2023 |
| | $ variance |
| % variance |
| |
Revenue |
| $ | 4,002,463 |
| $ | 5,393,231 |
| $ | (1,390,768) |
| (26) | % |
Cost of revenue |
| | 3,584,300 |
| | 3,808,150 |
| | (223,850) |
| (6) | % |
Gross profit | | | 418,163 |
| | 1,585,081 |
| | (1,166,918) |
| (74) | % |
Total operating expenses |
| | 7,261,028 |
| | 10,480,130 |
| | (3,219,102) |
| (31) | % |
Loss from operations |
| | (6,842,865) |
| | (8,895,049) |
| | 2,052,184 |
| (23) | % |
| | | | | | | | | | | | |
Other income (expense): |
| |
|
| |
|
| |
|
|
| |
Interest expense |
| | (729,274) |
| | (919,444) |
| | 190,170 |
| (21) | % |
Other income (expense) | | | 1,506 | | | (2,624) | | | 4,130 | | (157) | % |
Total other income (expense) |
| | (727,768) |
| | (922,068) |
| | 194,300 |
| (21) | % |
| | | | | | | | | | | | |
Provision for income taxes |
| | — |
| | — |
| | — |
| N/A | % |
Net loss | | $ | (7,570,633) |
| $ | (9,817,117) |
| $ | 2,246,484 |
| (23) | % |
Revenue
Our revenue for the three months ended March 31, 2024, was $4,002,463, a decrease of $1,390,768, or 26%, from $5,393,231 for the three months ended March 31, 2023. This decrease was primarily driven by a challenging ad market environment in the second quarter of fiscal year 2024 due to one of the largest ad demand participants changing their terms of business with ad publishers, which resulted in a material negative impact on our ad demand partner revenue.
During the latter part of the second quarter of fiscal year 2024, we worked with our demand partners and successfully integrated those changes and believe we restored demand from this ad demand participant, although their new
38
algorithms do not allow for the same historical frequency of ad calls and ad fills. As a result, we do not expect to experience the same levels of absolute revenue previously recognized by this ad-demand participant unless and until we significantly increase our distribution footprint.
Finally, our decrease in revenue for the three months ended March 31, 2024 from the three months ended March 31, 2023 was also a result of the reduction in ad demand partners in the second quarter of fiscal year 2024 that view our Loop Platform as a CTV platform on which CTV ad budgets can be spent, as compared to the number of ad partners that viewed us as a CTV platform in the second quarter of fiscal year 2023. CTV advertising budgets are generally significantly higher and thus CTV ad demand is generally associated with higher fill rates and CPMs, as compared to DOOH ad budgets and demand.
Cost of Revenue
Our cost of revenue for the three months ended March 31, 2024, was $3,584,300, a decrease of $223,850, or 6%, from $3,808,150 for the three months ended March 31, 2023. This decrease in cost of revenue was primarily due to decreased revenue, which results in lower variable costs, offset by fixed fee and minimum fee licensing costs.
Gross Profit Margin
Our gross profit margin for the three months ended March 31, 2024, was $418,163, a decrease of $1,166,918, or 74%, from $1,585,081 for the three months ended March 31, 2023. Our gross profit margin as a percentage of total revenue for the three months ended March 31, 2024, was approximately 10.4% compared to 29.4% for the three months ended March 31, 2023. The percentage decrease was primarily driven by decreased revenue.
Certain of our content license agreements provide for license fees to be paid at the greater of a percentage of revenue or some other non-revenue metric, based on the breadth of the Loop Platform and the amount of streaming done across that platform. In times of reduced revenue, our ability to match more closely revenue and expenses is reduced, as our license fees may not be paid out as a percentage of revenue, but instead on other less advantageous metrics. In addition, our fixed fee content license agreements reduce our gross profit margins, as the fixed fees paid are a greater percentage of lower revenue than they would be on higher revenue.
The relative contributions to total revenue of our O&O Platform and Partner Platforms businesses will impact our gross profit margin as a percentage of total revenue in future periods. Each of these businesses have different cost of revenue components with a lower gross profit margin in our Partner Platforms business, offset by lower operating and selling costs.
Total Operating Expenses
Our operating expenses for the three months ended March 31, 2024, were $7,261,028, a decrease of $3,219,102, or 31%, from $10,480,130 for the three months ended March 31, 2023. This decrease in operating expenses was primarily due to a decrease in sales, general and administrative expenses as well as stock-based compensation as follows:
Sales, General and Administrative Expenses
Our Sales, General and Administrative Expenses for the three months ended March 31, 2024, were $5,735,694, a decrease of $2,033,619, or 26%, from $7,769,314 for the three months ended March 31, 2023. This decrease in Sales, General and Administrative expenses was primarily due to reductions in marketing costs, professional and administration fees, headcount, sales commissions and stock compensation.
More specifically:
| ● | Our marketing costs for the three months ended March 31, 2024, were $1,747,971, a decrease of $1,031,546, or 37%, from $2,779,517 for the three months ended March 31, 2023, primarily due to a reduction in affiliate fees, brand marketing and digital advertising spend. |
39
| ● | Our payroll costs for the three months ended March 31, 2024, were $2,853,716, a decrease of$939,871, or 25%, from $3,793,587 for the three months ended March 31, 2023, primarily driven by a reduction in headcount, sales commissions and corporate bonuses. |
| ● | Our professional fees for the three months ended March 31, 2024, were $275,692, a decrease of $24,013, or 8%, from $299,705 for the three months ended March 31, 2023, primarily due to a decrease in legal and accounting fees. |
| ● | Our administration fees for the three months ended March 31, 2024, were $271,736, a decrease of $80,996, or 23%, from $352,732 for the three months ended March 31, 2023, primarily due to a decrease in insurance premiums. |
Sales, General and Administrative Expenses as a percentage of total revenue for the three months ended March 31, 2024, was 143.3% compared to 144.1% for the three months ended March 31, 2023.
Stock-Based Compensation
Our stock compensation (non-cash) for the three months ended March 31, 2024, was $1,112,137, a decrease of $1,363,670, or 55%, from $2,475,807 for the three months ended March 31, 2023, primarily due to decrease of stock compensation expense driven by the decrease in our stock price.
Restructuring Costs
We had no restructuring costs for the three months ended March 31, 2024, or for the three months ended March 31, 2023.
Total Other Expense
Our total other expenses for the three months ended March 31, 2024, were $727,768, a decrease of $194,300, or 21%, from $922,068 total other expenses for the three months ended March 31, 2023. This decrease in other expenses was primarily driven by the paydown of debt and the conversion of debt to equity.
40
For the six months ended March 31, 2024, compared to the six months ended March 31, 2023:
| | | | | | | | | | | | |
|
| Six months ended March 31, | | | | | | | ||||
| | 2024 |
| 2023 |
| $ variance |
| % variance |
| |||
Revenue | | $ | 14,173,719 |
| $ | 20,219,062 |
| $ | (6,045,343) |
| (30) | % |
Cost of revenue | | | 10,131,017 |
| | 12,947,950 |
| | (2,816,933) |
| (22) | % |
Gross profit | | | 4,042,702 |
| | 7,271,112 |
| | (3,228,410) |
| (44) | % |
Total operating expenses | | | 15,142,105 |
| | 20,416,787 |
| | (5,274,682) |
| (26) | % |
Loss from operations | | | (11,099,403) |
| | (13,145,675) |
| | 2,046,272 |
| (16) | % |
| | | | | | | | | | | | |
Interest expense | | | (1,731,464) |
| | (1,927,027) |
| | 195,563 |
| (10) | % |
Other income | | | (25,168) |
| | (2,624) |
| | (22,544) |
| 859 | % |
Total other income (expense) | | | (1,756,632) |
| | (1,929,651) |
| | 173,019 |
| (9) | % |
| | | | | | | | | | | | |
Provision for income taxes | | | — |
| | (1,230) |
| | 1,230 |
| (100) | % |
Net loss | | $ | (12,856,035) |
| $ | (15,076,556) |
| $ | 2,220,521 |
| (15) | % |
Revenue
Our revenue for the six months ended March 31, 2024, was $14,173,719, a decrease of $6,045,343, or 30%, from $20,219,062 for the six months ended March 31, 2023. This decrease was primarily driven by a lack of political ad placements in the three months ended December 31, 2023, as compared to the three months ended December 31, 2022, which period experienced significant political ad spend in connection with the U.S. congressional and local elections, as well as a slowdown in digital advertising spend, as compared to the same period in the previous fiscal year, due to the more challenging macroeconomic environment in the three months ended December 31, 2023.
We also saw a slowdown in ad spending in the last couple of weeks of our first quarter of fiscal year 2024 due to one of the largest ad demand participants changing their terms of business with ad publishers. This change had a material adverseimpact on our ad demand partner revenue for the last weeks of December 2023.
During the latter half of the second quarter of fiscal year 2024 we worked with our demand partners and successfully integrated those changes and believe we restored demand from this ad demand participant, although their new algorithms do not allow for the same historical frequency of ad calls and ad fills. As a result, we will need to increase our distribution footprint to experience the levels of absolute revenue previously recognized by this ad demand participant.
Cost of Revenue
Our cost of revenue for the six months ended March 31, 2024, was $10,131,017, a decrease of $2,816,933, or 22%, from $12,947,950 for the six months ended March 31, 2023. This decrease in cost of revenue was primarily due to decreased revenue, which results in lower variable costs, offset by fixed fee and minimum fee licensing costs.
Gross Profit Margin
Our gross profit margin for the six months ended March 31, 2024, was $4,042,702, a decrease of $3,228,410, or 44%, from $7,271,112 for the six months ended March 31, 2023. Our gross profit margin as a percentage of total revenue for the six months ended March 31, 2024, was approximately 28.5% compared to 36.0% for the six months ended March 31, 2023. The percentage decrease was primarily driven by decreased revenue and revenue mix, as the year-ago period included a smaller portion of our Partner Platform business which carries lower gross margin, offset by lower operating costs resulting in higher operating margin.
Certain of our content license agreements provide for license fees to be paid at the greater of a percentage of revenue or some other non-revenue metric, based on the breadth of the Loop Platform and the amount of streaming done across that platform. In times of reduced revenue, our ability to match more closely revenue and expenses is reduced, as
41
our license fees may not be paid out as a percentage of revenue, but on other less advantageous metrics. In addition, our fixed fee content license agreements reduce our gross profit margins, as the fixed fees paid are a greater percentage of lower revenue than they would be on higher revenues.
The relative contributions to total revenue of our O&O Platform and Partner Platforms businesses will impact our gross profit margin as a percentage of total revenue in future periods. Each of these businesses have different cost of revenue components with a lower gross profit margin in our Partner Platforms business.
Total Operating Expenses
Our operating expenses for the six months ended March 31, 2024, were $15,142,105, a decrease of $5,274,682, or 26%, from $20,416,787 for the six months ended March 31, 2023. This decrease in operating expenses was primarily due to a decrease in sales, general and administrative expenses as well as a reduction in stock-based compensation, as follows:
Sales, General and Administrative Expenses
Our Sales, General and Administrative Expenses for the six months ended March 31, 2024, were $11,906,671, a decrease of $3,820,777, or 24%, from $15,727,448 for the six months ended March 31, 2023. This decrease in Sales, General and Administrative expenses was primarily due to a reduction in payroll costs, marketing costs and professional and administration fees resulting in lower expenditures and decreased payroll expenses.
More specifically:
| ● | Our payroll costs for the six months ended March 31, 2024, were $4,972,894, a decrease of$2,308,442, or 32%, from $7,281,336 for the six months ended March 31, 2023, primarily driven by a reduction in headcount, sales commissions and corporate bonuses. |
| ● | Our marketing costs for the six months ended March 31, 2024, were $3,926,219, a decrease of $1,978,325, or 34%, from $5,904,544 for the six months ended March 31, 2023, primarily due to a reduction in affiliate fees, brand marketing and digital advertising spend resulting in lower marketing expenditures. |
| ● | Our professional fees for the six months ended March 31, 2024, were $793,878, a slight increase of $29,035, or 4%, from $764,843 for the six months ended March 31, 2023, primarily due to an increase in accounting and legal and accounting fees. |
| ● | Our administration fees for the six months ended March 31, 2024, were $502,340, a decrease of $247,602, or 33%, from $749,942 for the six months ended March 31, 2023, primarily due to a decrease in insurance premiums and board fees. |
Sales, General and Administrative Expenses as a percentage of total revenue for the six months ended March 31, 2024, was 84% compared to 77.8% for the six months ended March 31, 2023.
Stock-Based Compensation
Our stock compensation (non-cash) for the six months ended March 31, 2024, was $2,440,362, a decrease of $1,826,252, or 43%, from $4,266,614 for the six months ended March 31, 2023, primarily due to decrease of stock compensation expense driven by the decrease in our stock price.
Restructuring Costs
We had no restructuring costs for the six months ended March 31, 2024, or for the six months ended March 31, 2023.
42
Total Other Expense
Our total other expenses for the six months ended March 31, 2024, were $1,756,632, a decrease of $173,019, or 9%, from $1,929,651 total other expenses for the six months ended March 31, 2023. This increase in other expenses was primarily due to by the paydown of debt and the conversion of debt to equity.
Non-GAAP EBITDA
We believe that the presentation of EBITDA (as defined below), a financial measure that is not part of U.S. Generally Accepted Accounting Principles, or U.S. GAAP, provides investors with additional information about our financial results. EBITDA is an important supplemental measure used by our Board of Directors and management to evaluate our operating performance from period-to-period on a consistent basis and as a measure for planning and forecasting overall expectations and for evaluating actual results against such expectations. We define EBITDA as earnings before interest expense (income), income tax (expense)/benefit, depreciation and amortization.
EBITDA is not measured in accordance with, or an alternative to, measures prepared in accordance with U.S. GAAP. In addition, this non-GAAP measure is not based on any comprehensive set of accounting rules or principles. As a non-GAAP measure, EBITDA has limitations in that it does not reflect all of the amounts associated with our results of operations as determined in accordance with U.S. GAAP. In particular:
| ● | EBITDA does not reflect the amounts we paid in interest expense on our outstanding debt; |
| ● | EBITDA does not reflect the amounts we received in interest income on our investments; |
| ● | EBITDA does not reflect the amounts we paid in taxes or other components of our tax provision; |
| ● | EBITDA does not include depreciation expense from fixed assets; and |
| ● | EBITDA does not include amortization expense. |
Because of these limitations, you should consider EBITDA alongside other financial performance measures including net income (loss) and our financial results presented in accordance with U.S. GAAP.
The following table provides a reconciliation of net loss to EBITDA for each of the periods indicated:
| | | | | | | | | | | | |
| | Three months ended March 31, |
| Six months ended March 31, | ||||||||
| | 2024 |
| 2023 | | 2024 |
| 2023 | ||||
GAAP net loss | | $ | (7,570,633) | | $ | (9,817,117) | | $ | (12,856,035) | | $ | (15,076,556) |
Adjustments to reconcile to EBITDA: | |
|
| |
|
| |
|
| |
|
|
Interest expense | |
| 729,274 | |
| 919,444 | |
| 1,731,464 | |
| 1,927,027 |
Depreciation and amortization expense* | |
| 1,164,473 | |
| 865,552 | |
| 2,353,356 | |
| 1,735,435 |
Income Tax expense/(benefit) | |
| — | |
| — | |
| — | |
| 1,230 |
EBITDA | | $ | (5,676,886) | | $ | (8,032,121) | | $ | (8,771,215) | | $ | (11,412,864) |
*Includes amortization of content assets for cost of revenue and operating expenses and ATM facility.
Non-GAAP Adjusted EBITDA
We believe that the presentation of Adjusted EBITDA, a financial measure that is not part of U.S. GAAP, provides investors with additional information about our financial results. Adjusted EBITDA is an important supplemental measure used by our Board of Directors and management to evaluate our operating performance from period-to-period on a
43
consistent basis and as a measure for planning and forecasting overall expectations and for evaluating actual results against such expectations.
We define Adjusted EBITDA as earnings before interest expense (income), income tax (expense)/benefit, depreciation and amortization, adjusted for stock-based compensation and non-recurring income and expenses, if any.
Adjusted EBITDA is not measured in accordance with, or an alternative to, measures prepared in accordance with U.S. GAAP. In addition, this non-GAAP measure is not based on any comprehensive set of accounting rules or principles. As a non-GAAP measure, Adjusted EBITDA has limitations in that it does not reflect all of the amounts associated with our results of operations as determined in accordance with U.S. GAAP. In particular:
| ● | Adjusted EBITDA does not reflect the amounts we paid in interest expense on our outstanding debt; |
| ● | Adjusted EBITDA does not reflect the amounts we paid in taxes or other components of our tax provision; |
| ● | Adjusted EBITDA does not include depreciation expense from fixed assets; |
| ● | Adjusted EBITDA does not include amortization expense; |
| ● | Adjusted EBITDA does not include the impact of stock-based compensation; |
| ● | Adjusted EBITDA does not include the impact of non-recurring expense; |
| ● | Adjusted EBITDA does not include the impact of the loss on the extinguishment of debt; and |
| ● | Adjusted EBITDA does not include the impact of other income including foreign currency translation adjustments, realized foreign currency gains/losses and unrealized gains/losses. |
Because of these limitations, you should consider Adjusted EBITDA alongside other financial performance measures including net income (loss) and our financial results presented in accordance with U.S. GAAP.
The following table provides a reconciliation of net loss to Adjusted EBITDA for each of the periods indicated:
| | | | | | | | | | | | |
| | Three months ended March 31, |
| Six months ended March 31, | ||||||||
| | 2024 |
| 2023 | | 2024 |
| 2023 | ||||
GAAP net loss | | $ | (7,570,633) | | $ | (9,817,117) | | $ | (12,856,035) | | $ | (15,076,556) |
Adjustments to reconcile to Adjusted EBITDA: | |
|
| |
|
| |
|
| |
|
|
Interest expense | |
| 729,274 | |
| 919,444 | |
| 1,731,464 | |
| 1,927,027 |
Depreciation and amortization expense * | |
| 1,164,473 | |
| 865,552 | |
| 2,353,356 | |
| 1,735,435 |
Income tax expense (benefit) | |
| — | |
| — | |
| — | |
| 1,230 |
Stock-based compensation** | |
| 1,112,137 | |
| 2,475,807 | |
| 2,440,362 | |
| 4,266,614 |
Non-recurring expense | | | 21,171 | | | — | | | 278,413 | | | — |
Other income | | | (1,506) | | | 2,624 | | | 25,168 | | | 2,624 |
Adjusted EBITDA | | $ | (4,545,084) | | $ | (5,553,690) | | $ | (6,027,272) | | $ | (7,143,626) |
* Includes amortization of content assets for cost of revenue and operating expenses and ATM facility.
** Includes options, restricted stock units (“RSUs”) and warrants.
44
Liquidity and Capital Resources
As of March 31, 2024, we had cash of $2,197,359.
The following table provides a summary of our net cash flows from operating, investing, and financing activities.
| | | | | | |
| | Six months ended March 31, | ||||
|
| 2024 |
| 2023 | ||
Net cash used in operating activities | | $ | (2,287,455) | | $ | (8,715,387) |
Net cash used in investing activities | |
| (473,562) | |
| (1,046,876) |
Net cash provided by (used in) financing activities | |
| 1,889,680 | |
| 341,112 |
Change in cash | |
| (871,337) | |
| (9,421,151) |
| | | | | | |
Cash, beginning of period | |
| 3,068,696 | |
| 14,071,914 |
Cash, end of period | | $ | 2,197,359 | | $ | 4,650,763 |
Historically, our principal sources of cash have included revenues from our operations, proceeds from the issuance of shares and dilutive common share equivalents outstanding. During periods whenof our common stock equivalents,(“Common Stock”), preferred stock and warrants as well as proceeds from the issuance of debt.
Although historically we have reported significant recurring losses as well as negative cash flows used in operations, we intend to meet future cash requirements and maintain operations by continuing to reduce overall operating expenses, continuing to focus on increasing the scope and size of the Partner Platforms and explore alternative revenue generating sources to generate cash through operations while continuing to fund through financing activities, including sales of Common Stock under our ATM Sales Agreement, and through the use of equity and debt instruments available to us.
For the next twelve months, we anticipate that we will need to supplement our cash from revenues with additional cash raised from equity investment or debt transactions, while maintaining reduced spending levels, to ensure that we will have adequate cash to support our minimum operating cash requirements and thus to continue as a going concern.
There can be no guarantee or assurance that we can raise adequate capital from outside sources. If we are unable to raise funds when required or on acceptable terms, we may have to significantly reduce, or discontinue our operations.
Cash Flows for the Six Months Ended March 31, 2024, and 2023
Net Cash Flow Used in Operating Activities
Our net cash used in operating activities during the six months ended March 31, 2024, was $2,287,455, a decrease of $6,427,932, or 74%, from $8,715,387 for the six months ended March 31, 2023, primarily driven by decreased SG&A expenditures and stock-based compensation expense partially offset by increased bad debt expense.
Net Cash Flow Used in Investing Activities
Our net cash used in investing activities during the six months ended March 31, 2024, was $473,562, a decrease of $573,314, or 55%, from $1,046,876 for the six months ended March 31, 2023, primarily driven by a decrease in the purchase of property and equipment.
Net Cash Flow Provided by Financing Activities
Our net cash provided by financing activities during the six months ended March 31, 2024, was $1,889,680, an increase of $1,548,568, or 454%, from $341,112 for the six months ended March 31, 2023, primarily due to proceeds from the exercise of warrants as well as proceeds from a revolving line of credit partially offset by repayments on lines of credit and increased deferred costs partially offset by increased debt issuance costs.
45
As a result of the above activities, for the six months ended March 31, 2024, we recorded a cash balance of $2,197,359, a decrease of $2,453,404, or 53%, from $4,650,763 for the six months ended March 31, 2023.
Future Capital Requirements
We have generated limited revenue, and as of March 31, 2024, our cash totaled $2,197,359, and we had an accumulated deficit of $141,141,578. We anticipate further losses as well as negative cash flows used in operations in the foreseeable future. These factors raise substantial doubt about our ability to continue as a going concern for a period of at least one year from the date of issuance of the accompanying consolidated financial statements.
Historically, our principal sources of cash have included proceeds from the issuance of Common Stock, preferred stock and warrants and proceeds from the issuance of debt. Our principal uses of cash have included cash used in operations, payments for license rights and payments relating to purchases of property and equipment. We expect that the principal uses of cash in the future will be for continuing operations, and general working capital requirements. We expect that as our operations continue to grow, we will need to raise additional capital to sustain operations and growth.
Our primary source of operating funds since inception has been cash proceeds from the sale of our Common Stock and debt and equity financing transactions. Our ability to continue as a going concern is dependent upon our ability to generate sufficient revenue and our ability to raise additional funds by way of our debt and equity financing efforts.
Revolving Lines of Credit
Excel Revolving Line of Credit
Effective as of December 14, 2023, we entered into a Revolving Line of Credit Loan Agreement with Excel Family Partners, LLLP (“Excel” and the “Excel Revolving Line of Credit Agreement”) for up to a principal sum of $2,500,000, under which we may pay down and re-borrow up to the maximum amount of the $2,500,000 limit (the “Excel Revolving Line of Credit”). Our drawdown on the Excel Revolving Line of Credit is limited to no more than twenty-five percent (25%) of the last three full months’ revenue, not to exceed $1,250,000 in any quarter, and not to exceed in aggregate the outstanding debt amount of $2,500,000.The Excel Revolving Line of Credit is a perpetual loan, with a maturity date that is twelve (12) months from the date of formal notice of termination by Excel, and accrues interest, payable semi-annually in arrears, at a fixed rate of interest equal to ten percent (10%) per year. Under the Excel Revolving Line of Credit Agreement, we granted to Excel a security interest in all of our present and future assets and properties, real or personal, tangible or intangible, wherever located, including products and proceeds thereof, which security interest is pari passu with the RAT Non-Revolving Line of Credit Agreement and the May 2023 Secured Line of Credit (each as defined below), but is subordinate in rights to GemCap under the GemCap Revolving Line of Credit Agreement (each as defined below).
Under the terms of the Excel Revolving Line of Credit Agreement, on December 14, 2023, we issued to Excel a warrant to purchase up to an aggregate of 3,125,000 shares of our Common Stock. The warrant has an exercise price of $0.80 per share, which was the closing price of our Common Stock on December 13, 2023, expires on December 14, 2026, and is exercisable at any time prior to such date, to the extent that after giving effect to such exercise, Excel and its affiliates would beneficially own, for purposes of Section 13(d) of the Securities Exchange Act of 1934, as amended (the “Exchange Act”), no more than 29.99% of the outstanding shares of our Common Stock.
The Excel Revolving Line of Credit had a balance, including accrued interest, amounting to $2,519,396 and $0 as of March 31, 2024, and September 30, 2023, respectively. We incurred interest expense for the Excel Revolving Line of Credit in the amount of $118,284 and $0 for the six months ended March 31, 2024, and 2023, respectively.
GemCap Revolving Line of Credit
Effective as of July 29, 2022, we entered into a Loan and Security Agreement with Industrial Funding Group, Inc. (the “Initial Lender”) for a revolving loan credit facility for the initial principal sum of up to $4,000,000, and through the exercise of an accordion feature, a total sum of up to $10,000,000 (the “GemCap Revolving Line of Credit Agreement”), evidenced by a Revolving Loan Secured Promissory Note, also effective as of July 29, 2022 (the “GemCap
46
Revolving Line of Credit”). Shortly after the effective date of the GemCap Revolving Line of Credit Agreement, the Initial Lender assigned the GemCap Revolving Line of Credit Agreement, and the loan documents related thereto, to GemCap Solutions, LLC (“GemCap” or the “Senior Lender”). Availability for borrowing under the GemCap Revolving Line of Credit is dependent upon our assets in certain eligible accounts and measures of revenue, subject to reduction for reserves that the Senior Lender may require in its discretion, and the accordion feature is a provision whereby we may request that the Senior Lender increase availability under the GemCap Revolving Line of Credit, subject to its sole discretion. Effective as of October 27, 2022, we entered into Amendment Number 1 to the Loan and Security Agreement and to the Revolving Loan Agreement Schedule, and the Amended and Restated Secured Promissory Note (Revolving Loans) with the Senior Lender to increase the principal sum available under the GemCap Revolving Line of Credit Agreement from $4,000,000 to $6,000,000. The GemCap Revolving Line of Credit matures on July 29, 2024, and began accruing interest on the unpaid principal balance of advances, payable monthly in arrears, on September 7, 2022, at an annual rate equal to the greater of (I) the sum of (i) the “Prime Rate” as reported in the “Money Rates” column of The Wall Street Journal, adjusted as and when such Prime Rate changes, plus (ii) zero percent (0.00%), and (II) four percent (4.00%).
Under the GemCap Revolving Line of Credit Agreement, we have granted to the Senior Lender a first-priority security interest in all of our present and future property and assets, including products and proceeds thereof. In connection with the loan, our existing secured lenders, some of whom are the RAT Lenders under our RAT Non-Revolving Line of Credit (each as defined below) (collectively, the “Subordinated Lenders”) delivered subordination agreements (the “GemCap Subordination Agreements”) to the Senior Lender. We are permitted to make regularly scheduled payments, including payments upon maturity, to such subordinated lenders and potentially other payments subject to a measure of cash flow and receiving certain financing activity proceeds, in accordance with the terms of the GemCap Subordination Agreements. In connection with the delivery of the GemCap Subordination Agreements by the Subordinated Lenders, on July 29, 2022, we issued warrants to each Subordinated Lender on identical terms for an aggregate of up to 296,329 shares of our Common Stock (each, a “Subordination Agreement Warrant”). Each Subordination Agreement Warrant has an exercise price of $5.25 per share, expires on July 29, 2025, and is exercisable at any time prior to such date. One warrant for 191,570 warrant shares was issued to Eagle Investment Group, LLC, an entity managed by Bruce Cassidy, Chairman of our Board of Directors (“Mr. Cassidy”), as directed by its affiliate, Excel Family Partners, LLLP (“Excel”), an entity also managed by Mr. Cassidy, one of the Subordinated Lenders. The Subordinated Lenders receiving warrants for the remaining 104,759 warrant shares were also entitled to receive a cash payment of $22,000 six months from the date of the GemCap Subordination Agreements, representing one percent (1.00%) of the outstanding principal amount of the loan held by such Subordinated Lenders. This cash payment was made to those Subordinated Lenders on January 25, 2023.
The GemCap Revolving Line of Credit had a balance, including accrued interest, amounting to $2,147,821 and $3,757,074 as of March 31, 2024, and September 30, 2023, respectively. We incurred interest expense for the GemCap Revolving Line of Credit in the amount of $707,962 and $714,740 for the six months ended March 31, 2024, and 2023, respectively.
47
Non-Revolving Lines of Credit
RAT Non-Revolving Line of Credit
Effective as of May 13, 2022, we entered into a Secured Non-Revolving Line of Credit Loan Agreement (the “RAT Non-Revolving Line of Credit Agreement”) with several institutions and individuals (each a “RAT Lender” and collectively, the “RAT Lenders”) and RAT Investment Holdings, LP, as administrator of the loan (the “Loan Administrator”) for an aggregate principal amount of $2,200,000 (the “RAT Non-Revolving Line of Credit”), evidenced by a Non-Revolving Line of Credit Promissory Note (the “RAT Note”), also effective as of May 13, 2022. Pursuant to the terms of the RAT Non-Revolving Line of Credit Agreement, the RAT Non-Revolving Line of Credit matured eighteen (18) months from the effective date of the RAT Non-Revolving Line of Credit Agreement (the “Original RAT Line of Credit Maturity Date”) and accrues interest, payable semi-annually in arrears, at a fixed rate of interest equal to twelve percent (12%) per year. Under the RAT Non-Revolving Line of Credit Agreement, we granted to the RAT Lenders a security interest in all of our present and future assets and properties, real or personal, tangible or intangible, wherever located, including products and proceeds thereof, which security interest is pari passu with the Excel Revolving Line of Credit Agreement (as defined above) and the May 2023 Secured Line of Credit Agreement (as defined below) and (each of which are subordinated in connection with our GemCap Revolving Line of Credit Agreement (as defined above)).
In connection with the RAT Non-Revolving Line of Credit Agreement, on May 13, 2022, we issued a warrant to each RAT Lender (collectively, the “RAT Loan Warrants”) for an aggregate of up to 209,522 shares of our Common Stock. Each RAT Loan Warrant had an exercise price of $5.25 per share, expires on May 13, 2025, and is exercisable at any time prior to the expiration date.
Effective as of November 13, 2023, we entered into a Non-Revolving Line of Credit Loan Agreement Amendment (the “RAT Non-Revolving Line of Credit Agreement Amendment #1”) with the RAT Lenders to: (i) extend the Original RAT Line of Credit Maturity Date from eighteen (18) months to twenty-seven (27) months from the date of the RAT Non-Revolving Line of Credit Agreement, or August 13, 2024 (the “First Extended RAT Line of Credit Maturity Date”); and (ii) amend the payment terms of the RAT Non-Revolving Line of Credit such that payments of interest or principal under the RAT Non-Revolving Line of Credit Agreement and the RAT Note will be due and payable from November 13, 2023, to the First Extended RAT Line of Credit Maturity Date as follows: (a) one payment of $374,000 (comprised of accrued interest of $132,000 due through November 13, 2023, an initial payment of principal of $220,000 and $22,000 as consideration to extend the Original RAT Line of Credit Maturity Date) due on November 13, 2023; and (b) nine (9) monthly payments of principal of $220,000 plus accrued interest, commencing December 13, 2023. In consideration for the extension of the Original RAT Line of Credit Maturity Date, we agreed to amend the terms of the RAT Loan Warrants as well as the Subordination Agreement Warrants issued to the RAT Lenders in connection with the GemCap Subordination Agreements described above to reduce the respective exercise prices thereof to $1.00. See “—GemCap Revolving Line of Credit.” We also agreed to apply one-third (1/3) of the net proceeds of any capital raise that takes place subsequent to the date of the RAT Non-Revolving Line of Credit Agreement Amendment #1, other than proceeds from an equity offering under our ATM Sales Agreement (as defined below) or from an affiliate or insider, toward paying down the then outstanding principal amount due under the RAT Non-Revolving Line of Credit. Pursuant to the RAT Non-Revolving Line of CreditAgreement Amendment #1, each RAT Lender agreed to enter into a lock-up agreement restricting the disposal of any shares of our Common Stock that are issued in connection with the exercise of the RAT Loan Warrants or the Subordination Agreement Warrants for a period of twelve (12) months from the date of the RAT Non-Revolving Line of Credit Agreement Amendment #1. Effective as of November 13, 2023, we issued an Amended and Restated Non-Revolving Line of Credit Promissory Note Amendment to the Lenders reflecting the extension of the Original RAT Line of Credit Maturity Date.
On April 18, 2024, we entered into a Non-Revolving Line of Credit Loan Agreement Amendment #2 (the “RAT Non-Revolving Line of Credit Agreement Amendment #2”) with the RAT Lenders to: (i) extend the Original RAT Line of Credit Maturity Date from eighteen (18) months to thirty-two (32) months from the date of the RAT Non-Revolving Line of Credit Agreement, or January 13, 2025 (the “Second Extended RAT Line of Credit Maturity Date”); and (ii) amend the payment terms of the RAT Non-Revolving Line of Credit such that payments of interest and principal under the RAT Non-Revolving Line of Credit Agreement and the RAT Note will be due and payable from April 13, 2024, to the Second Extended RAT Line of Credit Maturity Date, as follows: (a) one payment of $121,000, comprised of accrued interest of
48
$11,000 through April 13, 2024, and an initial payment of principal of $110,000, due on April 13, 2024; and (b) nine (9) monthly payments of principal of $110,000, plus accrued interest, commencing May 13, 2024. We issued a Second Amended and Restated Non-Revolving Line of Credit Promissory Note Amendment, effective April 13, 2024, to the RAT Lenders reflecting the extension of the Original RAT Line of Credit Maturity Date.
The RAT Non-Revolving Line of Credit had a balance, including accrued interest, amounting to $1,106,473 and $2,300,899 as of March 31, 2024, and September 30, 2023, respectively. We incurred interest expense for the RAT Non-Revolving Line of Credit in the amount of $310,009 and $446,764 for the six months ended March 31, 2024, and 2023, respectively.
May 2023 Secured Loan
Effective as of May 10, 2023, we entered into a Secured Non-Revolving Line of Credit Loan Agreement (the “May 2023 Secured Line of Credit Agreement”) with several individuals and institutional lenders for aggregate loans of up to $4.0 million (the “May 2023 Secured Line of Credit”), evidenced by the Secured Non-Revolving Line of Credit Promissory Notes (each a “May 2023 Secured Note” and collectively, the “May 2023 Secured Notes”), also effective as of May 10, 2023. The May 2023 Secured Line of Credit matures twenty-four (24) months from the date of the May 2023 Secured Line of Credit and accrues interest, payable semi-annually in arrears, at a fixed rate of interest equal to twelve percent (12%) per year. We granted to the lenders under the May 2023 Secured Line of Credit Agreement a security interest in all of our present and future assets and properties, real or personal, tangible or intangible, wherever located, including products and proceeds thereof, which security interest is pari passu with the RAT Non-Revolving Line of Credit Agreement and the Excel Revolving Line of Credit Agreement, but is subordinate in rights to GemCap under the GemCap Revolving Line of Credit Agreement. See “— GemCap Revolving Line of Credit Agreement.”
In connection with the May 2023 Secured Line of Credit, on May 10, 2023, we agreed to issue to each lender under the May 2023 Secured Line of Credit Agreement, upon a drawdown, a warrant to purchase up to an aggregate of 369,517 shares of our Common Stock. Each warrant has an exercise price of $4.33 per share, expires on May 10, 2026, and is exercisable at any time prior to such date.
As of May 10, 2023, Excel, an entity managed by Mr. Cassidy, had committed to be a lender under the May 2023 Secured Line of Credit Agreement for an aggregate loan of $2.65 million, and as of September 11, 2023, Excel had not loaned any funds under the May 2023 Secured Line of Credit. On May 31, 2023, we entered into a Secured Non-Revolving Line of Credit Loan Agreement (the “Excel $2.2M Secured Line of Credit Agreement”) with Excel for an aggregate principal amount of up to $2,200,000 (the “Excel $2.2M Line of Credit”), evidenced by a Non-Revolving Line of Credit Promissory Note (the “Excel $2.2M Note”). Pursuant to the terms of a Pay Off Letter Agreement with Excel dated September 12, 2023, we refinanced the outstanding principal and interest of the Excel $2.2M Line of Credit to be included as part of the obligations of the May 2023 Secured Line of Credit Agreement. As a result of such refinancing, as of September 12, 2023, no principal or interest remained outstanding under the Excel $2.2M Secured Line of Credit, and the Excel $2.2M Secured Line of Credit Agreement was terminated, and as of September 12, 2023, Excel had loaned $2,266,733 under the May 2023 Secured Line of Credit Agreement and received a warrant to purchase 209,398 shares of our Common Stock.
As of December 14, 2023, the outstanding principal and interest on Excel’s portion of the May 2023 Secured Line of Credit was $2,328,617 (the “Excel May 2023 Secured Line of Credit Pay Off-Amount”), of the total aggregate principal and interest outstanding under the May 2023 Secured Line of Credit of $3,262,817. On December 14, 2023, Excel agreed to convert the Excel May 2023 Secured Line of Credit Pay-Off Amount owed under the May 2023 Secured Line of Credit Agreement into 2,910,771 shares of our Common Stock at a conversion price per share of $0.80. In addition, in connection with the Warrant Repricing (as defined below), on December 14, 2023, Excel agreed to reprice the per share warrant exercise price of the warrant for 209,398 shares of our Common Stock to $0.80 per warrant share and immediately exercised the warrant, delivering the net proceeds of $167,518.40 to us. See “—Repricing and Exercise of Certain Warrants.”
On December 31, 2023, one of the remaining lenders under the May 2023 Secured Line of Credit converted $101,699.83 in outstanding principal and interest into 127,124 shares of our Common Stock at a conversion price per share
49
of $0.80. As of March 31, 2024, a total principal amount of $800,000 remained outstanding on the May 2023 Secured Line of Credit and warrants for a total of 83,142 warrant shares had been issued to the remaining lenders in connection with the May 2023 Secured Line of Credit and remained outstanding.
The May 2023 Secured Loan had a principal balance, including accrued interest, amounting to $861,333 and $3,214,769 as of March 31, 2024, and September 30, 2023, respectively. We incurred interest expense for the May 2023 Secured Loan in the amount of $576,229 and $0 for the six months ended March 31, 2024, and 2023, respectively.
Excel $1.0M Line of Credit
On March 28, 2024, we entered into a Secured Non-Revolving Line of Credit Loan Agreement with Excel, an entity managed by Bruce Cassidy, Chairman of our Board of Directors (the “Excel $1.0M Secured Line of Credit Agreement”), for an aggregate principal amount of up to $1,000,000 (the “Excel $1.0M Line of Credit”), evidenced by a Secured Non-Revolving Line of Credit Promissory Note (the “Excel $1.0M Note”). The Excel $1.0M Line of Credit matures one hundred eighty (180) days from the date of the Excel $1.0M Secured Line of Credit Agreement (the “Excel $1.0M Line of Credit Maturity Date”) and accrues interest, payable in arrears on the Excel $1.0M Line of Credit Maturity Date, at a fixed rate of interest equal to twelve percent (12%) per year.
Under the Excel $1.0M Secured Line of Credit Agreement, we granted to Excel a security interest in all of our present and future assets and properties, real or personal, tangible or intangible, wherever located, including products and proceeds thereof, which security interest is subordinate in rights to GemCap under the GemCap Revolving Line of Credit Agreement.
The Excel $1.0M Line of Credit had a balance, including accrued interest, amounting to $1,001,000 and $0 as of March 31, 2024, and September 30, 2023, respectively. We incurred interest expense for the Excel $1.0M Line of Credit in the amount of $1,000 and $0 for the six months ended March 31, 2024, and 2023, respectively.
Repricing and Exercise of Certain Existing Warrants
On December 14, 2023, we agreed to offer to amend certain existing warrants exercisable for an aggregate of up to 4,055,240 shares of our Common Stock (each such warrant an “Existing Warrant”) to reduce the respective exercise prices thereof to $0.80 per share (such new price being referred to as the “Amended Warrant Exercise Price”), which was the closing price per share of our common stock as quoted on the NYSE American on December 13, 2023, on the condition that the holder of each Existing Warrant would commit to exercise the Existing Warrant within a certain period of time, paying the aggregate Amended Warrant Exercise Price of each respective Existing Warrant in cash to us (the “Warrant Repricing”). As of December 14, 2023, Existing Warrants exercisable for an aggregate of up to 786,482 shares of our common stock were held by Excel and Eagle Investment Group, LLC, entities managed by Bruce Cassidy, Sr., Executive Chairman of our Board of Directors, and Existing Warrants exercisable for an aggregate of up to 443,332 shares of our Common Stock were held by Denise Penz, a member of our Board of Directors. In connection with the Warrant Repricing, each of Mr. Cassidy and Ms. Penz exercised their Existing Warrants, resulting in net proceeds to us of $983,851.
As of March 31, 2024, holders of Existing Warrants (including those held by Mr. Cassidy and Ms. Penz) had exercised an aggregate of 1,850,874 shares for an aggregate exercise price of $1,480,699. No other Existing Warrants have been repriced or exercised under the Warrant Repricing.
Shelf Registration ($50 Million ATM)
On December 22, 2022, we filed a Shelf Registration Statement on Form S-3 that has been declared effective by the SEC. On May 12, 2023, we entered into an At Market (“ATM”) Issuance Sales Agreement (the “ATM Sales Agreement”) with B. Riley Securities, Inc. (the “Agent”) pursuant to which we may offer and sell, from time to time through the Agent, shares of our Common Stock, for aggregate gross proceeds of up to $50,000,000.
We are now subject to the limitations of General Instruction I.B.6. of Form S-3, and in accordance with the terms of the ATM Sales Agreement, the number of shares of our Common Stock available for sale thereunder is now limited to
50
one-third of the aggregate market value of our Common Stock held by non-affiliates of the Company, as calculated pursuant to General Instruction I.B.6. of Form S-3. On January 8, 2024, we filed a Prospectus Supplement to the Prospectus filed on January 11, 2023, to decrease the amount of our Common Stock that is available to be sold under the ATM Sales Agreement, such that we registered the offer and sale of our Common Stock having an aggregate sales price of up to $18,200,000, from time to time.
During the six months ended March 31, 2024, and from April 1, 2024, through the date of this Report, we have not raised any funds through sales under our ATM Sales Agreement.
Future Use of Operating Cash and Capital Requirements
Our future use of operating cash and capital requirements will depend on many forward-looking factors, including the following:
| ● | our ability to attract and retain management with experience in digital media including digital video music streaming, and similar emerging technologies; |
| ● | our ability to negotiate, finalize and maintain economically feasible agreements with the major and independent music labels, publishers and performance rights organizations; |
| ● | our expectations regarding market acceptance of our products in general, and our ability to penetrate digital video music streaming in particular; |
| ● | volatility in digital programmatic advertising spend which can affect our revenues; |
| ● | the scope, validity and enforceability of our and third-party intellectual property rights; |
| ● | the intensity of competition; |
| ● | changes in the political and regulatory environment and in business and fiscal conditions in the United States and overseas; |
| ● | our ability to attract prospective users and to retain existing users; |
| ● | our dependence upon third-party licenses for sound recordings and musical compositions; |
| ● | our lack of control over the providers of our content and their effect on our access to music and other content; |
| ● | our ability to comply with the many complex license agreements to which we are a party; |
| ● | our ability to accurately estimate the amounts payable under our license agreements; |
| ● | the limitations on our operating flexibility due to the minimum guarantees required under certain of our license agreements; |
| ● | our ability to obtain accurate and comprehensive information about music compositions in order to obtain necessary licenses or perform obligations under our existing license agreements; |
| ● | potential breaches of our security systems; |
| ● | assertions by third parties of infringement or other violations by us of their intellectual property rights; |
51
| ● | our ability to generate sufficient revenue to be profitable or to generate positive cash flow on a sustained basis; |
| ● | our ability to accurately estimate our user metrics; |
| ● | risks associated with manipulation of stream counts and user accounts and unauthorized access to our services; |
| ● | our ability to maintain, protect and enhance our brand; |
| ● | risks relating to the acquisition, investment and disposition of companies or technologies; |
| ● | dilution resulting from additional share issuances; |
| ● | tax-related risks; |
| ● | the concentration of voting power among our founders who have and will continue to have substantial control over our business; and |
| ● | risks associated with accounting estimates, currency fluctuations and foreign exchange controls. |
We have evaluated and expect to continue to evaluate a wide array of strategic transactions as part of our plan to acquire or license and develop additional products and services to augment our current business operations. Strategic transaction opportunities that we may pursue could materially affect our liquidity and capital resources and may require us to incur additional indebtedness, seek equity capital or both. Accordingly, we expect to continue to opportunistically seek access to additional capital to license or acquire additional products, services or companies to expand our operations or for general corporate purposes. Strategic transactions may require us to raise additional capital through one or more public or private debt or equity financings or could be structured as a collaboration or partnering arrangement. We have no arrangements, agreements, or understandings in place at the present time to enter into any acquisition, licensing or similar strategic business transaction.
If we raise additional funds by issuing equity securities, our stockholders will experience dilution. Debt financing, if any, are anti-dilutive theyavailable, would result in increased fixed payment obligations and may involve agreements that include covenants limiting or restricting our ability to take specific actions, such as incurring additional debt, making capital expenditures, or declaring dividends. Any debt financing or additional equity that we raise may contain terms, such as liquidation and other preferences that are not consideredfavorable to us or our stockholders.
As of March 31, 2024, our cash totaled $2,197,359. During the six months ended March 31, 2024, we incurred a net loss of $12,856,035 and used $2,287,455 of cash in operations. We have incurred significant operating losses in the computation.past and, as of March 31, 2024, we had an accumulated deficit of $141,141,578. We do not expect to experience positive cash flows from operations in the near future as we continue to invest in the distribution of our Loop Players and the expansion of our Partner Platform business. We also expect to incur significant additional legal and financial expenditures in meeting the regulatory requirements of an NYSE American listed public company.
There is uncertainty regarding our ability to grow our business without additional financing. Our long-term future growth and success are dependent upon our ability to continue selling our services, generate cash from operating activities and obtain additional financing. We may be unable to continue selling our products and services, generate sufficient cash from operations, sell additional shares of Common Stock or borrow additional funds. Our inability to obtain additional cash could have a material adverse effect on our ability to grow our business to a greater extent than we can with our existing financial resources.
52
Critical Accounting Policies and Use of estimatesEstimates
Use of Estimates and Assumptions
The preparation of the financial statements in conformity with generally accepted accounting principles requires management to make estimates and assumptions that affect the reported amounts of assets and liabilities and disclosure of contingent assets and liabilities at the date of the financial statements and the reported amounts of revenue and expenses during the reporting period. Actual results could differ significantly from those estimates. Significant estimates include assumptions used in the revenue recognition of performance obligations, fair value of stock-based compensation awards and income taxes.
Revenue Recognition
Recent pronouncementsWe recognize revenue in accordance with ASC 606, Revenue from Contracts with Customers (“ASC 606”). Our revenue recognition disclosure reflects our updated accounting policies that are affected by this new standard. We applied the “modified retrospective” transition method for open contracts for the implementation of Topic 606. As sales are and have been primarily from delivery of streaming services, delivery of subscription content services in customized formats, and delivery of hardware and ongoing content delivery through software and we have no significant post-delivery obligations, this new standard did not result in a material recognition of revenue on our consolidated financial statements for the cumulative impact of applying this new standard. Therefore, there was no cumulative effect adjustment required.
We recognize revenue when it satisfies a performance obligation by transferring control over a product to a customer. Revenue is measured based on the consideration we expect to receive in exchange for those products. In instances where final acceptance of the product is specified by the customer, revenue is deferred until all acceptance criteria have been met. For example, we bill subscription services in advance of when the service is performed and revenue is treated as deferred revenue until the service is performed and/or the performance obligation is satisfied. Revenues are recognized under Topic 606 in a manner that reasonably reflects the delivery of our products and services to clients in return for expected consideration and includes the following elements:
| ● | executed contracts with our clients that we believe are legally enforceable; |
| ● | identification of performance obligations in the respective contract; |
| ● | determination of the transaction price for each performance obligation in the respective contract; |
| ● | allocation the transaction price to each performance obligation; and |
| ● | recognition of revenue only when we satisfy each performance obligation. |
Our revenue can be categorized into two revenue streams: Advertising revenue and Legacy and other revenue.
The Company hasfollowing table disaggregates our revenue by major type for each of the periods indicated:
| | | | | | | | | | | | |
| | Three months ended March 31, | | Six months ended March 31, | ||||||||
| | | 2024 | | | 2023 | | | 2024 | | | 2023 |
Advertising revenue | | $ | 3,544,992 | | $ | 4,648,390 | | $ | 12,939,756 | | $ | 18,607,895 |
Legacy and other revenue | | | 457,471 | | | 744,841 | | | 1,233,963 | | | 1,611,167 |
Total | | $ | 4,002,463 | | $ | 5,393,231 | | $ | 14,173,719 | | $ | 20,219,062 |
We generate advertising revenue by selling advertising impressions on the Loop Platform, which consists of both the O&O Platform and the Partner Platform. Our advertising sales team works across both platforms, selling ad impressions for both platforms to the same DSPs and other demand sources. Revenue recognition for both Platforms is the same.
53
Legacy and other revenue includes streaming services, subscription content services, and hardware delivery, as further described below.
We consider ourselves the principal on all advertising transactions in which we sell ad impressions, and thus report revenues on a gross basis (net of advertising agency fees and commissions retained by advertising demand sources). We have evaluated ASC 606-10-50-5 and determined that there are no significant differences in the recenttype of goods or services, geographical region, market or type of customer, contract type, contract duration, timing of transfer and sales channel between the O&O Platform and Partner Platform, and therefore would not require additional disaggregation of advertising revenue.
Performance Obligations and Significant Judgments
Our performance obligations and recognition patterns for each revenue stream are as follows:
Advertising Revenue
For the six months ended March 31, 2024, and 2023, advertising revenue accounts for 91% and 92%, respectively, of our revenue and includes revenue from direct programmatic and local advertising as well as sponsorships.
For all advertising revenue sources, we evaluate whether we should be considered the principal (i.e., report revenues on a gross basis) or an agent (i.e., report revenues on a net basis). Our role as principal or agent differs based on our performance obligation for each revenue share arrangement.
For both the O&O and Platform Partner businesses, advertising inventory provided to advertisers through the use of an advertising demand partner or agency, with whose fees or commission is calculated based on a stated percentage of gross advertising spending, we are considered the agent and our revenues are reported net of agency fees and commissions. We are considered the agent because the demand partner or agency controls all aspects of the transaction (pricing risk, inventory risk, obligation for fulfillment) except for the devices used to show the advertisements, therefore we report this advertising revenue net of agency fees and commissions.
We are considered the principal in our arrangements with content providers in our O&O Platform business and with our arrangements with our third-party partners in our Partner Platforms business and thus report revenues on a gross basis (net of agency fees and commissions), wherein the amounts billed to our advertising demand partners, advertising agencies, and direct advertisers and sponsors are recorded as revenues, and amounts paid to content providers and third-party partners are recorded as expenses. We are considered the principal because we control the advertising space, are primarily responsible to our advertising demand partners and other parties filling our advertising inventory, have discretion in pricing and advertising fill rates and typically have an inventory risk.
For advertising revenue, we recognize revenue at the time the digital advertising impressions are filled and the advertisements are played, and for sponsorship revenue, we generally recognize revenue ratably over the term of the sponsorship arrangement as the sponsored advertisements are played.
Legacy and Other Business Revenue
For the six months ended March 31, 2024, and 2023, legacy and other business revenue accounts for the remaining 9% and 8%, respectively, of total revenue and includes streaming services, subscription content services, and hardware delivery, as described below:
| ● | Delivery of streaming services including content encoding and hosting. We recognize revenue over the term of the service based on bandwidth usage. Revenue from streaming services is insignificant. |
| ● | Delivery of subscription content services in customized formats. We recognize revenue straight-line over the term of the service. |
54
| ● | Delivery of hardware for ongoing subscription content delivery through software. We recognize revenue at the point of hardware delivery. Revenue from hardware sales is insignificant. |
Transaction prices for performance obligations are explicitly outlined in relevant contractual agreements; therefore, we do not believe that significant judgments are required with respect to the determination of the transaction price, including any variable consideration identified.
Stock-Based Compensation
Stock-based compensation awarded to employees is measured at the award date, based on the fair value of the award, and is recognized as an expense over the requisite vesting period. We measure the fair value of the stock-based compensation issued to non-employees using the stock price observed in the trading market (for stock transactions) or the fair value of the award (for non-stock transactions), which were more reliably determinable measures of fair value than the value of the services being rendered. The measurement date is the earlier of (1) the date at which commitment for performance by the counterparty to earn the equity instruments is reached, or (2) the date at which the counterparty’s performance is complete.
Content Assets
On January 1, 2020, we adopted the guidance in Accounting Standards Update (“ASU”) 2019-02, Entertainment—Films—Other Assets—Film Costs (Subtopic 926-20) and Entertainment—Broadcasters—Intangibles—Goodwill and Other (Subtopic 920-350): Improvements to Accounting for Costs of Films and License Agreements for Program Materials, on a prospective basis. We capitalize the fixed content fees and our corresponding liability when the license period begins, the cost of the content is known, and the content is accepted and available for streaming. If the licensing fee is not determinable or reasonably estimable, no asset or liability is recorded, and licensing costs are expenses as incurred. We amortize licensed content assets into cost of revenue, using the straight-line method over the contractual period of availability. The liability is paid in accordance with the contractual terms of the arrangement. Internally-developed content costs are capitalized in the same manner as licensed content costs, when the cost of the content is known and the content is ready and available for streaming. We amortize internally-developed content assets into cost of revenue, using the straight-line method over the estimated period of streaming.
Income Taxes
We account for income taxes in accordance with ASC 740. ASC 740 requires a company to use the asset and liability method of accounting pronouncementsfor income taxes, whereby deferred tax assets are recognized for deductible temporary differences, and deferred tax liabilities are recognized for taxable temporary differences. Temporary differences are the differences between the reported amounts of assets and liabilities and their tax bases. Deferred tax assets are reduced by a valuation allowance when, in the opinion of management, it is more likely than not that some portion, or all of, the deferred tax assets will not be realized. Deferred tax assets and liabilities are adjusted for the effect of changes in tax laws and rates on the date of enactment.
Under ASC 740, a tax position is recognized as a benefit only if it is “more likely than not” that the tax position would be sustained in a tax examination, with a tax examination being presumed to occur. The amount recognized is the largest amount of tax benefit that is greater than 50% likely of being realized on examination. For tax positions not meeting the “more likely than not” test, no tax benefit is recorded. We have no material uncertain tax positions for any of the reporting periods presented.
We recognize accrued interest and penalties related to unrecognized tax benefits as part of income tax expense. We have also made a policy election to treat the income tax with respect to global intangible low-tax income as a period expense when incurred.
55
In December 2019, the FASB issued ASU No. 2019-12, Simplifying the Accounting for Income Taxes, as part of its initiative to reduce complexity in accounting standards. The amendments in the ASU are effective for fiscal years beginning after December 15, 2020, including interim periods therein. The adoption of this standard in the first quarter of 2022 had no impact on our consolidated financial statements.
In December 2023, the FASB issued ASU 2023-09, Income Taxes (Topic 740): Improvements to Income Tax Disclosures (“ASU 2023-09”). ASU 2023-09 is intended to enhance the transparency and decision usefulness of income tax disclosures. The amendments in ASU 2023-09 address investor requests for enhanced income tax information primarily through February 2018changes to the rate reconciliation and believesincome taxes paid information. ASU 2023-09 will be effective for us in the annual period beginning October 1, 2025, though early adoption is permitted. We are still evaluating the presentational effect that noneASU 2023-09 will have on our consolidated financial statements, but we expect considerable changes to our income tax footnote.
Recently Adopted Accounting Pronouncements
In September 2016, the FASB issued ASU 2016-13, Financial Instruments - Credit Losses (Topic 326): Measurement of themCredit Losses on Financial Instruments. This guidance requires the measurement of all expected credit losses for financial assets held at the reporting date based on historical experience, current conditions and reasonable and supportable forecasts. This guidance also requires enhanced disclosures regarding significant estimates and judgments used in estimating credit losses. The new guidance is effective for fiscal years beginning after December 15, 2022. We are currently evaluating the impact of this standard on our condensed consolidated financial statements and related disclosures. We adopted this ASU as of October 1, 2023, and there is no material impact to our financial statements as of March 31, 2024.
Item 3.Quantitative and Qualitative Disclosures About Market Risk.
Not required.
Item 4.Controls and Procedures.
Evaluation of Disclosure Controls and Procedures
We maintain disclosure controls and procedures, as defined in Rules 13a-15(e) and 15d-15(e) of the Securities Exchange Act of 1934, as amended (the “Exchange Act”), consisting of controls and other procedures designed to give reasonable assurance that information we are required to disclose in the reports we file or submit under the Exchange Act is recorded, processed, summarized and reported within the time periods specified in the SEC’s rules and forms and that such information is accumulated and communicated to management, including our Chief Executive Officer and our Chief Financial Officer, to allow timely decisions regarding such required disclosure. A control system, no matter how well conceived and operated, can provide only reasonable, not absolute, assurance that the objectives of the control system are met. Our Chief Executive Officer and Chief Financial Officer have evaluated such disclosure controls and procedures as of the end of the period covered by this Quarterly Report on Form 10-Q and have determined that such disclosure controls and procedures are effective.
Changes in Internal Controls over Financial Reporting
There have been no changes in our internal control over financial reporting (as defined in Rule 13a-15(f) under the Exchange Act) that occurred during our last fiscal quarter that have materially affected or are reasonably likely to materially affect our internal control over financial reporting.
There was no change in our internal control over financial reporting during the second quarter of 2023 that has materially affected, or is reasonably likely to materially affect, our internal control over financial reporting. There was no change in our internal control over financial reporting during the second quarter of 2023 that has materially affected, or is reasonably likely to materially affect, our internal control over financial reporting. There was no change in our internal control over financial reporting during the second quarter of 2023 that has materially affected, or is reasonably likely to materially affect, our internal control over financial reporting. There was no change in our internal control over financial reporting during the second quarter of 2023 that has materially affected, or is reasonably likely to materially affect, our internal control over financial reporting. There was no change in our internal control over financial reporting during the second quarter of 2023 that has materially affected, or is reasonably likely to materially affect, our internal control over financial reporting.There was no change in our internal control over financial reporting during the second quarter of fiscal 2023 that has materially affected, or is reasonably likely to materially affect, our internal control over financial reporting. | | | | | | ||||||
| There have been no changes in our internal control over financial reporting (as defined in Rules 13a-15(f) or 15d-15(f) under the Exchange Act) that occurred during the first quarter of 2023 that have materially affected, or are reasonably likely to materially affect, our internal control over financial reporting.Our management, with the participation of our Chief Executive Officer and Chief Financial Officer, evaluated the effectiveness of our disclosure controls and procedures as of December 31, 2022.Based upon the evaluation, our Chief Executive Officer and Chief Financial Officer concluded that, as of such date, our disclosure controls and procedures were effective at the reasonable assurance level.There were no other changes in our internal control over financial reporting (as such term is defined in Exchange Act Rule 13a.With oversight from the Audit Committee, management will continue to design and implement remediation measures to address the material weaknesses described above and enhance our internal control over financial reporting. We will strive to ensure that a proper, consistent tone is communicated throughout the organization, which emphasizes the expectation that previously existing deficiencies will be rectified through implementation of processes and controls to ensure strict compliance with accounting principles generally accepted in the United States and regulatory requirements. | | |||||||||
| | | | | |||||||
56
PART II — OTHER INFORMATION
Item 1.Legal Proceedings
We are currently not involved in any litigation that we believe could have a material adverse effect on our financial condition or results of operations. There is no action, suit, proceeding, inquiry or investigation before or by any court, public board, government agency, self-regulatory organization or body pending or, to the company’sknowledge of our executive officers, threatened against or affecting us, or our Common Stock, in which an adverse decision could have a material adverse effect.
Item 1A. Risk Factors
Factors that could cause our actual results to differ materially from those in this Quarterly Report on Form 10-Q are any of the risks described in our Annual Report on Form 10-K filed with the SEC on December 19, 2023. Any of these factors could result in a significant or material adverse effect on our results of operations or financial statements.condition. Additional risk factors not presently known to us or that we currently deem immaterial may also impair our business or results of operations.
NOTE 2 - GOING CONCERN
The accompanying financial statementsExcept as set forth below, there have been prepared assuming thatno material changes from the Company will continue as a going concern, which contemplatesrisk factors previously disclosed under the recoverability of assets andheading “Risk Factors” in our Annual Report on Form 10-K filed with the satisfaction of liabilities in the normal course of business. Since its inception, the Company has been engaged substantially in financing activities and developing its business plan and incurring start up costs and expenses. As a result, the Company had a retained deficit as ofSEC on December 31, 2017 of ($171,711). In addition, the Company’s activities since inception have been financially sustained through debt and equity financing.19, 2023.
Risks Related to Our Business
TheThere is substantial doubt about our ability of the Company to continue as a going concern and if we are unable to generate significant revenue or secure additional financing, we may have to significantly reduce or discontinue our operations.
We are a small and emerging media company that is dependent upon itsin the early stages of our business plans to capture a significant portion of the out of home market and related advertising sales revenue. Historically, we have not generated sufficient revenues to operate our business. We have a significant accumulated deficit and have incurred operating losses for years and expect losses to continue during the remainder of our fiscal year ending September 30, 2024, and beyond. Our independent registered public accounting firm has indicated in their report that these conditions raise substantial doubt about our ability to raise additional capital from the sale of common stock and, ultimately, the achievement of significant operating revenues. These financial statements do not include any adjustments relating to the recoverability and classification of recorded asset amounts, or amounts and classification of liabilities that might result from this uncertainty.
F-6
INTERLINK PLUS, INC.
NOTES TO FINANCIAL STATEMENTS
(UNAUDITED)
NOTE 3 - PREPAID EXPENSES
As of December 31, 2017, the Company had prepaid transfer agent expenses totaling $750. The prepaid professional fees will be expensed oncontinue as a straight-line basis over the remaining life of the service period. During the nine months ended December 31, 2017 the Company incurred an additional $750 of prepaid transfer agent fees and amortized transfer agent expenses of $375.
Additionally, the Company had prepaid expense related to deposits at hotels totaling $181,107. The prepaid expenses will be reclassified against revenue when our clients complete their stay at the hotel.
NOTE 4 - FIXED ASSETS
The following is a summary of fixed asset costs:
|
| December 31, | |
|
| 2017 | |
Fixed asset |
| $ | 1,176 |
Less: accumulated amortization |
|
| (98) |
Fixed asset, net |
| $ | 1,078 |
Depreciation expense for the six months ended December 31, 2017 was $98.
NOTE 5 - WEBSITE
The following is a summary of website costs:
|
| December 31, | |
|
| 2017 | |
Website |
| $ | 3,500 |
Less: accumulated amortization |
|
| (1,882) |
Website, net |
| $ | 1,618 |
Amortization expense for the six months ended December 31, 2017 was $583.
NOTE 6 - NOTES PAYABLE
On October 11, 2017, the Company executed a promissory note with an entity for $15,000. The unsecured note has a flat interest payment of $2,250 and is due in forty-five days of issuing the note or two business days after demand for payment. As of December 31, 2017, the principal balance is $15,000 and accrued interest is $2,250.
NOTE 7 - NOTES PAYABLE AND CONVERTIBLE DEBT - RELATED PARTY
Short term
On December 23, 2015, the Company executed a promissory note with a related party for $5,000. The unsecured note bears interest at 10% per annum and is due upon demand. During July 2017, the terms of the loan were negotiated. The interest rate is 20% per annum starting August 1, 2017 and is convertible at a fixed conversion rate equal to $0.005 per share. The loan has a prepayment penalty. On December 22, 2017, the note was sold to an unrelated third party.
F-7
INTERLINK PLUS, INC.
NOTES TO FINANCIAL STATEMENTS
(UNAUDITED)
NOTE 7 - NOTES PAYABLE AND CONVERTIBLE DEBT - RELATED PARTY (CONTINUED)
Short term (continued)
On February 26, 2016, the Company executed a promissory note with a related party for $1,000. The unsecured note bears interest at 10% per annum and is due upon demand. During July 2017, the terms of the loan were negotiated. The interest rate is 20% per annum starting August 1, 2017 and is convertible at a fixed conversion rate equal to $0.005 per share. The loan is due on July 31, 2018. The loan has a prepayment penalty. On December 22, 2017, the note was sold to an unrelated third party.
Convertible debt short term
On May 22, 2015, the Company executed a convertible promissory note with a related party for $4,000. The unsecured note bears interest at 10% per annum and is due on May 22, 2017. This note is convertible at $0.005 per share and can be converted on or before the maturity date of May 22, 2017. During July 2017, the partied agreed to extend the maturity date to July 31, 2018. On December 22, 2017, the note was sold to an unrelated third party.
As of December 31, 2017, the balance of accrued interest was $1,687. The interest expense for the six months ended September 30, 2017 was $3,536 including amortization of debt discount of $2,683.
NOTE 8 - CONVERTIBLE DEBT
Convertible debt short term
On April 25, 2016, the Company executed a convertible promissory note with an entity for $5,000. The unsecured note bears interest at 10% per annum and is due on April 25, 2017. This note is convertible at $0.005 per share and can be converted on or before the maturity date of April 25, 2017. During July 2017, the partied agreed to extend the maturity date to July 31, 2018. On December 22, 2017, the note was sold to an unrelated third party.
On July 15, 2016, the Company executed a convertible promissory note with an entity for $5,000. The unsecured note bears interest at 10% per annum and is due on July 15, 2017. This note is convertible at $0.005 per share and can be converted on or before the maturity date of July 15, 2017. During July 2017, the partied agreed to extend the maturity date to July 31, 2018. On December 22, 2017, the note was sold to an unrelated third party.
On August 18, 2016, the Company executed a convertible promissory note with an entity for $5,000. The unsecured note bears interest at 10% per annum and is due on August 18, 2017. This note is convertible at $0.005 per share and can be converted on or before the maturity date of September 27, 2018. On December 22, 2017, the note was sold to an unrelated third party.
As of December 31, 2017, the balance of accrued interest was $2,285. The interest expense for the six months ended December 31, 2017 was $3,848 including amortization of debt discount of $833.
NOTE 9 - STOCKHOLDERS’ EQUITY (DEFICIT)
The Company is authorized to issue 475,000,000 shares of its $0.0001 par value common stock and 25,000,000 shares of its $0.0001 par value preferred stock. The Series A convertible preferred stock have a liquidation preference of $0.10 per share, have super voting rights of 100 votes per share, and each share of Series A may be converted into 100 shares of common stock.
Preferred stock
During the six months ended December 31, 2017, there have been no other issuances of preferred stock.
Common stock
During the six months ended December 31, 2017, there have been no other issuances of common stock.
F-8
INTERLINK PLUS, INC.
NOTES TO FINANCIAL STATEMENTS
(UNAUDITED)
NOTE 9 - STOCKHOLDERS’ EQUITY (DEFICIT) (CONTINUED)
Common stock
During the six months ended December 31, 2017, the Company recorded $6,950 to additional paid in capital for beneficial conversion feature on the convertible debt and $367 in donated capital.
NOTE 10 - WARRANTS AND OPTIONS
As of December 31, 2017, there were no warrants or options outstanding to acquire any additional shares of common stock.
NOTE 11 - RELATED PARTY TRANSACTIONS
On July 11, 2015, the Company executed a consulting agreementgoing concern for a period of three years with a former officer and director and current shareholder at a rate of $3,000 per month. During the six12 months ended December 31, 2017, the Company had professional fees - related party totaling $0 and expenses totaling $0. During the six months ended December 31, 2017, the Company recorded a reduction of $11,188 related to repayment of personal charges on the credit card. As of December 31, 2017, the accounts payable - related party balance was $30,312. On July 1, 2017, the parties mutually agreed to terminate the agreement.
On July 1, 2017, the Company executed a consulting agreement Company owned and controlled with a former officer and director and current shareholder at a rate of $3,000 per month. The Company or entity may terminate with 30 days written notice. During the six months ended December 31, 2017, the Company had professional fees - related party totaling $18,000. As of December 31, 2017, the accounts payable - related party balance was $15,000.
F-9
Item 2. Management’s Discussion and Analysis of Financial Condition and Results of Operations
Forward-Looking Statements
Certain statements, other than purely historical information, including estimates, projections, statements relating to our business plans, objectives, and expected operating results, and the assumptions upon which those statements are based, are “forward-looking statements” within the meaning of the Private Securities Litigation Reform Act of 1995, Section 27A of the Securities Act of 1933 and Section 21E of the Securities Exchange Act of 1934. These forward-looking statements generally are identified by the words “believes,” “project,” “expects,” “anticipates,” “estimates,” “intends,” “strategy,” “plan,” “may,” “will,” “would,” “will be,” “will continue,” “will likely result,” and similar expressions. We intend such forward-looking statements to be covered by the safe-harbor provisions for forward-looking statements contained in the Private Securities Litigation Reform Act of 1995, and are including this statement for purposes of complying with those safe-harbor provisions. Forward-looking statements are based on current expectations and assumptions that are subject to risks and uncertainties which may cause actual results to differ materially from the forward-looking statements. Our ability to predict results or the actual effectissuance date of future plans or strategies is inherently uncertain. Factors which could have a material adverse affect on our operations and future prospects on a consolidated basis include, but are not limited to: changes in economic conditions, legislative/regulatory changes, availability of capital, interest rates, competition, and generally accepted accounting principles. These risks and uncertainties should also be considered in evaluating forward-looking statements and undue reliance should not be placed on such statements. We undertake no obligation to update or revise publicly any forward-looking statements, whether as a result of new information, future events or otherwise. Further information concerning our business, including additional factors that could materially affect our financial results, is included herein and in our other filings with the SEC.
Company Overview
Our business is divided into two major segments: travel agency assistance services and convention services.
We have signed services contract with multiple travel agents to assist with hotel room price quotation and negotiation and communicating with hotels to ensure that accurate reservations are made with Chinese clientele. Through December 31, 2017, we have generated some revenue from our agreement with our clients. We earned $34,718 and $3,998 in revenues for the three months ended December 31, 2017 and 2016, respectively. We are also hopeful that we will engage in other contracts for the services outlined below.
We require additional capital necessary for us to grow our business. Our initial plans include: hiring necessary personnel, marketing our business, completing our website, purchasing equipment and software and further developing the service offering. Our business plan calls for capital of approximately $250,000 in the next twelve months. There is no assurance that we will be successful in these endeavors or that if we accomplish all of these steps we will be able to operate profitably. We intend to fulfill the service needs of our potential customers by utilizing resources and employees in the United States, but, as we grow, we believe we can reduce costs and increase margins by utilizing personnel in foreign countries, such as China, to fulfill the services on behalf of our customers.
Through our services, we believe that clients will be able to gain the advantage of maintaining their growth goals without the need to sacrifice precious resources to address standard business bottlenecks. Our goal is to allow firms to retain their entrepreneurial speed and agility, advantages they would otherwise sacrifice in dealing with logistics rather than the specific focus of the client’s business. We plan to allow clients to grow at a faster pace as they will be less constrained by large capital expenditures for people, training, equipment, or mistakes made from lack of experience in areas which are unrelated to the client’s specific business purpose.
Since our inception, we have been attempting to raise money to implement our business plan, but have not been able to secure the funds necessary to do so. The lack of funds have prevented us from growing the business as we had hoped. As we have been unable to raise the capital necessary to develop and market our services, we have recently been engaged in a search for other business opportunities which may benefit our shareholders and allow us to raise capital and operate. Recent negotiations with what we believe is a more viable business opportunity leads us to believe that we will be revising our business plan and focus over the next quarter. If this opportunity does not develop, however, we will continue to both seek new opportunities and look for capital to further our existing business plan.
4
Travel Agency Assistance
We provide services for overseas travel agents on hotel price quotation and negotiation, contract reviewing, detailed guests’ arrangements, hotel check-in assistance and tradeshow assistance. Overseas travel agents often encounter language barriers and time differences on office hours when dealing with U.S. based hotels and U.S. based conventions. We believe that our bilingual language services, flexible office hours, and reasonable fee structure will help our clients to increase accuracy and efficiency levels, and reduce costs.
Currently, we service 7 overseas and domestic travel agents. These travel agencies work with exhibition service agents in China to coordinate the travel plans of tour groups that plan on attending exhibitions in the U.S. Depending on the exhibition, these tour groups can range from 20 to over 700 people. It is vital for the travel agents and exhibition services agents to provide their clients - Chinese businesses who exhibit in the trade show, a seamless and worry-free trip.
Our role is to help the travel agencies communicate with hotels and convention staff timely and accurately, including finding and negotiating hotel rate, reviewing and updating contracts, submitting and revising guest lists, group check-in (pick up and sorting the room keys for different groups), communicating on bill differences, etc. We currently have bilinguals that are fluent in English and Chinese. We plan to expand our staff of bilinguals to cater to other languages and countries other than China. Our main focus at the present time is to establish a presence in China and we intend to branch out to other Asian countries from there as resources permit.
In November 2016, we became a certified travel agency. Additionally, we became an affiliate partner with booking.com and the Expedia TAAP program. We hope these recent events will help us increase revenue in the future.
Convention Services
Our second business segment is catering to the individual exhibitors at the exhibitions. Exhibitors/ attendees often have temporary assistance needs at conventions and trade shows. We assist these clients on booth set up, tradeshow promotion material preparing, entourage interpreter and/or exhibitor booth personnel arrangements, including bilingual spokespersons, sales associates, narrators and demonstrators, hostesses/hosts, promoters and models.
We are also able to provide custom and pre-made booths, booth graphic design, and exhibit booth setup services to our clients. For clients looking for complete tradeshow exhibit booths, we provide turnkey solutions for sale. We offer top of the range Tablets, TV screens with stands, tables, and chairs, storage bins among others, to ensure that your tradeshow booth is highly inviting. We are able to work with clients on their required specifications and our staff is capable of delivery and assembly of attractive booth designs.
We have limited clients in this business segment. We plan to utilize our travel agency and exhibition service agent contacts to reach out to these exhibitors and establish direct connections for our exhibition services. We may also work though these vital contacts as an extension of their services to these clientele. Furthermore, because we have a U.S. presence, we plan to reach out to the U.S. exhibitions to offer our services to these clientele.
Results of operationsstatements for the three and six months ended DecemberMarch 31, 2017 and 2016
We have earned revenues2024. Our primary source of $34,718 for the three months ended December 31, 2017, as compared with $3,998 for the same period ended 2016. We have earned revenues of $51,812 for the six months ended December 31, 2017, as compared with $9,537 for the same period ended 2016.
We expect to continue to achieve steadily increasing revenues within the coming months. However, as we are a start-up, we have limited operating history to rely upon and we cannot guarantee that our business plan will be successful. To date, we only have 7 travel agencies as our main clients that we contracted to assist with hotel room price quotation and negotiation and communicating with hotels to ensure that accurate reservations are made with Chinese clientele. Our management is actively working to secure additional contracts to grow the business. We are also looking at other business opportunities that would better serve our shareholders.
5
Operating expenses were $41,506 for the three months ended December 31, 2017, as compared with $18,836 for the same period ended 2016. Operating expenses were $69,589 for the six months ended December 31, 2017, as compared with $33,606 for the same period ended 2016. Our operating expenses for the six months ended December 31, 2017 consisted mainly of professional fees and related party professional fees. Our operating expenses for all periods mainly consisted of professional fees and related party professional fees.
We anticipate our operating expenses will increase as we undertake our plan of operations, including increased costs associated with marketing, personnel, and other general and administrative expenses, along with increased professional fees associated with SEC compliance as our business grows more complex and more expensive to maintain.
We incurred other expenses of $4,627 for the three months ended December 31, 2017, as compared with other expenses of $4,506 for the same period ended 2016. We incurred other expenses of $7,384 for the six months ended December 31, 2017, as compared with other expenses of $12,104 for the same period ended 2016. Our other expenses for all periods consisted of interest expense and related party interest expense. We expect that our other expenses will increase in 2018 as a resultfunds since inception has been cash proceeds from sales of our outstanding debt,Common Stock and any additional debt we take on in our financing efforts.
We recorded a net loss of $11,415 for the three months ended December 31, 2017, as compared with a net loss of $19,344 for the same period ended 2016. We recorded a net loss of $25,161 for the six months ended December 31, 2017, as compared with a net loss of $36,173 for the same period ended 2016.
Liquidity and Capital Resources
As of December 31, 2017, we had current assets of $210,938, consisting of cash, accounts receivable and prepaid expenses. Our total current liabilities as of December 31, 2017 were $308,159. As a result, we had working capital deficit of $97,221 as of December 31, 2017.
Operating activities used $774 in cash for the six months ended December 31, 2017, as compared with cash provided of $1,162 for the same period ended 2016. Our negative operating cash flow in 2017 was mainly the result of an increase in prepaid expenses of $123,164 and our net loss of $25,161, offset by increase in customer deposits of $150,334.
Investing activities used $1,176 in cash for the six months ended December 31, 2017, as compared with $0 for the same period ended 2016. Our negative investing cash flow for the six months ended December 31, 2017 was a result of the purchase of fixed assets.
Financing activities provided $15,367 in cash for the six months ended December 31, 2017, as compared with $10,000 for the same period ended 2016.
Because of our limited operating history, it is difficult to predict our capital needs on a monthly, quarterly or annual basis. We will have no capital available to us if we are unable to raise money from this offering or find alternate forms of financing, which we do not have in place at this time.
During the current reporting period, we have been able to extend the maturity date on several promissory notes in the aggregate principal amount of $24,000 through July 31, 2018 with some concessions, as previously reported.
On October 11, 2017, we executed a demand promissory note for $15,000 with a flat interest of $2,250 on or before 45 days from the note issuing date or on the date two business days after receipt of demand for payment.
There can be no assurance that we will be successful in raising additional funding. If we are not able to secure additional funding, the implementation of our business plan will be impaired. There can be no assurance that such additional financing will be available to us on acceptable terms or at all.
Our plan specifies a minimum amount of $250,000 in additional operating capital to operate for the next twelve months. If we are unable to raise $250,000 from this offering, our business will be in jeopardy and we could be formed to suspend our operations or go out of business. As such, there can be no assurance that this offering will be successful. You may lose your entire investment.
6
Off Balance Sheet Arrangements
As of December 31, 2017, there were no off balance sheet arrangements.
Going Concern
The accompanying financial statements have been prepared assuming that we will continue as a going concern, which contemplates the recoverability of assets and the satisfaction of liabilities in the normal course of business. As noted above, we are a start-up and, accordingly, have generated slight revenues from operations. Since our inception, we have been engaged substantially in financing activities and developing our business plan and incurring startup costs and expenses. As a result, we incurred accumulated net losses from Inception (May 11, 2015) through the period ended December 31, 2017 of ($171,711). In addition, our development activities since inception have been financially sustained through debt and equity financing.
financing transactions. Our ability to continue as a going concern is dependent upon our ability to generate sufficient revenue and our ability to raise additional funds by way of its debt and equity financing efforts. There can be no assurance that adequate financing will be available in a timely manner, on acceptable terms, or at all.
For the next twelve months, we anticipate that we will need to supplement our cash from revenues with additional cash raised from equity investment or debt transactions, while maintaining reduced spending levels, to ensure that we will have adequate cash to support our minimum operating cash requirements and thus to continue as a going concern. We have based this estimate on assumptions that may prove to be wrong, and we could use our available capital resources sooner than we expect.
We have no agreements, commitments, or understandings to secure additional financing at this time and there can be no guarantee or assurance that we can raise adequate capital from the saleoutside sources. Our long-term future growth and success are dependent upon our ability to continue selling our services, generate cash from operating activities and obtain additional financing. We may be unable to continue selling our products and services, generate sufficient cash from operations, sell additional shares of common stock or borrow additional funds. Our inability to obtain additional cash by raising funds when required or on acceptable terms, or otherwise, could have a material adverse effect on our ability to grow our business to a greater extent than we can with our existing financial resources and ultimately,we may have to significantly reduce, or discontinue our operations.
57
Risks Related to Owning Our Common Stock
We are currently out of compliance with the achievementcontinued listing standards of significant operating revenues. These financial statements do not include any adjustmentsthe NYSE American. Our failure to resume compliance with the continued listing standards or make continued progress toward compliance consistent with a plan of compliance we intend to submit to NYSE American may result in the delisting of our Common Stock.
Our Common Stock is listed on the NYSE American and such listing is contingent on our compliance with the NYSE American’s conditions for continued listing, including requirements relating to maintaining minimum stockholders’ equity. On April 23, 2024, we received a deficiency letter (the “Deficiency Letter”) from the recoverability and classification of recorded asset amounts, or amounts and classification of liabilitiesNYSE American indicating that might result from this uncertainty.
Item 3. Quantitative and Qualitative Disclosures About Market Risk
A smaller reporting companythe Company is not required to providein compliance with the information required by this Item.
Item 4. ControlsNYSE American continued listing standards set forth in Sections 1003(a)(i), (ii) and Procedures
Disclosure Controls and Procedures
We carried out an evaluation(iii) of the effectivenessNYSE American Company Guide. Section 1003(a)(i) of the design and operationNYSE American Company Guide requires a listed company’s stockholders’ equity be at least $2.0 million if it has reported losses from continuing operations and/or net losses in two of our disclosure controls and procedures (as definedits three most recent fiscal years. Section 1003(a)(ii) of the NYSE American Company Guide requires a listed company’s stockholders’ equity be at least $4.0 million if it has reported losses from continuing operations and/or net losses in Exchange Act Rules 13a-15(e) and 15d-15(e))three of its four most recent fiscal years. Section 1003(a)(iii) of the NYSE American Company Guide requires a listed company’s stockholders’ equity be at least $6.0 million if it has reported losses from continuing operations and/or net losses in its five most recent fiscal years. The Deficiency Letter noted that the Company reported stockholders’ deficit of $(3.7) million as of December 31, 2017. This evaluation was carried2023, and losses from continuing operations and/or net losses in its five most recent fiscal years ended September 30, 2023, thereby putting us out underof compliance with Sections 1003(a)(i), (ii) and (iii) of the supervisionNYSE American Company Guide. The Deficiency Letter also noted that the Company is not currently eligible for any exemption set forth in Section 1003(a) of the NYSE American Company Guide.
As a result of this non-compliance, we became subject to the procedures and requirements set forth in Section 1009 of the NYSE American Company Guide. In order to maintain our listing on the NYSE American, we are required to submit a plan of compliance (the “Plan”) by May 23, 2024, addressing how we intend to regain compliance with Sections 1003(a)(i), (ii) and (iii) of the NYSE American Company Guide by October 23, 2025 (the “Deadline”). We intend to submit the Plan by the Deadline. We have been advised that if we fail to submit a Plan, our Plan is not accepted, we do not make progress consistent with the participation of our Chief Executive Officer and our Chief Financial Officer. Based upon that evaluation, our Chief Executive Officer and Chief Financial Officer concluded that, as of December 31, 2017, our disclosure controls and procedures were not effective duePlan, or we fail to regain compliance by the Deadline, then NYSE American may commence delisting procedures. Although we intend to regain compliance with the continued listing requirements prior to the presence of material weaknesses in internal control over financial reporting.
A material weakness is a deficiency, or a combination of deficiencies, in internal control over financial reporting, such that there is a reasonable possibility that a material misstatement of the company’s annual or interim financial statements will not be prevented or detected on a timely basis. Management has identified the following material weaknesses which have caused management to conclude that, as of December 31, 2017, our disclosure controls and procedures were not effective: (i) inadequate segregation of duties and effective risk assessment; and (ii) insufficient written policies and procedures for accounting and financial reporting with respect to the requirements and application of both US GAAP and SEC guidelines.
Remediation Plan to Address the Material Weaknesses in Internal Control over Financial Reporting
Our company plans to take steps to enhance and improve the design of our internal controls over financial reporting. During the period covered by this quarterly report on Form 10-Q,Deadline, we have not been able to remediate the material weaknesses identified above. To remediate such weaknesses, we plan to implement the following changes during our fiscal year ending June 30, 2018: (i) appoint additional qualified personnel to address inadequate segregation of duties and ineffective risk management; and (ii) adopt sufficient written policies and procedures for accounting and financial reporting. The remediation efforts set out are largely dependent upon our securing additional financing to cover the costs of implementing the changes required. If we are unsuccessful in securing such funds, remediation efforts may be adversely affected in a material manner.
We are unable to remedy our controls relateddo so. If delisting proceedings are commenced, the NYSE American rules permit us to the inadequate segregation of duties and ineffective risk management until we receive financing to hire additional employees.
7
Changes in Internal Control over Financial Reporting
There were no changes in our internal control over financial reporting during the three months ended December 31, 2017 that have materially affected, or are reasonable likely to materially affect, our internal control over financial reporting.
Limitations on the Effectiveness of Internal Controls
Our management does not expect that our disclosure controls and procedures or our internal control over financial reporting will necessarily prevent all fraud and material error. Further, the design ofappeal a control system must reflect the fact that there are resource constraints, and the benefits of controls must be considered relative to their costs. Because of the inherent limitations in all control systems, no evaluation of controls can provide absolute assurance that all control issues and instances of fraud, if any, within the Company have been detected. These inherent limitations include the realities that judgments in decision-making can be faulty, and that breakdowns can occur because of simple error or mistake. Additionally, controls can be circumvented by the individual acts of some persons, by collusion of two or more people, or by management override of the internal control. The design of any system of controls also is based in part upon certain assumptions about the likelihood of future events, andstaff delisting determination; however, there can be no assurance that the outcome of any designsuch appeal would be in our favor.
Our Common Stock will succeed in achieving its stated goals under all potential future conditions. Over time, control may become inadequate because of changes in conditions, orcontinue to be listed and traded on the degree ofNYSE American during the Plan period, subject to our compliance with the policiesNYSE American’s other applicable continued listing standards and will continue to trade under the symbol “LPTV,” but will have an added designation of “.BC” to indicate that the Company is not in compliance with the NYSE American’s listing standards. The NYSE American notification does not affect our business operations or procedures may deteriorate.
8
PART II - OTHER INFORMATION
Item 1. Legal Proceedings
We areour SEC reporting requirements and does not a party to any pending legal proceeding. We are not awareconflict with or cause an event of any pending legal proceeding to whichdefault under any of the Company’s material agreements.
If NYSE American delists our officers, directors, or any beneficialCommon Stock from trading on its exchange due to our failure to meet the NYSE American’s listing conditions, we and our security holders could face significant material adverse consequences, including, but not limited to, a lack of 5% or moretrading market for our Common Stock, reduced liquidity, decreased analyst coverage of our voting securities are adverseCommon Stock and an inability for us to us or have a material interest adverseobtain additional financing to us.fund our operations.
Item 1A. Risk Factors
See risk factors included in our Annual Report on Form 10-K for 2017.
Item 2.Unregistered Sales of Equity Securities and Use of Proceeds
None
Proceeds.
None.
Item 3.Defaults uponUpon Senior SecuritiesSecurities.
There were no material defaults regarding payments of principal and interest that exceeded 5% of our total assets.
None58
Item 4.Mine Safety Disclosures
Disclosures.
Not applicable.
Item 5.Other InformationInformation.
(a)
NoneBoard Cash Compensation Deferral
As part of the cost-cutting measures being undertaken across the Company, effective as of May 3, 2024, our Board of Directors agreed to defer all cash compensation due to them for the remainder of fiscal year 2024 until October 1, 2024, at which time deferred payments are expected to be paid and regularly quarterly payments are scheduled to resume.
CEO Employment Letter Agreement Amendment
As previously disclosed, we entered into an employment letter agreement with Justis Kao (“Mr. Kao”) in connection with his appointment as Interim Chief Executive Officer (the “CEO Employment Letter Agreement”), which was effective as of March 17, 2024. On May 3, 2024, we entered into an amendment to the CEO Employment Letter Agreement (the “CEO Employment Letter Agreement Amendment”) to add the following provisions: in each case of (a) termination without Cause unrelated to a Change of Control (as defined in the CEO Employment Letter Agreement) and (b) termination without Cause or Resignation for Good Reason related to a Change of Control (as defined in the CEO Employment Letter Agreement), Mr. Kao will receive the unpaid portion of the agreed-upon bonus for the fiscal year ended September 30, 2022.
The foregoing description of the CEO Employment Letter Agreement Amendment does not purport to be complete and is qualified in its entirety by reference to the full text of the CEO Employment Letter Agreement Amendment, a copy of which is filed as Exhibit 10.8 to this Report and incorporated herein by reference.
(b)None.
(c)None of our directors or officers adopted, modified, or terminated a Rule 10b5-1 trading arrangement or a non-Rule 10b5-1 trading arrangement during our fiscal quarter ended March 31, 2024 (each as defined in Item 408 of Regulation S-K under the Securities Exchange Act of 1934, as amended).
Item 6. Exhibits
Exhibit No. |
| Exhibit Description | |
| | | |
10.1 | | ||
| | | |
10.2 | | ||
| | | |
10.3 | |
59
| | |
10.4 | | |
| | |
10.5 | | |
| | |
10.6 | | |
| | |
10.7 | | |
| | |
10.8* | | CEO Employment Letter Agreement Amendment between the Company and Justis Kao, effective May 3, 2024. |
| | |
31.1* |
| |
|
|
|
|
| |
|
|
|
|
| |
|
|
|
|
| |
| | |
| |
|
| | |
101.SCH | | Inline XBRL Taxonomy Extension Schema |
| | |
101.CAL | | Inline XBRL Taxonomy Extension Calculation Linkbase |
| | |
101.DEF | | Inline XBRL Taxonomy Extension Definition Linkbase |
| | |
101.LAB | | Inline XBRL Taxonomy Extension Label Linkbase |
| | |
101.PRE | | Inline XBRL Taxonomy Extension Presentation Linkbase |
| | |
104 | | Cover Page Interactive Data File (formatted as inline XBRL and contained in |
| | |
**Provided herewith Filed herewith.
** This certification is not deemed “filed” for purposes of Section 18 of the Securities Exchange Act of 1934, or otherwise subject to the liability of that section. Such certification will not be deemed to be incorporated by reference into any filing under the Securities Act of 1933 or the Securities Exchange Act of 1934, except to the extent that the registrant specifically incorporates it by reference.
60
SIGNATURES
Pursuant to the requirements of Section 13 or 15(d) of the Securities Exchange Act of 1934, the registrant has duly caused this reportReport to be signed on its behalf by the undersigned thereunto duly authorized.
| | |
|
| |
| (Registrant) | |
| | |
| | |
Date: May 3, 2024 |
| |
By: | /s/
| |
| | Justis Kao |
| | Chief Executive Officer |
| | (Principal Executive Officer) |
| | |
| | |
Date: May 3, 2024 | By: | /s/ Neil Watanabe |
| | Neil Watanabe |
| | Chief Financial Officer |
| | (Principal Financial and |
61
10