UNITED STATES
SECURITIES AND EXCHANGE COMMISSION
Washington, D.C. 20549
FORM 10-Q
| | | | | |
| (Mark One) | |
| ☒ | QUARTERLY REPORT PURSUANT TO SECTION 13 OR 15(d) OF THE SECURITIES EXCHANGE ACT OF 1934 |
For the Quarterly Period Ended June 30, 20222023
OR
| | | | | |
| ☐ | TRANSITION REPORT PURSUANT TO SECTION 13 OR 15(d) OF THE SECURITIES EXCHANGE ACT OF 1934 |
For the transition period from to
Commission File Number: 001-35060
PACIRA BIOSCIENCES, INC.
(Exact Name of Registrant as Specified in its Charter)
| | | | | | | | |
| Delaware | | 51-0619477 |
(State or Other Jurisdiction of
Incorporation or Organization) | | (I.R.S. Employer
Identification No.) |
5401 West Kennedy Boulevard, Suite 890
Tampa, Florida 33609
(Address and Zip Code of Principal Executive Offices)
(813) 553-6680
(Registrant’s Telephone Number, Including Area Code)
Securities registered pursuant to Section 12(b) of the Act: | | | | | | | | | | | | | | |
| Title of each class | | Trading symbol | | Name of each exchange on which registered |
| Common Stock, par value $0.001 per share | | PCRX | | Nasdaq Global Select Market |
Indicate by check mark whether the registrant (1) has filed all reports required to be filed by Section 13 or 15(d) of the Securities Exchange Act of 1934 during the preceding 12 months (or for such shorter period that the registrant was required to file such reports), and (2) has been subject to such filing requirements for the past 90 days. ☒ Yes ☐ No
Indicate by check mark whether the registrant has submitted electronically every Interactive Data File required to be submitted pursuant to Rule 405 of Regulation S-T (§ 232.405 of this chapter) during the preceding 12 months (or for such shorter period that the registrant was required to submit such files.) ☒ Yes ☐ No
Indicate by check mark whether the registrant is a large accelerated filer, an accelerated filer, a non-accelerated filer, a smaller reporting company, or an emerging growth company. See the definitions of “large accelerated filer”, “accelerated filer”, “smaller reporting company”, and “emerging growth company” in Rule 12b-2 of the Exchange Act.
| | | | | | | | | | | | | | | | | | | | |
| Large accelerated filer | ☒ | | Accelerated filer | ☐ | |
| Non-accelerated filer | ☐ | | Smaller reporting company | ☐ | |
| | | | Emerging growth company | ☐ | |
If an emerging growth company, indicate by check mark if the registrant has elected not to use the extended transition period for complying with any new or revised financial accounting standards pursuant to Section 13(a) of the Exchange Act. ☐
Indicate by check mark whether the registrant is a shell company (as defined in Rule 12b-2 of the Exchange Act). ☐ Yes ☒ No
As of August 1, 2022, 45,824,2102023, 46,417,025 shares of the registrant’s common stock, $0.001 par value per share, were outstanding.
PACIRA BIOSCIENCES, INC.
QUARTERLY REPORT ON FORM 10-Q
FOR THE QUARTER ENDED JUNE 30, 20222023
TABLE OF CONTENTS
Pacira BioSciences, Inc. | Q2 20222023 Form 10-Q | Page 3
PART I — FINANCIAL INFORMATION
Item 1. FINANCIAL STATEMENTS (Unaudited)
PACIRA BIOSCIENCES, INC.
CONDENSED CONSOLIDATED BALANCE SHEETS
(In thousands, except share and per share amounts)
(Unaudited) | | | June 30,
2022 | | December 31,
2021 | | June 30,
2023 | | December 31,
2022 |
| ASSETS | ASSETS | | | | ASSETS | | | |
| Current assets: | Current assets: | | | | Current assets: | | | |
| Cash and cash equivalents | Cash and cash equivalents | $ | 122,061 | | | $ | 585,578 | | Cash and cash equivalents | $ | 86,810 | | | $ | 104,139 | |
| Short-term available-for-sale investments | Short-term available-for-sale investments | 194,332 | | | 70,831 | | Short-term available-for-sale investments | 133,956 | | | 184,512 | |
| Accounts receivable, net | Accounts receivable, net | 91,105 | | | 96,318 | | Accounts receivable, net | 99,079 | | | 98,397 | |
| Inventories, net | Inventories, net | 100,588 | | | 98,550 | | Inventories, net | 92,130 | | | 96,063 | |
| Prepaid expenses and other current assets | Prepaid expenses and other current assets | 18,124 | | | 14,771 | | Prepaid expenses and other current assets | 17,349 | | | 15,223 | |
| Total current assets | Total current assets | 526,210 | | | 866,048 | | Total current assets | 429,324 | | | 498,334 | |
| | Noncurrent available-for-sale investments | | Noncurrent available-for-sale investments | — | | | 37,209 | |
| Fixed assets, net | Fixed assets, net | 191,279 | | | 188,401 | | Fixed assets, net | 180,310 | | | 183,512 | |
| Right-of-use assets, net | Right-of-use assets, net | 72,082 | | | 76,410 | | Right-of-use assets, net | 65,837 | | | 70,877 | |
| Goodwill | Goodwill | 146,132 | | | 145,175 | | Goodwill | 163,243 | | | 163,243 | |
| Intangible assets, net | Intangible assets, net | 595,324 | | | 623,968 | | Intangible assets, net | 511,902 | | | 540,546 | |
| Deferred tax assets | Deferred tax assets | 167,149 | | | 153,364 | | Deferred tax assets | 156,140 | | | 160,309 | |
| Investments and other assets | Investments and other assets | 35,812 | | | 21,987 | | Investments and other assets | 35,625 | | | 27,170 | |
| Total assets | Total assets | $ | 1,733,988 | | | $ | 2,075,353 | | Total assets | $ | 1,542,381 | | | $ | 1,681,200 | |
| | LIABILITIES AND STOCKHOLDERS’ EQUITY | LIABILITIES AND STOCKHOLDERS’ EQUITY | | | | LIABILITIES AND STOCKHOLDERS’ EQUITY | | | |
| Current liabilities: | Current liabilities: | | | | Current liabilities: | | | |
| Accounts payable | Accounts payable | $ | 13,983 | | | $ | 10,543 | | Accounts payable | $ | 24,206 | | | $ | 15,220 | |
| Accrued expenses | Accrued expenses | 77,275 | | | 127,555 | | Accrued expenses | 56,221 | | | 89,785 | |
| Lease liabilities | Lease liabilities | 8,134 | | | 7,891 | | Lease liabilities | 8,981 | | | 9,121 | |
| Convertible senior notes, net | — | | | 350,466 | | |
| Current portion of convertible senior notes, net | | Current portion of convertible senior notes, net | 8,641 | | | — | |
| | Current portion of long-term debt, net | Current portion of long-term debt, net | 33,776 | | | 24,234 | | Current portion of long-term debt, net | 10,863 | | | 33,648 | |
| Income taxes payable | 11 | | | 429 | | |
| | Total current liabilities | Total current liabilities | 133,179 | | | 521,118 | | Total current liabilities | 108,912 | | | 147,774 | |
| Convertible senior notes, net | Convertible senior notes, net | 403,534 | | | 339,267 | | Convertible senior notes, net | 397,360 | | | 404,767 | |
| Long-term debt, net | Long-term debt, net | 318,344 | | | 335,263 | | Long-term debt, net | 134,823 | | | 251,056 | |
| Lease liabilities | Lease liabilities | 67,575 | | | 71,727 | | Lease liabilities | 60,046 | | | 64,802 | |
| | Contingent consideration | Contingent consideration | 35,247 | | | 57,598 | | Contingent consideration | 21,482 | | | 28,122 | |
| Other liabilities | Other liabilities | 19,473 | | | 19,972 | | Other liabilities | 11,783 | | | 9,669 | |
| Total liabilities | Total liabilities | 977,352 | | | 1,344,945 | | Total liabilities | 734,406 | | | 906,190 | |
| Commitments and contingencies (Note 16) | 0 | | 0 | |
| Commitments and contingencies (Note 15) | | Commitments and contingencies (Note 15) | |
| Stockholders’ equity: | Stockholders’ equity: | | | | Stockholders’ equity: | | | |
| Preferred stock, par value $0.001; 5,000,000 shares authorized; none issued and outstanding at June 30, 2022 and December 31, 2021 | — | | | — | | |
| Common stock, par value $0.001; 250,000,000 shares authorized; 45,801,578 and 44,734,308 shares issued and outstanding at June 30, 2022 and December 31, 2021, respectively | 46 | | | 45 | | |
| Preferred stock, par value $0.001; 5,000,000 shares authorized; none issued and outstanding at June 30, 2023 and December 31, 2022 | | Preferred stock, par value $0.001; 5,000,000 shares authorized; none issued and outstanding at June 30, 2023 and December 31, 2022 | — | | | — | |
| Common stock, par value $0.001; 250,000,000 shares authorized; 46,408,961 and 45,927,790 shares issued and outstanding at June 30, 2023 and December 31, 2022, respectively | | Common stock, par value $0.001; 250,000,000 shares authorized; 46,408,961 and 45,927,790 shares issued and outstanding at June 30, 2023 and December 31, 2022, respectively | 46 | | | 46 | |
| Additional paid-in capital | Additional paid-in capital | 895,151 | | | 942,091 | | Additional paid-in capital | 950,626 | | | 924,095 | |
| Accumulated deficit | Accumulated deficit | (137,956) | | | (211,895) | | Accumulated deficit | (142,524) | | | (148,751) | |
| Accumulated other comprehensive (loss) income | (605) | | | 167 | | |
| Accumulated other comprehensive loss | | Accumulated other comprehensive loss | (173) | | | (380) | |
| Total stockholders’ equity | Total stockholders’ equity | 756,636 | | | 730,408 | | Total stockholders’ equity | 807,975 | | | 775,010 | |
| Total liabilities and stockholders’ equity | Total liabilities and stockholders’ equity | $ | 1,733,988 | | | $ | 2,075,353 | | Total liabilities and stockholders’ equity | $ | 1,542,381 | | | $ | 1,681,200 | |
See accompanying notes to condensed consolidated financial statements.
Pacira BioSciences, Inc. | Q2 20222023 Form 10-Q | Page 4
PACIRA BIOSCIENCES, INC.
CONDENSED CONSOLIDATED STATEMENTS OF OPERATIONS
(In thousands, except per share amounts)
(Unaudited)
| | | Three Months Ended
June 30, | | Six Months Ended
June 30, | | Three Months Ended
June 30, | | Six Months Ended
June 30, |
| | | 2022 | | 2021 | | 2022 | | 2021 | | 2023 | | 2022 | | 2023 | | 2022 |
| Revenues: | Revenues: | | | | | | | | Revenues: | | | | | | | |
| Net product sales | Net product sales | $ | 168,581 | | | $ | 134,863 | | | $ | 326,003 | | | $ | 253,601 | | Net product sales | $ | 169,467 | | | $ | 168,581 | | | $ | 328,898 | | | $ | 326,003 | |
| Royalty revenue | Royalty revenue | 830 | | | 602 | | | 1,399 | | | 891 | | Royalty revenue | — | | | 830 | | | 910 | | | 1,399 | |
| Collaborative licensing and milestone revenue | — | | | 125 | | | — | | | 125 | | |
| | Total revenues | Total revenues | 169,411 | | | 135,590 | | | 327,402 | | | 254,617 | | Total revenues | 169,467 | | | 169,411 | | | 329,808 | | | 327,402 | |
| Operating expenses: | Operating expenses: | | | | | | | | Operating expenses: | | | | | | | |
| Cost of goods sold | Cost of goods sold | 50,627 | | | 35,248 | | | 86,701 | | | 66,597 | | Cost of goods sold | 48,207 | | | 50,627 | | | 97,227 | | | 86,701 | |
| Research and development | Research and development | 26,282 | | | 12,573 | | | 47,887 | | | 28,453 | | Research and development | 18,824 | | | 26,282 | | | 35,964 | | | 47,887 | |
| Selling, general and administrative | Selling, general and administrative | 65,003 | | | 50,813 | | | 129,263 | | | 99,335 | | Selling, general and administrative | 64,850 | | | 65,003 | | | 135,693 | | | 129,263 | |
| Amortization of acquired intangible assets | Amortization of acquired intangible assets | 14,322 | | | 1,967 | | | 28,644 | | | 3,933 | | Amortization of acquired intangible assets | 14,322 | | | 14,322 | | | 28,644 | | | 28,644 | |
| Acquisition-related (gains) charges, product discontinuation and other | (18,058) | | | 146 | | | (13,721) | | | 2,019 | | |
| Acquisition-related (gains) charges, restructuring charges and other | | Acquisition-related (gains) charges, restructuring charges and other | (16,613) | | | (18,058) | | | (4,506) | | | (13,721) | |
| Total operating expenses | Total operating expenses | 138,176 | | | 100,747 | | | 278,774 | | | 200,337 | | Total operating expenses | 129,590 | | | 138,176 | | | 293,022 | | | 278,774 | |
| Income from operations | Income from operations | 31,235 | | | 34,843 | | | 48,628 | | | 54,280 | | Income from operations | 39,877 | | | 31,235 | | | 36,786 | | | 48,628 | |
| Other (expense) income: | Other (expense) income: | | | | | | | | Other (expense) income: | | | | | | | |
| Interest income | Interest income | 252 | | | 224 | | | 523 | | | 639 | | Interest income | 2,111 | | | 252 | | | 5,253 | | | 523 | |
| Interest expense | Interest expense | (8,833) | | | (7,023) | | | (19,079) | | | (13,994) | | Interest expense | (3,865) | | | (8,833) | | | (13,454) | | | (19,079) | |
| | Loss on early extinguishment of debt | | Loss on early extinguishment of debt | — | | | — | | | (16,926) | | | — | |
| Other, net | Other, net | (647) | | | (2,396) | | | (771) | | | (2,554) | | Other, net | (269) | | | (647) | | | (279) | | | (771) | |
| Total other expense, net | Total other expense, net | (9,228) | | | (9,195) | | | (19,327) | | | (15,909) | | Total other expense, net | (2,023) | | | (9,228) | | | (25,406) | | | (19,327) | |
| Income before income taxes | Income before income taxes | 22,007 | | | 25,648 | | | 29,301 | | | 38,371 | | Income before income taxes | 37,854 | | | 22,007 | | | 11,380 | | | 29,301 | |
| Income tax expense | Income tax expense | (2,131) | | | (6,567) | | | (2,597) | | | (8,921) | | Income tax expense | (12,091) | | | (2,131) | | | (5,153) | | | (2,597) | |
| Net income | Net income | $ | 19,876 | | | $ | 19,081 | | | $ | 26,704 | | | $ | 29,450 | | Net income | $ | 25,763 | | | $ | 19,876 | | | $ | 6,227 | | | $ | 26,704 | |
| | Net income per share: | Net income per share: | | | | | | | | Net income per share: | | | | | | | |
| Basic net income per common share | Basic net income per common share | $ | 0.44 | | | $ | 0.43 | | | $ | 0.59 | | | $ | 0.67 | | Basic net income per common share | $ | 0.56 | | | $ | 0.44 | | | $ | 0.14 | | | $ | 0.59 | |
| Diluted net income per common share | Diluted net income per common share | $ | 0.40 | | | $ | 0.42 | | | $ | 0.55 | | | $ | 0.64 | | Diluted net income per common share | $ | 0.51 | | | $ | 0.40 | | | $ | 0.13 | | | $ | 0.55 | |
| Weighted average common shares outstanding: | Weighted average common shares outstanding: | | | | | Weighted average common shares outstanding: | | | | |
| Basic | Basic | 45,501 | | | 44,145 | | | 45,185 | | | 43,989 | | Basic | 46,088 | | | 45,501 | | | 46,019 | | | 45,185 | |
| Diluted | Diluted | 52,478 | | | 45,592 | | | 52,262 | | | 45,779 | | Diluted | 52,054 | | | 52,478 | | | 46,285 | | | 52,262 | |
See accompanying notes to condensed consolidated financial statements.
Pacira BioSciences, Inc. | Q2 20222023 Form 10-Q | Page 5
PACIRA BIOSCIENCES, INC.
CONDENSED CONSOLIDATED STATEMENTS OF COMPREHENSIVE INCOME
(In thousands)
(Unaudited)
| | | Three Months Ended
June 30, | | Six Months Ended
June 30, | | Three Months Ended
June 30, | | Six Months Ended
June 30, |
| | | 2022 | | 2021 | | 2022 | | 2021 | | 2023 | | 2022 | | 2023 | | 2022 |
| Net income | Net income | $ | 19,876 | | | $ | 19,081 | | | $ | 26,704 | | | $ | 29,450 | | Net income | $ | 25,763 | | | $ | 19,876 | | | $ | 6,227 | | | $ | 26,704 | |
| Other comprehensive (loss) income: | | | | | | | | |
| Other comprehensive income (loss): | | Other comprehensive income (loss): | | | | | | | |
| Net unrealized (loss) gain on investments, net of tax | Net unrealized (loss) gain on investments, net of tax | (160) | | | 12 | | | (893) | | | (138) | | Net unrealized (loss) gain on investments, net of tax | (35) | | | (160) | | | 216 | | | (893) | |
| Foreign currency translation adjustments | Foreign currency translation adjustments | 82 | | | (3) | | | 121 | | | 1 | | Foreign currency translation adjustments | (1) | | | 82 | | | (9) | | | 121 | |
| Total other comprehensive (loss) income | Total other comprehensive (loss) income | (78) | | | 9 | | | (772) | | | (137) | | Total other comprehensive (loss) income | (36) | | | (78) | | | 207 | | | (772) | |
| Comprehensive income | Comprehensive income | $ | 19,798 | | | $ | 19,090 | | | $ | 25,932 | | | $ | 29,313 | | Comprehensive income | $ | 25,727 | | | $ | 19,798 | | | $ | 6,434 | | | $ | 25,932 | |
See accompanying notes to condensed consolidated financial statements.
Pacira BioSciences, Inc. | Q2 20222023 Form 10-Q | Page 6
PACIRA BIOSCIENCES, INC.
CONDENSED CONSOLIDATED STATEMENTS OF STOCKHOLDERS’ EQUITY
FOR THE THREE MONTHS ENDED JUNE 30, 20222023 AND 2021
(In thousands)
(Unaudited)
| | | | | | | | | | | | | | | | | | | | | | | | | | | | | | | | | | | |
| | Common Stock | | Additional
Paid-In
Capital | | Accumulated
Deficit | | Accumulated Other Comprehensive (Loss) Income | | |
| | Shares | | Amount | | | | | Total |
| Balance at March 31, 2022 | 45,064 | | | $ | 45 | | | $ | 867,890 | | | $ | (157,832) | | | $ | (527) | | | $ | 709,576 | |
| | | | | | | | | | | |
| Exercise of stock options | 307 | | | 1 | | | 10,856 | | | — | | | — | | | 10,857 | |
| Vested restricted stock units | 292 | | | — | | | — | | | — | | | — | | | — | |
Common stock issued under employee stock
purchase plan | 37 | | | — | | | 1,821 | | | — | | | — | | | 1,821 | |
| Stock-based compensation | — | | | — | | | 11,544 | | | — | | | — | | | 11,544 | |
| Issuance of common stock upon conversion of 2022 convertible senior notes (Note 9) | 102 | | | — | | | 3,040 | | | — | | | — | | | 3,040 | |
| | | | | | | | | | | |
| | | | | | | | | | | |
| Other comprehensive loss (Note 11) | — | | | — | | | — | | | — | | | (78) | | | (78) | |
| Net income | — | | | — | | | — | | | 19,876 | | | — | | | 19,876 | |
| Balance at June 30, 2022 | 45,802 | | | $ | 46 | | | $ | 895,151 | | | $ | (137,956) | | | $ | (605) | | | $ | 756,636 | |
| | | | | | | | | | | | | | | | | | | | | | | | | | | | | | | | | | | |
| | | | | | | | | | | |
| | Common Stock | | Additional
Paid-In
Capital | | Accumulated
Deficit | | Accumulated Other Comprehensive Loss | | |
| | Shares | | Amount | | | | | Total |
| Balance at March 31, 2023 | 45,970 | | | $ | 46 | | | $ | 936,419 | | | $ | (168,287) | | | $ | (137) | | | $ | 768,041 | |
| | | | | | | | | | | |
| Exercise of stock options | 50 | | | — | | | 1,580 | | | — | | | — | | | 1,580 | |
| Vested restricted stock units | 339 | | | — | | | — | | | — | | | — | | | — | |
Common stock issued under employee stock
purchase plan | 50 | | | — | | | 1,672 | | | — | | | — | | | 1,672 | |
| Stock-based compensation | — | | | — | | | 10,955 | | | — | | | — | | | 10,955 | |
| | | | | | | | | | | |
| | | | | | | | | | | |
| Other comprehensive loss (Note 10) | — | | | — | | | — | | | — | | | (36) | | | (36) | |
| Net income | — | | | — | | | — | | | 25,763 | | | — | | | 25,763 | |
| Balance at June 30, 2023 | 46,409 | | | $ | 46 | | | $ | 950,626 | | | $ | (142,524) | | | $ | (173) | | | $ | 807,975 | |
| | | Common Stock | | Additional
Paid-In
Capital | | Accumulated
Deficit | | Accumulated Other Comprehensive (Loss) Income | | |
| | Shares | | Amount | | Total | | Common Stock | | Additional
Paid-In
Capital | | Accumulated
Deficit | | Accumulated Other Comprehensive Loss | |
| Balance at March 31, 2021 | 43,958 | | | $ | 44 | | | $ | 894,108 | | | $ | (243,506) | | | $ | 172 | | | $ | 650,818 | | |
| | | Shares | | Amount | | Additional
Paid-In
Capital | | Accumulated
Deficit | | Accumulated Other Comprehensive Loss | | Total |
| Balance at March 31, 2022 | | Balance at March 31, 2022 | 45,064 | | | $ | 45 | | | $ | 709,576 | |
| | Exercise of stock options | Exercise of stock options | 162 | | | — | | | 5,225 | | | — | | | — | | | 5,225 | | Exercise of stock options | 307 | | | 1 | | | 10,856 | | | — | | | — | | | 10,857 | |
| Vested restricted stock units | Vested restricted stock units | 286 | | | — | | | — | | | — | | | — | | | — | | Vested restricted stock units | 292 | | | — | | | — | | | — | | | — | | | — | |
Common stock issued under employee stock
purchase plan | Common stock issued under employee stock
purchase plan | 31 | | | — | | | 1,574 | | | — | | | — | | | 1,574 | | Common stock issued under employee stock
purchase plan | 37 | | | — | | | 1,821 | | | — | | | — | | | 1,821 | |
| Stock-based compensation | Stock-based compensation | — | | | — | | | 10,461 | | | — | | | — | | | 10,461 | | Stock-based compensation | — | | | — | | | 11,544 | | | — | | | — | | | 11,544 | |
| Issuance of common stock upon conversion of 2022 convertible senior notes | | Issuance of common stock upon conversion of 2022 convertible senior notes | 102 | | | — | | | 3,040 | | | — | | | — | | | 3,040 | |
| | Other comprehensive income (Note 11) | — | | | — | | | — | | | — | | | 9 | | | 9 | | |
| Other comprehensive loss (Note 10) | | Other comprehensive loss (Note 10) | — | | | — | | | — | | | — | | | (78) | | | (78) | |
| Net income | Net income | — | | | — | | | — | | | 19,081 | | | — | | | 19,081 | | Net income | — | | | — | | | — | | | 19,876 | | | — | | | 19,876 | |
| Balance at June 30, 2021 | 44,437 | | | $ | 44 | | | $ | 911,368 | | | $ | (224,425) | | | $ | 181 | | | $ | 687,168 | | |
| Balance at June 30, 2022 | | Balance at June 30, 2022 | 45,802 | | | $ | 46 | | | $ | 895,151 | | | $ | (137,956) | | | $ | (605) | | | $ | 756,636 | |
See accompanying notes to condensed consolidated financial statements.
Pacira BioSciences, Inc. | Q2 20222023 Form 10-Q | Page 7
PACIRA BIOSCIENCES, INC.
CONDENSED CONSOLIDATED STATEMENTS OF STOCKHOLDERS’ EQUITY
FOR THE SIX MONTHS ENDED JUNE 30, 20222023 AND 20212022
(In thousands)
(Unaudited)
| | | | Common Stock | | Additional
Paid-In
Capital | | Accumulated
Deficit | | Accumulated Other Comprehensive (Loss) Income | | | | Common Stock | | Additional
Paid-In
Capital | | Accumulated
Deficit | | Accumulated Other Comprehensive Loss | | |
| | | Shares | | Amount | | Total | | Shares | | Amount | | Total |
| Balance at December 31, 2021 | 44,734 | | | $ | 45 | | | $ | 942,091 | | | $ | (211,895) | | | $ | 167 | | | $ | 730,408 | | |
| Reclassification of the equity component of convertible senior notes to liabilities upon adoption of Accounting Standards Update 2020-06 (Note 2) | — | | | — | | | (96,468) | | | 47,235 | | | — | | | (49,233) | | |
| Balance at December 31, 2022 | | Balance at December 31, 2022 | 45,928 | | | $ | 46 | | | $ | 924,095 | | | $ | (148,751) | | | $ | (380) | | | $ | 775,010 | |
| | | Exercise of stock options | Exercise of stock options | 630 | | | 1 | | | 21,934 | | | — | | | — | | | 21,935 | | Exercise of stock options | 62 | | | — | | | 1,914 | | | — | | | — | | | 1,914 | |
| Vested restricted stock units | Vested restricted stock units | 299 | | | — | | | — | | | — | | | — | | | — | | Vested restricted stock units | 369 | | | — | | | — | | | — | | | — | | | — | |
Common stock issued under employee stock
purchase plan | Common stock issued under employee stock
purchase plan | 37 | | | — | | | 1,821 | | | — | | | — | | | 1,821 | | Common stock issued under employee stock
purchase plan | 50 | | | — | | | 1,672 | | | — | | | — | | | 1,672 | |
| Stock-based compensation | Stock-based compensation | — | | | — | | | 22,733 | | | — | | | — | | | 22,733 | | Stock-based compensation | — | | | — | | | 22,945 | | | — | | | — | | | 22,945 | |
| Issuance of common stock upon conversion of 2022 convertible senior notes (Note 9) | 102 | | | — | | | 3,040 | | | — | | | — | | | 3,040 | | |
| | Other comprehensive loss (Note 11) | — | | | — | | | — | | | — | | | (772) | | | (772) | | |
| Other comprehensive income (Note 10) | | Other comprehensive income (Note 10) | — | | | — | | | — | | | — | | | 207 | | | 207 | |
| Net income | Net income | — | | | — | | | — | | | 26,704 | | | — | | | 26,704 | | Net income | — | | | — | | | — | | | 6,227 | | | — | | | 6,227 | |
| Balance at June 30, 2022 | 45,802 | | | $ | 46 | | | $ | 895,151 | | | $ | (137,956) | | | $ | (605) | | | $ | 756,636 | | |
| Balance at June 30, 2023 | | Balance at June 30, 2023 | 46,409 | | | $ | 46 | | | $ | 950,626 | | | $ | (142,524) | | | $ | (173) | | | $ | 807,975 | |
| | | | | | | | | | | | | | | | | | | | | | | | | | | | | | | | | | | |
| Common Stock | | Additional
Paid-In
Capital | | Accumulated
Deficit | | Accumulated Other Comprehensive (Loss) Income | | |
| Shares | | Amount | | | | | Total |
| Balance at December 31, 2021 | 44,734 | | | $ | 45 | | | $ | 942,091 | | | $ | (211,895) | | | $ | 167 | | | $ | 730,408 | |
| | | | | | | | | | | |
| | | | | | | | | | | |
Reclassification of the equity component of convertible senior notes to liabilities upon adoption of Accounting Standards Update 2020-06 (1) | — | | | — | | | (96,468) | | | 47,235 | | | — | | | (49,233) | |
| Exercise of stock options | 630 | | | 1 | | | 21,934 | | | — | | | — | | | 21,935 | |
| Vested restricted stock units | 299 | | | — | | | — | | | — | | | — | | | — | |
Common stock issued under employee stock
purchase plan | 37 | | | — | | | 1,821 | | | — | | | — | | | 1,821 | |
| Stock-based compensation | — | | | — | | | 22,733 | | | — | | | — | | | 22,733 | |
| Issuance of common stock upon conversion of 2022 convertible senior notes | 102 | | | — | | | 3,040 | | | — | | | — | | | 3,040 | |
| | | | | | | | | | | |
| Other comprehensive loss (Note 10) | — | | | — | | | — | | | — | | | (772) | | | (772) | |
| Net income | — | | | — | | | — | | | 26,704 | | | — | | | 26,704 | |
| Balance at June 30, 2022 | 45,802 | | | $ | 46 | | | $ | 895,151 | | | $ | (137,956) | | | $ | (605) | | | $ | 756,636 | |
| | | | | | | | | | | | | | | | | | | | | | | | | | | | | | | | | | | |
| Common Stock | | Additional
Paid-In
Capital | | Accumulated
Deficit | | Accumulated Other Comprehensive (Loss) Income | | |
| Shares | | Amount | | | | | Total |
| Balance at December 31, 2020 | 43,637 | | | $ | 44 | | | $ | 873,201 | | | $ | (253,875) | | | $ | 318 | | | $ | 619,688 | |
| | | | | | | | | | | |
| | | | | | | | | | | |
| Exercise of stock options | 479 | | | — | | | 16,022 | | | — | | | — | | | 16,022 | |
| Vested restricted stock units | 290 | | | — | | | — | | | — | | | — | | | — | |
Common stock issued under employee stock
purchase plan | 31 | | | — | | | 1,574 | | | — | | | — | | | 1,574 | |
| Stock-based compensation | — | | | — | | | 20,571 | | | — | | | — | | | 20,571 | |
| | | | | | | | | | | |
| | | | | | | | | | | |
| | | | | | | | | | | |
| Other comprehensive loss (Note 11) | — | | | — | | | — | | | — | | | (137) | | | (137) | |
| Net income | — | | | — | | | — | | | 29,450 | | | — | | | 29,450 | |
| Balance at June 30, 2021 | 44,437 | | | $ | 44 | | | $ | 911,368 | | | $ | (224,425) | | | $ | 181 | | | $ | 687,168 | |
See accompanying notes to condensed consolidated financial statements.
Pacira BioSciences, Inc. | Q2 20222023 Form 10-Q | Page 8
PACIRA BIOSCIENCES, INC.
CONDENSED CONSOLIDATED STATEMENTS OF CASH FLOWS
(In thousands)
(Unaudited) | | | Six Months Ended
June 30, | | Six Months Ended
June 30, |
| | | 2022 | | 2021 | | 2023 | | 2022 |
| Operating activities: | Operating activities: | | | | Operating activities: | | | |
| Net income | Net income | $ | 26,704 | | | $ | 29,450 | | Net income | $ | 6,227 | | | $ | 26,704 | |
| Adjustments to reconcile net income to net cash provided by operating activities: | Adjustments to reconcile net income to net cash provided by operating activities: | | | | Adjustments to reconcile net income to net cash provided by operating activities: | | | |
| Deferred taxes | Deferred taxes | 2,193 | | | 7,613 | | Deferred taxes | 4,100 | | | 2,193 | |
| Depreciation of fixed assets and amortization of intangible assets | Depreciation of fixed assets and amortization of intangible assets | 40,897 | | | 9,748 | | Depreciation of fixed assets and amortization of intangible assets | 38,656 | | | 40,897 | |
| Amortization of debt issuance costs | Amortization of debt issuance costs | 2,053 | | | 1,310 | | Amortization of debt issuance costs | 1,628 | | | 2,053 | |
| Amortization of debt discount | Amortization of debt discount | 1,412 | | | 11,401 | | Amortization of debt discount | 703 | | | 1,412 | |
| | Loss (gain) on disposal of fixed assets | 193 | | | (10) | | |
| Loss on early extinguishment of debt | | Loss on early extinguishment of debt | 16,926 | | | — | |
| Loss on disposal of fixed assets | | Loss on disposal of fixed assets | — | | | 193 | |
| Stock-based compensation | Stock-based compensation | 22,733 | | | 20,571 | | Stock-based compensation | 22,945 | | | 22,733 | |
| Changes in contingent consideration | Changes in contingent consideration | (22,351) | | | (988) | | Changes in contingent consideration | (6,640) | | | (22,351) | |
| | Loss on investment | Loss on investment | 108 | | | 2,601 | | Loss on investment | 11 | | | 108 | |
| Changes in operating assets and liabilities: | Changes in operating assets and liabilities: | | | | Changes in operating assets and liabilities: | | | |
| Accounts receivable, net | Accounts receivable, net | 5,213 | | | (15,312) | | Accounts receivable, net | (683) | | | 5,213 | |
| Inventories, net | Inventories, net | (2,038) | | | (615) | | Inventories, net | 3,933 | | | (2,038) | |
| Prepaid expenses and other assets | Prepaid expenses and other assets | (3,233) | | | (944) | | Prepaid expenses and other assets | (4,369) | | | (3,233) | |
| Accounts payable | Accounts payable | 5,258 | | | 2,156 | | Accounts payable | 9,683 | | | 5,258 | |
| Accrued expenses and income taxes payable | Accrued expenses and income taxes payable | (19,038) | | | (18,140) | | Accrued expenses and income taxes payable | (30,771) | | | (19,038) | |
| Other liabilities | Other liabilities | 479 | | | (964) | | Other liabilities | 278 | | | 479 | |
| Payment of contingent consideration | — | | | (5,662) | | |
| | Net cash provided by operating activities | Net cash provided by operating activities | 60,583 | | | 42,215 | | Net cash provided by operating activities | 62,627 | | | 60,583 | |
| Investing activities: | Investing activities: | | | | Investing activities: | | | |
| | Purchases of fixed assets | Purchases of fixed assets | (19,403) | | | (23,624) | | Purchases of fixed assets | (9,969) | | | (19,403) | |
| Purchases of available-for-sale investments | Purchases of available-for-sale investments | (187,641) | | | (318,132) | | Purchases of available-for-sale investments | (69,509) | | | (187,641) | |
| Sales of available-for-sale investments | Sales of available-for-sale investments | 62,936 | | | 294,288 | | Sales of available-for-sale investments | 159,745 | | | 62,936 | |
| Payment of contingent consideration | Payment of contingent consideration | (32,000) | | | — | | Payment of contingent consideration | — | | | (32,000) | |
| Purchases of equity and debt investments | Purchases of equity and debt investments | (12,750) | | | (14,220) | | Purchases of equity and debt investments | (6,758) | | | (12,750) | |
| Sale of equity investment | — | | | 9,057 | | |
| | Net cash used in investing activities | (188,858) | | | (52,631) | | |
| | Net cash provided by (used in) investing activities | | Net cash provided by (used in) investing activities | 73,509 | | | (188,858) | |
| Financing activities: | Financing activities: | | | | Financing activities: | | | |
| Proceeds from exercises of stock options | Proceeds from exercises of stock options | 21,881 | | | 15,997 | | Proceeds from exercises of stock options | 1,913 | | | 21,881 | |
| Proceeds from shares issued under employee stock purchase plan | Proceeds from shares issued under employee stock purchase plan | 1,821 | | | 1,574 | | Proceeds from shares issued under employee stock purchase plan | 1,673 | | | 1,821 | |
| | Proceeds from Term loan A facility | | Proceeds from Term loan A facility | 149,550 | | | — |
| Repayment of 2022 convertible senior notes | Repayment of 2022 convertible senior notes | (156,960) | | | — | | Repayment of 2022 convertible senior notes | — | | | (156,960) | |
| Repayment of 2024 convertible senior notes | Repayment of 2024 convertible senior notes | (192,609) | | | — | | Repayment of 2024 convertible senior notes | — | | | (192,609) | |
| Repayment of Term loan B facility maturing December 2026 | (9,375) | | | — | | |
| Repayment of Term loan B facility | | Repayment of Term loan B facility | (296,875) | | | (9,375) | |
| Repayment of Term loan A facility | | Repayment of Term loan A facility | (2,813) | | | — | |
| | Debt extinguishment costs | | Debt extinguishment costs | (5,750) | | | — | |
| Payment of debt issuance and financing costs | | Payment of debt issuance and financing costs | (1,163) | | | — | |
| | Payment of contingent consideration to MyoScience, Inc. securityholders | — | | | (1,338) | | |
| Net cash (used in) provided by financing activities | (335,242) | | | 16,233 | | |
| Net (decrease) increase in cash and cash equivalents | (463,517) | | | 5,817 | | |
| Net cash used in financing activities | | Net cash used in financing activities | (153,465) | | | (335,242) | |
| Net decrease in cash and cash equivalents | | Net decrease in cash and cash equivalents | (17,329) | | | (463,517) | |
| Cash and cash equivalents, beginning of period | Cash and cash equivalents, beginning of period | 585,578 | | | 99,957 | | Cash and cash equivalents, beginning of period | 104,139 | | | 585,578 | |
| Cash and cash equivalents, end of period | Cash and cash equivalents, end of period | $ | 122,061 | | | $ | 105,774 | | Cash and cash equivalents, end of period | $ | 86,810 | | | $ | 122,061 | |
| | | | | | Supplemental cash flow information: | Supplemental cash flow information: | | | | Supplemental cash flow information: | | | |
| Cash paid for interest | Cash paid for interest | $ | 14,686 | | | $ | 3,586 | | Cash paid for interest | $ | 20,802 | | | $ | 14,686 | |
| Cash paid for income taxes, net of refunds | Cash paid for income taxes, net of refunds | $ | 4,104 | | | $ | 1,447 | | Cash paid for income taxes, net of refunds | $ | 795 | | | $ | 4,104 | |
| Non-cash investing and financing activities: | Non-cash investing and financing activities: | | | | Non-cash investing and financing activities: | | | |
| Issuance of common stock from conversion of 2022 convertible senior notes | Issuance of common stock from conversion of 2022 convertible senior notes | $ | 3,040 | | | $ | — | | Issuance of common stock from conversion of 2022 convertible senior notes | $ | — | | | $ | 3,040 | |
| | Fixed assets included in accounts payable and accrued liabilities | Fixed assets included in accounts payable and accrued liabilities | $ | 2,454 | | | $ | 8,096 | | Fixed assets included in accounts payable and accrued liabilities | $ | 2,388 | | | $ | 2,454 | |
| |
See accompanying notes to condensed consolidated financial statements.
Pacira BioSciences, Inc. | Q2 20222023 Form 10-Q | Page 9
PACIRA BIOSCIENCES, INC.
NOTES TO CONDENSED CONSOLIDATED FINANCIAL STATEMENTS
(Unaudited)
NOTE 1—DESCRIPTION OF BUSINESS
Pacira BioSciences, Inc. and its subsidiaries (collectively, the “Company” or “Pacira”) is the industry leader in its commitment to non-opioid pain management and providing a non-opioid optionpain management options to as many patients as possible to redefine the role of opioids as rescue therapy only. The companyCompany is also developing innovative interventions to address debilitating conditions involving the sympathetic nervous system, such as cardiac electrical storm, chronic pain and spasticity. The Company’s long-acting, local analgesic, EXPAREL® (bupivacaine liposome injectable suspension), was commercially launched in the United States, or U.S., in April 2012 and approved in select European countries and the United Kingdom, or U.K., in November 2021. EXPAREL utilizes the Company’s proprietary multivesicular liposome (pMVL) drug delivery technology that encapsulates drugs without altering their molecular structure, and releases them over a desired period of time. In November 2021, the Company acquired Flexion Therapeutics, Inc., or Flexion (the “Flexion Acquisition”), and added ZILRETTA® (triamcinolone acetonide extended-release injectable suspension) to its product portfolio. ZILRETTA is the first and only extended-release, intra-articular (meaning in the joint) injection indicated for the management of osteoarthritis, or OA, knee pain. For more information, see Note 4, Flexion Acquisition. In April 2019, the Company added iovera°® to its commercial offering with the acquisition of MyoScience, Inc., or MyoScience (the “MyoScience Acquisition”). The iovera° system is a handheld cryoanalgesia device used to deliver a precise, controlled application of cold temperature to only targeted nerves.
Pacira is subject to risks common to companies in similar industries and stages, including, but not limited to, competition from larger companies, reliance on revenue from 3three products, reliance on a limited number of wholesalers, reliance on a limited number of manufacturing sites, new technological innovations, dependence on key personnel, reliance on third-party service providers and sole source suppliers, protection of proprietary technology, compliance with government regulations and risks related to cybersecurity.
The Company is managed and operated as a single business focused on the development, manufacture, marketing, distribution and sale of non-opioid pain management and regenerative health solutions. The Company is managed by a single management team, and, consistent with its organizational structure, the Chief Executive Officer and Chairman Officer—who is the Company’s chief operating decision maker—manages and allocates resources at a consolidated level. Accordingly, the Company views its business as 1one reportable operating segment to evaluate its performance, allocate resources, set operational targets and forecast its future financial results.
Coronavirus (COVID-19) Pandemic and Global Economic Conditions
Since early 2020, the Company’s revenues have been impacted by COVID-19 pandemic-related challenges that included the significant postponement or suspension in the scheduling of elective surgical procedures due to public health guidance and government directives. While the degree of impact has diminished during the course of the pandemic due to the introduction of vaccines and therapeutics, as well as the lessening of elective surgery restrictions, certain pandemic-related operational and staffing challenges persist. It remains unclear how long it will take the elective surgery market to normalize or if restrictions on elective procedures will recur due to future COVID-19 variants or otherwise. Direct effects of the pandemic and global economic conditions may negatively impact the Company’s business, financial condition and results of operations. Such impacts may include the effect of prolonged periods of inflation on the Company’s customers and suppliers and longer lead-times or the inability to secure a sufficient supply of materials. The situation remains dynamic and subject to rapid and possibly material changes. Additional negative impacts may also arise that the Company is unable to foresee. The nature and extent of such impacts will depend on future developments, which are highly uncertain and cannot be predicted.
NOTE 2—SUMMARY OF SIGNIFICANT ACCOUNTING POLICIES
Basis of Presentation and Principles of Consolidation
These interim condensed consolidated financial statements have been prepared in accordance with generally accepted accounting principles in the United States of America, or GAAP, and in accordance with the rules and regulations of the United States Securities and Exchange Commission (SEC), for interim reporting. Pursuant to these rules and regulations, certain information and footnote disclosures normally included in complete annual financial statements have been condensed or omitted. Therefore, these interim condensed consolidated financial statements should be read in conjunction with the audited annual consolidated financial statements and notes thereto included in the Company’s Annual Report on Form 10-K for the year ended December 31, 20212022 (the “2022 Annual Report”). The condensed consolidated financial statements at June 30, 2022,2023, and for the three and six-month periods ended June 30, 20222023 and 2021,2022, are unaudited, but include all adjustments (consisting of only normal recurring adjustments) which, in the
Pacira BioSciences, Inc. | Q2 2022 Form 10-Q | Page 10
opinion of management, are necessary to present fairly the financial information set forth herein in accordance with GAAP. The condensed consolidated balance sheet at December 31, 20212022 is derived from the audited consolidated financial statements included in the Company’s 2022 Annual Report on Form 10-K for the year ended December 31, 2021.Report. The condensed consolidated financial statements as presented reflect certain reclassifications from previously issued financial statements to conform to the current year presentation. The accounts of wholly-owned subsidiaries are included in the condensed consolidated financial statements. Intercompany accounts and transactions have been eliminated in consolidation.
The results of operations for these interim periods are not necessarily indicative of results that may be expected for any other interim periods or for the full year.
Pacira BioSciences, Inc. | Q2 2023 Form 10-Q | Page 10
Concentration of Major Customers
The Company sells EXPAREL through a drop-ship program under which orders are processed through wholesalers (including AmerisourceBergen Health Corporation, Cardinal Health, Inc. and McKesson Drug Company), but shipments of the product are sent directly to individual accounts, such as hospitals, ambulatory surgery centers and individual doctors. The Company also sells EXPAREL directly to ambulatory surgery centers and physicians. The Company sells ZILRETTA primarily to specialty distributors and a specialty pharmacy, who then subsequently resell ZILRETTA to physicians, clinics and certain medical centers or hospitals. The Company also contracts directly with healthcare providers and intermediaries such as Group Purchasing Organizations, or GPOs. The Company sells iovera° directly to end users and its bupivacaine liposome injectable suspension for veterinary use to a third-party licensee in the U.S. and sells iovera° directly to end users.
The table below includes the percentage of revenues comprised by the Company’s 3three largest wholesalers in each period presented:
| | | Three Months Ended
June 30, | | Six Months Ended
June 30, | | Three Months Ended
June 30, | | Six Months Ended
June 30, |
| | 2022 | | 2021 | | 2022 | | 2021 | | 2023 | | 2022 | | 2023 | | 2022 |
| Largest wholesaler | Largest wholesaler | 32% | | 31% | | 31% | | 31% | Largest wholesaler | 33% | | 32% | | 32% | | 31% |
| Second largest wholesaler | Second largest wholesaler | 23% | | 29% | | 23% | | 29% | Second largest wholesaler | 24% | | 23% | | 24% | | 23% |
| Third largest wholesaler | Third largest wholesaler | 22% | | 26% | | 22% | | 26% | Third largest wholesaler | 20% | | 22% | | 21% | | 22% |
| Total | Total | 77% | | 86% | | 76% | | 86% | Total | 77% | | 77% | | 77% | | 76% |
The percentage of revenues from the Company’s 3 largest wholesalers have shifted in the current year with the addition of ZILRETTA sales.
Recently Adopted Accounting Pronouncements
In August 2020, the Financial Accounting Standards Board, or FASB, issued Accounting Standards Update, or ASU, 2020-06, Debt—Debt with Conversion and Other Options (Subtopic 470-20) and Derivatives and Hedging—Contracts in Entity’s Own Equity (Subtopic 815-40), which limits the number of convertible instruments that require separate accounting to (i) those with embedded conversion features that are not clearly and closely related to the debt, that meet the definition of a derivative and that do not qualify for the scope exception from derivative accounting and (ii) convertible debt instruments issued with substantial premiums for which the premiums were recorded as paid in capital. In addition, the new guidance requires diluted earnings per share calculations be prepared using the if-converted method instead of the treasury stock method. The Company elected to adopt the new guidance using a modified retrospective method of transition, which applied to transactions outstanding at January 1, 2022. As a result, the Company does not separately present in equity an embedded conversion feature for its convertible debt. Instead, the Company accounts for its convertible debt instruments wholly as debt. In addition, effective on January 1, 2022, the Company did not record interest expense on the previously recorded discount on its convertible debt. The impact on the condensed consolidated balance sheet at January 1, 2022 increased net debt by approximately $64.9 million, reduced accumulated deficit by $47.2 million, reduced additional paid-in capital by $96.5 million and decreased deferred tax liabilities by $15.7 million.
Pacira BioSciences, Inc. | Q2 2022 Form 10-Q | Page 11
NOTE 3—REVENUE
Revenue from Contracts with Customers
The Company’s net product sales consist of (i) EXPAREL in the U.S., the European Union, or E.U., and the U.K.; (ii) ZILRETTA in the U.S.; (iii) iovera° in the U.S., Canada and the E.U. and (iv) sales of and royalties on, its bupivacaine liposome injectable suspension primarily for veterinary use. Royalty revenues are related to a collaborative licensing agreement from the Company’s collaborative licensing agreements.sale of its bupivacaine liposome injectable suspension primarily for veterinary use. The Company does not consider revenue from sources other than sales of EXPAREL and ZILRETTA to be material sources of its consolidated revenue. As such, the following disclosure only relatesis limited to revenue associated with net product sales of EXPAREL and ZILRETTA product sales.ZILRETTA.
Net Product Sales
The Company sells EXPAREL through a drop-ship program under which orders are processed through wholesalers based on orders of the product placed by end-users, namely hospitals, ambulatory surgery centers and healthcare provider offices. EXPAREL is delivered directly to the end-user without the wholesaler ever taking physical possession of the product. The Company primarily sells ZILRETTA to specialty distributors and a specialty pharmacy, who then subsequently resell ZILRETTA to physicians, clinics and certain medical centers or hospitals. The Company also contracts directly with healthcare providers and intermediaries such as GPOs. Product revenue is recognized when control of the promised goods are transferred to the customers, in an amount that reflects the consideration the Company expects to be entitled to in exchange for transferring those goods. EXPAREL and ZILRETTA revenue isrevenues are recorded at the time the product isproducts are transferred to the customer.
Revenues from sales of products are recorded net of returns allowances, prompt payment discounts, service fees, government rebates, volume rebates and chargebacks. These reserves are based on estimates of the amounts earned or to be claimed on the related sales. These amounts are treated as variable consideration, estimated and recognized as a reduction of the transaction price at the time of the sale, using the most likely amount method, except for returns, which is based on the expected value method. The Company includes these estimated amounts in the transaction price to the extent it is probable that a significant reversal of cumulative revenue recognized for such transaction will not occur, or when the uncertainty associated with the variable consideration is resolved.
Chargebacks for fees and discounts to qualified government healthcare providers represent the estimated obligations resulting from contractual commitments to sell products to qualified Department of Veteran Affairs hospitals and 340B entities at prices lower than the list prices charged to other customers. The 340B Drug Discount Program is a U.S. federal government program that requires participating drug manufacturers to provide outpatient drugs to eligible health care organizations and covered entities at reduced prices. Customers charge the Company for the difference between the product payment and the statutory selling price to the qualified entity. Reserves are established in the same period that the related revenue is recognized, resulting in a reduction of product revenue and trade receivables, net. Chargeback amounts are generally determined at the time of sale to the qualified government healthcare provider by customers, and the Company generally issues credits for such
Pacira BioSciences, Inc. | Q2 2023 Form 10-Q | Page 11
amounts within weeks of the customer’s notification to the Company of the sale. Reserves for chargebacks consist of credits that the Company expects to issue for units that the Company expects will be sold to qualified healthcare providers, and chargebacks that customers have claimed, but for which the Company has not yet issued a credit.
The calculation offor some of these items requires management to make estimates based on sales data, historical return data, contracts, statutory requirements and other related information that may become known in the future. The adequacy of these provisions is reviewed on a quarterly basis.
Accounts Receivable
The majority of accounts receivable arise from product sales and represent amounts due from wholesalers, hospitals, ambulatory surgery centers, specialty distributors, a specialty pharmacy GPOs and doctors.individual physicians. Payment terms generally range from zero to 97 daysfour months from the date of the transaction, and accordingly, there is no significant financing component.
Performance Obligations
A performance obligation is a promise in a contract to transfer a distinct good or service to the customer and is the unit of account in Accounting Standards Codification, or ASC, 606. A contract’s transaction price is allocated to each distinct performance obligation and recognized as revenue when, or as, the performance obligation is satisfied.
At contract inception, the Company assesses the goods promised in its contracts with customers and identifies a performance obligation for each promise to transfer to the customer a good that is distinct. When identifying individual performance obligations, the Company considers all goods promised in the contract regardless of whether explicitly stated in the customer contract or implied by customary business practices. The Company’s contracts with customers require it to transfer an individual distinct product, which represents a single performance obligation. The Company’s performance obligation with respect to its product sales is satisfied at a point in time, which transfers control upon delivery of EXPAREL and ZILRETTA to its customers. The Company considers control to have transferred upon delivery because the customer has legal title to the asset, physical possession of the asset has been transferred, the customer has significant risks and rewards of ownership of the asset and the Company has a present right to payment at that time.
Pacira BioSciences, Inc. | Q2 2022 Form 10-Q | Page 12
Disaggregated Revenue
The following table represents disaggregated net product sales in the periods presented as follows (in thousands): | | | | | | | | | | | | | | | | | | | | | | | | | | |
| | Three Months Ended
June 30, | | Six Months Ended
June 30, |
| | 2022 | | 2021 | | 2022 | | 2021 |
| Net product sales: | | | | | | | | |
| EXPAREL | | $ | 137,007 | | | $ | 130,058 | | | $ | 266,212 | | | $ | 244,736 | |
| ZILRETTA | | 27,417 | | | — | | | 51,052 | | | — | |
| iovera° | | 3,201 | | | 3,813 | | | 6,227 | | | 7,081 | |
| Bupivacaine liposome injectable suspension | | 956 | | | 992 | | | 2,512 | | | 1,784 | |
| Total net product sales | | $ | 168,581 | | | $ | 134,863 | | | $ | 326,003 | | | $ | 253,601 | |
| | | | | | | | | | | | | | | | | | | | | | | |
| Three Months Ended
June 30, | | Six Months Ended
June 30, |
| 2023 | | 2022 | | 2023 | | 2022 |
| Net product sales: | | | | | | | |
| EXPAREL | $ | 135,127 | | | $ | 137,007 | | | $ | 265,535 | | | $ | 266,212 | |
| ZILRETTA | 29,261 | | | 27,417 | | | 53,595 | | | 51,052 | |
| iovera° | 4,384 | | | 3,201 | | | 8,385 | | | 6,227 | |
| Bupivacaine liposome injectable suspension | 695 | | | 956 | | | 1,383 | | | 2,512 | |
| Total net product sales | $ | 169,467 | | | $ | 168,581 | | | $ | 328,898 | | | $ | 326,003 | |
NOTE 4—FLEXION ACQUISITION
On November 19, 2021, the Company acquired Flexion (the “Flexion Acquisition”), a biopharmaceutical company focused on the discovery, development, and commercialization of novel, local therapies for the treatment of patients with musculoskeletal conditions, beginning with osteoarthritis, the most common form of arthritis. Upon consummation of the Flexion Acquisition, Flexion became a wholly-owned subsidiary of the Company and was renamed Pacira Therapeutics, Inc.
The total consideration for the Flexion Acquisition was approximately $578.8 million consisting of: (i) $448.5 million of cash paid to former Flexion stockholders and to settle restricted stock units and in-the-money stock options; (ii) an $85.1 million cash payment to repay Flexion debt that was not assumed by the Company and (iii) $45.2 million of estimated contingent consideration related to contingent value rights, or CVRs, that were issued to Flexion shareholders and certain equity award holders in conjunction with the Flexion Acquisition. The consideration is subject to adjustments based on the achievement of certain potential milestone payments. Up to an additional $380.2 million in the aggregate may be payable to holders of the CVRs if each of the applicable milestones are achieved. No contingent consideration milestones were achieved in the six months ended June 30, 2022. See Note 10, Financial Instruments, for information regarding the methodology and key assumptions used in the fair value measurements of contingent consideration and for more information regarding the changes in fair value.
Pacira BioSciences, Inc. | Q2 2022 Form 10-Q | Page 13
The Company is finalizing its valuation of liabilities and tax analyses, and anticipates finalizing the purchase price allocation as the information necessary to complete the analysis is obtained, but no later than one year after the acquisition date. The following table sets forth the preliminary allocation of the Flexion Acquisition purchase price to the estimated fair value of the net assets acquired at the acquisition date (in thousands): | | | | | | | | | | | | | | | | | | | | |
| | Amounts Recognized at the Acquisition Date (as previously reported) (a) | | Measurement Period Adjustments (b) | | Amounts Recognized at the Acquisition Date
(as adjusted) |
| ASSETS ACQUIRED | | | | | | |
| Cash and cash equivalents | | $ | 113,562 | | | $ | — | | | $ | 113,562 | |
| Short-term available-for-sale investments | | 11,153 | | | — | | | 11,153 | |
| Accounts receivable | | 32,838 | | | — | | | 32,838 | |
| Inventories | | 29,667 | | | — | | | 29,667 | |
| Prepaid expenses and other assets | | 4,852 | | | — | | | 4,852 | |
| Fixed assets | | 23,307 | | | — | | | 23,307 | |
| Deferred tax assets | | 58,015 | | | — | | | 58,015 | |
| Right-of-use assets | | 6,585 | | | — | | | 6,585 | |
| Identifiable intangible assets | | 480,000 | | | — | | | 480,000 | |
| In-process research and development (IPR&D) | | 61,000 | | | — | | | 61,000 | |
| Total assets | | $ | 820,979 | | | $ | — | | | $ | 820,979 | |
| LIABILITIES ASSUMED | | | | | | |
| Accounts payable | | $ | 9,794 | | | $ | — | | | $ | 9,794 | |
| Accrued expenses | | 22,746 | | | 957 | | | 23,703 | |
| Deferred revenue | | 10,000 | | | — | | | 10,000 | |
| Lease liabilities | | 6,585 | | | — | | | 6,585 | |
| Other liabilities | | 1,187 | | | — | | | 1,187 | |
| Long-term debt | | 201,450 | | | — | | | 201,450 | |
| Total liabilities | | 251,762 | | | 957 | | | 252,719 | |
| Total identifiable net assets acquired | | 569,217 | | | (957) | | | 568,260 | |
| Goodwill | | 9,628 | | | 957 | | | 10,585 | |
| Total consideration transferred | | $ | 578,845 | | | $ | — | | | $ | 578,845 | |
(a) As previously reported in the Company’s Annual Report on Form 10-K for the year ended December 31, 2021.
(b) Represents pre-acquisition expenses that were paid by the Company in 2022, partially offset by the release of estimated reserves.
Unaudited Pro Forma Summary of Operations
The following table shows the unaudited pro forma summary of operations for the three and six-month periods ended June 30, 2021, as if the Flexion Acquisition had occurred on January 1, 2020. This pro forma information does not purport to represent what the Company’s actual results would have been if the Flexion Acquisition had occurred as of January 1, 2020, and is not indicative of what such results would be expected for any future period (in thousands, except per share amounts): | | | | | | | | | | | |
| Three Months Ended
June 30, 2021 | | Six Months Ended
June 30, 2021 |
| Total revenues | $ | 163,765 | | | $ | 307,381 | |
| Net loss | $ | (3,367) | | | $ | (20,487) | |
| Pro forma basic and diluted net loss per share | $ | (0.08) | | | $ | (0.47) | |
The unaudited pro forma financial information was prepared using the acquisition method of accounting and was based on the historical financial information of the Company and Flexion. The summary pro forma financial information primarily reflects the following pro forma adjustments:
•Recognition of the income tax benefit resulting from decreasing Flexion’s existing valuation allowance on deferred tax assets for the three and six months ended June 30, 2021;
Pacira BioSciences, Inc. | Q2 2022 Form 10-Q | Page 14
•Removal of Flexion’s interest expense and associated deferred financing cost amortization related to the $85.1 million of debt not assumed;
•Adjustments to the Company’s interest income for the cash used to acquire Flexion;
•Additional cost of goods sold related to a step-up value in inventory;
•Additional amortization expense from the acquired developed technology intangible assets;
•Additional depreciation of Flexion’s fixed assets; and
•Additional lease expense on Flexion’s right-of-use, or ROU, assets.
In addition, all of the above adjustments were adjusted for the applicable tax impact.
NOTE 5—INVENTORIES
The components of inventories, net are as follows (in thousands):
| | | June 30, | | December 31, | | June 30, | | December 31, |
| | 2022 | | 2021 | | 2023 | | 2022 |
| Raw materials | Raw materials | $ | 36,301 | | | $ | 36,337 | | Raw materials | $ | 46,489 | | | $ | 39,810 | |
| Work-in-process | Work-in-process | 39,407 | | | 35,182 | | Work-in-process | 27,696 | | | 28,853 | |
| Finished goods | Finished goods | 24,880 | | | 27,031 | | Finished goods | 17,945 | | | 27,400 | |
| Total | Total | $ | 100,588 | | | $ | 98,550 | | Total | $ | 92,130 | | | $ | 96,063 | |
Pacira BioSciences, Inc. | Q2 2023 Form 10-Q | Page 12
NOTE 6—5—FIXED ASSETS
Fixed assets, net, summarized by major category, consist of the following (in thousands):
| | | June 30, | | December 31, | | June 30, | | December 31, |
| | 2022 | | 2021 | | 2023 | | 2022 |
| Machinery and equipment | Machinery and equipment | $ | 116,364 | | | $ | 117,264 | | Machinery and equipment | $ | 120,750 | | | $ | 118,684 | |
| Leasehold improvements | Leasehold improvements | 60,155 | | | 59,740 | | Leasehold improvements | 62,060 | | | 61,302 | |
| Computer equipment and software | Computer equipment and software | 13,598 | | | 13,197 | | Computer equipment and software | 16,216 | | | 15,360 | |
| Office furniture and equipment | Office furniture and equipment | 2,303 | | | 2,883 | | Office furniture and equipment | 2,382 | | | 2,420 | |
| Construction in progress | Construction in progress | 94,332 | | | 80,557 | | Construction in progress | 106,653 | | | 103,226 | |
| Total | Total | 286,752 | | | 273,641 | | Total | 308,061 | | | 300,992 | |
| Less: accumulated depreciation | Less: accumulated depreciation | (95,473) | | | (85,240) | | Less: accumulated depreciation | (127,751) | | | (117,480) | |
| Fixed assets, net | Fixed assets, net | $ | 191,279 | | | $ | 188,401 | | Fixed assets, net | $ | 180,310 | | | $ | 183,512 | |
For the three months ended June 30, 20222023 and 2021,2022, depreciation expense was $6.5$4.7 million and $2.9$6.5 million, respectively. For the three months ended June 30, 20222023 and 2021,2022, there was $1.0$0.7 million and $1.1$1.0 million of capitalized interest on the construction of manufacturing sites, respectively.
For the six months ended June 30, 20222023 and 2021,2022, depreciation expense was $12.2$10.0 million and $5.8$12.2 million, respectively. For the six months ended June 30, 20222023 and 2021,2022, there was $1.8$2.1 million and $2.1$1.8 million of capitalized interest on the construction of manufacturing sites, respectively.
At June 30, 20222023 and December 31, 2021,2022, total fixed assets, net includes leasehold improvements and manufacturing process equipment and leasehold improvements located in Europe in the amount of $60.0$40.6 million and $65.4$44.7 million, respectively.
As of June 30, 20222023 and December 31, 2021,2022, the Company had asset retirement obligations of $3.1$3.4 million and $2.4$3.3 million, respectively, included in accrued expenses and other liabilities on its condensed consolidated balance sheet,sheets, for costs associated with returning leased spaces to their original condition upon the termination of certain of its lease agreements.
Pacira BioSciences, Inc. | Q2 2022 Form 10-Q | Page 15
NOTE 7—6—LEASES
The Company leases all of its facilities, including its EXPAREL and iovera° handpiece manufacturing facility at its Science Center Campus in San Diego, California. These leases have remaining terms up to 8.2 years, some of which provide renewal options at the then-current market value. The Company also has 2two embedded leases with Thermo Fisher Scientific Pharma Services for the use of their manufacturing facility in Swindon, England for the production of EXPAREL and ZILRETTA. A portion of the associated monthly base fees has been allocated to the lease components based on a relative fair value basis.
Since July 2022 and February 2023, the Company has been recognizing sublease income for laboratory space leased in Woburn, Massachusetts and a portion of office space leased in Burlington, Massachusetts, respectively, from leases that were assumed as part of the Flexion Acquisition.
Subsequent to June 30, 2023, the Company partially exited its Burlington, Massachusetts office space lease that had been assumed as part of the Flexion Acquisition at a one-time termination fee of $0.8 million, which released its obligation of $1.6 million in future cash payments for the respective proportion of square footage exited.
The operating lease costs for the facilities include lease and non-lease components, such as common area maintenance and other common operating expenses, along with executory costs such as insurance and real estate taxes. Total operating lease costs areexpense, net is as follows (in thousands):
| | | Three Months Ended | | Six Months Ended | | Three Months Ended | | Six Months Ended |
| | June 30, | | June 30, | | June 30, | | June 30, |
| | 2022 | | 2021 | | 2022 | | 2021 | | 2023 | | 2022 | | 2023 | | 2022 |
| Fixed lease costs | Fixed lease costs | | $ | 3,542 | | | $ | 2,922 | | | $ | 7,069 | | | $ | 5,843 | | Fixed lease costs | | $ | 3,631 | | | $ | 3,542 | | | $ | 7,259 | | | $ | 7,069 | |
| Variable lease costs | Variable lease costs | | 508 | | | 424 | | | 980 | | | 902 | | Variable lease costs | | 378 | | | 508 | | | 945 | | | 980 | |
| Sublease income | | Sublease income | | (169) | | | — | | | (322) | | | — | |
| Total | Total | | $ | 4,050 | | | $ | 3,346 | | | $ | 8,049 | | | $ | 6,745 | | Total | | $ | 3,840 | | | $ | 4,050 | | | $ | 7,882 | | | $ | 8,049 | |
Pacira BioSciences, Inc. | Q2 2023 Form 10-Q | Page 13
Supplemental cash flow information related to operating leases is as follows (in thousands):
| | | | | | | | | | | | | | |
| | Six Months Ended |
| | June 30, |
| | 2022 | | 2021 |
| Cash paid for operating lease liabilities, net of lease incentive | | $ | 6,637 | | | $ | 7,177 | |
| ROU assets recorded in exchange for lease obligations | | $ | — | | | $ | — | |
| | | | | | | | | | | | | | |
| | Six Months Ended |
| | June 30, |
| | 2023 | | 2022 |
| Cash paid for operating lease liabilities, net of lease incentives | | $ | 7,325 | | | $ | 6,637 | |
| | | | |
The Company has elected to net the amortization of the ROUright-of-use asset and the reduction of the lease liability principal in other liabilities in the condensed consolidated statementstatements of cash flows.
The Company has measured its operating lease liabilities at an estimated discount rate at which it could borrow on a collateralized basis over the remaining term for each operating lease. The weighted average remaining lease termterms and the weighted average discount raterates are summarized as follows: | | | June 30, | | June 30, |
| | 2022 | | 2021 | | 2023 | | 2022 |
| Weighted average remaining lease term | Weighted average remaining lease term | | 7.33 years | | 8.71 years | Weighted average remaining lease term | | 6.39 years | | 7.33 years |
| Weighted average discount rate | Weighted average discount rate | | 6.95 | % | | 6.89 | % | Weighted average discount rate | | 7.03 | % | | 6.95 | % |
Maturities of the Company’s operating lease liabilities are as follows (in thousands):
| | Year | Year | | Aggregate Minimum Payments Due | Year | | Aggregate Minimum
Payments Due |
| 2022 (remaining six months) | | $ | 6,509 | | |
| 2023 | | 13,304 | | |
| 2023 (remaining six months) | | 2023 (remaining six months) | | $ | 6,925 | |
| 2024 | 2024 | | 13,435 | | 2024 | | 13,928 | |
| 2025 | 2025 | | 12,575 | | 2025 | | 13,078 | |
| 2026 | 2026 | | 12,310 | | 2026 | | 12,814 | |
| 2027 | | 2027 | | 12,587 | |
| Thereafter | Thereafter | | 39,422 | | Thereafter | | 27,350 | |
| Total future lease payments | Total future lease payments | | 97,555 | | Total future lease payments | | 86,682 | |
| Less: imputed interest | Less: imputed interest | | (21,846) | | Less: imputed interest | | (17,655) | |
| Total operating lease liabilities | Total operating lease liabilities | | $ | 75,709 | | Total operating lease liabilities | | $ | 69,027 | |
Pacira BioSciences, Inc. | Q2 20222023 Form 10-Q | Page 1614
As of June 30, 2022, the Company has entered into 1 lease agreement not included above as the Company has not yet taken possession of the property. When the lease commences, the future lease obligations will be as follows (in thousands):
| | | | | | | | |
| Year | | Aggregate Minimum Payments Due |
| 2022 (remaining six months) | | $ | 81 | |
| 2023 | | 492 | |
| 2024 | | 494 | |
| 2025 | | 503 | |
| 2026 | | 505 | |
| Thereafter | | 443 | |
| Total future lease payments | | $ | 2,518 | |
Subsequent to June 30, 2022, the Company entered into a sublease for the former Flexion research and development laboratory in Woburn, Massachusetts in July 2022 which resulted in a $0.4 million ROU asset to be reclassified to a fixed asset.
NOTE 8—7—GOODWILL AND INTANGIBLE ASSETS
Goodwill
The Company’s goodwill results from the acquisition of Pacira Pharmaceuticals, Inc. (the Company’s California operating subsidiary) from SkyePharma Holding, Inc., or Skyepharma, (now a subsidiary of Vectura Group plc) in March 2007 (the “Skyepharma Acquisition”), the MyoScience Inc., or MyoScience, (the “MyoScience Acquisition”)Acquisition in April 2019 and the Flexion Acquisition in November 2021. The balancesbalance at each of June 30, 20222023 and December 31, 2021 were $146.1 million and $145.2 million, respectively. The increase2022 was due to measurement period adjustments associated with the Flexion Acquisition. See Note 4, Flexion Acquisition, for more information.$163.2 million.
The Skyepharma Acquisition occurred in March 2007, prior to the requirements to record contingent consideration at fair value under ASC 805-30. In connection with the Skyepharma Acquisition, the Company agreed to certain milestone payments for DepoBupivacaine products, including EXPAREL. The final Skyepharma milestone payment of $32.0 million when annual net sales collected reached $500.0 million was achieved in the fourth quarter of 2021 and paid during the first quarter of 2022.
Intangible Assets
Intangible assets, net, consistconsists of the in-process research and development, or IPR&D, and developed technology from the Flexion Acquisition and developed technology and customer relationships from the MyoScience Acquisition and are summarized as follows (dollar amounts in thousands):
| | June 30, 2022 | | Gross Carrying Value | | Accumulated
Amortization | | Intangible
Assets, Net | | Weighted-Average Useful Lives | |
| June 30, 2023 | | June 30, 2023 | | Gross Carrying Value | | Accumulated
Amortization | | Intangible
Assets, Net | | Weighted-Average Useful Lives |
| Developed technologies | Developed technologies | | $ | 590,000 | | | $ | (55,737) | | | $ | 534,263 | | | 10 years, 5 months | Developed technologies | | $ | 590,000 | | | $ | (113,016) | | | $ | 476,984 | | | 10 years, 5 months |
| Customer relationships | Customer relationships | | 90 | | | (29) | | | 61 | | | 10 years | Customer relationships | | 90 | | | (38) | | | 52 | | | 10 years |
| Total finite-lived intangible assets, net | Total finite-lived intangible assets, net | | 590,090 | | | (55,766) | | | 534,324 | | | Total finite-lived intangible assets, net | | 590,090 | | | (113,054) | | | 477,036 | | |
| Acquired IPR&D | Acquired IPR&D | | 61,000 | | — | | | 61,000 | | | Acquired IPR&D | | 34,866 | | | — | | | 34,866 | | |
| Total intangible assets, net | Total intangible assets, net | | $ | 651,090 | | | $ | (55,766) | | | $ | 595,324 | | | Total intangible assets, net | | $ | 624,956 | | | $ | (113,054) | | | $ | 511,902 | | |
| | December 31, 2021 | | Gross Carrying Value | | Accumulated
Amortization | | Intangible
Assets, Net | | Weighted-Average Useful Lives | |
| December 31, 2022 | | December 31, 2022 | | Gross Carrying Value | | Accumulated
Amortization | | Intangible
Assets, Net | | Weighted-Average Useful Lives |
| Developed technologies | Developed technologies | | $ | 590,000 | | | $ | (27,097) | | | $ | 562,903 | | | 10 years, 5 months | Developed technologies | | $ | 590,000 | | | $ | (84,376) | | | $ | 505,624 | | | 10 years, 5 months |
| Customer relationships | Customer relationships | | 90 | | | (25) | | | 65 | | | 10 years | Customer relationships | | 90 | | | (34) | | | 56 | | | 10 years |
| Total finite-lived intangible assets, net | Total finite-lived intangible assets, net | | 590,090 | | | (27,122) | | | 562,968 | | | Total finite-lived intangible assets, net | | 590,090 | | | (84,410) | | | 505,680 | | |
| Acquired IPR&D | Acquired IPR&D | | 61,000 | | — | | | 61,000 | | | Acquired IPR&D | | 34,866 | | | — | | | 34,866 | | |
| Total intangible assets, net | Total intangible assets, net | | $ | 651,090 | | | $ | (27,122) | | | $ | 623,968 | | | Total intangible assets, net | | $ | 624,956 | | | $ | (84,410) | | | $ | 540,546 | | |
Amortization expense on intangible assets was $14.3 million for both the three months ended June 30, 2023 and 2022. Amortization expense on intangible assets was $28.6 million for both the six months ended June 30, 2022 was $14.3 million2023 and $28.6 million, respectively. Amortization expense on intangible assets for the three and six months ended June 30, 2021 was
Pacira BioSciences, Inc. | Q2 2022 Form 10-Q | Page 17
$2.0 million and $3.9 million, respectively. The increase in amortization expense in the current year is a result of the amortization of ZILRETTA for osteoarthritis knee pain acquired as part of the Flexion Acquisition in November 2021.2022.
Assuming no changes in the gross carrying amount of these intangible assets, the future estimated amortization expense on the finite-lived intangible assets will be $28.6 million for the remaining six months of 2022,2023, $57.3 million each year from 20232024 to 2030, $37.4 million in 2031, $7.9 million in 2032 and $2.2 million in 2033.
The Company reviews its long-lived assets for impairment whenever an event or change in circumstances arise that indicate the carrying amountPacira BioSciences, Inc. | Q2 2023 Form 10-Q | Page 15
NOTE 9—8—DEBT
The carrying value of the Company’s outstanding debt is summarized as follows (in thousands): | | | | | | | | | | | |
| June 30, | | December 31, |
| 2022 | | 2021 |
| Term loan B facility maturing December 2026 | $ | 352,120 | | | $ | 359,497 | |
| 0.750% Convertible senior notes due August 2025 | 394,894 | | | 330,627 | |
| 3.375% Convertible senior notes due May 2024 | 8,640 | | | 201,249 | |
2.375% Convertible senior notes due April 2022 (1) | — | | | 157,857 | |
| Total | $ | 755,654 | | | $ | 1,049,230 | |
| | | | | | | | | | | |
| June 30, | | December 31, |
| 2023 | | 2022 |
| Term loan A facility maturing March 2028 | $ | 145,686 | | | $ | — | |
Term loan B facility maturing December 2026 (1) | — | | | 284,704 | |
| 0.750% Convertible senior notes due August 2025 | 397,360 | | | 396,126 | |
| 3.375% Convertible senior notes due May 2024 | 8,641 | | | 8,641 | |
| Total | $ | 551,687 | | | $ | 689,471 | |
(1) The 2022 NotesTLB Term Loan (as defined below) maturedwas refinanced on April 1, 2022.March 31, 2023 as discussed below.
2028 Term Loan BA Facility
In December 2021,On March 31, 2023, the Company entered into a term loan credit agreement (the “Credit“TLA Credit Agreement”) with JP MorganJPMorgan Chase Bank, N.A., as administrative agent, and certain lenders, to refinance the initial lender.indebtedness outstanding under the Company’s TLB Credit Agreement (as defined and discussed below). The term loan issued under the TLA Credit Agreement (the “Term“TLA Term Loan”) was issued at a 3%0.30% discount and allowsprovides for a single-advance term loan BA facility in the principal amount of $375.0$150.0 million, which is secured by substantially all of the Company’s and eachany subsidiary guarantor’s assets. Subject to certain conditions, the Company may, at any time, on one or more occasion, add one or more new classes of term facilities and/or increase the principal amount of the loans of any existing class by requesting one or more incremental term facilities. The net proceeds of the TLA Term Loan were approximately $363.8$149.6 million after deducting an original issue discount of $11.2$0.4 million.
The total debt composition of the
TLA Term Loan is as follows (in thousands):
| | | | | | | | | | | |
| June 30, | | December 31, |
| 2022 | | 2021 |
| Term Loan maturing December 2026 | $ | 365,625 | | | $ | 375,000 | |
| Deferred financing costs | (3,856) | | | (4,443) | |
| Discount on debt | (9,649) | | | (11,060) | |
| Total debt, net of debt discount and deferred financing costs | $ | 352,120 | | | $ | 359,497 | |
| | | |
| | | |
| | | |
| | | |
| | | | | | | |
| June 30, | | |
| 2023 | | |
| Term loan A facility maturing March 2028 | $ | 147,188 | | | |
| Deferred financing costs | (1,079) | | | |
| Discount on debt | (423) | | | |
| Total debt, net of debt discount and deferred financing costs | $ | 145,686 | | | |
The TLA Term Loan matures on December 7, 2026March 31, 2028 and requires quarterly repayments of principal in the amount of $9.4$2.8 million which commenced on June 30, 2023, increasing to $3.8 million commencing June 30, 2022, increasing to $14.1 million commencing DecemberMarch 31, 2025, with a remaining balloon payment of approximately $188.0$85.3 million due at maturity. During 2022,the remainder of 2023, the Company is required to make 3two more quarterly principal payments totaling $28.1$5.6 million.
The Company is also required to make mandatory prepayments of principal from (i) the Company’s excess cash flow (as defined in the Credit Agreement) existing in any fiscal year and if the Senior Secured Leverage Ratio (as defined in the Credit Agreement) for such fiscal year exceeds certain predetermined limits (ii) net proceeds (as defined in the Credit Agreement) of non-ordinary course assets sales and casualty events and (iii) debt issuance proceeds (other than permitted debt under the Credit Agreement). Prepayment penalties for the Term Loan are 2% in the first loan year plus an interest make-whole payment, 2% in the second loan year, 1% in the third loan year and nothing thereafter. Prepayment penalties generally do not apply to mandatory prepayment obligations under theTLA Credit Agreement such as prepayments due in connection with excess cash flow. During the three and six months ended June 30, 2022, the Company made a scheduled principal payment of $9.4 million.
Pacira BioSciences, Inc. | Q2 2022 Form 10-Q | Page 18
The Term Loan requires the Company to, among other things, maintain (i) a first lien net leverage ratio,Senior Secured Net Leverage Ratio (as defined in the TLA Credit Agreement), determined as of the last day of anyeach fiscal quarter, of no greater than 1.753.00 to 1.00 and (ii) liquidity, at any time,a Fixed Charge Coverage Ratio (as defined in the Credit Agreement), determined as of at least $150.0 million.the last day of each fiscal quarter, of no less than 1.50 to 1.00. The Term LoanTLA Credit Agreement also contains customary affirmative and negative covenants, financial covenants, representations and warranties, events of default and other provisions. As of June 30, 2022,2023, the Company was in compliance with all financial covenants under the TLA Credit Agreement.
The Company may elect to borrow either (i) alternate base rate borrowings or (ii) term benchmark borrowings or daily simple SOFR (as defined in the TLA Credit Agreement) borrowings. Each term loan borrowing that is an alternate base rate borrowings. Term benchmark borrowings bearborrowing bears interest at a variable rate per annum equal to (i) the Alternate Base Rate (as defined in the TLA Credit Agreement), plus (ii) a spread based on the Company’s Senior Secured Net Leverage Ratio ranging from 2.00% to 2.75%. Each term loan borrowing that is a term benchmark borrowing or daily simple SOFR borrowing bears interest at a rate per annum equal to (i) the Adjusted Term SOFR Rate or Adjusted Daily Simple SOFR (as each is defined in the Credit Agreement) (subject, plus (ii) a spread based on the Company’s Senior Secured Net Leverage Ratio ranging from 3.00% to 3.75%. During the six months ended June 30, 2023, the Company made a 75 basis points floor) plus an applicable marginscheduled principal payment of 700 basis points. Alternate base rate borrowings bear interest at a variable rate per annum determined using a base rate (subject to a 175 basis points floor) equal to the greatest of (i) the Prime Rate (as defined in the Credit Agreement) in effect on such day, (ii) the NYFRB Rate (as defined in the Credit Agreement) plus 50 basis points or (iii) the Adjusted Term SOFR Rate (as defined in the Credit Agreement) plus 100 basis points, subject to certain exceptions, plus an applicable margin of 600 basis points.$2.8 million. As of June 30, 2022,2023, borrowings under the TLA Term Loan consisted entirely of term benchmark borrowings at a rate of 7.81%8.01%. Subsequent to June 30, 2023, the Company made a $25.0 million principal prepayment in July 2023.
Pacira BioSciences, Inc. | Q2 2023 Form 10-Q | Page 16
2026 Term Loan B Facility
In December 2021, the Company entered into a term loan credit agreement (the “TLB Credit Agreement”) with JPMorgan Chase Bank, N.A., as administrative agent and the initial lender. The term loan issued under the Credit Agreement (the “TLB Term Loan”) was issued at a 3.00% discount and allowed for a single-advance term loan B facility in the principal amount of $375.0 million, which was secured by substantially all of the Company’s and each subsidiary guarantor’s assets. The net proceeds of the TLB Term Loan were approximately $363.8 million after deducting an original issue discount of $11.2 million.
On March 31, 2023, the Company used the $149.6 million of net borrowings under the TLA Credit Agreement and cash on hand to repay the indebtedness outstanding under the TLB Credit Agreement and concurrently terminated the TLB Credit Agreement. The Company incurred a prepayment fee of 2.00% of the outstanding principal balance of the TLB Term Loan in connection with the termination.
The total debt composition of the TLB Term Loan was as follows (in thousands): | | | | | | | | | | | |
| June 30, | | December 31, |
| 2023 | | 2022 |
| Term loan B facility maturing December 2026 | $ | — | | | $ | 296,875 | |
| Deferred financing costs | — | | | (3,919) | |
| Discount on debt | — | | | (8,252) | |
| Total debt, net of debt discount and deferred financing costs | $ | — | | | $ | 284,704 | |
| | | |
| | | |
| | | |
| | | |
During the six months ended June 30, 2023, the Company made a scheduled principal payment of $9.4 million and repaid the outstanding $287.5 million principal on the TLB Term Loan, which resulted in a $16.9 million loss on early extinguishment of debt.
Convertible Senior Notes Due 2025
In July 2020, the Company completed a private placement of $402.5 million in aggregate principal amount of its 0.750% convertible senior notes due 2025, or 2025 Notes, and entered into an indenture with Computershare Corporate Trust, N.A. (formerly Wells Fargo Bank, N.A.), or 2025 Indenture, with respect to the 2025 Notes. The 2025 Notes accrue interest at a fixed rate of 0.750% per year, payable semiannually in arrears on February 1st and August 1st of each year. The 2025 Notes mature on August 1, 2025.
The total debt composition of the 2025 Notes is as follows (in thousands): | | | June 30, | | December 31, | | June 30, | | December 31, |
| | 2022 | | 2021 | | 2023 | | 2022 |
| 0.750% convertible senior notes due August 2025 | 0.750% convertible senior notes due August 2025 | $ | 402,500 | | | $ | 402,500 | | 0.750% convertible senior notes due August 2025 | $ | 402,500 | | | $ | 402,500 | |
| Deferred financing costs | Deferred financing costs | (7,606) | | | (7,155) | | Deferred financing costs | (5,140) | | | (6,374) | |
| Discount on debt | — | | | (64,718) | | |
| | Total debt, net of debt discount and deferred financing costs | Total debt, net of debt discount and deferred financing costs | $ | 394,894 | | | $ | 330,627 | | Total debt, net of debt discount and deferred financing costs | $ | 397,360 | | | $ | 396,126 | |
The net proceeds from the issuance of the 2025 Notes were approximately $390.0 million, after deducting commissions and the offering expenses paid by the Company. A portion of the net proceeds from the 2025 Notes was used by the Company to repurchase $185.0 million in aggregate principal amount of its then-outstanding 2.375% convertible senior notes due 2022 in privately-negotiated transactions for a total of $211.1 million of cash (including accrued interest).
Holders may convert the 2025 Notes at any time prior to the close of business on the business day immediately preceding February 3, 2025, only if certain circumstances are met, including if during the previous calendar quarter, the last reported sales price of the Company’s common stock was greater than 130% of the conversion price then applicable for at least 20 out of the last 30 consecutive trading days of the quarter. During the quarter ended June 30, 2022, this condition2023, the conditions for conversion waswere not met.
On or after February 3, 2025, until the close of business on the second scheduled trading day immediately preceding August 1, 2025, holders may convert their 2025 Notes at any time.
Upon conversion, holders will receive the principal amount of their 2025 Notes and any excess conversion value, calculated based on the per share volume-weighted average price for each of the 40 consecutive trading days during the observation period (as more fully described in the 2025 Indenture). For both the principal and excess conversion value, holders may receive cash, shares of the Company’s common stock or a combination of cash and shares of the Company’s common stock, at the Company’s option. The initial conversion rate for the 2025 Notes is 13.9324 shares of common stock per $1,000
Pacira BioSciences, Inc. | Q2 2023 Form 10-Q | Page 17
principal amount, which is equivalent to an initial conversion price of $71.78 per share of the Company’s common stock. The conversion rate will be subject to adjustment in some events but will not be adjusted for any accrued and unpaid interest. The initial conversion price of the 2025 Notes represents a premium of approximately 32.5% to the closing sale price of $54.17 per share of the Company’s common stock on the Nasdaq Global Select Market on July 7, 2020, the date that the Company priced the private offering of the 2025 Notes.
As of June 30, 2022,2023, the 2025 Notes had a market price of $1,038$926 per $1,000 principal amount. In the event of conversion, holders would forgo all future interest payments, any unpaid accrued interest and the possibility of further stock price appreciation. Upon the receipt of conversion requests, the settlement of the 2025 Notes will be paid pursuant to the terms of the 2025 Indenture. In the event that all of the 2025 Notes are converted, the Company would be required to repay the
Pacira BioSciences, Inc. | Q2 2022 Form 10-Q | Page 19
$402.5 $402.5 million in principal value and any conversion premium in any combination of cash and shares of its common stock (at the Company’s option).
Prior to August 1, 2023, the Company may not redeem the 2025 Notes. On or afterBeginning on August 1, 2023 (but, in the case of a redemption of less than all of the outstanding 2025 Notes, no later than the 40th scheduled trading day immediately before the maturity date), the Company may redeem for cash all or part of the 2025 Notes if the last reported sale price (as defined in the 2025 Indenture) of the Company’s common stock has been at least 130% of the conversion price then in effect for (i) each of at least 20 trading days (whether or not consecutive) during any 30 consecutive trading days ending on, and including, the trading day immediately before the date the Company sends the related notice of redemption and (ii) the trading day immediately before the date the Company sends such notice. The redemption price will equal the sum of (i) 100% of the principal amount of the 2025 Notes being redeemed, plus (ii) accrued and unpaid interest, including additional interest, if any, to, but excluding, the redemption date. In addition, calling the 2025 Notes for redemption will constitute a “make-whole fundamental change” (as defined in the 2025 Indenture) and will, in certain circumstances, increase the conversion rate applicable to the conversion of such notes if it is converted in connection with the redemption. No sinking fund is provided for the 2025 Notes.
While the 2025 Notes are currently classified on the Company’s condensed consolidated balance sheet at June 30, 20222023 as long-term debt, the future convertibility and resulting balance sheet classification of this liability is monitored at each quarterly reporting date and is analyzed dependent upon market prices of the Company’s common stock during the prescribed measurement periods. In the event that the holders of the 2025 Notes have the election to convert the 2025 Notes at any time during the prescribed measurement period, the 2025 Notes would then be considered a current obligation and classified as such.
Convertible Senior Notes Due 2024 Assumed from the Flexion Acquisition
Prior to the Flexion Acquisition, on May 2, 2017, Flexion issued an aggregate of $201.3 million principal amount of 3.375% convertible senior notes due 2024 (the “Flexion 2024 Notes”), pursuant to the indenture, dated as of May 2, 2017 (the “Original Flexion Indenture”), between Flexion and Computershare Corporate Trust, N.A. (formerly Wells Fargo Bank, N.A.), as trustee (the “Flexion Trustee”), as supplemented by the First Supplemental Indenture, dated as of November 19, 2021, between Flexion and the Flexion Trustee (the “First Supplemental Flexion Indenture” and, together with the Original Flexion Indenture, the “Flexion Indenture”). The Flexion 2024 Notes have a maturity date ofmature on May 1, 2024, are unsecured and accrue interest at a rate of 3.375% per annum, payable semi-annually on May 1st and November 1st of each year. Upon the Flexion Acquisition, the principal was assumed and recorded at fair value by the Company.
Upon conversion of the Flexion 2024 Notes, at the election of each holder thereof, each Flexion 2024 Note was convertible into cash, shares of Flexion’s common stock, or a combination thereof, at Flexion’s election, at a conversion rate of approximately 37.3413 shares of Flexion common stock per $1,000 principal amount of the Flexion 2024 Notes, which corresponded to an initial conversion price of approximately $26.78 per share of Flexion’s common stock. As a result of the Flexion Acquisition, and in connection with the Notice (as defined below), holders of the Flexion 2024 Notes became entitled to certain Flexion Acquisition-related conversion and repurchase rights, as discussed below. In addition, as a result of the Flexion Acquisition and as discussed in more detail below, any future conversion rights are subject to the occurrence of any future events giving rise to such conversion rights under the Flexion Indenture.
On December 6, 2021, as a result of the Flexion Acquisition and in accordance with the Flexion Indenture, Flexion provided a Fundamental Change Company Notice and Offer to Purchase (the “Notice”) to the holders of the Flexion 2024 Notes in accordance with the Flexion Indenture, holders of the Flexion 2024 Notes became entitled to certain Flexion Acquisition-related conversion and repurchase rights. On December 6, 2021, as a result of the Flexion Acquisition and in accordance with the Flexion Indenture, the Company offered to repurchase for cash all of the outstanding Flexion 2024 Notes, at a repurchase price in cash equal to 100% of the principal amount of the Flexion 2024 Notes being repurchased, plus accrued and unpaid interest thereon to, but excluding, January 7, 2022, subject to the terms and conditions set forth therein. The offer to purchase expired at 5:00 p.m., New York City time, on January 6, 2022, as scheduled.
Any holder that did not exercise its repurchase right in accordance with the terms of the Notice retained the conversion rights associated with such holder’s Flexion 2024 Notes under the Flexion Indenture. For conversion of Flexion 2024 Notes in connection withIndenture as well as the Fundamental Change and the Make-Whole Fundamental Change (each as defined in the Flexion Indenture) resulting from the Flexion Acquisition, each $1,000 principal amount of the Flexion 2024 Notes was convertible into (i) $317.40 in cash and (ii) 37.3413 CVRs, based on the conversion rate of 37.3413, prior to 5:00 p.m., New York City time, on January 7, 2022. Alternatively, holders could retain their Flexion 2024 Notes and such Flexion 2024 Notes would remain outstanding subject to their existing terms, including with respect to a holder’s right to receive interest payments on the Flexion 2024 Notes and exercise any future conversion rights that may arise under the Flexion Indenture.Notes.
On January 7, 2022, following the expiration of the offer to purchase, the Company accepted the $192.6 million aggregate principal amount of Flexion 2024 Notes that were validly tendered (and not validly withdrawn). No Flexion 2024 Notes were converted in connection with the Notice. At June 30, 2022,2023, the remaining principal outstanding is $8.6 million.
Pacira BioSciences, Inc. | Q2 2022 Form 10-Q | Page 20
Convertible Senior Notes Due 2022
In March 2017, the Company completed a private placement of $345.0 million in aggregate principal amount of 2.375% convertible senior notes due 2022, or 2022 Notes. The 2022 Notes, accrued interest at a fixed rate of 2.375% per year, payable semiannually in arrears on April 1stand October 1st of each year. In July 2020, the Company used part of the net proceeds from the issuance of the 2025 Notesentered into an indenture with respect to repurchase $185.0 million aggregate principal amount of the 2022 Notes in privately-negotiated transactions for an aggregate of $211.1 million in cash (including accrued interest).
The total debt composition of the 2022 Notes is as follows (in thousands): | | | | | | | | | | | |
| June 30, | | December 31, |
| 2022 | | 2021 |
| 2.375% convertible senior notes due April 2022 | $ | — | | | $ | 160,000 | |
| Deferred financing costs | — | | | (223) | |
| Discount on debt | — | | | (1,920) | |
| Total debt, net of debt discount and deferred financing costs | $ | — | | | $ | 157,857 | |
Notes. On April 1, 2022, the 2022 Notes matured and the Company settled the remaining outstanding principal balance of $160.0 million and a
Pacira BioSciences, Inc. | Q2 2023 Form 10-Q | Page 18
conversion premium of $4.8 million through a cash payment of $156.9 million and the issuance of 101,521 shares of the Company’s common stock, which increased additional paid-in capital by $3.0 million.
Interest Expense
The following table sets forth the total interest expense recognized in the periods presented (dollar amounts in thousands):
| | | | | | | | | | | | | | | | | | | | | | | |
| Three Months Ended
June 30, | | Six Months Ended
June 30, |
| 2022 | | 2021 | | 2022 | | 2021 |
| Contractual interest expense | $ | 8,196 | | | $ | 1,713 | | | $ | 17,381 | | | $ | 3,418 | |
| Amortization of debt issuance costs | 874 | | | 659 | | | 2,053 | | | 1,310 | |
| Amortization of debt discount | 706 | | | 5,744 | | | 1,412 | | | 11,401 | |
| Capitalized interest and other (Note 6) | (943) | | | (1,093) | | | (1,767) | | | (2,135) | |
| Total | $ | 8,833 | | | $ | 7,023 | | | $ | 19,079 | | | $ | 13,994 | |
| | | | | | | |
| Effective interest rate on total debt | 5.08 | % | | 6.70 | % | | 5.31 | % | | 6.70 | % |
Upon the adoption of ASU 2020-06 effective January 1, 2022, the Company eliminated the convertible debt discounts associated with the 2022 Notes and the 2025 Notes that were originally recorded as offsets to the embedded conversion features recognized in equity. Effective January 1, 2022, the Company will not record interest expense on the previously recorded discounts on convertible debt. The deferred financing costs previously allocated to the conversion features have since been re-allocated to the outstanding debt, slightly increasing the future annual amortization of deferred financing costs. For additional information regarding the adoption of ASU 2020-06, see Note 2, Summary of Significant Accounting Policies. | | | | | | | | | | | | | | | | | | | | | | | |
| Three Months Ended
June 30, | | Six Months Ended
June 30, |
| 2023 | | 2022 | | 2023 | | 2022 |
| Contractual interest expense | $ | 3,849 | | | $ | 8,196 | | | $ | 13,199 | | | $ | 17,381 | |
| Amortization of debt issuance costs | 691 | | | 874 | | | 1,628 | | | 2,053 | |
| Amortization of debt discount | 28 | | | 706 | | | 703 | | | 1,412 | |
| Capitalized interest and other (Note 5) | (703) | | | (943) | | | (2,076) | | | (1,767) | |
| Total | $ | 3,865 | | | $ | 8,833 | | | $ | 13,454 | | | $ | 19,079 | |
| | | | | | | |
| Effective interest rate on total debt | 3.16 | % | | 5.08 | % | | 4.38 | % | | 5.31 | % |
NOTE 10—9—FINANCIAL INSTRUMENTS
Fair Value Measurements
Fair value is defined as the price that would be received to sell an asset or be paid to transfer a liability in the principal or most advantageous market in an orderly transaction. To increase consistency and comparability in fair value measurements, the FASBFinancial Accounting Standards Board (FASB) established a three-level hierarchy which requires an entity to maximize the use of observable inputs and minimize the use of unobservable inputs when measuring fair value. The three levels of fair value measurements are:
•Level 1: Quoted prices (unadjusted) in active markets that are accessible at the measurement date for assets or liabilities. The fair value hierarchy gives the highest priority to Level 1 inputs.
•Level 2: Observable prices that are based on inputs not quoted on active markets, but corroborated by market data.
•Level 3: Unobservable inputs that are used when little or no market data is available. The fair value hierarchy gives the lowest priority to Level 3 inputs.
Pacira BioSciences, Inc. | Q2 2022 Form 10-Q | Page 21
The carrying value of financial instruments including cash and cash equivalents, accounts receivable and accounts payable approximate their respective fair values due to the short-term nature of these items. The fair value of the Company’s convertible senior notes are calculated utilizing market quotations from an over-the-counter trading market for these notes (Level 2). The fair value of the Company’s acquisition-related contingent consideration is reported at fair value on a recurring basis (Level 3). The carrying amounts of equity investments and convertible notes receivable without readily determinable fair values have not been adjusted for either an impairment or upward or downward adjustments based on observable transactions.
Pacira BioSciences, Inc. | Q2 2023 Form 10-Q | Page 19
At June 30, 2022,2023, the carrying values and fair values of the following financial assets and liabilities were as follows (in thousands): | | | | Carrying Value | | Fair Value Measurements Using | | | Carrying Value | | Fair Value Measurements Using |
| | | | Level 1 | | Level 2 | | Level 3 | | | | Level 1 | | Level 2 | | Level 3 |
| Financial Assets and Financial Liabilities Measured at Fair Value on a Recurring Basis: | Financial Assets and Financial Liabilities Measured at Fair Value on a Recurring Basis: | | | | | | | | | Financial Assets and Financial Liabilities Measured at Fair Value on a Recurring Basis: | | | | | | | | |
| Financial Assets: | Financial Assets: | | Financial Assets: | |
| Equity investments | Equity investments | | $ | 25,627 | | | $ | — | | | $ | — | | | $ | 25,627 | | Equity investments | | $ | 15,877 | | | $ | — | | | $ | — | | | $ | 15,877 | |
| Convertible notes receivable | Convertible notes receivable | | $ | 5,299 | | | $ | — | | | $ | — | | | $ | 5,299 | | Convertible notes receivable | | $ | 12,062 | | | $ | — | | | $ | — | | | $ | 12,062 | |
| Financial Liabilities: | Financial Liabilities: | | Financial Liabilities: | |
| Acquisition-related contingent consideration | Acquisition-related contingent consideration | | $ | 35,247 | | | $ | — | | | $ | — | | | $ | 35,247 | | Acquisition-related contingent consideration | | $ | 21,482 | | | $ | — | | | $ | — | | | $ | 21,482 | |
| | Financial Liabilities Measured at Amortized Cost: | Financial Liabilities Measured at Amortized Cost: | | Financial Liabilities Measured at Amortized Cost: | |
| Term loan facility due December 2026 | | $ | 352,120 | | | $ | — | | | $ | 366,562.5 | | | $ | — | | |
| Term loan A facility due March 2028 | | Term loan A facility due March 2028 | | $ | 145,686 | | | $ | — | | | $ | 146,452 | | | $ | — | |
0.750% convertible senior notes due 2025 (1) | 0.750% convertible senior notes due 2025 (1) | | $ | 394,894 | | | $ | — | | | $ | 417,855 | | | $ | — | | 0.750% convertible senior notes due 2025 (1) | | $ | 397,360 | | | $ | — | | | $ | 372,566 | | | $ | — | |
3.375% convertible senior notes due 2024 (2) | 3.375% convertible senior notes due 2024 (2) | | $ | 8,640 | | | $ | — | | | $ | 8,606 | | | $ | — | | 3.375% convertible senior notes due 2024 (2) | | $ | 8,641 | | | $ | — | | | $ | 8,641 | | | $ | — | |
(1) The closing price of the Company’s common stock as reported on the Nasdaq Global Select Market was $58.30$40.07 per share at June 30, 20222023 compared to a conversion price of $71.78 per share. Therefore, atAt June 30, 2022,2023, as the conversion price was above the stock price.price, the requirements for conversion have not been met. The maximum conversion premium that could have been due on the 2025 Notes is 5.6 million shares of the Company’s common stock, which assumes no increase in the conversion rate for certain corporate events.
(2) Relates to the Flexion 2024 Notes. For more information, See Note 9, Debt.Financial Assets and Liabilities Measured at Fair Value on a Recurring Basis
Equity and Convertible Note Investments
The Company holds strategic investments in clinical and preclinical stage privately-held biotechnology companies in the form of equity and convertible note investments. The following investments have no readily determinable fair value and are recorded at cost minus impairment, if any, plus or minus observable price changes of identical or similar investments (in thousands):
| | | | | | | | | | | | | | | | | |
| Equity Investments | | Convertible Notes Receivable | | Total |
| Balance at December 31, 2021 | $ | 14,127 | | | $ | 4,132 | | | $ | 18,259 | |
| Purchases | 11,500 | | | 1,250 | | | 12,750 | |
| Foreign currency adjustments | — | | | (83) | | | (83) | |
| Balance at June 30, 2022 | $ | 25,627 | | | $ | 5,299 | | | $ | 30,926 | |
Pacira BioSciences, Inc. | Q2 2022 Form 10-Q | Page 22
| | | | | | | | | | | | | | | | | | | | |
| | Equity Investments | | Convertible Notes Receivable | | Total |
| Balance at December 31, 2021 | | $ | 14,127 | | | $ | 4,132 | | | $ | 18,259 | |
| Purchases | | 11,750 | | | 1,250 | | | 13,000 | |
| Impairment | | (10,000) | | | — | | | (10,000) | |
| Foreign currency adjustments | | — | | | (67) | | | (67) | |
| Balance at December 31, 2022 | | 15,877 | | | 5,315 | | | 21,192 | |
| Purchases | | — | | | 6,758 | | | 6,758 | |
| | | | | | |
| Foreign currency adjustments | | — | | | (11) | | | (11) | |
| Balance at June 30, 2023 | | $ | 15,877 | | | $ | 12,062 | | | $ | 27,939 | |
Acquisition-Related Contingent Consideration
The Company has recognized contingent consideration related to the Flexion Acquisition and the MyoScience Acquisition in the amount of $35.2$21.5 million and $57.6$28.1 million as of June 30, 20222023 and December 31, 2021,2022, respectively. For more information, see Note 14, Acquisition-Related (Gains) Charges, Restructuring Charges and Other.
The Company’s contingent consideration obligations are recorded at their estimated fair values and are revalued each reporting period if and until the related contingencies are resolved. The Company has measured the fair value of its contingent consideration using a probability-weighted discounted cash flow approach that is based on unobservable inputs and a Monte Carlo simulation. These inputs include, as applicable, estimated probabilities and the timing of achieving specified commercial and regulatory milestones, estimated forecasts of revenue and costs and the discount rates used to calculate the present value of estimated future payments. Significant changes may increase or decrease the probabilities of achieving the related commercial and regulatory events, shorten or lengthen the time required to achieve such events, or increase or decrease estimated forecasts.
Pacira BioSciences, Inc. | Q2 2023 Form 10-Q | Page 20
In November 2021, the Company completed the Flexion Acquisition, which provided for contingent consideration related to CVRscontingent value rights that were issued to Flexion shareholders and certain equity award holders which could aggregate up to a total of $425.5$372.3 million if certain regulatory and commercial milestones are met. The aggregate amount was initially $425.5 million prior to the Company’s September 2022 decision to formally discontinue further development of Flexion’s product candidate, PCRX-301. The Company’s obligation to make milestone payments is limited to those milestones achieved through December 31, 2030, and are to be paid within 60 days of the end of the fiscal quarter of achievement. As part of the purchase price consideration related to the Flexion Acquisition, the Company recorded contingent consideration of $45.2 million, which represented the Company’s potential achievement of meeting the regulatory and commercial milestones. For the period from the date of the Flexion Acquisition through December 31, 2021, the Company recorded an additional $1.2 million liability. During the three and six months ended June 30, 2023, the Company recorded gains of $18.3 million and $6.6 million, respectively, due to adjustments to long-term forecasts which reduced the probability of meeting the sales-based contingent consideration milestones by December 31, 2030, the expiration date for achieving the milestones. The gains recognized during the six months ended June 30, 2023 were partially offset by a decrease in the assumed discount rate that is utilized in calculating the liability’s present value, based on a significant improvement in the Company’s incremental borrowing rate resulting from the TLA Credit Agreement entered into in March 2023. During the three and six months ended June 30, 2022,, the Company recorded gains of $12.5 million and $13.3 million, respectively, primarily due to adjustments to near-term forecasts for the earnout period of the contingent consideration. These adjustments were recorded as acquisition-related gainscharges (gains) in the condensed consolidated statements of operations. At June 30, 2022,2023, the weighted average discount rate was 13.5%10.2% and the weighted average probability of successpayment for the achievement of the remaining regulatory milestonesmilestone by the expiration date was 11.1%12.5%. As of June 30, 20222023 and December 31, 2021,2022, a contingent consideration liability related to the Flexion Acquisition was recognized in the amount of $33.1$21.5 million and $46.4$28.1 million, respectively.
In April 2019, the Company completed the MyoScience Acquisition pursuant to the terms of an Agreement and Plan of Merger, which provided for contingent milestone payments of up to an aggregate of $100.0 million upon the achievement of certain regulatory and commercial milestones. The Company’s obligation to make milestone payments is limited to those milestones achieved through December 31, 2023, and are to be paid within 60 days of the end of the fiscal quarter of achievement. As of June 30, 2022,2023, the maximum potential remaining milestone payments to be paid are $43.0 million. The Company recognizedAt June 30, 2023, the probability of success for the regulatory milestone that has not yet been met was assessed as zero. As of June 30, 2023 and December 31, 2022, a contingent consideration gains of $8.8 million and $9.0 million duringliability related to the MyoScience Acquisition has been assessed as zero. During the three and six months ended June 30, 2022, the Company recognized contingent consideration gains of $8.8 million and $9.0 million, respectively, due to the reduced probability of meeting the contingent consideration milestones by December 31, 2023, the expiration date for achieving the milestones. The Company recognized a $0.1 million contingent consideration charge and a $1.0 million gain during the three and six months ended June 30,2021, respectively.
At June 30, 2022, the weighted average discount rate was 12.5% and the probability of success for the regulatory milestone that has not yet been met was reduced to 0. As of June 30, 2022 and December 31, 2021, a contingent consideration liability related to the MyoScience Acquisition has been recognized in the amounts of $2.1 million and $11.2 million, respectively.
The following table includes the key assumptions used in the valuation of the Company’s contingent consideration:
| | | | | | | | | | | | | | |
| Assumption | | Flexion Ranges Utilized as of June 30, 2022 | | MyoScience Ranges
Utilized as of
June 30, 20222023
|
| Discount rates | | 12.64%9.4% to 14.37% | | 11.69% to 13.34%11.0% |
| Probabilities of payment for regulatory milestones | | 5%0% to 15% | | 0%12.5% |
| Projected years of payment for regulatory and commercial milestones | | 2027 to 2030 | | 2023 |
The change in the Company’s contingent consideration recorded at fair value using Level 3 measurements is as follows (in thousands): | | | | | | | | |
| | Contingent Consideration
Fair Value |
| Balance at December 31, 2021 | | $ | 57,598 | |
| Fair value adjustments and accretion | | (29,476) | |
| Balance at December 31, 2022 | | 28,122 | |
| Fair value adjustments and accretion | | (22,351)(6,640) | |
| | |
| | |
Balance at June 30, 20222023 | | $ | 35,24721,482 | |
Pacira BioSciences, Inc. | Q2 2022 Form 10-Q | Page 23
Available-for-Sale Investments
Short-term investments consist of asset-backed securities collateralized by credit card receivables, investment grade commercial paper and corporate, federal agency and government bonds with maturities greater than three months, but less than one year. Noncurrent investments consist of federal agency bonds and government bonds with maturities greater than one year but less than three years. Net unrealized gains and losses (excluding credit losses, if any) from the Company’s short-term investments are reported in other comprehensive income (loss).income. At June 30, 20222023 and December 31, 2021,2022, all of the Company’s short-term and noncurrent investments are classified as available-for-sale investments and are determined to be Level 2 instruments,
Pacira BioSciences, Inc. | Q2 2023 Form 10-Q | Page 21
which are measured at fair value using standard industry models with observable inputs. The fair value of the commercial paper is measured based on a standard industry model that uses the three-month U.S. Treasury bill rate as an observable input. The fair value of the asset-backed securities and corporate bonds is principally measured or corroborated by trade data for identical issues in which related trading activity is not sufficiently frequent to be considered a Level 1 input or that of comparable securities. At the time of purchase, all short-termavailable-for-sale investments had an “A” or better rating by Standard & Poor’s.
The following summarizes the Company’s short-term and noncurrent available-for-sale investments at June 30, 20222023 and December 31, 20212022 (in thousands):
| | June 30, 2022 Investments | | Cost | | Gross
Unrealized
Gains | | Gross
Unrealized
Losses | | Fair Value
(Level 2) | |
| | June 30, 2023 Investments | | June 30, 2023 Investments | | Cost | | Gross
Unrealized
Gains | | Gross
Unrealized
Losses | | Fair Value
(Level 2) |
| Current: | | Current: | | | | | | | | |
| Asset-backed securities | Asset-backed securities | | $ | 30,906 | | | $ | — | | | $ | (239) | | | $ | 30,667 | | Asset-backed securities | | $ | 5,972 | | | $ | — | | | $ | (16) | | | $ | 5,956 | |
| Commercial paper | Commercial paper | | 138,705 | | | — | | | (796) | | | 137,909 | | Commercial paper | | 49,007 | | | — | | | (99) | | | 48,908 | |
| Corporate bonds | | 6,288 | | | — | | | (31) | | | 6,257 | | |
| U.S. Government bonds | | 19,531 | | | — | | | (32) | | | 19,499 | | |
| | U.S. federal agency bonds | | U.S. federal agency bonds | | 64,789 | | | — | | | (314) | | | 64,475 | |
| U.S. government bonds | | U.S. government bonds | | 14,697 | | | — | | | (80) | | | 14,617 | |
| | | Total | Total | | $ | 195,430 | | | $ | — | | | $ | (1,098) | | | $ | 194,332 | | Total | | $ | 134,465 | | | $ | — | | | $ | (509) | | | $ | 133,956 | |
| | December 31, 2021 Investments | | Cost | | Gross
Unrealized
Gains | | Gross
Unrealized
Losses | | Fair Value
(Level 2) | |
| | December 31, 2022 Investments | | December 31, 2022 Investments | | Cost | | Gross
Unrealized
Gains | | Gross
Unrealized
Losses | | Fair Value
(Level 2) |
| Current: | | Current: | | | | | | | | |
| Asset-backed securities | Asset-backed securities | | $ | 3,182 | | | $ | — | | | $ | — | | | $ | 3,182 | | Asset-backed securities | | $ | 6,836 | | | $ | — | | | $ | (3) | | | $ | 6,833 | |
| Commercial paper | Commercial paper | | 57,533 | | | 80 | | | (2) | | | 57,611 | | Commercial paper | | 134,423 | | | 23 | | | (386) | | | 134,060 | |
| Corporate bonds | | 9,936 | | | 102 | | | — | | | 10,038 | | |
| | Total | | $ | 70,651 | | | $ | 182 | | | $ | (2) | | | $ | 70,831 | | |
| U.S. federal agency bonds | | U.S. federal agency bonds | | 41,971 | | | — | | | (337) | | | 41,634 | |
| U.S. government bonds | | U.S. government bonds | | 2,003 | | | — | | | (18) | | | 1,985 | |
| Subtotal | | Subtotal | | $ | 185,233 | | | $ | 23 | | | $ | (744) | | | $ | 184,512 | |
| Noncurrent: | | Noncurrent: | | | | | | | | |
| | U.S. federal agency bonds | | U.S. federal agency bonds | | 22,783 | | | 2 | | | (66) | | | 22,719 | |
| U.S. government bonds | | U.S. government bonds | | 14,499 | | | — | | | (9) | | | 14,490 | |
| Subtotal | | Subtotal | | 37,282 | | | 2 | | | (75) | | | 37,209 | |
| Total | | Total | | $ | 222,515 | | | $ | 25 | | | $ | (819) | | | $ | 221,721 | |
At June 30, 2022,2023, there were no investments available for sale that were materially less than their amortized cost.
The Company elects to recognize its interest receivable separate from its available-for-sale investments. At June 30, 20222023 and December 31, 2021,2022, the interest receivable from its available-for-sale investments recognized in prepaid expenses and other current assets was $0.2$0.9 million and $0.1$0.8 million, respectively.
Credit Risk
Financial instruments that potentially subject the Company to concentrations of credit risk consist primarily of cash and cash equivalents, short-term and long-term available-for-sale investments and accounts receivable. The Company maintains its cash and cash equivalents with high-credit quality financial institutions. Such amounts may exceed federally-insured limits.
As of June 30, 2023, three wholesalers each accounted for over 10% of the Company’s accounts receivable, at 36%, 21% and 15%. At December 31, 2022, 3three wholesalers each accounted for over 10% of the Company’s accounts receivable, at 34%, 17%19% and 17%. At December 31, 2021, 4 wholesalers each accounted for over 10% of the Company’s accounts receivable, at 30%, 20%, 17% and 11%18%. For additional information regarding the Company’s wholesalers, see Note 2, Summary of Significant Accounting Policies. EXPAREL and ZILRETTA revenues are primarily derived from major wholesalers and specialty distributors that generally have significant cash resources. The Company performs ongoing credit evaluations of its customers as warranted and generally does not require collateral. Allowances for credit losses on the Company’s accounts receivable are maintained based on historical payment patterns, current and estimated future economic conditions, aging of accounts receivable and its write-off history. As of June 30, 20222023 and December 31, 2021,2022, the Company did not deem any allowances for credit losses on its accounts receivable necessary.
Pacira BioSciences, Inc. | Q2 20222023 Form 10-Q | Page 2422
NOTE 11—10—STOCKHOLDERS’ EQUITY
Accumulated Other Comprehensive (Loss) IncomeLoss
The following tables illustrate the changes in the balances of the Company’s accumulated other comprehensive (loss) incomeloss for the periods presented (in thousands):
| | | | | | | | | | | | | | | | | | | | |
| | Net Unrealized (Loss) Gain From Available
For Sale Investments | | Unrealized Foreign Currency Translation | | Accumulated Other Comprehensive (Loss) Income |
| Balance at December 31, 2021 | | $ | 139 | | | $ | 28 | | | $ | 167 | |
| Net unrealized loss on investments, net of tax | | (893) | | | — | | | (893) | |
| Foreign currency translation adjustments | | — | | | 121 | | | 121 | |
| | | | | | |
| Balance at June 30, 2022 | | $ | (754) | | | $ | 149 | | | $ | (605) | |
| | | | | | | | | | | | | | | | | | | | |
| | Net Unrealized Gain (Loss) From Available-For-Sale Investments | | Unrealized Foreign Currency Translation | | Accumulated Other Comprehensive Loss |
| Balance at December 31, 2022 | | $ | (523) | | | $ | 143 | | | $ | (380) | |
Net unrealized gain on investments, net of tax (1) | | 216 | | | — | | | 216 | |
| Foreign currency translation adjustments | | — | | | (9) | | | (9) | |
| | | | | | |
| Balance at June 30, 2023 | | $ | (307) | | | $ | 134 | | | $ | (173) | |
| | | Net Unrealized (Loss) Gain From Available
For Sale Investments | | Unrealized Foreign Currency Translation | | Accumulated Other Comprehensive (Loss) Income | | Net Unrealized (Loss) Gain From Available-For-Sale Investments | | Unrealized Foreign Currency Translation | | Accumulated Other Comprehensive (Loss) Income |
| Balance at December 31, 2020 | | $ | 319 | | | $ | (1) | | | $ | 318 | | |
| Balance at December 31, 2021 | | Balance at December 31, 2021 | | $ | 139 | | | $ | 28 | | | $ | 167 | |
Net unrealized loss on investments, net of tax | Net unrealized loss on investments, net of tax | | (138) | | | — | | | (138) | | Net unrealized loss on investments, net of tax | | (893) | | | — | | | (893) | |
| Foreign currency translation adjustments | Foreign currency translation adjustments | | — | | | 1 | | | 1 | | Foreign currency translation adjustments | | — | | | 121 | | | 121 | |
| Balance at June 30, 2021 | | $ | 181 | | | $ | — | | | $ | 181 | | |
| Balance at June 30, 2022 | | Balance at June 30, 2022 | | $ | (754) | | | $ | 149 | | | $ | (605) | |
(1) Net of a $0.2 million tax expense and $0.3 million tax benefit for the six months ended June 30, 2023 and 2022, respectively.
NOTE 12—11—STOCK PLANS
Stock Incentive Plans
The Company’s Amended and Restated 2011 Stock Incentive Plan, or 2011 Plan, was originally adopted by its board of directors and approved by its stockholders in June 2011 and was amended and restated in June 2014, June 2016, June 2019, June 2021 and June 2023. In June 2023, the Company’s stockholders approved the amendment and restatement which increased the number of shares of common stock authorized for issuance as equity awards under the 2011 Plan by 3,300,000 shares. The 2011 Plan allows the granting of incentive stock options, non-statutory stock options, restricted stock units and other stock-based awards.
Stock-Based Compensation
The Company recognized stock-based compensation expense in the periods presented as follows (in thousands):
| | | Three Months Ended
June 30, | | Six Months Ended
June 30, | | Three Months Ended
June 30, | | Six Months Ended
June 30, |
| | 2022 | | 2021 | | 2022 | | 2021 | | 2023 | | 2022 | | 2023 | | 2022 |
| Cost of goods sold | Cost of goods sold | | $ | 1,478 | | | $ | 1,465 | | | $ | 2,830 | | | $ | 2,917 | | Cost of goods sold | | $ | 1,436 | | | $ | 1,478 | | | $ | 3,160 | | | $ | 2,830 | |
| Research and development | Research and development | | 1,520 | | | 1,329 | | | 2,978 | | | 2,435 | | Research and development | | 1,722 | | | 1,520 | | | 3,597 | | | 2,978 | |
| Selling, general and administrative | Selling, general and administrative | | 8,546 | | | 7,667 | | | 16,925 | | | 15,219 | | Selling, general and administrative | | 7,797 | | | 8,546 | | | 16,188 | | | 16,925 | |
| Total | Total | | $ | 11,544 | | | $ | 10,461 | | | $ | 22,733 | | | $ | 20,571 | | Total | | $ | 10,955 | | | $ | 11,544 | | | $ | 22,945 | | | $ | 22,733 | |
| | Stock-based compensation from: | Stock-based compensation from: | | Stock-based compensation from: | |
| Stock options | Stock options | | $ | 6,542 | | | $ | 6,552 | | | $ | 13,327 | | | $ | 13,048 | | Stock options | | $ | 5,742 | | | $ | 6,542 | | | $ | 12,206 | | | $ | 13,327 | |
| Restricted stock units | Restricted stock units | | 4,717 | | | 3,646 | | | 8,830 | | | 7,038 | | Restricted stock units | | 4,969 | | | 4,717 | | | 10,219 | | | 8,830 | |
| Employee stock purchase plan | Employee stock purchase plan | | 285 | | | 263 | | | 576 | | | 485 | | Employee stock purchase plan | | 244 | | | 285 | | | 520 | | | 576 | |
| Total | Total | | $ | 11,544 | | | $ | 10,461 | | | $ | 22,733 | | | $ | 20,571 | | Total | | $ | 10,955 | | | $ | 11,544 | | | $ | 22,945 | | | $ | 22,733 | |
|
Pacira BioSciences, Inc. | Q2 20222023 Form 10-Q | Page 2523
Equity Awards
The following tables contain information about the Company’s stock option and restricted stock unit, or RSU, activity for the six months ended June 30, 2022:2023:
| | Stock Options | Stock Options | | Number of Options | | Weighted Average Exercise Price (Per Share) | Stock Options | | Number of
Stock Options | | Weighted Average Exercise Price (Per Share) |
| Outstanding at December 31, 2021 | | 6,050,540 | | | $ | 49.32 | | |
| Outstanding at December 31, 2022 | | Outstanding at December 31, 2022 | | 6,272,994 | | | $ | 52.38 | |
| Granted | Granted | | 1,010,780 | | | 60.22 | | Granted | | 1,426,343 | | | 39.15 | |
| Exercised | Exercised | | (630,413) | | | 34.80 | | Exercised | | (61,896) | | | 30.91 | |
| Forfeited | Forfeited | | (54,215) | | | 52.41 | | Forfeited | | (106,927) | | | 57.38 | |
| Expired | Expired | | (13,054) | | | 85.48 | | Expired | | (88,438) | | | 55.06 | |
| Outstanding at June 30, 2022 | | 6,363,638 | | | 52.39 | | |
| Outstanding at June 30, 2023 | | Outstanding at June 30, 2023 | | 7,442,076 | | | 49.91 | |
| | Restricted Stock Units | Restricted Stock Units | | Number of Units | | Weighted Average Grant Date Fair Value (Per Share) | Restricted Stock Units | | Number of
Restricted
Stock Units | | Weighted Average Grant Date Fair Value (Per Share) |
| Unvested at December 31, 2021 | | 955,277 | | | $ | 52.85 | | |
| Unvested at December 31, 2022 | | Unvested at December 31, 2022 | | 1,149,462 | | | $ | 57.26 | |
| Granted | Granted | | 568,049 | | | 60.63 | | Granted | | 759,762 | | | 39.24 | |
| Vested | Vested | | (298,607) | | | 49.65 | | Vested | | (368,641) | | | 54.96 | |
| Forfeited | Forfeited | | (44,929) | | | 54.16 | | Forfeited | | (95,349) | | | 58.56 | |
| Unvested at June 30, 2022 | | 1,179,790 | | | 57.36 | | |
| Unvested at June 30, 2023 | | Unvested at June 30, 2023 | | 1,445,234 | | | 48.27 | |
The weighted average fair value of stock options granted during the six months ended June 30, 20222023 was$25.69 $16.22 per share. The fair values of stock options granted were estimated using the Black-Scholes option valuation model with the following weighted average assumptions:
| | | | | | | | |
| Black-Scholes Weighted Average Assumption | | Six Months Ended June 30, 20222023 |
| Expected dividend yield | | None |
| Risk-free interest rate | | 2.83%4.00% |
| Expected volatility | | 45.15%41.32% |
| Expected term of options | | 4.924.86 years |
Employee Stock Purchase Plan
In June 2022, theThe Company’s stockholders approved the Amended and Restated 2014 Employee Stock Purchase Plan, or ESPP. The ESPP was amended to increase the number of shares of common stock that may be sold under the ESPP by an additional 500,000 shares.
The ESPP, features 2two six-month offering periods per year, running from January 1 to June 30 and July 1 to December 31. Under the ESPP, employees may elect to contribute after-tax earnings to purchase shares at 85% of the closing fair market value of the Company’s common stock on either the offering date or the purchase date, whichever is less.lesser. During the six months ended June 30, 2022, 36,7292023, 50,634 shares were purchased and issued through the ESPP.
Pacira BioSciences, Inc. | Q2 20222023 Form 10-Q | Page 2624
NOTE 13—12—NET INCOME (LOSS) PER SHARE
Basic net income (loss) per common share is calculated by dividing the net income (loss) attributable to common shares by the weighted average number of common shares outstanding during the period. Diluted net income (loss) per common share is calculated by dividing the net income (loss) attributable to common shares by the weighted average number of common shares outstanding plus dilutive potential common shares outstanding during the period.
ASU 2020-06 was adopted on January 1, 2022Potential common shares include the shares of common stock issuable upon the exercise of outstanding stock options, the vesting of RSUs and requires the Company to usepurchase of shares from the if-converted method to calculateESPP (using the number of potentially dilutivetreasury stock method), if applicable. Potential common shares forassociated with convertible debt. Undernotes are treated under the if-converted method, adjustments are made to the diluted net income (loss) per common share calculation as if the Company had converted the convertible debt on the first day of each period presented. Adjustments to the numerator are made to add back the interest expense associated with the convertible debt on a post-tax basis. Adjustments to the denominator reflect the number of shares assumed to be convertible at the beginning of the period. For additional information regarding ASU 2020-06, see Note 2, Summary of Significant Accounting Policies. Prior to January 1, 2022, the Company used the treasury stock method to calculate dilutive shares on its convertible debt.
Potential common shares include the shares of common stock issuable upon the exercise of outstanding stock options, the vesting of RSUs and the purchase of shares from the ESPP (using the treasury stock method), if applicable.
Potential common shares are excluded from the diluted net income (loss) per common share computation to the extent they would be antidilutive.
The following table sets forth the computation of basic and diluted net income per common share for the three and six months ended June 30, 20222023 and 20212022 (in thousands, except per share amounts):
| | | | | | | | | | | | | | | | | | | | | | | |
| Three Months Ended
June 30, | | Six Months Ended
June 30, |
| 2022 | | 2021 | | 2022 | | 2021 |
| Numerator: | | | | | | | |
| Net income—basic | $ | 19,876 | | | $ | 19,081 | | | $ | 26,704 | | | $ | 29,450 | |
| ASU 2020-06 convertible notes if-converted method adjustment | 1,039 | | | — | | | 2,078 | | | — | |
| | | | | | | |
| Adjusted net income—diluted | 20,915 | | | 19,081 | | | 28,782 | | | 29,450 | |
| | | | | | | |
| | | | | | | |
| | | | | | | |
| | | | | | | |
| | | | | | | |
| Denominator: | | | | | | | |
| Weighted average common shares outstanding—basic | 45,501 | | | 44,145 | | | 45,185 | | | 43,989 | |
| Computation of diluted securities: | | | | | | | |
| ASU 2020-06 convertible notes if-converted method adjustment | 5,607 | | | — | | | 5,607 | | | — | |
| Dilutive effect of stock options | 1,016 | | | 1,062 | | | 1,106 | | | 1,284 | |
| Dilutive effect of RSUs | 347 | | | 381 | | | 360 | | | 426 | |
| Dilutive effect of conversion premium on the 2022 Notes | — | | | — | | | — | | | 76 | |
| Dilutive effect of ESPP purchase options | 7 | | | 4 | | | 4 | | | 4 | |
| | | | | | | |
| Weighted average common shares outstanding—diluted | 52,478 | | | 45,592 | | | 52,262 | | | 45,779 | |
| Net income per share: | | | | | | | |
| Basic net income per common share | $ | 0.44 | | | $ | 0.43 | | | $ | 0.59 | | | $ | 0.67 | |
| Diluted net income per common share | $ | 0.40 | | | $ | 0.42 | | | $ | 0.55 | | | $ | 0.64 | |
Pacira BioSciences, Inc. | Q2 2022 Form 10-Q | Page 27
| | | | | | | | | | | | | | | | | | | | | | | |
| Three Months Ended
June 30, | | Six Months Ended
June 30, |
| 2023 | | 2022 | | 2023 | | 2022 |
| Numerator: | | | | | | | |
| Net income—basic | $ | 25,763 | | | $ | 19,876 | | | $ | 6,227 | | | $ | 26,704 | |
| ASU 2020-06 convertible notes if-converted method adjustment | 1,029 | | | 1,039 | | | — | | | 2,078 | |
| | | | | | | |
| Adjusted net income—diluted | $ | 26,792 | | | $ | 20,915 | | | $ | 6,227 | | | $ | 28,782 | |
| | | | | | | |
| | | | | | | |
| | | | | | | |
| | | | | | | |
| | | | | | | |
| Denominator: | | | | | | | |
| Weighted average common shares outstanding—basic | 46,088 | | | 45,501 | | | 46,019 | | | 45,185 | |
| Computation of diluted securities: | | | | | | | |
| ASU 2020-06 convertible notes if-converted method adjustment | 5,607 | | | 5,607 | | | — | | | 5,607 | |
| Dilutive effect of stock options | 108 | | | 1,016 | | | 92 | | | 1,106 | |
| Dilutive effect of RSUs | 244 | | | 347 | | | 170 | | | 360 | |
| Dilutive effect of ESPP purchase options | 7 | | | 7 | | | 4 | | | 4 | |
| Weighted average common shares outstanding—diluted | 52,054 | | | 52,478 | | | 46,285 | | | 52,262 | |
| Net income per share: | | | | | | | |
| Basic net income per common share | $ | 0.56 | | | $ | 0.44 | | | $ | 0.14 | | | $ | 0.59 | |
| Diluted net income per common share | $ | 0.51 | | | $ | 0.40 | | | $ | 0.13 | | | $ | 0.55 | |
The following table summarizes the outstanding stock options, RSUs and convertible senior notes that were excluded from the diluted net income per common share calculation because the effects of including these potential shares were antidilutive in the periods presented (in thousands): | | | Three Months Ended
June 30, | | Six Months Ended
June 30, | | Three Months Ended
June 30, | | Six Months Ended
June 30, |
| | 2022 | | 2021 | | 2022 | | 2021 | | 2023 | | 2022 | | 2023 | | 2022 |
| Weighted average number of stock options | Weighted average number of stock options | 1,948 | | | 2,088 | | | 1,855 | | | 1,489 | | Weighted average number of stock options | 5,404 | | | 1,948 | | | 5,403 | | | 1,855 | |
| Convertible senior notes | Convertible senior notes | — | | | — | | | 1,196 | | | — | | Convertible senior notes | — | | | — | | | 5,607 | | | 1,196 | |
| Weighted average number of RSUs | Weighted average number of RSUs | 31 | | | 26 | | | 24 | | | 14 | | Weighted average number of RSUs | 701 | | | 31 | | | 759 | | | 24 | |
| | Total | Total | 1,979 | | | 2,114 | | | 3,075 | | | 1,503 | | Total | 6,105 | | | 1,979 | | | 11,769 | | | 3,075 | |
For the six months ended June 30, 2023, the antidilutive impact associated with the convertible senior notes would have included an interest expense add-back to net income of $2.1 million.
Pacira BioSciences, Inc. | Q2 2023 Form 10-Q | Page 25
NOTE 14—13—INCOME TAXES
Income before income taxes and income tax expense isare as follows (dollar amounts in thousands):
| | | Three Months Ended
June 30, | | Six Months Ended
June 30, | | Three Months Ended
June 30, | | Six Months Ended
June 30, |
| | 2022 | | 2021 | | 2022 | | 2021 | | 2023 | | 2022 | | 2023 | | 2022 |
| Income (loss) before income taxes: | Income (loss) before income taxes: | | | | | | | | Income (loss) before income taxes: | | | | | | | |
| Domestic | Domestic | $ | 23,798 | | | $ | 25,863 | | | $ | 30,380 | | | $ | 41,795 | | Domestic | $ | 40,189 | | | $ | 23,798 | | | $ | 12,416 | | | $ | 30,380 | |
| Foreign | Foreign | (1,791) | | | (215) | | | (1,079) | | | (3,424) | | Foreign | (2,335) | | | (1,791) | | | (1,036) | | | (1,079) | |
| Total income before income taxes | Total income before income taxes | $ | 22,007 | | | $ | 25,648 | | | $ | 29,301 | | | $ | 38,371 | | Total income before income taxes | $ | 37,854 | | | $ | 22,007 | | | $ | 11,380 | | | $ | 29,301 | |
| | Income tax expense | Income tax expense | $ | 2,131 | | | $ | 6,567 | | | $ | 2,597 | | | $ | 8,921 | | Income tax expense | $ | 12,091 | | | $ | 2,131 | | | $ | 5,153 | | | $ | 2,597 | |
| Effective tax rate | Effective tax rate | 10 | % | | 26 | % | | 9 | % | | 23 | % | Effective tax rate | 32 | % | | 10 | % | | 45 | % | | 9 | % |
|
The Company’s income tax expense represents the estimated annual effective tax rate applied to the year-to-date domestic operating resultsresults adjusted for certain discrete tax items.
The Company’s effective tax rates for the three and six months ended June 30, 2023 includes costs related to non-deductible stock-based compensation, a valuation allowance recorded against non-U.S. results and non-deductible executive compensation. The Company’s effective tax rate for the three and six months ended June 30, 2022 includeincludes benefits related to stock-based compensation, a first quarter Skyepharma milestone payment and a fair value adjustment for Flexion contingent consideration, partially offset by non-deductiblenondeductible executive compensation costs and a valuation allowance against non-U.S. results. The Company’s effective tax rates for the three and six months ended June 30, 2021 include benefits related to stock-based compensation offset by non-deductible executive compensation costs and valuation allowances recorded against deductible capital losses and non-U.S. results.
NOTE 15—ACQUISITION–RELATED14—ACQUISITION-RELATED (GAINS) CHARGES, PRODUCT DISCONTINUATIONRESTRUCTURING CHARGES AND OTHER
Acquisition-related (gains) charges, product discontinuationrestructuring charges and other for the three and six months ended June 30, 20222023 and 20212022 summarized below (in thousands):
| | | | | | | | | | | | | | | | | | | | | | | |
| Three Months Ended
June 30, | | Six Months Ended
June 30, |
| 2022 | | 2021 | | 2022 | | 2021 |
| Severance-related expenses | $ | 950 | | | $ | — | | | $ | 4,065 | | | $ | — | |
| Acquisition-related fees | 2,168 | | | 7 | | | 4,013 | | | 7 | |
| Other acquisition expenses | 104 | | | — | | | 552 | | | — | |
| Total acquisition-related charges | 3,222 | | | 7 | | | 8,630 | | | 7 | |
| Flexion contingent consideration | (12,523) | | | — | | | (13,317) | | | — | |
| MyoScience contingent consideration | (8,757) | | | 139 | | | (9,034) | | | (988) | |
| Nuance Biotech Co. Ltd. agreement dissolution costs | — | | | — | | | — | | | 3,000 | |
| Total acquisition-related (gains) charges, product discontinuation and other | $ | (18,058) | | | $ | 146 | | | $ | (13,721) | | | $ | 2,019 | |
Pacira BioSciences, Inc. | Q2 2022 Form 10-Q | Page 28
| | | | | | | | | | | | | | | | | | | | | | | |
| Three Months Ended
June 30, | | Six Months Ended
June 30, |
| 2023 | | 2022 | | 2023 | | 2022 |
| Severance-related expenses | $ | — | | | $ | 950 | | | $ | — | | | $ | 4,065 | |
| Acquisition-related fees | 709 | | | 2,168 | | | 1,198 | | | 4,013 | |
| Other acquisition expenses | — | | | 104 | | | — | | | 552 | |
| Total acquisition-related charges | 709 | | | 3,222 | | | 1,198 | | | 8,630 | |
| Flexion contingent consideration | (18,258) | | | (12,523) | | | (6,640) | | | (13,317) | |
| MyoScience contingent consideration | — | | | (8,757) | | | — | | | (9,034) | |
| | | | | | | |
| Restructuring charges | 936 | | | — | | | 936 | | | — | |
| Total acquisition-related (gains) charges, restructuring charges and other | $ | (16,613) | | | $ | (18,058) | | | $ | (4,506) | | | $ | (13,721) | |
Flexion Acquisition
The Company recognized acquisition-related costs of $0.7 million and $1.2 million during the three and six months endedJune 30, 2023, respectively, primarily related to the remaining Flexion leases. The Company recognized acquisition-related costs of $3.2 million and $8.6 million during the three and six months ended June 30, 2022, respectively,, primarily forrelated to severance, legal fees, third-party services and other one-time charges related to the Flexion Acquisition. See Note 4, Flexion Acquisition, for more information.charges.
On November 19, 2021, as part of the purchase priceThe Company recognized $18.3 million and $6.6 million contingent consideration related to the Flexion Acquisition, the Company recorded contingent consideration of $45.2 million, which represents the Company’s potential achievement of meeting regulatory and sales-based milestones. Duringgains during the three and six months ended June 30, 2022, the2023, respectively. The Company recordedrecognized $12.5 million and $13.3 million gains, respectively, due to a decrease to the fair value of its contingent consideration which was included in acquisition-related (gains) charges ingains during the condensed consolidated statements of operations.three and six months endedJune 30, 2022, respectively. See Note 109, Financial Instruments, for information regarding the method, key assumptions used in the fair value measurements of contingent consideration and more information regarding the changes in fair value.
Pacira BioSciences, Inc. | Q2 2023 Form 10-Q | Page 26
MyoScience Acquisition
The Company recognized $8.8 million and $9.0 million of contingent consideration gains during the three and six months ended June 30, 2022, respectively. The Company recognized a $0.1 million contingent consideration charge and a $1.0 million gain during the three and six months ended June 30, 2021, respectively.2022, respectively. See Note 109, Financial Instruments, for information regarding the method, key assumptions used in the fair value measurements of contingent consideration and more information regarding the changes in fair value.
Nuance Biotech Co. Ltd.Restructuring Charges
In June 2018,June 2023, the Company implemented a restructuring plan in an effort to improve its operational efficiencies. The restructuring charges are predominantly related to one-time employee termination benefits through a reduction of headcount, such as severance and related costs. During the Company entered an agreement with Nuance Biotech Co. Ltd., or Nuance, a China-based specialty pharmaceutical company, to advance the developmentthree and commercialization of EXPAREL in China. Under the terms of the agreement, the Company had granted Nuance the exclusive rights to develop and commercialize EXPAREL. In April 2021, the Company and Nuance agreed to a mutual termination of the agreement due to the lack of a viable regulatory pathway that adequately safeguards the Company’s intellectual property against the risk of a generic product. Dissolution costs of $3.0 million were included in other operating expenses in the condensed consolidated statements of operations for the six months ended June 30, 2023, t2021.he Company recognized $0.9 million of restructuring charges, of which $0.4 million was paid. The remaining $0.5 million is expected to be paid in the third quarter of 2023.
NOTE 16—15—COMMITMENTS AND CONTINGENCIES
From time to time, the Company has been and may again become involved in legal proceedings arising in the ordinary course of its business, including those related to patents, product liability and government investigations. Except as described below, the Company is not presently a party to any legal proceedings that it believes to be material, and is not aware of any pending or threatened litigation against the Company which it believes could have a material adverse effect on its business, operating results, financial condition or cash flows.
MyoScience Milestone Litigation
In August 2020, the Company and its subsidiary, Pacira CryoTech, Inc. (“Pacira CryoTech”), filed a lawsuit in the Court of Chancery of the State of Delaware against Fortis Advisors LLC (“Fortis”), solely in its capacity as representative for the former securityholders of MyoScience, and certain other defendants, seeking declaratory judgment with respect to certain terms of the merger agreement for the MyoScience Acquisition (the “Merger“MyoScience Merger Agreement”), specifically related to the achievement of certain milestone payments under the MyoScience Merger Agreement. In addition, the Company and Pacira CryoTech sought general, special and compensatory damages against the other defendants related to breach of fiduciary duties in connection with the purported achievement of milestone payments under the MyoScience Merger Agreement, and breach of the MyoScience Merger Agreement and certain other agreements with the defendants. In October 2020, Fortis filed an answer and counterclaim against the Company and Pacira CryoTech seeking to recover certain milestone payments under the MyoScience Merger Agreement. The total remaining value of these milestones is $30.0 million, plus attorneys’ fees. The Company believes that the counterclaim from Fortis is without merit and intends to vigorously defend against all claims. A trial is expected to commence in the second half of 2023. The Company is unable to predict the outcome of this action at this time.
eVenus Pharmaceutical Laboratories Litigations
In October 2021, the Company received a Notice Letter advising that eVenus Pharmaceutical Laboratories, Inc., or eVenus, of Princeton, New Jersey, submitted to the FDA an Abbreviated New Drug Application, (ANDA)or ANDA with a Paragraph IV certification seeking authorization for the manufacturing and marketing of a generic version of EXPAREL (266 mg/20 mL) in the U.S. prior to the expiration of U.S. Patent No. 11,033,495 (the ’495 patent).
Pacira BioSciences, Inc. | Q2 2022 Form 10-Q | Page 29
In November 2021, the Company filed a patent infringement suit against eVenus and its parent company in the U.S. District Court for the District of New Jersey (21-cv-19829) asserting infringement of the ’495 patent. This triggered an automatic 30-month stay of final approval of the eVenus ANDA. On January 6, 2022, eVenus filed an Answer with counterclaims to the Complaint, alleging the ’495 patent is invalid and/or not infringed through the manufacture, sale, or offer for sale of the product described in product described in eVenus’s ANDA submission.
In December 2021, the Company received a second Notice Letter advising that eVenus submitted to the FDA an amendment to its ANDA with a Paragraph IV Certification seeking authorization for the manufacturing and marketing of a generic version of EXPAREL (133 mg/10 mL) in the U.S. prior to the expiration of the ’495 patent. In the Notice Letter, eVenus also advised that it submitted a Paragraph IV Certification to the FDA seeking authorization for the manufacturing and marketing of a generic version of EXPAREL (266 mg/20 mL and 133 mg/10 mL) in the U.S. prior to the expiration of U.S. Patent No. 11,179,336 (the ’336 patent). eVenus further alleges in the Notice Letter that both the ’495 patent and the ’366’336 patent are invalid and/or not infringed.
In February 2022, the Company filed a second patent infringement suit against eVenus and its parent company in the U.S. District Court for the District of New Jersey (22-cv-00718) asserting that the 133 mg/10 mL ANDA product will infringe the ’495 and ’336 patents and that the 266 mg/20 mL ANDA product will infringe the ’336 patent. This filing triggered a second
Pacira BioSciences, Inc. | Q2 2023 Form 10-Q | Page 27
automatic 30-month stay of final approval for the 133 mg/10 mL ANDA product. The first and second patent infringement suits were consolidated.
In February 2023, eVenus filed its first amended answer to the first amended complaint, alleging patent invalidity, non-infringement and inequitable conduct. The Company has denied the allegations in eVenus’s first amended answer.
In April 2023, the Company filed a third patent infringement suit against eVenus, its parent company, and Fresenius Kabi USA, LLC, in the U.S. District Court for the District of New Jersey (23-cv-2367) asserting that the 133 mg/10 mL and 266 mg/20 mL ANDA products will infringe U.S. Patent No. 11,426,348 (the ’348 patent). In July 2023, eVenus filed its answer with claims for declaratory judgment, alleging patent invalidity, non-infringement and inequitable conduct with respect to the ’348 patent as well as the Company’s other patents, U.S. Patent Nos. 11,278,494; 11,304,904; 11,311,486; 11,357,727 and 11,452,691.
These litigations are in their infancy,early stages, and the Company is unable to predict thetheir outcome of this action at this time.
Research Development Foundation
Pursuant to an agreement with the Research Development Foundation, or RDF, the Company was required to pay RDF a low single-digit royalty on the collection of revenues from certain products, for as long as certain patents assigned to the Company under the agreement remain valid. RDF has the right to terminate the agreement for an uncured material breach by the Company, in connection with its bankruptcy or insolvency or if it directly or indirectly opposes or disputes the validity of the assigned patent rights. The Company’s U.S. Patent No. 11,033,495 was’495 patent issued on June 15, 2021. Thereafter, RDF asserted that the issuance of that patent extends the Company’s royalty obligations under the agreement until 2041. The Company believes that the royalty period under the agreement was set to endended on December 24, 2021 with the expiration of its U.S. Patent No. 9,585,838. Because of the disagreement over the interpretation of the agreement, in December 2021, the Company filed a declaratory judgment lawsuit in the U.S. District Court for the District of Nevada (21-cv-02241). The lawsuit seeks a declaration from the court that the Company owes no royalties to RDF with respect to its EXPAREL product after December 24, 2021. During the pendency of the lawsuit, the Company will continue to pay royalties to RDF under protest, however, the Company is unable to predict the outcome of this action at this time.
Other Commitments and Contingencies
Pediatric Trial Commitments
The FDA, as a condition of EXPAREL approval, has required the Company to study EXPAREL in pediatric patients, as well as the administration of EXPARELfor infiltration and as a nervebrachial plexus block in the pediatric setting. The Company was granted a deferraldeferrals for the required pediatric trials until after the indications were approved in adults. Similarly, in Europe, the Company agreed with the European Medicines Agency, or EMA, on a Pediatric Investigation Plan as a prerequisite for submitting a Marketing Authorization Application (MAA) in the E.U. Despite the U.K.’s withdrawal from the E.U., the agreed pediatric plan is applicable in the U.K.
In December 2019, the Company announced positive results for its extended pharmacokinetic and safety study (“PLAY”) for local analgesia in children aged six to 17 undergoing cardiovascular or spine surgeries. Those positive results were the basis for the submission of a supplemental New Drug Application, or sNDA, in the U.S. and Type II variations in the E.U. and U.K. to expand the EXPAREL label to include use in patients six years of age and older for single-dose infiltration to produce postsurgical local analgesia. In March 2021, the Company announced that the FDA approved the submission of the sNDA in the U.S. In the E.U. and U.K., the Company also submitted the results of the PLAY study as Type II variations in the E.U. and U.K. to include the use of EXPAREL in children aged six years or older as a field block for treatment of somatic post-operative pain for small- to medium-sized wounds. The EMA and the Medicines and Healthcare Products Regulatory Agency, or MHRA, are still reviewingin the Type II variations.
U.K. both approved the variations in their respective regions in November 2022. The Company is working with the FDA, MAAEMA and MHRA to finalize the regulatory pathway for its remaining pediatric commitments.
Hong Kong Pharma Tainuo Ltd.Contingent Milestone Payments
Refer to Note 9, Financial Instruments, for information on potential contingent milestone payments related to the Flexion Acquisition and MyoScience Acquisition.
PCRX-201
PCRX-201, a novel, intra-articular gene therapy product candidate that produces the anti-inflammatory protein interleukin-1 receptor antagonist (IL-1Ra) treating OA pain in the knee, was added to the Company’s portfolio as part of the Flexion Acquisition in November 2021. Prior to the Flexion Acquisition, in March 2020,February 2017, Flexion entered into an exclusive license agreement with Hong Kong Tainuo Pharma Ltd., or HK Tainuo, and Jiangsu Tainuo Pharmaceutical Co. Ltd., or Jiangsu Tainuo, a subsidiary of ChinaGQ Bio Therapeutics GmbH (formerly named GeneQuine Biotherapeutics GmbH) to acquire the global rights to
Pacira BioSciences, Inc. | Q2 20222023 Form 10-Q | Page 3028
Shijiazhuang Pharmaceutical Co, Ltd., for the development and commercialization of ZILRETTA in Greater China (consisting of mainland China, Hong Kong, Macau and Taiwan). Under the termsPCRX-201, a gene therapy product candidate. As part of the agreement, HK Tainuo paid Flexion an upfront payment of $10.0 million during the year ended December 31, 2020 which was recorded in other liabilities as of June 30, 2022 and December 31, 2021. The Company was also eligible to receive up to $32.5an aggregate of $56.0 million of payments could become due upon the achievement of certain development and regulatory milestones, including up to $4.5 million through initiation of a Phase 2 proof of concept clinical trial and, following successful proof of concept, up to an additional $51.5 million in aggregate development and global regulatory and commercial salesapproval milestone payments under the exclusive license agreement. HK Tainuo was responsible for the clinical development, product registration and commercialization of ZILRETTA in Greater China. The Company was solely responsible for the manufacture and supply of ZILRETTA to HK Tainuo for all clinical and commercial activities. The terms related to product manufacturing and supply, including pricing and minimum purchase requirements agreed to in the license agreement, were to be covered by a separate supply agreement, which had not yet been finalized as of June 30, 2022. Unless terminated earlier in accordance with its terms, the license agreement was scheduled to continue in effect in perpetuity or as long as HK Tainuo or Jiangsu Tainuo continued to sell ZILRETTA in Greater China.payments.
Subsequently, in July 2022, the Company submitted a termination letter to HK Tainuo associated with this license agreement.
Pacira BioSciences, Inc. | Q2 20222023 Form 10-Q | Page 3129
Item 2. MANAGEMENT’S DISCUSSION AND ANALYSIS OF FINANCIAL CONDITION AND RESULTS OF OPERATIONS
Management’s Discussion and Analysis of Financial Condition and Results of Operations is based upon our condensed consolidated financial statements, which have been prepared in accordance with generally accepted accounting principles in the United States of America (GAAP) and in accordance with the rules and regulations of the United States Securities and Exchange Commission, or SEC.
This Quarterly Report on Form 10-Q and certain other communications made by us contain forward-looking statements within the meaning of Section 21E of the Securities Exchange Act of 1934, as amended (the “Exchange Act”), and the Private Securities Litigation Reform Act of 1995, including, without limitation, statements related to: the Flexion Acquisition (as defined below) and the costs and benefits thereof, our growth and future operating results and trends, our strategy, plans, objectives, expectations (financial or otherwise) and intentions, future financial results and growth potential, including our plans with respect to the repayment of our indebtedness, anticipated product portfolio, development programs, patent terms, development of products, strategic alliances patent terms and intellectual property. For this purpose, any statement that is not a statement of historical fact should be considered a forward-looking statement. We often use the words “believe,” “anticipate,” “plan,” “estimate,” “expect,” “intend,” “may,” “will,” “would,” “could,” “can” and similar expressions to help identify forward-looking statements. We cannot assure you that our estimates, assumptions and expectations will prove to have been correct. Actual results may differ materially from these indicated by such forward-looking statements as a result of various important factors, including risks relating to, among others: risks associated with acquisitions, such as the risk that the acquired businesses will not be integrated successfully, that such integration may be more difficult, time-consuming or costly than expected or that the expected benefits of the transaction will not occur; the possibility that if we do not achieve the perceived benefits of the Flexion Acquisition as rapidly or to the extent anticipated by financial analysts or investors, the market price of our shares could decline; thelingering impact of the COVID-19 pandemic on elective surgeries, our manufacturing and supply chain, global and United States, or U.S., economic conditions (including inflation and rising interest rates), and our business, including our revenues, financial condition, cash flows and results of operations; the success of our sales and manufacturing efforts in support of the commercialization of EXPAREL® (bupivacaine liposome injectable suspension), ZILRETTA® (triamcinolone acetonide extended-release injectable suspension) and iovera°® and; the rate and degree of market acceptance of EXPAREL, ZILRETTA and iovera°; the size and growth of the potential markets for EXPAREL, ZILRETTA and iovera° and our ability to serve those markets; our plans to expand the use of EXPAREL, ZILRETTA and iovera° to additional indications and opportunities, and the timing and success of any related clinical trials for EXPAREL, ZILRETTA and iovera°; the commercial success of EXPAREL, ZILRETTA and iovera°; the related timing and success of United States Food and Drug Administration, or FDA, supplemental New Drug Applications, or sNDAs, and premarket notification 510(k)s; the related timing and success of European Medicines Agency, or EMA, Marketing Authorization Applications, or MAA;MAAs; our plans to evaluate, develop and pursue additional product candidates utilizing our proprietary multivesicular liposome, or pMVL, drug delivery technology; the approval of the commercialization of our products in other jurisdictions; clinical trials in support of an existing or potential pMVL-based product; our commercialization and marketing capabilities,capabilities; our ability to successfully constructcomplete an additional EXPAREL manufacturing suitecapacity expansion project in San Diego, California; our ability to successfully complete a ZILRETTA capacity expansioncapital project in Swindon, England; the outcome of any litigation; the ability to successfully integrate Flexion or any future acquisitions into our existing business; the recoverability of our deferred tax assets; and assumptions associated with contingent consideration payments.
Important factors could cause our actual results to differ materially from those indicated or implied by forward-looking statements, and as such we anticipate that subsequent events and developments will cause our views to change. Except as required by applicable law, we undertake no intention or obligation to update or revise any forward-looking statements, whether as a result of new information, future events or otherwise, and readers should not rely on the forward-looking statements as representing our views as of any date subsequent to the date of the filing of this Quarterly Report on Form 10-Q.
These forward-looking statements involve known and unknown risks, uncertainties and other factors that may cause our actual results, levels of activity, performance or achievements to differ materially from those expressed or implied by these statements. These factors include items mentioned herein and the matters discussed and referenced in Part I-Item 1A. “Risk Factors” included in our Annual Report on Form 10-K for the year ended December 31, 20212022 (the “2022 Annual Report”) and in other reports as filed with the SEC.
Unless the context requires otherwise, references to “Pacira,” “we,” the “Company,” “us” and “our” in this Quarterly Report on Form 10-Q refer to Pacira BioSciences, Inc. and its subsidiaries.
Pacira BioSciences, Inc. | Q2 20222023 Form 10-Q | Page 3230
Overview
Pacira is the industry leader in our commitment to non-opioid pain management and providing a non-opioid optionpain management options to as many patients as possible to redefine the role of opioids as rescue therapy only. We are also developing innovative interventions to address debilitating conditions involving the sympathetic nervous system, such as cardiac electrical storm, chronic pain and spasticity. Our long-acting, local analgesic EXPAREL® (bupivacaine liposome injectable suspension) was commercially launched in April 2012. EXPAREL utilizes our unique pMVL drug delivery technology that encapsulates drugs without altering their molecular structure and releases them over a desired period of time. In the U.S., EXPAREL is the only opioid-free, long-acting local and regional analgesic approved for infiltration, field blocks and interscalene brachial plexus nerve block to produce local or regional postsurgical analgesia. EXPAREL is also approved for infiltration in pediatric patients aged six years and older in the U.S. In Europe, EXPAREL is approved as a brachial plexus block or femoral nerve block for treatment of post-operative pain in adults, and as a field block for treatment of somatic post-operative pain from small- to medium-sized surgical wounds in adults.adults and children aged six years and older. Since its initial approval in 2011, more than 1012 million patients have been treated with EXPAREL. We drop-ship EXPAREL directly to end-users based on orders placed to wholesalers or directly to us, and there is no product held by wholesalers. With the acquisition (the “Flexion Acquisition”) of Flexion Therapeutics, Inc. (“Flexion”), or Flexion, in November 2021 (the “Flexion Acquisition”), we acquired ZILRETTA® (triamcinolone acetonide extended-release injectable suspension), the first and only extended-release, intra-articular therapy that can provide major relief for osteoarthritis, or OA, knee pain for three months and has the potential to become an alternative to hyaluronic acid, or HA, and platelet rich plasma or PRP, injections or other early intervention treatments. With the acquisition of MyoScience, Inc., or MyoScience, in April 2019 (the “MyoScience Acquisition”) in April 2019,, we acquired iovera°®, a handheld cryoanalgesia device used to deliver a precise, controlled application of cold temperature only to targeted nerves, which we sell directly to end users. TheEXPAREL, ZILRETTA and the iovera° system isare highly complementary to EXPARELproducts as along-acting, non-opioid therapytherapies that alleviates pain by disrupting pain signals being transmitted to the brain from the site of injury or surgery. We also believe ZILRETTA is highly complementary to iovera°.
We expect to continue to pursue the expanded use of EXPAREL, ZILRETTA and iovera° in additional procedures; progress our earlier-stage product candidate pipeline; advance regulatory activities for EXPAREL, ZILRETTA, iovera° and our other product candidates; invest in sales and marketing resources for EXPAREL, ZILRETTA and iovera°; expand and enhance our manufacturing capacity for EXPAREL, ZILRETTA and iovera°; invest in products, businesses and technologies; and support legal matters.
Flexion Acquisition
In November 2021, we completed the Flexion Acquisition pursuant to an Agreement and Plan of Merger (the “Merger Agreement”), under which Flexion became our wholly owned subsidiary and added ZILRETTA, a non-opioid corticosteroid that employs a proprietary microsphere technology to provide extended pain relief, to our commercial offering. The addition of ZILRETTA to our innovative non-opioid product portfolio directly aligns with our mission to provide an opioid alternative to as many patients as possible and address medical needs along the neural pain pathway.
The total consideration of $578.8 million included an initial payment of $428.3 million which represented $8.50 in cash per share of Flexion common stock, $20.2 million paid to settle restricted stock units and in-the-money stock options, an $85.1 million cash payment to repay Flexion debt that was not assumed by us and $45.2 million in contingent consideration representing the fair value of contingent value rights, or CVRs, that were issued in conjunction with the Flexion Acquisition. The Merger Agreement provided for one non-tradeable CVR per share of Flexion common stock as well as one CVR per share for certain Flexion equity awards. Each CVR entitles Flexion shareholders to contingent milestone payments of up to an aggregate of $8.00 in cash per share of Flexion common stock if certain milestones are met on or prior to December 31, 2030. Up to an additional $380.2 million in the aggregate may be payable to holders of the CVRs if each of the applicable milestones are achieved. For more information, see Note 4, Flexion Acquisition, to our condensed consolidated financial statements included herein.
Coronavirus (COVID-19) Pandemic and Global Economic Conditions
Since early 2020, our revenues have been impacted by COVID-19 pandemic-related challenges that included the significant postponement or suspension in the scheduling of elective surgical procedures due to public health guidanceDirect and government directives. While the degree of impact has diminished during the course of the pandemic due to the introduction of vaccines and therapeutics, as well as the lessening of elective surgery restrictions, certain pandemic-related operational and staffing challenges persist. It remains unclear how long it will take the elective surgery market to normalize or if restrictions on elective procedures will recur due to future COVID-19 variants or otherwise. Directindirect effects of the pandemic and global economic conditions may negatively impact our business, financial condition and results of operations. Such impacts may include, but are not limited to, the effect of prolonged periods of inflation on our customers and suppliers and longer lead-times or the inability to
Pacira BioSciences, Inc. | Q2 2022 Form 10-Q | Page 33
secure a sufficient supply of materials. The situation remains dynamic and subject to rapid and possibly material changes. Additional negative impacts may also arise that we are unable to foresee. The nature and extent of such impacts are subject to material change, and will depend on future developments which are dynamic, highly uncertain and cannot be predicted.
We will continue to actively monitor the situation and implement measures recommended by federal, state or local authorities, or that we determine are in the best interests of our patients, employees, partners, suppliers, shareholders and stakeholders. For a description of risks facing us that relate to the COVID-19 pandemic or any other future pandemic, epidemic or outbreak of contagious disease, see our Annual Report on Form 10-K for the year ended December 31, 2021.
Recent Highlights
•The U.S. Patent and Trademark Office issued Patent Nos. 11,304,904, and 11,311,486 in April 2022, and issued Patent No. 11,357,727 in June 2022. The ’904, ’486, and ’727 patents are listed in the FDA Approved Drug Products with Therapeutic Equivalence Evaluations (the “Orange Book”). With these three new patents, there are currently six EXPAREL patents listed in the Orange Book, each with an expiration date of January 22, 2041.
•In June 2022, we announced the launch of a partnership with the National Safety Council, or NSC, and the Connect2Prevent program. Connect2Prevent is an innovative employee-family educational program that increases awareness and prevention of opioid addiction. The NSC created a comprehensive curriculum designed to educate employees on the risks associated with opioids and provide them with the tools to have meaningful discussions with adolescent family members. The curriculum includes 10-12 weeks of engaging lessons on opioids, addiction, stigma, risk factors for substance use, refusal skills, harm reduction, how to talk to doctors about opioid alternatives and more. The lessons provide easy-to-understand education, action steps and evidence-based tools to connect and communicate with teens.
•In August 2022, we announced the completion of patient enrollment in our two Phase 3 studies of EXPAREL as a nerve block in lower extremity surgeries. The first study is evaluating EXPAREL as an adductor canal block for total knee arthroplasty, or TKA, and the second is evaluating EXPAREL as a popliteal sciatic nerve block for bunionectomy. We believe positive results from these studies will form the basis for an sNDA submission seeking label expansion to include lower extremity nerve blocks.
EXPAREL
In the U.S., EXPAREL is currently indicated for single-dose infiltration in patients six years of age and older for single-dose infiltration to produce postsurgical local analgesia and in adults as an interscalene brachial plexus nerve block to produce postsurgical regional analgesia. Safety and efficacy have not been established in other nerve blocks. In the E.U.,Europe, EXPAREL is indicatedapproved as a brachial plexus block andor femoral nerve block for treatment of post-operative pain in adults and as a field block for treatment of somatic post-operative pain from small- to medium-sized surgical wounds in adults.adults, and in children aged 6 years or older as a field block for treatment of somatic post-operative pain from small- to medium-sized surgical wounds.
EXPAREL Label and Global Expansion
•Lower extremity nerve block. We have completed enrollment in two Phase 3 registration studiesThe FDA is currently reviewing our sNDA seeking expansion of the EXPAREL as a nerve block in lower extremity surgeries. One is a popliteal sciatic nerve block for bunionectomy and the second is an adductor canal block for TKA. We believe positive results from these studies will form the basis for an sNDA submission seeking label expansion to include lower extremity nerve blocks. We believeblock procedures with a Prescription Drug User Fee Act, or PDUFA, action date of November 13, 2023. Our application is based on positive results from two Phase 3 registration studies. The first study, which evaluated EXPAREL admixed with bupivacaine HCl as a femoral nerve block in the additionadductor canal in patients undergoing total knee arthroplasty, or TKA, achieved the primary endpoint, demonstrating a statistically significant reduction in cumulative pain scores from 0 to 96 hours compared with bupivacaine HCl (p<0.01). EXPAREL admixed with bupivacaine HCl also achieved a statistically significant reduction in postsurgical opioid consumption through 96 hours (p<0.01) compared with bupivacaine HCl, a key secondary endpoint. The second study, which evaluated EXPAREL as a sciatic nerve block in the popliteal fossa in patients undergoing bunionectomy, achieved the primary endpoint by demonstrating a statistically significant reduction in cumulative pain scores from 0 to 96 hours compared with bupivacaine HCl (p<0.00001). EXPAREL achieved a statistically significant reduction in postsurgical opioid consumption (p<0.00001) and a statistically significant percentage of this indication is significant as anesthesia-driven regional approaches using nerve and field blocks continue to expand as institutional protocols.opioid-free subjects (p<0.001) through 96 hours
Pacira BioSciences, Inc. | Q2 2023 Form 10-Q | Page 31
compared with bupivacaine HCl, which were key secondary endpoints. EXPAREL was well tolerated with a safety profile consistent with bupivacaine HCl.
•Pediatrics.We are working with the FDAexpect to finalize our studiesinitiate a Phase 1 pharmacokinetic study after which we would initiate a registration study to support expansion of the EXPAREL single-dose infiltration label to include patients under six years of age. We have met with the FDA to discuss appropriate studies of EXPAREL in pediatric patients aged 0 to less than 6 years of age. WeIf successful, we expect that these studies, if successful,this study, followed by a larger Phase 3 study, will be the basis for an sNDA seekingsupport expansion of the EXPAREL label to include this patient population for single-dose infiltration.labels in the U.S. and E.U. We are also discussing with the FDA, EMA and Medicines and Healthcare Products Regulatory Agency (MHRA) our regulatory strategy for EXPAREL administered as a nerve block in the pediatric setting. We are working with both the FDA and the European Medicines Agency, or EMA, with the goal of harmonizing our pediatric clinical studies as much as possible between the two regions.
•Stellate ganglion block. Planning is underway for a multicenter registration study of EXPAREL as a stellate ganglion block for treating refractory cardiac ventricular dysrhythmias and for use to prevent postoperative atrial fibrillation after open heart surgery. We are working with a steering committee of Key Opinion Leaders in regional anesthesia and
Pacira BioSciences, Inc. | Q2 2022 Form 10-Q | Page 34
stellate ganglion blocks who will convene later this year to help finalize study design. After anwe meet with the FDA meeting to align on our regulatory strategy for expanding the EXPAREL label to include stellate ganglion block, we expect to proceed with a registration trial. We believe a stellate ganglion block utilizing EXPAREL will last for several days and address a significant unmet need in patients with ventricular and atrial dysrhythmias.
•Global expansion. We have prioritized the European and Latin American marketsmarket for global expansion.expansion and launched EXPAREL in the U.K. and targeted E.U. countries in 2021. In Europe, we were granted marketing authorization by the EC in November 2020 for EXPAREL is approved as a brachial plexus block or femoral nerve block for treatment of post-operatingpost-operative pain in adults and as a field block for treatment of somatic post-operative pain from small- to medium-sized surgical wounds in adults. We launched EXPARELadults, and as a field block for treatment of somatic post-operative pain from small- to medium-sized surgical wounds in the U.K. and targeted E.U. countries in the fourth quarter of 2021.children aged six years or older. In Latin America, we have a distribution agreement with Eurofarma Laboratories S.A., or Eurofarma, for the development and commercialization of EXPAREL. Eurofarma has the exclusive right to market and distribute EXPAREL in 19 countries in Latin America, including Argentina, Brazil, Colombia and Mexico. In addition, Eurofarma will be responsible for regulatory filings for EXPAREL in these countries. We will receive royalties and are also eligible to receive regulatory- and commercial-based milestone payments that are triggered by the achievement of certain events.
ZILRETTA
ZILRETTA was approved by the FDA in October 2017 and launched in the U.S. shortly thereafter. We market ZILRETTA through our ZILRETTA and iovera° sales force of approximately 50 Treatment Solutions Managers who are providing clinicians with two unique OA treatment options to individualize patient care. ZILRETTA is the first and only extended-release, intra-articular therapy for patients confronting OA knee pain. ZILRETTA employs a proprietary microsphere technology combining triamcinolone acetonide, or TA, a commonly administered, immediate-release corticosteroid, with a poly lactic-co-glycolic acid, or PLGA, matrix to provide extended pain relief. PLGA is a proven extended-release delivery vehicle that is metabolized to carbon dioxide and water as it releases drug in the intra-articular space and is used in other approved drug products and surgical devices. The ZILRETTA microspheres slowly and continuously release triamcinolone acetonide into the knee to provide significant pain relief for 12 weeks, with some people experiencing pain relief through 16 weeks. ZILRETTA was approved by the FDA in October 2017 and launched in the U.S. shortly thereafter.
We believe ZILRETTA’s extended-release profile may also provide effective treatment for OA pain of the shoulder, and we intend to initiate a Phase 3 trial investigating ZILRETTA in shoulder OA in 2023 after aligning with the FDA on study design.2023. In addition, we are planning a study comparing ZILRETTA to immediate release triamcinolone acetonideTA in patients with Type 2 diabetes and are evaluating a repeat dosing study.
ZILRETTA Clinical Benefits
ZILRETTA combines a commonly administered steroid, TA, with PLGA, delivering a 32 milligrammg dose of TA to provide extended therapeutic concentrations in the joint and persistent analgesic effect.
Based on the strength of its pivotal and other clinical trials, we believe that ZILRETTA represents an important treatment option for the millions of patients in the U.S. in need of safe and effective extended relief from OA knee pain. The pivotal Phase 3 trial on which the approval of ZILRETTA was based showed that ZILRETTA significantly reduced OA knee pain for 12 weeks, with some people experiencing pain relief through Week 16.16 weeks. Both the magnitude and duration of pain relief provided by ZILRETTA in clinical trials were clinically meaningful with the magnitude of pain relief amongstamong the largest seen to date in OA clinical trials. The overall frequency of treatment-related adverse events in these trials was similar to those observed with placebo, and no drug-related serious adverse events were reported. We believe that ZILRETTA holds the potential to become the corticosteroid of choice given its safety and efficacy profile, and the fact that it is the first and only extended-release corticosteroid on the market. In September 2021, the American Association of Orthopaedic Surgeons, or AAOS, updated its evidence-based clinical practice guidelines, finding ZILRETTA can improve patient outcomes over traditional immediate-release corticosteroids.
Pacira BioSciences, Inc. | Q2 2023 Form 10-Q | Page 32
iovera°
The iovera° system is an FDA-approved,a non-opioid handheld cryoanalgesia device used to produce precise, controlled doses of cold temperature only to targeted nerves. It has beenis FDA 510(k) cleared in the U.S., has a CE mark in the E.U. and is cleared for marketing in Canada for the blocking of pain. We believe the iovera° system is highly complementary to EXPAREL and ZILRETTA as a non-opioid therapy that alleviates pain using a non-pharmacological nerve block to disrupt pain signals being transmitted to the brain from the site of injury or surgery. It is also indicated for the relief of pain and symptoms associated with arthritis of the knee for up to 90 days.
Pacira BioSciences, Inc. | Q2 2022 Form 10-Q | Page 35
iovera° Clinical Benefits
There is a growing body of clinical data demonstrating success with iovera° treatment for OA of the knee. Surgical intervention is typically a last resort for patients suffering from OA of the knee. In one study, the majority of the patients suffering from OA of the knee experienced pain relief up to 150 days after being treated with iovera°.
Preliminary findings demonstrated reductions in opioids, including:
•The daily morphine equivalent consumption in the per protocol group analysis was significantly lower at 72 hours (p<0.05), 6 weeks (p<0.05) and 12 weeks (p<0.05).
•Patients who were administered iovera° were far less likely to take opioids six weeks after surgery. The number of patients taking opioids six weeks after TKA in the control group was three times the number of patients taking opioids in the cryoanalgesia group (14% vs. 44%, p<0.01).
•Patients in the iovera° group demonstrated a statistically significant reduction in pain scores from their baseline pain scores at 72 hours (p<0.05) and at 12 weeks (p<0.05).
We believe these data validate iovera° as a clinically meaningful non-opioid alternative for patients undergoing TKA, and that iovera° offers the opportunity to provide patients with non-opioid pain control well in advance of any necessary surgical intervention through a number of key product attributes:
•iovera° is safe and effective with immediate pain relief that can last for months as the nerve regenerates over time;
•iovera° is repeatable;
•The iovera° technology does not risk damage to the surrounding tissue;
•iovera° is a convenient handheld device with a single-use procedure-specific Smart Tip; and
•iovera° can be delivered precisely using ultrasound guidance or an anatomical landmark.
In September 2021, the AAOS updated its evidence-based clinical practice guidelines, reporting that denervation therapy—including cryoneurolysis—may reduce knee pain and improve function in patients with symptomatic OA of the knee.
We are also encouraged by usage of iovera° in other areas. Key opinion leadersOpinion Leaders in orthopedics, spine and anesthesia are interested in replacing heat-based radiofrequency ablation with iovera° cold therapy. There is interest across a wide range of treatment opportunities such as low back pain, spine, spasticity and rib fracture. We intend to use investigator-initiated studies and grants to develop data across these areas.
iovera° Global Expansion
In July 2021, we entered into a licensing agreement with Verve Medical Products, Inc. for the distribution of iovera° in Canada. We began selling iovera° in Canada in the fourth quarter of 2021. Additionally, we began selling iovera° in the E.U. through a contracted sales force in the first quarter of 2022.
Pacira BioSciences, Inc. | Q2 2023 Form 10-Q | Page 33
The Osteoarthritis Market
OA is the most common form of arthritis. It is also called degenerative joint disease and occurs most frequently in the hands, hips and knees. With OA, the cartilage within a joint begins to break down and the underlying bone begins to change. These changes usually develop slowly and get worseworsen over time. OA can cause pain, stiffness and swelling. In some cases it also causes reduced function and disability; disability—some people are no longer able to do daily tasks or work. According to the CDC,Centers for Disease Control and Prevention, OA affects over 32.5 million adults in the U.S.
The lifetime risk of developing symptomatic knee OA is 45 percent.percent according to the Arthritis Foundation. The prevalence of symptomatic knee OA increases with each decade of life, with the annual incidence of knee OA being highest between age 55 and 64 years old. There are 14 million individuals in the U.S. who have symptomatic knee OA, and nearly two million are under the age of 45. Surgical intervention is typically a last resort for patients suffering from OA of the knee.
With the addition of ZILRETTA to our product offering, we can now offer clinicians the flexibility to individualize OA knee pain treatment with either ZILRETTA or a drug-free nerve block with iovera° based on patient factors and preference, physician training, site of care and reimbursement considerations.
Pacira BioSciences, Inc. | Q2 2022 Form 10-Q | Page 36
Clinical Development Programs
PCRX-201 and PCRX-301 (Formerly FX-201 and FX-301)
PCRX-201 and PCRX-301 werewas added to our portfolio as part of the Flexion Acquisition. PCRX-201 is a novel, IA gene therapy product candidate designed to provide “on demand” production of anthat produces the anti-inflammatory protein, interleukin-1 receptor antagonist (IL-1Ra) whenever inflammation is detectedIL-1Ra, for treating OA pain in the joint. PCRX-301, isknee. Based upon compelling initial Phase 1 efficacy and safety data for PCRX-201, we are preparing to initiate a locally administered NaV1.7 inhibitor, known as funapide, formulated for extended releasesecond Phase 1 study in OA of the knee and intend to request a thermosensitive hydrogel. The initial development of PCRX-301 was intended to support administration as a peripheral analgesic lower extremity nerve block for management of post-operative pain.Regenerative Medicine Advanced Therapy, or RMAT, designation.
pMVL-Based Clinical Programs
Given the proven safety, flexibility and customizability of our pMVL drug delivery technology platform for acute, sub-acute and chronic pain applications, we have several pMVL-based products in clinical development. Following data readouts from preclinical and feasibility studies for these candidates, we have prioritized three programs for clinical development: (i) PCRX-401, a dexamethasone-pMVL for low back pain; (ii) PCRX-501, a high potency bupivacaine-pMVL for longer-lasting pain relief (20.0 mg/mL) and (iii) a bupivacaine-pMVLEXPAREL for intrathecal analgesia (13.3 mg/mL). We are planning to initiateinitiated the second half of our Phase 1 study of low-concentration bupivacaine-pMVLEXPAREL for intrathecal analgesia in late 2022.June 2023.
External Innovation
In parallel to our internal clinical programs, our business development team continues to pursueis pursuing innovative acquisition targets that are complementary to EXPAREL, ZILRETTA and iovera° and that we believe are of great interest to the surgical and anesthesia audiences we are already calling on today. We are using a combination of strategic investments, in-licensing and acquisition transactions to build outbuildout a pipeline of innovation to improve patients’ journeys along the neural pain pathway. SelectThe strategic investments we have made to support promising early stage platforms are summarized below.below:
| | | | | | | | | | | |
| Company | Development Stage | Description of Platform Technology | Potential Therapeutic Areas |
Carthronix,CarthroniX, Inc. | PreclinicalPhase 1-Ready | CX-011, a small molecule modulator of gp130 formulated as an intra-articular injection designed to slow joint degeneration by mediating IL-6 cytokines | Knee OA |
Coda Therapeutics, Inc. | Preclinical | Chemogenetic platform to reverse the aberrant neuronal activity underlying neurological disorders using optimized Adeno-Associated Virus (AAV) vectors | Neuropathic pain |
| Genascence Corporation | Phase 11b | AAV vector-basedAdeno-associated virus (AAV) based gene therapy targeting Interleukin 1engineered to deliver Interleukin-1 Receptor Antagonist (IL-1Ra) to target cells in joint(s) | Knee OA |
GeneQuine BiotherapeuticsGQ Bio Therapeutics GmbH | Preclinical | Next-generationHigh capacity adenovirus (HCAd) based gene transfer vehicles that enter jointtherapy engineered to deliver DNA to target cells to confer multi-year gene expressionin joint(s) and intervertebral disc(s) | Knee OA and other musculoskeletal disordersdegenerative disc disease (DDD) |
| Spine BioPharma, LLC | Phase 3-ready3 | RemediscSB-01, a 7-amino acid chain peptide that binds to and induces down regulation of transforming growth factor, beta 1 (TGFβ1) | Degenerative disc disease (DDD) |
Pacira BioSciences, Inc. | Q2 20222023 Form 10-Q | Page 3734
Product Portfolio and Internal Pipeline
Our current product portfolio and internal product candidate pipeline, along with anticipated milestones over the next 12 to 18 months, are summarized in the table below:
* Study designs have not been finalized for infiltration in pediatric patients aged 0 to 6 years old or for nerve block in pediatric patients.
- NOCITA® is a registered trademark of Aratana Therapeutics, Inc., a wholly owned subsidiary of Elanco Animal Health, Inc.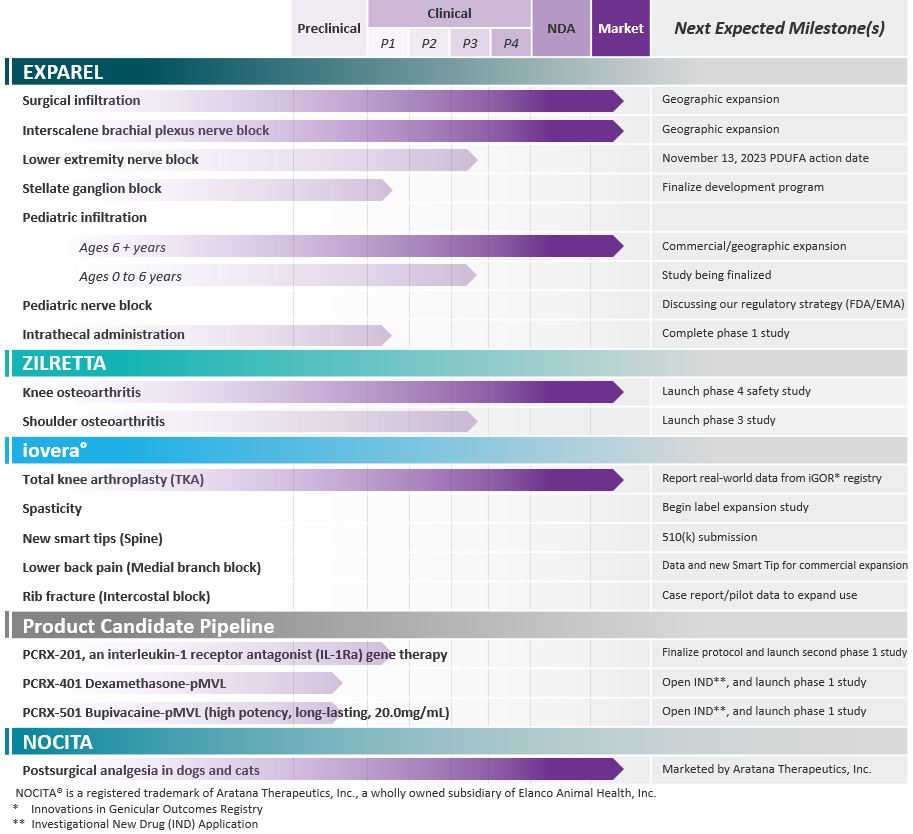
Pacira Training Facilities
We maintain and operate two training facilities—one in Tampa, Florida and one in Houston, Texas. These sites were constructed with a singular goal in mind: to advance education on best practice techniques to effectively manage acute pain while reducing or eliminating the need for opioids. These facilities provide clinicians with flexible, state-of-the-art environments for interactive, hands-on instruction on the latest and most innovative local, regional and field block approaches for managing pain, improving patient care and enabling patient migration to the 23-hour stay environment.
Pacira BioSciences, Inc. | Q2 20222023 Form 10-Q | Page 3835
Pacira Training FacilitiesTampa, Florida
In October 2020, we opened the Pacira Innovation and Training, centeror PIT, Center of Tampa (the “PITT”).Tampa. We designed this facility to help advance clinician understanding of the latest local, regional and field block approaches for managing pain. The PITTPIT of Tampa provides an unparalleled training environment for healthcare providers working to reduce or eliminate patient exposure to opioids. The PITTPIT of Tampa supports a full range of educational events to advance clinician understanding of the latest local, regional, and field block approaches for managing pain and reducing or eliminating exposure to opioids. Our principal executive offices and corporate headquarters are also located at the PITT.PIT of Tampa.
The PITTPIT of Tampa consists of approximately 13,000 square-feet of fully adaptable space and is equipped with state-of-the-art technology and audio/visual capabilities and features several distinct training spaces including a simulation lab equipped with seven ultrasound scanning stations; a lecture hall featuring a 4½-foot tall by 24-foot wide liquid crystal display video wall to support live, virtual and even global presentations; and a green-screen broadcast studio designed to livestream content with single or multiple hosts.
In addition to our EXPAREL programs, we are hosting ongoing workshops to train new users on best practice techniques for iovera° administration at the PITT.PIT of Tampa. Led by healthcare professionals, these labs include didactic lectures and hands-on trainings including live model nerve scanning and identification using ultrasound and peripheral nerve stimulation.
At no fee to the organization, the PITTPIT of Tampa also serves as a venue for national anesthesia provider organizations to host their own workshops and training sessions to educate healthcare providers.
We have launched development plans for aHouston, Texas
In January 2023, we opened our second training facility, the Houston Pacira Innovation and Training Center, in Houston, Texas. This 19,000 square-foot state-of-the-art facility will feature anfeatures a 125-seat adaptive lecture hall featuring the same liquid crystal display video wall that the PIT of Tampa has, a broadcast studio and both wet and dry lab space for cadaver and other interactive workshops. TheseA simulation lab is equipped with eight advanced ultrasound machines equipped with artificial intelligence and 3-D training centers aresoftware in addition to professional medical lighting and in-ceiling cameras. The PIT of Houston is core to developing both our physician champions and community-based clinicians who want to stay on the forefront of opioid-sparing pain management. We expect to openWith this new training facility, before the end of 2022 which would immediately doublewe have doubled our capacity and ability to host programs for EXPAREL, ZILRETTA and iovera°.
Results of Operations
Comparison of the Three and Six Months Ended June 30, 20222023 and 20212022
Revenues
Net productTotal revenues consist of sales consist of (i) EXPAREL in the U.S., the European Union, or E.U., and the United Kingdom, or U.K.; (ii) ZILRETTA in the U.S.; (iii) iovera° in the U.S., Canada and the E.U. and (iv) sales of, and royalties on, our bupivacaine liposome injectable suspension primarily for veterinary use.
The following table provides information regarding our revenues during the periods indicated, including percent changes (dollar amounts in thousands):
| | | Three Months Ended
June 30, | | % Increase / (Decrease) | | Six Months Ended
June 30, | | % Increase / (Decrease) | | Three Months Ended
June 30, | | % Increase / (Decrease) | | Six Months Ended
June 30, | | % Increase / (Decrease) |
| | | 2022 | | 2021 | | 2022 | | 2021 | | | 2023 | | 2022 | | 2023 | | 2022 | |
| Net product sales: | Net product sales: | | | | | | | | | | | | Net product sales: | | | | | | | | | | | |
| EXPAREL | EXPAREL | $ | 137,007 | | | $ | 130,058 | | | 5% | | $ | 266,212 | | | $ | 244,736 | | | 9% | EXPAREL | $ | 135,127 | | | $ | 137,007 | | | (1)% | | $ | 265,535 | | | $ | 266,212 | | | (0)% |
| ZILRETTA | ZILRETTA | 27,417 | | | — | | | N/A | | 51,052 | | | — | | | N/A | ZILRETTA | 29,261 | | | 27,417 | | | 7% | | 53,595 | | | 51,052 | | | 5% |
| iovera° | iovera° | 3,201 | | | 3,813 | | | (16)% | | 6,227 | | | 7,081 | | | (12)% | iovera° | 4,384 | | | 3,201 | | | 37% | | 8,385 | | | 6,227 | | | 35% |
| Bupivacaine liposome injectable suspension | Bupivacaine liposome injectable suspension | 956 | | | 992 | | | (4)% | | 2,512 | | | 1,784 | | | 41% | Bupivacaine liposome injectable suspension | 695 | | | 956 | | | (27)% | | 1,383 | | | 2,512 | | | (45)% |
| Total net product sales | Total net product sales | 168,581 | | | 134,863 | | | 25% | | 326,003 | | | 253,601 | | | 29% | Total net product sales | 169,467 | | | 168,581 | | | 1% | | 328,898 | | | 326,003 | | | 1% |
| Royalty revenue | Royalty revenue | 830 | | | 602 | | | 38% | | 1,399 | | | 891 | | | 57% | Royalty revenue | — | | | 830 | | | (100)% | | 910 | | | 1,399 | | | (35)% |
| Collaborative licensing and milestone revenue | — | | | 125 | | | (100)% | | — | | | 125 | | | (100)% | |
| | Total revenues | Total revenues | $ | 169,411 | | | $ | 135,590 | | | 25% | | $ | 327,402 | | | $ | 254,617 | | | 29% | Total revenues | $ | 169,467 | | | $ | 169,411 | | | 0% | | $ | 329,808 | | | $ | 327,402 | | | 1% |
Pacira BioSciences, Inc. | Q2 2023 Form 10-Q | Page 36
EXPAREL revenue increased 5%decreased 1% in the three months ended June 30, 2023 and 9%remained flat in the six months ended June 30, 2023 versus 2022, primarily due to enrolling EXPAREL in the 340B drug pricing program, resulting in greater discounts, and other strategic partnerships as well as the sales mix of EXPAREL vial sizes. These decreases were largely offset by increases of 4.2% and 5.2% in gross vial volume and increases of 4.4% and 4.3% in gross selling price per unit in the three and six months ended June 30, 2023 versus 2022, versus 2021, respectively, primarily due to increases of 3.6% and 7.2% in gross vial volume and increases of 3.7% and 3.8% in gross selling price per
Pacira BioSciences, Inc. | Q2 2022 Form 10-Q | Page 39
unit, partially offset by the sales mix of EXPAREL vial sizes. Although therespectively. The demand for EXPAREL has continued to increase primarily as a result of Ambulatory Surgical Centersincreased with ASCs and anesthesiologists broadening the use of long-acting EXPAREL regional approaches as a foundation of multimodal opioid-minimization strategies that enable shifting inpatient procedures to 23-hour sites of care and among those customers that are eligible to participate in the 340B drug pricing program. While the elective surgery market has faced additional pandemic-relatedpost-pandemic-related challenges due to regional surges in COVID-19 variant cases, staffing shortages and fatigue from care teams addressing significant procedure backlogs.global economic pressures, EXPAREL utilization remains above the overall sharp decline in elective surgical procedures relative to pre-pandemic baseline levels due to increased utilization in outpatient settings and emergent procedures.
As a result of the Flexion Acquisition, we acquired ZILRETTA in November 2021, which is an extended-release corticosteroid treatment for OA knee pain. We recognized net product sales of $27.4 millionrevenue increased 7% and $51.1 million for the three and six months ended June 30, 2022, respectively.
Net product sales of iovera° decreased 16% and 12%5% in the three and six months ended June 30, 20222023 versus 2021,2022, respectively, primarily due to a delayincreases of 8.1% and 5.4% in gross kit volume and increases of 2.0% and 2.9% in gross selling price per unit during the applicable periods and was partially offset by higher customer discounting primarily due to expanded contracting efforts.
Net product sales of iovera° increased 37% and 35% in the transition from generation 1three and six months ended June 30, 2023 versus 2022, respectively, due to generation 2 iovera° productsincreases of 38% in Smart Tip volume in both periods and short-term variationsincreases of 6.7% and 3.1% in reimbursement policies in certain territories.gross selling price per Smart Tip, partially offset by higher customer discounting.
Bupivacaine liposome injectable suspension net product sales decreased 27% and its related royalties increased nominally45% in the three months ended June 30, 2022 versus 2021. Bupivacaine liposome injectable suspension net product sales and its related royalties increased in the six months ended June 30, 2023 versus 2022, respectively. Its related royalties decreased 100% and 35% in the three and six months ended June 30, 2023 versus 2021. These changes versus the prior year periods were2022, respectively, primarily due to the timing and product mix of orders placedand related sales made by Aratana Therapeutics, Inc. for veterinary use.
Any renewed government suspension of or reluctance of patients to have elective procedures would impact our future sales of EXPAREL, ZILRETTA and iovera° during the ongoing COVID-19 pandemic.
The following tables provide a summary of activity with respect to our sales related allowances and accruals related to EXPAREL and ZILRETTA for the six months ended June 30, 20222023 and 20212022 (in thousands):
| | | | | | | | | | | | | | | | | | | | | | | | | | | | | | | | | | | | | | |
| June 30, 2022 | | Returns Allowances | | Prompt Payment Discounts | | Service
Fees | | Volume
Rebates and
Chargebacks | | Government Rebates | | Total |
| Balance at December 31, 2021 | | $ | 3,361 | | | $ | 1,178 | | | $ | 3,636 | | | $ | 3,494 | | | $ | 761 | | | $ | 12,430 | |
| Provision | | 817 | | | 5,470 | | | 8,123 | | | 19,191 | | | 754 | | | 34,355 | |
| Payments / Adjustments | | (2,503) | | | (5,540) | | | (8,876) | | | (18,960) | | | (740) | | | (36,619) | |
| Balance at June 30, 2022 | | $ | 1,675 | | | $ | 1,108 | | | $ | 2,883 | | | $ | 3,725 | | | $ | 775 | | | $ | 10,166 | |
| | | | | | | | | | | | | | | | | | | | | | | | | | | | | | | | | | | | | | |
| June 30, 2023 | | Returns Allowances | | Prompt Payment Discounts | | Service
Fees | | Volume
Rebates and
Chargebacks | | Government Rebates | | Total |
| Balance at December 31, 2022 | | $ | 1,691 | | | $ | 1,187 | | | $ | 3,193 | | | $ | 5,452 | | | $ | 786 | | | $ | 12,309 | |
| Provision | | 1,122 | | | 5,952 | | | 8,895 | | | 46,936 | | | 1,027 | | | 63,932 | |
| Payments / Adjustments | | (956) | | | (5,918) | | | (8,677) | | | (45,659) | | | (982) | | | (62,192) | |
| Balance at June 30, 2023 | | $ | 1,857 | | | $ | 1,221 | | | $ | 3,411 | | | $ | 6,729 | | | $ | 831 | | | $ | 14,049 | |
| | | | | | | | | | | | | | | | | | | | | | | | | | | | | | | | | | | | | | |
| June 30, 2021 | | Returns Allowances | | Prompt Payment Discounts | | Service
Fees | | Volume
Rebates and
Chargebacks | | Government
Rebates | | Total |
| Balance at December 31, 2020 | | $ | 1,023 | | | $ | 1,007 | | | $ | 1,168 | | | $ | 1,600 | | | $ | — | | | $ | 4,798 | |
| Provision | | 498 | | | 5,050 | | | 3,806 | | | 6,238 | | | — | | | 15,592 | |
| Payments / Adjustments | | (261) | | | (4,631) | | | (3,846) | | | (5,814) | | | — | | | (14,552) | |
| Balance at June 30, 2021 | | $ | 1,260 | | | $ | 1,426 | | | $ | 1,128 | | | $ | 2,024 | | | $ | — | | | $ | 5,838 | |
| | | | | | | | | | | | | | | | | | | | | | | | | | | | | | | | | | | | | | |
| June 30, 2022 | | Returns Allowances | | Prompt Payment Discounts | | Service
Fees | | Volume
Rebates and
Chargebacks | | Government
Rebates | | Total |
| Balance at December 31, 2021 | | $ | 3,361 | | | $ | 1,178 | | | $ | 3,636 | | | $ | 3,494 | | | $ | 761 | | | $ | 12,430 | |
| Provision | | 817 | | | 5,470 | | | 8,123 | | | 19,191 | | | 754 | | | 34,355 | |
| Payments / Adjustments | | (2,503) | | | (5,540) | | | (8,876) | | | (18,960) | | | (740) | | | (36,619) | |
| Balance at June 30, 2022 | | $ | 1,675 | | | $ | 1,108 | | | $ | 2,883 | | | $ | 3,725 | | | $ | 775 | | | $ | 10,166 | |
Total reductions of gross product sales from sales-related allowances and accruals were $63.9 million and $34.4 million, or 16.3% and $15.6 million, or 9.6% and 5.8% of gross product sales, for the six months ended June 30, 20222023 and 2021,2022, respectively. The overall 6.7% increase in sales-related allowances and accruals as a percentage of gross product sales was primarily related to accruals as a result of enrolling EXPAREL in the addition of the ZILRETTA-related allowances340B drug pricing program and accruals.chargeback-related allowances.
Pacira BioSciences, Inc. | Q2 20222023 Form 10-Q | Page 4037
Cost of Goods Sold
Cost of goods sold primarily relates to the costs to produce, package and deliver our products to customers. These expenses include labor, raw materials, manufacturing overhead and occupancy costs, depreciation of facilities, royalty payments, quality control and engineering.
The following table provides information regarding our cost of goods sold and gross margin during the periods indicated, including percent changes (dollar amounts in thousands):
| | | Three Months Ended
June 30, | | % Increase / (Decrease) | | Six Months Ended
June 30, | | % Increase / (Decrease) | | Three Months Ended
June 30, | | % Increase / (Decrease) | | Six Months Ended
June 30, | | % Increase / (Decrease) |
| | | 2022 | | 2021 | | 2022 | | 2021 | | | 2023 | | 2022 | | 2023 | | 2022 | |
| Cost of goods sold | Cost of goods sold | $ | 50,627 | | | $ | 35,248 | | | 43% | | $ | 86,701 | | $ | 66,597 | | 30% | Cost of goods sold | $ | 48,207 | | $ | 50,627 | | (5)% | | $ | 97,227 | | $ | 86,701 | | 12% |
| Gross margin | Gross margin | 70 | % | | 74 | % | | 74 | % | | 74 | % | | Gross margin | 72 | % | | 70 | % | | 71 | % | | 74 | % | |
Gross margin decreased four percentage pointsincreased two percentage-points in the three months ended June 30, 20222023 versus 20212022, mainly due to higher costs in 2022 for the transition of manufacturing sites for iovera°, partially offset by an increase in sales-related allowances and accruals as a result of enrolling EXPAREL inventory reserves due to raw material supply chain delays andin the ZILRETTA step-up of fixed assets and inventory to fair value340B drug pricing program which resulted in accordance with purchase accounting. There was no changea lower net selling price in grossthe current period.
Gross margin decreased three percentage-points in the six months ended June 30, 2023 versus 2022, versus 2021, when a two percentage point increase due to the prior period’s unplanned downtime was offset by a two percentage point decreasemainly due to higher EXPAREL product cost due to operational challenges at our third-party contract manufacturing site in Swindon, England and discounting resulting in a lower net selling price in the current period, partially offset by higher costs in 2022 for the transition of manufacturing sites for iovera° and ZILRETTA product costs due to a fair value step-up of inventory reserves attributable to raw material supply chain delays.and fixed assets acquired in the Flexion Acquisition.
Research and Development Expenses
Research and development expenses primarily consist of costs related to clinical trials and related outside services, product development and other research and development costs, including trials that we are conducting to generate new data for EXPAREL, ZILRETTA and iovera° and stock-based compensation expense. Clinical and preclinical development expenses include costs for clinical personnel, clinical trials performed by third-parties, toxicology studies, materials and supplies, database management and other third-party fees. Product development and manufacturing capacity expansion expenses include development costs for our products, which include personnel, equipment, materials and contractor costs for process development and product candidates, development costs related to significant scale-ups of our manufacturing capacity and facility costs for our research space. Regulatory and other expenses include regulatory activities related to unapproved products and indications, medical information expenses, registry expenses and related personnel. Stock-based compensation expense relates to the costs of stock option grants, awards of restricted stock units, or RSUs, and our employee stock purchase plan, or ESPP.
The following table provides a breakout of our research and development expenses during the periods indicated, including percent changes (dollar amounts in thousands): | | | Three Months Ended
June 30, | | % Increase / (Decrease) | | Six Months Ended
June 30, | | % Increase / (Decrease) | | Three Months Ended
June 30, | | % Increase / (Decrease) | | Six Months Ended
June 30, | | % Increase / (Decrease) |
| | | 2022 | | 2021 | | 2022 | | 2021 | | | 2023 | | 2022 | | 2023 | | 2022 | |
| Clinical and preclinical development | Clinical and preclinical development | $ | 17,734 | | | $ | 5,111 | | | 100%+ | | $ | 31,174 | | $ | 13,131 | | 100%+ | Clinical and preclinical development | $ | 5,194 | | $ | 17,734 | | (71)% | | $ | 10,455 | | $ | 31,174 | | (66)% |
| Product development and manufacturing capacity expansion | Product development and manufacturing capacity expansion | 5,080 | | | 4,607 | | | 10% | | 10,073 | | 9,309 | | 8% | Product development and manufacturing capacity expansion | 9,305 | | 5,080 | | 83% | | 16,977 | | 10,073 | | 69% |
| Regulatory and other | Regulatory and other | 1,948 | | | 1,526 | | | 28% | | 3,662 | | 3,578 | | 2% | Regulatory and other | 2,603 | | 1,948 | | 34% | | 4,935 | | 3,662 | | 35% |
| Stock-based compensation | Stock-based compensation | 1,520 | | | 1,329 | | | 14% | | 2,978 | | 2,435 | | 22% | Stock-based compensation | 1,722 | | 1,520 | | 13% | | 3,597 | | 2,978 | | 21% |
| Total research and development expense | Total research and development expense | $ | 26,282 | | | $ | 12,573 | | | 100%+ | | $ | 47,887 | | $ | 28,453 | | 68% | Total research and development expense | $ | 18,824 | | $ | 26,282 | | (28)% | | $ | 35,964 | | $ | 47,887 | | (25)% |
| % of total revenues | % of total revenues | 16 | % | | 9 | % | | | 15 | % | | 11 | % | | % of total revenues | 11 | % | | 16 | % | | 11 | % | | 15 | % | |
Total research and development expense increased over 100%decreased 28% and 68%25% in the three and six months ended June 30, 20222023 versus 2021,2022, respectively.
Clinical and preclinical development expense increased over 100%decreased 71% and 66% in each of the three and six months ended June 30, 2023 versus 2022, versus 2021,respectively, due to the start-upcompletion of and continued enrollment in two EXPAREL lower extremity nerve block trials in bunionectomy and
Pacira BioSciences, Inc. | Q2 2023 Form 10-Q | Page 38
TKA and ongoing trialsin the third quarter of 2022, toxicology studies that are near completion for the product candidates and the completion of a trial in the second quarter of 2022 for a former product candidate that was acquired as part of the Flexion Acquisition.from Flexion.
Product development and manufacturing capacity expansion expense increased 10%83% and 8%69% in the three and six months ended June 30, 20222023 versus 2021,2022, respectively, mainly attributable to the significantcontinued scale-up activities of our EXPAREL manufacturing capacity at our Science Center Campus in San Diego, California.
Pacira BioSciences, Inc. | Q2 2022 Form 10-Q | Page 41
Regulatory and other expense increased 28%34% and 2%35% in the three and six months ended June 30, 20222023 versus 2021,2022, respectively, due to increased support of E.U. EXPAREL pediatric submissions, partially offset by lower ongoing costs in 2022enrollment and additional sites related to ouran observational iovera° clinical data registry as comparedstudy which tracks patients’ symptoms and experience with pain management related to start-up expenses incurred inOA of the first half of 2021.knee, and increased medical information publications.
Stock-based compensation increased 14%13% and 22%21% in the three and six months ended June 30, 20222023 versus 2021,2022, respectively, primarily due to greater equity awards outstanding for research and development personnel.personnel, partially offset by a lower fair value of newer equity awards granted.
Selling, General and Administrative Expenses
Sales and marketing expenses primarily consist of compensation and benefits for our sales force and personnel that support our sales, marketing, medical and scientific affairs operations, payments to our marketing partners for the promotion and sale of our products, expenses related to communicating the health outcome benefits of our products, investments in provider-level market access and patient reimbursement support and educational programs for our customers. General and administrative expenses consist of compensation and benefits for legal, finance, regulatory activities related to approved products and indications, compliance, information technology, human resources, business development, executive management and other supporting personnel. It also includes professional fees for legal, audit, tax and consulting services. Stock-based compensation expense relates to the costs of stock option grants, RSU awards and our ESPP.
The following table provides information regarding our selling, general and administrative expenses during the periods indicated, including percent changes (dollar amounts in thousands): | | | Three Months Ended
June 30, | | % Increase / (Decrease) | | Six Months Ended
June 30, | | % Increase / (Decrease) | | Three Months Ended
June 30, | | % Increase / (Decrease) | | Six Months Ended
June 30, | | % Increase / (Decrease) |
| | | 2022 | | 2021 | | 2022 | | 2021 | | | 2023 | | 2022 | | 2023 | | 2022 | |
| Sales and marketing | Sales and marketing | $ | 36,854 | | | $ | 28,259 | | | 30% | | $ | 75,294 | | $ | 55,361 | | 36% | Sales and marketing | $ | 37,462 | | $ | 36,854 | | 2% | | $ | 79,041 | | $ | 75,294 | | 5% |
| General and administrative | General and administrative | 19,603 | | | 14,887 | | | 32% | | 37,044 | | 28,755 | | 29% | General and administrative | 19,591 | | 19,603 | | (0)% | | 40,464 | | 37,044 | | 9% |
| Stock-based compensation | Stock-based compensation | 8,546 | | | 7,667 | | | 11% | | 16,925 | | 15,219 | | 11% | Stock-based compensation | 7,797 | | 8,546 | | (9)% | | 16,188 | | 16,925 | | (4)% |
| Total selling, general and administrative expense | Total selling, general and administrative expense | $ | 65,003 | | | $ | 50,813 | | | 28% | | $ | 129,263 | | $ | 99,335 | | 30% | Total selling, general and administrative expense | $ | 64,850 | | $ | 65,003 | | (0)% | | $ | 135,693 | | $ | 129,263 | | 5% |
| % of total revenues | % of total revenues | 38 | % | | 37 | % | | 39 | % | | 39 | % | | % of total revenues | 38 | % | | 38 | % | | 41 | % | | 39 | % | |
Total selling, general and administrative expensesexpense was flat in the three months and increased 28%5% in the six months ended June 30, 2023 versus 2022, respectively.
Sales and 30%marketing expense increased 2% and 5% in the three and six months ended June 30, 2023 versus 2022, versus 2021, respectively,
Sales and marketing expenses increased 30% and 36% in the three and six months ended June 30, 2022 versus 2021, respectively. The increases were driven by a sales force expansion supporting iovera°, the addition of a sales force to support ZILRETTA and fully staffing a contracted sales forcean increase in Europe. We are continuingmarketing investments in our marketing investment in EXPAREL and iovera°, which includesproducts, including educational initiatives and programs related to the impact of opioids and postsurgical pain management and our national advocacy campaign designed to educate patients about non-opioid treatment options. Additionally, we continueWe also have invested in strategic partnerships with sports organizations, such as the Ladies Professional Golf Association (LPGA) and National Football League Alumni Association (NFLA), to increase awareness of the availability and benefits of non-opioid options to manage acute and chronic pain for athletes, including postsurgical pain and knee OA. We also expanded our investment in clinician training in the use of EXPAREL and iovera° at our PITT training facility in Tampa, Florida. The additionas well as the opening of ZILRETTA to our commercial portfolio has increased our sales and marketing spenda second training facility in 2022 as we increased the size of our ZILRETTA and iovera° sales force, which is providing clinicians with two unique OA treatment options to individualize patient care and patient reimbursement support for ZILRETTA.Houston, Texas in January 2023.
General and administrative expensesexpense was flat in the three months and increased 32%9% in the six months ended June 30, 2023 versus 2022, respectively, primarily driven by legal fees attributable to ongoing litigation. For more information, see Note 15, Commitments and 29% inContingencies, to our condensed consolidated financial statements included herein.
Stock-based compensation decreased 9% and 4% for the three and six months ended June 30, 2023 versus 2022, versus 2021, respectively. The increases were driven by administrative support costs as a result of the Flexion Acquisition in November 2021, including transition expenses during integration, and additional support for our expansion into European markets. The increase in the six months ended June 30, 2022 also includes legal costs to support intellectual property protection.
Stock-based compensation increased 11% in both the three and six months ended June 30, 2022 and 2021respectively, primarily due to an increasea decrease in the number of equity awards outstanding for selling, general and administrative personnel.
Pacira BioSciences, Inc. | Q2 20222023 Form 10-Q | Page 4239
Amortization of Acquired Intangible Assets
The following table provides a summary of the amortization of acquired intangible assets during the periods indicated, including percent changes (dollar amounts in thousands): | | | | | | | | | | | | | | | | | | | | | | | | | | | | | | | | | | | |
| Three Months Ended
June 30, | | % Increase / (Decrease) | | Six Months Ended
June 30, | | % Increase / (Decrease) |
| | | |
| 2022 | | 2021 | | | 2022 | | 2021 | |
| Amortization of acquired intangible assets | $ | 14,322 | | | $ | 1,967 | | | 100% + | | $ | 28,644 | | | $ | 3,933 | | | 100% + |
| | | | | | | | | | | | | | | | | | | | | | | | | | | | | | | | | | | |
| Three Months Ended
June 30, | | % Increase / (Decrease) | | Six Months Ended
June 30, | | % Increase / (Decrease) |
| | | |
| 2023 | | 2022 | | | 2023 | | 2022 | |
| Amortization of acquired intangible assets | $ | 14,322 | | | $ | 14,322 | | | —% | | $ | 28,644 | | | $ | 28,644 | | | —% |
AmortizationAs part of the Flexion Acquisition and the MyoScience Acquisition, we acquired intangible assets increased substantially in the three and six months ended June 30, 2022 versus 2021 due to the Flexion Acquisition. We acquired aconsisting of developed technology intangible asset for ZILRETTA for OA knee pain, which is being amortized over aassets and customer relationships, with estimated useful life of approximately tenlives between 9 and 14 years. For more information, see Note 4, Flexion Acquisition, and Note 8,7, Goodwill and Intangible Assets, to our condensed consolidated financial statements included herein.
Acquisition-Related (Gains) Charges, Product DiscontinuationRestructuring Charges and Other
The following table provides a summary of the costs related to the Flexion Acquisition, MyoScience Acquisition, termination costsrestructuring charges and other activities during the periods indicated, including percent changes (dollar amounts in thousands):
| | | | | | | | | | | | | | | | | | | | | | | | | | | | | | | | | | | |
| Three Months Ended
June 30, | | % Increase / (Decrease) | | Six Months Ended
June 30, | | % Increase / (Decrease) |
| | | |
| 2022 | | 2021 | | | 2022 | | 2021 | |
| Acquisition-related (gains) charges, net | $ | (18,058) | | | $ | 146 | | | N/A | | $ | (13,721) | | | $ | (981) | | | (100)%+ |
| | | | | | | | | | | |
| Other | — | | | — | | | N/A | | — | | | 3,000 | | | (100)% |
| Total acquisition-related (gains) charges, product discontinuation and other | $ | (18,058) | | | $ | 146 | | | N/A | | $ | (13,721) | | | $ | 2,019 | | | N/A |
| | | | | | | | | | | | | | | | | | | | | | | | | | | | | | | | | | | |
| Three Months Ended
June 30, | | % Increase / (Decrease) | | Six Months Ended
June 30, | | % Increase / (Decrease) |
| | | |
| 2023 | | 2022 | | | 2023 | | 2022 | |
| Acquisition-related (gains) charges, net | $ | (17,549) | | | $ | (18,058) | | | (3)% | | $ | (5,442) | | | $ | (13,721) | | | (60)% |
| Restructuring charges | 936 | | | — | | | N/A | | 936 | | | — | | | N/A |
| | | | | | | | | | | |
| Total acquisition-related (gains) charges, restructuring charges and other | $ | (16,613) | | | $ | (18,058) | | | (8)% | | $ | (4,506) | | | $ | (13,721) | | | (67)% |
Total acquisition-related (gains) charges, product discontinuationrestructuring charges and other increased substantiallydecreased 8% and 67% in the three and six months ended June 30, 20222023 versus 2021.2022.
During the three and six months ended June 30, 2023, we recognized acquisition-related gains, net of $17.5 million and $5.4 million, respectively. These gains were primarily due to adjustments to long-term forecasts which reduced the probability of meeting the sales-based contingent consideration milestones for the Flexion Acquisition by December 31, 2030, the expiration date for achieving the milestones. The gains recognized during the six months ended June 30, 2023 were partially offset by a decrease in the assumed discount rate that is utilized in calculating the liability’s present value, based on a significant improvement in the Company’s incremental borrowing rate. In addition, in June 2023 we implemented a restructuring plan in an effort to improve our operational efficiencies and recognized $0.9 million in one-time employee termination benefits through a reduction of headcount. For more information, see Note 9, Financial Instruments and Note 14, Acquisition-Related (Gains) Charges, Restructuring Charges and Other, to our condensed consolidated financial statements included herein.
During the three and six months ended June 30, 2022, we recognized acquisition-related gains, net of $18.1 million and $13.7 million, respectively. These gains were primarily driven by reductions in acquisition contingent consideration liabilities due to adjustments to near-term forecasts for the applicable period during which the Flexion contingent consideration may be achieved under the Merger Agreement and due to the reduced probability of meeting the MyoScience contingent consideration milestones by December 31, 2023, the expiration date for achieving the milestones. These gains were partially offset by severance, legal fees, third-party services and other one-time charges related to the Flexion Acquisition. For more information, seeSee Note 10, Financial Instruments, and Note 15,14, Acquisition-Related (Gains) Charges, Product DiscontinuationRestructuring Charges and Other,, to our condensed consolidated financial statements included herein.
In the three and six months ended June 30, 2021, as part of the MyoScience Acquisition, we recognized acquisition-related charges of $0.1 million and gains of $1.0 million, respectively, primarily related to changes in the fair value of contingent consideration. See Note 10, Financial Instruments, to our condensed consolidated financial statements included herein, for information regarding the methods and key assumptions used in the fair value measurements of contingent consideration.more information.
In June 2018, we entered into an agreement with Nuance Biotech Co. Ltd. to advance the development and commercialization of EXPAREL in China. In April 2021, we agreed to a mutual termination of the agreement due to the lack of a viable regulatory pathway that adequately safeguards our intellectual property against the risk of a generic product. Dissolution costs of $3.0 million were included in other operating expenses in the condensed consolidated statements of operations for the six months ended June 30, 2021.
Pacira BioSciences, Inc. | Q2 20222023 Form 10-Q | Page 4340
Other Income (Expense)Expense, Net
The following table provides information regarding other expense, net during the periods indicated, including percent changes (dollar amounts in thousands):
| | | Three Months Ended
June 30, | | % Increase / (Decrease) | | Six Months Ended
June 30, | | % Increase / (Decrease) | | Three Months Ended
June 30, | | % Increase / (Decrease) | | Six Months Ended
June 30, | | % Increase / (Decrease) |
| | | 2022 | | 2021 | | 2022 | | 2021 | | | 2023 | | 2022 | | 2023 | | 2022 | |
| Interest expense | | Interest expense | $ | (3,865) | | | $ | (8,833) | | | (56)% | | $ | (13,454) | | | $ | (19,079) | | | (29)% |
| Interest income | Interest income | $ | 252 | | | $ | 224 | | | 13% | | $ | 523 | | | 639 | | | (18)% | Interest income | 2,111 | | | 252 | | | 100% + | | 5,253 | | | 523 | | | 100%+ |
| Interest expense | (8,833) | | | (7,023) | | | 26% | | (19,079) | | | (13,994) | | | 36% | |
| | Loss on early extinguishment of debt | | Loss on early extinguishment of debt | — | | | — | | | N/A | | (16,926) | | | — | | | N/A |
| Other, net | Other, net | (647) | | | (2,396) | | | (73)% | | (771) | | | (2,554) | | | (70)% | Other, net | (269) | | | (647) | | | (58)% | | (279) | | | (771) | | | (64)% |
| Total other expense, net | Total other expense, net | $ | (9,228) | | | (9,195) | | | —% | | $ | (19,327) | | | (15,909) | | | 21% | Total other expense, net | $ | (2,023) | | | (9,228) | | | (78)% | | $ | (25,406) | | | $ | (19,327) | | | 31% |
Total other expense, net increased nominally and 21%decreased 78% in the three months ended June 30, 2023 and increased 31% in the six months ended June 30, 20222023 versus 2021, respectively. 2022.
The 26%56% and 36% increase29% decrease in interest expense during the three and six months ended June 30, 2022,2023, respectively, was dueprimarily driven by entering into the TLA Term Loan (as defined below) in March 2023 in order to the $375.0 millionretire our term loan B and related credit agreement (the “Term“TLB Term Loan”) entered into in December 2021. This increase was partially offset by, and, to a lesser extent, the absence of debt discount amortization associated with our convertible notes in the current year due to adopting Accounting Standards Update, or ASU, 2020-06 in 2022, and the maturing of our 2.375% convertible senior notes due 2022, or 2022 Notes, onthat matured in April 1, 2022. For additional information regardingRetiring our TLB Term Loan is expected to significantly further reduce our 2023 full-year interest expense as our new TLA Term Loan carries approximately $140.0 million less principal and an interest rate that is 400 basis points lower than the adoption of ASU 2020-06, see Note 2, Summary of Significant Accounting Policies, to our condensed consolidated financial statements herein.interest rate applicable under the TLB Term Loan.
Other, netThe increase in the prior year periods included a realized loss on the sale of an equity investmentinterest income in the amounts of $2.5 million and $2.6 million during the three and six months ended June 30, 2021, respectively.2023 versus 2022 was due to higher interest rates and overall investment balances.
In conjunction with the entry into the TLA Credit Agreement (as defined below), we incurred a $16.9 million loss on early extinguishment of debt recognized as a result of the retirement of $287.5 million aggregate principal of our TLB Term Loan. For more information, see Note 8, Debt, to our condensed consolidated financial statements included herein.
Income Tax Expense
The following table provides information regarding our income tax expense during the periods indicated, including percent changes (dollar amounts in thousands): | | | | | | | | | | | | | | | | | | | | | | | | | | | | | | | | | | | |
| Three Months Ended
June 30, | | % Increase / (Decrease) | | Six Months Ended
June 30, | | % Increase / (Decrease) |
| | | |
| 2022 | | 2021 | | | 2022 | | 2021 | |
| Income tax expense | $ | 2,131 | | | $ | 6,567 | | | (68)% | | $ | 2,597 | | | $ | 8,921 | | | (71)% |
| Effective tax rate | 10 | % | | 26 | % | | | | 9 | % | | 23 | % | | |
| | | | | | | | | | | | | | | | | | | | | | | | | | | | | | | | | | | |
| Three Months Ended
June 30, | | % Increase / (Decrease) | | Six Months Ended
June 30, | | % Increase / (Decrease) |
| | | |
| 2023 | | 2022 | | | 2023 | | 2022 | |
| Income tax expense | $ | 12,091 | | | $ | 2,131 | | | 100% + | | $ | 5,153 | | | $ | 2,597 | | | 98% |
| Effective tax rate | 32 | % | | 10 | % | | | | 45 | % | | 9 | % | | |
The effective tax rates were 32% and 45% for the three and six months ended June 30, 2023, respectively. The effective tax rates were 10% and 9% for the three and six months ended June 30, 2022, respectively. The effective tax rates were 26% and 23% for the three and six months ended June 30, 2021, respectively. Income tax expense represents the estimated annual effective tax rate applied to the year-to-date domestic operating results adjusted for certain discrete tax items.
The effective tax rate for the three and six months ended June 30, 2023 includes costs related to non-deductible stock-based compensation, a valuation allowance recorded against non-U.S. results and non-deductible executive compensation. The effective tax rates for the three and six months ended June 30, 2022 include benefits related to stock-based compensation, a first quarter milestone payment to SkyePharma Holding, Inc., or Skyepharma, (now a subsidiary of Vectura Group plc), milestone paymentor Skyepharma, and a fair value adjustment for Flexion contingent consideration, offset by non-deductiblenondeductible executive compensation costs and a valuation allowance against non-U.S. results. The effective tax rates for the three and six months ended June 30, 2021 include benefits related to stock-based compensation offset by non-deductible executive compensation costs and valuation allowances recorded against deductible capital losses and non-U.S. results.
Pacira BioSciences, Inc. | Q2 2023 Form 10-Q | Page 41
Liquidity and Capital Resources
Since our inception in 2006, we have devoted most of our cash resources to manufacturing, research and development and selling, general and administrative activities related to the development and commercialization of EXPAREL. In addition, we acquired ZILRETTA as part of the Flexion Acquisition in November 2021 and iovera° as part of the MyoScience Acquisition in April 2019. We are primarily dependent on the commercial success of EXPAREL and ZILRETTA. We have financed our operations primarily with the proceeds from the sale of convertible senior notes and other debt, common stock, product sales and collaborative licensing and milestone revenue. As of June 30, 2022,2023, we had an accumulated deficit of $138.0$142.5 million, cash and cash equivalents and short-term available-for-sale investments of $316.4$220.8 million and working capital of $393.0$320.4 million.
We expect that our cash and available-for-sale investments on hand will be adequate to cover our short-term liquidity needs, and that we would be able to access other sources of financing should the need arise.
In March 2020, the Coronavirus Aid, Relief and Economic Security (CARES) Act was signed into law in response to the COVID-19 pandemic. The CARES Act, among other things, allows for certain measures to increase liquidity for businesses
Pacira BioSciences, Inc. | Q2 2022 Form 10-Q | Page 44
such as the deferral of employer payroll taxes, a tax credit for retaining employees and other provisions. We benefited from the provision to defer the payment of certain employer payroll taxes in the amount of $2.8 million for the year ended December 31, 2020 and remitted $1.4 million in December 2021. The remaining $1.4 million is due by December 31, 2022.
Summary of Cash Flows
The following table summarizes our cash flows from operating, investing and financing activities for the periods indicated (in thousands): | | | Six Months Ended
June 30, | | Six Months Ended
June 30, |
| Condensed Consolidated Statements of Cash Flows Data: | Condensed Consolidated Statements of Cash Flows Data: | | 2022 | | 2021 | Condensed Consolidated Statements of Cash Flows Data: | | 2023 | | 2022 |
| Net cash (used in) provided by: | | | | | |
| Net cash provided by (used in): | | Net cash provided by (used in): | | | | |
| Operating activities | Operating activities | | $ | 60,583 | | | $ | 42,215 | | Operating activities | | $ | 62,627 | | | $ | 60,583 | |
| Investing activities | Investing activities | | (188,858) | | | (52,631) | | Investing activities | | 73,509 | | | (188,858) | |
| Financing activities | Financing activities | | (335,242) | | | 16,233 | | Financing activities | | (153,465) | | | (335,242) | |
| Net (decrease) increase in cash and cash equivalents | | $ | (463,517) | | | $ | 5,817 | | |
| Net decrease in cash and cash equivalents | | Net decrease in cash and cash equivalents | | $ | (17,329) | | | $ | (463,517) | |
Operating Activities
During the six months ended June 30, 2022,2023, net cash provided by operating activities was $60.6$62.6 million, compared to $42.2$60.6 million during the six months ended June 30, 2021.2022. The increase of $18.4$2.0 million was primarily attributable to higher revenues, increased net product sales from both ZILRETTA, acquired as partinterest income and lower interest expense, partially offset by the payment of the Flexion Acquisition in November 2021,a $13.0 million termination fee relating to a licensing agreement and EXPAREL, coupled with realized efficiencies from the acquisition of Flexion.lower gross margin.
Investing Activities
During the six months ended June 30, 2023, net cash provided by investing activities was $73.5 million, which reflected proceeds from $90.2 million of available-for-sale investment sales (net of purchases), partially offset by purchases of fixed assets of $10.0 million for fill lines for our products and equipment for an EXPAREL capacity expansion project at our Science Center Campus in San Diego, California and purchases of equity and debt investments of $6.8 million.
During the six months ended June 30, 2022, net cash used in investing activities was $188.9 million, which reflected $124.7 million of short-term available-for-sale investment purchases (net of maturities), a $32.0 million contingent consideration milestone payment that had been achieved in the fourth quarter of 2021 associated with our 2007 acquisition of Pacira Pharmaceuticals, Inc. from Skyepharma, purchases of fixed assets of $19.4 million for fill lines for our products and equipment for a 200-liter EXPAREL capacity expansion project at our Science Center Campus in San Diego, California and purchases of equity and debt investments of $12.8 million.
Financing Activities
During the six months ended June 30, 2021,2023, net cash used in investingfinancing activities was $52.6$153.5 million, which reflected $23.8consisted of a $296.9 million repayment of short-termTLB Term Loan principal as well as a $5.8 million prepayment penalty in connection with the retirement of the TLB Term Loan facility, partially offset by the net proceeds from the TLA Term Loan of $149.6 million and long-term investment purchases (netthe exercise of maturities)stock options of $1.9 million and purchases$1.7 million from the issuance of fixed assets of $23.6 million. Major fixed asset purchasescommon stock through our ESPP. See Note 8, Debt, to our condensed consolidated financial statements included equipmentherein for a new 200-liter EXPAREL capacity expansion project at our Science Center Campus in San Diego, California, and continuing expenditures for our expanding EXPAREL manufacturing capacity in Swindon, England. In addition, we made a $10.0 million equity investment and also purchased a total of $4.2 million in convertible notes. We also sold one of our equity investments for net cash proceeds of $9.1 million.
Financing Activitiesfurther discussion.
During the six months ended June 30, 2022, net cash used in financing activities was $335.2 million, which primarily consisted of a $192.6 million principal repayment of the 3.375% convertible senior notes due 2024 (the “Flexion 2024 Notes”) as part of a repurchase offer to the holders of the Flexion 2024 Notes that was triggered by the Flexion Acquisition, a $157.0 million to settle the 2022 Notesrepayment of our 2.375% convertible senior notes that matured on April 1, 2022 and a $9.4 million scheduled
Pacira BioSciences, Inc. | Q2 2023 Form 10-Q | Page 42
repayment of TLB Term Loan principal, partially offset by $21.9 million of proceeds from the exercise of stock options and $1.8 million from the issuance of common stock through our ESPP.
During the six months ended June 30, 2021, net cash provided by financing activities was $16.2 million, which consisted of proceeds from the exercise of stock options of $16.0 million and $1.6 million from the issuance of common stock through our ESPP, partially offset by the $1.3 million financing component of the $7.0 million contingent consideration payment made to MyoScience securityholders.
Pacira BioSciences, Inc. | Q2 2022 Form 10-Q | Page 45
Debt
20262028 Term Loan BA Facility
In December 2021,On March 31, 2023, we entered into a credit agreement (the “TLA Credit Agreement”) to refinance the $375.0indebtedness outstanding under the Company’s TLB Credit Agreement (as defined and discussed below). The term loan issued under the TLA Credit Agreement (the “TLA Term Loan”) was issued at a 0.30% discount and provides for a single-advance term loan A facility in the principal amount of $150.0 million, Term Loan which is secured by substantially all of our and any subsidiary guarantor’s assets and is scheduled to maturematures on December 7, 2026, subject to certain exceptions set forth in the term loan credit agreement (the “Credit Agreement”).March 31, 2028. We may elect to borrow either (i) alternate base rate borrowings or (ii) term benchmark borrowings or daily simple SOFR (as defined in the TLA Credit Agreement) borrowings. Each term loan borrowing which is an alternate base rate borrowing bears interest at a variable rate per annum equal to (i) the Alternate Base Rate (as defined in the TLA Credit Agreement) subject, plus (ii) a spread based on our Senior Secured Net Leverage Ratio ranging from 2.00% to a 1.75% floor, plus 6.00%2.75%. Each term loan borrowing which is a term benchmark borrowing or daily simple SOFR borrowing bears interest at a variable rate per annum equal to (i) the Adjusted Term SOFR Rate or Adjusted Daily Simple SOFR (as each is defined in the TLA Credit Agreement) subject to a 0.75% floor, plus (ii) 7.00%a spread based on our Senior Secured Net Leverage Ratio ranging from 3.00% to 3.75%. During the six months ended June 30, 2023, the Company made a scheduled principal payment of $2.8 million. As of June 30, 2023, borrowings under the TLA Term Loan consisted entirely of term benchmark borrowings at a rate of 8.01%. Subsequent to June 30, 2023, the Company made a $25.0 million principal prepayment in July 2023.
The TLA Credit Agreement requires us to, among other things, maintain (i) a first lien net leverage ratio,Senior Secured Net Leverage Ratio (as defined in the Credit Agreement), determined as of the last day of anyeach fiscal quarter, of no greater than 1.753.00 to 1.00 and (ii) liquidity, at any time,a Fixed Charge Coverage Ratio (as defined in the TLA Credit Agreement), determined as of at least $150.0 million.the last day of each fiscal quarter, of no less than 1.50 to 1.00. The TLA Credit Agreement also contains customary affirmative and negative covenants, financial covenants, representations and warranties, events of default and other provisions. As of June 30, 2022,2023, we were in compliance with all financial covenants under the TLA Credit Agreement. See Note 8, Debt, to our condensed consolidated financial statements included herein for further discussion.
2026 Term Loan B Facility
In December 2021, we entered into the $375.0 million TLB Term Loan which was secured by substantially all of our and any subsidiary guarantor’s assets and was scheduled to mature on December 7, 2026, subject to certain exceptions set forth in the TLB Credit Agreement.
On March 31, 2023, we used the $149.6 million of net borrowings under the TLA Credit Agreement and cash on hand to repay the indebtedness outstanding under the TLB Credit Agreement and concurrently terminated the TLB Credit Agreement. We incurred a prepayment fee of 2.00% of the outstanding principal balance of the TLB Term Loan in connection with the termination. During the six months ended June 30, 2022,2023, we made a scheduled principal payment of $9.4 million. At June 30, 2022, we had $365.6 million inand repaid the outstanding borrowings under$287.5 million principal on the Term Loan. As a result of our entry into theTLB Term Loan, we expect our interest expense to increasewhich resulted in 2022.a $16.9 million loss on early extinguishment of debt. See Note 9,8, Debt, to our condensed consolidated financial statements included herein for further discussion.
2025 Convertible Senior Notes
In July 2020, we completed a private placement of $402.5 million in aggregate principal amount of our 0.750% convertible senior notes due 2025, or 2025 Notes, and entered into an indenture with respect to the 2025 Notes. The 2025 Notes accrue interest at a fixed rate of 0.750% per annum, payable semiannually in arrears on February 1st and August 1st of each year. The 2025 Notes mature on August 1, 2025. At June 30, 2022,2023, the outstanding principal on the 2025 Notes was $402.5 million. See Note 9,8, Debt, to our condensed consolidated financial statements included herein for further discussion.
2024 Convertible Senior Notes
In November 2021, as part of the Flexion Acquisition, we assumed $201.3 million in aggregate principal amount of the Flexion 2024 Notes. The Flexion 2024 Notes have a maturity date of May 1, 2024, are unsecured, and accrue interest at a rate of 3.375% per annum, payable semi-annually on May 1st and November 1st of each year. In January 2022, we repurchased $192.6 million aggregate principal amount of the Flexion 2024 Notes. At June 30, 2022,2023, the outstanding principal on the Flexion 2024 Notes was $8.6 million. See Note 9,8, Debt, to our condensed consolidated financial statements included herein for further discussion.
Pacira BioSciences, Inc. | Q2 2023 Form 10-Q | Page 43
Future Capital Requirements
We believe that our existing cash and cash equivalents, available-for-sale investments and cash received from product sales will be sufficient to enable us to fund our operating expenses, capital expenditure requirements and payment of the interest and principal on our TLA Term Loan, Flexion 2024 Notes and our convertible notes, and any conversions of our2025 Notes (collectively, the “Notes”) through the next 12 months. Our future use of operating cash and capital requirements will depend on many forward-looking factors, including, but not limited to, the following:
•the costs of successfully integrating Flexion into our existing business and expanding the commercialization of ZILRETTA;to:
•the cost and timing of the potential Flexion milestone payments under the CVR Agreement,to former Flexion stockholders, which could be up to an aggregate of $425.5$372.3 million if certain regulatory and commercial milestones are met. (SeeSee Note 4,9, Flexion AcquisitionFinancial Instruments, to our condensed consolidated financial statements included herein for more information);information;
•the cost and timing of potential remaining milestone payments to former MyoScience security holders, which could be up to an aggregate of $43.0 million if certain regulatory and commercial milestones are met. See Note 9, Financial Instruments, to our condensed consolidated financial statements included herein for more information;
•the impact of the COVID-19 pandemic and global economic conditions, conditions—including the amountsimpact of inflation—on our product and delays of suspended elective surgical procedures, clinical trials,material costs, supply chain, longer lead-times, for or thean inability to secure a sufficient supply of materials;materials, our operating expenses and our business strategy;
•the timing of and extent to which the holders of our convertible senior notesNotes elect to convert their notes andNotes, the timing of principal and interest payments on our TLA Term Loan;
Pacira BioSciences, Inc. | Q2 2022 Form 10-Q | Page 46
•Loan and the timing and impact of increases to the variable interest rate on our TLA Term Loan borrowings in accordance with the terms of the TLA Credit Agreement;
•the costs and our ability to successfully continue to expand the commercialization of EXPAREL, ZILRETTA and iovera°, including outside of the U.S.;
•the cost and timing of expanding and maintaining our manufacturing facilities, including the current EXPAREL capacity expansion project at our Science Center Campus in San Diego, California (which we expect to submit an sNDA for in the second half of 2023) and a ZILRETTA capital projectprojects at the Thermo Fisher site in Swindon, England;
•the cost and timing of potential remaining milestone payments to MyoScience security holders, which could be up to an aggregate of $43.0 million if certain regulatory and commercial milestones are met (See Note 10, Financial Instruments, to our condensed consolidated financial statements included herein for more information);
•the cost and timing of additional strategic investments, including additional investments under existing agreements;
•the costs related to legal and regulatory issues;
•the impact of inflation on our product costs, operating expenses and business strategy;matters;
•the costs of performing additional clinical trials for our products, including the additional pediatric trials required by the FDA and EMA as a condition of the approval of EXPAREL;
•the costs for the development and commercialization of other product candidates;
•the costs and timing of future payments under our employee benefit plans, including but not limited to our cash long-term incentive plan and non-qualified deferred compensation plan; and
•the extent to which we acquire or invest in products, businesses and technologies.
We may require additional debt or equity financing to meet our future operating and capital requirements. We have no committed external sources of funds, and additional equity or debt financing may not be available on acceptable terms, if at all. In particular, capital market disruptions or negative economic conditions especially in light of the COVID-19 pandemic, may hinder our access to capital.
Critical Accounting Estimates
See Note 2, Summary of Significant Accounting Policies, to our condensed consolidated financial statements included herein for a discussion of recently issued accounting pronouncements and their impact or future potential impact on our financial results, if determinable. For a description of critical accounting policies that affect our significant judgments and estimates used in the preparation of our consolidated financial statements, refer to our most recent 2022 Annual Report. There have been no significant changes to our critical accounting policies nor any recently issued accounting pronouncements that are expected to have a material impact on Form 10-K for the year endedour financial results since December 31, 2021.2022.
Contractual Obligations
Except for aentry into the new leaseTLA Credit Agreement and termination of the TLB Credit Agreement as described in Note 7,8, LeasesDebt, to our condensed consolidated financial statements included herein, there have been no material changes in our contractual obligations relating to our indebtedness, lease obligations and purchase obligations from those reported in our 2022 Annual Report on Form 10-K for the year ended December 31, 2021.Report. For more information on our contractual obligations and commercial commitments, see Part II, Item 7 in our 2022 Annual Report on Form 10-K for the year ended December 31, 2021. Pacira BioSciences, Inc. | Q2 20222023 Form 10-Q | Page 4744
Item 3. QUANTITATIVE AND QUALITATIVE DISCLOSURES ABOUT MARKET RISK
The primary objective of our cash equivalents and investment activities is to preserve principal while at the same time maximizing the income that we receive from our investments without significantly increasing risk. We invest in corporate bonds, commercial paper, asset-backed securities and U.S. Treasury and other government agency notes, which are reported at fair value. These securities are subject to interest rate risk and credit risk. This means that a change in prevailing interest rates may cause the fair value of the investment to fluctuate. For example, if we hold a security that was issued with a fixed interest rate at the then-prevailing rate and the interest rate later rises, we expect that the fair value of our investment will decline. A hypothetical 100 basis point increase in interest rates would have reduced the fair value of our available-for-sale securities at June 30, 20222023 by approximately $0.6 million.
The fair values of our Notes are impacted by both the fair value of our common stock and interest rate fluctuations. As of June 30, 2022,2023, the estimated fair value of the 2025 Notes was $1,038$926 per $1,000 principal amount. See Note 9,8, Debt, to our condensed consolidated financial statements included herein for further discussion of our Notes, which bear interest at a fixed rate. At June 30, 2022,2023, all $402.5 million of principal remains outstanding on the 2025 Notes and $8.6 million of principal remains outstanding on the Flexion 2024 Notes.
The TLB Term Loan provided for a single-advance term loan in the principal amount of $375.0 million and iswas scheduled to mature on December 7, 2026. Each term loan borrowing which iswas an alternate base rate borrowing bears interest at a variable rate per annum equal to the Alternate Base Rate (as defined in the TLB Term Loan Credit Agreement) subject to a 1.75% floor, plus 6.00%. Each term loan borrowing which iswas a term benchmark borrowing bears interest at a variable rate per annum equal to (i) the Adjusted Term SOFR rate (as defined in the TLB Term Loan Credit Agreement) subject to a 0.75% floor plus (ii) 7.00%. At June 30, 2022, we had $365.6 million inWe repaid the outstanding principal for TLB Term Loan on March 31, 2023, therefore there were no outstanding borrowings under the TLB Term Loan.Loan as of June 30, 2023.
The TLA Term Loan provides for a single-advance term loan in the principal amount of $150.0 million and is scheduled to mature on March 31, 2028. Each term loan borrowing that is a term benchmark borrowing or daily simple SOFR borrowing bears interest at a rate per annum equal to (i) the Adjusted Term SOFR Rate or Adjusted Daily Simple SOFR (as each is defined in the TLA Credit Agreement), plus (ii) a spread based on our Senior Secured Net Leverage Ratio ranging from 3.00% to 3.75%. As of June 30, 2023, borrowings under the TLA Term Loan consisted entirely of term benchmark borrowings at a rate of 8.01%. A hypothetical 100 basis point increase in interest rates would have increased interest expense duringfor both the three and six months ended June 30, 20222023 by approximately $0.9 million and $1.9 million, respectively.$0.4 million.
As a result of the Flexion Acquisition and as discussed in more detail in Note 9,8, Debt, to our condensed consolidated financial statements included herein, any future conversion rights for the Flexion 2024 Notes are subject to the occurrence of any future events giving rise to such conversion rights under the indenture governing the Flexion 2024 Notes.
We have agreements with certain vendors and partners that operate in foreign jurisdictions. The more significant transactions are primarily denominated in the U.S. Dollar, subject to an annual adjustment based on changes in currency exchange rates.
Additionally, our accounts receivable are primarily concentrated with four large wholesalers of pharmaceutical products. In the event of non-performance or non-payment, there may be a material adverse impact on our financial condition, results of operations or net cash flow.
Pacira BioSciences, Inc. | Q2 2022 Form 10-Q | Page 48
Item 4. CONTROLS AND PROCEDURES
Evaluation of Disclosure Controls and Procedures
As required by Rule 13a-15(b) under the Exchange Act, our management, including our Chief Executive Officer and Chairman and our Chief Financial Officer, conducted an evaluation of the effectiveness of the design and operation of our disclosure controls and procedures as of the end of the period covered by this report. As defined in Rules 13a-15(e) and 15d-15(e) under the Exchange Act, disclosure controls and procedures are controls and other procedures which are designed to ensure that information required to be disclosed by us in the reports we file or submit under the Exchange Act is recorded, processed, summarized and reported, within the time periods specified in the SEC’s rules and forms. Disclosure controls and procedures include, without limitation, controls and procedures designed to ensure that information required to be disclosed by us in the reports we file or submit under the Exchange Act is accumulated and communicated to our management, including our Chief Executive Officer and Chairman and our Chief Financial Officer, as appropriate, to allow timely decisions regarding required disclosure.
In November 2021, we acquired Flexion (now Pacira Therapeutics,BioSciences, Inc., or Pacira Therapeutics). As such, the scope | Q2 2023 Form 10-Q | Page 45
Based on that evaluation, our Chief Executive Officer and Chairman and our Chief Financial Officer concluded that our disclosure controls and procedures were effective as of June 30, 2022.2023.
Changes in Internal Control over Financial Reporting
There have been no other changes in our internal control over financial reporting that occurred during the quarter ended June 30, 20222023 that have materially affected, or are reasonably likely to materially affect, our internal control over financial reporting.
As a result of the Flexion Acquisition, we have commenced an evaluation of the Pacira Therapeutics internal control processes and procedures and have begun incorporating those processes and procedures into our internal control framework.
Inherent Limitations on Effectiveness of Controls
Our management, including the Chief Executive Officer and Chairman and our Chief Financial Officer, does not expect that our disclosure controls or our internal control over financial reporting will prevent or detect all errors and all fraud. A control system, no matter how well designed and operated, can provide only reasonable, not absolute, assurance that the control system’s objectives will be met. The design of a control system must reflect the fact that there are resource constraints, and the benefits of controls must be considered relative to their costs. Further, because of the inherent limitations in all control systems, no evaluation of controls can provide absolute assurance that misstatements due to error or fraud will not occur or that all control issues and instances of fraud, if any, within our company have been detected. These inherent limitations include the realities that judgments in decision-making can be faulty and that breakdowns can occur because of simple errors or mistakes. Controls can also be circumvented by the individual acts of some persons, by collusion of two or more people or by management override of the controls. The design of any system of controls is based in part on certain assumptions about the likelihood of future events, and there can be no assurance that any design will succeed in achieving its stated goals under all potential future conditions. Projections of any evaluation of controls effectiveness to future periods are subject to risks. Over time, controls may become inadequate because of changes in conditions or deterioration in the degree of compliance with policies or procedures.
Pacira BioSciences, Inc. | Q2 20222023 Form 10-Q | Page 4946
PART II — OTHER INFORMATION
Item 1. LEGAL PROCEEDINGS
For information related to Item 1. Legal Proceedings, refer to Note 16,15, Commitments and Contingencies, to our
condensed consolidated financial statements included herein.
Item 1A. RISK FACTORS
You should carefully consider the factors discussed in Part I, Item 1A. “Risk Factors” in our 2022 Annual Report on Form 10-K for the year ended December 31, 2021, which could materially affect our business, financial condition, cash flows or future results. There have been no material changes in our risk factors included in our 2022 Annual Report on Form 10-K for the year ended December 31, 2021.Report. The risks described in our 2022 Annual Report on Form 10-K for the year ended December 31, 2021 are not the only risks facing our Company. Additional risks and uncertainties not currently known to us or that we currently deem to be immaterial also may materially adversely affect our business, financial condition or future results.
Item 2. UNREGISTERED SALES OF EQUITY SECURITIES AND USE OF PROCEEDS
None.
Item 3. DEFAULTS UPON SENIOR SECURITIES
None.
Item 4. MINE SAFETY DISCLOSURES
Not applicable.
Item 5. OTHER INFORMATION
Rule 10b5-1 Trading Plans
The following table shows the “Rule 10b5-1 trading arrangements” and “non-Rule 10b5-1 trading arrangements” (as each term is defined in Item 408(a) of Regulation S-K) adopted or terminated by our directors and executive officers during the quarter ended June 30, 2023:
| | | | | | | | | | | | | | | | | | | | |
| | | Trading Arrangement | | |
| Name and Position | Action | Date | Rule 10b5-1* | Non-Rule
10b5-1** | Total Number of
Shares to be Sold | Expiration Date |
Gary Pace Director | Adopt | 6/16/2023 | X | | 8,000 | 6/3/2024 |
Gary Pace Director | Terminate (1) | 5/11/2023 | X | | 7,000 | 5/11/2023 |
* Intended to satisfy the affirmative defense of Rule 10b5-1(c).
** Not intended to satisfy the affirmative defense of Rule 10b5-1(c).
Not applicable.(1) Trading arrangement was originally adopted on June 13, 2022.
Pacira BioSciences, Inc. | Q2 20222023 Form 10-Q | Page 5047
Item 6. EXHIBITS
The exhibits listed below are filed or furnished as part of this report.
| | | | | | | | |
| Exhibit Number | | Description |
| | Amended and Restated 2014 Employee2011 Stock PurchaseIncentive Plan.(1)† |
| | |
| | Side Letter dated June 5, 2023, to the Manufacturing and Supply Agreement by and between the Registrant and Patheon UK Limited.†† |
| | |
| | Certification of Chief Executive Officer and Chairman pursuant to Rule 13a-14(a) and 15d-14(a), as amended.* |
| | | |
| | Certification of Chief Financial Officer pursuant to Rule 13a-14(a) and 15d-14(a), as amended.* |
| | | |
| | Certification of Chief Executive Officer and Chairman and Chief Financial Officer pursuant to 18 U.S.C. Section 1350, as adopted pursuant to Section 906 of the Sarbanes-Oxley Act of 2002.** |
| | | |
| 101 | | The following materials from the Quarterly Report on Form 10-Q of Pacira BioSciences, Inc. for the quarter ended June 30, 2022,2023, formatted in iXBRL (Inline eXtensible Business Reporting Language): (i) the Condensed Consolidated Balance Sheets; (ii) the Condensed Consolidated Statements of Operations; (iii) the Condensed Consolidated Statements of Comprehensive Income; (iv) the Condensed Consolidated Statements of Stockholders’ Equity; (v) the Condensed Consolidated Statements of Cash Flows; and (vi) the Condensed Notes to Consolidated Financial Statements.* |
| | |
| 104 | | Cover Page Interactive Data File (Formatted as Inline XBRL and contained in Exhibit 101). |
| | | | | | | | |
| * | | Filed herewith. |
| | |
| ** | | Furnished herewith. |
| | |
| † | | Denotes management contract or compensatory plan or arrangement. |
| | |
| †† | | Certain portions of the exhibit have been omitted pursuant to Rule 601(b)(10) of Regulation S-K. The omitted information is (i) not material and (ii) would cause competitive harm to the Company if publicly disclosed. |
| | |
| (1) | | Incorporated by reference to the Registrant’s Current Report on Form 8-K, filed on June 10, 2022.20, 2023. |
Pacira BioSciences, Inc. | Q2 20222023 Form 10-Q | Page 5148
SIGNATURES
Pursuant to the requirements of Section 13 or 15(d) of the Securities Exchange Act of 1934, the registrant has duly caused this report to be signed on its behalf by the undersigned, thereunto duly authorized.
| | | | | | | | | | | | | | |
| | | | PACIRA BIOSCIENCES, INC.
(REGISTRANT) |
| | |
Dated:Date: | August 3, 20222, 2023 | By: | | /s/ DAVID STACK |
| | | | David Stack |
| | | | Chief Executive Officer and Chairman |
| | | | (Principal Executive Officer) |
| | | | |
Dated:Date: | August 3, 20222, 2023 | By: | | /s/ CHARLES A. REINHART, III |
| | | | Charles A. Reinhart, III |
| | | | Chief Financial Officer |
| | | | (Principal Financial Officer) |
Pacira BioSciences, Inc. | Q2 20222023 Form 10-Q | Page 5249