UNITED STATES
SECURITIES AND EXCHANGE COMMISSION
WASHINGTON, D.C. 20549
FORM 10-Q
| ý | QUARTERLY REPORT PURSUANT TO SECTION 13 OR 15(d) OF THE SECURITIES EXCHANGE ACT OF 1934 |
| |
For the Quarterly Period Ended June 30, 2012March 31, 2013
OR
| ¨ | TRANSITION REPORT PURSUANT TO SECTION 13 OR 15(d) OF THE SECURITIES EXCHANGE ACT OF 1934 |
For the transition period from to
ARMOUR RESIDENTIAL REIT, INC.
(Exact name of registrant as specified in its charter)
| Maryland | 001-34766 | 26-1908763 |
| (State or other jurisdiction of incorporation or organization) | (Commission File Number) | (I.R.S. Employer Identification No.) |
3001 Ocean Drive, Suite 201, Vero Beach, FL 32963
(Address of principal executive offices)(zip code)
(772) 617-4340
(Registrant’s telephone number, including area code)
Securities registered pursuant to Section 12(b) of the Act:
Indicate by check mark whether the registrant (1) has filed all reports required to be filed by Section 13 or 15(d) of the Securities Exchange Act of 1934 during the preceding twelve12 months (or for such shorter period that the registrant was required to file such reports) and (2) has been subject to such filing requirements for the past 90 days. YES ý NO o
Indicate by check mark whether the registrant has submitted electronically and posted on its corporate Web site, if any, every Interactive Data File required to be submitted and posted pursuant to Rule 405 of Regulation S-T during the preceding twelve12 months (or for such shorter period that the registrant was required to submit and post such files). YES ý NO ¨
Indicate by check mark whether the registrant is a large accelerated filer, an accelerated filer, or a non-accelerated filer, or a smaller reporting company. See definitionthe definitions of "larger"large accelerated filer," "accelerated filer" and "smaller reporting company" in Rule 12b-2 of the Exchange Act.
Large accelerated filer oý Accelerated filer ýo Non-accelerated filer o Smaller reporting company o
Indicate by check mark whether the registrant is a shell company (as defined in Rule 12b-2 of the Exchange Act). YES o NO ý
The number of outstanding shares of the Registrant’s common stock as of July 30, 2012May 1, 2013 was 234,226,342.374,119,857.
ARMOUR Residential REIT, Inc.
TABLE OF CONTENTS
| PART I. FINANCIAL INFORMATION | 3 |
| Item 1. Financial Statements | 3 |
| Item 2. Management’s Discussion and Analysis of Financial Condition and Results of Operations | 2125 |
Item 3. Quantitative and Qualitative Disclosures Aboutabout Market Risk | 3240 |
| Item 4. Controls and Procedures | 3442 |
| PART II. OTHER INFORMATION | 3542 |
| Item 1. Legal Proceedings | 3542 |
| Item 1A. Risk Factors | 3542 |
| Item 2. Unregistered Sales of Equity Securities and Use of Proceeds | 3542 |
| Item 3. Defaults Upon Senior Securities | 3542 |
| Item 4. Mine Safety Disclosures | 3542 |
| Item 5. Other Information | 3542 |
| Item 6. Exhibits | 3542 |
ARMOUR Residential REIT, Inc. and Subsidiary
CONDENSED CONSOLIDATED BALANCE SHEETS
(in thousands, except per share amounts)
(Unaudited)
PART I. FINANCIAL INFORMATION
Item 1. Financial Statements
ARMOUR Residential REIT, Inc. and Subsidiary
CONDENSED CONSOLIDATED BALANCE SHEETS
(dollars in thousands, except share and per share amounts)
(Unaudited)| | | March 31, 2013 | | | December 31, 2012 | |
| Assets | | | | | | | | |
| Cash and cash equivalents | | $ | 836,501 | | | $ | 771,282 | |
| Cash collateral posted | | | 230,451 | | | | 265,552 | |
| Agency Securities, available for sale, at fair value (including pledged assets of $23,810,215 and $18,578,690) | | | 24,339,169 | | | | 19,096,562 | |
| Receivable for unsettled securities | | | 2,226,168 | | | | 668,244 | |
| Derivatives, at fair value | | | 38,923 | | | | 5,367 | |
| Principal payments receivable | | | 9,381 | | | | 16,037 | |
| Accrued interest receivable | | | 71,664 | | | | 55,430 | |
| Prepaid and other assets | | | 559 | | | | 404 | |
| Total Assets | | $ | 27,752,816 | | | $ | 20,878,878 | |
| | | | | | | | | |
| Liabilities and Stockholders’ Equity | | | | | | | | |
| Liabilities: | | | | | | | | |
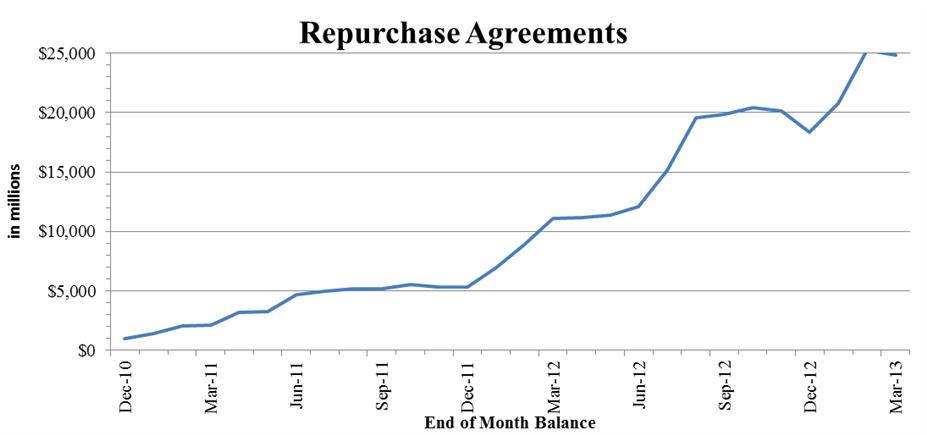
| Repurchase agreements | | $ | 24,828,614 | | | $ | 18,366,095 | |
| Derivatives, at fair value | | | 191,514 | | | | 190,540 | |
| Accrued interest payable | | | 10,302 | | | | 10,064 | |
| Cash collateral held | | | 10,155 | | | | - | |
| Accounts payable and accrued expenses | | | 3,425 | | | | 4,395 | |
| Dividends payable | | | 8 | | | | 9 | |
| Total Liabilities | | | 25,044,018 | | | | 18,571,103 | |
| | | | | | | | | |
| Stockholders’ Equity: | | | | | | | | |
| Preferred stock, $0.001 par value, 50,000 shares authorized; | | | | | | | | |
8.250% Series A Cumulative Preferred Stock; 2,181 and 2,006 issued and outstanding at March 31, 2013 and December 31, 2012 | | | 2 | | | | 2 | |
| 7.875% Series B Cumulative Preferred Stock; 5,650 and none issued and outstanding at March 31, 2013 and December 31, 2012 | | | 6 | | | | - | |
| Common stock, $0.001 par value, 1,000,000 shares authorized, 374,053 and 309,013 shares issued and outstanding at March 31, 2013 and December 31, 2012 | | | 374 | | | | 309 | |
| Additional paid-in capital | | | 2,805,755 | | | | 2,226,198 | |
| Accumulated deficit | | | (129,334 | ) | | | (149,298 | ) |
| Accumulated other comprehensive income | | | 31,995 | | | | 230,564 | |
| Total Stockholders’ Equity | | | 2,708,798 | | | | 2,307,775 | |
| Total Liabilities and Stockholders’ Equity | | $ | 27,752,816 | | | $ | 20,878,878 | |
| Assets | | June 30, 2012 | | | December 31, 2011 | |
| Cash | | $ | 326,736 | | | $ | 252,372 | |
| Restricted cash | | | 193,086 | | | | 147,199 | |
| Agency securities, available for sale, at fair value (including pledged assets of $12,758,125 and $5,225,234) | | | 13,328,514 | | | | 5,393,675 | |
| Receivable for unsettled securities | | | - | | | | 382,931 | |
| Derivatives, at fair value | | | 9,600 | | | | - | |
| Principal payments receivable | | | 9,190 | | | | 12,493 | |
| Accrued interest receivable | | | 38,544 | | | | 18,637 | |
| Prepaid and other assets | | | 823 | | | | 440 | |
| Total Assets | | $ | 13,906,493 | | | $ | 6,207,747 | |
| | | | | | | | | |
| Liabilities and Stockholders’ Equity | | | | | | | | |
| Liabilities: | | | | | | | | |
| Repurchase agreements | | $ | 12,112,586 | | | $ | 5,335,962 | |
| Payable for unsettled securities | | | 272,863 | | | | 117,885 | |
| Derivatives, at fair value | | | 156,515 | | | | 121,727 | |
| Accrued interest payable | | | 3,373 | | | | 2,154 | |
| Accounts payable and accrued expenses | | | 2,790 | | | | 2,663 | |
| Dividends payable | | | 276 | | | | 750 | |
| Total Liabilities | | | 12,548,403 | | | | 5,581,141 | |
| | | | | | | | | |
| Stockholders’ Equity: | | | | | | | | |
| Preferred stock, $0.001 par value, 25,000,000 shares authorized, 1,400,000 8.250% Series A Cumulative Preferred Stock issued and outstanding at June 30, 2012 and none issued and outstanding at December 31, 2011 | | | 1 | | | | - | |
| Common stock, $0.001 par value, 500,000,000 shares authorized, 188,185,880 and 95,436,949 shares issued and outstanding at June 30, 2012 and December 31, 2011, respectively | | | 188 | | | | 95 | |
| Additional paid-in capital | | | 1,340,403 | | | | 678,641 | |
| Accumulated deficit | | | (150,152 | ) | | | (100,878 | ) |
| Accumulated other comprehensive income | | | 167,650 | | | | 48,748 | |
| Total Stockholders’ Equity | | | 1,358,090 | | | | 626,606 | |
| Total Liabilities and Stockholders’ Equity | | $ | 13,906,493 | | | $ | 6,207,747 | |
See notes to condensed consolidated financial statements.
ARMOUR Residential REIT, Inc. and Subsidiary
CONDENSED CONSOLIDATED STATEMENTS OF OPERATIONS
(dollars in thousands, except per share amounts)
(Unaudited)
| | For the Quarters Ended | | For the Six Months Ended | | For the Quarters Ended | |
| | June 30, 2012 | | June 30, 2011 | | | June 30, 2012 | | June 30, 2011 | | | March 31, 2013 | | March 31, 2012 | |
| Interest Income: | | | | | | | | | | | | | | |
| Interest income, net of amortization of premium | $ | 86,204 | | $ | 29,105 | | | $ | 148,967 | | | $ | 42,629 | | | $ | 130,637 | | | $ | 62,763 | |
| Interest expense: | | | | | | | | | | | | | | | | |
| Repurchase agreements | | (11,106 | ) | | (2,351 | ) | | | (18,036 | ) | | | (3,707 | ) | | | (25,475 | ) | | | (6,929 | ) |
| Net interest income | | 75,098 | | | 26,754 | | | | 130,931 | | | | 38,922 | | | | 105,162 | | | | 55,834 | |
| Other (Loss) Income: | | | | | | | | | | | |
| Realized (loss) gain on sale of agency securities | | (1,268 | ) | | - | | | | 5,048 | | | | - | | |
| Other income | | 1,043 | | | - | | | 1,043 | | | - | | |
| Other Income: | | | | | | | |
Realized gain on sale of Agency Securities (reclassified from Other comprehensive (loss) income) | | | | 18,514 | | | | 6,316 | |
Realized loss on derivatives (Note 8) | | | | (29,053 | ) | | | (9,741 | ) |
| Unrealized gain on derivatives | | | | 16,301 | | | | 17,614 | |
| Subtotal | | (225 | ) | | - | | | | 6,091 | | | | - | | | | (12,752 | ) | | | 7,873 | |
| Realized loss on derivatives (1) | | (12,400 | ) | | (6,078 | ) | | | (22,140 | ) | | | (8,004 | ) | |
| Unrealized loss on derivatives | | (70,394 | ) | | (25,817 | ) | | | (52,780 | ) | | | (26,083 | ) | |
| Subtotal | | (82,794 | ) | | (31,895 | ) | | | (74,920 | ) | | | (34,087 | ) | |
| Total other (loss) | | (83,019 | ) | | (31,895 | ) | | | (68,829 | ) | | | (34,087 | ) | |
| Total other income | | | | 5,762 | | | | 14,189 | |
| Expenses: | | | | | | | | | | | | | | | | |
| Management fee | | 4,298 | | 1,495 | | | | 7,811 | | | | 2,251 | | | | 6,633 | | 3,512 | |
| Professional fees | | 425 | | 242 | | | | 936 | | | | 613 | | | | 1,004 | | | | 511 | |
| Insurance | | 55 | | 51 | | | | 104 | | | | 103 | | | | 78 | | | | 49 | |
| Compensation | | 498 | | 140 | | | | 992 | | | | 272 | | | | 257 | | | | 493 | |
| Other | | 407 | | | 200 | | | | 672 | | | | 260 | | | | 662 | | | | 266 | |
| Total expenses | | 5,683 | | | 2,128 | | | | 10,515 | | | | 3,499 | | | | 8,634 | | | | 4,831 | |
| Net (loss) income before taxes | | (13,604 | ) | | (7,269 | ) | | | 51,587 | | | | 1,336 | | |
| Income tax (expense) benefit | | (3 | ) | | (3 | ) | | | 29 | | | | (12 | ) | |
| Net (Loss) Income | $ | (13,607 | ) | $ | (7,272 | ) | | $ | 51,616 | | | $ | 1,324 | | |
| Dividends on preferred stock | | (160 | ) | | - | | | (160 | ) | | | - | | |
| Net (Loss) Income (related) available to common stockholders | $ | (13,767 | ) | $ | (7,272 | ) | | $ | 51,456 | | $ | 1,324 | | |
| Net (loss) income (related) available per share to common stockholders: | | | | | | | | | | | |
| Net income before taxes | | | | 102,290 | | | | 65,192 | |
| Income tax benefit | | | | - | | | | 32 | |
| Net Income | | | | 102,290 | | | | 65,224 | |
| Dividends declared on preferred stock | | | | (2,497 | ) | | | - | |
| Net Income available to common stockholders | | | $ | 99,793 | | | $ | 65,224 | |
| Net income available per share to common stockholders: | | | | | | | |
| Basic | $ | (0.08 | ) | $ | (0.14 | ) | | $ | 0.33 | | | $ | 0.03 | | | $ | 0.30 | | | | 0.48 | |
| Diluted | $ | (0.08 | ) | $ | (0.14 | ) | | $ | 0.32 | | $ | 0.03 | | | $ | 0.29 | | | $ | 0.48 | |
| Dividends per common share | $ | 0.30 | | $ | 0.36 | | | $ | 0.62 | | | $ | 0.70 | | |
| Dividends declared per common share | | | $ | 0.24 | | | $ | 0.32 | |
| Weighted average common shares outstanding: | | | | | | | | | | | | | | | | |
| Basic | | 180,773 | | | 53,259 | | | | 157,838 | | | | 39,903 | | | | 337,935 | | | 134,903 | |
| Diluted | | 180,773 | | | 53,259 | | | 158,553 | | | 40,062 | | | | 339,722 | | | | 134,903 | |
(1) | Interest expense related to our interest rate swap contracts is recorded in realized loss on derivatives on the condensed consolidated statements of operations. For additional information, see Note 8 to the condensed consolidated financial statements. |
See notes to condensed consolidated financial statements.
ARMOUR Residential REIT, Inc. and Subsidiary
CONDENSED CONSOLIDATED STATEMENTS OF COMPREHENSIVE INCOME
(dollars (in thousands)
(Unaudited)
| | | For the Quarters Ended |
| | | March 31, 2013 | | | March 31, 2012 | |
| Net Income | | $ | 102,290 | | | $ | 65,224 | |
| Other comprehensive (loss) income : | | | | | | | | |
| Reclassification adjustment for realized gain on sale of Agency Securities | | | (18,514 | ) | | | (6,316 | ) |
| Net unrealized (loss) gain on Agency Securities | | | (180,055 | ) | | | 11,622 | |
| Other comprehensive (loss) income | | | (198,569 | ) | | | 5,306 | |
| Comprehensive (Loss) Income | | $ | (96,279 | ) | | $ | 70,530 | |
| | | For the Quarters Ended | | For the Six Months Ended |
| | | June 30, 2012 | | | June 30, 2011 | | | June 30, 2012 | | | June 30, 2011 | |
| Net (Loss) Income | | $ | (13,607 | ) | | $ | (7,272 | ) | | $ | 51,616 | | | $ | 1,324 | |
| Other comprehensive income : | | | | | | | | | | | | | | | | |
| Reclassification adjustment for realized loss (gain) on sale of Agency Securities | | | 1,268 | | | | - | | | | (5,048 | ) | | | - | |
| Net unrealized gain on available for sale securities | | | 112,328 | | | | 36,787 | | | | 123,950 | | | | 36,542 | |
| Other comprehensive income | | | 113,596 | | | | 36,787 | | | | 118,902 | | | | 36,542 | |
| Comprehensive Income | | $ | 99,989 | | | $ | 29,515 | | | $ | 170,518 | | | $ | 37,866 | |
ARMOUR Residential REIT, Inc. and Subsidiary
CONDENSED CONSOLIDATED STATEMENTS OF STOCKHOLDERS’ EQUITY
(in thousands, except per share amounts)
(Unaudited)
| | Preferred Stock | | Common Stock | | | | | | | | | |
| | 8.250% Series A | | 7.875% Series B | | | | | | | | | | | | | | | |
| | Shares | | Par Amount | | Additional Paid in Capital | | Shares | | Par Amount | | Additional Paid in Capital | | Shares | | Par Amount | | Additional Paid in Capital | | Total Additional Paid in Capital | | Accumulated Deficit | | Accumulated Other Comprehensive Income | | Total | |
| Balance, December 31, 2012 | 2,006 | | $ | 2 | | $ | 48,792 | | - | | $ | - | | $ | - | | 309,013 | | $ | 309 | | $ | 2,177,406 | | $ | 2,226,198 | | $ | (149,298 | ) | $ | 230,564 | | $ | 2,307,775 | |
| Series A Preferred dividends declared | - | | | - | | | - | | - | | | - | | | - | | - | | | - | | | - | | | - | | | (1,107 | ) | | - | | | (1,107 | ) |
| Series B Preferred dividends declared | - | | | - | | | - | | - | | | - | | | - | | - | | | - | | | - | | | - | | | (1,390 | ) | | - | | | (1,390 | ) |
| Common dividends declared | - | | | - | | | - | | - | | | - | | | - | | - | | | - | | | - | | | - | | | (79,829 | ) | | - | | | (79,829 | ) |
| Issuance of Series A Preferred stock, net | 175 | | | - | | | 4,381 | | - | | | - | | | - | | - | | | - | | | - | | | 4,381 | | | - | | | - | | | 4,381 | |
| Issuance of Series B Preferred stock | - | | | - | | | - | | 5,650 | | | 6 | | | 136,565 | | - | | | - | | | - | | | 136,565 | | | - | | | | | | 136,571 | |
| Issuance of common stock, net | - | | | - | | | - | | - | | | - | | | - | | 65,010 | | | 65 | | | 438,421 | | | 438,421 | | | - | | | - | | | 438,486 | |
| Stock based compensation, net of withholding requirements | - | | | - | | | - | | - | | | - | | | - | | 30 | | | - | | | 190 | | | 190 | | | - | | | - | | | 190 | |
| Net income | - | | | - | | | - | | - | | | - | | | - | | - | | | - | | | - | | | - | | | 102,290 | | | - | | | 102,290 | |
| Other comprehensive loss | - | | | - | | | - | | - | | | - | | | - | | - | | | - | | | - | | | - | | | - | | | (198,569 | ) | | (198,569 | ) |
| Balance, March 31, 2013 | 2,181 | | $ | 2 | | $ | 53,173 | | 5,650 | | $ | 6 | | $ | 136,565 | | 374,053 | | $ | 374 | | $ | 2,616,017 | | $ | 2,805,755 | | $ | (129,334 | ) | $ | 31,995 | | $ | 2,708,798 | |
See notes to condensed consolidated financial statements.
ARMOUR Residential REIT, Inc. and Subsidiary
CONDENSED CONSOLIDATED STATEMENTS of STOCKHOLDERS’ EQUITYOF CASH FLOWS
(dollars in thousands)
(Unaudited)
| | | Preferred Stock | | Common Stock | | | | | | | | | | | | |
| | | Shares | | | Par Amount | | | Additional Paid in Capital | | | Shares | | | Par Amount | | | Additional Paid in Capital | | Total Additional Paid in Capital | | Accumulated Deficit | | | Accumulated Other Comprehensive Income | | | Total | |
| Balance, December 31, 2011 | | | - | | | $ | - | | | | - | | | | 95,437 | | | $ | 95 | | | $ | 678,641 | | $ | 678,641 | | $ | (100,878 | ) | | $ | 48,748 | | | $ | 626,606 | |
| Preferred dividends declared | | | - | | | | - | | | | - | | | | - | | | | - | | | | - | | | - | | | (160 | ) | | | - | | | | (160 | ) |
| Common dividends declared | | | - | | | | - | | | | - | | | | - | | | | - | | | | - | | | - | | | (100,730 | ) | | | - | | | | (100,730 | ) |
| Issuance of Preferred stock, net | | | 1,400 | | | | 1 | | | | 33,778 | | | | - | | | | - | | | | - | | | 33,778 | | | - | | | | - | | | | 33,779 | |
| Issuance of common stock, net | | | - | | | | - | | | | - | | | | 92,705 | | | | 92 | | | | 627,724 | | | 627,724 | | | - | | | | - | | | | 627,816 | |
| Stock based compensation, net of withholding requirements | | | - | | | | - | | | | - | | | | 44 | | | | 1 | | | | 260 | | | 260 | | | - | | | | - | | | | 261 | |
| Net income | | | - | | | | - | | | | - | | | | - | | | | - | | | | - | | | - | | | 51,616 | | | | - | | | | 51,616 | |
| Other comprehensive income | | | - | | | | - | | | | - | | | | - | | | | - | | | | - | | | - | | | - | | | | 118,902 | | | | 118,902 | |
| Balance, June 30, 2012 | | | 1,400 | | | $ | 1 | | | $ | 33,778 | | | | 188,186 | | | $ | 188 | | | $ | 1,306,625 | | $ | 1,340,403 | | $ | (150,152 | ) | | $ | 167,650 | | | $ | 1,358,090 | |
| | | For the Quarters Ended | |
| | | March 31, 2013 | | | March 31, 2012 | |
| Cash Flows From Operating Activities: | | | | | | |
| Net income | | $ | 102,290 | | | $ | 65,224 | |
| Adjustments to reconcile net income to net cash provided by operating activities: | | | | | | | | |
| Net amortization of premium on Agency Securities | | | 60,698 | | | | 13,943 | |
| Realized gain on sale of Agency Securities | | | (18,514 | ) | | | (6,316 | ) |
| Stock based compensation | | | 190 | | | | 61 | |
| Changes in operating assets and liabilities: | | | | | | | | |
| Increase in accrued interest receivable | | | (16,234 | ) | | | (17,366 | ) |
| Increase in prepaid and other assets | | | (150 | ) | | | (213 | ) |
| Increase in derivatives, at fair value | | | (32,582 | ) | | | (20,938 | ) |
| Increase (decrease) in accrued interest payable | | | 238 | | | | (41 | ) |
| (Decrease) increase in accounts payable and accrued expenses | | | (970 | ) | | | 1,247 | |
| Net cash provided by operating activities | | | 94,966 | | | | 35,601 | |
| Cash Flows From Investing Activities: | | | | | | | | |
| Purchases of Agency Securities | | | (8,944,656 | ) | | | (7,086,954 | ) |
| Principal repayments of Agency Securities | | | 1,208,551 | | | | 331,955 | |
| Proceeds from sales of Agency Securities | | | 701,476 | | | | 452,171 | |
| Decrease in cash collateral | | | 45,256 | | | | 8,550 | |
| Net cash used in investing activities | | | (6,989,373 | ) | | | (6,294,278 | ) |
| Cash Flows From Financing Activities: | | | | | | | | |
| Issuance of Series A Preferred stock, net of expenses | | | 4,381 | | | | - | |
| Issuance of Series B Preferred stock, net of expenses | | | 136,571 | | | | - | |
| Issuance of common stock, net of expenses | | | 438,481 | | | | 555,911 | |
| Proceeds from repurchase agreements | | | 42,366,300 | | | | 25,719,289 | |
| Principal repayments on repurchase agreements | | | (35,903,781 | ) | | | (19,957,390 | ) |
| Series A Preferred dividends paid | | | (1,107 | ) | | | - | |
| Series B Preferred dividends paid | | | (1,390 | ) | | | - | |
| Common dividends paid | | | (79,829 | ) | | | (46,755 | ) |
| Net cash provided by financing activities | | | 6,959,626 | | | | 6,271,055 | |
| Net increase in cash | | | 65,219 | | | | 12,378 | |
| Cash - beginning of period | | | 771,282 | | | | 252,372 | |
| Cash - end of period | | $ | 836,501 | | | $ | 264,750 | |
| Supplemental Disclosure: | | | | | | | | |
| Cash paid during the period for interest | | $ | 55,254 | | | $ | 20,478 | |
| Non-Cash Investing and Financing Activities: | | | | | | | | |
| Receivable for unsettled security sales | | $ | 2,226,168 | | | $ | 218,873 | |
| Payable for unsettled security purchases | | $ | - | | | $ | 391,678 | |
| Unrealized (loss) gain on investment on Agency Securities | | $ | (180,055 | ) | | $ | 11,622 | |
| Amounts receivable for issuance of common stock | | $ | 5 | | | $ | 2 | |
| Common dividends declared, to be paid in subsequent period | | $ | - | | | $ | 91 | |
See notes to condensed consolidated financial statements.
ARMOUR Residential REIT, Inc. and Subsidiary
CONDENSED CONSOLIDATED STATEMENTS of CASH FLOWS
(dollars in thousands)
(Unaudited)
| | | For the Six Months Ended June 30, 2012 | | | For the Six Months Ended June 30, 2011 | |
| Cash Flows From Operating Activities: | | | | | | |
| Net income | | $ | 51,616 | | | $ | 1,324 | |
| Adjustments to reconcile net income to net cash provided by operating activities: | | | | | | | | |
| Net amortization of premium on Agency Securities | | | 33,737 | | | | 7,933 | |
| Unrealized loss on derivatives | | | 25,188 | | | | 33,478 | |
| Realized gain on sale of Agency Securities | | | (5,048 | ) | | | - | |
| Stock based compensation | | | 261 | | | | 145 | |
| Changes in operating assets and liabilities: | | | | | | | | |
| Increase in accrued interest receivable | | | (19,919 | ) | | | (12,064 | ) |
| (Increase) decrease in prepaid income taxes and other assets | | | (678 | ) | | | 430 | |
| Increase in accrued interest payable | | | 1,218 | | | | 428 | |
| Increase in accounts payable and accrued expenses | | | 1,498 | | | | 993 | |
| Net cash provided by operating activities | | | 87,873 | | | | 32,667 | |
| Cash Flows From Investing Activities: | | | | | | | | |
| Purchases of Agency Securities | | | (8,745,763 | ) | | | (4,074,907 | ) |
| Principal repayments of Agency Securities | | | 777,772 | | | | 183,355 | |
| Proceeds from sales of Agency Securities | | | 664,588 | | | | - | |
| Decrease in restricted cash | | | (45,887 | ) | | | (50,631 | ) |
| Net cash used in investing activities | | | (7,349,290 | ) | | | (3,942,183 | ) |
| Cash Flows From Financing Activities: | | | | | | | | |
| Issuance of preferred stock, net of expenses | | | 33,779 | | | | - | |
| Issuance of common stock, net of expenses | | | 627,813 | | | | 408,837 | |
| Proceeds from repurchase agreements | | | 57,438,695 | | | | 13,771,873 | |
| Principal repayments on repurchase agreements | | | (50,663,141 | ) | | | (10,088,322 | ) |
| Common dividends paid | | | (101,365 | ) | | | (29,982 | ) |
| Net cash provided by financing activities | | | 7,335,781 | | | | 4,062,406 | |
| Net increase in cash | | | 74,364 | | | | 152,890 | |
| Cash - beginning of period | | | 252,372 | | | | 35,344 | |
| Cash - end of period | | $ | 326,736 | | | $ | 188,234 | |
| Supplemental Disclosure: | | | | | | | | |
| Cash paid for income taxes (not including tax refunds received) | | $ | 12 | | | $ | 15 | |
| Cash paid during the period for interest | | $ | 46,012 | | | $ | 2,970 | |
| Non-Cash Investing and Financing Activities: | | | | | | | | |
| Payable for unsettled security purchases | | $ | 272,863 | | | $ | 302,680 | |
| Unrealized gain on investment in available for sale securities | | $ | 123,950 | | | $ | 36,542 | |
| Amounts receivable for issuance of common stock | | $ | 3 | | | $ | 8,225 | |
| Common dividends declared, to be paid in subsequent period | | $ | 8 | | | $ | 9 | |
| Preferred dividends declared, to be paid in subsequent period | | $ | 160 | | | $ | - | |
See notes to condensed consolidated financial statements
ARMOUR Residential REIT, Inc. and Subsidiary
NOTES TO CONDENSED CONSOLIDATED FINANCIAL STATEMENTS
(Unaudited)
Note 1 – Basis of Presentation
The accompanying unaudited financial statements have been prepared in accordance with U.S. generally accepted accounting principles in the U.S. (“GAAP”) for interim financial information and with the instructions to Form 10-Q and Rule 10-011001 of Regulation S-X promulgated by the Securities and Exchange Commission (the “SEC”). Accordingly, they do not include all of the information and footnotes required by GAAP for complete financial statements. In the opinion of management, all adjustments (consisting of normal recurring accruals) considered necessary for a fair presentation have been included. Operating results for the quarter and six months ended June 30, 2012March 31, 2013 are not necessarily indicative of the results that may be expected for the calendar year ending December 31, 2012.2013. These unaudited financial statements should be read in conjunction with the audited financial statements and notes thereto included in the Company’sour annual report on Form 10-K for the year ended December 31, 2011.2012.
Our financial statements are presented in accordance with GAAP. The condensed consolidated financial statements include the accounts of ARMOUR Residential REIT, Inc. and its subsidiary, allsubsidiary. All intercompany accounts and transactions have been eliminated. The preparation of financial statements in conformity with GAAP requires management to make estimates and assumptions that affect the reported amounts of assets and liabilities and disclosure of contingent assets and liabilities at the date of the financial statements and the reported amounts of revenues and expenses during the reporting period. Actual results could differ from those estimates. Significant estimates affecting the accompanying condensed consolidated financial statements include the valuation of Agency Securities (as defined below) and derivative instruments.
Note 2 -– Organization and Nature of Business Operations
Business
References to “we”, “us”, “our”,“we,” “us,” “our,” "ARMOUR" or the “Company” are to ARMOUR Residential REIT, Inc. References to "ARRM" are to ARMOUR Residential Management LLC, a Delaware limited liability company. References to “Enterprise” are to Enterprise Acquisition Corp., which is a wholly-owned subsidiary of ARMOUR.
We are an externally managed Maryland corporation organized in 2008, managed by ARRM.ARRM (see Note 14, “Related Party Transactions” for additional discussion). We invest primarily in hybrid adjustable rate, adjustable rate and fixed rate residential mortgage backed securities. These securities are issued or guaranteed by a U.S. Government-sponsored entity (“GSE”), such as the Federal National Mortgage Association ( Fannie(Fannie Mae), the Federal Home Loan Mortgage Corporation (Freddie Mac) or guaranteed by the Government National Mortgage Administration (Ginnie Mae) (collectively, "Agency Securities"). As of March 31, 2013, Agency Securities account for 100% of our portfolio. It is expected that the percentage will continue to be 100% or close thereto. Our portfolio consists primarily of securities backed by fixed rate, hybrid adjustable rate, and adjustable rate home loans. From time to time, a portion of our portfolio may be invested in unsecured notes and bonds issued by U.S. Government-charteredGovernment-sponsored entities (collectively, “Agency Debt”), U.S. Treasuries and money market instruments, subject to certain income tests we must satisfy for our qualification as a real estate investment trust (“REIT”). On December 1, 2011, our stockholders approved an amendment to our charter to alter our investment asset class restriction in response to potential changes in Agency Securities to include non-AgencyNon-Agency as well as Agency Securities in our investment asset class restriction. While we remain committed to investing in Agency Securities for so long as an adequate supply and pricing exists, we believe it is prudent for us to have the flexibility to invest in non-AgencyNon-Agency Securities and respond to changes in GSE policy.
We intend to qualify and have elected to be taxed as a REIT under the Internal Revenue Code (“the Code”). Our qualification as a REIT depends on our ability to meet, on a continuing basis, various complex requirements under the Code relating to, among other things, the sources of our gross income, the composition and values of our assets, our distribution levels and the concentration of ownership of our capital stock. We believe that we are organized in conformity with the requirements for qualification as a REIT under the Code and our manner of operations enables us to meet the requirements for taxation as a REIT for federal income tax purposes.
As a REIT, we will generally not be subject to federal income tax on the REIT taxable income that we currently distribute to our stockholders. If we fail to qualify as a REIT in any taxable year and do not qualify for certain statutory relief provisions, we will be subject to federal income tax at regular corporate rates. Even if we qualify as a REIT for federal income tax purposes, we may still be subject to some federal, state and local taxes on our income.
Note 3 -– Summary of Significant Accounting Policies
Reclassification
We reclassified previously presented financial information to conform to the presentation in our condensed consolidated financial statements for the quarterCash and six months ended June 30, 2012 and for the year ended December 31, 2011. Certain commissions with respect to Eurodollar Futures Contracts (“Futures Contracts”) which were previously included in interest expense have been reclassified into realized gain or loss on those contracts. The unrealized gains and losses on our derivatives previously classified on our condensed consolidated statement of operations as an adjustment to arrive at “net interest income after change in fair value of interest rate contracts” is no longer presented as an adjustment to interest income and has been reclassified into “other income” as part of the unrealized gain or loss on derivatives. This reclassification had no effect on previously reported net income or comprehensive income. This reclassification caused interest income to decrease by $0.4 million and $0.6 million, respectively and interest expense to decrease by $6.1 million and $8.1 million, respectively for the quarter and six months ended June 30, 2011. Realized loss on derivatives increased by the net amount of $5.7 million and $7.5 million, respectively for the quarter and six months ended June 30, 2011.
ARMOUR Residential REIT, Inc. and Subsidiary
NOTES TO CONDENSED CONSOLIDATED FINANCIAL STATEMENTS
(Unaudited)
Cashcash equivalents
Cash and cash equivalents includes cash on deposit with financial institutions and investments in high quality overnight money market funds, all of which have original maturities of three months or less, at the time of purchase. We may maintain deposits in federally insured financial institutions in excess of federally insured limits. However, management believes we are not exposed to significant credit risk due to the financial position and creditworthiness of the depository institutions in which those deposits are held.
ARMOUR Residential REIT, Inc. and Subsidiary
NOTES TO CONDENSED CONSOLIDATED FINANCIAL STATEMENTS
(Unaudited)
RestrictedCash Collateral
The following table presents information related to margin collateral posted (held) for interest rate swap contracts, interest rate swaptions and Eurodollar Futures Contracts (“Futures Contracts”) which are included in cash at June 30, 2012collateral on the accompanying condensed consolidated balance sheets as of March 31, 2013 and December 31, 2011 represents approximately $193.1 million and $147.2 million, respectively, held by counterparties as collateral.2012.
| | | March 31, 2013 | | | December 31, 2012 | |
| | | (in thousands) | |
| | | Fair Value (1) | | | Fair Value (1) | |
| Interest rate swap contracts | | $ | 227,008 | | | $ | 261,364 | |
| Interest rate swaptions | | | (10,155 | ) | | | - | |
| Futures Contracts | | | 3,443 | | | | 4,188 | |
| Totals | | $ | 220,296 | | | $ | 265,552 | |
| (1) | See Note 6, “Fair Value of Financial Instruments” for additional discussion. |
Agency Securities, at Fair Value
We invest primarily in Agency Securities. A portion of our portfolio may be invested in Agency Debt, U.S. Treasuries and money market instruments, subject to certain income tests we must satisfy for our qualification as a REIT. As of June 30,March 31, 2013 and December 31, 2012, all of our financial instrument investments consist of Agency Securities Agency Debt, U.S. Treasuries, money market instruments (including reverse repurchase agreements),and hedging and other derivative instruments related to the foregoing investments.
We generally intend to hold most of our Agency Securities for long-term periods.long periods of time. We may, from time to time, sell any of our Agency Securities as part of ourthe overall management of our portfolio. Management determines the appropriate classifications of the securities at the time they are acquired and evaluates the appropriateness of such classifications at each balance sheet date. As of June 30,March 31, 2013 and December 31, 2012, all of our Agency Securities were classified as available for sale. Agency securitiesSecurities classified as available for sale are reported at their estimated fair values, based on fair values obtained from third-party sources, with unrealized gains and losses excluded from earnings and reported as part of the separate condensed consolidated statements of comprehensive income. Agency securities transactions are recorded on the trade date and are valued using third-party pricing services and dealer quotes.
We evaluate securities for other than temporary impairment at least on a quarterly basis and more frequently when economic or market concerns warrant such evaluation. We determine if we (1) have the intent to sell the Agency Securities, (2) believe it is more likely than not that we will be required to sell the securities before recovery or (3) do not expect to recover the entire amortized cost basis of the Agency Securities. There was no other than temporary impairment for the quarters ended March 31, 2013 and six months ended June 30, 2012 and June 30, 2011.March 31, 2012.
Repurchase Agreements
We finance the acquisition of our Agency Securities through the use of repurchase agreements. Our repurchase agreements are secured by our Agency Securities and bear interest rates that have historically moved in close relationship to the Federal Funds Rate and the London Interbank Offered Rate (“LIBOR”). Under these agreements, we sell securities to a lender and agree to repurchase the same securities in the future for a price that is higher than the original sales price. The difference between the sales price that we receive and the repurchase price that we pay represents interest paid to the lender. A repurchase agreement operates as financing under which we pledge our securities as collateral to secure a loan which is equal in value to a specified percentage of the estimated fair value of the pledged collateral. We retain beneficial ownership of the pledged collateral. At the maturity of a repurchase agreement, we are required to repay the loan and concurrently receive back our pledged collateral from the lender or, with the consent of the lender, we may renew such agreement at the then prevailing interest rate. The repurchase agreements may require us to pledge additional assets to the lender in the event the estimated fair value of the existing pledged collateral declines.
ARMOUR Residential REIT, Inc. and Subsidiary
NOTES TO CONDENSED CONSOLIDATED FINANCIAL STATEMENTS
(Unaudited)
Derivatives
We recognize all derivative instrumentsderivatives as either assets or liabilities at fair value on our condensed consolidated balance sheets. We do not designate our derivative activitiesderivatives as cash flow hedges, which, among other factors, would require us to match the pricing dates of both derivative transactionsderivatives and repurchase agreements. Operational issues and credit market volatility make such matching impractical for us. Since we have not elected cash flow hedge accounting treatment as allowed by GAAP, all changes in the fair values of our derivatives are reflected in our condensed consolidated statements of operations. Accordingly, our operating results may reflect greater volatility than otherwise would be the case, because gains or losses on derivatives may not be offset by changes in the fair value or cash flows of the transaction within the same accounting period or ever. Consequently, any declines in the fair value of our derivatives result in a charge to earnings. We will continue to designate derivative activitiesderivatives as hedges for tax purposes and any unrealized derivative gains or losses would not affect our distributable net taxable income.
ARMOUR Residential REIT, Inc. and Subsidiary
NOTES TO CONDENSED CONSOLIDATED FINANCIAL STATEMENTS
(Unaudited)
Accrued Interest Receivable and Payable
Accrued interest receivable includes interest accrued between payment dates on Agency Securities. Accrued interest payable includes interest payable on our repurchase agreements.
Credit Risk
We have limited our exposure to credit losses on our portfolio of Agency Securities by only purchasing securities issued by Freddie Mac, Fannie Mae or Ginnie Mae.Securities. The payment of principal and interest on the Freddie Mac and Fannie Mae Agency Securities are guaranteed by those respective agencies and the payment of principal and interest on the Ginnie Mae Agency Securities are backed by the full faith and credit of the U.S. Government.
In September 2008, both Freddie Mac and Fannie Mae were placed in the conservatorship of the U.S. Government. While it is hoped that the conservatorship will help stabilize Freddie Mac's and Fannie Mae's losses and overall financial position, there can be no assurance that it will succeed or that, if necessary, Freddie Mac or Fannie Mae will be able to satisfy their guarantees of Agency Securities. On August 5, 2011, Standard & Poor’s Corporation downgraded the U.S.’s Government’s credit rating from AAA to AA+ and on August 8, 2011, Fannie Mae and Freddie Mac’s credit ratings were downgraded from AAA to AA+. Because Fannie Mae and Freddie Mac areremain in conservatorship of the U.S. Government,Government. There can be no assurances how or when the U.S.'s credit rating downgrade and Government will end these conservatorships or how the future profitability of Fannie Mae and Freddie Mac’sMac and any future credit rating downgrades willactions may impact the credit risk associated with Agency Securities and, therefore, may decrease the value of the Agency Securities in our portfolio.
Market Risk
Weakness in the mortgage market may adversely affect the performance and market value of our investments. This could negatively impact our net book value. Furthermore, if our lenders are unwilling or unable to provide additional financing, we could be forced to sell our Agency Securities at an inopportune time when prices are depressed.
Preferred Stock
At June 30, 2012,March 31, 2013, we were authorized to issue up to 25,000,00050,000,000 shares of preferred stock, par value $0.001 per share with such designations, voting and other rights and preferences as may be determined from time to time by our Board of Directors (“Board”) or a committee thereof.
Series A Cumulative Preferred Shares (”Series A Preferred Stock”)
On June 6, 2012, we filed with the Maryland State Department of Assessments and Taxation of the State of Maryland to designate 1,610,000 shares of the 25,000,00050,000,000 authorized preferred stock as 8.250% Series A Cumulative Preferred Shares (“Series A Preferred Stock”)Stock with the powers, designations, preferences and other rights as set forth therein. On July 13, 2012, we entered into an At June 30,Market Issuance Sales Agreement with MLV & Co. LLC, as our agent, to offer and sell, from time to time, up to 6,000,000 shares of Series A Preferred Stock. On July 27, 2012, we entered into an Equity Distribution Agreement with Citadel Securities LLC, as our agent, to offer and sell, from time to time, up to 2,000,000 shares of Series A Preferred Stock. At March 31, 2013, there were 9,610,000 shares designated as Series A Preferred Stock.
At March 31, 2013, we had issued and outstanding 1,400,0002,180,572 shares of Series A Preferred Stock, with a par value of $0.001 per share and a liquidation preference of $25.00 per share plus accrued and unpaid dividends. The Series A Preferred Stock is entitled to a dividend at a rate of 8.250% per year based on the $25.00 liquidation preference before the common stock is entitled to receive any dividends. The Series A Preferred Stock is redeemable at $25.00 per share plus accrued and unpaid dividends exclusively at our option commencing on June 7, 2017 (subject to our right under limited circumstances to redeem the Series A Preferred Stock earlier in order to preserve our qualification as a REIT). The Series A Preferred Stock is senior to the our common stock and therefore in the event of liquidation, dissolution or winding up, the Series A Preferred Stock will receive a liquidation preference of $25.00 per share plus accumulated and unpaid dividends before distributions are paid to holders of our common stock, with no right or claim to any of our remaining assets thereafter. The Series A Preferred Stock generally does not have voting rights except if we fail to pay dividends on the Series A Preferred Stock for eighteen months, whether or not consecutive. Under such circumstances, the Series A Preferred Stock will be entitled to vote to elect two additional directors to the Board, until all unpaid dividends have been paid or declared and restrictedset aside for payment. The Series A Preferred Stock has no stated maturity, is not subject to any sinking fund or mandatory redemption and will remain outstanding indefinitely unless repurchased or redeemed by us or converted into our common stock in connection with a change of control by the holders of Series A Preferred Stock.
ARMOUR Residential REIT, Inc. and Subsidiary
NOTES TO CONDENSED CONSOLIDATED FINANCIAL STATEMENTS
(Unaudited)
Series B Cumulative Preferred Shares (”Series B Preferred Stock”)
On February 11, 2013, we filed with the Maryland State Department of Assessments and Taxation to designate 6,210,000 shares of the 50,000,000 authorized preferred stock as 7.875% Series B Preferred Stock with the powers, designations, preferences and other rights as set forth therein.
At March 31, 2013, we had issued and outstanding 5,650,000 shares of Series B Preferred Stock, with a par value of $0.001 per share and a liquidation preference of $25.00 per share plus accrued and unpaid dividends. The Series B Preferred Stock is entitled to a dividend at a rate of 7.875% per year based on the $25.00 liquidation preference before the common stock is entitled to receive any dividends. The Series B Preferred Stock is redeemable at $25.00 per share plus accrued and unpaid dividends exclusively at our option commencing on February 12, 2018 (subject to our right under limited circumstances to redeem the Series A Preferred Stock earlier in order to preserve our qualification as a REIT). The Series B Preferred Stock is senior to our common stock and rank on parity with the Series A Preferred Stock. In the event of liquidation, dissolution or winding up, the Series B Preferred Stock will receive a liquidation preference of $25.00 per share plus accumulated and unpaid dividends before distributions are paid to holders of our common stock, with no right or claim to any of our remaining assets thereafter. The Series B Preferred Stock generally does not have voting rights except if we fail to pay dividends on the Series B Preferred Stock for eighteen months, whether or not consecutive. Under such circumstances, the Series B Preferred Stock will be entitled to vote to elect two additional directors to the Board, until all unpaid dividends have been paid or declared and set aside for payment. The Series B Preferred Stock has no stated maturity, is not subject to any sinking fund or mandatory redemption and will remain outstanding indefinitely unless repurchased or redeemed by us or converted into our common stock in connection with a change of control by the holders of Series B Preferred Stock.
Common Stock and Warrants
At June 30, 2012,March 31, 2013, we were authorized to issue up to 500,000,0001,000,000,000 shares of common stock, par value $0.001 per share, with such designations, voting and other rights and preferences as may be determined from time to time by our Board. We had 188,185,880374,053,198 shares of common stock issued and outstanding at June 30, 2012.March 31, 2013. At June 30, 2012,March 31, 2013, we had outstanding warrants to purchase 32,500,000 shares of common stock, which are exercisable at $11.00 per share and expire in November 2013.
ARMOUR Residential REIT, Inc. and Subsidiary
NOTES TO CONDENSED CONSOLIDATED FINANCIAL STATEMENTS
(Unaudited)
Income per Common Share
The following table presents a reconciliation of the net (loss) income and the shares used in calculating basic and diluted earnings per share for the quarters and six months ended June 30, 2012 and June 30, 2011.
| | | For the Quarters Ended | | For the Six Months Ended |
| | | June 30, 2012 | | | June 30, 2011 | | | June 30, 2012 | | | June 30, 2011 | |
| Net (Loss) Income (related) available to common stockholders | | $ | (13,767 | ) | | $ | (7,272 | ) | | $ | 51,456 | | | $ | 1,324 | |
| | | | | | | | | | | | | | | | | |
| Weighted average common shares outstanding - basic | | | 180,773 | | | | 53,259 | | | | 157,838 | | | | 39,903 | |
| Add: Effect of dilutive non-vested restricted stock awards, assumed vested | | | - | | | | - | | | | 715 | | | | 159 | |
| Weighted average common shares outstanding- diluted | | | 180,773 | | | | 53,259 | | | | 158,553 | | | | 40,062 | |
32,500,000 warrants were outstanding and considered anti-dilutive as their exercise price exceeded the average stock price for the quarters and six months ended June 30, 2012 and June 30, 2011.
Comprehensive Income
Comprehensive income refers to changechanges in equity during a period from transactions and other events and circumstances from non-owner sources. It includes all changes in equity during a period except those resulting from investments by owners and distributions to owners.
Revenue Recognition
Interest income is earned and recognized based on the unpaid principal amount of the Agency Securities and their contractual terms. Premiums and discounts associated with the purchase of Agency Securities are amortized or accreted into interest income over the actual lives of the securities using the effective interest method.
Income Taxes
We intend to qualify and have elected to be taxed as a REIT under the Code. We will generally not be subject to federal income tax to the extent that we distribute our taxable income to our stockholders and as long as we satisfy the ongoing REIT requirements under the Code including meeting certain asset, income and stock ownership tests.securities.
Our management is responsible for determining whether a tax position taken by us is more likely than not to be sustained on its merits. We have no material unrecognized tax benefits and have not recognized in these financial statements any interest or penalties related to income taxes. Should any such interest and penalties be recognized, they will be included in interest expense and other expenses, respectively. None of our income tax returns have been examined by federal, state or local authorities; therefore our 2009, 2010 and 2011 federal and state tax returns remain open for examination.
Note 4 -– Recent Accounting Pronouncements
Accounting Standards Adopted in 2012
We adopted recent amendmentsIn January 2013, the FASB issued ASU 2013-01, Clarifying the Scope of Disclosures about Offsetting Assets and Liabilities, Balance Sheet (Topic 210). This update to authoritative guidance issued by the Financial Accounting Standards Board (“FASB”)ASU 2011-11 addressed implementation issues and applied to derivatives accounted for in April 2011 related to the accounting foraccordance with Topic 815, Derivatives and Hedging, including bifurcated embedded derivatives, repurchase agreements and otherreverse repurchase agreements, and securities borrowing and securities lending transactions that entitleare either offset in accordance with ASC 210-20-45 or ASC 815-10-45 or subject to an enforceable master netting arrangement or similar agreement. The guidance was effective January 1, 2013 and obligate a transferor to repurchase or redeem financial assets before their maturity.
We adopted recent amendments to authoritativewas applied retrospectively. This guidance issued by FASB in May 2011 to establish commondid not affect the presentation of Derivatives, at fair value measurementon our condensed consolidated balance sheets and disclosure requirements in GAAP and International Financial Reporting Standards.
We adopted recent amendments to authoritative guidance issued by FASB in June and December 2011 providing for the option to present the total of comprehensive income, the components of net income, and the components of other comprehensive income either in a single continuous statement of comprehensive income or in two separate but consecutivetherefore, did not affect our financial statements.
ARMOUR Residential REIT, Inc. and Subsidiary
NOTES TO CONDENSED CONSOLIDATED FINANCIAL STATEMENTS
(Unaudited)
Accounting Standards to be Adopted in Future Periods
In December 2011,February 2013, the FASB issued amendmentsASU 2013-02, Reporting of Amounts Reclassified Out of Accumulated Other Comprehensive Income, Comprehensive Income (Topic 220). This update to authoritative guidanceASU 2011-12 addressed improving the reporting of reclassifications out of accumulated other comprehensive income by requiring entities that have financial instruments and derivative instrumentsreporting of the effect of significant reclassifications out of accumulated net income if the amount being reclassified is required under GAAP to disclose information about offsetting and related arrangements. Thebe classified in its entirety to net income. For amounts not required to be reclassified in their entirety to net income in the same reporting period, an entity is required to cross-reference other disclosures required under this amendedGAAP that provide additional detail about these amounts. The update did not change the current requirements for reporting net income or other comprehensive income and resulted in additional disclosure but had no significant effect on our condensed consolidated financial statements. The guidance are intended to enable users of an entity’s financial statements to evaluate the effect or potential effect of netting arrangements on an entity’s financial position, including the effect or potential effect of rights of offset associated with certain financial instruments and derivative instruments. The provisions of these amendments arewas effective for annualreporting periods beginning after January 1, 2013. We anticipate the adoption of these amendments may change the presentation of our financial statementsDecember 15, 2012 and related disclosures.was applied prospectively.
Note 5 -– Agency Securities, Available for Sale
All of our Agency Securities are classified as available for sale and, as such, are reported at their estimated fair value.value and reported as part of the condensed consolidated statements of comprehensive income. As of March 31, 2013 and December 31, 2012, investments in Agency Securities accounted for 100% of our portfolio.
As of June 30, 2012,March 31, 2013, we had the following securities in an unrealized gain or loss position as presented below. The components of the carrying value of our Agency Securities as of June 30, 2012March 31, 2013 are also presented below.
| June 30, 2012 | | Fannie Mae | | Freddie Mac | | Ginnie Mae | | Total Agency Securities | | |
| March 31, 2013 | | | Fannie Mae | | Freddie Mac | | Ginnie Mae | | Total Agency Securities | |
| | | (dollars in thousands) | | | (in thousands) | |
| Principal Amount | | $ | 8,253,755 | | | $ | 3,963,691 | | | $ | 344,154 | | | $ | 12,561,600 | | | $ | 16,460,012 | | | $ | 6,471,944 | | $ | 265,852 | | | $ | 23,197,808 | |
| Net unamortized premium | | | 393,551 | | | | 189,778 | | | | 15,935 | | | | 599,264 | | | | 794,430 | | | | 302,778 | | | 12,158 | | | | 1,109,366 | |
| Amortized cost | | | 8,647,306 | | | | 4,153,469 | | | | 360,089 | | | | 13,160,864 | | | | 17,254,442 | | | | 6,774,722 | | 278,010 | | | | 24,307,174 | |
| | | | | | | | | | | | | | | | | | | |
| Unrealized gains | | | 111,484 | | | | 53,084 | | | | 5,488 | | | | 170,056 | | | | 79,035 | | | | 31,278 | | 5,894 | | | | 116,207 | |
| Unrealized losses | | | (1,912 | ) | | | (491 | ) | | | (3 | ) | | | (2,406 | ) | | | (65,242 | ) | | | (18,962 | ) | | | (8 | ) | | | (84,212 | ) |
| Fair value | | $ | 8,756,878 | | | $ | 4,206,062 | | | $ | 365,574 | | | $ | 13,328,514 | | | $ | 17,268,235 | | | $ | 6,787,038 | | $ | 283,896 | | | $ | 24,339,169 | |
| June 30, 2012 | | Adjustable Rate | | Fixed Rate | | Total Agency Securities | | |
| March 31, 2013 | | | Adjustable Rate | | | Fixed Rate | | | Total Agency Securities | |
| | | (dollars in thousands) | | | (in thousands) | |
| Principal Amount | | $ | 2,685,281 | | | $ | 9,876,319 | | | $ | 12,561,600 | | | $ | 1,812,295 | | | $ | 21,385,513 | | | $ | 23,197,808 | |
| Net unamortized premium | | | 113,379 | | | | 485,885 | | | | 599,264 | | | | 75,239 | | | | 1,034,127 | | | | 1,109,366 | |
| Amortized cost | | | 2,798,660 | | | | 10,362,204 | | | | 13,160,864 | | | | 1,887,534 | | | | 22,419,640 | | | | 24,307,174 | |
| | | | | | | | | | | | | | | | | | | | |
| Unrealized gains | | | 39,755 | | | | 130,301 | | | | 170,056 | | | | 34,425 | | | | 81,782 | | | | 116,207 | |
| Unrealized losses | | | (687 | ) | | | (1,719 | ) | | | (2,406 | ) | | | (112 | ) | | | (84,100 | ) | | | (84,212 | ) |
| Fair value | | $ | 2,837,728 | | | $ | 10,490,786 | | | $ | 13,328,514 | | | $ | 1,921,847 | | | $ | 22,417,322 | | | $ | 24,339,169 | |
ARMOUR Residential REIT, Inc. and Subsidiary
NOTES TO CONDENSED CONSOLIDATED FINANCIAL STATEMENTS
(Unaudited)
As of December 31, 2011,2012, we had the following securities in an unrealized gain or loss position as presented below. The components of the carrying value of our Agency Securities as of December 31, 20112012 are also presented below.
| December 31, 2011 | | Fannie Mae | | Freddie Mac | | Ginnie Mae | | Total Agency Securities | | |
| December 31, 2012 | | | Fannie Mae | | Freddie Mac | | Ginnie Mae | | Total Agency Securities | |
| | | (dollars in thousands) | | | (in thousands) | |
| Principal Amount | | $ | 3,451,906 | | | $ | 1,283,848 | | | $ | 392,476 | | | $ | 5,128,230 | | | $ | 12,328,493 | | | $ | 5,305,071 | | $ | 292,434 | | | $ | 17,925,998 | |
| Net unamortized premium | | | 144,337 | | | | 54,059 | | | | 18,301 | | | | 216,697 | | | | 641,833 | | | | 284,739 | | | 13,428 | | | | 940,000 | |
| Amortized cost | | | 3,596,243 | | | | 1,337,907 | | | | 410,777 | | | | 5,344,927 | | | | 12,970,326 | | | | 5,589,810 | | 305,862 | | | | 18,865,998 | |
| | | | | | | | | | | | | | | | | | | |
| Unrealized gains | | | 33,558 | | | | 13,657 | | | | 5,439 | | | | 52,654 | | | | 169,227 | | | | 66,904 | | 6,466 | | | | 242,597 | |
| Unrealized losses | | | (3,269 | ) | | | (613 | ) | | | (24 | ) | | | (3,906 | ) | | | (9,815 | ) | | | (2,170 | ) | | | (48 | ) | | | (12,033 | ) |
| Fair value | | $ | 3,626,532 | | | $ | 1,350,951 | | | $ | 416,192 | | | $ | 5,393,675 | | | $ | 13,129,738 | | | $ | 5,654,544 | | $ | 312,280 | | | $ | 19,096,562 | |
ARMOUR Residential REIT, Inc. and Subsidiary
NOTES TO CONDENSED CONSOLIDATED FINANCIAL STATEMENTS
(Unaudited)
| December 31, 2011 | | Adjustable Rate | | Fixed Rate | | Total Agency Securities | | |
| December 31, 2012 | | | Adjustable Rate | | Fixed Rate | | Total Agency Securities | |
| | | (dollars in thousands) | | | (in thousands) | |
| Principal Amount | | $ | 2,681,911 | | | $ | 2,446,319 | | | $ | 5,128,230 | | | $ | 2,037,778 | | $ | 15,888,220 | | | $ | 17,925,998 | |
| Net unamortized premium | | | 107,641 | | | | 109,056 | | | | 216,697 | | | | 84,255 | | | 855,745 | | | | 940,000 | |
| Amortized cost | | | 2,789,552 | | | | 2,555,375 | | | | 5,344,927 | | | | 2,122,033 | | 16,743,965 | | | | 18,865,998 | |
| | | | | | | | | | | | | | | |
| Unrealized gains | | | 26,157 | | | | 26,497 | | | | 52,654 | | | | 36,758 | | 205,839 | | | | 242,597 | |
| Unrealized losses | | | (2,534 | ) | | | (1,372 | ) | | | (3,906 | ) | | | (222 | ) | | | (11,811 | ) | | | (12,033 | ) |
| Fair value | | $ | 2,813,175 | | | $ | 2,580,500 | | | $ | 5,393,675 | | | $ | 2,158,569 | | $ | 16,937,993 | | | $ | 19,096,562 | |
Actual maturities of Agency Securities are generally shorter than stated contractual maturities because actual maturities of Agency Securities are affected by the contractual lives of the underlying mortgages, periodic payments of principal and prepayments of principal.
The following table summarizes the weighted average lives of our Agency Securities as of June 30, 2012March 31, 2013 and December 31, 2011.2012.
| | | June 30, 2012 | | December 31, 2011 | | | March 31, 2013 | | December 31, 2012 | |
| | | (dollars in thousands) | | | (in thousands) | |
| Weighted Average Life of all Agency Securities | | Fair Value | | Amortized Cost | | Fair Value | | Amortized Cost | | | Fair Value | | Amortized Cost | | Fair Value | | Amortized Cost | |
| Less than one year | | $ | 2,682 | | | $ | 2,637 | | | $ | 179 | | | $ | 179 | | | $ | 10 | | | $ | 10 | | | $ | 2,647 | | | $ | 2,593 | |
| Greater than one year and less than five years | | | 13,309,810 | | | | 13,142,241 | | | | 5,274,072 | | | | 5,226,255 | | |
| Greater than one year and less than three years | | | 2,603,053 | | 2,554,020 | | 8,618,862 | | 8,476,157 | |
| Greater than three years and less than five years | | | 10,926,786 | | 10,882,077 | | 9,681,538 | | 9,592,001 | |
| Greater than or equal to five years | | | 16,022 | | | | 15,986 | | | | 119,424 | | | | 118,493 | | | | 10,809,320 | | | | 10,871,067 | | | | 793,515 | | | | 795,247 | |
| Total Agency Securities | | $ | 13,328,514 | | | $ | 13,160,864 | | | $ | 5,393,675 | | | $ | 5,344,927 | | | $ | 24,339,169 | | | $ | 24,307,174 | | | $ | 19,096,562 | | | $ | 18,865,998 | |
We use a third-party model to calculate the weighted average life of Agency Securities. Weighted average life is calculated based on expectations for estimated prepayments for the underlying mortgage loans of our Agency Securities. These estimated prepayments are based on assumptions such as interest rates, current and future home prices, housing policy and borrower incentives. The weighted average lives of theour Agency Securities as of June 30, 2012March 31, 2013 and December 31, 20112012 in the table above are based upon market factors, assumptions, models and estimates from the third partythird-party model and also incorporate ARRM’smanagement’s judgment and experience. The actual weighted average lives of the Agency Securities could be longer or shorter than estimated.
ARMOUR Residential REIT, Inc. and Subsidiary
NOTES TO CONDENSED CONSOLIDATED FINANCIAL STATEMENTS
(Unaudited)
The following table presents the unrealized losses and estimated fair value of our Agency Securities by length of time that such securities have been in a continuous unrealized loss position as of June 30, 2012March 31, 2013 and December 31, 2011.2012.
| | | Unrealized Loss Position For: (dollars in thousands) | |
| | | Less than 12 months | | | 12 Months or More | | | Total | |
| | | | | | | | | | | | | | | | | | | |
| As of | | Fair Value | | | Unrealized Losses | | | Fair Value | | | Unrealized Losses | | | Fair Value | | | Unrealized Losses | |
| June 30, 2012 | | $ | 804,479 | | | $ | (2,390 | ) | | $ | 1,653 | | | $ | (16 | ) | | $ | 806,132 | | | $ | (2,406 | ) |
| December 31, 2011 | | | 1,173,098 | | | | (3,560 | ) | | | 96,684 | | | | (346 | ) | | | 1,269,782 | | | | (3,906 | ) |
| | | Unrealized Loss Position For: (in thousands) | |
| | | Less than 12 months | | | 12 Months or More | | | Total | |
| As of | | Fair Value | | | Unrealized Losses | | | Fair Value | | | Unrealized Losses | | | Fair Value | | | Unrealized Losses | |
| March 31, 2013 | | $ | 13,004,337 | | | $ | (84,210 | ) | | $ | 65 | | | $ | (2 | ) | | $ | 13,044,402 | | | $ | (84,212 | ) |
| December 31, 2012 | | | 1,521,052 | | | | (12,030 | ) | | | 836 | | | | (3 | ) | | | 1,521,888 | | | | (12,033 | ) |
The decline in value of these securities is solely due to market conditions and not the credit quality of the assets. All of our Agency Securities are issued by the GSEs. The GSEs have a rating of AA+. The investments are not considered other than temporarily impaired because we currently have the ability and intent to hold the investments to maturity or for a period of time sufficient for a forecasted market price recovery up to or beyond the cost of the investments and we are not required to sell for regulatory or other reasons. Also, we are guaranteed payment of the principal amount of the securities by the GSEs that created them.
ARMOUR Residential REIT, Inc. and Subsidiary
NOTES TO CONDENSED CONSOLIDATED FINANCIAL STATEMENTS
(Unaudited)
During the quarterquarters ended June 30,March 31, 2013 and March 31, 2012, we did not sell any Agency Securities. However, we realized a loss on sale of Agency Securities of $1.3 million. $1.1 million of this amount is due to the bankruptcy of a counterparty to a repurchase agreementsold $2.3 billion and the remaining $0.2 million is a reduction of the first quarter realized gains due to factor updates. In addition, due to the bankruptcy we also recorded $1.0 million of other income resulting from the non-performance of the counterparty on the related repurchase agreement. During the six months ended June 30, 2012 we sold $0.2 billion of Agency Securities resulting in a realized gain of $5.0 million. We did not sell any Agency Securities during the quarter$18.5 million and six months ended June 30, 2011.$6.3 million, respectively.
Note 6 -– Fair Value of Financial Instruments
Our valuation techniques for financial instruments are based on observable and unobservable inputs. Observable inputs reflect readily obtainable data from third-party sources, while unobservable inputs reflect management’s market assumptions. The ASCAccounting Standards Codification Topic No. 820 “Fair Value Measurement” classifies these inputs into the following hierarchy:
Level 1 Inputs- Quoted prices for identical instruments in active markets.
Level 2 Inputs- Quoted prices for similar instruments in active markets; quoted prices for identical or similar instruments in markets that are not active; and model-derived valuations whose inputs are observable or whose significant value drivers are observable.
Level 3 Inputs- Instruments with primarily unobservable value drivers.
The following describes the valuation methodologies used for our assets and liabilities measured at fair value, as well as the general classification of such instruments pursuant to the valuation hierarchy.
Cash - Cash and restricted cash - Cashequivalents includes cash on deposit with financial institutions and investments in high quality overnight money market funds, all of which have maturities of three months or less, at the time of purchase. The carrying amount of cash is deemed to be its fair value. RestrictedOur cash includes cashbalances are classified as Level 1. Cash balances posted or held by counterparties as collateral.collateral are classified as Level 2.
Agency Securities Available for Sale - Fair value for the Agency Securities in our portfolio is based on obtaining a valuation for each Agency Security from third-party pricing services and dealer quotes. The third-party pricing services use common market pricing methods that may include pricing models that may incorporate such factors as coupons, prepayment speeds, spread to the Treasury curves and interest rate swap curves, duration, periodic and life caps and credit enhancement. If the fair value of a security is not available from the third-party pricing serviceservices or such data appears unreliable, we obtain valuations from up to three dealers who make markets in similar financial instruments. In general, the dealers incorporate common market pricing methods, including a spread measurement to the Treasury curve or interest rate swap curve as well as underlying characteristics of the particular security including coupon, periodic and life caps, collateral type, rate reset period and seasoning or age of the security. Management reviews pricing used to ensure that current market conditions are properly represented. This review includes, but is not limited to, comparisons of similar market transactions or alternative third-party pricing services, dealer quotes and comparisons to a pricing model. Values obtained from the third-party pricing serviceservices for similar instruments are classified as Level 2 securities if the pricing methods used are consistent with the Level 2 definition. If quoted prices for a security are not reasonably available from the pricing service, but dealer quotes are, the security will be classified as a Level 2 security. If neither is available, management will determine the fair value based on characteristics of the security that we receive from the issuer and based on available market information received from dealers and classify it as a Level 3 security. At June 30, 2012March 31, 2013 and December 31, 2011,2012, all of our Agency Security values were based solely on third-party sources.sources and therefore were classified as Level 2.
ARMOUR Residential REIT, Inc. and Subsidiary
NOTES TO CONDENSED CONSOLIDATED FINANCIAL STATEMENTS
(Unaudited)
Repurchase Agreements -The fair value of repurchase agreements reflects the present value of the contractual cash flows discounted at the estimated LIBOR based market interest rates at the valuation date for repurchase agreements with a term equivalent to the remaining term to interest rate repricing, which may be at maturity, of our repurchase agreements. The fair value of the repurchase agreements approximates their carrying amount due to the short-term nature of these financial instruments. Our repurchase agreements are classified as Level 2.
Derivative Transactions - The fair values of our– Our Futures Contracts are based on closing pricestraded on the Chicago Mercantile Exchange (“CME”). and are classified as Level 1. The fair values of our interest rate swap contracts and options to enter into interest rate swaps (“interest rate swaptions”)swaptions are valued using a third-party pricing serviceservices that incorporates common market pricing methods that may include current interest rate curves, forward interest rate curves and market spreads to interest rate curves. Management compares pricing used to dealer quotes to ensure that the current market conditions are properly represented. Our Futures Contracts are classified as Level 1 and theThe fair values of our interest rate swap contracts and our interest rate swaptions are classified as Level 2.
Excluded from the tables below are financial instruments carried on the accompanying condensed consolidated balance sheets at cost basis, which is deemed to approximate fair value, primarily due to the short-term nature of these instruments, including cash, restricted cash, receivables for unsettled securities, principal payments receivables, accrued interest receivables, payables for unsettled securities, payables and borrowings under repurchase arrangements. The fair values of these instruments are determined using Level 1 inputs. The following tables provide a summary of our assets and liabilities that are measured at fair value on a recurring basis as of June 30, 2012March 31, 2013 and December 31, 2011.2012.
| | | Quoted Prices in Active Markets for Identical Assets (Level 1) | | | Significant Observable Inputs (Level 2) | | | Significant Unobservable Inputs (Level 3) | | | Balance at March 31, 2013 | |
| | | (in thousands) | |
| Assets at Fair Value: | | | | | | | | | | | | | |
| Agency Securities, available for sale | | $ | - | | | $ | 24,339,169 | | | $ | - | | | $ | 24,339,169 | |
| Derivatives | | $ | - | | | $ | 38,923 | | | $ | - | | | $ | 38,923 | |
| Liabilities at Fair Value: | | | | | | | | | | | | | | | | |
| Derivatives | | $ | 3,262 | | | $ | 188,252 | | | $ | - | | | $ | 191,514 | |
| | | Quoted Prices in Active Markets for Identical Assets (Level 1) | | | Significant Observable Inputs (Level 2) | | | Significant Unobservable Inputs (Level 3) | | | Balance at December 31, 2012 | |
| | | (in thousands) | |
| Assets at Fair Value: | | | | | | | | | | | | | |
| Agency Securities, available for sale | | $ | - | | | $ | 19,096,562 | | | $ | - | | | $ | 19,096,562 | |
| Derivatives | | $ | - | | | $ | 5,367 | | | $ | - | | | $ | 5,367 | |
| Liabilities at Fair Value: | | | | | | | | | | | | | | | | |
| Derivatives | | $ | 3,919 | | | $ | 186,621 | | | $ | - | | | $ | 190,540 | |
ARMOUR Residential REIT, Inc. and Subsidiary
NOTES TO CONDENSED CONSOLIDATED FINANCIAL STATEMENTS
(Unaudited)
| June 30, 2012 | | Level 1 | | | Level 2 | | | Level 3 | | | Totals | |
| | | (dollars in thousands) | |
| Assets: | | | | | | | | | | | | |
| Agency Securities, available for sale | | $ | - | | | $ | 13,328,514 | | | $ | - | | | $ | 13,328,514 | |
| Derivatives, at fair value | | $ | - | | | $ | 9,600 | | | | - | | | $ | 9,600 | |
| Liabilities: | | | | | | | | | | | | | | | | |
| Derivatives, at fair value | | $ | (4,916 | ) | | $ | (151,599 | ) | | | - | | | $ | (156,515 | ) |
| December 31, 2011 | | Level 1 | | | Level 2 | | | Level 3 | | | Totals | |
| | | (dollars in thousands) | |
| Assets: | | | | | | | | | | | | |
| Agency Securities, available for sale | | $ | - | | | $ | 5,393,675 | | | $ | - | | | $ | 5,393,675 | |
| Liabilities: | | | | | | | | | | | | | | | | |
| Derivatives, at fair value | | $ | (5,292 | ) | | $ | (116,435 | ) | | | - | | | $ | (121,727 | ) |
| | | At March 31, 2013 | | | Fair Value Measurements using: | |
| | | Carrying Value | | | Fair Value | | | Quoted Prices in Active Markets for Identical Assets (Level 1) | | | Significant Observable Inputs (Level 2) | | | Significant Unobservable Inputs (Level 3) | |
| | | (in thousands) | |
| Financial Assets: | | | | | | | | | | | | | | | | | | | | |
| Cash | | $ | 836,501 | | | $ | 836,501 | | | $ | 836,501 | | | $ | | | | $ | - | |
| Cash collateral posted | | | 230,451 | | | | 230,451 | | | | - | | | | 230,451 | | | | - | |
| Receivable for unsettled securities | | | 2,226,168 | | | | 2,226,168 | | | | - | | | | 2,226,168 | | | | - | |
| Principal payments receivable | | | 9,381 | | | | 9,381 | | | | - | | | | 9,381 | | | | - | |
| Accrued interest receivable | | | 71,664 | | | | 71,664 | | | | - | | | | 71,664 | | | | - | |
| Financial Liabilities: | | | | | | | | | | | | | | | | | | | | |
| Repurchase agreements | | $ | 24,828,614 | | | $ | 24,828,614 | | | $ | - | | | $ | 24,828,614 | | | $ | - | |
| Accrued interest payable | | | 10,302 | | | | 10,302 | | | | - | | | | 10,302 | | | | - | |
| Cash collateral held | | | 10,155 | | | | 10,155 | | | | - | | | | 10,155 | | | | - | |
| | | At December 31, 2012 | | | Fair Value Measurements using: | |
| | | Carrying Value | | | Fair Value | | | Quoted Prices in Active Markets for Identical Assets (Level 1) | | | Significant Observable Inputs (Level 2) | | | Significant Unobservable Inputs (Level 3) | |
| | | (in thousands) | |
| Financial Assets: | | | | | | | | | | | | | | | | | | | | |
| Cash and cash equivalents | | $ | 771,282 | | | $ | 771,282 | | | $ | 771,282 | | | $ | - | | | $ | - | |
| Cash collateral posted | | | 265,552 | | | | 265,552 | | | | - | | | | 265,552 | | | | - | |
| Receivable for unsettled securities | | | 668,244 | | | | 668,244 | | | | - | | | | 668,244 | | | | - | |
| Principal payments receivable | | | 16,037 | | | | 16,037 | | | | - | | | | 16,037 | | | | - | |
| Accrued interest receivable | | | 55,430 | | | | 55,430 | | | | - | | | | 55,430 | | | | - | |
| Financial Liabilities: | | | | | | | | | | | | | | | | | | | | |
| Repurchase agreements | | $ | 18,366,095 | | | $ | 18,366,095 | | | $ | - | | | $ | 18,366,095 | | | $ | - | |
| Accrued interest payable | | | 10,064 | | | | 10,064 | | | | - | | | | 10,064 | | | | - | |
Note 7 -– Repurchase Agreements
As of June 30, 2012 and December 31, 2011, we had repurchase agreements in place in the amount of $12.1 billion and $5.3 billion, respectively, to finance Agency Security purchases. At June 30, 2012 and December 31, 2011, the weighted average interest rate or cost of funds was 0.40% and 0.37%, respectively. At June 30, 2012 and December 31, 2011, we had repurchase agreements outstanding with 26 and 23 counterparties, respectively, with a weighted average maturity of 32 days and 18 days, respectively.
The following table represents the contractual repricing regarding our repurchase agreements to finance Agency Security purchases as of March 31, 2013 and December 31, 2012.
| | | March 31, 2013 | | | December 31, 2012 | |
| | | (in thousands) | |
| Within 30 days | | $ | 11,626,612 | | | $ | 7,771,444 | |
| 31 days to 60 days | | | 11,540,240 | | | | 7,840,268 | |
| 61 days to 90 days | | | 562,762 | | | | 2,699,706 | |
| Greater than 90 days | | | 1,099,000 | | | | 54,677 | |
| Total | | $ | 24,828,614 | | | $ | 18,366,095 | |
ARMOUR Residential REIT, Inc. and Subsidiary
NOTES TO CONDENSED CONSOLIDATED FINANCIAL STATEMENTS
(Unaudited)
The following table represents the Master Repurchase Agreements (“MRAs”) and other information regarding our repurchase agreements to finance Agency Security purchases as of June 30, 2012March 31, 2013 and December 31, 2011.
| | | June 30, 2012 | | | December 31, 2011 | |
| | | (dollars in thousands) | |
| Within 30 days | | $ | 7,823,536 | | | $ | 4,068,197 | |
| 31 days to 60 days | | | 2,038,459 | | | | 1,111,480 | |
| 61 days to 90 days | | | 1,707,767 | | | | 156,285 | |
| Greater than 90 days | | | 542,824 | | | | - | |
| Total | | $ | 12,112,586 | | | $ | 5,335,962 | |
As of June 30, 2012 and December 31, 2011,| | | March 31, 2013 | | | December 31, 2012 | |
| Number of MRA’s | | | 33 | | | | 33 | |
| Number of counterparties with repurchase agreements outstanding | | | 28 | | | | 26 | |
| Weighted average maturity in days | | | 36 | | | | 34 | |
| Weighted average contractual rate | | | 0.43 | % | | | 0.49 | % |
Haircut for repurchase agreements (1) | | | 4.8 | % | | | 4.8 | % |
(1) The Haircut represents the weighted average margin requirement, or the percentage amount by which the collateral value must exceed the loan amount, which we also refer to as the haircut, under all our repurchase agreements was approximately 4.8% and 5.0%, respectively.amount.
Note 8 -– Derivatives
We enter into transactions to manage our interest rate risk exposure. These transactions include entering into interest rate swap contracts and interest rate swaptions as well as purchasing or selling Futures Contracts. These transactions are designed to lock in funding costs for financing activitiesrepurchase agreements associated with our assets in such a way to help assure the realization of net interest margins. Such transactions are based on assumptions about prepayments which, if not realized, will cause transaction results to differ from expectations. Our derivatives are carried on our condensed consolidated balance sheets, as assets or as liabilities at their fair value. We do not designate our activitiesderivatives as cash flow hedges and as such, we recognize changes in the marketfair value of these transactionsderivatives through earnings. For the quarter and six months ended June 30, 2012, we recognized unrealized losses of $70.4 million and $52.8 million, respectively related to our derivatives. For the quarter and six months ended June 30, 2011, we recognized unrealized losses of $25.8 million and $26.1 million, respectively related to our derivatives. Our derivative instruments are carried on our condensed consolidated balance sheets at fair value, as assets, if their fair value is positive, or as liabilities, if their fair value is negative.
ARMOUR Residential REIT, Inc. and Subsidiary
NOTES TO CONDENSED CONSOLIDATED FINANCIAL STATEMENTS
(Unaudited)
As of June 30, 2012 and December 31, 2011, we had entered into interest rate swap contracts with an aggregate notional balance of $6.0 billion and $2.8 billion, respectively. We have agreements with our swap (including swaption) counterparties that provide for the posting of collateral based on the fair values of our interest rate swap contracts. Through this margin process, either we or our swap counterparty may be required to pledge cash or Agency Securities as collateral. Collateral requirements vary by counterparty and change over time based on the market value,value; notional amount and remaining term of the swap.interest rate swap contracts. Certain interest rate swap contracts provide for cross collateralization and cross default with repurchase agreements and other contracts with the same counterparty.
As of June 30, 2012 we had entered into interest rate swaptions with an aggregate notional balance of $0.8 billion. We had not entered into any interest rate swaptions as of December 31, 2011. Interest rate swaptions generally provide us the option to enter into an interest rate swap agreement forat a certain point of time in the future with a predetermined notional amount, stated term where we generally pay a fixedand stated rate of interest and receive a floating rate of interest rates in the future.fixed leg and interest rate index on the floating leg.
As of June 30, 2012 and December 31, 2011, we had purchased or sold Futures Contracts with an aggregate notional balance of $121.0 million and $131.0 million, respectively, traded in 771 and 1,033 individual contracts, respectively. Our Futures Contracts are traded on the CME which requires the use of daily mark-to-market collateral and the CME provides substantial credit support. The collateral requirements of the CME require us to pledge assets under a bi-lateral margin arrangement, including either cash or Agency Securities and these requirements may vary and change over time based on the market value, notional amount and remaining term of the Futures Contracts. In the event we are unable to meet a margin call under one of our Futures Contracts, the counterparty to such agreement may have the option to terminate or close-out all of the outstanding Futures Contracts with us. In addition, any close-out amount due to the counterparty upon termination of the counterparty’s transactions would be immediately payable by us pursuant to the applicable agreement.
As of June 30, 2012, included in restricted cash on the condensed consolidated balance sheet is $5.3 million related to margin posted for Futures Contracts as well as $187.8 million of restricted cash related to interest rate swap contracts. As of December 31, 2011, we had $5.9 million of restricted cash related to margin posted for Futures Contracts and $141.3 million of restricted cash related to interest rate swap contracts.
The following table presentstables present information about interest rate swap contracts, interest rate swaptions and Futures Contracts which are included in derivatives on the accompanying condensed consolidated balance sheets as of June 30, 2012March 31, 2013 and December 31, 2011.
| | | June 30, 2012 | | | December 31, 2011 | |
| | | (dollars in thousands) | |
| | | Notional Amount | | | Net Fair Value (1) | | | Notional Amount | | | Net Fair Value (1) | |
| Interest rate Swap contracts | | $ | 5,990,000 | | | $ | (150,650 | ) | | $ | 2,765,000 | | | $ | (116,435 | ) |
| Interest rate swaptions | | | 800,000 | | | | 8,651 | | | | - | | | | - | |
| Futures Contracts | | | 121,000 | | | | (4,916 | ) | | | 131,000 | | | | (5,292 | ) |
| Totals | | $ | 6,911,000 | | | $ | (146,915 | ) | | $ | 2,896,000 | | | $ | (121,727 | ) |
(1) See Note 6, “Fair Value of Financial Instruments” for additional discussion.2012.
ARMOUR Residential REIT, Inc. and Subsidiary
NOTES TO CONDENSED CONSOLIDATED FINANCIAL STATEMENTS
(Unaudited)
March 31, 2013
| | | Notional Amount | | | Assets at Fair Value (1) | | Liabilities at Fair Value (1) | |
| | | (in thousands) | |
| Interest rate swap contracts | | $ | 12,320,000 | | | $ | 17,503 | | | $ | (188,252 | ) |
| Interest rate swaptions | | | 1,550,000 | | | | 21,420 | | | | - | |
| Futures Contracts | | | 99,000 | | | | - | | | | (3,262 | ) |
| Totals | | $ | 13,969,000 | | | $ | 38,923 | | | $ | (191,514 | ) |
| (1) | See Note 6, “Fair Value of Financial Instruments” for additional discussion. |
December 31, 2012
| | | Notional Amount | | | Assets at Fair Value (1) | | Liabilities at Fair Value (1) | |
| | | (in thousands) | |
| Interest rate swap contracts | | $ | 8,670,000 | | | $ | 1,718 | | | $ | (186,621 | ) |
| Interest rate swaptions | | | 1,050,000 | | | | 3,649 | | | | - | |
| Futures Contracts | | | 102,000 | | | | - | | | | (3,919 | ) |
| Totals | | $ | 9,822,000 | | | $ | 5,367 | | | $ | (190,540 | ) |
| (1) | See Note 6, “Fair Value of Financial Instruments” for additional discussion. |
The following tables present information about interest rate swap contracts, interest rate swaptions and Futures Contracts and the potential effects of netting if we were to offset the assets and liabilities of these financial instruments on the accompanying condensed consolidated balance sheets. Currently we present these financial instruments at their gross amounts and they are included in derivatives, at fair value on the accompanying condensed consolidated balance sheets as of March 31, 2013.
| | | | | | | Gross Amounts Not Offset in the Condensed Consolidated Balance Sheet | | | | | |
| Assets | | Gross Amounts of Assets Presented in the Condensed Consolidated Balance Sheet | | | Financial Instruments | | | Cash Collateral Held | | | Net Amount | |
| | | (in thousands) | |
| Interest rate swap contracts | | $ | 17,503 | | | $ | (17,503 | ) | | $ | - | | | $ | - | |
| Interest rate swaptions | | | 21,420 | | | | - | | | | (10,155 | ) | | | 11,265 | |
| Totals | | $ | 38,923 | | | $ | (17,503 | ) | | $ | (10,155 | ) | | $ | 11,265 | |
ARMOUR Residential REIT, Inc. and Subsidiary
NOTES TO CONDENSED CONSOLIDATED FINANCIAL STATEMENTS
(Unaudited)
| | | | | | | Gross Amounts Not Offset in the Condensed Consolidated Balance Sheet | | | | | |
| Liabilities | | Gross Amounts of Liabilities Presented in the Condensed Consolidated Balance Sheet | | | Financial Instruments | | | Cash Collateral Posted | | | Net Amount | |
| | | (in thousands) | |
| Interest rate swap contracts | | $ | (188,252 | ) | | $ | 17,503 | | | $ | 227,008 | | | $ | 56,259 | |
| Futures Contracts | | | (3,262 | ) | | | - | | | | 3,443 | | | | 181 | |
| Totals | | $ | (191,514 | ) | | $ | 17,503 | | | $ | 230,451 | | | $ | 56,440 | |
The following tables present information about interest rate swap contracts, interest rate swaptions and Futures Contracts and the potential effects of netting if we were to offset the assets and liabilities of these financial instruments on the accompanying condensed consolidated balance sheets. Currently we present these financial instruments at their gross amounts and they are included in derivatives, at fair value on the accompanying condensed consolidated balance sheets as of December 31, 2012.
| | | | | | | Gross Amounts Not Offset in the Condensed Consolidated Balance Sheet | | | | | |
| Assets | | Gross Amounts of Assets Presented in the Condensed Consolidated Balance Sheet | | | Financial Instruments | | | Cash Collateral Held | | | Net Amount | |
| | | (in thousands) | |
| Interest rate swap contracts | | $ | 1,718 | | | $ | (1,718 | ) | | $ | - | | | $ | - | |
| Swaptions | | | 3,649 | | | | - | | | | - | | | | 3,649 | |
| Totals | | $ | 5,367 | | | $ | (1,718 | ) | | $ | - | | | $ | 3,649 | |
| | | | | | | Gross Amounts Not Offset in the Condensed Consolidated Balance Sheet | | | | | |
| Liabilities | | Gross Amounts of Liabilities Presented in the Condensed Consolidated Balance Sheet | | | Financial Instruments | | | Cash Collateral Posted | | | Net Amount | |
| | | (in thousands) | |
| Interest rate swap contracts | | $ | (186,621 | ) | | $ | 1,718 | | | $ | 261,364 | | | $ | 76,461 | |
| Futures Contracts | | | (3,919 | ) | | | - | | | | 4,188 | | | | 269 | |
| Totals | | $ | (190,540 | ) | | $ | 1,718 | | | $ | 265,552 | | | $ | 76,730 | |
ARMOUR Residential REIT, Inc. and Subsidiary
NOTES TO CONDENSED CONSOLIDATED FINANCIAL STATEMENTS
(Unaudited)
The following table represents the location and information regarding our derivatives which are included in total other (loss) incomeOther (Loss) Income in the accompanying condensed consolidated statements of operations for the quarters ended March 31, 2013 and six months ended June 30, 2012 and June 30, 2011.March 31, 2012.
| | | | (Loss) Income Recognized (in thousands) For the Quarters Ended | |
| Derivatives | Location on condensed consolidated statements of operations | | March 31, 2013 | | | March 31, 2012 | |
| Interest rate swap contracts: | | | | | | | |
| Interest income | Realized loss on derivatives | | $ | 4,099 | | | $ | 931 | |
| Interest expense | Realized loss on derivatives | | | (32,501 | ) | | | (10,191 | ) |
| Realized loss | Realized loss on derivatives | | | - | | | | - | |
| Changes in fair value | Unrealized gain on derivatives | | | 16,953 | | | | 17,556 | |
| | | | | (11,449 | ) | | | 8,296 | |
| Interest rate swaptions: | | | | | | | | | |
| Changes in fair value | Unrealized gain on derivatives | | | (1,309 | ) | | | - | |
| | | | | (1,309 | ) | | | - | |
| Futures Contracts: | | | | | | | | | |
| Realized loss | Realized loss on derivatives | | | (651 | ) | | | (481 | ) |
| Changes in fair value | Unrealized gain on derivatives | | | 657 | | | | 58 | |
| | | | | 6 | | | | (423 | ) |
| Totals | | | $ | (12,752 | ) | | $ | 7,873 | |
| | | | | Loss Recognized in Income (dollars in thousands) | |
| | | | | For the Quarters Ended | | For the Six Months Ended | |
| Derivatives | | Location on condensed consolidated statements of operations | | | June 30, 2012 | | | June 30, 2011 | | | June 30, 2012 | | | June 30, 2011 | |
| Interest rate swap contracts: | | | | | | | | | | | | | | | | | |
| Interest income | | Realized loss on derivatives | | $ | 1,928 | | $ | 356 | | | $ | 2,859 | | | $ | 567 | |
| Interest expense | | Realized loss on derivatives | | | (13,756 | ) | | (6,107 | ) | | | (23,946 | ) | | | (8,128 | ) |
| Realized gain | | Realized loss on derivatives | | | - | | | - | | | | - | | | | 17 | |
| Changes in fair value | | Unrealized loss on derivatives | | | (59,233 | ) | | (24,038 | ) | | | (41,677 | ) | | | (24,162 | ) |
| | | | | | (71,061 | ) | | (29,789 | ) | | | (62,764) | | | | (31,706 | ) |
| Interest rate swaptions: | | | | | | | | | | | | | | | | | |
| Realized (loss) | | Realized loss on derivatives | | | - | | | - | | | | - | | | | - | |
| Changes in fair value | | Unrealized loss on derivatives | | | (11,479 | ) | | - | | | | (11,479 | ) | | | - | |
| | | | | | (11,479 | ) | | - | | | | (11,479 | ) | | | - | |
| Futures Contracts: | | | | | | | | | | | | | | | | | |
| Realized (loss) | | Realized loss on derivatives | | | (572 | ) | | (327 | ) | | | (1,053 | ) | | | (460 | ) |
| Changes in fair value | | Unrealized loss on derivatives | | | 318 | | | (1,779 | ) | | | 376 | | | | (1,921 | ) |
| | | | | | (254 | ) | | (2,106 | ) | | | (677 | ) | | | (2,381 | ) |
| Totals | | | | $ | (82,794 | ) | $ | (31,895 | ) | | $ | (74,920 | ) | | $ | (34,087 | ) |
Note 9 -– Share-Based Compensation
We adopted the 2009 Stock Incentive Plan (the "Plan") to attract, retain and reward directors officers and other employees of ours and other persons who provide services to us in the course of operations. The Plan authorizes the Board to grant awards including common stock, restricted shares of common stock (“RSUs”), stock options, performance shares, performance units, stock appreciation rights and other equity and cash-based awards (collectively “Awards”), subject to terms as provided in the Plan.
On May 12, 2010, the Board allocated up to 250,000 shares to be available under the Plan. In considering such allocation, the Board considered the size of the Plan relative to our capital base and our current and potential future performance and capitalization. On July 18, 2011, our stockholders approved an amendment to the Plan to increase the number of shares issuable thereunder from 250,000 shares to 2,000,000 shares and the Plan was amended accordingly. During the six monthsquarter ended June 30, 2012March 31, 2013, we awarded a total of 655,5241,278,195 RSUs to members of our Board and employeesto ARRM for its employees. Of these awards, 150,208 shares vesting in 2017 were awarded subject to shareholder approval of ARRM.an increase to the number of shares issuable.
RSU transactions for the six monthsquarter ended June 30, 2012March 31, 2013 are summarized below:
| | | June 30, 2012 | | March 31, 2013 |
| | | Number of Awards | | Weighted Average Grant Date Fair Value per Award | | Number of Awards | | Weighted Average Grant Date Fair Value per Award |
| Unvested Awards Outstanding at January 1, 2012 | | | 153,980 | | | $ | 7.91 | | |
| Unvested Awards Outstanding beginning of period | | | 628,367 | | $ | 7.28 |
| Granted | | | 655,524 | | | | 7.13 | | | 1,278,195 | | 6.78 |
| Vested | | | (96,322 | ) | | | 7.28 | | | (106,315 | ) | | 7.27 |
| Unvested Awards Outstanding at June 30, 2012 | | | 713,182 | | | $ | 7.28 | | |
| Unvested Awards Outstanding end of period | | | 1,800,247 | | $ | 6.94 |
ARMOUR Residential REIT, Inc. and Subsidiary
NOTES TO CONDENSED CONSOLIDATED FINANCIAL STATEMENTS
(Unaudited)
As of June 30, 2012,March 31, 2013, there was approximately $5.2$12.5 million of unearned non-cash stock-based compensation related to the Awards (based on the June 30, 2012March 31, 2013 stock price)price of $6.53 per share), that we expect to recognize as an expense over the remaining average service period of 4.03.6 years.
ARMOUR Residential REIT, Inc. and Subsidiary
NOTES TO CONDENSED CONSOLIDATED FINANCIAL STATEMENTS
(Unaudited)
Note 10 -– Stockholders’ Equity
Dividends
The following table presentstables present our common stock dividend transactions for the six monthsquarter ended June 30, 2012.March 31, 2013.
| Record Date | | Payment Date | | Rate per common share | | | Aggregate amount paid to holders of record (in millions) | |
| January 15, 2012 | | January 30, 2012 | | $ | 0.11 | * | | $ | 11.6 | |
| February 15, 2012 | | February 28, 2012 | | | 0.11 | | | | 15.3 | |
| March 15, 2012 | | March 29, 2012 | | | 0.11 | | | | 19.9 | |
| April 15, 2012 | | April 27, 2012 | | | 0.10 | | | | 17.8 | |
| May 15, 2012 | | May 30, 2012 | | | 0.10 | | | | 18.1 | |
| June 15, 2012 | | June 28, 2012 | | | 0.10 | | | | 18.6 | |
| Record Date | | Payment Date | | Rate per common share | | | Aggregate amount paid to holders of record (in millions) | |
| January 15, 2013 | | January 30, 2013 | | $ | 0.08 | | | $ | 24.8 | |
| February 15, 2013 | | February 27, 2013 | | | 0.08 | | | | 24.8 | |
| March 15, 2013 | | March 27, 2013 | | | 0.08 | | | | 30.2 | |
* this amount included $0.006 per common share of taxable income related to the year ended December 31, 2011.
Dividends were not paid on outstanding shares ofThe following table presents our Series A Preferred Stock dividend transactions for the six monthsquarter ended June 30, 2012. On July 27, 2012, a cash dividend of $0.2865 per outstanding share ofMarch 31, 2013.
| Record Date | | Payment Date | | Rate per Series A Preferred Share | | | Aggregate amount paid to holders of record (in millions) | |
| January 15, 2013 | | January 28, 2013 | | $ | 0.17 | | | $ | 0.3 | |
| February 15, 2013 | | February 26, 2013 | | | 0.17 | | | | 0.4 | |
| March 15, 2013 | | March 26, 2013 | | | 0.17 | | | | 0.4 | |
The following table presents our Series AB Preferred Stock or $0.4 million in the aggregate, was paid to holders of record on July 13, 2012dividend transactions for the period of June 7, 2012 through July 30, 2012. Our condensed consolidated financial statements reflect an accrual of $0.2 million for the June amount payable.quarter ended March 31, 2013.
| Record Date | | Payment Date | | Rate per Series B Preferred Share | | | Aggregate amount paid to holders of record (in millions) | |
| March 15, 2013 | | March 27, 2013 | | $ | 0.25 | | | $ | 1.4 | |
Equity Capital Raising Activities
The following table presents our equity transactions for the six monthsquarter ended June 30, 2012.March 31, 2013.
| Transaction Type | | Completion Date | | Number of Shares (1) | | | Per Share price | | | Net Proceeds (in millions) | |
| Follow-on public offering | | January 13, 2012 | | | 10,350,000 | | | $ | 6.80 | | | $ | 70.1 | |
| Follow-on public offering | | February 8, 2012 | | | 29,900,000 | | | | 6.80 | | | | 203.0 | |
| Equity distribution agreement | | February 29, 2012 | | | 1,287,570 | | | | 7.06 | | | | 8.9 | |
| Follow-on public offering | | March 8, 2012 | | | 35,650,000 | | | | 6.72 | | | | 239.2 | |
| Issuance of preferred stock | | June 7, 2012 | | | 1,400,000 | | | | 25.00 | | | | 33.8 | |
| Equity distribution agreement | | January 1, 2012 to June 30, 2012 | | | 15,500,000 | | | | 7.02 | (2) | | | 106.5 | |
| Dividend Reinvestment and Stock Purchase Plan | | January 1, 2012 to June 30, 2012 | | | 17,758 | | | | 6.95 | (2) | | | 0.1 | |
| Transaction Type | | Completion Date | | Number of Shares | | Per Share price | | | Net Proceeds (in millions) |
| Series A Preferred equity distribution agreements | | January 2, 2013 through January 30, 2013 | | 174,961 | | $ | 25.51 | (1) | | $ | 4.4 |
| Dividend reinvestment and stock purchase plan | | January 25, 2013 through March 27, 2013 | | 10,110 | | | 6.64 | (1) | | | 0.1 |
| Series B Preferred initial offering | | February 12, 2013 | | 5,650,000 | | | 25.00 | | | | 136.6 |
| Common stock follow-on public offering | | February 20, 2013 | | 65,000,000 | | | 6.75 | | | | 438.4 |
(1) Inclusive of over allotment option| (1) | Weighted average price |
(2) This amount is a weighted average price
ARMOUR Residential REIT, Inc. and Subsidiary
NOTES TO CONDENSED CONSOLIDATED FINANCIAL STATEMENTS
(Unaudited)
Note 11 – Net Income per Common Share
The following table presents a reconciliation of net income and the shares used in calculating weighted average basic and diluted earnings per common share for the quarters ended March 31, 2013 and March 31, 2012.
| | | For the Quarters Ended | |
| �� | | March 31, 2013 | | | March 31, 2012 | |
| | | (in thousands) | |
| Net Income | | $ | 102,290 | | | $ | 65,224 | |
| Less: Preferred dividends | | | (2,497 | ) | | | - | |
| Net Income available to common stockholders | | $ | 99,793 | | | $ | 65,224 | |
| | | | | | | | | |
| Weighted average common shares outstanding - basic | | | 337,935 | | | | 134,903 | |
| Add: Effect of dilutive non-vested restricted stock awards, assumed vested | | | 1,787 | | | | - | |
| Weighted average common shares outstanding - diluted | | | 339,722 | | | | 134,903 | |
We have 32,500,000 warrants that were outstanding and considered anti-dilutive as their exercise price exceeded the average stock price for the quarters ended March 31, 2013 and March 31, 2012.
Note 12 – Income Taxes
We have elected to be taxed as a REIT under the Code. We will generally not be subject to federal income tax to the extent that we distribute our taxable income to our stockholders and as long as we satisfy the ongoing REIT requirements under the Code including meeting certain asset, income and stock ownership tests.
The following table reconciles our GAAP net income to estimated REIT taxable income for the quarters ended March 31, 2013 and March 31, 2012.
| | | For the Quarters Ended | |
| | | March 31, 2013 | | | March 31, 2012 | |
| | | (in millions) | |
| GAAP Net income | | $ | 102.3 | | | $ | 65.2 | |
| Book to tax differences: | | | | | | | | |
| Unrealized gain on derivatives | | | (16.3 | ) | | | (17.6 | ) |
| Estimated taxable income | | $ | 86.0 | | | $ | 47.6 | |
The aggregate tax basis of our assets and liabilities is greater than our total Stockholders’ Equity at March 31, 2013 by approximately $120.6 million, or approximately $0.32 per share (based on the 374,053,198 shares then outstanding).
We are required and intend to timely distribute substantially all of our REIT taxable income in order to maintain our REIT status. For the quarter ended March 31, 2013, we paid dividends of $0.08 per outstanding share of common stock and $0.17 per outstanding share of Series A Preferred stock for each month of the quarter. In addition, we paid dividends of $0.25 per outstanding share of Series B Preferred stock for the month of March, resulting in total payments to stockholders of $82.3 million. Our estimated REIT taxable income available to pay dividends was $86.0 million for the quarter ended March 31, 2013. At March 31, 2013, our under distributed estimated REIT taxable income was $3.7 million.
We have elected to treat Enterprise as a taxable REIT subsidiary, which is a tax paying entity for income tax purposes and it is taxed separately from ARMOUR.
The federal income tax (expense) benefit for the quarter and six months ended June 30, 2012 was ($0.0) million and $0.03 million, respectively. The $0.03 million of federal income tax benefit was a result of a reversal of an over accrual of Because Enterprise is inactive, its taxes due in 2011. This accrual was reversed during the first quarter of 2012 when the tax return was filed and all income tax amounts due were paid. Our provision for income taxes for the quarter and six months ended June 30, 2011, wasare nominal.
ARMOUR Residential REIT, Inc. and Subsidiary
NOTES TO CONDENSED CONSOLIDATED FINANCIAL STATEMENTS
(Unaudited)
Our management is responsible for determining whether tax positions taken by us are more likely than not to be sustained on their merits. We have no material unrecognized tax benefits or material uncertain tax positions.
Note 12 -13 – Commitments and Contingencies
Management Agreement with ARRM
As discussed in Note 1314 “Related Party Transactions,” we are externally managed by ARRM pursuant to an amended and restateda management agreement, as furthermost recently amended and restated on June 18, 2012 (the “Second Amended and Restated“2012 Management Agreement”). The Second Amended and Restated2012 Management Agreement entitles ARRM to receive a management fee payable monthly in arrears in an amount equal to 1/12th of 1% of gross equity raised until gross equity raised was $50 million. Thereafter, the monthly management fee would be 1/12th12th of the sum of (a) 1.5% of gross equity raised up to $1 billion plus (b) 0.75% of gross equity raised in excess of $1 billion. We are also obligated to reimburse certain expenses incurred by ARRM and its affiliates. ARRM is further entitled to receive a termination fee from us under certain circumstances. The ARRM monthly management fee is not calculated based on the performance of our portfolio. Accordingly, the payment of our monthly management fee may not decline in the event of a decline in our earnings and may cause us to incur losses.
Operating Leases
We are not party to any agreement for the rental of real property and office space, or any leases for office, computer and other equipment or office furnishings.
Indemnifications and Litigation
We enter into certain contracts that contain a variety of indemnifications to third-parties, principally with ARRM and brokers. The maximum potential amount of future payments we could be required to make under these indemnification provisions is unknown. We have not incurred any costs to defend lawsuits or settle claims related to these indemnification agreements. As a result, the estimated fair value of these agreements is minimal. Accordingly, we have no liabilities recorded for these agreements as of June 30, 2012March 31, 2013 and December 31, 2011.2012.
We are not party to any pending, threatened or contemplated litigation.
Note 13 -14 – Related Party Transactions
We are externally managed by ARRM pursuant to the Second Amended and Restated2012 Management Agreement. All of our executive officers are also employees of ARRM. ARRM manages our day-to-day operations, subject to the direction and oversight of the Board. The Second Amended and Restated2012 Management Agreement became effective on June 18, 2012 and expires after an initial term of 10ten years on June 18, 2022 and is thereafter automatically renewed for an additional five-year term unless terminated under certain circumstances. Either party must provide 180 days prior written notice of any such termination.
Under the terms of the Second Amended and Restated2012 Management Agreement, ARRM is responsible for costs incident to the performance of its duties, such as compensation of its employees and various overhead expenses. ARRM is responsible for the following primary roles:
| · | Advising us with respect to, arrange for and manage the acquisition, financing, management and disposition of, elements of our investment portfolio, |
| · | Evaluating the duration risk and prepayment risk within the investment portfolio and arranging borrowing and hedging strategies, |
| · | Coordinating capital raising activities, |
| · | Advising us on the formulation and implementation of operating strategies and policies, arranging for the acquisition of assets, monitoring the performance of those assets and providing administrative and managerial services in connection with our day-to-day operations and |
| · | Providing executive and administrative personnel, office space and other appropriate services required in rendering management services to us. |
| · | ARRM is also responsible for the payment of a sub-management fee payable monthly in arrears to Staton Bell Blank Check LLC in an amount equal to 25% of the monthly base management fee earned by ARRM, net of expenses. |
We are required to take actions as may be reasonably required to permit and enable ARRM to carry out its duties and obligations. We are also responsible for any costs and expenses that ARRM incurred solely on behalf of ARMOUR or its subsidiary other than the various overhead expenses specified in the terms of the 2012 Management Agreement. For the quarter ended March 31, 2013 we reimbursed ARRM $0.4 million for expenses incurred on our behalf. For the quarter ended March 31, 2012 we did not reimburse ARRM for any expenses.
ARMOUR Residential REIT, Inc. and Subsidiary
NOTES TO CONDENSED CONSOLIDATED FINANCIAL STATEMENTS
(Unaudited)
For the quarterquarters ended March 31, 2013 and six months ended June 30,March 31, 2012 we incurred $4.3$6.6 million and $7.8 million in management fees to ARRM, respectively. For the quarter and six months ended June 30, 2011, we incurred $1.5 million and $2.3$3.5 million in management fees to ARRM, respectively.
ARMOUR Residential REIT, Inc. and Subsidiary
NOTES TO CONDENSED CONSOLIDATED FINANCIAL STATEMENTS
(Unaudited)
Note 14 -15 – Interest Rate Risk
Our primary market risk is interest rate risk. Interest rates are highly sensitive to many factors, including governmental monetary and tax policies, domestic and international economic and political considerations and other factors beyond our control. Changes in the general level of interest rates can affect net interest income, which is the difference between the interest income earned and the interest expense incurred in connection with the liabilities, by affecting the spread between the interest-earning assets and interest-bearing liabilities. Changes in the level of interest rates also can affect the value of Agency Securities and our ability to realize gains from the sale of these assets. A decline in the value of the Agency Securities pledged as collateral for borrowings under repurchase agreements could result in the counterparties demanding additional collateral pledges or liquidation of some of the existing collateral to reduce borrowing levels.
Note 1516 – Subsequent Events
Events subsequent to the balance sheet date have been evaluated for inclusion in the accompanying financial statements through the issuance date.
On July 9, 2012, we filed a registration statement on Form S-3ASR. This automatic shelf registration statement permits us to issue and sell, from time to time, shares of our common stock, preferred stock, warrants, depositary shares and debt securities, which may consist of debentures, notes, or other types of debt, in one or more offerings. We will provide specific terms of each offering and issuance of these securities, such as when we sell the securities, the amounts of securities we will sell and the prices and other terms on which we will sell them, in a prospectus supplement. We may offer and sell these securities to or through one or more underwriters, dealers and agents, or directly to purchasers, on a continuous or delayed basis.
On July 13, 2012, we completed an underwritten follow-on public offering of 40,000,000 shares of common stock at a price of $7.06 per share. The underwriters fully exercised the over-allotment option for 6,000,000 additional shares. Net proceeds were $324.6 million, net of issuance costs of approximately $0.2 million.
On July 13, 2012, we entered into an At Market Issuance Sales Agreement with MLV & Co. LLC, as our agent, to offer and sell, from time to time, up to 6,000,000 shares of our Series A Preferred Stock in at-the-market transactions. As of July 30, 2012, 68,003 shares have been issued under this agreement.
On July 27, 2012,April 29, 2013, a cash dividend of $0.2865$0.17 per outstanding share of Series A Preferred Stock, or $0.4 million in the aggregate, was paid to holders of record on July 13, 2012.April 15, 2013. We have also announced cash dividends of $0.17 per outstanding share of Series A Preferred Stock payable May 27, 2013 to holders of record on May 15, 2013 and payable June 27, 2013 to holders of record on June 14, 2013.
On July 27, 2012, we entered into an Equity Distribution Agreement with Citadel Securities LLC, as our agent, to offer and sell, from time to time, up to 22,500,000 shares of our common stock and up to 2,000,000 shares of our Series A Preferred Stock. As of July 31, 2012, no shares have been issued under this agreement.
On July 30, 2012,April 29, 2013, a cash dividend of $0.10$0.16 per commonoutstanding share of Series B Preferred Stock, or $23.4$0.9 million in the aggregate, was paid to holders of record on July 16, 2012.April 15, 2013. We have also announced cash dividends of $0.16 per outstanding share of Series B Preferred Stock payable May 27, 2013 to holders of record on May 15, 2013 and payable June 27, 2013 to holders of record on June 14, 2013.
On April 29, 2013, a cash dividend of $0.07 per outstanding common share, or $26.2 million in the aggregate, was paid to holders of record on April 15, 2013.
Item 2. Management’s Discussion and Analysis of Financial Condition and Results of Operations
The following discussion of our financial condition and results of operations should be read in conjunction with our financial statements and related notes included elsewhere in this report.
References to “we”, “us”, “our”,“we,” “us,” “our,” “ARMOUR” or the “Company” are to ARMOUR Residential REIT, Inc. References to “ARRM” are to ARMOUR Residential Management LLC, a Delaware limited liability company. References to “Enterprise” are to Enterprise Acquisition Corp., which is a wholly-owned subsidiary of ARMOUR.
CAUTIONARY NOTE REGARDING FORWARD-LOOKING STATEMENTS
This report contains various “forward-looking statements.” Forward-looking statements relate to expectations, beliefs, projections, future plans and strategies, anticipated events or trends and similar expressions concerning matters that are not historical facts. In some cases, you can identify forward-looking statements by the use of forward-looking terminology such as “believes,” “expects,” “may,” “will,” “would,” “could,” “should,” “seeks,” “approximately,” “intends,” “plans,” “projects,” “estimates” or “anticipates” or the negative of these words and phrases or similar words or phrases. All forward-looking statements may be impacted by a number of risks and uncertainties, including statements regarding the following subjects:
· | our business and investment strategy; |
· | our anticipated results of operations; |
· | statements about future dividends; |
· | our ability to obtain financing arrangements; |
· | our understanding of our competition and ability to compete effectively; |
· | market, industry and economic trends; and |
The forward-looking statements in this report are based on our beliefs, assumptions and expectations of our future performance, taking into account all information currently available to us. These beliefs, assumptions and expectations are subject to risks and uncertainties and can change as a result of many possible events or factors, not all of which are known to us. If a change occurs, our business, financial condition, liquidity and results of operations may vary materially from those expressed in our forward-looking statements. You should carefully consider these risks before you make an investment decision with respect to our stock.
We cannot guarantee future results, levels of activity, performance or achievements. You should not place undue reliance on forward-looking statements, which apply only as of the date of this report. We do not intend and disclaim any duty or obligation to update or revise any industry information or forward-looking statements set forth in this report to reflect new information, future events or otherwise, except as required under the U.S. Federal securities laws.
Overview
We are an externally managed Maryland corporation organizedformed in 2008, managed by ARRM. We invest primarily in hybrid adjustable rate, adjustable rate and fixed rate residential mortgage backed securities (“RMBS”). These securities are issued or guaranteed by a U.S. Government-sponsored entity (“GSE”), such as the Federal National Mortgage Association (Fannie Mae) and, the Federal Home Loan Mortgage Corporation (Freddie Mac), or guaranteed by the Government National Mortgage Administration (Ginnie Mae) (collectively, “Agency Securities”). Our portfolio consists primarily of securities backed by fixed rate, hybrid adjustable rate, and adjustable rate home loans. From time to time, a portion of our portfolio may be invested in unsecured notes and bonds issued by U.S. Government-chartered entities (collectively, “Agency Debt”), U.S. Treasuries and money market instruments, subject to certain income tests we must satisfy for our qualification as a real estate investment trust (“REIT”). On December 1, 2011, our stockholders approved an amendmentOur charter permits us to our charter to alter our investment asset class restriction in response to potential changesinvest in Agency Securities to include non-Agency as well asand Non-Agency Securities. As of March 31, 2013, Agency Securities inaccount for 100% of our investment asset class restriction. While we remain committedportfolio. It is expected that the percentage will continue to investing in Agency Securities for so long as an adequate supply and pricing exists, we believe it is prudent for us to have the flexibility to invest in non-Agency Securities and respond to changes in GSE policy.be 100% or close thereto.
We seek attractive long-term investment returns by investing our equity capital and borrowed funds in our targeted asset class of Agency Securities. We earn returns on the spread between the yield on our assets and our costs, including the interest cost of the funds we borrow, after giving effect to our hedges. We intend to qualify and have elected to be taxed as a REIT under the Internal Revenue Code (“the Code”). We will generally not be subject to federal income tax to the extent that we distribute our taxable income to our stockholders and as long as we satisfy the ongoing REIT requirements including meeting certain asset, income and stock ownership tests. Our business plan is to identify and acquire Agency Securities, finance our acquisitions with borrowings under a series of short-term repurchase agreements at the most competitive interest rates available to us and then cost-effectively hedge our interest rate and other risks based on our entire portfolio of assets, liabilities and derivatives and our management's view of the market. Successful implementation of our business plan requires us to address interest rate risk, maintain adequate liquidity and effectively hedge interest rate risks. We execute our business plan in a manner consistent with our intention of qualifying as a REIT and avoid regulation as an investment company.company under the Investment Company Act of 1940 (the “1940 Act”).
Factors that Affect our Results of Operations and Financial Condition
Our results of operations and financial condition are affected by various factors, many of which are beyond our control, including, among other things, our net interest income, the market value of our assets and the supply of and demand for such assets. We invest in financial assets and markets. Recent events, such as those discussed below, can affect our business in ways that are difficult to predict and may produce results outside of typical operating variances. Our net interest income varies primarily as a result of changes in interest rates, borrowing costs and prepayment speeds, the behavior of which involves various risks and uncertainties. Prepayment rates, as reflected by the rate of principal pay downs and interest rates vary according to the type of investment, conditions in financial markets, government actions, competition and other factors, none of which can be predicted with any certainty. In general, as prepayment rates on our Agency Securities purchased at a premium increase, related purchase premium amortization increases, thereby reducing the net yield on such assets. Because changes in interest rates may significantly affect our activities, our operating results depend, in large part, upon our ability to manage interest rate risks and prepayment risks effectively while maintaining our status as a REIT. In addition, since we have not elected to use cash flow hedge accounting, earnings reported in accordance with U.S. generally accepted accounting principles in the U.S. (“GAAP”) will fluctuate even in situations where our derivatives are operating as intended. As a result of this mark-to-market accounting treatment, our results of operations are likely to fluctuate far more than if we were to designate our derivative activities as cash flow hedges. Comparisons with companies that use cash flow hedge accounting for all or part of their derivative activities may not be meaningful.
We anticipate that, for any period during which changes in the interest rates earned on our assets do not coincide with interest rate changes on our borrowings, such assets will reprice more slowly than the corresponding liabilities. Consequently, changes in interest rates, particularly short-term interest rates, may significantly influence our net interest income. With the maturities of our assets generally of longer term than those of our liabilities, interest rate increases will tend to decrease our net interest income and the market value of our assets (and therefore our book value). Such rate increases could possibly result in operating losses or adversely affect our ability to make distributions to our stockholders.
Prepayments on Agency Securities and the underlying mortgage loans may be influenced by changes in market interest rates and a variety of economic and geographic factors beyond our control, as well as policy decisions by Fannie Mae, Freddie Mac, their regulator the Federal Housing Finance Agency (“FHFA”), Ginnie Mae and Ginnie Mae.others. Consequently prepayment rates cannot be predicted with certainty. To the extent we have acquired Agency Securities at a premium or discount to par, or face value, changes in prepayment rates may impact our anticipated yield. In periods of declining interest rates, prepayments on our Agency Securities will likely increase. If we are unable to reinvest the proceeds of such prepayments at comparable yields, our net interest income may suffer. The recent climate of government intervention in the mortgage markets significantly increases the risk associated with prepayments.
While we intend to use strategies to economically hedge some of our interest rate risk, we do not intend to hedge all of our exposure to changes in interest rates and prepayment rates, as there are practical limitations on our ability to insulate our portfolio from all potential negative consequences associated with changes in short-term interest rates in a manner that will allow us to seek attractive net spreads on our portfolio.
In addition, a variety of other factors relating to our business may also impact our financial condition and operating performance; these factors include,
| · | our access to funding and borrowing capacity; |
| · | our use of derivatives to hedge interest rate risk; |
| · | the REIT requirements; and |
| · | the requirements to qualify for an exemption under the Investment Company1940 Act and other regulatory and accounting policies related to our business. |
For a discussion of additional risks relating to our business see “Risk Factors” in Item 1A, the Risk Factors below, and in our Annual Report on Form 10-K for the year ended December 31, 2011.
Our Manager
We are externally managed by ARRM, pursuant to an amended and restateda management agreement as furthermost recently amended and restated on June 18, 2012 (the “Second Amended“2012 Management Agreement”). ARRM is an investment advisor registered with the Securities and Restated Management Agreement”Exchange Commission (“SEC”) (see Note 1214 to the condensed consolidated financial statements). All of our executive officers are also employees of ARRM. ARRM is also the external manager of JAVELIN Mortgage Investment Corp. (“JAVELIN”), a publicly traded REIT which invests in and manages a leveraged portfolio of Agency Securities and Non-Agency Securities. Our executive officers also serve as executive officers of JAVELIN. ARRM manages our day-to-day operations, subject to the direction and oversight of the Board of Directors (“Board”). The Second Amended and Restated2012 Management Agreement became effective on June 18, 2012 and expires after an initial term of 10ten years on June 18, 2022 and is thereafter automatically renewed for an additional five-year term unless terminated under certain circumstances. Either party must provide 180 days prior written notice of any such termination.
Pursuant to the Second Amended and Restated2012 Management Agreement, ARRM is entitled to receive a management fee payable monthly in arrears in an amount equal to 1/12th12th of 1% of gross equity raised until gross equity raised was $50 million. Thereafter, the monthly management fee would be 1/12th12th of the sum of (a) 1.5% of gross equity raised up to $1 billion plus (b) 0.75% of gross equity raised in excess of $1 billion. We are also obligated to reimburse certain expenses incurred by ARRM and its affiliates. ARRM is further entitled to receive a termination fee from us under certain circumstances.
For the quarter ended March 31, 2013, we reimbursed ARRM $0.4 million for expenses incurred on our behalf. For the quarter ended March 31, 2012, we did not reimburse ARRM for any expenses. ARRM is entitled to receive a monthly management fee regardless of the performance of our portfolio. Accordingly, the payment of our monthly management fee may not decline in the event of a decline in our earnings and may cause us to incur losses.
Recent DevelopmentsPursuant to the Sub-Management Agreement between ARRM and the Sub-Manager, ARRM is responsible for paying a sub-management fee to the Sub-Manager in an amount equal to 25% of the base management fee earned by ARRM, net of expenses. On November 6, 2014 the Sub-Manager has the option of terminating the Sub-Management Agreement. Upon termination of the Sub-Management Agreement we are required to make a final payment to the Sub-Manager in the amount of 6.16 times the annualized rate of the sub-management fee for the prior three months. Thereafter, we will be entitled to receive the sub-management fee or, at the option of ARRM, reimbursement of the final payment by ARRM.
Market and Interest Rate Trends and the Effect on our Portfolio
Developments at Fannie Mae and Freddie Mac
Payments on the Agency Securities in which we invest are guaranteed by Fannie Mae and Freddie Mac. Because of the guarantee and the underwriting standards associated with mortgages underlying Agency Securities, Agency Securities historically have had high stability in value and been considered to present low credit risk.
In February 2011, the U.S. Treasury along with the U.S. Department of Housing and Urban Development released a report entitled, “Reforming America’s Housing Finance Market” to the U.S. Congress outlining recommendations for reforming the U.S. housing system, specifically Fannie Mae and Freddie Mac and transforming the U.S. Government’s involvement in the housing market. It is unclear how future legislation may impact the housing finance market and the investing environment for Agency Securities as the method of reform is undecided and has not yet been defined by the regulators. Without U.S. Government support for residential mortgages, we may not be able to execute our current business model in an efficient manner.
In March 2011, the U.S. Treasury announced that it would begin the orderly wind down of Agency Securities it had purchased from Fannie Mae, Freddie Mac and Ginnie Mae to stabilize the housing market, with sales up to $10.0 billion per month, subject to market conditions. We are unable to predict the timing or manner in which the U.S. Treasury or the U.S. Federal Reserve (“the Fed”) will liquidate their holdings or make further interventions in the Agency Securities markets, or what impact, if any, such action could have on the Agency Securities market, the Agency Securities we hold, our business, results of operations and financial condition.
We cannot predict whether or when new actions may occur, the timing and pace of current actions already implemented, or what impact if any, such actions, or future actions, could have on our business, results of operations and financial condition.
U.S. Government Mortgage Related Securities Market Intervention
The U.S. Federal Reserve’s (“In September 2012, the Fed”)Fed announced a third quantitative easing program, popularly referred to as “QE3,” to purchase Agency Securities which had commenced in January 2009 and was terminated on March 31, 2010 has a significant impact on market prices. In total, $1.3 trillionan additional $40 billion of Agency Securities were purchased. In addition,per month until the unemployment rate and other economic indicators improve. QE3 plus its existing investment programs are expected to grow the Fed’s Agency Securities holding by approximately $85 billion per month at least through the courseend of 2009,2012. On December 12, 2012, the U.S. Treasury purchased $250.0 billion of Agency Securities. An effect of these purchases has been an increase in the prices of Agency Securities, which has decreased our net interest margin. When these programs terminated, the market expectation was that it might cause a decrease in demand for these securities which would likely reduce their market price. However, this has not happened and we continue to see strong demand as these securities remain desirable assets in this rather volatile economic environment. It is difficult to quantify the impact, as there are many factors at work at the same time that affect the price of Agency Securities and, therefore, our yield and book value. Due to the unpredictability in the markets for our securities in particular and yield generating assets in general, there is no pattern that can be implied with any certainty. In March 2011, the U.S. TreasuryFederal Reserve also announced that it will beginkeep the orderly wind down of its remainingtarget range for the Federal Funds Rate between zero and 0.25% for at least as long as the unemployment rate remains above 6.5%, inflation between one and two years ahead is projected to be no more than 0.5% above the Federal Reserve’s 2% longer-run goal, and longer-term inflation expectations continue to be well anchored.
The Fed expects these measures to put downward pressure on long-term interest rates. In the short term, these actions have driven Agency Securities with sales upprices to $10.0 billion per month, subjectall-time highs, which have further compressed interest spreads, and removed the historical correlation between mortgage rates and U.S. Treasury or interest rate swaps. These factors have contributed to market conditions. It is unclear how these sales will affect market conditions and pricing. On September 21, 2011, the U.S. Federal Reserve announced that it will begin reinvesting principal payments from its holdings of Agency Debt and Agency Securities.a challenging interest rate hedging environment.
Financial Regulatory Reform Bill and Other Government Activity
We believe that we conduct our business in a manner that allows us to avoid being regulated as an investment company under the Investment Company Act, (“the Act”) pursuant to the exemptionexclusion provided by Section 3(c)(5)(C) of the 1940 Act for entities that are primarily engaged in the business of purchasing or otherwise acquiring “mortgages and other liens on and interests in real estate.” On August 31, 2011, the Securities and Exchange CommissionSEC issued a concept release (No. IC-29778; File No. SW7-34-11, Companies Engaged in the Business of Acquiring Mortgages and Mortgage-RelatedMortgage Related Instruments) pursuant to which it is reviewing whether certain companies that invest in mortgage backed securities (“MBS”) and rely on the exemptionexclusion from registration under Section 3(c)(5)(C) of the 1940 Act (such as us) should continue to be allowed to rely on such exemptionexclusion from registration. If we fail to continue to qualify for this exemptionexclusion from registration as an investment company, or the SEC determines that companies that invest in MBS are no longer able to rely on this exemption,exclusion, our ability to use leverage would be substantially reduced and we would be unable to conduct our business as planned, or we may be required to register as an investment company under the 1940 Act, either of which could negatively affect the value of shares of our stock and our ability to make distributions to our stockholders.
Certain programs initiated by the U.S. Government, through the Federal Housing AdministrationFHFA and the Federal Deposit Insurance Corporation (“FDIC”), to provide homeowners with assistance in avoiding residential mortgage loan foreclosures are currently in effect. The programs may involve, among other things, the modification of mortgage loans to reduce the principal amount of the loans or the rate of interest payable on the loans, or to extend the payment terms of the loans. While the effect of these programs has not been as extensive as originally expected, the effect of such programs for holders of Agency Securities could be that such holders would experience changes in the anticipated yields of their Agency Securities due to (i) increased prepayment rates andand/or (ii) lower interest and principal payments.
In March 2009, the Home Affordable Modification Program (“HAMP”) was introduced to provide homeowners with assistance in avoiding residential mortgage loan foreclosures. HAMP is designed to help at risk homeowners, both those who are in default and those who are at imminent risk of default, by providing the borrower with affordable and sustainable monthly payments.
In October 2011, the FHFA announced changes to the Home Affordable Refinance Program (“HARP”) to expand access to refinancing for qualified individuals and families whose homes have lost value, including increasing the HARP loan to value ratio above 125%. However, this would only apply to mortgages guaranteed by the GSEs. There are many challenging issues to this proposal, notably the question as to whether a loan with a loan to value ratio of 125% qualifies as a mortgage or an unsecured consumer loan. The chances of this initiative’s success have created additional uncertainty in the Agency Securities market, particularly with respect to possible increases in prepayment rates.
On January 4, 2012, the Fed issued a white paper outlining additional ideas with regard to refinancings and loan modifications. It is likely that loan modifications would result in increased prepayments on some Agency Securities. These loan modification programs, as well as future legislative or regulatory actions, including amendments to the bankruptcy laws, that result in the modification of outstanding mortgage loans may adversely affect the value of, and the returns on, the Agency Securities in which we invest.
In an effort to continue to provide meaningful solutions to the housing crisis, effective June 1, 2012, the Obama administration expanded the population of homeowners that may be eligible for HAMP.
On July 21, 2010, President Obama signed the Dodd-Frank Act into law. The Dodd-Frank Act is extensive, complicated and comprehensive legislation that impacts practically all aspects of banking, and a significant overhaul of many aspects of the regulation of the financial services industry. Although many provisions remain subject to further rulemaking, the Dodd-Frank Act implements numerous and far-reaching changes that affect financial companies, including our company, and other banks and institutions which are important to our business model. Certain notable rules are, among other things:
Requiring regulation and oversight of large, systemically important financial institutions by establishing an interagency council on systemic risk and implementation of heightened prudential standards and regulation by the Board of Governors of the U.S. Federal Reserve for systemically important financial institutions (including nonbank financial companies), as well as the implementation of the FDIC resolution procedures for liquidation of large financial companies to avoid market disruption;
| · | Requiring regulation and oversight of large, systemically important financial institutions by establishing an interagency council on systemic risk and implementation of heightened prudential standards and regulation by the Board of Governors of the Fed for systemically important financial institutions (including nonbank financial companies), as well as the implementation of the FDIC resolution procedures for liquidation of large financial companies to avoid market disruption; |
| · | Applying the same leverage and risk-based capital requirements that apply to insured depository institutions to most bank holding companies, savings and loan holding companies and systemically important nonbank financial companies; |
| · | Limiting the Fed’s emergency authority to lend to nondepository institutions to facilities with broad-based eligibility, and authorizing the FDIC to establish an emergency financial stabilization fund for solvent depository institutions and their holding companies, subject to the approval of Congress, the Secretary of the U.S. Treasury and the Fed; |
| · | Creating regimes for regulation of over-the-counter derivatives and non-admitted property and casualty insurers and reinsurers; |
| · | Implementing regulation of hedge fund and private equity advisers by requiring such advisers to register with the SEC; |
| · | Providing for the implementation of corporate governance provisions for all public companies concerning proxy access and executive compensation; and |
| · | Reforming regulation of credit rating agencies. |
Applying the same leverage and risk-based capital requirements that apply to insured depository institutions to most bank holding companies, savings and loan holding companies and systemically important nonbank financial companies;
Limiting the U.S. Federal Reserve’s emergency authority to lend to nondepository institutions to facilities with broad-based eligibility, and authorizing the FDIC to establish an emergency financial stabilization fund for solvent depository institutions and their holding companies, subject to the approval of Congress, the Secretary of the U.S. Treasury and the U.S. Federal Reserve;
Creating regimes for regulation of over-the-counter derivatives and non-admitted property and casualty insurers and reinsurers;
Implementing regulation of hedge fund and private equity advisers by requiring such advisers to register with the SEC;
Providing for the implementation of corporate governance provisions for all public companies concerning proxy access and executive compensation; and
Reforming regulation of credit rating agencies.
Many of the provisions of the Dodd-Frank Act, including certain provisions described above are subject to further study, rulemaking, and the discretion of regulatory bodies. As the hundreds of regulations called for by the Dodd-Frank Act are promulgated, we will continue to evaluate the impact of any such regulations. It is unclear how this legislation may impact the borrowing environment, investing environment for Agency Securities and interest rate swap contracts as much of the bill’s implementation has not yet been defined by the regulators.
In addition, in 2010, the Group of Governors and Heads of Supervisors of the Basel Committee on Banking Supervision, the oversight body of the Basel Committee, published its “calibrated” capital standards for major banking institutions (“Basel III”). Under these standards, when fully phased in on January 1, 2019, banking institutions will be required to maintain heightened Tier 1 common equity, Tier 1 capital and total capital ratios, as well as maintaining a “capital conservation buffer.” Beginning with the Tier 1 common equity and Tier 1 capital ratio requirements, Basel III will be phased in incrementally between January 1, 2013 and January 1, 2019. The final package of Basel III reforms were approved by the G20 leaders in November 2010 and are subject to individual adoption by member nations, including the United States by January 1, 2013.U.S., which is continuing to evaluate comments on its specific implementation proposals. It is presently unclear howwhen the U.S. will complete its implementation of Basel III reforms and whether the adoption of Basel IIIthese reforms will affect our business at this time.
In September 2011, the White House announced work on a major initiative to allow certain homeowners who owe more on their mortgages than their homes are worth to refinance. In October 2011, the Federal Housing Finance Agency, (“FHFA”) announced changes to the Home Affordable Refinance Program, (“HARP”) to expand access to refinancing for qualified individuals and families whose homes have lost value, including increasing the HARP loan-to-value ratio above 125%. However, this would only apply to mortgages guaranteed by the GSEs. In addition, the expansion does not change the time period which these loans were originated, maintaining the requirement that the loans must have been guaranteed by Fannie Mae or Freddie Mac prior to June 2009. There are many challenging issues to this proposal, notably the question as to whether a loan with a loan-to-value ratio of 125% qualifies as a mortgage or an unsecured consumer loan. The chances of this initiative’s success have created additional uncertainty in the Agency Securities market, particularly with respect to possible increases in prepayment rates. We do not expect this announcement to have a significant impact on our results of operations.business.
On January 4,September 28, 2012 the FedUnited Kingdom Financial Services Authority (“FSA”) released a report titled “Thethe results of its review of the process for setting the London Interbank Offered Rate (“LIBOR”) interest rate for various currencies and maturities (“Wheatley Review”). Some of our derivative positions use various maturities of U.S. Housing Market: Current Conditionsdollar LIBOR. Our borrowings in the repurchase market have also historically tracked these LIBOR rates. The Wheatley Review found, among other things, that potential conflicts of interests coupled with insufficient oversight and Policy Considerations”accountability resulted in some reported LIBOR rates that did not reflect the true cost of inter-bank borrowings they were meant to Congress providing a framework for contemplating certain issues and tradeoffs that policy makers might consider. It is unclear how future legislation may impact the housing finance market and the investing environment for Agency Securities as the method of reform is undecided and has not yet been defined by the regulators.represent.
The Wheatley Review also proposes a number of remedial actions, including:
| · | New statutory authority for the FSA to supervise and regulate the LIBOR setting process. |
| · | Establishing a new independent oversight body to administer the LIBOR setting process. |
| · | Eliminating LIBOR rates for certain currencies and maturities where markets are not sufficiently deep and liquid. |
| · | Ceasing immediate reporting of rates submitted by individual participating banks. |
| · | Establishing controls to ensure that submitted rates represent actual transactions. |
There can be no assurance whether or when the Wheatley Review recommendations will be implemented in whole or in part. The company’s derivatives and repurchase borrowings are conducted in U.S. dollars for maturities with historically deep and liquid markets. However, there can be no assurance whether the implementation of any Wheatley Review recommendations would have a material impact on the future reported levels of LIBOR rates relevant to the company’s derivatives or repurchase borrowings.
Credit Market Disruption and Current Conditions
During the past few years, the residential housing and mortgage markets in the U.S. have experienced a variety of difficulties and changed economic conditions including loan defaults, credit losses and decreased liquidity. These conditions have resulted in volatility in the value of the Agency Securities we purchase and an increase in the average collateral requirements under our repurchase agreements.agreements we have obtained. While these markets have recovered a great deal,significantly, further increased volatility and deterioration in the broader residential mortgage and RMBS markets may adversely affect the performance and market value of the Agency Securities and other high quality RMBS.
Despite modest economic expansion during the first quarter of 2012, signs of decline remain evident in job growth, housing, and inflation. While the first quarter of 2012 U.S. economic performance reflected an upward trend in job growth and U.S. real gross domestic product, preliminary second quarter results reflect a slowing in the first quarter improvements, notably in job growth and the unemployment rate, which, in May, remained unchanged at 8.2% in March. Consumer price inflation also declined, reflecting decreases in crude oil and gasoline prices. Expectations of long-run inflation are projected to be subdued, at or below 2% due to a slightly increased unemployment rate as well as anchored long run inflation projections. Overall consensus by participating members of the Federal Open Market Committee (FOMC) suggests that the economy continues to grow modestly, however, not at the rate anticipated, confirming the need to reaffirm the target range for the federal funds rate at or near zero through 2014.
Interest Rates
The overall credit market deterioration since August 2007 has also affected prevailing interest rates. For example, interest rates have been unusually volatile since the third quarter of 2007. Since September 18, 2007, the Fed has lowered the target for the Federal Funds Rate nine times from 4.75% to 1.00% in October 2008. In December 2008, the Federal ReserveFed stated that it was adopting a policy of “quantitative easing” and would target keeping the Federal Funds Rate between 0.00% and 0.25%. To date, the Federal ReserveFed has maintained that target range. Our funding costs, which traditionally have tracked the 30-day London Interbank Offered Rate (“LIBOR”)LIBOR have generally benefited by this easing of monetary policy, although to a somewhat lesser extent. Because of continued uncertainty in the credit markets and U.S. economic conditions, we expect that interest rates are likely to experience continued volatility, which will likely affect our financial results since our cost of funds is largely dependent on short-term rates.
Historically, 30-day LIBOR has closely tracked movements in the Federal Funds Rate and the Effective Federal Funds Rate. The Effective Federal Funds Rate can differ from the Federal Funds Rate in that the Effective index represents the volume weighted average of interest rates at which depository institutions lend balances at the Federal ReserveFed to other depository institutions overnight (actual transactions, rather than target rate).
Our borrowings in the repurchase market have also historically closely tracked the Federal Funds Rate and LIBOR. Traditionally, a lower Federal Funds Rate has indicated a time of increased net interest margin and higher asset values. However, since July 2007 LIBOR and repurchase market rates have varied greatly and often have been significantly higher than the target and the Effective Federal Funds Rate. The difference between 30-day LIBOR and the Effective Federal Funds Rate has also been quite volatile, with the spread alternately returning to more normal levels and then widening out again. The continued volatility in these rates and divergence from the historical relationship among these rates could negatively impact our ability to manage our portfolio. If this were to occur, our net interest margin and the value of our portfolio might suffer as a result.
The following table shows 30-day LIBOR as compared to the Effective Federal Funds Rate for the quarterly periods presented.at March 31, 2013 and March 31, 2012.
| Quarter ended | | 30-Day LIBOR | | | Effective Federal Funds Rate | |
| June 30, 2012 | | | 0.25 | % | | | 0.09 | % |
| March 31, 2012 | | | 0.24 | | | | 0.09 | |
| December 31, 2011 | | | 0.30 | | | | 0.04 | |
| September 30, 2011 | | | 0.24 | | | | 0.06 | |
| June 30, 2011 | | | 0.19 | | | | 0.07 | |
| Quarter ended | | 30-Day LIBOR | | Effective Federal Funds Rate |
| March 31, 2013 | | 0.20 | % | | 0.09 | % |
| March 31, 2012 | | 0.24 | | | 0.09 | |
Results of Operations
As a result of our continued equity raising efforts, our earnings as reported in our condensed consolidated financial statements, particularly on a per share basis, may take time to reach a level in which we consider to be indicative of a full run-rate. Some period over period comparisons in the discussion below may not be meaningful and may be misleading.
Net Income summarySummary
Our primary source of income is the interest income we earn on our investment portfolio. Our net (loss) income for the quarter and six months ended June 30, 2012 (related)March 31, 2013 available to common stockholders was ($13.8)$99.8 million, and $51.5 million, respectively, or ($0.08) and $0.33$0.30 per basic and ($0.08) and $0.32$0.29 per diluted weighted average common share, respectively.share. These results compare to net (loss) income of ($7.3)$65.2 million and $1.3 million, respectively, (related) available to common stockholders or ($0.14) and $0.03$0.48 per basic and diluted weighted average common share for the quarter and six months ended June 30, 2011.March 31, 2012. The main driversfactors of the difference from the quarter ended 2012 to the quarter ended 2013 were the increased equity capital resources from 2011 throughand the six months ended June 30, 2012 and thecontinued implementation of our investment strategy, offset by unrealized losses from our derivatives and increased management fees.
As of June 30, 2012March 31, 2013 and December 31, 2011,2012, our Agency Securities portfolio was purchasedcarried at a net premium to par value with a weighted average amortized cost, of 104.77%104.78% and 104.23%105.24% respectively, due to the average interest rates on these securities being higher than prevailing market rates.
The following table presents the components of the yield earned on our Agency Security portfolio for the quarterly periods presented.quarters ended March 31, 2013 and March 31, 2012.
| Quarter Ended | | Asset Yield | | | Cost of Funds | | | Net Interest Margin | | | Interest Expense on Repurchase Agreements | |
| June 30, 2012 | | | 2.97 | % | | | 0.82 | % | | | 2.15 | % | | | 0.39 | % |
| March 31, 2012 | | | 3.04 | | | | 0.81 | | | | 2.23 | | | | 0.34 | |
| December 31, 2011 | | | 2.60 | | | | 0.98 | | | | 1.62 | | | | 0.35 | |
| September 30, 2011 | | | 3.11 | | | | 0.93 | | | | 2.18 | | | | 0.27 | |
| June 30, 2011 | | | 3.35 | | | | 0.99 | | | | 2.36 | | | | 0.28 | |
| Quarter Ended | | Asset Yield | | | Cost of Funds | | | Net Interest Margin | | | Interest Expense on Repurchase Agreements | |
| March 31, 2013 | | | 2.33 | % | | | 0.98 | % | | | 1.35 | % | | | 0.46 | % |
| March 31, 2012 | | | 3.04 | | | | 0.81 | | | | 2.23 | | | | 0.34 | |
The yield on our assets is most significantly affected by the rate of repayments on our Agency Securities. Our rate of portfolio repayment for the quarter ended June 30, 2012,March 31, 2013, was 9.1%15.7% on a Constant Prepayment Basisconstant prepayment basis compared to 9.3%11.4% for the quarter ended June 30, 2011.March 31, 2012.
Our repurchase agreements are secured by our Agency Securities and bear interest at rates that have historically moved in close relationship to the Federal Funds Rate and LIBOR. The Federal Funds Rate was 0.09% and LIBOR was 0.25%0.20% at June 30, 2012.March 31, 2013. During the quarterquarters ended March 31, 2013 and six months ended June 30,March 31, 2012, we realized losses of $12.4$29.1 million, and $22.1 million, respectively, related to our derivatives. During the quarter and six months ended June 30, 2011 we realized losses of $6.1 million and $8.0$9.7 million, respectively related to our derivatives. We increased our total interest rate swap contracts aggregate notional balance from $2.8$8.7 billion at December 31, 20112012 to $6.0$12.3 billion at June 30, 2012, with,March 31, 2013. Our interest rate swap contracts had a weighted average swap rate of 1.1%1.4% and a weighted average term of 51 months.75 months at March 31, 2013. During the quarter ended June 30, 2012March 31, 2013, we entered intoincreased our total interest rate swaptions with an aggregate notional balance of $0.8from $1.1 billion withat December 31, 2012 to $1.6 billion at March 31, 2013. Our swaptions had an underlying weighted average swap rate of 1.9%2.1% and a weighted average term of 10 months. We had not entered into any interest rate swaptions as of December4 months at March 31, 2011. We decreased our2013. Our total Eurodollar FutureFutures Contracts (“Futures Contracts”) notional amount decreased from $131.0$102.0 million at December 31, 20112012 to $121.0$99.0 million at June 30, 2012, withMarch 31, 2013 due to the maturity of contracts. Our Futures Contracts had a weighted average swap equivalent rate of 1.8%1.9% and weighted average term of 2318 months as of June 30, 2012.March 31, 2013.
Net Interest Income
Our net interest income for the quarter and six months ended June 30, 2012March 31, 2013 was $75.1$105.2 million and $130.9 million, respectively compared to $26.8$55.8 million and $38.9 million, respectively for the quarter and six months ended June 30, 2011.March 31, 2012. The continued growth of our net interest income from year to year is due to the completion of equity raises in the six months ended June 30, 2012.raises. The proceeds from these equity raises were invested in Agency Securities, creating a larger investment portfolio able to generate increasing levels of interest income. As of June 30, 2012March 31, 2013 and December 31, 2011,2012, our portfolio of Agency Securities consisted of $13.3$24.3 billion and $5.4$19.1 billion of securities, respectively.
Gains and Losses on Sale of Agency Securities
During the quarter ended June 30, 2012 we did not sell any Agency Securities. However, we realized a loss on sale of Agency Securities of $1.3 million. $1.1 million of this amount is due to the bankruptcy of a counterparty to a repurchase agreement and the remaining $0.2 million is a reduction of the first quarter realized gains due to factor updates. In addition, due to the bankruptcy we also recorded $1.0 million of other income resulting from the non-performance of the counterparty on the related repurchase agreement. During the six months ended June 30, 2012March 31, 2013, we sold $0.2$2.3 billion of Agency Securities resulting in a realized gain of $5.0$18.5 million. We did not sell anyThese results compare to $0.2 billion of Agency Securities duringsold resulting in a realized gain of $6.3 million for the quarter and six months ended June 30, 2011.March 31, 2012.
Operating Expenses
Our total operating expenses for the quarter and six months ended June 30, 2012,March 31, 2013 were $5.7$8.6 million and $10.5 million, respectively as compared to $2.1$4.8 million and $3.5 million, respectively for the quarter and six months ended June 30, 2011.March 31, 2012. The increase in operating expenses from 2011year to 2012year is primarily due to two factors. The first factor beingis due to increased management fees. AsOur total management fee expense for the quarter ended March 31, 2013, was $6.6 million as compared to $3.5 million for the quarter ended March 31, 2012. Management fees are determined based on gross equity raised. Therefore as we continue to successfully raise capital our management fee continues to increaseincrease. However, because it is linked directlythe management fee rate decreased to 0.75% per annum for gross equity raises.raised in excess of $1 billion pursuant to the 2012 management agreement; the effective average management fee rate will continue to decline. The second factor is an increase in professional fees and operating costs to support our current portfolio.
Taxable Income
We intend to qualify and have negative retained earnings (titled “Accumulated deficit” inelected to be taxed as a REIT under the stockholders’ equity sectionCode. We will generally not be subject to federal income tax to the extent that we distribute our taxable income to our stockholders and as long as we satisfy the ongoing REIT requirements under the Code including meeting certain asset, income and stock ownership tests.
The following table reconciles our GAAP net income to estimated REIT taxable income for the quarters ended March 31, 2013 and March 31, 2012.
| | | For the Quarters Ended | |
| | | March 31, 2013 | | | March 31, 2012 | |
| | | (in millions) | |
| GAAP Net income | | $ | 102.3 | | | $ | 65.2 | |
| Book to tax differences: | | | | | | | | |
| Unrealized gain on derivatives | | | (16.3 | ) | | | (17.6 | ) |
| Estimated taxable income | | $ | 86.0 | | | $ | 47.6 | |
The aggregate tax basis of our accompanying condensed consolidated balance sheets) asassets and liabilities is greater than our total Stockholders’ Equity at March 31, 2013 by approximately $120.6 million, or approximately $0.32 per share (based on the 374,053,198 shares then outstanding).
We are required and intend to timely distribute substantially all of June 30, 2012, due to the consequences of our tax qualification as a REIT. Our dividends are based on our REIT taxable income as determined for federal income tax purposes and notin order to maintain our net income computed in accordance with GAAP as reported in our condensed consolidated financial statements. Accordingly, we may be required to pay out more in dividends than we have calculated in distributable earnings on a GAAP basis.
REIT status. For the quarter ended March 31, 2013, we paid dividends of $0.08 per outstanding share of common stock and six months$0.17 per outstanding share of Series A Preferred stock for each month of the quarter. In addition we paid dividends of $0.25 per outstanding share of Series B Preferred stock for the month of March, resulting in total payments stockholders of $82.3 million. Our estimated REIT taxable income available to pay dividends was $86.0 million for the quarter ended June 30, 2012March 31, 2013. At March 31, 2013, our under distributed estimated REIT taxable income was approximately $56.8 million and $104.4 million, respectively. The most significant difference between GAAP and$3.7 million.
Our management is responsible for determining whether tax income was the unrealized losspositions taken by us are more likely than not to be sustained on derivatives which is reflected in GAAP earnings but does not decrease REIT taxable income.their merits. We have no material unrecognized tax benefits or material uncertain tax positions.
Financial Condition
Agency Securities
We typically purchase Agency Securities at premium prices. The premium price paid over par value on those assets is expensed as the underlying mortgages experience repayment or prepayment. The lower the constant prepayment rate, the lower the amount of amortization expense for a particular period. Accordingly, the yield on an asset and earnings, are higher. If prepayment rates increase, the amount of amortization expense for a particular period will go up. These increased prepayment rates would act to decrease the yield on an asset and would decrease earnings.
The tables below summarize certain characteristics of our Agency Securities for the periods presentedas of March 31, 2013 and December 31, 2012 (dollars in thousands).
Agency Securities:
| Quarter ended | | Principal Amount | | | Net Unamortized Premium | | | Amortized Cost | | | Amortized Cost divided by Principal | | | Fair Value | | | Fair Value divided by Principal | |
| June 30. 2012 | | $ | 12,561,600 | | | $ | 599,264 | | | $ | 13,160,864 | | | | 104.77 | % | | $ | 13,328,514 | | | | 106.11 | % |
| March 31, 2012 | | | 11,550,912 | | | | 532,588 | | | | 12,083,500 | | | | 104.61 | | | | 12,137,554 | | | | 105.08 | |
| December 31, 2011 | | | 5,128,230 | | | | 216,697 | | | | 5,344,927 | | | | 104.23 | | | | 5,393,675 | | | | 105.18 | |
| September 30, 2011 | | | 5,675,822 | | | | 236,695 | | | | 5,912,517 | | | | 105.29 | | | | 5,975,823 | | | | 105.29 | |
| June 30, 2011 | | | 5,028,223 | | | | 197,865 | | | | 5,226,088 | | | | 103.94 | | | | 5,258,400 | | | | 104.58 | |
| As of | | Principal Amount | | | Net Unamortized Premium | | | Amortized Cost | | | Amortized Cost divided by Principal | | | Fair Value | | | Fair Value divided by Principal | |
| March 31, 2013 | | $ | 23,197,808 | | | $ | 1,109,366 | | | $ | 24,307,174 | | | | 104.78 | % | | $ | 24,339,169 | | | | 104.92 | % |
| December 31, 2012 | | | 17,925,998 | | | | 940,000 | | | | 18,865,998 | | | | 105.24 | | | | 19,096,562 | | | | 106.53 | |
Adjustable and Hybrid Adjustable Rate Agency Securities:
| Quarter ended | | Principal Amount | | | Weighted Average Coupon | | | Weighted Average Months to Reset | | | Percentage of Total Agency Securities | |
| June 30, 2012 | | $ | 2,685,281 | | | $ | 3.71 | | | $ | 75 | | | | 21.4 | % |
| March 31, 2012 | | | 2,514,725 | | | | 3.72 | | | | 73 | | | | 21.8 | |
| December 31, 2011 | | | 2,681,911 | | | | 3.72 | | | | 76 | | | | 52.2 | |
| September 30, 2011 | | | 2,858,964 | | | | 3.71 | | | | 75 | | | | 50.2 | |
| June 30, 2011 | | | 2,671,472 | | | | 3.65 | | | | 62 | | | | 53.0 | |
| As of | | Principal Amount | | | Weighted Average Coupon | | | Weighted Average Months to Reset | | | Percentage of Total Agency Securities | |
| March 31, 2013 | | $ | 1,812,296 | | | | 3.68 | % | | $ | 62 | | | | 7.8 | % |
| December 31, 2012 | | | 2,037,778 | | | | 3.69 | | | | 66 | | | | 11.4 | |
Fixed Rate Agency Securities:
| Quarter ended | | Principal Amount | | | Weighted Average Coupon | | | Weighted Average Months to Maturity | | | Percentage of Total Agency Securities | |
| June 30, 2012 | | $ | 9,876,319 | | | $ | 3.62 | | | | 217 | | | | 78.6 | % |
| March 31, 2012 | | | 9,036,187 | | | | 3.64 | | | | 219 | | | | 78.2 | |
| December 31, 2011 | | | 2,446,319 | | | | 3.97 | | | | 188 | | | | 47.8 | |
| September 30, 2011 | | | 2,816,858 | | | | 4.00 | | | | 172 | | | | 49.8 | |
| June 30, 2011 | | | 2,356,751 | | | | 4.11 | | | | 174 | | | | 47.0 | |
| As of | | Principal Amount | | | Weighted Average Coupon | | | Weighted Average Months to Maturity | | | Percentage of Total Agency Securities | |
| March 31, 2013 | | $ | 21,385,512 | | | | 3.35 | % | | | 309 | | | | 92.2 | % |
| December 31, 2012 | | | 15,888,220 | | | | 3.52 | | | | 276 | | | | 88.6 | |
The following table shows the average principal repayment rate for those securities which have settled for the quarterly periods presented.
| Quarter ended | | Average Quarterly Principal Repayment Rate | |
June 30, 2012March 31, 2013 | | | 9.115.7 | % |
| March 31, 2012 | | | 11.4 | |
December 31, 2011 | | | 19.3 | |
September 30, 2011 | | | 12.4 | |
June 30, 2011 | | | 9.3 | |
As of June 30, 2012,March 31, 2013, our Agency Security portfolio consisted of approximately $13.3$24.3 billion in market value of Agency Securities with initial fixed-interest rate periods of three, five, seven, ten, fifteen, twenty, twenty five and twentythirty years.
Our net income is primarily a function of the difference between the yield on our assets and the financing cost of owning those assets. Since we tend to purchase assetsAgency Securities at a premium to par, the main item that can affect the yield on our assetsAgency Securities after they are purchased is the rate at which the mortgage borrowers repay the loan. While the scheduled repayments, which are the principal portion of the homeowners’ regular monthly payments, are fairly predictable, the unscheduled repayments, which are generally refinancing of the mortgage but can also result from repurchases of delinquent, defaulted, or modified loans, are less so. Being able to accurately estimate and manage these repayment rates is a critical portion of the management of our portfolio, not only for estimating current yield but also for considering the rate of reinvestment of those proceeds into new securities, the yields which those new securities may add to our portfolio and our hedging strategy. We expect that prepayment rates will be elevated due to repurchases of loans that reach 120 day or more delinquency by Freddie Mac and Fannie Mae on a continuing basis.
As of June 30, 2012March 31, 2013 and December 31, 2011,2012, the adjustable and hybrid adjustable rate mortgage loans underlying our Agency Securities have fixed-interest rates for an average period of approximately 7562 months and 7666 months, respectively, after which time the interest rates reset and become adjustable. After a reset date, interest rates on our adjustable and hybrid adjustable Agency Securities float based on spreads over various indices, typically LIBOR or the one-year Constant Maturity Treasury rate. These interest rates are subject to caps that limit the amount the applicable interest rate can increase during any year, known as an annual cap and through the maturity of the security, known as a lifetime cap.
Liabilities
We have entered into repurchase agreements to finance most of our Agency Securities. Our repurchase agreements are secured by our Agency Securities and bear interest at rates that have historically moved in close relationship to the Federal Funds Rate and LIBOR. We have established borrowing relationships with several investment banking firms and other lenders, 2628 of which we had done repurchase trades with as of June 30, 2012March 31, 2013 and 2326 of which we had done repurchases trades with as of December 31, 2011.2012. We had outstanding balances under our repurchase agreements as of June 30, 2012March 31, 2013 and December 31, 20112012 of $12.1$24.8 billion and $5.3$18.4 billion, respectively.
Derivative Instruments
We generally intend to hedge as much of our interest rate risk as our managerARRM deems prudent in light of market conditions and the associated costs. We generally pay a fixed rate and receive a floating rate with the objective of fixing a portion of our borrowing costs and hedging the change in our book value to some degree. The floating rate we receive is generally the Federal Funds Rate or LIBOR. While our policies do not contain specific requirements as to the percentages or amount of interest rate risk that we are required to hedge, we maintain an overall target of hedging at least 40% of our non-adjustable rate mortgages (“ARMs”).mortgages. For interest rate risk mitigation purposes, we consider Agency Securities to be ARMsadjustable rate mortgages (“ARMs”) if their interest rate is either currently subject to adjustment according to prevailing rates or if they are within 18 months of the period where such adjustments will occur. No assurance can be given that our derivatives will have the desired beneficial impact on our results of operations or financial condition. We have not elected cash flow hedge accounting treatment as allowed by GAAP. Since we do not designate our derivative activities as cash flow hedges, realized as well as unrealized gains/losses from these transactions will impact our earnings.
Use of derivative instruments may fail to protect or could adversely affect us because, among other things:
| · | available derivatives may not correspond directly with the interest rate risk for which protection is sought; |
| · | the duration of the derivatives may not match the duration of the related liability; |
| · | the party owing money on the derivatives may default on its obligation to pay; |
| · | the credit-quality of the party owing money on the derivatives may be downgraded to such an extent that it impairs our ability to sell or assign our side of the hedging transaction; and |
| · | the value of derivatives may be adjusted from time to time in accordance with GAAP to reflect changes in fair value; downward adjustments, or “mark-to-market losses,” would reduce our net income or increase any net loss. |
As of June 30, 2012March 31, 2013 and December 31, 2011,2012, we had interest rate swap contracts with an aggregate notional balance of $6.0$12.3 billion and $2.8$8.7 billion, respectively. As of June 30,March 31, 2013 and December 31, 2012, we had entered into interest rate swaptions with an aggregate notional balance of $0.8 billion. We had not entered into any interest rate swaptions as of December 31, 2011.$1.6 billion and $1.1 billion, respectively. In addition, as of June 30, 2012March 31, 2013 and December 31, 2011,2012, we had purchased or sold Futures Contracts with an aggregate notional balance of $121.0$99.0 million and $131.0$102.0 million, respectively, traded in 771 and 1,033 individual contracts, respectively. Futures Contracts are traded on the Chicago Mercantile Exchange (“CME”). Counterparty risk of interest rate swap contracts, interest rate swaptions and Futures Contracts are limited to some degree because of daily mark-to-market and collateral requirements. In addition, substantial credit support for the Futures Contracts is provided by the CME. These derivative transactions are designed to lock in some funding costs for financing activities associated with our assets in such a way as to help assure the realization of attractive net interest margins and to vary inversely in value with our Agency Securities. Such contracts are based on assumptions about prepayments which, if not realized, will cause results to differ from expectations.
Although we attempt to structure our derivatives to offset the changes in asset prices, they are not perfectly correlated and depend on the corresponding durations and sections of the yield curve that moves to offset each other. For the six monthsquarters ended June 30,March 31, 2013 and March 31, 2012 the change in the fair valuewe recognized losses of our derivative positions decreased by $25.2$12.8 million and gains of $7.9 million, respectively, related to our derivatives. For the quarters ended March 31, 2013 and March 31, 2012, the unrealized change in the fair value of our Agency Securities (decreased) increased by $124.0 million. For($180.1) million and $11.6 million, respectively.
As required by the six months endedDodd-Frank Act, the Commodity Futures Trading Commission has adopted rules requiring certain interest rate swap contracts to be cleared through a derivatives clearing organization. We may be required to begin clearing certain new interest rate swap contracts as early as June 30, 2011,2013. There can be no assurances what effects, if any, these interest rate swap clearing requirements will have on the unrealized changeavailability, pricing, liquidity or margin requirements associated with cleared or un-cleared interest rate swap contracts that we might enter into in the fair value of our derivative positions decreased by $33.5 million and the unrealized change in the fair value of our Agency Securities increased by $36.5 million.future.
Liquidity and Capital Resources
ForDuring the six monthsquarter ended June 30, 2012March 31, 2013, we issued 92,705,32865,010,110 shares of common stock and raised additional net common equity of approximately $627.8$438.5 million. ForDuring the six monthsquarter ended June 30, 2012March 31, 2013, we issued 1,400,000174,961 shares of 8.250% of Series A Cumulative Redeemable Preferred Stock (“Series A Preferred Stock”) and raisedissued 5,650,000 shares of 7.875% Series B Cumulative Preferred Stock (“Series B Preferred Stock”) for a combined net preferred equity of approximately $33.8$141.0 million. These changesAs a result, we were materialable to our companyacquire additional assets, arrange additional repurchase agreement funding and significantly affect the results we report. We believe that the timing for additional investment, in both assets and liabilities, was appropriate and beneficial to our long-term performance. In addition, our effective percentage management fee is reduced and there are furtherincrease economies of scale that also are reached as our managedscale. At times, we purchased assets grow. As we invest the proceeds of our offerings, we are methodical, at times purchasing our assets withfor forward settlementssettlement up to 90 days in the future in order to minimize purchase price.prices. Our management fee expense also increased in absolute terms under the provisions of our management agreement. However, pursuant to the 2012 Management Agreement, the average effective management fee rate declined because the management fee rate stepped down as the amounts of equity raised exceeded $1.0 billion.
Our primary sources of funds are borrowings under repurchase arrangements, monthly principal and interest payments on our investments and cash generated from our operating results. Other sources of funds may include proceeds from equity and debt offerings and asset sales. We generally maintain liquidity to pay down borrowings under repurchase arrangements to reduce borrowing costs and otherwise efficiently manage our long-term investment capital. Because the level of our borrowings can be adjusted on a daily basis, the level of cash and cash equivalents carried on our balance sheet is significantly less important than our potential liquidity available under our borrowing arrangements. We currently believe that we have sufficient liquidity and capital resources available for the acquisition of additional investments, repayments on borrowings and the payment of cash dividends as required for continued qualification as a REIT.
Our primary uses of cash are to purchase Agency Securities, pay interest and principal on our borrowings, fund our operations and pay dividends. During the six monthsquarter ended June 30, 2012,March 31, 2013, we purchased $8.7$8.9 billion current face amount of Agency Securities using proceeds from equity raises, repurchase agreements and principal repayments. During the six monthsquarter ended June 30, 2012,March 31, 2013, we received cash of $0.8$1.2 billion from prepayments and scheduled principal payments on our Agency Securities. We received net proceeds of $661.6$438.5 million from common equity issuances, including our dividend reinvestment and stock purchase plan (“DRIP”) and $33.8$4.4 million of proceeds from the issuance of 1,400,000174,961 shares of Series A Preferred Stock and $136.6 million of proceeds from the issuance of 5,650,000 shares of Series B Preferred Stock during the six monthsquarter ended June 30, 2012.March 31, 2013. We had a net cash increase from our repurchase agreements of $6.8$6.5 billion for the six monthsquarter ended June 30, 2012March 31, 2013 and made cash interest payments of approximately $46.0$55.3 million on our liabilities for the six monthsquarter ended June 30, 2012.March 31, 2013. Part of funding our operations includes providing margin cash to offset liability balances on our derivatives. This required an additional $45.9We recovered $35.1 million of cash to be maintained in a restricted accountcollateral posted with counterparties and increased our counterpartiesliability by $10.2 million for the six months ended June 30, 2012.cash collateral held as of March 31, 2013.
In response to the growth of our Agency Securities portfolio and to the relatively weak financing market, we have continued to pursue additional lending counterparties in order to help increase our financial flexibility and ability to withstand periods of contracting liquidity in the credit markets. As of June 30, 2012 we have Master Repurchase Agreements (“MRAs”), which are uncommitted repurchase facilities, with 31 lending counterparties to finance our portfolio, subject to certain conditions and have borrowings outstanding with 26 of these counterparties.
Repurchase Facilities
The following table represents the contractual repricing regarding our repurchase agreements to finance Agency Security purchases as of March 31, 2013 and December 31, 2012.
| | | March 31, 2013 | | | December 31, 2012 | |
| | | (in thousands) | |
| Within 30 days | | $ | 11,626,612 | | | $ | 7,771,444 | |
| 31 days to 60 days | | | 11,540,240 | | | | 7,840,268 | |
| 61 days to 90 days | | | 562,762 | | | | 2,699,706 | |
| Greater than 90 days | | | 1,099,000 | | | | 54,677 | |
| Total | | $ | 24,828,614 | | | $ | 18,366,095 | |
The following table represents the Master Repurchase Agreements (“MRAs”) and other information regarding our repurchase agreements to finance Agency Security purchases as of June 30, 2012March 31, 2013 and December 31, 2011.2012.
| | | | | June 30, 2012 | | | December 31, 2011 | |
| | | | | (dollars in thousands) | |
| Within 30 days | | $ | 7,823,536 | | | $ | 4,068,197 | |
| 31 days | to | 60 days | | | 2,038,459 | | | | 1,111,480 | |
| 61 days | to | 90 days | | | 1,707,767 | | | | 156,285 | |
| Greater than 90 days | | | 542,824 | | | | - | |
| Total | | $ | 12,112,586 | | | $ | 5,335,962 | |
| | | March 31, 2013 | | | December 31, 2012 | |
| Number of MRA’s | | | 33 | | | | 33 | |
| Number of counterparties with repurchase agreements outstanding | | | 28 | | | | 26 | |
| Weighted average maturity in days | | | 36 | | | | 34 | |
| Weighted average contractual rate | | | 0.43 | % | | | 0.49 | % |
Haircut for repurchase agreements (1) | | | 4.8 | % | | | 4.8 | % |
As of June 30, 2012 and December 31, 2011,(1) The Haircut represents the weighted average margin requirement, or the percentage amount by which the collateral value must exceed the loan amount which we also refer to as the haircut, under all our repurchase agreements was approximately 4.8% and 5.0%, respectively. .
Declines in the value of our Agency Securities portfolio can trigger margin calls by our lenders under our repurchase agreements. An event of default or termination event under the standard MRA would give our counterparty the option to terminate all repurchase transactions existing with us and require any amount due to be payable immediately.
The residential mortgage market in the U.S. experienced difficult economic conditions over the last several years including:
| · | increased volatility of many financial assets, including Agency Securities and other high-quality RMBS assets; |
| · | increased volatility and deterioration in the broader residential mortgage and RMBS markets; and |
| · | significant disruption in financing of RMBS. |
While conditions have improved, should there be a reoccurrence of difficulties in the residential mortgage market, our lenders may be forced to exit the repurchase market, become insolvent or further tighten lending standards or increase the amount of required equity capital or haircut, any of which could make it more difficult or costly for us to obtain financing.
Financial sector volatility can also lead to increased demand and prices for high quality debt securities, including Agency Securities. While increased prices may increase the value of our Agency Securities, higher values may also reduce the return on reinvestment of capital, thereby lowering our future profitability.
The following graph represents the month-end outstanding balances of our repurchase agreements, which finance most of our Agency Securities. Over time, the level of our repurchase agreement financing has grown in conjunction with the growth in our portfolio of Agency Securities, which in turn has been the result of successful equity capital raising efforts. The balance of repurchase agreements outstanding will fluctuate within any given month based on changes in the market value of the particular Agency Security pledged as collateral (including the effects of principal paydowns) and the level and timing of investment and reinvestment activity.
Effects of Margin Requirements, Leverage and Credit Spreads
Our Agency Securities have values that fluctuate according to market conditions and, as discussed above, the market value of our Agency Securities will decrease as prevailing interest rates or credit spreads increase. When the value of the securities pledged to secure a repurchase loan decreases to the point where the positive difference between the collateral value and the loan amount is less than the haircut, our lenders may issue a margin call, which means that the lender will require us to pay the margin call in cash or pledge additional collateral to meet that margin call. Under our repurchase facilities, our lenders have full discretion to determine the value of the Agency Securities we pledge to them. Most of our lenders will value securities based on recent trades in the market. Lenders also issue margin calls as the published current principal balance factors change on the pool of mortgages underlying the securities pledged as collateral when scheduled and unscheduled principal repayments are announced monthly.
We experience margin calls in the ordinary course of our business and under certain conditions, such as during a period of declining market value for Agency Securities and we may experience margin calls monthly or more frequently. In seeking to effectively manage the margin requirements established by our lenders, we maintain a position of cash and unpledged securities. We refer to this position as our liquidity. The level of liquidity we have available to meet margin calls is directly affected by our leverage levels, our haircuts and the price changes on our securities. If interest rates increase as a result of a yield curve shift or for another reason or if credit spreads widen, the prices of our collateral (and our unpledged assets that constitute our liquidity) will decline and we may experience margin calls. We will use our liquidity to meet such margin calls. There can be no assurance that we will maintain sufficient levels of liquidity to meet any margin calls. If our haircuts increase, our liquidity will proportionately decrease. If we increase our borrowings, our liquidity will decrease by the amount of additional haircut on the increased level of indebtedness. In addition, certain of our MRAs contain a restriction that prohibits our leverage from exceeding twelve times our stockholders’ equity as well as termination events in the case of significant reductions in equity capital.
We intend to maintain a level of liquidity in relation to our assets that enables us to meet reasonably anticipated margin calls but that also allows us to be substantially invested in Agency Securities. We may misjudge the appropriate amount of our liquidity by maintaining excessive liquidity, which would lower our investment returns, or by maintaining insufficient liquidity, which would force us to liquidate assets into unfavorable market conditions and harm our results of operations and financial condition.
We generally seek to borrow (on a recourse basis) between six and ten times the amount of our total stockholders’ equity, although we are not limited to that range.equity. At June 30, 2012March 31, 2013 and December 31, 2011,2012, our total borrowings were approximately $12.1$24.8 billion and $5.3$18.4 billion (excluding accrued interest), respectively, which represented a leverage ratio of approximately 8.92:9.17:1 and 8.52:7.96:1, respectively.
Forward-Looking Statements Regarding Liquidity
Based on our current portfolio, leverage rate and available borrowing arrangements, we believe that our equity, combined with cash flow from operations and available borrowing capacity, will be sufficient to enable us to meet anticipated short-term (one year or less) liquidity requirements such as to fund our investment activities, pay fees under our Second Amended and Restatedthe 2012 Management Agreement, fund our distributions to stockholders and pay general corporate expenses.
We may increase our capital resources by obtaining long-term credit facilities or making public or private offerings of equity or debt securities, including classes of preferred stock, common stock and senior or subordinated notes to meet our long-term (greater than one year) liquidity. Such financing will depend on market conditions for capital raises and for the investment of any proceeds.
Stockholder’s Equity
Dividends
The following table presentstables present our common stock dividend transactions for the six monthsquarter ended June 30, 2012.March 31, 2013.
| Record Date | | Payment Date | | Rate per common share | | Aggregate amount paid to holders of record (in millions) | |
| January 15, 2012 | | January 30, 2012 | | $ | 0.11* | | $ | 11.6 | |
| February 15, 2012 | | February 28, 2012 | | | 0.11 | | | 15.3 | |
| March 15, 2012 | | March 29, 2012 | | | 0.11 | | | 19.9 | |
| April 15, 2012 | | April 27, 2012 | | | 0.10 | | | 17.8 | |
| May 15, 2012 | | May 30, 2012 | | | 0.10 | | | 18.1 | |
| June 15, 2012 | | June 28, 2012 | | | 0.10 | | | 18.6 | |
| Record Date | | Payment Date | | Rate per common share | | | Aggregate amount paid to holders of record (in millions) | |
| January 15, 2013 | | January 30, 2013 | | $ | 0.08 | | | $ | 24.8 | |
| February 15, 2013 | | February 27, 2013 | | | 0.08 | | | | 24.8 | |
| March 15, 2013 | | March 27, 2013 | | | 0.08 | | | | 30.2 | |
* this amount included $0.006 per common share of taxable income related to the year ended December 31, 2011.
Dividends were not paid on outstanding shares ofThe following table presents our Series A Preferred Stock dividend transactions for the six monthsquarter ended June 30, 2012. . On July 27, 2012, a cash dividend of $0.2865 per outstanding share ofMarch 31, 2013.
| Record Date | | Payment Date | | Rate per Series A Preferred Share | | | Aggregate amount paid to holders of record (in millions) | |
| January 15, 2013 | | January 28, 2013 | | $ | 0.17 | | | $ | 0.3 | |
| February 15, 2013 | | February 26, 2013 | | | 0.17 | | | | 0.4 | |
| March 15, 2013 | | March 26, 2013 | | | 0.17 | | | | 0.4 | |
The following table presents our Series AB Preferred Stock or $0.4 million in the aggregate, was paid to holders of record on July 13, 2012dividend transactions for the period of June 7, 2012 through July 30, 2012. Our condensed consolidated financial statements reflect an accrual of $0.2 million for the June amount payable.quarter ended March 31, 2013.
| Record Date | | Payment Date | | Rate per Series B Preferred Share | | | Aggregate amount paid to holders of record (in millions) | |
| March 15, 2013 | | March 27, 2013 | | $ | 0.25 | | | $ | 1.4 | |
Equity Capital Raising Activities
The following table presents our equity transactions for the six monthsquarter ended June 30, 2012.March 31, 2013.
| Transaction Type | | Completion Date | | Number of Shares (1) | | | Per Share price | | Net Proceeds (in millions) | |
| Follow-on public offering | | January 13, 2012 | | | 10,350,000 | | | $ | 6.80 | | $ | 70.1 | |
| Follow-on public offering | | February 8, 2012 | | | 29,900,000 | | | | 6.80 | | | 203.0 | |
| Equity distribution agreement | | February 29, 2012 | | | 1,287,570 | | | | 7.06 | | | 8.9 | |
| Follow-on public offering | | March 8, 2012 | | | 35,650,000 | | | | 6.72 | | | 239.2 | |
| Issuance of Series A Preferred Stock | | June 7, 2012 | | | 1,400,000 | | | | 25.00 | | | 33.8 | |
| Equity distribution agreement | | January 1, 2012 to June 30, 2012 | | | 15,500,000 | | | | 7.02(2) | | | 106.5 | |
| DRIP share issuance | | January 1, 2012 to June 30, 2012 | | | 17,758 | | | | 6.95(2) | | | 0.1 | |
| Transaction Type | | Completion Date | | Number of Shares | | Per Share price | | | Net Proceeds (in millions) |
| Series A Preferred equity distribution agreements | | January 2, 2013 through January 30, 2013 | | 174,961 | | $ | 25.51 | (1) | | $ | 4.4 |
| DRIP | | January 25, 2013 through March 27, 2013 | | 10,110 | | | 6.64 | (1) | | | 0.1 |
| Series B Preferred initial offering | | February 12, 2013 | | 5,650,000 | | | 25.00 | | | | 136.6 |
| Common stock follow-on public offering | | February 20, 2013 | | 65,000,000 | | | 6.75 | | | | 438.4 |
| (1) | Weighted average price |
(1) Inclusive of over allotment option(2) This amount is a weighted average price37
Off-Balance Sheet Arrangements
As of June 30, 2012March 31, 2013 and December 31, 2011,2012, we did not maintain any relationships with unconsolidated entities or financial partnerships, such as entities often referred to as structured finance, or special purpose or variable interest entities, established for the purpose of facilitating off-balance sheet arrangements or other contractually narrow or limited purposes. Further, as of June 30, 2012March 31, 2013 and December 31, 2011,2012, we had not guaranteed any obligations of any unconsolidated entities or entered into any commitment or intent to provide funding to any such entities.
Critical Accounting Policies
AOur financial statements are prepared in conformity with GAAP. In preparing the financial statements, management is required to make various judgments, estimates and assumptions that affect the reported amounts. Changes in these estimates and assumptions could have a material effect on our financial statements. The following is a summary of our critical accounting policies most affected by management’s judgments, estimates and assumptions.
Revenue Recognition: Interest income is earned and recognized based on the unpaid principal amount of the Agency Securities and their contractual terms. Premiums and discounts associated with the purchase of Agency Securities are amortized or accreted into interest income over the actual lives of the securities.
Fair Value of Agency Securities: We invest in Agency Securities representing interests in or obligations backed by pools of single-family fixed rate, hybrid adjustable rate and adjustable rate mortgage loans. The authoritative literature requires us to classify our investments as either trading, available for sale or held to maturity securities. Management determines the appropriate classifications of the securities at the time they are acquired and evaluates the appropriateness of such classifications at each balance sheet date. We currently classify all of our securities as available for sale. All assets that are classified as available for sale are carried at fair value and unrealized gains and losses are included in Item 7other comprehensive income or loss as a component of stockholders’ equity. We utilize a third party pricing service to value our Annual Reportportfolio. The pricing service incorporates common market pricing methods including a spread measurement to the Treasury yield curve as well as underlying characteristics of the particular security including coupon, periodic and life caps, rate reset period and expected life of the security.
Security purchase and sale transactions, including purchase of when issued securities, are recorded on Form 10-Kthe trade date. Gains or losses realized from the sale of securities are included in income and are determined using the specific identification method.
Impairment of Assets: We assess our Agency Securities for other than temporary impairment on at least a quarterly basis. When the year ended December 31, 2011. Therefair value of an investment is less than its amortized cost at the balance sheet date of the reporting period for which impairment is assessed, the impairment is designated as either “temporary” or “other than temporary.” In deciding on whether or not a security is other than temporarily impaired, we use a two-step evaluation process. First, we determine whether we have made any decision to sell a security that is in an unrealized loss position, or, if not, is it more likely than not that we will be forced to sell the security prior to recovering its amortized cost basis. If we determine that the answer to either of these questions is “yes” then the security is considered other than temporarily impaired. To date there have been no significantsuch impairment losses recognized.
Derivative Instruments: We account for derivative instruments in accordance with GAAP, which establishes accounting and reporting standards for derivative instruments, including certain derivative instruments embedded in other contracts (collectively referred to as derivatives) and for derivative activities. The guidance requires that every derivative instrument be recorded in the balance sheet as either an asset or liability measured at its fair value and that changes in the derivative’s fair value be recognized currently in earnings unless specific hedge accounting criteria are met.
We do not designate our derivative activities as cash flow hedges for GAAP purposes, which, among other factors, would require us to those policies during 2012.match the pricing dates of both derivative transactions and repurchase agreements. Operational issues and credit market volatility make such matching impractical for us. Since we have not elected cash flow hedge accounting treatment, our operating results may suffer because losses on the derivative instruments may not be offset by a changes in the fair value or cash flows of the related hedged transaction. Consequently, any declines in the hedged interest rates would result in a charge to earnings. We will continue to designate derivative transactions as hedges for tax purposes and any unrealized gains or losses should not affect our distributable net taxable income.
Inflation
Virtually all of our assets and liabilities are interest rate-sensitive in nature. As a result, interest rates and other factors influence our performance far more than inflation. Changes in interest rates do not necessarily correlate with inflation rates or changes in inflation rates. Our financial statements are prepared in accordance with GAAP and any distributions we may make will be determined by our Board based in part on our REIT taxable income as calculated according to the requirements of the Code; in each case, our activities and balance sheet are measured with reference to fair value without considering inflation.
Subsequent Events
See Note 1516 to the condensed consolidated financial statements.
CAUTIONARY NOTE REGARDING FORWARD-LOOKING STATEMENTS
This report contains various “forward-looking statements.” Forward-looking statements relate to expectations, beliefs, projections, future plans and strategies, anticipated events or trends and similar expressions concerning matters that are not historical facts. In some cases, you can identify forward-looking statements by the use of forward-looking terminology such as “believes,” “expects,” “may,” “will,” “would,” “could,” “should,” “seeks,” “approximately,” “intends,” “plans,” “projects,” “estimates” or “anticipates” or the negative of these words and phrases or similar words or phrases. All forward-looking statements may be impacted by a number of risks and uncertainties, including statements regarding the following subjects:
| · | our business and investment strategy; |
| · | our anticipated results of operations; |
| · | statements about future dividends; |
| · | our ability to obtain financing arrangements; |
| · | our understanding of our competition and ability to compete effectively; |
| · | market, industry and economic trends; and |
| · | interest rates. |
The forward-looking statements in this report are based on our beliefs, assumptions and expectations of our future performance, taking into account all information currently available to us. These beliefs, assumptions and expectations are subject to risks and uncertainties and can change as a result of many possible events or factors, not all of which are known to us. If a change occurs, our business, financial condition, liquidity and results of operations may vary materially from those expressed in our forward-looking statements. You should carefully consider these risks before you make an investment decision with respect to our stock, along with the following factors that could cause actual results to vary from our forward-looking statements:
| (1) | the factors referenced in this report and including those set forth under Item 1A “Risk Factors” in our Annual Report on Form 10-K for the year ended December 31, 2012. |
| (2) | the federal conservatorship of Fannie Mae and Freddie Mac and related efforts, along with any changes in laws and regulations affecting the relationship between Fannie Mae and Freddie Mac and the federal government and the Fed system; |
| (3) | mortgage loan modification programs and future legislative action; |
| (4) | availability, terms and deployment of capital; |
| (5) | changes in economic conditions generally; |
| (6) | changes in interest rates, interest rate spreads and the yield curve or prepayment rates; |
| (7) | general volatility of the financial markets, including markets for mortgage securities; |
| (8) | inflation or deflation; |
| (9) | availability of suitable investment opportunities; |
| (10) | the degree and nature of our competition, including competition for Agency Securities from the U.S. Treasury; |
| (11) | changes in our business and investment strategy; |
| (12) | our dependence on ARRM and ability to find a suitable replacement if ARRM were to terminate their management relationship with us; |
| (13) | the existence of conflicts of interest in our relationship with ARRM, certain of our directors and our officers, which could result in decisions that are not in the best interest of our stockholders; |
| (14) | changes in personnel at ARRM or the availability of qualified personnel at ARRM; |
| (15) | limitations imposed on our business by our status as a REIT; |
| (16) | changes in GAAP, including interpretations thereof; and |
| (17) | changes in applicable laws and regulations. |
We cannot guarantee future results, levels of activity, performance or achievements. You should not place undue reliance on forward-looking statements, which apply only as of the date of this report. We do not intend and disclaim any duty or obligation to update or revise any industry information or forward-looking statements set forth in this report to reflect new information, future events or otherwise, except as required under the U.S. Federal securities laws.
Item 3. Quantitative and Qualitative Disclosures Aboutabout Market Risk
We seek to manage our risks related to the credit-quality of our assets, interest rates, liquidity, prepayment speeds and market value while, at the same time, seeking to provide an opportunity to stockholders to realize attractive risk adjusted returns through ownership of our capital stock. While we do not seek to avoid risk completely, we believe the risk can be quantified from historical experience and seek to actively manage that risk, to earn sufficient compensation to justify taking those risks and to maintain capital levels consistent with the risks we undertake.
Interest Rate, Cap and Mismatch Risk
We invest in fixed rate, hybrid adjustable rate hybrid and fixedadjustable rate Agency Securities. Hybrid mortgages are ARMs that have a fixed-interest rate for an initial period of time (typically three years or greater) and then convert to an adjustable rate for the remaining loan term. Our debt obligations are generally repurchase agreements of limited duration that are periodically refinanced at current market rates.
ARM-related assetsARMs are typically subject to periodic and lifetime interest rate caps that limit the amount an ARM-related asset’sARMs interest rate can change during any given period. ARM securitiesARMs are also typically subject to a minimum interest rate payable. Our borrowings are not subject to similar restrictions. Hence, in a period of increasing interest rates, interest rates on our borrowings could increase without limitation, while the interest rates on our mortgage related assets could be limited. This exposure would be magnified to the extent we acquire fixed rate Agency Securities or ARM securitiesARMs that are not fully indexed. Further, some ARM-related assetsARMs may be subject to periodic payment caps that result in some portion of the interest being deferred and added to the principal outstanding. These factors could lower our net interest income or cause a net loss during periods of rising interest rates, which would negatively impact our liquidity, net income and our ability to make distributions to stockholders.
We fund the purchase of a substantial portion of our ARM-related assetsARMs with borrowings that have interest rates based on indices and repricing terms similar to, but of shorter maturities than, the interest rate indices and repricing terms of our mortgage assets. Thus, we anticipate that in most cases the interest rate indices and repricing terms of our mortgage assets and our funding sources will not be identical, thereby creating an interest rate mismatch between assets and liabilities. During periods of changing interest rates, such interest rate mismatches could negatively impact our net interest income, dividend yield and the market price of our stock. Most of our adjustable rate assets are based on the one-year constant maturity treasury rate and the one-year LIBOR rate and our debt obligations are generally based on LIBOR. These indices generally move in the same direction, but there can be no assurance that this will continue to occur.
Our ARM-related assetsARMs and borrowings reset at various different dates for the specific asset or obligation. In general, the repricing of our debt obligations occurs more quickly than on our assets. Therefore, on average, our cost of funds may rise or fall more quickly than does our earnings rate on our assets.
Further, our net income may vary somewhat as the spread between one-month interest rates, the typical term for our repurchase agreements and six-month and twelve-month interest rates, the typical reset term of adjustable rate Agency Securities, varies.
Prepayment Risk
As we receive repayments of principal on our Agency Securities from prepayments and scheduled payments, premiums paid on such securities are amortized against interest income and discounts are accreted to interest income as realized. Premiums arise when we acquire Agency Securities at prices in excess of the principal balance of the mortgage loans underlying such Agency Securities. Conversely, discounts arise when we acquire Agency Securities at prices below the principal balance of the mortgage loans underlying such Agency Securities. To date, all of our Agency Securities have been purchased at a premium.
Interest Rate Risk and Effect on Market Value Risk
Another component of interest rate risk is the effect changes in interest rates will have on the market value of our Agency Securities. We face the risk that the market value of our Agency Securities will increase or decrease at different rates than that of our liabilities, including our derivative instruments.
We primarily assess our interest rate risk by estimating the effective duration of our assets and the effective duration of our liabilities and by estimating the time difference between the interest rate adjustment of our assets and the interest rate adjustment of our liabilities. Effective duration essentially measures the market price volatility of financial instruments as interest rates change. We generally estimate effective duration using various financial models and empirical data. Different models and methodologies can produce different effective duration estimates for the same securities.
The sensitivity analysis tables presented below reflect the estimated impact of an instantaneous parallel shift in the yield curve, up and down 50 and 100 basis points, on the market value of our interest rate-sensitive investments and net interest income, at June 30,March 31, 2013 and March 31, 2012, and December 31, 2011, assuming a static portfolio. When evaluating the impact of changes in interest rates, prepayment assumptions and principal reinvestment rates are adjusted based on our manager’sARRM’s expectations. The analysis presented utilized assumptions, models and estimates of the manager based on the manager’s judgment and experience.
As of June 30, 2012March 31, 2013
| Change in Interest Rates | | | Percentage Change in Projected Net Interest Income | | | Percentage Change in Projected Portfolio Value Including Derivatives | |
| | 1.00 | % | | | (0.46) | % | | | (1.17) | % |
| | 0.50 | | | | 6.23 | | | | (0.89) | |
| | (0.50) | | | | (2.90) | | | | (1.39) | |
| | (1.00) | | | | (22.59) | | | | (1.90) | |
| Change in Interest Rates | | Percentage Change in Projected Net Interest Income | | Percentage Change in Projected Portfolio Value Including Derivatives | |
| 1.00 | % | (11.89) | % | (2.42) | % |
| 0.50 | | (4.16) | | (1.27) | |
| (0.50) | | 4.67 | | (0.04) | |
| (1.00) | | (9.62) | | (0.04) | |
As of December 31, 20112012
| Change in Interest Rates | | | Percentage Change in Projected Net Interest Income | | | Percentage Change in Projected Portfolio Value Including Derivatives | |
| | 1.00 | % | | | (9.79) | % | | | 0.08 | % |
| | 0.50 | | | | 1.35 | | | | 0.19 | |
| | (0.50) | | | | 8.91 | | | | (0.41) | |
| | (1.00) | | | | (7.53) | | | | (0.94) | |
| Change in Interest Rates | | Percentage Change in Projected Net Interest Income | | Percentage Change in Projected Portfolio Value Including Derivatives | |
| 1.00 | % | 4.90 | % | (0.99) | % |
| 0.50 | | 12.81 | | (0.60) | |
| (0.50) | | (6.38) | | (1.31) | |
| (1.00) | | (41.89) | | (2.17) | |
While the tabletables above reflectsreflect the estimated immediate impact of interest rate increases and decreases on a static portfolio, we rebalance our portfolio from time to time either to seek to take advantage of or reduce the impact of changes in interest rates. It is important to note that the impact of changing interest rates on market value and net interest income can change significantly when interest rates change beyond 100 basis points from current levels. Therefore, the volatility in the market value of our assets could increase significantly when interest rates change beyond amounts shown in the table above. In addition, other factors impact the market value of and net interest income from our interest rate-sensitive investments and derivative instruments, such as the shape of the yield curve, market expectations as to future interest rate changes and other market conditions. Accordingly, interest income would likely differ from that shown above and such difference might be material and adverse to our stockholders.
The above table quantifiestables quantify the potential changes in net interest income and portfolio value, which includes the value of our derivatives, should interest rates immediately change. Given the low level of interest rates at June 30, 2012March 31, 2013 and December 31, 2011,2012, we applied a floor of 0% for all anticipated interest rates included in our assumptions. Due to the presence of this floor, it is anticipated that any hypothetical interest rate decrease would have a limited positive impact on our funding costs beyond a certain level; however, because prepayments speeds are unaffected by this floor, it is expected that any increase in our prepayment speeds (occurring as a result of any interest rate decrease or otherwise) could result in an acceleration of our premium amortization and the reinvestment of such prepaid principal in lower yielding assets. As a result, the presence of this floor limits the positive impact of any interest rate decrease on our funding costs. Therefore, at some point, hypothetical interest rate decreases could cause the fair value of our financial instruments and our net interest income to decline.
Market Value Risk
All of our Agency Securities are classified as available for sale assets. As such, they are reflected at fair value with the periodic adjustment to fair value (that is not considered to be an other than temporary impairment) reflectedreported as part of “Accumulated other comprehensive income” that is included in the stockholders’ equity section of our condensed consolidated balance sheets. The market value of our assets can fluctuate due to changes in interest rates and other factors. Weakness in the mortgage market may adversely affect the performance and market value of our investments. This could negatively impact our net book value. Furthermore, if our lenders are unwilling or unable to provide additional financing, we could be forced to sell our Agency Securities at an inopportune time when prices are depressed. The principal payments are guaranteed by Freddie Mac, Fannie Mae, or Ginnie Mae on our Agency Securities.
Liquidity Risk
Our primary liquidity risk arises from financing long-maturity Agency Securities with short-term debt. The interest rates on our borrowings generally adjust more frequently than the interest rates on our adjustable rate Agency Securities. Accordingly, in a period of rising interest rates, our borrowing costs will usually increase faster than our interest earnings from Agency Securities.
Item 4. Controls and Procedures
Our Co-Chief Executive OfficerOfficers (“Co-CEO”Co-CEOs”) and Chief Financial Officer (“CFO”) participated in an evaluation by our management of the effectiveness of our disclosure controls and procedures (as defined in Rules 13a-15(e) and 15d-15(e) under the Securities Exchange Act of 1934, as amended (the “Exchange Act”)) as of the end of our fiscal quarter that ended on June 30, 2012.March 31, 2013. Based on their participation in that evaluation, our Co-CEOCo-CEOs and CFO concluded that our disclosure controls and procedures were effective as of June 30, 2012March 31, 2013 to ensure that information required to be disclosed in our reports filed or submitted under the Securities Exchange Act, of 1934, as amended, is recorded, processed, summarized and reported within the time periods specified in the SECsSEC’s rules and forms, and to ensure that information required to be disclosed in our reports filed or furnished under the Securities Exchange Act, of 1934, as amended, is accumulated and communicated to our management, including our Co-CEOCo-CEOs and CFO, as appropriate, to allow timely decisions regarding required disclosures. Our Co-CEOCo-CEOs and CFO also participated in an evaluation by our management of any changes in our internal control over financial reporting (as defined in Rules 13a-15(f) and 15d-15(f) under the Exchange Act) that occurred during the quarter ended June 30, 2012.March 31, 2013. That evaluation did not identify any changes that have materially affected, or are reasonably likely to materially affect, our internal control over financial reporting.
PART II. OTHER INFORMATION
Item 1. Legal Proceedings
Our company and our managerARRM are not currently subject to any legal proceedings.proceedings, as described in Item 103 of Regulation S-K.
Item 1A. Risk Factors
There have been no material changes from the risk factors disclosed in the “Risk Factors” section of our Annual Report on Form 10-K filed on March 6, 2012February 22, 2013 with the SEC.
Item 2. Unregistered Sales of Equity Securities and Use of Proceeds
None.
Item 3. Defaults Upon Senior Securities
None.
Item 4. Mine Safety Disclosures
Not applicable.
Not applicable.
Item 5. Other Information
None.
Item 6. Exhibits
See Exhibit Index.
SIGNATURES
Pursuant to the requirements of the Securities and Exchange Act of 1934, the registrant has duly caused this report to be signed on its behalf by the undersigned thereunto duly authorized.
| | | |
Date: August 1, 2012 May 2, 2013 | ARMOUR RESIDENTIAL REIT, INC. | |
| | /s/ Scott J. Ulm | James R. Mountain |
| | Scott J. Ulm | James R. Mountain |
| | Co-Chief ExecutiveChief Financial Officer, Chief InvestmentDuly Authorized Officer Head of
Risk Management and Co-Vice Chairman (Principal Executive
Officer)
| Principal Financial and Accounting Officer |
EXHIBIT INDEX
Exhibit Number | | Description |
| 3.1 | | Amended and Restated Articles of Incorporation (1) |
3.2 | | Articles of Amendment to Amended and Restated Articles of Incorporation (2) |
3.3 | | Articles of Amendment to Amended and Restated Articles of Incorporation (3) |
3.4 | | Articles Supplementary of 1,610,000classifying 6,210,000 shares of 8.250%ARMOUR Residential REIT, Inc.’s preferred stock into shares of 7.875% Series AB Cumulative Redeemable Preferred Stock (4) |
3.5 | | Articles Supplementary of 6,000,000 shares of 8.250% series A Cumulative Redeemable Preferred Stock (5) |
3.6 | | Amended Bylaws (6) |
10.1 | | Second Amended and Restated Management Agreement, dated June 18, 2012, between ARMOUR and ARRM (7)(1) |
| 31.1 | | Certification of Chief Executive Officer Pursuant to SEC Rule 13a-14(a)/15d-14(a) (8)(2) |
| 31.2 | | Certification of Chief Executive Officer Pursuant to SEC Rule 13a-14(a)/15d-14(a) (2) |
| 31.3 | | Certification of Chief Financial Officer Pursuant to SEC Rule 13a14(a)/15d-14(a) (8)(2) |
| 32.1 | | Certification of Chief Executive Officer Pursuant to 18 U.S.C. §1350 (8)(3) |
| 32.2 | | Certification of Chief Executive Officer Pursuant to 18 U.S.C. §1350 (3) |
| 32.3 | | Certification of Chief Financial Officer Pursuant to 18 U.S.C. §1350 (8)(3) |
| 101.INS# | | XBRL Instance Document |
| 101.SCH# | | XBRL Taxonomy Extension Schema Document |
| 101.CAL# | | XBRL Taxonomy Extension Calculation Linkbase Document |
| 101.DEF# | | XBRL Taxonomy Extension Definition Linkbase Document |
| 101.LAB# | | XBRL Taxonomy Extension Label Linkbase Document |
| 101.PRE# | | XBRL Taxonomy Extension Presentation Linkbase Document |
| (1) | Incorporated by reference to Exhibit 3.4 to ARMOUR’s Current Report on Form 8-K filed with the SEC on November 12, 2009. |
(2) | Incorporated by reference to Exhibit 3.1 to ARMOUR’s Current Report on Form 8-K filed with the SEC on August 8, 2011. |
(3) | Incorporated by reference to Exhibit 3.1 to ARMOUR’s Current report on Form 8-K filed with the SEC on December 1, 2011.February 12, 2013. |
| | |
(4)(2) | Incorporated by reference to Exhibit 3.1 to ARMOUR’s Current report on Form 8-K filed with the SEC on June 6, 2012Filed herewith |
| | |
(5)(3) | Incorporated by reference to Exhibit 3.1 to ARMOUR’s Current report on Form 8-K filed with the SEC on July 13, 2012 |
| |
(6) | Incorporated by reference to Exhibit 3.5 to ARMOUR’s Current Report on Form 8-K filed with the SEC on November 12, 2009. |
| |
(7) | Incorporated by reference to Exhibit 10.1 to ARMOUR’s Current Report on Form 8-K filed with the SEC on June 22, 2012. |
| |
(8) | FiledFurnished herewith |
| # | Pursuant to Rule 406T of Regulation S-T, these interactive data files are deemed not filed or part of a registration statement or prospectus for purposes of Sections 11 or 12 of the Securities Act of 1933, are deemed not filed for purposes of Section 18 of the Securities Exchange Act of 1934 and otherwise are not subject to liability under those sections. |
44