UNITED STATES
SECURITIES AND EXCHANGE COMMISSION
WASHINGTON, D.C. 20549
___________________________
FORM 10-Q
þ☑QUARTERLY REPORT PURSUANT TO SECTION 13 OR 15(d) OF THE SECURITIES EXCHANGE ACT OF 1934
For the quarterly period ended SeptemberJune 30, 20172021
OR
¨☐ TRANSITION REPORT PURSUANT TO SECTION 13 OR 15(d) OF THE SECURITIES EXCHANGE ACT OF 1934
For the transition period from _____ to _____
Commission File No. 001-35674
REALOGY HOLDINGS CORP.
(Exact name of registrant as specified in its charter)
20-8050955
(I.R.S. Employer Identification Number)
Commission File No. 333-148153
REALOGY GROUP LLC
(Exact name of registrant as specified in its charter)
20-4381990
| | | | | |
| Commission File No. 001-35674 | Commission File No. 333-148153 |
| REALOGY HOLDINGS CORP. | REALOGY GROUP LLC |
| (Exact name of registrant as specified in its charter) | (Exact name of registrant as specified in its charter) |
| 20-8050955 | 20-4381990 |
| (I.R.S. Employer Identification Number) | (I.R.S. Employer Identification Number) |
Delaware
(State or other jurisdiction of incorporation or organization)
175 Park Avenue
Madison, NJ 07940
(Address of principal executive offices) (Zip Code)
(973) 407-2000
(Registrants' telephone number, including area code)
___________________________ | | | | | | | | | | | | | | | | | |
| Securities registered pursuant to Section 12(b) of the Act: |
| Title of each class | | Trading Symbol(s) | | Name of each exchange on which registered |
| Realogy Holdings Corp. | Common Stock, par value $0.01 per share | | RLGY | | New York Stock Exchange |
| Realogy Group LLC | None | | None | | None |
Indicate by check mark whether the Registrants (1) have filed all reports required to be filed by Section 13 or 15(d) of the Securities Exchange Act of 1934 during the preceding 12 months (or for such shorter period that the registrant was required to file such reports), and (2) have been subject to such filing requirements for the past 90 days.
Realogy Holdings Corp. Yes þ☑ No ¨☐Realogy Group LLC Yes ¨☐ No þ☑
Indicate by check mark whether the Registrants have submitted electronically and posted on its corporate Web site, if any, every Interactive Data File required to be submitted and posted pursuant to Rule 405 of Regulation S-T (§ 232.405 of this chapter) during the preceding 12 months (or for such shorter period that the Registrants were required to submit and post such files).
Realogy Holdings Corp. Yes þ☑ No ¨☐Realogy Group LLC Yes þ☑ No ¨☐
Indicate by check mark whether the Registrants are large accelerated filers, accelerated filers, non-accelerated filers, smaller reporting companies, or emerging growth companies. See the definitions of "large accelerated filer," "accelerated filer," "smaller reporting company," and "emerging growth company" in Rule 12b-2 of the Exchange Act.
|
| | | | | | | | | | | | | | | | | | | | | | | | | | | | |
| Large accelerated filer | | Accelerated filer | | Non-accelerated filer (Do not check if a smaller
| | Smaller reporting company)company | | Smaller reporting
company
| | Emerging growth company |
| Realogy Holdings Corp. | þ☑ | | ¨☐ | | ¨☐ | | ¨☐ | | ¨☐ |
| Realogy Group LLC | ¨☐ | | ¨☐ | | þ☑ | | ¨☐ | | ¨☐ |
If an emerging growth company, indicate by check mark if the registrant has elected not to use the extended transition period for complying with any new or revised financial accounting standards provided pursuant to Section 13(a) of the Exchange Act. ¨
Indicate by check mark whether the Registrants are a shell company (as defined in Rule 12b-2 of the Exchange Act).
Realogy Holdings Corp. Yes ¨☐ No þ☑Realogy Group LLC Yes ¨☐ No þ☑
There were 134,616,566116,584,201 shares of Common Stock, $0.01 par value, of Realogy Holdings Corp. outstanding as of November 1, 2017.August 2, 2021.
TABLE OF CONTENTS
| | | | | | | | |
| Page |
| |
| |
| | |
| PART I | PageFINANCIAL INFORMATION | |
| Item 1. | | |
| |
| | |
PART I | FINANCIAL INFORMATION | |
Item 1. | | |
| | |
| | |
| | |
| | |
| | |
| | |
| | |
| Item 2. | | |
| Item 3. | | |
| Item 4. | | |
| PART II | OTHER INFORMATION | |
| Item 1. | | |
Item 1.1A. | | |
Item 2.6. | | |
Item 5. | | |
Item 6. | | |
| |
| |
INTRODUCTORY NOTE
Except as otherwise indicated or unless the context otherwise requires, the terms "we," "us," "our," "our company," "Realogy," "Realogy Holdings" and the "Company" refer to Realogy Holdings Corp., a Delaware corporation, and its consolidated subsidiaries, including Realogy Intermediate Holdings LLC, a Delaware limited liability company ("Realogy Intermediate"), and Realogy Group LLC, a Delaware limited liability company ("Realogy Group"). Neither Realogy Holdings, the indirect parent of Realogy Group, nor Realogy Intermediate, the direct parent company of Realogy Group, conducts any operations other than with respect to its respective direct or indirect ownership of Realogy Group. As a result, the consolidated financial positions, results of operations and cash flows of Realogy Holdings, Realogy Intermediate and Realogy Group are the same.
Realogy Holdings is not a party to the As used in this Quarterly Report on Form 10-Q:
•"Senior Secured Credit FacilityAgreement" refers to the Amended and Term Loan A FacilityRestated Credit Agreement dated as of March 5, 2013, as amended, amended and certain references in this reportrestated, modified or supplemented from time to time, that governs our consolidated indebtedness exclude Realogy Holdings with respectsenior secured credit facility, or "Senior Secured Credit Facility;"
•"Non-extended Revolving Credit Commitment" and "Extended Revolving Credit Commitment" each refer to indebtednessthe applicable portion of the revolving credit facility under the Senior Secured Credit Facility and are referred to collectively as the "Revolving Credit Facility;"
•"Term Loan B Facility" refers to the term loans outstanding under the Senior Secured Credit Facility;
•"Term Loan A Facility. In addition, while Realogy Holdings is a guarantor of Realogy Group's obligations under its unsecured notes, Realogy Holdings is not subjectAgreement" refers to the restrictive covenants inTerm Loan A Agreement, dated as of October 23, 2015, as amended, amended and restated, modified or supplemented from time to time;
•"Non-extended Term Loan A" and "Extended Term Loan A" each refer to the indentures governing such indebtedness.applicable portion of the Term Loan A facility under the Term Loan A Agreement and are referred to collectively as the "Term Loan A Facility;"
•"4.875% Senior Notes", "9.375% Senior Notes" and "5.75% Senior Notes" refer to our 4.875% Senior Notes due 2023, 9.375% Senior Notes due 2027 and 5.75% Senior Notes due 2029, respectively, and are referred to collectively as the "Unsecured Notes;" •"7.625% Senior Secured Second Lien Notes" refers to our 7.625% Senior Secured Second Lien Notes due 2025; and
•"Exchangeable Senior Notes" refers to our 0.25% Exchangeable Senior Notes due 2026.
FORWARD-LOOKING STATEMENTS
Forward-lookingThis Quarterly Report on Form 10-Q includes forward-looking statements included in this reportwithin the meaning of Section 27A of the Securities Act of 1933 and our other public filings or other public statements that we make from time to time are based on various facts and derived utilizing numerous important assumptions and are subject to known and unknown risks, uncertainties and other factors that may cause our actual results, performance or achievements to be materially different from any future results, performance or achievements expressed or implied by such forward-looking statements.Section 21E of the Securities Exchange Act of 1934 (the "Exchange Act"). Forward-looking statements include all statements that do not relate solely to historical or current facts, and can generally be identified by the information concerning our future financial performance, business strategy, projected plans and objectives,use of words such as well as projections of macroeconomic and industry trends, which are inherently unreliable due to the multiple factors that impact economic trends, and any such variations may be material. Statements preceded by, followed by or that otherwise include the words "believes,"believe," "expects,"expect," "anticipates,"anticipate," "intends,"intend," "projects,"project," "estimates,"estimate," "plans,"plan," and similar expressions or future or conditional verbs such as "will," "should," "would," "may" and "could" are generally"could."
In particular, information appearing under "Management's Discussion and Analysis of Financial Condition and Results of Operations" includes forward-looking statements. Forward-looking statements inherently involve many risks and uncertainties that could cause actual results to differ materially from those projected in naturethese statements. Where, in any forward-looking statement, we express an expectation or belief as to future results or events, it is based on management's current plans and expectations, expressed in good faith and believed to have a reasonable basis. However, we can give no assurance that any such expectation or belief will result or will be achieved or accomplished.
The following include some, but not historical facts. You should understandall, of the risks and uncertainties that the following important factors could affect our future results and cause actual results to differ materially from those expressed in the forward-looking statements:
risks related to general business, economic, employment•The residential real estate market is cyclical, and political conditions andwe are negatively impacted by adverse developments or the absence of sustained improvement in the U.S. residential real estate markets, either regionally or nationally, which could include, but are not limited to factors that impact homesale transaction volume, such as:
◦continued or accelerated declines in inventory or a decline in the number of home sales;
◦increases in mortgage rates or inflation or tightened mortgage underwriting standards;
◦changes in consumer preferences, including weakening in the consumer trends that have benefited us since the second half of 2020;
◦reductions in housing affordability, as a result of inflation, increases in average homesale price or otherwise; and
◦stagnant or declining home prices;
•Likewise, we are negatively impacted by adverse developments or the absence of sustained improvement in macroeconomic conditions (such as business, economic or political conditions) on a global, domestic or local basis, which could include, but are not limited to:
◦contraction in the U.S. economy, including the impact of recessions, slow economic growth, or a deterioration in other economic factors (including potential consumer, business or governmental defaults or delinquencies due to the COVID-19 crisis or otherwise); and
◦fiscal and monetary policies of the federal government and its agencies, particularly those that may result in unfavorable changes to the interest rate environment and tax reform;
•The impact of evolving competitive and consumer dynamics, which could include, but are not limited to:
◦continued erosion of the broker's share of the commission income generated by homesale transactions and the continued rise of the sales agent’s share of such commissions;
◦our ability to compete against non-traditional competitors, including but not limited to:
| |
◦ | a lack of improvement or a decline in the number of homesales, stagnant or declining home prices and/or a deterioration in other economic factors that particularly impact the residential real estate market and the business segments in which we operate; |
| |
◦ | increasing mortgage rates and/or constraints on the availability of mortgage financing; |
| |
◦ | insufficient or excessive home inventory levels by market and price point; |
| |
◦ | a decrease in consumer confidence; |
| |
◦ | the impact of recessions, slow economic growth, disruptions in the U.S. government or banking system, disruptions in a major geoeconomic region, or equity or commodity markets and high levels of unemployment in the U.S. and abroad, which may impact all or a portion of the housing markets in which we and our franchisees operate; |
| |
◦ | legislative, tax or regulatory changes (including changes in regulatory interpretations or enforcement practices) that would adversely impact the residential real estate market, including changes relating to the Real Estate Settlement Procedures Act ("RESPA"), potential reforms of Fannie Mae and Freddie Mac, immigration reform, and potential tax code reform (including reforms related to the deductibility of home mortgage interest or state, local and property taxes); |
| |
◦ | a decrease in housing affordability due to higher mortgage rates and increases in average homesale prices; |
| |
◦ | high levels of foreclosure activity; |
| |
◦ | changing attitudes towards home ownership, particularly among potential first-time homebuyers who may delay, or decide not to, purchase a home, as well as the potential impact of decisions to rent versus purchase a home; and |
| |
◦ | the inability or unwillingness of current homeowners to purchase their next home due to various factors, including limited or negative equity in their current home, difficult mortgage underwriting standards, attractive rates on existing mortgages and the lack of available inventory in their market; |
increased competition whether through traditional competitors, other industry participants orto, iBuying and home swap business models and virtual brokerages, in particular those competitors with alternative business models (such as flat fee, capped fee or desk fee models) including companies employing technologies intendedaccess to disrupt the traditional brokerage model, as well as eliminating brokers or agents from, or minimizing the role they playsignificant third-party capital that may prioritize market share over profitability; and
◦meaningful decreases in the homesale transaction, such as reducing brokerage commissions, and companies otherwise competing for a portion of grossaverage broker commission income;rate;
competition for more productive sales associates, sales associate teams, and manager talent will continue to impact the ability of our company owned brokerage•Our business and financial results may be materially and adversely impacted if we are unable to execute our affiliated franchisees to business strategy and achieve growth, including if we are not successful in our efforts to:
◦recruit and retain productive independent sales agents;
◦attract and retain independent sales associates, either individuallyfranchisees or as members of a team, and will result in continuing pressure on the commission split rates paid by our company owned brokerages and our affiliated franchisees;
our geographic and high-end market concentration, particularly with respect to our company owned brokerage operations;
our inability to enter into franchise agreements with new franchisees at current net effective royalty rates, or to realize royalty revenue growth from them;
our inability to renew existing franchise agreements at current net effectivewithout reducing contractual royalty rates or without increasing the amount and prevalence of non-standard incentives,sales incentives;
◦compete for real estate services business, including homesale transactions and title underwriting, title and settlement, mortgage origination, relocation and lead generation services;
◦develop or to maintainprocure products, services and technology that support our strategic initiatives;
◦realize the expected benefits from our non-exclusive mortgage origination joint venture, our RealSure joint venture, or enhance our value proposition to franchisees;from other existing or future strategic partnerships;
the lack of revenue growth or declining profitability of our franchisees and company owned brokerage operations, including the impact of lower average broker commission rates;
disputes or issues with entities that license us their tradenames for use in our business or events that negatively impact their brands that could impede our franchising of those brands;
actions by our franchisees that could harm our business or reputation, non-performance of our franchisees, controversies with our franchisees or actions against us by their independent sales associates or employees or third parties with which our franchisees have business relationships;
loss, attrition or changes among our senior executives, other key employees or our inability to recruit top talent;
our inability to ◦achieve or maintain a beneficial cost structure or savings and other benefits from our restructuring activities;cost-saving initiatives;
◦generate a meaningful number of high-quality leads for independent sales agents and franchisees; and
◦complete or integrate acquisitions and joint ventures into our inabilityexisting operations, or to realizecomplete or effectively manage divestitures or other corporate transactions;
•The COVID-19 crisis has in the benefits from acquisitions duepast, and may again (due to the impact of virus mutations or otherwise), amplify risks to our business, and worsening economic consequences of the crisis or the reinstatement of significant limitations on normal business operations could have a material adverse effect on our profitability, liquidity, financial condition and results of operations;
•Our financial condition and/or results of operations may be adversely impacted by risks related to our business structure, including, but not limited to:
◦our geographic and high-end market concentration;
◦the operating results of affiliated franchisees;
◦continued consolidation among our top 250 franchisees;
◦difficulties in the business or changes in the licensing strategy of the owners of the two brands we do not own;
◦the loss of key personnelour largest real estate benefit program client or productive agentsmultiple significant relocation clients;
◦continued reductions in corporate relocations or relocation benefits or in refinancing activity;
◦the failure of third-party vendors or partners to perform as expected or our failure to adequately monitor such third-parties; and
◦our reliance on information technology to operate our business and maintain our competitiveness;
•Listing aggregator concentration and market power creates, and is expected to continue to create, disruption in the residential real estate brokerage industry, which may have a material adverse effect on our results of operations and financial condition;
•Industry structure changes—as a result of new laws, regulations, administrative policies or guidance, litigation or other legal action (such as investigations and regulatory proceedings), the rules of multiple listing services ("MLSs") or the National Association of Realtors ("NAR") or otherwise—that disrupt the functioning of the acquired companies, as well asresidential real estate market could materially adversely affect our operations and financial results;
•We are subject to numerous risks related to our substantial indebtedness that could adversely limit our operations and/or adversely impact our liquidity, including but not limited to our interest obligations and the possibility that expected benefitsnegative covenant restrictions contained in our debt agreements and synergiesour ability to refinance or repay our indebtedness or incur additional indebtedness;
•We are subject to risks related to the issuance of the Exchangeable Senior Notes and exchangeable note hedge and warrant transactions, including the potential impact on the value of our common stock and counterparty risk with respect to the exchangeable note hedge transactions;
•We are subject to risks related to legal and regulatory matters, which may cause us to incur increased costs (including in connection with compliance efforts) and any of which could result in adverse financial, operational or reputational consequences to us, including but not be achieved in a timely manner or at all;
limited to our failure or alleged failure to comply with laws, regulations and regulatory interpretations and any changes in laws and regulations or stricter interpretations of regulatory requirements,any of the foregoing (whether through private litigation or governmental action), including but not limited toto: (1) antitrust laws and regulations, (2) the Real Estate Settlement Procedures Act ("RESPA") or other federal or state consumer protection or similar laws, and (3) state or federal employment laws or regulations that would require reclassification of independent contractor sales associatesagents to employee status, (2) RESPA or state consumer protection or similar laws and (3)(4) privacy or data security laws and regulations;
any adverse resolution of litigation, governmental or regulatory proceedings or arbitration awards as well as any adverse impact of decisions to voluntarily modify•We face reputational, business arrangements or enter into settlement agreements to avoid the risk of protractedcontinuity and costly litigation or other proceedings;
our inability to obtain new technologies and systems, to replace or introduce new technologies and systems as quickly as our competitors and in a cost-effective manner or to achieve the benefits anticipated from new technologies or systems;
risks and growing costs related to cybersecurity threats to our data and customer, franchisee, employee and independent sales associate data, including but not limited to:
| |
◦ | the failure or significant disruption of our operations from various causes, including human error, computer malware, ransomware, insecure software, zero day threats, or other events related to our critical information technologies and systems; |
| |
◦ | the increasing level and sophistication of cybersecurity attacks, including distributed denial of service attacks, data exfiltration, fraud or malicious acts on the part of trusted insiders, social engineering, or other unlawful tactics aimed at compromising the systems and data of our officers, employees and franchisee and company owned brokerage sales associates and their customers (including via systems not directly controlled by us); and |
| |
◦ | the reputational or financial risks associated with a loss of data or material data breach (including unauthorized access to our proprietary business information or personal information of our customers, employees and independent sales associates), the transmission of computer malware, or the diversion of homesale transaction closing funds; |
risks related to our international operations, including compliance with the Foreign Corrupt Practices Act and similar anti-corruption laws as well as risks relating to the master franchisor model that we deploy internationally;
risks associated with our substantial indebtednesscybersecurity incidents; and interest obligations
•Our goodwill and restrictions contained in our debt agreements, including risks relatingother long-lived assets are subject to having to dedicate a significant portion of our cash flows from operations to service our debt;
risks relating to our ability to refinance or repay our indebtedness, incur additional indebtedness or return capital to stockholders;
changes in corporate relocation practices resulting in fewer employee relocations, reduced relocation benefits or the loss of one or more significant affinity clients;
an increase in the claims rate of our title underwriter and an increase in mortgage ratesimpairment which could adversely impact the revenue of our title and settlement services segment;
our inability to securitize certain assets of our relocation business, which would require us to find an alternative source of liquidity that may not be available, or if available, may not be on favorable terms;
risks that could materially adverselynegatively impact our equity investment inearnings;
•Severe weather events or natural disasters, including increasing severity or frequency of such events due to climate change or otherwise, or other catastrophic events, including public health crises, such as pandemics and epidemics, may disrupt our mortgage origination joint venture, including increases in mortgage rates, the impact of joint venture operational or liquidity risks, the impact of a transition from our current joint venture to our new joint venture, regulatory changes, litigation, investigationsbusiness and inquiries or any termination of the venture;
risks relating to thehave an unfavorable impact on homesale activity dueactivity.
More information on factors that could cause actual results or events to severe weather events or natural disasters;
any remaining resolutions or outcomesdiffer materially from those anticipated is included from time to time in our reports filed with respect to contingent liabilities of our former parent, Cendant Corporationthe Securities and Exchange Commission ("Cendant"SEC"), under the Separationincluding this Quarterly Report and Distribution Agreement and the Tax Sharing Agreement (each as described in our Annual Report on Form 10-K for the year ended December 31, 2016, the "20162020 (the "2020 Form 10-K"), including any adverse impact on our future cash flows; and
new types of taxes or increases in state, local or federal taxes that could diminish profitability or liquidity.
Other factors not identified above, including those describedparticularly under the headingscaptions "Forward-Looking Statements," "Risk Factors" andFactors," "Management's Discussion and Analysis of Financial Condition and Results of Operations" in the 2016 Form 10-K, filed with the SecuritiesOperations," and Exchange Commission ("SEC"), may also cause actual results to differ materially from those described in our forward-looking statements."Legal Proceedings". Most of these factors are difficult to anticipate and are generally beyond our control. You should consider these factors in connection with any forward-looking statements that may be made by us and our businesses generally.
All forward-looking statements herein speak only as of the date of this Quarterly Report. Except for our ongoing obligations to disclose material information under the federal securities laws,as is required by law, we undertake noexpressly disclaim any obligation to publicly release publicly any revisions to any forward-looking statements to reportreflect events or to reportafter the occurrencedate of unanticipated events unless we are required to do so by law.this Quarterly Report. For any forward-looking statement contained in this Quarterly Report, our public filings or other public statements, we claim the protection of the safe harbor for forward-looking statements contained in the Private Securities Litigation Reform Act of 1995.
PART I - FINANCIAL INFORMATION
Item 1. Financial Statements.
REPORT OF INDEPENDENT REGISTERED PUBLIC ACCOUNTING FIRMReport of Independent Registered Public Accounting Firm
To the Board of Directors and Stockholders of Realogy Holdings Corp.:
Results of Review of Interim Financial Statements
We have reviewed the accompanying condensed consolidated balance sheet of Realogy Holdings Corp. and its subsidiaries (the "Company") as of SeptemberJune 30, 2017,2021, and the related condensed consolidated statements of operations and comprehensive income (loss) for the three-month and nine-monthsix-month periods ended SeptemberJune 30, 20172021 and 20162020, and the condensed consolidated statement of cash flows for the nine-monthsix-month periods ended SeptemberJune 30, 20172021 and 2016. These2020, including the related notes (collectively referred to as the “interim financial statements”). Based on our reviews, we are not aware of any material modifications that should be made to the accompanying interim financial statements arefor them to be in conformity with accounting principles generally accepted in the responsibilityUnited States of the Company's management.America.
We conducted our reviewhave previously audited, in accordance with the standards of the Public Company Accounting Oversight Board (United States)., the consolidated balance sheet of the Company as of December 31, 2020, and the related consolidated statements of operations, comprehensive (loss) income, equity and of cash flows for the year then ended (not presented herein), and in our report dated February 23, 2021, which included a paragraph describing a change in the manner of accounting for leases in the 2019 financial statements, we expressed an unqualified opinion on those consolidated financial statements. In our opinion, the information set forth in the accompanying consolidated balance sheetinformation as of December 31, 2020, is fairly stated, in all material respects, in relation to the consolidated balance sheet from which it has been derived.
Basis for Review Results
These interim financial statements are the responsibility of the Company’s management.We are a public accounting firm registered with the Public Company Accounting Oversight Board (United States) (PCAOB) and are required to be independent with respect to the Company in accordance with the U.S. federal securities laws and the applicable rules and regulations of the Securities and Exchange Commission and the PCAOB. We conducted our review in accordance with the standards of the PCAOB. A review of interim financial information consists principally of applying analytical procedures and making inquiries of persons responsible for financial and accounting matters. It is substantially less in scope than an audit conducted in accordance with the standards of the Public Company Accounting Oversight Board (United States),PCAOB, the objective of which is the expression of an opinion regarding the financial statements taken as a whole. Accordingly, we do not express such an opinion.
/s/ PricewaterhouseCoopers LLP
Florham Park, New Jersey
August 4, 2021
Report of Independent Registered Public Accounting Firm
To the Board of Directors and Stockholder of Realogy Group LLC
Results of Review of Interim Financial Statements
We have reviewed the accompanying condensed consolidated balance sheet of Realogy Group LLC and its subsidiaries (the "Company") as of June 30, 2021, and the related condensed consolidated statements of operations and comprehensive income (loss) for the three-month and six-month periods ended June 30, 2021 and 2020, and of cash flows for the six-month periods ended June 30, 2021 and 2020, including the related notes (collectively referred to as the "interim financial statements"). Based on our review,reviews, we are not aware of any material modifications that should be made to the accompanying condensed consolidated interim financial informationstatements for itthem to be in conformity with accounting principles generally accepted in the United States of America.
We have previously audited, in accordance with the standards of the Public Company Accounting Oversight Board (United States), and in accordance with auditing standards generally accepted in the United States of America, the consolidated balance sheet of the Company as of December 31, 2016,2020, and the related consolidated statements of operations, comprehensive (loss) income, equity, and of cash flows for the year then ended (not presented herein), and in our report dated February 24, 2017,23, 2021, which included a paragraph describing a change in the manner of accounting for leases in the 2019 financial statements, we expressed an unqualified opinion on those consolidated financial statements. In our opinion, the information set forth in the accompanying condensed consolidated balance sheet information as of December 31, 2016,2020, is fairly stated, in all material respects, in relation to the consolidated balance sheet from which it has been derived.
Basis for Review Results
/s/ PricewaterhouseCoopers LLP
Florham Park, NJ
November 3, 2017
REPORT OF INDEPENDENT REGISTERED PUBLIC ACCOUNTING FIRM
To the Board of Directors and Stockholder of Realogy Group LLC:
We have reviewed the accompanying condensed consolidated balance sheet of Realogy Group LLC and its subsidiaries as of September 30, 2017, and the related condensed consolidated statements of operations and comprehensive income for the three-month and nine-month periods ended September 30, 2017 and 2016 and the condensed consolidated statement of cash flows for the nine-month periods ended September 30, 2017 and 2016. These interim financial statements are the responsibility of the Company's management.
We are a public accounting firm registered with the Public Company Accounting Oversight Board (United States) (PCAOB) and are required to be independent with respect to the Company in accordance with the U.S. federal securities laws and the applicable rules and regulations of the Securities and Exchange Commission and the PCAOB. We conducted our reviewreviews in accordance with the standards of the Public Company Accounting Oversight Board (United States)PCAOB and in accordance with auditing standards generally accepted in the United States of America applicable to reviews of interim financial information. A review of interim financial information consists principally of applying analytical procedures and making inquiries of persons responsible for financial and accounting matters. It is substantially less in scope than an audit conducted in accordance with the standards of the Public Company Accounting Oversight Board (United States)PCAOB or in accordance with auditing standards generally accepted in the United States of America, the objective of which is the expression of an opinion regarding the financial statements taken as a whole. Accordingly, we do not express such an opinion.
Based on our review, we are not aware of any material modifications that should be made to the accompanying condensed consolidated interim financial information for it to be in conformity with accounting principles generally accepted in the United States of America.
We previously audited, in accordance with the standards of the Public Company Accounting Oversight Board (United States) and in accordance with auditing standards generally accepted in the United States of America, the consolidated balance sheet as of December 31, 2016, and the related consolidated statements of operations, comprehensive income, equity, and of cash flows for the year then ended (not presented herein), and in our report dated February 24, 2017, we expressed an unqualified opinion on those consolidated financial statements. In our opinion, the information set forth in the accompanying condensed consolidated balance sheet information as of December 31, 2016, is fairly stated in all material respects in relation to the consolidated balance sheet from which it has been derived.
/s/ PricewaterhouseCoopers LLP
Florham Park, NJNew Jersey
November 3, 2017August 4, 2021
REALOGY HOLDINGS CORP. AND REALOGY GROUP LLC
CONDENSED CONSOLIDATED STATEMENTS OF OPERATIONS
(In millions, except per share data)
(Unaudited) | | | | | | | | | | | | | | | | | | | | | | | |
| Three Months Ended | | Six Months Ended |
| | June 30, | | June 30, |
| | 2021 | | 2020 | | 2021 | | 2020 |
| Revenues | | | | | | | |
| Gross commission income | $ | 1,773 | | | $ | 919 | | | $ | 2,927 | | | $ | 1,769 | |
| Service revenue | 314 | | | 219 | | | 563 | | | 421 | |
| Franchise fees | 147 | | | 85 | | | 252 | | | 156 | |
| Other | 42 | | | 32 | | | 81 | | | 77 | |
| Net revenues | 2,276 | | | 1,255 | | | 3,823 | | | 2,423 | |
| Expenses | | | | | | | |
| Commission and other agent-related costs | 1,373 | | | 685 | | | 2,258 | | | 1,315 | |
| Operating | 422 | | | 320 | | | 806 | | | 688 | |
| Marketing | 66 | | | 41 | | | 124 | | | 100 | |
| General and administrative | 114 | | | 69 | | | 204 | | | 157 | |
| Former parent legacy cost, net | 1 | | | 0 | | | 1 | | | 0 | |
| Restructuring costs, net | 5 | | | 18 | | | 10 | | | 30 | |
| Impairments | 1 | | | 63 | | | 2 | | | 540 | |
| Depreciation and amortization | 51 | | | 46 | | | 102 | | | 91 | |
| Interest expense, net | 57 | | | 59 | | | 95 | | | 160 | |
| Loss on the early extinguishment of debt | 1 | | | 8 | | | 18 | | | 8 | |
| Other income, net | (16) | | | 0 | | | (18) | | | 0 | |
| Total expenses | 2,075 | | | 1,309 | | | 3,602 | | | 3,089 | |
| Income (loss) before income taxes, equity in earnings and noncontrolling interests | 201 | | | (54) | | | 221 | | | (666) | |
| Income tax expense (benefit) | 60 | | | (5) | | | 77 | | | (146) | |
| Equity in earnings of unconsolidated entities | (10) | | | (36) | | | (41) | | | (45) | |
| Net income (loss) | 151 | | | (13) | | | 185 | | | (475) | |
| Less: Net income attributable to noncontrolling interests | (2) | | | (1) | | | (3) | | | (1) | |
| Net income (loss) attributable to Realogy Holdings and Realogy Group | $ | 149 | | | $ | (14) | | | $ | 182 | | | $ | (476) | |
| | | | | | | |
| Earnings (loss) per share attributable to Realogy Holdings shareholders: |
| Basic earnings (loss) per share | $ | 1.28 | | | $ | (0.12) | | | $ | 1.57 | | | $ | (4.14) | |
| Diluted earnings (loss) per share | $ | 1.25 | | | $ | (0.12) | | | $ | 1.52 | | | $ | (4.14) | |
| Weighted average common and common equivalent shares of Realogy Holdings outstanding: |
| Basic | 116.5 | | | 115.4 | | | 116.2 | | | 115.0 | |
| Diluted | 119.3 | | | 115.4 | | | 119.4 | | | 115.0 | |
|
| | | | | | | | | | | | | | | |
| | Three Months Ended | | Nine Months Ended |
| | September 30, | | September 30, |
| | 2017 | | 2016 | | 2017 | | 2016 |
| Revenues | | | | | | | |
| Gross commission income | $ | 1,250 |
| | $ | 1,211 |
| | $ | 3,505 |
| | $ | 3,288 |
|
| Service revenue | 261 |
| | 273 |
| | 710 |
| | 715 |
|
| Franchise fees | 111 |
| | 107 |
| | 296 |
| | 280 |
|
| Other | 52 |
| | 53 |
| | 159 |
| | 157 |
|
| Net revenues | 1,674 |
| | 1,644 |
| | 4,670 |
| | 4,440 |
|
| Expenses | | | | | | | |
| Commission and other agent-related costs | 887 |
| | 834 |
| | 2,462 |
| | 2,256 |
|
| Operating | 394 |
| | 400 |
| | 1,162 |
| | 1,158 |
|
| Marketing | 63 |
| | 58 |
| | 195 |
| | 181 |
|
| General and administrative | 82 |
| | 78 |
| | 269 |
| | 234 |
|
| Former parent legacy cost (benefit), net | 1 |
| | — |
| | (10 | ) | | 1 |
|
| Restructuring costs | 2 |
| | 9 |
| | 9 |
| | 30 |
|
| Depreciation and amortization | 50 |
| | 53 |
| | 149 |
| | 149 |
|
| Interest expense, net | 41 |
| | 37 |
| | 127 |
| | 169 |
|
| Loss on the early extinguishment of debt | 1 |
| | — |
| | 5 |
| | — |
|
| Other income, net | — |
| | (1 | ) | | — |
| | (1 | ) |
| Total expenses | 1,521 |
| | 1,468 |
| | 4,368 |
| | 4,177 |
|
| Income before income taxes, equity in earnings and noncontrolling interests | 153 |
| | 176 |
| | 302 |
| | 263 |
|
| Income tax expense | 67 |
| | 74 |
| | 131 |
| | 114 |
|
| Equity in earnings of unconsolidated entities | (10 | ) | | (5 | ) | | (7 | ) | | (10 | ) |
| Net income | 96 |
| | 107 |
| | 178 |
| | 159 |
|
| Less: Net income attributable to noncontrolling interests | (1 | ) | | (1 | ) | | (2 | ) | | (3 | ) |
| Net income attributable to Realogy Holdings and Realogy Group | $ | 95 |
| | $ | 106 |
| | $ | 176 |
| | $ | 156 |
|
| | | | | | | | |
| Earnings per share attributable to Realogy Holdings: | | | | | | | |
| Basic earnings per share | $ | 0.70 |
| | $ | 0.74 |
| | $ | 1.28 |
| | $ | 1.07 |
|
| Diluted earnings per share | $ | 0.69 |
| | $ | 0.73 |
| | $ | 1.26 |
| | $ | 1.06 |
|
| Weighted average common and common equivalent shares of Realogy Holdings outstanding: |
| Basic | 136.1 |
| | 144.0 |
| | 137.8 |
| | 145.4 |
|
| Diluted | 138.1 |
| | 145.1 |
| | 139.4 |
| | 146.6 |
|
| | | | | | | | |
| Cash dividends declared per share (beginning in August 2016) | $ | 0.09 |
| | $ | 0.09 |
| | $ | 0.27 |
| | $ | 0.09 |
|
See Notes to Condensed Consolidated Financial Statements.
6
REALOGY HOLDINGS CORP. AND REALOGY GROUP LLC
CONDENSED CONSOLIDATED STATEMENTS OF COMPREHENSIVE INCOME (LOSS)
(In millions)
(Unaudited) | | | | | | | | | | | | | | | | | | | | | | | |
| Three Months Ended | | Six Months Ended |
| June 30, | | June 30, |
| 2021 | | 2020 | | 2021 | | 2020 |
| Net income (loss) | $ | 151 | | | $ | (13) | | | $ | 185 | | | $ | (475) | |
| Currency translation adjustment | 0 | | | 1 | | | (1) | | | (1) | |
| Defined benefit pension plan—amortization of actuarial loss to periodic pension cost | 1 | | | 0 | | | 2 | | | 1 | |
| Other comprehensive income, before tax | 1 | | | 1 | | | 1 | | | 0 | |
| Income tax expense (benefit) related to items of other comprehensive income amounts | 0 | | | 0 | | | 0 | | | 0 | |
| Other comprehensive income, net of tax | 1 | | | 1 | | | 1 | | | 0 | |
| Comprehensive income (loss) | 152 | | | (12) | | | 186 | | | (475) | |
| Less: comprehensive income attributable to noncontrolling interests | (2) | | | (1) | | | (3) | | | (1) | |
| Comprehensive income (loss) attributable to Realogy Holdings and Realogy Group | $ | 150 | | | $ | (13) | | | $ | 183 | | | $ | (476) | |
|
| | | | | | | | | | | | | | | |
| | Three Months Ended | | Nine Months Ended |
| | September 30, | | September 30, |
| | 2017 | | 2016 | | 2017 | | 2016 |
| Net income | $ | 96 |
| | $ | 107 |
| | $ | 178 |
| | $ | 159 |
|
| Currency translation adjustment | 1 |
| | — |
| | 3 |
| | (3 | ) |
| Defined benefit pension plan - amortization of actuarial loss to periodic pension cost | 1 |
| | — |
| | 1 |
| | 1 |
|
| Other comprehensive income (loss), before tax | 2 |
| | — |
| | 4 |
| | (2 | ) |
| Income tax expense related to items of other comprehensive income | 1 |
| | 1 |
| | 1 |
| | 1 |
|
| Other comprehensive income (loss), net of tax | 1 |
| | (1 | ) | | 3 |
| | (3 | ) |
| Comprehensive income | 97 |
| | 106 |
| | 181 |
| | 156 |
|
| Less: comprehensive income attributable to noncontrolling interests | (1 | ) | | (1 | ) | | (2 | ) | | (3 | ) |
| Comprehensive income attributable to Realogy Holdings and Realogy Group | $ | 96 |
| | $ | 105 |
| | $ | 179 |
| | $ | 153 |
|
See Notes to Condensed Consolidated Financial Statements.
7
REALOGY HOLDINGS CORP. AND REALOGY GROUP LLC
CONDENSED CONSOLIDATED BALANCE SHEETS
(In millions, except share data)
(Unaudited) | | | | | | | | | | | |
| | June 30,
2021 | | December 31, 2020 |
| | |
| ASSETS | | | |
| Current assets: | | | |
| Cash and cash equivalents | $ | 859 | | | $ | 520 | |
| Restricted cash | 7 | | | 3 | |
| Trade receivables (net of allowance for doubtful accounts of $11 and $13) | 145 | | | 128 | |
| Relocation receivables | 206 | | | 139 | |
| Other current assets | 207 | | | 154 | |
| Total current assets | 1,424 | | | 944 | |
| Property and equipment, net | 304 | | | 317 | |
| Operating lease assets, net | 453 | | | 450 | |
| Goodwill | 2,899 | | | 2,910 | |
| Trademarks | 685 | | | 685 | |
| Franchise agreements, net | 1,054 | | | 1,088 | |
| Other intangibles, net | 181 | | | 188 | |
| Other non-current assets | 407 | | | 352 | |
| Total assets | $ | 7,407 | | | $ | 6,934 | |
| LIABILITIES AND EQUITY | | | |
| Current liabilities: | | | |
| Accounts payable | $ | 124 | | | $ | 128 | |
| Securitization obligations | 147 | | | 106 | |
| Current portion of long-term debt | 18 | | | 62 | |
| Current portion of operating lease liabilities | 125 | | | 129 | |
| Accrued expenses and other current liabilities | 565 | | | 600 | |
| Total current liabilities | 979 | | | 1,025 | |
| Long-term debt | 3,357 | | | 3,145 | |
| Long-term operating lease liabilities | 428 | | | 430 | |
| Deferred income taxes | 343 | | | 276 | |
| Other non-current liabilities | 294 | | | 291 | |
| Total liabilities | 5,401 | | | 5,167 | |
| Commitments and contingencies (Note 8) | | | |
| Equity: | | | |
| Realogy Holdings preferred stock: $0.01 par value; 50,000,000 shares authorized, NaN issued and outstanding at June 30, 2021 and December 31, 2020 | 0 | | | 0 | |
| Realogy Holdings common stock: $0.01 par value; 400,000,000 shares authorized, 116,566,078 shares issued and outstanding at June 30, 2021 and 115,457,067 shares issued and outstanding at December 31, 2020 | 1 | | | 1 | |
| Additional paid-in capital | 4,932 | | | 4,876 | |
| Accumulated deficit | (2,873) | | | (3,055) | |
| Accumulated other comprehensive loss | (58) | | | (59) | |
| Total stockholders' equity | 2,002 | | | 1,763 | |
| Noncontrolling interests | 4 | | | 4 | |
| Total equity | 2,006 | | | 1,767 | |
| Total liabilities and equity | $ | 7,407 | | | $ | 6,934 | |
|
| | | | | | | |
| | September 30,
2017 | | December 31,
2016 |
| | |
| ASSETS | | | |
| Current assets: | | | |
| Cash and cash equivalents | $ | 348 |
| | $ | 274 |
|
| Trade receivables (net of allowance for doubtful accounts of $10 and $13) | 166 |
| | 152 |
|
| Relocation receivables | 275 |
| | 244 |
|
| Other current assets | 153 |
| | 148 |
|
| Total current assets | 942 |
| | 818 |
|
| Property and equipment, net | 272 |
| | 267 |
|
| Goodwill | 3,704 |
| | 3,690 |
|
| Trademarks | 748 |
| | 748 |
|
| Franchise agreements, net | 1,311 |
| | 1,361 |
|
| Other intangibles, net | 291 |
| | 313 |
|
| Other non-current assets | 253 |
| | 224 |
|
| Total assets | $ | 7,521 |
| | $ | 7,421 |
|
| LIABILITIES AND EQUITY | | | |
| Current liabilities: | | | |
| Accounts payable | $ | 152 |
| | $ | 140 |
|
| Securitization obligations | 234 |
| | 205 |
|
| Due to former parent | 18 |
| | 28 |
|
| Current portion of long-term debt | 242 |
| | 242 |
|
| Accrued expenses and other current liabilities | 442 |
| | 435 |
|
| Total current liabilities | 1,088 |
| | 1,050 |
|
| Long-term debt | 3,234 |
| | 3,265 |
|
| Deferred income taxes | 518 |
| | 389 |
|
| Other non-current liabilities | 216 |
| | 248 |
|
| Total liabilities | 5,056 |
| | 4,952 |
|
| Commitments and contingencies (Note 9) | | | |
| Equity: | | | |
| Realogy Holdings preferred stock: $.01 par value; 50,000,000 shares authorized, none issued and outstanding at September 30, 2017 and December 31, 2016 | — |
| | — |
|
| Realogy Holdings common stock: $.01 par value; 400,000,000 shares authorized, 135,180,292 shares issued and outstanding at September 30, 2017 and 140,227,692 shares issued and outstanding at December 31, 2016 | 1 |
| | 1 |
|
| Additional paid-in capital | 5,383 |
| | 5,565 |
|
| Accumulated deficit | (2,886 | ) | | (3,062 | ) |
| Accumulated other comprehensive loss | (37 | ) | | (40 | ) |
| Total stockholders' equity | 2,461 |
| | 2,464 |
|
| Noncontrolling interests | 4 |
| | 5 |
|
| Total equity | 2,465 |
| | 2,469 |
|
| Total liabilities and equity | $ | 7,521 |
| | $ | 7,421 |
|
See Notes to Condensed Consolidated Financial Statements.
8
REALOGY HOLDINGS CORP. AND REALOGY GROUP LLC
CONDENSED CONSOLIDATED STATEMENTS OF CASH FLOWS
(In millions)
(Unaudited) | | | | | | | | | | | |
| | Six Months Ended
June 30, |
| | 2021 | | 2020 |
| Operating Activities | | | |
| Net income (loss) | $ | 185 | | | $ | (475) | |
| Adjustments to reconcile net income (loss) to net cash provided by operating activities: | | |
| Depreciation and amortization | 102 | | | 91 | |
| Deferred income taxes | 65 | | | (141) | |
| Impairments | 2 | | | 540 | |
| Amortization of deferred financing costs and debt discount (premium) | 6 | | | 5 | |
| Loss on the early extinguishment of debt | 18 | | | 8 | |
| Gain on the sale of a business | (15) | | | 0 | |
| Equity in earnings of unconsolidated entities | (41) | | | (45) | |
| Stock-based compensation | 14 | | | 10 | |
| Mark-to-market adjustments on derivatives | (7) | | | 59 | |
| Other adjustments to net income (loss) | (2) | | | 0 | |
| Net change in assets and liabilities, excluding the impact of acquisitions and dispositions: | | | |
| Trade receivables | (14) | | | (3) | |
| Relocation receivables | (67) | | | 11 | |
| Other assets | (14) | | | (8) | |
| Accounts payable, accrued expenses and other liabilities | (63) | | | (29) | |
| Dividends received from unconsolidated entities | 38 | | | 22 | |
| Other, net | (21) | | | (12) | |
| Net cash provided by operating activities | 186 | | | 33 | |
| Investing Activities | | | |
| Property and equipment additions | (50) | | | (49) | |
| Proceeds from the sale of business | 15 | | | 0 | |
| Investment in unconsolidated entities | (7) | | | (2) | |
| Other, net | (9) | | | (12) | |
| Net cash used in investing activities | (51) | | | (63) | |
| Financing Activities | | | |
| Net change in Revolving Credit Facility | 0 | | | 625 | |
| Payments for refinancing of Term Loan A Facility and Term Loan B Facility | (1,055) | | | 0 | |
| Proceeds from issuance of Senior Notes | 905 | | | 0 | |
| Proceeds from issuance of Senior Secured Second Lien Notes | 0 | | | 550 | |
| Redemption of Senior Notes | 0 | | | (550) | |
| Proceeds from issuance of Exchangeable Senior Notes | 403 | | | 0 | |
| Payments for purchase of Exchangeable Senior Notes hedge transactions | (67) | | | 0 | |
| Proceeds from issuance of Exchangeable Senior Notes warrant transactions | 46 | | | 0 | |
| Amortization payments on term loan facilities | (6) | | | (19) | |
| Net change in securitization obligations | 40 | | | (92) | |
| Debt issuance costs | (20) | | | (8) | |
| Cash paid for fees associated with early extinguishment of debt | (11) | | | (7) | |
| Taxes paid related to net share settlement for stock-based compensation | (9) | | | (5) | |
| Other, net | (18) | | | (26) | |
| Net cash provided by financing activities | 208 | | | 468 | |
| Effect of changes in exchange rates on cash, cash equivalents and restricted cash | 0 | | | 0 | |
| Net increase in cash, cash equivalents and restricted cash | 343 | | | 438 | |
| Cash, cash equivalents and restricted cash, beginning of period | 523 | | | 266 | |
| Cash, cash equivalents and restricted cash, end of period | $ | 866 | | | $ | 704 | |
| | | |
| Supplemental Disclosure of Cash Flow Information | | | |
| Interest payments (including securitization interest of $2 and $3 respectively) | $ | 83 | | | $ | 105 | |
| Income tax payments, net | 13 | | | 0 | |
|
| | | | | | | |
| | Nine Months Ended
September 30, |
| | 2017 | | 2016 |
| Operating Activities | | | |
| Net income | $ | 178 |
| | $ | 159 |
|
| Adjustments to reconcile net income to net cash provided by operating activities: | | | |
| Depreciation and amortization | 149 |
| | 149 |
|
| Deferred income taxes | 129 |
| | 98 |
|
| Amortization of deferred financing costs and discount | 12 |
| | 12 |
|
| Noncash portion of loss on early extinguishment of debt | 4 |
| | — |
|
| Equity in earnings of unconsolidated entities | (7 | ) | | (10 | ) |
| Stock-based compensation | 38 |
| | 39 |
|
| Mark-to-market adjustments on derivatives | 6 |
| | 39 |
|
| Other adjustments to net income | (2 | ) | | (4 | ) |
| Net change in assets and liabilities, excluding the impact of acquisitions and dispositions: | | | |
| Trade receivables | (13 | ) | | (29 | ) |
| Relocation receivables | (30 | ) | | (14 | ) |
| Other assets | (33 | ) | | (20 | ) |
| Accounts payable, accrued expenses and other liabilities | 10 |
| | (5 | ) |
| Due to former parent | (10 | ) | | 1 |
|
| Dividends received from unconsolidated entities | 24 |
| | 5 |
|
| Other, net | (11 | ) | | (9 | ) |
| Net cash provided by operating activities | 444 |
| | 411 |
|
| Investing Activities | | | |
| Property and equipment additions | (69 | ) | | (61 | ) |
| Payments for acquisitions, net of cash acquired | (13 | ) | | (95 | ) |
| Investment in unconsolidated entities | (34 | ) | | — |
|
| Change in restricted cash | 3 |
| | (2 | ) |
| Other, net | 17 |
| | (5 | ) |
| Net cash used in investing activities | (96 | ) | | (163 | ) |
| Financing Activities | | | |
| Net change in revolving credit facility | (10 | ) | | (45 | ) |
| Proceeds from issuance of Term Loan A-1 | — |
| | 355 |
|
| Repayment of amended Term Loan B facility | — |
| | (758 | ) |
| Amortization payments on term loan facilities | (31 | ) | | (31 | ) |
| Proceeds from issuance of Senior Notes | — |
| | 750 |
|
| Redemption of Senior Notes | — |
| | (500 | ) |
| Net change in securitization obligations | 29 |
| | 9 |
|
| Debt issuance costs | (6 | ) | | (15 | ) |
| Repurchase of common stock | (180 | ) | | (134 | ) |
| Dividends paid on common stock | (37 | ) | | (13 | ) |
| Proceeds from exercise of stock options | 7 |
| | 1 |
|
| Taxes paid related to net share settlement for stock-based compensation | (11 | ) | | (6 | ) |
| Payments of contingent consideration related to acquisitions | (18 | ) | | (23 | ) |
| Other, net | (19 | ) | | (28 | ) |
| Net cash used in financing activities | (276 | ) | | (438 | ) |
| Effect of changes in exchange rates on cash and cash equivalents | 2 |
| | (1 | ) |
| Net increase (decrease) in cash and cash equivalents | 74 |
| | (191 | ) |
| Cash and cash equivalents, beginning of period | 274 |
| | 415 |
|
| Cash and cash equivalents, end of period | $ | 348 |
| | $ | 224 |
|
| Supplemental Disclosure of Cash Flow Information | | | |
| Interest payments (including securitization interest of $5 for both periods presented) | $ | 111 |
| | $ | 117 |
|
| Income tax payments, net | 10 |
| | 13 |
|
See Notes to Condensed Consolidated Financial Statements.
9
REALOGY HOLDINGS CORP. AND REALOGY GROUP LLC
NOTES TO CONDENSED CONSOLIDATED FINANCIAL STATEMENTS
(Unless otherwise noted, all amounts are in millions)
(Unaudited)
1. BASIS OF PRESENTATION
Realogy Holdings Corp. ("Realogy Holdings", "Realogy" or the "Company") is a holding company for its consolidated subsidiaries including Realogy Intermediate Holdings LLC ("Realogy Intermediate") and Realogy Group LLC ("Realogy Group") and its consolidated subsidiaries. Realogy, through its subsidiaries, is a global provider of residential real estate services. Neither Realogy Holdings, the indirect parent of Realogy Group, nor Realogy Intermediate, the direct parent company of Realogy Group, conducts any operations other than with respect to its respective direct or indirect ownership of Realogy Group. As a result, the consolidated financial positions, results of operations, comprehensive income (loss) and cash flows of Realogy Holdings, Realogy Intermediate and Realogy Group are the same.
The accompanying Condensed Consolidated Financial Statements include the financial statements of Realogy Holdings and Realogy Group. Realogy Holdings' only asset is its investment in the common stock of Realogy Intermediate, and Realogy Intermediate's only asset is its investment in Realogy Group. Realogy Holdings' only obligations are its guarantees of certain borrowings and certain franchise obligations of Realogy Group. All expenses incurred by Realogy Holdings and Realogy Intermediate are for the benefit of Realogy Group and have been reflected in Realogy Group's Condensed Consolidated Financial Statements.
The Condensed Consolidated Financial Statements have been prepared in accordance with accounting principles generally accepted in the United States of America and with Article 10 of Regulation S-X. Interim results may not be indicative of full year performance because of seasonal and short-term variations. The Company has eliminated all material intercompany transactions and balances between entities consolidated in these financial statements. In presenting the Condensed Consolidated Financial Statements, management makes estimates and assumptions that affect the amounts reported and the related disclosures. Estimates, by their nature, are based on judgment and available information. Accordingly, actual results could differ materially from those estimates.
In management's opinion, the accompanying unaudited Condensed Consolidated Financial Statements reflect all normal and recurring adjustments necessary for a fair statement of Realogy Holdings and Realogy Group's financial position as of SeptemberJune 30, 20172021 and the results of operations and comprehensive income (loss) for the three and ninesix months ended SeptemberJune 30, 20172021 and 20162020 and cash flows for the ninesix months ended SeptemberJune 30, 20172021 and 2016.2020. The Consolidated Balance Sheet at December 31, 20162020 was derived from audited annual financial statements but does not contain all of the footnote disclosures from the annual financial statements. The Condensed Consolidated Financial Statements should be read in conjunction with the audited Consolidated Financial Statements and notes thereto included in the Annual Report on Form 10-K for the year ended December 31, 2016.2020.
Fair Value Measurements
The following tables present the Company’s assets and liabilities that are measured at fair value on a recurring basis and are categorized using the fair value hierarchy. The fair value hierarchy has three levels based on the reliability of the inputs used to determine fair value.
| | | | | | | | |
| Level Input: | | Input Definitions: |
| | |
Level Input: | | Input Definitions: |
| | |
Level I | | Inputs are unadjusted, quoted prices for identical assets or liabilities in active markets at the measurement date. |
| |
| Level II | | Inputs other than quoted prices included in Level I that are observable for the asset or liability through corroboration with market data at the measurement date. |
| |
| Level III | | Unobservable inputs that reflect management’s best estimate of what market participants would use in pricing the asset or liability at the measurement date. |
The availability of observable inputs can vary from asset to asset and is affected by a wide variety of factors, including, for example, the type of asset, whether the asset is new and not yet established in the marketplace, and other characteristics particular to the transaction. To the extent that valuation is based on models or inputs that are less observable or unobservable in the market, the determination of fair value requires more judgment. Accordingly, the degree of judgment
exercised by the Company in determining fair value is greatest for instruments categorized in Level III. In certain cases, the
inputs used to measure fair value may fall into different levels of the fair value hierarchy. In such cases, for disclosure purposes, the level in the fair value hierarchy within which the fair value measurement in its entirety falls is determined based on the lowest level input that is significant to the fair value measurement in its entirety.
The fair value of financial instruments is generally determined by reference to quoted market values. In cases where quoted market prices are not available, fair value is based on estimates using present value or other valuation techniques, as appropriate. The fair value of interest rate swaps is determined based upon a discounted cash flow approach.
The Company measures financial instruments at fair value on a recurring basis and recognizes transfers within the fair value hierarchy at the end of the fiscal quarter in which the change in circumstances that caused the transfer occurred.
The following table summarizes fair value measurements by level at SeptemberJune 30, 20172021 for assets and liabilities measured at fair value on a recurring basis: | | | | | | | | | | | | | | | | | | | | | | | |
| Level I | | Level II | | Level III | | Total |
| Deferred compensation plan assets (included in other non-current assets) | $ | 1 | | | $ | 0 | | | $ | 0 | | | $ | 1 | |
| Interest rate swaps (included in other non-current liabilities) | 0 | | | 63 | | | 0 | | | 63 | |
| Contingent consideration for acquisitions (included in accrued expenses and other current liabilities and other non-current liabilities) | 0 | | | 0 | | | 3 | | | 3 | |
|
| | | | | | | | | | | | | | | |
| | Level I | | Level II | | Level III | | Total |
| Interest rate swaps (included in other current and non-current liabilities) | $ | — |
| | $ | 24 |
| | $ | — |
| | $ | 24 |
|
| Deferred compensation plan assets (included in other non-current assets) | 3 |
| | — |
| | — |
| | 3 |
|
| Contingent consideration for acquisitions (included in accrued expenses and other current liabilities and non-current liabilities) | — |
| | — |
| | 33 |
| | 33 |
|
The following table summarizes fair value measurements by level at December 31, 20162020 for assets and liabilities measured at fair value on a recurring basis:
|
| | | | | | | | | | | | | | | |
| | Level I | | Level II | | Level III | | Total |
| Interest rate swaps (included in other non-current liabilities) | $ | — |
| | $ | 33 |
| | $ | — |
| | $ | 33 |
|
| Deferred compensation plan assets (included in other non-current assets) | 3 |
| | — |
| | — |
| | 3 |
|
| Contingent consideration for acquisitions (included in accrued expenses and other current liabilities and non-current liabilities) | — |
| | — |
| | 50 |
| | 50 |
|
| | | | | | | | | | | | | | | | | | | | | | | |
| Level I | | Level II | | Level III | | Total |
| Deferred compensation plan assets (included in other non-current assets) | $ | 1 | | | $ | 0 | | | $ | 0 | | | $ | 1 | |
| Interest rate swaps (included in other non-current liabilities) | 0 | | | 81 | | | 0 | | | 81 | |
| Contingent consideration for acquisitions (included in accrued expenses and other current liabilities and other non-current liabilities) | 0 | | | 0 | | | 3 | | | 3 | |
The fair value of the Company’s contingent consideration for acquisitions is measured using a probability weighted-average discount rate to estimate future cash flows based upon the likelihood of achieving future operating results for individual acquisitions. These assumptions are deemed to be unobservable inputs and as such the Company’s contingent consideration is classified within Level III of the valuation hierarchy. The Company reassesses the fair value of the contingent consideration liabilities on a quarterly basis.
The following table presents changes in Level III financial liabilities measured at fair value on a recurring basis:
|
| | | | |
| | | Level III |
| Fair value of contingent consideration at December 31, 2016 | | $ | 50 |
|
| Additions: contingent consideration related to acquisitions completed during the period | | 3 |
|
| Reductions: payments of contingent consideration (reflected in the financing section of the Consolidated Statement of Cash Flows) | | (18 | ) |
| Changes in fair value (reflected in the Consolidated Statement of Operations) | | (2 | ) |
| Fair value of contingent consideration at September 30, 2017 | | $ | 33 |
|
| | | | | | | | |
| | Level III |
| Fair value of contingent consideration at December 31, 2020 | | $ | 3 | |
| Additions: contingent consideration related to acquisitions completed during the period | | 1 | |
| Reductions: payments of contingent consideration | | (1) | |
| Changes in fair value (reflected in general and administrative expenses) | | 0 | |
| Fair value of contingent consideration at June 30, 2021 | | $ | 3 | |
The following table summarizes the principal amount of the Company’s indebtedness compared to the estimated fair value, primarily determined by quoted market values, at:
|
| | | | | | | | | | | | | | | |
| | September 30, 2017 | | December 31, 2016 |
| Debt | Principal Amount | | Estimated
Fair Value (a) | | Principal Amount | | Estimated
Fair Value (a) |
| Senior Secured Credit Facility: | | | | | | | |
| Revolving Credit Facility | $ | 190 |
| | $ | 190 |
| | $ | 200 |
| | $ | 200 |
|
| Term Loan B | 1,086 |
| | 1,092 |
| | 1,094 |
| | 1,100 |
|
| Term Loan A Facility: | | | | | | | |
| Term Loan A | 397 |
| | 398 |
| | 413 |
| | 414 |
|
| Term Loan A-1 | 344 |
| | 345 |
| | 351 |
| | 351 |
|
| 4.50% Senior Notes | 450 |
| | 462 |
| | 450 |
| | 461 |
|
| 5.25% Senior Notes | 550 |
| | 573 |
| | 550 |
| | 562 |
|
| 4.875% Senior Notes | 500 |
| | 514 |
| | 500 |
| | 483 |
|
| Securitization obligations | 234 |
| | 234 |
| | 205 |
| | 205 |
|
| | | | | | | | | | | | | | | | | | | | | | | |
| | June 30, 2021 | | December 31, 2020 |
| Debt | Principal Amount | | Estimated
Fair Value (a) | | Principal Amount | | Estimated
Fair Value (a) |
| Senior Secured Credit Facility: | | | | | | | |
| Non-extended Revolving Credit Commitment | $ | 0 | | | $ | 0 | | | $ | 0 | | | $ | 0 | |
| Extended Revolving Credit Commitment | 0 | | | 0 | | | 0 | | | 0 | |
| Term Loan B | 237 | | | 237 | | | 1,048 | | | 1,032 | |
| Term Loan A Facility: | | | | | | | |
| Non-extended Term Loan A | 197 | | | 189 | | | 684 | | | 671 | |
| Extended Term Loan A | 236 | | | 227 | | | 0 | | | 0 | |
| 7.625% Senior Secured Second Lien Notes | 550 | | | 597 | | | 550 | | | 595 | |
| 4.875% Senior Notes | 407 | | | 424 | | | 407 | | | 415 | |
| 9.375% Senior Notes | 550 | | | 611 | | | 550 | | | 609 | |
| 5.75% Senior Notes | 900 | | | 941 | | | 0 | | | 0 | |
| 0.25% Exchangeable Senior Notes | 403 | | | 409 | | | 0 | | | 0 | |
_______________
| |
(a) | The fair value of the Company's indebtedness is categorized as Level II. |
Investment in Mortgage Origination Ventures(a)The fair value of the Company's indebtedness is categorized as Level II.
Equity Method Investments
At June 30, 2021 and December 31, 2020, the Company had various equity method investments which are recorded within other non-current assets on the accompanying Condensed Consolidated Balance Sheets.
The Company owns 49.9% of PHH Home Loans, a mortgage origination venture formedCompany's investment in 2005 created for the purpose of originating and selling mortgage loans primarily sourced through the Company’s real estate brokerage and relocation businesses. PHH Corporation ("PHH") owns the remaining percentage. On February 15, 2017, Realogy announced that it and Guaranteed Rate, Inc. (“Guaranteed Rate”) agreed to form a new mortgage origination venture, Guaranteed Rate Affinity, LLC ("Guaranteed Rate Affinity"), which began doing business in August 2017. Guaranteed Rate owns a controlling 50.1% stake at Realogy Title Group had investment balances of Guaranteed Rate Affinity while Realogy owns 49.9%. Guaranteed Rate has responsibility for the oversight of the officers$92 million and senior employees of Guaranteed Rate Affinity who are designated to manage Guaranteed Rate Affinity.
In accordance with the asset purchase agreement, Guaranteed Rate Affinity is acquiring certain assets of the mortgage operations of PHH Home Loans, including its four regional centers and employees across the United States, but not its mortgage assets. The asset purchase agreement and the movement of employees from the existing joint venture to the new joint venture is expected to be completed in a series of five phases. The first two phases were completed in the third quarter of 2017 and in October the third phase was completed. The remaining two phases are expected to be completed in the fourth quarter of 2017. While the equity earnings related to PHH Home Loans are included in the financial results of the Company Owned Real Estate Brokerage Services segment, the equity earnings related to Guaranteed Rate Affinity are included in the financial results of the Title and Settlement Services segment.
At September$90 million at June 30, 20172021 and December 31, 2016, the Company had various equity method investments aggregating $85 million and $66 million,2020, respectively. The Company's investment in PHH Home Loans was $46 million at September 30, 2017 and $59 million at December 31, 2016. The Company's investment in Guaranteed Rate Affinity was $31 million at September 30, 2017.
For the third quarter of 2017,three months ended June 30, 2021 and 2020, the Company recorded equity earnings of $10$8 million which consisted of $14and $35 million, of earnings from the sale of the first two phases of PHH Home Loans' assetsrespectively, related to its investment in Guaranteed Rate Affinity, partially offset by $2 million of exit costs. In addition, there was a $2 million loss from equity method investments at the Title and Settlement Services segment primarily related to costs associated with the start up of operations of Guaranteed Rate Affinity, including $1 million of amortization of intangible assets recorded in purchase accounting.Affinity. For the third quarter of 2016,six months ended June 30, 2021 and 2020, the Company recorded equity earnings of $5$38 million of which $4and $44 million, respectively, related to its investment in PHH Home Loans.
For the nine months ended September 30, 2017, the Company recorded equity earnings of $7 million which consisted of $14 million of earnings from the sale of the first two phases of PHH Home Loans' assets to Guaranteed Rate Affinity, partially offset by $5 million of exit costs and losses of $1 million from the continuing operations results of PHH Home Loans. In addition, there was a $1 million loss from equity method investments at the Title and Settlement Services segment primarily related to costs associated with the start up of operations of Guaranteed Rate Affinity, including $1 million of
amortization of intangible assets recorded in purchase accounting. For the nine months ended September 30, 2016, the Company recorded equity earnings of $10 million of which $7 million related to its investment in PHH Home Loans.
Affinity. The Company received $24$35 million and $5$20 million in cash dividends primarily from PHH Home Loans, during the nine months ended September 30, 2017 and 2016, respectively. The Company invested $34 million into Guaranteed Rate Affinity during the ninesix months ended SeptemberJune 30, 2017.2021 and 2020, respectively.
The Company's other equity method investments had investment balances totaling $14 million and $10 million at June 30, 2021 and December 31, 2020, respectively. The Company recorded $2 million and $1 million equity earnings from the operations of these equity method investments for the three months ended June 30, 2021 and 2020, respectively. The Company recorded $3 million and $1 million equity earnings from the operations of these equity method investments for the six months ended June 30, 2021 and 2020, respectively. The Company received $3 million and $2 million in cash dividends from these equity method investments during the six months ended June 30, 2021 and 2020, respectively.
Income Taxes
The Company's provision for income taxes in interim periods is computed by applying its estimated annual effective tax rate against the income before income taxes for the period. In addition, non-recurring or discrete items are recorded in the period in which they occur. The provision for income taxes was an expense of $67$60 million and $74a benefit of $5 million for the three months ended SeptemberJune 30, 20172021 and 2016,2020, respectively, and an expense of $131$77 million and $114a benefit of $146 million for the ninesix months ended SeptemberJune 30, 20172021 and 2016,2020, respectively.
Derivative Instruments
The Company records derivatives and hedging activities on the balance sheet at their respective fair values. The Company uses foreign currency forward contracts largely to manage its exposure to changes in foreign currency exchange rates associated with its foreign currency denominated receivables and payables. The Company primarily manages its foreign currency exposure to the Euro, British Pound, Swiss Franc and Canadian Dollar. The Company has not elected to utilize hedge accounting for these forward contracts; therefore, any change in fair value is recorded in the Condensed Consolidated Statements of Operations. However, the fluctuations in the value of these forward contracts generally offset the impact of changes in the value of the underlying risk that they are intended to economically hedge. As of September 30, 2017, the Company had outstanding foreign currency forward contracts in an asset position with a fair value of less than $1 million and a notional value of $32 million. As of December 31, 2016, the Company had outstanding foreign currency forward contracts in a liability position with a fair value of $2 million and a notional value of $29 million.
The Company also enters into interest rate swaps to manage its exposure to changes in interest rates associated with its variable rate borrowings. TheAs of June 30, 2021, the Company hashad interest rate swaps with an aggregate notional value of $1,475$1,000 million to offset the variability in cash flows resulting from the term loan facilities as follows:
|
| | | | | | | | | | | | | | | | |
| Notional Value (in millions) | | Commencement Date | | Expiration Date | |
$225450 | July 2012 | February 2018November 2017 | | November 2022 | |
$200400 | January 2013 | February 2018August 2020 | | August 2025 | |
$600150 | August 2015 | August 2020 |
$450 | November 2017 | November 2022 | | November 2027 | |
The swaps help to protect our outstanding variable rate borrowings from future interest rate volatility. The Company has not elected to utilize hedge accounting for these interest rate swaps; therefore, any change in fair value is recorded in the Condensed Consolidated Statements of Operations.
The fair value of derivative instruments was as follows: | | | | | | | | | | | | | | | | | | | | |
| Not Designated as Hedging Instruments | | Balance Sheet Location | | June 30, 2021 | | December 31, 2020 |
| Interest rate swap contracts | | Other non-current liabilities | | 63 | | | 81 | |
|
| | | | | | | | | | |
| Liability Derivatives | | Fair Value |
| Not Designated as Hedging Instruments | | Balance Sheet Location | | September 30, 2017 | | December 31, 2016 |
| Interest rate swap contracts | | Other current and non-current liabilities | | $ | 24 |
| | $ | 33 |
|
The effect of derivative instruments on earnings was as follows: | | | | | | | | | | | | | | | | | | | | | | | | | | | | | | | | |
| Derivative Instruments Not Designated as Hedging Instruments | | Location of Loss or (Gain) Recognized for Derivative Instruments | | Loss or (Gain) Recognized on Derivatives |
| Three Months Ended June 30, | | Six Months Ended June 30, |
| 2021 | | 2020 | | 2021 | | 2020 |
| Interest rate swap contracts | | Interest expense | | $ | 6 | | | $ | 8 | | | $ | (7) | | | $ | 59 | |
Revenue
Revenue is recognized upon the transfer of control of promised services to customers in an amount that reflects the consideration the Company expects to receive in exchange for those services in accordance with the revenue standard. The Company's revenue is disaggregated by major revenue categories on our Condensed Consolidated Statements of Operations and further disaggregated by business segment as follows:
| | | | | | | | | | | | | | | | | | | | | | | | | | | | | | | | | | | | | | | | | | | | | | | | | | | | | | | | | | | |
| Three Months Ended June 30, |
| Realogy Franchise Group | | Realogy Brokerage Group | | Realogy Title
Group | | Corporate and Other | | Total
Company |
| 2021 | | 2020 | | 2021 | | 2020 | | 2021 | | 2020 | | 2021 | | 2020 | | 2021 | | 2020 |
| Gross commission income (a) | $ | 0 | | | $ | 0 | | | $ | 1,773 | | | $ | 919 | | | $ | 0 | | | $ | 0 | | | $ | 0 | | | $ | 0 | | | $ | 1,773 | | | $ | 919 | |
| Service revenue (b) | 60 | | | 61 | | | 8 | | | 4 | | | 246 | | | 154 | | | 0 | | | 0 | | | 314 | | | 219 | |
| Franchise fees (c) | 259 | | | 148 | | | 0 | | | 0 | | | 0 | | | 0 | | | (112) | | | (63) | | | 147 | | | 85 | |
| Other (d) | 28 | | | 18 | | | 10 | | | 10 | | | 9 | | | 6 | | | (5) | | | (2) | | | 42 | | | 32 | |
| Net revenues | $ | 347 | | | $ | 227 | | | $ | 1,791 | | | $ | 933 | | | $ | 255 | | | $ | 160 | | | $ | (117) | | | $ | (65) | | | $ | 2,276 | | | $ | 1,255 | |
| | | | | | | | | | | | | | | | | | | | | | | | | | | | | | | | | | | | | | | | | | | | | | | | | | | | | | | | | | | |
| Six Months Ended June 30, |
| Realogy Franchise Group | | Realogy Brokerage Group | | Realogy Title
Group | | Corporate and Other | | Total
Company |
| 2021 | | 2020 | | 2021 | | 2020 | | 2021 | | 2020 | | 2021 | | 2020 | | 2021 | | 2020 |
| Gross commission income (a) | $ | 0 | | | $ | 0 | | | $ | 2,927 | | | $ | 1,769 | | | $ | 0 | | | $ | 0 | | | $ | 0 | | | $ | 0 | | | $ | 2,927 | | | $ | 1,769 | |
| Service revenue (b) | 107 | | | 125 | | | 15 | | | 9 | | | 441 | | | 287 | | | 0 | | | 0 | | | 563 | | | 421 | |
| Franchise fees (c) | 440 | | | 275 | | | 0 | | | 0 | | | 0 | | | 0 | | | (188) | | | (119) | | | 252 | | | 156 | |
| Other (d) | 54 | | | 47 | | | 20 | | | 24 | | | 15 | | | 10 | | | (8) | | | (4) | | | 81 | | | 77 | |
| Net revenues | $ | 601 | | | $ | 447 | | | $ | 2,962 | | | $ | 1,802 | | | $ | 456 | | | $ | 297 | | | $ | (196) | | | $ | (123) | | | $ | 3,823 | | | $ | 2,423 | |
______________
(a)Gross commission income at Realogy Brokerage Group is recognized at a point in time at the closing of a homesale transaction.
(b)Service revenue primarily consists of title and escrow fees at Realogy Title Group and are recognized at a point in time at the closing of a homesale transaction. Service revenue at Realogy Franchise Group includes relocation fees, which are recognized as revenue when or as the related performance obligation is satisfied dependent on the type of service performed, and fees related to leads and related services, which are recognized at a point in time at the closing of a homesale transaction or at the completion of the relatedservice.
(c)Franchise fees at Realogy Franchise Group primarily include domestic royalties which are recognized at a point in time when the underlying franchisee revenue is earned (upon close of the homesale transaction).
(d)Other revenue is comprised of brand marketing funds received from franchisees at Realogy Franchise Group and other miscellaneous revenues across all of the business segments.
|
| | | | | | | | | | | | | | | | | | |
| Derivative Instruments Not Designated as Hedging Instruments | | Location of (Gain) or Loss Recognized for Derivative Instruments | | (Gain) or Loss Recognized on Derivatives |
| Three Months Ended September 30, | | Nine Months Ended September 30, |
| | 2017 | | 2016 | | 2017 | | 2016 |
| Interest rate swap contracts | | Interest expense | | $ | — |
| | $ | (5 | ) | | $ | 4 |
| | $ | 40 |
|
| Foreign exchange contracts | | Operating expense | | 1 |
| | (1 | ) | | 2 |
| | (1 | ) |
Restricted Cash
Restricted cash primarily relatesThe following table shows the change in the Company's contract liabilities (deferred revenue) related to amounts specifically designated as collateralrevenue contracts by reportable segment for the repaymentperiod: | | | | | | | | | | | | | | | | | | | | | | | |
| | Beginning Balance at January 1, 2021 | | Additions during the period | | Recognized as Revenue during the period | | Ending
Balance at
June 30, 2021 |
| Realogy Franchise Group: | | | | | | | |
| Deferred area development fees (a) | $ | 43 | | | $ | 1 | | | $ | (3) | | | $ | 41 | |
| Deferred brand marketing fund fees (b) | 14 | | | 51 | | | (46) | | | 19 | |
| Deferred outsourcing management fees (c) | 3 | | | 21 | | | (18) | | | 6 | |
| Other deferred income related to revenue contracts | 10 | | | 17 | | | (16) | | | 11 | |
| Total Realogy Franchise Group | 70 | | | 90 | | | (83) | | | 77 | |
| Realogy Brokerage Group: | | | | | | | |
| Advanced commissions related to development business (d) | 9 | | | 1 | | | 0 | | | 10 | |
| Other deferred income related to revenue contracts | 3 | | | 2 | | | (2) | | | 3 | |
| Total Realogy Brokerage Group | 12 | | | 3 | | | (2) | | | 13 | |
| Total | $ | 82 | | | $ | 93 | | | $ | (85) | | | $ | 90 | |
_______________
(a)The Company collects initial area development fees ("ADF") for international territory transactions, which are recorded as deferred revenue when received and recognized into franchise revenue over the average 25 year life of outstanding borrowings under the Company’s securitization facilities. Such amounts approximated $4 millionrelated franchise agreement as consideration for the right to access and $7 millionbenefit from Realogy’s brands. In the event an ADF agreement is terminated prior to the end of its term, the unamortized deferred revenue balance will be recognized into revenue immediately upon termination.
(b)Revenues recognized include intercompany marketing fees paid by Realogy Brokerage Group.
(c)The Company earns revenues from outsourcing management fees charged to clients that may cover several of the relocation services listed above, according to the clients' specific needs. Outsourcing management fees are recorded as deferred revenue when billed (usually at
September 30, 2017 and December 31, 2016, respectively,the relocation) and are primarily included within other current assetsrecognized as revenue over the average time period required to complete the transferee's move, or a phase of the move that the fee covers, which is typically 3 to 6 months depending on the Company’s Condensed Consolidated Balance Sheets.move type.
(d)New development closings generally have a development period of between 18 and 24 months from contracted date to closing.
Allowance for Doubtful Accounts
The Company estimates the allowance necessary to provide for uncollectible accounts receivable. The estimate is based on historical experience, combined with a review of current conditions and forecasts of future losses, and includes specific accounts for which payment has become unlikely. The process by which the Company calculates the allowance begins in the individual business units where specific problem accounts are identified and reserved primarily based upon the age profile of the receivables and specific payment issues, combined with reasonable and supportable forecasts of future losses.
Supplemental Cash Flow Information
Significant non-cash transactions during the nine months ended September 30, 2017 and 2016 included capitalfinance lease additions of $13$3 million and $10$7 million during the six months ended June 30, 2021 and 2020, respectively, which resulted in non-cash additions to property and equipment, net and other non-current liabilities.
Stock RepurchasesLeases
Other than the Company's facility closures as described in Note 5, "Restructuring Costs," the Company's lease obligations as of June 30, 2021 have not changed materially from the amounts reported in our 2020 Form 10-K.
Recently Adopted Accounting Pronouncements
The Company may repurchase shares of its common stock under authorizations made from its Board of Directors. Shares repurchased are retiredadopted the new standard on Simplifying the Accounting for Income Taxes effective January 1, 2021. The new standard clarifies and not displayed separately as treasury stock on the consolidated financial statements. The par valuesimplifies aspects of the shares repurchased and retired is deducted from common stock and the excessaccounting for income taxes to help promote consistent application of the purchase price over par value is first charged against any available additional paid-in capital with the balance charged to retained earnings. Direct costs incurred to repurchase the shares are included in the total cost of the shares.
In February 2016, the Company's Board of Directors authorized a share repurchase program of up to $275 million of the Company's common stock. In February 2017, the Company's Board of Directors authorized a new share repurchase program of up to an additional $300 million of the Company's common stock.
As of September 30, 2017, the Company had repurchased and retired 13 million shares of common stock for an aggregate of $275 million under the February 2016 share repurchase program and $102 million under the February 2017 share repurchase program at a total weighted average market price of $29.07 per share, including 1.8 million shares of common stock repurchased during the third quarter of 2017 for $58 million at a weighted average market price of $33.83 per share. As of September 30, 2017, approximately $198 million of authorization remains available for the repurchase of shares under the February 2017 share repurchase program.
Dividend Policy
In August 2016, the Company’s Board of Directors approved the initiation of a quarterly cash dividend policy of $0.09 per share on its common stock. The Board declared and paid a quarterly cash dividend of $0.09 per share of the Company’s common stock during each of the first, second and third quarters of 2017.
The declaration and payment of any future dividend will be subjectGAAP by eliminating certain exceptions to the discretiongeneral principles of the BoardASC Topic 740, Income Taxes. The adoption of Directors and will depend on a variety of factors, including the Company’s financial condition and results of operations, contractual restrictions, including restrictive covenants contained in the Company’s credit agreements, and the indentures governing the Company’s outstanding debt securities, capital requirements and other factors that the Board of Directors deems relevant.
Pursuantthis guidance did not have an impact to the Company’s policy, the dividends payable in cash are treated as a reductionConsolidated Financial Statements upon adoption on January 1, 2021.
Recently Issued Accounting Pronouncements
The Company considers the applicability and impact of all Accounting Standards Updates. ASUs not listed belowUpdates ("ASUs"). Recently issued standards were assessed and determined to be either not applicable or are expected to have minimal impact on our consolidated financial position or results of operations.
In August 2016, the FASB issued a new standard on classification of cash receipts and payments on the statement of cash flows intending to reduce diversity in practice on how certain transactions are classified. In addition, in November 2016, the FASB issued a new standard requiring that the statement of cash flows explain the change during the period in the total of cash, cash equivalents, and amounts generally described as restricted cash or restricted cash equivalents. Therefore, amounts generally described as restricted cash and restricted cash equivalents should be included with cash and cash equivalents when reconciling the beginning-of-period and end-of-period total amounts shown on the statement of cash flows. The new standards are effective for annual periods beginning after December 15, 2017 and will require a retrospective application at the beginning of the earliest comparative period presented in the year of adoption. The Company plans to early adopt the new standard in the fourth quarter of 2017. The Company expects there to be reclassifications between cash flow categories, but no net cash impact to its Condensed Consolidated Statement of Cash Flows.
In February 2016, the FASB issued its new standard on leases Accounting for Convertible Instruments and Contracts in an Entity’s Own Equity which requires virtually all leases to besimplifies the accounting for instruments with characteristics of liabilities and equity, including convertible debt. The new standard reduces the number of accounting models for convertible debt instruments and convertible preferred stock resulting in fewer embedded conversion features being separately recognized onfrom the balance sheet. Lessees will recognize a right-of-use assethost contract and a lease liability for all leases (other than leases that meet the definitioninterest rate of a short-term lease). The liability will be equalmore convertible debt instruments being closer to the present value of lease payments.coupon interest rate, as compared with current guidance. The asset willnew standard also amends the derivative guidance for the “own stock” scope exception, which exempts qualifying instruments from being accounted for as derivatives if certain criteria are met. In addition, the standard changes the diluted earnings per share calculation for instruments that may be based on the liability, subject to adjustment, such assettled in cash or shares and for initial direct costs. For income statement purposes, the FASB retained a dual model, requiring leases to be classified as either operating or finance leases. Operating leases will result in straight-line expense, similar to current operating leases, while finance leases will result in a front-loaded expense pattern, similar to current capital leases. Classification will be based on criteria that are largely similar to those applied in current lease accounting, but without explicit bright lines.convertible instruments. The new standard is effective for annualreporting periods beginning on or after December 15, 2018. Early adoption is permitted. The new leasing standard requires2021 and permits the use of either the modified retrospective transition, which requires applicationor fully retrospective method of the new guidance at the beginning of the earliest comparative period presented in the year of adoption.transition. The Company is currently evaluating the impact of the standardand transition method on its consolidated financial statements and is in the process of implementing a new lease management system.
In May 2014, the FASB issued a standard on revenue recognition that will impact most companies to some extent. The objective of the revenue standard is to provide a single, comprehensive revenue recognition model for all contracts with customers to improve comparability within industries, across industries, and across capital markets. The revenue standard contains principles that an entity will apply to determine the measurement of revenue and the timing of revenue recognition. The new standard permits for two alternative implementation methods, the use of either (1) full retrospective application to each prior reporting period presented or (2) modified retrospective application in which the cumulative effect of initially applying the revenue standard is recognized as an adjustment to the opening balance of retained earnings in the period of adoption. The Company plans to adopt the new standard in the first quarter of 2018 using the modified retrospective transition method. The Company has made progress on redrafting its revenue recognition accounting policies affected by the standard, assessing the redesign of internal controls, as well as evaluating the expanded disclosure requirements. After a review of the Company's revenue streams, the Company does not expect the new standard to have a material impact on financial results as the majority of the Company's revenue is recognized at the completion of a homesale transaction which will not result in a change in the timing of recognition of revenue transactions under the new revenue recognition guidance.statements.
2017 Acquisitions
During the nine months ended September 30, 2017, the Company acquired eleven real estate brokerage operations through its wholly owned subsidiary, NRT, for aggregate cash consideration of $6 million and established $1 million of contingent consideration. These acquisitions resulted in goodwill of $5 million, pendings and listings of $1 million and other intangibles of $1 million.2. GOODWILL AND INTANGIBLE ASSETS
During the nine months ended September 30, 2017, the Company acquired one title and settlement operation through its wholly owned subsidiary, TRG, for cash consideration of $7 million and established $2 million of contingent consideration. This acquisition resulted in goodwill of $8 million and pendings of $1 million.Goodwill
None of the 2017 acquisitions were significant to the Company’s results of operations, financial position or cash flows individually or in the aggregate.
2016 Acquisitions
During the year ended December 31, 2016, the Company acquired eleven real estate brokerage and property management operations through its wholly owned subsidiary, NRT, for aggregate cash consideration of $74 million and established $9 million of contingent consideration. These acquisitions resulted in goodwill of $52 million, customer relationships of $20 million, pendings and listings of $6 million, other intangible assets of $3 million, other assets of $5 million and other liabilities of $3 million.
During the year ended December 31, 2016, the Company acquired one title and settlement operation through its wholly owned subsidiary, TRG, for cash consideration of $24 million and established $10 million of contingent consideration. This acquisition resulted in goodwill of $20 million, title plant of $7 million, pendings of $5 million, trademarks of $3 million, other intangible assets of $2 million, other assets of $6 million and other liabilities of $9 million.
None of the 2016 acquisitions were significant to the Company’s results of operations, financial position or cash flows individually or in the aggregate.
Goodwill by segmentreporting unit and changes in the carrying amount are as follows:
| | | | | | | | | | | | | | | | | | | | | | | |
| Realogy Franchise Group | | Realogy Brokerage Group | | Realogy
Title Group | | Total
Company |
| Balance at December 31, 2020 | $ | 2,509 | | | $ | 245 | | | $ | 156 | | | $ | 2,910 | |
| Goodwill acquired (a) | 0 | | | 0 | | | 2 | | | 2 | |
| Goodwill reduction for sale of a business (b) | (3) | | | (10) | | | 0 | | | (13) | |
| Balance at June 30, 2021 | $ | 2,506 | | | $ | 235 | | | $ | 158 | | | $ | 2,899 | |
| | | | | | | |
| Accumulated impairment losses (c) | $ | 1,447 | | | $ | 808 | | | $ | 324 | | | $ | 2,579 | |
|
| | | | | | | | | | | | | | | | | | | |
| | Real Estate Franchise Services | | Company Owned Brokerage Services | | Relocation Services | | Title and Settlement Services | | Total Company |
| Gross goodwill as of December 31, 2016 | $ | 3,315 |
| | $ | 1,051 |
| | $ | 641 |
| | $ | 469 |
| | $ | 5,476 |
|
| Accumulated impairment losses | (1,023 | ) | | (158 | ) | | (281 | ) | | (324 | ) | | (1,786 | ) |
| Balance at December 31, 2016 | 2,292 |
| | 893 |
| | 360 |
| | 145 |
| | 3,690 |
|
| Goodwill acquired | — |
| | 6 |
| | — |
| | 8 |
| | 14 |
|
| Balance at September 30, 2017 | $ | 2,292 |
| | $ | 899 |
| | $ | 360 |
| | $ | 153 |
| | $ | 3,704 |
|
(a)Goodwill acquired during the six months ended June 30, 2021 relates to the acquisition of 1 title and settlement operation.
(b)Goodwill reduction relates to the sale of a relocation-related business during the first quarter of 2021 and the sale of a business at Realogy Brokerage Group during the second quarter of 2021.
(c)Includes impairment charges which reduced goodwill by $540 million during 2020, $253 million during 2019, $1,279 million during 2008 and $507 million during 2007.
Intangible Assets
Intangible assets are as follows: | | | | | | | | | | | | | | | | | | | | | | | | | | | | | | | | | | | |
| | As of June 30, 2021 | | As of December 31, 2020 |
| | Gross
Carrying
Amount | | Accumulated
Amortization | | Net
Carrying
Amount | | Gross
Carrying
Amount | | Accumulated
Amortization | | Net
Carrying
Amount |
| Amortizable—Franchise agreements (a) | $ | 2,010 | | | $ | 956 | | | $ | 1,054 | | | $ | 2,010 | | | $ | 922 | | | $ | 1,088 | |
| Indefinite life—Trademarks (b) | $ | 685 | | | | | $ | 685 | | | $ | 685 | | | | | $ | 685 | |
| Other Intangibles | | | | | | | | | | | |
| Amortizable—License agreements (c) | $ | 45 | | | $ | 13 | | | $ | 32 | | | $ | 45 | | | $ | 13 | | | $ | 32 | |
| Amortizable—Customer relationships (d) | 456 | | | 334 | | | 122 | | | 509 | | | 376 | | | 133 | |
| Indefinite life—Title plant shares (e) | 25 | | | | | 25 | | | 20 | | | | | 20 | |
| Amortizable—Other (f) | 14 | | | 12 | | | 2 | | | 14 | | | 11 | | | 3 | |
| Total Other Intangibles | $ | 540 | | | $ | 359 | | | $ | 181 | | | $ | 588 | | | $ | 400 | | | $ | 188 | |
|
| | | | | | | | | | | | | | | | | | | | | | | |
| | As of September 30, 2017 | | As of December 31, 2016 |
| | Gross Carrying Amount | | Accumulated Amortization | | Net Carrying Amount | | Gross Carrying Amount | | Accumulated Amortization | | Net Carrying Amount |
| Amortizable—Franchise agreements (a) | $ | 2,019 |
| | $ | 708 |
| | $ | 1,311 |
| | $ | 2,019 |
| | $ | 658 |
| | $ | 1,361 |
|
| Indefinite life—Trademarks (b) | $ | 748 |
| | | | $ | 748 |
| | $ | 748 |
| | | | $ | 748 |
|
| Other Intangibles | | | | | | | | | | | |
| Amortizable—License agreements (c) | $ | 45 |
| | $ | 10 |
| | $ | 35 |
| | $ | 45 |
| | $ | 9 |
| | $ | 36 |
|
| Amortizable—Customer relationships (d) | 550 |
| | 330 |
| | 220 |
| | 550 |
| | 312 |
| | 238 |
|
| Indefinite life—Title plant shares (e) | 18 |
| | | | 18 |
| | 18 |
| | | | 18 |
|
| Amortizable—Pendings and listings (f) | 2 |
| | 1 |
| | 1 |
| | 6 |
| | 5 |
| | 1 |
|
| Amortizable—Other (g) | 33 |
| | 16 |
| | 17 |
| | 33 |
| | 13 |
| | 20 |
|
| Total Other Intangibles | $ | 648 |
| | $ | 357 |
| | $ | 291 |
| | $ | 652 |
| | $ | 339 |
| | $ | 313 |
|
_______________
(a)Generally amortized over a period of 30 years.
| |
(b) | Primarily relates to the Century 21®, Coldwell Banker®, ERA®, Corcoran®, Coldwell Banker Commercial® and Cartus tradenames, which are expected to generate future cash flows for an indefinite period of time.
|
| |
(c) | Relates to the Sotheby’s International Realty® and Better Homes and Gardens® Real Estate agreements which are being amortized over 50 years (the contractual term of the license agreements).
|
| |
(d) | Relates to the customer relationships at the Relocation Services segment, the Title and Settlement Services segment, the Real Estate Franchise Services segment and our Company Owned Real Estate Brokerage Services segment. These relationships are being amortized over a period of 2 to 20 years. |
| |
(e) | Ownership in a title plant is required to transact title insurance in certain states. The Company expects to generate future cash flows for an indefinite period of time. |
| |
(f) | Generally amortized over a period of 5 months. |
| |
(g) | Consists of covenants not to compete which are amortized over their contract lives and other intangibles which are generally amortized over periods ranging from 5 to 10 years. |
(b)Primarily related to real estate franchise brands which are expected to generate future cash flows for an indefinite period of time.
(c)Relates to the Sotheby’s International Realty® and Better Homes and Gardens® Real Estate agreements which are being amortized over 50 years (the contractual term of the license agreements).
(d)Relates to the customer relationships at Realogy Franchise Group, Realogy Title Group and Realogy Brokerage Group. These relationships are being amortized over a period of 2 to 20 years.
(e)Ownership in a title plant is required to transact title insurance in certain states. The Company expects to generate future cash flows for an indefinite period of time.
(f)Consists of covenants not to compete which are amortized over their contract lives and other intangibles which are generally amortized over periods ranging from 5 to 10 years.
Intangible asset amortization expense is as follows: | | | | | | | | | | | | | | | | | | | | | | | |
| | Three Months Ended
June 30, | | Six Months Ended
June 30, |
| | 2021 | | 2020 | | 2021 | | 2020 |
| Franchise agreements | $ | 17 | | | $ | 17 | | | $ | 34 | | | $ | 34 | |
| Customer relationships | 5 | | | 0 | | | 11 | | | 1 | |
| Other | 1 | | | 1 | | | 1 | | | 2 | |
| Total | $ | 23 | | | $ | 18 | | | $ | 46 | | | $ | 37 | |
|
| | | | | | | | | | | | | | | |
| | Three Months Ended
September 30, | | Nine Months Ended
September 30, |
| | 2017 | | 2016 | | 2017 | | 2016 |
| Franchise agreements | $ | 16 |
| | $ | 16 |
| | $ | 50 |
| | $ | 50 |
|
| License agreements | 1 |
| | — |
| | 1 |
| | 1 |
|
| Customer relationships | 5 |
| | 7 |
| | 18 |
| | 20 |
|
| Pendings and listings | 2 |
| | 7 |
| | 3 |
| | 9 |
|
| Other | 1 |
| | 1 |
| | 4 |
| | 4 |
|
| Total | $ | 25 |
| | $ | 31 |
| | $ | 76 |
| | $ | 84 |
|
Based on the Company’s amortizable intangible assets as of SeptemberJune 30, 2017,2021, the Company expects related amortization expense for the remainder of 2017,2021, the four4 succeeding years and thereafter to be approximately $25$46 million,, $97 $90 million,, $97 $89 million,, $95 $89 million,, $92 $89 million and $1,178$807 million,, respectively.
| |
4. | ACCRUED EXPENSES AND OTHER CURRENT LIABILITIES |
3. ACCRUED EXPENSES AND OTHER CURRENT LIABILITIES
Accrued expenses and other current liabilities consisted of:
| | | | | | | | | | | |
| | June 30, 2021 | | December 31, 2020 |
| Accrued payroll and related employee costs | $ | 185 | | | $ | 239 | |
| Advances from clients | 32 | | | 65 | |
| Accrued volume incentives | 37 | | | 46 | |
| Accrued commissions | 60 | | | 48 | |
| Restructuring accruals | 13 | | | 16 | |
| Deferred income | 57 | | | 46 | |
| Accrued interest | 43 | | | 18 | |
| Current portion of finance lease liabilities | 12 | | | 13 | |
| Due to former parent | 19 | | | 19 | |
| Other | 107 | | | 90 | |
| Total accrued expenses and other current liabilities | $ | 565 | | | $ | 600 | |
|
| | | | | | | |
| | September 30, 2017 | | December 31, 2016 |
| Accrued payroll and related employee costs | $ | 123 |
| | $ | 138 |
|
| Accrued volume incentives | 38 |
| | 40 |
|
| Accrued commissions | 41 |
| | 31 |
|
| Restructuring accruals | 7 |
| | 14 |
|
| Deferred income | 60 |
| | 69 |
|
| Accrued interest | 31 |
| | 13 |
|
| Contingent consideration for acquisitions | 23 |
| | 24 |
|
| Other | 119 |
| | 106 |
|
| Total accrued expenses and other current liabilities | $ | 442 |
| | $ | 435 |
|
5.4. SHORT AND LONG-TERM DEBT
Total indebtedness is as follows:
|
| | | | | | | |
| | September 30, 2017 | | December 31, 2016 |
| Senior Secured Credit Facility: | | | |
| Revolving Credit Facility | $ | 190 |
| | $ | 200 |
|
| Term Loan B | 1,065 |
| | 1,069 |
|
| Term Loan A Facility: | | | |
| Term Loan A | 395 |
| | 411 |
|
| Term Loan A-1 | 341 |
| | 347 |
|
| 4.50% Senior Notes | 443 |
| | 439 |
|
| 5.25% Senior Notes | 546 |
| | 545 |
|
| 4.875% Senior Notes | 496 |
| | 496 |
|
| Total Short-Term & Long-Term Debt | $ | 3,476 |
| | $ | 3,507 |
|
| Securitization obligations: | | | |
| Apple Ridge Funding LLC | $ | 223 |
| | $ | 192 |
|
| Cartus Financing Limited | 11 |
| | 13 |
|
| Total securitization obligations | $ | 234 |
| | $ | 205 |
|
| | | | | | | | | | | |
| | June 30, 2021 | | December 31, 2020 |
| Senior Secured Credit Facility: | | | |
| Non-extended Revolving Credit Commitment | $ | 0 | | | $ | 0 | |
| Extended Revolving Credit Commitment | 0 | | | 0 | |
| Term Loan B | 235 | | | 1,036 | |
| Term Loan A Facility: | | | |
| Non-extended Term Loan A | 196 | | | 681 | |
| Extended Term Loan A | 235 | | | 0 | |
| 7.625% Senior Secured Second Lien Notes | 541 | | | 540 | |
| 4.875% Senior Notes | 406 | | | 406 | |
| 9.375% Senior Notes | 544 | | | 544 | |
| 5.75% Senior Notes | 898 | | | 0 | |
| 0.25% Exchangeable Senior Notes | 320 | | | 0 | |
| Total Short-Term & Long-Term Debt | $ | 3,375 | | | $ | 3,207 | |
| Securitization Obligations: | | | |
| Apple Ridge Funding LLC | $ | 145 | | | $ | 102 | |
| Cartus Financing Limited | 2 | | | 4 | |
| Total Securitization Obligations | $ | 147 | | | $ | 106 | |
Indebtedness Table
As of SeptemberJune 30, 2017,2021, the Company’s borrowing arrangements were as follows: | | | | | | | | | | | | | | | | | | | | | | | | | | | | | |
| Interest
Rate | | Expiration
Date | | Principal Amount | | Unamortized Discount (Premium) and Debt Issuance Costs | | Net Amount |
| Senior Secured Credit Facility (1): | | | | | | | | | |
| Non-extended Revolving Credit Commitment | (2) | | February 2023 | | $ | 0 | | | $ * | | $ | 0 | |
| Extended Revolving Credit Commitment | (2) | | February 2025 (3) | | 0 | | | * | | 0 | |
| Term Loan B | (4) | | February 2025 | | 237 | | | 2 | | | 235 | |
| Term Loan A Facility (5): | | | | | | | | | |
| Non-extended Term Loan A | (6) | | February 2023 | | 197 | | | 1 | | | 196 | |
| Extended Term Loan A | (7) | | February 2025 (3) | | 236 | | | 1 | | | 235 | |
| Senior Secured Second Lien Notes (8) | 7.625% | | June 2025 | | 550 | | | 9 | | | 541 | |
| Senior Notes (8) | 4.875% | | June 2023 | | 407 | | | 1 | | | 406 | |
| Senior Notes (8) | 9.375% | | April 2027 | | 550 | | | 6 | | | 544 | |
| Senior Notes (8) | 5.75% | | January 2029 | | 900 | | | 2 | | | 898 | |
| Exchangeable Senior Notes | 0.25% | | June 2026 | | 403 | | | 83 | | | 320 | |
| Total Short-Term & Long-Term Debt | $ | 3,480 | | | $ | 105 | | | $ | 3,375 | |
| Securitization obligations: (9) | | | | | | | | | |
| Apple Ridge Funding LLC (10) | | June 2022 | | $ | 145 | | | $ * | | $ | 145 | |
| Cartus Financing Limited (11) | | August 2021 | | 2 | | | * | | 2 | |
| Total Securitization Obligations | $ | 147 | | | $ | 0 | | | $ | 147 | |
_______________
*The debt issuance costs related to our Revolving Credit Facility and securitization obligations are classified as a deferred financing asset within other assets.
(1)The available capacity under the Non-extended Revolving Credit Commitment is $477 million, while the available capacity under the Extended Revolving Credit Commitment is $948 million. As of June 30, 2021, there were 0 outstanding borrowings under
|
| | | | | | | | | | | | | | | |
| | Interest
Rate | | Expiration
Date | | Principal Amount | | Unamortized Discount and Debt Issuance Costs | | Net Amount |
| Senior Secured Credit Facility: | | | | | | | | | |
| Revolving Credit Facility (1) | (2) | | October 2020 | | $ | 190 |
| | $ * |
| | $ | 190 |
|
| Term Loan B | (3) | | July 2022 | | 1,086 |
| | 21 |
| | 1,065 |
|
| Term Loan A Facility: | | | | | | | | | |
| Term Loan A | (4) | | October 2020 | | 397 |
| | 2 |
| | 395 |
|
| Term Loan A-1 | (5) | | July 2021 | | 344 |
| | 3 |
| | 341 |
|
| Senior Notes | 4.50% | | April 2019 | | 450 |
| | 7 |
| | 443 |
|
| Senior Notes | 5.25% | | December 2021 | | 550 |
| | 4 |
| | 546 |
|
| Senior Notes | 4.875% | | June 2023 | | 500 |
| | 4 |
| | 496 |
|
| Securitization obligations: (6) | | | | | | | | | |
| Apple Ridge Funding LLC (7) | | | June 2018 | | 223 |
| | * |
| | 223 |
|
| Cartus Financing Limited (8) | | | August 2018 | | 11 |
| | * |
| | 11 |
|
| Total (9) | $ | 3,751 |
| | $ | 41 |
| | $ | 3,710 |
|
either the Non-extended Revolving Credit Commitment or Extended Revolving Credit Commitment and $42 million of outstanding undrawn letters of credit. The Non-extended Revolving Credit Commitment expires in February 2023 and, subject to earlier spring maturity described in footnote (3), the Extended Revolving Credit Commitment expires in February 2025, but in each instance, amounts outstanding would be classified on the balance sheet as current due to the revolving nature and terms and conditions of the facilities. On August 2, 2021, the Company had 0 outstanding borrowings under the Revolving Credit Facility and $42 million of outstanding undrawn letters of credit.
_______________(2)Interest rates with respect to revolving loans under the Senior Secured Credit Facility at June 30, 2021 were based on, at the Company's option, (a) adjusted London Interbank Offering Rate ("LIBOR") plus an additional margin or (b) JP Morgan Chase Bank, N.A.'s prime rate ("ABR") plus an additional margin, in each case subject to adjustment based on the then current senior secured leverage ratio. Based on the previous quarter's senior secured leverage ratio, the LIBOR margin was 1.75% and the ABR margin was 0.75% for the three months ended June 30, 2021.
(3)The maturity date of each of the Extended Revolving Credit Commitment and Extended Term Loan A may spring forward to a date prior to February 2025 as follows: (i) if on or before March 2, 2023, the 4.875% Senior Notes have not been extended, refinanced or replaced to have a maturity date after May 10, 2025 (or are not otherwise discharged, defeased or repaid by March 2, 2023), the maturity date of the Extended Revolving Credit Commitment and Extended Term Loan A Facility will be March 2, 2023; and (ii) if on or before November 9, 2024, the Term Loan B Facility under the Senior Secured Credit Agreement is not extended, refinanced or replaced to have a maturity date after May 10, 2025 (or otherwise repaid prior to November 9, 2024), the maturity date of the Extended Revolving Credit Commitment and Extended Term Loan A Facility will be November 9, 2024.
(4)In January and February 2021, we used a portion of the proceeds from the issuance of 5.75% Senior Notes to pay down $655 million of outstanding borrowings under the Term Loan B Facility. In April 2021, the Company used cash on hand to pay down $150 million of outstanding borrowings under the Term Loan B Facility. The Term Loan B Facility provides for quarterly amortization payments totaling 1% per annum of the $1,080 million original principal amount. The interest rate with respect to term loans under the Term Loan B Facility is based on, at the Company’s option, (a) adjusted LIBOR plus 2.25% (with a LIBOR floor of 0.75%) or (b) ABR plus 1.25% (with an ABR floor of 1.75%).
(5)In January 2021, prior to the effective date of the 2021 Amendments, we used a portion of the proceeds from the issuance of 5.75% Senior Notes to pay down $250 million of outstanding borrowings under the Term Loan A Facility. The interest rates with respect to each of the Non-extended Term Loan A and Extended Term Loan A are based on, at the Company's option, (a) adjusted LIBOR plus an additional margin or (b) ABR plus an additional margin, in each case subject to adjustment based on the then current senior secured leverage ratio. Based on the previous quarter's senior secured leverage ratio, the LIBOR margin was 1.75% and the ABR margin was 0.75% for the three months ended June 30, 2021.
(6)The Company is not required to make amortization payments on the Non-extended Term Loan A. The balance of the Non-Extended Term Loan A is due at maturity on February 8, 2023.
(7)The Extended Term Loan A has quarterly amortization payments, commencing with the quarter ending June 30, 2021, equal to a percentage per quarter of the $237 million principal amount of the Extended Term Loan A outstanding on January 27, 2021 (the effective date of the 2021 Amendments), as follows: 0.625% per quarter from June 30, 2021 to March 31, 2022; 1.25% per quarter from June 30, 2022 to March 31, 2023; 1.875% per quarter from June 30, 2023 to March 31, 2024; and 2.50% per quarter for periods ending on or after June 30, 2024, with the balance of the Extended Term Loan A due at maturity on February 8, 2025.
(8)Realogy Group may redeem all or a portion of the Unsecured Notes or 7.625% Senior Secured Second Lien Notes, as applicable, at the redemption price set forth in the applicable indenture governing such notes, commencing on the following dates: | | | | | |
* | The debt issuance costs related to our Revolving Credit Facility and securitization obligations are classified as a deferred financing asset within other assets. |
| Date |
(1)7.625% Senior Secured Second Lien Notes | As of September 30, 2017, the Company had $1,050 million of borrowing capacity under its Revolving Credit Facility, leaving $860 million of available capacity. The revolving credit facility expires in October 2020, but is classified on the balance sheet as current due to the revolving nature of the facility. On November 1, 2017, the Company had $70 million in outstanding borrowings under the Revolving Credit Facility, leaving $980 million of available capacity. |
| June 15, 2022 |
(2)4.875% Senior Notes | Interest rates with respect to revolving loans under the Senior Secured Credit Facility at September 30, 2017 are based on, at the Company's option, (a) adjusted LIBOR plus an additional margin or (b) ABR plus an additional margin, in each case subject to adjustment based on the then current senior secured leverage ratio. Based on the previous quarter senior secured leverage ratio, the LIBOR margin was 2.00% and the ABR margin was 1.00% for the three months ended September 30, 2017. |
| March 1, 2023 |
(3)9.375% Senior Notes | The Term Loan B provides for quarterly amortization payments totaling 1% per annum of the original principal amount. The interest rate with respect to term loans under the Term Loan B is based on, at the Company’s option, (a) adjusted LIBOR plus 2.25% (with a LIBOR floor of 0.75%) or (b) JPMorgan Chase Bank, N.A.’s prime rate ("ABR") plus 1.25% (with an ABR floor of 1.75%).
|
| April 1, 2022 |
(4)5.75% Senior Notes | The Term Loan A provides for quarterly amortization payments, which commenced March 31, 2016, totaling per annum 5%, 5%, 7.5%, 10.0% and 12.5% of the original principal amount of the Term Loan A in 2016, 2017, 2018, 2019 and 2020, respectively. The interest rates with respect to term loans under the Term Loan A are based on, at the Company's option, (a) adjusted LIBOR plus an additional margin or (b) ABR plus an additional margin, in each case subject to adjustment based on the then current senior secured leverage ratio. Based on the previous quarter senior secured leverage ratio, the LIBOR margin was 2.00% and the ABR margin was 1.00% for the three months ended September 30, 2017.
January 15, 2024 |
| |
(5) | The Term Loan A-1 provides for quarterly amortization payments, which commenced on September 30, 2016, totaling per annum 2.5%, 2.5%, 5%, 7.5% and 10.0% of the original principal amount of the Term Loan A-1, with the last amortization payment made on June 30, 2021. The interest rates with respect to term loans under the Term Loan A-1 are based on, at the Company's option, (a) adjusted LIBOR plus an additional margin or (b) ABR plus an additional margin, in each case subject to adjustment based on the then current senior secured leverage ratio. Based on the previous quarter senior secured leverage ratio, the LIBOR margin was 2.00% and the ABR margin was 1.00% for the three months ended September 30, 2017. |
| |
(6) | Available capacity is subject to maintaining sufficient relocation related assets to collateralize these securitization obligations. |
| |
(7) | In June 2017, Realogy Group extended the existing Apple Ridge Funding LLC securitization program utilized by Cartus until June 2018. As of September 30, 2017, the Company had $325 million of borrowing capacity under the Apple Ridge Funding LLC securitization program leaving $102 million of available capacity. |
| |
(8) | Consists of a £10 million revolving loan facility and a £5 million working capital facility. As of September 30, 2017, the Company had $20 million of borrowing capacity under the Cartus Financing Limited securitization program leaving $9 million of available capacity. In September 2017, Realogy Group extended the existing Cartus Financing Limited securitization program to August 2018.
Prior to the dates noted above, Realogy Group may redeem the applicable notes at their option, in whole or in part, at a redemption price equal to 100% of the principal amount of such notes redeemed plus a "make-whole" premium as set forth in the applicable indenture governing such notes. In addition, prior to the dates noted above, we may redeem up to 40% of the notes (other than the 4.875% Senior Notes) from the proceeds of certain equity offerings as set forth in the applicable indenture governing such notes. See below under the header "Exchangeable Senior Notes" for information on certain redemption features of the Exchangeable Senior Notes. (9)Available capacity is subject to maintaining sufficient relocation related assets to collateralize these securitization obligations. (10)In June 2021, Realogy Group extended the existing Apple Ridge Funding LLC securitization program utilized by Cartus until June 2022. As of June 30, 2021, the Company had $200 million of borrowing capacity under the Apple Ridge Funding LLC securitization program leaving $55 million of available capacity. (11)Consists of a £10 million revolving loan facility and a £5 million working capital facility. As of June 30, 2021, the Company had $21 million of borrowing capacity under the Cartus Financing Limited securitization program leaving $19 million of available capacity.
|
| |
(9) | Not included in this table is the Company's Unsecured Letter of Credit Facility which had a capacity of $74 million with $71 million utilized at a weighted average rate of 3.24% at September 30, 2017. |
Maturities Table
As of SeptemberJune 30, 2017,2021, the combined aggregate amount of maturities for long-term borrowings excluding securitization obligations, for the remainder of 20172021 and each of the next four years is as follows:
|
| | | | |
| Year | | Amount |
| Remaining 2017 (a) | | $ | 200 |
|
| 2018 | | 57 |
|
| 2019 | | 527 |
|
| 2020 | | 357 |
|
| 2021 | | 837 |
|
| | | | | | | | |
| Year | | Amount |
| Remaining 2021 (a) | | $ | 8 | |
| 2022 | | 21 | |
| 2023 | | 631 | |
| 2024 | | 33 | |
| 2025 | | 934 | |
_______________
| |
(a) | (a)Remaining 2021 includes amortization payments totaling $3 million and $5 million for the Extended Term Loan A and Term Loan B Facility, respectively. The current portion of long-term debt consists of remaining 2017 amortization payments totaling $5 million, $2 million and $3 million for the Term Loan A, Term Loan A-1 and Term Loan B facilities, respectively, as well as $190 million of revolver borrowings under the revolving credit facility which expires in October 2020, but are classified on the balance sheet as current due to the revolving nature of the facility. |
long-term debt of $18 million shown on the Condensed Consolidated Balance Sheets consists of four quarters of amortization payments totaling $7 million and $11 million for the Extended Term Loan A and Term Loan B Facility, respectively.
Senior Secured Credit FacilityAgreement and Term Loan A Agreement
In July 2016, the Company entered into a third amendment (the “Third Amendment”) to theThe Company's Amended and Restated Credit Agreement dated as of March 5, 2013 as amended. The Third Amendment replaced the $1,858 million Term Loan B due March 2020 with a new $1,100 million Term Loan B due July 20, 2022. In January 2017, the Company entered into a fourth amendment (the “Fourth Amendment”(as amended, amended and restated, modified or supplemented from time to the Amended and Restated Credit Agreement, as so amended,time, the "Senior Secured Credit Agreement") that repricedgoverns its senior secured revolving credit facility (the "Revolving Credit Facility") and term loan B facility (the "Term Loan B Facility", and collectively with the Revolving Credit Facility, the "Senior Secured Credit Facility") and the Company's Term Loan A Agreement dated as of October 23, 2015 (as amended, amended and restated, modified or supplemented from time to time, the "Term Loan A Agreement") governs its senior secured term loan A credit facility (the "Term Loan A Facility").
In January 2021, the Company repaid $250 million of outstanding borrowings under the Term Loan A Facility and $655 million of outstanding borrowings under the Term Loan B through a refinancingFacility using proceeds from its January and February 2021 issuances of $900 million 5.75% Senior Notes due 2029. In April 2021, the existing term loan with a new Term Loan B. The Fourth Amendment reduced the interest rate by 75 basis points but did not change the maturity date forCompany used cash on hand to pay down $150 million of outstanding borrowings under the Term Loan B. The Company alsoB Facility.
In January 2021, Realogy Group entered into an Incremental Assumption Agreementamendments to the Senior Secured Credit Agreement, pursuantreferred to collectively herein as the "2021 Amendments", which among other things:
•extend the Company increasedmaturity for approximately $237 million of the borrowing capacityapproximately $434 million outstanding loans under itsthe Term Loan A Facility (the "Extended Term Loan A") after giving effect to the application of the proceeds of the 5.75% Senior Notes offering, from February 2023 to February 2025, subject to the following:
◦if on or before March 2, 2023, the 4.875% Senior Notes have not been extended, refinanced or replaced to have a maturity date after May 10, 2025 (or are not otherwise discharged, defeased or repaid by March 2, 2023), the maturity date of the Extended Term Loan A will be March 2, 2023; and
◦if on or before November 9, 2024, the Term Loan B Facility under the Senior Secured Credit Agreement is not extended, refinanced or replaced to have a maturity date after May 10, 2025 (or otherwise repaid prior to November 9, 2024), the maturity date of the Extended Term Loan A will be November 9, 2024; and
•extend the maturity of approximately $948 million of the $1,425 million in commitments under the Revolving Credit Facility (the "Extended Revolving Credit Commitment") from February 2023 to $1,050 million fromFebruary 2025, subject to the existing $815 million.earlier springing maturity dates applicable to the Extended Term Loan A described above.
The 2021 Amendments also made certain modifications to the Senior Secured Credit Agreement and Term Loan A Agreement, including amendments that tightened certain covenants in the Senior Secured Credit Agreement and Term Loan A Agreement and reduced the maximum permitted senior secured leverage ratio (the financial covenant under such agreements) for the applicable trailing twelve-month period to below the levels that had been permitted under the amendments to the Senior Secured Credit Agreement and Term Loan A Agreement that Realogy Group entered into in July 2020 (referred to collectively herein as the "2020 Amendments"). These modifications were to remain in place for the periods specified in the 2021 Amendments, unless terminated earlier by Realogy Group at its election. In June 2021, Realogy Group elected to terminate the covenant relief period and, accordingly, the senior secured leverage ratio reset to the pre-amendment level of 4.75 to 1.00 for the trailing twelve-month period ended June 30, 2021 and future periods and the
other covenants that had been tightened under the 2021 Amendments and 2020 Amendments returned to the pre-amendment levels.
Senior Secured Credit Facility
The Senior Secured Credit Agreement provides for:Facility includes:
| |
(a) | a Term Loan B issued in the original aggregate principal amount of $1,100 million with a maturity date of July 2022. The Term Loan B has quarterly amortization payments totaling 1% per annum of the initial aggregate principal amount. The interest rate with respect to term loans under the Term Loan B is based on, at Realogy Group's option, adjusted LIBOR plus 2.25% (with a LIBOR floor of 0.75%) or ABR plus 1.25% (with an ABR floor of 1.75%); and |
| |
(b) | a $1,050(a)the Term Loan B Facility issued in the original aggregate principal amount of $1,080 million with a maturity date of February 2025. The Term Loan B Facility has quarterly amortization payments totaling 1% per annum of the initial aggregate principal amount. The interest rate with respect to term loans under the Term Loan B Facility is based on, at Realogy Group's option, adjusted LIBOR plus 2.25% (with a LIBOR floor of 0.75%) or ABR plus 1.25% (with an ABR floor of 1.75%); and (b)a $1,425 million Revolving Credit Facility with a maturity date of October 23, 2020, which includes (i) a $125 million letter of credit subfacility and (ii) a swingline loan subfacility. The Revolving Credit Facility includes available capacity under the Non-extended Revolving Credit Commitment of $477 million and the available capacity under the Extended Revolving Credit Commitment of $948 million. The Non-extended Revolving Credit Commitment expires in February 2023 and, subject to earlier spring maturity described above, the Extended Revolving Credit Commitment expires in February 2025. The interest rate with respect to revolving loans under the Revolving Credit Facility is based on, at Realogy Group's option, adjusted LIBOR or ABR plus an additional margin subject to the following adjustments based on the Company’s then current senior secured leverage ratio: |
|
| | | | |
| Senior Secured Leverage Ratio | | Applicable LIBOR Margin | | Applicable ABR Margin |
| Greater than 3.50 to 1.00 | | 2.50% | | 1.50% |
| Less than or equal to 3.50 to 1.00 but greater than or equal to 2.50 to 1.00 | | 2.25% | | 1.25% |
| Less than 2.50 to 1.00 | | 2.00% | | 1.00% |
The Senior Secured Credit Agreement permits the Company to obtain up to $500 million of additional credit facilities from lenders reasonably satisfactory to the administrative agent and us, without the consent of the existing lenders under the new senior secured credit facility, plus an unlimited amount if Realogy Group's senior secured leverage
ratio is less than 3.50 to 1.00 on a pro forma basis. Subject to certain restrictions, the Senior Secured Credit Agreement also permits us to issue senior secured or unsecured notes in lieu of any incremental facility.ratio: | | | | | | | | | | | | | | |
| Senior Secured Leverage Ratio | | Applicable LIBOR Margin | | Applicable ABR Margin |
| Greater than 3.50 to 1.00 | | 2.50% | | 1.50% |
| Less than or equal to 3.50 to 1.00 but greater than or equal to 2.50 to 1.00 | | 2.25% | | 1.25% |
| Less than 2.50 to 1.00 but greater than or equal to 2.00 to 1.00 | | 2.00% | | 1.00% |
| Less than 2.00 to 1.00 | | 1.75% | | 0.75% |
The obligations under the Senior Secured Credit Agreement are secured to the extent legally permissible by substantially all of the assets of Realogy Group, Realogy Intermediate and all of their domestic subsidiaries, other than certain excluded subsidiaries.subsidiaries and subject to certain exceptions.
Realogy Group’sGroup's Senior Secured Credit Agreement contains financial, affirmative and negative covenants and requiresas well as a financial covenant that Realogy Group to maintain (so long as commitments under the Revolving Credit Facility are outstanding) a maximum permitted senior secured leverage ratio, not to exceed 4.75 to 1.00.1.00. The leverage ratio is tested quarterly regardless of the amount of borrowings outstanding and letters of credit issued under the revolverRevolving Credit Facility at the testing date. Total senior secured net debt does not include the securitization obligations, 7.625% Senior Secured Second Lien Notes, or our unsecured indebtedness, including the Unsecured Notes as well asand the securitization obligations.Exchangeable Senior Notes. At SeptemberJune 30, 2017,2021, Realogy Group was in compliance with the senior secured leverage ratio covenant. For the calculation of the senior secured leverage ratio for the second quarter of 2021, see Part I., "Item 2. Management's Discussion and Analysis of Financial Condition and Results of Operations—Senior Secured Leverage Ratio applicable to our Senior Secured Credit Facility and Term Loan A Facility".
Term Loan A Facility
In October 2015, Realogy Group entered intoThe term loans under the Term Loan A senior secured credit agreement which provides for a five-year, $435Facility were originally $750 million loan issued at par with aand include the Non-extended Term Loan A due February 2023 and the Extended Term Loan A due February 2025, subject to earlier spring maturity date of October 23, 2020 (the “Term Loan A”) and has terms substantially similar to the Senior Secured Credit Agreement.described above. The Extended Term Loan A provides for quarterly amortization payments, which commenced March 31, 2016, totaling the amount per annum equal to the following percentagesbased on a percentage of the original principal amount of $237 million, commencing with the Term Loan A: 5%, 5%, 7.5%, 10.0%quarter ending June 30, 2021, as follows: 0.625% per quarter from June 30, 2021 to March 31, 2022; 1.25% per quarter from June 30, 2022 to March 31, 2023; 1.875% per quarter from June 30, 2023 to March 31, 2024; and 12.5%2.50% per quarter for amortizations payable in 2016, 2017, 2018, 2019 and 2020,periods ending on or after June 30, 2024, with the balance payable uponof the finalExtended Term Loan A due at maturity date. on February 8, 2025. No amortization payments are required on the Non-extended Term Loan A.
The interest rates with respect to term loans under the Term Loan A Facility are based on, at ourthe Company's option, adjusted LIBOR or ABR plus an additional margin subject to the following adjustments based on the Company’sCompany's then current senior secured leverage ratio: | | | | | | | | | | | | | | |
| Senior Secured Leverage Ratio | | Applicable LIBOR Margin | | Applicable ABR Margin |
| Greater than 3.50 to 1.00 | | 2.50% | | 1.50% |
| Less than or equal to 3.50 to 1.00 but greater than or equal to 2.50 to 1.00 | | 2.25% | | 1.25% |
| Less than 2.50 to 1.00 but greater than or equal to 2.00 to 1.00 | | 2.00% | | 1.00% |
| Less than 2.00 to 1.00 | | 1.75% | | 0.75% |
|
| | | | |
| Senior Secured Leverage Ratio | | Applicable LIBOR Margin | | Applicable ABR Margin |
| Greater than 3.50 to 1.00 | | 2.50% | | 1.50% |
| Less than or equal to 3.50 to 1.00 but greater than or equal to 2.50 to 1.00 | | 2.25% | | 1.25% |
| Less than 2.50 to 1.00 | | 2.00% | | 1.00% |
In July 2016, Realogy Group entered into a first amendment to theThe Term Loan A Agreement contains covenants that are substantially similar to those in the Senior Secured Credit Agreement.
Senior Secured Second Lien Notes
The 7.625% Senior Secured Second Lien Notes mature on June 15, 2025 and interest is payable semiannually on June 15 and December 15 of each year.
The 7.625% Senior Secured Second Lien Notes are guaranteed on a senior secured credit agreement. Under the amendment, the Company issued the Term Loan A-1 in the amountsecond priority basis by Realogy Intermediate and each domestic subsidiary of $355 million withRealogy Group, other than certain excluded entities, that is a maturity date in July 2021guarantor under its existingSenior Secured Credit Facility and Term Loan A Facility and certain of its outstanding debt securities. The 7.625% Senior Secured Second Lien Notes are also guaranteed by Realogy Holdings on termsan unsecured senior subordinated basis. The 7.625% Senior Secured Second Lien Notes are secured by substantially similar tothe same collateral as Realogy Group's existing first lien obligations under its existing Term Loan A. The Term Loan A-1 provides for quarterly amortization payments totaling per annum 2.5%, 2.5%, 5%, 7.5% and 10.0% of the original principal amount of the Term Loan A-1, which commenced September 30, 2016 continuing through June 30, 2021.
The interest rates with respect to term loans under the Term Loan A-1 are based on, at our option, adjusted LIBOR or ABR plus an additional margin subject to the following adjustments based on the Company’s then current senior secured leverage ratio:
|
| | | | |
| Senior Secured Leverage Ratio | | Applicable LIBOR Margin | | Applicable ABR Margin |
| Greater than 3.50 to 1.00 | | 2.50% | | 1.50% |
| Less than or equal to 3.50 to 1.00 but greater than or equal to 2.50 to 1.00 | | 2.25% | | 1.25% |
| Less than 2.50 to 1.00 but greater than or equal to 2.00 to 1.00 | | 2.00% | | 1.00% |
| Less than 2.00 to 1.00 | | 1.75% | | 0.75% |
Consistent with the Senior Secured Credit Agreement, theFacility and Term Loan A Facility permitson a second priority basis.
The indentures governing the Company7.625% Senior Secured Second Lien Notes contain various covenants that limit the ability of Realogy Intermediate, Realogy Group and Realogy Group's restricted subsidiaries to obtain uptake certain actions, which covenants are subject to $500 milliona number of additional credit facilities from lenders reasonably satisfactoryimportant exceptions and qualifications. These covenants are substantially similar to the administrative agent andcovenants in the company, withoutindenture governing the consent of the existing lenders9.375% Senior Notes due 2027, as described under the Term Loan A, plus an unlimited amount if the Company's senior secured leverage ratio is less than 3.50 to 1.00 on a pro forma basis. Subject to certain restrictions, the Term Loan A Facility also permits us to issue senior secured or unsecured notes in lieu of any incremental facility.Unsecured Notes below.
Unsecured Notes
The 4.50%4.875% Senior Notes, 5.25%9.375% Senior Notes and 4.875%5.75% Senior Notes (each as defined below, collectively(collectively the "Unsecured Notes") are unsecured senior obligations of Realogy Group that mature on April 15, 2019, December 1, 2021 and June 1, 2023, April 1, 2027 and January 15, 2029, respectively. Interest on the Unsecured Notes is payable each year semiannually on April 15 and October 15 for the 4.50% Senior Notes and June 1 and December 1 for both the 5.25%4.875% Senior Notes, on April 1 and October 1 for the 9.375% Senior Notes, and 4.875%on January 15 and July 15 for the 5.75% Senior Notes.Notes (commencing on July 15, 2021).
The Unsecured Notes are guaranteed on an unsecured senior basis by each domestic subsidiary of Realogy Group that is a guarantor under the Senior Secured Credit Facility, Term Loan A Facility and Realogy Group's outstanding debt securities and are guaranteed by Realogy Holdings on an unsecured senior subordinated basis.
Other Debt FacilitiesThe indenture governing the 4.875% Senior Notes contains various negative covenants that limit Realogy Group's and its restricted subsidiaries' ability to take certain actions, which covenants are subject to a number of important exceptions and qualifications. These covenants include limitations on Realogy Group's and its restricted subsidiaries’ ability to (a) incur or guarantee additional indebtedness, or issue disqualified stock or preferred stock, (b) pay dividends or make distributions to their stockholders, (c) repurchase or redeem capital stock, (d) make investments or acquisitions, (e) incur restrictions on the ability of certain of their subsidiaries to pay dividends or to make other payments to Realogy Group, (f) enter into transactions with affiliates, (g) create liens, (h) merge or consolidate with other companies or transfer all or substantially all of their assets, (i) transfer or sell assets, including capital stock of subsidiaries and (j) prepay, redeem or repurchase debt that is subordinated in right of payment to the Unsecured Notes.
The Company has an Unsecured Letter of Credit Facilitycovenants in the indenture governing the 9.375% Senior Notes are substantially similar to provide for the issuance of letters of credit required for general corporate purposes bycovenants in the Company. At September 30, 2017,indentures governing the capacity of the facility was $74 million4.875% Senior Notes, with $71 million being utilizedcertain exceptions, including several changes relating to Realogy Group's ability to make restricted payments, and at December 31, 2016, the capacity of the facility was $131 million with $127 million being utilized. In August 2017, the standby irrevocable letter of credit, which was utilizedin particular, its ability to support the Company’s payment obligationsrepurchase shares and pay dividends. Specifically, with respect to its sharethe 9.375% Senior Notes Indenture, (a) neither the cumulative credit basket (nor any other basket) is available to repurchase shares to the extent the consolidated leverage ratio is equal to or greater than 4.0 to 1.0 on a pro forma basis giving effect to such repurchase; (b) the cumulative credit basket for which restricted payments may
otherwise be available is equal to 50% of Consolidated Net Income (as defined in such indenture) for the period (taken as a resultone accounting period) from January 1, 2019 to the end of the resolutionmost recently ended fiscal quarter for which internal financial statements are available at the time of any such restricted payment; provided however, that, to the extent the Consolidated Leverage Ratio is equal to or greater than 4.0 to 1.0, then 25% of the Consolidated Net Income for the aforementioned period will be included; (c) the consolidated leverage ratio must be less than 3.0 to 1.0 to use the unlimited general restricted payment basket (which payments will reduce the cumulative credit basket, but not below zero); (d) the $100 million general restricted payment basket may be used only for Restricted Investments (as defined in such indenture); and (e) a Cendant legacy tax matter, reducingrestricted payment basket is available for up to $45 million of dividends per calendar year (with any actual dividends deducted from the capacityavailable cumulative credit basket). The covenants in the indenture governing 5.75% Senior Notes are substantially similar to the covenants in the indentures governing the 4.875% Senior Notes, but also include some of the additional limitations of the 9.375% Senior Notes.
The consolidated leverage ratio is measured by dividing Realogy Group's total net debt by the trailing four quarters EBITDA. EBITDA, as defined in the indenture governing the 9.375% Senior Notes (as well as the other Unsecured Notes and outstanding letters of credit7.625% Senior Secured Second Lien Notes), is substantially similar to EBITDA calculated on a Pro Forma Basis, as those terms are defined in the Senior Secured Credit Agreement. Net debt under the Unsecured Letterindentures governing the 9.375% Senior Notes, 7.625% Senior Secured Second Lien Notes and 5.75% Senior Notes is Realogy Group's total indebtedness (excluding securitizations) less (i) its cash and cash equivalents in excess of Credit Facility.restricted cash and (ii) a $200 million seasonality adjustment permitted when measuring the ratio on a date during the period of March 1 to May 31.
Exchangeable Senior Notes
In June 2021, Realogy Group issued an aggregate principal amount of $403 million of 0.25% Exchangeable Senior Notes due 2026. The facility's expiration dates are as follows:
|
| |
Capacity (in millions) | Expiration Date |
$8 | September 2018 |
$66 | December 2019 |
The fixed pricingthe net proceeds from this offering to pay the cost of the exchangeable note hedge transactions described below (with such cost partially offset by the proceeds to the Company is based on a spread abovefrom the credit default swap ratesale of the warrants pursuant to the warrant transactions described below). The Company expects to use the remaining net proceeds for seniorits working capital and other general corporate purposes.
The Exchangeable Senior Notes are unsecured debtsenior obligations of Realogy Group that mature on June 15, 2026. Interest on the Company over the applicable letter of credit period. Realogy Group's obligations under the Unsecured Letter of Credit FacilityExchangeable Senior Notes is payable each year semiannually on June 15 and December 15 (commencing on December 15, 2021).
The Exchangeable Senior Notes are guaranteed on an unsecured senior basis by each domestic subsidiary of Realogy Group that is a guarantor under the Senior Secured Credit Facility, Term Loan A Facility and Realogy Group's outstanding debt securities.securities and are guaranteed by Realogy Holdings on an unsecured senior subordinated basis.
Before March 15, 2026, noteholders will have the right to exchange their Exchangeable Senior Notes upon the occurrence of certain events described in the indenture governing the notes. On or after March 15, 2026, noteholders may exchange their Exchangeable Senior Notes at any time at their election until the close of business on the second scheduled trading day immediately before the maturity date of the notes.
Upon exchange, Realogy Group will pay cash up to the aggregate principal amount of the Exchangeable Senior Notes to be exchanged and pay or deliver, as the case may be, cash, shares of the Company’s common stock or a combination of cash and shares of the Company’s common stock, at Realogy Group's election, in respect of the remainder, if any, of its exchange obligation in excess of the aggregate principal amount of the Exchangeable Senior Notes being exchanged.
The initial exchange rate for Exchangeable Senior Notes is 40.8397 shares of the Company’s common stock per $1,000 principal amount of notes (which represents an initial exchange price of approximately $24.49 per share of the Company’s common stock). The exchange rate and exchange price of the Exchangeable Senior Notes are subject to customary adjustments upon the occurrence of certain events. In addition, if a “Make-Whole Fundamental Change” (as defined in the indenture governing the Exchangeable Senior Notes) occurs, then the exchange rate of the Exchangeable Senior Notes will, in certain circumstances, be increased for a specified period of time. Initially, a maximum of approximately 23,013,139 shares of the Company’s common stock may be issued upon the exchange of the Exchangeable Senior Notes, based on the initial maximum exchange rate of 57.1755 shares of the Company’s common stock per $1,000 principal amount of notes, which is subject to customary anti-dilution adjustment provisions.
The Exchangeable Senior Notes will be redeemable, in whole or in part (subject to a partial redemption limitation described in the indenture governing the notes), at Realogy Group's option at any time, and from time to time, on or after June 20, 2024 and on or before the 30th scheduled trading day immediately before the maturity date, at a cash redemption
price equal to the principal amount of the Exchangeable Senior Notes to be redeemed, plus accrued and unpaid interest, if any, to, but excluding, the redemption date, but only if the last reported sale price per share of the Company’s common stock exceeds 130% of the exchange price on (1) each of at least 20 trading days, whether or not consecutive, during the 30 consecutive trading days ending on, and including, the trading day immediately before the date it sends the related redemption notice; and (2) the trading day immediately before the date it sends such notice. In addition, calling any Exchangeable Senior Notes for redemption will constitute a Make-Whole Fundamental Change with respect to that note, in which case the exchange rate applicable to the exchange of that note will be increased in certain circumstances if it is exchanged with an exchange date occurring during the period from, and including, the date Realogy Group sends the redemption notice to, and including, the second business day immediately before the related redemption date.
If certain corporate events that constitute a “Fundamental Change” (as defined in the indenture governing the Exchangeable Senior Notes) of the Company occur, then noteholders may require Realogy Group to repurchase their Exchangeable Senior Notes at a cash repurchase price equal to the principal amount of the notes to be repurchased, plus accrued and unpaid interest, if any, to, but excluding, the fundamental change repurchase date. The definition of Fundamental Change includes, among other things, certain business combination transactions involving the Company and certain de-listing events with respect to the Company’s common stock.
The indenture governing the Exchangeable Senior Notes also provides for events of default which, if any of them occurs, would permit or require the principal of and accrued interest on the Exchangeable Senior Notes to become or to be declared due and payable.
Exchangeable debt instruments that may be settled in cash are required to be separated into liability and equity components. The allocation to the liability component is based on the fair value of a similar instrument that does not contain an equity conversion option. Based on this debt to equity ratio, debt issuance costs are then allocated to the liability and equity components in a similar manner. Accordingly, at issuance on June 2, 2021, the Company allocated $319 million to the debt liability and $53 million to additional paid in capital.
The difference between the principal amount of the Exchangeable Senior Notes and the liability component, inclusive of issuance costs, represents the debt discount, which the Company will amortize to interest expense over the term of the Exchangeable Senior Notes using an effective interest rate of 4.375%.The Company recognized non-cash interest expense of $1 million, related to the Exchangeable Senior Notes in the second quarter of 2021.
The Exchangeable Senior Notes consisted of the following components as of June 30, 2021:
| | | | | |
| June 30, 2021 |
| Liability component: | |
| Principal | $ | 403 | |
| Less: debt discount and issuance costs, net of amortization | 83 |
| Net carrying amount | $ | 320 | |
| |
Equity component: (*) | $ | 53 | |
_______________
(*) Included in additional paid-in capital on the consolidated balance sheets.
Exchangeable Note Hedge and Warrant Transactions
In connection with the pricing of the Exchangeable Senior Notes (and with the exercise by the initial purchasers of the notes to purchase additional notes), Realogy Group entered into exchangeable note hedge transactions with certain counterparties (the "Option Counterparties"). The exchangeable note hedge transactions cover, subject to anti-dilution adjustments substantially similar to those applicable to the Exchangeable Senior Notes, the number of shares of the Company’s common stock underlying the Notes. The total cost of such exchangeable note hedge transactions was $67 million.
Concurrently with Realogy Group entering into the exchangeable note hedge transactions, the Company entered into warrant transactions with the Option Counterparties whereby the Company sold to the Option Counterparties warrants to purchase, subject to customary adjustments, up to the same number of shares of the Company’s common stock. The initial strike price of the warrant transactions is $30.6075 per share. The Company received $46 million in cash proceeds from the sale of these warrant transactions.
Taken together, the purchase of such exchangeable note hedges and the sale of such warrants are intended to offset (in whole or in part) any potential dilution and/or cash payments upon the exchange of the Exchangeable Senior Notes, and to effectively increase the overall exchange price from $24.49 to $30.6075 per share.
At issuance, the Company recorded a deferred tax liability of $20 million related to the Exchangeable Senior Notes debt discount and a deferred tax asset of $18 million related to the exchangeable note hedge transactions. The deferred tax liability and deferred tax asset are recorded net within deferred income taxes in the unaudited consolidated balance sheets.
Securitization Obligations
Realogy Group has secured obligations through Apple Ridge Funding LLC under a securitization program. Inprogram which expires in June 2017, Realogy Group extended2022. As of June 30, 2021, the program until June 2018. The program has a capacity of $325 million. At September 30, 2017, Realogy GroupCompany had $223$200 million of outstanding borrowingsborrowing capacity under the facility.Apple Ridge Funding LLC securitization program with $145 million being utilized, leaving $55 million of available capacity subject to maintaining sufficient relocation related assets to collateralize the securitization obligation.
Realogy Group, through a special purpose entity known as Cartus Financing Limited, has agreements providing for a £10 million revolving loan facility and a £5 million working capital facility. In September 2017, Realogy Group extended the existing Cartus Financing Limited securitization program tofacility which expires in August 2018. There2021. As of June 30, 2021, there were $11$2 million of outstanding borrowings onunder the facilities at September 30, 2017.leaving $19 million of available capacity subject to maintaining sufficient relocation related assets to collateralize the securitization obligation. These Cartus Financing Limited facilities are secured by the relocation assets of a U.K. government contract in this special purpose entity and are therefore classified as permitted securitization financings as defined in Realogy Group’s Senior Secured Credit FacilityAgreement and the indentures governing the Unsecured Notes and 7.625% Senior Secured Second Lien Notes.
The Apple Ridge entities and the Cartus Financing Limited entity are consolidated special purpose entities that are utilized to securitize relocation receivables and related assets. These assets are generated from advancing funds on behalf of clients of Realogy Group’s relocation businessoperations in order to facilitate the relocation of their employees. Assets of these special purpose entities are not available to pay Realogy Group’s general obligations. Under the Apple Ridge program, provided no termination or amortization event has occurred, any new receivables generated under the designated relocation management agreements are sold into the securitization program and as new eligible relocation management agreements are entered into, the new agreements are designated to the program.
The Apple Ridge program has restrictive covenants and trigger events, including performance triggers linked to the age and quality of the underlying assets, foreign obligor limits, multicurrency limits, financial reporting requirements, restrictions on mergers and change of control, any uncured breach of Realogy Group’s senior secured leverage ratio under Realogy Group’s Senior Secured Credit Facility, and cross-defaults to Realogy Group’s material indebtedness. The occurrence of a trigger event under the Apple Ridge securitization facility could restrict our ability to access new or existing funding under this facility or result in termination of the facility, either of which would adversely affect the operation of ourthe Company's relocation business.services.
Certain of the funds that Realogy Group receives from relocation receivables and related assets mustare required to be utilized to repay securitization obligations. These obligations wereare collateralized by $259$201 million and $238$135 million of underlying relocation receivables and other related relocation assets at SeptemberJune 30, 20172021 and December 31, 2016,2020, respectively. Substantially all relocation related assets are realized in less than twelve months from the transaction date. Accordingly, all of Realogy Group’sGroup's securitization obligations are classified as current in the accompanying Condensed Consolidated Balance Sheets.
Interest incurred in connection with borrowings under these facilities amounted to $2$1 million for both the three months ended SeptemberJune 30, 20172021 and 20162020, as well as $2 million and $5$3 million for the ninesix months ended SeptemberJune 30, 20172021 and 2016.2020, respectively. This interest is recorded within net revenues in the accompanying Condensed Consolidated Statements of Operations as related borrowings are utilized to fund Realogy Group's relocation businessoperations where interest is generally earned on such assets. These securitization obligations represent floating rate debt for which the average weighted interest rate was 3.3%3.6% and 2.5%3.8% for the ninesix months ended SeptemberJune 30, 20172021 and 2016,2020, respectively.
Loss on the Early Extinguishment of Debt and Write-Off of Financing Costs
As a result of the refinancing transactiontransactions in January and February 2021 and pay down of 2017 and reduction$150 million of outstanding borrowings under the Unsecured Letter of CreditTerm Loan B Facility in September of 2017,April 2021, the Company recorded losses on the early extinguishment of debt of $5$18 million and wrote off certain financing costs of $1 million to interest expense during the ninesix months ended SeptemberJune 30, 2017.
2021.
During the six months ended June 30, 2020 the Company recorded a loss on the early extinguishment of debt of $8 million as a result of the refinancing transactions in June 2020.
5. RESTRUCTURING COSTS
Restructuring charges were $2$5 million and $9$10 million for the three and ninesix months ended SeptemberJune 30, 2017,2021, respectively, and $9$18 million and $30 million for the three and ninesix months ended SeptemberJune 30, 2016,2020, respectively. The components of the restructuring charges for the three and ninesix months ended SeptemberJune 30, 20172021 and 20162020 were as follows:
| | | | Three Months Ended September 30, | | Nine Months Ended September 30, | | Three Months Ended June 30, | | Six Months Ended June 30, |
| | 2017 | | 2016 | | 2017 | | 2016 | | 2021 | | 2020 | | 2021 | | 2020 |
| Personnel-related costs (1) | $ | 1 |
| | $ | 6 |
| | $ | 7 |
| | $ | 17 |
| Personnel-related costs (1) | $ | 2 | | | $ | 5 | | | $ | 4 | | | $ | 8 | |
| Facility-related costs (2) | — |
| | 2 |
| | 1 |
| | 7 |
| Facility-related costs (2) | 3 | | | 13 | | | 6 | | | 22 | |
| Accelerated depreciation on asset disposals | — |
| | 1 |
| | — |
| | 1 |
| |
| Other restructuring costs (3) | 1 |
| | — |
| | 1 |
| | 5 |
| |
| Total restructuring charges | $ | 2 |
| | $ | 9 |
| | $ | 9 |
| | $ | 30 |
| Total restructuring charges | $ | 5 | | | $ | 18 | | | $ | 10 | | | $ | 30 | |
_______________
| |
(1) | Personnel-related costs consist of severance costs provided to employees who have been terminated and duplicate payroll costs during transition. |
| |
(2) | Facility-related costs consist of costs associated with planned facility closures such as contract termination costs, lease payments that will continue to be incurred under the contract for its remaining term without economic benefit to the Company and other facility and employee relocation related costs. |
| |
(3) | Other restructuring costs consist of costs related to professional fees, consulting fees and other costs associated with restructuring activities which are primarily included in the Corporate and Other business segment. |
Business Optimization Initiative(1)Personnel-related costs consist of severance costs provided to employees who have been terminated and duplicate payroll costs during transition.
During(2)Facility-related costs consist of costs associated with planned facility closures such as contract termination costs, amortization of lease assets that will continue to be incurred under the contract for its remaining term without economic benefit to the Company, accelerated depreciation on asset disposals and other facility and employee relocation related costs.
Facility and Operational Efficiencies Program
Beginning in the first quarter of 2019, the Company commenced the implementation of a plan to accelerate its office consolidation to reduce storefront costs, as well as institute other operational efficiencies to drive profitability. In addition, the Company commenced a plan to transform and centralize certain aspects of the operational support and drive changes in how it serves its affiliated independent sales agents from a marketing and technology perspective to help such agents be more productive and enable them to make their businesses more profitable. In the third quarter of 2019, the Company reduced headcount in connection with the wind-down of a former affinity real estate benefit program. In the fourth quarter of 2015,2019, the Company began a businessexpanded its operational efficiencies program to focus on workforce optimization. This workforce optimization initiative thatwas focused on maximizingconsolidating similar or overlapping roles, reducing the efficiencynumber of hierarchical layers and effectivenessstreamlining work and decision making. Furthermore, at the end of 2019, the Company expanded these strategic initiatives which have resulted in additional operational and facility related efficiencies in 2020.
As a result of the cost structureCOVID-19 pandemic, the Company transitioned substantially all of eachits employees to a remote-work environment in mid-March 2020 and has worked to comply with state and local regulators to ensure safe working conditions. Many of the Company's business units. The action was designedemployees continued to improve client service levels across eachwork remotely on a full-time or hybrid basis. This transition to remote work has allowed the Company to reevaluate its office space needs. As a result, additional facility and operational efficiencies were identified and implemented in the second half of the business units while enhancing the Company's profitability2020 and incremental margins. The plan focused on several key areas of opportunity which include process improvement efficiencies, office footprint optimization, leveraging technology and media spend, centralized procurement, outsourcing administrative services and organizational design. Theadditional facility initiatives are expected costs of activities undertaken in connection with the restructuring plan are largely complete.2021.
The following is a reconciliation of the beginning and ending restructuring reserve balances related to the Facility and Operational Efficiencies Program:
| | | | | | | | | | | | | | | | | |
| Personnel-related costs | | Facility-related costs | | Total |
| Balance at December 31, 2020 | $ | 5 | | | $ | 22 | | | $ | 27 | |
| Restructuring charges (1) | 4 | | | 6 | | | 10 | |
| Costs paid or otherwise settled | (6) | | | (9) | | | (15) | |
| Balance at June 30, 2021 | $ | 3 | | | $ | 19 | | | $ | 22 | |
_______________
(1)In addition, the Company incurred an additional $1 million of facility-related costs for lease asset impairments in connection with the Business Optimization Initiative:Facility and Operational Efficiencies Program during the six months ended June 30, 2021.
|
| | | | | | | | | | | | | | | | | | | |
| | Personnel-related costs | | Facility-related costs | | Accelerated depreciation on asset disposal | | Other restructuring costs | | Total |
| Balance at December 31, 2016 | $ | 9 |
| | $ | 7 |
| | $ | — |
| | $ | — |
| | $ | 16 |
|
| Restructuring charges | 7 |
| | 1 |
| | — |
| | 1 |
| | 9 |
|
| Costs paid or otherwise settled | (12 | ) | | (5 | ) | | — |
| | (1 | ) | | (18 | ) |
| Balance at September 30, 2017 | $ | 4 |
| | $ | 3 |
| | $ | — |
| | $ | — |
| | $ | 7 |
|
The following table shows the total restructuring costs currently expected to be incurred by type of cost forrelated to the Business Optimization Initiative:Facility and Operational Efficiencies Program:
| | | | | | | | | | | | | | | | | |
| Total amount expected to be incurred (1) | | Amount incurred
to date | | Total amount remaining to be incurred (1) |
| Personnel-related costs | $ | 57 | | | $ | 54 | | | $ | 3 | |
| Facility-related costs | 108 | | | 67 | | | 41 | |
| Other restructuring costs | 1 | | | 1 | | | 0 | |
| Total | $ | 166 | | | $ | 122 | | | $ | 44 | |
|
| | | | | | | | | | | |
| | Total amount expected to be incurred | | Amount incurred to date | | Total amount remaining to be incurred |
| Personnel-related costs | $ | 32 |
| | $ | 32 |
| | $ | — |
|
| Facility-related costs | 16 |
| | 14 |
| | 2 |
|
| Accelerated depreciation related to asset disposals | 2 |
| | 1 |
| | 1 |
|
| Other restructuring costs | 12 |
| | 11 |
| | 1 |
|
| Total | $ | 62 |
| | $ | 58 |
| | $ | 4 |
|
(1)Facility-related costs include potential lease asset impairments to be incurred under the Facility and Operational Efficiencies Program.
The following table shows the total restructuring costs currently expected to be incurred by reportable segment related to the Facility and Operational Efficiencies Program:
| | | | | | | | | | | | | | | | | |
| Total amount expected to be incurred | | Amount incurred
to date | | Total amount remaining to be incurred |
| Realogy Franchise Group | $ | 32 | | | $ | 31 | | | $ | 1 | |
| Realogy Brokerage Group | 82 | | | 64 | | | 18 | |
| Realogy Title Group | 6 | | | 6 | | | 0 | |
| Corporate and Other | 46 | | | 21 | | | 25 | |
| Total | $ | 166 | | | $ | 122 | | | $ | 44 | |
6. EQUITY
Condensed Consolidated Statement of Changes in Equity for the Business Optimization Initiative:Realogy Holdings
| | | | | | | | | | | | | | | | | | | | | | | | | | | | | | | | | | | | | | | | | |
| | Three Months Ended June 30, 2021 |
| | Common Stock | | Additional
Paid-In
Capital | | Accumulated
Deficit | | Accumulated
Other
Comprehensive
Loss | | Non-
controlling
Interests | | Total
Equity |
|
|
| Shares | | Amount | |
| Balance at March 31, 2021 | 116.4 | | | $ | 1 | | | $ | 4,874 | | | $ | (3,022) | | | $ | (59) | | | $ | 3 | | | $ | 1,797 | |
| Net income | — | | | — | | | — | | | 149 | | | — | | | 2 | | | 151 | |
| Other comprehensive income | — | | | — | | | — | | | — | | | 1 | | | — | | | 1 | |
| Equity component of Exchangeable Senior Notes issuance, net | — | | | — | | | 53 | | | — | | | — | | | — | | | 53 | |
| Purchase of Exchangeable Senior Notes note hedge transactions | — | | | — | | | (67) | | | — | | | — | | | — | | | (67) | |
| Tax benefit related to purchase of Exchangeable Senior Notes note hedge transactions | — | | | — | | | 18 | | | — | | | — | | | — | | | 18 | |
| Issuance of Exchangeable Senior Notes warrant transactions | — | | | — | | | 46 | | | — | | | — | | | — | | | 46 | |
| Exercise of stock options | — | | | — | | | 1 | | | — | | | — | | | — | | | 1 | |
| Stock-based compensation | — | | | — | | | 8 | | | — | | | — | | | — | | | 8 | |
| Issuance of shares for vesting of equity awards | 0.2 | | | 0 | | | — | | | — | | | — | | | — | | | 0 | |
| Shares withheld for taxes on equity awards | 0 | | | 0 | | | (1) | | | — | | | — | | | — | | | (1) | |
| Dividends | — | | | — | | | 0 | | | — | | | — | | | (1) | | | (1) | |
| Balance at June 30, 2021 | 116.6 | | | $ | 1 | | | $ | 4,932 | | | $ | (2,873) | | | $ | (58) | | | $ | 4 | | | $ | 2,006 | |
|
| | | | | | | | | | | |
| | Total amount expected to be incurred | | Amount incurred to date | | Total amount remaining to be incurred |
| Real Estate Franchise Services | $ | 5 |
| | $ | 5 |
| | $ | — |
|
| Company Owned Real Estate Brokerage Services | 37 |
| | 35 |
| | 2 |
|
| Relocation Services | 5 |
| | 5 |
| | — |
|
| Title and Settlement Services | 1 |
| | 1 |
| | — |
|
| Corporate and Other | 14 |
| | 12 |
| | 2 |
|
| Total | $ | 62 |
| | $ | 58 |
| | $ | 4 |
|
| | | | | | | | | | | | | | | | | | | | | | | | | | | | | | | | | | | | | | | | | |
| | Three Months Ended June 30, 2020 |
| | Common Stock | | Additional
Paid-In
Capital | | Accumulated
Deficit | | Accumulated
Other
Comprehensive
Loss | | Non-
controlling
Interests | | Total
Equity |
|
|
| Shares | | Amount | |
| Balance at March 31, 2020 | 115.3 | | | $ | 1 | | | $ | 4,844 | | | $ | (3,157) | | | $ | (57) | | | $ | 3 | | | $ | 1,634 | |
| Net (loss) income | — | | | — | | | — | | | (14) | | | — | | | 1 | | | (13) | |
| Other comprehensive income | — | | | — | | | — | | | — | | | 1 | | | — | | | 1 | |
| Stock-based compensation | — | | | — | | | 4 | | | — | | | — | | | — | | | 4 | |
| Issuance of shares for vesting of equity awards | 0.1 | | | 0 | | | — | | | — | | | — | | | — | | | 0 | |
| Shares withheld for taxes on equity awards | 0 | | | 0 | | | (1) | | | — | | | — | | | — | | | (1) | |
| Balance at June 30, 2020 | 115.4 | | | $ | 1 | | | $ | 4,847 | | | $ | (3,171) | | | $ | (56) | | | $ | 4 | | | $ | 1,625 | |
| | | | | | | | | | | | | | | | | | | | | | | | | | | | | | | | | | | | | | | | | |
| | Six Months Ended June 30, 2021 |
| | Common Stock | | Additional
Paid-In
Capital | | Accumulated
Deficit | | Accumulated
Other
Comprehensive
Loss | | Non-
controlling
Interests | | Total
Equity |
|
|
| Shares | | Amount | |
| Balance at December 31, 2020 | 115.5 | | | $ | 1 | | | $ | 4,876 | | | $ | (3,055) | | | $ | (59) | | | $ | 4 | | | $ | 1,767 | |
| Net income | — | | | — | | | — | | | 182 | | | — | | | 3 | | | 185 | |
| Other comprehensive income | — | | | — | | | — | | | — | | | 1 | | | — | | | 1 | |
| Equity component of Exchangeable Senior Notes issuance, net | — | | | — | | | 53 | | | — | | | — | | | — | | | 53 | |
| Purchase of Exchangeable Senior Notes note hedge transactions | — | | | — | | | (67) | | | — | | | — | | | — | | | (67) | |
| Tax benefit related to purchase of Exchangeable Senior Notes note hedge transactions | — | | | — | | | 18 | | | — | | | — | | | — | | | 18 | |
| Issuance of Exchangeable Senior Notes warrant transactions | — | | | — | | | 46 | | | — | | | — | | | — | | | 46 | |
| Exercise of stock options | — | | | — | | | 1 | | | — | | | — | | | — | | | 1 | |
| Stock-based compensation | — | | | — | | | 14 | | | — | | | — | | | — | | | 14 | |
| Issuance of shares for vesting of equity awards | 1.6 | | | 0 | | | — | | | — | | | — | | | — | | | 0 | |
| Shares withheld for taxes on equity awards | (0.5) | | | 0 | | | (9) | | | — | | | — | | | — | | | (9) | |
| Dividends | — | | | — | | | 0 | | | — | | | — | | | (3) | | | (3) | |
| Balance at June 30, 2021 | 116.6 | | | $ | 1 | | | $ | 4,932 | | | $ | (2,873) | | | $ | (58) | | | $ | 4 | | | $ | 2,006 | |
| |
7. | STOCK-BASED COMPENSATION |
| | | | | | | | | | | | | | | | | | | | | | | | | | | | | | | | | | | | | | | | | |
| | Six Months Ended June 30, 2020 |
| | Common Stock | | Additional
Paid-In
Capital | | Accumulated
Deficit | | Accumulated
Other
Comprehensive
Loss | | Non-
controlling
Interests | | Total
Equity |
|
|
| Shares | | Amount | |
| Balance at December 31, 2019 | 114.4 | | | $ | 1 | | | $ | 4,842 | | | $ | (2,695) | | | $ | (56) | | | $ | 4 | | | $ | 2,096 | |
| Net (loss) income | — | | | — | | | — | | | (476) | | | — | | | 1 | | | (475) | |
| Stock-based compensation | — | | | — | | | 10 | | | — | | | — | | | — | | | 10 | |
| Issuance of shares for vesting of equity awards | 1.5 | | | 0 | | | — | | | — | | | — | | | — | | | 0 | |
| Shares withheld for taxes on equity awards | (0.5) | | | 0 | | | (5) | | | — | | | — | | | — | | | (5) | |
| Dividends | — | | | — | | | 0 | | | — | | | — | | | (1) | | | (1) | |
| Balance at June 30, 2020 | 115.4 | | | $ | 1 | | | $ | 4,847 | | | $ | (3,171) | | | $ | (56) | | | $ | 4 | | | $ | 1,625 | |
Condensed Consolidated Statement of Changes in Equity for Realogy Group
The Company has stock-based compensation plans (the 2007 Stock Incentive Plannot included a statement of changes in equity for Realogy Group as the operating results of Group are consistent with the operating results of Realogy Holdings as all revenue and expenses of Realogy Group flow up to Realogy Holdings and there are no incremental activities at the 2012 Long-Term Incentive Plan) under which incentive equity awards such as non-qualified stock options, rights to purchase sharesRealogy Holdings level. The only difference between Realogy Group and Realogy Holdings is that the $1 million in par value of common stock restricted stock,in Realogy Holdings' equity is included in additional paid-in capital in Realogy Group's equity.
Stock-Based Compensation
During the first quarter of 2021, the Company granted restricted stock units ("RSUs"),related to 0.9 million shares with a weighted average grant date fair value of $14.10 and performance stock units related to 0.6 million shares with a weighted average grant date fair value of $11.55. The Company granted all time-based equity awards in the form of restricted stock units and performance share units ("PSUs") may be issuedwhich are subject to employees, consultants and directors of Realogy. The Company's stockholders approved the Amended and Restated 2012 Long-Term Incentive Plan at the 2016 Annual Meeting of Stockholders held on May 4, 2016 (the "Amended and Restated 2012 LTIP"). The Amended and Restated 2012 LTIP increases the number of shares authorized for issuance under that plan by 9.8 million shares. The total number of shares authorized for issuance under the plans is 19.4 million shares.
Awards granted under the Amended and Restated 2012 LTIP utilizing the additional 9.8 million share reserve, except options and stock appreciation rights, must be counted against the foregoing share limit on a 2.22 share to one basis for each share actually granted in connection with such award. As of September 30, 2017, the total number of shares available for future grants under the Amended and Restated 2012 LTIP was approximately 3 million shares. The Company does not expect to issue any additional awards under the 2007 Stock Incentive Plan.
Consistent with the 2016 long-term incentive equity awards, the 2017 awards include a mix of PSUs, RSUs (performance restricted stock units for the CEO and direct reports) and options. The 2017 PSUs are incentives that reward grantees based upon the Company's financial performanceratable vesting over a three-year performance period ending December 31, 2019. There are two PSU awards: one is based upon the total stockholder return of Realogy's common stock relative to the total stockholder return of the SPDR S&P Homebuilders Index ("XHB") (the "RTSR award"), and the other is based upon the achievement of cumulative free cash flow goals. The number of shares that may be issued under the PSU is variable and based upon the extent to which the performance goals are achieved over the performance period (with a range of payout from 0% to 175% of target for the RTSR award and 0% to 200% of target for the achievement of cumulative free cash flow award). The shares earned will be distributed in early 2020. The RSUs vest over three years, with 33.33% vesting on each anniversary of the grant date. Time-vesting of the 2017 performance RSUs for the CEO and direct reports is subject to achievement of a minimum EBITDA performance goal for 2017. The stock options have a maximum term of ten years and vest over four years, with 25% vesting on each anniversary date of the grant date. The options have an exercise price equal to the closing sale price of the Company's common stock on the date of grant.period.
In August 2016, the Company’s Board of Directors approved the initiation of a quarterly cash dividend policy on its common stock. The Board declared a cash dividend of $0.09 per share of the Company’s common stock per quarter. When payment of cash dividends occurs, the Company issues dividend equivalent units ("DEUs") to eligible holders of
outstanding RSUs and PSUs. The number of DEUs granted for each RSU or PSU is calculated by dividing the amount of the cash dividend on the number of shares covered by the RSU or PSU at the time of the related dividend record date by the closing price of the Company's stock on the related dividend payment date. The DEUs are subject to the same vesting requirements, settlement provisions, and other terms and conditions as the original award to which they relate. The issuance of DEUs have an immaterial impact on the Company's stock-based compensation activity.
The fair value of RSUs and PSUs without a market condition is equal to the closing sale price of the Company's common stock on the date of grant. The fair value of the RTSR PSU award was estimated on the date of grant using the Monte Carlo Simulation method utilizing the following assumptions. Expected volatility was based on historical volatilities of the Company and select comparable companies.
|
| | | |
| | 2017 RTSR PSU |
| Weighted average grant date fair value | $ | 27.98 |
|
| Weighted average expected volatility | 29.0 | % |
| Weighted average volatility of XHB | 18.4 | % |
| Weighted average correlation coefficient | 0.53 |
|
| Weighted average risk-free interest rate | 1.5 | % |
| Weighted average dividend yield | — |
|
A summary of RSU activity for the nine months ended September 30, 2017 is presented below (number of shares in millions):
|
| | | | | | |
| | Restricted
Stock Units | | Weighted Average Grant Date Fair Value |
| Unvested at January 1, 2017 | 1.4 |
| | $ | 37.53 |
|
| Granted | 1.1 |
| | 28.22 |
|
| Vested (a) | (0.6 | ) | | 39.56 |
|
| Forfeited | (0.1 | ) | | 30.82 |
|
| Unvested at September 30, 2017 | 1.8 |
| | $ | 31.34 |
|
______________ | |
(a) | The total fair value of RSUs which vested during the nine months ended September 30, 2017 was $26 million. |
A summary of PSU activity for the nine months ended September 30, 2017 is presented below (number of shares in millions):
|
| | | | | | |
| | Performance Share Units (a) | | Weighted Average Grant Date Fair Value |
| Unvested at January 1, 2017 | 1.0 |
| | $ | 36.66 |
|
| Granted | 0.7 |
| | 27.70 |
|
| Vested | — |
| | — |
|
| Forfeited | — |
| | — |
|
| Unvested at September 30, 2017 | 1.7 |
| | $ | 32.71 |
|
______________
| |
(a) | The PSU amounts in the table are shown at the target amount of the award. |
The fair value of the options was estimated on the date of grant using the Black-Scholes option-pricing model. Expected volatility was based on historical volatilities of the Company and select comparable companies. The expected term of the options granted represents the period of time that options are expected to be outstanding and is based on the simplified method. The risk-free interest rate was based on the U.S. Treasury yield curve in effect at the time of the grant, which corresponds to the expected term of the options.
|
| | | |
| | 2017 Options |
| Weighted average grant date fair value | $ | 8.00 |
|
| Weighted average expected volatility | 30.7 | % |
| Weighted average expected term (years) | 6.25 |
|
| Weighted average risk-free interest rate | 2.1 | % |
| Weighted average dividend yield | 1.3 | % |
A summary of stock option unit activity for the nine months ended September 30, 2017 is presented below (number of shares in millions):
|
| | | | | | |
| | Options | | Weighted Average Exercise Price |
| Outstanding at January 1, 2017 | 3.3 |
| | $ | 31.69 |
|
| Granted | 0.4 |
| | 27.56 |
|
| Exercised (a) (b) | (0.3 | ) | | 23.77 |
|
| Forfeited/Expired | — |
| | — |
|
| Outstanding at September 30, 2017 (c) | 3.4 |
| | $ | 31.52 |
|
______________
| |
(a) | The intrinsic value of options exercised during the nine months ended September 30, 2017 was $2 million. |
| |
(b) | Cash received from options exercised during the nine months ended September 30, 2017 was $7 million. |
| |
(c) | Options outstanding at September 30, 2017 have an intrinsic value of $6 million and have a weighted average remaining contractual life of 5.8 years. |
Stock-Based Compensation Expense
As of September 30, 2017, based on current performance achievement expectations, there was $45 million of unrecognized compensation cost related to incentive equity awards under the plans which will be recorded in future periods as compensation expense over a remaining weighted average period of approximately 1.2 years. The Company recorded stock-based compensation expense related to the incentive equity awards of $12 million and $38 million for the three and nine months ended September 30, 2017, respectively, and $14 million and $39 million for the three and nine months ended September 30, 2016, respectively.
8.7. EARNINGS (LOSS) PER SHARE
Earnings (loss) per share attributable to Realogy Holdings
Basic earnings (loss) per common share is computed based on net income attributable to Realogy Holdings stockholders divided by the basic weighted-averageweighted average number of shares of common stock outstanding during the period. Diluted earnings (loss) per common share is computed based on the weighted average number of shares of common stock outstanding, plus the effect of dilutive potential common shares outstanding during the period.period using the treasury stock method. Dilutive potential common shares include shares the Company could be obligated to issue from its Exchangeable Senior Notes and warrants (see Note 4. "Short and Long-Term Debt", to the Condensed Consolidated Financial Statements for further discussion) and unvested stock-based awards. The following table sets forth the computation of basic and diluted earnings (loss) per share:
| | | | | | | | | | | | | | | | | | | | | | | |
| Three Months Ended
June 30, | | Six Months Ended
June 30, |
| (in millions, except per share data) | 2021 | | 2020 | | 2021 | | 2020 |
| Numerator: | | | | | | | |
| Net income (loss) attributable to Realogy Holdings shareholders | $ | 149 | | | $ | (14) | | | $ | 182 | | | $ | (476) | |
| Denominator: | | | | | | | |
| Weighted average common shares outstanding (denominator for basic earnings (loss) per share calculation) | 116.5 | | | 115.4 | | | 116.2 | | | 115.0 | |
| Dilutive effect of stock-based compensation | 2.8 | | | 0 | | | 3.2 | | | 0 | |
| Dilutive effect of Exchangeable Senior Notes and warrants | 0 | | | 0 | | | 0 | | | 0 | |
| Weighted average common shares outstanding (denominator for diluted earnings (loss) per share calculation) | 119.3 | | | 115.4 | | | 119.4 | | | 115.0 | |
| Earnings (loss) per share attributable to Realogy Holdings shareholders: |
| Basic earnings (loss) per share | $ | 1.28 | | | $ | (0.12) | | | $ | 1.57 | | | $ | (4.14) | |
| Diluted earnings (loss) per share | $ | 1.25 | | | $ | (0.12) | | | $ | 1.52 | | | $ | (4.14) | |
The three and six months ended June 30, 2021 exclude 4.7 million and 4.4 million shares, respectively, of common stock issuable for incentive equity awards, which include performance share units based on the achievement of target amounts, that are anti-dilutive to the diluted earnings per share is computed consistently withcomputation. The Company was in a net loss position for the basicthree and six months ended June 30, 2020 and therefore the impact of incentive equity awards were excluded from the computation while giving effectof dilutive loss per share as the inclusion of such amounts would be anti-dilutive. Shares to all dilutive potential common shares and common share equivalents that were outstanding during the period. Realogy Holdings uses the treasury stock methodbe provided to reflect the potential dilutive effect of unvested stock awards and unexercised options.
|
| | | | | | | | | | | | | | | |
| | Three Months Ended September 30, | | Nine Months Ended September 30, |
| (in millions, except per share data) | 2017 | | 2016 | | 2017 | | 2016 |
| Net income attributable to Realogy Holdings shareholders | $ | 95 |
| | $ | 106 |
| | $ | 176 |
| | $ | 156 |
|
| Basic weighted average shares | 136.1 |
| | 144.0 |
| | 137.8 |
| | 145.4 |
|
| Stock options, restricted stock units and performance share units (a) | 2.0 |
| | 1.1 |
| | 1.6 |
| | 1.2 |
|
| Weighted average diluted shares | 138.1 |
| | 145.1 |
| | 139.4 |
| | 146.6 |
|
| Earnings Per Share: | | | | | | | |
| Basic | $ | 0.70 |
| | $ | 0.74 |
| | $ | 1.28 |
| | $ | 1.07 |
|
| Diluted | $ | 0.69 |
| | $ | 0.73 |
| | $ | 1.26 |
| | $ | 1.06 |
|
_______________
| |
(a) | The three and nine months ended September 30, 2017 respectively exclude 4.9 million and 5.3 million shares of common stock issuable for incentive equity awards, which includes performance share units based on the achievement of target amounts, that are anti-dilutive to the diluted earnings per share computation. The three and nine months ended September 30, 2016 respectively exclude 5.2 million and 5.1 million shares of common stock issuable for incentive equity awards, which includes performance share units based on the achievement of target amounts, that are anti-dilutive to the diluted earnings per share computation. |
In the third quarter of 2017, the Company repurchasedfrom the exchangeable note hedge transactions purchased concurrently with its issuance of Exchangeable Senior Notes are anti-dilutive and retired 1.8 million shares of common stock for $58 million at a weighted average market price of $33.83 per share. For the nine months ended September 30, 2017, the Company repurchased and retired 5.9 million shares of common stock for $178 million at a weighted average market price of $30.40 per share. The shares repurchased include 77,900 shares for which the trade date occurredare not included in late September 2017 while settlement occurred in October 2017. The purchase of shares under this plan reduces the weighted-average number of shares outstanding in the basic earnings per share calculation.its diluted shares.
| |
9. | COMMITMENTS AND CONTINGENCIES |
8. COMMITMENTS AND CONTINGENCIES
Litigation
The Company is involved in claims, legal proceedings, alternative dispute resolution and governmental inquiries related to alleged contract disputes, business practices, intellectual property and other commercial, employment, regulatory and tax matters. Examples of such matters include but are not limited to allegations:
•concerning anti-trust and anti-competition matters (including claims related to NAR or MLS rules regarding buyer broker commissions);
•that the Company is vicariously liable for the acts of franchisees under theories of actual or apparent agency;
by current or former franchisees that franchise agreements were breached including improper terminations;
concerning claims for alleged RESPA or state real estate law violations including but not limited to claims challenging the validity of sales associates indemnification, and administrative fees;
thatindependent residential real estate sales associatesagents engaged by NRT—Realogy Brokerage Group or by affiliated franchisees—under certain state or federal laws—are potentially employees instead of independent contractors, and they or regulators therefore may bring claims against NRTRealogy Brokerage Group for breach of contract, wage and hour classification claims, wrongful discharge, unemployment and workers' compensation and could seek benefits,
back wages, overtime, indemnification, penalties related to classification practices and expense reimbursement available to employees;employees or make similar claims against Realogy Franchise Group as an alleged joint employer of an affiliated franchisee’s independent sales agents;
•concerning other employment law matters, including other types of worker classification claims as well as wage and hour claims and retaliation claims;
•that the Company is vicariously liable for the acts of franchisees under theories of actual or apparent agency;
•by current or former franchisees that franchise agreements were breached including improper terminations;
•concerning alleged RESPA or state real estate law violations;
•concerning claims related to the Telephone Consumer Protection Act, including autodialer claims;
•concerning claims generally against the company owned brokerage operations for negligence, misrepresentation or breach of fiduciary duty in connection with the performance of real estate brokerage or other professional services as well as other brokerage claims associated with listing information and property history;
•related to copyright law, including infringement actions alleging improper use of copyrighted photographs on websites or in marketing materials without consent of the copyright holder or claims challenging our trademarks;
•concerning breach of obligations to make websites and other services accessible for consumers with disabilities;
•concerning claims generally against the title companyagent contending that as the escrow company, the companyagent knew or should have known that a transaction was fraudulent or concerning otherthat the agent was negligent in addressing title defects or settlement errors; andconducting the settlement;
•concerning information security, including claims under new and cyber crime.emerging data privacy laws related to the protection of customer, employee or third-party information;
•concerning cyber-crime, including claims related to the diversion of homesale transaction closing funds; and
•those related to general fraud claims.
Worker Classification Litigation
Whitlach v. Premier Valley, Inc. d/b/a Century 21 M&M and Century 21 Real Estate LLC (Superior Court of California, Stanislaus County). This was filed as a putative class action complaint on December 20, 2018 by plaintiff James Whitlach against Premier Valley Inc., a Century 21 Real Estate independently-owned franchisee doing business as Century 21 M&M (“Century 21 M&M”). The complaint also names Century 21 Real Estate LLC, a wholly-owned subsidiary of the Company and the franchisor of Century 21 Real Estate (“Century 21”), as an alleged joint employer of the franchisee’s independent sales agents and seeks to certify a class that could potentially include all agents of both Century 21 M&M and Century 21 in California. In February 2019, the plaintiff amended his complaint to assert claims pursuant to the California Private Attorneys General Act (“PAGA”). Following the Court's dismissal of the plaintiff's non-PAGA claims without prejudice in June 2019, the plaintiff filed a second amended complaint asserting one cause of action for alleged civil penalties under PAGA in June 2020 and continued to pursue his PAGA claims as a representative of purported "aggrieved employees" as defined by PAGA. As such representative, the plaintiff seeks all non-individualized relief available to the purported aggrieved employees under PAGA, as well as attorneys’ fees. Under California law, PAGA claims are generally not subject to arbitration and may result in exposure in the form of additional penalties.
In the second amended complaint, the plaintiff continues to allege that Century 21 M&M misclassified all of its independent real estate agents, salespeople, sales professionals, broker associates and other similar positions as independent contractors, failed to pay minimum wages, failed to provide meal and rest breaks, failed to pay timely wages, failed to keep proper records, failed to provide appropriate wage statements, made unlawful deductions from wages, and failed to reimburse plaintiff and the putative class for business related expenses, resulting in violations of the California Labor Code. The demurrer filed by Century 21 M&M (and joined by Century 21) on August 3, 2020 to the plaintiff's amended complaint, was granted by the Court on November 10, 2020, dismissing the case without leave to replead. In January 2021, the plaintiff filed a notice of appeal of the Court’s order granting the demurrer and filed its brief in support of the appeal on June 28, 2021. This case raises various previously unlitigated claims and the PAGA claim adds additional litigation, financial and operating uncertainties.
Real Estate BusinessIndustry Litigation
Dodge, et al.Moehrl, Cole, Darnell, Nager, Ramey, Sawbill Strategic, Inc., Umpa and Ruh v. PHH Corporation, et al.The National Association of Realtors, Realogy Holdings Corp., formerly captioned Strader, et al.Homeservices of America, Inc., BHH Affiliates, LLC, The Long & Foster Companies, Inc., RE/MAX LLC, and HallKeller Williams Realty, Inc. (U.S. District Court for the Northern District of Illinois). This amended putative class action complaint (the "amended Moehrl complaint"), filed on June 14, 2019, (i) consolidates the Moehrl and Sawbill litigation reported in our Form 10-Q for the period ended March 31, 2019, (ii) adds certain plaintiffs and defendants, and (iii) serves as a response to the separate motions to dismiss filed on May 17, 2019 in the prior Moehrl litigation by each of NAR and the Company (along with the other defendants named in the prior Moehrl complaint).
In the amended Moehrl complaint, the plaintiffs allege that the defendants engaged in a continuing contract, combination, or conspiracy to unreasonably restrain trade and commerce in violation of Section 1 of the Sherman Act because defendant NAR allegedly established mandatory anticompetitive policies for the multiple listing services and its member brokers that require brokers to make an offer of buyer broker compensation when listing a property. The plaintiffs further allege that commission sharing, which provides for the broker representing the seller sharing or paying a portion of its commission to the broker representing the buyer, is anticompetitive and violates the Sherman Act, and that the defendant franchisors conspired with NAR by requiring their respective franchisees to comply with NAR’s policies and Code of Ethics. The plaintiffs seek a permanent injunction enjoining the defendants from requiring home sellers to pay buyer broker commissions or to otherwise restrict competition among buyer brokers, an award of damages and/or restitution, attorneys fees and costs of suit. In October 2019, the Department of Justice ("DOJ") filed a statement of interest for this matter, in their words “to correct the inaccurate portrayal, by defendant The National Association of Realtors (‘NAR’), of a 2008 consent decree between the United States and NAR.” A motion to appoint lead counsel in the case was granted on an interim basis by the Court in May 2020. In October 2020, the Court denied the separate motions to dismiss filed in August 2019 by each of NAR and the Company (together with the other defendants named in the amended Moehrl complaint). Discovery between the plaintiffs and defendants is ongoing.
Sitzer and Winger v. PHH Corporation, et al.The National Association of Realtors, Realogy Holdings Corp., Homeservices of America, Inc., RE/MAX Holdings, Inc., and Keller Williams Realty, Inc. (U.S. District Court for the CentralWestern District of California)Missouri). This is a purportedputative class action broughtcomplaint filed on April 29, 2019 and amended on June 21, 2019 against NAR, the Company, Homeservices of America, Inc., RE/MAX Holdings, Inc., and Keller Williams Realty, Inc. The complaint contains substantially similar allegations, and seeks the same relief under the Sherman Act, as the Moehrl litigation. The Sitzer litigation is limited both in allegations and relief sought to the State of Missouri and includes an additional cause of action for alleged violation of the Missouri Merchandising Practices Act, or MMPA. On August 22, 2019, the Court denied defendants' motions to transfer the Sitzer matter to the U.S. District Court for the Northern District of Illinois and on October 16, 2019, denied the motions to dismiss this litigation filed respectively by fourNAR and the Company (together with the other named brokerage/franchisor defendants). In September 2019, the DOJ filed a statement of interest and appearances for this matter for the same purpose stated in the Moehrl matter. In July 2020, the DOJ requested the Company provide it with all materials produced for Sitzer, with such request related to and preceding the subsequent civil lawsuit filed and related settlement agreement between the DOJ and NAR in November 2020. In July 2021, the DOJ filed a notice of withdrawal of consent to its November 2020 proposed settlement with NAR and submitted an additional request to the Company for any supplemental materials produced in Sitzer. Plaintiffs filed their motion for class certification on May 24, 2021 and on June 30, 2021, filed a second amended complaint limiting the class definition to home sellers who used a listing broker affiliated with one of the defendants, among other things. Discovery between the plaintiffs and defendants is ongoing.
Leeder v. The National Association of Realtors, Realogy Holdings Corp., Homeservices of America, Inc., BHH Affiliates, LLC, HSF Affiliates, LLC, The Long & Foster Companies, Inc., RE/MAX LLC, and Keller Williams Realty, Inc. (U.S. District Court for the Northern District of Illinois Eastern Division). In this putative class action filed on January 25, 2021, the plaintiff takes issue with certain NAR policies, including those related to buyer broker compensation at issue in the Moehrl and Sitzer matters as well as those at issue in the 2020 settlement between the DOJ and NAR, but claims the alleged conspiracy has harmed buyers (instead of sellers). The plaintiff alleges that the defendants made agreements and engaged in a conspiracy in restraint of trade in violation of the Sherman Act and were unjustly enriched, and seek a permanent injunction enjoining NAR from establishing in the future the same or similar rules, policies, or practices as those challenged in the action as well as an award of damages and/or restitution, interest, and reasonable attorneys’ fees and expenses. The Company (together with the other companies named in the complaint) filed a motion to dismiss the complaint on April 20, 2021 and, on June 4, 2021, the plaintiff filed his opposition to which the defendants replied on July 6, 2021.
Conti v. San Francisco Association of Realtors, National Association of Realtors, Greater San Diego Association of Realtors, Realogy Holdings Corp., Compass SF I, Inc., Sotheby’s International Realty, Homeservices of America, Inc., Rodeo Realty, Inc., RE/MAX Holdings, Inc., and Keller Williams Realty, Inc. (U.S. District Court for the Northern District of California residents againstSan Francisco Division). In this putative class action filed on March 19, 2021, the plaintiff raises claims regarding the NAR policies and rules similar to those at issue in the Leeder matter, alleging violations of the Sherman Act, the California Cartwright Act, the California Unfair Competition Law as well as unjust enrichment claims. The plaintiff seeks a permanent injunction enjoining NAR from establishing in the future the same or similar rules, policies, or practices as those challenged in the action as well as an award of damages and/or restitution, interest, and reasonable attorneys’ fees and expenses. On May 27, 2021, the plaintiff filed a notice of voluntary dismissal without prejudice.
Rubenstein, Nolan v. The National Association of Realtors, Realogy Holdings Corp., Coldwell Banker, Sotheby’s Investment Realty, and Homeservices of America, Inc. (U.S. District Court for the District of Connecticut). In this putative class action, the plaintiffs take issue with the same NAR policies related to buyer broker compensation at issue in the Moehrl and Sitzer matters, but claim the alleged conspiracy has harmed buyers (instead of sellers) and is a federal racketeering violation (instead of a violation of federal antitrust law). In October 2020, the plaintiffs filed a statement with the Court outlining the alleged racketeering violations. The Company filed its motion to dismiss the amended complaint in November 2020 and in January 2021, the plaintiffs filed their objections and opposition. In January 2021, the Court granted defendants’ motion to stay discovery pending its determination of the pending motion to dismiss. On July 26, 2021, the Court dismissed this action with prejudice.
Bauman, Bauman and Nosalek v. MLS Property Information Network, Inc., Realogy Holdings Corp., Homeservices of America, Inc., BHH Affiliates, LLC, HSF Affiliates, LLC, RE/MAX LLC, and Keller Williams Realty, Inc. (U.S. District Court for the District of Massachusetts). This is a putative class action filed on December 17, 2020, wherein the plaintiffs take issue with policies and rules similar to those at issue in the Moehrl, Sitzer and Rubenstein matters, but rather than objecting to the national policies and rules published by NAR, this lawsuit specifically objects to the alleged policies and rules of a multiple listing service that is owned by realtors, including in part by one of Realogy’s company-owned brokerages. The plaintiffs allege that the defendants made agreements and engaged in a conspiracy in restraint of trade in violation of the Sherman Act and seek a permanent injunction, enjoining the defendants from continuing conduct determined to be unlawful, as well as an award of damages and/or restitution, interest, and reasonable attorneys’ fees and expenses. The Company (together with the other companies named in the complaint) filed a motion to dismiss the complaint in March 2021 and, on April 15, 2021, the plaintiffs filed their opposition to which the defendants including replied on May 17, 2021.
The Company disputes the allegations in each of the captioned matters described above and will vigorously defend these actions. Given the early stages of each of these cases, we cannot estimate a range of reasonably possible losses for this litigation.
The Company believes that it has adequately accrued for legal matters as appropriate. The Company records litigation accruals for legal matters which are both probable and estimable.
Litigation and other disputes are inherently unpredictable and subject to substantial uncertainties and unfavorable resolutions could occur. In addition, class action lawsuits can be costly to defend and, depending on the class size and claims, could be costly to settle. As such, the Company could incur judgments or enter into settlements of claims with liability that are materially in excess of amounts accrued and these settlements could have a material adverse effect on the Company’s financial condition, results of operations or cash flows in any particular period.
* * *
Company-Initiated Litigation
Realogy Holdings Corp., NRT New York LLC (d/b/a The Corcoran Group), Sotheby’s International Realty, Inc., Coldwell Banker Residential Brokerage Company, Coldwell Banker Residential Real Estate LLC, NRT West, Inc., Martha Turner Properties, L.P. And Better Homes and Gardens Real Estate LLC v. Urban Compass, Inc., and Compass, Inc. (Supreme Court New York, New York County). On July 10, 2019, the Company and certain of its subsidiaries PHH Corporationfiled a complaint against Urban Compass, Inc. and PHH Home Loans, LLC (a joint venture between RealogyCompass, Inc. (together, "Compass") alleging misappropriation of trade secrets; tortious interference with contract; intentional and PHH), allegingtortious interference with prospective economic advantage; unfair competition under New York common law; violations of the California Unfair Competition Law, Business and Professional Code Section 8(a)17200 et. seq. (unfair competition); violations of RESPA. Plaintiffs seekNew York General Business Law Section 349 (deceptive acts or practices); violations of New York General Business Law Sections 350 and 350-a (false advertising); conversion; and
aiding and abetting breach of contract. The Company seeks, among other things, actual and compensatory damages, injunctive relief, and attorneys’ fees and costs. The Company subsequently amended its complaint (which, among other things, withdrew the count for aiding and abetting breach of contract and added a count for defamation). Beginning in September 2019, Compass filed a series of motions, which the Company opposed, including a motion to represent two subclasses compriseddismiss and a motion to compel arbitration with respect to certain claims involving Corcoran. In June 2020, having previously denied certain portions of all personsCompass’ motion to dismiss, the Court denied the balance of the motion to dismiss, and denied as moot Compass’ motion to compel arbitration, granting the Company leave to amend the allegations in its complaint that relate to Corcoran’s exclusive listings in order to clarify the claims and damages sought in the United States who, sinceaction. The Company filed its amended complaint in July 2020. In December 2020, the Court denied a motion to compel arbitration filed by Compass in September 2020 with respect to certain claims in the Company's amended complaint concerning or purportedly related to Corcoran and Sotheby’s International Realty, Inc. Compass subsequently filed an appellate brief appealing the Court's denial. On June 1, 2021, the Appellate Division affirmed the Court's denial of Compass' motion to compel arbitration. In January 31, 2005, (1) obtained a RESPA-covered mortgage loan from either (a) PHH Home Loans, LLC or one2021, Compass filed its answer to the Company’s amended complaint, as well as counterclaims and third-party claims against the Company and certain of its subsidiaries, or (b) onealleging unfair competition, tortious interference with prospective business relations, defamation, injurious falsehoods, and misappropriation of trade secrets. The third-party claim names a Company-affiliated franchise brokerage and an independent contractor for that franchise. Compass seeks compensatory and punitive damages, injunctive relief, disgorgement of profits, interest and attorneys’ fees. In March 2021, the Company filed a motion to dismiss (with respect to certain counterclaims) and a reply (to the remaining counts of the mortgage services managed by PHH Corporation for other lenders, and (2) paidcounterclaims). On April 22, 2021, pursuant to a fee for title insurance or settlement services to TRG or onestipulation of its subsidiaries. Plaintiffs allege, among other things, that PHH Home Loans, LLC operates in violation of RESPA and that the other defendants violate RESPA by referring business to one another under agreements or arrangements. Plaintiffs seek treble damages and an award of attorneys’ fees, costs and disbursements. On May 19, 2017, the parties, held a mediation session, at which they agreed in principle to a settlementthe Court ordered the dismissal without prejudice of the action, pursuant to whichCompass’s third-party claims and those counterclaims against the Company would pay approximately $8 million (or one-halfrelated to unfair competition under New York common law, conspiracy and misappropriation of the settlement). As a result, the Company accrued $8 milliontrade secrets. Discovery in the second quarter of 2017 and the liabilitycase is included in accrued expenses and other current liabilities on the Condensed Consolidated Balance Sheets. On July 31, 2017, the fourth amended complaint was filed changing the named plaintiffs. At a hearing on the plaintiffs' motion for preliminary approval of the settlement held October 19, 2017, the Court indicated that if certain modest revisions are made to the settlement agreement and an amended motion for preliminary approval is filed by no later than November 3, 2017, the Court will grant preliminary approval to the settlement; however, there can be no assurance that the parties will reach a definitive settlement or that the Court will approve it.continuing.
* * *
The Company is involved in certain other claims and legal actions arising in the ordinary course of our business. Such litigation, regulatory actions and other proceedings may include, but are not limited to, actions relating to intellectual property, commercial arrangements, indemnification (under contract or common law), franchising arrangements, actions against our title company alleging it knew or should have known that others were committing mortgage fraud,the fiduciary duties of brokers, standard brokerage disputes like the failure to disclose accurate square footage or hidden defects in the property such as mold, vicarious liability based upon conduct of individuals or entities outside of our control, including franchisees and independent sales associates,agents, antitrust and anti-competition claims (including claims related to NAR or MLS rules regarding buyer broker commissions), general fraud claims (including wire fraud associated with third-party diversion of funds from a brokerage transaction), claims under the False Claims Act (or similar state laws), consumer lending and debt collection law claims, employment law claims, including claims challenging the classification of ourindependent sales associatesagents as independent contractors, wage and hour classificationrelated claims, and claims related to business actions responsive to the COVID-19 outbreak and governmental and regulatory directives thereto, and claims alleging violations of RESPA, or state consumer fraud statutes or federal consumer protection statutes. While the results of such claims and legal actions cannot be predicted with certainty, we do not believe based on information currently available to us that the final outcome of current proceedings against the Company will have a material adverse effect on our consolidated financial position, results of operations or cash flows. In addition, with the increasing requirements resulting from government laws and regulations concerning data breach notifications and data privacy and protection obligations, claims associated with these laws may become more common. While most litigation involves claims against the Company, from time to time the Company commences litigation, including litigation against former employees, franchisees and competitors when it alleges that such persons or entities have breached agreements or engaged in other wrongful conduct.
* * *
Cendant Corporate LitigationLiabilities and Guarantees to Cendant and Affiliates
Realogy Group (then Realogy Corporation) separated from Cendant on July 31, 2006 (the "Separation"), pursuant to a plan by Cendant (now known as Avis Budget Group, Inc.) to separate into four4 independent companies—one1 for each of Cendant's business units—real estate services (Realogy Group), travel distribution services ("Travelport"), hospitality services, including timeshare resorts ("Wyndham Worldwide"), and vehicle rental ("Avis Budget Group"). Pursuant to the Separation and Distribution Agreement dated as of July 27, 2006 among Cendant, Realogy Group, Wyndham Worldwide and Travelport (the "Separation and Distribution Agreement"), each of Realogy Group, Wyndham Worldwide and Travelport have assumed certain contingent and other corporate liabilities (and related costs and expenses), which are primarily related to each of their respective businesses. In addition, Realogy Group has assumed 62.5% and Wyndham Worldwide has assumed 37.5% of certain contingent and other corporate liabilities (and related costs and expenses) of Cendant or its subsidiaries, which are not primarily related to any of the respective businesses of Realogy Group, Wyndham Worldwide, Travelport and/or Cendant’s vehicle rental operations, in each case incurred or allegedly incurred on or prior to the date of the separation of Travelport from Cendant.
* * *
The Company believes that it has adequately accrued for legal matters as appropriate. The Company records litigation accruals for legal matters which are both probable and estimable.
Litigation and other disputes are inherently unpredictable and subject to substantial uncertainties and unfavorable resolutions could occur. In addition, class action lawsuits can be costly to defend and, depending on the class size and claims, could be costly to settle. As such, the Company could incur judgments or enter into settlements of claims with
liability that are materially in excess of amounts accrued and these settlements could have a material adverse effect on the Company’s financial condition, results of operations or cash flows in any particular period.
Transfer of Cendant Corporate Liabilities, Issuance of Guarantees to Cendant and Affiliates and Contingent Liability Letter of Credit
Realogy Group has certain guarantee commitments with Cendant (pursuant to the assumption of certain liabilities and the obligation to indemnify Cendant, Wyndham Worldwide and Travelport for such liabilities). These guarantee arrangements primarily relate to certain contingent litigation liabilities, contingent tax liabilities, and other corporate liabilities, of which Realogy Group assumed and is generally responsible for 62.5%. Upon separation from Cendant, the liabilities assumed by Realogy Group were comprised of certain Cendant corporate liabilities which were recorded on the historical books of Cendant as well as additional liabilities which were established for guarantees issued at the date of Separation related to certain unresolved contingent matters that could arise during the guarantee period. Regarding the guarantees, if any of the companies responsible for all or a portion of such liabilities were to default in its payment of costs or expenses related to any such liability, Realogy Group would be responsible for a portion of the defaulting party or parties’ obligation. To the extent such recorded liabilities are in excess or are not adequate to cover the ultimate payment amounts, such excess or deficiency will be reflected in the results of operations in future periods.
In April 2007, the Company established a standby irrevocable letter of credit for the benefit of Avis Budget Group in accordance with the Separation and Distribution Agreement. The letter of credit was utilized to support the Company’s payment obligations with respect to its share of Cendant contingent and other corporate liabilities. The stated amount of the standby irrevocable letter of credit was subject to periodic adjustment to reflect the then current estimate of Cendant contingent and other liabilities. The standby irrevocable letter of credit terminates if (i) the Company’s senior unsecured credit rating is raised to BB by Standard and Poor’s or Ba2 by Moody’s or (ii) the aggregate value of the former parent contingent liabilities falls below $30 million.
The letter of credit was $53 million at December 31, 2016. With the resolution of a Cendant legacy tax matter in the third quarter of 2017, the aggregate value of the former parent contingent liabilities fell below $30 million to $18 million and therefore the standby irrevocable letter of credit was terminated in accordance with the agreement.
The due to former parent balance was $18 million and $28$19 million at Septemberboth June 30, 20172021 and December 31, 2016, respectively.2020. The due to former parent balance was comprised of the Company’s portion of the following: (i) Cendant’s remaining state and foreign contingent tax liabilities, (ii) accrued interest on contingent tax liabilities, (iii) potential liabilities related to Cendant’s terminated or divested businesses, and (iv)(iii) potential liabilities related to the residual portion of accruals for Cendant operations.
Tax Matters
The Company is subject to income taxes in the United States and several foreign jurisdictions. Significant judgment is required in determining the worldwide provision for income taxes and recording related assets and liabilities. In the ordinary course of business, there are many transactions and calculations where the ultimate tax determination is uncertain. The Company is regularly under audit by tax authorities whereby the outcome of the audits is uncertain. The Company believes there is appropriate support for positions taken on its tax returns. The liabilities that have been recorded represent the best estimates of the probable loss on certain positions and are adequate for all open years based on an assessment of many factors including past experience and interpretations of tax law applied to the facts of each matter. However, the outcomes of tax audits are inherently uncertain.
Under the Tax Sharing Agreement with Cendant, Wyndham Worldwide and Travelport, the Company is generally responsible for 62.5% of payments made to settle claims with respect to tax periods ending on or prior to December 31, 2006 that relate to income taxes imposed on Cendant and certain of its subsidiaries, the operations (or former operations) of which were determined by Cendant not to relate specifically to the respective businesses of Realogy, Wyndham Worldwide, Avis Budget or Travelport.
With respect to any remaining legacy Cendant tax liabilities, the Company and its former parent believe there is appropriate support for the positions taken on Cendant’s tax returns. However, tax audits and any related litigation, including disputes or litigation on the allocation of tax liabilities between parties under the Tax Sharing Agreement, could result in outcomes for the Company that are different from those reflected in the Company’s historical financial statements.
Escrow and Trust Deposits
As a service to its customers, the Company administers escrow and trust deposits which represent undisbursed amounts received for the settlement of real estate transactions. Deposits at FDIC-insured institutions are insured up to $250 thousand.$250 thousand. These escrow and trust deposits totaled $472$1,103 million at SeptemberJune 30, 20172021 and $415$585 million at December 31, 2016.2020, respectively. These escrow and trust deposits are not assets of the Company and, therefore, are excluded from the accompanying Condensed Consolidated Balance Sheets. However, the Company remains contingently liable for the disposition of these deposits.
9. SEGMENT INFORMATION
The reportable segments presented below represent the Company’s operating segments for which separate financial information is available and which is utilized on a regular basis by its chief operating decision maker to assess performance and to allocate resources. In identifying its reportable segments, the Company also considers the nature of services provided by its operating segments. Management evaluates the operating results of each of its reportable segments based upon revenue and Operating EBITDA. Operating EBITDA which is defined by us as net income (loss) before depreciation and amortization, interest (income) expense, net (other than Relocation Servicesrelocation services interest for relocation receivablessecuritization assets and securitization obligations) and, income taxes, eachand other items that are not core to the operating activities of which is presented in the Company’s Condensed Consolidated StatementsCompany such as restructuring charges, former parent legacy items, gains or losses on the early extinguishment of Operations.debt, impairments, gains or losses on discontinued operations and gains or losses on the sale of investments or other assets. The Company’s presentation of Operating EBITDA may not be comparable to similar measures used by other companies.
|
| | | | | | | | | | | | | | | |
| | Revenues (a) (b) |
| | Three Months Ended September 30, | | Nine Months Ended September 30, |
| | 2017 | | 2016 | | 2017 | | 2016 |
| Real Estate Franchise Services | $ | 224 |
| | $ | 215 |
| | $ | 631 |
| | $ | 593 |
|
| Company Owned Real Estate Brokerage Services | 1,267 |
| | 1,231 |
| | 3,556 |
| | 3,340 |
|
| Relocation Services | 111 |
| | 116 |
| | 290 |
| | 308 |
|
| Title and Settlement Services | 154 |
| | 164 |
| | 431 |
| | 424 |
|
| Corporate and Other (c) | (82 | ) | | (82 | ) | | (238 | ) | | (225 | ) |
| Total Company | $ | 1,674 |
| | $ | 1,644 |
| | $ | 4,670 |
| | $ | 4,440 |
|
| | | | | | | | | | | | | | | | | | | | | | | |
| | Revenues (a) |
| | Three Months Ended June 30, | | Six Months Ended June 30, |
| | 2021 | | 2020 | | 2021 | | 2020 |
| Realogy Franchise Group | $ | 347 | | | $ | 227 | | | $ | 601 | | | $ | 447 | |
| Realogy Brokerage Group | 1,791 | | | 933 | | | 2,962 | | | 1,802 | |
| Realogy Title Group | 255 | | | 160 | | | 456 | | | 297 | |
| Corporate and Other (b) | (117) | | | (65) | | | (196) | | | (123) | |
| Total Company | $ | 2,276 | | | $ | 1,255 | | | $ | 3,823 | | | $ | 2,423 | |
_______________
| |
(a) | Transactions between segments are eliminated in consolidation. Revenues for the Real Estate Franchise Services segment include intercompany royalties and marketing fees paid by the Company Owned Real Estate Brokerage Services segment of $82 million and $238 million for the three and nine months ended September 30, 2017, respectively, and $82 million and $225 million for the three and nine months ended September 30, 2016, respectively. Such amounts are eliminated through the Corporate and Other line. |
| |
(b) | Revenues for the Relocation Services segment include intercompany referral commissions paid by the Company Owned Real Estate Brokerage Services segment of $11 million and $31 million for the three and nine months ended September 30, 2017, respectively, and $12 million and $33 million for the three and nine months ended September 30, 2016, respectively. Such amounts are recorded as contra-revenues by the Company Owned Real Estate Brokerage Services segment. There are no other material intersegment transactions. |
| |
(c) | Includes the elimination of transactions between segments. |
(a)Transactions between segments are eliminated in consolidation. Revenues for the Realogy Franchise Group include intercompany royalties and marketing fees paid by Realogy Brokerage Group of $117 million and $196 million for the three and six months ended June 30, 2021, respectively, and $65 million and $123 million for the three and six months ended June 30, 2020, respectively. Such amounts are eliminated through the Corporate and Other line. |
| | | | | | | | | | | | | | | |
| | EBITDA |
| | Three Months Ended September 30, | | Nine Months Ended September 30, |
| | 2017 (a) | | 2016 (b) | | 2017 (c) | | 2016 (d) |
| Real Estate Franchise Services | $ | 159 |
| | $ | 153 |
| | $ | 427 |
| | $ | 394 |
|
| Company Owned Real Estate Brokerage Services | 62 |
| | 74 |
| | 113 |
| | 131 |
|
| Relocation Services | 37 |
| | 40 |
| | 65 |
| | 74 |
|
| Title and Settlement Services | 21 |
| | 23 |
| | 49 |
| | 49 |
|
| Corporate and Other (e) | (25 | ) | | (20 | ) | | (70 | ) | | (60 | ) |
| Total Company | $ | 254 |
| | $ | 270 |
| | $ | 584 |
| | $ | 588 |
|
| Less: | | | | | | | |
| Depreciation and amortization (f) | $ | 51 |
| | $ | 53 |
| | $ | 150 |
| | $ | 149 |
|
| Interest expense, net | 41 |
| | 37 |
| | 127 |
| | 169 |
|
| Income tax expense | 67 |
| | 74 |
| | 131 |
| | 114 |
|
| Net income attributable to Realogy Holdings and Realogy Group | $ | 95 |
| | $ | 106 |
| | $ | 176 |
| | $ | 156 |
|
| | | | | | | | | | | | | | | | | | | | | | | |
| | Operating EBITDA |
| | Three Months Ended June 30, | | Six Months Ended June 30, |
| | 2021 | | 2020 | | 2021 | | 2020 |
| Realogy Franchise Group | $ | 224 | | | $ | 125 | | | $ | 365 | | | $ | 221 | |
| Realogy Brokerage Group | 70 | | | 15 | | | 65 | | | (36) | |
| Realogy Title Group | 55 | | | 61 | | | 116 | | | 73 | |
| Corporate and Other (a) | (39) | | | (26) | | | (74) | | | (51) | |
| Total Company | $ | 310 | | | $ | 175 | | | $ | 472 | | | $ | 207 | |
| | | | | | | |
| Less: Depreciation and amortization | 51 | | | 46 | | | 102 | | | 91 | |
| Interest expense, net | 57 | | | 59 | | | 95 | | | 160 | |
| Income tax expense (benefit) | 60 | | | (5) | | | 77 | | | (146) | |
| Restructuring costs, net (b) | 5 | | | 18 | | | 10 | | | 30 | |
| Impairments (c) | 1 | | | 63 | | | 2 | | | 540 | |
| Former parent legacy cost, net (d) | 1 | | | 0 | | | 1 | | | 0 | |
| Loss on the early extinguishment of debt (d) | 1 | | | 8 | | | 18 | | | 8 | |
| Gain on the sale of a business (e) | (15) | | | 0 | | | (15) | | | 0 | |
| Net income (loss) attributable to Realogy Holdings and Realogy Group | $ | 149 | | | $ | (14) | | | $ | 182 | | | $ | (476) | |
_______________
| |
(a) | The three months ended September 30, 2017 includes a net cost of $1 million of former parent legacy items and $1 million related to the loss on the early extinguishment of debt in Corporate and Other, and restructuring charges of $2 million in the Company Owned Real Estate Brokerage Services segment. |
| |
(b) | The three months ended September 30, 2016 includes $9 million of restructuring charges as follows: $1 million in the Real Estate Franchise Services segment, $6 million in the Company Owned Real Estate Brokerage Services segment, $1 million in the Relocation Services segment and $1 million in the Title and Settlement Services segment. |
| |
(c) | The nine months ended September 30, 2017 includes an $8 million expense related to the settlement of the Strader legal matter and $5 million related to the losses on the early extinguishment of debt, partially offset by a net benefit of $10 million of former parent legacy items in Corporate and Other, and $9 million of restructuring charges as follows: $8 million in the Company Owned Real Estate Brokerage Services segment and $1 million in the Real Estate Franchise Services segment. |
| |
(d) | The nine months ended September 30, 2016 includes $30 million of restructuring charges as follows: $4 million in the Real Estate Franchise Services segment, $15 million in the Company Owned Real Estate Brokerage Services segment, $4 million in the Relocation Services segment, $1 million in the Title and Settlement Services segment and $6 million in Corporate and Other, and a net cost of $1 million of former parent legacy items included in Corporate and Other. |
| |
(e) | Includes the elimination of transactions between segments. |
| |
(f) | Depreciation and amortization for both the three and nine months ended September 30, 2017 includes $1 million of amortization expense related to Guaranteed Rate Affinity's purchase accounting included in the "Equity in earnings of unconsolidated entities" line on the Condensed Consolidated Statement of Operations. |
(a)Includes the elimination of transactions between segments.
(b)The three months ended June 30, 2021 includes restructuring charges of $1 million at Realogy Franchise Group, $2 million at Realogy Brokerage Group and $2 million at Corporate and Other.
The three months ended June 30, 2020 includes restructuring charges of $4 million at Realogy Franchise Group, $12 million at Realogy Brokerage Group and $2 million at Realogy Title Group.
The six months ended June 30, 2021 includes restructuring charges of $3 million at Realogy Franchise Group, $4 million at Realogy Brokerage Group and $3 million at Corporate and Other.
The six months ended June 30, 2020 includes restructuring charges of $6 million at Realogy Franchise Group, $21 million at Realogy Brokerage Group and $3 million at Realogy Title Group.
(c)Impairments for the three and six months ended June 30, 2021 primarily relate to lease asset and software impairments.
Non-cash impairments for the three months ended June 30, 2020 include $44 million of impairment charges during the three months ended June 30, 2020 (while Cartus Relocation Services was held for sale) to reduce the net assets to the estimated proceeds and other asset impairments of $19 million primarily related to lease asset impairments.
Non-cash impairments for the six months ended June 30, 2020 include:
•a goodwill impairment charge of $413 million related to Realogy Brokerage Group;
•an impairment charge of $30 million related to Realogy Franchise Group's trademarks;
•$74 million of impairment charges during the six months ended June 30, 2020 (while Cartus Relocation Services was held for sale) to reduce the net assets to the estimated proceeds; and
•other asset impairments of $23 million primarily related to lease asset impairments.
(d)Former parent legacy items and Loss on the early extinguishment of debt are recorded in Corporate and Other.
(e)Gain on the sale of a business is recorded in Realogy Brokerage Group.
On October 23, 2017, the Company announced that Ryan Schneider has been elected as President and Chief Operating Officer of the Company and appointed as a member of the Company’s Board of Directors. In accordance with the succession plan developed by the Board, Mr. Schneider is expected to be named Chief Executive Officer (the “CEO”) by December 31, 2017.
Upon the appointment of Mr. Schneider as CEO on or before December 31, 2017, Richard Smith, the Company’s Chairman and Chief Executive Officer, will retire from the Company and resign from the Board. The Company anticipates that Michael Williams, the Company’s Lead Independent Director, will be named Chairman of the Board upon the appointment of Mr. Schneider as CEO.
On October 23, 2017, the Company amended the employment agreement dated March 13, 2017 with Mr. Smith (the “Amended CEO Employment Agreement”). Under the Amended CEO Employment Agreement, Mr. Smith continues as the Company's CEO and Chairman of the Board until the earlier of (a) the Board appoints a new Chairman of the Board or a new CEO to assume these roles from Mr. Smith and (b) December 31, 2017 (the “Transition Date”). Upon the Transition Date, Mr. Smith’s employment with the Company will terminate and he will resign as an officer and director of the Company, which will be considered a termination by Mr. Smith with good reason under the terms of the Amended CEO Employment Agreement. As previously agreed under Mr. Smith's employment agreement, upon such a termination, subject to his continued compliance with his restrictive covenants and the execution and non-revocation of a release of claims, the Company will provide Mr. Smith with severance payments and benefits, including an amount equal to 2.4 times the sum of his annual base salary and target annual bonus, payable in 24 equal monthly installments (or $6 million).
Item 2. Management's Discussion and Analysis of Financial Condition and Results of Operations.
The following discussion and analysis should be read in conjunction with our Condensed Consolidated Financial Statements and accompanying notes thereto included elsewhere herein and with our Consolidated Financial Statements and accompanying notes included in the 20162020 Form 10-K. Unless otherwise noted, all dollar amounts in tables are in millions. Neither Realogy Holdings, the indirect parent of Realogy Group, nor Realogy Intermediate, the direct parent company of Realogy Group, conducts any operations other than with respect to its respective direct or indirect ownership of Realogy Group. As a result, the condensed consolidated financial positions, results of operations and cash flows of Realogy Holdings, Realogy Intermediate and Realogy Group are the same. This Management's Discussion and Analysis of Financial Condition and Results of Operations, containor MD&A, contains forward-looking statements. See "Forward-Looking Statements" in this report and "Forward-Looking Statements" and "Risk Factors" inQuarterly Report as well as our 20162020 Form 10-K for a discussion of the uncertainties, risks and assumptions associated with these statements. Actual results may differ materially from those contained in any forward-looking statements.
OVERVIEW
We are a global provider of real estate and relocation services and report our operations in the following fourthree business segments:
| |
• | Real Estate Franchise Services (known as Realogy Franchise Group or RFG)—franchises the Century 21®, Coldwell Banker®, Coldwell Banker Commercial®, ERA®, Sotheby's International Realty® and Better Homes and Gardens® Real Estate brand names. As of September 30, 2017,•Realogy Franchise Group—franchises the Century 21®, Coldwell Banker®, Coldwell Banker Commercial®, Corcoran®, ERA®, Sotheby's International Realty® and Better Homes and Gardens® Real Estate brand names. As of June 30, 2021, our franchise systems had approximately 14,450 franchised and company owned offices and approximately 286,500 independent sales associates operating under our franchise and proprietary brands in the U.S. and 113 other countries and territories around the world, which included more than 780 of our company owned and operated brokerage offices with more than 50,000 independent sales associates. |
Our wholly-owned subsidiary, ZapLabs LLC (which changed its name from ZipRealty LLC in 2016), is the developer of our proprietary technology platform for the real estate brokeragesfranchise systems and proprietary brands had approximately 336,900 independent sales associates in our franchise system as well as their customers. We believe the Zap technology platform will increase the value proposition to franchisees,agents worldwide, including approximately 194,200 independent sales associates and customers as well as improveagents operating in the productivity ofU.S. (which included approximately 54,100 company owned brokerage independent sales associates.agents). As of June 30, 2021, our real estate franchise systems and proprietary brands had approximately 21,100 offices worldwide in 118 countries and territories, including approximately 5,700 brokerage offices in the U.S. (which included approximately 660 company owned brokerage offices). This segment also includes our lead generation activities and global relocation services operation.
| |
• | Company Owned Real Estate Brokerage Services (known as NRT)—operates a full-service real estate brokerage business with more than 780 owned and operated brokerage offices with more than 50,000 independent sales associates principally under the Coldwell Banker®, Corcoran®, Sotheby’s International Realty®, ZipRealty® and Citi HabitatsSM brand names in more than 50 of the 100 largest metropolitan areas in the U.S. This segment also includes the Company's share of earnings for our PHH Home Loans venture, which is in the process of winding down as we transition to our new mortgage origination joint venture with Guaranteed Rate Affinity.
|
| |
• | Relocation Services (known as Cartus®)—primarily offers clients employee relocation services such as homesale assistance, providing home equity advances to transferees (generally guaranteed by the individual's employer), home finding and other destination services, expense processing, relocation policy counseling and consulting services, arranging household goods moving services, coordinating visa and immigration support, intercultural and language training and group move management services. In addition, we provide home buying and selling assistance to members of affinity clients.
|
•Realogy Brokerage Group—operates a full-service real estate brokerage business with approximately 660 owned and operated brokerage offices with approximately 54,100 independent sales agents principally under the Coldwell Banker®, Corcoran® and Sotheby’s International Realty® brand names in many of the largest metropolitan areas in the U.S.
•Realogy Title and Settlement Services (known as Title Resource Group or TRG)—provides full-service title, escrow and settlement services to consumers, real estate companies, affinity groups, corporations and financial institutions with many of these services provided in connection with the Company's real estate brokerage and relocation services business.businesses. Our title insurance underwriter, Title Resources Guaranty Company, provides title underwriting services relating to the closing of home purchases and refinancing of home loans, working with affiliated and independent agents. This segment also includes the Company's share of equity earnings including start-up costs, for our Guaranteed Rate Affinity, venture.
RECENT DEVELOPMENTS
Leadership Succession Plan
On October 23, 2017, the Company announced that Ryan Schneider has been named President and Chief Operating Officer of the Company and appointed to the Board of Directors. Mr. Schneider is expected to be named Chief Executive Officer of the Company by December 31, 2017. Upon the appointment of Mr. Schneider as CEO on or before December 31, 2017, Richard Smith, the Company’s Chairman and Chief Executive Officer, will retire from the Company. The Company anticipates that Michael Williams, the Company’s Lead Independent Director, will be named Chairman of the Board upon the appointment of Mr. Schneider as CEO.
Strategic Initiatives
Our strategic initiatives are focused on affiliated independent sales associates, including targeted recruiting strategies, best-in-class retention practices, and organizational changes with new centers of excellence to enhance support for services such as marketing and education for affiliated independent sales associates. We believe that this refined strategic plan will manifest itself in a variety of ways, including improved lead generation, education and performance coaching and strengthened technology and marketing services, all of which are designed to increase the productivity of our existing independent sales associates and attract new independent sales associates.
Consistent with this strategy, NRT has been placing, and will continue to place, an even greater focus on the quality of our services, including the development of tools to increase sales associate productivity, and the use of financial incentives to strengthen our recruiting and retention of independent sales associates and teams. These actions include a focused strategy to recruit and retain high performing sales associates. In addition, there is an enhanced focus on the value proposition offered to independent sales associate teams. This strategic emphasis on recruitment and retention is driven by our overall goal to sustain or grow market share in various markets and ultimately improve the Company's overall profitability. While we have seen revenue improvements directly related to these initiatives, we have experienced and expect to continue to experience pressure on costs and margin from these initiatives.
Impact of Natural Disasters
In the third quarter of 2017, Hurricanes Harvey and Irma caused damage to residential and commercial property and infrastructure in Texas and Florida, which delayed the closing of homesale transactions. The hurricanes had an unfavorable impact on homesale transaction volume, title closing units and broker-to-broker referral fees during the third quarter of 2017 in the affected areas and are expected to have a similar unfavorable impact in the fourth quarter of 2017.
In October 2017, several catastrophic wildfires occurred in Northern California. We are assessing the impact of these wildfires, which we currently do not expect will have a material impact on our results of operations in the fourth quarter of 2017.
Although our segments operate in the affected regions as noted above, we did not incur significant damage to our office locations related to the hurricanes and have not incurred any significant damage to our office locations as a result of the wildfires and we believe we have adequate insurance coverage to protect our property losses.
New Mortgage Origination Joint Venture
On February 15, 2017, Realogy announced that it and Guaranteed Rate, Inc. (“Guaranteed Rate”) agreed to form a newminority-owned mortgage origination joint venture with Guaranteed Rate, Affinity, LLC ("Guaranteed Rate Affinity"), which began doing business in August 2017. Inc.
Our technology and data organization is dedicated to providing innovative technology products and solutions that support the productivity and success of Realogy’s businesses, brands, brokers, agents, and consumers.
RECENT DEVELOPMENTS
Capital Structure
In accordance with the asset purchase agreement, Guaranteed Rate Affinity is acquiring certain assetsJune 2021, we issued $403 million aggregate principal amount of 0.25% Exchangeable Senior Notes due 2026. We used a portion of the mortgage operationsnet proceeds from this offering to pay the cost of PHH Home Loans,exchangeable note hedge transactions (with such cost partially offset by the existing joint venture between Realogyproceeds to us from the sale of warrants). Taken together, the purchase of such exchangeable note hedges and PHH Mortgage Corporation, including its four regional centers and employees across the United States, but not its mortgage assets.
Following completionsale of such warrants are intended to offset (in whole or in part) any potential dilution and/or cash payments upon the exchange of the transactions underExchangeable Senior Notes, and to effectively increase the asset purchase agreement, Guaranteed Rate Affinity will originateoverall exchange price from $24.49 to $30.6075 per share. We expect to use the remaining net proceeds for working capital and market its mortgage lending services to Realogy’s real estate brokerageother general corporate purposes. See "Liquidity and relocation subsidiariesCapital Resources" below, as well as other real estate brokerageNote 4, "Short and relocation companies across the country. Guaranteed Rate owns a controlling 50.1% stake of Guaranteed Rate Affinity and Realogy owns 49.9%. Guaranteed Rate will have responsibility for the oversight of the officers and senior employees of Guaranteed Rate Affinity who are designated to manage Guaranteed Rate Affinity.
The asset purchase agreement and the movement of employees from the existing joint ventureLong-Term Debt", to the new joint venture is being completed in a series of five phases. The first two phases were completed in the third quarter of 2017 and in October the third phase was completed. The remaining two phases are expected to be completed in the fourth quarter of 2017. After giving effect to the establishment of Guaranteed Rate Affinity and the liquidation of Realogy's interest in PHH Home Loans in early 2018, the Company expects to realize net cash proceeds of approximately $20 million. There can be no assurance that all of the transactions contemplated by the asset purchase agreement will be consummated in a timely manner or at all or that the Company will receive the cash it expects from the wind down of the existing joint venture and the establishment of the new joint venture. The equity earnings related to Guaranteed Rate Affinity will be included in the financial results of our Title and Settlement Services segment.
Return of Capital to Stockholders
During the third quarter of 2017, the Company repurchased and retired 1.8 million shares of common stock for $58 million at a weighted average market price of $33.83 per share. Since beginning the repurchase of the Company's common stock in February 2016, the Company has repurchased a total of 13 million shares at a weighted average market price of $29.07 per share through September 30, 2017. As of September 30, 2017, approximately $198 million of authorization remains available for the repurchase of shares under the February 2017 share repurchase program.
Repurchases under these programs may be made at management's discretion from time to time on the open market, pursuant to Rule 10b5-1 trading plans or privately negotiated transactions. The size and timing of these repurchases will depend on price, market and economic conditions, legal and contractual requirements and other factors. The repurchase programs have no time limit and may be suspended or discontinued at any time.
Refer to "Part II—Other Information, Item 2. Unregistered Sales of Equity Securities and Use of Proceeds"Condensed Consolidated Financial Statements for additional information on the Company's share repurchase programs.Exchangeable Senior Notes, exchangeable note hedge transactions and warrant transactions.
CURRENT BUSINESS AND INDUSTRY TRENDS
The first half of 2021 demonstrated continued strength in the residential real estate market, which we believe has been driven by certain beneficial consumer trends such as home buyer preferences for certain geographies (including attractive tax and weather destinations) and demand in the high-end market, supported by an increase in the prevalence of remote work arrangements, home buying trends among millennials, a favorable mortgage rate environment and low inventory contributing to higher average homesale price.
Year-over-year comparisons are complicated by the impact of the COVID-19 crisis in 2020, which resulted in a sharp decline in homesale transaction volume during the second quarter of 2020, followed by an exceptionally robust recovery in the third quarterand fourth quarters.However, the strength of 2017,homesale transaction volume in the Board declared and paid a quarterly cash dividendfirst half of $0.09 per share2021 can also be demonstrated by comparison to the first half of the Company’s common stock.
CURRENT INDUSTRY TRENDS
2019. According to the National Association of Realtors ("NAR"), NAR:
•during the first nine monthshalf of 2017,2021 as compared to the first half of 2020, homesale transaction volume increased 6%41% due to a 5%24% increase in homesale transactions and a 14% increase in average homesale price; and
•during the first half of 2021 as compared to the first half of 2019, homesale transaction volume increased 35% due to an 18% increase in average homesale price and a 1% increase in the number of homesale transactions. The higher increase in the average homesale price relative to the14% increase in homesale transactions is a function of high demand against a limited supply of homes for sale. RFG and NRT homesaletransactions.
Homesale transaction volume on a combined basis for Realogy Franchise and Brokerage Groups increased 7%66% during the six months ended June 30, 2021 compared to the six months ended June 30, 2020. Homesale transaction volume at Realogy Franchise Group increased 65% during such period, primarily as a result of a 29% increase in the first nine monthsaverage homesale price and a 28% increase in existing homesale transactions. Homesale transaction volume at Realogy Brokerage Group increased 68% during such period, primarily as a result of 2017. NRT experienced a 2%34% increase in existing homesale transactions and a 6%25% increase in average homesale price while RFG experiencedprice.
Homesale transaction volume on a 1%combined basis for Realogy Franchise and Brokerage Groups increased 85% during the three months ended June 30, 2021 compared to the three months ended June 30, 2020. Homesale transaction volume at Realogy Franchise Group increased 80% during such period, primarily as a result of a 35% increase in existing homesale transactions and a 6%34% increase in average homesale price. Homesale transaction volume at Realogy Brokerage Group increased 96% during such period, primarily as a result of a 46% increase in existing homesale transactions and a 35% increase in average homesale price.
Recruitment and retentionIncreased homesale transaction volume at Realogy Franchise Group has been primarily driven since the second half of independent sales associates and independent sales associate teams are critical2020 by strong performance in the overall housing market as well as at the high-end of the market. We believe homesale transaction volume for Realogy Brokerage Group also benefited in the second quarter of 2021 from the strength of the high-end of the market as well as from its concentrated geographic footprint in certain major metropolitan markets, including New York City, which showed improved strength in the first half of 2021 after lagging the overall housing market recovery from the COVID-19 crisis. We expect year-over-year homesale transaction volume comparisons to be challenging for second half of 2021 as we will lap the significant growth in homesale transaction volume that occurred in the back-half of 2020.
As shown in the tables below, NAR reports in its most recent press release that homesale transaction volume increased 53% in the second quarter of 2021 as compared to the businesssecond quarter of 2020 and increased 29% in the second quarter of 2021 as compared to the second quarter of 2019.
NAR Existing Homesale Transaction Volume
_______________
(a)Q1 and Q2 existing homesale data is as of the most recent NAR press release, which is subject to sampling error.
(b)Forecasted existing homesale data, on a seasonally adjusted basis, is as of the most recent NAR forecast.
There remain significant uncertainties regarding whether the beneficial consumer trends discussed above will be maintained at the same strength or at all, and whether such trends will continue to have a positive effect on our financial results, as well as significant uncertainties related to the COVID-19 crisis, including the impact of vaccines and virus mutations on the severity, duration and extent of the pandemic.
Existing Homesales
For the six months ended June 30, 2021 compared to the same period in 2020, NAR existing homesale transactions increased to 2.9 million homes or up 24%. For the six months ended June 30, 2021, homesale transactions on a combined basis for Realogy Franchise and Brokerage Groups increased 29% compared to the same period in 2020 due primarily to continued strength in the residential real estate market, particularly at the high-end of the market. We attribute the continued strength in the second quarter to certain beneficial consumer trends, supported by other factors, including a favorable mortgage rate environment. The quarterly and annual year-over-year trends in homesale transactions are as follows:
Existing Homesale Transactions
Realogy Compared to 2021 Industry Data
_______________
(a)Q1 and Q2 existing homesale data is as of the most recent NAR press release, which is subject to sampling error.
(b)Forecasted existing homesale data, on a seasonally adjusted basis, is as of the most recent NAR forecast.
(c)Forecasted existing homesale data, on a seasonally adjusted basis, is as of the most recent Fannie Mae press release.
As of their most recent releases, NAR is forecasting existing homesale transactions to remain flat in 2022 at 6 million homes while Fannie Mae is forecasting existing homesale transactions to decrease 3% for the same period.
Existing Homesale Price
For the six months ended June 30, 2021 compared to the same period in 2020, NAR existing homesale average price increased 14%. For the six months ended June 30, 2021, average homesale price on a combined basis for Realogy Franchise and Brokerage Groups increased 28% compared to the same period in 2020 which consisted of a brokerage,29% increase in average homesale price for Realogy Franchise Group and a 25% increase in average homesale price for Realogy Brokerage Group. Strength in the overall housing market benefited both Realogy Franchise Group and Realogy Brokerage Group as did low inventory contributing to higher average homesale price, with both Realogy Franchise Group and Realogy Brokerage Group also benefiting from strength at the high-end of the market and Realogy Brokerage Group also benefiting from its concentrated geographic footprint in certain major metropolitan markets, including New York City. The quarterly and annual year-over-year trends in the price of homes are as follows:
Existing Homesale Price
Realogy Compared to 2021 Industry Data
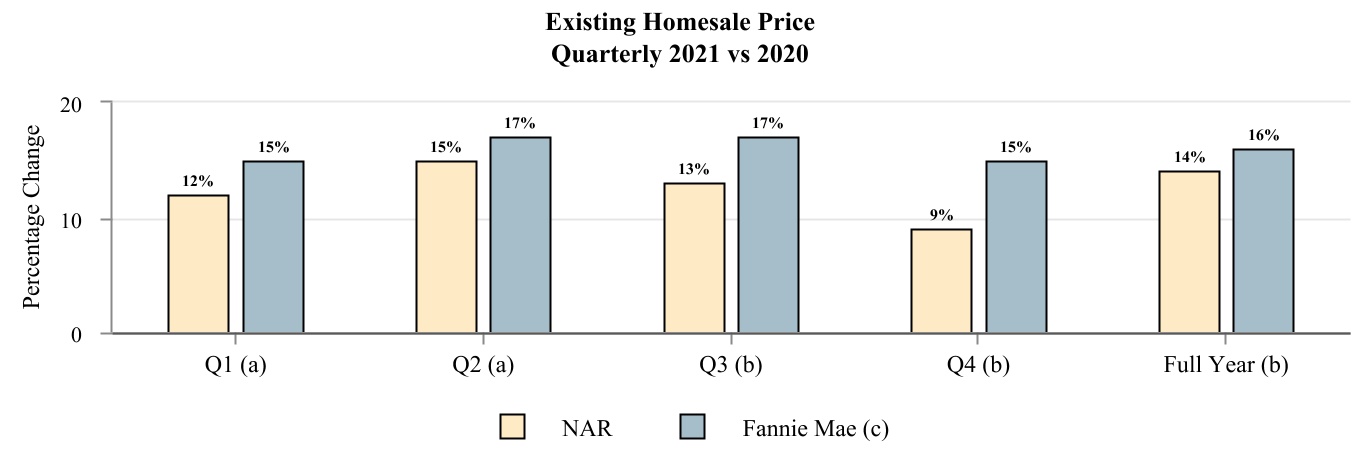 _______________
(a)Q1 and Q2 homesale price data is for existing homesale average price and is as of the most recent NAR press release.
(b)Forecasted homesale price data is for median price and is as of the most recent NAR forecast.
(c)Existing homesale price data is for median price and is as of the most recent Fannie Mae press release.
As of their most recent releases, NAR is forecasting median existing homesale price to increase 4% in 2022 while Fannie Mae is forecasting median existing homesale price to increase 8% for the same period.
2020 Temporary Cost-Saving Measures.Quarterly earnings comparisons are also challenged in the second quarter of 2021 by the absence of the temporary cost-saving measures we took in the second quarter of 2020 in response to the COVID-19 crisis. Certain of those temporary cost-saving measures continued into the third quarter of 2020. Those temporary cost saving measures resulted in approximately $150 million of aggregate savings in the second and third quarter of 2020, with approximately two-thirds of such amount recognized in the second quarter of 2020. Substantially all of these measures were reversed during the third quarter of 2020 and we do not expect to realize comparable cost-savings from these prior temporary measures in future periods.
Inventory. Continued or accelerated declines in inventory, whether attributable to the COVID-19 crisis or otherwise, have in the past and may in the future result in insufficient supply to meet any increased demand driven by the lower interest rate environment and beneficial consumer trends. Additional inventory pressure arises from periods of slow or decelerated new housing construction. Even before the COVID-19 crisis, low housing inventory levels had been an industry-wide concern, in particular in certain highly sought-after geographies and at lower price points. According to NAR, the inventory of existing homes for sale in the U.S. decreased approximately 19% from 1.5 million as of June 2020 to 1.3 million as of June 2021. As a result, inventory has decreased from 3.9 months of supply in June 2020 to 2.6 months as of June 2021. These levels continue to be significantly below the 10-year average of 4.8 months, the 15-year average of 6.0 months and the 25-year average of 5.6 months.
While insufficient inventory levels generally have a negative impact on homesale transaction growth, during the three months ended June 30, 2021, Realogy Franchise and Brokerage Groups saw a 37% increase in homesale transactions on a combined basis compared to the same period in 2020. We believe that an intensified pace of inventory supply turnover beginning in the second half of 2020 has contributed to the reported low levels of inventory, without a correlating decrease in homesale transactions. For example, at our company owned Coldwell Banker brokerages, the speed at which a home that was listed for sale went under contract reduced to a median of 12 days on the market in the second quarter of 2021 from a median of 26 days on the market in the second quarter of 2020. There is significant uncertainty as to whether this recent pattern of low inventory, but increased homesale transactions driven by supply turnover will continue. Constraints in home inventory levels have typically had and those operatedmay continue to have an adverse impact on the number of homesale transactions closed by our affiliated franchisees. CompetitionRealogy Franchise and Brokerage Groups. In addition, in periods of rapid inventory turnover there is an increased risk that new homesale unit listings will not keep pace with demand, which could also negatively impact homesale transaction volume.
Unemployment.According to the U.S. Bureau of Labor Statistics, the U.S. unemployment rate declined to 5.9% in June 2021, down considerably from a high of 14.8% reached in April 2020, but still 2.4% higher compared to its pre-pandemic level in February 2020. If the COVID-19 pandemic continues to impact employment levels and economic activity for independent sales associatesa substantial period, or if jobs recovery slows or worsens, it could lead to an increase in our industry,loan defaults and foreclosure activity and may make it more difficult for potential home buyers to arrange financing.
Mortgage Rates and Mortgage Origination Joint Venture. We have been in an unusually prolonged period of low interest rates, with mortgage rates in the U.S. reaching then-historic lows beginning in the second quarter of 2020. Our financial results are typically favorably impacted by a low interest rate environment as a decline in mortgage rates generally drives increased refinancing activity and homesale transactions. However, refinancing volumes are inherently cyclical and are highly correlated with fluctuations in mortgage rates. In addition, operating margins may be compressed due to competitive factors related to decreased demand. For example, at Realogy Title Group, purchase title and closing units increased 48%, but refinancing title and closing units declined 18%, during the second quarter of 2021 as compared to the second quarter of 2020. Equity in earnings at Guaranteed Rate Affinity declined from $35 million in the second quarter of 2020 to $8 million in the second quarter of 2021, primarily driven by a negative $19 million related to mark-to-market adjustments on the mortgage loan pipeline as well as margin compression and a decline in refinance volumes, partially offset by strong purchase volume growth. Given the strength of refinancing volumes in the second half of 2020, we expect softer refinance volumes to continue during the second half of 2021.
We have been and could again be negatively impacted by a rising interest rate environment as increases in mortgage rates generally have a negative impact on refinancing title and closing units as well as mortgage unit volumes, housing affordability and homesale transaction volume.
A wide variety of factors can contribute to mortgage rates, including within our franchise system, is high, in particular with respectTreasury note yields, federal interest rates, inflation, demand, consumer income, unemployment levels and foreclosure rates. Yields on the 10-year Treasury note hit all-time lows during the COVID-19 crisis, but as of June 30, 2021 were 1.45% as compared to more productive sales associates. Most0.66% as of June 30, 2020. According to Freddie Mac, mortgage rates on commitments for a brokerage's real estate listings are sourced through the sphere30-year, conventional, fixed-rate first mortgage lowered to
an average of their independent sales associates, notwithstanding the growing influence of internet-generated leads. Competition for independent sales associates is generally subject to numerous factors, including remuneration (such as sales commission percentage and other financial incentives paid to independent sales associates), other expenses of independent sales associates, leads or business opportunities generated3.00% for the independent sales associatesecond quarter of 2021 compared to 3.23% for the second quarter of 2020. Although such mortgage rates began to increase during the first quarter of 2021 from the brokerage, independent sales associates' perception of the value of the broker's brand affiliation, marketing and advertising efforts by the brokerage, the office manager, staff and fellow independent sales associates with whomlows seen in late 2020, they collaborate daily and technology, continuing professional education, and other services provided by the brokerage. We believe that the influence of independent sales associates and independent sales associate teams has increased during the past five years and, together with the increasing competition from other brokerages, has negatively impacted the recruitment and retention of independent sales associates and put pressure on commission rate splits. These factors may also put pressure on RFG's net effective royalty rate as the economics for agents and agent teams change. At NRT, we continue to focusbe at low levels compared to the 10-year average of 3.93%, according to Freddie Mac. On June 30, 2021, mortgage rates were 2.98%, or approximately 30 basis points higher than on our growth initiatives, specifically our recruitingDecember 31, 2020 and approximately 100 basis points lower than the 10-year average, according to Freddie Mac.
Banks may tighten mortgage standards, even if rates remain at low levels or decline, which could limit the availability of mortgage financing. In addition, many federal and/or state monetary or fiscal programs meant to assist individuals and businesses in the focusnavigation of COVID-related financial challenges (including mortgage forbearance programs) have ended or are expected to end in the near term, which could have a negative impact on strengthening the sales agent value proposition.consumer financial health.
Affordability. The new targeted recruiting initiatives that we introduced in late 2016 have enabled us to mitigate prior declines in market share through the addition of high performing NRT independent sales associates. While these recruiting and retention initiatives have increased our commission expense, we expect these initiatives will improve our operating results over the longer term and will continue to positively impact our market share trend.
Asfixed housing affordability index, as reported by NAR, thedecreased from 180 for May 2020 to 152 for May 2021. A housing affordability index has continued to be at historically favorable levels, despite the increases in the average homesale price over the past several years. An index above 100 signifies that a family earning the median income has sufficient income to purchase a median-priced home, assuming a 20 percent down payment and ability to qualify for a mortgage. The composite housingHousing affordability index was 150 for August 2017 and 165 for 2016. The housing affordability index remains significantly higher than the average of 127 for the period from 1970 through 2016.
According to Freddie Mac,may be impacted in future periods by inflationary pressures, increases in mortgage rates on commitments for a 30-year, conventional, fixed-rate first mortgages averaged 3.7% for 2016 and the rate at September 30, 2017 was 3.8%. Although mortgage rates have increased 30 basis points to 3.8% as of September 30, 2017 from 3.5% as of September 2016, they continue to be at low levels by historical
standards. While this increase adversely impacts housing affordability, we believe that rising wages, improving consumer confidence and a continuation of low inventory levels for the mainstream housing market will result in continued favorable demand conditions and existing homesale volume growth. To the extent that mortgage rates increase, consumers continue to have financing alternatives such as adjustable rate mortgages or shorter term mortgages which can be utilized to obtain a lower mortgage rate than a 30-year fixed-rate mortgage.
Partially offsetting the positive impact of historically favorable affordability and mortgage rates are low housing inventory levels, which have been in decline over the past several years. According to NAR, the inventory of existing homes for sale in the U.S. was 1.9 million and 2.0 million at the end of September 2017 and September 2016, respectively. The September 2017 inventory represents a national average supply of 4.2 months at the current homesales pace which is significantly below the 6.1 month 25-year average as of December 31, 2016. The national average supply at the then-current homesales pace for September 2016, 2015 and 2014 was 4.5 months, 4.8 months and 5.4 months, respectively.
Additional offsetting factors include the ongoing rise in home prices, conservative mortgage underwriting standards and certain homeowners having limited or negative equity in homes. Mortgage credit conditions tightened significantly during the recent housing downturn, with banks limiting credit availability to more creditworthy borrowers and requiring larger down payments, stricter appraisal standards, and more extensive mortgage documentation. Although mortgage credit conditions appear to be easing, mortgages remain less available to some borrowers and it frequently takes longer to close a homesale transaction due to current mortgage and underwriting requirements.
Existing Homesales
According to NAR, existing homesale transactions for 2016 increased to 5.5 million homes, or up 4%, compared to 2015, while homesale transactions increased 2% on a combined basis for RFG and NRT.
For the quarters ended March 31, 2017, June 30, 2017 and September 30, 2017, compared to the same periods in 2016, NAR existing homesale transactions were 1.1 million, 1.6 million and 1.5 million homes, or up 5%, up 2% and down 2%, respectively. For the periods above, RFG and NRT homesale transactions on a combined basis increased 3%, increased 1% and decreased 1%, respectively, compared to the same periods in 2016. During the first nine months of the year, the number of homesale transactions for RFG and NRT has continued to be challenged by inventory constraints, however for NRT there has been a shift from stabilization to growth in the high end of the housing market. The annual and quarterly year-over-year trends in homesale transactions are as follows: |
| | | | | | | | | | | | | | | | | | |
| | | | 2017 vs. 2016 | |
| Number of Existing Homesales | Full Year
2016 vs.
2015 | | First
Quarter | | Second
Quarter | | Third
Quarter | | Fourth
Quarter
Forecast | | Full Year
Forecast
2017 vs. 2016 | |
| Industry | | | | | | | | | | | | |
| NAR | 4 | % | (a) | 5 | % | (a) | 2 | % | (a) | (2 | %) | (a) | (4 | %) | (b) | — | % | (b) |
| Fannie Mae (c) | 4 | % | | 5 | % | | 2 | % | | (2 | %) | | (5 | %) | | — | % | |
| Realogy | | | | | | | | | | | | |
| RFG and NRT Combined | 2 | % | | 3 | % | | 1 | % | | (1 | %) | | | | | |
| RFG | 3 | % | | 3 | % | | 1 | % | | (1 | %) | | | | | |
| NRT | — | % | | 4 | % | | 3 | % | | — | % | | | | | |
_______________
| |
(a) | Historical existing homesale data is as of the most recent NAR press release, which is subject to sampling error. |
| |
(b) | Forecasted existing homesale data, on a seasonally adjusted basis, is as of the most recent NAR forecast. |
| |
(c) | Forecasted existing homesale data, on a seasonally adjusted basis, is as of the most recent Fannie Mae press release. |
As of their most recent releases, NAR is forecasting existing homesales to increase 7% in 2018 while Fannie Mae is forecasting an increase in existing homesale transactions of 2% in 2018.
Existing Homesale Price
In 2016, NAR existing homesale average price increased 4% compared to the same period in 2015, while average homesale price, increased 2% on a combined basis for RFG and NRT.
For the quarters ended March 31, 2017, June 30, 2017low inventory environment as well as the rise in unemployment and September 30, 2017, compared to the same periods in 2016, NAR existing homesale average price increased 5%, 5% and 4%, respectively. For the periods above, RFG and NRT average homesale price on a combined basis increased 5%, 7%, and 6%, respectively, compared to the same periods in 2016. The combined average homesale price increase was due to the increase in homesale transactions at the high end of the markets served by NRT and RFG. Both RFG and NRT homesale price also improvedeconomic challenges as a result of increased demand duethe COVID-19 crisis.
Recruitment and Retention of Independent Sales Agents; Commission Income.Recruitment and retention of independent sales agents and independent sales agent teams are critical to the continuationbusiness and financial results of constrained inventory levels. The annuala brokerage, including our company owned brokerages and quarterly year-over-year trendsthose operated by our affiliated franchisees. In the second quarter of 2021, agents affiliated with our company owned brokerages grew 4% and, based on information from such franchisees, agents affiliated with our U.S. franchisees increased 3%, in each case as compared to June 30, 2020. Aggressive competition for the affiliation of independent sales agents has negatively impacted recruitment and retention efforts at both Realogy Franchise and Brokerage Groups, in particular with respect to more productive sales agents, and has previously had and may continue to have a negative impact on our market share. These competitive market factors are expected to continue to put upward pressure on the average share of commissions earned by independent sales agents and may continue to impact our franchisees. Such franchisees have and may continue to seek reduced royalty fee arrangements or other incentives from us to offset the continued business pressures on such franchisees, which would result in a reduction in royalty fees paid to us.
Non-Traditional Market Participants. While real estate brokers using historical real estate brokerage models typically compete for business primarily on the basis of services offered, brokerage commission, reputation, utilization of technology and personal contacts, participants pursuing non-traditional methods of marketing real estate may compete in other ways, including companies that employ technologies intended to disrupt historical real estate brokerage models or minimize or eliminate the role traditional brokers and sales agents perform in the price of homes are as follows:
|
| | | | | | | | | | | | | | | | | | |
| | | | 2017 vs. 2016 | |
| Price of Existing Homes | Full Year
2016 vs.
2015 | | First
Quarter | | Second
Quarter | | Third
Quarter | | Fourth
Quarter
Forecast | | Full Year
Forecast
2017 vs. 2016 | |
| Industry | | | | | | | | | | | | |
| NAR | 4 | % | (a) | 5 | % | (a) | 5 | % | (a) | 4 | % | (a) | 5 | % | (b) | 6 | % | (b) |
| Fannie Mae (c) | 5 | % | | 7 | % | | 6 | % | | 6 | % | | 6 | % | | 6 | % | |
| Realogy | | | | | | | | | | | | |
| RFG and NRT Combined | 2 | % | | 5 | % | | 7 | % | | 6 | % | | | | | |
| RFG | 3 | % | | 6 | % | | 6 | % | | 6 | % | | | | | |
| NRT | — | % | | 3 | % | | 9 | % | | 4 | % | | | | | |
_______________
| |
(a) | Historical homesale price data is for existing homesale average price and is as of the most recent NAR press release. |
| |
(b) | Forecasted homesale price data is for median price and is as of the most recent NAR forecast. |
| |
(c) | Existing homesale price data is for median price and is as of the most recent Fannie Mae press release. |
As of their most recent releases, NAR and Fannie Mae are both forecasting an increase in median existing homesale price of 5% in 2018 compared to 2017.
* * *
We believe that long-term demand for housing and the growth of our industry are primarily driven by the affordability of housing, the economic healthtransaction process. The significant size of the U.S. economy, demographic trendsreal estate market has continued to attract outside capital investment in disruptive and traditional competitors that seek to access a portion of this market, including iBuying and home swap business models. These competitors and their investors may pursue increases in market share over profitability, further complicating the competitive landscape.
A growing number of companies are competing in non-traditional ways for a portion of the gross commission income generated by homesale transactions. For example, virtual brokerage models (including virtual brokerages and brokerages that operate in a more virtual fashion) directly compete with traditional brokerage models and may dilute the relationship between the brokerage and the agent.
In addition, certain alternative transaction models, such as population growth, the increase in household formation, mortgage rate levelsiBuying and mortgage availability, certain tax benefits, job growth, the inherent attributes of homeownership versus rentinghome swap models, are less reliant on brokerages and the influence of local housing dynamics of supply versus demand. At this time, most of these factors are generally trending favorably. Factors that may negatively affect continued growth in the housing industry include:
higher mortgage rates due to increases in long-term interest ratessales agents, which could have a negative impact on such brokerages and agents as well as reduced availabilityon the average homesale broker commission rate. These models also look to capture ancillary real estate services such as title and mortgage services and referral fees. RealSure, our joint venture with Home Partners of mortgage financing;America, offers consumers the benefit of iBuying, while also keeping the independent sales agent at the center of the transaction. RealSure is available in 21 U.S. markets as of June 30, 2021 and we are investing to expand the scale of the program by pursuing direct-to-consumer marketing opportunities. Under the RealSure Sell program, sellers with qualifying properties receive a cash offer valid for 45 days immediately upon listing, and during this time frame have the opportunity to pursue a better price by marketing their property with an affiliated independent sales agent. Sellers who are enrolled in RealSure Sell can utilize RealSure Buy to make a more competitive offer on their next home before their current home is sold by leveraging their RealSure Sell cash offer.
continued insufficient inventory levelsIn addition, the concentration and lackmarket power of buildingthe top listing aggregators allow them to monetize their platforms by a variety of new housing leading to lower unit sales;
changing attitudes towards home ownership, particularly among potential first-time homebuyers who may delay, or decide not to, purchase homes;
potential homebuyers with a low credit rating or inability to afford down payments;
the impact of limited or negative equity of current homeowners, as well as the lack of available inventory may limit their proclivity to purchase an alternative home;
reduced affordability of homes;
economic stagnation or contraction in the U.S. economy;
a decline in home ownership levels in the U.S.;
geopolitical and economic instability; and
legislative or regulatory reform,actions, including but not limited to reform that adversely impactssetting up competing brokerages and/or expanding their offerings to include
products (including agent tools) and services ancillary to the financing of the U.S. housing market or amends the Internal Revenue Code in a manner that negatively impacts home ownershipreal estate transaction, such as reformtitle, escrow and mortgage origination services, that reducescompete with services offered by us, charging significant referral, listing and display fees, diluting the amountrelationship between agents and brokers and between agents and the consumer, tying referrals to use of their products, consolidating and leveraging data, and engaging in preferential or exclusionary practices to favor or disfavor other industry participants. These actions divert and reduce the earnings of other industry participants, including our company owned and franchised brokerages. Aggregators could intensify their current business tactics or introduce new programs that certain taxpayers wouldcould be allowedmaterially disadvantageous to deduct for home mortgage interestour business and other brokerage participants in the industry and such tactics could further increase pressures on the profitability of our company owned and franchised brokerages and affiliated independent sales agents, reduce our franchisor service revenue and dilute our relationships with affiliated franchisees and such franchisees' relationships with affiliated independent sales agents and buyers and sellers of homes. For example, one dominant listing aggregator recently launched a brokerage with employee sales agents in several locations to support its iBuying offering and has joined most local multiple listing services, known as MLSs, as a participating broker to gain electronic access directly to real estate listings rather than relying on disparate electronic feeds from other brokers participating in the MLSs or state, localMLS syndication feeds.
We are also impacted by changes in the rules and property taxes.policies of NAR and the MLSs, which can be driven by changes in membership, including the entry of new industry participants, and other industry forces.
Many of the trends impacting our businesses that derive revenue from homesales also impact Cartus, which is a global provider of outsourced employee relocation services.control, including long cycle times and irregular project completion timing. In addition, the new development industry has also experienced significant disruption due to general residential housing trends, key driversthe COVID-19 crisis. Accordingly, earnings attributable to this business can fluctuate meaningfully from year to year, impacting both homesale transaction volume and the share of Cartus are globalgross commission income we realize on such transactions.
Relocation Spending.Global corporate spending on relocation services which has not returnedcontinued to levels that existed priorshift to the most recent recession andlower cost relocation benefits as corporate clients engage in cost reduction initiatives and/or restructuring programs, as well as changes in employment relocation trends. Cartus is subject to a competitive pricing environment and lower average revenue per relocation asAs a result of a shift in the mix of services and number of services being delivered per move. These factorsmove, our relocation operations have been increasingly subject to a competitive pricing environment and maylower average revenue per relocation. Lower volume growth, in particular with respect to global relocation activity, has also impacted the operating results of our relocation operations. The COVID-19 crisis, along with related ongoing travel restrictions in the U.S. and elsewhere, has exacerbated these trends and is expected to continue to put pressure on the growthfinancial results of Cartus Relocation Services (part of the Realogy Franchise Group segment). In addition, the greater acceptance of remote work arrangements during the COVID-19 crisis has the potential to have a negative impact on relocation volumes in the long-term.
Leads Generation.Through Realogy Leads Group, a part of Realogy Franchise Group, we seek to provide high-quality leads to affiliated agents, including through real estate benefit programs that provide home-buying and profitabilityselling assistance to members of organizations such as credit unions and interest groups that have established members who are buying or selling a home as well as to consumers and corporations who have expressed interest in a certain brand, product or service (such as relocation services). We operate several real estate benefit programs, including a program with a large long-term client as well as other programs we have launched in the past two years, including AARP® Real Estate Benefits. There can be no assurance that we will be able to maintain or expand these programs, and even if we are successful in these efforts, such programs may not generate a meaningful number of high-quality leads.
Legal & Regulatory Environment.See Part II., "Item 1.—Legal Proceedings" of this segment.Quarterly Report for a discussion of the current legal and regulatory environment and how such environment could potentially impact us.
* * *
While data provided by NAR and Fannie Mae are two indicators of the direction of the residential housing market, we believe that homesale statistics will continue to vary between us and NAR and Fannie Mae because:
•they use survey data and estimates in their historical reports and forecasting models, which are subject to sampling error, whereas we use data based on actual reported results;
•there are geographical differences and concentrations in the markets in which we operate versus the national market. For example, many of our company owned brokerage offices are geographically located where average homesale prices are generally higher than the national average and therefore NAR survey data will not correlate with NRT'sRealogy Brokerage Group's results;
comparability is also impaired due to
•NAR’s utilization offorecasts utilize seasonally adjusted annualized rates whereas we report actual period-over-period changes and their use of median price for their forecasts compared to our average price;
•NAR historical data is subject to periodic review and revision and these revisions have been material in the past, and could be material in the future; and
•NAR and Fannie Mae generally update their forecasts on a monthly basis and a subsequent forecast may change materially from a forecast that was previously issued.
While we believe that the industry data presented herein is derived from the most widely recognized sources for reporting U.S. residential housing market statistical data, we do not endorse or suggest reliance on this data alone. We also note that forecasts are inherently uncertain or speculative in nature and actual results for any period could materially differ.
KEY DRIVERS OF OUR BUSINESSES
Within RFGRealogy Franchise and NRT,Brokerage Groups, we measure operating performance using the following key operating statistics:metrics: (i) closed homesale sides, which represents either the "buy" side or the "sell" side of a homesale transaction, (ii) average homesale price, which represents the average selling price of closed homesale transactions, and (iii) average homesale broker commission rate, which represents the average commission rate earned on either the "buy" side or "sell" side of a homesale transaction.
For RFG,Realogy Franchise Group, we also use net effective royalty rateper side, which represents the average percentage of our franchisees’ commission revenues payableroyalty payment to RFG, net of volume incentives achieved.
Since 2014 we have experienced approximately a one basis point decline in theRealogy Franchise Group for each homesale transaction side taking into account royalty rates, homesale price, average broker commission rate each yearrates, volume incentives achieved and we expect that overother incentives. We utilize net royalty per side as it includes the long term the average brokerage commission rates will continue to modestly decline as a resultimpact of increaseschanges in average homesale prices and, to a lesser extent, competitors providing fewer services for a reduced fee. Continuing growth in the housing market should result in an increase in our revenues, although such increases could be offset by modestly declining brokerage commission rates and competitive pressures.
In general, most of our third-party franchisees are entitled to volume incentives, which are calculated for each franchisee as a progressive percentage of each franchisee's annual gross income. These incentives decrease during times of declining homesale transaction volumes and increase when there is a corresponding increase in homesale transaction volume. In addition, several of our larger franchisees have a flat royalty rate. If our top franchisees, who earn higher volume incentives or have a flat royalty rate, continue to grow faster than the majority of our other franchisees, the Company's net effective royalty rate will continue to modestly decline.
Royalty fees are charged to all franchisees pursuant to the terms of the relevant franchise agreements and are included in each of the real estate brands' franchise disclosure documents. Non-standard incentives may be used as consideration for new or renewing franchisees. Most of our franchisees do not receive these non-standard incentives and in contrast to royalties and volume incentives, they are not homesale transaction based. We have accordingly excluded the non-standard incentives from the calculation of the net effective royalty rate. Had these non-standard incentives been included, the net effective royalty rate would be lower by approximately 23 and 21 basis points for the years ended December 31, 2016 and
2015, respectively. We expect that the trend of increasing non-standard incentives by approximately 3 to 4 basis points a year will continue in the future in order to attract and retain certain large franchisees.
NRT has a significant concentration of real estate brokerage offices and transactions in geographic regions where home prices are at the higher end of the U.S. real estate market, particularly the east and west coasts, while RFG has franchised offices that are more widely dispersed across the United States. Accordingly, operating results and homesale statistics may differ between NRT and RFG based upon geographic presence and the corresponding homesale activity in each geographic region. In addition, the share of commissions earned by sales associates directly impacts the margin earned by NRT. Such share of commissions earned by sales associates varies by region and commission schedules are generally progressive to incentivize sales associates to achieve higher levels of production. We expect that they will continue to be subject to upward pressure because of the increased bargaining power of independent sales associates and teamsprice as well as more aggressive recruitmentall incentives and represents the royalty revenue impact of each incremental side.
For Realogy Brokerage Group, we also use gross commission income per side, which represents gross commission income divided by closed homesale sides. Gross commission income includes commissions earned in homesale transactions and certain other activities, taken by our competitors.
As described above under "Current Industry Trends," competition for independent sales associates in our industry has intensified and we expect this competition will continue particularly with respectprimarily leasing transactions. Realogy Brokerage Group, as a franchisee of Realogy Franchise Group, pays a royalty fee of approximately 6% per transaction to more productive independent sales associates which has impacted NRT's market share and results of operations, as well as RFG toRealogy Franchise Group from the commission earned on a lesser extent. Currently, there are several different compensation models being utilized by real estate brokerages to compensate their independent sales associates.transaction. The most common models are as follows: (1) a graduatedremainder of gross commission plan, sometimes referred to asincome is split between the "traditional model" wherebroker (Realogy Brokerage Group) and the independent sales associate receives a percentage ofagent in accordance with their applicable independent contractor agreement (which specifies the brokerage commission that increases as the independent sales associate increases his or her volume of homesale transactions and the brokerage frequently provides independent sales associates with a broad set of support offerings and promotion of properties, (2) a desk rental or 100% plan, where the independent sales associate is entitled to all or nearly allportion of the broker commission and pays the broker on both a monthly and transaction basis for office space, tools, technology and support while also being responsible for the promotion of properties and other items, (3) a capped model, which generally blends aspects of the first two models described herein, and (4) a fixed transaction fee model where the sales associate is entitled to all of the broker commission and pays a fixed fee per homesale transaction and often receives very limited support from the brokerage. Most brokerages focus primarily on one compensation model though some may offer one or more of these models to their sales associates. Increasingly, independent sales associates have affiliated with brokerages that offer fewer servicesbe paid to the independent sales associates, allowing the independent sales associate to retain a greater percentage of the commission. However, there are long-term trade-offs in the level of support independent sales associates receive in areas such as marketing, technology and professional education.agent), which varies by each agent agreement.
While NRT has historically compensated its independent sales associates using a traditional model, utilizing elements of other models depending upon the geographic market, we are placing an even greater focus on the quality of our services and use of financial incentives to strengthen our recruiting and retention of independent sales associates and teams. These actions include a more aggressive strategy to recruit and retain high performing sales associates. In addition, there is an enhanced focus on the value proposition offered to independent sales associate teams. This strategic emphasis on recruitment and retention is driven by our overall goal to sustain or grow market share in various markets and ultimately improve the Company's overall profitability. While we have seen revenue improvements directly related to these initiatives, we have experienced and expect to continue to experience pressure on costs and margin from these initiatives.
Within Cartus, we measure operating performance using the following key operating statistics: (i) initiations, which represent the total number of new transferees and the total number of real estate closings for affinity members and (ii) referrals, which represent the number of referrals from which we earn revenue from real estate brokers.
In TRG,For Realogy Title Group, operating performance is evaluated using the following key metrics: (i) purchase title and closing units, which represent the number of title and closing units we process as a result of home purchases, (ii) refinance title and closing units, which represent the number of title and closing units we process as a result of homeowners refinancing their home loans, and (iii) average fee per closing unit, which represents the average fee we earn on purchase title and refinancing title sides. An increase or decrease in homesale transactions will impact the financial results of TRG;Realogy Title Group; however, thetheir financial results are not significantly impacted by a change in homesale price. In addition,The following table presents our drivers for the average mortgage rate increased inthree and six months ended June 30, 2021 and 2020. See "Results of Operations" below for a discussion as to how these drivers affected our business for the fourth quarterperiods presented.
| | | | | | | | | | | | | | | | | | | | | | | | | | | | | | | | | | | |
| Three Months Ended June 30, | | Six Months Ended June 30, |
| 2021 | | 2020 | | % Change | | 2021 | | 2020 | | % Change |
| Realogy Franchise Group (a) | | | | | | | | | | | |
| Closed homesale sides | 320,463 | | | 238,085 | | | 35 | % | | 565,161 | | | 441,273 | | | 28 | % |
| Average homesale price | $ | 430,756 | | | $ | 321,308 | | | 34 | % | | $ | 414,842 | | | $ | 321,841 | | | 29 | % |
| Average homesale broker commission rate | 2.46 | % | | 2.49 | % | | (3) | bps | | 2.46 | % | | 2.48 | % | | (2) | bps |
| Net royalty per side | $ | 418 | | | $ | 324 | | | 29 | % | | $ | 402 | | | $ | 321 | | | 25 | % |
| Realogy Brokerage Group | | | | | | | | | | | |
| Closed homesale sides | 103,945 | | | 71,375 | | | 46 | % | | 178,938 | | | 133,916 | | | 34 | % |
| Average homesale price | $ | 678,978 | | | $ | 503,935 | | | 35 | % | | $ | 649,634 | | | $ | 517,888 | | | 25 | % |
| Average homesale broker commission rate | 2.43 | % | | 2.43 | % | | — | bps | | 2.43 | % | | 2.42 | % | | 1 | bps |
| Gross commission income per side | $ | 17,053 | | | $ | 12,863 | | | 33 | % | | $ | 16,357 | | | $ | 13,206 | | | 24 | % |
| Realogy Title Group | | | | | | | | | | | |
| Purchase title and closing units | 47,375 | | | 32,028 | | | 48 | % | | 81,203 | | | 60,752 | | | 34 | % |
| Refinance title and closing units | 14,472 | | | 17,548 | | | (18) | % | | 34,939 | | | 26,447 | | | 32 | % |
| Average fee per closing unit | $ | 2,608 | | | $ | 2,062 | | | 26 | % | | $ | 2,446 | | | $ | 2,151 | | | 14 | % |
_______________
(a)Includes all franchisees except for Realogy Brokerage Group.
A decline in the number of homesale transactions andand/or decline in homesale prices could adversely affect our results of operations by: (i) reducing the royalties we receive from our franchisees, (ii) reducing the commissions our company owned brokerage operations earn, (iii) reducing the demand for our title, escrow and settlement and underwriting services (iv) reducingor the referral fees we earn inservices of our relocation services business,mortgage origination joint venture, and (v)(iv) increasing the risk of franchisee default due to lower homesale
volume. Our results could also be negatively affected by a decline in commission rates charged by brokers or greater commission payments to sales associates.agents or by an increase in volume or other incentives paid to franchisees, among other factors.
The followingWith the exception of 2020, since 2014, we have experienced approximately a one basis point decline in the average homesale broker commission rate each year, which we believe has been largely attributable to increases in average homesale prices (as higher priced homes tend to have a lower broker commission) and, to a lesser extent, competitors providing fewer or similar services for a reduced fee. In 2020, the average homesale broker commission rate increased by two basis points at Realogy Brokerage Group and one basis point at Realogy Franchise Group.
Royalty fees are charged to all franchisees pursuant to the terms of the relevant franchise agreements and are included in each of the real estate brands' franchise disclosure documents. Most of our brands utilize a volume-based incentive model with a royalty fee rate that is initially equal to 6% of the franchisee's gross commission income, but subject to reduction based upon volume incentives.
We also utilize other royalty fee models that are not generally eligible for volume incentives. For example, certain of our franchisees (including some of our largest franchisees) have a flat royalty fee rate of less than 6%. In addition, a royalty fee generally equal to 5% of franchisee commission (capped at a set amount per independent sales agent per year) is applicable to franchisees operating under the "capped fee model" that was launched for our Better Homes and Gardens Real Estate franchise business in January 2019. Our Corcoran franchise business utilizes a tiered royalty fee model under which franchisees pay us a royalty fee percentage (generally set at an initial rate of 6%) that decreases in steps during each calendar year as the franchisee’s gross commission income reaches certain levels to a minimum of 4%. We have and may, from time to time in the future, restructure or revise the model used at one or more franchised brands, including with respect to the applicable initial royalty fee rate.
Other incentives may also be used as consideration to attract new franchisees, grow franchisees (including through independent sales agent recruitment) or extend existing franchise agreements, although in contrast to volume incentives, the majority of other incentives are not homesale transaction based.
Transaction volume growth has generally exceeded royalty revenue growth due primarily to the growth in gross commission income generated by our top 250 franchisees and our increased use of other sales incentives, both of which directly impact royalty revenue. Over the past several years, our top 250 franchisees have grown faster than our other franchisees through organic growth and market consolidation. If the amount of gross commission income generated by our top 250 franchisees continues to grow at a quicker pace relative to our other franchisees, we would expect our royalty revenue to continue to increase, but at a slower pace than homesale transaction volume. Likewise, our royalty revenue would continue to increase, but at a slower pace than homesale transaction volume, if the gross commission income generated by all of our franchisees grows faster than the applicable annual volume incentive table presentsincrease or if we increase our driversuse of standard volume or other incentives. However, in the event that the gross commission income generated by our franchisees increases as a result of increased transaction volume, we would expect to recognize an increase in overall royalty payments to us.
We face significant competition from other national real estate brokerage brand franchisors for franchisees and we expect that the trend of increasing incentives will continue in the future in order to attract, retain, and help grow certain franchisees. Taking into account competitive factors, we have and may, from time to time in the future, restructure or revise the model used at one or more franchised brands. We expect to experience pressures on net royalty per side, largely due to the impact of competitive market factors noted above, continued concentration among our top 250 franchisees, and the impact of affiliated franchisees of our Better Homes and Gardens® Real Estate brand moving to the "capped fee model" we adopted in 2019; however, these pressures were more than offset by increases in homesale prices in the three and nine monthssix-month period ended SeptemberJune 30, 20172021.
Realogy Brokerage Group has a significant concentration of real estate brokerage offices and 2016. See "Resultstransactions in geographic regions where home prices are at the higher end of Operations" belowthe U.S. real estate market, particularly the east and west coasts, while
Realogy Franchise Group has franchised offices that are more widely dispersed across the United States. Accordingly, operating results and homesale statistics may differ between Realogy Brokerage Group and Realogy Franchise Group based upon geographic presence and the corresponding homesale activity in each geographic region. In addition, the share of commissions earned by independent sales agents directly impacts the margin earned by Realogy Brokerage Group. Such share of commissions earned by independent sales agents varies by region and commission schedules are generally progressive to incentivize sales agents to achieve higher levels of production. Commission share has been and we expect will continue to be subject to upward pressure in favor of the independent sales agent for a discussionvariety of factors, including more aggressive recruitment and retention activities taken by us and our competitors as to how these drivers affected our business for the periods presented.well as growth in independent sales agent teams.
|
| | | | | | | | | | | | | | | | | | | | | |
| | Three Months Ended September 30, | | Nine Months Ended September 30, |
| | 2017 | | 2016 | | % Change | | 2017 | | 2016 | | % Change |
| RFG (a) | | | | | | | | | | | |
| Closed homesale sides | 318,961 |
| | 323,176 |
| | (1 | %) | | 866,956 |
| | 861,254 |
| | 1 | % |
| Average homesale price | $ | 292,000 |
| | $ | 275,325 |
| | 6 | % | | $ | 287,558 |
| | $ | 270,669 |
| | 6 | % |
| Average homesale broker commission rate | 2.49 | % | | 2.50 | % | | (1 | ) bps | | 2.50 | % | | 2.51 | % | | (1 | ) bps |
| Net effective royalty rate | 4.42 | % | | 4.50 | % | | (8 | ) bps | | 4.42 | % | | 4.50 | % | | (8 | ) bps |
| Royalty per side | $ | 334 |
| | $ | 322 |
| | 4 | % | | $ | 331 |
| | $ | 318 |
| | 4 | % |
| NRT | | | | | | | | | | | |
| Closed homesale sides | 95,236 |
| | 95,605 |
| | — | % | | 262,849 |
| | 258,163 |
| | 2 | % |
| Average homesale price | $ | 506,418 |
| | $ | 486,343 |
| | 4 | % | | $ | 515,617 |
| | $ | 487,781 |
| | 6 | % |
| Average homesale broker commission rate | 2.45 | % | | 2.46 | % | | (1 | ) bps | | 2.45 | % | | 2.47 | % | | (2 | ) bps |
| Gross commission income per side | $ | 13,142 |
| | $ | 12,681 |
| | 4 | % | | $ | 13,358 |
| | $ | 12,750 |
| | 5 | % |
| Cartus | | | | | | | | | | | |
| Initiations | 39,608 |
| | 40,556 |
| | (2 | %) | | 126,921 |
| | 129,290 |
| | (2 | %) |
| Referrals | 23,905 |
| | 25,495 |
| | (6 | %) | | 64,392 |
| | 68,526 |
| | (6 | %) |
| TRG | | | | | | | | | | | |
| Purchase title and closing units (b) | 43,764 |
| | 42,932 |
| | 2 | % | | 122,069 |
| | 116,082 |
| | 5 | % |
| Refinance title and closing units (c) | 6,513 |
| | 15,170 |
| | (57 | %) | | 21,370 |
| | 36,100 |
| | (41 | %) |
| Average fee per closing unit | $ | 2,115 |
| | $ | 1,824 |
| | 16 | % | | $ | 2,092 |
| | $ | 1,865 |
| | 12 | % |
_______________
| |
(a) | Includes all franchisees except for NRT. |
| |
(b) | The amounts presented for the three and nine months ended September 30, 2017 include 3,325 and 8,351 purchase units, respectively, as a result of the acquisitions completed prior to the third quarter of 2017.
|
| |
(c) | The amounts presented for the three and nine months ended September 30, 2017 include 725 and 1,858 refinance units, respectively, as a result of the acquisitions completed prior to the third quarter of 2017.
|
RESULTS OF OPERATIONS
Discussed below are our condensed consolidated results of operations and the results of operations for each of our reportable segments. The reportable segments presented below represent our operating segments for which separate financial information is available and which is utilized on a regular basis by our chief operating decision maker to assess performance and to allocate resources. In identifying our reportable segments, we also consider the nature of services provided by our operating segments. Management evaluates the operating results of each of our reportable segments based upon revenue and Operating EBITDA. Operating EBITDA is defined by us as net income (loss) before depreciation and amortization, interest (income) expense, net (other than Relocation Servicesrelocation services interest for securitization assets and securitization obligations) and, income taxes, eachand other items that are not core to the operating activities of which is presentedthe Company such as restructuring charges, former parent legacy items, gains or losses on our Condensed Consolidated Statementsthe early extinguishment of Operations.debt, impairments, gains or losses on discontinued operations and gains or losses on the sale of investments or other assets. Our presentation of Operating EBITDA may not be comparable to similarly titled measures used by other companies.
Our results of operations should be read in conjunction with our other disclosures in this Item 2. including under the heading Current Business and Industry Trends. Three Months Ended September June 30, 20172021 vs. Three Months EndedSeptember June 30, 20162020
Our consolidated results comprised the following:
| | | | | | | | | | | | | | | | | |
| | Three Months Ended June 30, |
| | 2021 | | 2020 | | Change |
| Net revenues | $ | 2,276 | | | $ | 1,255 | | | $ | 1,021 | |
| Total expenses | 2,075 | | | 1,309 | | | 766 | |
| Income (loss) before income taxes, equity in earnings and noncontrolling interests | 201 | | | (54) | | | 255 | |
| Income tax expense (benefit) | 60 | | | (5) | | | 65 | |
| Equity in earnings of unconsolidated entities | (10) | | | (36) | | | 26 | |
| Net income (loss) | 151 | | | (13) | | | 164 | |
| Less: Net income attributable to noncontrolling interests | (2) | | | (1) | | | (1) | |
| Net income (loss) attributable to Realogy Holdings and Realogy Group | $ | 149 | | | $ | (14) | | | $ | 163 | |
|
| | | | | | | | | | | |
| | Three Months Ended September 30, |
| | 2017 | | 2016 | | Change |
| Net revenues | $ | 1,674 |
| | $ | 1,644 |
| | $ | 30 |
|
| Total expenses (1) | 1,521 |
| | 1,468 |
| | 53 |
|
| Income before income taxes, equity in earnings and noncontrolling interests | 153 |
| | 176 |
| | (23 | ) |
| Income tax expense | 67 |
| | 74 |
| | (7 | ) |
| Equity in earnings of unconsolidated entities | (10 | ) | | (5 | ) | | (5 | ) |
| Net income | 96 |
| | 107 |
| | (11 | ) |
| Less: Net income attributable to noncontrolling interests | (1 | ) | | (1 | ) | | — |
|
| Net income attributable to Realogy Holdings and Realogy Group | $ | 95 |
| | $ | 106 |
| | $ | (11 | ) |
_______________
| |
(1) | Total expenses for the three months ended September 30, 2017 includes $2 million of restructuring charges, $1 million related to loss on the early extinguishment of debt and a net cost of $1 million of former parent legacy items. Total expenses for the three months ended September 30, 2016 includes $9 million of restructuring charges partially offset by $5 million of gains related to mark-to-market adjustments for our interest rate swaps. |
Net revenues increased $30$1,021 million or 2%81% for the three months ended SeptemberJune 30, 20172021 compared with the three months ended SeptemberJune 30, 2016, principally due to increases in gross commission income and franchise fees as a result of2020 driven by higher homesale transaction volume of 4%at Realogy Franchise and Brokerage Groups and an increase in purchase title and closing units at Realogy Title Group, in each case due primarily to continued strength in the residential real estate market, which we attribute to certain beneficial consumer trends supported by other factors, including a favorable mortgage rate environment and low inventory contributing to higher average homesale price. Quarter-over-quarter comparisons, on a combinedCompany-wide and individual segment basis, for NRT and RFG. also benefited from comparison against the sharp decline in homesale transactions that occurred in the second quarter of 2020 due to factors related to the COVID-19 crisis.
Total expenses increased $53$766 million or 4%59% for the second quarter of 2021 compared to the second quarter of 2020 primarily due to:
•a $53$688 million increase in commission and other sales associate-relatedagent-related costs primarily due to an increase in homesale transaction volume at NRT and higher sales commissions paid to its independent sales associates;
a $5 million increase in marketing expenses; and
a $4 million net increase in interest expense to $41 million in the third quarter of 2017 from $37 million in the third quarter of 2016 due to the absence of mark-to-market adjustments for our interest rate swaps that resulted in gains of $5 million during the third quarter of 2016 less a $1 million decreaseas well as a result of higher agent commission costs primarily driven by a reductionshift in total outstanding indebtednessmix to more productive, higher compensated agents, the impact of recruitment and retention efforts, and business and geographic mix;
•a lower weighted average interest rate.
The expense increases were partially offset by:
a $7$147 million decrease in restructuring costs related to the Company's business optimization plan; and
a $2 million decreaseincrease in operating and general and administrative expenses, which was largely the result of the absence in the 2021 quarter of the benefit of the temporary cost savings measures that were taken in the second quarter of 2020 in response to the COVID-19 crisis and due to higher employee incentive accruals; and
•a $25 million increase in marketing expense primarily driven by:due to higher advertising costs as compared to the second quarter of 2020, when such expenses were reduced due to the COVID-19 crisis,
| |
◦ | a $10 million increase in other expenses including professional fees and occupancy costs; and |
| |
◦ | a $1 million increase in employee-related costs primarily related to acquisitions; |
partially offset by:
| |
◦ | a $10 million decrease in variable operating costs at TRG primarily due to lower refinance and underwriter volume. |
Earnings from equity investments•impairments of $1 million primarily related to lease assets and software impairments during the second quarter of 2021 compared to $63 million in non-cash impairments during the second quarter of 2020;
•$15 million of gain on the sale of a business;
•a $13 million decrease in restructuring costs;
•a $1 million loss on the early extinguishment of debt as a result of the pay down of $150 million of outstanding borrowings under the Term Loan B Facility during the second quarter of 2021 compared to an $8 million loss on the early extinguishment of debt as a result of the refinancing transactions during the second quarter of 2020; and
•a $2 million net decrease in interest expense primarily due to a $2 million decrease in expense related to mark-to-market adjustments for interest rate swaps that resulted in $6 million losses during the second quarter of 2021 compared to losses of $8 million during the second quarter of 2020.
Equity in earnings were $10 million during the thirdsecond quarter of 20172021 compared to $5earnings of $36 million during the thirdsecond quarter of 2016.2020. Equity in earnings for Guaranteed Rate Affinity was $8 million, representing approximately 3% of the Company's Operating EBITDA for the second quarter of 2021, decreasing by $27 million from $35 million in the second quarter of 2020. The decrease was primarily the result of a negative $19 million related to mark-to-market adjustments on the mortgage loan pipeline as well as margin compression and a decline in refinance volumes, partially offset by strong purchase volume growth. Equity in earnings for the Company's other equity method investments increased $1 million from $1 million during the second quarter of 2021 compared with the same period in 2020.
During the second quarter of 2021, we incurred $5 million increase is equity earnings isof restructuring costs primarily due to:
an $8the program to be approximately $166 million, increase in equity earnings at NRTwith $122 million incurred to date and $44 million remaining primarily related to future expenses as a result of $14 million of earnings fromreducing the sale of the first two phases of PHH Home Loans' assets to Guaranteed Rate Affinity, partially offset by $2 million of exit costs. In addition, there was a $4 million decrease in earnings due to lower operating results as a result of lower origination volume, compressed industry margins and lower results due to the level of organizational change associated with the transition to the operations of Guaranteed Rate Affinity.
The increase in equity earnings was partially offset by:
a $3 million decrease in equity earnings at TRG primarily related to costs associated with the start up of operations of Guaranteed Rate Affinity, including $1 million of amortization of intangible assets recorded in purchase accounting.
As part of the business optimization initiative the Company began in the fourth quarter of 2015, we incurred $2 million of restructuring costs in the third quarter of 2017 compared to $9 million of costs in the third quarter of 2016. The Company expects to incur an additional $4 million related to initiatives still in progress bringing the total cost of the initiative to be $62 million.leased-office footprints. See Note 6,5, "Restructuring Costs", into the Condensed Consolidated Financial Statements for additional information.
The Company's provision for income taxes in interim periods is computed by applying its estimated annual effective tax rate against the income or loss before income taxes for the period. In addition, non-recurring or discrete items are recorded in the period in which they occur. The provision for income taxes was $67an expense of $60 million for the three months ended SeptemberJune 30, 20172021 compared to $74a benefit of $5 million for the three months ended SeptemberJune 30, 2016. Our federal and state blended statutory rate is estimated to be 40% for 2017 and our full year effective tax rate is estimated to be 41%.2020. Our effective tax rate was 41%28% for both the three months ended SeptemberJune 30, 20172021 and September2020. The effective tax rate for the three months ended June 30, 2016.2021 was primarily impacted by non-deductible executive compensation.
The following table reflects the results of each of our reportable segments during the three months ended SeptemberJune 30, 20172021 and 2016:2020:
| | | | | | | | | | | | | | | | | | | | | | | | | | | | | | | | | | | | | | | | | | | | | | | | | | | | | | | | | | | | | | | | | |
| | Revenues (a) | | $ Change | | %
Change | | Operating EBITDA | | $ Change | | %
Change | | Operating EBITDA Margin | | Change |
| | 2021 | | 2020 | | | | 2021 | | 2020 | | | | 2021 | | 2020 | |
| Realogy Franchise Group | $ | 347 | | | $ | 227 | | | 120 | | | 53 | | | $ | 224 | | | $ | 125 | | | 99 | | | 79 | | | 65 | % | | 55 | % | | 10 | |
| Realogy Brokerage Group | 1,791 | | | 933 | | | 858 | | | 92 | | | 70 | | | 15 | | | 55 | | | 367 | | | 4 | | | 2 | | | 2 | |
| Realogy Title Group | 255 | | | 160 | | | 95 | | | 59 | | | 55 | | | 61 | | | (6) | | | (10) | | | 22 | | | 38 | | | (16) | |
| Corporate and Other | (117) | | | (65) | | | (52) | | | * | | (39) | | | (26) | | | (13) | | | * | | | | | | |
| Total Company | $ | 2,276 | | | $ | 1,255 | | | 1,021 | | | 81 | | | $ | 310 | | | $ | 175 | | | 135 | | | 77 | | | 14 | % | | 14 | % | | — | |
| | | | | | | | | | | | | | | | | | | | | |
| Less: Depreciation and amortization | | 51 | | | 46 | | | | | | | | | | | |
| Interest expense, net | | 57 | | | 59 | | | | | | | | | | | |
| Income tax expense (benefit) | | 60 | | | (5) | | | | | | | | | | | |
| Restructuring costs, net (b) | | 5 | | | 18 | | | | | | | | | | | |
| Impairments (c) | | 1 | | | 63 | | | | | | | | | | | |
| Former parent legacy cost, net (d) | | 1 | | | — | | | | | | | | | | | |
| Loss on the early extinguishment of debt (d) | | 1 | | | 8 | | | | | | | | | | | |
| Gain on the sale of a business (e) | | (15) | | | — | | | | | | | | | | | |
| Net income (loss) attributable to Realogy Holdings and Realogy Group | | $ | 149 | | | $ | (14) | | | | | | | | | | | |
|
| | | | | | | | | | | | | | | | | | | | | | | | | | | | | | |
| | Revenues (a) | | % Change | | EBITDA (b) | | % Change | | EBITDA Margin | | Change |
| | 2017 | | 2016 | | | 2017 | | 2016 | | | 2017 | | 2016 | |
| RFG | $ | 224 |
| | $ | 215 |
| | 4 | % | | $ | 159 |
| | $ | 153 |
| | 4 | % | | 71 | % | | 71 | % | | — |
|
| NRT | 1,267 |
| | 1,231 |
| | 3 |
| | 62 |
| | 74 |
| | (16 | ) | | 5 |
| | 6 |
| | (1 | ) |
| Cartus | 111 |
| | 116 |
| | (4 | ) | | 37 |
| | 40 |
| | (8 | ) | | 33 |
| | 34 |
| | (1 | ) |
| TRG | 154 |
| | 164 |
| | (6 | ) | | 21 |
| | 23 |
| | (9 | ) | | 14 |
| | 14 |
| | — |
|
| Corporate and Other | (82 | ) | | (82 | ) | | * |
| | (25 | ) | | (20 | ) | | * |
| | | | | | |
| Total Company | $ | 1,674 |
| | $ | 1,644 |
| | 2 | % | | $ | 254 |
| | $ | 270 |
| | (6 | %) | | 15 | % | | 16 | % | | (1 | ) |
| Less: Depreciation and amortization (c) | | 51 |
| | 53 |
| | | | | | | | |
| Interest expense, net | | 41 |
| | 37 |
| | | | | | | | |
| Income tax expense | | 67 |
| | 74 |
| | | | | | | | |
| Net income attributable to Realogy Holdings and Realogy Group | | $ | 95 |
| | $ | 106 |
| | | | | | | | |
_______________* not meaningful
(a)Includes the elimination of transactions between segments, which consists of intercompany royalties and marketing fees paid by Realogy Brokerage Group of $117 million and $65 million during the three months ended June 30, 2021 and 2020, respectively.
| |
(a) | Includes the elimination of transactions between segments, which consists of intercompany royalties and marketing fees paid by NRT of $82 million during both the three months ended September 30, 2017 and September 30, 2016. |
| |
(b) | EBITDA for the three months ended September 30, 2017 includes $1 million related to loss on the early extinguishment of debt and a net cost of $1 million of former parent legacy items in Corporate and Other and $2 million of restructuring charges in NRT. |
EBITDA(b)Restructuring charges incurred for the three months ended SeptemberJune 30, 2016 includes $92021 include $1 million at Realogy Franchise Group, $2 million at Realogy Brokerage Group and $2 million at Corporate and Other. Restructuring charges incurred for the three months ended June 30, 2020 include $4 million at Realogy Franchise Group, $12 million at Realogy Brokerage Group and $2 million at Realogy Title Group.
(c)Impairments for the three months ended June 30, 2021 primarily relate to lease asset and software impairments. Non-cash impairments for the three months ended June 30, 2020 include $44 million of restructuringimpairment charges reflected above as follows: $6during the three months ended June 30, 2020 (while Cartus Relocation Services was held for sale) to reduce the net assets to the estimated proceeds and other asset impairments of $19 million primarily related to lease asset impairments.
(d)Former parent legacy items and Loss on the early extinguishment of debt are recorded in NRT, $1 millionCorporate and Other.
(e)Gain on the sale of a business is recorded in RFG, $1 million in Cartus and $1 million in TRG.Realogy Brokerage Group.
| |
(c) | Depreciation and amortization for the three months ended September 30, 2017 includes $1 million of amortization expense related to Guaranteed Rate Affinity's purchase accounting included in the "Equity in earnings of unconsolidated entities" line on the Condensed Consolidated Statement of Operations. |
As described in the aforementioned table, Operating EBITDA margin for "Total Company" expressed as a percentage of revenues decreased 1 percentage point to 15% from 16%remained flat at 14% for the three months ended SeptemberJune 30, 20172021 compared to the same period in 2016. On2020. Operating EBITDA margin for "Total Company", as well as on a segment basis, RFG'swas negatively impacted by the absence in the 2021 quarter of the benefit of the temporary cost savings measures that were taken in the second quarter of 2020 in response to the COVID-19 crisis. Realogy Franchise Group's margin remained flat at 71%. NRT'sincreased 10 percentage points to 65% from 55% primarily due to an increase in royalty revenue as a result of an increase in homesale transaction volume. Realogy Brokerage Group's margin decreased 1increased 2 percentage pointpoints to 5%4% from 6%2% primarily due to higher sales commission percentages paid to its independent sales associatestransaction volume, partially offset by lower restructuringhigher agent commission costs driven by a shift in mix to more productive, higher compensated agents, the impact of recruiting and an increase in earnings related to its equity investment in PHH Home Loans during the third quarter of 2017 compared to the same period in 2016. Cartus'retention efforts, as well as business and geographic mix. Realogy Title Group's margin decreased 116 percentage pointpoints to 33%22% from 34% primarily due
to lower international revenues. TRG's margin remained flat at 14% due to losses from equity investments during the third quarter of 2017 compared to earnings from equity investments during the third quarter of 201638% primarily due to costs associated with the start up of operationsa decrease in equity in earnings of Guaranteed Rate Affinity, which was primarily driven by a negative $19 million related to mark-to-market adjustments on the mortgage loan pipeline as well as margin compression and lower refinancing volume, partially offset by the reversal of a legal reserve.strong purchase volume growth.
Corporate and Other Operating EBITDA for the three months ended SeptemberJune 30, 20172021 declined $5$13 million to negative $25$39 million largely the result of the absence in the 2021 quarter of the benefit of the temporary cost savings measures that were taken in the second quarter of 2020 in response to the COVID-19 crisis as well as higher employee incentive accruals.
Realogy Franchise and Brokerage Groups on a Combined Basis
The following table reflects Realogy Franchise and Brokerage Groups' results before the intercompany royalties and marketing fees as well as on a combined basis to show the Operating EBITDA contribution of these business segments to the overall Operating EBITDA of the Company. The Operating EBITDA margin for the combined segments increased 2 percentage points from 13% to 15% primarily due to higher homesale transaction volume during the second quarter of 2021 compared to the second quarter of 2020:
| | | | | | | | | | | | | | | | | | | | | | | | | | | | | | | | | | | | | | | | | | | | | | | | | | | | | | | | | | | | | | | | | |
| | Revenues | | $ Change | | %
Change | | Operating EBITDA | | $ Change | | %
Change | | Operating EBITDA Margin | | Change |
| | 2021 | | 2020 | | | | 2021 | | 2020 | | | | 2021 | | 2020 | |
| Realogy Franchise Group (a) | $ | 230 | | | $ | 162 | | | 68 | | | 42 | | | $ | 107 | | | $ | 60 | | | 47 | | | 78 | | | 47 | % | | 37 | % | | 10 | |
| Realogy Brokerage Group (a) | 1,791 | | | 933 | | | 858 | | | 92 | | | 187 | | | 80 | | | 107 | | | 134 | | | 10 | | | 9 | | | 1 | |
| Realogy Franchise and Brokerage Groups Combined | $ | 2,021 | | | $ | 1,095 | | | 926 | | | 85 | | | $ | 294 | | | $ | 140 | | | 154 | | | 110 | | | 15 | % | | 13 | % | | 2 | |
_______________
(a)The segment numbers noted above do not reflect the impact of intercompany royalties and marketing fees paid by Realogy Brokerage Group to Realogy Franchise Group of $117 million and $65 million during the three months ended June 30, 2021 and 2020, respectively.
Realogy Franchise Group
Revenues increased $120 million to $347 million and Operating EBITDA increased $99 million to $224 million for the three months ended June 30, 2021 compared with the same period in 2020.
Revenues increased $120 million primarily as a result of:
•a $58 million increase in third-party domestic franchisee royalty revenue primarily due to an 80% increase in
homesale transaction volume at Realogy Franchise Group which consisted of a 35% increase in existing homesale transactions and a 34% increase in average homesale price;
•a $49 million increase in intercompany royalties received from Realogy Brokerage Group; and
•a $12 million increase in brand marketing fund revenue and related expense primarily due to higher advertising costs as compared to the second quarter of 2020, when such expenses were reduced due to the COVID-19 crisis.
Realogy Franchise Group revenue includes intercompany royalties received from Realogy Brokerage Group of $112 million and $63 million during the second quarter of 2021 and 2020, respectively, which are eliminated in consolidation against the expense reflected in Realogy Brokerage Group's results.
The $99 million increase in Operating EBITDA was primarily due to the $120 million increase in revenues discussed above and $11 million of lower expense for bad debt and notes reserves. These Operating EBITDA increases were partially offset by $20 million increase in employee and other operating costs, largely the result of the absence in the 2021 quarter of the benefit of the temporary cost savings measures that were taken in the second quarter of 2020 in response to the COVID-19 crisis and higher employee incentive accruals, as well as a $12 million increase in marketing expense discussed above.
Realogy Brokerage Group
Revenues increased $858 million to $1,791 million and Operating EBITDA increased $55 million to $70 million for the three months ended June 30, 2021 compared with the same period in 2020.
The revenue increase of $858 million was primarily driven by a 96% increase in homesale transaction volume at Realogy Brokerage Group which primarily consisted of a 46% increase in existing homesale transactions and a 35% increase in average homesale price. Realogy Brokerage Group saw continued strength in the residential real estate market in the second quarter of 2021, which we attribute to certain beneficial consumer trends supported by other factors, including a favorable mortgage rate environment and low inventory contributing to higher average homesale price.
Operating EBITDA increased $55 million primarily due to a $2an $858 million increase in employeerevenues discussed above, partially offset by:
•a $688 million increase in commission expenses paid to independent sales agents from $685 million for the second quarter of 2020 to $1,373 million in the second quarter of 2021. Commission expense increased primarily as a result of the impact of higher homesale transaction volume as discussed above, as well as higher agent commission costs primarily driven by a shift in mix to more productive, higher compensated agents, the impact of recruiting and retention efforts, as well as business and geographic mix;
•a $51 million increase in employee-related and other operating costs largely the result of the absence in the 2021 quarter of the benefit of the temporary cost savings measures that were taken in the second quarter of 2020 in response to the COVID-19 crisis and due to higher employee incentive accrualsaccruals;
•a $49 million increase in royalties paid to Realogy Franchise Group from $63 million during the second quarter of 2020 to $112 million during the second quarter of 2021 associated with the homesale transaction volume increase as described above; and investments
•a $15 million increase in technology development,marketing expense primarily due to higher advertising costs as compared to the second quarter of 2020, when such expenses were reduced due to the COVID-19 crisis.
Realogy Title Group
Revenues increased $95 million to $255 million and Operating EBITDA decreased $6 million to $55 million for the three months ended June 30, 2021 compared with the same period in 2020.
Revenues increased $95 million primarily as a result of a $57 million increase in resale revenue attributable to increased purchase unit activity as a result of the continued strength in the residential real estate market, which we attribute to certain beneficial consumer trends supported by other factors, including a favorable mortgage rate environment and low inventory contributing to higher average homesale price. In addition, there was a $39 million increase in underwriter revenue (including a $33 million increase in underwriter revenue with unaffiliated agents, which had a $3 million net positive impact on Operating EBITDA due to the related expense increase of $30 million), partially offset by a $4 million decrease in refinance revenue. Equity earnings or losses related to our minority interest in Guaranteed Rate Affinity are included in the financial results of Realogy Title Group, but are not reported as revenue to Realogy Title Group.
Operating EBITDA decreased $6 million primarily as a result of a $45 million increase in professional fees supporting strategic initiatives, $1employee and other operating costs, largely the result of the absence in the 2021 quarter of the benefit of the temporary cost savings measures that were taken in the second quarter of 2020 in response to the COVID-19 crisis and due to higher variable costs as a result of higher volume and higher employee incentive accruals, and a $30 million increase in variable operating costs related to the increase in underwriter revenue with unaffiliated agents discussed above where the revenue and expense are recorded on a gross basis. In addition, equity in earnings decreased $26 million from $36 million during the second quarter of 2020 to $10 million during the second quarter of 2021 primarily related to Guaranteed Rate Affinity. The decline in equity in earnings from Guaranteed Rate Affinity was driven primarily by a negative $19 million related to mark-to-market adjustments on the mortgage loan pipeline as well as margin compression and a decline in refinance volumes, partially offset by strong purchase volume growth. These decreases were partially offset by the $95 million increase in revenues discussed above.
Six Months Ended June 30, 2021 vs Six Months Ended June 30, 2020
Our consolidated results comprised the following:
| | | | | | | | | | | | | | | | | |
| | Six Months Ended June 30, |
| | 2021 | | 2020 | | Change |
| Net revenues | $ | 3,823 | | | $ | 2,423 | | | $ | 1,400 | |
| Total expenses | 3,602 | | | 3,089 | | | 513 | |
| Income (loss) before income taxes, equity in earnings and noncontrolling interests | 221 | | | (666) | | | 887 | |
| Income tax expense (benefit) | 77 | | | (146) | | | 223 | |
| Equity in earnings of unconsolidated entities | (41) | | | (45) | | | 4 | |
| Net income (loss) | 185 | | | (475) | | | 660 | |
| Less: Net income attributable to noncontrolling interests | (3) | | | (1) | | | (2) | |
| Net income (loss) attributable to Realogy Holdings and Realogy Group | $ | 182 | | | $ | (476) | | | $ | 658 | |
Net revenues increased $1,400 million or 58% for the six months ended June 30, 2021 compared with the six months ended June 30, 2020 driven by higher homesale transaction volume at Realogy Franchise and Brokerage Groups and an increase in volume at Realogy Title Group, in each case due primarily to continued strength in the residential real estate market, which we attribute to certain beneficial consumer trends supported by other factors, including a favorable mortgage rate environment and low inventory contributing to higher average homesale price. Year-over-year comparisons, on a Company-wide and individual segment basis, also benefited from comparison against the sharp decline in homesale transactions that occurred in the second quarter of 2020 due to factors related to the COVID-19 crisis.
Total expenses increased $513 million or 17% for the first half of 2021 compared to the first half of 2020 primarily due to:
•a $943 million increase in commission and other sales agent-related costs primarily due to an increase in homesale transaction volume as well as a result of higher agent commission costs primarily driven by a shift in mix to more productive, higher compensated agents, the impact of recruitment and retention efforts, and business and geographic mix;
•a $165 million increase in operating and general and administrative expenses, largely the result of the absence of the benefit of the temporary cost savings measures that were taken in the second quarter of 2020 in response to the COVID-19 crisis and due to higher employee incentive accruals; and
•a $24 million increase in marketing expense primarily due to higher advertising costs as compared to the second quarter of 2020, when such expenses were reduced due to the COVID-19 crisis,
partially offset by:
•impairments of $2 million primarily related to lease assets and software impairments during the six months ended June 30, 2021 compared to $540 million in non-cash impairments during the six months ended June 30, 2020.
•a $65 million net decrease in interest expense primarily due to a $66 million decrease in expense related to mark-to-market adjustments for interest rate swaps that resulted in $7 million gains for the six months ended June 30, 2021 compared to losses of $59 million for the six months ended June 30, 2020;
•a $20 million decrease in restructuring costs;
•$15 million of gain on the sale of a business; and
•an $18 million loss on the early extinguishment of debt as a result of the reductionrefinancing transactions in the Unsecured LetterJanuary and February 2021 and pay down of Credit Facility and a net cost of $1$150 million of former parent legacy itemsoutstanding borrowings under the Term Loan B Facility in April 2021 compared to an $8 million loss on the early extinguishment of debt as a result of the refinancing transactions during the third quarterfirst half of 2017 compared to the third quarter of 2016.2020.
EBITDA before restructuring charges was $256Equity in earnings were $41 million for the threesix months ended SeptemberJune 30, 20172021 compared to $279earnings of $45 million during the same period of 2020. Equity in earnings for Guaranteed Rate Affinity was $38 million, representing approximately 8% of the Company's Operating EBITDA for the three months ended September 30, 2016. EBITDA before restructuring chargesfirst half of 2021, decreasing by reportable segment$6 million from $44 million in the first half of 2020. The decrease was primarily the result of the impact of mark-to-market adjustments on the mortgage loan pipeline as well as margin compression and a decline in refinance volumes, partially offset by strong purchase volume growth. Equity in earnings for the three months ended September 30, 2017 was as follows:
|
| | | | | | | | | | | | | | | | | | |
| | Three Months Ended September 30, | | |
| | 2017 | | 2016 | | |
| | EBITDA | | Restructuring Charges | | EBITDA Before Restructuring | | EBITDA Before Restructuring | | %
Change |
| RFG | $ | 159 |
| | $ | — |
| | $ | 159 |
| | $ | 154 |
| | 3 | % |
| NRT | 62 |
| | 2 |
| | 64 |
| | 80 |
| | (20 | ) |
| Cartus | 37 |
| | — |
| | 37 |
| | 41 |
| | (10 | ) |
| TRG | 21 |
| | — |
| | 21 |
| | 24 |
| | (13 | ) |
| Corporate and Other | (25 | ) | | — |
| | (25 | ) | | (20 | ) | | * |
|
| Total Company | $ | 254 |
| | $ | 2 |
| | $ | 256 |
| | $ | 279 |
| | (8 | %) |
_______________
The following table reflects RFG and NRT results on a combined basis forCompany's other equity method investments increased $2 million from $1 million during the third quarterfirst half of 2017 compared to the third quarter of 2016. The EBITDA before restructuring margin for the combined segments decreased 1 percentage point from 17% to 16% due primarily to higher sales commission percentages paid to NRT's independent sales associates:
|
| | | | | | | | | | | | | | | | | | | | | | | | | | | | | | |
| | Revenues (a) | | % Change | | EBITDA Before Restructuring (b) | | % Change | | Margin | | Change |
| | 2017 | | 2016 | | | 2017 | | 2016 | | | 2017 | | 2016 | |
| RFG and NRT Combined | $ | 1,409 |
| | $ | 1,364 |
| | 3 | % | | $ | 223 |
| | $ | 234 |
| | (5 | %) | | 16 | % | | 17 | % | | (1 | ) |
_______________ | |
(a) | Excludes transactions between segments, which consists of intercompany royalties and marketing fees paid by NRT to RFG of $82 million during both the three months ended September 30, 2017 and 2016. |
| |
(b) | EBITDA for the combined RFG and NRT segments excludes $2 million and $7 million of restructuring charges for the three months ended September 30, 2017 and 2016, respectively. |
Real Estate Franchise Services (RFG)
Revenues increased $9 million to $224 million and EBITDA increased $6 million to $159 million for the three months ended September 30, 20172021 compared with the same period in 2016.2020.
During the six months ended June 30, 2021, we incurred $10 million of restructuring costs primarily related to the Company's restructuring program focused on office consolidation and instituting operational efficiencies to drive profitability.The increase in revenue was driven by a $2Company expects the estimated total cost of the program to be approximately $166 million, increase in third-party domestic franchisee royalty revenue duewith $122 million incurred to a 6% increase in the average homesale price, partially offset by a 1% decrease in the number of homesale transactions including the negative impact attributabledate and $44 million remaining primarily related to regional market disruption due to hurricanes in the third quarter of 2017, and a lower net effective royalty rate. Revenue also increased due to a $2 million increase in royalties received from NRTfuture expenses as a result of volume increases at NRT, a $3 million increase in other revenue primarily due to brand conferences and franchisee events and a $2 million increase in international revenues.
The intercompany royalties received from NRT of $81 million and $79 million duringreducing the third quarter of 2017 and 2016, respectively, are eliminated in consolidation to avoid the revenue from being double counted in NRT and RFG.leased-office footprints. See "Company Owned Real Estate Brokerage Services" for a discussion of the drivers related to intercompany royalties paid to RFG.
The $6 million increase in EBITDA was principally due to the $9 million increase in revenues discussed above and the absence of $1 million of restructuring charges incurred in the third quarter of 2016, partially offset by a $2 million increase in expenses related to the brand conferences and franchisee events.
Company Owned Real Estate Brokerage Services (NRT)
Revenues increased $36 million to $1,267 million and EBITDA decreased $12 million to $62 million for the three months ended September 30, 2017 compared with the same period in 2016.
The revenue increase of $36 million was comprised of a $19 million increase in commission income earned on homesale transactions by our existing brokerage operations and a $17 million increase in commission income earned from acquisitions. The increase was driven by a 4% increase in the average price of homes, partially offset by a 1 basis point decrease in the average broker commission rate. The number of homesale transactions remained flat in spite of the negative impact on homesale transaction volume attributable to the market disruption in Texas and Florida due to the hurricanes during the third quarter of 2017. We believe our positive revenue growth is attributable to the recruiting and organic growth focus by NRT management as well as stabilization in the high end of the housing market. The stabilization at the high end of the housing market had an adverse impact on the average homesale broker commission rate. In addition, homesale price is continuing to increase due to continued constrained inventory levels across the lower and mid price points in the markets served by NRT.
EBITDA decreased $12 million primarily due to:
a $53 million increase in commission expenses paid to independent sales associates from $834 million in the third quarter of 2016 to $887 million in the third quarter of 2017. The $53 million increase is comprised of a $41 million increase in commission expense due to our existing brokerage operations and was driven by the impact of initiatives focused on growing and retaining our productive independent sales associate base and higher homesale transaction volume, as well as a $12 million increase in commission expense related to acquisitions. The $53 million increase in commission expense was significantly impacted by the mix of business as approximately 70% of the increase was due to higher homesale transaction volume in the west region where we pay a greater proportion of commissions to independent sales associates;
a $7 million increase in other costs including occupancy costs;
a $2 million increase in marketing expenses including the effect of acquisitions; and
a $2 million increase in royalties paid to RFG from $79 million in the third quarter of 2016 to $81 million in the third quarter of 2017.
These EBITDA decreases were partially offset by:
the $36 million increase in revenues discussed above;
an $8 million increase in earnings for our equity method investment in PHH Home Loans for the third quarter of 2017 compared to the third quarter 2016 as a result of $14 million of earnings from the sale of the first two phases of PHH Home Loans' assets to Guaranteed Rate Affinity partially offset by $2 million of exit costs. In addition, there was a $4 million decrease in earnings due to lower operating results as a result of lower origination volume, compressed industry margins and lower results due to the level of organizational change associated with the transition of the operations to Guaranteed Rate Affinity;
a $4 million decrease in restructuring costs related to the Company's business optimization plan from $6 million in the third quarter of 2016 to $2 million in the third quarter of 2017; and
a $3 million decrease in employee-related costs due to a $5 million decrease primarily related to expense reduction initiatives offset by a $2 million increase in costs attributable to acquisitions.
Relocation Services (Cartus)
Revenues decreased $5 million to $111 million and EBITDA decreased $3 million to $37 million for the three months ended September 30, 2017 compared with the same period in 2016.
Revenues decreased $5 million primarily as a result of a $3 million decrease in other revenue due to lower volume and a $2 million decrease in international revenue as a result of an increasingly higher percentage of clients reducing their global relocation activity.
EBITDA decreased $3 million as a result of the $5 million decrease in revenues discussed above, partially offset by a $1 million decrease in employee related costs and the absence of $1 million of restructuring costs incurred during the third quarter of 2016.
Title and Settlement Services (TRG)
Revenues decreased $10 million to $154 million and EBITDA decreased $2 million to $21 million for the three months ended September 30, 2017 compared with the same period in 2016.
The decrease in revenues was as a result of a $6 million decrease in refinancing revenue, which was the primary driver of an $8 million decrease of underwriter revenue, partially offset by a $7 million increase in resale revenue related to acquisitions. The overall decline in revenue was due to a decrease in activity in the refinance market and the negative impact attributable to regional market disruption due to hurricanes in the third quarter of 2017.
EBITDA decreased $2 million as a result of the $10 million decrease in revenues discussed above, an increase of $2 million in employee-related costs primarily related to acquisitions and a $2 million decrease in earnings from equity investments related to costs associated with the start up of operations of Guaranteed Rate Affinity during the third quarter of 2017. These decreases were mostly offset by a $10 million decrease in variable operating costs primarily due to lower refinancing and underwriter volume and $2 million related to the reversal of a legal reserve.
Nine Months Ended September 30, 2017 vs. Nine Months Ended September 30, 2016
Our consolidated results comprised the following:
|
| | | | | | | | | | | |
| | Nine Months Ended September 30, |
| | 2017 | | 2016 | | Change |
| Net revenues | $ | 4,670 |
| | $ | 4,440 |
| | $ | 230 |
|
| Total expenses (1) | 4,368 |
| | 4,177 |
| | 191 |
|
| Income before income taxes, equity in earnings and noncontrolling interests | 302 |
| | 263 |
| | 39 |
|
| Income tax expense | 131 |
| | 114 |
| | 17 |
|
| Equity in earnings of unconsolidated entities | (7 | ) | | (10 | ) | | 3 |
|
| Net income | 178 |
| | 159 |
| | 19 |
|
| Less: Net income attributable to noncontrolling interests | (2 | ) | | (3 | ) | | 1 |
|
| Net income attributable to Realogy Holdings and Realogy Group | $ | 176 |
| | $ | 156 |
| | $ | 20 |
|
_______________
| |
(1) | Total expenses for the nine months ended September 30, 2017 includes $9 million of restructuring charges, an $8 million expense related to the settlement of the Strader legal matter, $5 million related to losses on the early extinguishment of debt and $4 million of losses related to mark-to-market adjustments for our interest rate swaps, partially offset by a net benefit of $10 million of former parent legacy items. Total expenses for the nine months ended September 30, 2016 includes $40 million of losses related to mark-to-market adjustments for our interest rate swaps, $30 million of restructuring charges and a net cost of $1 million of former parent legacy items. |
Net revenues increased $230 million or 5% for the nine months ended September 30, 2017 compared with the same period in 2016, principally due to increases in gross commission income and franchise fees as a result of a homesale transaction volume increase of 7% on a combined basis for NRT and RFG.
Total expenses increased $191 million or 5% primarily due to:
a $206 million increase in commission and other sales associate-related costs due to an increase in homesale transaction volume at NRT and higher sales commissions paid to its independent sales associates;
a $39 million increase in operating and general and administrative expenses primarily driven by:
| |
◦ | $24 million of additional employee-related costs associated with acquisitions; |
| |
◦ | a $24 million increase in other expenses including professional fees and occupancy costs; and |
| |
◦ | an $8 million expense related to the settlement of the Strader legal matter in the second quarter of 2017; |
partially offset by:
| |
◦ | a $7 million decrease in variable operating costs at TRG primarily due to lower refinance and underwriter volume; |
a $14 million increase in marketing expenses; and
$5 million related to the losses on the early extinguishment of debt primarily as a result of the refinancing transaction completed during the first quarter of 2017.
The expense increases were partially offset by:
a $42 million net decrease in interest expense to $127 million for the nine months ended September 30, 2017 from $169 million for the nine months ended September 30, 2016. Mark-to-market adjustments for our interest rate swaps resulted in losses of $4 million for the nine months ended September 30, 2017 compared to losses of $40 million in the same period of 2016. Before the mark-to-market adjustments for our interest rate swaps, interest expense decreased $6 million to $123 million for the nine months ended September 30, 2017 from $129 million for the nine months ended September 30, 2016 as a result of a reduction in total outstanding indebtedness and a lower weighted average interest rate;
a $21 million decrease in restructuring costs related to the Company's business optimization plan (see Note 6,5, "Restructuring Costs", into the Condensed Consolidated Financial Statements for additional information); and
an $11 million increase in the net benefit of former parent legacy items primarily as a result of the settlement of a Cendant legacy tax matter.
Earnings from equity investments were $7 million for the nine months ended September 30, 2017 compared to $10 million for the nine months ended September 30, 2016. The $3 million decrease in earnings is primarily due to:
a $4 million decrease in equity earnings at TRG primarily related to costs associated with the start up of operations of Guaranteed Rate Affinity, including $1 million of amortization of intangible assets recorded in purchase accounting.
The decrease in equity earnings was partially offset by:
a $1 million increase in equity earnings at NRT as a result of $14 million of earnings from the first two phases of the sale of PHH Home Loans' assets to Guaranteed Rate Affinity, partially offset by $5 million of exit costs. In addition, there was a $8 million decrease in earnings due to lower operating results as a result of lower origination volume, compressed industry margins and lower results due to the level of organizational change associated with the transition of the operations to Guaranteed Rate Affinity.information.
The Company's provision for income taxes in interim periods is computed by applying its estimated annual effective tax rate against the income or loss before income taxes for the period. In addition, non-recurring or discrete items are recorded in the period in which they occur. The provision for income taxes was $131an expense of $77 million for the ninesix months ended SeptemberJune 30, 20172021 compared to $114a benefit of $146 million for the ninesix months ended SeptemberJune 30, 2016. Our federal and state blended statutory rate is estimated to be 40% for 2017 and our full year effective tax rate is estimated to be 41%.2020. Our effective tax rate was 42%29% and 24% for both the ninesix months ended SeptemberJune 30, 20172021 and SeptemberJune 30, 2016.2020, respectively. The effective tax rate in each reporting periodfor the six months ended June 30, 2021 was primarily impacted by a discrete item related to equity awards for which the market value at vesting was lower than at the date of grant.non-deductible executive compensation.
The following table reflects the results of each of our reportable segments during the ninesix months ended SeptemberJune 30, 20172021 and 2016:2020:
| | | | | | | | | | | | | | | | | | | | | | | | | | | | | | | | | | | | | | | | | | | | | | | | | | | | | | | | | | | | | | | | | |
| | Revenues (a) | | $ Change | | %
Change | | Operating EBITDA | | $ Change | | %
Change | | Operating EBITDA Margin | | Change |
| | 2021 | | 2020 | | | | 2021 | | 2020 | | | | 2021 | | 2020 | |
| Realogy Franchise Group | $ | 601 | | | $ | 447 | | | 154 | | | 34 | | | $ | 365 | | | $ | 221 | | | 144 | | | 65 | | 61% | | 49 | % | | 12 | |
| Realogy Brokerage Group | 2,962 | | | 1,802 | | | 1,160 | | | 64 | | | 65 | | | (36) | | | 101 | | | 281 | | 2 | | (2) | | | 4 | |
| Realogy Title Group | 456 | | | 297 | | | 159 | | | 54 | | | 116 | | | 73 | | | 43 | | | 59 | | 25 | | 25 | | | — | |
| Corporate and Other | (196) | | | (123) | | | (73) | | | * | | (74) | | | (51) | | | (23) | | | * | | | | | | |
| Total Company | $ | 3,823 | | | $ | 2,423 | | | 1,400 | | | 58 | | | $ | 472 | | | $ | 207 | | | 265 | | | 128 | | 12% | | 9 | % | | 3 | |
| | | | | | | | | | | | | | | | | | | | | |
| Less: Depreciation and amortization | | 102 | | | 91 | | | | | | | | | | | |
| Interest expense, net | | 95 | | | 160 | | | | | | | | | | | |
| Income tax expense (benefit) | | 77 | | | (146) | | | | | | | | | | | |
| Restructuring costs, net (b) | | 10 | | | 30 | | | | | | | | | | | |
| Impairments (c) | | 2 | | | 540 | | | | | | | | | | | |
| Former parent legacy cost, net (d) | | 1 | | | — | | | | | | | | | | | |
| Loss on the early extinguishment of debt (d) | | 18 | | | 8 | | | | | | | | | | | |
| Gain on the sale of a business (e) | | (15) | | | — | | | | | | | | | | | |
| Net income (loss) attributable to Realogy Holdings and Realogy Group | | $ | 182 | | | $ | (476) | | | | | | | | | | | |
|
| | | | | | | | | | | | | | | | | | | | | | | | | | | | | | |
| | Revenues (a) | | % Change | | EBITDA (b) | | % Change | | EBITDA Margin | | Change |
| | 2017 | | 2016 | | | 2017 | | 2016 | | | 2017 | | 2016 | |
| RFG | $ | 631 |
| | $ | 593 |
| | 6 | % | | $ | 427 |
| | $ | 394 |
| | 8 | % | | 68 | % | | 66 | % | | 2 |
|
| NRT | 3,556 |
| | 3,340 |
| | 6 |
| | 113 |
| | 131 |
| | (14 | ) | | 3 |
| | 4 |
| | (1 | ) |
| Cartus | 290 |
| | 308 |
| | (6 | ) | | 65 |
| | 74 |
| | (12 | ) | | 22 |
| | 24 |
| | (2 | ) |
| TRG | 431 |
| | 424 |
| | 2 |
| | 49 |
| | 49 |
| | — |
| | 11 |
| | 12 |
| | (1 | ) |
| Corporate and Other | (238 | ) | | (225 | ) | | * |
| | (70 | ) | | (60 | ) | | * |
| | | | | | |
| Total Company | $ | 4,670 |
| | $ | 4,440 |
| | 5 | % | | $ | 584 |
| | $ | 588 |
| | (1 | )% | | 13 | % | | 13 | % | | — |
|
| Less: Depreciation and amortization (c) | | 150 |
| | 149 |
| | | | | | | | |
| Interest expense, net | | 127 |
| | 169 |
| | | | | | | | |
| Income tax expense | | 131 |
| | 114 |
| | | | | | | | |
| Net income attributable to Realogy Holdings and Realogy Group | | $ | 176 |
| | $ | 156 |
| | | | | | | | |
_______________* not meaningful
(a)Includes the elimination of transactions between segments, which consists of intercompany royalties and marketing fees paid by Realogy Brokerage Group of $196 million and $123 million during the six months ended June 30, 2021 and 2020, respectively.
| |
(a) | Includes the elimination of transactions between segments, which consists of intercompany royalties and marketing fees paid by NRT of $238 million and $225 million during the nine months ended September 30, 2017 and September 30, 2016, respectively. |
| |
(b) | EBITDA for the nine months ended September 30, 2017 includes an $8 million expense related to the settlement of the Strader legal matter and $5 million related to losses on the early extinguishment of debt, partially offset by a net benefit of $10 million of former parent legacy items in Corporate and Other, and $9 million of restructuring charges discussed further below. |
EBITDA(b)Restructuring charges incurred for the ninesix months ended SeptemberJune 30, 2016 includes2021 include $3 million at Realogy Franchise Group, $4 million at Realogy Brokerage Group and $3 million at Corporate and Other. Restructuring charges incurred for the six months ended June 30, 2020 include $6 million at Realogy Franchise Group, $21 million at Realogy Brokerage Group and $3 million at Realogy Title Group.
(c)Impairments for the six months ended June 30, 2021 primarily relate to lease asset and software impairments. Non-cash impairments for the six months ended June 30, 2020 include:
•a goodwill impairment charge of $413 million related to Realogy Brokerage Group;
•an impairment charge of $30 million related to Realogy Franchise Group's trademarks;
•$74 million of restructuringimpairment charges reflected above as follows: $15during the six months ended June 30, 2020 (while Cartus Relocation Services was held for sale) to reduce the net assets to the estimated proceeds; and
•other asset impairments of $23 million in NRT, $6 millionprimarily related to lease asset impairments.
(d)Former parent legacy items and Loss on the early extinguishment of debt are recorded in Corporate and Other, $4 millionOther.
(e)Gain on the sale of a business is recorded in Cartus and $4 million in RFG, and a net cost of $1 million of former parent legacy items included in Corporate and Other.Realogy Brokerage Group.
| |
(c) | Depreciation and amortization for the nine months ended September 30, 2017 includes $1 million of amortization expense related to Guaranteed Rate Affinity's purchase accounting included in the "Equity in earnings of unconsolidated entities" line on the Condensed Consolidated Statement of Operations. |
As described in the aforementioned table, Operating EBITDA margin for "Total Company" expressed as a percentage of revenues remained flat at 13%increased 3 percentage points to 12% for the ninesix months ended SeptemberJune 30, 20172021 compared to 9% for the same period in 2016. On2020. Operating EBITDA margin for "Total Company", as well as on a segment basis, RFG'swas negatively impacted by the absence in the second quarter of the benefit of the temporary cost savings measures that were taken in the second quarter of 2020 in response to COVID-19 crisis. Realogy Franchise Group's margin increased 212 percentage points to 68%61% from 66%49% primarily due to an increase in royalty revenue as a result of an increase in homesale transaction volume, and lower restructuring costs. NRT'spartially offset by a decrease in revenue related to the early termination of third party listing fee agreements. Realogy Brokerage Group's margin decreased 1increased 4 percentage pointpoints to 3%2% from 4%negative 2% primarily due to higher sales commission percentages paid to its independent sales associatestransaction volume, partially offset by lower restructuringhigher agent commission costs fordriven by a shift in mix to more productive, higher compensated agents, the nine months ended September 30, 2017 compared to the same period in 2016. Cartus'impact of recruiting and retention efforts, as well as business and geographic mix. Realogy Title Group's margin decreased 2 percentage points to 22% from 24%remained flat at 25% primarily due to lower international revenuean increase in resale, underwriter and lower foreign currency exchange rate gains, partiallyrefinance activity at Realogy Title Group, offset by lower employee related costs during nine months ended the September 30, 2017 compared to the same period in 2016 and the absence of restructuring costs incurred during the nine months ended September 30, 2016. TRG's margin decreased 1 percentage point to 11% from 12% for the nine months ended September 30, 2017 compared to the same period in 2016 due to a decrease in earnings from equity investments primarily related to costs associated with the transition and start up of operationsin earnings of Guaranteed Rate Affinity, mostly the result of the impact of mark to market adjustments on the mortgage loan pipeline as well as margin compression and lower refinancing volume, partially offset by the reversal of a legal reserve.strong purchase volume growth.
Corporate and Other Operating EBITDA for the ninesix months ended SeptemberJune 30, 20172021 declined $10$23 million to negative $70$74 million, primarily due to an $8 million expense related tolargely the settlement of the Strader legal matter, $5 million related to the losses on the early extinguishment of debt primarily as a result of the refinancing transaction duringabsence in the first2021 quarter of 2017, a $10 million increasethe benefit of the temporary cost savings measures that were taken in other costs duethe second quarter of 2020 in response to professional fees supporting strategic initiatives and occupancy costs and a $6 million increase in employee costs due tothe COVID-19 crisis as well as higher employee incentive accrualsaccruals.
Realogy Franchise and investments in technology development. These expenses were partially offset by an $11 million increase in the net benefit of former parent legacy items primarily asBrokerage Groups on a result of the settlement of a Cendant legacy tax matter and the absence of $6 million in restructuring charges incurred during the nine months ended September 30, 2016.Combined Basis
EBITDA before restructuring charges was $593 million for the nine months ended September 30, 2017 compared to $618 million for the nine months ended September 30, 2016. EBITDA before restructuring charges by reportable segment for the nine months ended September 30, 2017 was as follows:
|
| | | | | | | | | | | | | | | | | | |
| | Nine Months Ended September 30, | | |
| | 2017 | | 2016 | | |
| | EBITDA | | Restructuring Charges | | EBITDA Before Restructuring | | EBITDA Before Restructuring | | %
Change |
| RFG | $ | 427 |
| | $ | 1 |
| | $ | 428 |
| | $ | 398 |
| | 8 | % |
| NRT | 113 |
| | 8 |
| | 121 |
| | 146 |
| | (17 | ) |
| Cartus | 65 |
| | — |
| | 65 |
| | 78 |
| | (17 | ) |
| TRG | 49 |
| | — |
| | 49 |
| | 50 |
| | (2 | ) |
| Corporate and Other | (70 | ) | | — |
| | (70 | ) | | (54 | ) | | * |
|
| Total Company | $ | 584 |
| | $ | 9 |
| | $ | 593 |
| | $ | 618 |
| | (4 | %) |
_______________
The following table reflects RFGRealogy Franchise and NRTBrokerage Groups' results before the intercompany royalties and marketing fees as well as on a combined basis forto show the nine months ended September 30, 2017 and 2016.Operating EBITDA contribution of these business segments to the overall Operating EBITDA of the Company. The Operating EBITDA before restructuring margin for the combined segments decreased 1increased 4 percentage pointpoints from 9% to 14% from 15%13% primarily due primarily to higher sales commission percentageshomesale transaction volume during the first half of 2021 compared to the first half of 2020:
| | | | | | | | | | | | | | | | | | | | | | | | | | | | | | | | | | | | | | | | | | | | | | | | | | | | | | | | | | | | | | | | | |
| | Revenues | | $ Change | | %
Change | | Operating EBITDA | | $ Change | | %
Change | | Operating EBITDA Margin | | Change |
| | 2021 | | 2020 | | | | 2021 | | 2020 | | | | 2021 | | 2020 | |
| Realogy Franchise Group (a) | $ | 405 | | | $ | 324 | | | 81 | | | 25 | | $ | 169 | | | $ | 98 | | | 71 | | | 72 | | 42 | % | | 30 | % | | 12 | |
| Realogy Brokerage Group (a) | 2,962 | | | 1,802 | | | 1,160 | | | 64 | | 261 | | | 87 | | | 174 | | | 200 | | 9 | | | 5 | | | 4 | |
| Realogy Franchise and Brokerage Groups Combined | $ | 3,367 | | | $ | 2,126 | | | 1,241 | | | 58 | | $ | 430 | | | $ | 185 | | | 245 | | | 132 | | | 13 | % | | 9 | % | | 4 | |
_______________
(a)The segment numbers noted above do not reflect the impact of intercompany royalties and marketing fees paid by Realogy Brokerage Group to NRT's independent sales associates:Realogy Franchise Group of $196 million and $123 million during the six months ended June 30, 2021 and 2020, respectively.
|
| | | | | | | | | | | | | | | | | | | | | | | | | | | | | | |
| | Revenues (a) | | % Change | | EBITDA Before Restructuring (b) | | % Change | | Margin | | Change |
| | 2017 | | 2016 | | | 2017 | | 2016 | | | 2017 | | 2016 | |
| RFG and NRT Combined | $ | 3,949 |
| | $ | 3,708 |
| | 6 | % | | $ | 549 |
| | $ | 544 |
| | 1 | % | | 14 | % | | 15 | % | | (1 | ) |
_______________ | |
(a) | Excludes transactions between segments, which consists of intercompany royalties and marketing fees paid by NRT to RFG of $238 million and $225 million during the nine months ended September 30, 2017 and 2016, respectively. |
| |
(b) | EBITDA for the combined RFG and NRT segments excludes $9 million and $19 million of restructuring charges for the nine months ended September 30, 2017 and 2016, respectively.
|
Real EstateRealogy Franchise Services (RFG)Group
Revenues increased $38$154 million to $631$601 million and Operating EBITDA increased $33$144 million to $427$365 million for the ninesix months ended SeptemberJune 30, 20172021 compared with the same period in 2016.2020.
The increase in revenue was driven byRevenues increased $154 million primarily as a $12result of:
•an $88 million increase in third-party domestic franchisee royalty revenue primarily due to a 6%65% increase in thehomesale transaction volume at Realogy Franchise Group which consisted of a 29% increase in average homesale price and a 1%28% increase in the number ofexisting homesale transactions, partially offset by transactions;
•a lower net effective royalty rate. Revenue also increased due to a $12$69 million increase in intercompany royalties received from NRT as Realogy Brokerage Group; and
•a result of volume increases at NRT, a $4$15 million increase in other revenue primarily due to otherbrand marketing related activities and brand conferences and franchisee events and $3 million increase in international revenues. Brand marketingfund revenue and related expense both increasedprimarily due to higher advertising costs as compared to the second quarter of 2020, when such expenses were reduced due to the COVID-19 crisis,
partially offset by:
•a $12 million decrease in service and other revenue primarily related to an $18 million net decrease in revenue from our relocation and lead generation operations in the first quarter of 2021, driven by lower volume largely related to the impact of the COVID-19 pandemic; and
•a $6 million decrease in revenue related to the early termination of third party listing fee agreements.
Realogy Franchise Group revenue includes intercompany royalties received from Realogy Brokerage Group of $188 million and $119 million during the first half of 2021 and 2020, respectively, which are eliminated in consolidation against the expense reflected in Realogy Brokerage Group's results.
The $144 million increase in Operating EBITDA was primarily due to the level of advertising spending during the nine months ended September 30, 2017 compared to the same period in 2016.
The intercompany royalties received from NRT of $229 million and $217 million during the nine months ended September 30, 2017 and September 30, 2016, respectively, are eliminated in consolidation to avoid the revenue from being double counted in NRT and RFG. See "Company Owned Real Estate Brokerage Services" for a discussion of the drivers related to intercompany royalties paid to RFG.
The $33 million increase in EBITDA was principally due to the $38$154 million increase in revenues discussed above and a $3$15 million decrease in restructuring costs incurred in the first nine months of 2017 compared to the same period in 2016,lower expense for bad debt and notes reserves. These Operating EBITDA increases were partially offset by a $6the $15 million increase in brand marketing expense discussed above and a $1$10 million increase in expenses relatedemployee and other operating costs, largely the result of the absence of the benefit of the temporary cost savings measures that were taken in the second quarter of 2020 in response to the brand conferencesCOVID-19 crisis and franchisee events.due to higher employee incentive accruals.
Company Owned Real EstateRealogy Brokerage Services (NRT)Group
Revenues increased $216$1,160 million to $3,556$2,962 million and Operating EBITDA declined $18increased $101 million to $113$65 million for the ninesix months ended SeptemberJune 30, 20172021 compared with the same period in 2016.2020.
The revenue increase of $216$1,160 million was comprised of a $151 million increase in commission income earned on homesale transactions by our existing brokerage operations and a $65 million increase in commission income earned from acquisitions. The revenue increase wasprimarily driven by a 2%68% increase in the numberhomesale transaction volume at Realogy Brokerage Group which primarily consisted of a 34% increase in existing homesale transactions and a 6%25% increase in the average price of homes, partially offset by a 2 basis points decreasehomesale price. Realogy Brokerage Group's revenue results in the average broker commission rate as well as a negative impact on homesale transaction volume attributable to the market disruption in Texas and Florida due to hurricanes during the third quarterfirst half of 2017. We believe our positive revenue growth is attributable to the recruiting and organic growth focus by NRT management as well as a shift2021 benefited from stabilization to sustained growthcontinued strength in the high end of the housing market. The improvement in the high end of the housingresidential real estate market, had an adverse impact on thewhich we attribute to certain beneficial consumer trends supported by other factors, including a favorable mortgage rate environment and low inventory contributing to higher average homesale broker commission rate. In addition, homesale price is continuing to increase due to continued constrained inventory levels across the lower and mid price points in the markets served by NRT..
Operating EBITDA decreased $18increased $101 million primarily due to:to a $1,160 million increase in revenues discussed above, partially offset by:
•a $206$943 million increase in commission expenses paid to independent sales associatesagents from $2,256$1,315 million forin the nine months ended September 30, 2016first half of 2020 to $2,462$2,258 million forin the nine months ended September 30, 2017. The increase in commissionfirst half of 2021. Commission expense is due to an increaseincreased primarily as a result of $166 million by our existing brokerage operations due to the impact of initiatives focused on growing and retaining our productive independent sales associate base and higher homesale transaction volume as discussed above, as well as higher agent commission costs primarily driven by a $40 million increase relatedshift in mix to acquisitions. The $206 million increase in commission expense was impacted bymore productive, higher compensated agents, the miximpact of recruiting and retention efforts, as well as business as approximately 46% of the increase was due to higher homesale transaction volume in the west region where we pay and geographic mix;
•a greater proportion of commissions to independent sales associates;
a $14 million increase in other costs including occupancy costs of which $6 million related to acquisitions;
a $12$69 million increase in royalties paid to RFGRealogy Franchise Group from $217$119 million forin the nine months ended September 30, 2016first half of 2020 to $229$188 million forin the nine months ended September 30, 2017;same period of 2021 associated with the homesale transaction volume increase as described above;
•a $6$35 million increase in employee-related, occupancy and other operating costs, largely the result of the absence of the benefit of the temporary cost savings measures that were taken in the second quarter of 2020 in response to the COVID-19 crisis and due to higher employee incentive accruals; and
•a $12 million increase attributable to acquisitions offset by a $6 million decreasein marketing expense primarily due to expense reduction initiatives; and
a $6 million increase in marketing expenses of which $3 million related to acquisitions.
These EBITDA decreases were partially offset by:
a $216 million increase in revenues discussed above;
a $7 million decrease in restructuringhigher advertising costs incurred during the nine months ended September 30, 2017as compared to the same period in 2016; and
a $1 million increase in earnings for our equity method investment in PHH Home Loans for the nine months ended September 30, 2017 compared to the same period in 2016 as a result of $14 million of earnings from the first two phases of the sale of PHH Home Loans' assets to Guaranteed Rate Affinity partially offset by $5 million of exit costs. In addition, there was a $8 million decrease in earnings due to lower operating results as a result of lower origination volume, compressed industry margins and lower results2020, when such expenses were reduced due to the level of organizational change associated with the transition of the operations to Guaranteed Rate Affinity.COVID-19 crisis.
Relocation Services (Cartus)Realogy Title Group
Revenues decreased $18increased $159 million to $290$456 million and Operating EBITDA decreased $9increased $43 million to $65$116 million for the ninesix months ended SeptemberJune 30, 20172021 compared with the same period in 2016.2020.
Revenues decreased $18increased $159 million primarily as a result of an $10a $70 million decreaseincrease in international revenue as a result of an increasingly higher percentage of clients reducing their global relocation activity, as well as an $8 million decrease in otherresale revenue due to lower volume.increased purchase unit activity that benefited from continued strength in the residential real estate market, which we attribute to certain beneficial consumer trends supported by other factors, including a favorable mortgage rate environment and low inventory contributing to higher average homesale price. In addition, there was a $68 million increase in underwriter revenue (including a $60 million increase in underwriter revenue with unaffiliated agents, which had a $7 million net positive impact on Operating EBITDA due to the related expense increase of $53 million), a $17 million increase in refinance revenue due to an increase in activity in the refinance market driven by the favorable interest rate environment and
$4 million in other revenue. Equity earnings or losses related to our minority interest in Guaranteed Rate Affinity are included in the financial results of Realogy Title Group, but are not reported as revenue to Realogy Title Group.
Operating EBITDA decreased $9increased $43 million primarily as a result of the $18 million decrease in revenues discussed above and a $3 million net negative impact from foreign currency exchange rates, partially offset by a $5 million decrease in employee related costs, the absence of $4 million of restructuring costs incurred during the nine months ended September 30, 2016 and a $2 million decrease in other operating expenses as a result of lower volume.
Title and Settlement Services (TRG)
Revenues increased $7 million to $431 million and EBITDA remained flat at $49 million for the nine months ended September 30, 2017 compared with the same period in 2016.
The increase in revenues was driven by a $24 million increase in resale revenue of which $16 million was related to acquisitions, partially offset by a $9 million decrease in refinancing revenue and a $5 million decrease of underwriter revenue due to an overall decrease in activity in the refinance market in the third quarter of 2017.
EBITDA remained flat as a result of an increase of $11 million in employee-related costs primarily related to acquisitions, a $3 million decrease earnings from equity investments primarily related to costs associated with the start up of operations of Guaranteed Rate Affinity and a $2 million increase in other costs during the nine months ended September 30, 2017 compared with the same period in 2016. The decreases were offset by the $7$159 million increase in revenues discussed above and $6 million unrealized gain on an investment. These increases were partially offset by a $7$65 million decreaseincrease in employee and other operating costs largely the result of the absence in the 2021 quarter of the benefit of the temporary cost savings measures that were taken in the second quarter of 2020 in response to the COVID-19 crisis and due to higher variable costs as a result of higher volume and higher employee incentive accruals, and a $53 million increase in variable operating costs primarily due to lower refinancing and underwriter volume and $2 million related to the reversalincrease in underwriter revenue with unaffiliated agents discussed above where the revenue and expense are recorded on a gross basis. In addition, equity in earnings decreased $4 million from $45 million for the six months ended June 30, 2020 to $41 million for the six months ended June 30, 2021 primarily related to Guaranteed Rate Affinity, mostly the result of the impact of mark-to-market adjustments on the mortgage loan pipeline as well as margin compression and a legal reserve.decline in refinance volumes, partially offset by strong purchase volume growth.
FINANCIAL CONDITION, LIQUIDITY AND CAPITAL RESOURCES
Financial Condition
| | | | September 30, 2017 | | December 31, 2016 | | Change | | June 30, 2021 | | December 31, 2020 | | Change |
| Total assets | $ | 7,521 |
| | $ | 7,421 |
| | $ | 100 |
| Total assets | $ | 7,407 | | | $ | 6,934 | | | $ | 473 | |
| Total liabilities | 5,056 |
| | 4,952 |
| | 104 |
| Total liabilities | 5,401 | | | 5,167 | | | 234 | |
| Total equity | 2,465 |
| | 2,469 |
| | (4 | ) | Total equity | 2,006 | | | 1,767 | | | 239 | |
For the ninesix months ended SeptemberJune 30, 2017,2021, total assets increased $100$473 million primarily due to to:
•a $74$339 million increase in cash and cash equivalents due to cash flows from operations and an increase in corporate debt;
•a $45$108 million increase in other current and non-current assets; and
•an $84 million increase in trade and relocation receivables primarily due to seasonal increases in volume, a $29 million increase in other non-current assets primarily due to higher prepaid expenses and investments and a $14 million increase in goodwill from acquisitions. These increases were
partially offset by by:
•a $72$46 million net decrease in franchise agreements and other amortizable intangible assets primarily due to amortization.amortization;
•a $13 million decrease in property and equipment; and
•an $11 million decrease in goodwill primarily due to the sale of a business at Realogy Brokerage Group.
Total liabilities increased $104$234 million primarily due to to:
•a $129$168 million increase in corporate debt;
•a $67 million increase in deferred tax liabilities, liabilities; and
•a $29$41 million increase in securitization obligations,
partially offset by:
•a $12$35 million increase in accounts payable and a $7 million increasedecrease in accrued expenses and other current liabilities primarily due to the payment of employee-related liabilities in the first quarter of 2021 which were fully accrued as of December 31, 2020, partially offset by accrued interest; and
•a $32$6 million decrease in other non-current liabilities due to interest rate swaps and liabilities related to contingent consideration from acquisitions, a $31 million decrease in corporate debt primarily due to amortization payments on the term loan facilities and a $10 million decrease in the due to former parent liability primarily as a result of the resolution of a Cendant legacy tax matter.
operating lease liabilities.
Total equity decreased $4increased $239 million primarily due to anet income of $182 million decreasefor the six months ended June 30, 2021 and a $56 million increase in additional paid in capital primarily related to the Company's repurchaseissuance of $180 million of common stock and $37 million of dividend payments partially offset by stock-based compensation activity of $34 million. The decrease in additional paid in capital was mostly offset by net income of $176 millionthe Exchangeable Senior Notes for the ninesix months ended SeptemberJune 30, 2017.2021.
Liquidity and Capital Resources
Cash flows from operations, supplemented by funds available under our Revolving Credit Facility and securitization facilities are our primary sources of liquidity. We did not borrow from our Revolving Credit Facility in the first half of 2021. Our primary uses of liquidity needs have been toare debt service our debt and finance ourcombined with working capital and business investment via capital expenditures, which we have historically satisfied withexpenditures. We currently expect to prioritize using our cash flows from operations in 2021 for business investment and funds available underdebt reduction.
While we are focused on reducing our revolving credit facilities and securitization facilities. In January 2017, the Company increased the borrowing capacity under its Revolving Credit Facility from $815 millionindebtedness, we continue to $1,050 million.
We intend to use future cash flow primarily to acquire stock underbe significantly encumbered by our share repurchase program, pay dividends, fund acquisitions, enter into strategic relationships and reduce indebtedness. In February 2016, the Company's Board of Directors authorized a share repurchase program of up to $275 million of the Company’s common stock. In February 2017, our Board authorized a new share repurchase program of up to an additional $300 million of the Company's common stock. Repurchases under these programs may be made at management's discretion from time to time on the open market, pursuant to Rule 10b5-1 trading plans or privately negotiated transactions. The size and timing of these repurchases will depend on price, market and economic conditions, legal and contractual requirements and other factors. The repurchase programs have no time limit and may be suspended or discontinued at any time.debt obligations. As of SeptemberJune 30, 2017, the Company had repurchased and retired 132021, our total debt, excluding our securitization obligations, was $3,480 million shares of common stock for an aggregate of $275compared to $3,239 million under the February 2016 share repurchase program and $102 million under the February 2017 share repurchase program at a total weighted average market price of $29.07 per share.
Included in the 13 million shares of common stock repurchased to date, the Company repurchased 5.9 million shares of common stock for $178 million at a weighted average market price of $30.40 per share during the first nine months of 2017. As of September 30, 2017, approximately $198 million of authorization remains available for the repurchase of shares under the February 2017 share repurchase program.
During the period October 1, 2017 through November 1, 2017, we repurchased an additional 0.5 million shares at a weighted average market price of $33.11. Giving effect to these repurchases, we had approximately $181 million of remaining capacity authorized under the February 2017 share repurchase program as of November 1, 2017.
In April 2007, the Company established a standby irrevocable letter of credit for the benefit of Avis Budget Group in accordance with the Separation and Distribution Agreement. The letter of credit was utilized to support the Company’s payment obligations with respect to its share of Cendant contingent and other corporate liabilities. In September 2017, the standby irrevocable letter of credit was terminated pursuant to the governing agreement as the aggregate value of the Cendant contingent and other liabilities fell below $30 million with the resolution of a Cendant legacy tax matter in the third quarter of 2017, reducing the capacity and outstanding letters of credit under the Unsecured Letter of Credit Facility. At September 30, 2017, the aggregate value of the former parent contingent liabilities was $18 million.
We also initiated and paid a quarterly cash dividend of $0.09 per share in August 2016 and paid $0.09 per share cash dividends in every subsequent quarter. During the first nine months of 2017, we returned $37 million to stockholders through the payment of cash dividends. The declaration and payment of any future dividend will be subject to the discretion of the Board of Directors and will depend on a variety of factors, including the Company’s financial condition and results of operations, contractual restrictions, including restrictive covenants contained in the Company’s credit agreement, and the indenture governing the Company’s outstanding debt securities, capital requirements and other factors that the Board of Directors deems relevant.
We may also from time to time seek to repurchase our outstanding notes through tender offers, open market purchases, privately negotiated transactions or otherwise. Such repurchases, if any, will depend on prevailing market conditions, our liquidity requirements, contractual restrictions and other factors.
We are currently experiencing growth in the residential real estate market; however, if the residential real estate market or the economy as a whole does not continue to improve or weakens, our business, financial condition and liquidity may be materially adversely affected, including our ability to access capital and grow our business.
Historically, operating results and revenues for all of our businesses have been strongest in the second and third quarters of the calendar year. A significant portion of the expenses we incur in our real estate brokerage operations are related to
marketing activities and commissions and therefore, are variable. However, many of our other expenses, such as interest payments, facilities costs and certain personnel-related costs, are fixed and cannot be reduced during a seasonal slowdown. Consequently, our debt balances are generally at their highest levels at or around the end of the first quarter of every year.
December 31, 2020. Our liquidity position has significantly improved but continuesbeen and is expected to continue to be negatively impacted by our remainingthe interest expense and wouldon our debt obligations, which could be adversely impacted by: (i) stagnation or a downturn of the residential real estate market, (ii)intensified by a significant increase in LIBOR (or any replacement rate) or ABR, or (iii)ABR.
In June 2021, the Company issued $403 million principal amount of 0.25% Exchangeable Senior Notes due 2026. In April 2021, the Company used cash on hand to pay down $150 million of outstanding borrowings under the Term Loan B Facility. In January and February 2021, Realogy Group entered into refinancing transactions, including the issuance in the aggregate of $900 million of 5.75% Senior Notes due 2029 (the proceeds of which were used to pay down $250 million of the Term Loan A Facility and $655 million of the Term Loan B Facility) and the amendment of the Senior Secured Credit Agreement and Term Loan A Agreement (the "2021 Amendments"). The 2021 Amendments provide for the extension of the maturity of a portion of the remaining balance of the Term Loan A facility from 2023 to 2025 and the extension of the maturity of a portion of the Revolving Credit Facility from 2023 to 2025, in each case subject to certain earlier springing maturity dates. See Note 4, "Short and Long-Term Debt", to the Condensed Consolidated Financial Statements for additional information.
At June 30, 2021, we were in compliance with the financial covenant in each of the Senior Secured Credit Agreement and the Term Loan A Agreement. We believe that we will continue to be in compliance with the senior secured leverage ratio and meet our inability to access our relocation securitization programs.cash flow needs during the next twelve months. For additional information, see below under the header "Financial Obligations—Covenants under the Senior Secured Credit Facility, Term Loan A Facility and Indentures".
We will continue to evaluate potential refinancing and financing transactions.transactions, including refinancing certain tranches of our indebtedness and extending maturities, among other potential alternatives. There can be no assurance as to which, if any, of these alternatives we may pursue as the choice of any alternative will depend upon numerous factors such as market conditions, our financial performance and the limitations applicable to such transactions under our existing financing agreements and the consents we may need to obtain under the relevant documents. There can be no assurance that financing willFinancing may not be available to us on commercially reasonable terms, on terms that are acceptable termsto us, or at all. Any future indebtedness may impose various additional restrictions and covenants on us which could limit our ability to respond to market conditions, to make capital investments or to take advantage of business opportunities.
Historically, operating results and revenues for all of our businesses have been strongest in the second and third quarters of the calendar year, although the strong recovery in the second half of 2020 resulted in higher than historic operating results and revenues in the fourth quarter of 2020 and first quarter of 2021. A significant portion of the expenses we incur in our real estate brokerage operations are related to marketing activities and commissions and therefore, are variable. However, many of our other expenses, such as interest payments, facilities costs and certain personnel-related costs, are fixed and cannot be reduced during the seasonal fluctuations in the business. Consequently, our need to borrow under the Revolving Credit Facility and corresponding debt balances are generally at their highest levels at or around the end of the first quarter of every year.
We may from time to time seek to repurchase our outstanding Unsecured Notes, 7.625% Senior Secured Second Lien Notes, Exchangeable Senior Notes or term loans through, as applicable, tender offers, open market purchases, privately negotiated transactions or otherwise. Such repurchases, if any, will depend on prevailing market conditions, our liquidity requirements, contractual restrictions and other factors.
In addition, we are required to pay quarterly amortization payments for the Extended Term Loan A and Term Loan B Facility. Remaining payments for 2021 total $3 million and $5 million for the Extended Term Loan A and Term Loan B Facility, respectively, and we expect payments for 2022 to total $10 million and $11 million for the Extended Term Loan A and Term Loan B Facility, respectively.
We have historically utilized net operating losses to offset the majority of our federal and state income tax payments. Based upon current financial projections, we expect that we will utilize the majority of our remaining net operating losses during 2021.
If the recovery of the residential real estate market were to materially slow or reverse itself, if the economy as a whole does not improve or if the broader real estate industry (including REITs, commercial and rental markets) were to experience a significant downturn, our business, financial condition and liquidity may be materially adversely affected, including our ability to access capital, grow our business and return capital to stockholders.
Cash Flows
At SeptemberJune 30, 2017,2021, we had $348$866 million of cash, and cash equivalents and restricted cash, an increase of $74$343 million compared to the balance of $274$523 million at December 31, 2016.2020. The following table summarizes our cash flows for the ninesix months ended SeptemberJune 30, 20172021 and 2016:2020:
| | | | Nine Months Ended September 30, | | Six Months Ended June 30, |
| | 2017 | | 2016 | | Change | | 2021 | | 2020 | | Change |
| Cash provided by (used in): | | | | | | Cash provided by (used in): | | | | | |
| Operating activities | $ | 444 |
| | $ | 411 |
| | $ | 33 |
| Operating activities | $ | 186 | | | $ | 33 | | | $ | 153 | |
| Investing activities | (96 | ) | | (163 | ) | | 67 |
| Investing activities | (51) | | | (63) | | | 12 | |
| Financing activities | (276 | ) | | (438 | ) | | 162 |
| Financing activities | 208 | | | 468 | | | (260) | |
| Effects of change in exchange rates on cash and cash equivalents | 2 |
| | (1 | ) | | 3 |
| |
| Net change in cash and cash equivalents | $ | 74 |
| | $ | (191 | ) | | $ | 265 |
| |
| Effects of change in exchange rates on cash, cash equivalents and restricted cash | | Effects of change in exchange rates on cash, cash equivalents and restricted cash | — | | | — | | | — | |
| Net change in cash, cash equivalents and restricted cash | | Net change in cash, cash equivalents and restricted cash | $ | 343 | | | $ | 438 | | | $ | (95) | |
For the ninesix months ended SeptemberJune 30, 2017, $332021, $153 million more cash was provided by operating activities compared to the same period in 2016. The change was2020 principally due to $14to:
•$275 million of additionalmore cash provided by operating results, $15results; and
•$16 million more cash from dividends received primarily from Guaranteed Rate Affinity,
partially offset by:
•$89 million less cash provided by the net change in relocation and trade receivables;
•$34 million more cash used for accounts payable, accrued expenses and other liabilities and $19 million more cash received as dividends from unconsolidated entities primarily from PHH Home Loans, partially offset by $13liabilities;
•$9 million more cash used due to an increase infor other operating activities; and
•$6 million more cash used for other assets.
For the ninesix months ended SeptemberJune 30, 2017,2021, we used $67$12 million less cash for investing activities compared to the same period in 20162020 primarily due to $82to:
•$15 million of cash proceeds from the sale of business; and
•$3 million less cash used for acquisition related payments and $22 million more cash provided by other investing activities,
partially offset by $34 million of cash used for our investment in Guaranteed Rate Affinity and $8$5 million more cash used for property and equipment additions.investments in unconsolidated entities.
For the ninesix months ended SeptemberJune 30, 2017, $2762021, $208 million of cash was used forprovided by financing activities compared to $438$468 million of cash usedprovided during the same period in 2016.2020. For the ninesix months ended SeptemberJune 30, 2017, $2762021, $208 million of cash was used for:provided by financing activities as follows:
•$180 million for the repurchase of our common stock;
$37201 million of dividend payments;cash provided as a result of finance transactions primarily from the issuance of the Exchangeable Senior Notes, which included payments for purchase of exchangeable note hedge and proceeds from issuance of warrants, partially offset by a partial pay down of outstanding borrowings under the Term Loan B Facility, in the second quarter of 2021; and
•$3140 million of quarterly amortization payments on the term loan facilities;net increase in securitization borrowings,
partially offset by :
•$1918 million of other financing payments primarily related to capitalfinance leases and interest rate swaps;contracts;
•$18 million for payments of contingent consideration;
$119 million of tax payments related to net share settlement for stock-based compensation; and
$10 million repayment of borrowings under the Revolving Credit Facility; and
•$6 million of debt issuance costs;
partially offset by,
a $29 million net decrease in securitization borrowings; and
•$7 million proceeds from exercise of stock options.
For the nine months ended September 30, 2016, $438 million of cash was used for financing activities as a result of:
the repayment of $758 million to reduce the Term Loan B facility;
the repayment of $500 million to retire the 3.375% Senior Notes at maturity;
the net repayment of $45 million of borrowings under the Revolving Credit Facility;
$134 million for the purchase of our common stock;
$31 million ofquarterly amortization payments on the term loan facilities;facilities.
$23For the six months ended June 30, 2020, $468 million for payments of contingent consideration; andcash was provided by financing activities related to $625 million of additional borrowings under the Revolving Credit Facility, partially offset by:
•$2892 million net decrease in securitization borrowings;
•$26 million of other financing payments partiallyprimarily related to capital leases and interest rate swaps;finance leases;
•$19 million of quarterly amortization payments on the term loan facilities;
•$15 million of debt issuance costs;cash paid as a result of the refinancing transactions in the second quarter of 2020; and
•$13 million of dividend payments; and
$65 million of tax payments related to net share settlement for stock-based compensation;compensation.
$355 million of proceeds from issuance of the Term Loan A-1 facility; and
a $9 million net increase in securitization borrowings.
Financial Obligations
Indebtedness Table
As of September 30, 2017, the Company’s borrowing arrangements were as follows:
|
| | | | | | | | | | | | | | | |
| | Interest
Rate | | Expiration
Date | | Principal Amount | | Unamortized Discount and Debt Issuance Costs | | Net Amount |
| Senior Secured Credit Facility: | | | | | | | | | |
| Revolving Credit Facility (1) | (2) | | October 2020 | | $ | 190 |
| | $ * |
| | $ | 190 |
|
| Term Loan B | (3) | | July 2022 | | 1,086 |
| | 21 |
| | 1,065 |
|
| Term Loan A Facility: | | | | | | | | | |
| Term Loan A | (4) | | October 2020 | | 397 |
| | 2 |
| | 395 |
|
| Term Loan A-1 | (5) | | July 2021 | | 344 |
| | 3 |
| | 341 |
|
| Senior Notes | 4.50% | | April 2019 | | 450 |
| | 7 |
| | 443 |
|
| Senior Notes | 5.25% | | December 2021 | | 550 |
| | 4 |
| | 546 |
|
| Senior Notes | 4.875% | | June 2023 | | 500 |
| | 4 |
| | 496 |
|
| Securitization obligations: (6) | | | | | | | | | |
| Apple Ridge Funding LLC (7) | | | June 2018 | | 223 |
| | * |
| | 223 |
|
| Cartus Financing Limited (8) | | | August 2018 | | 11 |
| | * |
| | 11 |
|
| Total (9) | $ | 3,751 |
| | $ | 41 |
| | $ | 3,710 |
|
_______________
| |
* | The debt issuance costs related to our Revolving Credit Facility and securitization obligations are classified as a deferred financing asset within other assets. |
| |
(1) | As of September 30, 2017, the Company had $1,050 million of borrowing capacity under its Revolving Credit Facility leaving $860 million of available capacity. The revolving credit facility expires in October 2020, but is classified on the balance sheet as current due to the revolving nature of the facility. On November 1, 2017, the Company had $70 million in outstanding borrowings under the Revolving Credit Facility, leaving $980 million of available capacity. |
| |
(2) | Interest rates with respect to revolving loans under the Senior Secured Credit Facility at September 30, 2017 are based on, at the Company's option, (a) adjusted LIBOR plus an additional margin or (b) ABR plus an additional margin, in each case subject to adjustment based on the then current senior secured leverage ratio. Based on the previous quarter senior secured leverage ratio, the LIBOR margin was 2.00% and the ABR margin was 1.00% for the three months ended September 30, 2017. |
| |
(3) | The Term Loan B provides for quarterly amortization payments totaling 1% per annum of the original principal amount. The interest rate with respect to term loans under the Term Loan B is based on, at the Company’s option, (a) adjusted LIBOR plus 2.25% (with a LIBOR floor of 0.75%) or (b) JPMorgan Chase Bank, N.A.’s prime rate ("ABR") plus 1.25% (with an ABR floor of 1.75%).
|
| |
(4) | The Term Loan A provides for quarterly amortization payments, which commenced March 31, 2016, totaling per annum 5%, 5%, 7.5%, 10.0% and 12.5% of the original principal amount of the Term Loan A in 2016, 2017, 2018, 2019 and 2020, respectively. The |
interest rates with respect to term loans under the Term Loan A are based on, at the Company's option, (a) adjusted LIBOR plus an additional margin or (b) ABR plus an additional margin, in each case subject to adjustment based on the then current senior secured leverage ratio. Based on the previous quarter senior secured leverage ratio, the LIBOR margin was 2.00% and the ABR margin was 1.00% for the three months ended September 30, 2017.
| |
(5) | The Term Loan A-1 provides for quarterly amortization payments, which commenced on September 30, 2016, totaling per annum 2.5%, 2.5%, 5%, 7.5% and 10.0% of the original principal amount of the Term Loan A-1, with the last amortization payment made on June 30, 2021. The interest rates with respect to term loans under the Term Loan A-1 are based on, at the Company's option, (a) adjusted LIBOR plus an additional margin or (b) ABR plus an additional margin, in each case subject to adjustment based on the then current senior secured leverage ratio. Based on the previous quarter senior secured leverage ratio, the LIBOR margin was 2.00% and the ABR margin was 1.00% for the three months ended September 30, 2017. |
| |
(6) | Available capacity is subject to maintaining sufficient relocation related assets to collateralize these securitization obligations. |
| |
(7) | In June 2017, Realogy Group extended the existing Apple Ridge Funding LLC securitization program utilized by Cartus until June 2018. As of September 30, 2017, the Company had $325 million of borrowing capacity under the Apple Ridge Funding LLC securitization program leaving $102 million of available capacity. |
| |
(8) | Consists of a £10 million revolving loan facility and a £5 million working capital facility. As of September 30, 2017, the Company had $20 million of borrowing capacity under the Cartus Financing Limited securitization program leaving $9 million of available capacity. In September 2017, Realogy Group extended the existing Cartus Financing Limited securitization program to August 2018. |
| |
(9) | Not included in this table, is the Company's Unsecured Letter of Credit Facility which had a capacity of $74 million with $71 million utilized at a weighted average rate of 3.24% at September 30, 2017. |
See Note 5,4, "Short and Long-Term Debt", to the Condensed Consolidated Financial Statements, for additional information on the Company's indebtedness.indebtedness as of June 30, 2021.
LIBOR is the subject of recent national, international and other regulatory guidance and proposals for reform. As a result of concerns about the accuracy of the calculation of LIBOR, a number of British Bankers’ Association member banks entered into settlements with certain regulators and law enforcement agencies with respect to the alleged manipulation of LIBOR, and LIBOR and other "benchmark" rates are subject to ongoing national and international regulatory scrutiny and reform. The cessation date for submission and publication of rates for certain tenors of LIBOR has since been extended by the ICE Benchmark Administration until mid-2023. In response to concerns regarding the future of LIBOR, the United States Federal Reserve, in conjunction with the Alternative Reference Rates Committee, a steering committee comprised of large U.S. financial institutions, is considering replacing LIBOR with a new index calculated by short-term repurchase agreements, backed by U.S. Treasury securities: the Secured Overnight Financing Rate, or "SOFR." We are unable to predict whether SOFR will attain market traction as a LIBOR replacement or the impact of other reforms, whether currently enacted or enacted in the future. Any new benchmark rate, including SOFR, will likely not replicate LIBOR exactly and if future rates based upon a successor rate are higher than LIBOR rates as currently determined, it could result in an increase in the cost of our variable rate indebtedness and may have a material adverse effect on our financial condition and results of operations.
Our primary interest rate exposure is interest rate fluctuations, specifically with respect to LIBOR, due to its impact on our variable rate borrowings under the Senior Secured Credit Facility (for our Revolving Credit Facility and Term Loan B Facility) and the Term Loan A Facility. As of June 30, 2021, we had interest rate swaps based on LIBOR with a notional value of $1,000 million to manage a portion of our exposure to changes in interest rates associated with our variable rate borrowings.
Covenants under the Senior Secured Credit Facility, Term Loan A Facility and Indentures
The Senior Secured Credit Facility,Agreement, Term Loan A Facility, the Unsecured Letter of Credit FacilityAgreement, and the indentures governing the Unsecured Notes and 7.625% Senior Secured Second Lien Notes contain various covenants that limit (subject to certain exceptions) Realogy Group’s ability to, among other things:
•incur or guarantee additional debt or issue disqualified stock or preferred stock;
•pay dividends or make distributions to Realogy Group’s stockholders, including Realogy Holdings;
•repurchase or redeem capital stock;
•make loans, investments or acquisitions;
•incur restrictions on the ability of certain of Realogy Group's subsidiaries to pay dividends or to make other payments to Realogy Group;
•enter into transactions with affiliates;
•create liens;
•merge or consolidate with other companies or transfer all or substantially all of Realogy Group's and its material subsidiaries' assets;
•transfer or sell assets, including capital stock of subsidiaries; and
•prepay, redeem or repurchase subordinated indebtedness.
As a result of the covenants to which we remain subject, we are limited in the manner in which we conduct our business and we may be unable to engage in favorable business activities or finance future operations or capital needs. In addition, the Senior Secured Credit FacilityAgreement and Term Loan A FacilityAgreement require us to maintain a senior secured leverage ratio.
Senior Secured Leverage Ratio applicable to our Senior Secured Credit Facility and Term Loan A Facility
The senior secured leverage ratio is tested quarterly and may not exceed 4.75 to 1.00. The senior secured leverage ratio is measured by dividing Realogy's GroupRealogy Group's total senior secured net debt by the trailing twelve monthfour quarters EBITDA calculated on a Pro Forma Basis, as those terms are defined in the senior secured credit facilities.Senior Secured Credit Agreement. Total senior secured net debt does not include the 7.625% Senior Secured Second Lien Notes, our unsecured indebtedness, including the Unsecured Notes and
Exchangeable Senior Notes, or the securitization obligations. EBITDA calculated on a Pro Forma Basis, as defined in the senior secured credit facilities,Senior Secured Credit Agreement, includes adjustments to EBITDA for restructuring, retention and disposition costs, former parent legacy cost (benefit) items, net, loss (gain) on the early extinguishment of debt, non-cash charges and incremental securitization interest costs, as well as pro forma cost savings for restructuring initiatives, the pro forma effect of business optimization initiatives and the pro forma effect of acquisitions and new franchisees, in each case calculated as of the beginning of the twelve-monthtrailing four-quarter period. The Company was in compliance with the senior secured leverage ratio covenant at SeptemberJune 30, 2017.2021.
A reconciliation of net (loss) income attributable to Realogy Group to Operating EBITDA and EBITDA calculated on a Pro Forma Basis, as those terms are defined in the Senior Secured Credit Agreement, for the four-quarter period ended June 30, 2021 is set forth in the following table: | | | | | | | | | | | | | | | | | | | | | | | | | | | | | |
| | | Less | | Equals | | Plus | | Equals |
| Year Ended | | Six Months Ended | | Six Months Ended | | Six Months Ended | | Twelve Months
Ended |
| December 31,
2020 | | June 30,
2020 | | December 31,
2020 | | June 30,
2021 | | June 30,
2021 |
| Net (loss) income attributable to Realogy Group (a) | $ | (360) | | | $ | (476) | | | $ | 116 | | | $ | 182 | | | $ | 298 | |
| Income tax (benefit) expense | (104) | | | (146) | | | 42 | | | 77 | | | 119 | |
| (Loss) income before income taxes | (464) | | | (622) | | | 158 | | | 259 | | | 417 | |
| Depreciation and amortization | 186 | | | 91 | | | 95 | | | 102 | | | 197 | |
| Interest expense, net | 246 | | | 160 | | | 86 | | | 95 | | | 181 | |
| Restructuring costs, net | 67 | | | 30 | | | 37 | | | 10 | | | 47 | |
| Impairments | 682 | | | 540 | | | 142 | | | 2 | | | 144 | |
| Former parent legacy cost, net | 1 | | | — | | | 1 | | | 1 | | | 2 | |
| Loss on the early extinguishment of debt | 8 | | | 8 | | | — | | | 18 | | | 18 | |
| Gain on the sale of a business | — | | | — | | | — | | | (15) | | | (15) | |
| Operating EBITDA (b) | 726 | | | 207 | | | 519 | | | 472 | | | 991 | |
| Bank covenant adjustments: | | |
| Pro forma effect of business optimization initiatives (c) | | 45 | |
| Non-cash charges (d) | | 26 | |
| Pro forma effect of acquisitions and new franchisees (e) | | 5 | |
| Incremental securitization interest costs (f) | | 3 | |
| Costs expensed related to the disposition | | (3) | |
| EBITDA as defined by the Senior Secured Credit Agreement | | $ | 1,067 | |
| Total senior secured net debt (g) | | $ | (4) | |
| Senior secured leverage ratio | | 0.00 | x |
_______________
(a)Net (loss) income attributable to Realogy consists of: (i) income of $98 million for the third quarter of 2020, (ii) income of $18 million for the fourth quarter of 2020, (iii) income of $33 million for the first quarter of 2021 and (iv) income of $149 million for the second quarter of 2021.
(b)Operating EBITDA consists of: (i) $313 million for the third quarter of 2020, (ii) $206 million for the fourth quarter of 2020, (iii) $162 million for the first quarter of 2021 and (iv) $310 million for the second quarter of 2021.
(c)Represents the four-quarter pro forma effect of business optimization initiatives.
(d)Represents the elimination of non-cash expenses including $43 million of stock-based compensation expense less $9 million of other items, $5 million of foreign exchange benefits and $3 million for the change in the allowance for doubtful accounts and notes reserves for the four-quarter period ended June 30, 2021.
(e)Represents the estimated impact of acquisitions and franchise sales activity, net of brokerages that exited our franchise system as if these changes had occurred on July 1, 2020. Franchisee sales activity is comprised of new franchise agreements as well as growth through acquisitions and independent sales agent recruitment by existing franchisees with our assistance. We have made a number of assumptions in calculating such estimates and there can be no assurance that we would have generated the projected levels of Operating EBITDA had we owned the acquired entities or entered into the franchise contracts as of July 1, 2020.
(f)Incremental borrowing costs incurred as a result of the securitization facilities refinancing for the twelve months ended June 30, 2021.
(g)Represents total borrowings under the Senior Secured Credit Facility (including the Revolving Credit Facility and Term Loan B Facility) and Term Loan A Facility and borrowings secured by a first priority lien on our assets of $670 million plus $27 million of finance lease obligations less $701 million of readily available cash as of June 30, 2021. Pursuant to the terms of our senior secured credit facilities, total senior secured net debt does not include our securitization obligations, 7.625% Senior Secured Second Lien Notes or unsecured indebtedness, including the Unsecured Notes and Exchangeable Senior Notes.
Consolidated Leverage Ratio applicable to our 9.375% Senior Notes and 7.625% Senior Secured Second Lien Notes
The consolidated leverage ratio is measured by dividing Realogy Group's total net debt by the trailing four quarter EBITDA. EBITDA, as defined in the indentures governing the 9.375% Senior Notes and 7.625% Senior Secured Second Lien Notes, is substantially similar to EBITDA calculated on a Pro Forma Basis for the period presented, as those terms are defined in the Senior Secured Credit Agreement. Net debt under the indentures is Realogy Group's total indebtedness (excluding securitizations) less (i) its cash and cash equivalents in excess of restricted cash and (ii) a $200 million seasonality adjustment permitted when measuring the ratio on a date during the period of March 1 to May 31.
The consolidated leverage ratio under the indentures governing the 9.375% Senior Notes and 7.625% Senior Secured Second Lien Notes for the four-quarter period ended June 30, 2021 is set forth in the following table: | | | | | | | | |
| | As of June 30, 2021 |
| Non-extended Revolving Credit Commitment | | $ | — | |
| Extended Revolving Credit Commitment | | — | |
| Non-extended Term Loan A | | 197 | |
| Extended Term Loan A | | 236 | |
| Term Loan B | | 237 | |
| 7.625% Senior Secured Second Lien Notes | | 550 | |
| 4.875% Senior Notes | | 407 | |
| 9.375% Senior Notes | | 550 | |
| 5.75% Senior Notes | | 900 | |
| 0.25% Exchangeable Senior Notes | | 403 | |
| Finance lease obligations | | 27 | |
| Corporate Debt (excluding securitizations) | | 3,507 | |
| Less: Cash and cash equivalents | | 859 | |
| Net debt under the indentures governing the 9.375% Senior Notes and 7.625% Senior Secured Second Lien Notes | | $ | 2,648 | |
| | |
| EBITDA as defined under the indentures governing the 9.375% Senior Notes and 7.625% Senior Secured Second Lien Notes (a) | | $ | 1,067 | |
| | |
| Consolidated leverage ratio under the indentures governing the 9.375% Senior Notes and 7.625% Senior Secured Second Lien Notes | | 2.5 | x |
_______________
(a)As set forth in the immediately preceding table, for the four-quarter period ended June 30, 2021, EBITDA, as defined under the indentures governing the 9.375% Senior Notes and 7.625% Senior Secured Second Lien Notes, was the same as EBITDA calculated on a Pro Forma Basis, as those terms are defined in the Senior Secured Credit Agreement.
At June 30, 2021 the amount of the Company's cumulative credit under the 9.375% Senior Notes and 7.625% Senior Secured Second Lien Notes was approximately $588 million. At June 30, 2021, the cumulative credit basket available for restricted payments was approximately $547 million under the indenture governing the 9.375% Senior Notes and approximately $567 million under the indenture governing 7.625% Senior Secured Second Lien Notes.
See Note 5,4, "Short and Long-Term Debt—Senior Secured Credit Facility"Facility and "Short and Long-Term Debt—Term Loan A Facility" and "—Unsecured Notes" and "—Senior Secured Second Lien Notes", to the Condensed Consolidated Financial Statements for additional information.
Non-GAAP Financial Measures
The SEC has adopted rules to regulate the use in filings with the SEC and in public disclosures of "non-GAAP financial measures," such as EBITDA and Operating EBITDA. These measures are derived on the basis of methodologies other than in accordance with GAAP.
Operating EBITDA is defined by us as net income (loss) before depreciation and amortization, interest expense, net (other than relocation services interest for securitization assets and securitization obligations) and, income taxes, and is our primary non-GAAP measure. Operating EBITDA is defined by usother items that are not core to the operating activities of the Company such as EBITDA before restructuring losscharges, former parent legacy items, gains or losses on the early extinguishment of debt, impairments, gains or losses on discontinued operations and former parent legacy items andgains or losses on the sale of investments or other assets. Operating EBITDA is used as a supplementary financialour primary non-GAAP measure.
We present EBITDA and Operating EBITDA because we believe they areit is useful as a supplemental measuresmeasure in evaluating the performance of our operating businesses and provideprovides greater transparency into our results of operations. Our management, including our chief operating decision maker, uses Operating EBITDA as a factor in evaluating the performance of our business. EBITDA and Operating EBITDA should not be considered in isolation or as a substitute for net income or other statement of operations data prepared in accordance with GAAP.
We believe Operating EBITDA facilitates company-to-company operating performance comparisons by backing out potential differences caused by variations in capital structures (affecting net interest expense), taxation, the age and book depreciation of facilities (affecting relative depreciation expense) and the amortization of intangibles, as well as other items that are not core to the operating activities of the Company such as restructuring charges, gains or losses on the early extinguishment of debt, former parent legacy items, impairments, gains or losses on discontinued operations and gains or losses on the sale of investments or other assets, which may vary for different companies for reasons unrelated to operating performance. We further believe that Operating EBITDA is frequently used by securities analysts, investors and other interested parties in their evaluation of companies, many of which present an Operating EBITDA measure when reporting their results.
EBITDA and Operating EBITDA havehas limitations as an analytical tools,tool, and you should not consider EBITDA and Operating EBITDA either in isolation or as substitutesa substitute for analyzing our results as reported under GAAP. Some of these limitations are:
these measures do•this measure does not reflect changes in, or cash required for, our working capital needs;
these measures do•this measure does not reflect our interest expense (except for interest related to our securitization obligations), or the cash requirements necessary to service interest or principal payments on our debt;
these measures do•this measure does not reflect our income tax expense or the cash requirements to pay our taxes;
these measures do•this measure does not reflect historical cash expenditures or future requirements for capital expenditures or contractual commitments;
•although depreciation and amortization are non-cash charges, the assets being depreciated and amortized will often require replacement in the future, and these measures dothis measure does not reflect any cash requirements for such replacements; and
•other companies may calculate these measuresthis measure differently so they may not be comparable.
Set forth in the table below is a reconciliation of net income attributable to Realogy to EBITDA and Operating EBITDA for the three-month periods ended September 30, 2017 and 2016:
|
| | | | | | | |
| | Three Months Ended |
| | September 30, 2017 | | September 30, 2016 |
| Net income attributable to Realogy | $ | 95 |
| | $ | 106 |
|
| Income tax expense | 67 |
| | 74 |
|
| Income before income taxes | 162 |
| | 180 |
|
| Interest expense, net | 41 |
| | 37 |
|
| Depreciation and amortization (a) | 51 |
| | 53 |
|
| EBITDA | 254 |
| | 270 |
|
| EBITDA adjustments: | | | |
| Restructuring costs | 2 |
| | 9 |
|
| Former parent legacy cost, net | 1 |
| | — |
|
| Loss on the early extinguishment of debt | 1 |
| | — |
|
| Operating EBITDA | $ | 258 |
| | $ | 279 |
|
| |
(a) | Depreciation and amortization for the three months ended September 30, 2017 includes $1 million of amortization expense related to Guaranteed Rate Affinity's purchase accounting included in the "Equity in earnings of unconsolidated entities" line on the Condensed Consolidated Statement of Operations. |
Contractual Obligations
AllOther than the issuance of $403 million of Exchangeable Senior Notes in June 2021, the Company's future contractual obligations as of SeptemberJune 30, 20172021 have not changed materially from the amounts reported on the "Contractual Obligations Update" table in our 20162020 Form 10-K.10-K, which included the Company's debt transactions on a pro forma basis that occurred during the first quarter of 2021, as described in Note 4, "Short and Long-Term Debt", to the Condensed Consolidated Financial Statements.
Critical Accounting Policies
In presenting our financial statements in conformity with generally accepted accounting principles, we are required to make estimates and assumptions that affect the amounts reported therein. Several of the estimates and assumptions we are required to make relate to matters that are inherently uncertain as they pertain to future events. However, events that are outside of our control cannot be predicted and, as such, they cannot be contemplated in evaluating such estimates and assumptions. If there is a significant unfavorable change to current conditions, it could result in a material adverse impact to
our combined results of operations, financial position and liquidity. We believe that the estimates and assumptions we used when preparing our financial statements were the most appropriate at that time.
These Condensed Consolidated Financial Statements should be read in conjunction with the Consolidated Financial Statements included in the Annual Report on Form 10-K for the year ended December 31, 2016,2020, which includes a description of our critical accounting policies that involve subjective and complex judgments that could potentially affect reported results.
Impairment of goodwill and other indefinite-lived intangible assets
Goodwill represents the excess of acquisition costs over the fair value of the net tangible assets and identifiable intangible assets acquired in a business combination. Other indefinite-lived intangible assets primarily consist of trademarks acquired in business combinations. Goodwill and other indefinite-lived assets are not amortized, but are subject to impairment testing. The aggregate carrying values of our goodwill and other indefinite-lived intangible assets were $2,899 million and $710 million, respectively, at June 30, 2021 and are subject to an impairment assessment annually as of October 1, or whenever events or changes in circumstances indicate that the carrying amount may not be fully recoverable. This assessment compares carrying values of the goodwill reporting units and other indefinite lived intangible assets to their respective fair values and, when appropriate, the carrying value is reduced to fair value.
In testing goodwill, the fair value of each reporting unit is estimated using the income approach, a discounted cash flow approach. For the other indefinite lived intangible assets, fair value is estimated using the relief from royalty method. Management utilizes long-term cash flow forecasts and the Company's annual operating plans adjusted for terminal value assumptions. The fair value of the Company's reporting units and other indefinite lived intangible assets are determined utilizing the best estimate of future revenues, operating expenses, including commission expense, market and general economic conditions, trends in the industry, as well as assumptions that management believes marketplace participants would utilize including discount rates, cost of capital, trademark royalty rates, and long-term growth rates. The trademark royalty rate was determined by reviewing similar trademark agreements with third parties. Although management believes that assumptions are reasonable, actual results may vary significantly. These impairment assessments involve the use of accounting estimates and assumptions, changes in which could materially impact our financial condition or operating performance if actual results differ from such estimates and assumptions. To address this uncertainty, a sensitivity analysis is performed on key estimates and assumptions.
Significant negative industry or economic trends, disruptions to our business, unexpected significant changes or planned changes in use of the assets, a decrease in our business results, growth rates that fall below our assumptions, divestitures, and a sustained decline in our stock price and market capitalization may have a negative effect on the fair values and key valuation assumptions. Such changes could result in changes to our estimates of our fair value and a material impairment of goodwill or other indefinite-lived intangible assets. Management considered these factors and does not believe that it was more likely than not that the fair value of a reporting unit is less than its carrying amount.
Recently Issued Accounting Pronouncements
The SEC issued a final rule on Management’s Discussion and Analysis, Selected Financial Data, and Supplementary Financial Information adopting amendments to modernize, simplify, and enhance certain financial disclosure requirements in Regulation S-K. In summary, the amendments eliminate the requirement to provide selected financial data in Item 301, replace the requirement for tabular supplementary financial information in Item 302 with a principles-based disclosure requirement regarding material retrospective changes and make amendments to Management’s Discussion and Analysis (MD&A) in Item 303 intended to eliminate duplicative disclosures and modernize and enhance MD&A disclosures for the benefit of investors, while simplifying compliance efforts for registrants. The amendments became effective on February 10, 2021 and companies are required to comply with the amendments beginning with the first fiscal year that ends on or after the date that is 210 days after publication in the Federal Register (which was on January 11, 2021). Therefore, the Company will not be required to comply with the amended rules until its 2021 Annual Report on Form 10-K. The rules may be applied early on an Item by Item basis as long as all of the amendments within an Item comply.
See Note 1, "Basis of Presentation", to the Condensed Consolidated Financial Statements for a discussion of recently issued FASB accounting pronouncements.
Item 3. Quantitative and Qualitative Disclosures about Market Risks.
We are exposed to market risk from changes in interest rates primarily through our senior secured debt. At SeptemberJune 30, 2017,2021, our primary interest rate exposure was to interest rate fluctuations, specifically LIBOR, due to its impact on our variable rate borrowings of our Revolving Credit Facility and Term Loan B Facility under the Senior Secured Credit AgreementFacility and the Term Loan A Facility. Given that our borrowings under the Senior Secured Credit AgreementFacility and Term Loan A Facility are generally based upon LIBOR, this rate (or any replacement rate) will be the Company's primary market risk exposure for the foreseeable future. We do not have significant exposure to foreign currency risk nor do we expect to have significant exposure to foreign currency risk in the foreseeable future.
We assess our market risk based on changes in interest rates utilizing a sensitivity analysis. The sensitivity analysis measures the potential impact on earnings, fair values and cash flows based on a hypothetical change (increase and
decrease) in interest rates. We exclude the fair values of relocation receivables and advances and securitization borrowings from our sensitivity analysis because we believe the interest rate risk on these assets and liabilities is mitigated as the rate we earn on relocation receivables and advances and the rate we incur on our securitization borrowings are based on similar variable indices.
At SeptemberJune 30, 2017,2021, we had variable interest rate long-term debt fromoutstanding under our outstanding term loansSenior Secured Credit Facility and revolverTerm Loan A Facility of $2,017$670 million, which excludes $234$147 million of securitization obligations. The weighted average interest rate on the outstanding term loansamounts under our Senior Secured Credit Facility and revolverTerm Loan A Facility at SeptemberJune 30, 20172021 was 3.36%2.26%. The interest rate with respect to the Term Loan B Facility is based on adjusted LIBOR plus 2.25% (with a LIBOR floor of 0.75%). The interest rates with respect to the Revolving Credit Facility and term loans under the Term Loan A Facility are based on adjusted LIBOR plus an additional margin subject to adjustment based on the current senior secured leverage ratio. Based on the SeptemberJune 30, 20172021 senior secured leverage ratio, the LIBOR margin was 2.00%1.75%. At SeptemberJune 30, 2017,2021, the one-month LIBOR rate was 1.23%0.10%; therefore, we have estimated that a 0.25% increase in LIBOR would have a $5$1 million impact on our annual interest expense.
We have entered intoAs of June 30, 2021, we had interest rate swaps with a notional value of $1,475$1,000 million to manage a portion of our exposure to changes in interest rates associated with our $2,017$670 million of variable rate borrowings. Our interest rate swaps arewere as follows:
|
| | | | | | | | | | | | | | | | |
| Notional Value (in millions) | | Commencement Date | | Expiration Date | |
$225450 | July 2012 | February 2018November 2017 | | November 2022 | |
$200400 | January 2013 | February 2018August 2020 | | August 2025 | |
$600150 | August 2015 | August 2020 |
$450 | November 2017 | November 2022 | | November 2027 | |
The swaps help protect our outstanding variable rate borrowings from future interest rate volatility. The fixed interest rates on the swaps range from 2.07% to 2.89%3.11%. The Company had a liability of $63 million for the fair value of the interest rate swaps of$24 million at SeptemberJune 30, 2017.2021. The fair value of these interest rate swaps is subject to movements in LIBOR and will fluctuate in future periods. We have estimated that a 0.25% increase in the LIBOR yield curve would increase the fair value of our interest rate swaps by $10$7 million and would decrease interest expense. While these results may be used as a benchmark, they should not be viewed as a forecast of future results.
Item 4. Controls and Procedures.
Controls and Procedures for Realogy Holdings Corp.
| |
(a) | Realogy Holdings Corp. ("Realogy Holdings") maintains disclosure controls and procedures that are designed to ensure that information required to be disclosed in its filings under the Securities Exchange Act of 1934, as amended (the "Exchange Act"), is recorded, processed, summarized and reported within the periods specified in the rules and forms of the Securities and Exchange Commission. Such information is accumulated and communicated to its management, including its Chief Executive Officer and Chief Financial Officer, as appropriate, to allow timely decisions regarding required disclosure. Realogy Holdings' management, including the Chief Executive Officer and the Chief Financial Officer, recognizes that any set of controls and procedures, no matter how well designed and operated, can provide only reasonable assurance of achieving the desired control objectives. |
| |
(b) | As of the end of the period covered by this quarterly report on Form 10-Q, Realogy Holdings has carried out an evaluation, under the supervision and with the participation of its management, including its Chief Executive Officer and Chief Financial Officer, of the effectiveness of the design and operation of its disclosure controls and procedures. Based upon that evaluation, the Chief Executive Officer and Chief Financial Officer concluded that Realogy Holdings' disclosure controls and procedures are effective at the "reasonable assurance" level. |
| |
(c) | There has not been any change in Realogy Holdings' internal control over financial reporting during the period covered by this quarterly report on Form 10-Q that has materially affected, or is reasonably likely to materially affect, its internal control over financial reporting. |
(a)Realogy Holdings Corp. ("Realogy Holdings") maintains disclosure controls and procedures that are designed to ensure that information required to be disclosed in its filings under the Securities Exchange Act of 1934, as amended (the "Exchange Act"), is recorded, processed, summarized and reported within the periods specified in the rules and forms of the Securities and Exchange Commission and that such information is accumulated and communicated to its management, including its Chief Executive Officer and Chief Financial Officer, as appropriate, to allow timely decisions regarding required disclosure. Realogy Holdings' management, including the Chief Executive Officer and the Chief Financial Officer, recognizes that any set of controls and procedures, no matter how well designed and operated, can provide only reasonable assurance of achieving the desired control objectives.
(b)As of the end of the period covered by this quarterly report on Form 10-Q, Realogy Holdings has carried out an evaluation, under the supervision and with the participation of its management, including its Chief Executive
Officer and Chief Financial Officer, of the effectiveness of the design and operation of its disclosure controls and procedures. Based upon that evaluation, the Chief Executive Officer and Chief Financial Officer concluded that Realogy Holdings' disclosure controls and procedures are effective at the "reasonable assurance" level.
(c)There has not been any change in Realogy Holdings' internal control over financial reporting during the period covered by this quarterly report on Form 10-Q that has materially affected, or is reasonably likely to materially affect, its internal control over financial reporting.
Controls and Procedures for Realogy Group LLC
| |
(a) | (a)Realogy Group LLC ("Realogy Group") maintains disclosure controls and procedures that are designed to ensure that information required to be disclosed in its filings under the Securities Exchange Act of 1934, as amended (the "Exchange Act"), is recorded, processed, summarized and reported within the periods specified in the rules and procedures that are designed to ensure that information required to be disclosed in its filings under the Securities Exchange Act of 1934, as amended (the "Exchange Act"), is recorded, processed, summarized and reported within the periods specified in the rules and |
forms of the Securities and Exchange Commission. SuchCommission and that such information is accumulated and communicated to its management, including its Chief Executive Officer and Chief Financial Officer, as appropriate, to allow timely decisions regarding required disclosure. Realogy Group's management, including the Chief Executive Officer and the Chief Financial Officer, recognizes that any set of controls and procedures, no matter how well designed and operated, can provide only reasonable assurance of achieving the desired control objectives.
| |
(b) | As of the end of the period covered by this quarterly report on Form 10-Q, Realogy Group has carried out an evaluation, under the supervision and with the participation of its management, including its Chief Executive Officer and Chief Financial Officer, of the effectiveness of the design and operation of its disclosure controls and procedures. Based upon that evaluation, the Chief Executive Officer and Chief Financial Officer concluded that Realogy Group's disclosure controls and procedures are effective at the "reasonable assurance" level. |
| |
(c) | There has not been any change in Realogy Group's internal control over financial reporting during the period covered by this quarterly report on Form 10-Q that has materially affected, or is reasonably likely to materially affect, its internal control over financial reporting. |
(b)As of the end of the period covered by this quarterly report on Form 10-Q, Realogy Group has carried out an evaluation, under the supervision and with the participation of its management, including its Chief Executive Officer and Chief Financial Officer, of the effectiveness of the design and operation of its disclosure controls and procedures. Based upon that evaluation, the Chief Executive Officer and Chief Financial Officer concluded that Realogy Group's disclosure controls and procedures are effective at the "reasonable assurance" level.
(c)There has not been any change in Realogy Group's internal control over financial reporting during the period covered by this quarterly report on Form 10-Q that has materially affected, or is reasonably likely to materially affect, its internal control over financial reporting.
Other Financial Information
The Condensed Consolidated Financial Statements as of SeptemberJune 30, 20172021 and for the three and nine-monthsix-month periods ended SeptemberJune 30, 20172021 and 20162020 have been reviewed by PricewaterhouseCoopers LLP, an independent registered public accounting firm. Their reports, dated November 3, 2017,August 4, 2021, are included on pages 4 and 5. The reports of PricewaterhouseCoopers LLP state that they did not audit and they do not express an opinion on that unaudited financial information. Accordingly, the degree of reliance on their report on such information should be restricted in light of the limited nature of the review procedures applied. PricewaterhouseCoopers LLP is not subject to the liability provisions of Section 11 of the Securities Act of 1933 (the "Act") for their report on the unaudited financial information because that report is not a "report" or a "part" of the registration statement prepared or certified by PricewaterhouseCoopers LLP within the meaning of Sections 7 and 11 of the Act.
PART II - OTHER INFORMATION
Item 1. Legal Proceedings.
See Note 9,8, "Commitments and Contingencies—Litigation", to the Condensed Consolidated Financial Statements included elsewhere in this Quarterly Report for additional information on the Company's legal proceedings including a description of the Dodge, et al. v. PHH Corporation, et al. litigation, which we refer to as the Strader legal matter..
The Company believes that it has adequately accrued for legal matters as appropriate. The Company records litigation accruals for legal matters which are both probable and estimable.
Litigation and other disputes are inherently unpredictable and subject to substantial uncertainties and unfavorable resolutions could occur.occur and even cases brought by us can involve counterclaims asserted against us. In addition, litigation and other legal matters, including class action lawsuits orand regulatory proceedings challenging practices that have broad impact can be costly to defend and, depending on the class size and claims, could be costly to settle. As such, the Company could incur judgments or enter into settlements of claims with liability that are materially in excess of amounts accrued and these settlements could have a material adverse effect on the Company’s financial condition, results of operations or cash flows in any particular period.
LitigationLegal and Regulatory Environment. All of our businesses, as well as our mortgage origination joint venture and the businesses of our franchisees are highly regulated and subject to shifts in public policy, statutory interpretation and enforcement priorities of regulators and other government authorities as well as amendments to existing regulations and regulatory guidance. Likewise, litigation, investigations, claims and regulatory proceedings against other participants in the residential real estate industry or relocation industry – or against companies in other industries – may impact the Company and its affiliated franchisees when the rulings or settlements in those cases cover practices common to the broader industry.industry or business community and may generate litigation or investigations for the Company. In addition, through our subsidiaries, employees and/or affiliated agents, we are a participant in many multiple listing services ("MLSs"), a member-owner of certain MLSs, and a member of the National Association of Realtors ("NAR") and respective state realtor associations, all of which also are subject to litigation, regulatory or policy shifts, including with respect to NAR and MLS rules.
From time to time, certain industry practices have come under federal or state scrutiny or have been the subject of litigation. Examples may include, claims associatedbut are not limited to, various NAR and MLS rules, compliance with RESPA compliance,or similar state statutes (including, but not limited to, those related to the broker-to-broker exception, marketing agreements or consumer rebates), sales agent classification and worker classification statutes, broker fiduciary duties, federal and sales agent classification. Onestate fair housing laws, consumer lending and debt collection laws, false or fraudulent claims laws, and state laws limiting or prohibiting inducements, cash rebates and gifts to consumers.
Heightened scrutiny can follow changes in administration and the industry is currently experiencing such case is PHH Corp. vs. Consumer Financial Protection Bureau, No. 15-1177. On October 11, 2016,increased interest by regulators and other government offices, both on a three-judge panelfederal and state level. We cannot assure you that changes in legislation, regulations, interpretations or regulatory guidance, or enforcement priorities will not result in additional limitations or restrictions on our business or otherwise adversely affect us.
For example, in July 2021, the Department of Justice (“DOJ”) filed a notice of withdrawal of consent to its November 2020 proposed settlement with NAR to settle a civil lawsuit in which the DOJ alleged that NAR established and enforced illegal restraints on the ways the real estate industry operates. The DOJ also filed to voluntarily dismiss the civil lawsuit without prejudice in July 2021, stating in a concurrently filed press release that “[t]he department determined that the [November 2020] settlement will not adequately protect the department’s rights to investigate other conduct by NAR that could impact competition in the real estate market…” The DOJ further noted in its press release that it “is taking this action to permit a broader investigation of NAR’s rules and conduct to proceed without restriction.” Although we were not a party to or a participant in the DOJ’s civil lawsuit against, or settlement agreement with, NAR, and do not agree with certain of the United Statesassertions raised, we do believe the settlement provisions generally were reasonable revisions that would modernize the practices at issue. We intend over time to comply voluntarily with the substance of various commitments embodied in the settlement agreement to the extent such commitments are within our control, including enhancing consumer access to certain information concerning real estate agent commission arrangements wherever MLSs manage brokers’ listings and authorize display.
In addition, to the announcements by DOJ, there have been recent statements and actions by the Federal Trade Commission (“FTC”) and the executive branch focused on increasing competition. An Executive Order issued by the White House in July 2021 identified areas of interest for further investigation—including real estate brokerage and listings. In July
2021, the FTC rescinded its 2015 antitrust policy statement, noting in a press release that such statement “has constrained the agency’s use of its authority to stop anticompetitive business tactics under Section 5 of the FTC Act.”
In 2018, the DOJ and FTC held a joint public workshop to explore competition issues in the residential real estate services industry at which a variety of issues, beyond those alleged in the DOJ's November 2020 civil lawsuit against NAR, were raised that could be determined to be anti-competitive in the future.
Further, in worker classification litigation involving a competing brokerage, the New Jersey Appellate Division recently applied a strict classification test to wage and hour cases in New Jersey. We anticipate this decision will be appealed. In its holding, the New Jersey Appellate Division also observed that legislative statutory amendments made in 2018 may affect worker classification claims related to real estate agents in New Jersey on a go-forward basis. Another worker classification matter in New Jersey against an insurance brokerage also is pending before the New Jersey Supreme Court of Appeals for the D.C. Circuit issued a decisionand an adverse ruling in that case addressingcould adversely impact other industries, including the real estate industry. Also, there have been several challenges to the constitutionality and enforceability of a California worker classification statute adopted in 2019 as it applies to other industries, which if found unconstitutional, could have the CFPB's structure as a single-Director independent agency where the CFPB Director can only be removed by the Presidenteffect of the U.S. for "cause"eliminating that statute's less restrictive test applicable to real estate professionals in California. We continue to monitor these matters as well as various important RESPA issues, including that: (1) Section 8(c)(2)related federal and state developments.
There can be no assurances as to whether the DOJ or FTC, their state counterparts, state or federal courts, or other governmental body will determine that any industry practices or developments have an anti-competitive effect on the industry or are otherwise proscribed. Any such determination by the DOJ, FTC, their state counterparts, courts, or other governmental body could result in industry investigations, enforcement actions or other legislative or regulatory action or other actions, any of RESPA (which permits “bona fide” payments for goodswhich could have the potential to materially disrupt our business.
Item 1A. Risk Factors
Other than as described below, there were no material changes to the risk factors reported in Part 1, "Item 1A. Risk Factors" in our 2020 Form 10-K.
The exchangeable note hedge and services actually performed), remains a viable exception under RESPA and does not constitute a payment for a referral in violation of RESPA wherewarrant transactions may affect the amount paid does not exceed the reasonable market value of our common stock.
Concurrent with the goods or services; (2) new CFPB interpretations of RESPA cannot be enforced on a retroactive basis where there is reliance on prior regulatory interpretations; and (3) the CFPB is bound by the three-year statute of limitations for government enforcement of RESPA. On February 16, 2017, the full D.C. Circuit Court of Appeals agreed to hear an appealoffering of the October 11, 2016 decisionExchangeable Senior Notes, we entered into exchangeable note hedge transactions and vacatedwarrant transactions with certain counterparties (the "Option Counterparties"). The exchangeable note hedge transactions are expected generally to reduce the potential dilution upon exchange of the notes and/or offset any cash payments we are required to make in excess of the principal amount of exchanged notes, as the case may be. However, the warrant transactions could separately have a dilutive effect on our common stock to the extent that decision pending the appeal. Oral arguments were held on May 24, 2017. A decision frommarket price per share of common stock exceeds the full D.C. Circuit Court is pending.strike price of the warrants.
The Company alsoOption Counterparties or their respective affiliates may be impactedmodify their hedge positions by litigation andentering into or unwinding various derivatives with respect to our common stock and/or purchasing or selling the common stock or other claims against companiessecurities of ours in other industries. Rulings on matters such assecondary market transactions prior to the enforcement of arbitration and class waiver agreements and worker classification may adversely affect the Company and other residential real estate industry participants as a resultmaturity of the classification of sales associates as independent contractors, irrespectiveExchangeable Senior Notes (and are likely to do so during any observation period related to an exchange of the fact thatnotes). This activity could cause or avoid an increase or a decrease in the partiesmarket price of our common stock.
We are subject to counterparty risk with respect to the exchangeable note hedge transactions.
The Option Counterparties are financial institutions or affiliates of financial institutions, and we are subject to the rulings are in a different industry. Torisk that one or more of such Option Counterparties may default under the extentexchangeable note hedge transactions. Our exposure to the defendants are unsuccessful in these types of litigation matters, and we or our franchisees cannot distinguish our or their practices (or our industry’s practices), we and our franchisees could face significant liability and could be required to modify certain business relationships, either of which could materially and adversely impact our financial condition and results of operations. There also are changing employment-related regulatory interpretations at both the federal and state levels that could create risks around historic practices and that could require changes in business practices, both for us and our franchisees.
Item 2. Unregistered Sales of Equity Securities and Use of Proceeds.
| |
(c) | The following table sets forth information relating to repurchase of shares of our common stock during the quarter ended September 30, 2017: |
|
| | | | | | | | | | | | |
| Period | | Total Number of Shares Purchased | | Average Price Paid per Share | | Total Number of Shares Purchased as Part of a Publicly Announced Programs (1) | | Approximate Dollar Value of Shares that May Yet Be Purchased Under the Programs (1) |
| July 1 - 31, 2017 | | 452,691 |
| | $33.14 | | 452,691 |
| | $ | 241,402,984 |
|
| August 1 - 31, 2017 | | 516,900 |
| | $34.33 | | 516,900 |
| | $ | 223,657,807 |
|
September 1 - 30, 2017 (2) | | 759,600 |
| | $33.91 | | 759,600 |
| | $ | 197,899,771 |
|
_______________
| |
(1) | In February 2016, the Company's Board of Directors authorized a share repurchase program of up to $275 million of the |
Company’s common stock. As of April 30, 2017, allcredit risk of the capacityOption Counterparties is not secured by any collateral. If any Option Counterparty becomes subject to insolvency proceedings, we will become an unsecured creditor in those proceedings with a claim equal to our exposure at that time under this program had been utilized. In February 2017, our Board authorized a new share repurchase program of up to an additional $300 million of the Company's common stock. Repurchases under these programs may be made at management's discretion from time to time on the open market, pursuant to Rule 10b5-1 trading plans or privately negotiated transactions. The size and timing of these repurchasesexchangeable note hedge transaction. Our exposure will depend on many factors but, generally, the increase in our exposure will be correlated to the increase in our common stock market price market and economic conditions, legal and contractual requirements and other factors. The repurchase programs have no time limit and may be suspended or discontinued at any time. Allin the volatility of the repurchased common stock has been retired.
| |
(2) | Includes 77,900 of shares purchased for which the trade date occurred in late September 2017 while settlement occurred in October 2017. |
During the period October 1, 2017 through November 1, 2017, we repurchased an additional 0.5 million shares at a weighted average market price of $33.11. Giving effectour common stock. In addition, upon a default by the Option Counterparty, we may suffer adverse tax consequences and dilution with respect to these repurchases, we had approximately $181 million of remaining capacity authorized under the February 2017 share repurchase programour common stock. We can provide no assurance as of November 1, 2017.
Item 5. Other Information.
On November 2, 2017, the Board of Directors of Realogy Holdings Corp. (the “Board”) approved the Fourth Amended and Restated Bylaws of the Company (the “Bylaws”), which include amendments to:
•remove certain provisions that are inapplicable following the Company’s de-classification of the Board;
add the positions of Chairman of the Board and Lead Independent Director to Article III (Board of Directors) of the Bylaws and make related ancillary changes; and
align statutory officer positions in Article IV (Officers) with Company practice, including the elimination of the statutory officer roles of Treasurer and Chief Accounting Officer, and make related ancillary changes.
The foregoing description of the amendments to the Bylaws is qualified in its entirety by reference to the Bylaws, which are attached to this Quarterly Report on Form 10-Q as Exhibit 3.1 and are incorporated herein by reference.financial stability or viability of any Option Counterparty.
On November 2, 2017, the Board approved Amendment Number 1 (the "Plan Amendment") to the Realogy Holdings Corp. Amended and Restated 2012 Long-Term Incentive Plan (the "Amended and Restated 2012 LTIP") to allow for the elimination of fractional shares by rounding up or down in the discretion of plan administrator (which is generally the Compensation Committee of the Board). On November 2, 2017, the Compensation Committee amended outstanding performance restricted stock unit, performance share unit and restricted stock unit awards (the "Amended Awards") granted to employees, including executive officers, prior to the date of the Plan Amendment, to provide for the rounding up of fractional shares upon the final vesting of the Amended Awards.
The foregoing description of the Plan Amendment is qualified in its entirety by reference to the Plan Amendment, which is attached to this Quarterly Report on Form 10-Q as Exhibit 10.1 and is incorporated herein by reference.
Item 6. Exhibits.
See Exhibit Index.
SIGNATURES
Pursuant to the requirements of the Securities Exchange Act of 1934, the registrants have duly caused this report to be signed on its behalf by the undersigned thereunto duly authorized.
REALOGY HOLDINGS CORP.
and
REALOGY GROUP LLC
(Registrants)
Date: November 3, 2017August 4, 2021
/S/ ANTHONY E. HULL CHARLOTTE C. SIMONELLI
Anthony E. HullCharlotte C. Simonelli
Executive Vice President and
Chief Financial Officer
Date: November 3, 2017August 4, 2021
/S/ TIMOTHY B. GUSTAVSON
Timothy B. Gustavson
Senior Vice President,
Chief Accounting Officer and
Controller
EXHIBIT INDEX
Exhibit Description
| |
101.INS ^ | XBRL Instance Document. |
| |
101.SCH ^ | XBRL Taxonomy Extension Schema Document. |
| |
101.CAL^ | XBRL Taxonomy Extension Calculation Linkbase Document. |
| |
101.DEF ^ | XBRL Taxonomy Extension Definition Linkbase Document. |
| |
101.LAB ^ | XBRL Taxonomy Extension Label Linkbase Document. |
| |
101.PRE ^ | XBRL Taxonomy Extension Presentation Linkbase Document. |
______________
| |
^ | Furnished electronically with this report. |