UNITED STATES
SECURITIES AND EXCHANGE COMMISSION
WASHINGTON, D.C. 20549
___________________________
FORM 10-Q
þQUARTERLY REPORT PURSUANT TO SECTION 13 OR 15(d) OF THE SECURITIES EXCHANGE ACT OF 1934
For the quarterly period ended March 31, 20182019
OR
¨TRANSITION REPORT PURSUANT TO SECTION 13 OR 15(d) OF THE SECURITIES EXCHANGE ACT OF 1934
For the transition period from _____ to _____
Commission File No. 001-35674
REALOGY HOLDINGS CORP.
(Exact name of registrant as specified in its charter)
20-8050955
(I.R.S. Employer Identification Number)
Commission File No. 333-148153
REALOGY GROUP LLC
(Exact name of registrant as specified in its charter)
20-4381990
(I.R.S. Employer Identification Number)
Delaware
(State or other jurisdiction of incorporation or organization)
175 Park Avenue
Madison, NJ 07940
(Address of principal executive offices) (Zip Code)
(973) 407-2000
(Registrants' telephone number, including area code)
___________________________
Indicate by check mark whether the Registrants (1) have filed all reports required to be filed by Section 13 or 15(d) of the Securities Exchange Act of 1934 during the preceding 12 months (or for such shorter period that the registrant was required to file such reports), and (2) have been subject to such filing requirements for the past 90 days.
Realogy Holdings Corp. Yes þ No ¨Realogy Group LLC Yes ¨ No þ
Indicate by check mark whether the Registrants have submitted electronically and posted on its corporate Web site, if any, every Interactive Data File required to be submitted and posted pursuant to Rule 405 of Regulation S-T (§ 232.405 of this chapter) during the preceding 12 months (or for such shorter period that the Registrants were required to submit and post such files).
Realogy Holdings Corp. Yes þ No ¨Realogy Group LLC Yes þ No ¨
Indicate by check mark whether the Registrants are large accelerated filers, accelerated filers, non-accelerated filers, smaller reporting companies, or emerging growth companies. See the definitions of "large accelerated filer," "accelerated filer," "smaller reporting company," and "emerging growth company" in Rule 12b-2 of the Exchange Act.
|
| | | | | | | | | |
| | Large accelerated filer | | Accelerated filer | | Non-accelerated filer (Do not check if a smaller reporting company)
| | Smaller reporting company | | Emerging growth company |
| Realogy Holdings Corp. | þ | | ¨ | | ¨ | | ¨ | | ¨ |
| Realogy Group LLC | ¨ | | ¨ | | þ | | ¨ | | ¨ |
If an emerging growth company, indicate by check mark if the registrant has elected not to use the extended transition period for complying with any new or revised financial accounting standards provided pursuant to Section 13(a) of the Exchange Act. ¨
Indicate by check mark whether the Registrants are a shell company (as defined in Rule 12b-2 of the Exchange Act).
Realogy Holdings Corp. Yes ¨ No þRealogy Group LLC Yes ¨ No þ
|
| | | | | |
| Securities registered pursuant to Section 12(b) of the Act: |
| Title of each class | | Trading Symbol(s) | | Name of each exchange on which registered |
| Realogy Holdings Corp. | Common Stock, par value $0.01 per share | | RLGY | | New York Stock Exchange |
| Realogy Group LLC | None | | None | | None |
There were 127,514,633114,213,121 shares of Common Stock, $0.01 par value, of Realogy Holdings Corp. outstanding as of May 1, 2018.April 30, 2019.
TABLE OF CONTENTS
|
| | |
| | Page |
| |
| |
| | | |
| PART I | FINANCIAL INFORMATION | |
| Item 1. | | |
| | | |
| | | |
| | | |
| | | |
| | | |
| | | |
| | | |
| Item 2. | | |
| Item 3. | | |
Item 4. | | |
PART II | | |
Item 1.4. | | |
| PART II | | |
| Item 1. | | |
| Item 2. | | |
| Item 6. | | |
| |
| |
INTRODUCTORY NOTE
Except as otherwise indicated or unless the context otherwise requires, the terms "we," "us," "our," "our company," "Realogy," "Realogy Holdings" and the "Company" refer to Realogy Holdings Corp., a Delaware corporation, and its consolidated subsidiaries, including Realogy Intermediate Holdings LLC, a Delaware limited liability company ("Realogy Intermediate"), and Realogy Group LLC, a Delaware limited liability company ("Realogy Group"). Neither Realogy Holdings, the indirect parent of Realogy Group, nor Realogy Intermediate, the direct parent company of Realogy Group, conducts any operations other than with respect to its respective direct or indirect ownership of Realogy Group. As a result, the consolidated financial positions, results of operations and cash flows of Realogy Holdings, Realogy Intermediate and Realogy Group are the same.
Realogy Holdings is not a party to the Amended and Restated Credit Agreement dated as of March 5, 2013, as amended, amended and restated, modified or supplemented from time to time (the "Senior Secured Credit Agreement") that governs our senior secured credit facility (the "Senior Secured Credit Facility", which includes our "Revolving Credit Facility" and our "Term Loan B") and the Term Loan A Agreement dated as of October 23, 2015, as amended from time to time (the "Term Loan A Agreement") that governs our senior secured term loan A credit facility (the "Term Loan A Facility") and certain references in this report to our consolidated indebtedness exclude Realogy Holdings with respect to indebtedness under the Senior Secured Credit Facility and Term Loan A Facility. In addition, while Realogy Holdings is a guarantor of Realogy Group's obligations under its unsecured notes, Realogy Holdings is not subject to the restrictive covenants in the indentures governing such indebtedness.
As used in this Quarterly Report on Form 10-Q, the terms "4.50%"5.25% Senior Notes," "5.25%Notes", "4.875% Senior Notes" and "4.875%"9.375% Senior Notes" refer to our 4.50% Senior Notes due 2019, our 5.25% Senior Notes due 2021, and our 4.875% Senior Notes due 2023, and our 9.375% Senior Notes due 2027, respectively, and are referred to collectively as the "Unsecured Notes." The term "4.50% Senior Notes" refers to our 4.50% Senior Notes due 2019 (paid in full in February 2019).
FORWARD-LOOKING STATEMENTS
This Quarterly Report on Form 10-Q includes forward-looking statements within the meaning of Section 27A of the Securities Act of 1933 and Section 21E of the Securities Exchange Act of 1934 (the "Exchange Act"). Forward-looking statements include all statements that do not relate solely to historical or current facts, and can generally be identified by the use of words such as "believe," "expect," "anticipate," "intend," "project," "estimate," "plan," and similar expressions or future or conditional verbs such as "will," "should," "would," "may" and "could" are generally forward-looking in nature and not historical facts.
In particular, information appearing under "Management's Discussion and Analysis of Financial Condition and Results of Operations" includes forward-looking statements. Forward-looking statements inherently involve many risks and uncertainties that could cause actual results to differ materially from those projected in these statements. Where, in any forward-looking statement, we express an expectation or belief as to future results or events, it is based on management's current plans and expectations, expressed in good faith and believed to have a reasonable basis. However, we can give no assurance that any such expectation or belief will result or will be achieved or accomplished.
The following include some, but not all, of the factors that could affect our future results and cause actual results to differ materially from those expressed in the forward-looking statements:
adverse developments or the absence of sustained improvement in general business, economic andor political conditions or the U.S. residential real estate markets, either regionally or nationally, including but not limited to:
| |
| ◦ | a decline or a lack of improvement or a decline in the number of homesales; |
| |
| ◦ | stagnant or declining home prices; |
| |
| ◦ | a reduction in the affordability of housing; |
| |
| ◦ | increasing mortgage rates and/or constraints on the availability of mortgage financing; |
| |
| ◦ | insufficient or excessive home inventory levels by market and price point; |
| |
| ◦ | a lack of improvement or deceleration in the building of new housing and/or irregular timing or volume of new development closings; |
| |
| ◦ | the potential negative impact of certain provisions of the Tax Cuts and Jobs Act of 2017 (the “2017 Tax Act”) on (i) on home values over time in states with high property, sales and state and local income taxes and (ii) on homeownership rates; and/or |
homeownership rates; and/or
| |
| ◦ | the impact of recessions, slow economic growth, or a deterioration in other economic factors that particularly impact the residential real estate market and the business segments in which we operate whether broadly or by geography and price segments; |
increased competition in the industry and for the affiliation of independent sales agents, whether through traditional competitors, competitors with alternative business models or other industry participants otherwise competing for a portion of gross commission income;including through:
| |
| ◦ | competing real estate brokerages, including those seeking to disrupt historic real estate brokerage models; |
| |
| ◦ | competitors seeking to eliminate brokers or agents from, or minimize the role they play in, the homesale transaction; and |
| |
| ◦ | other industry participants otherwise competing for a portion of gross commission income; |
continuing pressure on the share of gross commission income paid by our company owned brokerages and our affiliated franchisees to theiraffiliated independent affiliated sales agents;agents and independent sales agent teams;
our inability to successfully develop or procure technology that supports our strategy to grow the base of independent sales agents at our company owned and franchisee real estate brokerages;
our geographic and high-end market concentration;concentration, including the heightened competition for independent sales agents in those geographies and price points;
our inability to enter into franchise agreements with new franchisees or renew existing franchise agreements at current contractual royalty rates without increasing the amount and prevalence of sales incentives;
the lack of revenue growth or declining profitability of our franchisees and company owned brokerage operations;operations or declines in other revenue streams, such as third-party listing fees;
the loss of a significant affinity client or multiple significant relocation clients or changes in corporate relocation practices resulting in fewer employee relocations, reduced relocation benefits and/or increasing competition in corporate relocation or the loss of one or more significant affinity clients;relocation;
an increase in the experienced claims losses of our title underwriter;
| |
| • | an increase in the experienced claims losses of our title underwriter; |
our failure or alleged failure to comply with laws, regulations and regulatory interpretations and any changes or stricter interpretations of any of the foregoing;foregoing (whether through private litigation or governmental action), including but not limited to (1) state or federal employment laws or regulations that would require reclassification of independent contractor sales agents to employee status, (2) privacy or data security laws and regulations, (3) RESPA or other federal or state consumer protection or similar laws and (4) antitrust laws and regulations;
risks relating to our ability to return capital to stockholders pursuant toincluding, among other risks, the restrictions contained in our stock repurchase program;
risks and growing costs related to cybersecurity threats to our data and customer, franchisee, employee and independent sales agent data; anddebt agreements, in particular the indenture governing the 9.375% Senior Notes;
risks associated with our substantial indebtedness and interest obligations and restrictions contained in our debt agreements, including risks relating to having to dedicate a significant portion of our cash flows from operations to service our debt.debt and risks relating to our ability to refinance or repay our indebtedness or incur additional indebtedness; and
risks and growing costs related to both cybersecurity threats to our data and customer, franchisee, employee and independent sales agent data, as well as those related to our compliance with the growing number of laws, regulations and other requirements related to the protection of personal information.
More information on factors that could cause actual results or events to differ materially from those anticipated is included from time to time in our reports filed with the Securities and Exchange Commission ("SEC"), including our Annual Report on Form 10-K for the year ended December 31, 20172018 (the "2017"2018 Form 10-K"), particularly under the captions headings "Forward-Looking Statements," "Risk Factors" and "Management's Discussion and Analysis of Financial Condition and Results of Operations." Most of these factors are difficult to anticipate and are generally beyond our control. You should consider these factors in connection with any forward-looking statements that may be made by us and our businesses generally.
All forward-looking statements herein speak only as of the date of this report and are expressly qualified in their entirety by the cautionary statements included in or incorporated by reference into this report. Except as is required by law, we expressly disclaim any obligation to publicly release any revisions to forward-looking statements to reflect events after the date of this report. For any forward-looking statement contained in this report, our public filings or other public statements, we claim the protection of the safe harbor for forward-looking statements contained in the Private Securities Litigation Reform Act of 1995.
PART I - FINANCIAL INFORMATION
Item 1. Financial Statements.
REPORT OF INDEPENDENT REGISTERED PUBLIC ACCOUNTING FIRMReport of Independent Registered Public Accounting Firm
To the Board of Directors and Stockholders of Realogy Holdings Corp.
Results of Review of Interim Financial Statements
We have reviewed the accompanying condensed consolidated balance sheet of Realogy Holdings Corp. and its subsidiaries (the "Company") as of March 31, 2018,2019, and the related condensed consolidated statements of operations, comprehensive loss and cash flows for the three-month periods ended March 31, 20182019 and March 31, 2017,2018, including the related notes (collectively referred to as the “interim financial statements”). Based on our reviews, we are not aware of any material modifications that should be made to the accompanying interim financial statements for them to be in conformity with accounting principles generally accepted in the United States of America.
We have previously audited, in accordance with the standards of the Public Company Accounting Oversight Board (United States), the consolidated balance sheet of the Company as of December 31, 2017,2018, and the related consolidated statements of operations, comprehensive income, equity, and of cash flows for the year then ended (not presented herein), and in our report dated February 27, 2018,26, 2019, we expressed an unqualified opinion on those consolidated financial statements. In our opinion, the information set forth in the accompanying condensed consolidated balance sheet information as of December 31, 2017,2018, is fairly stated, in all material respects, in relation to the consolidated balance sheet from which it has been derived.
Basis for Review Results
These interim financial statements are the responsibility of the Company’s management.We are a public accounting firm registered with the Public Company Accounting Oversight Board (United States) (“PCAOB”) and are required to be independent with respect to the Company in accordance with the U.S. federal securities laws and the applicable rules and regulations of the Securities and Exchange Commission and the PCAOB. We conducted our review in accordance with the standards of the PCAOB. A review of interim financial information consists principally of applying analytical procedures and making inquiries of persons responsible for financial and accounting matters. It is substantially less in scope than an audit conducted in accordance with the standards of the PCAOB, the objective of which is the expression of an opinion regarding the financial statements taken as a whole. Accordingly, we do not express such an opinion.
/s/ PricewaterhouseCoopers LLP
Florham Park, New Jersey
May 3, 20182, 2019
REPORT OF INDEPENDENT REGISTERED PUBLIC ACCOUNTING FIRMReport of Independent Registered Public Accounting Firm
To the Board of Directors and Stockholder of Realogy Group LLC
Results of Review of Interim Financial Statements
We have reviewed the accompanying condensed consolidated balance sheet of Realogy Group LLC and its subsidiaries (the "Company") as of March 31, 2018,2019, and the related condensed consolidated statements of operations, comprehensive loss and cash flows for the three-month periods ended March 31, 2019 and 2018, and March 31, 2017. Theseincluding the related notes (collectively referred to as the "interim financial statements"). Based on our reviews, we are not aware of any material modifications that should be made to the accompanying interim financial statements arefor them to be in conformity with accounting principles generally accepted in the responsibilityUnited States of the Company’s management.
America.
We conducted our reviewhave previously audited, in accordance with the standards of the Public Company Accounting Oversight Board (United States) and in accordance with auditing standards generally accepted in the United States of America, the consolidated balance sheet of the Company as of December 31, 2018, and the related consolidated statements of operations, comprehensive income, and of cash flows for the year then ended (not presented herein), and in our report dated February 26, 2019, we expressed an unqualified opinion on those consolidated financial statements. In our opinion, the information set forth in the accompanying condensed consolidated balance sheet information as of December 31, 2018, is fairly stated, in all material respects, in relation to the consolidated balance sheet from which it has been derived.
Basis for Review Results
These interim financial statements are the responsibility of the Company's management. We are a public accounting firm registered with the Public Company Accounting Oversight Board (United States) ("PCAOB") and are required to be independent with respect to the Company in accordance with the U.S. federal securities laws and the applicable rules and regulations of the Securities and Exchange Commission and the PCAOB. We conducted our reviews in accordance with the standards of the PCAOB and in accordance with auditing standards generally accepted in the United States of America applicable to reviews of interim financial information. A review of interim financial information consists principally of applying analytical procedures and making inquiries of persons responsible for financial and accounting matters. It is substantially less in scope than an audit conducted in accordance with the standards of the Public Company Accounting Oversight Board (United States)PCAOB or in accordance with auditing standards generally accepted in the United States of America, the objective of which is the expression of an opinion regarding the financial statements taken as a whole. Accordingly, we do not express such an opinion.
Based on our review, we are not aware of any material modifications that should be made to the accompanying condensed consolidated interim financial statements for them to be in conformity with accounting principles generally accepted in the United States of America.
We previously audited, in accordance with the standards of the Public Company Accounting Oversight Board (United States) and in accordance with auditing standards generally accepted in the United States of America, the consolidated balance sheet as of December 31, 2017, and the related consolidated statements of operations, comprehensive income, and of cash flows for the year then ended (not presented herein), and in our report dated February 27, 2018, we expressed an unqualified opinion on those consolidated financial statements. In our opinion, the information set forth in the accompanying condensed consolidated balance sheet information as of December 31, 2017, is fairly stated, in all material respects, in relation to the consolidated balance sheet from which it has been derived.
/s/ PricewaterhouseCoopers LLP
Florham Park, New Jersey
May 3, 20182, 2019
REALOGY HOLDINGS CORP. AND REALOGY GROUP LLC
CONDENSED CONSOLIDATED STATEMENTS OF OPERATIONS
(In millions, except per share data)
(Unaudited)
| | | | Three Months Ended | Three Months Ended |
| | March 31, | March 31, |
| | 2018 | | 2017 | 2019 | | 2018 |
| Revenues | | | | | | |
| Gross commission income | $ | 902 |
| | $ | 881 |
| $ | 799 |
| | $ | 902 |
|
| Service revenue | 197 |
| | 194 |
| 188 |
| | 197 |
|
| Franchise fees | 79 |
| | 75 |
| 70 |
| | 79 |
|
| Other | 51 |
| | 53 |
| 57 |
| | 51 |
|
| Net revenues | 1,229 |
| | 1,203 |
| 1,114 |
| | 1,229 |
|
| Expenses | | | | | | |
| Commission and other agent-related costs | 645 |
| | 605 |
| 575 |
| | 645 |
|
| Operating | 392 |
| | 383 |
| 380 |
| | 392 |
|
| Marketing | 67 |
| | 62 |
| 69 |
| | 67 |
|
| General and administrative | 89 |
| | 89 |
| 95 |
| | 89 |
|
| Restructuring costs, net | 30 |
| | 5 |
| 12 |
| | 30 |
|
| Lease asset impairment | | 1 |
| | — |
|
| Depreciation and amortization | 48 |
| | 50 |
| 49 |
| | 48 |
|
| Interest expense, net | 33 |
| | 39 |
| 63 |
| | 33 |
|
| Loss on the early extinguishment of debt | 7 |
| | 4 |
| 5 |
| | 7 |
|
| Total expenses | 1,311 |
| | 1,237 |
| 1,249 |
| | 1,311 |
|
| Loss before income taxes, equity in losses and noncontrolling interests | (82 | ) | | (34 | ) | |
| Loss before income taxes, equity in (earnings) losses and noncontrolling interests | | (135 | ) | | (82 | ) |
| Income tax benefit | (19 | ) | | (9 | ) | (35 | ) | | (19 | ) |
| Equity in losses of unconsolidated entities | 4 |
| | 3 |
| |
| Equity in (earnings) losses of unconsolidated entities | | (1 | ) | | 4 |
|
| Net loss | (67 | ) | | (28 | ) | (99 | ) | | (67 | ) |
| Less: Net income attributable to noncontrolling interests | — |
| | — |
| — |
| | — |
|
| Net loss attributable to Realogy Holdings and Realogy Group | $ | (67 | ) | | $ | (28 | ) | $ | (99 | ) | | $ | (67 | ) |
| | | | | | | |
| Loss per share attributable to Realogy Holdings: | | | | | | |
| Basic loss per share | $ | (0.51 | ) | | $ | (0.20 | ) | $ | (0.87 | ) | | $ | (0.51 | ) |
| Diluted loss per share | $ | (0.51 | ) | | $ | (0.20 | ) | $ | (0.87 | ) | | $ | (0.51 | ) |
Weighted average common and common equivalent shares of Realogy Holdings outstanding: | | Basic | 130.3 |
| | 139.7 |
| 114.0 |
| | 130.3 |
|
| Diluted | 130.3 |
| | 139.7 |
| 114.0 |
| | 130.3 |
|
| | | | | |
| Cash dividends declared per share | $ | 0.09 |
| | $ | 0.09 |
| |
See Notes to Condensed Consolidated Financial Statements.
5
REALOGY HOLDINGS CORP. AND REALOGY GROUP LLC
CONDENSED CONSOLIDATED STATEMENTS OF COMPREHENSIVE LOSS
(In millions)
(Unaudited)
| | | | Three Months Ended | Three Months Ended |
| | March 31, | March 31, |
| | 2018 | | 2017 | 2019 | | 2018 |
| Net loss | $ | (67 | ) | | $ | (28 | ) | $ | (99 | ) | | $ | (67 | ) |
| Currency translation adjustment | 1 |
| | 1 |
| 1 |
| | 1 |
|
| Defined benefit pension plan - amortization of actuarial loss to periodic pension cost | 1 |
| | — |
| 1 |
| | 1 |
|
| Other comprehensive income, before tax | 2 |
| | 1 |
| 2 |
| | 2 |
|
| Income tax expense (benefit) related to items of other comprehensive income amounts | — |
| | — |
| — |
| | — |
|
| Other comprehensive income, net of tax | 2 |
| | 1 |
| 2 |
| | 2 |
|
| Comprehensive loss | (65 | ) | | (27 | ) | (97 | ) | | (65 | ) |
| Less: comprehensive income attributable to noncontrolling interests | — |
| | — |
| — |
| | — |
|
| Comprehensive loss attributable to Realogy Holdings and Realogy Group | $ | (65 | ) | | $ | (27 | ) | $ | (97 | ) | | $ | (65 | ) |
See Notes to Condensed Consolidated Financial Statements.
6
REALOGY HOLDINGS CORP. AND REALOGY GROUP LLC
CONDENSED CONSOLIDATED BALANCE SHEETS
(In millions, except share data)
(Unaudited)
| | | | March 31,
2018 | | December 31,
2017 | March 31,
2019 | | December 31,
2018 |
| | | |
| ASSETS | | | | | | |
| Current assets: | | | | | | |
| Cash and cash equivalents | $ | 182 |
| | $ | 227 |
| $ | 243 |
| | $ | 225 |
|
| Restricted cash | 6 |
| | 7 |
| 3 |
| | 13 |
|
| Trade receivables (net of allowance for doubtful accounts of $10 and $11) | 163 |
| | 153 |
| |
| Trade receivables (net of allowance for doubtful accounts of $11 and $9) | | 155 |
| | 146 |
|
| Relocation receivables | 250 |
| | 223 |
| 223 |
| | 231 |
|
| Other current assets | 159 |
| | 179 |
| 147 |
| | 153 |
|
| Total current assets | 760 |
| | 789 |
| 771 |
| | 768 |
|
| Property and equipment, net | 281 |
| | 289 |
| 302 |
| | 304 |
|
| Operating lease assets, net | | 544 |
| | — |
|
| Goodwill | 3,711 |
| | 3,710 |
| 3,712 |
| | 3,712 |
|
| Trademarks | 749 |
| | 749 |
| 749 |
| | 749 |
|
| Franchise agreements, net | 1,277 |
| | 1,294 |
| 1,210 |
| | 1,227 |
|
| Other intangibles, net | 276 |
| | 284 |
| 246 |
| | 254 |
|
| Other non-current assets | 271 |
| | 222 |
| 277 |
| | 276 |
|
| Total assets | $ | 7,325 |
| | $ | 7,337 |
| $ | 7,811 |
| | $ | 7,290 |
|
| LIABILITIES AND EQUITY | | | | | | |
| Current liabilities: | | | | | | |
| Accounts payable | $ | 139 |
| | $ | 156 |
| $ | 154 |
| | $ | 147 |
|
| Securitization obligations | 184 |
| | 194 |
| 187 |
| | 231 |
|
| Current portion of long-term debt | 332 |
| | 127 |
| 440 |
| | 748 |
|
| Current portion of operating lease liabilities | | 130 |
| | — |
|
| Accrued expenses and other current liabilities | 426 |
| | 478 |
| 346 |
| | 401 |
|
| Total current liabilities | 1,081 |
| | 955 |
| 1,257 |
| | 1,527 |
|
| Long-term debt | 3,263 |
| | 3,221 |
| 3,335 |
| | 2,800 |
|
| Long-term operating lease liabilities | | 473 |
| | — |
|
| Deferred income taxes | 291 |
| | 327 |
| 352 |
| | 389 |
|
| Other non-current liabilities | 262 |
| | 212 |
| 205 |
| | 259 |
|
| Total liabilities | 4,897 |
| | 4,715 |
| 5,622 |
| | 4,975 |
|
| Commitments and contingencies (Note 8) | | | | |
| Commitments and contingencies (Note 9) | | | | |
| Equity: | | | | | | |
| Realogy Holdings preferred stock: $.01 par value; 50,000,000 shares authorized, none issued and outstanding at March 31, 2018 and December 31, 2017 | — |
| | — |
| |
| Realogy Holdings common stock: $.01 par value; 400,000,000 shares authorized, 128,755,023 shares issued and outstanding at March 31, 2018 and 131,636,870 shares issued and outstanding at December 31, 2017 | 1 |
| | 1 |
| |
| Realogy Holdings preferred stock: $.01 par value; 50,000,000 shares authorized, none issued and outstanding at March 31, 2019 and December 31, 2018 | | — |
| | — |
|
| Realogy Holdings common stock: $.01 par value; 400,000,000 shares authorized, 114,205,678 shares issued and outstanding at March 31, 2019 and 114,620,499 shares issued and outstanding at December 31, 2018 | | 1 |
| | 1 |
|
| Additional paid-in capital | 5,179 |
| | 5,285 |
| 4,841 |
| | 4,869 |
|
| Accumulated deficit | (2,711 | ) | | (2,631 | ) | (2,606 | ) | | (2,507 | ) |
| Accumulated other comprehensive loss | (44 | ) | | (37 | ) | (50 | ) | | (52 | ) |
| Total stockholders' equity | 2,425 |
| | 2,618 |
| 2,186 |
| | 2,311 |
|
| Noncontrolling interests | 3 |
| | 4 |
| 3 |
| | 4 |
|
| Total equity | 2,428 |
| | 2,622 |
| 2,189 |
| | 2,315 |
|
| Total liabilities and equity | $ | 7,325 |
| | $ | 7,337 |
| $ | 7,811 |
| | $ | 7,290 |
|
See Notes to Condensed Consolidated Financial Statements.
7
REALOGY HOLDINGS CORP. AND REALOGY GROUP LLC
CONDENSED CONSOLIDATED STATEMENTS OF CASH FLOWS
(In millions)
(Unaudited)
| | | | Three Months Ended
March 31, | Three Months Ended
March 31, |
| | 2018 | | 2017 | 2019 | | 2018 |
| Operating Activities | | | | | | |
| Net loss | $ | (67 | ) | | $ | (28 | ) | $ | (99 | ) | | $ | (67 | ) |
| Adjustments to reconcile net loss to net cash used in operating activities: | | | | | | |
| Depreciation and amortization | 48 |
| | 50 |
| 49 |
| | 48 |
|
| Deferred income taxes | (28 | ) | | (10 | ) | (37 | ) | | (28 | ) |
| Lease asset impairment | | 1 |
| | — |
|
| Amortization of deferred financing costs and discount | 4 |
| | 4 |
| 3 |
| | 4 |
|
| Loss on the early extinguishment of debt | 7 |
| | 4 |
| 5 |
| | 7 |
|
| Equity in losses of unconsolidated entities | 4 |
| | 3 |
| |
| Equity in (earnings) losses of unconsolidated entities | | (1 | ) | | 4 |
|
| Stock-based compensation | 9 |
| | 12 |
| 8 |
| | 9 |
|
| Mark-to-market adjustments on derivatives | (12 | ) | | (1 | ) | 14 |
| | (12 | ) |
| Other adjustments to net loss | 4 |
| | (1 | ) | — |
| | 4 |
|
| Net change in assets and liabilities, excluding the impact of acquisitions and dispositions: | | | | | | |
| Trade receivables | (8 | ) | | 4 |
| (9 | ) | | (8 | ) |
| Relocation receivables | (27 | ) | | 22 |
| 8 |
| | (27 | ) |
| Other assets | (17 | ) | | (24 | ) | (11 | ) | | (17 | ) |
| Accounts payable, accrued expenses and other liabilities | (45 | ) | | (44 | ) | (34 | ) | | (45 | ) |
| Dividends received from unconsolidated entities | 1 |
| | 1 |
| 1 |
| | 1 |
|
| Other, net | (3 | ) | | (4 | ) | (1 | ) | | (3 | ) |
| Net cash used in operating activities | (130 | ) | | (12 | ) | (103 | ) | | (130 | ) |
| Investing Activities | | | | | | |
| Property and equipment additions | (25 | ) | | (28 | ) | (24 | ) | | (25 | ) |
| Payments for acquisitions, net of cash acquired | — |
| | (1 | ) | |
| Investment in unconsolidated entities | (4 | ) | | (3 | ) | (2 | ) | | (4 | ) |
| Proceeds from investments in unconsolidated entities | 19 |
| | — |
| — |
| | 19 |
|
| Other, net | 1 |
| | (1 | ) | 3 |
| | 1 |
|
| Net cash used in investing activities | (9 | ) | | (33 | ) | (23 | ) | | (9 | ) |
| Financing Activities | | | | | | |
| Net change in revolving credit facility | 232 |
| | 110 |
| |
| Net change in Revolving Credit Facility | | 140 |
| | 232 |
|
| Payments for refinancing of Term Loan B | (4 | ) | | — |
| — |
| | (4 | ) |
| Proceeds from refinancing of Term Loan A & A-1 | 17 |
| | — |
| — |
| | 17 |
|
| Proceeds from issuance of Senior Notes | | 550 |
| | — |
|
| Redemption of Senior Notes | | (450 | ) | | — |
|
| Amortization payments on term loan facilities | (3 | ) | | (10 | ) | (7 | ) | | (3 | ) |
| Net change in securitization obligations | (11 | ) | | (33 | ) | (45 | ) | | (11 | ) |
| Debt issuance costs | (16 | ) | | (6 | ) | (7 | ) | | (16 | ) |
| Cash paid for fees associated with early extinguishment of debt | | (4 | ) | | — |
|
| Repurchase of common stock | (94 | ) | | (57 | ) | (20 | ) | | (94 | ) |
| Dividends paid on common stock | (12 | ) | | (13 | ) | (10 | ) | | (12 | ) |
| Proceeds from exercise of stock options | — |
| | 1 |
| |
| Taxes paid related to net share settlement for stock-based compensation | (9 | ) | | (10 | ) | (6 | ) | | (9 | ) |
| Payments of contingent consideration related to acquisitions | — |
| | (4 | ) | (2 | ) | | — |
|
| Other, net | (7 | ) | | (5 | ) | (5 | ) | | (7 | ) |
| Net cash provided by (used in) financing activities | 93 |
| | (27 | ) | |
| Net cash provided by financing activities | | 134 |
| | 93 |
|
| Effect of changes in exchange rates on cash, cash equivalents and restricted cash | — |
| | 1 |
| — |
| | — |
|
| Net decrease in cash, cash equivalents and restricted cash | (46 | ) | | (71 | ) | 8 |
| | (46 | ) |
| Cash, cash equivalents and restricted cash, beginning of period | 234 |
| | 281 |
| 238 |
| | 234 |
|
| Cash, cash equivalents and restricted cash, end of period | $ | 188 |
| | $ | 210 |
| $ | 246 |
| | $ | 188 |
|
| Supplemental Disclosure of Cash Flow Information | | | | | | |
| Interest payments (including securitization interest of $2 and $1 for the periods presented) | $ | 21 |
| | $ | 24 |
| |
| Interest payments (including securitization interest of $2 for both periods presented) | | $ | 40 |
| | $ | 21 |
|
| Income tax payments, net | 4 |
| | 2 |
| 1 |
| | 4 |
|
See Notes to Condensed Consolidated Financial Statements.
8
REALOGY HOLDINGS CORP. AND REALOGY GROUP LLC
NOTES TO CONDENSED CONSOLIDATED FINANCIAL STATEMENTS
(Unless otherwise noted, all amounts are in millions)
(Unaudited)
Realogy Holdings Corp. ("Realogy Holdings", "Realogy" or the "Company") is a holding company for its consolidated subsidiaries including Realogy Intermediate Holdings LLC ("Realogy Intermediate") and Realogy Group LLC ("Realogy Group") and its consolidated subsidiaries. Realogy, through its subsidiaries, is a global provider of residential real estate services. Neither Realogy Holdings, the indirect parent of Realogy Group, nor Realogy Intermediate, the direct parent company of Realogy Group, conducts any operations other than with respect to its respective direct or indirect ownership of Realogy Group. As a result, the consolidated financial positions, results of operations, comprehensive income and cash flows of Realogy Holdings, Realogy Intermediate and Realogy Group are the same.
The accompanying Condensed Consolidated Financial Statements include the financial statements of Realogy Holdings and Realogy Group. Realogy Holdings' only asset is its investment in the common stock of Realogy Intermediate, and Realogy Intermediate's only asset is its investment in Realogy Group. Realogy Holdings' only obligations are its guarantees of certain borrowings and certain franchise obligations of Realogy Group. All expenses incurred by Realogy Holdings and Realogy Intermediate are for the benefit of Realogy Group and have been reflected in Realogy Group's Condensed Consolidated Financial Statements.
The Condensed Consolidated Financial Statements have been prepared in accordance with accounting principles generally accepted in the United States of America and with Article 10 of Regulation S-X. Interim results may not be indicative of full year performance because of seasonal and short-term variations. The Company has eliminated all material intercompany transactions and balances between entities consolidated in these financial statements. In presenting the Condensed Consolidated Financial Statements, management makes estimates and assumptions that affect the amounts reported and the related disclosures. Estimates, by their nature, are based on judgment and available information. Accordingly, actual results could differ materially from those estimates. Certain reclassifications have been made to prior period amounts to conform to the current period presentation.
In management's opinion, the accompanying unaudited Condensed Consolidated Financial Statements reflect all normal and recurring adjustments necessary for a fair statement of Realogy Holdings and Realogy Group's financial position as of March 31, 20182019 and the results of operations and comprehensive loss for the three months ended March 31, 20182019 and 20172018 and cash flows for the three months ended March 31, 20182019 and 2017.2018. The Consolidated Balance Sheet at December 31, 20172018 was derived from audited annual financial statements but does not contain all of the footnote disclosures from the annual financial statements. The Condensed Consolidated Financial Statements should be read in conjunction with the audited Consolidated Financial Statements and notes thereto included in the Annual Report on Form 10-K for the year ended December 31, 20172018.
As discussed in further detail below under Recently Adopted Accounting Pronouncements, effective January 1, 2019, the Company adopted Accounting Standard Update No. 2016-02 (Topic 842) "Leases". The adoption of this standard is reflected in the amounts and disclosures set forth in this Form 10-Q.
Fair Value Measurements
The following tables present the Company’s assets and liabilities that are measured at fair value on a recurring basis and are categorized using the fair value hierarchy. The fair value hierarchy has three levels based on the reliability of the inputs used to determine fair value.
|
| | |
| Level Input: | | Input Definitions: |
| | | |
| Level I | | Inputs are unadjusted, quoted prices for identical assets or liabilities in active markets at the measurement date. |
| | |
| Level II | | Inputs other than quoted prices included in Level I that are observable for the asset or liability through corroboration with market data at the measurement date. |
| | |
| Level III | | Unobservable inputs that reflect management’s best estimate of what market participants would use in pricing the asset or liability at the measurement date. |
The availability of observable inputs can vary from asset to asset and is affected by a wide variety of factors, including, for example, the type of asset, whether the asset is new and not yet established in the marketplace, and other characteristics particular to the transaction. To the extent that valuation is based on models or inputs that are less observable or unobservable in the market, the determination of fair value requires more judgment. Accordingly, the degree of judgment
exercised by the Company in determining fair value is greatest for instruments categorized in Level III. In certain cases, the inputs used to measure fair value may fall into different levels of the fair value hierarchy. In such cases, for disclosure purposes, the level in the fair value hierarchy within which the fair value measurement in its entirety falls is determined based on the lowest level input that is significant to the fair value measurement in its entirety.
The fair value of financial instruments is generally determined by reference to quoted market values. In cases where quoted market prices are not available, fair value is based on estimates using present value or other valuation techniques, as appropriate. The fair value of interest rate swaps is determined based upon a discounted cash flow approach.
The Company measures financial instruments at fair value on a recurring basis and recognizes transfers within the fair value hierarchy at the end of the fiscal quarter in which the change in circumstances that caused the transfer occurred.
The following table summarizes fair value measurements by level at March 31, 20182019 for assets and liabilities measured at fair value on a recurring basis:
| | | | Level I | | Level II | | Level III | | Total | Level I | | Level II | | Level III | | Total |
| Deferred compensation plan assets (included in other non-current assets) | $ | 3 |
| | $ | — |
| | $ | — |
| | $ | 3 |
| $ | 2 |
| | $ | — |
| | $ | — |
| | $ | 2 |
|
| Interest rate swaps (included in other non-current assets) | — |
| | 9 |
| | — |
| | 9 |
| — |
| | 1 |
| | — |
| | 1 |
|
| Interest rate swaps (included in other non-current liabilities) | — |
| | 6 |
| | — |
| | 6 |
| — |
| | 26 |
| | — |
| | 26 |
|
| Contingent consideration for acquisitions (included in accrued expenses and other current liabilities and other non-current liabilities) | — |
| | — |
| | 34 |
| | 34 |
| — |
| | — |
| | 7 |
| | 7 |
|
The following table summarizes fair value measurements by level at December 31, 20172018 for assets and liabilities measured at fair value on a recurring basis:
|
| | | | | | | | | | | | | | | |
| | Level I | | Level II | | Level III | | Total |
| Deferred compensation plan assets (included in other non-current assets) | $ | 2 |
| | $ | — |
| | $ | — |
| | $ | 2 |
|
| Interest rate swaps (included in other non-current assets) | — |
| | 6 |
| | — |
| | 6 |
|
| Interest rate swaps (included in other non-current liabilities) | — |
| | 16 |
| | — |
| | 16 |
|
| Contingent consideration for acquisitions (included in accrued expenses and other current liabilities and other non-current liabilities) | — |
| | — |
| | 10 |
| | 10 |
|
|
| | | | | | | | | | | | | | | |
| | Level I | | Level II | | Level III | | Total |
| Deferred compensation plan assets (included in other non-current assets) | $ | 3 |
| | $ | — |
| | $ | — |
| | $ | 3 |
|
| Interest rate swaps (included in other current and non-current liabilities) | — |
| | 13 |
| | — |
| | 13 |
|
| Contingent consideration for acquisitions (included in accrued expenses and other current liabilities and other non-current liabilities) | — |
| | — |
| | 34 |
| | 34 |
|
The fair value of the Company’s contingent consideration for acquisitions is measured using a probability weighted-average discount rate to estimate future cash flows based upon the likelihood of achieving future operating results for individual acquisitions. These assumptions are deemed to be unobservable inputs and as such the Company’s contingent consideration is classified within Level III of the valuation hierarchy. The Company reassesses the fair value of the contingent consideration liabilities on a quarterly basis.
The following table presents changes in Level III financial liabilities measured at fair value on a recurring basis:
|
| | | | |
| | | Level III |
| Fair value of contingent consideration at December 31, 2018 | | $ | 10 |
|
| Additions: contingent consideration related to acquisitions completed during the period | | — |
|
| Reductions: payments of contingent consideration | | (3 | ) |
| Changes in fair value (reflected in the Condensed Consolidated Statement of Operations) | | — |
|
| Fair value of contingent consideration at March 31, 2019 | | $ | 7 |
|
The following table summarizes the principal amount of the Company’s indebtedness compared to the estimated fair value, primarily determined by quoted market values, at:
| | | | March 31, 2018 | | December 31, 2017 | March 31, 2019 | | December 31, 2018 |
| Debt | Principal Amount | | Estimated
Fair Value (a) | | Principal Amount | | Estimated
Fair Value (a) | Principal Amount | | Estimated
Fair Value (a) | | Principal Amount | | Estimated
Fair Value (a) |
| Senior Secured Credit Facility: | | | | | | | | | | | | | | |
| Revolving Credit Facility | $ | 302 |
| | $ | 302 |
| | $ | 70 |
| | $ | 70 |
| $ | 410 |
| | $ | 410 |
| | $ | 270 |
| | $ | 270 |
|
| Term Loan B | 1,077 |
| | 1,083 |
| | 1,083 |
| | 1,085 |
| 1,067 |
| | 1,035 |
| | 1,069 |
| | 1,010 |
|
| Term Loan A Facility: | | | | | | | | | | | | | | |
| Term Loan A | 750 |
| | 750 |
| | 391 |
| | 393 |
| 731 |
| | 721 |
| | 736 |
| | 707 |
|
| Term Loan A-1 | — |
| | — |
| | 342 |
| | 343 |
| |
| 4.50% Senior Notes | 450 |
| | 452 |
| | 450 |
| | 457 |
| — |
| | — |
| | 450 |
| | 447 |
|
| 5.25% Senior Notes | 550 |
| | 553 |
| | 550 |
| | 569 |
| 550 |
| | 554 |
| | 550 |
| | 524 |
|
| 4.875% Senior Notes | 500 |
| | 479 |
| | 500 |
| | 495 |
| 500 |
| | 466 |
| | 500 |
| | 434 |
|
| 9.375% Senior Notes | | 550 |
| | 565 |
| | — |
| | — |
|
| Securitization obligations | 184 |
| | 184 |
| | 194 |
| | 194 |
| 187 |
| | 187 |
| | 231 |
| | 231 |
|
_______________
| |
| (a) | The fair value of the Company's indebtedness is categorized as Level II. |
Equity Method Investments
At March 31, 20182019 and December 31, 2017,2018, the Company had various equity method investments aggregating $55$54 million and $74$51 million, respectively, which are recorded within other non-current assets on the accompanying Condensed Consolidated Balance Sheets. The $55 million investment balancebalances at March 31, 2019 and December 31, 2018 included $47$46 million and $43 million, respectively, for the Company's investment in Guaranteed Rate Affinity, LLC ("Guaranteed Rate Affinity"). The Company's interest in PHH Home Loans, LLC ("PHH Home Loans") was sold to a subsidiary of PHH Corporation in
For the first quarter of 2018 and2019, the Company received net cash proceedsrecorded equity earnings of $19$1 million reducingat the investment balanceTitle and Settlement Services segment primarily related to zero. The $74 million investment balance at December 31, 2017 included $48 million forearnings from the Company's investment inoperations of Guaranteed Rate Affinity and $19 million for the Company's investment in PHH Home Loans.
Affinity. For the first quarter of 2018, the Company recorded equity losses of $4 million at the Title and Settlement Services segment primarily related to costs associated with the ramp up of operations of Guaranteed Rate Affinity, including $2 million of amortization of intangible assets recorded in purchase accounting. For the first quarter of 2017, the Company recorded equity losses of $3 million primarily related to its investment in PHH Home Loans.
The Company received $1 million ofin cash dividends from equity method investments during both the three months ended March 31, 20182019 and 2017.2018. The Company invested an additional$2 million and $4 million of cash into Guaranteed Rate Affinity during the three months ended March 31, 2018.2019 and 2018, respectively.
Income Taxes
The Company's provision for income taxes in interim periods is computed by applying its estimated annual effective tax rate against the income before income taxes for the period. In addition, non-recurring or discrete items are recorded in the period in which they occur. The provision for income taxes was a benefit of $19$35 million and $9$19 million for the three months ended March 31, 2019 and 2018, and 2017, respectively. There were no changes to the net benefit recorded during the year ended December 31, 2017 relating to the 2017 Tax Act which was a provisional amount that reflected the Company’s reasonable estimate at the time.
Derivative Instruments
The Company records derivatives and hedging activities on the balance sheet at their respective fair values. The Company uses foreign currency forward contracts largely to manage its exposure to changes in foreign currency exchange rates associated with its foreign currency denominated receivables and payables. The Company primarily manages its foreign currency exposure to the Euro, Swiss Franc, British Pound Swiss Franc and Canadian Dollar. The Company has not elected to utilize hedge accounting for these forward contracts; therefore, any change in fair value is recorded in the Condensed Consolidated Statements of Operations. However, the fluctuations in the value of these forward contracts generally offset the impact of changes in the value of the underlying risk that they are intended to economically hedge. As of March 31, 2018,2019, the Company had outstanding foreign currency forward contracts in an asset position with a fair value of less than $1 million and a notional value of $26$25 million. As of December 31, 2017,2018, the Company had outstanding foreign currency forward contracts in a liability position with a fair value of less than $1 million and a notional value of $25$27 million.
The Company also enters into interest rate swaps to manage its exposure to changes in interest rates associated with its variable rate borrowings. Interest rate swaps with a notional value of $425 million expired February 10, 2018. As of March 31, 2018,2019, the Company had interest rate swaps with an aggregate notional value of $1,050$1,600 million to offset the variability in cash flows resulting from the term loan facilities as follows:
|
| | | | |
| Notional Value (in millions) | | Commencement Date | | Expiration Date |
| $600 | | August 2015 | | August 2020 |
| $450 | | November 2017 | | November 2022 |
| $400 |
| August 2020 | | August 2025 |
| $150 |
| November 2022 | | November 2027 |
The swaps help to protect our outstanding variable rate borrowings from future interest rate volatility. The Company has not elected to utilize hedge accounting for these interest rate swaps; therefore, any change in fair value is recorded in the Condensed Consolidated Statements of Operations.
The fair value of derivative instruments was as follows:
|
| | | | | | | | | | |
| Not Designated as Hedging Instruments | | Balance Sheet Location | | March 31, 2019 | | December 31, 2018 |
| Interest rate swap contracts | | Other non-current assets | | $ | 1 |
| | $ | 6 |
|
| | Other current and non-current liabilities | | 26 |
| | 16 |
|
|
| | | | | | | | | | |
| Not Designated as Hedging Instruments | | Balance Sheet Location | | March 31, 2018 | | December 31, 2017 |
| Interest rate swap contracts | | Other non-current assets | | $ | 9 |
| | $ | — |
|
| | Other current and non-current liabilities | | 6 |
| | 13 |
|
The effect of derivative instruments on earnings was as follows:
|
| | | | | | | | | | |
| Derivative Instruments Not Designated as Hedging Instruments | | Location of (Gain) or Loss Recognized for Derivative Instruments | | (Gain) or Loss Recognized on Derivatives |
| Three Months Ended March 31, |
| | 2019 | | 2018 |
| Interest rate swap contracts | | Interest expense | | $ | 14 |
| | $ | (12 | ) |
|
| | | | | | | | | | |
| Derivative Instruments Not Designated as Hedging Instruments | | Location of Gain Recognized for Derivative Instruments | | Gain Recognized on Derivatives |
| Three Months Ended March 31, |
| | 2018 | | 2017 |
| Interest rate swap contracts | | Interest expense | | $ | (12 | ) | | $ | (1 | ) |
Restricted Cash
Restricted cash primarily relates to amounts specifically designated as collateral for the repayment of outstanding borrowings under the Company’s securitization facilities. Such amounts approximated $6$3 million and $7$13 million at March 31, 20182019 and December 31, 2017, respectively.
Supplemental Cash Flow Information
Significant non-cash transactions during the three months ended March 31, 2018 and 2017 included capital lease additions of $4 million and $5 million, respectively, which resulted in non-cash additions to property and equipment, net and other non-current liabilities.
Stock-Based Compensation
During the three months endedMarch 31, 2018, the Company granted 0.4 million shares of non-qualified stock options for a weighted exercise price of $25.35 and 1.1 million shares of restricted stock units ("RSUs") at a weighted average grant date fair value of $25.45.
Effective March 1, 2018, the Board approved, subject to stockholder approval at the 2018 Annual Meeting, the Realogy Holdings Corp. 2018 Long-Term Incentive Plan, as amended (the "2018 LTIP"). Options and RSUs included in the 2018 LTIP were granted on March 1, 2018. In addition to these awards, RSUs and PSUs aggregating 0.8 million shares were also awarded on March 1, 2018, but the grant was subject to approval of the 2018 LTIP at the 2018 Annual Meeting of Stockholders held on May 2, 2018. The stockholders approved the 2018 LTIP at the May 2, 2018 Annual Meeting and the Company will accordingly treat May 2, 2018 as the grant date for these awards and expense those awards from that date over the balance of the vesting or performance period.
Stock Repurchases
The Company may repurchase shares of its common stock under authorizations made from its Board of Directors. Shares repurchased are retired and not displayed separately as treasury stock on the consolidated financial statements. The par value of the shares repurchased and retired is deducted from common stock and the excess of the purchase price over par value is first charged against any available additional paid-in capital with the balance charged to retained earnings. Direct costs incurred to repurchase the shares are included in the total cost of the shares.
The Company's Board of Directors authorized a share repurchase program of up to $275 million, $300 million and $350 million of the Company's common stock in February 2016, 2017 and 2018, respectively.
As of March 31, 2018, the Company had repurchased and retired 20.2 million shares of common stock for an aggregate of $275 million under the February 2016 share repurchase program and $299 million under the February 2017 share repurchase program at a total weighted average market price of $28.36 per share, including 3.7 million shares of common stock repurchased during the first quarter of 2018 for $99 million at a weighted average market price of $26.58 per share. As of March 31, 2018, $351 million remained available for repurchase under the share repurchase programs.
Dividend Policy
In August 2016, the Company’s Board of Directors approved the initiation of a quarterly cash dividend policy of $0.09 per share on its common stock. The Board declared and paid a quarterly cash dividend of $0.09 per share of the Company’s common stock during the first quarter of 2018.
The declaration and payment of any future dividend will be subject to the discretion of the Board of Directors and will depend on a variety of factors, including the Company’s financial condition and results of operations, contractual restrictions, including restrictive covenants contained in the Company’s credit agreements, and the indentures governing the Company’s outstanding debt securities, capital requirements and other factors that the Board of Directors deems relevant.
Pursuant to the Company’s policy, the dividends payable in cash are treated as a reduction of additional paid-in capital since the Company is currently in a retained deficit position.
Recently Adopted Accounting Pronouncements
In May 2014, the FASB issued Accounting Standards Update No. 2014-09 (Topic 606) "Revenue from Contracts with Customers" (the "new revenue standard"). The objective of the new revenue standard is to provide a single, comprehensive revenue recognition model for all contracts with customers to improve comparability within industries, across industries, and across capital markets. The new revenue standard contains principles that an entity will apply to determine the measurement of revenue and the timing of revenue recognition. The Company rewrote its current revenue recognition accounting policies based on the five-step model provided in the new revenue standard, assessed the redesign of internal controls, as well as evaluated the expanded disclosure requirements. After a review of the Company's revenue streams, the Company determined that the new revenue standard did not have a material impact on financial results as the majority of the Company's revenue is recognized at the completion of a homesale transaction which did not result in a change in the timing of recognition of revenue transactions under the new revenue standard. The Company adopted the new revenue standard on January 1, 2018 using the modified retrospective transition method in which the cumulative effect of applying the new revenue standard was recognized as an adjustment to the opening balance of retained earnings. See Note 2, "Revenue Recognition" for further details.
In February 2018, the FASB issued a new standard which permits companies to reclassify certain income tax effects resulting from the 2017 Tax Act, called "stranded tax effects", from accumulated other comprehensive income ("AOCI") to retained earnings. According to the new guidance, the reclassification amount should include the effect of the change in the U.S. federal corporate income tax rate on the gross deferred tax amounts and related valuation allowances, if any, at the date of enactment of the 2017 Tax Act related to items remaining in AOCI. The guidance is effective for all companies for fiscal years beginning after December 15, 2018, and interim periods within those fiscal years, with early adoption is permitted. The Company early adopted this standard in the first quarter of 2018 which resulted in a debit to Accumulated other comprehensive loss and a credit to Accumulated deficit for $9 million. The Company’s accounting policy for releasing income tax effects from AOCI is to release those effects when our entire portfolio of the type of item is liquidated.
Recently Issued Accounting Pronouncements
The Company considers the applicability and impact of all Accounting Standards Updates. ASUs not listed below were assessed and determined to be either not applicable or are expected to have minimal impact on our consolidated financial position or results of operations.
In February 2016, the FASB issued its new standard on leases which requires virtually all leases to be recognized on the balance sheet. Lessees will recognize a right-of-use asset and a lease liability for all leases (other than leases that meet the definition of a short-term lease). The liability will be equal to the present value of lease payments. The asset will be based on the liability, subject to adjustment, such as for initial direct costs. For income statement purposes, the FASB retained a dual model, requiring leases to be classified as either operating or finance leases. Operating leases will result in straight-line expense, similar to current operating leases, while finance leases will result in a front-loaded expense pattern, similar to current capital leases. Classification will be based on criteria that are largely similar to those applied in current lease accounting, but without explicit bright lines. The new standard is effective for annual periods beginning after December 15, 2018. Early adoption is permitted. The new leasing standard requires modified retrospective transition, which requires application of the new guidance at the beginning of the earliest comparative period presented in the year of adoption. In January 2018, the FASB issued a proposed ASU that would allow entities to elect a simplified transition approach which would require applying the provisions of the new guidance at the effective date (e.g., January 1, 2019) as opposed to the earliest period presented under the modified retrospective approach (January 1, 2017). While the Company is still evaluating the impact of the standard on its consolidated financial statements, it does expect that the right to use asset and lease liability recorded on its Consolidated Balance Sheets will be material. The Company disclosed its future lease obligations in Note 13. "Commitments and Contingencies" of the Annual Report on Form 10-K for the year ended December 31, 2017. The Company is in the process of evaluating its policies and internal controls as well as implementing a new lease management system which will be utilized to account for leases under the new guidance once adopted.
Adoption of the New Revenue Standard
Effective January 1, 2018, the Company adopted the new revenue standard using the modified retrospective method. Results for reporting periods beginning after January 1, 2018 are presented under the new revenue standard; however, the comparative prior period amounts have not been restated and continue to be reported in accordance with historic accounting under ASC Topic 605. The majority of the Company's revenue continues to be recognized at the completion of a homesale transaction under the new revenue standard, however as a result of the adoption the Company recognized additional contract liabilities and deferred assets associated with certain other revenue streams. As of January 1, 2018, the Company recorded a net debit to its opening Accumulated deficit of $22 million, net of tax, due to the cumulative impact of adopting the new revenue standard, with the impact primarily related to the recognition of additional contract liabilities for initial area development fees and deferred assets for prepaid commissions.
Contract Liabilities for Initial Area Development Fees ("ADF"):
Contract liabilities are recorded when cash payments are received or due in advance of the Company's performance. The Company records these as deferred revenues and are classified as current or non-current liabilities in the Condensed Consolidated Balance Sheets based on the expected timing of revenue recognition.
The Real Estate Franchise Services segment collects an initial ADF for international territory transactions, which are recorded as deferred revenue when received and recognized into revenue over the term of the agreement, typically 25 years, as consideration for the right to access and benefit from Realogy’s brands. ADFs were recognized as revenue upfront when received under historical guidance.
Prepaid Commissions:
The incremental direct costs of obtaining a contract, which primarily consist of franchise sales commissions, are deferred and amortized generally over the estimated life of the customer relationship for domestic and international contracts. The Company classifies prepaid commissions as current or non-current assets in the Condensed Consolidated Balance Sheets based on the expected timing of recognizing expense.
The Real Estate Franchise Services segment recognizes a deferred asset for commissions paid to Realogy franchise sales employees upon the sale of a new franchise. The amount of commissions is calculated as a percentage of the anticipated gross commission income of the new franchisee or the amount of the ADF and is amortized over the estimated life of franchise customer relationships, 30 years for domestic franchise agreements, or the agreement term for international franchise agreements which is generally 25 years. Franchise sales commissions were expensed upfront when paid under historical guidance.
Practical Expedients and Exemptions:
The Company elected to apply the practical expedient that only requires the Company to apply the revenue standard to contracts that were open as of the beginning of the earliest period presented which impacted the amount of prepaid commissions capitalized.
The majority of the Company's contracts are transactional in nature or have a duration of one-year or less. Accordingly, the Company does not disclose the value of unsatisfied performance obligations for contracts with an original expected length of one year or less.
The cumulative effect of the changes made to the Condensed Consolidated Balance Sheets for the adoption of the new revenue standard were as follows:
|
| | | | | | | | | | | |
| | Balance Sheet accounts prior to the new revenue standard adoption adjustments | | Adjustments due to the adoption of the new revenue standard | | Balance Sheet accounts after the new revenue standard adoption adjustments |
| ASSETS | | | | | |
| Current assets: | | | | | |
| Trade receivables | $ | 153 |
| | $ | 1 |
| | $ | 154 |
|
| Other current assets | 179 |
| | 2 |
| | 181 |
|
| Total current assets | 789 |
| | 3 |
| | 792 |
|
| Other non-current assets | 222 |
| | 23 |
| | 245 |
|
| Total assets | $ | 7,337 |
| | $ | 26 |
| | $ | 7,363 |
|
| | | | | | |
| LIABILITIES AND EQUITY | | | | | |
| Current liabilities: | | | | | |
| Accrued expenses and other current liabilities | $ | 478 |
| | $ | 2 |
| | $ | 480 |
|
| Total current liabilities | 955 |
| | 2 |
| | 957 |
|
| Deferred income taxes | 327 |
| | (8 | ) | | 319 |
|
| Other non-current liabilities | 212 |
| | 54 |
| | 266 |
|
| Total liabilities | 4,715 |
| | 48 |
| | 4,763 |
|
| Equity: | | | | | |
| Accumulated deficit (a) | (2,622 | ) | | (22 | ) | | (2,644 | ) |
| Accumulated other comprehensive loss (a) | (46 | ) | | — |
| | (46 | ) |
| Total stockholders' equity | 2,618 |
| | (22 | ) | | 2,596 |
|
| Total equity | 2,622 |
| | (22 | ) | | 2,600 |
|
| Total liabilities and equity | $ | 7,337 |
| | $ | 26 |
| | $ | 7,363 |
|
_______________ | |
(a) | Beginning balances have been adjusted for the adoption of the accounting standard update on stranded tax effects related to the 2017 Tax Act which resulted in a debit to Accumulated other comprehensive loss and a credit to Accumulated deficit of $9 million. See Note 1, "Basis of Presentation" in the "Recently Adopted Accounting Pronouncements" section for additional information. |
The impact of adopting the new revenue standard, as compared to historic guidance under ASC Topic 605, was immaterial to the Company's Condensed Consolidated Financial Statements as of and for the period ended March 31, 2018.
Revenue Recognition
Revenue is recognized upon the transfer of control of promised services to customers in an amount that reflects the consideration the Company expects to receive in exchange for those services in accordance with the new revenue standard. The Company's revenue is disaggregated by major revenue categories on our Condensed Consolidated Statements of Operations and further disaggregated by business segment as follows:
|
| | | | | | | | | | | | | | | | | | | | | | | |
| | Three Months Ended March 31, 2018 |
| | Real Estate
Franchise
Services | | Company
Owned
Brokerage
Services | | Relocation
Services | | Title and
Settlement
Services | | Corporate and Other | | Total
Company |
| Gross commission income (a) | $ | — |
| | $ | 902 |
| | $ | — |
| | $ | — |
| | $ | — |
| | $ | 902 |
|
| Service revenue (b) | — |
| | 2 |
| | 78 |
| | 117 |
| | — |
| | 197 |
|
| Franchise fees (c) | 139 |
| | — |
| | — |
| | — |
| | (60 | ) | | 79 |
|
| Other (d) | 37 |
| | 13 |
| | 1 |
| | 3 |
| | (3 | ) | | 51 |
|
| Net revenues | $ | 176 |
| | $ | 917 |
| | $ | 79 |
| | $ | 120 |
| | $ | (63 | ) | | $ | 1,229 |
|
| | | | | | | | | | | | | | | | Three Months Ended March 31, |
| | Three Months Ended March 31, 2017 (e) | Real Estate
Franchise
Services | | Company
Owned
Brokerage
Services | | Relocation
Services | | Title and
Settlement
Services | | Corporate and Other | | Total
Company |
| | Real Estate
Franchise
Services | | Company
Owned
Brokerage
Services | | Relocation
Services | | Title and
Settlement
Services | | Corporate and Other | | Total
Company | 2019 | | 2018 | | 2019 | | 2018 | | 2019 | | 2018 | | 2019 | | 2018 | | 2019 | | 2018 | | 2019 | | 2018 |
| Gross commission income (a) | $ | — |
| | $ | 881 |
| | $ | — |
| | $ | — |
| | $ | — |
| | $ | 881 |
| $ | — |
| | $ | — |
| | $ | 799 |
| | $ | 902 |
| | $ | — |
| | $ | — |
| | $ | — |
| | $ | — |
| | $ | — |
| | $ | — |
| | $ | 799 |
| | $ | 902 |
|
| Service revenue (b) | — |
| | 2 |
| | 76 |
| | 116 |
| | — |
| | 194 |
| — |
| | — |
| | 2 |
| | 2 |
| | 75 |
| | 78 |
| | 111 |
| | 117 |
| | — |
| | — |
| | 188 |
| | 197 |
|
| Franchise fees (c) | 134 |
| | — |
| | — |
| | — |
| | (59 | ) | | 75 |
| 123 |
| | 139 |
| | — |
| | — |
| | — |
| | — |
| | — |
| | — |
| | (53 | ) | | (60 | ) | | 70 |
| | 79 |
|
| Other (d) | 36 |
| | 14 |
| | 1 |
| | 4 |
| | (2 | ) | | 53 |
| 40 |
| | 37 |
| | 15 |
| | 13 |
| | 1 |
| | 1 |
| | 3 |
| | 3 |
| | (2 | ) | | (3 | ) | | 57 |
| | 51 |
|
| Net revenues | $ | 170 |
| | $ | 897 |
| | $ | 77 |
| | $ | 120 |
| | $ | (61 | ) | | $ | 1,203 |
| $ | 163 |
| | $ | 176 |
| | $ | 816 |
| | $ | 917 |
| | $ | 76 |
| | $ | 79 |
| | $ | 114 |
| | $ | 120 |
| | $ | (55 | ) | | $ | (63 | ) | | $ | 1,114 |
| | $ | 1,229 |
|
_______________
| |
| (a) | During both the three months ended March 31, 2018 and March 31, 2017, approximately 74%Consists primarily of the Company's total net revenues related to gross commission income at the Company Owned Brokerage Services segment which is recognized at a point in time at the closing of a homesale transaction. |
| |
| (b) | During both the three months ended March 31, 2018 and March 31, 2017, approximately 16% of the Company's total net revenues related to service feesService revenue primarily consistingconsists of title and escrow fees at the Title and Settlement Services segment, (10%), which are recognized at a point in time at the closing of a homesale transaction, and relocation fees at the Relocation Services segment, (6%), which are recognized as revenue when or as the related performance obligation is satisfied, which is dependent on the type of service performed. Relocation fees at the Relocation Services segment primarily include: (i) referral fees which are recognized at a point in time at the closing of a homesale transaction, (ii) outsourcing fees, which are management fees charged to clients frequently related to a bundle of relocation services performed and are recognized over the average time period to complete a move, and (iii) referral commissions from third party suppliers which are recognized at the time of the completion of the related service.
|
| |
| (c) | During both the three months ended March 31, 2018 and March 31, 2017, approximately 6% of the Company's total net revenues related to franchiseFranchise fees at the Real Estate Franchise Services segment primarily include domestic royalties which are recognized at a point in time when the underlying franchisee revenue is earned (upon close of the homesale transaction). |
| |
| (d) | During both the three months ended March 31, 2018 and March 31, 2017, approximately 4% of the Company's total net revenues related to otherOther revenue whichis comprised of brand marketing funds received at the Real Estate Franchise Services segment from franchisees, third-party listing fees and other miscellaneous revenues across all of the business segments. |
| |
(e) | Prior period amounts have not been adjusted under the modified retrospective method. |
The Company's revenue streams are discussed further below by business segment:
Real Estate Franchise Services
The Company franchises its real estate brands to real estate brokerage businesses that are independently owned and operated. Franchise revenue principally consists of royalty and marketing fees from the Company’s franchisees. The royalty received is primarily based on a percentage of the franchisee’s gross commission income. Royalty fees are accrued as the underlying franchisee revenue is earned (upon close of the homesale transaction). Annual volume incentives given to certain franchisees on royalty fees are recorded as a reduction to revenue and are accrued for in relative proportion to the recognition of the underlying gross franchise revenue. Non-standard sales incentives are recorded as a reduction to revenue ratably over the related performance period or from the date of issuance through the remaining life of the related franchise agreement. Franchise revenue also includes initial franchise fees which are generally non-refundable and recognized by the Company as revenue upon the execution or opening of a new franchisee office to cover the upfront costs associated with opening the franchisee for business under one of Realogy’s brands.
The Company also earns marketing fees from its franchisees and utilizes such fees to fund marketing campaigns on behalf of its franchisees. As such, brand marketing fund fees are recorded as deferred revenue when received and recognized into revenue as earned when these funds are spent on marketing activities. The balance for deferred brand marketing fund fees decreased from $13 million at January 1, 2018 to $9 million at March 31, 2018 primarily due to amounts recognized into revenue matching expenses for marketing activities partially offset by additional fees received from franchisees during the first quarter of 2018.
The Company collects initial ADFs for international territory transactions, which are recorded as deferred revenue when received and recognized into revenue over the average 25 year life of the related franchise agreement as consideration for the right to access and benefit from Realogy’s brands. The balance for deferred ADFs decreased from $58 million at January 1, 2018 to $57 million at March 31, 2018 due to revenues recognized during the first quarter of 2018 that were included in the deferred revenue balance at the beginning of the period. There were no additional initial area development fees received during the three months ended March 31, 2018.
The Real Estate Franchise Services segment records deferred income related to various other revenue contracts. The balance of other deferred income increased from $8 million at January 1, 2018 to $9 million at March 31, 2018 as a result of cash payments received or due during the first quarter of 2018 partially offset by revenues recognized as the performance obligations were satisfied.
In addition, the Company recognizes a deferred asset for commissions paid to Realogy franchise sales employees upon the sale of a new franchise as these are considered costs of obtaining a contract with a customer that are expected to provide benefits to the Company for longer than one year. The amount of commissions is calculated as a percentage of the anticipated gross commission income of the new franchisee or ADF and is amortized over 30 years for domestic franchise agreements or the agreement term for international franchise agreements (generally 25 years).
Company Owned Real Estate Brokerage Services
As an owner-operator of real estate brokerages, the Company assists home buyers and sellers in listing, marketing, selling and finding homes. Real estate commissions earned by the Company’s real estate brokerage business are recorded as revenue at a point in time which is upon the closing of a real estate transaction (i.e., purchase or sale of a home). These revenues are referred to as gross commission income. The commissions the Company pays to real estate agents are recognized concurrently with associated revenues and presented as the commission and other agent-related costs line item on the accompanying Condensed Consolidated Statements of Operations.
The Company has relationships with developers, primarily in major cities, to provide marketing and brokerage services in new developments. New development closings generally have a development period of between 18 and 24 months from contracted date to closing. In some cases, the Company receives advanced commissions which are recorded as deferred revenue when received and recognized as revenue when the new development closes. The balance of advanced commissions related to developments at January 1, 2018 was a liability of $10 million which increased $2 million related to additional commissions received for new developments and decreased $2 million due to revenues recognized on units closed during the three months ended March 31, 2018. The balance of advance commissions related to developments was $10 million at March 31, 2018.
Relocation Services
The Company provides relocation services to corporate and government clients for the transfer of their employees ("transferees"). Such services include homesale assistance including the purchasing and/or selling of a transferee’s home and providing home equity advances to transferees (generally guaranteed by the individual's employer), arranging household goods moving services, and other relocation services such as expense processing, relocation policy counseling, relocation-related accounting, coordinating visa and immigration support, intercultural and language training and destination services. In the majority of relocation transactions, the gain or loss on the sale of a transferee’s home is generally borne by the individual's employer. Clients may pay an outsourcing management fee that can cover several of the relocation services listed above, according to the clients' specific needs. In addition, the Company provides home buying and selling assistance to members of Affinity organizations.
The Company earns referral commission revenue primarily from real estate brokers for the home sale and purchase of transferees and Affinity members, which is recognized at a point in time when the underlying property closes, and revenues from other third-party service providers where the Company earns a referral commission, which is recognized at the point in time at the completion of services. Furthermore, the Company generally earns interest income on the funds it advances on behalf of the transferring employee, which is recorded within other revenue (as is the corresponding interest expense on the securitization obligations) in the accompanying Condensed Consolidated Statements of Operations.
The Company earns revenues from outsourcing management fees charged to clients for the performance and facilitation of relocation services. Outsourcing management fees are recorded as deferred revenue when billed (usually at the start of the relocation) and are recognized as revenue over the average time period required to complete the transferee's move, or a phase of the move that the fee covers, which is typically 3 to 6 months depending on the move type. The balance for outsourcing management fees increased from $5 million on January 1, 2018 to $6 million on March 31, 2018. The increase was primarily due to additions of $13 million during the first quarter of 2018 primarily related to new management fees billed on new relocation files in the first quarter of 2018, in advance of the Company satisfying its performance obligation, partially offset by a $12 million decrease as a result of revenues recognized during the first quarter of 2018 as the performance obligations were satisfied.
The Relocation Services segment manages the Cartus Broker Network, which is a network of real estate brokers consisting of our company owned brokerage operations, select franchisees and independent real estate brokers who have been approved to become members. Network fees are billed in the fourth quarter of the previous year for the following year's membership and recognized into revenue on a straight-line basis each month during the membership period. The balance for Cartus Broker Membership decreased from $8 million at January 1, 2018 to $6 million at March 31, 2018 primarily due to $3 million of revenues recognized during the first quarter of 2018 that were included in the deferred revenue balance at the beginning of the period.
Title and Settlement Services
The Company provides title and closing services, which include title search procedures for title insurance policies, homesale escrow and other closing services. Title revenues, which are recorded net of amounts remitted to third-party insurance underwriters, and title and closing service fees are recorded at a point in time which occurs at the time a homesale transaction or refinancing closes. The Company also owns an underwriter of title insurance. For independent title agents, the underwriter recognizes policy premium revenue on a gross basis (before deduction of agent commission) upon notice of policy issuance from the agent. For affiliated title agents, the underwriter recognizes the incremental policy premium revenue upon the effective date of the title policy as the agent commission revenue is already recognized by the affiliated title agent.
Contract Balances (Deferred Revenue)
The following table shows the change in the Company's contract liabilities (deferred revenue) related to revenue contracts by reportable segment for the period:
|
| | | | | | | | | | | | | | | |
| | Three Months Ended March 31, 2018 |
| | Beginning Balance at January 1, 2018 | | Additions during the period | | Recognized as Revenue during the period | | Ending Balance at March 31, 2018 |
| Real Estate Franchise Services (a) | $ | 79 |
| | $ | 30 |
| | $ | (34 | ) | | $ | 75 |
|
| Company Owned Real Estate Brokerage Services | 17 |
| | 3 |
| | (4 | ) | | 16 |
|
| Relocation Services | 18 |
| | 19 |
| | (19 | ) | | 18 |
|
| Total | $ | 114 |
| | $ | 52 |
| | $ | (57 | ) | | $ | 109 |
|
|
| | | | | | | | | | | | | | | |
| | Beginning Balance at January 1, 2019 | | Additions during the period | | Recognized as Revenue during the period | | Ending Balance at March 31, 2019 |
| Real Estate Franchise Services: | | | | | | | |
| Deferred area development fees (a) | $ | 54 |
| | $ | — |
| | $ | (1 | ) | | $ | 53 |
|
| Deferred brand marketing fund fees (b) | 12 |
| | 23 |
| | (27 | ) | | 8 |
|
| Other deferred income related to revenue contracts | 12 |
| | 10 |
| | (12 | ) | | 10 |
|
| Total Real Estate Franchise Services | 78 |
| | 33 |
| | (40 | ) | | 71 |
|
| Company Owned Real Estate Brokerage Services: | | | | | | | |
| Advanced commissions relates to its development business (c) | 10 |
| | — |
| | — |
| | 10 |
|
| Other deferred income related to revenue contracts | 4 |
| | 2 |
| | (2 | ) | | 4 |
|
| Total Company Owned Real Estate Brokerage Services | 14 |
| | 2 |
| | (2 | ) | | 14 |
|
| Relocation Services: | | | | | | | |
| Deferred broker network fees (d) | — |
| | 8 |
| | (3 | ) | | 5 |
|
| Deferred outsourcing fees (e) | 4 |
| | 16 |
| | (14 | ) | | 6 |
|
| Other deferred income related to revenue contracts | 5 |
| | 5 |
| | (4 | ) | | 6 |
|
| Total Relocation Services | 9 |
| | 29 |
| | (21 | ) | | 17 |
|
| Total | $ | 101 |
| | $ | 64 |
| | $ | (63 | ) | | $ | 102 |
|
_______________
| |
| (a) | The Company collects initial area development fees for international territory transactions, which are recorded as deferred revenue when received and recognized into franchise revenue over the average 25 year life of the related franchise agreement as consideration for the right to access and benefit from Realogy’s brands. |
| |
| (b) | Revenues recognized include intercompany marketing fees paid by the Company Owned Real Estate Brokerage Services segment. |
| |
| (c) | New development closings generally have a development period of between 18 and 24 months from contracted date to closing. |
| |
| (d) | Network fees are generally billed annually and recognized into revenue on a straight-line basis each month during the membership period. |
| |
| (e) | Outsourcing management fees are recorded as deferred revenue when billed (usually at the start of the relocation) and are recognized as revenue over the average time period required to complete the transferee's move, or a phase of the move that the fee covers, which is typically 3 to 6 months depending on the move type. |
Recently Adopted Accounting Pronouncements
In August 2018, the SEC issued a final rule that amends certain disclosure requirements as part of the SEC’s overall project to improve disclosure effectiveness and simplify compliance. The final rule eliminates redundant, duplicative and overlapping requirements which are substantially similar to current GAAP or other SEC disclosure requirements, as well as amends or removes outdated and superseded requirements. However, in some situations, the amendments expanded disclosure requirements, such as an analysis of changes in stockholders’ equity will now be required for the current and comparative quarter and year-to-date interim periods. The Company applied the amendments in the final rule to its Annual Report on Form 10-K for the year ended December 31, 2018 and the interim disclosure requirements to this quarterly report on Form 10-Q.
Adoption of the New Leasing Standard
In February 2016, the FASB issued Accounting Standard Update No. 2016-02 (Topic 842) "Leases" (the "new leasing standard") which requires virtually all leases to be recognized on the balance sheet. Effective January 1, 2019, the Company adopted the new leasing standard using the modified retrospective transition approach with optional transition relief and recognized the cumulative effect of applying the new leasing standard to existing contracts on the balance sheet on January 1, 2019. Therefore, results for reporting periods beginning after January 1, 2019 are presented under the new leasing
standard; however, the comparative prior period amounts have not been restated and continue to be reported in accordance with historic accounting under ASC Topic 840. The most significant effects of adoption of the new leasing standard relate to the recognition of new right-of-use assets and lease liabilities on the balance sheet for operating leases. The new leasing standard did not impact our Condensed Consolidated Statement of Operations and Condensed Consolidated Statement of Cash Flows. The impact of the changes to the Condensed Consolidated Balance Sheets for the adoption of the new leasing standard were as follows:
|
| | | | | | | | | | | |
| | Balance Sheet accounts prior to the new leasing standard adoption adjustments | | Adjustments due to the adoption of the new leasing standard | | Balance Sheet accounts after the new leasing standard adoption adjustments |
| ASSETS | | | | | |
| Current assets: | | | | | |
| Other current assets | $ | 153 |
| | $ | (14 | ) | | $ | 139 |
|
| Total current assets | 768 |
| | (14 | ) | | 754 |
|
| Operating lease assets, net | — |
| | 567 |
| | 567 |
|
| Other non-current assets | 276 |
| | (1 | ) | | 275 |
|
| Total assets | $ | 7,290 |
| | $ | 552 |
| | $ | 7,842 |
|
| | | | | | |
| LIABILITIES AND EQUITY | | | | | |
| Current liabilities: | | | | | |
| Current portion of operating lease liabilities | $ | — |
| | $ | 126 |
| | $ | 126 |
|
| Accrued expenses and other current liabilities | 401 |
| | (12 | ) | | 389 |
|
| Total current liabilities | 1,527 |
| | 114 |
| | 1,641 |
|
| Long-term operating lease liabilities | — |
| | 500 |
| | 500 |
|
| Other non-current liabilities | 259 |
| | (62 | ) | | 197 |
|
| Total liabilities | 4,975 |
| | 552 |
| | 5,527 |
|
| Total equity | 2,315 |
| | — |
| | 2,315 |
|
| Total liabilities and equity | $ | 7,290 |
| | $ | 552 |
| | $ | 7,842 |
|
The Company elected a package of practical expedients that were consequently applied to all leases. The Company did not reassess whether expired or existing contracts contain leases under the new definition of a lease, lease classification for expired or existing leases, nor whether previously capitalized initial direct costs would qualify for capitalization under the new standard. Upon transition, the Company did not elect to use hindsight with respect to lease renewals and purchase options when accounting for existing leases, as well as assessing the impairment of right-of-use assets. Therefore, lease terms largely remained unchanged. In addition, the Company elected the short-term lease recognition exemption and did not recognize a lease obligation and right-of-use asset on its balance sheet for all leases with terms of 12 months or less. The Company elected the practical expedient to combine lease and non-lease components in total gross rent for all of its leases which resulted in a larger lease liability recorded on the balance sheet.
Recently Issued Accounting Pronouncements
The Company considers the applicability and impact of all Accounting Standards Updates ("ASUs"). Recently issued ASUs were assessed and determined to be either not applicable or are expected to have minimal impact on our consolidated financial position or results of operations.
The Company's lease portfolio consists primarily of office space and equipment. The Company has approximately 1,000 real estate leases with lease terms ranging from less than 1 year to 17 years and includes the Company's brokerage sales offices, regional and branch offices for our title and relocation businesses, corporate headquarters, regional headquarters, and facilities serving as local administration, training and storage. The Company's brokerage sales offices are generally located in shopping centers and small office parks, typically with lease terms of 1 year to 5 years. In addition, the Company's has equipment leases which primarily consist of furniture, computers and other office equipment.
Right-of-use assets represent the Company's right to use an underlying asset for the lease term and lease liabilities represent the Company's obligation to make lease payments arising from the lease. At lease commencement, the Company records a liability for its lease obligation measured at the present value of future lease payments and a right-of-use asset equal to the lease liability adjusted for prepayments and lease incentives. The Company uses its collateralized incremental borrowing rate to calculate the present value of lease liabilities as most of its leases do not provide an implicit rate that is readily determinable.The Company does not recognize a lease obligation and right-of-use asset on its balance sheet for any leases with terms of 12 months or less. Some real estate leases include one or more options to renew or terminate a lease. The exercise of a lease renewal or termination option is assessed at commencement of the lease and only reflected in the lease term if the Company is reasonably certain to exercise the option. The Company has lease agreements that contain both lease and non-lease components, such as common area maintenance fees, and has made a policy election to combine both fixed lease and non-lease components in total gross rent for all of its leases. Expense for operating leases is recognized a straight-line basis over the lease term.
Supplemental balance sheet information related to the Company's leases was as follows:
|
| | | | | | |
| Lease Type | | Balance Sheet Classification | | March 31, 2019 |
| Assets: | | | | |
| Operating lease assets | | Operating lease assets, net | | $ | 544 |
|
| Finance lease assets (1) | | Property and equipment, net | | 38 |
|
| Total lease assets, net | | $ | 582 |
|
| | | | | |
| Liabilities: | | | | |
| Current: | | | | |
| Operating lease liabilities | | Current portion of operating lease liabilities | | $ | 130 |
|
| Finance lease liabilities | | Accrued expenses and other current liabilities | | 12 |
|
| Non-current: | | | | |
| Operating lease liabilities | | Long-term operating lease liabilities | | 473 |
|
| Finance lease liabilities | | Other non-current liabilities | | 20 |
|
| Total lease liabilities | | $ | 635 |
|
| | | | | |
| Weighted Average Lease Term and Discount Rate | | | | |
| Weighted average remaining lease term (years): | | | | |
| Operating leases | | 5.7 |
|
| Finance leases | | 3.3 |
|
| | | | | |
| Weighted average discount rate: | | | | |
| Operating leases | | 5.3 | % |
| Finance leases | | 3.9 | % |
| |
| (1) | Finance lease assets are recorded net of accumulated amortization of $32 million. |
As of March 31, 2019, maturities of lease liabilities by fiscal year were as follows:
|
| | | | | | | | | | | | |
| Maturity of Lease Liabilities | | Operating Leases | | Finance Leases | | Total |
| Remaining 2019 | | $ | 115 |
| | $ | 9 |
| | $ | 124 |
|
| 2020 | | 151 |
| | 11 |
| | 162 |
|
| 2021 | | 120 |
| | 8 |
| | 128 |
|
| 2022 | | 95 |
| | 5 |
| | 100 |
|
| 2023 | | 69 |
| | 1 |
| | 70 |
|
| Thereafter | | 154 |
| | — |
| | 154 |
|
| Total lease payments | | 704 |
| | 34 |
| | 738 |
|
| Less: Interest | | 101 |
| | 2 |
| | 103 |
|
| Present value of lease liabilities | | $ | 603 |
| | $ | 32 |
| | $ | 635 |
|
As previously disclosed in our 2018 Annual Report on Form 10-K and under historical lease accounting guidance, future minimum lease payments for noncancelable operating leases as of December 31, 2018 were as follows:
|
| | | | |
| Year | | As of December 31, 2018 |
| 2019 | | $ | 165 |
|
| 2020 | | 144 |
|
| 2021 | | 120 |
|
| 2022 | | 95 |
|
| 2023 | | 79 |
|
| Thereafter | | 196 |
|
| Total | | $ | 799 |
|
Supplemental income statement information related to the Company's leases is as follows:
|
| | | | |
| | | Three months ended |
| Lease Costs | | March 31, 2019 |
| Operating lease costs | | $ | 42 |
|
| Finance lease costs: | | |
| Amortization of leased assets | | 3 |
|
| Interest on lease liabilities | | — |
|
| Other lease costs (1) | | 7 |
|
| Impairment loss | | 1 |
|
| Less: Sublease income, gross | | 1 |
|
| Net lease cost | | $ | 52 |
|
| |
| (1) | Primarily consists of variable lease costs. |
Supplemental cash flow information related to leases was as follows:
|
| | | | |
| | | Three months ended |
| | | March 31, 2019 |
| Supplemental cash flow information: | | |
| Operating cash flows from operating leases | | $ | 43 |
|
| Operating cash flows from finance leases | | — |
|
| Financing cash flows from finance leases | | 4 |
|
| | | |
| Supplemental non-cash information: | | |
| Lease assets obtained in exchange for lease obligations: | | |
| Operating leases | | $ | 13 |
|
| Finance leases | | 5 |
|
Significant non-cash transactions included finance lease additions of $4 million for the three months ended March 31, 2018, which resulted in non-cash additions to property and equipment, net and other non-current liabilities.
Goodwill by segment and changes in the carrying amount are as follows:
|
| | | | | | | | | | | | | | | | | | | |
| | Real Estate Franchise Services | | Company Owned Brokerage Services | | Relocation Services | | Title and Settlement Services | | Total Company |
| Gross goodwill as of December 31, 2018 | $ | 3,315 |
| | $ | 1,064 |
| | $ | 641 |
| | $ | 478 |
| | $ | 5,498 |
|
| Accumulated impairment losses | (1,023 | ) | | (158 | ) | | (281 | ) | | (324 | ) | | (1,786 | ) |
| Balance at December 31, 2018 | 2,292 |
| | 906 |
| | 360 |
| | 154 |
| | 3,712 |
|
| Goodwill acquired | — |
| | — |
| | — |
| | — |
| | — |
|
| Balance at March 31, 2019 | $ | 2,292 |
| | $ | 906 |
| | $ | 360 |
| | $ | 154 |
| | $ | 3,712 |
|
|
| | | | | | | | | | | | | | | | | | | |
| | Real Estate Franchise Services | | Company Owned Brokerage Services | | Relocation Services | | Title and Settlement Services | | Total Company |
| Gross goodwill as of December 31, 2017 | $ | 3,315 |
| | $ | 1,062 |
| | $ | 641 |
| | $ | 478 |
| | $ | 5,496 |
|
| Accumulated impairment losses | (1,023 | ) | | (158 | ) | | (281 | ) | | (324 | ) | | (1,786 | ) |
| Balance at December 31, 2017 | 2,292 |
| | 904 |
| | 360 |
| | 154 |
| | 3,710 |
|
| Goodwill acquired (a) | — |
| | 1 |
| | — |
| | — |
| | 1 |
|
| Balance at March 31, 2018 | $ | 2,292 |
| | $ | 905 |
| | $ | 360 |
| | $ | 154 |
| | $ | 3,711 |
|
_______________
| |
(a) | Goodwill acquired during the three months ended March 31, 2018 relates to the acquisition of one real estate brokerage operation. |
Intangible assets are as follows:
|
| | | | | | | | | | | | | | | | | | | | | | | |
| | As of March 31, 2019 | | As of December 31, 2018 |
| | Gross Carrying Amount | | Accumulated Amortization | | Net Carrying Amount | | Gross Carrying Amount | | Accumulated Amortization | | Net Carrying Amount |
| Amortizable—Franchise agreements (a) | $ | 2,019 |
| | $ | 809 |
| | $ | 1,210 |
| | $ | 2,019 |
| | $ | 792 |
| | $ | 1,227 |
|
| Indefinite life—Trademarks (b) | $ | 749 |
| | | | $ | 749 |
| | $ | 749 |
| | | | $ | 749 |
|
| Other Intangibles | | | | | | | | | | | |
| Amortizable—License agreements (c) | $ | 45 |
| | $ | 11 |
| | $ | 34 |
| | $ | 45 |
| | $ | 11 |
| | $ | 34 |
|
| Amortizable—Customer relationships (d) | 549 |
| | 365 |
| | 184 |
| | 549 |
| | 359 |
| | 190 |
|
| Indefinite life—Title plant shares (e) | 18 |
| | | | 18 |
| | 18 |
| | | | 18 |
|
| Amortizable—Other (f) | 33 |
| | 23 |
| | 10 |
| | 33 |
| | 21 |
| | 12 |
|
| Total Other Intangibles | $ | 645 |
| | $ | 399 |
| | $ | 246 |
| | $ | 645 |
| | $ | 391 |
| | $ | 254 |
|
|
| | | | | | | | | | | | | | | | | | | | | | | |
| | As of March 31, 2018 | | As of December 31, 2017 |
| | Gross Carrying Amount | | Accumulated Amortization | | Net Carrying Amount | | Gross Carrying Amount | | Accumulated Amortization | | Net Carrying Amount |
| Amortizable—Franchise agreements (a) | $ | 2,019 |
| | $ | 742 |
| | $ | 1,277 |
| | $ | 2,019 |
| | $ | 725 |
| | $ | 1,294 |
|
| Indefinite life—Trademarks (b) | $ | 749 |
| | | | $ | 749 |
| | $ | 749 |
| | | | $ | 749 |
|
| Other Intangibles | | | | | | | | | | | |
| Amortizable—License agreements (c) | $ | 45 |
| | $ | 10 |
| | $ | 35 |
| | $ | 45 |
| | $ | 10 |
| | $ | 35 |
|
| Amortizable—Customer relationships (d) | 549 |
| | 341 |
| | 208 |
| | 549 |
| | 335 |
| | 214 |
|
| Indefinite life—Title plant shares (e) | 18 |
| | | | 18 |
| | 18 |
| | | | 18 |
|
| Amortizable—Pendings and listings (f) | — |
| | — |
| | — |
| | 2 |
| | 1 |
| | 1 |
|
| Amortizable—Other (g) | 33 |
| | 18 |
| | 15 |
| | 33 |
| | 17 |
| | 16 |
|
| Total Other Intangibles | $ | 645 |
| | $ | 369 |
| | $ | 276 |
| | $ | 647 |
| | $ | 363 |
| | $ | 284 |
|
_______________
| |
| (a) | Generally amortized over a period of 30 years. |
| |
| (b) | Primarily relatesrelated to the Century 21®, Coldwell Banker®, ERA®, Corcoran®, Coldwell Banker Commercial®real estate franchise brands and Cartus tradenames, which are expected to generate future cash flows for an indefinite period of time. |
| |
| (c) | Relates to the Sotheby’s International Realty® and Better Homes and Gardens® Real Estate agreements which are being amortized over 50 years (the contractual term of the license agreements). |
| |
| (d) | Relates to the customer relationships at the Relocation Services segment, the Title and Settlement Services segment and our Company Owned Real Estate Brokerage Services segment. These relationships are being amortized over a period of 2 to 20 years. |
| |
| (e) | Ownership in a title plant is required to transact title insurance in certain states. The Company expects to generate future cash flows for an indefinite period of time. |
| |
| (f) | Generally amortized over a period of 5 months. |
| |
(g) | Consists of covenants not to compete which are amortized over their contract lives and other intangibles which are generally amortized over periods ranging from 5 to 10 years. |
Intangible asset amortization expense is as follows:
|
| | | | | | | |
| | Three Months Ended March 31, |
| | 2019 | | 2018 |
| Franchise agreements | $ | 17 |
| | $ | 17 |
|
| Customer relationships | 6 |
| | 6 |
|
| Pendings and listings | — |
| | 1 |
|
| Other | 1 |
| | 1 |
|
| Total | $ | 24 |
| | $ | 25 |
|
|
| | | | | | | |
| | Three Months Ended March 31, |
| | 2018 | | 2017 |
| Franchise agreements | $ | 17 |
| | $ | 17 |
|
| License agreements | — |
| | — |
|
| Customer relationships | 6 |
| | 6 |
|
| Pendings and listings | 1 |
| | 1 |
|
| Other | 1 |
| | 2 |
|
| Total | $ | 25 |
| | $ | 26 |
|
Based on the Company’s amortizable intangible assets as of March 31, 2018,2019, the Company expects related amortization expense for the remainder of 2018,2019, the four succeeding years and thereafter to be approximately $73 million, $97 million, $95 million, $93 million, $92 million, $91 million and $1,085$994 million, respectively.
| |
| 4. | ACCRUED EXPENSES AND OTHER CURRENT LIABILITIES |
Accrued expenses and other current liabilities consisted of:
|
| | | | | | | |
| | March 31, 2019 | | December 31, 2018 |
| Accrued payroll and related employee costs | $ | 81 |
| | $ | 118 |
|
| Accrued volume incentives | 30 |
| | 37 |
|
| Accrued commissions | 32 |
| | 30 |
|
| Restructuring accruals | 12 |
| | 15 |
|
| Deferred income | 62 |
| | 59 |
|
| Accrued interest | 25 |
| | 15 |
|
| Current portion of finance lease liabilities | 12 |
| | — |
|
| Due to former parent | 21 |
| | 21 |
|
| Other | 71 |
| | 106 |
|
| Total accrued expenses and other current liabilities | $ | 346 |
| | $ | 401 |
|
|
| | | | | | | |
| | March 31, 2018 | | December 31, 2017 |
| Accrued payroll and related employee costs | $ | 86 |
| | $ | 140 |
|
| Accrued volume incentives | 30 |
| | 41 |
|
| Accrued commissions | 34 |
| | 38 |
|
| Restructuring accruals | 12 |
| | 5 |
|
| Deferred income | 65 |
| | 68 |
|
| Accrued interest | 35 |
| | 13 |
|
| Contingent consideration for acquisitions | 26 |
| | 26 |
|
| Due to former parent | 18 |
| | 18 |
|
| Other | 120 |
| | 129 |
|
| Total accrued expenses and other current liabilities | $ | 426 |
| | $ | 478 |
|
5. SHORT AND LONG-TERM DEBT
Total indebtedness is as follows:
|
| | | | | | | |
| | March 31, 2019 | | December 31, 2018 |
| Senior Secured Credit Facility: | | | |
| Revolving Credit Facility | $ | 410 |
| | $ | 270 |
|
| Term Loan B | 1,052 |
| | 1,053 |
|
| Term Loan A Facility: | | | |
| Term Loan A | 727 |
| | 732 |
|
| 4.50% Senior Notes | — |
| | 449 |
|
| 5.25% Senior Notes | 547 |
| | 547 |
|
| 4.875% Senior Notes | 497 |
| | 497 |
|
| 9.375% Senior Notes | 542 |
| | — |
|
| Total Short-Term & Long-Term Debt | $ | 3,775 |
| | $ | 3,548 |
|
| Securitization Obligations: | | | |
| Apple Ridge Funding LLC | $ | 171 |
| | $ | 218 |
|
| Cartus Financing Limited | 16 |
| | 13 |
|
| Total Securitization Obligations | $ | 187 |
| | $ | 231 |
|
|
| | | | | | | |
| | March 31, 2018 | | December 31, 2017 |
| Senior Secured Credit Facility: | | | |
| Revolving Credit Facility | $ | 302 |
| | $ | 70 |
|
| Term Loan B (1) | 1,060 |
| | 1,063 |
|
| Term Loan A Facility: | | | |
| Term Loan A (1) | 745 |
| | 390 |
|
| Term Loan A-1 | — |
| | 339 |
|
| 4.50% Senior Notes | 445 |
| | 444 |
|
| 5.25% Senior Notes | 546 |
| | 546 |
|
| 4.875% Senior Notes | 497 |
| | 496 |
|
| Total Short-Term & Long-Term Debt | $ | 3,595 |
| | $ | 3,348 |
|
| Securitization Obligations: | | | |
| Apple Ridge Funding LLC | $ | 170 |
| | $ | 181 |
|
| Cartus Financing Limited | 14 |
| | 13 |
|
| Total Securitization Obligations | $ | 184 |
| | $ | 194 |
|
_______________
| |
(1) | As of March 31, 2018, after giving effect to the February 2018 refinancing transactions discussed in this Note 5 under the headings "Senior Secured Credit Facility" and "Term Loan A Facility." |
Indebtedness Table
As of March 31, 2018,2019, the Company’s borrowing arrangements were as follows:
| | | | Interest
Rate | | Expiration
Date | | Principal Amount | | Unamortized Discount and Debt Issuance Costs | | Net Amount | Interest
Rate | | Expiration
Date | | Principal Amount | | Unamortized Discount and Debt Issuance Costs | | Net Amount |
| Senior Secured Credit Facility: | | | | | | | | | | | | | | | | | | |
| Revolving Credit Facility (1) | (2) | | February 2023 | | $ | 302 |
| | $ * |
| | $ | 302 |
| (2) | | February 2023 | | $ | 410 |
| | $ * |
| | $ | 410 |
|
| Term Loan B | (3) | | February 2025 | | 1,077 |
| | 17 |
| | 1,060 |
| (3) | | February 2025 | | 1,067 |
| | 15 |
| | 1,052 |
|
| Term Loan A Facility: | | | | | | | | | | | | |
| Term Loan A | (4) | | February 2023 | | 750 |
| | 5 |
| | 745 |
| (4) | | February 2023 | | 731 |
| | 4 |
| | 727 |
|
| Senior Notes | 4.50% | | April 2019 | | 450 |
| | 5 |
| | 445 |
| 5.25% | | December 2021 | | 550 |
| | 3 |
| | 547 |
|
| Senior Notes | 5.25% | | December 2021 | | 550 |
| | 4 |
| | 546 |
| 4.875% | | June 2023 | | 500 |
| | 3 |
| | 497 |
|
| Senior Notes | 4.875% | | June 2023 | | 500 |
| | 3 |
| | 497 |
| 9.375% | | April 2027 | | 550 |
| | 8 |
| | 542 |
|
| Securitization obligations: (5) | | | | | | | | | | | | |
| Apple Ridge Funding LLC (6) | | June 2018 | | 170 |
| | * |
| | 170 |
| Apple Ridge Funding LLC (6) | | June 2019 | | 171 |
| | * |
| | 171 |
|
| Cartus Financing Limited (7) | | August 2018 | | 14 |
| | * |
| | 14 |
| Cartus Financing Limited (7) | | August 2019 | | 16 |
| | * |
| | 16 |
|
| Total (8) | Total (8) | $ | 3,813 |
| | $ | 34 |
| | $ | 3,779 |
| Total (8) | $ | 3,995 |
| | $ | 33 |
| | $ | 3,962 |
|
_______________
| |
| * | The debt issuance costs related to our Revolving Credit Facility and securitization obligations are classified as a deferred financing asset within other assets. |
| |
| (1) | As of March 31, 2018,2019, the Company had $1,400$1,425 million of borrowing capacity under its Revolving Credit Facility, leaving $1,098 million of available capacity.Facility. The Revolving Credit Facility expires in February 2023 but is classified on the balance sheet as current due to the revolving nature and terms and conditions of the facility. In March 2019, the Company increased the borrowing capacity under its Revolving Credit Facility to $1,425 million from $1,400 million. On May 1, 2018,April 30, 2019, the Company had $372$470 million in outstanding borrowings under the Revolving Credit Facility, leaving $1,028 million of available capacity.Facility. |
| |
| (2) | Interest rates with respect to revolving loans under the Senior Secured Credit Facility at March 31, 20182019 were based on, at the Company's option, (a) adjusted London Interbank Offering Rate ("LIBOR") plus an additional margin or (b) JP Morgan Chase Bank, N.A.'s prime rate ("ABR") plus an additional margin, in each case subject to adjustment based on the then current senior secured leverage ratio. Based on the previous quarterquarter's senior secured leverage ratio, the LIBOR margin was 2.00%2.25% and the ABR margin was 1.00%1.25% for the three months ended March 31, 2018.2019. |
| |
| (3) | The Term Loan B provides for quarterly amortization payments totaling 1% per annum of the original principal amount. The interest rate with respect to term loans under the Term Loan B is based on, at the Company’s option, (a) adjusted LIBOR plus 2.25% (with a LIBOR floor of 0.75%) or (b) ABR plus 1.25% (with an ABR floor of 1.75%). |
| |
| (4) | The Term Loan A provides for quarterly amortization payments, which commencecommenced on June 30, 2018, totaling per annum 2.5%, 2.5%, 5.0%, 7.5% and 10.0% of the original principal amount of the Term Loan A, with the last amortization payment to be madebalance of the Term Loan A due at maturity on February 8, 2023. The interest rates with respect to term loans under the Term Loan A are based on, at the Company's option, (a) adjusted LIBOR plus an additional margin or (b) ABR plus an additional margin, in each case subject to adjustment based on the then current senior secured leverage ratio. Based on the previous quarterquarter's senior secured leverage ratio, the LIBOR margin was 2.00%2.25% and the ABR margin was 1.00%1.25% for the three months ended March 31, 2018. 2019. |
| |
| (5) | Available capacity is subject to maintaining sufficient relocation related assets to collateralize these securitization obligations. |
| |
| (6) | As of March 31, 2018,2019, the Company had $250 million of borrowing capacity under the Apple Ridge Funding LLC securitization program leaving $80$79 million of available capacity. |
| |
| (7) | Consists of a £10£10 million revolving loan facility and a £5£5 million working capital facility. As of March 31, 2018,2019, the Company had $21$20 million of borrowing capacity under the Cartus Financing Limited securitization program leaving $7$4 million of available capacity. |
| |
| (8) | Not included in this table is the Company's Unsecured Letter of Credit Facility which had a capacity of $74$66 million with $66$59 million utilized at a weighted average rate of 3.24%3.33% at March 31, 2018.2019. |
Maturities Table
As of March 31, 2018,2019, the combined aggregate amount of maturities for long-term borrowings, excluding securitization obligations, for the remainder of 20182019 and each of the next four years is as follows:
| | | Year | | Amount | | Amount |
| Remaining 2018 (a) | | $ | 324 |
| |
| 2019 | | 480 |
| |
| Remaining 2019 (a) | | | $ | 432 |
|
| 2020 | | 44 |
| | 44 |
|
| 2021 | | 613 |
| | 612 |
|
| 2022 | | 81 |
| | 81 |
|
| 2023 | | | 1,074 |
|
_______________
| |
| (a) | The current portion of long-term debt consists of remaining 2018Remaining 2019 includes amortization payments totaling $14 million and $8 million for the Term Loan A and Term Loan B facilities, respectively, as well as $302$410 million of revolver borrowings under the Revolving Credit Facility which expires in February 2023 but areis classified on the balance sheet as current due to the revolving nature and terms and conditions of the facility. The current portion of long-term debt of $440 million shown on the condensed consolidated balance sheet consists of four quarters of amortization payments totaling $19 million and $11 million for the Term Loan A and Term Loan B facilities, respectively, and $410 million of revolver borrowings under the Revolving Credit Facility. |
Senior Secured Credit Facility
In February 2018, the CompanyRealogy Group entered into fifth and sixth amendments to the Amended and Restated Senior Secured Credit Agreement dated as of March 5, 2013 (as amended, amended and restated, modified or supplemented from time to time, the "Senior Secured Credit Agreement") that respectively (i) replaced the approximately $1,100 million Term Loan B due July 2022 with a new $1,080 million Term Loan B due February 2025 and (ii) increased the borrowing capacity under its Revolving Credit Facility to $1,400 million from the prior $1,050 million and extended the maturity date to February 2023 from October 2020.
On March 27, 2019, Realogy Group entered into an incremental assumption agreement to the Senior Secured Credit Agreement that provided for an incremental revolving facility commitment of $25 million increasing the borrowing capacity under the Revolving Credit Facility to $1,425 million.
The Senior Secured Credit Agreement provides for:
| |
| (a) | the Term Loan B issued in the original aggregate principal amount of $1,080 million with a maturity date of February 2025. The Term Loan B has quarterly amortization payments totaling 1% per annum of the initial aggregate principal amount. The interest rate with respect to term loans under the Term Loan B is based on, at Realogy Group's option, adjusted LIBOR plus 2.25% (with a LIBOR floor of 0.75%) or ABR plus 1.25% (with an ABR floor of 1.75%); and |
| |
| (b) | a $1,400$1,425 million Revolving Credit Facility with a maturity date of February 2023, which includes a $125 million letter of credit subfacility. The interest rate with respect to revolving loans under the Revolving Credit Facility is based on, at Realogy Group's option, adjusted LIBOR or ABR plus an additional margin subject to the following adjustments based on the Company’s then current senior secured leverage ratio: |
|
| | | | |
| Senior Secured Leverage Ratio | | Applicable LIBOR Margin | | Applicable ABR Margin |
| Greater than 3.50 to 1.00 | | 2.50% | | 1.50% |
| Less than or equal to 3.50 to 1.00 but greater than or equal to 2.50 to 1.00 | | 2.25% | | 1.25% |
| Less than 2.50 to 1.00 but greater than or equal to 2.00 to 1.00 | | 2.00% | | 1.00% |
| Less than 2.00 to 1.00 | | 1.75% | | 0.75% |
The Senior Secured Credit Agreement permits the Company to obtain up to $500 million of additional credit facilities on a combined basis with the Term Loan A Agreement (less any amounts previously incurred under this provision) from lenders reasonably satisfactory to the administrative agent and us, without the consent of the existing lenders under the new senior secured credit facility, plus an unlimited amount if Realogy Group's senior secured leverage ratio is less than 3.50 to 1.00 on a pro forma basis. Subject to certain restrictions, the Senior Secured Credit Agreement also permits usthe Company to issue senior secured or unsecured notes in lieu of any incremental facility.
The obligations under the Senior Secured Credit Agreement are secured to the extent legally permissible by substantially all of the assets of Realogy Group, Realogy Intermediate and all of their domestic subsidiaries, other than certain excluded subsidiaries.
Realogy Group’s Senior Secured Credit Agreement contains financial, affirmative and negative covenants and requires Realogy Group to maintain (so long as the Revolving Credit Facility is outstanding) a senior secured leverage ratio, not to exceed 4.75 to 1.00. The leverage ratio is tested quarterly regardless of the amount of borrowings outstanding and letters of credit issued under the revolverRevolving Credit Facility at the testing date. Total senior secured net debt does not include unsecured indebtedness, including the Unsecured Notes as well as the securitization obligations. At March 31, 2018,2019, Realogy Group was in compliance with the senior secured leverage ratio covenant.
Term Loan A Facility
In February 2018, Realogy Group entered into a second amendment to the Term Loan A senior secured credit agreement.Agreement. Under the amendment, the Company aggregated the existing $435 million Term Loan A and $355 million Term Loan A-1 tranches due October 2020 and July 2021, respectively, into a new single tranche of $750 million Term Loan A due February 2023. The Term Loan A provides for quarterly amortization payments totaling per annum 2.5%, 2.5%, 5.0%, 7.5% and 10.0% of the original principal amount of the Term Loan A, which commencecommenced on June 30, 2018 and continue through February 8, 2023. The interest rates with respect to the Term Loan A are based on, at our option, adjusted LIBOR or ABR plus an additional margin subject to the following adjustments based on the Company’s then current senior secured leverage ratio:
|
| | | | |
| Senior Secured Leverage Ratio | | Applicable LIBOR Margin | | Applicable ABR Margin |
| Greater than 3.50 to 1.00 | | 2.50% | | 1.50% |
| Less than or equal to 3.50 to 1.00 but greater than or equal to 2.50 to 1.00 | | 2.25% | | 1.25% |
| Less than 2.50 to 1.00 but greater than or equal to 2.00 to 1.00 | | 2.00% | | 1.00% |
| Less than 2.00 to 1.00 | | 1.75% | | 0.75% |
Consistent with the Senior Secured Credit Agreement, the Term Loan A FacilityAgreement permits the Company to obtain up to $500 million of additional credit facilities on a combined basis with the Senior Secured Credit Agreement (less any amounts previously incurred under this provision) from lenders reasonably satisfactory to the administrative agent and the company,Company, without the consent of the existing lenders under the Term Loan A, plus an unlimited amount if the Company's senior secured leverage ratio is less than 3.50 to 1.00 on a pro forma basis. Subject to certain restrictions, the Term Loan A Facility also permits usthe Company to issue senior secured or unsecured notes in lieu of any incremental facility. The Term Loan A Agreement contains negative covenants consistent with those included in the Senior Secured Credit Agreement.
Unsecured Notes
TheIn February 2019, the Company used borrowings under its Revolving Credit Facility and cash on hand to fund the redemption of all of its outstanding $450 million 4.50% Senior Notes. In March 2019, the Company issued $550 million of 9.375% Senior Notes due in April 2027. The Company used $540 million of the net proceeds to repay a portion of outstanding borrowings under its Revolving Credit Facility.
The 5.25% Senior Notes, 4.875% Senior Notes and 4.875%the 9.375% Senior Notes (collectively the "Unsecured Notes") are unsecured senior obligations of Realogy Group that mature on April 15, 2019, December 1, 2021, and June 1, 2023 and April 1, 2027, respectively. Interest on the Unsecured Notes is payable each year semiannually on April 15 and October 15 for the 4.50% Senior Notes and June 1 and December 1 for both the 5.25% Senior Notes and 4.875% Senior Notes, and April 1 and October 1 for the 9.375% Senior Notes.
The Unsecured Notes are guaranteed on an unsecured senior basis by each domestic subsidiary of Realogy Group that is a guarantor under the Senior Secured Credit Facility and Realogy Group's outstanding debt securities and are guaranteed by Realogy Holdings on an unsecured senior subordinated basis.
The indentures governing the Unsecured Notes contain affirmative andvarious negative covenants ofthat limit Realogy Group and its restricted subsidiaries’ ability to take certain actions, which covenants are subject to a number of important exceptions and qualifications. These covenants include limitations on Realogy Group's and its restricted subsidiaries’ ability to (a) incur or guarantee additional indebtedness, or issue disqualified stock or preferred stock, (b) pay dividends or make distributions to their stockholders, (c) repurchase or redeem capital stock, (d) make investments or acquisitions, (e) incur restrictions on the subsidiary guarantors.ability of certain of their subsidiaries to pay dividends or to make other payments to Realogy Group, (f) enter into transactions with affiliates, (g) create liens, (h) merge or consolidate with other companies or transfer all or substantially all of their assets, (i) transfer or sell assets, including capital stock of subsidiaries and (j) prepay, redeem or repurchase debt that is subordinated in right of payment to the Unsecured Notes.
The covenants in the indenture governing the 9.375% Senior Notes are substantially similar to the covenants in the indentures governing the other Unsecured Notes, with certain exceptions, including several changes relating to Realogy Group’s ability to make restricted payments, and, in particular, its ability to repurchase shares and make dividends. Specifically, (a) the cumulative credit basket for restricted payments (i) was reset to zero and builds from January 1, 2019, (ii) builds at 25% of Consolidated Net Income (as defined in the indenture governing the 9.375% Senior Notes) when the consolidated leverage ratio (as defined below) is equal to or greater than 4.0 to 1.0 (and 50% of Consolidated Net Income when it is less than 4.0 to 1.0) and, consistent with the indentures governing the other Unsecured Notes, is reduced by 100% of the deficit when Consolidated Net Income is a deficit and (iii) may not be used when the consolidated leverage ratio is equal to or greater than 4.0 to 1.0; (b) the $100 million general restricted payment basket may be used only for Restricted Investments (as defined in the indenture governing the 9.375% Senior Notes); (c) the indenture governing the 9.375% Senior Notes requires the consolidated leverage ratio to be less than 3.0 to 1.0 to use the unlimited general restricted payment basket (which payments will reduce the cumulative credit basket, but not below zero); and (d) the indenture governing the 9.375% Senior Notes contains a new restricted payment basket that may be used for up to $45 million of dividends per calendar year.
The consolidated leverage ratio is measured by dividing Realogy Group's total net debt by the trailing four quarters EBITDA. EBITDA, as defined in the indenture governing the 9.375% Senior Notes, is substantially similar to EBITDA calculated on a Pro Forma Basis, as those terms are defined in the Senior Secured Credit Agreement. Net debt under the indenture is Realogy Group's total indebtedness (excluding securitizations) less (i) its cash and cash equivalents in excess of restricted cash and (ii) a $200 million seasonality adjustment permitted when measuring the ratio on a date during the period of March 1 to May 31.
Other Debt Facilities
The Company has an Unsecured Letter of Credit Facility to provide for the issuance of letters of credit required for general corporate purposes by the Company.Company which expires in December 2019. At March 31, 2018,2019, the capacity of the facility was $74$66 million, with $66$59 million being utilized and at December 31, 2017,2018, the capacity of the facility was $74$66 million with $69$63 million being utilized. The facility's expiration dates are as follows:
|
| |
Capacity (in millions) | Expiration Date |
$8 | September 2018 |
$66 | December 2019 |
The fixed pricing to the Company is based on a spread above the credit default swap rate for senior unsecured debt obligations of the Company over the applicable letter of credit period. Realogy Group's obligations under the Unsecured Letter of Credit Facility are guaranteed on an unsecured senior basis by each domestic subsidiary of Realogy Group that is a guarantor under the Senior Secured Credit Facility and Realogy Group's outstanding debt securities.
Securitization Obligations
Realogy Group has secured obligations through Apple Ridge Funding LLC under a securitization program. The program which expires in June 2018 and has a capacity2019. As of $250 million. At March 31, 2018, Realogy Group2019, the Company had $170$250 million of outstanding borrowingsborrowing capacity under the facility.Apple Ridge Funding LLC securitization program with $171 million being utilized.
Realogy Group, through a special purpose entity known as Cartus Financing Limited, has agreements providing for a £10 million revolving loan facility and a £5 million working capital facility both of which expireexpires in August 2018. There2019. As of March 31, 2019, there were $14$16 million of outstanding borrowings on the facilities at March 31, 2018.facilities. These Cartus Financing Limited facilities are secured by the relocation assets of a U.K. government contract in this special purpose entity and are therefore classified as permitted securitization financings as defined in Realogy Group’s Senior Secured Credit FacilityAgreement and the indentures governing the Unsecured Notes.
The Apple Ridge entities and the Cartus Financing Limited entity are consolidated special purpose entities that are utilized to securitize relocation receivables and related assets. These assets are generated from advancing funds on behalf of clients of Realogy Group’s relocation business in order to facilitate the relocation of their employees. Assets of these special purpose entities are not available to pay Realogy Group’s general obligations. Under the Apple Ridge program, provided no termination or amortization event has occurred, any new receivables generated under the designated relocation management agreements are sold into the securitization program and as new eligible relocation management agreements are entered into, the new agreements are designated to the program. The Apple Ridge program has restrictive covenants and trigger events, including performance triggers linked to the age and quality of the underlying assets, foreign obligor limits, multicurrency limits, financial reporting requirements, restrictions on mergers and change of control, any uncured breach of Realogy Group’s senior secured leverage ratio under Realogy Group’s Senior Secured Credit Facility, and cross-defaults to Realogy Group’s material indebtedness. The occurrence of a trigger event under the Apple Ridge securitization facility could restrict our ability to access new or existing funding under this facility or result in termination of the facility, either of which would adversely affect the operation of our relocation business.
Certain of the funds that Realogy Group receives from relocation receivables and related assets must be utilized to repay securitization obligations. These obligations were collateralized by $239$220 million and $218238 million of underlying relocation receivables and other related relocation assets at March 31, 20182019 and December 31, 20172018, respectively. Substantially all relocation related assets are realized in less than twelve months from the transaction date. Accordingly, all of Realogy Group’s securitization obligations are classified as current in the accompanying Condensed Consolidated Balance Sheets.
Interest incurred in connection with borrowings under these facilities amounted to $2 million and $1 million for both the three months ended March 31, 20182019 and 2017, respectively.2018. This interest is recorded within net revenues in the accompanying Condensed Consolidated Statements of Operations as related borrowings are utilized to fund Realogy Group's relocation business where interest is generally earned on such assets. These securitization obligations represent floating rate debt for which the average weighted interest rate was 3.6%4.4% and 3.3%3.6% for the three months ended March 31, 20182019 and 20172018, respectively.
Loss on the Early Extinguishment of Debt and Write-Off of Financing Costs
As a result of the refinancing transaction in February 2019, the Company recorded a loss on the early extinguishment of debt of $5 million during the three months ended March 31, 2019.
As a result of the refinancing transactions in February 2018, the Company recorded a loss on the early extinguishment of debt of $7 million and wrote off financing costs of $2 million to interest expense during the three months ended March 31, 2018.
As a result
Restructuring charges were $30$12 million and $5$30 million for the three months ended March 31, 20182019 and 2017,2018, respectively. The components of the restructuring charges for the three months ended March 31, 20182019 and 20172018 were as follows:
| | | | Three Months Ended March 31, | Three Months Ended March 31, |
| | 2018 | | 2017 | 2019 | | 2018 |
| Personnel-related costs (1) | $ | 14 |
| | $ | 5 |
| $ | 11 |
| | $ | 14 |
|
| Facility-related costs (2) | 9 |
| | — |
| 1 |
| | 9 |
|
| Internal use software impairment (3) | 7 |
| | — |
| — |
| | 7 |
|
Total restructuring charges | $ | 30 |
| | $ | 5 |
| $ | 12 |
| | $ | 30 |
|
_______________
| |
| (1) | Personnel-related costs consist of severance costs provided to employees who have been terminated and duplicate payroll costs during transition. |
| |
| (2) | Facility-related costs consist of costs associated with planned facility closures such as contract termination costs, amortization of lease payments, net of applicable sublease income,assets that will continue to be incurred under the contract for its remaining term without economic benefit to the Company, accelerated depreciation on asset disposals and other facility and employee relocation related costs. |
| |
| (3) | Internal use software impairment relates to development costs capitalized for a project that was determined to not meet the Company's strategic goals when analyzed by the Company's new leadership team. |
| |
| (4) | The three months ended March 31, 2019 includes $9 million and $3 million of expense related to the Facility and Operational Efficiencies Program and Leadership Realignment and Other Restructuring Activities Program, respectively. Restructuring charges for three months ended March 31, 2018 relate to prior restructuring programs. |
Facility and Operational Efficiencies Program
Beginning in the first quarter of 2019, the Company commenced the implementation of a plan to accelerate its office consolidation to reduce storefront costs, as well as institute other operational efficiencies to drive profitability. In addition, the Company commenced a plan to transform and centralize certain aspects of the operational support and drive changes in how it serves its affiliated independent sales agents from a marketing and technology perspective to help such agents be more productive and enable them to make their businesses more profitable.
The following is a reconciliation of the beginning and ending reserve balances related to the Facility and Operational Efficiencies Program:
|
| | | | | | | | | | | |
| | Personnel-related costs | | Facility-related costs (1) | | Total |
| Balance at December 31, 2018 | $ | — |
| | $ | — |
| | $ | — |
|
| Restructuring charges | 8 |
| | 1 |
| | 9 |
|
| Costs paid or otherwise settled | (6 | ) | | — |
| | (6 | ) |
| Balance at March 31, 2019 | $ | 2 |
| | $ | 1 |
| | $ | 3 |
|
_______________
| |
| (1) | In addition, the Company incurred an additional $1 million related to lease asset impairments in connection with the Facility and Operational Efficiencies Program during the three months ended March 31, 2019. |
The following table shows the total costs currently expected to be incurred by type of cost related to the Facility and Operational Efficiencies Program:
|
| | | | | | | | | | | |
| | Total amount expected to be incurred | | Amount incurred to date | | Total amount remaining to be incurred |
| Personnel-related costs | $ | 13 |
| | $ | 8 |
| | $ | 5 |
|
| Facility-related costs (1) | 40 |
| | 1 |
| | 39 |
|
| Total | $ | 53 |
| | $ | 9 |
| | $ | 44 |
|
_______________
| |
| (1) | Facility-related costs includes lease asset impairments expected to be incurred under the Facility and Operational Efficiencies Program. |
The following table shows the total costs currently expected to be incurred by reportable segment related to the Facility and Operational Efficiencies Program:
|
| | | | | | | | | | | |
| | Total amount expected to be incurred | | Amount incurred to date | | Total amount remaining to be incurred |
| Real Estate Franchise Services | $ | — |
| | $ | — |
| | $ | — |
|
| Company Owned Real Estate Brokerage Services | 45 |
| | 3 |
| | 42 |
|
| Relocation Services | 4 |
| | 3 |
| | 1 |
|
| Title and Settlement Services | 2 |
| | 1 |
| | 1 |
|
| Corporate and Other | 2 |
| | 2 |
| | — |
|
| Total | $ | 53 |
| | $ | 9 |
| | $ | 44 |
|
Leadership Realignment and Other Restructuring Activities
Beginning in the first quarter of 2018, the Company commenced the implementation of a plan to drive its business forward and enhance stockholder value. The key aspects of this plan includeincluded senior leadership realignment, an enhanced focus on technology and talent, as well as further attention onto office footprint and other operational efficiencies, including the consolidation of certain support services provided to the Company Owned Real Estate Brokerage Services and Real Estate Franchise Services segments.
The following is a reconciliation of the beginning and ending reserve balances for the restructuring program related to Leadership Realignment and Other Restructuring Activities:
|
| | | | | | | | | | | | | | | |
| | Personnel-related costs | | Facility-related costs | | Internal use software impairment | | Total |
| Balance at December 31, 2017 | $ | — |
| | $ | — |
| | $ | — |
| | $ | — |
|
| Restructuring charges | 14 |
| | 8 |
| | 7 |
| | 29 |
|
| Costs paid or otherwise settled | (8 | ) | | (1 | ) | | (7 | ) | | (16 | ) |
| Balance at March 31, 2018 | $ | 6 |
| | $ | 7 |
| | $ | — |
| | $ | 13 |
|
The following table shows the total costs currently expected to be incurred by type of cost the restructuring program related to Leadership Realignment and Other Restructuring Activities:
|
| | | | | | | | | | | |
| | Total amount expected to be incurred | | Amount incurred to date | | Total amount remaining to be incurred |
| Personnel-related costs | $ | 17 |
| | $ | 14 |
| | $ | 3 |
|
| Facility-related costs | 17 |
| | 8 |
| | 9 |
|
| Internal use software impairment | 7 |
| | 7 |
| | — |
|
| Total | $ | 41 |
| | $ | 29 |
| | $ | 12 |
|
The following table shows the total costs currently expected to be incurred by reportable segment for the restructuring program related to Leadership Realignment and Other Restructuring Activities: |
| | | | | | | | | | | |
| | Total amount expected to be incurred | | Amount incurred to date | | Total amount remaining to be incurred |
| Real Estate Franchise Services | $ | 2 |
| | $ | 2 |
| | $ | — |
|
| Company Owned Real Estate Brokerage Services | 27 |
| | 16 |
| | 11 |
|
| Relocation Services | 9 |
| | 8 |
| | 1 |
|
| Title and Settlement Services | 1 |
| | 1 |
| | — |
|
| Corporate and Other | 2 |
| | 2 |
| | — |
|
| Total | $ | 41 |
| | $ | 29 |
| | $ | 12 |
|
Business Optimization Initiative
During the fourth quarter of 2015, the Company began a business optimization initiative that focused on maximizing the efficiency and effectiveness of the cost structure of each of the Company's business units. The action was designed to improve client service levels across each of the business units while enhancing the Company's profitability and incremental margins. The plan focused on several key areas of opportunity which include process improvement efficiencies, office footprint optimization, leveraging technology and media spend, centralized procurement, outsourcing administrative services and organizational design.efficiencies. The expected costs of activities undertaken in connection with the restructuring plan are largely complete. At December 31, 2017,2018, the remaining liability was $7$20 million. During the three months ended March 31, 2018,2019, the Company incurred facility-relatedpersonnel-related costs of $1$3 million, and paid or settled costs of $3$5 million and reclassified $5 million to offset related lease assets upon adoption of the new leasing standard, resulting in a remaining accrual of $5 million.$13 million primarily related to facility and personnel related liabilities.
7. EARNINGS (LOSS) PER SHARECondensed Consolidated Statement of Changes in Equity for Realogy Holdings
|
| | | | | | | | | | | | | | | | | | | | | | | | | | | |
| | | Three Months Ended March 31, 2019 |
| | | Common Stock | | Additional Paid-In Capital | | Accumulated Deficit | | Accumulated Other Comprehensive Loss | | Non- controlling Interests | | Total Equity |
| |
| | |
| | | Shares | | Amount | |
| | Balance at December 31, 2018 | 114.6 |
| | $ | 1 |
| | $ | 4,869 |
| | $ | (2,507 | ) | | $ | (52 | ) | | $ | 4 |
| | $ | 2,315 |
|
| | Net loss | — |
| | — |
| | — |
| | (99 | ) | | — |
| | — |
| | (99 | ) |
| | Other comprehensive income | — |
| | — |
| | — |
| | — |
| | 2 |
| | — |
| | 2 |
|
| | Repurchase of common stock | (1.2 | ) | | — |
| | (20 | ) | | — |
| | — |
| | — |
| | (20 | ) |
| | Stock-based compensation | — |
| | — |
| | 8 |
| | — |
| | — |
| | — |
| | 8 |
|
| | Issuance of shares for vesting of equity awards | 1.2 |
| | — |
| | — |
| | — |
| | — |
| | — |
| | — |
|
| | Shares withheld for taxes on equity awards | (0.4 | ) | | — |
| | (6 | ) | | — |
| | — |
| | — |
| | (6 | ) |
| | Dividends declared ($0.09 per share) | — |
| | — |
| | (10 | ) | | — |
| | — |
| | (1 | ) | | (11 | ) |
| | Balance at March 31, 2019 | 114.2 |
| | $ | 1 |
| | $ | 4,841 |
| | $ | (2,606 | ) | | $ | (50 | ) | | $ | 3 |
| | $ | 2,189 |
|
|
| | | | | | | | | | | | | | | | | | | | | | | | | | | |
| | | Three Months Ended March 31, 2018 |
| | | Common Stock | | Additional Paid-In Capital | | Accumulated Deficit | | Accumulated Other Comprehensive Loss | | Non- controlling Interests | | Total Equity |
| |
| | |
| | | Shares | | Amount | |
| | Balance at December 31, 2017 | 131.6 |
| | $ | 1 |
| | $ | 5,285 |
| | $ | (2,631 | ) | | $ | (37 | ) | | $ | 4 |
| | $ | 2,622 |
|
| | Cumulative effect of adoption of new accounting pronouncements | — |
| | — |
| | — |
| | (13 | ) | | (9 | ) | | — |
| | (22 | ) |
| | Net loss | — |
| | — |
| | — |
| | (67 | ) | | — |
| | — |
| | (67 | ) |
| | Other comprehensive income | — |
| | — |
| | — |
| | — |
| | 2 |
| | — |
| | 2 |
|
| | Repurchase of common stock | (3.5 | ) | | — |
| | (94 | ) | | — |
| | — |
| | — |
| | (94 | ) |
| | Stock-based compensation | — |
| | — |
| | 9 |
| | — |
| | — |
| | — |
| | 9 |
|
| | Issuance of shares for vesting of equity awards | 1.0 |
| | — |
| | — |
| | — |
| | — |
| | — |
| | — |
|
| | Shares withheld for taxes on equity awards | (0.3 | ) | | — |
| | (9 | ) | | — |
| | — |
| | — |
| | (9 | ) |
| | Dividends declared ($0.09 per share) | — |
| | — |
| | (12 | ) | | — |
| | — |
| | (1 | ) | | (13 | ) |
| | Balance at March 31, 2018 | 128.8 |
| | $ | 1 |
| | $ | 5,179 |
| | $ | (2,711 | ) | | $ | (44 | ) | | $ | 3 |
| | $ | 2,428 |
|
Condensed Consolidated Statement of Changes in Equity for Realogy Group
The Company has not included a statement of changes in equity for Realogy Group as the operating results of Group are consistent with the operating results of Realogy Holdings as all revenue and expenses of Realogy Group flow up to Realogy Holdings and there are no incremental activities at the Realogy Holdings level. The only difference between Realogy Group and Realogy Holdings is that the $1 million in par value of common stock in Realogy Holdings' equity is included in additional paid in capital in Realogy Group's equity.
Stock Repurchases
The Company may repurchase shares of its common stock under authorizations from its Board of Directors. Shares repurchased are retired and not displayed separately as treasury stock on the consolidated financial statements. The par value of the shares repurchased and retired is deducted from common stock and the excess of the purchase price over par value is first charged against any available additional paid-in capital with the balance charged to retained earnings. Direct costs incurred to repurchase the shares are included in the total cost of the shares.
The Company's Board of Directors authorized a share repurchase program of up to $275 million, $300 million, $350 million and $175 million of the Company's common stock in February 2016, 2017, 2018 and 2019, respectively.
In the first quarter of 2019, the Company repurchased and retired 1.2 million shares of common stock for $20 million at a weighted average market price of $17.21 per share. As of March 31, 2019, the Company had repurchased and retired 35.5 million shares of common stock for an aggregate of $896 million at a total weighted average market price of $25.22 per share. As of March 31, 2019, $204 million remained available for repurchase under the share repurchase programs.
The restrictive covenants in the indenture governing the 9.375% Senior Notes restrict the Company's ability to repurchase shares. See "Note 5. Short and Long-Term Debt—Unsecured Notes."
Stock-Based Compensation
During the first quarter of 2019, the Company granted 0.9 million shares of non-qualified stock options with a weighted average exercise price of $13.45, restricted stock units related to 2.5 million shares with a weighted average grant date fair value of $13.53 and performance stock units related to 1.2 million shares with a weighted average grant date fair value of $11.08.
Dividend Policy
In August 2016, the Company’s Board of Directors approved the initiation of a quarterly cash dividend policy of $0.09 per share on its common stock. The Board declared and paid a quarterly cash dividend of $0.09 per share on the Company’s common stock during the first quarter of 2019.
The declaration and payment of any future dividend will be subject to the discretion of the Board of Directors and will depend on a variety of factors, including the Company’s financial condition and results of operations, contractual restrictions, including restrictive covenants contained in the Company’s credit agreements, and the indentures governing the Company’s outstanding debt securities, capital requirements and other factors that the Board of Directors deems relevant. The restrictive covenants in the indenture governing the 9.375% Senior Notes restrict the Company's ability to declare dividends in excess of $45 million per year. See Note 5. "Short and Long-Term Debt—Unsecured Notes" for additional information.
Pursuant to the Company’s policy, dividends payable in cash are treated as a reduction of additional paid-in capital since the Company is currently in an accumulated deficit position.
| |
| 8. | EARNINGS (LOSS) PER SHARE |
Earnings (loss) per share attributable to Realogy Holdings
Basic earnings (loss) per share is computed based on net income (loss) attributable to Realogy Holdings stockholders divided by the basic weighted-average shares outstanding during the period. Dilutive earnings per share is computed consistently with the basic computation while giving effect to all dilutive potential common shares and common share equivalents that were outstanding during the period. Realogy Holdings uses the treasury stock method to reflect the potential dilutive effect of unvested stock awards and unexercised options.
The Company was in a net loss position for the three months ended March 31, 20182019 and 2017,2018, and therefore the impact of incentive equity awards were excluded from the computation of dilutive loss per share as the inclusion of such amounts would be anti-dilutive. At March 31, 20182019 and 2017,2018, the number of shares of common stock issuable for incentive equity awards, with performance awards based on the achievement of 100% of target amounts, was 7.611.2 million and 7.37.6 million, respectively.
In the first quarter of 2018,2019, the Company repurchased and retired 3.71.2 million shares of common stock for $99$20 million at a weighted average market price of $26.58$17.21 per share. The shares repurchased include 202,860 shares for which the trade date occurred in late March 2018 while settlement occurred in April 2018. The purchase of shares under this plan reducesthese plans reduced the weighted-average number of shares outstanding in the basic earnings per share calculation.
| |
8.9. | COMMITMENTS AND CONTINGENCIES |
Litigation
The Company is involved in claims, legal proceedings, alternative dispute resolution and governmental inquiries related to alleged contract disputes, business practices, intellectual property and other commercial, employment, regulatory and tax matters. Examples of such matters include but are not limited to allegations:
that the Company is vicariously liable for the acts of franchisees under theories of actual or apparent agency;
by current or former franchisees that franchise agreements were breached including improper terminations;
concerning claims for alleged RESPA or state real estate law violations including but not limited to claims challenging the validity of sales agent indemnification, and administrative fees;
thatindependent residential real estate sales agents engaged by NRT—NRT or by affiliated franchisees—under certain state or federal laws—are potentially employees instead of independent contractors, and they or regulators therefore may bring claims against NRT for breach of contract, wage and hour classification claims, wrongful discharge, unemployment and workers' compensation and could seek benefits, back wages, overtime, indemnification, penalties related to classification practices and expense reimbursement available to employees;employees or similar claims against our franchise operations as an alleged joint employer of an affiliated franchisee’s independent sales agents;
concerning other employment law matters, including wage and hour claims and retaliation claims;
concerning anti-trust and anti-competition matters;
that the Company is vicariously liable for the acts of franchisees under theories of actual or apparent agency;
by current or former franchisees that franchise agreements were breached including improper terminations;
concerning claims for alleged RESPA or state real estate law violations;
concerning claims generally against the company owned brokerage operations for negligence, misrepresentation or breach of fiduciary duty in connection with the performance of real estate brokerage or other professional services as well as other brokerage claims associated with listing information and property history;
related to copyright law, including infringement actions alleging improper use of copyrighted photographs on websites or in marketing materials without consent of the copyright holder;
concerning claims generally against the title company contending that, as the escrow company, the company knew or should have known that a transaction was fraudulent or concerning other title defects or settlement errors;
concerning information security and cyber-crime, including claims under new and emerging data privacy laws related to the protection of customer, employee or third-party information, as well as those related to the diversion of homesale transaction closing funds and/or the protection of the privacy and personally identifiable information of our customers and employees;
concerning anti-trust and anti-competition matters;funds; and
those related to general fraud claims.
Real Estate Business Litigation
Dodge, et al.Whitlach v. PHH Corporation, et al.Premier Valley, Inc. d/b/a Century 21 M&M and Century 21 Real Estate LLC (California Superior Court for the County of Alameda). This is a putative class action complaint filed on December 20, 2018 by plaintiff James Whitlach against Premier Valley Inc., formerly captioned Strader, et al.a Century 21 Real Estate independently-owned franchisee doing business as Century 21 M&M (“Century 21 M&M”). The complaint also names Century 21 Real Estate LLC, a wholly-owned subsidiary of the Company and Hallthe franchisor of Century 21 Real Estate (“Century 21”), as an alleged joint employer of the franchisee’s independent sales agents and seeks to certify a class that could potentially include all agents of both Century 21 M&M and Century 21 in California. The plaintiff alleges that Century 21 M&M misclassified all of its independent real estate agents, salespeople, sales professionals, broker associates and other similar positions as independent contractors, failed to pay minimum wages, failed to provide meal and rest breaks, failed to pay timely wages, failed to keep proper records, failed to provide appropriate wage statements, made unlawful deductions from wages, and failed to reimburse plaintiff and the putative class for business related expenses, resulting in violations of the California Labor Code. The complaint also asserts an unfair business practice claim based on the alleged violations described above.
On February 15, 2019, the plaintiff amended his complaint to assert a claim pursuant to the California Private Attorneys General Act (“PAGA”). The PAGA claim included in the amended complaint are substantively similar to those asserted in the original complaint. Under California law, PAGA claims are generally not subject to arbitration and may result in exposure in the form of additional penalties. In April 2019, the defendants filed motions to compel arbitration of the non-PAGA claims, to stay the PAGA claim pending resolution of the arbitrable claims and to change venue.
Fenley v. PHH Corporation, et al.Realogy Franchise Group LLC, Sotheby’s International Realty, Inc., Wish Properties, Inc. and DOES 1-100 (Superior Court of California, Kern County). This is a putative class action complaint filed on April 25, 2019 by plaintiff Elizabeth Fenley against Wish Properties, Inc, a Sotheby’s International Realty independently-owned franchisee doing business as Wish Sotheby’s International Realty (“Wish SIR”). The complaint also names Realogy Franchise Group LLC and Sotheby’s International Realty, Inc., wholly-owned subsidiaries of the Company, as alleged joint employers of the franchisee’s independent sales agents and seeks to certify a class that could potentially include all agents in California affiliated with any Realogy Franchise Group brand. The plaintiff alleges that all defendants are jointly responsible for misclassifying Wish SIR’s agents as independent contractors and failed to reimburse for business expenses, provide accurate wage statements and timely pay wages, all in violation of the California Labor Code. The complaint also asserts an unfair business practice claim based on the violations previously described.
These cases raise significant and various previously unlitigated claims and the Whitlach PAGA claim adds additional litigation, financial and operating uncertainties.
Moehrl v. The National Association of Realtors, Realogy Holdings Corp., Homeservices of America, Inc., RE/MAX Holdings, Inc., and Keller Williams Realty, Inc. (U.S. District Court for the Northern District of Illinois). This is a putative class action complaint filed on March 6, 2019 by plaintiff Christopher Moehrl against NAR, the Company, Homeservices of America, Inc., RE/MAX Holdings, Inc., and Keller Williams Realty, Inc.
The plaintiff alleges that the defendants engaged in a continuing contract, combination, or conspiracy to unreasonably restrain trade and commerce in violation of Section 1 of the Sherman Act because defendant NAR allegedly established mandatory anticompetitive policies for the multiple listing services and its member brokers regarding the setting and payment of the buyer broker commission. The plaintiff further alleges that the defendant franchisors conspired with NAR by requiring their respective franchisees to comply with NAR’s policies and Code of Ethics. The plaintiff seeks a permanent injunction enjoining the defendants from requiring home sellers to pay buyer broker commissions or to otherwise restrict competition among buyer brokers, an award of damages and/or restitution, attorneys fees and costs of suit. The Company was served with the complaint on March 21, 2019. Plaintiff’s counsel has filed a motion to appoint lead counsel in the case, which has yet to be briefed or decided by the court.
Sawbill Strategic, Inc. v. The National Association of Realtors, Homeservices of America, Inc., Keller Williams Realty, Inc., Realogy Holdings Corp., and RE/MAX Holdings, Inc. (U.S. District Court for the CentralNorthern District of California)Illinois). This is a purportedputative class action broughtseeking to certify the same class, based on the same allegations and against the same defendants as the Moehrl litigation. On April 17, 2019, plaintiff filed a motion to consolidate the Sawbill and Moehrl litigation.
Sitzer and Winger v. The National Association of Realtors, Realogy Holdings Corp., Homeservices of America, Inc., RE/MAX Holdings, Inc., and Keller Williams Realty, Inc. (U.S. District Court for the Western District of Missouri). This is a putative class action complaint filed on April 29, 2019 by four California residentsplaintiffs Joshua Sitzer and Amy Winger against 15 defendants, including RealogyNAR, the Company, Homeservices of America, Inc., RE/MAX Holdings, Inc., and certainKeller Williams Realty, Inc. The complaint contains substantially similar allegations, and seeks the same relief under the Sherman Act, as the Sawbill and Moehrl litigations. The Sitzer litigation is limited both in allegations and relief sought to the State of its subsidiaries, PHH CorporationMissouri, and PHH Home Loans, LLC (a joint venture between Realogy and PHH), alleging violationsincludes an additional cause of Section 8(a) of RESPA. On May 19, 2017, the parties held a mediation session, at which they agreed in principle to a settlementaction for alleged violation of the action, pursuant to whichMissouri Merchandising Practices Act, or MMPA. The Company has not yet been served with the complaint.
The Company would pay approximately $8 million (or one-halfdisputes these allegations, believes it has complied with all applicable laws and regulations and will vigorously defend these actions. Given the early stages of the settlement). In settling the matter, the Company specifically denied any wrongdoing with respect to the claims asserted in the case. Aseach of these cases, we cannot estimate a resultrange of the settlement, the Company accrued $8 million in the second quarter of 2017 and the liability is included in accrued expenses and other current liabilities on the Condensed Consolidated Balance Sheets. On January 29, 2018, the Court issued an order granting preliminary approval of the settlement, directed class notices to be sent by February 2018 and set the hearing on final approval of the settlementreasonably possible losses for August 16, 2018. Class notices were sent in February 2018.this litigation.
The Company is involved in certain other claims and legal actions arising in the ordinary course of our business. Such litigation, regulatory actions and other proceedings may include, but are not limited to, actions relating to intellectual property, commercial arrangements, franchising arrangements, the fiduciary duties of brokers, actions against our title company alleging it knew or should have known that others were committing mortgage fraud, standard brokerage disputes like the failure to disclose accurate square footage or hidden defects in the property such as mold, vicarious liability based upon conduct of individuals or entities outside of our control, including franchisees and independent sales agents, antitrust
and anti-competition claims, general fraud claims (including wire fraud associated with third-party diversion of funds from a brokerage transaction), employment law claims, including claims challenging the classification of our sales agents as independent contractors, wage and hour classification claims and claims alleging violations of RESPA or state consumer fraud statutes. While the results of such claims and legal actions cannot be predicted with certainty, we do not believe based on information currently available to us that the final outcome of current proceedings against the Company will have a material adverse effect on our consolidated financial position, results of operations or cash flows. In addition, with the increasing requirements resulting from government laws and regulations concerning data breach notifications and data privacy and protection obligations, claims associated with these laws may become more common.
* * *
The Company believes that it has adequately accrued for legal matters as appropriate. The Company records litigation accruals for legal matters which are both probable and estimable.
Litigation and other disputes are inherently unpredictable and subject to substantial uncertainties and unfavorable resolutions could occur. In addition, class action lawsuits can be costly to defend and, depending on the class size and claims, could be costly to settle. As such, the Company could incur judgments or enter into settlements of claims with liability that are materially in excess of amounts accrued and these settlements could have a material adverse effect on the Company’s financial condition, results of operations or cash flows in any particular period.
Cendant Corporate LitigationLiabilities and Guarantees to Cendant and Affiliates
Realogy Group (then Realogy Corporation) separated from Cendant on July 31, 2006 (the "Separation"), pursuant to a plan by Cendant (now known as Avis Budget Group, Inc.) to separate into four independent companies—one for each of Cendant's business units—real estate services (Realogy Group), travel distribution services ("Travelport"), hospitality services, including timeshare resorts ("Wyndham Worldwide"), and vehicle rental ("Avis Budget Group"). Pursuant to the Separation and Distribution Agreement dated as of July 27, 2006 among Cendant, Realogy Group, Wyndham Worldwide and Travelport (the "Separation and Distribution Agreement"), each of Realogy Group, Wyndham Worldwide and Travelport have assumed certain contingent and other corporate liabilities (and related costs and expenses), which are primarily related to each of their respective businesses. In addition, Realogy Group has assumed 62.5% and Wyndham Worldwide has assumed 37.5% of certain contingent and other corporate liabilities (and related costs and expenses) of Cendant or its
subsidiaries, which are not primarily related to any of the respective businesses of Realogy Group, Wyndham Worldwide, Travelport and/or Cendant’s vehicle rental operations, in each case incurred or allegedly incurred on or prior to the date of the separation of Travelport from Cendant.
* * *
The Company believes that it has adequately accrued for legal matters as appropriate. The Company records litigation accruals for legal matters which are both probable and estimable.
Litigation and other disputes are inherently unpredictable and subject to substantial uncertainties and unfavorable resolutions could occur. In addition, class action lawsuits can be costly to defend and, depending on the class size and claims, could be costly to settle. As such, the Company could incur judgments or enter into settlements of claims with liability that are materially in excess of amounts accrued and these settlements could have a material adverse effect on the Company’s financial condition, results of operations or cash flows in any particular period.
Cendant Corporate Liabilities and Guarantees to Cendant and Affiliates
In 2006, Realogy Group entered into certain guarantee commitments with Cendant (pursuant to the assumption of certain liabilities and the obligation to indemnify Cendant, Wyndham Worldwide and Travelport for such liabilities). These guarantee arrangements primarily relate to certain contingent litigation liabilities, contingent tax liabilities, and other corporate liabilities, of which Realogy Group assumed and is generally responsible for 62.5%.
The due to former parent balance was $18$21 million at both March 31, 20182019 and December 31, 2017,2018, respectively. The due to former parent balance was comprised of the Company’s portion of the following: (i) Cendant’s remaining state and foreign contingent tax liabilities, (ii) accrued interest on contingent tax liabilities, (iii) potential liabilities related to Cendant’s terminated or divested businesses, and (iv) potential liabilities related to the residual portion of accruals for Cendant operations.
Tax Matters
The Company is subject to income taxes in the United States and several foreign jurisdictions. Significant judgment is required in determining the worldwide provision for income taxes and recording related assets and liabilities. In the ordinary course of business, there are many transactions and calculations where the ultimate tax determination is uncertain. The Company is regularly under audit by tax authorities whereby the outcome of the audits is uncertain. The Company believes there is appropriate support for positions taken on its tax returns. The liabilities that have been recorded represent the best estimates of the probable loss on certain positions and are adequate for all open years based on an assessment of many factors including past experience and interpretations of tax law applied to the facts of each matter. However, the outcomes of tax audits are inherently uncertain.
Escrow and Trust Deposits
As a service to its customers, the Company administers escrow and trust deposits which represent undisbursed amounts received for the settlement of real estate transactions. Deposits at FDIC-insured institutions are insured up to $250 thousand. These escrow and trust deposits totaled $548$550 million at March 31, 20182019 and $469$426 million at December 31, 20172018. These escrow and trust deposits are not assets of the Company and, therefore, are excluded from the accompanying Condensed Consolidated Balance Sheets. However, the Company remains contingently liable for the disposition of these deposits.
The reportable segments presented below represent the Company’s operating segments for which separate financial information is available and which is utilized on a regular basis by its chief operating decision maker to assess performance and to allocate resources. In identifying its reportable segments, the Company also considers the nature of services provided
by its operating segments. Management evaluates the operating results of each of its reportable segments based upon revenue and Operating EBITDA. Operating EBITDA is defined by us as net income (loss) before depreciation and amortization, interest expense, net (other than relocation services interest for securitization assets and securitization
obligations), income taxes, and other items that are not core to the operating activities of the Company such as restructuring charges, former parent legacy items, losses on the early extinguishment of debt, asset impairments, gains or losses on discontinued operations and gains or losses on the sale of investments or other assets. The Company’s presentation of Operating EBITDA may not be comparable to similar measures used by other companies.
| | | | Revenues (a) (b) | Revenues (a) (b) |
| | Three Months Ended March 31, | Three Months Ended March 31, |
| | 2018 | | 2017 | 2019 | | 2018 |
| Real Estate Franchise Services | $ | 176 |
| | $ | 170 |
| $ | 163 |
| | $ | 176 |
|
| Company Owned Real Estate Brokerage Services | 917 |
| | 897 |
| 816 |
| | 917 |
|
| Relocation Services | 79 |
| | 77 |
| 76 |
| | 79 |
|
| Title and Settlement Services | 120 |
| | 120 |
| 114 |
| | 120 |
|
| Corporate and Other (c) | (63 | ) | | (61 | ) | (55 | ) | | (63 | ) |
| Total Company | $ | 1,229 |
| | $ | 1,203 |
| $ | 1,114 |
| | $ | 1,229 |
|
_______________
| |
| (a) | Transactions between segments are eliminated in consolidation. Revenues for the Real Estate Franchise Services segment include intercompany royalties and marketing fees paid by the Company Owned Real Estate Brokerage Services segment of $63$55 million and $61$63 million for the three months ended March 31, 20182019 and 2017,2018, respectively. Such amounts are eliminated through the Corporate and Other line. |
| |
| (b) | Revenues for the Relocation Services segment include intercompany referral commissions paid by the Company Owned Real Estate Brokerage Services segment of $7 million and $8 million for both the three months ended March 31, 2019 and 2018, and 2017.respectively. Such amounts are recorded as contra-revenues by the Company Owned Real Estate Brokerage Services segment. There are no other material intersegment transactions. |
| |
| (c) | Includes the elimination of transactions between segments. |
|
| | | | | | | |
| | Operating EBITDA |
| | Three Months Ended March 31, |
| | 2019 | | 2018 |
| Real Estate Franchise Services | $ | 90 |
| | $ | 105 |
|
| Company Owned Real Estate Brokerage Services | (62 | ) | | (45 | ) |
| Relocation Services | 2 |
| | (1 | ) |
| Title and Settlement Services | (9 | ) | | (6 | ) |
| Corporate and Other (a) | (25 | ) | | (19 | ) |
| | | | |
| Less: Depreciation and amortization (b) | 49 |
| | 50 |
|
| Interest expense, net | 63 |
| | 33 |
|
| Income tax benefit | (35 | ) | | (19 | ) |
| Restructuring costs, net (c) | 12 |
| | 30 |
|
| Lease asset impairment | 1 |
| | — |
|
| Loss on the early extinguishment of debt (d) | 5 |
| | 7 |
|
| Net loss attributable to Realogy Holdings and Realogy Group | $ | (99 | ) | | $ | (67 | ) |
|
| | | | | | | |
| | Operating EBITDA |
| | Three Months Ended March 31, |
| | 2018 | | 2017 |
| Real Estate Franchise Services | $ | 105 |
| | $ | 102 |
|
| Company Owned Real Estate Brokerage Services | (45 | ) | | (21 | ) |
| Relocation Services | (1 | ) | | 1 |
|
| Title and Settlement Services | (6 | ) | | 2 |
|
| Corporate and Other (a) | (19 | ) | | (23 | ) |
| Total Company | $ | 34 |
| | $ | 61 |
|
| Less: Depreciation and amortization (b) | $ | 50 |
| | $ | 50 |
|
| Interest expense, net | 33 |
| | 39 |
|
| Income tax benefit | (19 | ) | | (9 | ) |
| Restructuring costs (c) | 30 |
| | 5 |
|
| Loss on the early extinguishment of debt (d) | 7 |
| | 4 |
|
| Net loss attributable to Realogy Holdings and Realogy Group | $ | (67 | ) | | $ | (28 | ) |
_______________
| |
| (a) | Includes the elimination of transactions between segments. |
| |
| (b) | Depreciation and amortization for the three months ended March 31, 2018 includes $2 million of amortization expense related to Guaranteed Rate Affinity's purchase accounting included in the "Equity in (earnings) losses of unconsolidated entities" line on the Condensed Consolidated Statement of Operations. |
| |
| (c) | IncludesThe three months ended March 31, 2019 includes restructuring charges of $2 million in the Real Estate Franchise Services segment, $17$4 million in the Company Owned Real Estate Brokerage Services segment, $8$3 million in the Cartus segment, $1 million at Title and Settlement Services segment and $2$4 million in Corporate and Other for the three months ended March 31, 2018. Includes restructuring charges of $5 million in the Company Owned Real Estate Brokerage Services segment for the three months ended March 31, 2017.Other. |
The three months ended March 31, 2018 includes restructuring charges of $2 million in the Real Estate Franchise Services segment, $17 million in the Company Owned Real Estate Brokerage Services segment, $8 million in the Cartus segment, $1 million at the Title and Settlement Services segment and $2 million in Corporate and Other.
| |
| (d) | Loss on the early extinguishment of debt is recorded in the Corporate and Other segment. |
Item 2. Management's Discussion and Analysis of Financial Condition and Results of Operations.
The following discussion and analysis should be read in conjunction with our Condensed Consolidated Financial Statements and accompanying notes thereto included elsewhere herein and with our Consolidated Financial Statements and accompanying notes included in the 20172018 Form 10-K. Unless otherwise noted, all dollar amounts in tables are in millions. Neither Realogy Holdings, the indirect parent of Realogy Group, nor Realogy Intermediate, the direct parent company of Realogy Group, conducts any operations other than with respect to its respective direct or indirect ownership of Realogy Group. As a result, the condensed consolidated financial positions, results of operations and cash flows of Realogy Holdings, Realogy Intermediate and Realogy Group are the same. This Management's Discussion and Analysis of Financial Condition and Results of Operations, or MD&A, contains forward-looking statements. See "Forward-Looking Statements" in this report and "Forward-Looking Statements" and "Risk Factors" in our 20172018 Form 10-K for a discussion of the uncertainties, risks and assumptions associated with these statements. Actual results may differ materially from those contained in any forward-looking statements.
OVERVIEW
We are a global provider of real estate and relocation services and report our operations in the following four segments:
| |
| • | Real Estate Franchise Services (known as Realogy Franchise Group or RFG)—franchises the Century 21®, Coldwell Banker®, Coldwell Banker Commercial®, ERA®��, Sotheby's International Realty® and Better Homes and Gardens® Real Estate brand names.names and launched franchise sales of the Corcoran® brand in January 2019. As of March 31, 2018,2019, our real estate franchise systems and proprietary brands had approximately 289,000301,900 independent sales agents worldwide, (which included approximately 50,100 company owned brokerage independent sales agents), including approximately 190,800 independent sales agents operating in the U.SU.S. (which included approximately 50,200 company owned brokerage independent sales agents). As of March 31, 2018,2019, our real estate franchise systems and proprietary brands had approximately 15,10016,600 offices (which included approximately 770 company owned brokerage offices) worldwide in 117113 countries and territories, including approximately 6,000 brokerage offices in the U.S.(which included approximately 750 company owned brokerage offices). |
| |
| • | Company Owned Real Estate Brokerage Services (known as NRT)—operates a full-service real estate brokerage business with approximately 770750 owned and operated brokerage offices with approximately 50,10050,200 independent sales agents principally under the Coldwell Banker®, Corcoran®, Sotheby’s International Realty®, ZipRealty®, Citi HabitatsSM and Climb Real Estate® brand names in more than 50many of the 100 largest metropolitan areas in the U.S. This segment also included the Company's share of earnings for our PHH Home Loans venture, which was sold to PHH in the first quarter of 2018 and we transitioned to our new mortgage origination joint venture, with Guaranteed Rate Affinity, which is included in the financial results of the Title and Settlement Services segment. |
| |
| • | Relocation Services (known as Cartus®)—primarily offers clients employee relocation services such as homesale assistance, providing home equity advances to transferees (generally guaranteed by the individual's employer), home finding and other destination services, expense processing, relocation policy counseling and consulting services, arranging household goods moving services, coordinating visa and immigration support, intercultural and language training and group move management services. In addition, we provide home buying and selling assistance to members of affinity clients. |
Title and Settlement Services (known as Title Resource Group or TRG)—provides full-service title and settlement services to real estate companies, affinity groups, corporations and financial institutions with many of these services provided in connection with the Company's real estate brokerage and relocation services business. This segment also includes the Company's share of earnings, including start-up costs, for our Guaranteed Rate Affinity joint venture.
| |
| • | Title and Settlement Services (known as Title Resource Group or TRG)—provides full-service title and settlement services to real estate companies, affinity groups, corporations and financial institutions with many of these services provided in connection with the Company's real estate brokerage and relocation services business. This segment also includes the Company's share of equity earnings and losses for our Guaranteed Rate Affinity mortgage origination joint venture. |
We pursue technology-enabled solutions for the real estate brokerages and independent sales agents in our franchise system as well as their customers, including through ZapLabs LLC, our wholly-owned subsidiary and developer of our proprietary technology platform.
RECENT DEVELOPMENTS
RefinancingLiquidity and Capital Resources Update
In February 2018,March 2019, the Company completed debt transactions which:
amendedissued $550 million of 9.375% Senior Notes due in April 2027. We used $540 million of the net proceeds to repay a portion of outstanding borrowings under our Revolving Credit Facility. In February 2019, the Company used borrowings under its Revolving Credit Facility by increasingand cash on hand to fund the capacity from $1,050redemption of all of its outstanding $450 million 4.50% Senior Notes, which were due in April 2019.
The Company expects to $1,400 millionprioritize investing in its business and extendingreducing indebtedness over other potential uses of cash until it is able to reduce its consolidated leverage ratio (as defined in the maturity date from October 2020indenture governing the 9.375% Senior Notes) to February 2023;below 4.00 to 1.00, although the Company currently anticipates continuing its quarterly cash dividend. Accordingly, during this period, the Company will not repurchase common stock pursuant to its existing share repurchase programs.
refinancedThere can be no assurances as to the existing aggregate $733 millionlength of time that will be necessary for the Company to achieve this reduction in its consolidated leverage ratio or whether it will be successful in reducing and maintaining its consolidated leverage ratio below 4.00 to 1.00. Moreover, there can be no assurances as to the timing, frequency or amounts of any dividends or share repurchases in the future and such determinations will be subject to the discretion of the Company's Board of Directors and will depend on a variety of factors, including the Company’s financial condition and results of operations, contractual restrictions, including restrictive covenants contained in the Senior Secured Credit Agreement, Term Loan A and Term Loan A-1 tranches due October 2020 and July 2021, respectively, into a new single tranche of $750 million Term Loan A due February 2023 (which included incremental borrowings of $17 million); and
refinanced the existing $1,083 million Term Loan B due July 2022 with a new Term Loan B issued at par in the amount of $1,080 million and with a maturity date in February 2025.
The interest rates with respect to the Revolving Credit Facility, and Term Loan A are the sameindentures governing the Unsecured Notes, capital requirements and other factors that had been in place under the Term Loan A-1. The Term Loan A provides for quarterly amortization payments on the last dayBoard of each quarter, totaling per annum 2.5%, 2.5%, 5.0%, 7.5%Directors deems relevant.
Facility and 10.0% of the original principal amount of the Term Loan A, commencing June 30, 2018, with the balance of the Term Loan A due in full in February 2023. The interest rate and amortization with respectOperational Efficiencies Program
During 2019, we plan to Term Loan B is unchanged. Theaccelerate our office consolidation to reduce our storefront costs, as well as institute other terms of the Revolving Credit Facility, Term Loan A and Term Loan B are substantially the same as those in place prioroperational efficiencies to the transactions.
Leadership Realignment and Other Restructuring Activities
Beginningdrive profitability. In addition, beginning in the first quarter of 2018, the Company2019, we commenced the implementation of a plan to drive our business forwardtransform and enhance stockholder value. The keycentralize certain aspects of this plan include senior leadership realignment, an enhanced focus onour operational support and drive changes in how we serve our affiliated independent sales agents from a marketing and technology perspective to help such agents be more productive and talent, as well as further attention on office footprint and other operational efficiencies, including the consolidation of certain support services providedenable them to NRT and RFG.make their businesses more profitable.
Total expected restructuring costs of approximately $41$53 million are currently anticipated to be incurred through the end of 2018.2019. As of March 31, 2018,2019, cost savings related to thethese restructuring activities were estimated to be approximately $45$50 million on an annual run rate basis.basis, with approximately $25 million of those cost savings expected to be realized in 2019. In addition to the $25 million of cost savings from restructuring activities, there are approximately $45 million of additional cost savings initiatives being implemented and expected to be realized in 2019. These costs savings are designed to partially offset inflation and other costs.
The following table reflects the total amount of restructuring costs for the Company's restructuringFacility and Operational Efficiencies program related to leadership realignment and other restructuring activities by reportable segment:
|
| | | | | | | | | | | |
| | Total amount expected to be incurred | | Amount incurred to date | | Total amount remaining to be incurred |
| RFG | $ | 2 |
| | $ | 2 |
| | $ | — |
|
| NRT | 27 |
| | 16 |
| | 11 |
|
| Cartus | 9 |
| | 8 |
| | 1 |
|
| TRG | 1 |
| | 1 |
| | — |
|
| Corporate and Other | 2 |
| | 2 |
| | — |
|
| Total | $ | 41 |
| | $ | 29 |
| | $ | 12 |
|
|
| | | | | | | | | | | |
| | Total amount expected to be incurred | | Amount incurred to date | | Total amount remaining to be incurred |
| Real Estate Franchise Services | $ | — |
| | $ | — |
| | $ | — |
|
| Company Owned Real Estate Brokerage Services | 45 |
| | 3 |
| | 42 |
|
| Relocation Services | 4 |
| | 3 |
| | 1 |
|
| Title and Settlement Services | 2 |
| | 1 |
| | 1 |
|
| Corporate and Other | 2 |
| | 2 |
| | — |
|
| Total | $ | 53 |
| | $ | 9 |
| | $ | 44 |
|
CURRENT BUSINESS AND INDUSTRY TRENDS
According to the National Association of Realtors ("NAR"), during the first quarter of 2018,2019, homesale transaction volume increased 2%decreased 4% due to a 2%7% decrease in the number of homesale transactions, partially offset by a 4%2% increase in the average homesale price.
We believe that the increasechallenging housing market conditions during 2018, which intensified in severity during the average homesales price is primarily a functionlast four months of high demand against a limited supply of homes for sale. A number of factors may have contributedthe year, continued to the decline in homesale transactions duringnegatively impact the first quarter of 2018, including2019. Specifically, we believe reduced affordability as a result of continued constrained inventory, higher average homesale prices and the limited supplyimpact of inventory, mortgage rate increases,volatility in the second half of 2018, as well as a number of other factors, such as personal income tax reform, inclement weather incontributed to the Northeast and Midwest and stock market volatility.decline. We are unable to extrapolate the relative impact that each of these factors may have had on regional and local markets in the United States, however, we believe that regional NAR data suggests that inventory constraints are an important, but not the only, factor influencing homesale transaction volume.
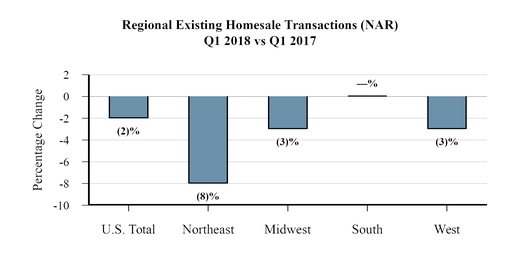
RFG and NRT homesale transaction volume on a combined basis increased 4% indecreased 9% during the first quarter ofthree months ended March 31, 2019 compared to the three months ended March 31, 2018. NRTNRT's transaction volume increased 2%decreased 11%, as a result of a 1%9% decrease in existing homesale transactions and a 3% increase2% decrease in the average homesale price. RFG's transaction volume increased 5%decreased 8%, as a result of a 1%10% decrease in existing homesale transactions, andpartially offset by a 6%2% increase in average homesale price.
We believe that while the industry fundamentals described above drove a significant portion of our decline in homesale transaction volume in the first quarter of 2019, we were also negatively impacted by our geographic concentration as well as the intensifying competitive environment. Specifically, our transaction volume was negatively impacted by our footprint in California, which experienced a larger homesale transaction volume decline in the first quarter of 2019 than the national average.
In addition, the growing intensity of competition for the affiliation of independent sales agents negatively impacted recruitment and retention efforts in certain geographies and contributed to the decline in homesale transaction volume at both NRT and RFG. We believe that certain of our competitors have investors that appear to be supportive of a model that pursues increases in market share over profitability, which not only exacerbates competition for independent sales agents, but places additional pressure on the share of commission income received by the agent.
As of their most recent release on April 30, 2019, NAR is forecasting existing homesale transaction volume to increase 2% for the full year 2019 compared to 2018. NAR's full year 2019 forecast includes a homesale transaction volume decrease in the first quarter of 2019 offset by expected volume growth during the rest of 2019. NAR's quarterly year-over-year forecasts for homesale transaction volume for 2019 compared to 2018 are as follows:
_______________
| |
| (a) | Q1 homesale transaction volume is calculated using existing homesale transactions and average price as of the most recent NAR press release on April 22, 2019. |
| |
| (b) | Forecasted homesale transaction volume is calculated using seasonally adjusted homesale transactions and median price as of the most recent NAR forecast release on April 30, 2019. |
Inventory. Although inventory levels have recently shown some signs of improvement, low housing inventory levels continue to be an industry-wide concern, in particular in certain highly sought-after geographies and at lower price points. According to NAR, the inventory of existing homes for sale in the U.S. was 1.64 million as of March 2018 and has increased to 1.68 million at the end of March 2019. As a result, inventory has increased from 3.6 months of supply in March 2018 to 3.9 months as of March 2019. However, these levels continue to be significantly below the 10-year average of 5.8 months, the 15-year average of 6.1 months and the 25-year average of 5.8 months.
Mortgage Rates. According to Freddie Mac, mortgage rates on commitments for a 30-year, conventional, fixed-rate first mortgage averaged 4.37% for the first quarter of 2019 compared to 4.27% for the first quarter of 2018. While mortgage rates reached as high as 4.87% in November 2018, rates have recently moderated, and on March 31, 2019 were 4.27%, according to Freddie Mac. Increases in mortgage rates adversely impact housing affordability and we have been and could continue to be negatively impacted by a rising interest rate environment. For example, a rise in mortgage rates could result in decreased homesale transaction volume if potential home sellers choose to stay with their lower mortgage rate rather than sell their home and pay a higher mortgage rate with the purchase of another home or, similarly, if potential home buyers choose to rent rather than pay higher mortgage rates. However, we believe that over the medium to long-term, rising wages, the availability of alternative mortgage arrangements and increasing rent prices for the mainstream housing market may help offset the impact of rising mortgage rates to some degree.
Affordability. The composite housing affordability index, as reported by NAR, decreased from 162 for February 2018 to 157 for February 2019, which is still above the 25-year average of 143. The affordability index hit the lowest point since 2008 in June 2018 at 138. As noted above, we believe the affordability decline is a result of lower inventory levels, which have continued to put upward pressure on home prices with additional pressure from higher mortgage rates along with other factors. A housing affordability index above 100 signifies that a family earning the median income has sufficient income to purchase a median-priced home, assuming a 20 percent down payment and ability to qualify for a mortgage.
Recruitment and Retention of Independent Sales Agents; Commission Income. Recruitment and retention of independent sales agents and independent sales agent teams are critical to the business and financial results of a brokerage, including our company owned brokerages and those operated by our affiliated franchisees. Competition for independent sales agents in our industry, including within our franchise system, is high, in particular with respect to more productive sales agents. Most of a brokerage's real estate listings are sourced through the sphere of influence of their independent sales agents, notwithstanding the growing influence of internet-generated leads. Competition for independent sales agents is generally subject to numerous factors, including:
remuneration (such as sales commission percentage and other financial incentives paid to independent sales agents);
other expenses borne by independent sales agents;
leads or business opportunities generated for the independent sales agent from the brokerage;
independent sales agents' perception of the value of the broker's brand affiliation;
marketing and advertising efforts by the brokerage or franchisor;
the office manager, staff and fellow independent sales agents with whom they collaborate daily; and
technology, continuing professional education, and other services provided by the brokerage or franchisor.
We believe that the influencea variety of independent sales agents and independent sales agent teams has increasedfactors in recent years and, together with the increasing competition from other brokerages, hashave negatively impacted the recruitment and retention of independent sales agents in the industry and has increasingly impacted the recruitment and retention of top producing agents. Such factors include increasing competition, changes in the spending patterns of independent sales agents (as more independent sales agents purchase services from third-parties outside of their affiliated broker) and the growth in independent sales agent teams. The continued competition for productive agents could continue to have a negative impact on our homesale transaction volume and could continue to put upward pressure on the average share of commissions earned by affiliated independent sales agents. These factors
NRT and RFG have also put pressure on RFG's royalty revenue compared to homesale transaction volume as the economics for agents and agent teams change.
Commencing in late 2016, NRT launched strategic initiatives focused on the targeted recruitment and retentionaddressing current market dynamics by expanding our base of affiliated independent sales agents.agents and affiliated franchisees.
For example, NRT continues to expand the use of commission plans other than the traditional graduated commission model, including plans that charge agents for certain activities. Separately, we recently introduced a collection of marketing tools aimed at increasing independent agent success, including Listing Concierge—a full service solution for the design, creation and distribution of automated customized property listings—as well as products designed to facilitate agent branding and customer prospecting. We intend to further advance these marketing initiatives throughout 2019.
In late 2018, in collaboration with Home Partners of America, we also launched the cataLIST Program—a quick-cash sale program that keeps the independent sales agent at the center of the transaction. The program is currently available in select markets (Atlanta, Greater Dallas and Tampa) and expansion to additional markets is planned in 2019, as well as the launch of complementary build-on offerings.
In addition, RFG is implementing strategic initiatives built onintended to add new franchisees and expand the full-service real estate brokeragebase of independent sales agents, including through the expansion of RFG’s historical scope of potential franchisee candidates as well as through new pricing model utilized by NRT instructures and new franchise brands.
most markets by placing an even greater focus on the quality of our services and more aggressively utilizing financial incentives to strengthen our recruiting and retention practices. The execution of the initiatives had a positive impact on our efforts to recruit and retain high-performing independent sales agents during 2017, which we believe was a key contributor to the rebuilding of our market share in 2017 from declines over the past several years. Execution of these initiatives resulted in increased spending on recruitment efforts and put upward pressure on the average share of commissions earned by affiliated independent sales agents.
While the execution of these recruiting and retention initiatives increased NRT's commission expense, and is expected to continue to increase, and adversely impact the margin earned by NRT, we expect that the continued execution of the initiatives and associated revenues from increased homesale transaction volume will (i) positively impact RFG results (via intercompany royalties) in the near term, (ii) over the longer term, improve NRT's operating results and (iii) continue to positively impact our market share.
NRT has relationships with developers, primarily in major cities, to provide marketing and brokerage services in new developments. New development closings generally have a development period of between 18 and 24 months from contracted date to closing. During 2017, NRT experienced stronger growth in its new development business with a significant increase in the number of closed transactions from 2016. This growth was largely due to the timing of closings of several major developments during the year. During the first quarter of 2018, there was a decrease in revenue related to our new development business as a result of lower closing volume due to long cycle times with irregular project completion timing. While our current new development pipeline remains robust over the next several years, due to the timing of anticipated closings and the cyclical nature of this business, we expect a reduction in the number of closed transactions in 2018 and a corresponding reduction in related earnings to NRT, with a significant portion of the remaining impact expected in the second quarter of 2018.
Low housing inventory levels continue to be an industry-wide concern. According to NAR, the inventory of existing homes for sale in the U.S. was 1.7 million and 1.8 million at the end of March 2018 and March 2017, respectively. The March 2018 inventory represents a national average supply of 3.6 months at the current homesales pace which is significantly below the 5.9 month 25-year average as of December 31, 2017.
As reported by NAR, the composite housing affordability index decreased to 160 for February 2018 from 164 for February 2017 as a result of lower inventory levels at higher prices and higher mortgage rates, partially offset by increasing wages. Despite the year over year decrease, the housing affordability index has continued to be at historically favorable levels and remains higher than the 25-year average of 142. An index above 100 signifies that a family earning the median income has sufficient income to purchase a median-priced home, assuming a 20 percent down payment and ability to qualify for a mortgage.
According to Freddie Mac, mortgage rates on commitments for a 30-year, conventional, fixed-rate first mortgage averaged 3.99% for 2017 and the rate at March 31, 2018 was 4.44%. Although mortgage rates have increased approximately 20 basis points to 4.44% as of March 31, 2018 from 4.20% as of March 2017, they continue to be at low levels compared to the 25-year average of 5.95%. While this increase adversely impacts housing affordability, we believe that rising wages, improving consumer confidence, the potential availability of alternative mortgage arrangements, increasing rent prices and a continuation of low inventory levels for the mainstream housing market may offset, in whole or in part, rising interest rates and may result in continued favorable demand conditions. Nevertheless, we could be negatively impacted by any rising interest rate environment as a rise in mortgage rates could result in decreased homesale transaction volume if potential home sellers choose to stay with their lower mortgage rate rather than sell their home and pay a higher mortgage rate with the purchase of another home or if potential home buyers choose to rent rather than pay higher mortgage rates.
Existing Homesales
For the quarter ended March 31, 2018,2019 compared to the same period in 2017,2018, NAR existing homesale transactions decreased to 1.11.0 million homes or down 2%7%. For the quarter ended above,March 31, 2019, RFG and NRT homesale transactions on a combined basis decreased 1%9% compared to the same period in 2017. Combined homesale transactions for RFG2018 due primarily to challenging market fundamentals, geographic concentration (in particular at NRT in California) and NRT benefited from successes under our initiatives focusedthe impact of competition on growingrecruitment and retaining our productive independent sales agent base. retention efforts at NRT.
The annualquarterly and quarterlyannual year-over-year trends in homesale transactions are as follows:
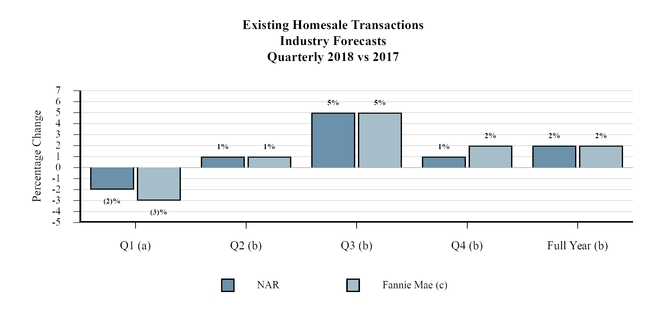
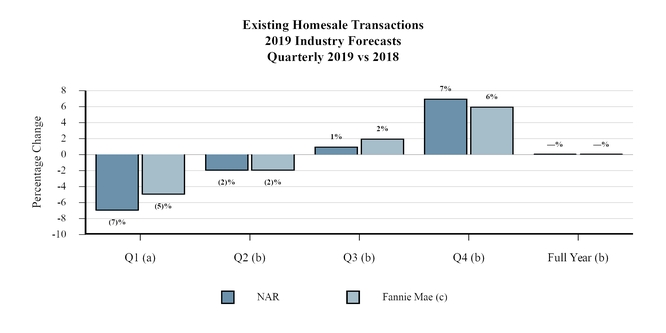 _______________
 | |
| (a) | HistoricalQ1 existing homesale data is as of the most recent NAR press release, which is subject to sampling error. |
| |
| (b) | Forecasted existing homesale data, on a seasonally adjusted basis, is as of the most recent NAR forecast. |
| |
| (c) | Forecasted existing homesale data, on a seasonally adjusted basis, is as of the most recent Fannie Mae press release. |
As of their most recent releases, NAR is forecasting existing homesaleshomesale transactions to increase 1%4% in 20192020 while Fannie Mae is forecasting an increase in existing homesale transactions ofto increase 2% in 2019.for the same period.
Existing Homesale Price
For the quarter ended March 31, 2018,2019 compared to the same periodsperiod in 2017,2018, NAR existing homesale average price increased 4%2%. For the quarter ended above,March 31, 2019, RFG and NRTNRT's average homesale price on a combined basis increased 5%1% compared to the same period in 2017.2018 and consisted of RFG's average homesale price increased 6% whileincrease of 2%, partially offset by NRT's average homesale price increased 3%decrease of 2%. The difference betweenNRT's geographic concentration in California and exposure to the averagehigh-end of the market drove the year-over-year decline in homesale price increase for RFG compared NRT is due to lower closing volume in NRT's new development business which is typically at a higher price point as well as lower transaction volume in the New York metropolitan market.overall industry. The annualquarterly and quarterlyannual year-over-year trends in the price of homes are as follows:
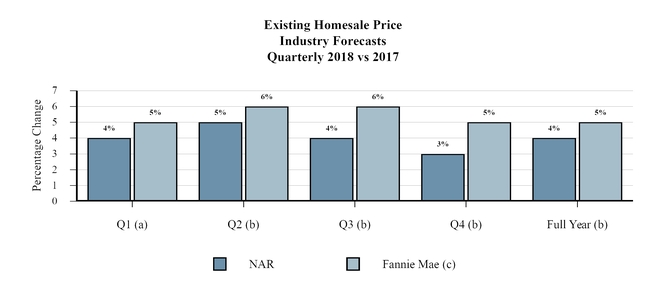
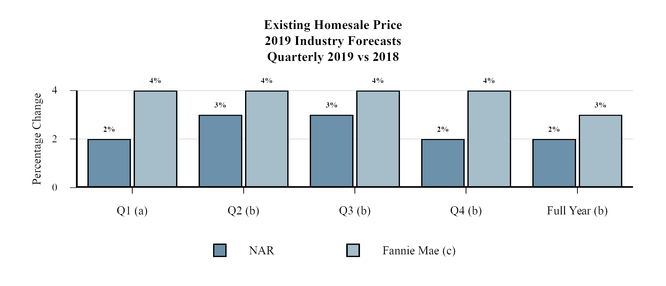 _______________
 | |
| (a) | HistoricalQ1 homesale price data is for existing homesale average price and is as of the most recent NAR press release. |
| |
| (b) | Forecasted homesale price data is for median price and is as of the most recent NAR forecast. |
| |
| (c) | Existing homesale price data is for median price and is as of the most recent Fannie Mae press release. |
As of their most recent releases, NAR is forecasting an increase in median existing homesale price of 3% in 20192020 while Fannie Mae is forecasting a 4% increase in 2019.2020.
* * *
We believe that long-term demand for housing and the growth of our industry are primarily driven by the affordability of housing, the economic health of the U.S. economy, demographic trends such as population growth, the increasegenerational transitions, increases in U.S. household formation, mortgage rate levels and mortgage availability, certain tax benefits, job growth, increases in renters that qualify as homebuyers, the inherent attributes of homeownership versus renting and the influence of local housing
dynamics of supply versus demand. At this time, mostcertain of these factors are generally trending favorably.favorably, such as household formation and job growth. Factors that may negatively affect continued growth in the housing industry include:
continued insufficient inventory levels;levels or stagnant and/or declining home prices;
further reduction in the affordability of homes;
higher mortgage rates due to increases in long-term interest rates and increasing down payment requirements as well as reduced availability of mortgage financing;
reduced affordability of homes;
certain provisions of the 2017 Tax Act that directly impact traditional incentives associated with home ownership and may reduce the financial distinction between renting and owning a home, including those that reduce the amount that certain taxpayers would be allowed to deduct for home mortgage interest or state, local and property taxes;
lack of building of new housing or irregular timing of new development closings leading to lower unit sales at NRT, which has relationships with developers, primarily in major cities, to provide marketing and brokerage services in new developments;
homeowners retaining their homes for longer periods of time;
changing attitudes towards home ownership;
decreasing consumer confidence in the economy and/or the residential real estate market;
an increase in potential homebuyers with low credit ratings or inability to afford down payments;
the impact of limited or negative equity of current homeowners, as well as the lack of available inventory may limit their proclivity to purchase an alternative home;
economic stagnation or contraction in the U.S. economy;
weak credit markets and/or instability of financial institutions;
increased levels of unemployment and/or stagnant wage growth in the U.S.;
a decline in home ownership levels in the U.S.;
other legislative or regulatory reforms, including but not limited to reform that adversely impacts the financing of the U.S. housing market;market, changes relating to RESPA, potential reform of Fannie Mae and Freddie Mac, immigration reform, and further potential tax code reform;
renewed high levels of foreclosure activity;
natural disasters, such as hurricanes, earthquakes, wildfires, mudslides and other events that disrupt local or regional real estate markets; and
geopolitical and economic instability.
Many of the trends impacting our businesses that derive revenue from homesales also impact Cartus, which is a globalthe leading provider of outsourced employeeglobal relocation services. In addition to general residential housing trends, key drivers of Cartus are global corporate spending on relocation services, which continue to shift to lower cost relocation benefits as corporate clients engage in cost reduction initiatives and/or restructuring programs as well as changes in employment relocation trends. Cartus is subject to a competitive pricing environment and lower average revenue per relocation as a result of a shift in the mix of services and number of services being delivered per move. These factors have and may continue to put pressure on the growth and profitability of this segment. Moreover, the 2017 Tax Act suspends the deductibility of certain home moving expenses, which may result in fewer instances of specific relocation services.
* * *
While data provided by NAR and Fannie Mae are two indicators of the direction of the residential housing market, we believe that homesale statistics will continue to vary between us and NAR and Fannie Mae because:
they use survey data and estimates in their historical reports and forecasting models, which are subject to sampling error, whereas we use data based on actual reported results;
there are geographical differences and concentrations in the markets in which we operate versus the national market. For example, many of our company owned brokerage offices are geographically located where average homesale prices are generally higher than the national average and therefore NAR survey data will not correlate with NRT's results;
comparability is also diminished due to NAR’s utilization of seasonally adjusted annualized rates whereas we report actual period-over-period changes and their use of median price for their forecasts compared to our average price;
NAR historical data is subject to periodic review and revision and these revisions have been material in the past, and could be material in the future; and
NAR and Fannie Mae generally update their forecasts on a monthly basis and a subsequent forecast may change materially from a forecast that was previously issued.
While we believe that the industry data presented herein is derived from the most widely recognized sources for reporting U.S. residential housing market statistical data, we do not endorse or suggest reliance on this data alone. We also note that forecasts are inherently uncertain or speculative in nature and actual results for any period could materially differ.
KEY DRIVERS OF OUR BUSINESSES
Within RFG and NRT, we measure operating performance using the following key operating metrics: (i) closed homesale sides, which represents either the "buy" side or the "sell" side of a homesale transaction, (ii) average homesale price, which represents the average selling price of closed homesale transactions, and (iii) average homesale broker commission rate, which represents the average commission rate earned on either the "buy" side or "sell" side of a homesale transaction. For RFG, we also use net royalty per side, which represents the royalty payment to RFG for each homesale transaction side taking into account royalty rates, volume incentives achieved and non-standard incentives. We utilize net royalty revenue per transaction as it reflects the impact of changes in average homesale price and represents the royalty revenue impact of each incremental side.
Within Cartus, we measure operating performance using the following key operating statistics: (i) initiations, which represent the total number of new transferees and the total number of real estate closings for affinity members and (ii) referrals, which represent the number of referrals from which we earn revenue from real estate brokers.
In TRG, operating performance is evaluated using the following key metrics: (i) purchase title and closing units, which represent the number of title and closing units we process as a result of home purchases, (ii) refinance title and closing units, which represent the number of title and closing units we process as a result of homeowners refinancing their home loans, and (iii) average fee per closing unit, which represents the average fee we earn on purchase title and refinancing title sides. An increase or decrease in homesale transactions will impact the financial results of TRG; however, the financial results are not significantly impacted by a change in homesale price. We believe that further increases in mortgage rates in the future will most likely have a negative impact on refinancing title and closing units.
The following table presents our drivers for the three months ended March 31, 20182019 and 2017.2018. See "Results of Operations" below for a discussion as to how these drivers affected our business for the periods presented.
| | | | Three Months Ended March 31, | Three Months Ended March 31, |
| | 2018 | | 2017 | | % Change | 2019 | | 2018 | | % Change |
| RFG (a) | | | | | | | | | | |
| Closed homesale sides | 223,990 |
| | 225,250 |
| | (1 | %) | 202,662 |
| | 223,990 |
| | (10 | %) |
| Average homesale price | $ | 292,580 |
| | $ | 275,828 |
| | 6 | % | $ | 298,361 |
| | $ | 292,580 |
| | 2 | % |
| Average homesale broker commission rate | 2.50 | % | | 2.50 | % | | — |
| 2.48 | % | | 2.50 | % | | (2 | ) bps |
Net royalty per side (b) | $ | 310 |
| | $ | 298 |
| | 4 | % | $ | 303 |
| | $ | 310 |
| | (2 | %) |
| NRT | | | | | | | | | | |
| Closed homesale sides | 66,097 |
| | 66,570 |
| | (1 | %) | 60,442 |
| | 66,097 |
| | (9 | %) |
| Average homesale price | $ | 525,020 |
| | $ | 509,197 |
| | 3 | % | $ | 511,922 |
| | $ | 525,020 |
| | (2 | %) |
| Average homesale broker commission rate | 2.45 | % | | 2.45 | % | | — |
| 2.41 | % | | 2.45 | % | | (4 | ) bps |
| Gross commission income per side | $ | 13,666 |
| | $ | 13,261 |
| | 3 | % | $ | 13,212 |
| | $ | 13,666 |
| | (3 | %) |
| Cartus | | | | | | | | | | |
| Initiations | 37,953 |
| | 36,515 |
| | 4 | % | 38,484 |
| | 37,953 |
| | 1 | % |
| Referrals | 16,031 |
| | 15,203 |
| | 5 | % | 14,879 |
| | 15,526 |
| | (4 | %) |
| TRG | | | | | | | | | | |
| Purchase title and closing units | 31,741 |
| | 31,297 |
| | 1 | % | 28,044 |
| | 31,741 |
| | (12 | %) |
| Refinance title and closing units | 5,410 |
| | 8,533 |
| | (37 | %) | 4,011 |
| | 5,410 |
| | (26 | %) |
| Average fee per closing unit | $ | 2,161 |
| | $ | 2,001 |
| | 8 | % | $ | 2,267 |
| | $ | 2,161 |
| | 5 | % |
_______________
| |
| (a) | Includes all franchisees except for NRT. |
| |
(b) | Net royalty per side amounts include the effect of volume incentives and non-standard incentives granted to franchisees. The net royalty per side increase of 4% was below the average homesale price increase of 6% as a result of an increase in sales incentives primarily due to a shift in mix to our top 250 franchisees. |
A decline in the number of homesale transactions and decline in homesale prices could adversely affect our results of operations by: (i) reducing the royalties we receive from our franchisees, (ii) reducing the commissions our company owned brokerage operations earn, (iii) reducing the demand for our title and settlement services, (iv) reducing the referral fees we earn in our relocation services business, and (v) increasing the risk of franchisee default due to lower homesale volume. Our results could also be negatively affected by a decline in commission rates charged by brokers or greater commission payments to sales agents.
Since 2014, we have experienced approximately a one basis point decline in the average homesale broker commission rate each year, andwhich we expect that over the long term the average brokerage commission rates will continuebelieve has been largely attributable to modestly decline as a result of increases in average homesale prices (as higher priced homes tend to have a lower broker commission) and, to a lesser extent, competitors providing fewer or similar services for a reduced fee.
Royalty fees are charged to all franchisees pursuant to the terms of the relevant franchise agreements and are included in each of the real estate brands' franchise disclosure documents. Most of our third-party franchisees are subject to a 6% royalty rate and entitled to volume incentives.incentives, although a royalty fee generally equal to 5% of franchisee commission (capped at a set amount per independent sales agent per year) is applicable to franchisees operating under the "capped fee model" that was launched for our Better Homes and Gardens® Real Estate franchise business in January 2019. Volume incentives are calculated as a progressive percentage of the applicable franchisee's eligible annual gross commission income and generally result in a net or effective royalty rate ranging from 6% to 3% for the franchisee. Volume incentives increase or decrease as the franchisee's gross commission income generated increases or decreases, respectively. We have the right to adjust the annual volume incentive tables on an annual basis in response to changing market conditions. In addition, some of our larger franchisees have a flat royalty rate of less than 6% and are not eligible for volume incentives.
Non-standard incentives may also be used as consideration to attract new franchisees, grow franchisees (including through independent sales agent recruitment) or extend existing franchisee agreements, although such incentives are generally not available to most franchisees, and, in contrast to volume incentives, the majority are not homesale transaction based. We expect that the trend of increasing non-standard incentives will continue in the future in order to attract, retain, and help grow certain franchisees.
Transaction volume growth has exceeded royalty revenue growth due primarily to the growth in gross commission income generated by our top 250 franchisees and our increased use of non-standard sales incentives, both of which directly impact royalty revenue. Over the past several years, our top 250 franchisees have grown faster than our other franchisees through organic growth and market consolidation. If the amount of gross commission income generated by our top 250 franchisees continue to grow at a quicker pace relative to our other franchisees, we would expect our royalty revenue to continue to increase, but at a slower pace than homesale transaction volume. Likewise, our royalty revenue would continue to increase, but at a slower pace than homesale transaction volume, if the gross commission income generated by all of our franchisees grows faster than the applicable annual volume incentive table increase or if we increase our use of standard volume or non-standard incentives. However, we expect that any such increases in gross commission income will result in increased overall royalty payments to us.
Non-standard incentives may also be used as consideration to attract, retain and help grow certain franchisees. Most of our franchisees do not receive these non-standard incentives and in contrast to volume incentives, the majority are not homesale transaction based. We expect that the trend of increasing non-standard incentives will continue in the future in order to attract, retain, and help grow certain franchisees. This may result in slower growth in our net royalty per side as compared to homesale transaction volume.
NRT has a significant concentration of real estate brokerage offices and transactions in geographic regions where home prices are at the higher end of the U.S. real estate market, particularly the east and west coasts, while RFG has franchised offices that are more widely dispersed across the United States. Accordingly, operating results and homesale statistics may differ between NRT and RFG based upon geographic presence and the corresponding homesale activity in each geographic region. In addition, the share of commissions earned by independent sales agents directly impacts the margin earned by NRT. Such share of commissions earned by independent sales agents varies by region and commission schedules are generally progressive to incentivize sales agents to achieve higher levels of production. WeCommission share has been and we expect that commission share will continue to be subject to upward pressure in favor of the independent sales agent becausefor a variety of the increased bargaining power of independent sales agents and teams as well asfactors, including more aggressive recruitment and retention activities taken by us and our competitors.competitors as well as growth in independent sales agent teams.
RESULTS OF OPERATIONS
Discussed below are our condensed consolidated results of operations and the results of operations for each of our reportable segments. The reportable segments presented below represent our operating segments for which separate financial information is available and which is utilized on a regular basis by our chief operating decision maker to assess performance and to allocate resources. In identifying our reportable segments, we also consider the nature of services provided by our operating segments. Management evaluates the operating results of each of our reportable segments based upon revenue and Operating EBITDA. Operating EBITDA is defined by us as net income (loss) before depreciation and amortization, interest expense, net (other than relocation services interest for securitization assets and securitization obligations), income taxes, and other items that are not core to the operating activities of the Company such as restructuring charges, former parent legacy items, losses on the early extinguishment of debt, asset impairments, gains or losses on discontinued operations and gains or losses on the sale of investments or other assets. Our presentation of Operating EBITDA may not be comparable to similarly titled measures used by other companies.
Three Months Ended March 31, 20182019 vs. Three Months EndedMarch 31, 20172018
Our consolidated results comprised the following:
| | | | Three Months Ended March 31, | Three Months Ended March 31, |
| | 2018 | | 2017 | | Change | 2019 | | 2018 | | Change |
| Net revenues | $ | 1,229 |
| | $ | 1,203 |
| | $ | 26 |
| $ | 1,114 |
| | $ | 1,229 |
| | $ | (115 | ) |
Total expenses (1) | 1,311 |
| | 1,237 |
| | 74 |
| 1,249 |
| | 1,311 |
| | (62 | ) |
| Loss before income taxes, equity in losses and noncontrolling interests | (82 | ) | | (34 | ) | | (48 | ) | |
| Loss before income taxes, equity in (earnings) losses and noncontrolling interests | | (135 | ) | | (82 | ) | | (53 | ) |
| Income tax benefit | (19 | ) | | (9 | ) | | (10 | ) | (35 | ) | | (19 | ) | | (16 | ) |
| Equity in losses of unconsolidated entities | 4 |
| | 3 |
| | 1 |
| |
| Equity in (earnings) losses of unconsolidated entities | | (1 | ) | | 4 |
| | (5 | ) |
| Net loss | (67 | ) | | (28 | ) | | (39 | ) | (99 | ) | | (67 | ) | | (32 | ) |
| Less: Net income attributable to noncontrolling interests | — |
| | — |
| | — |
| — |
| | — |
| | — |
|
| Net loss attributable to Realogy Holdings and Realogy Group | $ | (67 | ) | | $ | (28 | ) | | $ | (39 | ) | $ | (99 | ) | | $ | (67 | ) | | $ | (32 | ) |
_______________
| |
(1) | Total expenses for the three months ended March 31, 2018 includes $30 million of restructuring charges and $7 million related to loss on the early extinguishment of debt as a result of the debt transactions in the first quarter of 2018, partially offset by $12 million of gains related to mark-to-market adjustments for our interest rate swaps. Total expenses for the three months ended March 31, 2017 includes $5 million of restructuring charges and $4 million related to loss on the early extinguishment of debt, partially offset by $1 million of gains related to mark-to-market adjustments for our interest rate swaps. |
Net revenues increased $26decreased $115 million or 2%9% for the three months ended March 31, 20182019 compared with the three months ended March 31, 2017, principally due to increases in gross commission income and franchise fees as a result of higher2018 primarily driven by lower homesale transaction volume of 4% on a combined basis for NRT and RFG.at NRT.
Total expenses increased $74for the first quarter of 2019 decreased $62 million or 6%5% compared to the first quarter of 2018 primarily due to:
a $40$70 million increasedecrease in commission and other sales agent-related costs due to an increase inas a result of the impact of lower homesale transaction volume, at NRTpartially offset by higher agent commission costs related to initiatives focused on growing and higher sales commissions paid to itsretaining our productive independent sales agents including a shiftagent base; and
an $18 million decrease in mix in 2018 from the new development business which typically has lower commission expense compared to traditional brokerage operations;
$30restructuring costs as there was $12 million of restructuring costs primarilyincurred for the Company's restructuring program relatedfocused on office and operational efficiencies during the first quarter of 2019 compared to $30 million of restructuring costs incurred for the same period in 2018 for leadership realignment and other restructuring activities which began during the first quarter of 2018 compared to $5 million of restructuring costs incurred during the first quarter of 2017 related to the Company's business optimization plan;
a $9 million increase in operating expenses primarily driven by a:
| |
◦ | a $2 million increase in earn-out costs at NRT; |
| |
◦ | a $2 million increase in occupancy costs at NRT; and |
| |
◦ | a $2 million increase in variable operating costs at TRG; and |
a $5 million increase in marketing expenses comprised of $3 million at RFG and $2 million at NRT.activities.
The expense increasesdecreases were partially offset by a $6$30 million net decreaseincrease in interest expense to $33 million in the first quarter of 2018 from $39 million in the first quarter of 2017 primarily due to a $26 million net expense related to our mark-to-market adjustments for our interest rate swaps that resulted in losses of $14 million during the first quarter of 2019 compared to gains of $12 million during the first quarter of 2018 compared to gains of $12018. In addition, there was a $4 million during the
first quarter of 2017, partially offset by an increase in interest expense due to LIBOR rates increases and a $2 million write off of financing costs to interest expense as a result of the refinancing transactions in February of 2018.additional borrowings on our Revolving Credit Facility.
LossesEarnings from equity investments were $1 million during the first quarter of 2019 compared to losses of $4 million during the first quarter of 2018 compared to $3 million during the first quarter of 2017. The $1 million increase in equity losses is due to equity losses of $4 million at TRG during the first quarter of 2018, primarily related to costs associated with the ramp up of operations of Guaranteed Rate Affinity, compared to equity earnings of $1 million at TRG during the first quarter of 2017, partially offset by the absence of $4 million of equity losses at NRT related to its investment in PHH Home Loans incurred during the first quarter of 2017.2018.
During the first quarter of 2018,2019, we incurred $30$12 million of restructuring costs primarily related to the Company's restructuring program relatedfocused on office consolidation and instituting operational efficiencies to leadership realignment and other restructuring activities which began in the first quarter of 2018 compared to $5 million of costs related to the Company's business optimization initiatives in the first quarter of 2017.drive profitability. The Company expects to incur an additional $12 million related to the current restructuring plan bringing the estimated total cost of the plan to $41be approximately $53 million. See Note 6, "Restructuring Costs", in the Condensed Consolidated Financial Statements for additional information.
The Company's provision for income taxes in interim periods is computed by applying its estimated annual effective tax rate against the income or loss before income taxes for the period. In addition, non-recurring or discrete items are recorded in the period in which they occur. The provision for income taxes was a benefit of $35 million for the three months ended
March 31, 2019 compared to a benefit of $19 million benefit for the three months ended March 31, 2018 compared to a $9 million benefit for the three months ended March 31, 2017.2018. Our federal and state blended statutory rate is estimated to be 27% for 20182019 and our full year effective tax rate is estimated to be 29%34%. Our effective tax rate was 22%26% and 24%22% for the three months ended March 31, 20182019 and March 31, 2017,2018, respectively. The effective tax rate in each reporting periodfor the three months ended March 31, 2019 and March 31, 2018 was primarily impacted by a discrete item related to equity awards for which the market value at vesting was lower than at the date of grant. There were no changes to the net benefit recorded during the year ended December 31, 2017 relating to the 2017 Tax Act which was a provisional amount that reflected the Company’s reasonable estimate at the time.
The following table reflects the results of each of our reportable segments during the three months ended March 31, 20182019 and 2017:2018:
| | | | Revenues (a) | | $ Change | | % Change | | Operating EBITDA | | $ Change | | % Change | | Margin | | Change | Revenues (a) | | $ Change | | % Change | | Operating EBITDA | | $ Change | | % Change | | Operating EBITDA Margin | | Change |
| | 2018 | | 2017 | | 2018 | | 2017 | | 2018 | | 2017 | | 2019 | | 2018 | | 2019 | | 2018 | | 2019 | | 2018 | |
| RFG | $ | 176 |
| | $ | 170 |
| | $ | 6 |
| | 4 | % | | $ | 105 |
| | $ | 102 |
| | $ | 3 |
| | 3 | % | | 60 | % | | 60 | % | | — |
| $ | 163 |
| | $ | 176 |
| | $ | (13 | ) | | (7 | )% | | $ | 90 |
| | $ | 105 |
| | $ | (15 | ) | | (14 | )% | | 55 | % | | 60 | % | | (5 | ) |
| NRT | 917 |
| | 897 |
| | 20 |
| | 2 |
| | (45 | ) | | (21 | ) | | (24 | ) | | (114 | ) | | (5 | ) | | (2 | ) | | (3 | ) | 816 |
| | 917 |
| | (101 | ) | | (11 | ) | | (62 | ) | | (45 | ) | | (17 | ) | | (38 | ) | | (8 | ) | | (5 | ) | | (3 | ) |
| Cartus | 79 |
| | 77 |
| | 2 |
| | 3 |
| | (1 | ) | | 1 |
| | (2 | ) | | * | | (1 | ) | | 1 |
| | (2 | ) | 76 |
| | 79 |
| | (3 | ) | | (4 | ) | | 2 |
| | (1 | ) | | 3 |
| | 300 | | 3 |
| | (1 | ) | | 4 |
|
| TRG | 120 |
| | 120 |
| | — |
| | — |
| | (6 | ) | | 2 |
| | (8 | ) | | * | | (5 | ) | | 2 |
| | (7 | ) | 114 |
| | 120 |
| | (6 | ) | | (5 | ) | | (9 | ) | | (6 | ) | | (3 | ) | | (50) | | (8 | ) | | (5 | ) | | (3 | ) |
| Corporate and Other | (63 | ) | | (61 | ) | | (2 | ) | | * | | (19 | ) | | (23 | ) | | 4 |
| | * | | | | | | | (55 | ) | | (63 | ) | | 8 |
| | * | | (25 | ) | | (19 | ) | | (6 | ) | | * | | | | | | |
| Total Company | $ | 1,229 |
| | $ | 1,203 |
| | $ | 26 |
| | 2 | % | | $ | 34 |
| | $ | 61 |
| | $ | (27 | ) | | (44 | %) | | 3 | % | | 5 | % | | (2 | ) | $ | 1,114 |
| | $ | 1,229 |
| | $ | (115 | ) | | (9 | )% | | $ | (4 | ) | | $ | 34 |
| | $ | (38 | ) | | (112 | %) | | — | % | | 3 | % | | (3 | ) |
| Less: Depreciation and amortization (b) | Less: Depreciation and amortization (b) | | 50 |
| | 50 |
| | | | | | | | | | | Less: Depreciation and amortization (b) | | 49 |
| | 50 |
| | | | | | | | | | |
| Interest expense, net | Interest expense, net | | 33 |
| | 39 |
| | | | | | | | | | | Interest expense, net | | 63 |
| | 33 |
| | | | | | | | | | |
| Income tax benefit | Income tax benefit | | (19 | ) | | (9 | ) | | | | | | | | | | | Income tax benefit | | (35 | ) | | (19 | ) | | | | | | | | | | |
| Restructuring costs (c) | | 30 |
| | 5 |
| | | | | | | | | | | |
| Restructuring costs, net (c) | | Restructuring costs, net (c) | | 12 |
| | 30 |
| | | | | | | | | | |
| Lease asset impairment | | Lease asset impairment | | 1 |
| | — |
| | | | | | | | | | |
| Loss on the early extinguishment of debt (d) | Loss on the early extinguishment of debt (d) | | 7 |
| | 4 |
| | | | | | | | | | | Loss on the early extinguishment of debt (d) | | 5 |
| | 7 |
| | | | | | | | | | |
| Net loss attributable to Realogy Holdings and Realogy Group | Net loss attributable to Realogy Holdings and Realogy Group | | $ | (67 | ) | | $ | (28 | ) | | | | | | | | | | | Net loss attributable to Realogy Holdings and Realogy Group | | $ | (99 | ) | | $ | (67 | ) | | | | | | | | | | |
_______________
| |
| (a) | Includes the elimination of transactions between segments, which consists of intercompany royalties and marketing fees paid by NRT of $63$55 million and $61$63 million during the three months ended March 31, 20182019 and 2017,2018, respectively. |
| |
| (b) | Depreciation and amortization for the three months ended March 31, 2018 includes $2 million of amortization expense related to Guaranteed Rate Affinity's purchase accounting included in the "Equity in (earnings) losses of unconsolidated entities" line on the Condensed Consolidated Statement of Operations. |
| |
| (c) | Restructuring charges incurred for the three months ended March 31, 2019 include $4 million at NRT, $3 million at Cartus, $1 million at TRG and $4 million at Corporate and Other. Restructuring charges incurred for the three months ended March 31, 2018 include $2 million at RFG, $17 million at NRT, $8 million at Cartus, $1 million at TRG and $2 million at Corporate and Other. Restructuring charges incurred for the three months ended March 31, 2017 include $5 million at NRT. |
| |
| (d) | Loss on the early extinguishment of debt is recorded in the Corporate and Other segment. |
As described in the aforementioned table, Operating EBITDA margin for "Total Company" expressed as a percentage of revenues decreased 23 percentage points to 3%zero from 5%3% for the three months ended March 31, 20182019 compared to the same period in 2017.2018. On a segment basis, RFG's margin remained flat atdecreased 5 percentage points to 55% from 60%. primarily due to a decrease in royalty revenue and the net costs for meetings and conferences held during the first quarter of 2019 compared to the first quarter of 2018 primarily due to the RGX event. NRT's margin decreased 3 percentage points to negative 5%8% from negative 2%5% primarily due to lower transaction volume and higher sales commission percentages paid to its independent sales agents during the first quarter of 20182019 compared to the same period in 2017 and the impact of lower closing volume in our new development business, which typically has higher margins and very long cycle times with irregular project completion timing.2018. Cartus' margin decreased 2increased 4 percentage points to 3% from negative 1% from 1% primarily due to a decrease in costs as a result of cost savings initiatives and the negativenet positive impact from foreign currency exchange rates.rates on expenses. TRG's margin decreased 73 percentage points to negative 8% from negative 5% from 2% primarily due to losses from equity investments during the first quarter of 2018 as a result of costs associated with the ramp up of operations of Guaranteed Rate Affinity.a decrease in revenue due to a decrease in resale units.
Corporate and Other Operating EBITDA for the three months ended March 31, 2018 increased $42019 declined $6 million to negative $19$25 million primarily due to a $3 million decrease in professional fees supporting strategic initiatives during the first quarter of 2018 compared to 2017.
Real Estate Franchise Services (RFG)
Revenues increased $6 million to $176 million and Operating EBITDA increased $3 million to $105 million for the three months ended March 31, 2018 compared with the same period in 2017.
The increase in revenue was driven by a $3 million increase in third-party domestic franchisee royalty revenue primarily due to a 6% increase in the average homesale price, partially offset by a 1% decrease in the number of homesale transactions and a $1 million increase in non-standard incentive amortization. Brand marketing fund revenue and related expense both increased $3 million, primarily due to the level of advertising spend during the first quarter of 2018 compared with 2017.
The intercompany royalties received from NRT of $60 million and $59 million during the first quarter of 2018 and 2017, respectively, are eliminated in consolidation against the same expense reflected in NRT's segment results.
The $3 million increase in Operating EBITDA was principally due to the $6 million increase in revenues discussed above, partially offset by a $3 million increase in brand marketing fund expense discussed above.
Company Owned Real Estate Brokerage Services (NRT)
Revenues increased $20 million to $917 million and Operating EBITDA decreased $24 million to negative $45 million for the three months ended March 31, 2018 compared with the same period in 2017.
The revenue increase of $20 million was comprised of a $14 million increase in commission income earned on homesale transactions by our existing brokerage operations despite a decrease in revenue from our new development business. Commission income also included a $6 million increase in commission income earned from acquisitions. The increase was driven by a 3% increase in the average price of homes, partially offset by a 1% decrease in the number of homesale transactions. NRT's average homesale price increased due to a function of high demand against limited supply of homes for sale but this was partially offset by lower closing volume in NRT's new development business which is generally at a higher price point and lower transaction volume in the New York metropolitan market.
Operating EBITDA decreased $24 million primarily due to:
a $40 million increase in commission expenses paid to independent sales agents from $605 million in the first quarter of 2017 to $645 million in the first quarter of 2018. The $40 million increase is comprised of a $36 million increase in commission expense due to our existing brokerage operations as a result of the impact of initiatives focused on growing and retaining our productive independent sales agent base and higher homesale transaction volume including a shift in mix in 2018 from the new development business which typically has lower commission expense compared to traditional brokerage operations, as well as a $4 million increase in commission expense related to acquisitions;
a $7 million increase in otheremployee-related costs including aand $2 million increase in earn-out costs and a $2 million increase in occupancy costs; andof other costs.
a $2 million increase in marketing expenses.
These Operating EBITDA decreases were partially offset by:
the $20 million increase in revenues discussed above;
the absence of $4 million in losses from our equity method investment in PHH Home Loans in the first quarter of 2017; and
a $3 million decrease in employee related costs.
RFG and NRT on a Combined Basis
The following table reflects RFG and NRT results before the intercompany royalties and marketing fees as well as on a combined basis to show the Operating EBITDA contribution of these business units to the overall Operating EBITDA of the Company. The Operating EBITDA margin for the combined segments decreased 23 percentage points from 8%6% to 6%3% primarily due to higher sales commission percentages paid to NRT's independent sales agentslower transaction volume and the impactnet costs for meetings and conferences held during the first quarter of lower closing volume in our new development business, which typically has higher margins:2019 compared to the first quarter of 2018 primarily due to the RGX event:
|
| | | | | | | | | | | | | | | | | | | | | | | | | | | | | | | | | | | | | | |
| | Revenues | | Change | | % Change | | Operating EBITDA (b) | | Change | | % Change | | Margin | | Change |
| | 2018 | | 2017 | | | | 2018 | | 2017 | | | | 2018 | | 2017 | |
| RFG (a) | $ | 113 |
| | $ | 109 |
| | $ | 4 |
| | 4 | % | | $ | 42 |
| | $ | 41 |
| | $ | 1 |
| | 2 | % | | 37 | % | | 38 | % | | (1 | ) |
| NRT (a) | 917 |
| | 897 |
| | 20 |
| | 2 |
| | 18 |
| | 40 |
| | (22 | ) | | (55 | ) | | 2 |
| | 4 |
| | (2 | ) |
| RFG and NRT Combined | $ | 1,030 |
| | $ | 1,006 |
| | $ | 24 |
| | 2 | % | | $ | 60 |
| | $ | 81 |
| | $ | (21 | ) | | (26 | %) | | 6 | % | | 8 | % | | (2 | ) |
|
| | | | | | | | | | | | | | | | | | | | | | | | | | | | | | | | | | | | |
| | Revenues | | $ Change | | % Change | | Operating EBITDA | | $ Change | | % Change | | Operating EBITDA Margin | | Change |
| | 2019 | | 2018 | | | | 2019 | | 2018 | | | | 2019 | | 2018 | |
| RFG (a) | $ | 108 |
| | $ | 113 |
| | (5 | ) | | (4 | )% | | $ | 35 |
| | $ | 42 |
| | (7 | ) | | (17 | )% | | 32 | % | | 37 | % | | (5 | ) |
| NRT (a) | 816 |
| | 917 |
| | (101 | ) | | (11 | ) | | (7 | ) | | 18 |
| | (25 | ) | | (139 | ) | | (1 | ) | | 2 |
| | (3 | ) |
| RFG and NRT Combined | $ | 924 |
| | $ | 1,030 |
| | (106 | ) | | (10 | )% | | $ | 28 |
| | $ | 60 |
| | (32 | ) | | (53 | )% | | 3 | % | | 6 | % | | (3 | ) |
_______________
| |
| (a) | The RFG and NRT segment numbers noted above do not reflect the impact of intercompany royalties and marketing fees paid by NRT to RFG of $63$55 million and $61$63 million during the three months ended March 31, 2019 and 2018, and March 31, 2017, respectively. |
| |
(b) | NRT Operating EBITDA includes $4 million of equity losses from PHH Home Loans for the three months ended March 31, 2017. |
RelocationReal Estate Franchise Services (Cartus)(RFG)
Revenues increased $2decreased $13 million to $79$163 million and Operating EBITDA decreased $2$15 million to negative $1$90 million for the three months ended March 31, 20182019 compared with the same period in 2017.2018.
Revenues decreased $13 million primarily as a result of a $7 million decrease in third-party domestic franchisee royalty revenue primarily due to an 8% decrease in transaction volume at RFG and a $7 million decrease in intercompany royalties received from NRT.
RFG revenue includes intercompany royalties received from NRT of $53 million and $60 million during the first quarter of 2019 and 2018, respectively, which are eliminated in consolidation against the expense reflected in NRT's segment results.
The $15 million decrease in Operating EBITDA was principally due to the $13 million decrease in revenues discussed above and a $2 million net decrease on Operating EBITDA due to the scope and timing of meetings and conferences held during the first quarter of 2019 compared to the first quarter of 2018 primarily due to the RGX event.
Company Owned Real Estate Brokerage Services (NRT)
Revenues decreased $101 million to $816 million and Operating EBITDA decreased $17 million to negative $62 million for the three months ended March 31, 2019 compared with the same period in 2018.
The revenue decrease of $101 million was primarily driven by an 11% decrease in homesale transaction volume at NRT which consisted of a 9% decrease in the number of homesale transactions and a 2% decrease in average homesale price. NRT saw lower transaction volume largely due to weakness in California where NRT is highly concentrated as well as intense competition for independent sales agents.
Operating EBITDA decreased $17 million primarily due to the $101 million decrease in revenues discussed above partially offset by:
a $70 million decrease in commission expenses paid to independent sales agents from $645 million in the first quarter of 2018 to $575 million in the first quarter of 2019. Commission expense decreased as a result of the impact of lower homesale transaction volume as discussed above, partially offset by higher agent commission costs related to the impact of initiatives focused on growing and retaining our productive independent sales agent base;
a $7 million decrease in royalties paid to RFG from $60 million in the first quarter of 2018 to $53 million in the first quarter of 2019;
a $4 million decrease in occupancy costs; and
a $4 million decrease in other operating costs.
Relocation Services (Cartus)
Revenues decreased $3 million to $76 million and Operating EBITDA increased $3 million to $2 million for the three months ended March 31, 2019 compared with the same period in 2018.
Revenues decreased $3 million primarily as a result of a $2 million increasedecrease in otherreferral revenue and a $1 million increase in affinity referrals both primarily due to higher volume, partially offset by a $1 million decrease in international revenue.lower volume.
Operating EBITDA decreased $2increased $3 million primarily as a result of a $2$3 million decrease in employee related costs primarily due to cost savings initiatives, a $1 million net negativepositive impact from foreign currency exchange rates.rates on expenses, and a decrease in other expenses, partially offset by the $3 million decrease in revenues discussed above.
Title and Settlement Services (TRG)
Revenues remained flat at $120decreased $6 million to $114 million and Operating EBITDA decreased $8$3 million to negative $6$9 million for the three months ended March 31, 20182019 compared with the same period in 2017.2018.
Revenues remained flatdecreased $6 million as a result of a $6$7 million increasedecrease in resale revenue due to an increasea decrease in resale units, offset byas well as a $6$1 million decrease in refinancing revenue due to an overall decrease in activity in the refinance market.market, partially offset by a $3 million increase in underwriter revenue due to an increase of underwriter premiums as a result of a shift in mix to unaffiliated agents.
Operating EBITDA decreased $8$3 million as a result of a $3the $6 million increasedecrease in losses from the operations of equity investments primarily related to costs associated with the ramp up of operations of Guaranteed Rate Affinity in the first quarter of 2018, an increase of $3 million in timing of employee-related costsrevenues discussed above and an increase of $2 million in personnel and operating costs primarily due to an increase in underwriter revenue with unaffiliated agents where the revenue and expense is recorded on a gross basis. The decreases were partially offset by a $3 million increase in earnings from the equity investments related to market expansion.Guaranteed Rate Affinity and a $1 million decrease in other operating expenses.
FINANCIAL CONDITION, LIQUIDITY AND CAPITAL RESOURCES
Financial Condition
| | | | March 31, 2018 | | December 31, 2017 | | Change | March 31, 2019 | | December 31, 2018 | | Change |
| Total assets | $ | 7,325 |
| | $ | 7,337 |
| | $ | (12 | ) | $ | 7,811 |
| | $ | 7,290 |
| | $ | 521 |
|
| Total liabilities | 4,897 |
| | 4,715 |
| | 182 |
| 5,622 |
| | 4,975 |
| | 647 |
|
| Total equity | 2,428 |
| | 2,622 |
| | (194 | ) | 2,189 |
| | 2,315 |
| | (126 | ) |
For the three months ended March 31, 2018,2019, total assets decreased $12increased $521 million primarily due to the addition of $544 million of operating lease assets to the balance sheet as a $45result of the adoption of the new leasing standard and an $18 million decreaseincrease in cash and cash equivalents,equivalents. Total asset increases were partially offset by a $25 million net decrease in franchise agreements and other amortizable intangible assets primarily due to amortization, a $20$10 million decrease in restricted cash and a $6 million decrease in other current assets and an $8assets.
Total liabilities increased $647 million decrease in property and equipment. These decreases were partially offset by a $49 million increase in other non-current assets primarily due to the adjustmentaddition of $603 million of operating lease liabilities to prepaid expensesthe balance sheet as a result of the adoption of the new revenueleasing standard, related to commissions paid to Realogy franchise sales employees and an increase in deferred financing costs related to the debt transactions that occurred during the first quarter and a $37 million increase in trade and relocation receivables due to seasonal increases in volume.
Total liabilities increased $182 million due to a $247$227 million increase in corporate debt primarily due to $205the issuance of $550 million of 9.375% Senior Notes and additional borrowings under the Revolving Credit Facility, partially offset by the redemption of all of the Company's outstanding $450 million 4.50% Senior Notes, and a $50$7 million increase in other non-current liabilities primarily due to deferred income for area development fees for international transactions as a result of the adoption of the new revenue standard. Theseaccounts payable. Total liability increases were partially offset by a $52$55 million decrease in accrued expenses and other current liabilities primarily due to the payment of annual bonuses in the first quarter of 2018,2019, a $36$54 million decrease in other non-current liabilities primarily due to the reclassification of deferred rent liabilities which were credited against operating lease assets on transition as a result of the adoption of the new leasing standard, a $44 million decrease in securitization obligations and a $37 million decrease in deferred tax liabilities partially due to adjustments related to the adoption of the new revenue standard, a $17 million decrease in accounts payable and a $10 million decrease in securitization obligations.liabilities.
Total equity decreased $194$126 million primarily due to a $106net loss of $99 million for the three months ended March 31, 2019 and a $28 million decrease in additional paid in capital, related to the Company's repurchase of $94$20 million of common stock and $12$10 million of dividend payments as well as an $80 million decrease in accumulated deficit which consistspartially offset by stock-based compensation activity of a net loss of $67 million for the three months ended March 31, 2018 and $22 million due to the cumulative impact of adopting the new revenue standard.$2 million.
Liquidity and Capital Resources
Our primary liquidity needs have been to service our debt, and finance our working capital and capital expenditures and pay dividends and acquire stock under our share repurchase program, which we have historically satisfied with cash flows from operations and funds available under our revolving credit facilitiesRevolving Credit Facility and securitization facilities. In February 2018, theThe Company increased the borrowing capacity under its Revolving Credit Facility from $1,050 million to $1,400 million and extended the maturities of the Revolving Credit Facility, Term Loan A and Term Loan B.expects
We intend to use future cash flow primarily to acquire stock under our share repurchase program, pay dividends, enter into strategic relationships and reduce indebtedness. In February 2018, the Company's Board of Directors authorized a new share repurchase program of up to $350 million of the Company’s common stock which was incremental to the remaining authorization under the share repurchase program authorized in 2017. Repurchases under these programs may be made at management's discretion from time to time on the open market, pursuant to Rule 10b5-1 trading plans or privately negotiated transactions. The size and timing of these repurchases will depend on price, market and economic conditions, legal and contractual requirements and other factors. The repurchase programs have no time limit and may be suspended or discontinued at any time. As of March 31, 2018, the Company has repurchased and retired 20.2 million shares of common stock for an aggregate of $574 million under the share repurchase programs at a weighted average market price of $28.36 per share.
Included in the 20.2 million shares of common stock repurchased to date, the Company repurchased 3.7 million shares of common stock for $99 million at a weighted average market price of $26.58 per share during the first three months of 2018. As of March 31, 2018, $351 million remained available for repurchase under the share repurchase programs.
During the period April 1, 2018 through May 1, 2018, we repurchased an additional 1.4 million shares at a weighted average market price of $26.17 per share. Giving effect to these repurchases, all of the remaining capacity under the February 2017 program has been utilized and as of May 1, 2018, we had approximately $316 million of remaining capacity authorized under the February 2018 share repurchase program.
Beginningto prioritize investing in August 2016, we initiatedits business and paid a quarterlyreducing indebtedness over other potential uses of cash dividend of $0.09 per share and paid $0.09 per share cash dividendsuntil it is able to reduce its consolidated leverage ratio (as defined in every subsequent quarter. During the first quarter of 2018, we returned $12 million to stockholders through the dividend payments. The declaration and payment of any future dividend will be subject to the discretion of the Board of Directors and will depend on a variety of factors, including the Company’s financial condition and results of operations, contractual restrictions (including restrictive covenants contained in the Company’s credit agreement, and the indenture governing the Company’s outstanding debt securities), capital requirements and other factors that9.375% Senior Notes) to below 4.00 to 1.00, although the Board of Directors deems relevant.
We may also from timeCompany currently anticipates continuing its quarterly cash dividend. Accordingly, during this period, the Company will not repurchase common stock pursuant to time seek toits existing share repurchase our outstanding notes through tender offers, open market purchases, privately negotiated transactions or otherwise. Such repurchases, if any, will depend on prevailing market conditions, our liquidity requirements, contractual restrictions and other factors.
If the residential real estate market or the economy as a whole does not continue to improve or weakens, our business, financial condition and liquidity may be materially adversely affected, including our ability to access capital and grow our business.programs.
Historically, operating results and revenues for all of our businesses have been strongest in the second and third quarters of the calendar year. A significant portion of the expenses we incur in our real estate brokerage operations are related to marketing activities and commissions and therefore, are variable. However, many of our other expenses, such as interest payments, facilities costs and certain personnel-related costs, are fixed and cannot be reduced during the seasonal fluctuations in the business. Consequently, our debt balances are generally at their highest levels at or around the end of the first quarter of every year.
Our liquidity position has significantly improved but continues to be impacted by our remaining interest expense and would be adversely impacted by stagnationcontinued worsening or a downturnstagnation of the residential real estate market or a significant increase in LIBOR or ABR.
In March 2019, the Company issued $550 million of 9.375% Senior Notes due in April 2027. We used $540 million of the net proceeds to repay a portion of outstanding borrowings under our Revolving Credit Facility. In February 2019, the Company had used borrowings under its Revolving Credit Facility and cash on hand to fund the redemption of all of its outstanding $450 million 4.50% Senior Notes. The covenants in the indenture governing the 9.375% Senior Notes are substantially similar to the covenants in the indentures governing the 5.250% Senior Notes and the 4.785% Senior Notes, with certain exceptions, including changes relating to the Company’s ability to make restricted payments, including its ability to repurchase shares and make dividend payments in excess of $45 million per calendar year until the Company's consolidated leverage ratio is below 4.00 to 1.00.
In addition, we are required to pay quarterly amortization payments for the Term Loan B and Term Loan A facilities. Remaining payments for 2019 total $14 million and $8 million for the Term Loan A and Term Loan B facilities, respectively and we expect payments for 2020 to total $33 million and $11 million for the Term Loan A and Term Loan B facilities, respectively.
Beginning in August 2016, we initiated and paid a quarterly cash dividend of $0.09 per share and paid $0.09 per share cash dividends in every subsequent quarter. During the first quarter of 2019, we returned $10 million to stockholders through the dividend payments.
In February 2019, the Company's Board of Directors authorized a new share repurchase program of up to $175 million of the Company’s common stock which was incremental to the remaining capacity authorized under the February 2018 share repurchase program. Repurchases under these programs may be made at management's discretion from time to time on the open market, pursuant to Rule 10b5-1 trading plans or privately negotiated transactions. The size and timing of these repurchases will depend on price, market and economic conditions, legal and contractual requirements and other factors, including the restrictions contained in the indenture governing the 9.375% Senior Notes, which prohibit such repurchases until the consolidated leverage ratio falls below 4.00 to 1.00 and then (unless that ratio falls below 3.00 to 1.00) only to the extent of available cumulative credit, as defined under the indenture governing the 9.375% Senior Notes. The repurchase programs have no time limit and may be suspended or discontinued at any time.
As of March 31, 2019, the Company has repurchased and retired 35.5 million shares of common stock for an aggregate of $896 million under the share repurchase programs at a weighted average market price of $25.22 per share. Included in the 35.5 million shares of common stock repurchased to date, the Company repurchased 1.2 million shares of common stock for $20 million at a weighted average market price of $17.21 per share during the first quarter of 2019. As of March 31, 2019, $204 million remained available for repurchase under the share repurchase programs.
We have not repurchased any shares under the share repurchase programs since February 2019.
The timing, frequency or amounts of any dividends or share repurchases in the future will be subject to the discretion of the Company's Board of Directors and will depend on a variety of factors, including the Company’s financial condition and results of operations, contractual restrictions, including restrictive covenants contained in the Senior Secured Credit Agreement, Term Loan A Agreement, and the indentures governing the Unsecured Notes, capital requirements and other factors that the Board of Directors deems relevant.
We may also from time to time seek to repurchase our outstanding Unsecured Notes through tender offers, open market purchases, privately negotiated transactions or otherwise. Such repurchases, if any, will depend on prevailing market conditions, our liquidity requirements, contractual restrictions and other factors.
We will continue to evaluate potential refinancing and financing transactions. There can be no assurance as to which, if any, of these alternatives we may pursue as the choice of any alternative will depend upon numerous factors such as market conditions, our financial performance and the limitations applicable to such transactions under our existing financing agreements and the consents we may need to obtain under the relevant documents. There can be no assurance that financing will be available to us on acceptable terms or at all.
If the residential real estate market or the economy as a whole does not improve or continues to weaken, our business, financial condition and liquidity may be materially adversely affected, including our ability to access capital, grow our business and return capital to stockholders.
Cash Flows
At March 31, 2018,2019, we had $182$246 million of cash, and cash equivalents a decreaseand restricted cash, an increase of $45$8 million compared to the balance of $227$238 million at December 31, 2017.2018. The following table summarizes our cash flows for the three months ended March 31, 20182019 and 2017:2018:
| | | | Three Months Ended March 31, | Three Months Ended March 31, |
| | 2018 | | 2017 | | Change | 2019 | | 2018 | | Change |
| Cash provided by (used in): | | | | | | | | | | |
| Operating activities | $ | (130 | ) | | $ | (12 | ) | | $ | (118 | ) | $ | (103 | ) | | $ | (130 | ) | | $ | 27 |
|
| Investing activities | (9 | ) | | (33 | ) | | 24 |
| (23 | ) | | (9 | ) | | (14 | ) |
| Financing activities | 93 |
| | (27 | ) | | 120 |
| 134 |
| | 93 |
| | 41 |
|
| Effects of change in exchange rates on cash, cash equivalents and restricted cash | — |
| | 1 |
| | (1 | ) | — |
| | — |
| | — |
|
| Net change in cash, cash equivalents and restricted cash | $ | (46 | ) | | $ | (71 | ) | | $ | 25 |
| $ | 8 |
| | $ | (46 | ) | | $ | 54 |
|
For the three months ended March 31, 2018, $1182019, $27 million moreless cash was used in operating activities compared to the same period in 2017.2018. The change was principally due to $64$34 million of additional cash used in operating results and $61 million lessmore cash provided by the net change in relocation and trade receivables, partially offset by $7$11 million less cash used for accounts payable, accrued expenses and other liabilities and $6 million less cash used for other assets.assets, partially offset by $26 million more cash used in operating results.
For the three months ended March 31, 2018,2019, we used $24$14 million lessmore cash for investing activities compared to the same period in 20172018 primarily due to the absence in 2019 of $19 million of net cash proceeds received from the dissolution of our interest in PHH Home Loans LLC and $3 million less cash used for property and equipment additions.
which occurred in 2018.
For the three months ended March 31, 2018, $932019, $134 million of cash was provided by financing activities compared to $27$93 million of cash usedprovided during the same period in 2017. 2018. For the three months ended March 31, 2019, $134 million of cash was provided by:
$140 million of additional borrowings under the Revolving Credit Facility; and
$93 million of cash received as a result of the refinancing transactions in the first quarter of 2019 related to $550 million of proceeds received from issuance of 9.375% Senior Notes, partially offset by $450 million cash used for the redemption of 4.50% Senior Notes and $7 million of debt issuance costs;
partially offset by,
a $45 million net decrease in securitization borrowings;
$20 million for the repurchase of our common stock;
$10 million of dividend payments;
$7 million of quarterly amortization payments on the term loan facilities;
$6 million of tax payments related to net share settlement for stock-based compensation; and
$5 million of other financing payments primarily related to finance leases.
For the three months ended March 31, 2018, $93 million of cash was provided by additional borrowings under the Revolving Credit Facility of $232 million, partially offset by:
$94 million for the repurchase of our common stock;
$12 million of dividend payments;
an $11 million net decrease in securitization borrowings;
$9 million of tax payments related to net share settlement for stock-based compensation;
$7 million of other financing payments primarily related to capital leases;
$3 million for cash paid as a result of the refinancing transactions in February 2018 related to $16$16 million of debt issuance costs and $4$4 million repayment of borrowings under the Term Loan B Facility, partially offset by $17$17 million of proceeds received under the Term Loan A Facility; and
$3 million of quarterly amortization payments on the term loan facilities.
Financial Obligations
See Note 5, "Short and Long-Term Debt", to the three months endedCondensed Consolidated Financial Statements, for information on the Company's indebtedness as of March 31, 2017, $272019.
Issuance of $550 million of cash was used for:
$57 million for the repurchase9.375% Senior Notes, Redemption of our common stock;
$33 million net decrease in securitization borrowings;
$13$450 million of dividend payments;
$10 million of quarterly amortization payments on the term loan facilities;
$10 million of tax payments related to net share settlement for stock-based compensation;
$6 million of debt issuance costs;
$5 million of other financing payments primarily related to capital leases4.50% Senior Notes and interest rate swaps; and
$4 million for payments of contingent consideration;
partially offset by,
$110 million of additional borrowingsIncrease in Borrowing Capacity under the Revolving Credit Facility.Facility
In March 2019, the Company issued $550 million of 9.375% Senior Notes due in April 2027. We used $540 million of the net proceeds to repay a portion of the outstanding borrowings under our Revolving Credit Facility. In February 2019, the Company used borrowings under its Revolving Credit Facility and cash on hand to fund the redemption of all of its outstanding $450 million 4.50% Senior Notes. In March 2019, the Company entered into an amendment to the Senior Secured Credit Agreement that provided for an incremental revolving facility commitment of $25 million increasing the borrowing capacity under the Revolving Credit Facility to $1,425 million.
LIBOR Transition
In July 2017, the Financial Obligations
Indebtedness Table
AsConduct Authority, the UK regulator responsible for the oversight of March 31, 2018, the Company’s borrowing arrangements were as follows:
|
| | | | | | | | | | | | | | | |
| | Interest
Rate | | Expiration
Date | | Principal Amount | | Unamortized Discount and Debt Issuance Costs | | Net Amount |
| Senior Secured Credit Facility: | | | | | | | | | |
| Revolving Credit Facility (1) | (2) | | February 2023 | | $ | 302 |
| | $ * |
| | $ | 302 |
|
| Term Loan B | (3) | | February 2025 | | 1,077 |
| | 17 |
| | 1,060 |
|
| Term Loan A Facility: | | | | | | | | | |
| Term Loan A | (4) | | February 2023 | | 750 |
| | 5 |
| | 745 |
|
| Senior Notes | 4.50% | | April 2019 | | 450 |
| | 5 |
| | 445 |
|
| Senior Notes | 5.25% | | December 2021 | | 550 |
| | 4 |
| | 546 |
|
| Senior Notes | 4.875% | | June 2023 | | 500 |
| | 3 |
| | 497 |
|
| Securitization obligations: (5) | | | | | | | | | |
| Apple Ridge Funding LLC (6) | | | June 2018 | | 170 |
| | * |
| | 170 |
|
| Cartus Financing Limited (7) | | | August 2018 | | 14 |
| | * |
| | 14 |
|
| Total (8) | $ | 3,813 |
| | $ | 34 |
| | $ | 3,779 |
|
_______________
| |
* | The debt issuance costs related to our Revolving Credit Facility and securitization obligations are classified as a deferred financing asset within other assets. |
| |
(1) | As of March 31, 2018, the Company had $1,400 million of borrowing capacity under its Revolving Credit Facility leaving $1,098 million of available capacity. The Revolving Credit Facility expiresLIBOR, announced that it would no longer require banks to participate in February 2023, but is classified on the balance sheet as current due to the revolving nature of the facility. On May 1, 2018, the Company had $372 million in outstanding borrowings under the Revolving Credit Facility, leaving $1,028 million of available capacity. |
| |
(2) | Interest rates with respect to revolving loans under the Senior Secured Credit Facility at March 31, 2018 were based on, at the Company's option, (a) adjusted London Interbank Offering Rate ("LIBOR") plus an additional margin or (b) JP Morgan Chase Bank, N.A.'s prime rate ("ABR") plus an additional margin, in each case subject to adjustment based on the then current senior secured leverage ratio. Based on the previous quarter senior secured leverage ratio, the LIBOR margin was 2.00% and the ABR margin was 1.00% for the three months ended March 31, 2018. |
| |
(3) | The Term Loan B provides for quarterly amortization payments totaling 1% per annum of the original principal amount. The interest rate with respect to term loans under the Term Loan B is based on, at the Company’s option, (a) adjusted LIBOR plus 2.25% (with a LIBOR floor of 0.75%) or (b) ABR plus 1.25% (with an ABR floor of 1.75%). |
| |
(4) | The Term Loan A provides for quarterly amortization payments, which commence on June 30, 2018, totaling per annum 2.5%, 2.5%, 5.0%, 7.5% and 10.0% of the original principal amount of the Term Loan A, with the last amortization payment to be made on February 8, 2023. The interest rates with respect to term loans under the Term Loan A are based on, at the Company's option, (a) adjusted LIBOR plus an additional margin or (b) ABR plus an additional margin, in each case subject to adjustment based on the |
then current senior secured leverage ratio. Based on the previous quarter senior secured leverage ratio, the LIBOR margin was 2.00%submission process and would cease oversight over the rate after the end of 2021. Various industry groups continue to discuss replacement benchmark rates, the process for amending existing LIBOR-based contracts, and the ABR margin was 1.00% forpotential economic impacts of different alternatives. For example, in the three months ended March 31, 2018.U.S., a proposed replacement benchmark rate is the Secured Overnight Funding Rate (SOFR), which is an overnight rate based on secured financing.
| |
(5) | Available capacity is subject to maintaining sufficient relocation related assets to collateralize these securitization obligations. |
| |
(6) | As of March 31, 2018, the Company had $250 million of borrowing capacity under the Apple Ridge Funding LLC securitization program leaving $80 million of available capacity. |
| |
(7) | Consists of a £10 million revolving loan facility and a £5 million working capital facility. As of March 31, 2018, the Company had $21 million of borrowing capacity under the Cartus Financing Limited securitization program leaving $7 million of available capacity. |
| |
(8) | Not included in this table is the Company's Unsecured Letter of Credit Facility which had a capacity of $74 million with $66 million utilized at a weighted average rate of 3.24% at March 31, 2018. |
Covenants under the Senior Secured Credit Facility, Term Loan A Facility and Indentures
The Senior Secured Credit Facility,Agreement, Term Loan A Facility,Agreement, the Unsecured Letter of Credit Facility and the indentures governing the Unsecured Notes contain various covenants that limit (subject to certain exceptions) Realogy Group’s ability to, among other things:
incur or guarantee additional debt or issue disqualified stock or preferred stock;
pay dividends or make distributions to Realogy Group’s stockholders, including Realogy Holdings;
repurchase or redeem capital stock;
make loans, investments or acquisitions;
incur restrictions on the ability of certain of Realogy Group's subsidiaries to pay dividends or to make other payments to Realogy Group;
enter into transactions with affiliates;
create liens;
merge or consolidate with other companies or transfer all or substantially all of Realogy Group's and its material subsidiaries' assets;
transfer or sell assets, including capital stock of subsidiaries; and
prepay, redeem or repurchase subordinated indebtedness.
As a result of the covenants to which we remain subject, we are limited in the manner in which we conduct our business and we may be unable to engage in favorable business activities or finance future operations or capital needs. In addition,
the Senior Secured Credit Agreement and Term Loan A Agreement require us to maintain a senior secured leverage ratio. We are further restricted under the indenture governing the 9.375% Senior Notes from making restricted payments, including repurchasing shares of our common stock or issuing dividends in excess of $45 million per calendar year for so long as our consolidated leverage ratio is equal to or greater than 4.0 to 1.0 and then (unless that ratio falls below 3:00 to 1:00) only to the extent of available cumulative credit, as defined under the indenture governing the 9.375% Senior Notes.
Senior Secured Leverage Ratio applicable to our Senior Secured Credit Facility and Term Loan A Facility require us to maintain a senior secured leverage ratio.
The senior secured leverage ratio is tested quarterly and may not exceed 4.75 to 1.00. The senior secured leverage ratio is measured by dividing Realogy Group's total senior secured net debt by the trailing twelve monthfour quarters EBITDA calculated on a Pro Forma Basis, as those terms are defined in the senior secured credit facilities.Senior Secured Credit Agreement. Total senior secured net debt does not include unsecured indebtedness, including the Unsecured Notes, or the securitization obligations. EBITDA calculated on a Pro Forma Basis, as defined in the senior secured credit facilities,Senior Secured Credit Agreement, includes adjustments to EBITDA for restructuring costs, former parent legacy cost (benefit) items, net, loss on the early extinguishment of debt, non-cash charges and incremental securitization interest costs, as well as pro forma cost savings for restructuring initiatives, the pro forma effect of business optimization initiatives and the pro forma effect of acquisitions and new franchisees, in each case calculated as of the
beginning of the twelve-monthtrailing four-quarter period. The Company was in compliance with the senior secured leverage ratio covenant at March 31, 2018.2019.
A reconciliation of net income (loss) attributable to Realogy Group to Operating EBITDA and EBITDA calculated on a Pro Forma Basis, as those terms are defined in the Senior Secured Credit Agreement, for the four-quarter period ended March 31, 2019 is set forth in the following table:
|
| | | | | | | | | | | | | | | | | | | |
| | | | Less | | Equals | | Plus | | Equals |
| | Year Ended | | Three Months Ended | | Nine Months
Ended | | Three Months Ended | | Twelve Months
Ended |
| | December 31,
2018 | | March 31,
2018 | | December 31,
2018 | | March 31,
2019 | | March 31,
2019 |
| Net income (loss) attributable to Realogy Group (a) | $ | 137 |
| | $ | (67 | ) | | $ | 204 |
| | $ | (99 | ) | | $ | 105 |
|
| Income tax expense (benefit) | 65 |
| | (19 | ) | | 84 |
| | (35 | ) | | 49 |
|
| Income (loss) before income taxes | 202 |
| | (86 | ) | | 288 |
| | (134 | ) | | 154 |
|
| Depreciation and amortization (b) | 197 |
| | 50 |
| | 147 |
| | 49 |
| | 196 |
|
| Interest expense, net | 190 |
| | 33 |
| | 157 |
| | 63 |
| | 220 |
|
| Restructuring costs, net | 58 |
| | 30 |
| | 28 |
| | 12 |
| | 40 |
|
| Lease asset impairment | — |
| | — |
| | — |
| | 1 |
| | 1 |
|
| Former parent legacy cost, net | 4 |
| | — |
| | 4 |
| | — |
| | 4 |
|
| Loss on the early extinguishment of debt | 7 |
| | 7 |
| | — |
| | 5 |
| | 5 |
|
| Operating EBITDA (c) | 658 |
| | 34 |
| | 624 |
| | (4 | ) | | 620 |
|
| Bank covenant adjustments: | | |
| Pro forma effect of business optimization initiatives (d) | | 23 |
|
| Non-cash charges (e) | | 40 |
|
| Pro forma effect of acquisitions and new franchisees (f) | | 4 |
|
| Incremental securitization interest costs (g) | | 3 |
|
| EBITDA as defined by the Senior Secured Credit Agreement | | $ | 690 |
|
| Total senior secured net debt (h) | | $ | 2,096 |
|
| Senior secured leverage ratio | | 3.04 | x |
_______________
| |
| (a) | Net income (loss) attributable to Realogy consists of: (i) income of $123 million for the second quarter of 2018, (ii) income of $103 million for the third quarter of 2018, (iii) loss of $22 million for the fourth quarter of 2018 and (iv) a loss of $99 million for the first quarter of 2019. |
| |
| (b) | Depreciation and amortization for the year ended December 31, 2018 and the first quarter of 2018 includes $2 million of amortization expense related to Guaranteed Rate Affinity's purchase accounting included in the "Equity in (earnings) losses of unconsolidated entities" line on the Condensed Consolidated Statements of Operations during those periods. |
| |
| (c) | Operating EBITDA consists of: (i) $276 million the second quarter of 2018, (ii) $242 million for the third quarter of 2018, (iii) $106 million for the fourth quarter of 2018 and (iv) negative $4 million for the first quarter of 2019. |
| |
| (d) | Represents the four-quarter pro forma effect of business optimization initiatives. |
| |
| (e) | Represents the elimination of non-cash expenses including $39 million of stock-based compensation expense and $1 million of other items for the four-quarter period ended March 31, 2019. |
| |
| (f) | Represents the estimated impact of acquisitions and franchise sales activity, net of brokerages that exited our franchise system as if these changes had occurred on April 1, 2018. Franchisee sales activity is comprised of new franchise agreements as well as growth through acquisitions and independent sales agent recruitment by existing franchisees with our assistance. We have made a number of assumptions in calculating such estimates and there can be no assurance that we would have generated the projected levels of Operating EBITDA had we owned the acquired entities or entered into the franchise contracts as of April 1, 2018. |
| |
| (g) | Incremental borrowing costs incurred as a result of the securitization facilities refinancing for the four-quarter period ended March 31, 2019. |
| |
| (h) | Represents total borrowings under the senior secured credit facilities and borrowings secured by a first priority lien on our assets of $2,208 million plus $32 million of finance lease obligations less $144 million of readily available cash as of March 31, 2019. Pursuant to the terms of our senior secured credit facilities, total senior secured net debt does not include our securitization obligations or unsecured indebtedness, including the Unsecured Notes. |
Consolidated Leverage Ratio applicable to our 9.375% Senior Notes
The consolidated leverage ratio is measured by dividing Realogy Group's total net debt by the trailing four quarter EBITDA. EBITDA, as defined in the indenture governing the 9.375% Senior Notes, is substantially similar to EBITDA calculated on a Pro Forma Basis, as those terms are defined in the Senior Secured Credit Agreement. Net debt under the indenture is Realogy Group's total indebtedness (excluding securitizations) less (i) its cash and cash equivalents in excess of restricted cash and (ii) a $200 million seasonality adjustment permitted when measuring the ratio on a date during the period of March 1 to May 31.
The consolidated leverage ratio under the indenture governing the 9.375% Senior Notes for the four-quarter period ended March 31, 2019 is set forth in the following table:
|
| | | | |
| | | As of March 31, 2019 |
| Revolver | | $ | 410 |
|
| Term Loan A | | 731 |
|
| Term Loan B | | 1,067 |
|
| 5.25% Senior Notes | | 550 |
|
| 4.875% Senior Notes | | 500 |
|
| 9.375% Senior Notes | | 550 |
|
| Finance lease obligations | | 32 |
|
| Corporate Debt (excluding securitizations) | | 3,840 |
|
| Less: Cash and cash equivalents | | 243 |
|
| Net Corporate Debt (excluding securitizations) | | 3,597 |
|
| Less: Seasonality adjustment (a) | | 200 |
|
| Net debt under the indenture governing the 9.375% Senior Notes due 2027 | | $ | 3,397 |
|
| | | |
| EBITDA as defined under the indenture governing the 9.375% Senior Notes due 2027 (b) | | $ | 690 |
|
| | | |
| Consolidated leverage ratio under the indenture governing the 9.375% Senior Notes due 2027 | | 4.9 | x |
_______________
| |
| (a) | The indenture governing the 9.375% Senior Notes provides for a $200 million seasonality adjustment permitted when measuring the ratio on a date during the period of March 1 to May 31. Without this seasonality adjustment, the ratio would have been 5.2x for the quarter ended March 31, 2019. |
| |
| (b) | As set forth in the immediately preceding table, for the four-quarter period ended March 31, 2019, EBITDA, as defined under the indenture governing the 9.375% Senior Notes, was the same as EBITDA calculated on a Pro Forma Basis, as those terms are defined in the Senior Secured Credit Agreement. |
See Note 5, "Short and Long-Term Debt—Senior Secured Credit Facility" and "Short and Long-Term Debt—, "—Term Loan A Facility" and "—Unsecured Notes" to the Condensed Consolidated Financial Statements for additional information.
At March 31, 2019, the amount of cumulative credit available under the 9.375% Senior Notes was negative $69 million.
Non-GAAP Financial Measures
The SEC has adopted rules to regulate the use in filings with the SEC and in public disclosures of "non-GAAP financial measures," such as Operating EBITDA. These measures are derived on the basis of methodologies other than in accordance with GAAP.
Operating EBITDA is defined by us as net income (loss) before depreciation and amortization, interest expense, net (other than relocation services interest for securitization assets and securitization obligations), income taxes, and other items that are not core to the operating activities of the Company such as restructuring charges, former parent legacy items, losses on the early extinguishment of debt, asset impairments, gains or losses on discontinued operations and gains or losses on the sale of investments or other assets. Operating EBITDA is our primary non-GAAP measure.
We present Operating EBITDA because we believe it is useful as a supplemental measure in evaluating the performance of our operating businesses and provides greater transparency into our results of operations. Our management, including our chief operating decision maker, uses Operating EBITDA as a factor in evaluating the performance of our business. Operating EBITDA should not be considered in isolation or as a substitute for net income or other statement of operations data prepared in accordance with GAAP.
We believe Operating EBITDA facilitates company-to-company operating performance comparisons by backing out potential differences caused by variations in capital structures (affecting net interest expense), taxation, the age and book depreciation of facilities (affecting relative depreciation expense) and the amortization of intangibles, as well as other items that are not core to the operating activities of the Company such as restructuring charges, losses on the early extinguishment of debt, former parent legacy items, asset impairments, gains or losses on discontinued operations and gains or losses on the sale of investments or other assets, which may vary for different companies for reasons unrelated to operating performance. We further believe that Operating EBITDA is frequently used by securities analysts, investors and other interested parties in their evaluation of companies, many of which present an Operating EBITDA measure when reporting their results.
Operating EBITDA has limitations as an analytical tool, and you should not consider Operating EBITDA either in isolation or as a substitute for analyzing our results as reported under GAAP. Some of these limitations are:
this measure does not reflect changes in, or cash required for, our working capital needs;
this measure does not reflect our interest expense (except for interest related to our securitization obligations), or the cash requirements necessary to service interest or principal payments on our debt;
this measure does not reflect our income tax expense or the cash requirements to pay our taxes;
this measure does not reflect historical cash expenditures or future requirements for capital expenditures or contractual commitments;
although depreciation and amortization are non-cash charges, the assets being depreciated and amortized will often require replacement in the future, and this measure does not reflect any cash requirements for such replacements; and
other companies may calculate this measure differently so they may not be comparable.
Contractual Obligations
See Note 5, "Short and Long-Term Debt—Senior Secured Credit Facility" and "Short and Long-Term Debt—Term Loan A Facility""—Unsecured Notes", to the Condensed Consolidated Financial Statements included elsewhere in this Report for a description of the Company's recent debt transactions. All othertransactions which occurred during the first quarter of 2019. Other than the Company's debt transactions as described in Note 5, the Company's future contractual obligations as of March 31, 20182019 have not changed materially from the amounts reported in our 20172018 Form 10-K.
Critical Accounting Policies
In presenting our financial statements in conformity with generally accepted accounting principles, we are required to make estimates and assumptions that affect the amounts reported therein. Several of the estimates and assumptions we are required to make relate to matters that are inherently uncertain as they pertain to future events. However, events that are outside of our control cannot be predicted and, as such, they cannot be contemplated in evaluating such estimates and assumptions. If there is a significant unfavorable change to current conditions, it could result in a material adverse impact to
our combined results of operations, financial position and liquidity. We believe that the estimates and assumptions we used when preparing our financial statements were the most appropriate at that time.
These Condensed Consolidated Financial Statements should be read in conjunction with the Consolidated Financial Statements included in the Annual Report on Form 10-K for the year ended December 31, 20172018, which includes a description of our critical accounting policies that involve subjective and complex judgments that could potentially affect reported results.
Impairment of goodwill and other indefinite-lived intangible assets
The aggregate carrying values of our goodwill and other indefinite-lived intangible assets were $3,712 million and $767 million, respectively, at March 31, 2019 and are subject to impairment testing annually as of October 1, or whenever events or changes in circumstances indicate that the carrying amount may not be fully recoverable. This testing compares carrying values to fair values and, when appropriate, the carrying value is reduced to fair value. In testing goodwill, the fair value of our reporting units is estimated using a discounted cash flow approach utilizing long-term cash flow forecasts and our annual operating plans adjusted for terminal value assumptions.
Based upon the impairment analysis performed in the fourth quarter of 2018, there was no impairment of goodwill or other indefinite-lived intangible assets for 2018 and we do not believe there have been any events or changes in circumstances in the first quarter of 2019 that would require reassessment. However, significant negative industry or economic trends, disruptions to our business, unexpected significant changes or planned changes in use of the assets or divestitures may have a negative effect on the fair values.
Recently Issued Accounting Pronouncements
See Note 1, "Basis of Presentation", to the Condensed Consolidated Financial Statements for a discussion of recently issued accounting pronouncements.
Item 3. Quantitative and Qualitative Disclosures about Market Risks.
We are exposed to market risk from changes in interest rates primarily through our senior secured debt. At March 31, 2018,2019, our primary interest rate exposure was to interest rate fluctuations, specifically LIBOR, due to its impact on our variable rate borrowings of our Revolving Credit Facility and Term Loan B under the Senior Secured Credit Facility and the Term Loan A Facility. Given that our borrowings under the Senior Secured Credit Facility and Term Loan A Facility are generally based upon LIBOR, this rate will be the Company's primary market risk exposure for the foreseeable future. We do not have significant exposure to foreign currency risk nor do we expect to have significant exposure to foreign currency risk in the foreseeable future.
We assess our market risk based on changes in interest rates utilizing a sensitivity analysis. The sensitivity analysis measures the potential impact on earnings, fair values and cash flows based on a hypothetical change (increase and decrease) in interest rates. We exclude the fair values of relocation receivables and advances and securitization borrowings from our sensitivity analysis because we believe the interest rate risk on these assets and liabilities is mitigated as the rate we earn on relocation receivables and advances and the rate we incur on our securitization borrowings are based on similar variable indices.
At March 31, 2018,2019, we had variable interest rate long-term debt outstanding under our Senior Secured Credit Facility and Term Loan A Facility of $2,129$2,208 million, which excludes $184$187 million of securitization obligations. The weighted average interest rate on the outstanding amounts under our Senior Secured Credit Facility and Term Loan A Facility at March 31, 20182019 was 4.13%4.75%. The interest rate with respect to the Term Loan B is based on adjusted LIBOR plus 2.25% (with a LIBOR floor of 0.75%). The interest rates with respect to the Revolving Credit Facility and term loans under the Term Loan A Facility are based on adjusted LIBOR plus an additional margin subject to adjustment based on the current senior secured leverage ratio. Based on the March 31, 20182019 senior secured leverage ratio, the LIBOR margin was 2.25%. At March 31, 2018,2019, the one-month LIBOR rate was 1.88%2.50%; therefore, we have estimated that a 0.25% increase in LIBOR would have a $5$6 million impact on our annual interest expense.
As of March 31, 2018,2019, we had interest rate swaps with a notional value of $1,050$1,600 million to manage a portion of our exposure to changes in interest rates associated with our $2,129$2,208 million of variable rate borrowings. Interest rates swaps with a notional value of $425 million expired on February 10, 2018. Our remaining interest rate swaps arewere as follows:
|
| | | |
| Notional Value (in millions) | | Commencement Date | Expiration Date |
| $600 | | August 2015 | August 2020 |
| $450 | | November 2017 | November 2022 |
| $400 | | August 2020 | August 2025 |
| $150 | | November 2022 | November 2027 |
The swaps help protect our outstanding variable rate borrowings from future interest rate volatility. The fixed interest rates on the swaps range from 2.07% to 2.89%3.11%. The Company had an asset of $9$1 million and a liability of $6$26 million for the fair value of the interest rate swaps at March 31, 2018.2019. The fair value of these interest rate swaps is subject to movements in LIBOR and will fluctuate in future periods. We have estimated that a 0.25% increase in the LIBOR yield curve would increase the fair value of our interest rate swaps by $8$12 million and would decrease interest expense. While these results may be used as a benchmark, they should not be viewed as a forecast of future results.
Item 4. Controls and Procedures.
Controls and Procedures for Realogy Holdings Corp.
| |
| (a) | Realogy Holdings Corp. ("Realogy Holdings") maintains disclosure controls and procedures that are designed to ensure that information required to be disclosed in its filings under the Securities Exchange Act of 1934, as amended (the "Exchange Act"), is recorded, processed, summarized and reported within the periods specified in the rules and forms of the Securities and Exchange Commission. Such information is accumulated and communicated to its management, including its Chief Executive Officer and Chief Financial Officer, as appropriate, to allow timely decisions regarding required disclosure. Realogy Holdings' management, including the Chief Executive Officer and the Chief Financial Officer, recognizes that any set of controls and procedures, no matter how well designed and operated, can provide only reasonable assurance of achieving the desired control objectives. |
| |
| (b) | As of the end of the period covered by this quarterly report on Form 10-Q, Realogy Holdings has carried out an evaluation, under the supervision and with the participation of its management, including its Chief Executive Officer and Chief Financial Officer, of the effectiveness of the design and operation of its disclosure controls and procedures. Based upon that evaluation, the Chief Executive Officer and Chief Financial Officer concluded that Realogy Holdings' disclosure controls and procedures are effective at the "reasonable assurance" level. |
| |
| (c) | There has not been any change in Realogy Holdings' internal control over financial reporting during the period covered by this quarterly report on Form 10-Q that has materially affected, or is reasonably likely to materially affect, its internal control over financial reporting. |
Controls and Procedures for Realogy Group LLC
| |
| (a) | Realogy Group LLC ("Realogy Group") maintains disclosure controls and procedures that are designed to ensure that information required to be disclosed in its filings under the Securities Exchange Act of 1934, as amended (the "Exchange Act"), is recorded, processed, summarized and reported within the periods specified in the rules and forms of the Securities and Exchange Commission. Such information is accumulated and communicated to its management, including its Chief Executive Officer and Chief Financial Officer, as appropriate, to allow timely decisions regarding required disclosure. Realogy Group's management, including the Chief Executive Officer and the Chief Financial Officer, recognizes that any set of controls and procedures, no matter how well designed and operated, can provide only reasonable assurance of achieving the desired control objectives. |
| |
| (b) | As of the end of the period covered by this quarterly report on Form 10-Q, Realogy Group has carried out an evaluation, under the supervision and with the participation of its management, including its Chief Executive Officer and Chief Financial Officer, of the effectiveness of the design and operation of its disclosure controls and procedures. Based upon that evaluation, the Chief Executive Officer and Chief Financial Officer concluded that Realogy Group's disclosure controls and procedures are effective at the "reasonable assurance" level. |
| |
| (c) | There has not been any change in Realogy Group's internal control over financial reporting during the period covered by this quarterly report on Form 10-Q that has materially affected, or is reasonably likely to materially affect, its internal control over financial reporting. |
Other Financial Information
The Condensed Consolidated Financial Statements as of March 31, 20182019 and for the three-month periods ended March 31, 20182019 and 20172018 have been reviewed by PricewaterhouseCoopers LLP, an independent registered public accounting firm. Their reports, dated May 3, 2018,2, 2019, are included on pages 3 and 4. The reports of PricewaterhouseCoopers LLP state that they did not audit and they do not express an opinion on that unaudited financial information. Accordingly, the degree of reliance on their report on such information should be restricted in light of the limited nature of the review procedures applied. PricewaterhouseCoopers LLP is not subject to the liability provisions of Section 11 of the Securities Act of 1933 (the "Act") for their report on the unaudited financial information because that report is not a "report" or a "part" of the registration statement prepared or certified by PricewaterhouseCoopers LLP within the meaning of Sections 7 and 11 of the Act.
PART II - OTHER INFORMATION
Item 1. Legal Proceedings.
See Note 8,9, "Commitments and Contingencies—Litigation", to the Condensed Consolidated Financial Statements included elsewhere in this Reportquarterly report on Form 10-Q for additional information on the Company's legal proceedings, including a description of the Dodge, et al.matters captioned Whitlach v. PHH Corporation, et al. litigation, formerly captioned Strader, et al.Premier Valley, Inc. d/b/a Century 21 M&M and HallCentury 21 Real Estate LLC;Fenley v. PHH Corporation, et al.Realogy Franchise Group LLC, Sotheby’s International Realty, Inc., Wish Properties, Inc. and which we refer to as the Strader legal matter.DOES 1-100;Moehrl v. The National Association of Realtors, Realogy Holdings Corp., Homeservices of America, Inc., RE/MAX Holdings, Inc. and Keller Williams Realty, Inc.; Sawbill Strategic, Inc. v. The National Association of Realtors, Homeservices of America, Inc., Keller Williams Realty, Inc., Realogy Holdings Corp., and RE/MAX Holdings, Inc. and Sitzer and Winger v. The National Association of Realtors, Realogy Holdings Corp., Homeservices of America, Inc., RE/MAX Holdings, Inc., and Keller Williams Realty, Inc.
The Company believes that it has adequately accrued for legal matters as appropriate. The Company records litigation accruals for legal matters which are both probable and estimable.
Litigation and other disputes are inherently unpredictable and subject to substantial uncertainties and unfavorable resolutions could occur. In addition, class action lawsuits or regulatory proceedings challenging practices that have broad impact can be costly to defend and, depending on the class size and claims, could be costly to settle. As such, the Company could incur judgments or enter into settlements of claims with liability that are materially in excess of amounts accrued and these settlements could have a material adverse effect on the Company’s financial condition, results of operations or cash flows in any particular period.
* * *
Litigation and claims against other participants in the residential real estate industry may impact the Company and its affiliated franchisees when the rulings in those cases cover practices common to the broader industry. Examples may include claims associated with RESPA compliance, broker fiduciary duties, and sales agent classification. The Company also may be impacted by litigation and other claims against companies in other industries. Rulings on matters such as the enforcement of arbitration and class waiver agreements and worker classification may adversely affect the Company and other residential real estate industry participants as a result of the classification of sales agents as independent contractors, irrespective of the fact that the parties subject to the rulings are in a different industry. For example, a recent decision by the California Supreme Court involving delivery workers adopts a more stringent classification test than the multifactor test historically used by the California courts. To the extent the defendants are unsuccessful in these types of litigation matters, and we or our franchisees cannot distinguish our or their practices (or our industry’s practices), we and our franchisees could face significant liability and could be required to modify certain business relationships, either of which could materially and adversely impact our financial condition and results of operations. There also are changing employment-related regulatory interpretations at both the federal and state levels that could create risks around historic practices and that could require changes in business practices, both for us and our franchisees.
Changes in current legislation, regulations or interpretations that are applicable to the residential real estate service industry may also impact the Company. On April 5, 2018, the Federal Trade Commission (“FTC”) and Department
For example, there is active worker classification litigation in numerous jurisdictions against a variety of Justice (“DOJ”) announced that they will hold a joint public workshop in June 2018 to explore competition issues in theindustries—now including residential real estate brokerage industry. The workshop is expectedbrokerages in multiple states, including California and New Jersey—where the plaintiffs seek to focus on developmentsreclassify independent contractors as employees or to challenge the use of federal and state minimum wage and overtime exemptions. This type of litigation has been particularly prolific in California since the publicationCalifornia Supreme Court adopted worker classification standards in the second quarter of 2018 that are significantly more restrictive than those historically used in wage and hour cases. The California State Legislature is currently considering legislation that, if adopted, would codify the judicial test adopted by the California Supreme Court into statutory law, subject to alternate provisions that would be applicable to certain classes of workers and that may be less restrictive. There can be no assurances as to whether the California State Legislature will ultimately adopt such legislation in the current form, or at all, or if adopted, that such legislation would include alternate provisions for some or all independent real estate sales agents or that the Company would be able to satisfy any such alternative worker classification tests established by the California courts or legislature applicable to such independent real estate sales agents.
For a summary of legal proceedings initiated in California against wholly-owned subsidiary franchisors of the FTCCompany and DOJ’s Report on Competitionaffiliated franchisees alleging worker misclassification, see Note 9, "Commitments and Contingencies—Litigation", in the Real Estate Brokerage Industry from 2007, including the impact of Internet-enabled technologies on the industry and potential barriers to competition. The Company expects to submit comments and participate in the workshop.this report.
Item 2. Unregistered Sales of Equity Securities and Use of Proceeds.
| |
| (c) | The following table sets forth information relating to repurchase of shares of our common stock during the quarter ended March 31, 2018:2019: |
|
| | | | | | | | | | | | |
| Period | | Total Number of Shares Purchased | | Average Price Paid per Share | | Total Number of Shares Purchased as Part of a Publicly Announced Programs (1) | | Approximate Dollar Value of Shares that May Yet Be Purchased Under the Programs (1) |
| January 1 - 31, 2018 | | 1,182,670 |
| | $26.92 | | 1,182,670 |
| | $ | 68,640,666 |
|
| February 1 - 28, 2018 | | 308,880 |
| | $26.44 | | 308,880 |
| | $ | 410,473,879 |
|
March 1 - 31, 2018 (2) | | 2,262,455 |
| | $26.43 | | 2,262,455 |
| | $ | 350,677,193 |
|
|
| | | | | | | | | | | | |
| Period | | Total Number of Shares Purchased | | Average Price Paid per Share | | Total Number of Shares Purchased as Part of a Publicly Announced Programs (1) | | Approximate Dollar Value of Shares that May Yet Be Purchased Under the Programs (1) |
| January 2019 | | 871,292 |
| | $17.06 | | 871,292 |
| | $ | 33,899,228 |
|
| February 2019 | | 290,850 |
| | $17.67 | | 290,850 |
| | $ | 203,759,909 |
|
| March 2019 | | — |
| | $0.00 | | — |
| | $ | 203,759,909 |
|
_______________
| |
| (1) | In February 2018,2019, the Board authorized a new share repurchase program of up to $350$175 million of the Company's common stock, which was in additionincremental to the remaining authorization availablecapacity authorized under the February 20172018 share repurchase program. Repurchases under each program may be made at management's discretion from time to time on the open market, pursuant to Rule 10b5-1 trading plans or through privately negotiated transactions. The size and timing of these repurchases will depend on price, market and economic conditions, legal and contractual requirements and other factors, including the restrictions contained in the indenture governing the 9.375% Senior Notes, which prohibit such repurchases until the consolidated leverage ratio falls below 4.00 to 1.00 and then (unless that ratio falls below 3.00 to 1.00) only to the extent of available cumulative credit, as defined under the indenture governing the 9.375% Senior Notes due 2027. The repurchase programs have no time limit and may be suspended or discontinued at any time. All of the repurchased common stock has been retired. |
on price, market and economic conditions, legal and contractual requirements and other factors, and eachcash until it is able to reduce its consolidated leverage ratio (as defined in the indenture governing the 9.375% Senior Notes) to below 4.00 to 1.00. Accordingly, during this period, the Company will not repurchase common stock pursuant to its existing share repurchase program has no time limitprograms. See "Item 2.—Management's Discussion and may be suspended or discontinued at any time. AllAnalysis of the repurchased common stock has been retired.
| |
(2) | Includes 202,860 of shares purchasedFinancial Condition and Results of Operations—Financial Condition, Liquidity and Capital Resources" for which the trade date occurred in late March 2018 while settlement occurred in April 2018. |
During the period April 1, 2018 through May 1, 2018, we repurchased an additional 1.4 million shares at a weighted average market price of $26.17 per share. Giving effect to these repurchases, all of the remaining capacity under the February 2017 program has been utilized and as of May 1, 2018, we had approximately $316 million of remaining capacity authorized under the February 2018 share repurchase program.information.
Item 6. Exhibits.
See Exhibit Index.
SIGNATURES
Pursuant to the requirements of the Securities Exchange Act of 1934, the registrants have duly caused this report to be signed on its behalf by the undersigned thereunto duly authorized.
REALOGY HOLDINGS CORP.
and
REALOGY GROUP LLC
(Registrants)
Date: May 3, 20182, 2019
/S/ ANTHONY E. HULL CHARLOTTE C. SIMONELLI
Anthony E. HullCharlotte C. Simonelli
Executive Vice President and
Chief Financial Officer
Date: May 3, 20182, 2019
/S/ TIMOTHY B. GUSTAVSON
Timothy B. Gustavson
Senior Vice President,
Chief Accounting Officer and
Controller
EXHIBIT INDEX
Exhibit Description
| |
4.2 *4.1 | Supplemental Indenture, No. 6 dated as of February 6, 2018March 29, 2019, among Realogy Group LLC, as Issuer, Realogy Co-Issuer Corp., as Co-Issuer, Realogy Holdings Corp., the Note Guarantors (as defined therein) and The Bank of New York Mellon Trust Company, N.A., as Trustee, governing the 9.375% Senior Notes due 2027 (Incorporated by reference to Exhibit 4.1 to the 5.250% Senior Note Indenture.Registrants' Current Report on Form 8-K filed on March 29, 2019). |
| |
10.6 | Fifth Amendment, dated as of February 8, 2018, to the Amended and Restated Credit2019 Incremental Assumption Agreement, dated as of March 5, 2013, as amended,27, 2019, among Realogy Intermediate Holdings LLC, Realogy Group LLC, the several lenders partiesfinancial institution party thereto from time to time,and JPMorgan Chase Bank, N.A., as administrative agent for the lenders, and the other agents parties thereto (Incorporated by reference to Exhibit 10.1 to Registrants' Current Report on Form 8-K filed on February 8, 2018)March 29, 2019). |
| |
10.710.2 | Sixth Amendment, dated as of February 8, 2018, to the Amended and Restated CreditLetter Agreement dated as of March 5, 2013, as amended, amongFebruary 23, 2019 between Realogy Intermediate Holdings LLC, Realogy Group LLC, the several lenders parties thereto from time to time, JPMorgan Chase Bank, N.A., as administrative agent for the lenders,Corp. and the other agents parties theretoDonald J. Casey (Incorporated by reference to Exhibit 10.210.72 to the Registrants' Form 10-K for the year ended December 31, 2018). |
| |
10.810.4* | Second Amendment, dated as of February 8, 2018, to the Term Loan ALetter Agreement dated as of OctoberFebruary 23, 2015, among2019 between Realogy Intermediate Holdings LLC, Realogy Group LLC, the lenders party thereto from time to timeCorp. and JPMorgan Chase Bank, N.A., as administrative agent for the lenders (Incorporated by reference to Exhibit 10.3 to Registrants' Current Report on Form 8-K filed on February 8, 2018).Marilyn J. Wasser. Note: The Term Loan A Agreement reflecting the cumulative effect of all amendments through February 8, 2018 is attached as Exhibit A to this Exhibit 10.8. |
| |
101.INS ^ | XBRL Instance Document.Document - the instance document does not appear in the interactive data file because its XBRL tags are embedded within the inline XBRL document. |
Exhibit Description
| |
101.SCH ^ | XBRL Taxonomy Extension Schema Document. |
| |
101.CAL^101.CAL | XBRL Taxonomy Extension Calculation Linkbase Document. |
| |
101.DEF ^ | XBRL Taxonomy Extension Definition Linkbase Document. |
| |
101.LAB ^ | XBRL Taxonomy Extension Label Linkbase Document. |
| |
101.PRE ^ | XBRL Taxonomy Extension Presentation Linkbase Document. |
______________
| |
^ | Furnished electronically with this report. |