| Three Months Ended June 30, 2018 | |||||||||||||||||||||||||||
| Common Stock | Additional Paid-In Capital | Accumulated Deficit | Accumulated Other Comprehensive Loss | Non- controlling Interests | Total Equity | ||||||||||||||||||||||
| Shares | Amount | ||||||||||||||||||||||||||
| Balance at March 31, 2018 | 128.8 | $ | 1 | $ | 5,179 | $ | (2,711 | ) | $ | (44 | ) | $ | 3 | $ | 2,428 | ||||||||||||
| Net Income | — | — | — | 123 | — | 1 | 124 | ||||||||||||||||||||
| Other comprehensive loss | — | — | — | — | (3 | ) | — | (3 | ) | ||||||||||||||||||
| Repurchase of common stock | (4.3 | ) | — | (106 | ) | — | — | — | (106 | ) | |||||||||||||||||
| Stock-based compensation | — | — | 12 | — | — | — | 12 | ||||||||||||||||||||
| Issuance of shares for vesting of equity awards | 0.2 | — | — | — | — | — | — | ||||||||||||||||||||
| Shares withheld for taxes on equity awards | (0.1 | ) | — | (1 | ) | — | — | — | (1 | ) | |||||||||||||||||
| Dividends declared ($0.09 per share) | — | — | (11 | ) | — | — | (1 | ) | (12 | ) | |||||||||||||||||
| Balance at June 30, 2018 | 124.6 | $ | 1 | $ | 5,073 | $ | (2,588 | ) | $ | (47 | ) | $ | 3 | $ | 2,442 | ||||||||||||
| Six Months Ended June 30, 2019 | |||||||||||||||||||||||||||
| Common Stock | Additional Paid-In Capital | Accumulated Deficit | Accumulated Other Comprehensive Loss | Non- controlling Interests | Total Equity | ||||||||||||||||||||||
| Shares | Amount | ||||||||||||||||||||||||||
| Balance at December 31, 2018 | 114.6 | $ | 1 | $ | 4,869 | $ | (2,507 | ) | $ | (52 | ) | $ | 4 | $ | 2,315 | ||||||||||||
| Net Loss | — | — | — | (30 | ) | — | 1 | (29 | ) | ||||||||||||||||||
| Other comprehensive income | — | — | — | — | 1 | — | 1 | ||||||||||||||||||||
| Repurchase of common stock | (1.2 | ) | — | (20 | ) | — | — | — | (20 | ) | |||||||||||||||||
| Stock-based compensation | — | — | 15 | — | — | — | 15 | ||||||||||||||||||||
| Issuance of shares for vesting of equity awards | 1.3 | — | — | — | — | — | — | ||||||||||||||||||||
| Shares withheld for taxes on equity awards | (0.4 | ) | — | (6 | ) | — | — | — | (6 | ) | |||||||||||||||||
| Dividends declared ($0.18 per share) | — | — | (21 | ) | — | — | (2 | ) | (23 | ) | |||||||||||||||||
| Balance at June 30, 2019 | 114.3 | $ | 1 | $ | 4,837 | $ | (2,537 | ) | $ | (51 | ) | $ | 3 | $ | 2,253 | ||||||||||||
| Six Months Ended June 30, 2018 | |||||||||||||||||||||||||||
| Common Stock | Additional Paid-In Capital | Accumulated Deficit | Accumulated Other Comprehensive Loss | Non- controlling Interests | Total Equity | ||||||||||||||||||||||
| Shares | Amount | ||||||||||||||||||||||||||
| Balance at December 31, 2017 | 131.6 | $ | 1 | $ | 5,285 | $ | (2,631 | ) | $ | (37 | ) | $ | 4 | $ | 2,622 | ||||||||||||
| Cumulative effect of adoption of new accounting pronouncements | — | — | — | (13 | ) | (9 | ) | — | (22 | ) | |||||||||||||||||
| Net Income | — | — | — | 56 | — | 1 | 57 | ||||||||||||||||||||
| Other comprehensive loss | — | — | — | — | (1 | ) | — | (1 | ) | ||||||||||||||||||
| Repurchase of common stock | (7.8 | ) | — | (200 | ) | — | — | — | (200 | ) | |||||||||||||||||
| Stock-based compensation | — | — | 21 | — | — | — | 21 | ||||||||||||||||||||
| Issuance of shares for vesting of equity awards | 1.2 | — | — | — | — | — | — | ||||||||||||||||||||
| Shares withheld for taxes on equity awards | (0.4 | ) | — | (10 | ) | — | — | — | (10 | ) | |||||||||||||||||
| Dividends declared ($0.18 per share) | — | — | (23 | ) | — | — | (2 | ) | (25 | ) | |||||||||||||||||
| Balance at June 30, 2018 | 124.6 | $ | 1 | $ | 5,073 | $ | (2,588 | ) | $ | (47 | ) | $ | 3 | $ | 2,442 | ||||||||||||
| Three Months Ended March 31, 2019 | |||||||||||||||||||||||||||||||||||||||||||||||||||||||||||||||||||||||||||||
| Common Stock | Additional Paid-In Capital | Accumulated Deficit | Accumulated Other Comprehensive Loss | Non- controlling Interests | Total Equity | ||||||||||||||||||||||||||||||||||||||||||||||||||||||||||||||||||||||||
| Shares | Amount | ||||||||||||||||||||||||||||||||||||||||||||||||||||||||||||||||||||||||||||
| Balance at December 31, 2018 | 114.6 | $ | 1 | $ | 4,869 | $ | (2,507) | $ | (52) | $ | 4 | $ | 2,315 | ||||||||||||||||||||||||||||||||||||||||||||||||||||||||||||||||
| Net loss | — | — | — | (99) | — | — | (99) | ||||||||||||||||||||||||||||||||||||||||||||||||||||||||||||||||||||||
| Other comprehensive income | — | — | — | — | 2 | — | 2 | ||||||||||||||||||||||||||||||||||||||||||||||||||||||||||||||||||||||
| Repurchase of common stock | (1.2) | — | (20) | — | — | — | (20) | ||||||||||||||||||||||||||||||||||||||||||||||||||||||||||||||||||||||
| Stock-based compensation | — | — | 8 | — | — | — | 8 | ||||||||||||||||||||||||||||||||||||||||||||||||||||||||||||||||||||||
| Issuance of shares for vesting of equity awards | 1.2 | — | — | — | — | — | — | ||||||||||||||||||||||||||||||||||||||||||||||||||||||||||||||||||||||
| Shares withheld for taxes on equity awards | (0.4) | — | (6) | — | — | — | (6) | ||||||||||||||||||||||||||||||||||||||||||||||||||||||||||||||||||||||
| Dividends declared ($0.09 per share) | — | — | (10) | — | — | (1) | (11) | ||||||||||||||||||||||||||||||||||||||||||||||||||||||||||||||||||||||
| Balance at March 31, 2019 | 114.2 | $ | 1 | $ | 4,841 | $ | (2,606) | $ | (50) | $ | 3 | $ | 2,189 | ||||||||||||||||||||||||||||||||||||||||||||||||||||||||||||||||
Condensed Consolidated Statement of Changes in Equity for Realogy Group
The Company has not included a statement of changes in equity for Realogy Group as the operating results of Group are consistent with the operating results of Realogy Holdings as all revenue and expenses of Realogy Group flow up to Realogy Holdings and there are no incremental activities at the Realogy Holdings level. The only difference between Realogy Group and Realogy Holdings is that the $1 million in par value of common stock in Realogy Holdings' equity is included in additional paid inpaid-in capital in Realogy Group's equity.
Stock Repurchases
The Company may repurchase shares of its common stock under authorizations from its Board of Directors. Shares repurchased are retired and not displayed separately as treasury stock on the consolidated financial statements. The par value of the shares repurchased and retired is deducted from common stock and the excess of the purchase price over par value is first charged against any available additional paid-in capital with the balance charged to retained earnings. Direct costs incurred to repurchase the shares are included in the total cost of the shares.
The Company's Board of Directors authorized a share repurchase program of up to $275 million, $300 million, $350 million and $175 million of the Company's common stock in February 2016, 2017, 2018 and 2019, respectively.
In the first quarter of 2019, the Company repurchased and retired 1.2 million shares of common stock for $20 million at a weighted average market price of $17.21 per share. The Company didhas not repurchaserepurchased any shares under the share repurchase programs during the second quarter ofsince 2019. As of June 30, 2019, the Company had repurchased and retired 35.5 million shares of common stock for an aggregate of $896 million at a total weighted average market price of $25.22 per share. As of June 30, 2019,March 31, 2020, $204 million remained available for repurchase under the share repurchase programs. In May 2020, the Company's Board of Directors terminated its outstanding share repurchase programs.
The restrictive covenants in the indenture governing the 9.375% Senior Notes restrict the Company's ability to repurchase shares. See "Note 5. Short and Long-Term Debt—Unsecured Notes."
Stock-Based Compensation
During the first quarter of 2019,2020, the Company granted 0.9 million shares of non-qualified stock options with a weighted average exercise price of $13.45, restricted stock units related to 2.50.7 million shares with a weighted average grant date fair value of $13.53$9.70 and performance stock units related to 1.20.9 million shares with a weighted average grant date fair value of $11.08.$9.23. The Company shifted away from the use of options and granted all time-based equity awards in the form of restricted stock units which are subject to ratable vesting over a three-year period. Therefore, the Company did not grant shares of non-qualified stock options during the first quarter of 2020.
26
Earnings (loss) per share attributable to Realogy Holdings
Basic earnings (loss) per share is computed based on net income (loss) attributable to Realogy Holdings stockholders divided by the basic weighted-average shares outstanding during the period. Dilutive earnings per share is computed consistently with the basic computation while giving effect to all dilutive potential common shares and common share equivalents that were outstanding during the period. Realogy Holdings uses the treasury stock method to reflect the potential dilutive effect of unvested stock awards and unexercised options.
The Company was in a net loss position for the three months ended March 31, 2020 and 2019 and therefore the impact of incentive equity awards were excluded from the computation of dilutive loss per share as the inclusion of such amounts would be anti-dilutive.
9. COMMITMENTS AND CONTINGENCIES
| Three Months Ended June 30, | Six Months Ended June 30, | ||||||||||||||
| (in millions, except per share data) | 2019 | 2018 | 2019 | 2018 | |||||||||||
| Net income (loss) attributable to Realogy Holdings stockholders | $ | 69 | $ | 123 | $ | (30 | ) | $ | 56 | ||||||
| Basic weighted average shares | 114.3 | 126.5 | 114.1 | 128.4 | |||||||||||
| Stock options, restricted stock units and performance share units (a)(b) | 0.6 | 1.1 | — | 1.3 | |||||||||||
| Weighted average diluted shares | 114.9 | 127.6 | 114.1 | 129.7 | |||||||||||
| Earnings (Loss) Per Share: | |||||||||||||||
| Basic | $ | 0.60 | $ | 0.97 | $ | (0.26 | ) | $ | 0.44 | ||||||
| Diluted | $ | 0.60 | $ | 0.96 | $ | (0.26 | ) | $ | 0.43 | ||||||
Litigation
The Company is involved in claims, legal proceedings, alternative dispute resolution and governmental inquiries related to alleged contract disputes, business practices, intellectual property and other commercial, employment, regulatory and tax matters. Examples of such matters include but are not limited to allegations:
•that independent residential real estate sales agents engaged by NRTRealogy Brokerage Group or by affiliated franchisees—under certain state or federal laws—are potentially employees instead of independent contractors, and they or regulators therefore may bring claims against NRTRealogy Brokerage Group for breach of contract, wage and hour classification claims, wrongful discharge, unemployment and workers' compensation and could seek benefits, back wages, overtime, indemnification, penalties related to classification practices and expense reimbursement available to employees or similar claims against our franchise operationsRealogy Franchise Group as an alleged joint employer of an affiliated franchisee’s independent sales agents;
•concerning other employment law matters, including other types of worker classification claims as well as wage and hour claims and retaliation claims;
•concerning anti-trust and anti-competition matters;
•that the Company is vicariously liable for the acts of franchisees under theories of actual or apparent agency;
•by current or former franchisees that franchise agreements were breached including improper terminations;
•concerning alleged RESPA or state real estate law violations;
•concerning claims related to the Telephone Consumer Protection Act, including autodialer claims;
•concerning claims generally against the company owned brokerage operations for negligence, misrepresentation or breach of fiduciary duty in connection with the performance of real estate brokerage or other professional services as well as other brokerage claims associated with listing information and property history;
related to copyright law, including infringement actions alleging improper use of copyrighted photographs on websites or in marketing materials without consent of the copyright holder;
•concerning breach of obligations to make websites and other services accessible for consumers with disabilities;
•concerning claims generally against the title companyagent contending that as the escrow company, the companyagent knew or should have known that a transaction was fraudulent or concerning otherthat the agent was negligent in addressing title defects or settlement errors;conducting the settlement;
•concerning information security and cyber-crime, including claims under new and emerging data privacy laws related to the protection of customer, employee or third-party information, as well as those related to the diversion of homesale transaction closing funds; and
•those related to general fraud claims.
Worker Classification Litigation
Whitlach v. Premier Valley, Inc. d/b/a Century 21 M&M and Century 21 Real Estate LLC (Superior Court of California, AlamedaStanislaus County). This was filed as a putative class action complaint on December 20, 2018 by plaintiff James Whitlach against Premier Valley Inc., a Century 21 Real Estate independently-owned franchisee doing business as Century 21 M&M (“Century 21 M&M”). The complaint also names Century 21 Real Estate LLC, a wholly-owned subsidiary of the Company and the franchisor of Century 21 Real Estate (“Century 21”), as an alleged joint employer of the franchisee’s independent
27
sales agents and seeks to certify a class that could potentially include all agents of both Century 21 M&M and Century 21 in California. The plaintiff alleges that Century 21 M&M misclassified all of its independent real estate agents, salespeople, sales professionals, broker associates and other similar positions as independent contractors, failed to pay minimum wages, failed to provide meal and rest breaks, failed to pay timely wages, failed to keep proper records, failed to provide appropriate wage statements, made unlawful deductions from wages, and failed to reimburse plaintiff and the putative class for business related expenses, resulting in violations of the California Labor Code. The complaint also asserts an unfair business practice claim based on the alleged violations described above.
On February 15, 2019, the plaintiff amended his complaint to assert claims pursuant to the California Private Attorneys General Act (“PAGA”). The PAGA claims included in the amended complaint are substantively similar to those asserted in the original complaint. Under California law, PAGA claims are generally not subject to arbitration and may result in exposure in the form of additional penalties. In April 2019, the defendants filed motions to compel arbitration of the non-PAGA claims and to stay the PAGA claims pending resolution of the arbitrable claims and to change venue.claims. On June 5, 2019, the courtCourt dismissed the plaintiff’s non-PAGA claims without prejudice and withdrew the defendants’ motion to compel arbitration by stipulation of the parties. The plaintiff continues to pursue his PAGA claims as a representative of purported "aggrieved employees" as defined by PAGA. The plaintiff currently seeks, as the representative of all purported aggrieved employees, all non-individualized relief available to the purported aggrieved employees under PAGA, as well as attorneys’ fees. On November 15, 2019, Century 21 M&M filed a demurrer to the complaint, seeking to dismiss the remaining claim in the action, to which Century 21 filed a joinder, and on February 12, 2020 a brief in opposition was filed by the plaintiff. The hearing on the demurrer has been deferred and will not be heard until the courts reopen in California and resume addressing non-emergent civil motions.
Fenley v. Realogy Franchise Group LLC, Sotheby’s International Realty, Inc., Wish Properties, Inc. and DOES 1-100 (Superior Court of California, Kern County). This is a putative class action complaint filed on April 25, 2019 by plaintiff Elizabeth Fenley against Wish Properties, Inc, a Sotheby’s International Realty independently-owned franchisee doing business as Wish Sotheby’s International Realty (“Wish SIR”). The complaint also names Realogy Franchise Group LLC and Sotheby’s International Realty, Inc., wholly-owned subsidiaries of the Company, as alleged joint employers of the franchisee’s independent sales agents and seeks to certify a class that could potentially include all agents in California affiliated with any Realogy Franchise Group brand. The plaintiff alleges that all defendants are jointly responsible for misclassifying Wish SIR’s agents as independent contractors and failed to reimburse for business expenses, provide accurate wage statements and pay wages timely, all in violation of the California Labor Code. The complaint also asserts an unfair business practice claim based on the violations previously described. The plaintiff seeks reimbursement of allegedly necessary expenses, liquidated damages, waiting time penalties, civil penalties, pre- and post-judgment interest, restitution, injunctive relief, and attorneys’ fees and costs. On July 26,September 17, 2019, Wish SIR filed a motionthe Court denied the defendants’ motions to compel arbitration and stay all legal proceedings pending conclusion ofarbitration. In February 2020, the arbitration. On the same day, Realogy Franchise Group LLC and Sotheby’s International Realty, Inc. filed their own motion to compel arbitration and a joinder in Wish SIR’s motion.matter was settled on an individual basis.
These cases raise various previously unlitigated claims and the PAGA claims in the Whitlach matter add additional litigation, financial and operating uncertainties. There are similar classification cases pending against several other brokerages in the state of California and developments in one or more of those cases could impact progress in these cases.
Real Estate Industry Litigation
Moehrl, Cole, Darnell, Nager, Ramey, Sawbill Strategic, Inc., Umpa and Ruh v. The National Association of Realtors, Realogy Holdings Corp., Homeservices of America, Inc., BHH Affiliates, LLC, The Long & Foster Companies, Inc., RE/MAX LLC, and Keller Williams Realty, Inc. (U.S. District Court for the Northern District of Illinois). This amended putative class action complaint (the "amended MoehlerMoehrl complaint"), filed on June 14, 2019, (i) consolidates the Moehrl and Sawbill litigation reported in our Form 10-Q for the period ended March 31, 2019, (ii) adds certain plaintiffs and defendants, and (iii) serves as a response to the separate motions to dismiss filed on May 17, 2019 in the prior Moehrl litigation by each of NAR and the Company (along with the other defendants named in the prior Moehrl complaint).
In the amended Moehrl complaint, the plaintiffs allege that the defendants engaged in a continuing contract, combination, or conspiracy to unreasonably restrain trade and commerce in violation of Section 1 of the Sherman Act because defendant NAR allegedly established mandatory anticompetitive policies for the multiple listing services and its member brokers that require brokers to make an offer of buyer broker compensation when listing a property. The plaintiffs further allege that commission sharing, which provides for the broker representing the seller sharing or paying a portion of its commission to the broker representing the buyer, is anticompetitive and violates the Sherman Act, and that the defendant franchisors conspired with NAR by requiring their respective franchisees to comply with NAR’s policies and Code of Ethics. The plaintiffs seek a permanent injunction enjoining the defendants from requiring home sellers to pay buyer broker
28
commissions or to otherwise restrict competition among buyer brokers, an award of damages and/or restitution, attorneys fees and costs of suit. Plaintiffs' counsel has filed a motion to appoint lead counsel in the case, which has yet to be decided by the court.Court. On August 9, 2019, NAR and the Company (together with the other defendants named in the amended Moehrl complaint) each filed separate motions to dismiss this litigation. The plaintiffs filed their opposition to the motions to dismiss on September 13, 2019, and the defendants filed their replies in support of the motions on October 18, 2019. Discovery between the parties is stayed pending rulings on the outstanding motions to dismiss this litigation.
Sitzer and Winger v. The National Association of Realtors, Realogy Holdings Corp., Homeservices of America, Inc., RE/MAX Holdings, Inc., and Keller Williams Realty, Inc. (U.S. District Court for the Western District of Missouri). This is a putative class action complaint filed on April 29, 2019 and amended on June 21, 2019 by plaintiffs Joshua Sitzer and Amy Winger against NAR, the Company, Homeservices of America, Inc., RE/MAX Holdings, Inc., and Keller Williams Realty, Inc. The complaint contains substantially similar allegations, and seeks the same relief under the Sherman Act, as the Sawbill and Moehrl litigations.litigation. The Sitzer litigation is limited both in allegations and relief sought to the State of Missouri and includes an additional cause of action for alleged violation of the Missouri Merchandising Practices Act, or MMPA. On July 10,August 22, 2019, defendants filedthe Court denied defendants' motions to transfer the Sitzermatter to the U.S. District Court for the Northern District of Illinois. On August 5,Illinois and on October 16, 2019, denied the motions to dismiss this litigation filed respectively by NAR and the Company (together with the other defendants named inbrokerage/franchisor defendants). Discovery between the Sitzer complaint) each filed separate motions to dismiss this litigation.parties is ongoing.
Securities Litigation
Tanaskovic v. Realogy Holdings Corp., et. al. (U.S. District Court for the District of New Jersey). This is a putative class action complaint filed on July 11, 2019 by plaintiff Sasa Tanaskovic against the Company and certain of its current and former executive officers. The lawsuit alleges violations of Sections 10(b), 20(a) and Rule 10b-5 of the Exchange Act in connection with allegedly false and misleading statements made by the Company about its business, operations, and prospects. The plaintiffs seek, among other things, compensatory damages for purchasers of the Company’s common stock between February 24, 2017 through May 22, 2019, as well as attorneys’ fees and costs. Locals 302 and 612 of the International Union of Operating Engineers-Employers Construction Industry Retirement Trust (the “Retirement Trust”), was appointed lead plaintiff on November 7, 2019. Lead plaintiff filed its amended complaint on March 6, 2020 and the Company has until August 3, 2020 to file its response per the stipulation of the parties entered by the Court on March 25, 2020.
Fried v. Realogy Holdings Corp., et al. (U.S. District Court for the District of New Jersey). This is a putative derivative action filed on October 23, 2019 by plaintiff Adam Fried against the Company (as nominal defendant) and certain of its current and former executive officers and members of its Board of Directors (as defendants). The lawsuit alleges violations of Section 14(a) of the Exchange Act and breach of fiduciary duties for, among other things, allegedly false and misleading statements made by the Company about its business, operations and prospects as well as unjust enrichment claims. The plaintiff seeks, among other things, compensatory damages, disgorgement of improper compensation, certain reforms to the Company’s corporate governance and internal procedures and attorneys’ fees and costs. On December 23, 2019, the Court approved a motion staying this case pending further action in the Tanaskovic matter.
The Company disputes the allegations in each of the captioned matters described above and will vigorously defend these actions. Given the early stages of each of these cases, we cannot estimate a range of reasonably possible losses for this litigation.
The Company believes that it has adequately accrued for legal matters as appropriate. The Company records litigation accruals for legal matters which are both probable and estimable.
Litigation and other disputes are inherently unpredictable and subject to substantial uncertainties and unfavorable resolutions could occur. In addition, class action lawsuits can be costly to defend and, depending on the class size and claims, could be costly to settle. As such, the Company could incur judgments or enter into settlements of claims with liability that are materially in excess of amounts accrued and these settlements could have a material adverse effect on the Company’s financial condition, results of operations or cash flows in any particular period.
* * *
Company-Initiated Litigation
Realogy Holdings Corp. v. SIRVA Worldwide, Inc., North American Van Lines, Inc., Madison Dearborn Capital Partners VII-A, L.P., Madison Dearborn Capital Partners VII-C, L.P., and Madison Dearborn Capital Partners VII
29
Executive-A, L.P. (Court of Chancery of the State of Delaware). On April 27, 2020, the Company filed a complaint against affiliates of MDP and SIRVA to enforce SIRVA’s obligations under the Purchase Agreement for the sale of the Company’s employee relocation services business. The Company alleges breach of contract and seeks specific performance by SIRVA to perform its obligations under the Purchase Agreement, or in the alternative, ordering the defendants to specifically perform their contractual obligations to pay the Company a $30 million termination fee, as well as costs and expenses, including reasonable attorney’s fees. On April 30, 2020, the Company filed a motion to the expedite proceedings and the Court has scheduled a telephonic hearing for such motion on May 8, 2020.
Realogy Holdings Corp., NRT New York LLC (d/b/a The Corcoran Group), Sotheby’s International Realty, Inc., Coldwell Banker Residential Brokerage Company, Coldwell Banker Residential Real Estate LLC, NRT West, Inc., Martha Turner Properties, L.P. And Better Homes and Gardens Real Estate LLC v. Urban Compass, Inc., and Compass, Inc.
* * *
The Company is involved in certain other claims and legal actions arising in the ordinary course of our business. Such litigation, regulatory actions and other proceedings may include, but are not limited to, actions relating to intellectual property, commercial arrangements, franchising arrangements, the fiduciary duties of brokers, standard brokerage disputes like the failure to disclose accurate square footage or hidden defects in the property such as mold, vicarious liability based upon conduct of individuals or entities outside of our control, including franchisees and independent sales agents, antitrust and anti-competition claims, general fraud claims (including wire fraud associated with third-party diversion of funds from a brokerage transaction), employment law claims, including claims challenging the classification of our sales agents as independent contractors, wage and hour classificationrelated claims, and claims related to business actions responsive to the COVID-19 outbreak and governmental and regulatory directives thereto, and claims alleging violations of RESPA, state consumer fraud statutes or federal consumer protection statutes. While the results of such claims and legal actions cannot be predicted with certainty, we do not believe based on information currently available to us that the final outcome of current proceedings against the Company will have a material adverse effect on our consolidated financial position, results of operations or cash flows. In addition, with the increasing requirements resulting from government laws and regulations concerning data breach notifications and data privacy and protection obligations, claims associated with these laws may become more common. While most litigation involves claims against the Company, from time to time the Company commences litigation, including litigation against former employees, franchisees and competitors when it alleges that such persons or entities have breached agreements or engaged in other wrongful conduct.
* * *
Cendant Corporate Liabilities and Guarantees to Cendant and Affiliates
Realogy Group (then Realogy Corporation) separated from Cendant on July 31, 2006 (the "Separation"), pursuant to a plan by Cendant (now known as Avis Budget Group, Inc.) to separate into four4 independent companies—one1 for each of Cendant's business units—real estate services (Realogy Group), travel distribution services ("Travelport"), hospitality services, including timeshare resorts ("Wyndham Worldwide"), and vehicle rental ("Avis Budget Group"). Pursuant to the Separation and Distribution Agreement dated as of July 27, 2006 among Cendant, Realogy Group, Wyndham Worldwide and Travelport (the "Separation and Distribution Agreement"), each of Realogy Group, Wyndham Worldwide and
30
Travelport have assumed certain contingent and other corporate liabilities (and related costs and expenses), which are primarily related to each of their respective businesses. In addition, Realogy Group has assumed 62.5% and Wyndham Worldwide has assumed 37.5% of certain contingent and other corporate liabilities (and related costs and expenses) of Cendant.
The due to former parent balance was $18 million at June 30, 2019both March 31, 2020 and $21 million at December 31, 2018, respectively.2019. The due to former parent balance was comprised of the Company’s portion of the following: (i) Cendant’s remaining contingent tax liabilities, (ii) accrued interest on contingent tax liabilities, (iii) potential liabilities related to Cendant’s terminated or divested businesses, and (iv) potential liabilities related to the residual portion of accruals for Cendant operations.
Tax Matters
The Company is subject to income taxes in the United States and several foreign jurisdictions. Significant judgment is required in determining the worldwide provision for income taxes and recording related assets and liabilities. In the ordinary course of business, there are many transactions and calculations where the ultimate tax determination is uncertain. The Company is regularly under audit by tax authorities whereby the outcome of the audits is uncertain. The Company believes there is appropriate support for positions taken on its tax returns. The liabilities that have been recorded represent the best estimates of the probable loss on certain positions and are adequate for all open years based on an assessment of many factors including past experience and interpretations of tax law applied to the facts of each matter. However, the outcomes of tax audits are inherently uncertain.
Escrow and Trust Deposits
As a service to its customers, the Company administers escrow and trust deposits which represent undisbursed amounts received for the settlement of real estate transactions. Deposits at FDIC-insured institutions are insured up to $250 thousand.$250 thousand. These escrow and trust deposits totaled $685$556 million at June 30, 2019March 31, 2020 and $426$475 million at December 31, 2018.2019. These escrow and trust deposits are not assets of the Company and, therefore, are excluded from the accompanying Condensed Consolidated Balance Sheets. However, the Company remains contingently liable for the disposition of these deposits.
10. SEGMENT INFORMATION
The reportable segments presented below represent the Company’s operating segments for which separate financial information is available and which is utilized on a regular basis by its chief operating decision maker to assess performance and to allocate resources. In identifying its reportable segments, the Company also considers the nature of services provided by its operating segments. During the first quarter of 2020, Realogy Leads Group was consolidated into Realogy Franchise Group and the segment change is reflected for all periods presented. Realogy Leads Group, which previously was part of Cartus, consists of the Company's affinity and broker-to-broker business, as well as the broker network made up of agents and brokers from Realogy’s residential real estate brands and certain independent real estate brokers (which is referred to as the Realogy Advantage Broker Network). The Company initiated litigation against MDP and SIRVA to enforce SIRVA’s obligations under the Purchase Agreement as described in Note 11. "Subsequent Events". Based upon developments in this litigation, the Company may reassess segment classification in future periods.
Management evaluates the operating results of each of its reportable segments based upon revenue and Operating EBITDA. Operating EBITDA is defined by us as net income (loss) before depreciation and amortization, interest expense, net, (other than relocation services interest for securitization assets and securitization obligations), income taxes, and other items that are not core to the operating activities of the Company such as restructuring charges, former parent legacy items, gains or losses on the early extinguishment of debt, asset impairments, gains or losses on discontinued operations and gains or losses on the sale of investments or other assets. The Company’s presentation of Operating EBITDA may not be comparable to similar measures used by other companies.
| Revenues (a) (b) | |||||||||||||||||
| Three Months Ended March 31, | |||||||||||||||||
| 2020 | 2019 | ||||||||||||||||
| Realogy Franchise Group | $ | 168 | $ | 179 | |||||||||||||
| Realogy Brokerage Group | 869 | 816 | |||||||||||||||
| Realogy Title Group | 137 | 114 | |||||||||||||||
| Corporate and Other (c) | (58) | (55) | |||||||||||||||
| Total Company | $ | 1,116 | $ | 1,054 | |||||||||||||
31
| Revenues (a) (b) | |||||||||||||||
| Three Months Ended June 30, | Six Months Ended June 30, | ||||||||||||||
| 2019 | 2018 | 2019 | 2018 | ||||||||||||
| Real Estate Franchise Services | $ | 234 | $ | 237 | $ | 397 | $ | 413 | |||||||
| Company Owned Real Estate Brokerage Services | 1,331 | 1,408 | 2,147 | 2,325 | |||||||||||
| Relocation Services | 97 | 105 | 173 | 184 | |||||||||||
| Title and Settlement Services | 160 | 162 | 274 | 282 | |||||||||||
| Corporate and Other (c) | (87 | ) | (92 | ) | (142 | ) | (155 | ) | |||||||
| Total Company | $ | 1,735 | $ | 1,820 | $ | 2,849 | $ | 3,049 | |||||||
_______________
| Operating EBITDA | |||||||||||||||
| Three Months Ended June 30, | Six Months Ended June 30, | ||||||||||||||
| 2019 | 2018 | 2019 | 2018 | ||||||||||||
| Real Estate Franchise Services | $ | 163 | $ | 173 | $ | 253 | $ | 278 | |||||||
| Company Owned Real Estate Brokerage Services | 47 | 61 | (15 | ) | 16 | ||||||||||
| Relocation Services | 27 | 34 | 29 | 33 | |||||||||||
| Title and Settlement Services | 32 | 31 | 23 | 25 | |||||||||||
| Corporate and Other (a) | (24 | ) | (23 | ) | (49 | ) | (42 | ) | |||||||
| Less: Depreciation and amortization (b) | 50 | 49 | 99 | 99 | |||||||||||
| Interest expense, net | 81 | 46 | 144 | 79 | |||||||||||
| Income tax expense (benefit) | 34 | 52 | (1 | ) | 33 | ||||||||||
| Restructuring costs, net (c) | 9 | 6 | 21 | 36 | |||||||||||
| Impairment | 2 | — | 3 | — | |||||||||||
| Loss on the early extinguishment of debt (d) | — | — | 5 | 7 | |||||||||||
| Net income (loss) attributable to Realogy Holdings and Realogy Group | $ | 69 | $ | 123 | $ | (30 | ) | $ | 56 | ||||||
| Operating EBITDA | |||||||||||||||||
| Three Months Ended March 31, | |||||||||||||||||
| 2020 | 2019 | ||||||||||||||||
| Realogy Franchise Group | $ | 101 | $ | 98 | |||||||||||||
| Realogy Brokerage Group | (51) | (62) | |||||||||||||||
| Realogy Title Group | 12 | (9) | |||||||||||||||
| Corporate and Other (a) | (25) | (25) | |||||||||||||||
| Total continuing operations | 37 | 2 | |||||||||||||||
| Less: Depreciation and amortization | 45 | 41 | |||||||||||||||
| Interest expense, net | 101 | 63 | |||||||||||||||
| Income tax benefit | (132) | (32) | |||||||||||||||
| Restructuring costs, net (b) | 11 | 9 | |||||||||||||||
| Impairments (c) | 447 | 1 | |||||||||||||||
| Loss on the early extinguishment of debt (d) | — | 5 | |||||||||||||||
| Net loss from continuing operations | (435) | (85) | |||||||||||||||
| Net loss from discontinued operations | (27) | (14) | |||||||||||||||
| Net loss attributable to Realogy Holdings and Realogy Group | $ | (462) | $ | (99) | |||||||||||||
_______________
(a)Includes the elimination of transactions between segments.
(b)The three months ended March 31, 2020 includes restructuring charges of $1 million at Realogy Franchise Group, $9 million at Realogy Brokerage Group and $1 million at Realogy Title Group.
The three months ended June 30, 2018March 31, 2019 includes restructuring charges of $4 million in the Company Owned Real Estateat Realogy Brokerage Services segment,Group, $1 million inat Realogy Title Group and $4 million at Corporate and Other.
(c)Impairments for the Relocation Services segmentthree months ended March 31, 2020 include a goodwill impairment charge of $413 million which reduced the net carrying value of Realogy Brokerage Group by $314 million after accounting for the related income tax benefit of $99 million, an impairment charge of $30 million which reduced the carrying value of trademarks at Realogy Franchise Group and $4 million related to lease asset impairments. Impairments for the three months ended March 31, 2019 include $1 million inof impairment charges related to lease asset impairments.
(d)Loss on the Title and Settlement Services segment.
32
11. SUBSEQUENT EVENTS
Update to Planned Sale of Cartus Relocation Services
The Company entered into a Purchase and Sale Agreement on November 6, 2019 (the "Purchase Agreement"), for the acquisition of Cartus Relocation Services, the Company's global employee relocation business, by North American Van Lines, Inc. (as assignee of SIRVA) for $375 million in cash at closing, subject to certain adjustments set forth in the Purchase Agreement, and a $25 million deferred payment after the closing of the transaction. SIRVA is a portfolio company of Madison Dearborn Partners, LLC ("MDP").
The Company strongly believes that all conditions to SIRVA’s obligations to effect the closing have been and continue to be satisfied. On April 24, 2020, the Company delivered notice to SIRVA that it had satisfied all such conditions under the Purchase Agreement and was committed to closing the transaction on April 29, 2020. On April 25, 2020, SIRVA notified the Company that it did not believe that all conditions to closing have been or will be satisfied by the April 30, 2020 termination date under the Purchase Agreement.
On April 27, 2020, the Company filed a lawsuit against affiliates of MDP and SIRVA to enforce SIRVA’s obligations under the Purchase Agreement. SIRVA has since delivered notices to the Company purportedly terminating the Purchase Agreement, the validity of which the Company disputes. The Company strongly disagrees with SIRVA’s position and will pursue all legal remedies to enforce SIRVA’s obligations under the Purchase Agreement.
As of March 31, 2020, the assets and liabilities of Cartus Relocation Services are classified as held for sale in the Condensed Consolidated Balance Sheets and the results are reported in this Quarterly Report as discontinued operations. "Net loss from discontinued operations" is reflected on the Condensed Consolidated Statements of Operations for all periods presented. Based upon developments in this litigation, the Company will reassess held for sale and discontinued operations accounting treatment in future periods.
33
Item 2. Management's Discussion and Analysis of Financial Condition and Results of Operations.
The following discussion and analysis should be read in conjunction with our Condensed Consolidated Financial Statements and accompanying notes thereto included elsewhere herein and with our Consolidated Financial Statements and accompanying notes included in the 20182019 Form 10-K. Unless otherwise noted, all dollar amounts in tables are in millions. Neither Realogy Holdings, the indirect parent of Realogy Group, nor Realogy Intermediate, the direct parent company of Realogy Group, conducts any operations other than with respect to its respective direct or indirect ownership of Realogy Group. As a result, the condensed consolidated financial positions, results of operations and cash flows of Realogy Holdings, Realogy Intermediate and Realogy Group are the same. This Management's Discussion and Analysis of Financial Condition and Results of Operations, or MD&A, contains forward-looking statements. See "Forward-Looking Statements" in this report and "Forward-Looking Statements" and "Risk Factors" in this Quarterly Report as well as our 20182019 Form 10-K for a discussion of the uncertainties, risks and assumptions associated with these statements. Actual results may differ materially from those contained in any forward-looking statements.
OVERVIEW
We are a global provider of real estate and relocation services and report our operations in the following fourthree business segments:
•Realogy Brokerage Group—operates a full-service real estate brokerage business with approximately 700 owned and operated brokerage offices with approximately 52,200 independent sales agents principally under the Coldwell Banker®, Corcoran® and Sotheby’s International Realty® brand names in many of the largest metropolitan areas in the U.S.
•Realogy Title Group—provides full-service title and settlement services to real estate companies, affinity groups, corporations and financial institutions with many of these services provided in connection with the Company's real estate brokerage business. This segment also includes the Company's share of equity earnings and losses for our Guaranteed Rate Affinity mortgage origination joint venture.
Our technology and data group pursues technology-enabled solutions to support our business segments and franchisees as well as independent sales agents affiliated with Realogy Brokerage and Franchise Groups and their customers.
RECENT DEVELOPMENTS
COVID-19
The COVID-19 pandemic is having a profound effect on the global economy and financial markets. This unprecedented situation has created considerable risks and uncertainties for almost all sectors, including the U.S. real estate services industry, as well as for the Company and its affiliated franchisees, including those arising from the adverse effects on the economy as well as risks related to employees, independent sales agents, franchisees, and consumers.
In the United States, federal, state and local governments continue to react to this evolving public health crisis by, among other actions, recommending or requiring the avoidance of gatherings of people or significantly or entirely curtailing activities categorized as non-essential. The first statewide "shelter in place" order in the U.S. was issued by the State of California on March 19, 2020 and as of April 30, 2020, the vast majority of all Americans were subject to restrictions on their activities due to the public health crisis, although the level and duration of such restrictions vary by state and local mandates. Our near-term priority has been, and continues to be, the protection of the health and safety of our employees,
34
affiliated agents and franchisees and customers. Substantially all of our employees have been working remotely since mid-March 2020 and in early March 2020, we moved quickly to transform several near-term brand events to a virtual-only format.
Federal guidance from the U.S. Department of Homeland Security issued on March 28, 2020 included residential real estate services (including settlement services) on the list of essential services that are deemed critical to public health and safety as well as economic and national security. However, the definition of real estate services and whether the provision of real estate services is deemed to constitute an essential business varies by state and can also differ between counties and cities. Furthermore, even if such services are categorized as essential in any particular geography, local or state regulations may preclude or strictly limit traditional methods of marketing homes, such as open houses or in-person showings of property and may not include all aspects of home selling, such as home inspections and home repairs.
The ability of company owned and franchised brokerages to provide such services may also be limited by brokerage policies and procedures designed to protect the health and safety of independent sales agents and consumers. Residential real estate transactions may be additionally restricted due to each consumer's preferences, including with respect to health, financial and other matters, including, but not limited to, whether the home buyer or seller is affected by the heightened economic uncertainties resulting from the pandemic, including significant declines in the value of stock (and stock market volatility), declining wages and increasing unemployment.
We are taking actions to leverage technology for virtual showings, alternative processes for contract negotiation and execution, and recent legislative and procedural changes related to items such as remote appraisals and remote notarization. However, it is currently not clear whether, and how quickly and widespread, these alternatives may be adopted by independent sales agents and consumers. In addition, remote notarization and other closing procedures are not legally permitted in all states.
We experienced positive growth in closed homesale sides and strong year-over-year increases in homesale transaction volume and homesale transaction price during January and February. Homesale transaction volume was up 13% in January and 11% in February compared to the prior year. However, commencing around mid-March 2020, we began to see declines in new contracts to buy or sell a home (commonly referred to as "open homesale contracts"), which steepened during the last week of the quarter, when we also began to see declines in closed homesale transactions. As a result, homesale transaction volume was up 3% in March compared to March 2019. Declines in open homesale contracts and closed transactions during March 2020 were particularly pronounced in densely populated areas, such as California and the New York metropolitan area (geographies which also have an average sales price much higher than the U.S. average). This trend is continuing, with sustained declines in open homesale contracts and closed transactions in April 2020, as well as declines in average sale price due to geography mix and lower inventory in the high-end markets. In addition, these trends may continue or may worsen for so long as the COVID-19 crisis continues to have a material impact on the industry, consumers and the overall economy.
Accordingly, we anticipate that our revenue for the second quarter of 2020 will be materially lower than during the comparable period in 2019, primarily due to lower homesale transaction volume.
In mid-March 2020, we began taking a series of proactive measures intended to increase liquidity to support our operations, identify and implement cost-saving measures, and to work to provide liquidity to affiliated franchisees in light of the emerging COVID-19 crisis. These measures are assessed by management on an ongoing basis and may be extended and/or expanded as the situation evolves. Specifically:
•To supplement available cash on hand, we borrowed an additional $400 million under our Revolving Credit Facility in March 2020 resulting in $755 million of outstanding borrowings under our Revolving Credit Facility at March 31, 2020 and $628 million of cash and cash equivalents as of March 31, 2020.
•To preserve capital, we implemented a series of cost saving initiatives, which we expect to result in cost savings of $80 to $100 million for each full quarter for so long as such measures remain in place. Depending on management’s ongoing assessments, we may expand or contract the mix and scope of these cost saving initiatives (which may have an impact on quarterly savings). Current initiatives include:
◦employee-related cost-savings actions covering the vast majority of our employee base, which we expect will result in cost-savings of approximately $60 million for each full quarter for so long as such measures remain in place, including:
▪temporary salary reductions for all of our exempt employees, including our executive leadership, and temporary work-week reductions for certain non-exempt employees, each effective April 4, 2020;
▪temporary employment furloughs of certain employees, although we have continued to cover the
35
employee-portion of health insurance premiums for such employees;
▪reductions in workforce of certain non-exempt employees;
▪freezing new hires; and
▪elimination of our employee 401(k) match effective April 4, 2020;
◦other cost saving actions including reductions in marketing expense, incremental office optimization activities, delaying events and conferences as well as other actions focused on reducing operating expenses and delaying investments in certain initiatives.
•To provide enhanced liquidity to affiliated franchisees we took the following actions, which we believe are meaningful to franchisees, but are not expected to have a material impact on our financial results for the second quarter of 2020:
◦accelerated April payment of franchisee rebates by two weeks;
◦waived all domestic U.S. brand marketing fund fees (which we generally apply on a dollar-for-dollar basis to marketing expenses), including monthly minimums, if applicable, for all homesale transactions closing in the second quarter of 2020;
◦waived applicable domestic U.S. monthly minimum royalty fees due in the second quarter of 2020; and
◦agreed to retain franchisee rebate tiers at 2019 levels for the duration of 2020.
In addition, we have proactively shared information with affiliated franchisees and independent sales agents regarding the potential benefits which are available to sole proprietors and independent contractors under the "Coronavirus Aid, Relief, and Economic Security Act," or CARES Act, provision aimed at assisting small businesses during the crisis.
Material revenue declines relating to this crisis, including in the second quarter of 2020, are expected to have a material negative impact on our earnings and may also adversely impact our liquidity, notwithstanding the mitigation actions we have initiated and expect to continue during this crisis and, given the significant uncertainties created by the COVID-19 crisis and related economic downturn, may continue to have such an effect in future periods.
We are currently in compliance with our senior secured leverage ratio; however, a material decline in our franchise systemability to generate EBITDA calculated on a Pro Forma Basis, as defined in the Senior Secured Credit Agreement governing the Senior Secured Credit Facility and Term Loan A Facility, could result in our failure to comply with the senior secured leverage ratio covenant in future periods. In addition, prior to making new borrowings under the Revolving Credit Facility, we are required to certify that the representations and warranties in the Senior Secured Credit Agreement remain true and correct in all material respects as of the date of any borrowing (except to the extent such representations and warranties relate to an earlier date), including the absence of any material adverse effect on our business, property, operations or condition.
See Financial Condition, Liquidity and Capital Resources in this Item 2. for additional information on our near-term liquidity. See Note 5, "Short and Long-Term Debt", to the Condensed Consolidated Financial Statements for additional information on our short- and long-term debt. For important risks regarding our indebtedness, see Part II, Item 1A, "Risk Factors", of this Form 10-Q as well as their customers, including through ZapLabsthe risk factors that appear under the header Risks Related to Our Indebtedness in Part I, Item 1A, "Risk Factors" of the 2019 Form 10-K.
Update to the Planned Sale of Cartus Relocation Services
As previously disclosed, the Company entered into a Purchase and Sale Agreement on November 6, 2019 (the "Purchase Agreement"), for the acquisition of Cartus Relocation Services, the Company's global employee relocation business, by North American Van Lines, Inc. (as assignee of SIRVA Worldwide, Inc., or "SIRVA") for $375 million in cash at closing, subject to certain adjustments set forth in the Purchase Agreement, and a $25 million deferred payment after the closing of the transaction. SIRVA is a portfolio company of affiliates of Madison Dearborn Partners, LLC our wholly-owned subsidiary.("MDP").
On April 27, 2020, the Company filed a lawsuit against affiliates of MDP and SIRVA to enforce SIRVA’s obligations under the Purchase Agreement. SIRVA has since delivered notices to the Company purportedly terminating the Purchase
As of March 31, 2020, the assets and liabilities of Cartus Relocation Services are classified as held for sale in the Condensed Consolidated Balance Sheets and the results are reported in this Quarterly Report as discontinued operations. "Net loss from discontinued operations" is reflected on the Condensed Consolidated Statements of Operations for all periods presented.
Impairment of Goodwill and Other Indefinite-lived Intangible Assets
During the first quarter of 2020, we determined that the impact on future earnings related to the COVID-19 pandemic qualified as a triggering event for all of our reporting units and accordingly, we performed an impairment assessment of goodwill and indefinite-lived intangible assets as of March 31, 2020. This assessment resulted in the recognition of an impairment of Realogy Franchise Group trademarks of $30 million and a goodwill impairment of $413 million for Realogy Brokerage Group offset by an income tax benefit of $99 million resulting in a net reduction to Realogy Brokerage Group's carrying value of $314 million. The primary drivers to the impairments were a significant increase in the weighted average cost of capital due to the volatility in the capital and debt markets due to COVID-19 and the related lower projected financial results for 2020. The impairment charges are recorded on a separate line in the accompanying Condensed Consolidated Statements of Operations and are non-cash in nature.
Impairment analyses are highly complex and involve many subjective assumptions, estimates and judgments made by management.Suchassumptions, estimates and judgments may change in the near term due to multiple factors, including continued business and economic disruptions related to the ongoing COVID-19 crisis. If business conditions deteriorate further than we have modeled or if changes in key assumptions and estimates differ significantly from management’s expectations, it may be necessary to record additional impairment charges in the future, which may be material. See Note 3, "Goodwill and Intangible Assets", to the Condensed Consolidated Financial Statements for additional information related to impairment.
CURRENT BUSINESS AND INDUSTRY TRENDS
According to the National Association of Realtors ("NAR"), during the first halfquarter of 2019,2020, homesale transaction volume decreased 1%volume increased 13% due to a 4% decrease6% increase in the average homesale price and a 7% increase in the number of homesale transactions, partially offset bytransactions.
Homesale transaction volume on a combined basis for Realogy Franchise and Brokerage Groups increased 8% during the three months ended March 31, 2020 compared to the three months ended March 31, 2019. Homesale transaction volume at Realogy Brokerage Group increased 8%, primarily as a result of a 4% increase in average homesale price and a 3% increase in theexisting homesale transactions and homesale transaction volume at Realogy Franchise Group increased 8%, as a result of an 8% increase in average homesale price.price while existing homesale transactions remained flat.
2020. We believe that whileour first quarter 2020 results reflect these general market conditions; however, in addition to the industry fundamentals in late 2018 described above drove a significant portion of our decline in homesale transaction volume in the first half of 2019, our results for the second quarter of 2019 reflect someimpact of the modest improvements in market conditions also described above. However, during both the three- and six-month periods ended June 30, 2019,COVID-19 crisis which began around mid-March 2020, we were also negatively impacted during the first quarter of 2020 by the intensehighly competitive environment in 2019 which is reflected in our year over year comparison of the first quarter, as well as our geographic concentration.
Inventory. Although inventory levels have shown some signs of improvement during 2019,We expect that for so long as the COVID-19 crisis continues, affected geographies will experience dramatic declines in inventory. Even before the COVID-19 crisis, low housing inventory levels continue to behad been an industry-wide concern, in particular in certain highly sought-after geographies and at lower price points. According to NAR, the inventory of existing homes for sale in the U.S. increaseddecreased from 1.531.67 million as of December 2018March 2019 to 1.931.50 million as of June 2019 which is consistent with June 2018.March 2020. As a result, inventory has increased from 3.7decreased from 3.8 months of supply in December 2018March 2019 to 4.43.4 months as of June 2019. However, theseMarch 2020. These levels continue to be significantly below the 10-year average of 5.85.4 months, the 15-year average of 6.1 months and the 25-year average of 5.85.7 months.
Unemployment. More than 30 million Americans have applied for unemployment benefits since March 15, 2020 through April 25, 2020 and since the onset of the pandemic, many companies have announced reductions in work weeks and salaries. If the COVID-19 pandemic continues to curtail employment levels and economic activity for a substantial period,
37
it is likely to lead to an increase in loan defaults and foreclosure activity and make it more difficult for potential home buyers to arrange financing.
Mortgage Rates. A wide variety of factors can contribute to mortgage rates, including federal interest rates, demand, consumer income, unemployment levels and foreclosure rates. In response to the growing economic effects of the COVID-19 crisis, the Federal Reserve Board has cut the interest rate two times, dropping its benchmark interest rate to a range of 0% to 0.25% on March 15, 2020. According to Freddie Mac, mortgage rates on commitments for a 30-year, conventional, fixed-rate first mortgage averaged 4.00%3.51% for the secondfirst quarter of 20192020 compared to 4.54%4.37% for the secondfirst quarter of 2018. While2019. On March 31, 2020, mortgage rates reached as high as 4.87% in November 2018, rates have recently moderated, and on June 30, 2019 were 3.80%3.45%, according to Freddie Mac. A decline in mortgage rates generally drives increased refinancing activity, however, the demand for mortgages to purchase homes will generally decrease with declining homesale transaction activity. Due to the economic effects of the COVID-19 crisis, mortgage standards may tighten, even as rates declines, which could limit the availability of mortgage financing. Increases in mortgage rates adversely impact housing affordability and we have been and could continue toagain be negatively impacted by a rising interest rate environment. For example, a rise in mortgage rates could result in decreased homesale transaction volume if potential home sellers choose to stay with their lower mortgage rate rather than sell their home and pay a higher mortgage rate with the purchase of another home or, similarly, if potential home buyers choose to rent rather than pay higher mortgage rates.
Affordability. The fixed housing affordability index, as reported by NAR, increasedincreased from 142158 for May 2018February 2019 to 150170 for May 2019. As noted above,February 2020, which we believe that a decelerated rise in home prices contributedhas been primarily attributable to the increase in affordability.lower mortgage rates. A housing affordability index above 100 signifies that a family earning the median income has sufficient income to purchase a median-priced home, assuming a 20 percent down payment and ability to qualify for a mortgage. We expect housing affordability to be significantly impacted by the unprecedented rise in unemployment as a result of the COVID-19 crisis, but are unable to estimate the extent or duration of such decrease due to the uncertainties regarding the duration and severity of the COVID-19 crisis and its related impact on the global economy.
Recruitment and Retention of Independent Sales Agents; Commission Income. Recruitment and retention of independent sales agents and independent sales agent teams are critical to the business and financial results of a brokerage, including our company owned brokerages and those operated by our affiliated franchisees. CompetitionAggressive competition for the affiliation of independent sales agents in our industry, including within our franchise system, is high,has negatively impacted recruitment and retention efforts at both Realogy Franchise and Brokerage Groups, in particular with respect to more productive sales agents. agents, and drove a loss in our market share for 2019 compared to 2018. This loss of market share contributed to the decline in homesale transaction volume at both Realogy Franchise and Brokerage Groups and is expected to continue to adversely impact results.
We believe that a variety of factors in recent years have negatively impacted thedriven intensifying recruitment and retention oftactics for independent sales agents in the industry and has increasingly impacted theour recruitment and retention of top producing agents. Such factors include increasing competition, (which has particularly intensified in the last several quarters), increasing levels of commissions paid to agents possibly including up front(including up-front payments and equity,equity), changes in the spending
patterns of independent sales agents (as more independent sales agents purchase services from third-parties outside of their affiliated broker) and the growth in independent sales agent teams. The
In addition, industry competition for independent sales agents has been and is expected to continue to be further complicated by competitive models that do not prioritize traditional business objectives. For example, we believe that certain owned-brokerage competitors have investors that have historically allowed the pursuit of increases in market share over profitability, which not only exacerbates competition for independent sales agents, but places additional pressure on the share of commission income received by the agent.
This competitive environment has continued competitiondespite general business disruption due to the COVID-19 crisis. Competition for productive agents couldis expected to continue to have a negative impact on our homesale transaction volume and market share and could continue to put upward pressure on the average share of commissions earned by independent sales agents. These competitive market factors also impact our franchisees and such franchisees have and may continue to seek reduced royalty fee arrangements or other incentives from us to offset the continued business pressures on such franchisees, which would result in a reduction in royalty fees paid to us.
A growing number of companies are competing in non-traditional ways for a portion of the gross commission income generated by homesale transactions. For example, although most iBuying models paused home-buying activity in late March due to the COVID-19 pandemic (including our own version of such model), these models could restart as conditions
38
improve. Many iBuying business models seek to disintermediate real estate brokers and independent sales agents from buyers and sellers of homes by reducing brokerage commissions that may be earned on addressingthose transactions. In addition, the concentration and market power of the top listing aggregators allow them to monetize their platforms by a variety of actions, including expanding into the brokerage business, charging significant referral fees, charging listing and display fees, diluting the relationship between agents and brokers (and between agents and the consumer), tying referrals to use of their products, consolidating and leveraging data, and engaging in preferential or exclusionary practices to favor or disfavor other industry participants. These actions divert and reduce the earnings of other industry participants, including our company owned and franchised brokerages. Aggregators could intensify their current market dynamics by expandingbusiness tactics or introduce new programs that could be materially disadvantageous to our basebusiness and other brokerage participants in the industry and such tactics could further increase pressures on the profitability of our company owned and franchised brokerages and affiliated independent sales agents, reduce our franchisor service revenue and dilute our relationships with our franchisees and our and our franchisees' relationships with affiliated independent sales agents and affiliated franchisees, providing them with compelling databuyers and technology productssellers of homes.
As previously disclosed, we currently receive meaningful listing fees for our provision of real estate listings under agreements scheduled to expire in March 2022. Due to disputes between the parties, which heightened during the COVID-19 crisis, there is an increased risk that performance and services, generating high quality leads,payments under these agreements may be suspended or terminated. The suspension or termination of these agreements would have a negative impact on our revenues and enhancing the consumer experienceearnings but would eliminate various obligations and could result in certain reduced spend. We will continue to movefocus efforts on lead generation and other programs designed to benefit affiliated agents closerand franchisees.
New Development. Realogy Brokerage Group has relationships with developers, primarily in major cities, in particular New York City, to provide marketing and brokerage services in new developments. New development closings can vary significantly from year to year due to timing matters that are outside of our control, including long cycle times and irregular project completion timing. In addition, the new development industry has also experienced significant disruption related to the customer.
| Total amount expected to be incurred | Amount incurred to date | Total amount remaining to be incurred | |||||||||
| Real Estate Franchise Services | $ | — | $ | — | $ | — | |||||
| Company Owned Real Estate Brokerage Services | 44 | 10 | 34 | ||||||||
| Relocation Services | 4 | 4 | — | ||||||||
| Title and Settlement Services | 1 | 1 | — | ||||||||
| Corporate and Other | 5 | 3 | 2 | ||||||||
| Total | $ | 54 | $ | 18 | $ | 36 | |||||
Existing Homesales
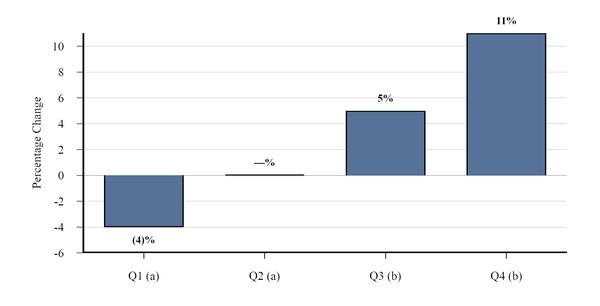
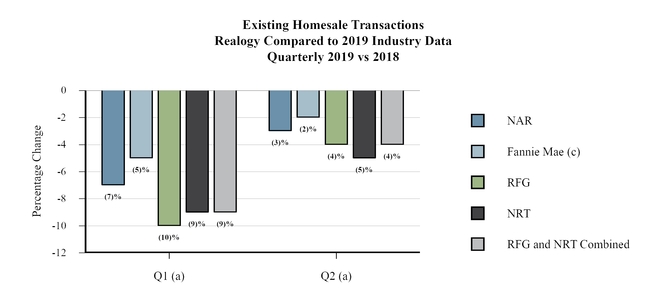
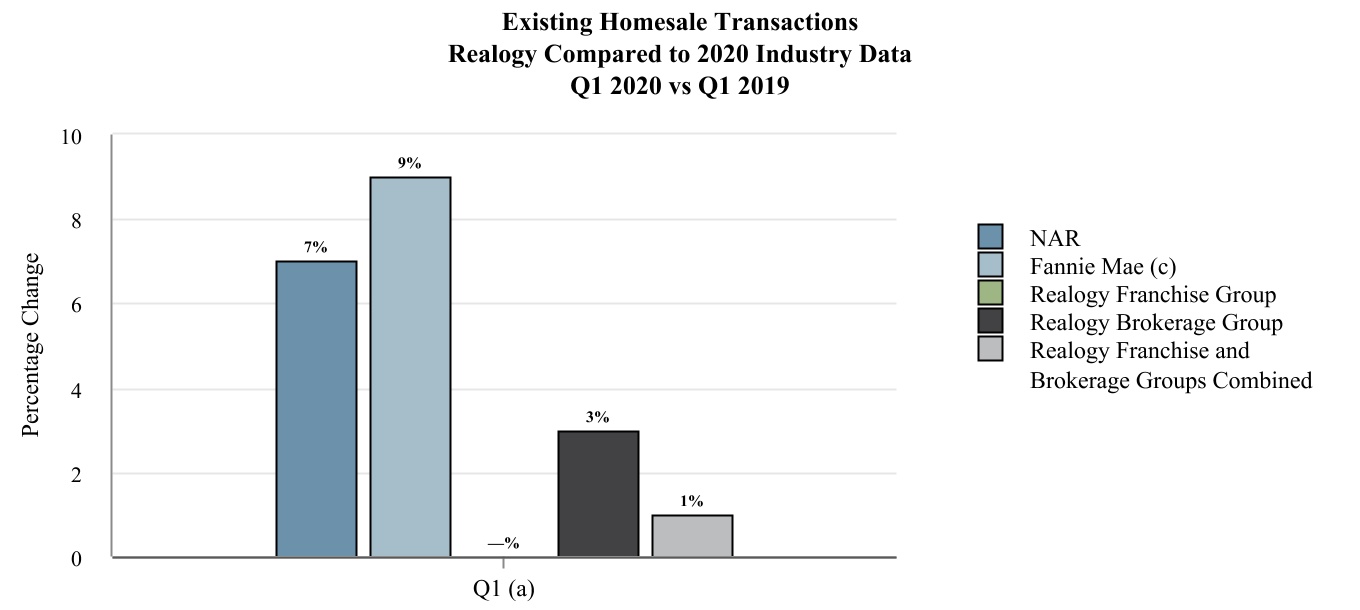
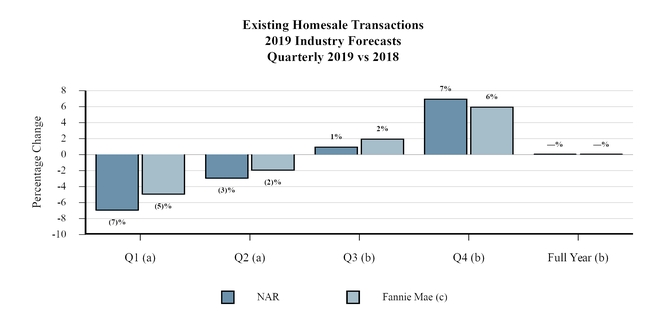
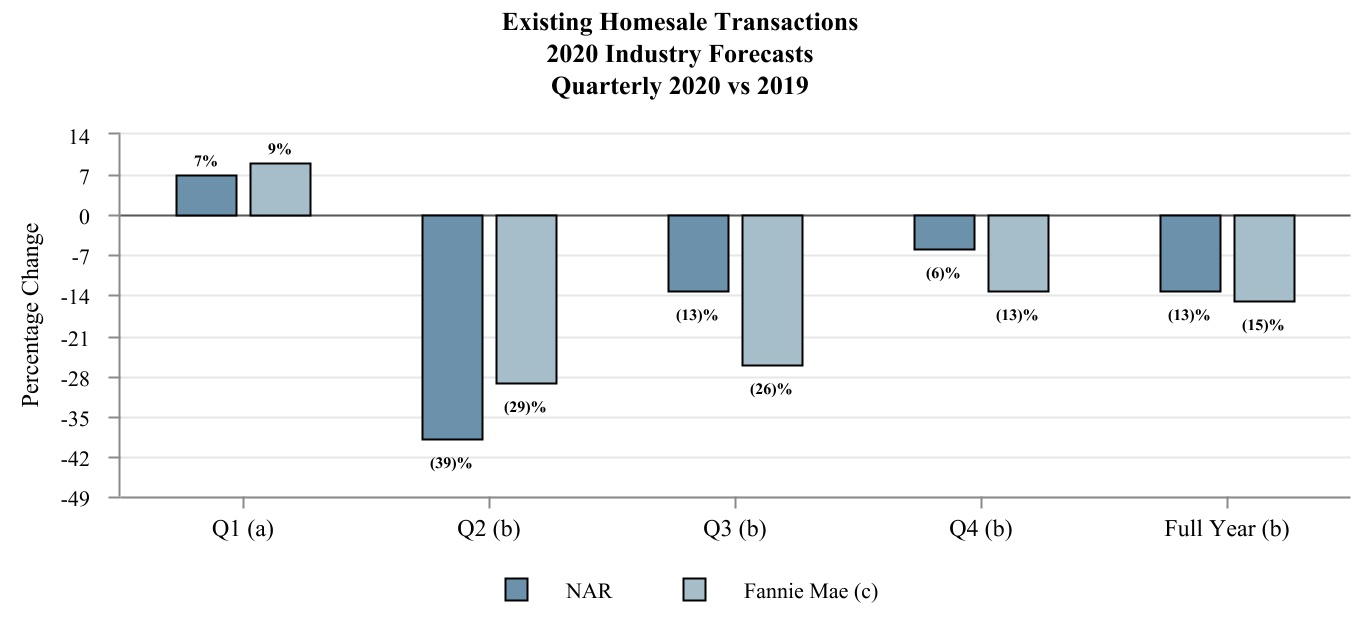
For the six monthsquarter ended June 30, 2019March 31, 2020 compared to the same period in 2018,2019, NAR existing homesale transactions decreasedtransactions increased to 2.5 million1.1 homes or down 4%up 7%. For the six monthsquarter ended June 30, 2019, RFG and NRTMarch 31, 2020, homesale transactions on a combined basis decreased 6%for Realogy Franchise and Brokerage Groups increased 1% compared to the same period in 20182019 due primarily to challenging market fundamentals,the impact, starting around mid-March 2020, of the COVID-19 crisis, the impact of competition (including on our market share), the loss of certain franchisees and the geographic concentration (in particular at NRT in California).of Realogy Brokerage Group. The quarterly and annual year-over-year trends in homesale transactions are as follows:
39
_______________
(a)Q1 existing homesale data is as of the most recent NAR press release, which is subject to sampling error.
(b)Forecasted existing homesale data, on a seasonally adjusted basis, is as of the most recent NAR forecast.
(c)Forecasted existing homesale data, on a seasonally adjusted basis, is as of the most recent Fannie Mae press release.
As of their most recent releases, NAR isand Fannie Mae are both forecasting existing homesale transactions to increase 5%15% in 2020 while Fannie Mae is forecasting existing homesale transactions to increase 1% for the same period.
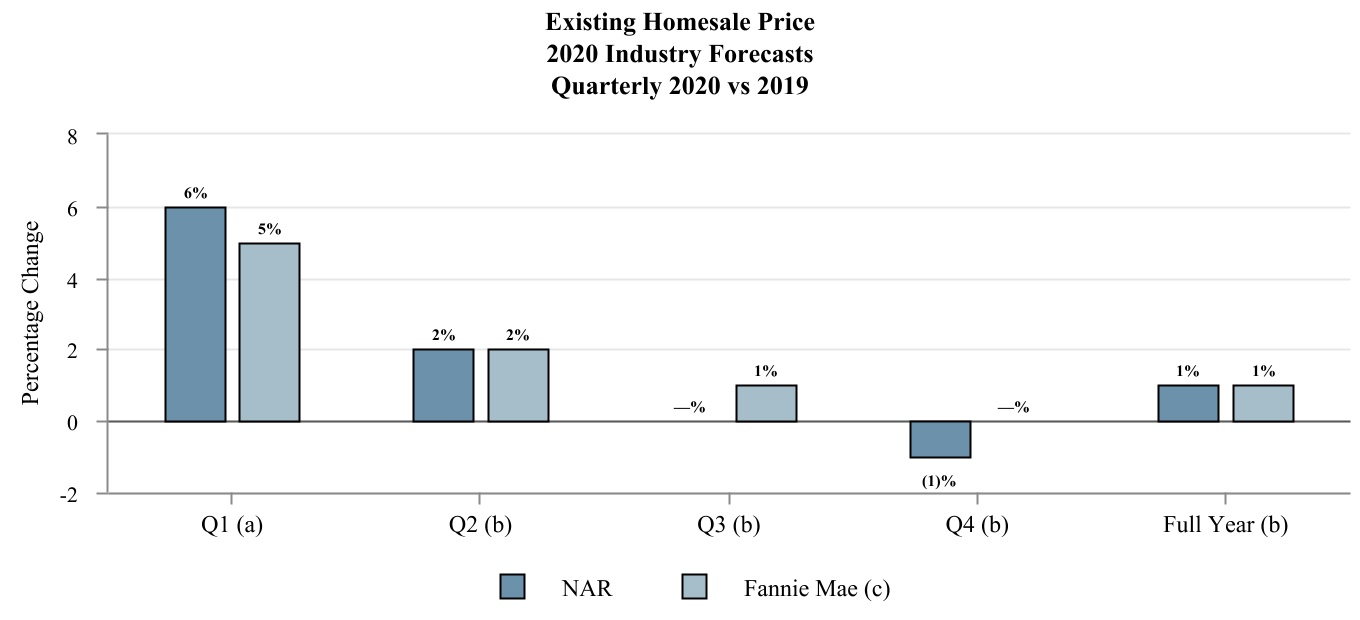
Existing Homesale Price
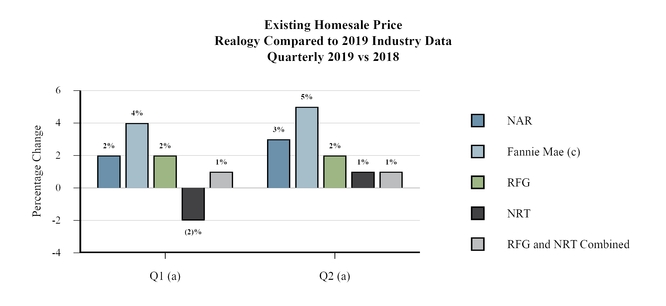
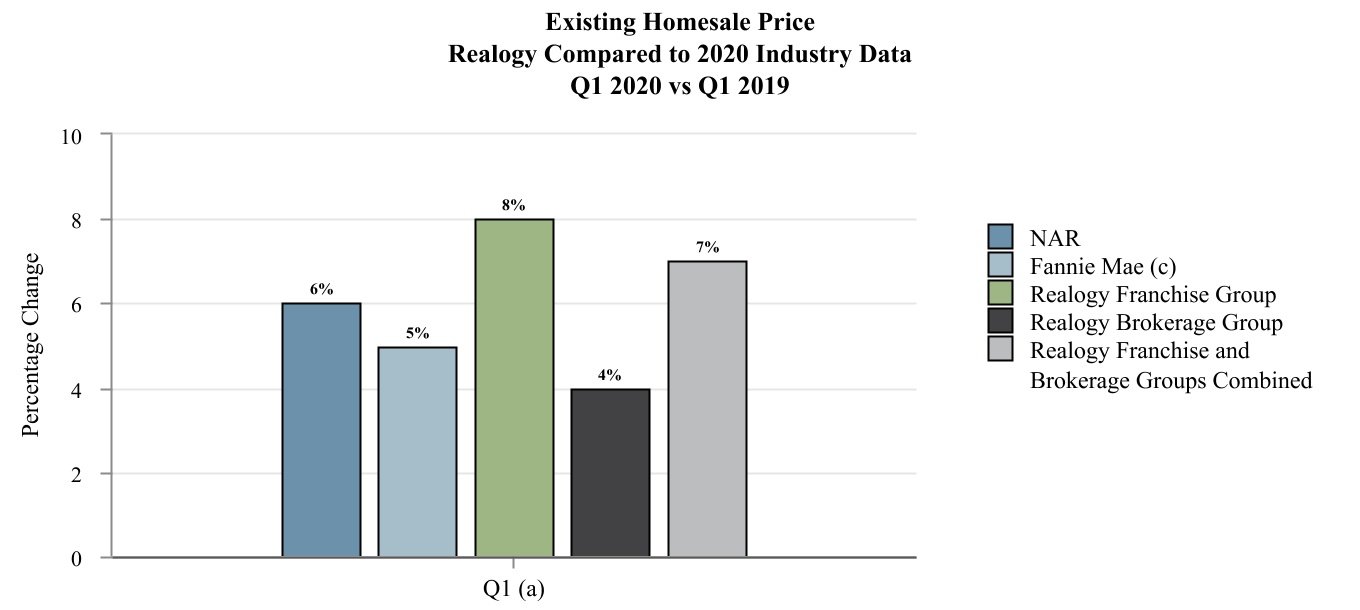
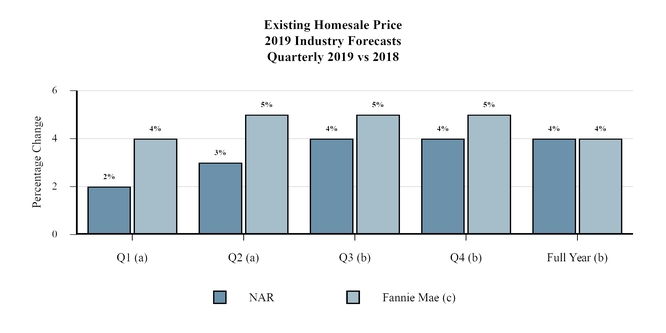
For the six monthsquarter ended June 30, 2019March 31, 2020 compared to the same period in 2018,2019, NAR existing homesale average price increased 3%6%. For the six monthsquarter ended June 30, 2019, RFG and NRT'sMarch 31, 2020, average homesale price on a combined basis for Realogy Franchise and Brokerage Groups increased 1%7% compared to the same period in 20182019. However, as noted above, beginning in April 2020, our company owned brokerages have experienced declines in average sale price due to geography mix and consisted of RFG's average homesale price increase of 2%, partially offset by NRT's average homesale price decrease of 1%. NRT'slower inventory in the high-end markets. Realogy Brokerage Group's geographic concentration in California and exposure to the high-end of the market plus the associated competitive pressures drove the year-over-year decline in homesale price compared to the overall industry. The quarterly and annual year-over-year trends in the price of homes are as follows:
40
_______________
(a)Q1 homesale price data is for existing homesale average price and is as of the most recent NAR press release.
(b)Forecasted homesale price data is for median price and is as of the most recent NAR forecast.
(c)Existing homesale price data is for median price and is as of the most recent Fannie Mae press release.
As of their most recent releases, NAR is forecasting median existing homesale price to increase 3% in 20202% while Fannie Mae is forecasting median existing homesale price to increase 4%1% in 2020.
* * *
We believe that long-term demand for housing and the growth of our industry are primarily driven by the affordability of housing, the economic health of the U.S. economy, demographic trends such as generational transitions, increases in U.S. household formation, mortgage rate levels and mortgage availability, certain tax benefits, job growth, increases in renters that qualify as homebuyers, the inherent attributes of homeownership versus renting and the influence of local housing dynamicsavailability of inventory supply versus demand.in the consumer's desired location and within the consumer's price range. At this time, certain of these factors are trending favorably, such as mortgage rate levels and household formation, although the COVID-19 pandemic continues to materially impact the entire industry and job growth.the global economy. Factors that may negatively affect growth in the housing industry include:
•the severity, length and spread of the COVID-19 pandemic and the speed of the U.S. and global economic recoveries;
•increased levels of unemployment and/or stagnant wage growth in the U.S.;
•economic stagnation or contraction in the U.S. economy;
•decreasing consumer confidence in the economy and/or the residential real estate market;
•an increase in potential homebuyers with low credit ratings or inability to afford down payments;
•reduced availability of mortgage financing or increasing down payment requirements or other mortgage challenges due to disrupted earnings;
•weak credit markets and/or instability of financial institutions;
•renewed high levels of foreclosure activity;
•a reduction in the affordability of homes;
•continued insufficient inventory levels or stagnant and/or declining home prices;
•certain provisions of the 2017 Tax Act that directly impact traditional incentives associated with home ownership and may reduce the financial distinction between renting and owning a home, including those that reduce the
41
amount that certain taxpayers would be allowed to deduct for home mortgage interest or state, local and property taxes;taxes as well as certain state or local tax reform, such as the "mansion tax" in New York City;
•decelerated or lack of building of new housing for homesales, increased building of new rental properties, or irregular timing of new development closings leading to lower unit sales at NRT,Realogy Brokerage Group, which has relationships with developers, primarily in major cities, to provide marketing and brokerage services in new developments;
•homeowners retaining their homes for longer periods of time;
•changing attitudes towards home ownership, particularly among potential first-time homebuyers who may delay, or decide not to, purchase a home, as well as changing preferences to rent versus purchase a home;
•the impact of limited or negative equity of current homeowners, as well as the lack of available inventory may limit their proclivity to purchase an alternative home;
•a decline in home ownership levels in the U.S.;
•natural disasters, such as hurricanes, earthquakes, wildfires, mudslides and other events that disrupt local or regional real estate markets, including public health crises, such as pandemics and epidemics;
•higher mortgage rates due to increases in long-term interest rates; and
•other legislative or regulatory reforms, including but not limited to reform that adversely impacts the financing of the U.S. housing market, changes relating to RESPA, potential reform of Fannie Mae and Freddie Mac, immigration reform, and further potential federal, state or local tax code reform;reform (including, for example, the proposed "pied-a-terre tax" in New York City).
* * *
While data provided by NAR and Fannie Mae are two indicators of the direction of the residential housing market, we believe that homesale statistics will continue to vary between us and NAR and Fannie Mae because:
•they use survey data and estimates in their historical reports and forecasting models, which are subject to sampling error, whereas we use data based on actual reported results;
there are geographical differences and concentrations in the markets in which we operate versus the national market. For example, many of our company owned brokerage offices are geographically located where average homesale prices are generally higher than the national average and therefore NAR survey data will not correlate with NRT'sRealogy Brokerage Group's results;
•comparability is also diminished due to NAR’s utilization of seasonally adjusted annualized rates whereas we report actual period-over-period changes and their use of median price for their forecasts compared to our average price;
•NAR historical data is subject to periodic review and revision and these revisions have been material in the past, and could be material in the future; and
•NAR and Fannie Mae generally update their forecasts on a monthly basis and a subsequent forecast may change materially from a forecast that was previously issued.
While we believe that the industry data presented herein is derived from the most widely recognized sources for reporting U.S. residential housing market statistical data, we do not endorse or suggest reliance on this data alone. We also note that forecasts are inherently uncertain or speculative in nature and actual results for any period could materially differ.
KEY DRIVERS OF OUR BUSINESSES
Within RFGRealogy Franchise and NRT,Brokerage Groups, we measure operating performance using the following key operating metrics: (i) closed homesale sides, which represents either the "buy" side or the "sell" side of a homesale transaction, (ii) average homesale price, which represents the average selling price of closed homesale transactions, and (iii) average homesale broker commission rate, which represents the average commission rate earned on either the "buy" side or "sell" side of a homesale transaction.
42
For RFG,Realogy Franchise Group, we also use net royalty per side, which represents the royalty payment to RFGRealogy Franchise Group for each homesale transaction side taking into account royalty rates, average broker commission rates, volume incentives achieved and other incentives. We utilize net royalty per side as it includes the impact of changes in average homesale price as well as all incentives and represents the royalty revenue impact of each incremental side.
For NRT,Realogy Brokerage Group, we also use gross commission income per side, which represents gross commission income divided by closed homesale sides. Gross commission income includes commissions earned in homesale transactions and certain other activities, primarily leasing and property management transactions. NRT,Realogy Brokerage Group, as a franchisee of RFG,Realogy Franchise Group, pays a royalty fee of approximately 6% per transaction to RFGRealogy Franchise Group from the commission earned on a real estate transaction. The remainder of gross commission income is split between the broker (NRT)(Realogy Brokerage Group) and the independent sales agent.
In TRG,Realogy Title Group, operating performance is evaluated using the following key metrics: (i) purchase title and closing units, which represent the number of title and closing units we process as a result of home purchases, (ii) refinance title and closing units, which represent the number of title and closing units we process as a result of homeowners refinancing their home loans, and (iii) average fee per closing unit, which represents the average fee we earn on purchase title and refinancing title sides. An increase or decrease in homesale transactions will impact the financial results of TRG;Realogy Title Group; however, the financial results are not significantly impacted by a change in homesale price. Although
Realogy Leads Group, which consists of Company- and client- directed affinity programs, broker-to-broker referrals and the average mortgage rate declined in 2019Realogy Advantage Broker Network (previously referred to as the Cartus Broker Network) was consolidated into Realogy Franchise Group during the first quarter of 2020.
During the first quarter of 2020, Cartus Relocation Services had 25,049 initiations as compared to 2018, we believe that increases in mortgage rates27,334 initiations during the first quarter of 2019. Cartus Relocation Services earned referral fee revenue from approximately 2,651 referrals in the future will most likely havefirst quarter of 2020 as compared to 2,741 referrals in the first quarter of 2019. Beginning in the second half of March 2020, Cartus experienced a negative impact on refinancing titledecline in new initiations believed to be attributable to the COVID-19 pandemic and closing units.
The following table presents our drivers for the three and six months ended June 30, 2019March 31, 2020 and 2018.2019. See "Results of Operations" below for a discussion as to how these drivers affected our business for the periods presented.
| Three Months Ended March 31, | ||||||||||||||||||||||||||||||||||||||||||||||||||
| Three Months Ended June 30, | Six Months Ended June 30, | 2020 | 2019 | % Change | ||||||||||||||||||||||||||||||||||||||||||||||
| 2019 | 2018 | % Change | 2019 | 2018 | % Change | |||||||||||||||||||||||||||||||||||||||||||||
| RFG (a) | ||||||||||||||||||||||||||||||||||||||||||||||||||
| Realogy Franchise Group (a) | Realogy Franchise Group (a) | |||||||||||||||||||||||||||||||||||||||||||||||||
| Closed homesale sides | 301,377 | 313,278 | (4 | %) | 504,039 | 537,268 | (6 | %) | Closed homesale sides | 203,188 | 202,662 | — | % | |||||||||||||||||||||||||||||||||||||
| Average homesale price | $ | 318,799 | $ | 312,087 | 2 | % | $ | 310,581 | $ | 303,955 | 2 | % | Average homesale price | $ | 322,465 | $ | 298,361 | 8 | % | |||||||||||||||||||||||||||||||
| Average homesale broker commission rate | 2.47 | % | 2.48 | % | (1 | ) bps | 2.47 | % | 2.49 | % | (2 | ) bps | Average homesale broker commission rate | 2.47 | % | 2.48 | % | (1) | bps | |||||||||||||||||||||||||||||||
| Net royalty per side (b) | $ | 331 | $ | 336 | (1 | %) | $ | 320 | $ | 325 | (2 | %) | ||||||||||||||||||||||||||||||||||||||
| NRT | ||||||||||||||||||||||||||||||||||||||||||||||||||
| Net royalty per side | Net royalty per side | $ | 316 | $ | 303 | 4 | % | |||||||||||||||||||||||||||||||||||||||||||
| Realogy Brokerage Group | Realogy Brokerage Group | |||||||||||||||||||||||||||||||||||||||||||||||||
| Closed homesale sides | 95,251 | 100,745 | (5 | %) | 155,693 | 166,842 | (7 | %) | Closed homesale sides | 62,541 | 60,442 | 3 | % | |||||||||||||||||||||||||||||||||||||
| Average homesale price | $ | 540,725 | $ | 537,748 | 1 | % | $ | 529,543 | $ | 532,706 | (1 | %) | Average homesale price | $ | 533,813 | $ | 511,922 | 4 | % | |||||||||||||||||||||||||||||||
| Average homesale broker commission rate | 2.41 | % | 2.43 | % | (2 | ) bps | 2.41 | % | 2.44 | % | (3 | ) bps | Average homesale broker commission rate | 2.41 | % | 2.41 | % | — | bps | |||||||||||||||||||||||||||||||
| Gross commission income per side | $ | 13,758 | $ | 13,804 | — | % | $ | 13,546 | $ | 13,750 | (1 | %) | Gross commission income per side | $ | 13,597 | $ | 13,212 | 3 | % | |||||||||||||||||||||||||||||||
| Cartus | ||||||||||||||||||||||||||||||||||||||||||||||||||
| Initiations | 50,586 | 53,230 | (5 | %) | 89,070 | 91,183 | (2 | %) | ||||||||||||||||||||||||||||||||||||||||||
| Referrals | 24,141 | 25,562 | (6 | %) | 39,020 | 41,088 | (5 | %) | ||||||||||||||||||||||||||||||||||||||||||
| TRG | ||||||||||||||||||||||||||||||||||||||||||||||||||
| Realogy Title Group | Realogy Title Group | |||||||||||||||||||||||||||||||||||||||||||||||||
| Purchase title and closing units | 42,202 | 46,189 | (9 | %) | 70,246 | 77,930 | (10 | %) | Purchase title and closing units | 28,724 | 28,044 | 2 | % | |||||||||||||||||||||||||||||||||||||
| Refinance title and closing units | 5,270 | 4,782 | 10 | % | 9,281 | 10,192 | (9 | %) | Refinance title and closing units | 8,899 | 4,011 | 122 | % | |||||||||||||||||||||||||||||||||||||
| Average fee per closing unit | $ | 2,356 | $ | 2,282 | 3 | % | $ | 2,320 | $ | 2,231 | 4 | % | Average fee per closing unit | $ | 2,269 | $ | 2,267 | — | % | |||||||||||||||||||||||||||||||
_______________
(a)Includes all franchisees except for Realogy Brokerage Group.
A decline in the number of homesale transactions andand/or decline in homesale prices could adversely affect our results of operations by: (i) reducing the royalties we receive from our franchisees, (ii) reducing the commissions our company owned
43
brokerage operations earn, (iii) reducing the demand for our title and settlement services, (iv) reducing the referral fees we earn in our relocation services business,from affinity, broker-to-broker and the Realogy Advantage Leads Network, and (v) increasing the risk of franchisee default due to lower homesale volume. Our results could also be negatively affected by a decline in commission rates charged by brokers or greater commission payments to sales agents or by an increase in volume or other incentives paid to franchisees.
Since 2014, we have experienced approximately a one basis point decline in the average homesale broker commission rate each year, which we believe has been largely attributable to increases in average homesale prices (as higher priced homes tend to have a lower broker commission) and, to a lesser extent, competitors providing fewer or similar services for a reduced fee.
Royalty fees are charged to all franchisees pursuant to the terms of the relevant franchise agreements and are included in each of the real estate brands' franchise disclosure documents. Most of our third-party franchisees are subject to a 6% royalty rate and entitled to volume incentives, although a royalty fee generally equal to 5% of franchisee commission (capped at a set amount per independent sales agent per year) is applicable to franchisees operating under the "capped fee model" that was launched for our Better Homes and Gardens® Real Estate franchise business in January 2019. Volume incentives are calculated as a progressive percentage of the applicable franchisee's eligible annual gross commission income and generally result in a net or effective royalty rate ranging from 6% to 3% for the franchisee.franchisee (prior to taking into account other incentives that may be applicable to the franchisee). Volume incentives increase or decrease as the franchisee's gross commission income generated increases or decreases, respectively. We have the right to adjust the annual volume incentive tables on an annual basis in response to changing market conditions. In addition, certain of our franchisees (including some of our larger franchiseeslargest franchisees) have a flat royalty rate of less than 6% and are not eligible for volume incentives.
Other incentives may also be used as consideration to attract new franchisees, grow franchisees (including through independent sales agent recruitment) or extend existing franchise agreements, although such incentives are generally not available to most franchisees, and, in contrast to volume incentives, the majority of other incentives are not homesale transaction based. We face significant competition from other national real estate brokerage brand franchisors for franchisees and we expect that
Realogy Brokerage Group has a significant concentration of real estate brokerage offices and transactions in geographic regions where home prices are at the higher end of the U.S. real estate market, particularly the east and west coasts, while RFGRealogy Franchise Group has franchised offices that are more widely dispersed across the United States. Accordingly, operating results and homesale statistics may differ between NRTRealogy Brokerage Group and RFGRealogy Franchise Group based upon geographic presence and the corresponding homesale activity in each geographic region. In addition, the share of commissions earned by independent sales agents directly impacts the margin earned by NRT.Realogy Brokerage Group. Such share of commissions earned by independent sales agents varies by region and commission schedules are generally progressive to incentivize sales agents to achieve higher levels of production. Commission share has been and we expect will continue to be subject to upward pressure in favor of the independent sales agent for a variety of factors, including more aggressive recruitment and retention activities taken by us and our competitors as well as growth in independent sales agent teams.
44
RESULTS OF OPERATIONS
Discussed below are our condensed consolidated results of operations and the results of operations for each of our reportable segments. The reportable segments presented below represent our operating segments for which separate financial information is available and which is utilized on a regular basis by our chief operating decision maker to assess performance and to allocate resources. In identifying our reportable segments, we also consider the nature of services provided by our operating segments. Management evaluates the operating results of each of our reportable segments based upon revenue and Operating EBITDA. Operating EBITDA is defined by us as net income (loss) before depreciation and amortization, interest expense, net, (other than relocation services interest for securitization assets and securitization obligations), income taxes, and other items that are not core to the operating activities of the Company such as restructuring charges, former parent legacy items, gains or losses on the early extinguishment of debt, asset impairments, gains or losses on discontinued operations and gains or losses on the sale of investments or other assets. Our presentation of Operating EBITDA may not be comparable to similarly titled measures used by other companies.
Our results of operations should be read in conjunction with our other disclosures in this Item 2. including under the headings Recent Developments—COVID-19 and Current Business and Industry Trends.
Three Months Ended June 30, 2019 March 31, 2020 vs. Three Months EndedJune 30, 2018 March 31, 2019
Our consolidated results comprised the following:
| Three Months Ended March 31, | |||||||||||||||||||||||||||||
| 2020 | 2019 | Change | |||||||||||||||||||||||||||
| Net revenues | $ | 1,116 | $ | 1,054 | $ | 62 | |||||||||||||||||||||||
| Total expenses | 1,692 | 1,172 | 520 | ||||||||||||||||||||||||||
| Loss from continuing operations before income taxes, equity in earnings and noncontrolling interests | (576) | (118) | (458) | ||||||||||||||||||||||||||
| Income tax benefit | (132) | (32) | (100) | ||||||||||||||||||||||||||
| Equity in earnings of unconsolidated entities | (9) | (1) | (8) | ||||||||||||||||||||||||||
| Net loss from continuing operations | (435) | (85) | (350) | ||||||||||||||||||||||||||
| Net loss from discontinued operations | (27) | (14) | (13) | ||||||||||||||||||||||||||
| Net loss | (462) | (99) | (363) | ||||||||||||||||||||||||||
| Less: Net income attributable to noncontrolling interests | — | — | — | ||||||||||||||||||||||||||
| Net loss attributable to Realogy Holdings and Realogy Group | $ | (462) | $ | (99) | $ | (363) | |||||||||||||||||||||||
| Three Months Ended June 30, | |||||||||||
| 2019 | 2018 | Change | |||||||||
| Net revenues | $ | 1,735 | $ | 1,820 | $ | (85 | ) | ||||
| Total expenses | 1,638 | 1,646 | (8 | ) | |||||||
| Income before income taxes, equity in earnings and noncontrolling interests | 97 | 174 | (77 | ) | |||||||
| Income tax expense | 34 | 52 | (18 | ) | |||||||
| Equity in earnings of unconsolidated entities | (7 | ) | (2 | ) | (5 | ) | |||||
| Net income | 70 | 124 | (54 | ) | |||||||
| Less: Net income attributable to noncontrolling interests | (1 | ) | (1 | ) | — | ||||||
| Net income attributable to Realogy Holdings and Realogy Group | $ | 69 | $ | 123 | $ | (54 | ) | ||||
Net revenues decreased $85increased $62 million or 5%6% for the three months ended June 30, 2019March 31, 2020 compared with the three months ended June 30, 2018March 31, 2019 primarily driven by lowerhigher homesale transaction volume at NRT.both RealogyFranchise and Brokerage Groups.
Total expenses for the secondfirst quarter of 2019 decreased $82020 increased $520 million compared to the secondfirst quarter of 20182019 primarily due to:
•impairments of $447 million including a goodwill impairment charge of $413 million which reduced the net carrying value of Realogy Brokerage Group by $314 million after accounting for the related income tax benefit of $99 million, an impairment charge of $30 million which reduced the carrying value of trademarks at Realogy Franchise Group (see Note 3, "Goodwill and Intangible Assets", to the Condensed Consolidated Financial Statements for additional information) and $4 million related to lease asset impairments;
•a $54$55 million decreaseincrease in commission and other sales agent-related costs primarily as a result of the impact of lowerhigher homesale transaction volume at NRT. The decreaseRealogy Brokerage Group and a shift in commissionmix to more productive agents; and other sales agent-related costs was partially offset by:
•a $35$38 million net increase in interest expense primarily due to a $37 million net expense related to our mark-to-market adjustments for our interest rate swaps that resulted in losses of $24$51 million during the second quarter of 2019 compared to no losses during the second quarter of 2018, and an $11 million increase in interest expense primarily due to the refinancing of Senior Notes in the first quarter of 2020 compared to losses of $14 million during the first quarter of 2019;
•an $11 million increasedecrease in operating and general and administrative expenses;expenses primarily due to lower employee-related, occupancy and other operating costs as a result of cost savings initiatives; and
•a $3$9 million increasedecrease in restructuring costs.marketing expense primarily due to the timing of meetings and conferences held during the first quarter of 2020 compared to the first quarter of 2019 as a result of the RGX event held in 2019 and lower advertising costs due to the beginning of the COVID-19 pandemic.
45
Equity in earnings were $7$9 million during the secondfirst quarter of 20192020 compared to earnings of $2$1 million during the secondfirst quarter of 20182019 primarily due to an improvement in earnings of Guaranteed Rate Affinity.
During the secondfirst quarter of 2019,2020, we incurred $9$11 million of restructuring costs primarily related to the Company's restructuring program focused on office consolidation and instituting operational efficiencies to drive profitability. The Company expects the estimated total cost of the plan which began in the first quarter of 2019 to be approximately $54 million.$73 million, with $49 million incurred through March 31, 2020. See Note 6, "Restructuring Costs", into the Condensed Consolidated Financial Statements for additional information.
The Company's provision for income taxes in interim periods is computed by applying its estimated annual effective tax rate against the income or loss before income taxes for the period. In addition, non-recurring or discrete items are recorded in the period in which they occur. The provision for income taxes was an expense of $34 million for the three months ended June 30, 2019 compared to an expense of $52 million for the three months ended June 30, 2018. Our effective tax rate was 33% and 30% for the three months ended June 30, 2019 and June 30, 2018, respectively.
| Revenues (a) | $ Change | % Change | Operating EBITDA | $ Change | % Change | Operating EBITDA Margin | Change | |||||||||||||||||||||||||||||||
| 2019 | 2018 | 2019 | 2018 | 2019 | 2018 | |||||||||||||||||||||||||||||||||
| RFG | $ | 234 | $ | 237 | $ | (3 | ) | (1 | )% | $ | 163 | $ | 173 | $ | (10 | ) | (6 | )% | 70 | % | 73 | % | (3 | ) | ||||||||||||||
| NRT | 1,331 | 1,408 | (77 | ) | (5 | ) | 47 | 61 | (14 | ) | (23 | ) | 4 | 4 | — | |||||||||||||||||||||||
| Cartus | 97 | 105 | (8 | ) | (8 | ) | 27 | 34 | (7 | ) | (21) | 28 | 32 | (4 | ) | |||||||||||||||||||||||
| TRG | 160 | 162 | (2 | ) | (1 | ) | 32 | 31 | 1 | 3 | 20 | 19 | 1 | |||||||||||||||||||||||||
| Corporate and Other | (87 | ) | (92 | ) | 5 | * | (24 | ) | (23 | ) | (1 | ) | * | |||||||||||||||||||||||||
| Total Company | $ | 1,735 | $ | 1,820 | $ | (85 | ) | (5 | )% | $ | 245 | $ | 276 | $ | (31 | ) | (11 | %) | 14 | % | 15 | % | (1 | ) | ||||||||||||||
| Less: Depreciation and amortization | 50 | 49 | ||||||||||||||||||||||||||||||||||||
| Interest expense, net | 81 | 46 | ||||||||||||||||||||||||||||||||||||
| Income tax expense | 34 | 52 | ||||||||||||||||||||||||||||||||||||
| Restructuring costs, net (b) | 9 | 6 | ||||||||||||||||||||||||||||||||||||
| Impairment | 2 | — | ||||||||||||||||||||||||||||||||||||
| Net income attributable to Realogy Holdings and Realogy Group | $ | 69 | $ | 123 | ||||||||||||||||||||||||||||||||||
| Revenues | $ Change | % Change | Operating EBITDA | $ Change | % Change | Operating EBITDA Margin | Change | |||||||||||||||||||||||||||||
| 2019 | 2018 | 2019 | 2018 | 2019 | 2018 | |||||||||||||||||||||||||||||||
| RFG (a) | $ | 147 | $ | 145 | 2 | 1 | % | $ | 76 | $ | 81 | (5 | ) | (6 | )% | 52 | % | 56 | % | (4 | ) | |||||||||||||||
| NRT (a) | 1,331 | 1,408 | (77 | ) | (5 | )% | 134 | 153 | (19 | ) | (12 | )% | 10 | % | 11 | % | (1 | ) | ||||||||||||||||||
| RFG and NRT Combined | $ | 1,478 | $ | 1,553 | (75 | ) | (5 | )% | $ | 210 | $ | 234 | (24 | ) | (10 | )% | 14 | % | 15 | % | (1 | ) | ||||||||||||||
| Six Months Ended June 30, | |||||||||||
| 2019 | 2018 | Change | |||||||||
| Net revenues | $ | 2,849 | $ | 3,049 | $ | (200 | ) | ||||
| Total expenses | 2,887 | 2,957 | (70 | ) | |||||||
| (Loss) income before income taxes, equity in earnings and noncontrolling interests | (38 | ) | 92 | (130 | ) | ||||||
| Income tax (benefit) expense | (1 | ) | 33 | (34 | ) | ||||||
| Equity in (earnings) losses of unconsolidated entities | (8 | ) | 2 | (10 | ) | ||||||
| Net (loss) income | (29 | ) | 57 | (86 | ) | ||||||
| Less: Net income attributable to noncontrolling interests | (1 | ) | (1 | ) | — | ||||||
| Net (loss) income attributable to Realogy Holdings and Realogy Group | $ | (30 | ) | $ | 56 | $ | (86 | ) | |||
The following table reflects the results of each of our reportable segments during the sixthree months ended June 30,March 31, 2020 and 2019:
| Revenues (a) | $ Change | % Change | Operating EBITDA | $ Change | % Change | Operating EBITDA Margin | Change | |||||||||||||||||||||||||||||||||||||||||||||||||||||||||||||||||||||||||||||||
| 2020 | 2019 | 2020 | 2019 | 2020 | 2019 | |||||||||||||||||||||||||||||||||||||||||||||||||||||||||||||||||||||||||||||||||
| Realogy Franchise Group | $ | 168 | $ | 179 | $ | (11) | (6) | % | $ | 101 | $ | 98 | $ | 3 | 3 | % | 60 | % | 55 | % | 5 | |||||||||||||||||||||||||||||||||||||||||||||||||||||||||||||||||
| Realogy Brokerage Group | 869 | 816 | 53 | 6 | (51) | (62) | 11 | 18 | (6) | (8) | 2 | |||||||||||||||||||||||||||||||||||||||||||||||||||||||||||||||||||||||||||
| Realogy Title Group | 137 | 114 | 23 | 20 | 12 | (9) | 21 | 233 | 9 | (8) | 17 | |||||||||||||||||||||||||||||||||||||||||||||||||||||||||||||||||||||||||||
| Corporate and Other | (58) | (55) | (3) | * | (25) | (25) | — | * | ||||||||||||||||||||||||||||||||||||||||||||||||||||||||||||||||||||||||||||||
| Total continuing operations | $ | 1,116 | $ | 1,054 | $ | 62 | 6 | % | $ | 37 | $ | 2 | $ | 35 | 1,750 | % | 3 | % | — | % | 3 | |||||||||||||||||||||||||||||||||||||||||||||||||||||||||||||||||
| Less: Depreciation and amortization | 45 | 41 | ||||||||||||||||||||||||||||||||||||||||||||||||||||||||||||||||||||||||||||||||||||
| Interest expense, net | 101 | 63 | ||||||||||||||||||||||||||||||||||||||||||||||||||||||||||||||||||||||||||||||||||||
| Income tax benefit | (132) | (32) | ||||||||||||||||||||||||||||||||||||||||||||||||||||||||||||||||||||||||||||||||||||
| Restructuring costs, net (b) | 11 | 9 | ||||||||||||||||||||||||||||||||||||||||||||||||||||||||||||||||||||||||||||||||||||
| Impairments (c) | 447 | 1 | ||||||||||||||||||||||||||||||||||||||||||||||||||||||||||||||||||||||||||||||||||||
| Loss on the early extinguishment of debt (d) | — | 5 | ||||||||||||||||||||||||||||||||||||||||||||||||||||||||||||||||||||||||||||||||||||
| Net loss from continuing operations | (435) | (85) | ||||||||||||||||||||||||||||||||||||||||||||||||||||||||||||||||||||||||||||||||||||
| Net loss from discontinued operations | (27) | (14) | ||||||||||||||||||||||||||||||||||||||||||||||||||||||||||||||||||||||||||||||||||||
| Net loss attributable to Realogy Holdings and Realogy Group | $ | (462) | $ | (99) | ||||||||||||||||||||||||||||||||||||||||||||||||||||||||||||||||||||||||||||||||||
_______________
* not meaningful
(a)Includes the elimination of transactions between segments, which consists of intercompany royalties and marketing fees paid by Realogy Brokerage Group of $58 million and $55 million during the three months ended March 31, 2020 and 2019, respectively.
(b)Restructuring charges incurred for the three months ended March 31, 2020 include $1 million at Realogy Franchise Group, $9 million at Realogy Brokerage Group and $1 million at Realogy Title Group. Restructuring charges incurred for the three months ended March 31, 2019 include $4 million at Realogy Brokerage Group, $1 million at Realogy Title Group and 2018:$4 million at Corporate and Other.
(c)Impairments for the three months ended March 31, 2020 include a goodwill impairment charge of $413 million which reduced the net carrying value of Realogy Brokerage Group by $314 million after accounting for the related income tax benefit of $99 million, an impairment charge of $30 million which reduced the carrying value of trademarks at Realogy Franchise Group and $4 million related to lease asset impairments. Impairments for the three months ended March 31, 2019 include $1 million of impairment charges related to lease asset impairments.
| Revenues (a) | $ Change | % Change | Operating EBITDA | $ Change | % Change | Operating EBITDA Margin | Change | |||||||||||||||||||||||||||||||
| 2019 | 2018 | 2019 | 2018 | 2019 | 2018 | |||||||||||||||||||||||||||||||||
| RFG | $ | 397 | $ | 413 | $ | (16 | ) | (4 | )% | $ | 253 | $ | 278 | $ | (25 | ) | (9 | )% | 64 | % | 67 | % | (3 | ) | ||||||||||||||
| NRT | 2,147 | 2,325 | (178 | ) | (8 | ) | (15 | ) | 16 | (31 | ) | (194 | ) | (1 | ) | 1 | (2 | ) | ||||||||||||||||||||
| Cartus | 173 | 184 | (11 | ) | (6 | ) | 29 | 33 | (4 | ) | (12) | 17 | 18 | (1 | ) | |||||||||||||||||||||||
| TRG | 274 | 282 | (8 | ) | (3 | ) | 23 | 25 | (2 | ) | (8) | 8 | 9 | (1 | ) | |||||||||||||||||||||||
| Corporate and Other | (142 | ) | (155 | ) | 13 | * | (49 | ) | (42 | ) | (7 | ) | * | |||||||||||||||||||||||||
| Total Company | $ | 2,849 | $ | 3,049 | $ | (200 | ) | (7 | )% | $ | 241 | $ | 310 | $ | (69 | ) | (22 | %) | 8 | % | 10 | % | (2 | ) | ||||||||||||||
| Less: Depreciation and amortization (b) | 99 | 99 | ||||||||||||||||||||||||||||||||||||
| Interest expense, net | 144 | 79 | ||||||||||||||||||||||||||||||||||||
| Income tax (benefit) expense | (1 | ) | 33 | |||||||||||||||||||||||||||||||||||
| Restructuring costs, net (c) | 21 | 36 | ||||||||||||||||||||||||||||||||||||
| Impairment | 3 | — | ||||||||||||||||||||||||||||||||||||
| Loss on the early extinguishment of debt (d) | 5 | 7 | ||||||||||||||||||||||||||||||||||||
| Net (loss) income attributable to Realogy Holdings and Realogy Group | $ | (30 | ) | $ | 56 | |||||||||||||||||||||||||||||||||
As described in the aforementioned table, Operating EBITDA margin for "Total Company"continuing operations" expressed as a percentage of revenues decreased 2increased 3 percentage points to 8%3% from 10%zero for the sixthree months ended June 30, 2019March 31, 2020 compared to the same period in 2018.2019. On a segment basis, RFG'sRealogy Franchise Group's margin decreased 3increased 5 percentage points to 64%60% from 67%55% primarily due to a decrease in royalty revenues. NRT's margin decreased 2 percentage points to negative 1% from 1% primarily due to lower transaction volume. Cartus' margin decreased 1 percentage point to 17% from 18% primarily due to a decrease in internationalemployee and referral revenues. TRG's margin decreased 1 percentage point to 8% from 9%other operating costs primarily as a result of cost savings initiatives. Realogy Brokerage Group's margin increased 2 percentage points from negative 8% to negative 6% primarily due to lower operating expenses primarily due to cost savings initiatives. Realogy Title Group's margin increased 17 percentage points to
46
9% from negative 8% primarily as a decrease in resale revenue, partially offset byresult of an increase in earnings from equity investments and a reduction in a reserve for contingent consideration.
The following table reflects RFGRealogy Franchise and NRTBrokerage Group's results before the intercompany royalties and marketing fees as well as on a combined basis to show the Operating EBITDA contribution of these business unitssegments to the overall Operating EBITDA of the Company. The Operating EBITDA margin for the combined segments decreasedincreased 1 percentage point from 11%4% to 10%5% primarily due to lowerhigher transaction volume during the first halfquarter of 20192020 compared to the first halfquarter of 2018:2019:
| Revenues | $ Change | % Change | Operating EBITDA | $ Change | % Change | Operating EBITDA Margin | Change | |||||||||||||||||||||||||||||
| 2019 | 2018 | 2019 | 2018 | 2019 | 2018 | |||||||||||||||||||||||||||||||
| RFG (a) | $ | 255 | $ | 258 | (3 | ) | (1 | )% | $ | 111 | $ | 123 | (12 | ) | (10 | )% | 44 | % | 48 | % | (4 | ) | ||||||||||||||
| NRT (a) | 2,147 | 2,325 | (178 | ) | (8 | )% | 127 | 171 | (44 | ) | (26 | )% | 6 | % | 7 | % | (1 | ) | ||||||||||||||||||
| RFG and NRT Combined | $ | 2,402 | $ | 2,583 | (181 | ) | (7 | )% | $ | 238 | $ | 294 | (56 | ) | (19 | )% | 10 | % | 11 | % | (1 | ) | ||||||||||||||
| Revenues | $ Change | % Change | Operating EBITDA | $ Change | % Change | Operating EBITDA Margin | Change | ||||||||||||||||||||||||||||||||||||||||||||||||||||||||||||||||||||||||||||
| 2020 | 2019 | 2020 | 2019 | 2020 | 2019 | ||||||||||||||||||||||||||||||||||||||||||||||||||||||||||||||||||||||||||||||
| Realogy Franchise Group (a) | $ | 110 | $ | 124 | (14) | (11) | $ | 43 | $ | 43 | — | — | 39 | % | 35 | % | 4 | ||||||||||||||||||||||||||||||||||||||||||||||||||||||||||||||||||
| Realogy Brokerage Group (a) | 869 | 816 | 53 | 6 | 7 | (7) | 14 | 200 | 1 | (1) | 2 | ||||||||||||||||||||||||||||||||||||||||||||||||||||||||||||||||||||||||
| Realogy Franchise and Brokerage Groups Combined | $ | 979 | $ | 940 | 39 | 4 | $ | 50 | $ | 36 | 14 | 39 | 5 | % | 4 | % | 1 | ||||||||||||||||||||||||||||||||||||||||||||||||||||||||||||||||||
_______________
(a)The segment numbers noted above do not reflect the impact of intercompany royalties and marketing fees paid by Realogy Brokerage Group to Realogy Franchise Group of $58 million and $55 million during the three months ended March 31, 2020 and 2019, respectively.
Realogy Franchise Services (RFG)Group
Revenues decreased $16$11 million to $397$168 million and Operating EBITDA decreased $25increased $3 million to $253$101 million for the sixthree months ended June 30, 2019March 31, 2020 compared with the same period in 2018.2019.
Revenues decreased $16$11 million primarily as a result of a $12the $11 million decrease in third-party domestic franchisee royaltyregistration revenue primarilyand brand marketing fund revenue, which has a $1 million net positive impact on Operating EBITDA due to the related expense decrease of $12 million, due to the level and timing of meetings and conferences held during the first quarter of 2020 compared to the first quarter of 2019 as a 4% decreaseresult of the RGX event held in transaction volume at RFG,2019 and lower advertising costs due to the COVID-19 pandemic.
In addition, there was a $12$3 million decrease in intercompany royalties received from NRTleads referral revenues driven by lower volume and a $2 millionreferral transactions primarily driven by the discontinuation of the USAA affinity program which ceased new enrollments in the third quarter of 2019. The revenue decrease in international royalties, partiallywas offset by a $3 million increase in international area development fee revenue as a result of contract terminations. Registration revenue and other brand marketing fund revenue increased $8 million and related expense increased $9 million, primarily due to the level and timing of advertising spending and conferences including the RGX event during the first half of 2019 compared to the same period in 2018.intercompany royalties received from Realogy Brokerage Group.
The $25$3 million decreaseincrease in Operating EBITDA was primarily due to a $5 million decrease in employee and other operating costs principally due to cost savings initiatives and the $26discontinuation of the USAA affinity program, partially offset by $2 million decrease in royalty revenues discussed above.of higher expense for bad debt and notes reserves.
Revenues decreased $178increased $53 million to $2,147$869 million and Operating EBITDA decreased $31increased $11 million to negative $15$51 million for the sixthree months ended June 30, 2019March 31, 2020 compared with the same period in 2018.2019.
47
Operating EBITDA decreased $31increased $11 million primarily due to:
•a $53 million increase in revenues discussed above;
•a $12 million decrease in employee-related, occupancy costs and other operating costs due to the $178cost savings initiatives; and
•a $4 million decrease in revenues discussed abovemarketing expense due to lower advertising costs due to the COVID-19 pandemic.
These increases were partially offset by:
•a $124$55 million decreaseincrease in commission expenses paid to independent sales agents from $1,654$575 million in the first halfquarter of 20182019 to $1,530$630 million in the same periodfirst quarter of 2019.2020. Commission expense decreasedincreased primarily as a result of the impact of lowerhigher homesale transaction volume as discussed above;above and a shift in mix to more productive agents; and
•a $12$3 million decreaseincrease in royalties paid to RFGRealogy Franchise Group from $149$53 million in the first halfquarter of 20182019 to $137$56 million in the same periodfirst quarter of 2019; and2020.
Revenues decreased $11increased $23 million to $173$137 million and Operating EBITDA decreased $4increased $21 million to $29$12 million for the sixthree months ended June 30, 2019March 31, 2020 compared with the same period in 2018.
Revenues decreased $11increased $23 million primarily as a result of a $10 million increase in underwriter revenue with unaffiliated agents, which has a $2 million net positive impact on Operating EBITDA due to the related expense increase of $8 million. In addition, there was a $6 million decreaseincrease in internationalresale revenue due to lower volumeincreases in purchase transactions and a $5 million decreaseincrease in referralrefinance revenue due to lower volume largely driven byan increase in activity in the absence of a large group move which occurred in 2018.refinance market.
Operating EBITDA decreased $4increased $21 million primarily as a result of the $11 million decreaseincrease in resale and refinance revenues discussed above, partially offset by lower operating expenses drivenan $8 million increase in equity in earnings primarily by a $5 million decrease in net employee-relatedrelated to Guaranteed Rate Affinity and other costs primarily due to cost savings initiatives and athe $2 million net positive impact from foreign currency exchange rates on expenses.of underwriter transactions with unaffiliated agents noted above.
Revenues for Cartus Relocation Services decreased $8 million to $274$52 million from $60 million and Operating EBITDA decreased $2improved $1 million to $23negative $5 million from negative $6 million for the sixthree months ended June 30, 2019March 31, 2020 compared with the same period in 2018.2019.
Revenues decreased $8 million primarily as a result of a $13$5 million decrease in resaleinternational revenue due to lost business and a $3 million decrease in other revenue primarily driven by lower volume. Beginning in the second half of March 2020, Cartus experienced a decline in units, partially offset by a $5 million increasenew initiations believed to be attributable to the COVID-19 pandemic and expects this trend to continue in underwriter revenue due to an increasethe second quarter of underwriter premiums as a result of a shift in mix to unaffiliated agents.2020 and potentially beyond.
Operating EBITDA decreased $2improved $1 million primarily asdue to a result of the $8 million decrease in revenues discussed aboveemployee and an increase of $4 million inother operating costs primarily due to an increase in underwriter revenue with unaffiliated agents wherecost savings initiatives, mostly offset by the revenue and expense is recorded on a gross basis. The decreases were partially offset by an $8 million increase in earnings from equity investments primarily related to Guaranteed Rate Affinity during the first halfdecrease discussed above.
48
FINANCIAL CONDITION, LIQUIDITY AND CAPITAL RESOURCES
Financial Condition
| March 31, 2020 | December 31, 2019 | Change | |||||||||||||||
| Total assets | $ | 7,461 | $ | 7,543 | $ | (82) | |||||||||||
| Total liabilities | 5,827 | 5,447 | 380 | ||||||||||||||
| Total equity | 1,634 | 2,096 | (462) | ||||||||||||||
| June 30, 2019 | December 31, 2018 | Change | |||||||||
| Total assets | $ | 7,954 | $ | 7,290 | $ | 664 | |||||
| Total liabilities | 5,701 | 4,975 | 726 | ||||||||
| Total equity | 2,253 | 2,315 | (62 | ) | |||||||
For the sixthree months ended June 30, 2019,March 31, 2020, total assets increased $664decreased $82 million primarily due to the addition of $536:
•a $413 million of operating lease assets to the balance sheetdecrease in goodwill as a result of the adoptionimpairment at Realogy Brokerage Group during the first quarter of 2020;
•a $67 million decrease in assets held for sale;
•a $30 million decrease in trademarks as a result of the new leasing standard, a $98 million increase in trade and relocation receivables due to seasonal increases in volume, a $45 million increase in cash and cash equivalents and a $27 million increase in other non-current assets primarily related to strategic investments and prepaid assets. Total asset increases were partially offset by a $49impairment of trademarks at Realogy Franchise Group during the first quarter of 2020;
•an $18 million net decrease in franchise agreements and other amortizable intangible assets primarily due to amortization.amortization; and
•a $14 million net decrease of operating lease assets,
partially offset by:
•a $393 million increase in cash and cash equivalents due to additional borrowings under the Revolving Credit Facility;
•a $48 million increase in other current and non-current assets primarily related to strategic investments and prepaid incentives; and
•a $23 million increase in trade receivables primarily due to timing and seasonal volume.
Total liabilities increased $726$380 million primarily due to the addition of $596 million of operating lease liabilities to the balance sheet as to:
•a result of the adoption of the new leasing standard, a $141$558 million increase in corporate debt primarily due to the issuance of $550$565 million of 9.375% Senior Notes and additionalincrease in borrowings under the Revolving Credit Facility, partially offset by the redemption of all of the Company's outstanding $450Facility; and
•a $44 million 4.50% Senior Notes, and a $51 million increase in accounts payable due to seasonal increases. Total liability increases were partially offset by a $27 million decrease in securitization obligations, an $18 million decrease in accrued expenses and other current liabilities and a $13 million decrease in other non-current liabilities primarily due to the reclassification of deferred rent liabilities which were credited against operating lease assets as a result of the adoption of the new leasing standard, partially offset by increased mark-to-market liabilities foradjustments on the Company's interest rate swaps.swaps,
partially offset by:
•a $137 million decrease in deferred tax liabilities primarily due to the recognition of an income tax benefit of $99 million related to the goodwill impairment charge;
•a $61 million decrease in liabilities held for sale;
•a $14 million decrease in accounts payable; and
•a $13 million decrease in operating lease liabilities.
Total equity decreased $62$462 million primarily due to a net loss of $30$462 million for the sixthree months ended June 30, 2019 and a $32March 31, 2020. The loss was primarily due to impairments of $447 million decrease in additional paid in capital, related to the Company's repurchase of $20 million of common stock during the first quarter of 2019 and $21 million of dividend payments during the first half of 2019 partially offset by stock-based compensation activity of $9 million for the six months ended June 30, 2019.2020.
Liquidity and Capital Resources
We have historically satisfied our liquidity needs with cash flows from operations and funds available under our Revolving Credit Facility and securitization facilities. Our primary liquidity needs have been to service our debt and finance our working capital and capital expenditures and, since August 2016, pay dividends. While we previously also acquired
We are significantly encumbered by our debt obligations. As of March 31, 2020, our total debt, excluding our securitization obligations, was $4,003 million. Our liquidity position continueshas been and is expected to continue to be negatively impacted by ourthe interest expense and wouldon our debt obligations, which could be adversely impactedintensified by worsening of the residential real estate market or a significant increase in LIBOR (or any replacement rate) or ABR.
49
Our Senior Secured Credit Facility and Term Loan A Facility require us to maintain a senior secured leverage ratio, which may not exceed 4.75 to 1.00. For the trailing four quarters ended March 31, 2020, we were in compliance with the senior secured leverage ratio covenant with a ratio of 3.06 to 1.0 with total senior secured debt (net of unrestricted cash and cash equivalents) of $2,031 million and trailing four quarters EBITDA calculated on a Pro Forma Basis (as those terms are defined in the credit agreement governing the Senior Secured Credit Facility) of $663 million.
In order to comply with the senior secured leverage ratio for the four-quarter periods ending June 30, September 30 and December 31, 2020 and March 2019,31, 2021 (or to avoid an event of default thereof), we will need to achieve a certain amount of trailing four quarters EBITDA calculated on a Pro Forma Basis and/or reduced levels of total senior secured first lien net debt. The factors that will impact the Company issued $550 millionforegoing include: (a) slowing decreases, stabilization or increases in sales volume and/or the price of 9.375% Senior Notes due in April 2027. We used $540 millionexisting homesales, (b) continuing to effect cost savings and business optimization initiatives, (c) increasing new franchise sales, independent sales agent recruitment and retention, or (d) a combination thereof. These factors may be insufficient to overcome macroeconomic conditions affecting us and the duration and severity of the net proceedsCOVID-19 crisis is expected to repaydirectly impact all of these factors. In addition, if we deem it advisable, we could seek to obtain additional junior lien or unsecured debt or equity financing from third party sources.
We believe that we will continue to be in compliance with, or be able to avoid an event of default under, the senior secured leverage ratio and meet our cash flow needs during the next twelve months based upon our current financial modeling, which incorporates factors (a) through (d) above and takes into account the level of open homesale contracts and closed homesale transaction activity we have observed since mid-March, our assumptions regarding the impact of the COVID-19 crisis and related economic downturn (which are subject to significant ongoing uncertainties), industry homesale transaction volume forecasts from multiple sources, and certain cost-savings actions, including those taken to date.
We have the right to avoid an event of default of the senior secured leverage ratio in three of any of the four consecutive quarters through the issuance of additional Realogy Holdings equity for cash, which would be infused as capital into the Company. The effect of such infusion would be to increase EBITDA calculated on a portionPro Forma Basis for purposes of outstanding borrowingscalculating the senior secured leverage ratio for the applicable four-quarter period.
If we are unable to maintain compliance with the senior secured leverage ratio and we fail to remedy a default through an equity cure permitted thereunder, there would be an “event of default” under our Revolving Credit Facility. In February 2019, the Company had used borrowings under its Revolving Credit Facility and cashTerm Loan A Facility, which may be waived by the lenders holding the majority of commitments under the Revolving Credit Facility or the lenders holding the majority of loans under the Term Loan A Facility, as applicable. Other events of default under the Revolving Credit Facility and Term Loan A Facility include, without limitation, nonpayment, material misrepresentations, insolvency, bankruptcy, certain judgments, change of control and cross-events of default on handmaterial indebtedness.
If an event of default occurs under the Revolving Credit Facility and Term Loan A Facility and we fail to fundobtain a waiver from the redemptionapplicable lenders, our financial condition, results of operations and business would be materially adversely affected. Upon the occurrence of an event of default under the Revolving Credit Facility and Term Loan A Facility, the lenders:
•would not be required to lend any additional amounts to us;
•could elect to declare all borrowings outstanding, together with accrued and unpaid interest and fees, to be due and payable; or
•could prevent us from making certain payments on the Unsecured Notes (other than payments of its outstanding $450 million 4.50%regularly scheduled interest or principal at maturity).
If we were unable to repay those amounts, the lenders under the Senior Notes. The covenants inSecured Credit Facility and Term Loan A Facility could proceed against the indenturecollateral granted to them to secure that indebtedness. We have pledged a significant portion of our assets as collateral to secure such indebtedness. If the lenders under our Senior Secured Credit Facility or Term Loan A Facility accelerate the repayment of borrowings, we may not have sufficient assets to repay the Senior Secured Credit Facility and Term Loan A Facility and our other indebtedness or be able to borrow sufficient funds to refinance such indebtedness. Upon the occurrence of an event of default under the indentures governing the 9.375%our Senior Notes, are substantially similarthe trustee or holders of 25% of the outstanding applicable notes could elect to declare the covenants inprincipal of, premium, if any, and accrued but unpaid interest on such notes to be due and payable. In addition, if an event of default is continuing under our Senior Secured Credit Facility, Term Loan A Facility, the indentures governing the 5.250% SeniorUnsecured Notes and the 4.785% Senior Notes, with certain exceptions, including changes relating to the Company’sor our other material indebtedness, such event could cause a termination of our ability to make restricted payments, including its ability to repurchase sharesobtain future advances under, and make dividend payments in excessamortization of, $45 million per calendar year until the Company's consolidated leverage ratio is below 4.00 to 1.00.our
In addition, prior to making new borrowings under the Revolving Credit Facility, we are required to certify that the representations and warranties in the Senior Secured Credit Agreement remain true and correct in all material respects as of the date of any borrowing (except to the extent such representations and warranties relate to an earlier date), including the absence of any material adverse effect on our business, property, operations or condition. If we were unable to certify to such representations and warranties as of the date of a proposed borrowing, we would not be able to incur the additional borrowing under our Revolving Credit Facility. An inability to access our Revolving Credit Facility for additional borrowings could have a material adverse effect on our liquidity and financial position.
For additional information, see below under the header "Financial Obligations—Covenants under the Senior Secured Credit Facility, Term Loan A Agreement,Facility and the indentures governing the Unsecured Notes, capital requirements, capital allocation strategy (including other potential uses of cash) and other factors that the Board of Directors deems relevant.Indentures".
We will continue to evaluate potential refinancing and financing transactions.transactions, including refinancing certain tranches of our indebtedness and extending maturities, among other potential alternatives, such public or private placements of our common stock or preferred stock (either of which could, among other things, dilute our current stockholders and materially and adversely affect the market price of our common stock). There can be no assurance as to which, if any, of these alternatives we may pursue as the choice of any alternative will depend upon numerous factors such as market conditions, our financial performance and the limitations applicable to such transactions under our existing financing agreements and the consents we may need to obtain under the relevant documents. There can be no assurance that financing willFinancing may not be available to us on commercially reasonable terms, on terms that are acceptable termsto us, or at all. Any future indebtedness may impose various additional restrictions and covenants on us which could limit our ability to respond to market conditions, to make capital investments or to take advantage of business opportunities.
We may from time to time seek to repurchase our outstanding Unsecured Notes through tender offers, open market purchases, privately negotiated transactions or otherwise. Such repurchases, if any, will depend on prevailing market conditions, our liquidity requirements, contractual restrictions and other factors.
The covenants in the indenture governing the 9.375% Senior Notes restrict our ability to make dividend payments or repurchase shares in any amount until the Company's consolidated leverage ratio is below 4.00 to 1.00. See Note 5, "Short and Long-Term Debt", to the Condensed Consolidated Financial Statements for additional information.
In addition, we are required to pay quarterly amortization payments for the Term Loan B and Term Loan A facilities. Remaining payments for 2020 total $28 million and $8 million for the Term Loan A and Term Loan B facilities, respectively and we expect payments for 2021 to total $51 million and $11 million for the Term Loan A and Term Loan B facilities, respectively.
If the residential real estate market or the economy as a whole does not improve or continues to weaken, our business, financial condition and liquidity may be materially adversely affected, including our ability to access capital, grow our business and return capital to stockholders.
Cash Flows
At June 30, 2019,March 31, 2020, we had $278$628 million of cash, cash equivalents and restricted cash, an increase of $40$393 million compared to the balance of $238$235 million at December 31, 2018.2019. The following table summarizes our cash flows from continuing operations for the sixthree months ended June 30, 2019March 31, 2020 and 2018:2019:
| Three Months Ended March 31, | |||||||||||||||||||||||||||||
| 2020 | 2019 | Change | |||||||||||||||||||||||||||
| Cash provided by (used in) activities from continuing operations: | |||||||||||||||||||||||||||||
| Operating activities | $ | (87) | $ | (93) | $ | 6 | |||||||||||||||||||||||
| Investing activities | (34) | (21) | (13) | ||||||||||||||||||||||||||
| Financing activities | 546 | 177 | 369 | ||||||||||||||||||||||||||
| Six Months Ended June 30, | |||||||||||
| 2019 | 2018 | Change | |||||||||
| Cash provided by (used in): | |||||||||||
| Operating activities | $ | 56 | $ | 9 | $ | 47 | |||||
| Investing activities | (62 | ) | (45 | ) | (17 | ) | |||||
| Financing activities | 46 | 42 | 4 | ||||||||
| Effects of change in exchange rates on cash, cash equivalents and restricted cash | — | (1 | ) | 1 | |||||||
| Net change in cash, cash equivalents and restricted cash | $ | 40 | $ | 5 | $ | 35 | |||||
For the sixthree months ended June 30, 2019, $47March 31, 2020, $6 million moreless cash was provided byused in operating activities from continuing operations compared to the same period in 2018.2019. The change was principally due to $61$28 million more cash provided by operating results offset by:
•$8 million less cash provided by the net change in relocation and trade receivables, $54receivables;
51
•$8 million lessmore cash used for other assets;
•$3 million more cash used for accounts payable, accrued expenses and other liabilitiesliabilities; and $9
•$3 million lessmore cash used for other assets, partially offset by $82 million less cash provided by operating results.activities.
For the sixthree months ended June 30, 2019,March 31, 2020, we used $17$13 million more cash for investing activities from continuing operations compared to the same period in 20182019 primarily due to the absence in 2019 of $19to:
•$11 million of netmore cash proceeds received from the dissolution of our interest in PHH Home Loans which occurred in 2018.used for other investing activities; and
•$2 million more cash used for property and equipment additions.
For the sixthree months ended June 30, 2019, $46March 31, 2020, $546 million of cash was provided by financing activities from continuing operations compared to $42$177 million of cash provided during the same period in 2018. 2019. For the sixthree months ended June 30, 2019, $46March 31, 2020, $546 million of cash was provided by financing activities from continuing operations related to $565 million of additional borrowings under the following:Revolving Credit Facility partially offset by:
•$918 million of other financing payments primarily related to finance leases;
•$7 million of quarterly amortization payments on the term loan facilities; and
•$4 million of tax payments related to net share settlement for stock-based compensation.
For the three months ended March 31, 2019, $177 million of cash provided by financing activities from continuing operations related to:
•$140 million of additional borrowings under the Revolving Credit Facility; and
•$89 million of cash received as a result of the refinancing transactions in the first quarter of 2019, related to $550 million of proceeds received from issuance of 9.375% Senior Notes, partially offset by $450 million cash used for the redemption of 4.50% Senior Notes and $9 million of debt issuance costs; and
partially offset by,
•$20 million for the repurchase of our common stock;
•$1510 million of dividend payments;
•$7 million of quarterly amortization payments on the term loan facilities;
•$107 million of other financing payments primarily related to finance leases; and
•$6 million of tax payments related to net share settlement for stock-based compensation.
Financial Obligations
See Note 5, "Short and Long-Term Debt", to the Condensed Consolidated Financial Statements, for information on the Company's indebtedness as of June 30, 2019.March 31, 2020.
LIBOR Transition
In July 2017, the Financial Conduct Authority, the UK regulator responsible for the oversight of LIBOR,the London Interbank Offering Rate ("LIBOR"), announced that it would no longer require banks to participate in the LIBOR submission process and would cease oversight over the rate after the end of 2021. Various industry groups continue to discuss replacement benchmark rates, the process for amending existing LIBOR-based contracts, and the potential economic impacts of different alternatives. For example, in the U.S., a proposed replacement benchmark rate is the Secured Overnight Funding Rate (SOFR), which is an overnight rate based on secured financing.financing, although uncertainty exists as to the transition process and broad acceptance of SOFR as the primary alternative to LIBOR.
Our primary interest rate exposure is interest rate fluctuations, specifically with respect to LIBOR, due to its impact on our variable rate borrowings under the Senior Secured Credit Facility (for our Revolving Credit Facility and Term Loan B) and the Term Loan A Facility (for our Term Loan A). As of March 31, 2020, we had interest rate swaps based on LIBOR with a notional value of $1,600 million to manage a portion of our exposure to changes in interest rates associated with our variable rate borrowings.
At this time, it is not possible to predict the effect of any changes to LIBOR, any phase out of LIBOR or any establishment of alternative benchmark rates. LIBOR may disappear entirely or perform differently than in the past. Any new benchmark rate will likely not replicate LIBOR exactly and if future rates based upon a successor rate (or a new method of calculating LIBOR) are higher than LIBOR rates as currently determined, it could result in an increase in the cost of our variable rate indebtedness and may have a material adverse effect on our financial condition and results of operations.
52
Covenants under the Senior Secured Credit Facility, Term Loan A Facility and Indentures
The Senior Secured Credit Agreement, Term Loan A Agreement, the Unsecured Letter of Credit Facility and the indentures governing the Unsecured Notes contain various covenants that limit (subject to certain exceptions) Realogy Group’s ability to, among other things:
•incur or guarantee additional debt or issue disqualified stock or preferred stock;
•pay dividends or make distributions to Realogy Group’s stockholders, including Realogy Holdings;
•repurchase or redeem capital stock;
•make loans, investments or acquisitions;
•incur restrictions on the ability of certain of Realogy Group's subsidiaries to pay dividends or to make other payments to Realogy Group;
•enter into transactions with affiliates;
•create liens;
•merge or consolidate with other companies or transfer all or substantially all of Realogy Group's and its material subsidiaries' assets;
•transfer or sell assets, including capital stock of subsidiaries; and
•prepay, redeem or repurchase subordinated indebtedness.
As a result of the covenants to which we remain subject, we are limited in the manner in which we conduct our business and we may be unable to engage in favorable business activities or finance future operations or capital needs. In addition, the Senior Secured Credit Agreement and Term Loan A Agreement require us to maintain a senior secured leverage ratio. We are further restricted under the indenture governing the 9.375% Senior Notes from making restricted payments, including repurchasing shares of our common stock or issuingability to issue dividends in excess of $45 million per calendar year or our ability to repurchase shares in any amount for so long as our consolidated leverage ratio is equal to or greater than 4.0 to 1.0 and then (unless that ratio falls below 3:00 to 1:00) only to the extent of available cumulative credit, as defined under the indenture governing the 9.375% Senior Notes.
Senior Secured Leverage Ratio applicable to our Senior Secured Credit Facility and Term Loan A Facility
The senior secured leverage ratio is tested quarterly and may not exceed 4.75 to 1.00. The senior secured leverage ratio is measured by dividing Realogy Group's total senior secured net debt by the trailing four quarters EBITDA calculated on a Pro Forma Basis, as those terms are defined in the Senior Secured Credit Agreement. Total senior secured net debt does not include unsecured indebtedness, including the Unsecured Notes, or the securitization obligations. EBITDA calculated on a Pro Forma Basis, as defined in the Senior Secured Credit Agreement, includes adjustments to EBITDA for restructuring costs, former parent legacy cost (benefit) items, net, loss (gain) on the early extinguishment of debt, non-cash charges and incremental securitization interest costs, as well as pro forma cost savings for restructuring initiatives, the pro forma effect of business optimization initiatives and the pro forma effect of acquisitions and new franchisees, in each case calculated as of the beginning of the trailing four-quarter period. The Company was in compliance with the senior secured leverage ratio covenant at June 30, 2019.
A reconciliation of net income (loss)loss attributable to Realogy Group to Operating EBITDA including discontinued operations and EBITDA calculated on a Pro Forma Basis, as those terms are defined in the Senior Secured Credit Agreement, for the four-quarter period ended June 30, 2019March 31, 2020 is set forth in the following table:
| Less | Equals | Plus | Equals | ||||||||||||||||||||||||||||||||||||||||||||||||||||||||||||||||||
| Less | Equals | Plus | Equals | Year Ended | Three Months Ended | Nine Months Ended | Three Months Ended | Twelve Months Ended | |||||||||||||||||||||||||||||||||||||||||||||||||||||||||||||
| Year Ended | Six Months Ended | Six Months Ended | Six Months Ended | Twelve Months Ended | December 31, 2019 | March 31, 2019 | December 31, 2019 | March 31, 2020 | March 31, 2020 | ||||||||||||||||||||||||||||||||||||||||||||||||||||||||||||
| December 31, 2018 | June 30, 2018 | December 31, 2018 | June 30, 2019 | June 30, 2019 | |||||||||||||||||||||||||||||||||||||||||||||||||||||||||||||||||
| Net income (loss) attributable to Realogy Group (a) | $ | 137 | $ | 56 | $ | 81 | $ | (30 | ) | $ | 51 | ||||||||||||||||||||||||||||||||||||||||||||||||||||||||||
| Income tax expense (benefit) | 65 | 33 | 32 | (1 | ) | 31 | |||||||||||||||||||||||||||||||||||||||||||||||||||||||||||||||
| Income (loss) before income taxes | 202 | 89 | 113 | (31 | ) | 82 | |||||||||||||||||||||||||||||||||||||||||||||||||||||||||||||||
| Depreciation and amortization (b) | 197 | 99 | 98 | 99 | 197 | ||||||||||||||||||||||||||||||||||||||||||||||||||||||||||||||||
| Net loss attributable to Realogy Group (a) | Net loss attributable to Realogy Group (a) | $ | (188) | $ | (99) | $ | (89) | $ | (462) | $ | (551) | ||||||||||||||||||||||||||||||||||||||||||||||||||||||||||
| Income tax (benefit) expense | Income tax (benefit) expense | (22) | (32) | 10 | (132) | (122) | |||||||||||||||||||||||||||||||||||||||||||||||||||||||||||||||
| Loss before income taxes | Loss before income taxes | (210) | (131) | (79) | (594) | (673) | |||||||||||||||||||||||||||||||||||||||||||||||||||||||||||||||
| Depreciation and amortization | Depreciation and amortization | 169 | 41 | 128 | 45 | 173 | |||||||||||||||||||||||||||||||||||||||||||||||||||||||||||||||
| Interest expense, net | 190 | 79 | 111 | 144 | 255 | Interest expense, net | 249 | 63 | 186 | 101 | 287 | ||||||||||||||||||||||||||||||||||||||||||||||||||||||||||
| Restructuring costs, net | 58 | 36 | 22 | 21 | 43 | Restructuring costs, net | 42 | 9 | 33 | 11 | 44 | ||||||||||||||||||||||||||||||||||||||||||||||||||||||||||
| Impairment | — | — | — | 3 | 3 | ||||||||||||||||||||||||||||||||||||||||||||||||||||||||||||||||
| Impairments | Impairments | 249 | 1 | 248 | 447 | 695 | |||||||||||||||||||||||||||||||||||||||||||||||||||||||||||||||
| Former parent legacy cost, net | 4 | — | 4 | — | 4 | Former parent legacy cost, net | 1 | — | 1 | — | 1 | ||||||||||||||||||||||||||||||||||||||||||||||||||||||||||
| Loss on the early extinguishment of debt | 7 | 7 | — | 5 | 5 | ||||||||||||||||||||||||||||||||||||||||||||||||||||||||||||||||
| Operating EBITDA (c) | 658 | 310 | 348 | 241 | 589 | ||||||||||||||||||||||||||||||||||||||||||||||||||||||||||||||||
| (Gain) loss on the early extinguishment of debt | (Gain) loss on the early extinguishment of debt | (5) | 5 | (10) | — | (10) | |||||||||||||||||||||||||||||||||||||||||||||||||||||||||||||||
| Income statement impact of discontinued operations | Income statement impact of discontinued operations | 95 | 8 | 87 | 22 | 109 | |||||||||||||||||||||||||||||||||||||||||||||||||||||||||||||||
| Operating EBITDA including discontinued operations (b) | Operating EBITDA including discontinued operations (b) | 590 | (4) | 594 | 32 | 626 | |||||||||||||||||||||||||||||||||||||||||||||||||||||||||||||||
| Bank covenant adjustments: | Bank covenant adjustments: | Bank covenant adjustments: | |||||||||||||||||||||||||||||||||||||||||||||||||||||||||||||||||||
| Operating EBITDA for discontinued operations (c) | Operating EBITDA for discontinued operations (c) | (29) | |||||||||||||||||||||||||||||||||||||||||||||||||||||||||||||||||||
| Pro forma effect of business optimization initiatives (d) | Pro forma effect of business optimization initiatives (d) | 28 | Pro forma effect of business optimization initiatives (d) | 30 | |||||||||||||||||||||||||||||||||||||||||||||||||||||||||||||||||
| Non-cash charges (e) | Non-cash charges (e) | 33 | Non-cash charges (e) | 32 | |||||||||||||||||||||||||||||||||||||||||||||||||||||||||||||||||
| Pro forma effect of acquisitions and new franchisees (f) | Pro forma effect of acquisitions and new franchisees (f) | 3 | Pro forma effect of acquisitions and new franchisees (f) | 4 | |||||||||||||||||||||||||||||||||||||||||||||||||||||||||||||||||
| Incremental securitization interest costs (g) | 3 | ||||||||||||||||||||||||||||||||||||||||||||||||||||||||||||||||||||
| EBITDA as defined by the Senior Secured Credit Agreement | EBITDA as defined by the Senior Secured Credit Agreement | $ | 656 | EBITDA as defined by the Senior Secured Credit Agreement | $ | 663 | |||||||||||||||||||||||||||||||||||||||||||||||||||||||||||||||
| Total senior secured net debt | Total senior secured net debt | $ | 1,991 | Total senior secured net debt | $ | 2,031 | |||||||||||||||||||||||||||||||||||||||||||||||||||||||||||||||
| Senior secured leverage ratio | Senior secured leverage ratio | 3.04 | x | Senior secured leverage ratio | 3.06 | x | |||||||||||||||||||||||||||||||||||||||||||||||||||||||||||||||
_______________
(a)Net loss attributable to Realogy consists of: (i) income of $69 million for the second quarter of 2019, (ii) loss of $113 million for the third quarter of 2019, (iii) loss of $45 million for the fourth quarter of 2019 and (iv) loss of $462 million for the first quarter of 2020.
(b)Consists of Operating EBITDA including discontinued operations of: (i) $245 million for the second quarter of 2019, (ii) $223 million for the third quarter of 2019, (iii) $126 million for the fourth quarter of 2019 and (iv) $32 million for the first quarter of 2020.
(c)Represents the Operating EBITDA for Cartus Relocation. If the Operating EBITDA of Cartus Relocation were to be included in EBITDA as defined by the Senior Secured Credit Agreement, the Senior Secured Leverage Ratio would improve to 2.93x from 3.06x.
(d)Represents the four-quarter pro forma effect of business optimization initiatives.
(e)Represents the elimination of non-cash expenses including $27 million of stock-based compensation expense and$5 million for the change in the allowance for doubtful accounts and notes reserves for the four-quarter period ended March 31, 2020.
(f)Represents the estimated impact of acquisitions and franchise sales activity, net of brokerages that exited our franchise system as if these changes had occurred on April 1, 2019. Franchisee sales activity is comprised of new franchise agreements as well as growth through acquisitions and independent sales agent recruitment by existing franchisees with our assistance. We have made a number of assumptions in calculating such estimates and there can be no assurance that we would have generated the projected levels of Operating EBITDA had we owned the acquired entities or entered into the franchise contracts as of April 1, 2019.
(g)Represents total borrowings under the senior secured credit facilities and borrowings secured by a first priority lien on our assets of $2,523 million plus $36 million of finance lease obligations less $528 million of readily available cash as of March 31, 2020. Pursuant to the terms of our senior secured credit facilities, total senior secured net debt does not include our securitization obligations or unsecured indebtedness, including the Unsecured Notes.
54
Consolidated Leverage Ratio applicable to our 9.375% Senior Notes
The consolidated leverage ratio is measured by dividing Realogy Group's total net debt by the trailing four quarter EBITDA. EBITDA, as defined in the indenture governing the 9.375% Senior Notes, is substantially similar to EBITDA calculated on a Pro Forma Basis, as those terms are defined in the Senior Secured Credit Agreement. Net debt under the indenture is Realogy Group's total indebtedness (excluding securitizations) less (i) its cash and cash equivalents in excess of
restricted cash and (ii) a $200 million seasonality adjustment permitted when measuring the ratio on a date during the period of March 1 to May 31.
The consolidated leverage ratio under the indenture governing the 9.375% Senior Notes for the four-quarter period ended June 30, 2019March 31, 2020 is set forth in the following table:
| As of June 30, 2019 | ||||
| Revolver | $ | 330 | ||
| Term Loan A | 727 | |||
| Term Loan B | 1,064 | |||
| 5.25% Senior Notes | 550 | |||
| 4.875% Senior Notes | 500 | |||
| 9.375% Senior Notes | 550 | |||
| Finance lease obligations | 33 | |||
| Corporate Debt (excluding securitizations) | 3,754 | |||
| Less: Cash and cash equivalents | 270 | |||
| Net debt under the indenture governing the 9.375% Senior Notes due 2027 | $ | 3,484 | ||
| EBITDA as defined under the indenture governing the 9.375% Senior Notes due 2027 (a) | $ | 656 | ||
| Consolidated leverage ratio under the indenture governing the 9.375% Senior Notes due 2027 | 5.3 | x | ||
| As | ||||||||
| Revolver | $ | 755 | ||||||
| Term Loan A | 712 | |||||||
| Term Loan B | 1,056 | |||||||
| 5.25% Senior Notes | 550 | |||||||
| 4.875% Senior Notes | 407 | |||||||
| 9.375% Senior Notes | 550 | |||||||
| Finance lease obligations | 36 | |||||||
| Corporate Debt (excluding securitizations) | 4,066 | |||||||
| Less: Cash and cash equivalents | 628 | |||||||
| Net Corporate Debt (excluding securitizations) | 3,438 | |||||||
| Less: Seasonality adjustment (a) | 200 | |||||||
| Net debt under the | $ | 3,238 | ||||||
| EBITDA as defined under the indenture governing the 9.375% Senior Notes | $ | 663 | ||||||
| Consolidated leverage ratio under the | 4.9 | x | ||||||
_______________
(a)The indenture governing the 9.375% Senior Notes provides for a $200 million seasonality adjustment permitted when measuring the ratio on a date during the period of March 1 to May 31. Without this seasonality adjustment, the ratio would have been 5.2x for the quarter ended March 31, 2020.
(b)As set forth in the immediately preceding table, for the four-quarter period ended March 31, 2020, EBITDA, as defined under the indenture governing the 9.375% Senior Notes, was the same as EBITDA calculated on a Pro Forma Basis, as those terms are defined in the Senior Secured Credit Agreement.
See Note 5, "Short and Long-Term Debt—Senior Secured Credit Facility", "—Term Loan A Facility" and "—Unsecured Notes", to the Condensed Consolidated Financial Statements for additional information.
At June 30, 2019,March 31, 2020 the amount of the Company's cumulative credit under the 9.375% Senior Notes was approximately $23 million. During the second quarter of 2019, the$79 million. The Company made approximately $11$21 million in dividend payments since issuance of the 9.375% Senior Notes, which applied against the cumulative credit basket under the indenture governing the 9.375% Senior Notes, would result in approximately $12$58 million remaining under that basket for restricted payments. This basket cannot be utilized until the Company's consolidated leverageleverage ratio is less than 4.0 to 1.0.
Non-GAAP Financial Measures
The SEC has adopted rules to regulate the use in filings with the SEC and in public disclosures of "non-GAAP financial measures," such as Operating EBITDA. These measures are derived on the basis of methodologies other than in accordance with GAAP.
Operating EBITDA is defined by us as net income (loss) before depreciation and amortization, interest expense, net, (other than relocation services interest for securitization assets and securitization obligations), income taxes, and other items that are not core to the operating activities of the Company such as restructuring charges, former parent legacy items, gains or losses on the early extinguishment of debt, asset impairments, gains or losses on discontinued operations and gains or losses on the sale of investments or other assets. Operating EBITDA is our primary non-GAAP measure.
55
We present Operating EBITDA because we believe it is useful as a supplemental measure in evaluating the performance of our operating businesses and provides greater transparency into our results of operations. Our management, including our chief operating decision maker, uses Operating EBITDA as a factor in evaluating the performance of our business. Operating EBITDA should not be considered in isolation or as a substitute for net income or other statement of operations data prepared in accordance with GAAP.
We believe Operating EBITDA facilitates company-to-company operating performance comparisons by backing out potential differences caused by variations in capital structures (affecting net interest expense), taxation, the age and book depreciation of facilities (affecting relative depreciation expense) and the amortization of intangibles, as well as other items that are not core to the operating activities of the Company such as restructuring charges, gains or losses on the early extinguishment of debt, former parent legacy items, asset impairments, gains or losses on discontinued operations and gains or losses on the sale of investments or other assets, which may vary for different companies for reasons unrelated to operating performance.
We further believe that Operating EBITDA is frequently used by securities analysts, investors and other interested parties in their evaluation of companies, many of which present an Operating EBITDA measure when reporting their results.
Operating EBITDA has limitations as an analytical tool, and you should not consider Operating EBITDA either in isolation or as a substitute for analyzing our results as reported under GAAP. Some of these limitations are:
•this measure does not reflect changes in, or cash required for, our working capital needs;
•this measure does not reflect our interest expense (except for interest related to our securitization obligations), or the cash requirements necessary to service interest or principal payments on our debt;
•this measure does not reflect our income tax expense or the cash requirements to pay our taxes;
•this measure does not reflect historical cash expenditures or future requirements for capital expenditures or contractual commitments;
•although depreciation and amortization are non-cash charges, the assets being depreciated and amortized will often require replacement in the future, and this measure does not reflect any cash requirements for such replacements; and
•other companies may calculate this measure differently so they may not be comparable.
Operating EBITDA including discontinued operations includes Operating EBITDA, as defined above plus the Operating EBITDA contribution from discontinued operations on the same basis.
Contractual Obligations
Critical Accounting Policies
In presenting our financial statements in conformity with generally accepted accounting principles, we are required to make estimates and assumptions that affect the amounts reported therein. Several of the estimates and assumptions we are required to make relate to matters that are inherently uncertain as they pertain to future events. However, events that are outside of our control cannot be predicted and, as such, they cannot be contemplated in evaluating such estimates and assumptions. If there is a significant unfavorable change to current conditions, it could result in a material adverse impact to our combined results of operations, financial position and liquidity. We believe that the estimates and assumptions we used when preparing our financial statements were the most appropriate at that time.
These Condensed Consolidated Financial Statements should be read in conjunction with the Consolidated Financial Statements included in the Annual Report on Form 10-K for the year ended December 31, 2018,2019, which includes a description of our critical accounting policies that involve subjective and complex judgments that could potentially affect reported results.
Impairment of goodwill and other indefinite-lived intangible assets
Recently Issued Accounting Pronouncements
See Note 1, "Basis of Presentation", to the Condensed Consolidated Financial Statements for a discussion of recently issued accounting pronouncements.
Item 3. Quantitative and Qualitative Disclosures about Market Risks.
We are exposed to market risk from changes in interest rates primarily through our senior secured debt. At June 30, 2019,March 31, 2020, our primary interest rate exposure was to interest rate fluctuations, specifically LIBOR, due to its impact on our variable rate borrowings of our Revolving Credit Facility and Term Loan B under the Senior Secured Credit Facility and the Term Loan A Facility. Given that our borrowings under the Senior Secured Credit Facility and Term Loan A Facility are generally based upon LIBOR, this rate (or any replacement rate) will be the Company's primary market risk exposure for the foreseeable future. We do not have significant exposure to foreign currency risk nor do we expect to have significant exposure to foreign currency risk in the foreseeable future.
We assess our market risk based on changes in interest rates utilizing a sensitivity analysis. The sensitivity analysis measures the potential impact on earnings, fair values and cash flows based on a hypothetical change (increase and decrease) in interest rates. We exclude the fair values of relocation receivables and advances and securitization borrowings from our sensitivity analysis because we believe the interest rate risk on these assets and liabilities is mitigated as the rate we earn on relocation receivables and advances and the rate we incur on our securitization borrowings are based on similar variable indices.
At June 30, 2019,March 31, 2020, we had variable interest rate long-term debt outstanding under our Senior Secured Credit Facility and Term Loan A Facility of $2,121 million, which excludes $204 million of securitization obligations.$2,523 million. The weighted average interest rate on the outstanding amounts under our Senior Secured Credit Facility and Term Loan A Facility at June 30, 2019March 31, 2020 was 4.65%3.24%. The interest rate with respect to the Term Loan B is based on adjusted LIBOR plus 2.25% (with a LIBOR floor of 0.75%). The interest rates with respect to the Revolving Credit Facility and term loans under the Term Loan A Facility are based on adjusted LIBOR plus an additional margin subject to adjustment based on the current senior secured leverage ratio. Based on the June 30, 2019March 31, 2020 senior secured leverage ratio, the LIBOR margin was 2.25%. At June 30, 2019,March 31, 2020, the one-month LIBOR rate was 2.40%0.99%; therefore, we have estimated that a 0.25% increase in LIBOR would have a $5$6 million impact on our annual interest expense.
As of June 30, 2019,March 31, 2020, we had interest rate swaps with a notional value of $1,600 million to manage a portion of our exposure to changes in interest rates associated with our $2,121$2,523 million of variable rate borrowings. Our interest rate swaps were as follows:
| Notional Value (in millions) | Commencement Date | Expiration Date | |||||||
| $600 | August 2015 | August 2020 | |||||||
| $450 | November 2017 | November 2022 | |||||||
| $400 | August 2020 | August 2025 | |||||||
| $150 | November 2022 | November 2027 | |||||||
The swaps help protect our outstanding variable rate borrowings from future interest rate volatility. The fixed interest rates on the swaps range from 2.07% to 3.11%. The Company had a liability of $48$96 million for the fair value of the interest
rate swaps at June 30, 2019.March 31, 2020. The fair value of these interest rate swaps is subject to movements in LIBOR and will fluctuate in future periods. We have estimated that a 0.25% increase in the LIBOR yield curve would increase the fair value of our interest rate swaps by $12$10 million and would decrease interest expense. While these results may be used as a benchmark, they should not be viewed as a forecast of future results.
Item 4. Controls and Procedures.
Controls and Procedures for Realogy Holdings Corp.
(a)Realogy Holdings Corp. ("Realogy Holdings") maintains disclosure controls and procedures that are designed to ensure that information required to be disclosed in its filings under the Securities Exchange Act of 1934, as amended (the "Exchange Act"), is recorded, processed, summarized and reported within the periods specified in the rules and forms of the Securities and Exchange Commission and that such information is accumulated and communicated to its management, including its Chief Executive Officer and Chief Financial Officer, as appropriate, to allow timely decisions regarding required disclosure. Realogy Holdings' management, including the Chief Executive Officer and the Chief Financial Officer, recognizes that any set of controls and procedures, no matter how well designed and operated, can provide only reasonable assurance of achieving the desired control objectives.
57
(b)As of the end of the period covered by this quarterly report on Form 10-Q, Realogy Holdings has carried out an evaluation, under the supervision and with the participation of its management, including its Chief Executive Officer and Chief Financial Officer, of the effectiveness of the design and operation of its disclosure controls and procedures. Based upon that evaluation, the Chief Executive Officer and Chief Financial Officer concluded that Realogy Holdings' disclosure controls and procedures are effective at the "reasonable assurance" level.
(c)There has not been any change in Realogy Holdings' internal control over financial reporting during the period covered by this quarterly report on Form 10-Q that has materially affected, or is reasonably likely to materially affect, its internal control over financial reporting.
Controls and Procedures for Realogy Group LLC
(a)Realogy Group LLC ("Realogy Group") maintains disclosure controls and procedures that are designed to ensure that information required to be disclosed in its filings under the Securities Exchange Act of 1934, as amended (the "Exchange Act"), is recorded, processed, summarized and reported within the periods specified in the rules and forms of the Securities and Exchange Commission and that such information is accumulated and communicated to its management, including its Chief Executive Officer and Chief Financial Officer, as appropriate, to allow timely decisions regarding required disclosure. Realogy Group's management, including the Chief Executive Officer and the Chief Financial Officer, recognizes that any set of controls and procedures, no matter how well designed and operated, can provide only reasonable assurance of achieving the desired control objectives.
(b)As of the end of the period covered by this quarterly report on Form 10-Q, Realogy Group has carried out an evaluation, under the supervision and with the participation of its management, including its Chief Executive Officer and Chief Financial Officer, of the effectiveness of the design and operation of its disclosure controls and procedures. Based upon that evaluation, the Chief Executive Officer and Chief Financial Officer concluded that Realogy Group's disclosure controls and procedures are effective at the "reasonable assurance" level.
(c)There has not been any change in Realogy Group's internal control over financial reporting during the period covered by this quarterly report on Form 10-Q that has materially affected, or is reasonably likely to materially affect, its internal control over financial reporting.
Other Financial Information
The Condensed Consolidated Financial Statements as of June 30, 2019March 31, 2020 and for the three-month periods ended June 30,March 31, 2020 and 2019 and 2018 have been reviewed by PricewaterhouseCoopers LLP, an independent registered public accounting firm. Their reports, dated August 8, 2019,May 7, 2020, are included on pages 34 and 4.5. The reports of PricewaterhouseCoopers LLP state that they did not audit and they do not express an opinion on that unaudited financial information. Accordingly, the degree of reliance on their report on such information should be restricted in light of the limited nature of the review procedures applied. PricewaterhouseCoopers LLP is not subject to the liability provisions of Section 11 of the Securities Act of 1933 (the "Act") for their report on the unaudited financial information because that report is not a "report" or a "part" of the registration statement prepared or certified by PricewaterhouseCoopers LLP within the meaning of Sections 7 and 11 of the Act.
PART II - OTHER INFORMATION
Item 1. Legal Proceedings.
See Note 9, "Commitments and Contingencies—Litigation", to the Condensed Consolidated Financial Statements included elsewhere in this quarterly report on Form 10-Q for additional information on the Company's legal proceedings.
The Company believes that it has adequately accrued for legal matters as appropriate. The Company records litigation accruals for legal matters which are both probable and estimable.
Litigation and other disputes are inherently unpredictable and subject to substantial uncertainties and unfavorable resolutions could occur and even cases brought by us can involve counterclaims asserted against us. In addition, litigation and other legal matters, including class action lawsuits orand regulatory proceedings challenging practices that have broad impact can be costly to defend and, depending on the class size and claims, could be costly to settle. As such, the Company could incur judgments or enter into settlements of claims with liability that are materially in excess of amounts accrued and these settlements could have a material adverse effect on the Company’s financial condition, results of operations or cash flows in any particular period.
* * *
Litigation, investigations and claims against other participants in the residential real estate industry may impact the Company and its affiliated franchisees when the rulings or settlements in those cases cover practices common to the broader industry. Examples may include claims associated with RESPA compliance, broker fiduciary duties, multiple listing service practices, and sales agent classification.classification and federal and state fair housing laws. The Company also may be impacted by litigation and other claims against companies in other industries. Changes in current legislation, regulations or interpretations that are applicable to the residential real estate service industry may also impact the Company.
For example, there is active worker classification litigation in numerous jurisdictions against a variety of industries—now including residential real estate brokerages in multiple states, including California and New Jersey—where the plaintiffs seek to reclassify independent contractors as employees or to challenge the use of federal and state minimum wage and overtime exemptions. This type of litigation has been particularly prolific in California since the California Supreme Court adopted a worker classification test in the second quarter of 2018 that is significantly more restrictive than those historically used in wage and hour cases. TheIn September 2019, this judicial worker classification test was codified into California State Legislature is currently considering legislation that, if adopted, would codify the judicial test adopted by the California Supreme Court into statutory law, but wouldthe adopted legislation also codifyprovides an alternate worker classification test provisions applicable to certain classes of workers (including real estate professionals)professionals that if applicable, may beis less restrictive than the judicial test. There can be no assurances
Since the enactment, there have been several challenges to the constitutionality and enforceability of this law as it applies to whetherother industries, which may ultimately impact the California State Legislature will ultimately adopt such legislation in the current form, or at all, or if adopted, that such legislation would include alternateless restrictive test provisions for some or all independentcurrently applicable to real estate sales agents or that the Company would be able to satisfy any such alternative worker classification tests established by the California courts or legislature applicable to such independent real estate sales agents.
professionals. For a summary of certain legal proceedings initiated in California againstinvolving the Company allegingthat allege worker misclassification, see Note 9, "Commitments and Contingencies—Litigation", to the Condensed Consolidated Financial Statements in this report.Quarterly Report.
Item 1A. Risk Factors
Other than as described below, there were no material changes to the risk factors reported in Part 1, "Item 1A. Risk Factors" in our 2019 Form 10-K.
The coronavirus disease 2019 (“COVID-19”) crisis has resulted in homesale transaction declines in the residential real estate industry and our business and continuation of the crisis could have a material adverse effect on our profitability, financial condition and results of operations.
The COVID-19 pandemic is having a profound effect on the global economy and financial markets. This unprecedented situation has created considerable risks and uncertainties for the U.S. real estate services industry in general and for the Company and its affiliated franchisees in particular, including those arising from the adverse effects on the economy as well as risks related to employees, independent sales agents, franchisees, and consumers.
Given the changes we and the rest of the industry saw, starting in mid-March, we anticipate that our revenue for the second quarter of 2020 will be materially lower than during the comparable period in 2019, primarily due to lower homesale transaction volume. Material revenue declines relating to this crisis may have a material adverse effect on our profitability, financial condition and results of operations, notwithstanding the mitigation actions we have initiated (including employee-
59
related cost saving actions, marketing expense pullbacks, and delaying investments in certain initiatives) and expect to continue during this crisis. In addition, we may determine that additional cost-savings initiatives, which may be material, are required and such additional mitigation actions may materiallyadversely impact our operations.
The duration and severity of the impact of the pandemic (and the corresponding economic and other consequences stemming from the pandemic) on our business and financial results will depend largely on future developments, which we are unable to accurately predict, including the extent and duration of the spread of the COVID-19 outbreak; the extent of related governmental regulation; the extent of related government financial support, including for franchisees, independent sales agents and corporations; evolving societal reactions to the pandemic; the duration and severity of the negative impact on the U.S. economy as well as capital and financial markets (including with respect to increasing down payment requirements from mortgage lenders or other tighter mortgage standards or a reduction in the availability of mortgage financing); the materiality of increases in mortgage delinquencies or foreclosure rates; the magnitude and duration of unemployment rates and adverse impact to wage growth; the related impact on consumer confidence and spending; and the magnitude of the financial and operational consequences to our franchisees, all of which are highly uncertain.
Our ability to advance our business strategy may continue to be impaired during the COVID-19 crisis.
Due to the extraordinary disruptions to us, the real estate services industry, society and the economy, and our significant debt leverage, we expect to face additional challenges to our ability to execute our growth strategy including our ability to recruit and retain independent sales agents and franchisees, provide and develop compelling data and technology programs to such agents and franchisees, and deleverage. An inability to execute our business strategy may have a material adverse effect on our profitability, financial condition and results of operations.
The COVID-19 crisis may amplify risks related to our franchise business.
Realogy Franchise Group is dependent upon the operational and financial success of current franchisees and our ability to grow our base of franchisees (without reducing contractual royalty rates or increasing the amount and prevalence of sales incentives). Affiliated franchisees have experienced, and are expected to continue to experience, similar adverse financial effects from the COVID-19 crisis as those affecting the Company and may seek reduced contractual royalty rates, increased sales incentives or other concessions at an increased level. Our royalty revenues and profitability will decline if the financial results of our franchisees continue to worsen, if our franchisees become unable or unwilling to pay franchise fees, or we experience a material decline in our ability to enter into franchise agreements with new franchisees. In addition, the COVID-19 crisis could contribute to an acceleration in the consolidation of our top 250 franchisees, which could result in increased volume incentives and other incentives earned by such franchisees, both of which directly impact our royalty revenue. Any of the foregoing could have a material adverse effect on our revenues and profitability. Further, we may have to increase our bad debt and note reserves and terminate franchisees due to non-payment.
The COVID-19 crisis has amplified and is expected to continue to amplify risks related to our geographic and high-end market concentration.
Our company owned brokerage operations may experience even greater adverse financial consequences due to the ongoing COVID-19 crisis as a result of the significant concentration for this business in transactions at the higher end of the market and in certain geographies, including California, the New York metropolitan area and Florida, which could materially adversely affect our revenues and profitability.
A decrease in homesale transaction volume will also have an adverse impact on Realogy Title Group and our mortgage joint venture and such impact may be intensified by pronounced regional declines in the areas in which our company owned brokerages are located, given the significant geographic overlap of these businesses.
Cartus Relocation Services is subject to risks related to global relocation services, including trends in global corporate spending on relocation services, which have been and are expected to be amplified by the COVID-19 crisis.
Relocation service providers, including Cartus Relocation Services, are impacted by many of the general residential housing trends that impact our residential real estate services business, including those trends emerging in connection with the COVID-19 crisis.In addition, Cartus Relocation Services operates worldwide, which elevates risks related to the international aspects of this business. The risks involved in our international operations and relationships that could result in losses against which we are not insured and therefore affect our profitability include, but are not limited to, heightened exposure to local economic conditions and local laws and regulations (including those related to employees), fluctuations in
60
foreign currency exchange rates, and potential adverse changes in the political stability of foreign countries or in their diplomatic relations with the U.S.
The financial results of Cartus Relocation Services are also directly impacted by global corporate spending on relocation services, which have for several years continued to shift to lower cost relocation benefits as corporate clients engage in cost reduction initiatives and/or restructuring programs, as well as changes in employment relocation trends. As a result of a shift in the mix of services and number of services being delivered per move, Cartus Relocation Services has been increasingly subject to a competitive pricing environment and lower average revenue per relocation. Competition is expected to continue to intensify as an increasingly higher percentage of relocation clients reduce their global relocation benefits and related spend. Lower volume, in particular with respect to global relocation activity, has also impacted the operating results of Cartus Relocation Services.
The COVID-19 crisis has amplified and is expected to continue to amplify the foregoing risks and factors, which may have an adverse effect on the growth and profitability of Cartus Relocation Services.
If multiple significant relocation clients cease or reduce volume under their contracts with Cartus Relocation Services, our revenues and profitability could be materially adversely affected.
Substantially all of our contracts with relocation clients of Cartus Relocation Services are terminable at any time at the option of the client, do not require such client to maintain any level of business with us and are non-exclusive. If multiple significant relocation clients cease or reduce volume under their contracts with Cartus Relocation Services, our revenues (including downstream revenue derived from relocation referrals) and profitability could be materially adversely affected.
We recognized significant non-cash impairment charges, including as related to management’s estimates with respect to the potential impact of the COVID-19 crisis on our business, and we may be required to take additional such charges in the future, which may be material.
During the first quarter of 2020, we performed an impairment assessment of goodwill and indefinite-lived intangible assets as of March 31, 2020, resulting in the recognition of a non-cash impairment of the Realogy Franchise Group trademarks and a non-cash goodwill impairment for Realogy Brokerage Group. The primary drivers to these impairments were a significant increase in the weighted average cost of capital due to the volatility in the capital and debt markets due to COVID-19 and lower projected financial results in 2020.
Given the increase in the discount rate and lower projected 2020 financial results in the first quarter of 2020 impairment analysis, the estimated excess fair value over carrying value for Realogy Franchise Group and Realogy Title Group was reduced to 7% and 5%, respectively. As a result, there is additional risk of an impairment for these business units.
Impairment analyses are highly complex and involve many subjective assumptions, estimates and judgments made by management.Suchassumptions, estimates and judgments may change in the near term due to multiple factors, including continued business and economic disruptions related to the ongoing COVID-19 crisis. If business conditions deteriorate further than we have modeled or if changes in key assumptions and estimates differ significantly from management’s expectations, it may be necessary to record additional impairment charges in the future, which may be material.
The COVID-19 crisis has amplified and may continue to amplify risks related to our significant indebtedness and could have a material adverse effect on our liquidity and financial position.
Under the Senior Secured Credit and Term Loan A Agreements, we are required to comply with a senior secured leverage ratio, as defined in such agreements. In order to comply with the senior secured leverage ratio for the four-quarter periods ending June 30, September 30 and December 31, 2020 and March 31, 2021 (or to avoid an event of default thereof), we will need to achieve a certain amount of trailing four quarters EBITDA calculated on a Pro Forma Basis (as defined in our Senior Secured Credit Agreement) and/or reduced levels of total senior secured first lien net debt. The factors that will impact the foregoing include: (a) slowing decreases, stabilization or increases in sales volume and/or the price of existing homesales, (b) continuing to effect cost savings and business optimization initiatives, (c) increasing new franchise sales, independent sales agent recruitment and retention, or (d) a combination thereof. These factors may be insufficient to overcome macroeconomic conditions affecting us and the duration and severity of the COVID-19 crisis is expected to directly impact all of these factors. In addition, if we determine it to be advisable, we could seek to obtain additional junior lien or unsecured debt or equity financing from third party sources.
61
We believe that we will continue to be in compliance with, or be able to avoid an event of default under, the senior secured leverage ratio and meet our cash flow needs during the next twelve months based upon our current financial modeling, which incorporates factors (a) through (d) above and takes into account the level of open homesale contracts and closed homesale transaction activity we have observed since mid-March, our assumptions regarding the impact of the COVID-19 crisis and related economic downturn (which are subject to significant ongoing uncertainties), industry homesale transaction volume forecasts from multiple sources, and certain cost-savings actions, including those taken to date.
A material decline in our ability to generate EBITDA calculated on a Pro Forma Basis, as defined in the Senior Secured Credit Agreement governing the Senior Secured Credit Facility, as a result of the ongoing COVID-19 crisis or otherwise, could result in our failure to comply with the senior secured leverage ratio covenant under our Senior Secured Credit Facility (including the Revolving Credit Facility) and Term Loan A Facility, which would result in an event of default if we fail to remedy or avoid a default as permitted under the applicable debt arrangement.
In addition, prior to making new borrowings under the Revolving Credit Facility, we are required to certify that the representations and warranties in the Senior Secured Credit Agreement remain true and correct in all material respects as of the date of any borrowing (except to the extent such representations and warranties relate to an earlier date), including the absence of any material adverse effect on our business, property, operations or condition. If we were unable to certify to such representations and warranties as of the date of a proposed borrowing, we would not be able to incur the additional borrowing under our Revolving Credit Facility. An inability to access our Revolving Credit Facility for additional borrowings could have a material adverse effect on our liquidity and financial position. A material misrepresentation in connection with such borrowing request would also cause an event of default under the Senior Secured Credit Agreement.
If the effects of the COVID-19 crisis, including the economic downturn, continue to worsen, we may determine to engage in additional actions to strengthen our capital structure and our improve our liquidity, which may include actions that would increase our leverage or be dilutive to the holders of our common stock. Our ability to enter into one or more potential refinancing or financing transactions (or to obtain a waiver from our lenders for one or more of the covenants under our senior secured credit facilities)is expected to be more challenging in the current environment and may not be available to us on commercially reasonable terms, on terms that are acceptable to us, or at all. In connection with any such transactions, we could incur increased interest and fees and become subject to more onerous covenants, including with respect to the senior secured leverage ratio and new or more restrictive limitations on asset sales, investments and discretionary capital expenditures.
Additionally, the impact of COVID-19 on the financial markets is expected to adversely impact our ability to raise funds through equity financings. Any equity financing in which a holder or group of holders acting together would own more than 35% of the common stock on a fully diluted basis after giving effect to the investment would require us to obtain waivers from our lenders under the Senior Secured Credit and Term Loan A Facilities as, under each applicable agreement, such ownership would otherwise constitute a change in control and would constitute an event of default.
Any of the above could have a material adverse effect on our liquidity and financial position.
Upon the occurrence of an event of default under the indentures governing our Senior Notes, the trustee or holders of 25% of the outstanding applicable notes could elect to declare the principal of, premium, if any, and accrued but unpaid interest on such notes to be due and payable. Any of the foregoing would have a material adverse effect on our business, financial condition and results of operations. If an event of default is continuing under our Senior Secured Credit Facility, Term Loan A Facility, the indentures governing the Unsecured Notes or our other material indebtedness, such event could cause a termination of our ability to obtain future advances under, and amortization of, our Apple Ridge Funding LLC securitization program.
Additional important risks regarding our indebtedness, including with respect to the potential acceleration of our debt upon an event of default, appear under the header Risks Related to Our Indebtedness in Item 1A—Risk Factors of the Form 10-K and are incorporated by reference herein.
We may be unable to continue to securitize certain of the relocation assets of Cartus Relocation Services, which may adversely impact our liquidity.
At March 31, 2020, $162 million of securitization obligations were outstanding through special purpose entities monetizing certain assets of Cartus Relocation Services under two lending facilities. We have provided a performance guaranty which guarantees the obligations of our Cartus subsidiary and its subsidiaries, as originator and servicer under the Apple Ridge securitization program. Our significant debt obligations may limit our ability to incur additional borrowings
62
under our existing securitization facilities and disruptions in the securitization markets, including in connection with the COVID-19 crisis, may have the effect of increasing our cost of funding or reducing our access to these markets in the future.
In addition, the Apple Ridge securitization facility contains terms which if triggered may result in a termination or limitation of new or existing funding under the facility and/or may result in a requirement that all collections on the assets be used to pay down the amounts outstanding under such facility. The triggering events include but are not limited to: (1) those tied to the age and quality of the underlying assets; (2) a change of control; (3) a breach of our senior secured leverage ratio covenant under our Senior Secured Credit Facility if uncured; and (4) the acceleration of indebtedness under our Senior Secured Credit Facility, Unsecured Notes or other material indebtedness. The occurrence of a trigger event under the Apple Ridge securitization facility could restrict our ability to access new or existing funding under this facility or result in termination of the facility. If securitization financing is not available to us for any reason, we could be required to borrow under the Revolving Credit Facility, which would adversely impact our liquidity, or we may be required to find additional sources of funding which may be on less favorable terms or may not be available at all.
Item 2. Unregistered Sales of Equity Securities and Use of Proceeds.
The Company did not repurchase common stock during the quarter ended June 30, 2019.March 31, 2020. The Company expects to prioritize investing in its business and reducing indebtedness. See "Item 2.—Management's Discussion and Analysis of Financial Condition and Results of Operations—Financial Condition, Liquidity and Capital Resources" for additional information.
Shares of common stock repurchased by the Company pursuant to authorizations made from its Board of Directors are retired and not displayed separately as treasury stock on the consolidated financial statements. The par value of the shares repurchased and retired is deducted from common stock and the excess of the purchase price over par value is first charged against any available additional paid-in-capital with the balance charged to retained earnings. Direct costs incurred to repurchase the shares are included in the total cost of the shares.
In February 2019,May 2020, the Company's Board of Directors authorized a newterminated its outstanding share repurchase programprograms. Although, as of up to $175March 31, 2020, $204 million ofhad remained available for repurchase under these now terminated share repurchase programs, the Company’s common stock which was incrementalCompany is prohibited from repurchasing its shares pursuant to the remaining capacity authorized under the February 2018 share repurchase program. Repurchases under these programs may be made at management's discretion from time to time on the open market, pursuant to Rule 10b5-1 trading plans or privately negotiated transactions. The size and timingterms of these repurchases will depend on price, market and economic conditions, legal and contractual requirements and other factors, including the restrictions contained in the indenture governing the 9.375% Senior Notes which prohibit such repurchases until the Company's consolidated leverage ratio falls below 4.00 to 1.00 and then only to the extent of available cumulative credit, as defined under the indenture governing the 9.375% Senior Notes. The repurchase programs have no time limit and may be suspended or discontinued at any time. As of June 30, 2019, $204 million remained available for repurchase under the share repurchase programs.
Item 6. Exhibits.
See Exhibit Index.
SIGNATURES
Pursuant to the requirements of the Securities Exchange Act of 1934, the registrants have duly caused this report to be signed on its behalf by the undersigned thereunto duly authorized.
REALOGY HOLDINGS CORP.
and
REALOGY GROUP LLC
(Registrants)
Date: May 7, 2020
/S/ CHARLOTTE C. SIMONELLI
Charlotte C. Simonelli
Executive Vice President and
Chief Financial Officer
Date: May 7, 2020
/S/ TIMOTHY B. GUSTAVSON
Timothy B. Gustavson
Senior Vice President,
Chief Accounting Officer and
Controller
EXHIBIT INDEX
Exhibit Description
______________
* Filed herewith. |