UNITED STATES
SECURITIES AND EXCHANGE COMMISSION
WASHINGTON, D.C. 20549
_______________________
FORM 10-Q
_______________________
☑ QUARTERLY REPORT PURSUANT TO SECTION 13 OR 15(d) OF THE SECURITIES EXCHANGE ACT OF 1934
For the quarterly period ended June 30, 2023March 31, 2024
OR
☐ TRANSITION REPORT PURSUANT TO SECTION 13 OR 15(d) OF THE SECURITIES EXCHANGE ACT OF 1934
For the transition period from ________ to ________
Commission File Number 001-35761
____________________
American Coastal Insurance Corporation
(Exact Name of Registrant as Specified in its Charter)
| | | | | | | | | | | | | | |
| Delaware | | 75-3241967 | |
| (State or Other Jurisdiction of
Incorporation or Organization) | | (IRS Employer Identification Number) | |
| | | | | | | | | | | | | | | | | |
| 800 2nd Avenue S. | | 33701 | |
| St. Petersburg, | Florida | | |
| (Address of Principle Executive Offices) | | (Zip Code) | |
727-895-7737727-633-0851
(Registrant's telephone number, including area code)
United Insurance Holdings Corp.
(Former name, former address and former fiscal year, if changed since last report)
Securities registered pursuant to Section 12(b) of the Act:
| | | | | | | | |
| Title of Each Class | Trading Symbol(s) | Name of Each Exchange on Which Registered |
| Common Stock, $0.0001 par value per share | ACIC | Nasdaq Stock Market LLC |
Indicate by check mark whether the registrant: (1) has filed all reports required to be filed by Section 13 or 15(d) of the Securities Exchange Act of 1934 during the preceding 12 months (or for such shorter period that the registrant was required to file such reports), and (2) has been subject to such filing requirements for the past 90 days. Yes ☑ No ☐
Indicate by check mark whether the registrant has submitted electronically every Interactive Data File required to be submitted pursuant to Rule 405 of Regulation S-T (§232.405 of this chapter) during the preceding 12 months (or for such shorter period that the registrant was required to submit such files). Yes ☑ No ☐
Indicate by check mark whether the registrant is a large accelerated filer, an accelerated filer, a non-accelerated filer, a smaller reporting company, or an emerging growth company. See the definitions of “large accelerated filer,” “accelerated filer,” “smaller reporting company,” and "emerging growth company" in Rule 12b-2 of the Exchange Act.
| | | | | | | | | | | | | | | | | |
| Large accelerated filer | ☐ | Accelerated filer | ☐☑ | Emerging growth company | ☐ |
| Non-accelerated filer | ☑☐ | Smaller reporting company | ☑ | | |
If an emerging growth company, indicate by check mark if the registrant has elected to use the extended transition period for complying with any new or revised financial accounting standards provided pursuant to Section 13(a) of the Exchange Act. £
Indicate by check mark whether the registrant is a shell company (as defined in Rule 12b-2 of the Exchange Act). Yes ☐ No R
As of August 9, 2023, 43,406,486May 3, 2024, 47,828,491 shares of common stock, par value $0.0001 per share, were outstanding.
AMERICAN COASTAL INSURANCE CORPORATION
| | | | | | | | |
PART I. FINANCIAL INFORMATION | |
| Item 1. Financial Statements | |
| Condensed Consolidated Balance Sheets (Unaudited) | |
| Condensed Consolidated Statements of Comprehensive Income (Loss) (Unaudited) | |
| Condensed Consolidated Statements of Stockholders' Equity (Deficit) (Unaudited) | |
| Condensed Consolidated Statements of Cash Flows (Unaudited) | |
| Notes to Unaudited Condensed Consolidated Financial Statements | |
| Item 2. Management's Discussion and Analysis of Financial Condition and Results of Operations | |
| Item 3. Quantitative and Qualitative Disclosures About Market Risk | |
| Item 4. Controls and Procedures | |
| PART II. OTHER INFORMATION | |
| Item 1. Legal Proceedings | |
| Item 1A. Risk Factors | |
| Item 2. Unregistered Sales of Equity Securities and Use of Proceeds | |
| Item 3. Defaults Upon Senior Securities | |
| Item 4. Mine Safety Disclosures | |
| Item 5. Other Information | |
| Item 6. Exhibits | |
| Signatures | |
Throughout this Quarterly Report on Form 10-Q (Form 10-Q), we present amounts in all tables in thousands, except for share amounts, per share amounts, policy counts or where more specific language or context indicates a different presentation. In the narrative sections of this Form 10-Q, we show full values rounded to the nearest thousand.
AMERICAN COASTAL INSURANCE CORPORATION
FORWARD-LOOKING STATEMENTS
This Form 10-Q contains “forward-looking statements” within the meaning of the Private Securities Litigation Reform Act of 1995. These forward-looking statements include statements about anticipated growth in revenues, gross written premium, earnings per share, estimated unpaid losses on insurance policies, investment returns, and diversification and expectations about our liquidity, our ability to meet our investment objectives, our ability to manage and mitigate market risk with respect to our investments and our ability to continue as a going concern. Without limiting the generality of the foregoing, words such as “may,” “will,” “expect,” “endeavor,” “project,” “believe,” “plan,” “anticipate,” “intend,” “could,” “would,” “estimate,” or “continue” or the negative variations thereof or comparable terminology are intended to identify forward-looking statements. These statements are based on current expectations, estimates and projections about the industry and market in which we operate, and management's beliefs and assumptions. Forward-looking statements are not guarantees of future performance and involve certain known and unknown risks and uncertainties that could cause actual results to differ materially from those expressed or implied by such statements. The risks and uncertainties include, without limitation:
•our exposure to catastrophic events and severe weather conditions;
•the regulatory, economic and weather conditions present in Florida and New York the states in which we write business as of March 1, 2023;business;
•our ability to cultivate and maintain agent relationships, particularly our relationship with AmRisc, LLC;LLC (AmRisc);
•the possibility that actual claims incurred may exceed our loss reserves for claims;
•assessments charged by various governmental agencies;
•our ability to implement and maintain adequate internal controls over financial reporting;reporting, including our ability to remediate any existing material weakness in our internal controls over financial reporting and the timing of any such remediation, as well as our ability to reestablish effective internal controls over financial reporting and disclosure controls and procedures;
•our ability to maintain information technology and data security systems, and to outsource relationships;
•our reliance on key vendor relationships, and the ability of our vendors to protect the personally identifiable information of our customers, claimants or employees;
•our ability to attract and retain the services of senior management;
•risks and uncertainties relating to our acquisitions, mergers, dispositions and other strategic transactions;
•risks associated with investments in which we share ownership or management with third parties;
•our ability to generate sufficient cash to service all of our indebtedness and comply with covenants and other requirements related to our indebtedness;
•our ability to maintain our market share;
•changes in the regulatory environment present in the states in which we operate;
•the impact of new federal or state regulations that affect the insurance industry;
•the cost, viability and availability of reinsurance;
•our ability to collect from our reinsurers or others on our reinsurance claims;
•dependence on investment income and the composition of our investment portfolio and related market risks;
•the possibility of the pricing and terms for our products to decline due to the historically cyclical nature of the property and casualty insurance and reinsurance industry;
•the outcome of litigation pending against us, including the terms of any settlements;
•downgrades in our financial strength or stability ratings;
•the impact of future transactions of substantial amounts of our common stock by us or our significant stockholders on our stock price;
•our ability to meet the standards for continued listing on Nasdaq;
•our ability to pay dividends in the future, which may be constrained by our holding company structure;
•the ability of our subsidiaries to pay dividends in the future, which may affect our liquidity and our ability to meet our obligations;
•the ability of R. Daniel Peed and his affiliates to exert significant control over us due to substantial ownership of our common stock, subject to certain restrictive covenants that may restrict our ability to pursue certain opportunities;
•the impact of transactions by R. Daniel Peed and his affiliates on the price of our common stock;
•provisions in our charter documents that may make it harder for others to obtain control of us; and
•other risks and uncertainties described in the section entitled "Risk Factors" in Part I, Item 1A in our Annual Report on Form 10-K for the year ended December 31, 20222023 and in Part II, Item 1A of this Form 10-Q.
We caution you not to rely on these forward-looking statements, which are valid only as of the date they were made. Except as may be required by applicable law, we undertake no obligation to update or revise any forward-looking statements to reflect new information, the occurrence of unanticipated events or otherwise.
AMERICAN COASTAL INSURANCE CORPORATION
PART I. FINANCIAL INFORMATION
Item 1. Financial Statements
Condensed Consolidated Balance Sheets (Unaudited)
| | June 30,
2023 | | December 31, 2022 |
| | March 31,
2024 | | | | March 31,
2024 | | December 31, 2023 |
| ASSETS | ASSETS | | | | | ASSETS | | | | |
| Investments, at fair value: | Investments, at fair value: | | | | | Investments, at fair value: | | |
| Fixed maturities, available-for-sale (amortized cost of $185,046 and $237,735, respectively) | | $ | 160,863 | | | $ | 204,682 | |
| Fixed maturities, available-for-sale (amortized cost of $198,750 and $200,951, respectively) | |
| Equity securities | Equity securities | | — | | | 15,657 | |
| Other investments (amortized cost of $3,403 and $3,072, respectively) | | 3,583 | | | 3,675 | |
| Other investments (amortized cost of $14,121 and $16,118, respectively) | |
| | Total investments | |
| Total investments | |
| Total investments | Total investments | | $ | 164,446 | | | $ | 224,014 | |
| Cash and cash equivalents | Cash and cash equivalents | | 27,767 | | | 70,903 | |
| Restricted cash | Restricted cash | | 49,501 | | | 45,988 | |
| Total cash, cash equivalents and restricted cash | Total cash, cash equivalents and restricted cash | | $ | 77,268 | | | $ | 116,891 | |
| Accrued investment income | Accrued investment income | | 1,632 | | | 1,605 | |
| Property and equipment, net | Property and equipment, net | | 4,474 | | | 5,293 | |
| Premiums receivable, net (credit allowance of $28 and $32, respectively) | | 55,651 | | | 39,301 | |
| Reinsurance recoverable on paid and unpaid losses, net (credit allowance of $169 and $333, respectively) | | 658,814 | | | 796,546 | |
| Premiums receivable, net (credit allowance of $53 and $51, respectively) | |
| Reinsurance recoverable on paid and unpaid losses, net (credit allowance of $65 and $97, respectively) | |
| Ceded unearned premiums | Ceded unearned premiums | | 329,676 | | | 90,496 | |
| Goodwill | Goodwill | | 59,476 | | | 59,476 | |
| Deferred policy acquisition costs, net | Deferred policy acquisition costs, net | | 34,821 | | | 52,369 | |
| Intangible assets, net | Intangible assets, net | | 10,946 | | | 12,770 | |
| Other assets | Other assets | | 35,546 | | | 3,920 | |
| Assets held for disposal | Assets held for disposal | | 12,105 | | | 1,434,815 | |
| Total Assets | Total Assets | | $ | 1,444,855 | | | $ | 2,837,496 | |
| LIABILITIES AND STOCKHOLDERS' EQUITY | LIABILITIES AND STOCKHOLDERS' EQUITY | | | | |
| Liabilities: | Liabilities: | |
| Liabilities: | |
| Liabilities: | |
| Unpaid losses and loss adjustment expenses | |
| Unpaid losses and loss adjustment expenses | |
| Unpaid losses and loss adjustment expenses | Unpaid losses and loss adjustment expenses | | $ | 534,676 | | | $ | 842,958 | |
| Unearned premiums | Unearned premiums | | 387,311 | | | 258,978 | |
| Reinsurance payable on premiums | Reinsurance payable on premiums | | 140,662 | | | 30,503 | |
| Payments outstanding | Payments outstanding | | 17,532 | | | 2,000 | |
| Accounts payable and accrued expenses | Accounts payable and accrued expenses | | 93,184 | | | 74,386 | |
| Operating lease liability | Operating lease liability | | 1,172 | | | 1,689 | |
| Other liabilities | Other liabilities | | 7,606 | | | 5,849 | |
| Notes payable, net | Notes payable, net | | 148,521 | | | 148,355 | |
| Liabilities held for disposal | Liabilities held for disposal | | 1,795 | | | 1,654,817 | |
| Total Liabilities | Total Liabilities | | $ | 1,332,459 | | | $ | 3,019,535 | |
| Commitments and contingencies (Note 12) | | | | |
| Commitments and Contingencies (Note 12) | | Commitments and Contingencies (Note 12) | | |
| Stockholders' Equity: | Stockholders' Equity: | |
| Preferred stock, $0.0001 par value; 1,000,000 shares authorized; none issued or outstanding | Preferred stock, $0.0001 par value; 1,000,000 shares authorized; none issued or outstanding | | $ | — | | | $ | — | |
| Common stock, $0.0001 par value; 100,000,000 shares authorized; 43,618,569 and 43,492,256 issued, respectively; 43,406,486 and 43,280,173 outstanding, respectively | | 4 | | | 4 | |
| Preferred stock, $0.0001 par value; 1,000,000 shares authorized; none issued or outstanding | |
| Preferred stock, $0.0001 par value; 1,000,000 shares authorized; none issued or outstanding | |
| Common stock, $0.0001 par value; 100,000,000 shares authorized; 48,011,548 and 46,989,089 issued, respectively; 47,799,465 and 46,777,006 outstanding, respectively | |
| Additional paid-in capital | Additional paid-in capital | | 396,136 | | | 395,631 | |
| Treasury shares, at cost: 212,083 shares | Treasury shares, at cost: 212,083 shares | | (431) | | | (431) | |
| Accumulated other comprehensive loss | Accumulated other comprehensive loss | | (21,072) | | | (30,947) | |
| Retained earnings (deficit) | Retained earnings (deficit) | | (262,241) | | | (546,296) | |
| | Total Stockholders' Equity (Deficit) | | $ | 112,396 | | | $ | (182,039) | |
| Total Stockholders' Equity | |
| | Total Stockholders' Equity | |
| | Total Stockholders' Equity | |
| Total Liabilities and Stockholders' Equity | Total Liabilities and Stockholders' Equity | | $ | 1,444,855 | | | $ | 2,837,496 | |
See accompanying Notes to Unaudited Condensed Consolidated Financial Statements.
AMERICAN COASTAL INSURANCE CORPORATION
Condensed Consolidated Statements of Comprehensive Income (Loss) (Unaudited)
| | Three Months Ended | | Six Months Ended |
| June 30, | | June 30, |
| 2023 | | 2022 | | 2023 | | 2022 |
| | | | Three Months Ended | |
| | | | Three Months Ended | |
| | | | Three Months Ended | |
| | | | March 31, | | | | | | March 31, |
| | | | | | 2024 | | | | | | | | 2024 | | 2023 |
| REVENUE: | REVENUE: | | | | | | | | |
| Gross premiums written | |
| Gross premiums written | |
| Gross premiums written | Gross premiums written | | $ | 243,885 | | | $ | 207,632 | | | $ | 431,008 | | | $ | 350,046 | |
| Change in gross unearned premiums | Change in gross unearned premiums | | (85,686) | | | (78,149) | | | (128,333) | | | (97,830) | |
| Gross premiums earned | Gross premiums earned | | 158,199 | | | 129,483 | | | 302,675 | | | 252,216 | |
| Ceded premiums earned | Ceded premiums earned | | (75,030) | | | (64,951) | | | (132,182) | | | (129,938) | |
| Net premiums earned | Net premiums earned | | 83,169 | | | 64,532 | | | 170,493 | | | 122,278 | |
| Net investment income | Net investment income | | 2,692 | | | 1,839 | | | 5,281 | | | 3,243 | |
| Net realized investment losses | Net realized investment losses | | (6,725) | | | (77) | | | (6,808) | | | (40) | |
| Net unrealized gains (losses) on equity securities | Net unrealized gains (losses) on equity securities | | 141 | | | (2,391) | | | 615 | | | (3,161) | |
| | Other revenue | Other revenue | | 18 | | | 7 | | | 34 | | | 22 | |
| Other revenue | |
| Other revenue | |
| Total revenue | Total revenue | | 79,295 | | | 63,910 | | | 169,615 | | | 122,342 | |
| EXPENSES: | EXPENSES: | |
| Losses and loss adjustment expenses | |
| Losses and loss adjustment expenses | |
| Losses and loss adjustment expenses | Losses and loss adjustment expenses | | 20,915 | | | 14,032 | | | 37,327 | | | 40,347 | |
| Policy acquisition costs | Policy acquisition costs | | 25,545 | | | 23,570 | | | 52,517 | | | 43,878 | |
| Operating expenses | Operating expenses | | 3,274 | | | 3,820 | | | 5,442 | | | 7,527 | |
| General and administrative expenses | General and administrative expenses | | 6,583 | | | 8,208 | | | 15,376 | | | 16,272 | |
| Interest expense | Interest expense | | 2,719 | | | 2,363 | | | 5,438 | | | 4,722 | |
| Total expenses | Total expenses | | 59,036 | | | 51,993 | | | 116,100 | | | 112,746 | |
| Income before other income | Income before other income | | 20,259 | | | 11,917 | | | 53,515 | | | 9,596 | |
| Other income | Other income | | 806 | | | 258 | | | 1,394 | | | 1,591 | |
| Income before income taxes | Income before income taxes | | 21,065 | | | 12,175 | | | 54,909 | | | 11,187 | |
| Provision for income taxes | Provision for income taxes | | 713 | | | 25,486 | | | 4,190 | | | 24,771 | |
| Income from continuing operations, net of tax | Income from continuing operations, net of tax | | $ | 20,352 | | | $ | (13,311) | | | $ | 50,719 | | | $ | (13,584) | |
| Income (loss) from discontinued operations, net of tax | | (2,573) | | | (55,744) | | | 234,340 | | | (88,728) | |
| Net income (loss) | | 17,779 | | | (69,055) | | | $ | 285,059 | | | $ | (102,312) | |
| Less: Net loss attributable to NCI | | — | | | (26) | | | — | | | (111) | |
| Net income (loss) attributable to ACIC | | $ | 17,779 | | | $ | (69,029) | | | $ | 285,059 | | | $ | (102,201) | |
| Income from discontinued operations, net of tax | |
| Net income | |
| | OTHER COMPREHENSIVE INCOME (LOSS): | OTHER COMPREHENSIVE INCOME (LOSS): | | | | | | | | |
| | OTHER COMPREHENSIVE INCOME (LOSS): | |
| | OTHER COMPREHENSIVE INCOME (LOSS): | |
| Change in net unrealized gains (losses) on investments | |
| Change in net unrealized gains (losses) on investments | |
| Change in net unrealized gains (losses) on investments | Change in net unrealized gains (losses) on investments | | (2,168) | | | (16,590) | | | 2,063 | | | (44,279) | |
| Reclassification adjustment for net realized investment losses | Reclassification adjustment for net realized investment losses | | 6,725 | | | 78 | | | 6,808 | | | 1,847 | |
| | Income tax benefit (expense) related to items of other comprehensive income (loss) | | — | | | (6,187) | | | — | | | 49 | |
| Total comprehensive income (loss) | | $ | 22,336 | | | $ | (91,754) | | | $ | 293,930 | | | $ | (144,695) | |
| Less: Comprehensive income (loss) attributable to NCI | | — | | | 479 | | | — | | | (164) | |
| Comprehensive income (loss) attributable to ACIC | | $ | 22,336 | | | $ | (92,233) | | | $ | 293,930 | | | $ | (144,531) | |
| Income tax benefit related to items of other comprehensive income (loss) | |
| Income tax benefit related to items of other comprehensive income (loss) | |
| Income tax benefit related to items of other comprehensive income (loss) | |
| Total comprehensive income | |
| | | Weighted average shares outstanding | Weighted average shares outstanding | |
| | Weighted average shares outstanding | |
| | Weighted average shares outstanding | |
| Basic | |
| Basic | |
| Basic | Basic | | 43,229,416 | | | 43,049,227 | | | 43,178,758 | | | 43,015,114 | |
| Diluted | Diluted | | 43,805,217 | | | 43,049,227 | | | 43,690,435 | | | 43,015,114 | |
| | Earnings available to ACIC common stockholders per share | Earnings available to ACIC common stockholders per share | |
| Earnings available to ACIC common stockholders per share | |
| Earnings available to ACIC common stockholders per share | |
| Basic | Basic | |
| Basic | |
| Basic | |
| Continuing operations | |
| Continuing operations | |
| Continuing operations | Continuing operations | | $ | 0.48 | | | $ | (0.31) | | | $ | 1.16 | | | $ | (0.31) | |
| Discontinued operations | Discontinued operations | | (0.06) | | | (1.29) | | | 5.43 | | | (2.06) | |
| Total | Total | | $ | 0.42 | | | $ | (1.60) | | | $ | 6.59 | | | $ | (2.37) | |
| Diluted | Diluted | | | | | | | | |
| Continuing operations | Continuing operations | | $ | 0.47 | | | $ | (0.31) | | | $ | 1.16 | | | $ | (0.31) | |
| Continuing operations | |
| Continuing operations | |
| Discontinued operations | Discontinued operations | | (0.06) | | | (1.29) | | | 5.36 | | | (2.06) | |
| Total | Total | | $ | 0.41 | | | $ | (1.60) | | | $ | 6.52 | | | $ | (2.37) | |
See accompanying Notes to Unaudited Condensed Consolidated Financial Statements.
AMERICAN COASTAL INSURANCE CORPORATION
Condensed Consolidated Statements of Stockholders’ Equity for the Three Months Ended
(Unaudited)
| | | | | | | | | | | | | | | | | | | | | | | | | | | | | | | | | | | | | | | | | | | | | | | | | | | | | |
| Common Stock | | Additional Paid-in Capital | | Treasury Stock | | Accumulated Other Comprehensive Loss | | Retained Earnings (Deficit) | | Stockholders' Equity Attributable to ACIC | | NCI | | Total Stockholders’ Equity |
| Number of Shares | | Dollars | | | | | | |
| | | | | | |
| March 31, 2022 | 43,257,595 | | | $ | 4 | | | $ | 394,720 | | | $ | (431) | | | $ | (25,657) | | | $ | (110,665) | | | $ | 257,971 | | | $ | 18,908 | | | $ | 276,879 | |
| Net loss | — | | | — | | | — | | | — | | | — | | | (69,029) | | | (69,029) | | | (26) | | | (69,055) | |
| Other comprehensive income (loss), net | — | | | — | | | — | | | — | | | (23,204) | | | — | | | (23,204) | | | 505 | | | (22,699) | |
| Return of Capital to NCI | — | | | — | | | — | | | — | | | — | | | 1,052 | | | 1,052 | | | (19,387) | | | (18,335) | |
| Stock Compensation | 55,571 | | | — | | | 182 | | | — | | | — | | | — | | | 182 | | | — | | | 182 | |
| | | | | | | | | | | | | | | | | |
| | | | | | | | | | | | | | | | | |
| | | | | | | | | | | | | | | | | |
| | | | | | | | | | | | | | | | | |
| | | | | | | | | | | | | | | | | |
| June 30, 2022 | 43,313,166 | | | $ | 4 | | | $ | 394,902 | | | $ | (431) | | | $ | (48,861) | | | $ | (178,642) | | | $ | 166,972 | | | $ | — | | | $ | 166,972 | |
| | | | | | | | | | | | | | | | | | | | | | | | | | | | | | | | | | | | | | | | | | | | | | | | | | | | | |
| Common Stock | | Additional Paid-in Capital | | Treasury Stock | | Accumulated Other Comprehensive Loss | | Retained Earnings (Deficit) | | Stockholders' Equity Attributable to ACIC | | NCI | | Total Stockholders’ Equity |
| Number of Shares | | Dollars | | | | | | | |
| | | | | | | |
| March 31, 2023 | 43,274,359 | | | $ | 4 | | | $ | 395,966 | | | $ | (431) | | | $ | (25,629) | | | $ | (280,020) | | | $ | 89,890 | | | $ | — | | | $ | 89,890 | |
| Net Income | — | | | — | | | — | | | — | | | — | | | 17,779 | | | 17,779 | | | — | | | 17,779 | |
| Other comprehensive income, net | — | | | — | | | — | | | — | | | 4,557 | | | — | | | 4,557 | | | — | | | 4,557 | |
| | | | | | | | | | | | | | | | | |
| Stock Compensation | 132,127 | | | — | | | 170 | | | — | | | — | | | — | | | 170 | | | — | | | 170 | |
| | | | | | | | | | | | | | | | | |
| | | | | | | | | | | | | | | | | |
| | | | | | | | | | | | | | | | | |
| | | | | | | | | | | | | | | | | |
| | | | | | | | | | | | | | | | | |
| June 30, 2023 | 43,406,486 | | | $ | 4 | | | $ | 396,136 | | | $ | (431) | | | $ | (21,072) | | | $ | (262,241) | | | $ | 112,396 | | | $ | — | | | $ | 112,396 | |
See accompanying Notes to Unaudited Condensed Consolidated Financial Statements. | | | | | | | | | | | | | | | | | | | | | | | | | | | | | | | | | | | | | | | | | | | | | |
| Common Stock | | Additional Paid-in Capital | | Treasury Stock | | Accumulated Other Comprehensive Loss | | Retained Earnings (Deficit) | | Total
Stockholders' Equity (Deficit) | | | | |
| Number of Shares | | Dollars | | | | | | |
| | | | | | |
| December 31, 2022 | 43,280,173 | | | $ | 4 | | | $ | 395,631 | | | $ | (431) | | | $ | (30,947) | | | $ | (546,296) | | | $ | (182,039) | | | | | |
| Net income | — | | | — | | | — | | | — | | | — | | | 267,280 | | | 267,280 | | | | | |
| Other comprehensive income, net | — | | | — | | | — | | | — | | | 4,314 | | | — | | | 4,314 | | | | | |
| Impact of Deconsolidation of Discontinued Operations | — | | | — | | | — | | | — | | | 1,004 | | | (1,004) | | | — | | | | | |
| Stock Compensation | (5,814) | | | — | | | 335 | | | — | | | — | | | — | | | 335 | | | | | |
| | | | | | | | | | | | | | | | | |
| | | | | | | | | | | | | | | | | |
| | | | | | | | | | | | | | | | | |
| | | | | | | | | | | | | | | | | |
| March 31, 2023 | 43,274,359 | | | $ | 4 | | | $ | 395,966 | | | $ | (431) | | | $ | (25,629) | | | $ | (280,020) | | | $ | 89,890 | | | | | |
AMERICAN COASTAL INSURANCE CORPORATION
Condensed Consolidated Statements of Stockholders’ Equity for the Six Months Ended
(Unaudited)
| | | | | | | | | | | | | | | | | | | | | | | | | | | | | | | | | | | | | | | | | | | | | | | | | | | | | |
| Common Stock | | Additional Paid-in Capital | | Treasury Stock | | Accumulated Other Comprehensive Loss | | Retained Earnings (Deficit) | | Stockholders' Equity Attributable to ACIC | | NCI | | Total Stockholders’ Equity |
| Number of Shares | | Dollars | | | | | | |
| | | | | | |
| December 31, 2021 | 43,370,442 | | | $ | 4 | | | $ | 394,268 | | | $ | (431) | | | $ | (6,531) | | | $ | (74,904) | | | $ | 312,406 | | | $ | 19,551 | | | $ | 331,957 | |
| Net loss | — | | | — | | | — | | | — | | | — | | | (102,201) | | | (102,201) | | | (111) | | | (102,312) | |
| Other comprehensive loss, net | — | | | — | | | — | | | — | | | (42,330) | | | — | | | (42,330) | | | (53) | | | (42,383) | |
| Return of Capital to NCI | — | | | — | | | — | | | — | | | — | | | 1,052 | | | 1,052 | | | (19,387) | | | (18,335) | |
| Stock Compensation | (57,276) | | | — | | | 634 | | | — | | | — | | | — | | | 634 | | | — | | | 634 | |
| | | | | | | | | | | | | | | | | |
| Cash dividends on common stock ($0.06 per common share) | — | | | — | | | — | | | — | | | — | | | (2,589) | | | (2,589) | | | — | | | (2,589) | |
| | | | | | | | | | | | | | | | | |
| | | | | | | | | | | | | | | | | |
| June 30, 2022 | 43,313,166 | | | $ | 4 | | | $ | 394,902 | | | $ | (431) | | | $ | (48,861) | | | $ | (178,642) | | | $ | 166,972 | | | $ | — | | | $ | 166,972 | |
| | | | | | | | | | | | | | | | | | | | | | | | | | | | | | | | | | | | | | | | | | | | | | | | | | | | | |
| Common Stock | | Additional Paid-in Capital | | Treasury Stock | | Accumulated Other Comprehensive Loss | | Retained Earnings (Deficit) | | Stockholders' Equity (Deficit)
Attributable to ACIC | | NCI | | Total Stockholders’ Equity (Deficit) |
| Number of Shares | | Dollars | | | | | | | |
| | | | | | | |
| December 31, 2022 | 43,280,173 | | | $ | 4 | | | $ | 395,631 | | | $ | (431) | | | $ | (30,947) | | | $ | (546,296) | | | $ | (182,039) | | | $ | — | | | $ | (182,039) | |
| Net Income | — | | | — | | | — | | | — | | | — | | | 285,059 | | | 285,059 | | | — | | | 285,059 | |
| Other comprehensive income, net | — | | | — | | | — | | | — | | | 8,871 | | | — | | | 8,871 | | | — | | | 8,871 | |
| Impact of Deconsolidation of Discontinued Operations | — | | | — | | | — | | | — | | | 1,004 | | | (1,004) | | | — | | | — | | | — | |
| Stock Compensation | 126,313 | | | — | | | 505 | | | — | | | — | | | — | | | 505 | | | — | | | 505 | |
| | | | | | | | | | | | | | | | | |
| | | | | | | | | | | | | | | | | |
| | | | | | | | | | | | | | | | | |
| | | | | | | | | | | | | | | | | |
| | | | | | | | | | | | | | | | | |
| June 30, 2023 | 43,406,486 | | | $ | 4 | | | $ | 396,136 | | | $ | (431) | | | $ | (21,072) | | | $ | (262,241) | | | $ | 112,396 | | | $ | — | | | $ | 112,396 | |
| | | | | | | | | | | | | | | | | | | | | | | | | | | | | | | | | | | | | | | | | | | | | |
| Common Stock | | Additional Paid-in Capital | | Treasury Stock | | Accumulated Other Comprehensive Loss | | Retained Earnings (Deficit) | | Total
Stockholders' Equity | | | | |
| Number of Shares | | Dollars | | | | | | | |
| | | | | | | |
| December 31, 2023 | 46,777,006 | | | $ | 5 | | | $ | 423,717 | | | $ | (431) | | | $ | (17,137) | | | $ | (237,389) | | | $ | 168,765 | | | | | |
| Net Income | — | | | — | | | — | | | — | | | — | | | 23,599 | | | 23,599 | | | | | |
| Other comprehensive loss, net | — | | | — | | | — | | | — | | | (198) | | | — | | | (198) | | | | | |
| | | | | | | | | | | | | | | | | |
| Stock Compensation | 22,459 | | | — | | | 428 | | | — | | | — | | | — | | | 428 | | | | | |
| Issuance of common stock | 1,000,000 | | | — | | | 11,398 | | | — | | | — | | | — | | | 11,398 | | | | | |
| | | | | | | | | | | | | | | | | |
| | | | | | | | | | | | | | | | | |
| | | | | | | | | | | | | | | | | |
| | | | | | | | | | | | | | | | | |
| March 31, 2024 | 47,799,465 | | | $ | 5 | | | $ | 435,543 | | | $ | (431) | | | $ | (17,335) | | | $ | (213,790) | | | $ | 203,992 | | | | | |
See accompanying Notes to Unaudited Condensed Consolidated Financial Statements.
AMERICAN COASTAL INSURANCE CORPORATION
Condensed Consolidated Statements of Cash Flows (Unaudited) | | Six Months Ended June 30, |
| 2023 | | 2022 |
| | Three Months Ended March 31, | | | | Three Months Ended March 31, |
| | 2024 | | | | 2024 | | 2023 |
| OPERATING ACTIVITIES | OPERATING ACTIVITIES | | | | |
| Net income (loss) | | $ | 285,059 | | | $ | (102,312) | |
| Adjustments to reconcile net loss to net cash provided by (used in) operating activities: | |
| Net income | |
| Net income | |
| Net income | |
| Adjustments to reconcile net loss to net cash used in operating activities: | |
| Depreciation and amortization | |
| Depreciation and amortization | |
| Depreciation and amortization | Depreciation and amortization | | 4,281 | | | 5,042 | |
| Bond amortization and accretion | Bond amortization and accretion | | 499 | | | 3,041 | |
| Net realized losses on investments | | 5,464 | | | 1,847 | |
| Net realized gains on investments | |
| Net unrealized losses (gains) on equity securities | Net unrealized losses (gains) on equity securities | | (2,694) | | | 7,352 | |
| Provision for uncollectable premiums | Provision for uncollectable premiums | | 4 | | | 6 | |
| Provision for uncollectable reinsurance recoverables | Provision for uncollectable reinsurance recoverables | | 164 | | | 223 | |
| | Deferred income taxes, net | Deferred income taxes, net | | 3,310 | | | 24,764 | |
| Deferred income taxes, net | |
| Deferred income taxes, net | |
| Stock based compensation | Stock based compensation | | 505 | | | 634 | |
| | Settlement of receivable owed by HCI in connection with purchase agreement | | — | | | 3,800 | |
| Gain on sale of property and equipment | Gain on sale of property and equipment | | (559) | | | (1,528) | |
| Fixed asset disposal | Fixed asset disposal | | 953 | | | 343 | |
| Gain on disposition of former subsidiary | Gain on disposition of former subsidiary | | (238,440) | | | — | |
| Changes in operating assets and liabilities: | Changes in operating assets and liabilities: | |
| Accrued investment income | |
| Accrued investment income | |
| Accrued investment income | Accrued investment income | | 555 | | | 200 | |
| Premiums receivable | Premiums receivable | | 7,648 | | | (22,386) | |
| Reinsurance recoverable on paid and unpaid losses | Reinsurance recoverable on paid and unpaid losses | | 423,501 | | | 239,386 | |
| Ceded unearned premiums | Ceded unearned premiums | | (191,910) | | | (72,033) | |
| Deferred policy acquisition costs, net | Deferred policy acquisition costs, net | | 24,201 | | | (38,671) | |
| Other assets | Other assets | | (49,699) | | | (1,728) | |
| | Unpaid losses and loss adjustment expenses | |
| Unpaid losses and loss adjustment expenses | |
| Unpaid losses and loss adjustment expenses | Unpaid losses and loss adjustment expenses | | (491,831) | | | (234,456) | |
| Unearned premiums | Unearned premiums | | (59,854) | | | 14,657 | |
| Reinsurance payable on premiums | Reinsurance payable on premiums | | 93,378 | | | 189,059 | |
| Payments outstanding | Payments outstanding | | (53,287) | | | (5,561) | |
| Accounts payable and accrued expenses | Accounts payable and accrued expenses | | 21,837 | | | (7,693) | |
| Operating lease liability | Operating lease liability | | (517) | | | (334) | |
| Other liabilities | Other liabilities | | (15,391) | | | 4,634 | |
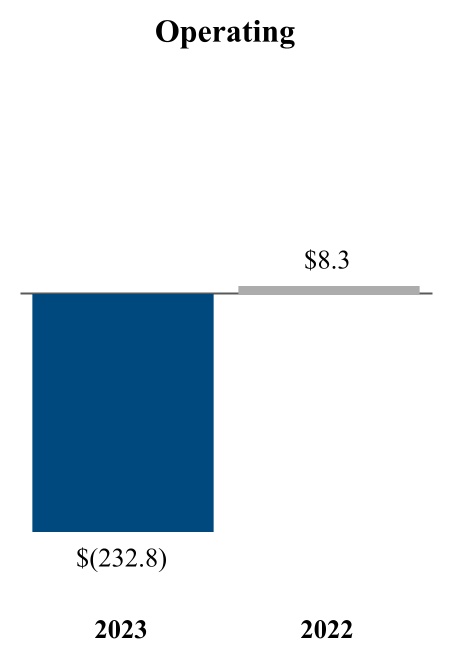
| Net cash provided by (used in) operating activities | Net cash provided by (used in) operating activities | | $ | (232,823) | | | $ | 8,286 | |
| INVESTING ACTIVITIES | INVESTING ACTIVITIES | | | | |
| Proceeds from sales, maturities and repayments of: | Proceeds from sales, maturities and repayments of: | |
| Proceeds from sales, maturities and repayments of: | |
| Proceeds from sales, maturities and repayments of: | |
| Fixed maturities | |
| Fixed maturities | |
| Fixed maturities | Fixed maturities | | 230,424 | | | 107,536 | |
| Equity securities | Equity securities | | 40,322 | | | 88 | |
| Other investments | Other investments | | 500 | | | 1,464 | |
| | Purchases of: | Purchases of: | |
| Fixed maturities | Fixed maturities | | (11,786) | | | (18,334) | |
| Fixed maturities | |
| Fixed maturities | |
| Equity securities | Equity securities | | 35 | | | (6,253) | |
| Other investments | | (759) | | | (840) | |
| | Proceeds from sale of property and equipment | |
| Proceeds from sale of property and equipment | |
| Proceeds from sale of property and equipment | Proceeds from sale of property and equipment | | 599 | | | 3,966 | |
| Cost of property, equipment and capitalized software acquired | Cost of property, equipment and capitalized software acquired | | (273) | | | (2,360) | |
| Disposition of cash on divestiture of subsidiary | Disposition of cash on divestiture of subsidiary | | (232,582) | | | — | |
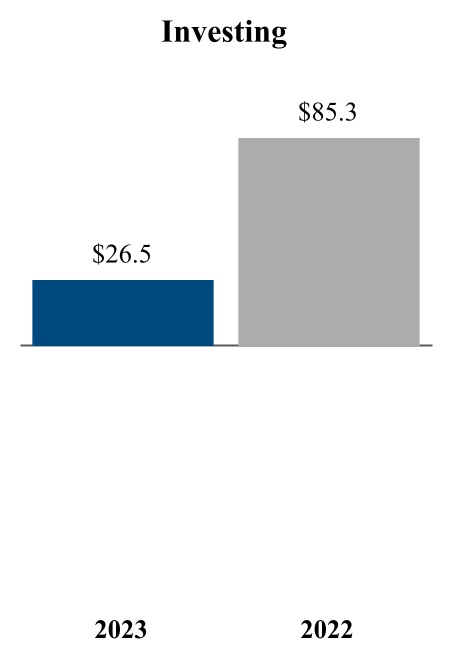
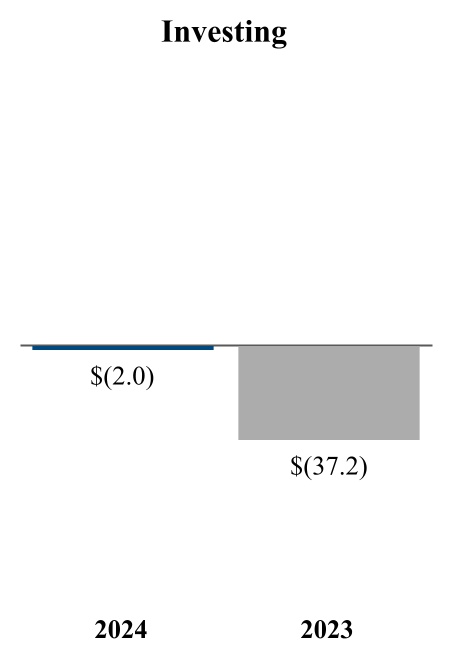
| Net cash provided by investing activities | | $ | 26,480 | | | $ | 85,267 | |
| Net cash used in investing activities | |
| FINANCING ACTIVITIES | FINANCING ACTIVITIES | |
| Repayments of borrowings | | — | | | (761) | |
| Dividends | | — | | | (2,589) | |
| | Return of capital in connection with termination of noncontrolling interest | | — | | | (18,335) | |
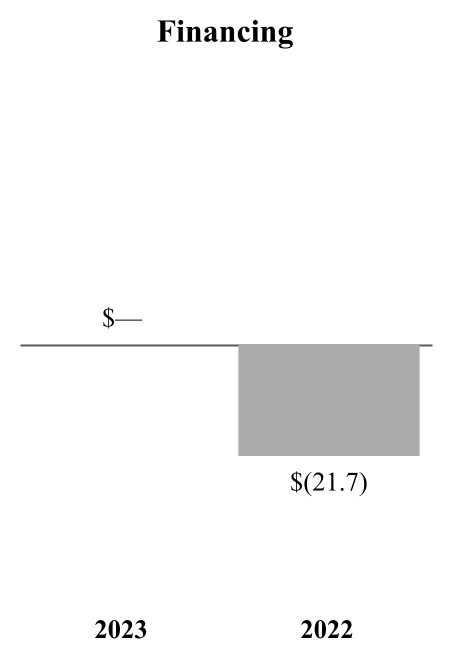
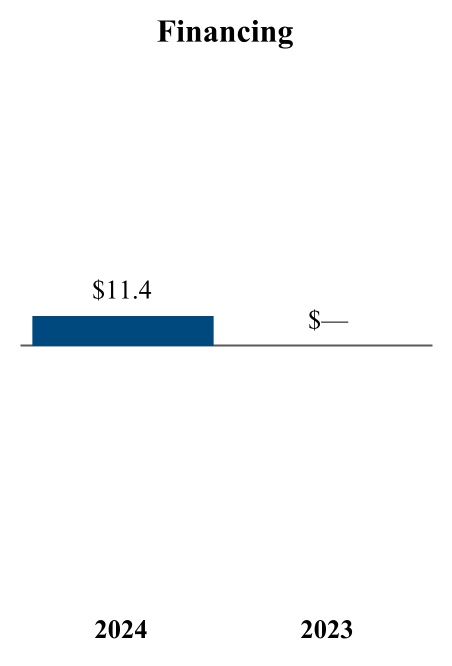
| Net cash used in financing activities | | $ | — | | | $ | (21,685) | |
| Increase in cash, cash equivalents and restricted cash, including cash classified as assets held for disposal | | (206,343) | | | 71,868 | |
| Cash, cash equivalents and restricted cash at beginning of period | | 283,611 | | | 245,278 | |
| | | Proceeds from issuance of common stock | |
| | Proceeds from issuance of common stock | |
| | Proceeds from issuance of common stock | |
| Net cash provided by financing activities | |
| Increase (decrease) in cash, cash equivalents and restricted cash, including cash classified as assets held for disposal | |
| Cash, cash equivalents and restricted cash at beginning of period | |
| Cash, cash equivalents and restricted at end of period | Cash, cash equivalents and restricted at end of period | | $ | 77,268 | | | $ | 317,146 | |
| Supplemental Cash Flows Information | Supplemental Cash Flows Information | | | | |
| Interest paid | Interest paid | | $ | 5,438 | | | $ | 4,771 | |
| Income taxes paid | | $ | 614 | | | $ | 644 | |
| | Interest paid | |
| Interest paid | |
| Income taxes paid (refunded) | |
See accompanying Notes to Unaudited Condensed Consolidated Financial Statements.
AMERICAN COASTAL INSURANCE CORPORATION
Notes to Unaudited Condensed Consolidated Financial Statements
June 30, 2023March 31, 2024
1) ORGANIZATION, CONSOLIDATION AND PRESENTATION
(a)Business
American Coastal Insurance Corporation (referred to in this document as we, our, us, the Company or ACIC) is a property and casualty insurance holding company that sources, writes and services residential commercial and personal property and casualty insurance policies using a network of agents and two wholly-owned insurance subsidiaries. On July 10, 2023, we changed our corporate name from United Insurance Holdings Corp. to American Coastal Insurance Corporation. Our two insurance subsidiaries are Interboro Insurance Company (IIC), acquired via mergeracquisition on April 29, 2016; and American Coastal Insurance Company (AmCoastal), acquired via merger on April 3, 2017.
Our other subsidiaries include United Insurance Management, L.C. (UIM), a managing general agent; Skyway Claims Services, LLC (SCS), which provides claims adjusting services to AmCoastal;our insurance companies; AmCo Holding Company, LLC (AmCo) which is a holding company subsidiary that consolidates its respective insurance company; BlueLine Cayman Holdings (BlueLine), which reinsures portfolios of excess and surplus policies; UPC Re, which provides a portion of the reinsurance protection purchased by our insurance subsidiaries when needed; Skyway Reinsurance Services, LLC, which provides reinsurance brokerage services for our insurance companies; Skyway Legal Services, LLC (SLS), which provides claims litigation services to our insurance companies; and Skyway Technologies,Underwriters, LLC, (SCS), a managing general agent that provides technological and distribution services to our insurance companies.
Our primary products are commercial and homeowners' residential property insurance. We currently offer commercial residential insurance in Florida. During 2022, we also wrote commercial residential insurance in South CarolinaFlorida and Texas, however, effective May 1, 2022, we no longer write in these states. In addition, we write personal residential insurance in New York. During 2022, we wroteWe conduct our operations under two reportable segments, commercial residential property and casualty insurance policies (commercial lines) and personal residential business in six other states; however onproperty and casualty insurance policies (personal lines). Our chief operating decision maker is our President, who makes decisions to allocate resources and assesses performance at both segment levels, as well as at the corporate level.
On February 27, 2023, our former insurance subsidiary, United Property & Casualty Insurance Company (UPC) was placed into receivership with the Florida Department of Financial Services (DFS), which divested our ownership of UPC. The events leading to receivership and results of this subsidiary, now included within discontinued operations, are discussed in Note 3 below.
On August 25, 2022, we announced that our former subsidiary UPC had filed plans for withdrawal in the states of Florida, Louisiana, and Texas and intended to file a plan for withdrawal in the state of New York. All filed plans entail non-renewing personal lines policies in these states. Additionally, we announced that Demotech, Inc. (Demotech), an insurance rating agency, notified UPC of its intent to withdraw UPC's Financial Stability Rating. On December 5, 2022, the Florida Office of Insurance Regulation ("FLOIR") issued Consent Order No. 303643-22- CO that provided for the administrative supervision and approval of the plan of run-off for UPC (the "Consent Order"). The Consent Order provided formal approval of UPC's Plan of Run-Off (the "Plan") to facilitate a solvent wind down of its affairs in an orderly fashion. Additionally, in connection with the Plan, IIC agreed to not pay ordinary dividends without the prior approval of the New York Department of Financial Services until January 1, 2025. On February 10, 2023, we announced that a solvent run-off of UPC was unlikely and on February 27, 2023, UPC was placed into receivership with the Florida Department of Financial Services (the "DFS") which divested our ownership of UPC.
Effective June 1, 2022, we merged our majority-owned insurance subsidiary, Journey Insurance Company (JIC) into AmCoastal, with AmCoastal being the surviving entity. JIC was formed in strategic partnership with a subsidiary of Tokio Marine Kiln Group Limited (Kiln) on August 30, 2018 and operated independently from AmCoastal prior to the merging of the entities. The Kiln subsidiary held a noncontrolling interest in JIC, which was terminated prior to the merger.
Effective June 1, 2022, we entered into a quota share reinsurance agreement with TypTap Insurance Company (Typtap). Under the terms of this agreement, we ceded 100% of our former subsidiary UPC's in-force, new, and renewal policies in the states of Georgia, North Carolina and South Carolina. Effective June 1, 2022, we began the transition of South Carolina policies to Homeowners Choice Property and Casualty Insurance Company, Inc. (HCPCI) in connection with our renewal rights agreement. Effective October 1, 2022, we transitioned Georgia policies to HCPCI in connection with our renewal rights agreement. Effective December 1, 2022, we began the transition of North Carolina policies to HCPCI in connection with our renewal rights agreement. As a result, these policies will no longer be covered under this agreement upon their renewal. This agreement replaces the 85% quota share agreement with HCPCI effective December 31, 2021.
Effective May 31, 2022, we merged Family Security Insurance Company, Inc. (FSIC) into our former subsidiary UPC, with UPC being the surviving entity. FSIC was acquired via merger on February 3, 2015, and operated independently from
AMERICAN COASTAL INSURANCE CORPORATION
Notes to Unaudited Condensed Consolidated Financial Statements
June 30, 2023
UPC prior to the merging of the entities. In conjunction with the merger, we dissolved Family Security Holdings (FSH), a holding company subsidiary that consolidated its respective insurance company, FSIC.
Effective June 1, 2021, we entered into a quota share reinsurance agreement with HCPCI and TypTap. Under the terms of this agreement, we ceded 100% of our former subsidiary UPC's in-force, new, and renewal policies in the states of Connecticut, New Jersey, Massachusetts, and Rhode Island. The cession of these policies was 50% to HCPCI and 50% to TypTap. HCPCI is responsible for processing all claims as a part of this agreement. As of April 1, 2022, we completed the transition of all policies in these four states to HCPCI in connection with our renewal rights agreement (Northeast Renewal Agreement) to sell UPC's personal lines homeowners business in these states.
We conduct our operations under two reportable segments, commercial residential property and casualty insurance policies (commercial lines) and personal residential property and casualty insurance policies (personal lines). Our chief operating decision maker is our President, who makes decisions to allocate resources and assesses performance at both segment levels, as well as at the corporate level.
(b)Consolidation and Presentation
We prepare our unaudited condensed consolidated interim financial statements in conformity with U.S. generally accepted accounting principles (GAAP). We have condensed or omitted certain information and footnote disclosures normally included in the annual consolidated financial statements presented in accordance with GAAP. In management's opinion, the accompanying unaudited condensed consolidated financial statements reflect all adjustments, including normal recurring items, considered necessary for a fair presentation of interim periods. We include all of our subsidiaries in our consolidated financial statements, eliminating intercompany balances and transactions during consolidation. As described in Note 23, our former subsidiary, UPC, and activities related directly to supporting the business conducted by UPC qualifyqualified as discontinued operations. Our unaudited condensed consolidated interim financial statements and footnotes should be read in conjunction with our consolidated financial statements and footnotes in our Annual Report on Form 10-K for the year ended December 31, 2022.2023.
While preparing our unaudited condensed consolidated financial statements, we make estimates and assumptions that affect the reported amounts of assets and liabilities and disclosures of contingent assets and liabilities at the date of the unaudited condensed consolidated financial statements, as well as reported amounts of revenues and expenses during the reporting period. Accordingly, actual results could differ from those estimates. Reported amounts that require us to make extensive use of estimates include our reserves for unpaid losses and loss adjustment expenses, investments and goodwill. Except for the captions on our Unaudited Condensed Consolidated Balance Sheets and Unaudited Condensed Consolidated Statements of Comprehensive Loss,Income, we generally use the term loss(es) to collectively refer to both loss and loss adjustment expenses.
Our results of operations and our cash flows as of the end of the interim periods reported herein do not necessarily indicate our results for the remainder of the year or for any other future period.
(c) Going Concern
Our unaudited condensed consolidated interim financial statements have been prepared in accordance with GAAP assuming the Company will continue as a going concern. As disclosed in our Annual Report on Form 10-K for the year ended December 31, 2022, our subsidiary AmCoastal is a part of a combined reinsurance program with our former subsidiary, UPC.
To properly allocate the reinsurance recoverables under the shared catastrophe treaties, UPC and AmCoastal entered into a reinsurance allocation agreement that became effective on June 1, 2022 (the "Allocation Agreement"). The Allocation Agreement was filed with and approved by the FLOIR on December 5, 2022. On February 10, 2023, we announced that a solvent run-off of UPC was unlikely, driven by Hurricane Ian losses which exhausted UPC's reinsurance coverage. On February 27, 2023, UPC was placed into receivership with the DFS which divested our ownership of UPC. As of the date of filing our Annual Report, the DFS had not recognized the Allocation Agreement, leaving uncertainty regarding the timing of both recoveries currently held by UPC that are allocated to AmCoastal and future recoverables. Management also believed that the ability for AmCoastal to obtain adequate reinsurance to meet its needs for the June 1, 2023 to May 31, 2024 catastrophe cover could only be accomplished assuming that recoveries due to AmCoastal pursuant to the Allocation Agreement could be resolved in short order.
However, on April 19, 2023, AmCoastal entered into a Memorandum of Understanding with the DFS. Under the terms of the Memorandum, AmCoastal and the DFS as receiver of UPC have reached the following agreement:
AMERICAN COASTAL INSURANCE CORPORATION
Notes to Unaudited Condensed Consolidated Financial Statements
June 30, 2023
1.The DFS adopts, ratifies and affirms the Allocation Agreement.
2.All future reinsurance recoverable under reinsurance agreements applicable to the Allocation Agreement for Hurricane Ian losses shall be paid, either directly from the reinsurers or directly from the reinsurance intermediary responsible therefor, to AmCoastal. If a true up adjustment demonstrates that any future reinsurance recoveries were over-collected by AmCoastal, AmCoastal will remit any over-payment to UPC.
On May 15, 2023, the Company, together with it's subsidiary, AmCoastal, entered into a Tax Memorandum of Understanding (the "Tax Memorandum") with the DFS as receiver of the Company's former subsidiary, UPC. On February 27, 2023, UPC entered into receivership with the DFS as receiver. As of March 31, 2023, in accordance with the various reinsurance allocation agreements including the Allocation Agreement described above, the Company is due approximately $38,352,000 of net reinsurance recoveries received by UPC on behalf of the Company but not settled prior to receivership. In addition, in April ACIC paid reinsurance premiums on behalf of UPC totaling $12,929,000. The Company and the DFS believe that an opportunity exists to settle these balances via the realization of certain deferred tax assets of the Company's consolidated Federal and Florida tax returns to which ACIC and UPC belong. UPC holds certain deferred tax assets that are believed to be on no value to UPC on a stand-alone basis. However, AmCoastal and the Company have the opportunity, subject to certain conditions such as continuing and adequate profitability, to realize these assets. Under the terms of the Tax Memorandum, the Company, AmCoastal and the DFS as receiver of UPC have reached the following agreement:2024
1.The parties agree to cooperate with one another to achieve realization of the deferred tax assets;
2.The parties agree to deposit the funds that are or may be due to UPC pursuant to the Tax Allocation Agreement into a segregated account (the "DTA Account") held by AmCoastal that will serve as collateral for any amount payable from or to UPC;
3.The parties agree that the Federal Income Tax Allocation Agreement entered into prior to UPC’s receivership is ratified and accepted by all parties;
4.The parties agree to an annual “true up” of the allocation of the disputed recoveries to the extent that such recoveries were not allocated correctly according to the Reinsurance Allocation Agreement;
5.In the event that AmCoastal, ACIC, or any of their affiliates make a claim or file a proof of claim in the UPC estate, the reviewed, approved, and/or adjudicated claim shall be reduced by the amount of (a) any tax benefit collectively received by AmCoastal, ACIC, or any of their affiliates as well as (b) any money withdrawn from the DTA Account for the benefit of any entity other than UPC; and
6.In the event that the benefit received by the Company is greater than the disputed recoveries, the difference shall be paid to DFS as receiver of UPC.
The Tax Memorandum allows the Company to secure amounts due from UPC to AmCoastal provided the Internal Revenue Service does not object to the Company utilizing UPC's net operating loss carry-forward against its future taxable income. We believe probability of the Internal Revenue Service (IRS) allowing the Company to utilize UPC's net operating losses is more likely than not based on other entities having successfully accomplished this and prior permission or approval from the IRS not being required.
The execution of these MOUs prior to June 30, 2023 alleviate the uncertainty regarding future recoverables, and recoveries currently held by UPC. In addition, as of March 31, 2023, the Company had not finalized its catastrophe cover for June 1, 2023 to May 31, 2024. However, as of June 30, 2023, the Company has finalized this cover, alleviating the uncertainty of this placement. As a result, the Company has concluded substantial doubt no longer exists regarding its ability to continue as a going concern.
2) SIGNIFICANT ACCOUNTING POLICIES
(a) Income Taxes
In June 2022, we assessed our deferred tax position and believed it was more likely than not that the benefit from certain net operating loss (NOL) carryforwards, net capital operating loss carryforwards and other net deferred tax assets would not be realized. In recognition of this risk, we recorded a valuation allowance against these deferred tax assets as of June 30, 2022. During the second quarter of 2023, we evaluated our position based on the results of our continuing operations and determined that it is more likely than not that we will be able to realize the benefit from these NOL carryforwards and other net deferred tax assets. Accordingly, we have reversed the valuation allowance on these deferred tax assets, totaling $2,223,000.
AMERICAN COASTAL INSURANCE CORPORATION
Notes to Unaudited Condensed Consolidated Financial Statements
June 30, 2023
On May 15, we entered into the Tax Memorandum with DFS, as described in Note 1 above. As a result of this Memorandum, any benefit received from the use of UPC's net operating losses are due to to the DFS as receiver of UPC. The expense related to this remittance is presented within our provision for income taxes on our Unaudited Condensed Consolidated Statements of Comprehensive Income (Loss), offsetting the tax benefit recognized.
(b) Changes to Significant Accounting Policies
During the three months ended March 31, 2023, our former subsidiary, UPC, was placed into receivership with the DFS. As described in Note 1, effective February 27, 2023, this receivership divested our ownership of UPC. This disposal, as well as the activities related directly to supporting the business conducted by UPC were evaluated for qualification as discontinued operations. The results of operations of business are reported as discontinued operations when the disposal represents a strategic shift that will have a major effect on the entity's operations and financial results. When a business is identified for discontinued operations reporting:
•Results for prior periods are retroactively reclassified as discontinued operations;
•Results of operations are reported in a single line, net of tax, in the Unaudited Condensed Consolidated Statements of Comprehensive Income (Loss); and
•Assets and liabilities are reported as held for disposal in the Unaudited Condensed Consolidated Balance Sheets
Additional details by major classification of operating results and financial position are included in Note 3.
There have been no other changes to our significant accounting policies as reported in our Annual Report on Form 10-K for the year ended December 31, 2022.2023.
(c)(b) Pending Accounting Pronouncements
In November 2023, the FASB issued ASU No. 2023-07, Segment Reporting (Topic 280) Improvements to Reportable Segments Disclosures. This update requires the disclosure of significant segment expenses that are part of an entity’s segment measure of profit or loss and regularly provided to the chief operating decision maker. In addition, it adds or makes clarifications to other segment-related disclosures, such as clarifying that the disclosure requirements in ASC 280 are required for entities with a single reportable segment and that an entity may disclose multiple measures of segment profit and loss. ASU 2023-07 is effective for fiscal years beginning after December 15, 2023 and interim periods beginning after December 15, 2024, with early adoption permitted. We have evaluated pending accounting pronouncements and do not believe any would haveintend to elect to early adopt and are assessing the impact of adopting this new accounting standard on our consolidated financial statements and related disclosures.
In December 2023, the FASB issued ASU No. 2023-09, Income Taxes (Topic 740) Improvements to Income Tax Disclosures. This update amends the Codification to enhance the transparency and decision usefulness of income tax disclosures. This ASU requires additional disaggregation of the reconciliation between the statutory and effective tax rate for an entity and of income taxes paid, both of which are disclosures required by current GAAP. The amendments improve the transparency of income tax disclosures by requiring (1) consistent categories and greater disaggregation of information in the rate reconciliation and (2) income taxes paid disaggregated by jurisdiction. ASU 2023-09 is effective for annual periods beginning after December 15, 2024, with early adoption permitted. We do not intend to elect to early adopt and are assessing the impact of adopting this new accounting standard on the operations orour consolidated financial reporting of our company.statements and related disclosures.
3) DISCONTINUED OPERATIONS
On August 25, 2022, we announced that our former subsidiary UPC had filed plans for withdrawal in the states of Florida, Louisiana, and Texas and intended to file a plan for withdrawal in the state of New York. All filed plans entailed non-renewing personal lines policies in these states. Additionally, we announced that Demotech, an insurance rating agency, notified UPC of its intent to withdraw UPC's Financial Stability Rating. On December 5, 2022, the FLOIR issued Consent Order No. 303643-22- CO that provided for the administrative supervision and approval of the plan of run-off for UPC (the "Consent Order"). The Consent Order provided formal approval of UPC's Plan of Run-Off (the "Plan") to facilitate a solvent wind down of its affairs in an orderly fashion. On February 10, 2023, we announced that a solvent run-off of UPC was unlikely, driven by Hurricane Ian losses which exhausted UPC's reinsurance coverage. On February 27, 2023, UPC was placed into receivership with the DFS which divested our ownership of UPC.
In the first quarter of 2023, the assets and liabilities of UPC were divested. In addition, activities provided by our entities, SCS, SLS and UIM, related directly to supporting the business conducted by UPC have been included. The remaining assets and liabilities for the balance sheet as of December 31, 20222023 are reclassifiedpresented as held for disposal, retrospectively, and the results of UPC and activities related directly to supporting the business conducted by UPC are presented as discontinued operations for all periods presented.
AMERICAN COASTAL INSURANCE CORPORATION
Notes to Unaudited Condensed Consolidated Financial Statements
June 30, 2023March 31, 2024
The results from discontinued operations for the three and six months ended June 30,March 31, 2024 and 2023 and 2022 are presented below.
| | Results From Discontinued Operations | Results From Discontinued Operations | |
| Three Months Ended
June 30, | | Six Months Ended
June 30, |
| 2023 | | 2022 | | 2023 | | 2022 |
| Results From Discontinued Operations | |
| Results From Discontinued Operations | |
| | | | Three Months Ended March 31, | |
| | | | Three Months Ended March 31, | |
| | | | Three Months Ended March 31, | |
| | | | | | 2024 | | | | | | | | 2024 | | 2023 |
| REVENUE: | REVENUE: | | | | | | | | |
| Gross premiums written | |
| Gross premiums written | |
| Gross premiums written | Gross premiums written | | $ | — | | | $ | 174,094 | | | $ | (120,608) | | | $ | 320,922 | |
| Change in gross unearned premiums | Change in gross unearned premiums | | — | | | 13,243 | | | 198,154 | | | 72,969 | |
| Gross premiums earned | Gross premiums earned | | — | | | 187,337 | | | 77,546 | | | 393,891 | |
| Ceded premiums earned | Ceded premiums earned | | — | | | (140,463) | | | (48,203) | | | (303,906) | |
| Net premiums earned | Net premiums earned | | — | | | 46,874 | | | 29,343 | | | 89,985 | |
| Net investment income | Net investment income | | — | | | 1,301 | | | 2,182 | | | 2,375 | |
| Net realized investment gains (losses) | | — | | | (1) | | | 1,343 | | | (1,807) | |
| Net unrealized gains (losses) on equity securities | | — | | | (2,693) | | | 2,080 | | | (4,191) | |
| Net realized investment gains | |
| Net unrealized gains on equity securities | |
| Other revenue | Other revenue | | — | | | 6,411 | | | 2,717 | | | 9,474 | |
| Total revenue | Total revenue | | — | | | 51,892 | | | 37,665 | | | 95,836 | |
| EXPENSES: | EXPENSES: | |
| Losses and loss adjustment expenses | |
| Losses and loss adjustment expenses | |
| Losses and loss adjustment expenses | Losses and loss adjustment expenses | | 1,191 | | | 76,051 | | | 36,417 | | | 141,115 | |
| Policy acquisition costs | Policy acquisition costs | | (170) | | | 5,418 | | | (1,522) | | | 11,126 | |
| Operating expenses | Operating expenses | | 507 | | | 9,199 | | | 4,503 | | | 17,740 | |
| General and administrative expenses | General and administrative expenses | | 1,275 | | | 6,286 | | | 2,559 | | | 14,227 | |
| Interest expense | Interest expense | | — | | | 31 | | | 22 | | | 50 | |
| Total expenses | Total expenses | | 2,803 | | | 96,985 | | | 41,979 | | | 184,258 | |
| Loss before other income | Loss before other income | | (2,803) | | | (45,093) | | | (4,314) | | | (88,422) | |
| Other income (loss) | | — | | | 13 | | | — | | | 23 | |
| Other income | |
| Loss before income taxes | Loss before income taxes | | (2,803) | | | (45,080) | | | (4,314) | | | (88,399) | |
| Provision (benefit) for income taxes | Provision (benefit) for income taxes | | (230) | | | 10,664 | | | (214) | | | 329 | |
| Income (loss) from discontinued operations, net of tax | | $ | (2,573) | | | $ | (55,744) | | | $ | (4,100) | | | $ | (88,728) | |
| Loss from discontinued operations, net of tax | |
As of February 28, 2023, the Company completed the disposal of its former subsidiary, UPC. This divestiture resulted in a gain of $238,440,000 for the three months ended March 31, 2023. This gain was driven by the negative equity position of UPC.
AMERICAN COASTAL INSURANCE CORPORATION
NotesUPC prior to Unaudited Condensed Consolidated Financial Statements
June 30, 2023
the divestiture.
AMERICAN COASTAL INSURANCE CORPORATION
Notes to Unaudited Condensed Consolidated Financial Statements
March 31, 2024
The major classes of assets and liabilities transferred as a result of the transaction as of the date of transfer and December 31, 2022 are presented below.
| | | | | | | | | | | | | | |
| Major Classes of Assets and Liabilities Disposed | | | | |
| | Closing (1) | | December 31, 2022 |
| ASSETS | | | | |
| Fixed maturities, available-for-sale | | $ | 1,380 | | | $ | 171,781 | |
| Equity securities | | 272 | | | 23,363 | |
| Other investments | | 12,882 | | | 12,952 | |
| Cash and cash equivalents | | 224,824 | | | 158,990 | |
| Restricted cash | | 7,758 | | | 7,730 | |
| Accrued investment income | | 875 | | | 1,457 | |
| Premiums receivable, net | | 22,733 | | | 46,736 | |
| Reinsurance recoverable on paid and unpaid losses, net | | 548,929 | | | 834,863 | |
| Ceded unearned premiums | | 75,262 | | | 122,533 | |
| Deferred policy acquisition costs, net | | (89) | | | (2,046) | |
| Other assets | | 53,675 | | | 33,548 | |
| Total assets | | $ | 948,501 | | | $ | 1,411,907 | |
| | | | |
| LIABILITIES | | | | |
| Unpaid losses and loss adjustment expenses | | 920,431 | | | 1,103,980 | |
| Unearned premiums | | 98,655 | | | 286,842 | |
| Reinsurance payable on premiums | | 12,612 | | | 29,394 | |
| Payments outstanding | | 144,238 | | | 213,058 | |
| Accounts payable and accrued expenses | | 1,361 | | | (872) | |
| Other liabilities | | 3,476 | | | 14,658 | |
| Notes payable, net | | 4,118 | | | 4,118 | |
| Total Liabilities | | $ | 1,184,891 | | | $ | 1,651,178 | |
| | | | | | | | | | |
| Major Classes of Assets and Liabilities Disposed | | | | |
| | Closing (1) | | |
| ASSETS | | | | |
| Fixed maturities, available-for-sale | | $ | 1,380 | | | |
| Equity securities | | 272 | | | |
| Other investments | | 12,882 | | | |
| Cash and cash equivalents | | 224,824 | | | |
| Restricted cash | | 7,758 | | | |
| Accrued investment income | | 875 | | | |
| Premiums receivable, net | | 22,733 | | | |
| Reinsurance recoverable on paid and unpaid losses, net | | 548,929 | | | |
| Ceded unearned premiums | | 75,262 | | | |
| Deferred policy acquisition costs, net | | (89) | | | |
| Other assets | | 51,625 | | | |
| Total assets | | $ | 946,451 | | | |
| | | | |
| LIABILITIES | | | | |
| Unpaid losses and loss adjustment expenses | | $ | 920,431 | | | |
| Unearned premiums | | 98,655 | | | |
| Reinsurance payable on premiums | | 12,612 | | | |
| Payments outstanding | | 144,238 | | | |
| Accounts payable and accrued expenses | | 1,361 | | | |
| Other liabilities | | 3,476 | | | |
| Notes payable, net | | 4,118 | | | |
| Total Liabilities | | $ | 1,184,891 | | | |
(1) The Company divested its ownership on February 27, 2023, the date the DFS was appointed as receiver of the entity.
In addition,During the major classesfirst quarter of assets2024, due to a change in circumstances, the Company evaluated its capitalized software, previously classified as held for disposal at December 31, 2023. As a result of this evaluation, it was determined that the use case of the software by the Company has shifted. The Company has reclassified this asset and liabilities remaining related to activities directly supporting the business conducted by UPC are outlinedassociated amortization expense in the table below ascurrent period presented within this footnote in accordance with GAAP guidance, resulting in amortization expense for the capitalized software being captured in continuing operations prospectively. Property & equipment of June 30, 2023 and$8,095,000 at December 31, 2022.
AMERICAN COASTAL INSURANCE CORPORATION
Notes to Unaudited Condensed Consolidated Financial Statements
June 30, 2023
| | | | | | | | | | | | | | |
| Major Classes of Assets and Liabilities Held for Disposal | | | | |
| | June 30, 2023 | | December 31, 2022 |
| ASSETS | | | | |
| Property and equipment, net | | 12,105 | | | 14,299 | |
| Deferred policy acquisition costs | | — | | | 8,609 | |
| Total assets | | $ | 12,105 | | | $ | 22,908 | |
| | | | |
| LIABILITIES | | | | |
| Commissions Payable | | 1,795 | | | 987 | |
| Unearned Policy Fees | | — | | | 2,652 | |
| Total Liabilities | | $ | 1,795 | | | $ | 3,639 | |
The discontinued operationsAs a result of the reclassification in the first quarter of 2024, described above, the Company incurred $488,000 and $748,000held no assets or liabilities for disposal at March 31, 2024. At December 31, 2023, assets held for disposal consisted of amortization expense during the six months ended June 30, 2023 and 2022, respectively.property & equipment totaling $8,095,000. There were no liabilities held for disposal at December 31, 2023. In addition, other noncashthan the item related to capitalized software noted above, there were no non-cash transactions for either period.during the three months ended March 31, 2024. During the three months ended March 31, 2023, amortization attributed to discontinued operations totaled $252,000.
4) SEGMENT REPORTING
Personal Lines Business
Our personal lines business provides structure, content and liability coverage for standard single-family homeowners, renters and condominium unit owners, through our subsidiary IIC. Personal residential products are offered in New York. We include coverage to policyholders for loss or damage to dwellings, detached structures or equipment caused by covered causes of loss such as fire, wind, hail, water, theft and vandalism.
We have developed a unique and proprietary homeowners’ product. This product uses a granular approach to pricing for catastrophe perils. We have focused on using independent agencies as a channel of distribution for our personal lines business. All of our personal lines business is managed internally.
Commercial Lines Business
AMERICAN COASTAL INSURANCE CORPORATION
Notes to Unaudited Condensed Consolidated Financial Statements
March 31, 2024
Our commercial lines business primarily provides commercial multi-peril property insurance for residential condominium associations and apartments in Florida, through our subsidiary AmCoastal. We include coverage to policyholders for loss or damage to buildings, inventory or equipment caused by covered causes of loss such as fire, wind, hail, water, theft and vandalism. We also wrote commercial residential coverage through our subsidiary JIC, in South Carolina and Texas. Effective June 1, 2022, JIC was merged into AmCoastal, with AmCoastal being the surviving entity. As a result, the commercial residential policies originally written by JIC were not renewed effective May 31, 2022.
All of our commercial lines business is administered by an outside managing general underwriter, AmRisc, LLC (AmRisc).AmRisc. This includes handling the underwriting, claims processing and premium collection related to our commercial business. In return, AmRisc is reimbursed through monthly management fees. International Catastrophe Insurance Managers (ICAT) handled the underwriting
Personal Lines Business
Our personal lines business provides structure, content and premium collectionliability coverage for JIC’s commercial business writtenstandard single-family homeowners, renters and condominium unit owners, through our subsidiary IIC. Personal residential products are offered in South CarolinaNew York. We include coverage to policyholders for loss or damage to dwellings, detached structures or equipment caused by covered causes of loss such as fire, wind, hail, water, theft and Texas and was also reimbursed through monthly management fees. Effective May 31, 2022, the Company terminated its agreement with ICAT.vandalism.
Please note the following similarities pertaining to the accounting and transactions of our operating segments for the three and six months ended June 30, 2023March 31, 2024 and 2022:2023:
•Both operating segments follow the accounting policies as reported in our Annual Report on Form 10-K for the year ended December 31, 2022;2023;
•Neither operating segment experienced significant noncashnon-cash transactions outside of depreciation and amortization for the three and six months ended June 30, 2023March 31, 2024 and 2022.2023.
The tables below present the information for each of the reportable segment's profit or loss for the three months ended March 31, 2024 and 2023.
AMERICAN COASTAL INSURANCE CORPORATION
Notes to Unaudited Condensed Consolidated Financial Statements
June 30, 2023March 31, 2024
The tables below present the information for each of the reportable segment's profit or loss, as well as segment assets for the three and six months ended June 30, 2023 and 2022. We have restated our segments to reflect the discontinued operations disclosed in Note 3, excluding the result of the entity for all periods presented.
| | Three Months Ended June 30, 2023 |
| Commercial | | Personal (1) | | Adjustments | | Consolidated |
| | Three Months Ended March 31, 2024 | | | | Three Months Ended March 31, 2024 |
| | Commercial | | | | Commercial | | Personal (1) | | Adjustments | | Consolidated |
| REVENUE: | REVENUE: | | | | | | | | |
| Gross premiums written | |
| Gross premiums written | |
| Gross premiums written | Gross premiums written | | $ | 236,822 | | | $ | 7,063 | | | $ | — | | | $ | 243,885 | |
| Change in gross unearned premiums | Change in gross unearned premiums | | (91,011) | | | 5,325 | | | — | | | (85,686) | |
| Gross premiums earned | Gross premiums earned | | 145,811 | | | 12,388 | | | — | | | 158,199 | |
| Ceded premiums earned | Ceded premiums earned | | (71,825) | | | (3,205) | | | — | | | (75,030) | |
| Net premiums earned | Net premiums earned | | 73,986 | | | 9,183 | | | — | | | 83,169 | |
| Net investment income | Net investment income | | 1,866 | | | 804 | | | 22 | | | 2,692 | |
| Net realized gains (losses) | | (6,708) | | | (17) | | | — | | | (6,725) | |
| Net realized investment losses | |
| Net unrealized losses on equity securities | Net unrealized losses on equity securities | | 140 | | | — | | | 1 | | | 141 | |
| | Other revenue | |
| Other revenue | |
| Other revenue | Other revenue | | — | | | 18 | | | — | | | 18 | |
| Total revenues | Total revenues | | 69,284 | | | 9,988 | | | 23 | | | 79,295 | |
| EXPENSES: | EXPENSES: | |
| Losses and loss adjustment expenses | Losses and loss adjustment expenses | | 16,245 | | | 4,670 | | | — | | | 20,915 | |
| Losses and loss adjustment expenses | |
| Losses and loss adjustment expenses | |
| Policy acquisition costs | Policy acquisition costs | | 23,526 | | | 2,019 | | | — | | | 25,545 | |
| Operating expenses | Operating expenses | | 1,501 | | | 1,669 | | | 104 | | | 3,274 | |
General and administrative expenses (2) | | 2,631 | | | 3,772 | | | 180 | | | 6,583 | |
| General and administrative expenses | |
| Interest expense | Interest expense | | — | | | — | | | 2,719 | | | 2,719 | |
| Total expenses | Total expenses | | 43,903 | | | 12,130 | | | 3,003 | | | 59,036 | |
| Income (loss) before other income | Income (loss) before other income | | 25,381 | | | (2,142) | | | (2,980) | | | 20,259 | |
| Other income (loss) | Other income (loss) | | — | | | 806 | | | — | | | 806 | |
| Income (loss) before income taxes | Income (loss) before income taxes | | $ | 25,381 | | | $ | (1,336) | | | (2,980) | | | 21,065 | |
| Provision for income taxes | Provision for income taxes | | | | | | 713 | | | 713 | |
| Net income (loss) | Net income (loss) | | $ | (3,693) | | | $ | 20,352 | |
| Less: Net loss attributable to noncontrolling interests | | — | | | — | |
| Net income (loss) attributable to ACIC | | $ | (3,693) | | | $ | 20,352 | |
| Loss ratio, net (3) (4) | | 22.0 | % | | 50.9 | % | | 25.1 | % |
Expense ratio (3) (5) | | 37.4 | % | | 81.2 | % | | 42.6 | % |
Combined ratio (3) (6) | | 59.4 | % | | 132.1 | % | | 67.7 | % |
| | Total segment assets | | $ | 1,612,469 | | | $ | (233,324) | | | $ | 53,605 | | | $ | 1,432,750 | |
| Loss ratio, net (2) (3) | |
| Loss ratio, net (2) (3) | |
| Loss ratio, net (2) (3) | | | 18.4 | % | | 71.4 | % | | | | 23.1 | % |
Expense ratio (2) (4) | | Expense ratio (2) (4) | | 34.6 | % | | 36.7 | % | | | | 35.2 | % |
Combined ratio (2) (5) | | Combined ratio (2) (5) | | 53.0 | % | | 108.1 | % | | | | 58.3 | % |
(1) Our personal lines income statement also includes amounts related to subsidiaries outside of our insurance companies. We have included these items as these subsidiaries directly support our personal lines operations.
(2) Included in our General and Administrative expenses is $996,000 and $811,000 of depreciation and amortization expense related to our personal and commercial lines assets, respectively.
(3) As these are calculated ratios, the addition of the ratios will not result in the same value as the consolidated ratio. To calculate the consolidated ratio please see the corresponding footnote below.
(4)(3) Loss ratio, net is calculated as losses and LAE net of losses ceded to reinsurers, relative to net premiums earned. Management uses this operating metric to analyze our loss trends and believes it is useful for investors to evaluate this component separately from our other operating expenses.
(5)(4) Expense ratio is calculated as the sum of all operating expenses less interest expense relative to net premiums earned. Management uses this operating metric to analyze our expense trends and believes it is useful for investors to evaluate these components separately from our loss expenses.
(6)(5) Combined ratio is the sum of the loss ratio, net and expense ratio. Management uses this operating metric to analyze our total expense trends and believes it is a key indicator for investors when evaluating the overall profitability of our business.
AMERICAN COASTAL INSURANCE CORPORATION
Notes to Unaudited Condensed Consolidated Financial Statements
June 30, 2023March 31, 2024
| | Three Months Ended June 30, 2022 |
| Commercial | | Personal (1) | | Adjustments | | Consolidated |
| | Three Months Ended March 31, 2023 | | | | Three Months Ended March 31, 2023 |
| | Commercial | | | | Commercial | | Personal (1) | | Adjustments | | Consolidated |
| REVENUE: | REVENUE: | | | | | | | | |
| Gross premiums written | |
| Gross premiums written | |
| Gross premiums written | Gross premiums written | | $ | 181,067 | | | $ | 26,565 | | | $ | — | | | $ | 207,632 | |
| Change in gross unearned premiums | Change in gross unearned premiums | | (67,849) | | | (10,300) | | | — | | | (78,149) | |
| Gross premiums earned | Gross premiums earned | | 113,218 | | | 16,265 | | | — | | | 129,483 | |
| Ceded premiums earned | Ceded premiums earned | | (61,771) | | | (3,180) | | | — | | | (64,951) | |
| Net premiums earned | Net premiums earned | | 51,447 | | | 13,085 | | | — | | | 64,532 | |
| Net investment income | Net investment income | | 1,476 | | | 353 | | | 10 | | | 1,839 | |
| Net realized gains (losses) | | (79) | | | 2 | | | — | | | (77) | |
| Net realized investment losses | |
| Net unrealized losses on equity securities | Net unrealized losses on equity securities | | (2,390) | | | — | | | (1) | | | (2,391) | |
| | Other revenue | |
| Other revenue | |
| Other revenue | Other revenue | | — | | | 7 | | | — | | | 7 | |
| Total revenues | Total revenues | | 50,454 | | | 13,447 | | | 9 | | | 63,910 | |
| EXPENSES: | EXPENSES: | |
| Losses and loss adjustment expenses | Losses and loss adjustment expenses | | 8,194 | | | 5,838 | | | — | | | 14,032 | |
| Losses and loss adjustment expenses | |
| Losses and loss adjustment expenses | |
| Policy acquisition costs | Policy acquisition costs | | 19,928 | | | 3,642 | | | — | | | 23,570 | |
| Operating expenses | Operating expenses | | 1,127 | | | 2,606 | | | 87 | | | 3,820 | |
General and administrative expenses (2) | | 2,421 | | | 5,285 | | | 502 | | | 8,208 | |
| General and administrative expenses | |
| Interest expense | Interest expense | | — | | | — | | | 2,363 | | | 2,363 | |
| Total expenses | Total expenses | | 31,670 | | | 17,371 | | | 2,952 | | | 51,993 | |
| Income (loss) before other income | Income (loss) before other income | | 18,784 | | | (3,924) | | | (2,943) | | | 11,917 | |
| Other income (loss) | | 2 | | | 199 | | | 57 | | | 258 | |
| Other income | |
| Income (loss) before income taxes | Income (loss) before income taxes | | $ | 18,786 | | | $ | (3,725) | | | (2,886) | | | 12,175 | |
| Provision for income taxes | Provision for income taxes | | | | | | 25,486 | | | 25,486 | |
| Net income (loss) | Net income (loss) | | $ | (28,372) | | | $ | (13,311) | |
| Less: Net loss attributable to noncontrolling interests | | (26) | | | (26) | |
| Net income (loss) attributable to ACIC | | $ | (28,346) | | | $ | (13,285) | |
| Loss ratio, net (3) (4) | | 15.9 | % | | 44.6 | % | | 21.7 | % |
Expense ratio (3) (5) | | 45.6 | % | | 88.1 | % | | 55.2 | % |
Combined ratio (3) (6) | | 61.5 | % | | 132.7 | % | | 76.9 | % |
| | Total segment assets | | $ | 1,352,713 | | | $ | (471,806) | | | $ | 304,824 | | | $ | 1,185,731 | |
| Loss ratio, net (2) (3) | |
| Loss ratio, net (2) (3) | |
| Loss ratio, net (2) (3) | | | 17.7 | % | | 29.0 | % | | | | 18.9 | % |
Expense ratio (2) (4) | | Expense ratio (2) (4) | | 35.6 | % | | 111.5 | % | | | | 43.4 | % |
Combined ratio (2) (5) | | Combined ratio (2) (5) | | 53.3 | % | | 140.5 | % | | | | 62.3 | % |
(1) Our personal lines income statement also includes amounts related to subsidiaries outside of our insurance companies. We have included these items as these subsidiaries directly support our personal lines operations.
(2) Included in our General and Administrative expenses is $1,047,000 and $877,000 of depreciation and amortization expense related to our personal and commercial lines assets, respectively.
(3) As these are calculated ratios, the addition of the ratios will not result in the same value as the consolidated ratio. To calculate the consolidated ratio please see the corresponding footnote below.
(4) Loss ratio, net is calculated as losses and LAE net of losses ceded to reinsurers, relative to net premiums earned. Management uses this operating metric to analyze our loss trends and believes it is useful for investors to evaluate this component separately from our other operating expenses.
(5) Expense ratio is calculated as the sum of all operating expenses less interest expense relative to net premiums earned. Management uses this operating metric to analyze our expense trends and believes it is useful for investors to evaluate these components separately from our loss expenses.
(6) Combined ratio is the sum of the loss ratio, net and expense ratio. Management uses this operating metric to analyze our total expense trends and believes it is a key indicator for investors when evaluating the overall profitability of our business.
AMERICAN COASTAL INSURANCE CORPORATION
Notes to Unaudited Condensed Consolidated Financial Statements
June 30, 2023
| | | | | | | | | | | | | | | | | | | | | | | | | | |
| | Six Months Ended June 30, 2023 |
| | Commercial | | Personal (1) | | Adjustments | | Consolidated |
| REVENUE: | | | | | | | | |
| Gross premiums written | | $ | 413,463 | | | $ | 17,545 | | | $ | — | | | $ | 431,008 | |
| Change in gross unearned premiums | | (135,618) | | | 7,285 | | | — | | | (128,333) | |
| Gross premiums earned | | 277,845 | | | 24,830 | | | — | | | 302,675 | |
| Ceded premiums earned | | (125,199) | | | (6,983) | | | — | | | (132,182) | |
| Net premiums earned | | 152,646 | | | 17,847 | | | — | | | 170,493 | |
| Net investment income | | 3,652 | | | 1,586 | | | 43 | | | 5,281 | |
| Net realized gains (losses) | | (6,791) | | | (17) | | | — | | | (6,808) | |
| Net unrealized losses on equity securities | | 613 | | | — | | | 2 | | | 615 | |
| Management fee income | | — | | | — | | | — | | | — | |
| Other revenue | | — | | | 34 | | | — | | | 34 | |
| Total revenues | | 150,120 | | | 19,450 | | | 45 | | | 169,615 | |
| EXPENSES: | | | | | | | | |
| Losses and loss adjustment expenses | | 30,146 | | | 7,181 | | | — | | | 37,327 | |
| Policy acquisition costs | | 48,692 | | | 3,825 | | | — | | | 52,517 | |
| Operating expenses | | 1,597 | | | 3,617 | | | 228 | | | 5,442 | |
General and administrative expenses (2) | | 5,385 | | | 9,679 | | | 312 | | | 15,376 | |
| Interest expense | | — | | | — | | | 5,438 | | | 5,438 | |
| Total expenses | | 85,820 | | | 24,302 | | | 5,978 | | | 116,100 | |
| Income (loss) before other income | | 64,300 | | | (4,852) | | | (5,933) | | | 53,515 | |
| Other income (loss) | | — | | | 1,609 | | | (215) | | | 1,394 | |
| Income (loss) before income taxes | | $ | 64,300 | | | $ | (3,243) | | | (6,148) | | | 54,909 | |
| Provision for income taxes | | | | | | 4,190 | | | 4,190 | |
| Net income (loss) | | | | | | $ | (10,338) | | | $ | 50,719 | |
| Less: Net loss attributable to noncontrolling interests | | | | | | — | | | — | |
| Net income (loss) attributable to ACIC | | | | | | $ | (10,338) | | | $ | 50,719 | |
| | | | | | | | |
Loss ratio, net (3) (4) | | 19.7 | % | | 40.2 | % | | | | 21.9 | % |
Expense ratio (3) (5) | | 36.5 | % | | 95.9 | % | | | | 43.0 | % |
Combined ratio (3) (6) | | 56.2 | % | | 136.1 | % | | | | 64.9 | % |
| | | | | | | | |
| Total segment assets | | $ | 1,612,469 | | | $ | (233,324) | | | $ | 53,605 | | | $ | 1,432,750 | |
(1) Our personal lines income statement also includes amounts related to subsidiaries outside of our insurance companies. We have included these items as these subsidiaries directly support our personal lines operations.
(2) Included in our General and Administrative expenses is $2,003,000 and $1,623,000 of depreciation and amortization expense related to our personal and commercial lines assets, respectively.
(3)As these are calculated ratios, the addition of the ratios will not result in the same value as the consolidated ratio. To calculate the consolidated ratio please see the corresponding footnote below.
(4) Loss ratio, net is calculated as losses and LAE net of losses ceded to reinsurers, relative to net premiums earned. Management uses this operating metric to analyze our loss trends and believes it is useful for investors to evaluate this component separately from our other operating expenses.
(5) Expense ratio is calculated as the sum of all operating expenses less interest expense relative to net premiums earned. Management uses this operating metric to analyze our expense trends and believes it is useful for investors to evaluate these components separately from our loss expenses.
(6) Combined ratio is the sum of the loss ratio, net and expense ratio. Management uses this operating metric to analyze our total expense trends and believes it is a key indicator for investors when evaluating the overall profitability of our business.
AMERICAN COASTAL INSURANCE CORPORATION
Notes to Unaudited Condensed Consolidated Financial Statements
June 30, 2023
| | | | | | | | | | | | | | | | | | | | | | | | | | |
| | Six Months Ended June 30, 2022 |
| | Commercial | | Personal (1) | | Adjustments | | Consolidated |
| REVENUE: | | | | | | | | |
| Gross premiums written | | $ | 309,031 | | | $ | 41,015 | | | $ | — | | | $ | 350,046 | |
| Change in gross unearned premiums | | (88,348) | | | (9,482) | | | — | | | (97,830) | |
| Gross premiums earned | | 220,683 | | | 31,533 | | | — | | | 252,216 | |
| Ceded premiums earned | | (123,793) | | | (6,145) | | | — | | | (129,938) | |
| Net premiums earned | | 96,890 | | | 25,388 | | | — | | | 122,278 | |
| Net investment income | | 2,603 | | | 621 | | | 19 | | | 3,243 | |
| Net realized gains | | (77) | | | 37 | | | — | | | (40) | |
| Net unrealized losses on equity securities | | (3,159) | | | — | | | (2) | | | (3,161) | |
| Management fee income | | | | — | | | | | — | |
| Other revenue | | — | | | 22 | | | — | | | 22 | |
| Total revenues | | 96,257 | | | 26,068 | | | 17 | | | 122,342 | |
| EXPENSES: | | | | | | | | |
| Losses and loss adjustment expenses | | 22,308 | | | 18,039 | | | — | | | 40,347 | |
| Policy acquisition costs | | 36,606 | | | 7,272 | | | — | | | 43,878 | |
| Operating expenses | | 2,236 | | | 5,113 | | | 178 | | | 7,527 | |
General and administrative expenses (2) | | 4,741 | | | 10,648 | | | 883 | | | 16,272 | |
| Interest expense | | — | | | — | | | 4,722 | | | 4,722 | |
| Total expenses | | 65,891 | | | 41,072 | | | 5,783 | | | 112,746 | |
| Income (loss) before other income | | 30,366 | | | (15,004) | | | (5,766) | | | 9,596 | |
| Other income | | 2 | | | (78) | | | 1,667 | | | 1,591 | |
| Income (loss) before income taxes | | $ | 30,368 | | | $ | (15,082) | | | (4,099) | | | 11,187 | |
| Provision for income taxes | | | | | | 24,771 | | | 24,771 | |
| Net income (loss) | | | | | | $ | (28,870) | | | $ | (13,584) | |
| Less: Net income attributable to noncontrolling interests | | | | | | (111) | | | (111) | |
| Net income (loss) attributable to ACIC | | | | | | $ | (28,759) | | | $ | (13,473) | |
| | | | | | | | |
| | | | | | | | |
| | | | | | | | |
| | | | | | | | |
| | | | | | | | |
| | | | | | | | |
| | | | | | | | |
| | | | | | | | |
Loss ratio, net (3) (4) (7) | | 23.0 | % | | 71.1 | % | | | | 33.0 | % |
Expense ratio (3) (5) (7) | | 45.0 | % | | 90.7 | % | | | | 55.3 | % |
Combined ratio (3) (6) (7) | | 68.0 | % | | 161.8 | % | | | | 88.3 | % |
| | | | | | | | |
| Total segment assets | | $ | 1,352,713 | | | $ | (471,806) | | | $ | 304,824 | | | $ | 1,185,731 | |
(1) Our personal lines income statement also includes amounts related to subsidiaries outside of our insurance companies. We have included these items as these subsidiaries directly support our personal lines operations.
(2) Included in our General and Administrative expenses is $2,121,000 and $1,762,000 of depreciation and amortization expense related to our personal and commercial lines assets, respectively.
(3) As these are calculated ratios, the addition of the ratios will not result in the same value as the consolidated ratio. To calculate the consolidated ratio please see the corresponding footnote below.
(4) Loss ratio, net is calculated as losses and LAE net of losses ceded to reinsurers, relative to net premiums earned. Management uses this operating metric to analyze our loss trends and believes it is useful for investors to evaluate this component separately from our other operating expenses.
(5)(4) Expense ratio is calculated as the sum of all operating expenses less interest expense relative to net premiums earned. Management uses this operating metric to analyze our expense trends and believes it is useful for investors to evaluate these components separately from our loss expenses.
(6)(5) Combined ratio is the sum of the loss ratio, net and expense ratio. Management uses this operating metric to analyze our total expense trends and believes it is a key indicator for investors when evaluating the overall profitability of our business.
Depreciation and amortization related to our commercial lines operating segment totaled $812,000 and $812,000 for the three months ended March 31, 2024 and 2023, respectively.
Depreciation and amortization related to our personal lines operating segment totaled $1,273,000 and $1,007,000 for the three months ended March 31, 2024 and 2023, respectively.
AMERICAN COASTAL INSURANCE CORPORATION
Notes to Unaudited Condensed Consolidated Financial Statements
June 30, 2023March 31, 2024
The tables below present the segment assets as of March 31, 2024 and December 31, 2023.
| | | | | | | | | | | | | | | | | | | | | | | | | | |
| Assets by Segment as of | | | | | | |
| | Commercial | | Personal | | Adjustments | | Total |
| March 31, 2024 | | $ | 903,446 | | | $ | 103,947 | | | $ | 69,918 | | | $ | 1,077,311 | |
| December 31, 2023 | | 896,159 | | | 85,099 | | | 71,030 | | | 1,052,288 | |
5) INVESTMENTS
The following table details fixed-maturity available-for-sale securities, by major investment category, at June 30, 2023March 31, 2024 and December 31, 2022:2023:
| | Cost or Adjusted/Amortized Cost | | Gross Unrealized Gains | | Gross Unrealized Losses | | Fair Value |
| June 30, 2023 | | | | | | | |
| Cost or Adjusted/Amortized Cost | | | Cost or Adjusted/Amortized Cost | | Gross Unrealized Gains | | Gross Unrealized Losses | | Fair Value |
| March 31, 2024 | |
| U.S. government and agency securities | |
| U.S. government and agency securities | |
| U.S. government and agency securities | U.S. government and agency securities | $ | 2,493 | | | $ | — | | | $ | 100 | | | $ | 2,393 | |
| Foreign government | Foreign government | 1,000 | | | — | | | 5 | | | 995 | |
| States, municipalities and political subdivisions | States, municipalities and political subdivisions | 26,470 | | | 11 | | | 3,002 | | | 23,479 | |
| Public utilities | Public utilities | 5,672 | | | — | | | 663 | | | 5,009 | |
| Corporate securities | Corporate securities | 72,088 | | | — | | | 10,318 | | | 61,770 | |
| Mortgage-backed securities | Mortgage-backed securities | 57,652 | | | — | | | 8,188 | | | 49,464 | |
| Asset-backed securities | Asset-backed securities | 19,671 | | | — | | | 1,918 | | | 17,753 | |
| | Total fixed maturities | Total fixed maturities | $ | 185,046 | | | $ | 11 | | | $ | 24,194 | | | $ | 160,863 | |
| Total fixed maturities | |
| Total fixed maturities | |
| | December 31, 2022 | |
| December 31, 2023 | |
| December 31, 2023 | |
| December 31, 2023 | |
| U.S. government and agency securities | U.S. government and agency securities | $ | 2,490 | | | $ | — | | | $ | 105 | | | $ | 2,385 | |
| Foreign government | 1,000 | | | — | | | 9 | | | 991 | |
| U.S. government and agency securities | |
| U.S. government and agency securities | |
| | States, municipalities and political subdivisions | |
| States, municipalities and political subdivisions | |
| States, municipalities and political subdivisions | States, municipalities and political subdivisions | 30,958 | | | 2 | | | 4,065 | | | 26,895 | |
| Public utilities | Public utilities | 8,936 | | | — | | | 1,242 | | | 7,694 | |
| Corporate securities | Corporate securities | 99,062 | | | 20 | | | 15,739 | | | 83,343 | |
| Mortgage-backed securities | Mortgage-backed securities | 65,251 | | | — | | | 9,136 | | | 56,115 | |
| Asset-backed securities | Asset-backed securities | 30,038 | | | 9 | | | 2,788 | | | 27,259 | |
| | Total fixed maturities | Total fixed maturities | $ | 237,735 | | | $ | 31 | | | $ | 33,084 | | | $ | 204,682 | |
| Total fixed maturities | |
| Total fixed maturities | |
Equity securities are summarized as follows:
| | | | | | | | | | | | | | | | | | | | | | | | | | |
| | June 30, 2023 | | December 31, 2022 |
| | Estimated Fair Value | | Percent of Total | | Estimated Fair Value | | Percent of Total |
| | | | | | | | |
| Mutual funds | | $ | — | | | — | % | | $ | 15,657 | | | 100.0 | % |
| | | | | | | | |
| | | | | | | | |
| | | | | | | | |
| | | | | | | | |
| | | | | | | | | | | | | | | | | | | | | | | | | | |
| | March 31, 2024 | | December 31, 2023 |
| | Estimated Fair Value | | Percent of Total | | Estimated Fair Value | | Percent of Total |
| | | | | | | | |
| Mutual funds | | $ | 6,214 | | | 100.0 | % | | $ | — | | | — | % |
| | | | | | | | |
| | | | | | | | |
| | | | | | | | |
| | | | | | | | |
AMERICAN COASTAL INSURANCE CORPORATION
Notes to Unaudited Condensed Consolidated Financial Statements
March 31, 2024
When we sellthe Company sells investments, we calculatethe Company calculates the gain or loss realized on the sale by comparing the sales price (fair value) to the cost or adjusted/amortized cost of the security sold. We determine the cost or adjusted/amortized cost of the security sold using the specific-identification method. The following table details our realized gains (losses) by major investment category for the three and six months ended June 30,March 31, 2024 and 2023, and 2022, respectively:
AMERICAN COASTAL INSURANCE CORPORATION | | | | | | | | | | | | | | | | | | | | | | | |
| 2024 | | 2023 |
| Gains
(Losses) | | Fair Value at Sale(1) | | Gains
(Losses) | | Fair Value at Sale(1) |
| | | | | | | |
| | | | | | | |
| | | | | | | |
| | | | | | | |
| | | | | | | |
| | | | | | | |
| | | | | | | |
| | | | | | | |
| | | | | | | |
| | | | | | | |
| | | | | | | |
| | | | | | | |
| Three Months Ended March 31, | | | | | | | |
| Fixed maturities | $ | — | | | $ | 1,957 | | | $ | 4 | | | $ | 5,292 | |
| | | | | | | |
| Short-term investments | — | | | — | | | — | | | 126 | |
| Other investments | — | | | 2,000 | | | — | | | — | |
| Total realized gains | — | | | 3,957 | | | 4 | | | 5,418 | |
| Fixed maturities | — | | | — | | | (87) | | | (41) | |
| | | | | | | |
| | | | | | | |
| | | | | | | |
| Total realized losses | — | | | — | | | (87) | | | (41) | |
| Net realized investment gains (losses) | $ | — | | | $ | 3,957 | | | $ | (83) | | | $ | 5,377 | |
Notes to Unaudited Condensed Consolidated Financial Statements
June 30, 2023
| | | | | | | | | | | | | | | | | | | | | | | |
| 2023 | | 2022 |
| Gains
(Losses) | | Fair Value at Sale | | Gains
(Losses) | | Fair Value at Sale |
| Three Months Ended June 30, | | | | | | | |
| Fixed maturities | $ | 55 | | | $ | 7,698 | | | $ | 23 | | | $ | 12,541 | |
| Equity securities | 165 | | | 5,786 | | | — | | | — | |
| Short-term investments | — | | | — | | | — | | | — | |
| Total realized gains | 220 | | | 13,484 | | | 23 | | | 12,541 | |
| Fixed maturities | (6,280) | | | 44,516 | | | (100) | | | 1,010 | |
| Equity securities | (665) | | | 10,372 | | | — | | | — | |
| Short-term investments | — | | | — | | | — | | | — | |
| Total realized losses | (6,945) | | | 54,888 | | | (100) | | | 1,010 | |
| Net realized investment gains (losses) | $ | (6,725) | | | $ | 68,372 | | | $ | (77) | | | $ | 13,551 | |
| Six Months Ended June 30, | | | | | | | |
| Fixed maturities | $ | 59 | | | $ | 12,990 | | | $ | 64 | | | $ | 24,733 | |
| Equity securities | 165 | | | 5,786 | | | — | | | — | |
| Short-term investments | — | | | 126 | | | — | | | — | |
| Total realized gains | 224 | | | 18,902 | | | 64 | | | 24,733 | |
| Fixed maturities | (6,367) | | | 44,475 | | | (104) | | | 1,261 | |
| Equity securities | (665) | | | 10,372 | | | — | | | — | |
| Short-term investments | — | | | — | | | — | | | — | |
| Total realized losses | (7,032) | | | 54,847 | | | (104) | | | 1,261 | |
| Net realized investment gains (losses) | $ | (6,808) | | | $ | 73,749 | | | $ | (40) | | | $ | 25,994 | |
The table below summarizes our fixed maturities at June 30, 2023March 31, 2024 by contractual maturity periods. Actual results may differ as issuers may have the right to call or prepay obligations, with or without penalties, prior to the contractual maturities of those obligations.
| | | | | | | | | | | | | | | | | | | | | | | |
| June 30, 2023 |
| Cost or Amortized Cost | | Percent of Total | | Fair Value | | Percent of Total |
| Due in one year or less | $ | 5,798 | | | 3.1 | % | | $ | 5,728 | | | 3.6 | % |
| Due after one year through five years | 38,018 | | | 20.5 | | | 34,426 | | | 21.4 | |
| Due after five years through ten years | 58,951 | | | 31.9 | | | 49,482 | | | 30.8 | |
| Due after ten years | 4,956 | | | 2.7 | | | 4,010 | | | 2.5 | |
| Asset and mortgage-backed securities | 77,323 | | | 41.8 | | | 67,217 | | | 41.7 | |
| Total | $ | 185,046 | | | 100.0 | % | | $ | 160,863 | | | 100.0 | % |
| | | | | | | | | | | | | | | | | | | | | | | |
| March 31, 2024 |
| Cost or Amortized Cost | | Percent of Total | | Fair Value | | Percent of Total |
| Due in one year or less | $ | 12,395 | | | 6.2 | % | | $ | 12,284 | | | 6.9 | % |
| Due after one year through five years | 62,890 | | | 31.6 | | | 59,194 | | | 33.2 | |
| Due after five years through ten years | 51,157 | | | 25.7 | | | 43,629 | | | 24.5 | |
| Due after ten years | 2,517 | | | 1.3 | | | 2,067 | | | 1.2 | |
| Asset and mortgage-backed securities | 69,791 | | | 35.2 | | | 61,142 | | | 34.2 | |
| Total | $ | 198,750 | | | 100.0 | % | | $ | 178,316 | | | 100.0 | % |
The following table summarizes our net investment income by major investment category:
| | Three Months Ended
June 30, | | Six Months Ended
June 30, |
| 2023 | | 2022 | | 2023 | | 2022 |
| | | Three Months Ended March 31, | |
| | | Three Months Ended March 31, | |
| | | Three Months Ended March 31, | |
| | | | | 2024 | | | | | | | 2024 | | 2023 |
| Fixed maturities | Fixed maturities | $ | 1,224 | | | $ | 1,583 | | | $ | 2,496 | | | $ | 3,014 | |
| Equity securities | Equity securities | — | | | 62 | | | 81 | | | 128 | |
| Cash and cash equivalents | Cash and cash equivalents | 1,624 | | | 195 | | | 2,928 | | | 217 | |
| Other investments | Other investments | (84) | | | 117 | | | (78) | | | 172 | |
| | Investment income | Investment income | 2,764 | | | 1,957 | | | 5,427 | | | 3,531 | |
| Investment income | |
| Investment income | |
| Investment expenses | Investment expenses | (72) | | | (118) | | | (146) | | | (288) | |
| Net investment income | Net investment income | $ | 2,692 | | | $ | 1,839 | | | $ | 5,281 | | | $ | 3,243 | |
Portfolio monitoring
AMERICAN COASTAL INSURANCE CORPORATION
Notes to Unaudited Condensed Consolidated Financial Statements
June 30, 2023March 31, 2024
Portfolio monitoring
We have a quarterly portfolio monitoring process to identify and evaluate each fixed-income security whose carrying value may be impaired as the result of a credit loss. For each fixed-income security in an unrealized loss position, if we determine that we intend to sell the security or that it is more likely than not that we will be required to sell the security before recovery of the cost or amortized cost basis for reasons such as liquidity needs, contractual or regulatory requirements, the security's entire decline in fair value is recorded in earnings.
If our management decides not to sell the fixed-income security and it is more likely than not that we will not be required to sell the fixed-income security before recovery of its amortized cost basis, we evaluate whether the decline in fair value has resulted from credit losses or other factors. This is typically indicated by a change in the rating of the security assigned by a rating agency, and any adverse conditions specifically related to the security or industry, among other factors. If the assessment indicates that a credit loss may exist, the present value of cash flows expected to be collected from the security are compared to the amortized cost basis of the security. If the present value of cash flows expected to be collected is less than the amortized cost basis, a credit loss exists and an allowance for credit losses will be recorded in earnings. Credit loss is limited to the difference between a security's amortized cost basis and its fair value. Any additional impairment not recorded through an allowance for credit losses is recognized in other comprehensive loss.
During the three and six months ended June 30, 2023,March 31, 2024, we determined that none of our fixed-income securities shown in the table below that are in an unrealized loss position have declines in fair value that are reflected as a result of credit losses. Therefore, no credit loss allowance was recorded at June 30, 2023.March 31, 2024. The issuers of our debt security investments continue to make interest payments on a timely basis. We do not intend to sell, nor is it likely that we would be required to sell the debt securities before we recover our amortized cost basis. Equity securities are reported at fair value with changes in fair value recognized in the valuation of equity investments.
The following table presents an aging of our unrealized investment losses by investment class:
| | Less Than Twelve Months | | | Less Than Twelve Months | | Twelve Months or More |
| Number of Securities(1) | | | Number of Securities(1) | | Gross Unrealized Losses | | Fair Value | | Number of Securities(1) | | Gross Unrealized Losses | | Fair Value |
| March 31, 2024 | |
| U.S. government and agency securities | |
| U.S. government and agency securities | |
| U.S. government and agency securities | |
| | Less Than Twelve Months | | Twelve Months or More |
| Number of Securities(1) | | Gross Unrealized Losses | | Fair Value | | Number of Securities(1) | | Gross Unrealized Losses | | Fair Value |
| June 30, 2023 | | | | | | | | | | | |
| U.S. government and agency securities | 1 | | | $ | 7 | | | $ | 992 | | | 2 | | | $ | 93 | | | $ | 1,400 | |
| Foreign governments | 1 | | | 5 | | | 995 | | | — | | | — | | | — | |
| States, municipalities and political subdivisions | |
| States, municipalities and political subdivisions | |
| States, municipalities and political subdivisions | States, municipalities and political subdivisions | 7 | | | 52 | | | 3,412 | | | 42 | | | 2,950 | | | 19,323 | |
| Public utilities | Public utilities | — | | | — | | | — | | | 12 | | | 663 | | | 5,008 | |
| Corporate securities | Corporate securities | 14 | | | 245 | | | 4,675 | | | 130 | | | 10,073 | | | 57,090 | |
| Mortgage-backed securities | Mortgage-backed securities | 5 | | | 135 | | | 1,744 | | | 118 | | | 8,053 | | | 47,719 | |
| Asset-backed securities | Asset-backed securities | 8 | | | 73 | | | 3,376 | | | 45 | | | 1,845 | | | 14,494 | |
| | Total fixed maturities | Total fixed maturities | 36 | | | $ | 517 | | | $ | 15,194 | | | 349 | | | $ | 23,677 | | | $ | 145,034 | |
| Total fixed maturities | |
| Total fixed maturities | |
| | December 31, 2022 | |
| December 31, 2023 | |
| December 31, 2023 | |
| December 31, 2023 | |
| U.S. government and agency securities | U.S. government and agency securities | 3 | | | $ | 105 | | | $ | 2,385 | | | — | | | $ | — | | | $ | — | |
| Foreign governments | 1 | | | 9 | | | 991 | | | — | | | — | | | — | |
| U.S. government and agency securities | |
| U.S. government and agency securities | |
| | States, municipalities and political subdivisions | |
| States, municipalities and political subdivisions | |
| States, municipalities and political subdivisions | States, municipalities and political subdivisions | 21 | | | 540 | | | 7,306 | | | 31 | | | 3,525 | | | 18,853 | |
| Public utilities | Public utilities | 8 | | | 193 | | | 2,286 | | | 4 | | | 1,049 | | | 5,408 | |
| Corporate securities | Corporate securities | 78 | | | 2,279 | | | 24,594 | | | 77 | | | 13,460 | | | 57,765 | |
| Mortgage-backed securities | Mortgage-backed securities | 48 | | | 1,282 | | | 15,259 | | | 80 | | | 7,854 | | | 40,856 | |
| Asset-backed securities | Asset-backed securities | 16 | | | 795 | | | 6,397 | | | 46 | | | 1,993 | | | 19,028 | |
| | Total fixed maturities | Total fixed maturities | 175 | | | $ | 5,203 | | | $ | 59,218 | | | 238 | | | $ | 27,881 | | | $ | 141,910 | |
| Total fixed maturities | |
| Total fixed maturities | |
(1) This amount represents the actual number of discrete securities, not the number of shares or units of those securities. The numbers are not presented in thousands.
AMERICAN COASTAL INSURANCE CORPORATION
Notes to Unaudited Condensed Consolidated Financial Statements
June 30, 2023
Fair value measurement
Fair value is defined as the price that would be received to sell an asset or paid to transfer a liability in an orderly transaction between market participants at the measurement date. The hierarchy for inputs used in determining fair value maximizes the use of observable inputs and minimizes the use of unobservable inputs by requiring that observable inputs be
AMERICAN COASTAL INSURANCE CORPORATION
Notes to Unaudited Condensed Consolidated Financial Statements
March 31, 2024
used when available. Assets and liabilities recorded on our Unaudited Condensed Consolidated Balance Sheets at fair value are categorized in the fair value hierarchy based on the observability of inputs to the valuation techniques as follows:
Level 1: Assets and liabilities whose values are based on unadjusted quoted prices for identical assets or liabilities in an active market that we can access.
Level 2: Assets and liabilities whose values are based on the following:
(a) Quoted prices for similar assets or liabilities in active markets;
(b) Quoted prices for identical or similar assets or liabilities in markets that are not active; or
(c) Valuation models whose inputs are observable, directly or indirectly, for substantially the full term of the asset or liability.
Level 3: Assets and liabilities whose values are based on prices or valuation techniques that require inputs that are both unobservable and significant to the overall fair value measurement. Unobservable inputs reflect our estimates of the assumptions that market participants would use in valuing the assets and liabilities.
We estimate the fair value of our investments using the closing prices on the last business day of the reporting period, obtained from active markets such as the NYSE, Nasdaq and NYSE American. For securities for which quoted prices in active markets are unavailable, we use a third-party pricing service that utilizes quoted prices in active markets for similar instruments, benchmark interest rates, broker quotes and other relevant inputs to estimate the fair value of those securities for which quoted prices are unavailable. Our estimates of fair value reflect the interest rate environment that existed as of the close of business on June 30, 2023March 31, 2024 and December 31, 2022.2023. Changes in interest rates subsequent to June 30, 2023March 31, 2024 may affect the fair value of our investments.
The fair value of our fixed maturities is initially calculated by a third-party pricing service. Valuation service providers typically obtain data about market transactions and other key valuation model inputs from multiple sources and, through the use of proprietary models, produce valuation information in the form of a single fair value for individual fixed-income and other securities for which a fair value has been requested. The inputs used by the valuation service providers include, but are not limited to, market prices from recently completed transactions and transactions of comparable securities, interest rate yield curves, credit spreads, liquidity spreads, currency rates and other information, as applicable. Credit and liquidity spreads are typically implied from completed transactions and transactions of comparable securities. Valuation service providers also use proprietary discounted cash flow models that are widely accepted in the financial services industry and similar to those used by other market participants to value the same financial information. The valuation models take into account, among other things, market observable information as of the measurement date, as described above, as well as the specific attributes of the security being valued, including its term, interest rate, credit rating, industry sector and, where applicable, collateral quality and other issue or issuer specific information. Executing valuation models effectively requires seasoned professional judgment and experience.
Any change in the estimated fair value of our fixed-income securities would impact the amount of unrealized gain or loss we have recorded, which could change the amount we have recorded for our investments and other comprehensive loss on our Unaudited Condensed Consolidated Balance Sheet as of June 30, 2023.March 31, 2024.
AMERICAN COASTAL INSURANCE CORPORATION
Notes to Unaudited Condensed Consolidated Financial Statements
March 31, 2024
The following table presents the fair value of our financial instruments measured on a recurring basis by level at June 30, 2023March 31, 2024 and December 31, 2022:2023:
AMERICAN COASTAL INSURANCE CORPORATION
Notes to Unaudited Condensed Consolidated Financial Statements
June 30, 2023
| | Total | | Level 1 | | Level 2 | | Level 3 |
| June 30, 2023 | | | | | | | |
| Total | | | Total | | Level 1 | | Level 2 | | Level 3 |
| March 31, 2024 | |
| U.S. government and agency securities | |
| U.S. government and agency securities | |
| U.S. government and agency securities | U.S. government and agency securities | $ | 2,393 | | | $ | — | | | $ | 2,393 | | | $ | — | |
| Foreign government | Foreign government | 995 | | | — | | | 995 | | | — | |
| States, municipalities and political subdivisions | States, municipalities and political subdivisions | 23,479 | | | — | | | 23,479 | | | — | |
| Public utilities | Public utilities | 5,009 | | | — | | | 5,009 | | | — | |
| Corporate securities | Corporate securities | 61,770 | | | — | | | 61,770 | | | — | |
| Mortgage-backed securities | Mortgage-backed securities | 49,464 | | | — | | | 49,464 | | | — | |
| Asset-backed securities | Asset-backed securities | 17,753 | | | — | | | 17,753 | | | — | |
| | Total fixed maturities | Total fixed maturities | 160,863 | | | — | | | 160,863 | | | — | |
| Total fixed maturities | |
| Total fixed maturities | |
| Mutual funds | Mutual funds | — | | | — | | | — | | | — | |
| | | Total equity securities | |
| | Total equity securities | |
| | Total equity securities | Total equity securities | — | | | — | | | — | | | — | |
Other investments (1) | Other investments (1) | 116 | | | — | | | 116 | | | — | |
| Total investments | Total investments | $ | 160,979 | | | $ | — | | | $ | 160,979 | | | $ | — | |
| | December 31, 2022 | |
| December 31, 2023 | |
| December 31, 2023 | |
| December 31, 2023 | |
| U.S. government and agency securities | U.S. government and agency securities | $ | 2,385 | | | $ | — | | | $ | 2,385 | | | $ | — | |
| Foreign government | 991 | | | — | | | 991 | | | — | |
| U.S. government and agency securities | |
| U.S. government and agency securities | |
| | States, municipalities and political subdivisions | |
| States, municipalities and political subdivisions | |
| States, municipalities and political subdivisions | States, municipalities and political subdivisions | 26,895 | | | — | | | 26,895 | | | — | |
| Public utilities | Public utilities | 7,694 | | | — | | | 7,694 | | | — | |
| Corporate securities | Corporate securities | 83,343 | | | — | | | 83,343 | | | — | |
| Mortgage-backed securities | Mortgage-backed securities | 56,115 | | | — | | | 56,115 | | | — | |
| Asset-backed securities | Asset-backed securities | 27,259 | | | — | | | 27,259 | | | — | |
| | Total fixed maturities | Total fixed maturities | 204,682 | | | — | | | 204,682 | | | — | |
| Total fixed maturities | |
| Total fixed maturities | |
| Mutual Funds | Mutual Funds | 15,657 | | | 15,657 | | | — | | | — | |
| | Total equity securities | Total equity securities | 15,657 | | | 15,657 | | | — | | | — | |
| | Total equity securities | |
| | Total equity securities | |
Other investments (1) | Other investments (1) | 125 | | | — | | | 125 | | | — | |
| Total investments | Total investments | $ | 220,464 | | | $ | 15,657 | | | $ | 204,807 | | | $ | — | |
(1) Other investments included in the fair value hierarchy exclude these limited partnership interests that are measured at estimated fair value using the net asset value per share (or its equivalent) practical expedient.
Certain financial assets and financial liabilities are measured at fair value on a non-recurring basis; this is, the instruments are not measured at fair value on an ongoing basis but are subject to fair value adjustments in certain circumstances (for example, when there is evidence of impairment). There were no financial instruments measured on a non-recurring basis at June 30, 2023March 31, 2024 and December 31, 2022.2023.
The carrying amounts for the following financial instrument categories approximate their fair values at June 30, 2023March 31, 2024 and December 31, 2022,2023, because of their short-term nature: cash and cash equivalents, accrued investment income, premiums receivable, reinsurance recoverable, reinsurance payable, other assets, and other liabilities. The carrying amount of our senior notes approximate fair value as the interest rates and terms are variable.
We are responsible for the determination of fair value and the supporting assumptions and methodologies. We have implemented a system of processes and controls designed to provide assurance that our assets and liabilities are appropriately valued. For fair values received from third parties, our processes are designed to provide assurance that the valuation
AMERICAN COASTAL INSURANCE CORPORATION
Notes to Unaudited Condensed Consolidated Financial Statements
March 31, 2024
methodologies and inputs are appropriate and consistently applied, the assumptions are reasonable and consistent with the objective of determining fair value, and the fair values are accurately recorded.
At the end of each quarter, we determine whether we need to transfer the fair values of any securities between levels of the fair value hierarchy and, if so, we report the transfer as of the end of the quarter. During the quarter ended June 30, 2023,March 31, 2024, we transferred no investments between levels.
AMERICAN COASTAL INSURANCE CORPORATION
Notes to Unaudited Condensed Consolidated Financial Statements
June 30, 2023
For our investments in U.S. government securities that do not have prices in active markets, agency securities, state and municipal governments, and corporate bonds, we obtain the fair values from our investment custodians, which use a third-party valuation service. The valuation service calculates prices for our investments in the aforementioned security types on a month-end basis by using several matrix-pricing methodologies that incorporate inputs from various sources. The model the valuation service uses to price U.S. government securities and securities of states and municipalities incorporates inputs from active market makers and inter-dealer brokers. To price corporate bonds and agency securities, the valuation service calculates non-call yield spreads on all issuers, uses option-adjusted yield spreads to account for any early redemption features, and adds final spreads to the U.S. Treasury curve at 3 p.m. (ET) as of quarter end. Since the inputs the valuation service uses in its calculations are not quoted prices in active markets, but are observable inputs, they represent Level 2 inputs.
Other investments
We acquired investments in limited partnerships, recorded in the other investments line of our Unaudited Condensed Consolidated Balance Sheets, and these investments are currently being measured at estimated fair value utilizing a net asset value per share (or its equivalent) practical expedient.
The information presented in the table below is as of June 30, 2023:March 31, 2024:
| | | Book Value | | | | Book Value | | Unrealized Gain | | Unrealized Loss | | Fair Value |
| March 31, 2024 | |
Limited partnership investments (1) | |
Limited partnership investments (1) | |
Limited partnership investments (1) | |
| | Book Value | | Unrealized Gain | | Unrealized Loss | | Fair Value |
| June 30, 2023 | | |
Limited partnership investments (1) | | $ | 3,286 | | | $ | 722 | | | $ | 541 | | | $ | 3,467 | |
| Certificates of deposit | | — | | | — | | | — | | | — | |
| Short-term investments | |
| Short-term investments | |
| Short-term investments | Short-term investments | | 117 | | | — | | | 1 | | | 116 | |
| Total other investments | Total other investments | | $ | 3,403 | | | $ | 722 | | | $ | 542 | | | $ | 3,583 | |
(1) Distributions will be generated from investment gains, from operating income, from underlying investments of funds, and from liquidation of the underlying assets of the funds. We estimate that the underlying assets of the funds will be liquidated over the next few months to five years.
Restricted Cash
We are required to maintain assets on deposit with various regulatory authorities to support our insurance operations. The cash on deposit with state regulators is available to settle insurance liabilities. We also use trust funds in certain reinsurance transactions.
The following table presents the components of restricted assets:
| | June 30, 2023 | | December 31, 2022 |
| March 31, 2024 | | | March 31, 2024 | | December 31, 2023 |
| Trust funds | Trust funds | $ | 48,874 | | | $ | 45,364 | |
| Cash on deposit (regulatory deposits) | Cash on deposit (regulatory deposits) | 627 | | | 624 | |
| Total restricted cash | Total restricted cash | $ | 49,501 | | | $ | 45,988 | |
In addition to the cash held on deposit described above, we also have securities on deposit with regulators, which are presented within our Fixed Maturities or Other Investments lines on the Unaudited Condensed Balance Sheets, dependent upon if they are short-term or long-term in nature. The table below shows the carrying value of those securities held on deposit with regulators.
| | | | | | | | | | | |
| June 30, 2023 | | December 31, 2022 |
| Invested assets on deposit (regulatory deposits) | $ | 2,493 | | | $ | 2,616 | |
| | | | | | | | | | | |
| March 31, 2024 | | December 31, 2023 |
| Invested assets on deposit (regulatory deposits) | $ | 1,495 | | | $ | 1,495 | |
AMERICAN COASTAL INSURANCE CORPORATION
Notes to Unaudited Condensed Consolidated Financial Statements
March 31, 2024
6) EARNINGS PER SHARE (EPS)
Basic EPS is based on the weighted average number of common shares outstanding for the period, excluding any dilutive common share equivalents. Diluted EPS reflects the potential dilution resulting from the vesting of outstanding restricted stock
AMERICAN COASTAL INSURANCE CORPORATION
Notes to Unaudited Condensed Consolidated Financial Statements
June 30, 2023
awards, restricted stock units, performance stock units and stock options. The following table shows the computation of basic and diluted EPS for the three and six month periods ended June 30,March 31, 2024 and 2023, and 2022, respectively:
| | Three Months Ended
June 30, | | Six Months Ended
June 30, |
| 2023 | | 2022 | | 2023 | | 2022 |
| | | | Three Months Ended March 31, | |
| | | | Three Months Ended March 31, | |
| | | | Three Months Ended March 31, | |
| | | | | | 2024 | | | | | | | | 2024 | | 2023 |
| Numerator: | Numerator: | | | | | | | | |
| Net income (loss) attributable to ACIC common stockholders | |
| Net income (loss) attributable to ACIC common stockholders | |
| Net income (loss) attributable to ACIC common stockholders | Net income (loss) attributable to ACIC common stockholders | | $ | 17,779 | | | $ | (69,029) | | | $ | 285,059 | | | $ | (102,201) | |
| | Denominator: | Denominator: | |
| Denominator: | |
| Denominator: | |
| Weighted-average shares outstanding | |
| Weighted-average shares outstanding | |
| Weighted-average shares outstanding | Weighted-average shares outstanding | | 43,229,416 | | | 43,049,227 | | | 43,178,758 | | | 43,015,114 | |
| Effect of dilutive securities | Effect of dilutive securities | | 575,801 | | | — | | | 511,677 | | | — | |
| Weighted-average diluted shares | Weighted-average diluted shares | | 43,805,217 | | | 43,049,227 | | | 43,690,435 | | | 43,015,114 | |
| | Earnings available to ACIC common stockholders per share | Earnings available to ACIC common stockholders per share | |
| Earnings available to ACIC common stockholders per share | |
| Earnings available to ACIC common stockholders per share | |
| Basic | |
| Basic | |
| Basic | Basic | | $ | 0.42 | | | $ | (1.60) | | | $ | 6.59 | | | $ | (2.37) | |
| Diluted | Diluted | | $ | 0.41 | | | $ | (1.60) | | | $ | 6.52 | | | $ | (2.37) | |
See Note 17 of these Notes to Unaudited Condensed Consolidated Financial Statements for additional information on the stock grants related to dilutive securities.
7) PROPERTY AND EQUIPMENT, NET
Property and equipment, net consists of the following:
| | | | | | | | | | | | | | |
| | June 30,
2023 | | December 31,
2022 |
| | | | |
| | | | |
| | | | |
Computer hardware and software (software in progress of $76 and $82, respectively) | | $ | 8,134 | | | $ | 8,164 | |
| Office furniture and equipment | | 806 | | | 1,414 | |
| Leasehold improvements | | 311 | | | 753 | |
Leased vehicles(1) | | — | | | 1,080 | |
| Total, at cost | | 9,251 | | | 11,411 | |
| Less: accumulated depreciation and amortization | | (4,777) | | | (6,118) | |
| Property and equipment, net | | $ | 4,474 | | | $ | 5,293 | |
| | | | | | | | | | | | | | |
| | March 31,
2024 | | December 31,
2023 |
| | | | |
| | | | |
| | | | |
| Computer hardware and software | | $ | 15,873 | | | $ | 7,925 | |
| Office furniture and equipment | | 705 | | | 748 | |
| Leasehold improvements | | — | | | 311 | |
| | | | |
| Total, at cost | | 16,578 | | | 8,984 | |
| Less: accumulated depreciation and amortization | | (6,227) | | | (5,326) | |
| Property and equipment, net | | $ | 10,351 | | | $ | 3,658 | |
(1) Includes vehicles under financing leases. See Note 12 of these Notes to Unaudited Condensed Consolidated Financial Statements for further information on leases.
Depreciation and amortization expense under property and equipment was $996,000 and $2,004,000$1,273,000 for the three and six months ended June 30, 2023, respectively.March 31, 2024. During the three months ended March 31, 2024, we moved capitalized software from discontinued operations to continuing operations to align with the Company's use of the system in the current year. Please see Note 3 for more detail. Depreciation and amortization expense under property and equipment was $1,230,000 and $2,502,000$1,008,000 for the three and six months ended June 30, 2022, respectively.March 31, 2023. During the sixthree months ended June 30,March 31, 2024, we sold or disposed of leasehold improvements totaling $311,000. The accumulated depreciation on these improvements totaled $232,000 at the time of disposal. We disposed of computer hardware and software totaling $147,000. The accumulated depreciation on these systems totaled $98,000 at the time of disposal. In addition, we disposed of office furniture totaling $43,000. The accumulated depreciation on the office furniture totaled $41,000 at the time of disposal. During the year ended December 31, 2023, we sold or disposed of leased vehicles totaling $1,069,000.
AMERICAN COASTAL INSURANCE CORPORATION
Notes to Unaudited Condensed Consolidated Financial Statements
March 31, 2024
The accumulated depreciation on these vehicles totaled $1,038,000 at the time of disposal. We realized a net gain on this disposal of $559,000. We disposed of computer hardware and software totaling $811,000.$1,061,000. The accumulated depreciation on these systems totaled $321,000$379,000 at the time of disposal. In addition, we disposed of office furniture totaling $691,000$749,000 during the period. Accumulated depreciation at the time of this disposal totaled $644,000. During$702,000. Our depreciation and amortization expense under property and equipment can be attributed fully to our personal lines operating segment for these periods. These gains (losses) are reflected within "Other income" on the year ended December 31, 2022, we disposed of computer hardware and software totaling $13,202,000, primarily related to the retirement of one of our policy systems for states in which we no longer write policies. The depreciation on these systems totaled $12,691,000 at the time of disposal. We also sold or disposed of leased vehicles totaling $1,222,000. The depreciation on these vehicles totaled $1,114,000 prior to disposal. The net gain on sale of these vehicles totaled $738,000. Finally, we sold three buildings and their related assets totaling $13,369,000. The depreciation on these buildings and related assets totaled $5,129,000 prior to disposal. The net realized gain on these sales totaled $12,164,000.
AMERICAN COASTAL INSURANCE CORPORATION
Notes to Unaudited Condensed Consolidated Financial Statements
June 30, 2023
of Comprehensive Income.
8) GOODWILL AND INTANGIBLE ASSETS
Goodwill
The carrying amount of goodwill at June 30, 2023March 31, 2024 and December 31, 20222023 was $59,476,000.
No impairment in the value of goodwill was recognized during the three or sixthree month period ended June 30, 2023. As a result of the strategic decision to place our former subsidiary UPC into an orderly runoff, we recognized an impairment of our personal lines reporting unit's goodwill totaling $10,156,000 during the third quarter of 2022. The goodwill attributable to our commercial lines reporting unit was most recently tested for impairment during the fourth quarter of 2022. It was determined that there was no impairment in the value of the asset as of DecemberMarch 31, 2022.2024.
Goodwill allocated to our commercial lines reporting unit was $59,476,000 at March 31, 2024June 30, 2023 and December 31, 2022.2023. There was no goodwill allocated to our personal lines reporting unit at June 30, 2023March 31, 2024 and December 31, 2022.2023.
There was no goodwill acquired or disposed of during the sixthree month periods ended June 30, 2023March 31, 2024 and 20222023. Accumulated impairment related to goodwill was $10,156,000 at June 30, 2023March 31, 2024 and December 31, 2022.2023. Accumulated impairment can be attributed to our personal lines segment.
Intangible Assets
The following is a summary of intangible assets excluding goodwill recorded as intangible assets on our Unaudited Condensed Consolidated Balance Sheets:
| | June 30, 2023 | | December 31, 2022 |
| | March 31, 2024 | | | | March 31, 2024 | | December 31, 2023 |
| Intangible assets subject to amortization | Intangible assets subject to amortization | | $ | 9,748 | | | $ | 11,372 | |
Indefinite-lived intangible assets(1) | Indefinite-lived intangible assets(1) | | 1,198 | | | 1,398 | |
| Total | Total | | $ | 10,946 | | | $ | 12,770 | |
(1) Indefinite-lived intangible assets are comprised of state insurance and agent licenses, as well as perpetual software licenses.
Intangible assets subject to amortization consisted of the following:
| | Weighted-average remaining amortization period (in years) | | Gross carrying amount | | Accumulated amortization | | Net carrying amount |
| June 30, 2023 | | | | | | | | |
| | Weighted-average remaining amortization period (in years) | | | | Weighted-average remaining amortization period (in years) | | Gross carrying amount | | Accumulated amortization | | Net carrying amount |
| March 31, 2024 | |
| Value of business acquired | |
| Value of business acquired | |
| Value of business acquired | Value of business acquired | | — | | $ | 42,788 | | | $ | (42,788) | | | $ | — | |
| Agency agreements acquired | Agency agreements acquired | | 3.8 | | 34,660 | | | (25,519) | | | 9,141 | |
| Trade names acquired | Trade names acquired | | 0.8 | | 6,381 | | | (5,774) | | | 607 | |
| Total | Total | | $ | 83,829 | | | $ | (74,081) | | | $ | 9,748 | |
| | December 31, 2022 | |
| December 31, 2023 | |
| December 31, 2023 | |
| December 31, 2023 | |
| Value of business acquired | |
| Value of business acquired | |
| Value of business acquired | Value of business acquired | | — | | $ | 42,788 | | | $ | (42,788) | | | $ | — | |
| Agency agreements acquired | Agency agreements acquired | | 4.3 | | 34,661 | | | (24,300) | | | 10,361 | |
| Trade names acquired | Trade names acquired | | 1.3 | | 6,381 | | | (5,370) | | | 1,011 | |
| Total | Total | | $ | 83,830 | | | $ | (72,458) | | | $ | 11,372 | |
AMERICAN COASTAL INSURANCE CORPORATION
Notes to Unaudited Condensed Consolidated Financial Statements
March 31, 2024
No impairment in the value of amortizing or non-amortizing intangible assets was recognized during the sixthree months ended June 30, 2023March 31, 2024 and 2022.2023. However, during the yearthree months ended DecemberMarch 31, 2022,2023, we disposed of intangible assets totaling $2,359,000.$200,000.
AMERICAN COASTAL INSURANCE CORPORATION
Notes to Unaudited Condensed Consolidated Financial Statements
June 30, 2023
Amortization expense of our intangible assets was $811,000 and $812,000 for both the three months ended June 30, 2023March 31, 2024 and 2022, respectively. Amortization expense of our intangible assets was $1,623,000 and $1,624,000 for the six months ended June 30, 2023 and 2022, respectively.2023.
Estimated amortization expense of our intangible assets to be recognized by the Company during the remainder of 20232024 and over the next five years is as follows:
| | Year ending December 31, | Year ending December 31, | | Estimated Amortization Expense | Year ending December 31, | | Estimated Amortization Expense |
| Remaining in 2023 | | $ | 1,623 | |
| 2024 | | 2,640 | |
| Remaining in 2024 | |
| 2025 | 2025 | | 2,438 | |
| 2026 | 2026 | | 2,438 | |
| 2027 | 2027 | | 609 | |
| 2028 | 2028 | | — | |
| 2029 | |
9) REINSURANCE
Our catastrophe reinsurance program isprograms are designed primarily by utilizing our risk management methodology,third-party catastrophe modeling software and consulting with third-party reinsurance experts to addressproject our exposure to catastrophes. catastrophe events. We evaluate modeled expected losses developed by the catastrophe modeling software using our risk portfolio data to estimate probable maximum losses (PML) across multiple return periods and the average annual loss. The Company monitors and manages its catastrophe risk using this model output along with other internal and external data sources, such as our historical loss experience and industry loss experience, to develop our view of catastrophe risk.
Our catastrophe reinsurance coverage consists of three separate placements:
1.AmCoastal’s core catastrophe reinsurance program in effect June 1 through May 31, annually, which includes excess of loss and quota share treaties providing coverage for catastrophe losses from named or numbered windstorms and earthquakes;
2.AmCoastal’s all other perils catastrophe excess of loss agreement in effect January 1 through December 31, annually, which provides protection from catastrophe loss events other than named or numbered windstorms and earthquakes; and
3.IIC’s core catastrophe reinsurance program in effect June 1 through May 31, annually, which provides protection from all catastrophe losses.
This reinsurance protection for catastrophes, including hurricanes and tropical storms. These reinsurance agreements areis an essential part of our catastrophe risk management strategy, whichstrategy. It is intended to provide our stockholders with an acceptable return on the risks assumed inby our property business,insurance entities, and to reduce the variability of earnings, while providing protection to our policyholders.surplus protection. Although reinsurance agreements contractually obligate our reinsurers to reimburse us for the agreed-upon portion of our gross paid losses, they do not discharge our primary liability. In the event one or more of our reinsurers fail to fulfill their obligation, the surplus of our statutory entities may decline, and we may not be able to fulfill our obligation to policyholders, or we may not be able to maintain compliance with various regulatory financial requirements. Additionally, we face the risk that actual losses incurred from one or more catastrophic events may be above the modeled expected loss, resulting in losses exceeding our reinsurance coverage, which may result in a decline in surplus, and as a result we may not be able to fulfill our obligations to policyholders, or we may not be able to maintain compliance with various regulatory financial requirements. The details of our programs and the likelihood of a catastrophic event exceeding these three coverages are outlined below.
Our program includes excess of loss and quota share treaties. Our AmCoastalAmCoastal’s core catastrophe reinsurance program in effect from June 1, 2023 through May 31, 2024, provides occurrence-based coverage for catastrophe losses from named or numbered windstorms and earthquakes up to an exhaustion point of approximately $1,100,000,000 for a first occurrence and $1,300,000,000 in the aggregate. Under this program, our core catastrophe excess of loss treaty, retention on a first and second event is $10,000,000 each. The exhaustion pointeach, plus $2,250,000 retained separately by our captive. AmCoastal’s program
AMERICAN COASTAL INSURANCE CORPORATION
Notes to Unaudited Condensed Consolidated Financial Statements
March 31, 2024
provides sufficient coverage for a 1-in-150-year return period, indicating that the probability of IIC'sa single occurrence exceeding protection purchased is roughly 0.7% estimated by equally blending the AIR and RMS catastrophe reinsurancemodels using long-term catalogs including demand surge. AmCoastal’s program is approximately $82,000,000also provides sufficient coverage for a 1-in-100-year event followed by a 1-in-50-year event in the aggregate, with a retentionsame treaty year, the probability of $3,000,000 per occurrence, covering all perils.which is less than 0.1%. While we believe these catastrophe models are very good tools and their output provides reasonable proxies for the probability of exhausting our reinsurance protections, they are imperfect, so actual results could vary dramatically from those expected.
During the third quarter of 2022, the Company's core catastrophe reinsurance program was impacted by Hurricane Ian. As a result, the Company has approximately $508 million of occurrence limit remaining for Hurricane Ian all of which is attributable to AmCoastal only. After reinstatement premiums of approximately $15.4 million, the Company, with its former subsidiary UPC has approximately $993 million of aggregate limit remaining after Hurricane Ian, based on our estimated ultimate net loss subject to the core catastrophe reinsurance program.
Effective January 1, 2023, we renewed ourAmCoastal’s all other perils catastrophe excess of loss agreement. The agreement provides protection from catastrophe loss events other than named windstorms and earthquakes up to $101,000,000.$172,000,000 in the aggregate. This agreement provides sufficient coverage for a 1-in-450-year return period, indicating that the probability of a single occurrence exceeding protection purchased is no more than 0.2%.
DuringIIC’s core catastrophe reinsurance program provides coverage up to an exhaustion point of approximately $82,000,000 in the third quarteraggregate, with a retention of 2022,$3,000,000 per occurrence. Based on IIC’s PML, the program provides sufficient coverage for a 1-in-130-year return period, indicating the probability of a single occurrence exceeding protection purchased is no more than 0.8%. IIC’s program also provides sufficient coverage for a 1-in-100-year event followed by a 1-in-50-year event in the same treaty year, the probability of which is less than 0.1%.
Effective December 15, 2023, we agreed to commute a private reinsurer’s share of core catastrophe reinsurance coverage and replace this gap in coverage with new coverage provided by one of our other private reinsurers who held a 100% share of the $15,000,000 in excess of $15,000,000 layer on our all other perils catastrophe excess of loss agreement notified us of their intent to terminate the agreement due to the contractual provision regarding the change in our former subsidiary UPC's statutory surplus being greater than 25%. We agreed to a termination and commutation date of August 22, 2022 for this contract.reinsurers. This changetransaction resulted in additional expense of approximately $1,300,000$6,300,000 for the year ended December 31, 2023, and a reduction in expense of ceded premium savings that would have otherwise been due inapproximately $9,400,000 during the fourth quarter of 2022 and the Company retaining all the risk for any non-hurricane catastrophe losses up to $30,000,000, excluding any quota share recoveries.three months ended March 31, 2024.
The table below outlines our quota share agreements in effect for the sixthree months ended June 30, 2023March 31, 2024 and 2022.2023. The impacts of these quota share agreements on the financial statements of our former subsidiary, UPC's financial statementsUPC, are included in discontinued operations.
AMERICAN COASTAL INSURANCE CORPORATION
Notes to Unaudited Condensed Consolidated Financial Statements
June 30, 2023
| | | | | | | | | | | | | | |
| Reinsurer | Companies in Scope (1) | Effective Dates | Cession Rate | States in Scope |
| External third-party | AmCoastal | 06/01/2023 - 06/01/2024 | 40% (2)(1) | Florida |
| External third-party | UPC, FSIC & AmCoastal | 06/01/2022 - 06/01/2023 | 10% (2)(1) | Florida, Louisiana, Texas |
| TypTap | UPC | 06/01/2022 - 06/01/2023 | 100% (3)(2) | Georgia, North Carolina, South Carolina |
External third-party | UPC, FSIC & AmCoastal | 12/31/2021 - 12/31/2022 | 8% (2)
| Florida, Louisiana, Texas |
HCPCI | UPC | 12/31/2021 - 06/01/2022 | 85% | Georgia, North Carolina, South Carolina |
External third-party | UPC & FSIC | 12/31/2021 - 12/31/2022 | 25% (4)
| Florida, Louisiana, Texas |
HCPCI / TypTap (5)
| UPC | 06/01/2021 - 06/01/2022 | 100% (3)
| Connecticut, New Jersey, Massachusetts, Rhode Island |
External third-party | UPC, FSIC & AmCoastal (6)
| 06/01/2021 - 06/01/2022 | 15% (2)
| Florida, Georgia, Louisiana, North Carolina, South Carolina, Texas |
IIC | UPC | 12/31/2020 - 12/31/2022 | 100% | New York |
(1) Effective May 31, 2022, FSIC was merged into UPC, with UPC being the surviving entity.
(2) This treaty provides coverage for all catastrophe perils and attritional losses incurred. For all catastrophe perils, the quota share agreement provides ground- up protection, effectively reducing our retention for catastrophe losses.
(3)(2) This treaty providesprovided coverage on our in-force, new and renewal policies until these states arewere transitioned to HCPCI or TypTap upon renewal.
(4) This treaty provides coverage on non-catastrophe losses on policies in-force on the effective date of the agreement.
(5) Cessions are split 50% to HCPCI and 50% to TypTap.
(6) This treaty was amended effective December 31, 2020 to include AmCoastal.
Reinsurance recoverable at the balance sheet dates consists of the following:
| | June 30, | | December 31, |
| 2023 | | 2022 |
| March 31, | | | March 31, | | December 31, |
| 2024 | | | 2024 | | 2023 |
| Reinsurance recoverable on unpaid losses and loss adjustment expenses | Reinsurance recoverable on unpaid losses and loss adjustment expenses | $ | 443,719 | | | $ | 732,254 | |
| Reinsurance recoverable on paid losses and loss adjustment expenses | Reinsurance recoverable on paid losses and loss adjustment expenses | 215,095 | | | 64,292 | |
Reinsurance recoverable (1) | Reinsurance recoverable (1) | $ | 658,814 | | | $ | 796,546 | |
(1) Our reinsurance recoverable balance is net of our allowance for expected credit losses. More information related to this allowance can
AMERICAN COASTAL INSURANCE CORPORATION
Notes to Unaudited Condensed Consolidated Financial Statements
March 31, 2024
10) LIABILITY FOR UNPAID LOSSES AND LOSS ADJUSTMENT EXPENSE (LAE)
We determine the reserve for unpaid losses on an individual case basis for all incidents reported. The liability also includes amounts for incurred but not reported (IBNR) claims as of the balance sheet date.
The table below shows the analysis of our reserve for unpaid losses for the sixthree months ended June 30,March 31, 2024 and 2023 and 2022 on a GAAP basis:
AMERICAN COASTAL INSURANCE CORPORATION
Notes to Unaudited Condensed Consolidated Financial Statements
June 30, 2023
| | June 30, |
| March 31, | | | March 31, |
| | | 2023 | | 2022 | | 2024 | | 2023 |
| Balance at January 1 | Balance at January 1 | $ | 842,958 | | | $ | 250,642 | |
| Less: reinsurance recoverable on unpaid losses | Less: reinsurance recoverable on unpaid losses | 732,254 | | | 176,096 | |
| Net balance at January 1 | Net balance at January 1 | $ | 110,704 | | | $ | 74,546 | |
| | Incurred related to: | Incurred related to: | |
| Incurred related to: | |
| Incurred related to: | |
| Current year | |
| Current year | |
| Current year | Current year | 45,643 | | | 47,288 | |
| Prior years | Prior years | (8,316) | | | (6,941) | |
| Total incurred | Total incurred | $ | 37,327 | | | $ | 40,347 | |
| Paid related to: | Paid related to: | | | |
| Current year | Current year | 27,217 | | | 30,666 | |
| Current year | |
| Current year | |
| Prior years | Prior years | 29,857 | | | 23,651 | |
| Total paid | Total paid | $ | 57,074 | | | $ | 54,317 | |
| | Net balance at June 30 | $ | 90,957 | | | $ | 60,576 | |
| Net balance at March 31 | |
| Net balance at March 31 | |
| Net balance at March 31 | |
| Plus: reinsurance recoverable on unpaid losses | Plus: reinsurance recoverable on unpaid losses | 443,719 | | | 163,509 | |
| Balance at June 30 | $ | 534,676 | | | $ | 224,085 | |
| Balance at March 31 | |
| Composition of reserve for unpaid losses and LAE:
| Composition of reserve for unpaid losses and LAE:
| |
Composition of reserve for unpaid losses and LAE:
| |
Composition of reserve for unpaid losses and LAE:
| |
| Case reserves | |
| Case reserves | |
| Case reserves | Case reserves | $ | 182,196 | | | $ | 116,428 | |
| IBNR reserves | IBNR reserves | 352,480 | | | 107,657 | |
| Balance at June 30 | $ | 534,676 | | | $ | 224,085 | |
| Balance at March 31 | |
Based upon our internal analysis and our review of the annual statement of actuarial opinion provided by our actuarial consultants at December 31, 2022,2023, we believe that the reserve for unpaid losses reasonably represents the amount necessary to pay all claims and related expenses which may arise from incidents that have occurred as of the balance sheet date.
As reflected in the table above, we had favorable development in both 20232024 and 20222023 related to prior year losses. This favorable development came as a result of re-estimating ultimate losses in 2024 and 2023 based on historical loss trends. The loss payments made by the Company during the sixthree months ended June 30, 2023,March 31, 2024, were higher than the loss payments made during the sixthree months ended June 30, 2022,March 31, 2023, due to the settling of claims related to Hurricane Ian, which made landfall during the third quarter of 2022.prior year catastrophe claims. Current year loss payments remained relatively flat. Case and IBNR reserves and reinsurance recoverable on unpaid losses also increaseddecreased when compared to the prior period as a result of Hurricane Ian.the continued settlement of prior year claims with no similar losses in 2023 or the current year.
11) LONG-TERM DEBT
Long-Term Debt
The table below presents all long-term debt outstanding as of June 30, 2023 and December 31, 2022:
| | | | | | | | | | | | | | | | | | | | | | | |
| | | Effective Interest Rate | | Carrying Value at |
| Maturity | | | June 30, 2023 | | December 31, 2022 |
| Senior Notes | December 15, 2027 | | 7.25% | | $ | 150,000 | | | $ | 150,000 | |
Florida State Board of Administration Note (1) | July 1, 2026 | | N/A | | — | | | — | |
Truist Term Note Payable (2) | May 26, 2031 | | N/A | | — | | | — | |
| Total long-term debt | | | | | $ | 150,000 | | | $ | 150,000 | |
(1) Our Florida State Board of Administration Note was held by our former subsidiary, UPC.
(2) Our Truist Term Note Payable was repaid in full on August 12, 2022.
AMERICAN COASTAL INSURANCE CORPORATION
Notes to Unaudited Condensed Consolidated Financial Statements
June 30, 2023March 31, 2024
11) LONG-TERM DEBT
Senior Notes Payable
On December 13, 2017, we issued $150,000,000 of 10-year senior notes (the Senior Notes) that will mature on December 15, 2027 and bear interest at a rate equal to 6.25% per annum payable semi-annually on each June 15 and December 15, commencing June 15, 2018. The Senior Notes are senior unsecured obligations of the Company. We may redeem the Senior Notes at our option, at any time and from time to time in whole or in part, prior to September 15, 2027, at a redemption price equal to the greater of (i) 100% of the principal amount of the notes to be redeemed and (ii) the sum of the present values of the remaining scheduled payments of principal and interest thereon from the date of redemption to the date that is three months prior to maturity, plus accrued and unpaid interest thereon. On or after that date, we may redeem the Senior Notes at par, plus accrued and unpaid interest thereon. On December 8, 2022, the Kroll Bond Rating Agency, LLC announced a downgrade of our issuer and debt ratings from BBB- to BB+. As a result, pursuant to our agreement, the interest rate of our Senior Notes increased from 6.25% to 7.25%.
Florida State Board of Administration Note Payable
On September 22, 2006, we issued a $20,000,000, 20-year note payable to the Florida State Board of Administration (the SBA Note). For the first three years of the SBA Note we were required to pay interest only. On October 1, 2009, we began to repay the principal in addition to interest. The SBA Note bears an annual interest rate equivalent to the 10-year Constant Maturity Treasury rate (as defined in the SBA Note agreement), which resets quarterly. This note was held by our former insurance subsidiary, UPC. On February 27, 2023, UPC was placed into receivership with the Florida Department of Financial Services, divesting our ownership of UPC.
Truist Term Note Payable
On May 26, 2016, we issued a $5,200,000, 15-year term note payable to Truist (the Truist Note), with the intent to use the funds to purchase, renovate, furnish and equip our principal executive office. The Truist Note bears interest at 1.65% in excess of the one-month LIBOR, which resets monthly. LIBOR was phased out at the end of 2021, however, the Intercontinental Exchange will continue to publish one-month LIBOR settings through 2023. The outstanding Truist Note payable balance, including applicable interest, was repaid in full on August 12, 2022. Therefore, effective August 12, 2022, Truist no longer holds our principal executive office as collateral and may not take possession of or foreclose upon the office.
Financial Covenants
Senior Notes - Our Senior Notes provide that the Company and its subsidiaries shall not incur any indebtedness unless no default exists and the Company’s leverage ratio as of the last day of any annual or quarterly period (the balance sheet date) immediately preceding the date on which such additional indebtedness is incurred would have been no greater than 0.3:1, determined on a pro forma basis as if the additional indebtedness and all other indebtedness incurred since the immediately preceding balance sheet date had been incurred and the proceeds therefrom applied as of such day. The Company and its subsidiaries also may not create, assume, incur or permit to exist any indebtedness for borrowed money that is secured by a lien on the voting stock of any significant subsidiary without securing the Senior Notes equally. The Company may not issue, sell, assign, transfer or otherwise dispose of, directly or indirectly, any of the capital stock of the Company’s significant subsidiaries as of the issue date of the Senior Notes (except to the Company or to one or more of the Company’s other subsidiaries, or for the purpose of qualifying directors or as may be required by law or regulation), subject to certain exceptions. At December 31, 2022,2023, while our leverage ratio was greater than the allowed ratio above, we did not incur any additional debtindebtedness during the period and as a result, we were in compliance with the covenants in the Senior Notes.
SBA Note - Our SBA Note required that UPC maintained either a 2:1 ratio of net written premium to surplus, or net writing ratio, or a 6:1 ratio of gross written premium to surplus, or gross writing ratio, to avoid additional interest penalties. The SBA Note agreement defined surplus for the purpose of calculating the required ratios as the $20,000,000 of capital contributed to UPC under the agreement plus the outstanding balance of the note. Should UPC have failed to exceed either a net writing ratio of 1.5:1 or a gross writing ratio of 4.5:1, UPC's interest rate would have increased by 450 basis points above the 10-year Constant Maturity Treasury rate, which was 3.81% at the end of June 2023. Any other writing ratio deficiencies resulted in an interest rate penalty of 25 basis points above the stated rate of the note. Our SBA Note further provided that the Florida State Board of Administration may, among other things, declare its loan immediately due and payable upon any default existing
AMERICAN COASTAL INSURANCE CORPORATION
Notes to Unaudited Condensed Consolidated Financial Statements
June 30, 2023
under the SBA Note; however, any payment is subject to approval by the insurance regulatory authority. At June 30, 2023, we no longer held the SBA Note as a result of placing UPC into receivership.
Debt Issuance Costs
The table below presents the rollforwardroll forward of our debt issuance costs paid, in conjunction with the debt instruments described above, during the sixthree months ended June 30, 2023March 31, 2024 and 2022:2023:
| | 2024 | | | 2024 | | 2023 |
| Balance at January 1, | |
| | 2023 | | 2022 |
| Balance at January 1, | $ | 1,645 | | | $ | 1,998 | |
| Additions | — | | | — | |
| Amortization | Amortization | (166) | | | (168) | |
| Balance at June 30, | $ | 1,479 | | | $ | 1,830 | |
| Amortization | |
| Amortization | |
| Balance at March 31, | |
12) COMMITMENTS AND CONTINGENCIES
Litigation
We are involved in claims-related legal actions arising in the ordinary course of business. We accrue amounts resulting from claims-related legal actions in unpaid losses and LAE during the period that we determine an unfavorable outcome becomes probable and we can estimate the amounts. Management makes revisions to our estimates based on its analysis of subsequent information that we receive regarding various factors, including: (i) per claim information; (ii) company and industry historical loss experience; (iii) judicial decisions and legal developments in the awarding of damages; and (iv) trends in general economic conditions, including the effects of inflation.
AMERICAN COASTAL INSURANCE CORPORATION
Notes to Unaudited Condensed Consolidated Financial Statements
March 31, 2024
At June 30,On October 20, 2023, we received notice that the Company isDFS filed a notice of claim and demand for tender of insurance policy limits under our director and officer insurance to carriers participating in our director and officer’s insurance program (the “Claim”). The Claim alleges that former officers and directors of UPC were involved in legal proceedings whereby on August 18, 2021, Jacqueline A. Miraglia filed suit in the United States District Court for the District of Delaware against United Insurance Holdings Corp. alleging violations arising under Title VII of the Civil Rights Act of 1964 and the Age Discrimination in Employment Act of 1967, and sought damages in an unspecified amount. On September 27, 2022, venue was transferred to the United States District Court for the Middle District of Florida, Tampa Division and in November, 2022, the plaintiff amended the complaint to add Skyway Claims Services as a defendant. On July 6, 2023, the Company entered into a Settlement Agreement and General Release, whichwrongful acts that resulted in an immaterial paymentUPCs insolvency and demands immediate tender of our director and officer’s policy limit of $40,000,000 where we have a retention of $1,500,000. The former directors and officers of UPC deny the allegations. Although no litigation has arisen from the Claim, litigation is anticipated. The directors and officers plan to vigorously defend against the plaintiff and did not involve an admissionClaim; however, due to our indemnification obligation, during 2023, we accrued the policy retention amount of any wrongdoing by any party.$1,500,000. This claim remains open as of March 31, 2024.
Commitments to fund partnership investments
We have fully funded one limited partnership investments andinvestment. We have committed to fund our remaining limited partnership investment. The amount ofno unfunded commitments was $3,602,000 and $4,238,000 at June 30, 2023March 31, 2024 and December 31, 2022, respectively.2023.
Leases
We, as lessee, have entered into leases of commercial office space of various term lengths. In addition to office space, we lease office equipment and a parking lot under operating leases and vehicles under finance leases.
The classification of operating and finance lease asset and liability balances within the Unaudited Condensed Consolidated Balance Sheets was as follows:
AMERICAN COASTAL INSURANCE CORPORATION
Notes to Unaudited Condensed Consolidated Financial Statements
June 30, 2023
| | Financial Statement Line | | June 30, 2023 | | December 31, 2022 |
| | Financial Statement Line | | | | Financial Statement Line | | March 31, 2024 | | December 31, 2023 |
| Assets | Assets | | | | |
| Operating lease assets | Operating lease assets | | Other assets | | $ | 903 | | | $ | 1,278 | |
| Financing lease assets | | Property and equipment, net | | — | | | 51 | |
| Operating lease assets | |
| Operating lease assets | |
| | Total lease assets | |
| Total lease assets | |
| Total lease assets | Total lease assets | | $ | 903 | | | $ | 1,329 | |
| | Liabilities | Liabilities | |
| Liabilities | |
| Liabilities | |
| Operating lease liabilities | Operating lease liabilities | | Operating lease liability | | $ | 1,172 | | | $ | 1,689 | |
| Financing lease liabilities | | Other liabilities | | — | | | 2 | |
| Operating lease liabilities | |
| Operating lease liabilities | |
| | Total lease liabilities | Total lease liabilities | | $ | 1,172 | | | $ | 1,691 | |
| Total lease liabilities | |
| Total lease liabilities | |
The components of lease expenses were as follows:
| | Three Months Ended June 30, | | Six Months Ended June 30, |
| 2023 | | 2022 | | 2023 | | 2022 |
| | | | Three Months Ended March 31, | |
| | | | Three Months Ended March 31, | |
| | | | Three Months Ended March 31, | |
| | | | | | 2024 | | | | | | | | 2024 | | 2023 |
| Operating lease expense | Operating lease expense | | $ | 222 | | | $ | 160 | | | $ | 444 | | | $ | 320 | |
| Financing lease expense: | Financing lease expense: | |
| Amortization of leased assets | Amortization of leased assets | | 2 | | | 113 | | | 9 | | | 242 | |
| Interest on lease liabilities | | — | | | 1 | | | — | | | 1 | |
| Amortization of leased assets | |
| Amortization of leased assets | |
| | | Net lease expense | Net lease expense | | $ | 224 | | | $ | 274 | | | $ | 453 | | | $ | 563 | |
| | Net lease expense | |
| | Net lease expense | |
At June 30, 2023,March 31, 2024, future minimum gross lease payments relating to these non-cancellable operating lease agreements were as follows:
| | | | | | | March 31, 2024 | |
| | | | | | March 31, 2024 | |
| | | | | | March 31, 2024 | |
| Remaining in 2024 | |
| 2025 | |
| 2026 | |
| 2027 | |
| | | | | | Total |
| Remaining in 2023 | | | | $ | 432 | |
| 2024 | | | | 593 | |
| 2025 | | | | 222 | |
| 2026 | | | | 11 | |
| Total undiscounted future minimum lease payments | |
| | Total undiscounted future minimum lease payments | |
| | Total undiscounted future minimum lease payments | Total undiscounted future minimum lease payments | | | | 1,258 | |
| Less: Imputed interest | Less: Imputed interest | | | | (86) | |
| Present value of lease liabilities | Present value of lease liabilities | | | | $ | 1,172 | |
AMERICAN COASTAL INSURANCE CORPORATION
Notes to Unaudited Condensed Consolidated Financial Statements
March 31, 2024
Weighted average remaining lease term and discount rate related to operating and finance leases were as follows:
| | | | | | | | | | | | | | |
| | June 30, 2023 | | December 31, 2022 |
| Weighted average remaining lease term (months) | | | | |
| Operating leases | | 21 | | | 25 | |
| Financing leases | | — | | | 9 | |
| | | | |
| Weighted average discount rate | | | | |
| Operating leases | | 3.57 | % | | 3.79 | % |
| Financing leases | | — | % | | 3.27 | % |
| | | | | | | | | | | | | | |
| | March 31, 2024 | | December 31, 2023 |
| Weighted average remaining lease term (months) | | 20 | | | 17 | |
| | | | |
| Weighted average discount rate | | 3.47 | % | | 3.30 | % |
| | | | |
There were no other cash or non-cash related activities during the three or six months ended June 30, 2023March 31, 2024 and 2022.2023.
AMERICAN COASTAL INSURANCE CORPORATION
Notes to Unaudited Condensed Consolidated Financial Statements
June 30, 2023
Capital lease amortization expenses are included in depreciation expense in our Unaudited Condensed Consolidated Statements of Comprehensive Loss.Income. See Note 7 of these Notes to Unaudited Condensed Consolidated Financial Statements for more information regarding depreciation expense, Note 11 for information regarding commitments related to long-term debt, and Note 14 for information regarding commitments related to regulatory actions.
Subleases
We previously leased and occupied office space in which we no longer operate. Effective October 1, 2022, this office space is nowwas subleased to a third-party. ThisThe sublease iswas effective from October 1, 2022 through July 31, 2025, with no option to extend. During the six months ended June 30, 2023, we recognized $99,000 of income related toHowever, on February 29, 2024, this sublease exclusivewas cancelled as a part of an agreement to terminate the original lease expense associated with the original lease.office space. During the yearthree months ended DecemberMarch 31, 2022,2024, we recognized $297,000$33,000 of income related to this sublease, exclusive of the lease expense associated with the original lease.
Additionally, as a result of the sublease, we evaluated our right-of-use asset associated with the original lease for impairment, using the undiscounted cash flows from the sublease. During the year ended December 31, 2022, we recognized impairment of $175,000, which was recognized in the results of our personal lines operating segment.
Employee Retention Credit
A series of legislation was enacted in the United States during 2020 and 2021 in response to the COVID-19 pandemic that provided financial relief for businesses impacted by government-mandated shutdowns, work stoppages, or other losses suffered by employers. The Coronavirus Aid, Relief, and Economic Security Act (CARES Act) provided an employee retention credit, which is a refundable tax credit against certain employment taxes of up to $5,000 per employee for eligible employers. The tax credit is equal to 50% of qualified wages paid to employees during a quarter, capped at $10,000 of qualified wages per employee. During the second quarter of 2022, we evaluated our eligibility and filed for a $10,161,000 refund in connection with our Employee Retention Tax Credit for the tax year ended December 31, 2021. As of June 30, 2023,March 31, 2024, we have received $5,718,000 from the Internal Revenue ServiceIRS related to this refund. A gain contingency is an uncertain situation that will be resolved in the future, possibly resulting in a gain. We have not recognized this gain contingency of $10,161,000 within our financial statements except for the $5,718,000 that has already been received.
WhileQuota Share Commission Loss Contingency
AmCoastal participates in shared quota-share reinsurance agreements with our former subsidiary, UPC, which are subject
to a variable ceding commission based on loss experience. With the receivership of UPC in 2023, we believehave not received data
related to UPC losses that could unfavorably shift AmCoastal’s commission related to these contracts. In addition, we cannot
reasonably determine how this shift will be allocated between the likelihoodcontracted parties. Until we receive this loss data and provide
the updated calculations to both our reinsurance partners and the DFS, as receiver of UPC, we are unable to estimate the refund approval being reversed is low,impact,
however, we believe a loss contingency related to the extentthese commissions may exist as of the refunds received and recognized of $5,718,000 is present. March 31, 2024.
We will continue to monitor the matter for further developments that could affect the outcome of these contingencies and will make any appropriate adjustments each quarter.
13) ALLOWANCE FOR EXPECTED CREDIT LOSSES
We are exposed to credit losses primarily through fourthree different pools of assets based on similar risk characteristics: premiums receivable for direct written business; reinsurance recoverables from ceded losses to our reinsurers; and our investment holdings; and our notes receivable.holdings. We estimate the expected credit losses based on historical trends, credit ratings assigned to reinsurers by rating agencies, average default rates, current economic conditions, and reasonable and supportable forecasts of future economic conditions that affect the collectability of the reported amounts over its expected life. Changes in the relevant information may significantly affect the estimates of expected credit losses.
AMERICAN COASTAL INSURANCE CORPORATION
Notes to Unaudited Condensed Consolidated Financial Statements
March 31, 2024
The allowance for credit losses is deducted from the amortized cost basis of the assets to present their net carrying value at the amount expected to be collected. Each period, the allowance for credit losses is adjusted through earnings to reflect expected credit losses over the remaining lives of the assets.
The following tables summarize our allowance for expected credit losses by pooled asset for the sixthree months ended June 30,March 31, 2024 and 2023, and 2022, respectively:
AMERICAN COASTAL INSURANCE CORPORATION
Notes to Unaudited Condensed Consolidated Financial Statements
June 30, 2023
| | | | | | | | | | | | | | | | | | | | | | | | | | |
| June 30, 2023 | | December 31, 2022 | | Provision for expected credit losses | | Write-offs | | June 30, 2023 |
| Premiums Receivable | | $ | 32 | | | $ | (47) | | | $ | 43 | | | $ | 28 | |
| Reinsurance Recoverables | | 333 | | | (164) | | | — | | | 169 | |
| | | | | | | | |
| Total | | $ | 365 | | | $ | (211) | | | $ | 43 | | | $ | 197 | |
| | | | | | | | |
| June 30, 2022 | | December 31, 2021 | | Provision for expected credit losses | | Write-offs | | June 30, 2022 |
| Premiums Receivable | | $ | 16 | | | $ | (21) | | | $ | 22 | | | $ | 17 | |
| Reinsurance Recoverables | | 58 | | | 23 | | | — | | | 81 | |
| | | | | | | | |
| Total | | $ | 74 | | | $ | 2 | | | $ | 22 | | | $ | 98 | |
| | | | | | | | | | | | | | | | | | | | | | | | | | |
| March 31, 2024 | | December 31, 2023 | | Provision for expected credit losses | | Write-offs | | March 31, 2024 |
| Premiums Receivable | | $ | 51 | | | $ | (16) | | | $ | 18 | | | $ | 53 | |
| Reinsurance Recoverables | | 97 | | | (32) | | | — | | | 65 | |
| | | | | | | | |
| Total | | $ | 148 | | | $ | (48) | | | $ | 18 | | | $ | 118 | |
| | | | | | | | |
| March 31, 2023 | | December 31, 2022 | | Provision for expected credit losses | | Write-offs | | March 31, 2023 |
| Premiums Receivable | | $ | 32 | | | $ | (34) | | | $ | 29 | | | $ | 27 | |
| Reinsurance Recoverables | | 333 | | | (183) | | | — | | | 150 | |
| | | | | | | | |
| Total | | $ | 365 | | | $ | (217) | | | $ | 29 | | | $ | 177 | |
14) STATUTORY ACCOUNTING AND REGULATION
The insurance industry is heavily regulated. State laws and regulations, as well as national regulatory agency requirements, govern the operations of all insurers such as our insurance subsidiaries. The various laws and regulations require that insurers maintain minimum amounts of statutory surplus and risk-based capital, restrict insurers' ability to pay dividends, specify allowable investment types and investment mixes, and subject insurers to assessments. Effective June 1, 2022, our insurance subsidiaries JIC and AmCoastal were merged, with AmCoastal being the surviving entity. Effective May 31, 2022, our former insurance subsidiaries UPC and FSIC were merged, with UPC being the surviving entity. Both UPC and AmCoastal areis domiciled in Florida, while IIC is domiciled in New York. At June 30, 2023,March 31, 2024, and during the sixthree months then ended, AmCoastal and IIC met all regulatory requirements of the states in which they operate. As of December 31, 2022, UPC was determined to be insolvent and effective February 27, 2023 was placed into receivership by the DFS.
During 2023, we received an assessment notice from the Florida Insurance Guaranty Association (FIGA). This assessment will be 0.7% on direct written premium of all covered lines of business in Florida to cover the cost of an insurance company facing insolvency. This assessment is in addition to the 1.3% assessment, described below, and is recoupable from policyholders. During 2022, we received an assessment notice from FIGA. This assessment will bewas 1.3% on direct written premium of all covered lines of business in Florida to cover the cost of an insurance company facing insolvency.
The National Association of Insurance Commissioners (NAIC) has Risk-Based Capital (RBC) guidelines for insurance companies that are designed to assess capital adequacy and to raise the level of protection that statutory surplus provides for policyholders. Most states, including Florida and New York, have enacted statutory requirements adopting the NAIC RBC guidelines, and insurers having less statutory surplus than required will be subject to varying degrees of regulatory action, depending on the level of capital inadequacy. State insurance regulatory authorities could require an insurer to cease operations in the event the insurer fails to maintain the required statutory capital.
The state laws of Florida and New York permit an insurer to pay dividends or make distributions out of that part of statutory surplus derived from net operating profit and net realized capital gains. The state laws further provide calculations to determine the amount of dividends or distributions that can be made without the prior approval of the insurance regulatory authorities in those states and the amount of dividends or distributions that would require prior approval of the insurance regulatory authorities in those states. Statutory RBC requirements may further restrict our insurance subsidiaries' ability to pay dividends or make distributions if the amount of the intended dividend or distribution would cause statutory surplus to fall below minimum RBC requirements. Additionally, in connection with our former subsidiary UPC's plan for run off, IIC has agreed not to pay ordinary dividends without prior approval of the New York Department of Financial Services until January 1, 2025.
Our insurance subsidiaries must each file with the various insurance regulatory authorities an “Annual Statement” which reports, among other items, statutory net income (loss) and surplus as regards policyholders, which is called stockholders'
AMERICAN COASTAL INSURANCE CORPORATION
Notes to Unaudited Condensed Consolidated Financial Statements
March 31, 2024
equity under GAAP. The table below details the statutory net income (loss) for each of our regulated entities for the three and six months ended June 30, 2023March 31, 2024 and 2022.2023.
AMERICAN COASTAL INSURANCE CORPORATION
Notes to Unaudited Condensed Consolidated Financial Statements
June 30, 2023
| | Three Months Ended June 30, | | Six Months Ended June 30, |
| 2023 | | 2022 | | 2023 | | 2022 |
AmCoastal(1) | | 40,883 | | | 4,577 | | | 59,113 | | | 10,687 | |
| | | | Three Months Ended March 31, | |
| | | | Three Months Ended March 31, | |
| | | | Three Months Ended March 31, | |
| | | | | | 2024 | | | | | | | | 2024 | | 2023 |
| AmCoastal | |
| IIC | IIC | | (278) | | | 1,389 | | | (2,481) | | | (2,596) | |
| Total | Total | | $ | 40,605 | | | $ | 5,966 | | | $ | 56,632 | | | $ | 8,091 | |
(1) AmCoastal results are inclusive of JIC as these entities were merged effective June 1, 2022.
Our insurance subsidiaries must maintain capital and surplus ratios or balances as determined by the regulatory authority of the states in which they are domiciled. At June 30, 2023,March 31, 2024, we met these requirements. The table below details the amount of surplus as regards policyholders for each of our regulated entities at June 30, 2023March 31, 2024 and December 31, 2022.2023.
| | June 30, 2023 | | December 31, 2022 |
AmCoastal(1) | | 122,200 | | | 77,511 | |
| | March 31, 2024 | | | | March 31, 2024 | | December 31, 2023 |
| AmCoastal | |
| IIC | IIC | | 23,574 | | | 26,152 | |
| Total | Total | | $ | 145,774 | | | $ | 103,663 | |
(1) AmCoastal results are inclusive of JIC as these entities were merged effective June 1, 2022.
15) ACCUMULATED OTHER COMPREHENSIVE LOSS
We report changes in other comprehensive income (loss) items within comprehensive income (loss) on the Unaudited Condensed Consolidated Statements of Comprehensive Income, (Loss), and we include accumulated other comprehensive income (loss) as a component of stockholders' equity on our Unaudited Condensed Consolidated Balance Sheets.
The table below details the components of accumulated other comprehensive loss at period end:
| | | | | | | | | | | | | | | | | |
| | Pre-Tax Amount | | Tax (Expense) Benefit | | Net-of-Tax Amount |
| December 31, 2022 | $ | (33,041) | | | $ | 2,094 | | | $ | (30,947) | |
| Changes in net unrealized losses on investments | 3,407 | | | 1,366 | | | 4,773 | |
| Reclassification adjustment for realized losses | 5,464 | | | (1,366) | | | 4,098 | |
| Impact of deconsolidation of discontinued operations | $ | (3) | | | $ | 1,007 | | | $ | 1,004 | |
| June 30, 2023 | $ | (24,173) | | | $ | 3,101 | | | $ | (21,072) | |
| | | | | | | | | | | | | | | | | |
| | Pre-Tax Amount | | Tax (Expense) Benefit | | Net-of-Tax Amount |
| December 31, 2023 | $ | (20,238) | | | $ | 3,101 | | | $ | (17,137) | |
| Changes in net unrealized losses on investments | (198) | | | — | | | (198) | |
| Reclassification adjustment for realized losses | — | | | — | | | — | |
| | | | | |
| March 31, 2024 | $ | (20,436) | | | $ | 3,101 | | | $ | (17,335) | |
16) STOCKHOLDERS' EQUITY
Our Board of Directors declared no dividends on our outstanding shares of common stock to stockholders of record as follows for the periods presented (in thousands, except per share amounts):
| | | | | | | | | | | | | | | | | | | | | | | | | | |
| | Six Months Ended June 30, |
| | 2023 | | 2022 |
| | Per Share Amount | | Aggregate Amount | | Per Share Amount | | Aggregate Amount |
| First Quarter | | $ | — | | | $ | — | | | $ | 0.06 | | | $ | 2,589 | |
| Second Quarter | | — | | | — | | | — | | | — | |
| | | | | | | | |
| | | | | | | | |
In July 2019, our Board of Directors authorized a stock repurchase plan of up to $25,000,000 of our common stock. As of June 30, 2023,March 31, 2024, we had not yet repurchased any shares under this stock repurchase plan. The timing and volume of repurchases are at the discretion of management, based on the capital needs of the business, the market price of ACIC common stock, and general market conditions. The plan has no expiration date, and the plan may be suspended or discontinued at any time.
In September 2023, the Company entered into an equity distribution agreement (the “Agreement”) with Raymond James & Associates, Inc., as agent (the “Agent”), of up to 8,000,000 shares of the Company’s common stock, par value $0.0001 per share (the “Shares”). Sales of the Shares under the Agreement will be made in sales deemed to be “at the market offerings”. The Agent is not required to sell any specific amount of Shares but has agreed to act as the Company’s sales agent for a commission equal to 3.0% of the gross proceeds from the sales of the Shares. As of March 31, 2024, 4,373,000 shares have been sold under the Agreement resulting in commissions paid of approximately $1,181,000 and net proceeds of approximately $38,190,000.
AMERICAN COASTAL INSURANCE CORPORATION
Notes to Unaudited Condensed Consolidated Financial Statements
June 30, 2023March 31, 2024
The Agreement will terminate upon the issuance and sale of all Shares subject to the Agreement, or the Agreement may be suspended or discontinued at any time. The Company does not plan to sell additional shares under the at-the-market program to which this Agreement relates during the first half of 2024.
See Note 17 in these Notes to Unaudited Condensed Consolidated Financial Statements for information regarding stock-based compensation activity.
17) STOCK-BASED COMPENSATION
We account for stock-based compensation under the fair value recognition provisions of ASC Topic 718 - Compensation - Stock Compensation. We recognize stock-based compensation cost over the award’s requisite service period on a straight-line basis for time-based restricted stock grants and performance-based restricted stock grants. We record forfeitures as they occur for all stock-based compensation.
The following table presents our total stock-based compensation expense:
| | Three Months Ended June 30, | | Six Months Ended June 30, |
| 2023 | | 2022 | | 2023 | | 2022 |
| | | | Three Months Ended March 31, | |
| | | | Three Months Ended March 31, | |
| | | | Three Months Ended March 31, | |
| | | | | | 2024 | | | | | | | | 2024 | | 2023 |
| Employee stock-based compensation expense | Employee stock-based compensation expense | | | | | | | | |
| Pre-tax | |
| Pre-tax | |
| Pre-tax | Pre-tax | | $ | 79 | | | $ | 141 | | | $ | 388 | | | $ | 531 | |
Post-tax (1) | Post-tax (1) | | 62 | | | 111 | | | 307 | | | 419 | |
| Director stock-based compensation expense | Director stock-based compensation expense | |
| Pre-tax | Pre-tax | | 29 | | | 41 | | | 55 | | | 103 | |
| Pre-tax | |
| Pre-tax | |
Post-tax (1) | Post-tax (1) | | 23 | | | 32 | | | 43 | | | 81 | |
(1) The after tax amounts are determined using the 21% corporate federal tax rate.
We had approximately $2,676,000$1,886,000 of unrecognized stock compensation expense at June 30, 2023March 31, 2024 related to non-vested stock-based compensation granted, which we expect to recognize over a weighted-average period of approximately 2.31.7 years. We had approximately $218,000$41,000 of unrecognized director stock-based compensation expense at June 30, 2023March 31, 2024 related to non-vested director stock-based compensation granted, which we expect to recognize over a weighted-average period of approximately 0.90.2 years.
Restricted stock, restricted stock units and performance stock units
Stock-based compensation cost for restricted stock awards, restricted stock units and performance stock units is measured based on the closing fair market value of our common stock on the date of grant, which vest in equal installments over the requisite service period of typically three years. Restricted stock awards granted to non-employee directors vest over a one-year period. Each restricted stock unit and performance stock unit represents our obligation to deliver to the holder one share of common stock upon vesting.
Performance stock units vest based on the Company's return on average equity compared to a defined group of peer companies. On the grant date, we issue the target number of performance stock units. They are subject to forfeitures if performance goals are not met. The actual number of performance stock units earned can vary from zero to 150 percent of the target for the 2023, 2022 and 2021 awards.
We granted 45,000 and 793,04130,000 shares of restricted common stock during the three months ended June 30, 2023 and 2022, respectively,March 31, 2024, which had a weighted-average grant date fair value of $5.25 and $1.74 per share, respectively.$9.46. We granted 45,000 and 907,907did not grant shares of restricted common stock during the sixthree months ended June 30, 2023 and 2022, respectively, which had a weighted-average grant date fair valueMarch 31, 2023.
The following table presents certain information related to the activity of $5.25 and $1.97 per share, respectively. Additionally, during the three and six month periods ended June 30, 2023, the Company granted 262,933 shares ofour non-vested restricted common stock with a fair value of $4.33, which are contingent upon stockholder approval of an increase in the number of shares of our common stock that may be issued pursuant to the 2020 Omnibus Incentive Plan. Stockholders will vote on this matter at our 2024 annual meeting of stockholders.
AMERICAN COASTAL INSURANCE CORPORATION
Notes to Unaudited Condensed Consolidated Financial Statements
June 30, 2023March 31, 2024
The following table presents certain information related to the activity of our non-vested common stock grants:
| | | | | | | | | | | |
| Number of Restricted Shares | | Weighted Average Grant Date Fair Value |
| Outstanding as of December 31, 2022 | 714,239 | | | $ | 2.73 | |
Granted (1) | 45,000 | | | 5.25 | |
| Less: Forfeited | 130,546 | | | 3.16 | |
| Less: Vested | 179,334 | | | 3.20 | |
| Outstanding as of June 30, 2023 | 449,359 | | | $ | 2.67 | |
| | | | | | | | | | | |
| Number of Restricted Shares | | Weighted Average Grant Date Fair Value |
Outstanding as of December 31, 2023(1) | 445,646 | | | $ | 2.64 | |
| Granted | 30,000 | | | 9.46 | |
| Less: Forfeited | 856 | | | 3.59 | |
| Less: Vested | 32,233 | | | 4.36 | |
| Outstanding as of March 31, 2024 | 442,557 | | | $ | 2.98 | |
(1) Contingent shares granted during 2023 have been excluded from the calculations in the table above.
Stock options
Stock option fair value was estimated on the grant date using the Black-Scholes-Merton formula. Stock options vest in equal installments over the requisite service period of typically three years. The following weighted-average assumptions were used to value the stock options granted:
| | 2023 | | 2022 |
| 2024 | | | 2024 | | 2023 |
| Expected annual dividend yield | Expected annual dividend yield | — | % | | — | % | Expected annual dividend yield | — | % | | — | % |
| Expected volatility | Expected volatility | 80.84 | % | | 49.66 | % | Expected volatility | — | % | | 80.84 | % |
| Risk-free interest rate | Risk-free interest rate | 3.44 | % | | 2.92 | % | Risk-free interest rate | — | % | | 3.44 | % |
| Expected term | Expected term | 6 years | | 6 years | Expected term | N/A | | 6 years |
The expected annual dividend yield for our options granted during 20232024 and 20222023 is based on no dividends being paid in future quarters. The expected volatility is a historical volatility calculated based on the daily closing prices over a period equal to the expected term. The risk-free interest rate is based on the U.S. Treasury yield curve in effect at the grant date. Expected term takes into account the three-year graded vesting term and the 10-year contractual term of the option.
We did not grant any stock options for the three and six months ended June 30,March 31, 2024 and 2023. We granted 635,643 stock options during the three and six month periods ended June 30, 2022, which had a weighted average grant date fair value of $0.86 per share. Additionally, during the three and six months ended June 30, 2023, the Company granted 123,399 stock options, with a fair value of $3.08, which are contingent upon stockholder approval of an increase in the number of shares of our common stock that may be issued pursuant to the 2020 Omnibus Incentive Plan. Stockholders will vote on this matter at our 2024 annual meeting of stockholders.
The following table presents certain information related to the activity of our non-vested stock option grants:
| | | | | | | | | | | | | | | | | | | | | | | |
| Number of Stock Options | | Weighted Average Exercise Prices | | Weighted Average Remaining Contractual Term (years) | | Aggregate Intrinsic Value |
| Outstanding as of December 31, 2022 | 1,250,685 | | | $ | 3.71 | | | 7.66 | | | $ | — | |
Granted(1) | — | | | — | | | — | | | — | |
| Less: Forfeited | 40,000 | | | 3.46 | | | — | | | — | |
| Less: Expired | 161,925 | | | 3.05 | | | — | | | — | |
| Less: Exercised | 20,000 | | | 3.46 | | | — | | | — | |
| Outstanding as of June 30, 2023 | 1,028,760 | | | $ | 3.83 | | | 8.30 | | | $ | 1,561 | |
| | | | | | | |
Vested as of June 30, 2023(2) | 800,759 | | | $ | 5.25 | | | 7.99 | | | $ | 653 | |
| Exercisable as of June 30, 2023 | 430,568 | | | $ | 5.25 | | | 7.99 | | | $ | 653 | |
| | | | | | | | | | | | | | | | | | | | | | | |
| Number of Stock Options | | Weighted Average Exercise Prices | | Weighted Average Remaining Contractual Term (years) | | Aggregate Intrinsic Value (3) |
Outstanding as of December 31, 2023(1) | 1,028,760 | | | $ | 3.83 | | | 7.80 | | | $ | 6,151,000 | |
| Granted | — | | | — | | | — | | | — | |
| Less: Forfeited | — | | | — | | | — | | | — | |
| Less: Expired | — | | | — | | | — | | | — | |
| Less: Exercised | — | | | — | | | — | | | — | |
| Outstanding as of March 31, 2024 | 1,028,760 | | | $ | 3.83 | | | 7.55 | | | $ | 7,368,000 | |
| | | | | | | |
Vested as of March 31, 2024(2) | 920,818 | | | $ | 4.78 | | | 7.31 | | | $ | 3,736,000 | |
| Exercisable as of March 31, 2024 | 580,568 | | | $ | 4.78 | | | 7.31 | | | $ | 3,736,000 | |
(1) Contingent options granted during 2023 have been excluded from the calculations in the table above.
(2) The vested shares are calculated based on all vested shares at June 30, 2023,March 31, 2024, inclusive of those that have since expired. The weighted average exercise prices, weighted-average remaining contractual term and aggregate intrinsic value is calculated based on only vested shares that are outstanding and exercisable at June 30, 2023.March 31, 2024.
(3) Presented in ones.
AMERICAN COASTAL INSURANCE CORPORATION
Notes to Unaudited Condensed Consolidated Financial Statements
June 30, 2023March 31, 2024
18) SUBSEQUENT EVENTS
We evaluate all subsequent events and transactions for potential recognition or disclosure in our financial statements.
At June 30, 2023,Effective April 17, 2024, the Company secured $200 million dollars of excess of loss reinsurance limit related to its AmCoastal core catastrophe reinsurance program for 2024-2025. This limit attaches to AmCoastal's reinsurance coverage at $275 million and was involved in legal proceedings whereby on August 18, 2021, Jacqueline A. Miraglia filed suit in the United States District Court for the District of Delaware against United Insurance Holdings Corp. alleging violations arising under Title VII of the Civil Rights Act of 1964 and the Age Discrimination in Employment Act of 1967, and sought damages in an unspecified amount. On September 27, 2022, venue was transferred to the United States District Court for the Middle District of Florida, Tampa Division and in November, 2022, the plaintiff amended the complaint to add Skyway Claims Services asobtained through 10.25% catastrophe bonds issued by Armor Re II Ltd., a defendant. On July 6, the Company entered into a Settlement Agreement and General Release, which resulted in an immaterial payment to the plaintiff and does not involve an admission of any wrongdoing by any party.Bermuda-domiciled special purpose insurer.
On July 10, 2023, we filedMay 9, 2024, the Company signed definitive agreements with the Secretary of the State of the State of Delaware a Second Certificate of Amendment of Certificate of Incorporation to change its corporate name from UnitedForza Insurance Holdings, Corp. to American Coastal Insurance Corporation, effective July 10, 2023. In connection with the Company's name change, the Board of Directors amended the Company's by-laws to reflect the corporate name American Coastal Insurance Corporation, also effective on July 10, 2023. No other changes were made to the Company's by-laws.
On July 27, 2023, we announced thatLLC ("Forza") in which the Company will begin tradingsell and Forza will acquire 100% of the issued and outstanding stock of IIC. Closing is subject to the approval of the New York Department of Financial Services. Concurrently, IIC and SageSure entered into a Program Administrator Agreement and Claims Services Agreement on NASDAQ underMay 9, 2024. Under the ticker symbol "ACIC", prior to market openterms of these service agreements, SageSure will provide policy administration, underwriting and claims administration services on August 15, 2023. The new ticker replaces the current ticker symbol "UIHC", which has been used since the Company's formation and initial public offering on the over-the-counter (OTC) market in 2007, and subsequent listing on The Nasdaq Capital Market in 2012.behalf of IIC.
On August 10, 2023, the Company issued a press release related to its earnings for the second quarter ended June 30, 2023 (the Earnings Release). The Earnings Release was filed as exhibit 99.1 to the Form 8-K filed on August 10, 2023. Subsequent to the Earnings Release, the Company has reported changes to its provision for income taxes and Income from discontinued operations, net of tax on its Consolidated Statements of Comprehensive Loss. In addition, the Company has decreased its reported other liabilities and increased its reported other assets on its Consolidated Balance Sheets.
On August 21, 2023, the Company filed an amended 10-Q for the first quarter ended March 31, 2023. This amended filing corrects our allocation of discontinued operations to include activities related directly to the support of our former subsidiary UPC. In addition, this amendment corrects our provision for income taxes to appropriately reflect the impact of the disposition of UPC.
AMERICAN COASTAL INSURANCE CORPORATION
Item 2. Management's Discussion and Analysis of Financial Condition and Results of Operations
The following discussion and analysis of our financial condition and results of operations should be read in conjunction with our Unaudited Condensed Consolidated Financial Statements and related notes appearing elsewhere in this Form 10-Q, as well as with the Consolidated Financial Statements and related footnotes under Part II. Item 8 of our Annual Report on Form 10-K for the year ended December 31, 2022.2023. This discussion and analysis contains forward-looking statements that involve risks, uncertainties and assumptions. Actual results may differ materially from those expressed or implied in these forward-looking statements as a result of certain known and unknown risks and uncertainties. See "Forward-Looking Statements."
EXECUTIVE SUMMARY
Overview
American Coastal Insurance Corporation (referred to in this document as we, our, us, the Company or ACIC) is a holding company primarily engaged in commercial and personal property and casualty insurance business with investments in the United States. On July 10, 2023, we changed our corporate name from United Insurance Holdings Corp. to American Coastal Insurance Corporation. We conduct our business principally through our two wholly-owned insurance subsidiaries: American Coastal Insurance Company (AmCoastal); and Interboro Insurance Company (IIC). Collectively, we refer to the holding company and all our subsidiaries, including non-insurance subsidiaries, as “American Coastal Insurance Corporation,” which is the preferred brand identification for our Company.
Our Company’s primary source of revenue is generated from writing insurance in Florida and New York. Our target market in such areas consists of states where the perceived threat of natural catastrophe has caused large national insurance carriers to reduce their concentration of policies. We believe an opportunity exists for ACIC to write profitable business in such areas. During 2022, we also wrote commercial residential insurance in South Carolina and Texas, however, effective May 1, 2022, we no longer write in these states. In addition, during 2022 we wrote personal residential business in six other states, however on
On February 27, 2023, our former insurance subsidiary, United Property & Casualty Insurance Company (UPC) was placed into receivership with the Florida Department of Financial Services (DFS), which divested our ownership of UPC. The events leading to receivership and results of this subsidiary, now included within discontinued operations, can be seen in Note 3 of the Notes to Unaudited Condensed Consolidated Financial Statements above.
On August 25, 2022, we announced that our former subsidiary UPC had filed plans for withdrawal in the states of Florida, Louisiana, and Texas and intended to file a plan for withdrawal in the state of New York. All filed plans entail non-renewing personal lines policies in these states. Additionally, we announced that Demotech, Inc. (Demotech), an insurance rating agency, notified UPC of its intent to withdraw UPC's Financial Stability Rating. On December 5, 2022, the Florida Office of Insurance Regulation ("FLOIR") issued Consent Order No. 303643-22- CO that provided for the administrative supervision and approval of the plan of run-off for UPC (the "Consent Order"). The Consent Order provided formal approval of UPC's Plan of Run-Off (the "Plan") to facilitate a solvent wind down of its affairs in an orderly fashion. Additionally, in connection with the Plan, IIC agreed to not pay ordinary dividends without the prior approval of the New York Department of Financial Services until January 1, 2025. On February 10, 2023, we announced that a solvent run-off of UPC was unlikely and on February 27, 2023, UPC was placed into receivership with the Florida Department of Financial Services (the "DFS") which divested our ownership of UPC.
Our Company, together with its former subsidiary, UPC and wholly-owned subsidiary United Insurance Management, L.C. (UIM), entered into a Renewal Rights Agreement (Southeast Renewal Agreement), dated as of December 30, 2021 with Homeowners Choice Property and Casualty Insurance Company, Inc. (HCPCI), pursuant to which our Company, UPC and UIM agreed to sell, and HCPCI agreed to purchase, the renewal rights to UPC’s personal lines homeowners business in Georgia, South Carolina and North Carolina. The transfer of policies is subject to regulatory approval. Effective June 1, 2022, we began transitioning South Carolina policies to HCPCI. The sale was consummated on December 30, 2021.
Effective June 1, 2022, we entered into a quota share reinsurance agreement with TypTap Insurance Company (Typtap) in connection with the Southeast Renewal Agreement. Under the terms of this agreement, we ceded 100% of our former subsidiary UPC's in-force, new, and renewal policies in the states of Georgia, North Carolina, and South Carolina. This agreement replaces the 85% quota share agreement with HCPCI effective December 31, 2021. Also effective June 1, our third-party quota share reinsurance agreements were renewed to exclude these states. We will no longer retain any risk associated with these states.
AMERICAN COASTAL INSURANCE CORPORATION
Our Company, together with its former subsidiary UPC and wholly-owned subsidiary UIM, entered into a Renewal Rights Agreement (Northeast Renewal Agreement), dated as of January 18, 2021 with HCPCI and HCI Group, Inc. (HCI), pursuant to which our Company, UPC and UIM agreed to sell, and HCPCI agreed to purchase, the renewal rights to UPC’s personal lines homeowners business in Connecticut, Massachusetts, New Jersey and Rhode Island. The transfer of all states was completed as of June 30, 2022.
Effective June 1, 2021, we entered into a quota share reinsurance agreement with HCPCI and TypTap in connection with the Northeast Renewal Agreement. Under the terms of this agreement, we ceded 100% of our former subsidiary UPC's in-force, new, and renewal policies in the states of Connecticut, New Jersey, Massachusetts, and Rhode Island. The cession of these policies is 50% to HCPCI and 50% to TypTap.
We have historically grown our business through strong organic growth, complemented by strategic acquisitions and partnerships, including our acquisitions of AmCo Holding Company, LLC (AmCo) and its subsidiaries, including AmCoastal, in April 2017 and IIC in April 2016, and Family Security Holdings, LLC (FSH), including its subsidiary Family Security Insurance Company, Inc. (FSIC),2016.
Our policies in-force decreased by 3.2% from 23,473 policies in-force at March 31, 2023 to 22,733 policies in-force at March 31, 2024. For more information regarding the concentration of our policies in February 2015, and our strategic partnership with a subsidiaryforce, please see the results of Tokio Marine Kiln Group Limited (Tokio Marine), which formed Journey Insurance Company (JIC) in August 2018. Effective June 1, 2022, we merged JIC into AmCoastal, with AmCoastal being the surviving entity. Effective May 31, 2022, we merged FSIC into UPC, with UPC being the surviving entity.operations section below.
As a result of the receivership of our former subsidiary UPC by the DFS effective February 27,October 6, 2023, our policies in-force decreased by 49.0% from 46,401 policies in-force at June 30, 2022 to 23,664 policies in-force at June 30, 2023.
We arewe were seeking a buyer for IIC to complete our exit from the personal lines business and expect the sale price to be the book value of the entity. The Company entered into a non-binding term sheet on October 6, 2023 for the sale of IIC whereby the buyer will acquire 100% of the issued and outstanding common stock of Interboro in exchange for a cash purchase price equal to the GAAP book value of IIC at the time of closing, subject to negotiating and entering into definitive documents containing customary terms and conditions and obtaining regulatory approval(s). The following discussion highlights significant factors influencing the consolidated financial position and results of operations of American Coastal Insurance Corporation. In evaluating our results of operations, we use premiums written and earned, policies in-force and new and renewal policies by geographic concentration. We also consider the impact of catastrophe losses and prior year development on our loss ratios, expense ratios and combined ratios. In monitoring our investments, we use credit quality, investment income, cash flows, realized gains and losses, unrealized gains and losses, asset diversification and portfolio duration. To evaluate our financial condition, we consider our liquidity, financial strength, ratings, book value per share and return on equity.
AMERICAN COASTAL INSURANCE CORPORATION
20232024 Highlights
| | | | Three Months Ended March 31, | |
| | | Three Months Ended March 31, | |
| | | Three Months Ended March 31, | |
| | | | | 2024 | | | | | | | 2024 | | 2023 |
| | Three Months Ended June 30, | | Six Months Ended June 30, |
| 2023 | | 2022 | | 2023 | | 2022 |
| | Gross premiums written | |
| Gross premiums written | |
| Gross premiums written | Gross premiums written | $ | 243,885 | | | $ | 207,632 | | | $ | 431,008 | | | $ | 350,046 | |
| Gross premiums earned | Gross premiums earned | 158,199 | | | 129,483 | | | 302,675 | | | 252,216 | |
| Net premiums earned | Net premiums earned | 83,169 | | | 64,532 | | | 170,493 | | | 122,278 | |
| Total revenues | Total revenues | 79,295 | | | 63,910 | | | 169,615 | | | 122,342 | |
| Earnings from continuing operations, net of tax | 20,352 | | | (13,311) | | | 50,719 | | | (13,584) | |
| Income (loss) from discontinued operations, net of tax | (2,573) | | | (55,744) | | | 234,340 | | | (88,728) | |
| Consolidated net income (loss) attributable to ACIC | 17,779 | | | (69,029) | | | 285,059 | | | (102,201) | |
| Net income (loss) available to ACIC stockholders per diluted share | |
| Income from continuing operations, net of tax | |
| Income from discontinued operations, net of tax | |
| Consolidated net income | |
| Net income available to ACIC stockholders per diluted share | |
| Continuing Operations | |
| Continuing Operations | |
| Continuing Operations | Continuing Operations | $ | 0.47 | | | $ | (0.31) | | | $ | 1.16 | | | $ | (0.31) | |
| Discontinued Operations | Discontinued Operations | (0.06) | | | (1.29) | | | 5.36 | | | (2.06) | |
| Total | Total | $ | 0.41 | | | $ | (1.60) | | | $ | 6.52 | | | $ | (2.37) | |
| | Reconciliation of net income (loss) to core income (loss): | |
| Reconciliation of net income to core income: | |
| Reconciliation of net income to core income: | |
| Reconciliation of net income to core income: | |
| | Plus: Non-cash amortization of intangible assets | $ | 811 | | | $ | 812 | | | $ | 1,623 | | | $ | 1,624 | |
| Less: Income (loss) from discontinued operations, net of tax | (2,573) | | | (55,744) | | | 234,340 | | | (88,728) | |
| Plus: Non-cash amortization of intangible assets and goodwill impairment | |
| | Plus: Non-cash amortization of intangible assets and goodwill impairment | |
| | Plus: Non-cash amortization of intangible assets and goodwill impairment | |
| Less: Income from discontinued operations, net of tax | |
| Less: Realized losses on investment portfolio | Less: Realized losses on investment portfolio | (6,725) | | | (77) | | | (6,808) | | | (40) | |
| Less: Unrealized gains (losses) on equity securities | Less: Unrealized gains (losses) on equity securities | 141 | | | (2,391) | | | 615 | | | (3,161) | |
Less: Net tax impact (1) | Less: Net tax impact (1) | 1,553 | | | 689 | | | 1,641 | | | 1,013 | |
Core income (2) | Core income (2) | 26,192 | | | (10,693) | | | 56,894 | | | (9,660) | |
Core income per diluted share(2) | Core income per diluted share(2) | $ | 0.60 | | | $ | (0.25) | | | $ | 1.30 | | | $ | (0.22) | |
| | Book value per share | Book value per share | | $ | 2.59 | | | $ | 3.85 | |
| Book value per share | |
| Book value per share | |
(1) In order to reconcile the net lossincome to the core lossincome measure, we included the tax impact of all adjustments using the 21% corporate federal tax rate.
(2) Core income, a measure that is not based on U.S. generally accepted accounting principles (GAAP), is reconciled above to net income, (loss), the most directly comparable GAAP measure. Additional information regarding non-GAAP financial measures presented in this Form 10-Q is in "Definitions of Non-GAAP Measures" below.
AMERICAN COASTAL INSURANCE CORPORATION
Consolidated Net Income (Loss)
| | Three Months Ended
June 30, | | Six Months Ended
June 30, |
| 2023 | | 2022 | | 2023 | | 2022 |
| | | | Three Months Ended March 31, | |
| | | | Three Months Ended March 31, | |
| | | | Three Months Ended March 31, | |
| | | | | | 2024 | | | | | | | | 2024 | | 2023 |
| REVENUE: | REVENUE: | | | | | | | | |
| Gross premiums written | |
| Gross premiums written | |
| Gross premiums written | Gross premiums written | | $ | 243,885 | | | $ | 207,632 | | | $ | 431,008 | | | $ | 350,046 | |
| Change in gross unearned premiums | Change in gross unearned premiums | | (85,686) | | | (78,149) | | | (128,333) | | | (97,830) | Change in gross unearned premiums | | | | | | (28,636) | | | (42,647) | | (42,647) |
| Gross premiums earned | Gross premiums earned | | 158,199 | | | 129,483 | | | 302,675 | | | 252,216 | |
| Ceded premiums earned | Ceded premiums earned | | (75,030) | | | (64,951) | | | (132,182) | | | (129,938) | |
| Net premiums earned | Net premiums earned | | 83,169 | | | 64,532 | | | 170,493 | | | 122,278 | |
| Net investment income | Net investment income | | 2,692 | | | 1,839 | | | 5,281 | | | 3,243 | |
| Net realized investment losses | Net realized investment losses | | (6,725) | | | (77) | | | (6,808) | | | (40) | |
| Net unrealized gains (losses) on equity securities | Net unrealized gains (losses) on equity securities | | 141 | | | (2,391) | | | 615 | | | (3,161) | |
| | Other revenue | Other revenue | | 18 | | | 7 | | | 34 | | | 22 | |
| Other revenue | |
| Other revenue | |
| Total revenue | Total revenue | | 79,295 | | | 63,910 | | | 169,615 | | | 122,342 | |
| EXPENSES: | EXPENSES: | |
| Losses and loss adjustment expenses | |
| Losses and loss adjustment expenses | |
| Losses and loss adjustment expenses | Losses and loss adjustment expenses | | 20,915 | | | 14,032 | | | 37,327 | | | 40,347 | |
| Policy acquisition costs | Policy acquisition costs | | 25,545 | | | 23,570 | | | 52,517 | | | 43,878 | |
| Operating expenses | Operating expenses | | 3,274 | | | 3,820 | | | 5,442 | | | 7,527 | |
| General and administrative expenses | General and administrative expenses | | 6,583 | | | 8,208 | | | 15,376 | | | 16,272 | |
| Interest expense | Interest expense | | 2,719 | | | 2,363 | | | 5,438 | | | 4,722 | |
| Total expenses | Total expenses | | 59,036 | | | 51,993 | | | 116,100 | | | 112,746 | |
| Income before other income | Income before other income | | 20,259 | | | 11,917 | | | 53,515 | | | 9,596 | |
| Other income | Other income | | 806 | | | 258 | | | 1,394 | | | 1,591 | |
| Income before income taxes | Income before income taxes | | 21,065 | | | 12,175 | | | 54,909 | | | 11,187 | |
| Provision for income taxes | Provision for income taxes | | 713 | | | 25,486 | | | 4,190 | | | 24,771 | |
| Net income from continuing operations, net of tax | Net income from continuing operations, net of tax | | $ | 20,352 | | | $ | (13,311) | | | $ | 50,719 | | | $ | (13,584) | |
| Income (loss) from discontinued operations, net of tax | | (2,573) | | | (55,744) | | | 234,340 | | | (88,728) | |
| Net income (loss) | | $ | 17,779 | | | $ | (69,055) | | | $ | 285,059 | | | $ | (102,312) | |
| Less: Net loss attributable to noncontrolling interests | | — | | | (26) | | | — | | | (111) | |
| Net income (loss) attributable to ACIC | | $ | 17,779 | | | $ | (69,029) | | | $ | 285,059 | | | $ | (102,201) | |
| Income from discontinued operations, net of tax | |
| Net income | |
| Earnings available to ACIC common stockholders per diluted share | Earnings available to ACIC common stockholders per diluted share | | $ | 0.41 | | | $ | (1.60) | | | $ | 6.52 | | | $ | (2.37) | |
| Book value per share | Book value per share | | $ | 2.59 | | | $ | 3.85 | |
| Return on equity based on GAAP net income (loss) | | NM | | (72.2) | % |
| Return on equity based on GAAP net income | | Return on equity based on GAAP net income | | | | | | 67.7 | % | | NM |
Loss ratio, net (1) | Loss ratio, net (1) | | 25.1 | % | | 21.7 | % | | 21.9 | % | | 33.0 | % | Loss ratio, net (1) | | | | | | 23.1 | % | | 18.9 | % |
Expense ratio (2) | Expense ratio (2) | | 42.6 | % | | 55.2 | % | | 43.0 | % | | 55.3 | % | Expense ratio (2) | | | | | | 35.2 | % | | 43.4 | % |
Combined ratio (3) | Combined ratio (3) | | 67.7 | % | | 76.9 | % | | 64.9 | % | | 88.3 | % | Combined ratio (3) | | | | | | 58.3 | % | | 62.3 | % |
| Effect of current year catastrophe losses on combined ratio | Effect of current year catastrophe losses on combined ratio | | 7.9 | % | | (3.3) | % | | 5.4 | % | | 2.8 | % | Effect of current year catastrophe losses on combined ratio | | | | | | 1.1 | % | | 3.0 | % |
| Effect of prior year development on combined ratio | Effect of prior year development on combined ratio | | (6.2) | % | | (6.0) | % | | (4.9) | % | | (5.7) | % | Effect of prior year development on combined ratio | | | | | | (0.6) | % | | (3.6) | % |
| Underlying combined ratio (4) | Underlying combined ratio (4) | | 66.0 | % | | 86.2 | % | | 64.4 | % | | 91.2 | % |
Underlying combined ratio (4) | |
Underlying combined ratio (4) | | | | | | | 57.8 | % | | 63.0 | % |
(1) Loss ratio, net is calculated as losses and LAE net of losses ceded to reinsurers, relative to net premiums earned. Management uses this operating metric to analyze our loss trends and believes it is useful for investors to evaluate this component separately from our other operating expenses.
(2) Expense ratio is calculated as the sum of all operating expenses less interest expense relative to net premiums earned. Management uses this operating metric to analyze our expense trends and believes it is useful for investors to evaluate this component separately from our loss expenses.
(3) Combined ratio is the sum of the loss ratio, net and the expense ratio, net. Management uses this operating metric to analyze our total expense trends and believes it is a key indicator for investors when evaluating the overall profitability of our business.
(4) Underlying combined ratio, a measure that is not based on GAAP, is reconciled above to the combined ratio, the most directly comparable GAAP measure. Additional information regarding non-GAAP financial measures presented in this Form 10-Q is in "Definitions of Non-GAAP Measures" below.
AMERICAN COASTAL INSURANCE CORPORATION
Definitions of Non-GAAP Measures
We believe that investors' understanding of ACIC's performance is enhanced by our disclosure of the following non-GAAP measures. Our methods for calculating these measures may differ from those used by other companies and therefore comparability may be limited.
Combined ratio excluding the effects of current year catastrophe losses and prior year reserve development (underlying combined ratio) is a non-GAAP measure, that is computed by subtracting the effect of current year catastrophe losses and prior year development from the combined ratio. We believe that this ratio is useful to investors and it is used by management to highlight the trends in our business that may be obscured by current year catastrophe losses and prior year development. Current year catastrophe losses cause our loss trends to vary significantly between periods as a result of their frequency of occurrence and magnitude, and can have a significant impact on the combined ratio. Prior year development is caused by unexpected loss development on historical reserves. We believe it is useful for investors to evaluate these components separately and in the aggregate when reviewing our performance. The most directly comparable GAAP measure is the combined ratio. The underlying combined ratio should not be considered as a substitute for the combined ratio and does not reflect the overall profitability of our business.
Net loss and LAE excluding the effects of current year catastrophe losses and prior year reserve development (underlying loss and LAE) is a non-GAAP measure, that is computed by subtracting the effect of current year catastrophe losses and prior year reserve development from net loss and LAE. We use underlying loss and LAE figures to analyze our loss trends that may be impacted by current year catastrophe losses and prior year development on our reserves. As discussed previously, these two items can have a significant impact on our loss trends in a given period. We believe it is useful for investors to evaluate these components separately and in the aggregate when reviewing our performance. The most directly comparable GAAP measure is net loss and LAE. The underlying loss and LAE measure should not be considered a substitute for net loss and LAE and does not reflect the overall profitability of our business.
Net income (loss) excluding the effects of amortization of intangible assets, income (loss) from discontinued operations, realized gains (losses) and unrealized gains (losses) on equity securities, net of tax (core income (loss)) is a non-GAAP measure, which is computed by adding amortization, net of tax, to net income (loss) and subtracting income (loss) from discontinued operations, net of tax, realized gains (losses) on our investment portfolio, net of tax, and unrealized gains (losses) on our equity securities, net of tax, from net income (loss). Amortization expense is related to the amortization of intangible assets acquired, including goodwill, through mergers and therefore the expense does not arise through normal operations. Investment portfolio gains (losses) and unrealized equity security gains (losses) vary independent of our operations. We believe it is useful for investors to evaluate these components separately and in the aggregate when reviewing our performance. The most directly comparable GAAP measure is net income (loss). The core income (loss) measure should not be considered a substitute for net loss and does not reflect the overall profitability of our business.
CRITICAL ACCOUNTING POLICIES AND ESTIMATES
When we prepare our consolidated financial statements and accompanying notes in conformity with GAAP, we must make estimates and assumptions about future events that affect the amounts we report. Certain of these estimates result from judgments that can be subjective and complex. As a result of that subjectivity and complexity, and because we continuously evaluate these estimates and assumptions based on a variety of factors, actual results could materially differ from our estimates and assumptions if changes in one or more factors require us to make accounting adjustments. During the sixthree months ended June 30, 2023,March 31, 2024, we reassessed our critical accounting policies and estimates as disclosed in Note 2 to the Notes to Unaudited Condensed Consolidated Financial Statements and our Annual Report on Form 10-K for the year ended December 31, 2022.2023. We have made no material changes or additions with regard to those policies and estimates.
RECENT ACCOUNTING STANDARDS
Please refer to Note 2 in the Notes to Unaudited Condensed Consolidated Financial Statements for a discussion of recent accounting standards that may affect us.
AMERICAN COASTAL INSURANCE CORPORATION
ANALYSIS OF FINANCIAL CONDITION - JUNE 30, 2023MARCH 31, 2024 COMPARED TO DECEMBER 31, 20222023
The following discussion and analysis of our financial condition and results of operations should be read in conjunction with our accompanying unaudited condensed consolidated interim financial statements and related notes, and in conjunction with the section entitled "Management's Discussion and Analysis of Financial Condition and Results of Operations" in our Annual Report on Form 10-K for the year ended December 31, 2022.2023.
Investments
The primary goals of our investment strategy are to preserve capital, maximize after-tax investment income, maintain liquidity and minimize risk. To accomplish our goals, we purchase debt securities in sectors that represent the most attractive relative value, and we maintain a moderate equity exposure. Limiting equity exposure manages risks and helps to preserve capital for two reasons: first, bond market returns are less volatile than stock market returns, and second, should the bond issuer enter bankruptcy liquidation, bondholders generally have a higher priority than equity holders in a bankruptcy proceeding. Our investment strategy is the same for both our personal lines and commercial lines operating segments.
We must comply with applicable state insurance regulations that prescribe the type, quality and concentrations of investments our insurance subsidiaries can make; therefore, our current investment policy limits investment in non-investment-grade fixed maturities and limits total investment amounts in preferred stock, common stock and mortgage notes receivable. We do not invest in derivative securities.
Two outside asset management companies, which have authority and discretion to buy and sell securities for us, manage our investments subject to (i) the guidelines established by our Board of Directors and (ii) the direction of management. The Investment Committee of our Board of Directors reviews and approves our investment policy on a regular basis.
Our cash, cash equivalents, restricted cash and investment portfolio totaled $241,714,000$504,456,000 at June 30, 2023,March 31, 2024, compared to $340,905,000$369,022,000 at December 31, 2022.2023.
The following table summarizes our investments, by type:
| | March 31, 2024 | | | March 31, 2024 | | December 31, 2023 |
| Estimated Fair Value | | | Estimated Fair Value | | Percent of Total | | Estimated Fair Value | | Percent of Total |
| U.S. government and agency securities | | U.S. government and agency securities | $ | 27,296 | | | 5.4% | | $ | 27,432 | | | 7.4% |
| | June 30, 2023 | | December 31, 2022 |
| Estimated Fair Value | | Percent of Total | | Estimated Fair Value | | Percent of Total |
| U.S. government and agency securities | $ | 2,393 | | | 1.0% | | $ | 2,385 | | | 0.7% |
| Foreign government | 995 | | | 0.4% | | 991 | | | 0.3% |
| States, municipalities and political subdivisions | |
| States, municipalities and political subdivisions | |
| States, municipalities and political subdivisions | States, municipalities and political subdivisions | 23,479 | | | 9.7% | | 26,895 | | | 7.9% | 23,277 | | | 4.6% | | 4.6% | | 23,865 | | | 6.5% | | 6.5% |
| Public utilities | Public utilities | 5,009 | | | 2.1% | | 7,694 | | | 2.3% | Public utilities | 5,128 | | | 1.0% | | 1.0% | | 5,134 | | | 1.4% | | 1.4% |
| Corporate securities | Corporate securities | 61,770 | | | 25.5% | | 83,343 | | | 24.3% | Corporate securities | 61,473 | | | 12.3% | | 12.3% | | 61,849 | | | 16.7% | | 16.7% |
| Mortgage-backed securities | Mortgage-backed securities | 49,464 | | | 20.5% | | 56,115 | | | 16.5% | Mortgage-backed securities | 45,440 | | | 9.0% | | 9.0% | | 46,310 | | | 12.5% | | 12.5% |
| Asset-backed securities | Asset-backed securities | 17,753 | | | 7.3% | | 27,259 | | | 8.0% | Asset-backed securities | 15,702 | | | 3.1% | | 3.1% | | 16,113 | | | 4.4% | | 4.4% |
| | Total fixed maturities | Total fixed maturities | 160,863 | | | 66.5 | % | | 204,682 | | | 60.0 | % |
| Total fixed maturities | |
| Total fixed maturities | | 178,316 | | | 35.4 | % | | 180,703 | | | 48.9 | % |
| Mutual funds | Mutual funds | — | | | —% | | 15,657 | | | 4.6% | Mutual funds | 6,214 | | | 1.2% | | 1.2% | | — | | | —% | | —% |
| | | Total equity securities | |
| | Total equity securities | |
| | Total equity securities | Total equity securities | — | | | — | % | | 15,657 | | | 4.6 | % | 6,214 | | | 1.2 | | 1.2 | % | | — | | | — | | — | % |
| Other investments | Other investments | 3,582 | | | 1.5 | % | | 3,675 | | | 1.1 | % | Other investments | 14,217 | | | 2.8 | | 2.8 | % | | 16,487 | | | 4.5 | | 4.5 | % |
| Total investments | Total investments | 164,446 | | | 68.0% | | 224,014 | | | 65.7% | Total investments | 198,747 | | | 39.4% | | 39.4% | | 197,190 | | | 53.4% | | 53.4% |
| Cash and cash equivalents | Cash and cash equivalents | 27,767 | | | 11.5 | % | | 70,903 | | | 20.8 | % | Cash and cash equivalents | 285,400 | | | 56.6 | | 56.6 | % | | 153,762 | | | 41.7 | | 41.7 | % |
| Restricted cash | Restricted cash | 49,501 | | | 20.5% | | 45,988 | | | 13.5% | Restricted cash | 20,309 | | | 4.0% | | 4.0% | | 18,070 | | | 4.9% | | 4.9% |
| Total cash, cash equivalents, restricted cash and investments | Total cash, cash equivalents, restricted cash and investments | $ | 241,714 | | | 100.0 | % | | $ | 340,905 | | | 100.0 | % | Total cash, cash equivalents, restricted cash and investments | $ | 504,456 | | | 100.0 | | 100.0 | % | | $ | 369,022 | | | 100.0 | | 100.0 | % |
AMERICAN COASTAL INSURANCE CORPORATION
We classify all of our fixed-maturity investments as available-for-sale. Our investments at June 30, 2023March 31, 2024 and December 31, 20222023 consisted mainly of U.S. government and agency securities, states, municipalities and political subdivisions, mortgage-backed securities and securities of investment-grade corporate issuers. Our equity holdings consisted mainlyas of securities issued by companies in the financial, utilities and industrial sectors orMarch 31, 2024 consist of mutual funds. We held no equities as of December 31, 2023. At June 30, 2023,March 31, 2024, approximately 82.7%83.1% of our fixed maturities were U.S. Treasuries or corporate bonds rated “A” or better, and 17.3%16.9% were corporate bonds rated “BBB” or "BB".
AMERICAN COASTAL INSURANCE CORPORATION
Reinsurance
We follow the industry practice of reinsuring a portion of our risks. Reinsurance involves transferring, or "ceding", all or a portion of the risk exposure on policies we write to another insurer, known as a reinsurer. To the extent that our reinsurers are unable to meet the obligations they assume under our reinsurance agreements, we remain primarily liable for the entire insured loss under the policies we write.
Our catastrophe reinsurance program is designed, utilizing our risk management methodology, to address our exposure to catastrophe losses. According to the Insurance Service Office (ISO), a catastrophe loss is defined as a single unpredictable incident or seriescoverage consists of closely related incidents that result in $25,000,000 or more in U.S. industry-wide direct insured losses to property and that affect a significant number of policyholders and insurers (ISO catastrophes). In addition to ISO catastrophes, we also include as catastrophes those events (non-ISO catastrophes), which may include losses, that we believe are, or will be, material to our operations which we define as incidents that result in $1,000,000 or more in losses for multiple policyholders.three separate placements:
During the second quarter of 2023, we placed our1.AmCoastal’s core catastrophe reinsurance program in effect June 1 through May 31, annually, which includes excess of loss and quota share treaties providing coverage for the 2023 hurricane season. We purchasedcatastrophe losses from named or numbered windstorms and earthquakes;
2.AmCoastal’s all other perils catastrophe excess of loss agreement in effect January 1 through December 31, annually, which provides protection from catastrophe loss events other than named or numbered windstorms and earthquakes; and
3.IIC’s core catastrophe reinsurance program in effect June 1 through May 31, annually, which provides protection from all catastrophe losses.
This reinsurance protection is an essential part of our catastrophe risk management strategy. It is intended to provide our stockholders with an acceptable return on the risks assumed by our insurance entities, and to reduce the variability of earnings, while providing surplus protection. Although reinsurance agreements contractually obligate our reinsurers to reimburse us for the agreed-upon portion of our gross paid losses, they do not discharge our primary liability. In the event one or more of our reinsurers fail to fulfill their obligation, the surplus of our statutory entities may decline, and we may not be able to fulfill our obligation to policyholders, or we may not be able to maintain compliance with various regulatory financial requirements. Additionally, we face the risk that actual losses incurred from one or more catastrophic events may be above the modeled expected loss resulting in losses exceeding our reinsurance coverage, which may result in a decline in surplus, and as a result we may not be able to fulfill our obligations to policyholders, or we may not be able to maintain compliance with various regulatory financial requirements. The details of our programs and the likelihood of a catastrophic event exceeding these three coverages are outlined below.
AmCoastal’s core catastrophe reinsurance program provides occurrence-based coverage up to an exhaustion point of approximately $1,100,000,000 for a first occurrence and $1,300,000,000 in the aggregate. The treaties reinsure for personal and commercial lines property excess catastrophe losses caused by multiple perils including hurricanes and tropical storms. The agreements became effective as of June 1, 2023, for a one-year term, and incorporate the mandatory coverage required by and placed with the Florida Hurricane Catastrophe Fund (FHCF) and coverage required under the Florida Optional Reinsurance Assistance Program (FORA Program). The FHCF Program covers Florida risks only and we participate at 90%. The FORA Program covers Florida risks only and we participate at 100%. Under this program, our core catastrophe excess of loss treaty, retention on a first and second event is $10,000,000. The exhaustion point$10,000,000 each, plus $2,250,000 retained separately by our captive. AmCoastal’s program provides sufficient coverage for a 1-in-150-year return period, indicating that the probability of IIC'sa single occurrence exceeding protection purchased is roughly 0.7% estimated by equally blending the AIR and RMS catastrophe reinsurancemodels using long-term catalogs including demand surge. AmCoastal’s program is approximately $82,000,000also provides sufficient coverage for a 1-in-100-year event followed by a 1-in-50-year event in the aggregate, with a retentionsame treaty year, the probability of $3,000,000 per occurrence, covering all perils.which is less than 0.1%. While we believe these catastrophe models are very good tools and their output provides reasonable proxies for the probability of exhausting our reinsurance protections, they are imperfect so actual results could vary dramatically from those expected.
During the third quarter of 2022, the Company's core catastrophe reinsurance program was impacted by Hurricane Ian. As a result, the Company has approximately $508 million of occurrence limit remaining for Hurricane Ian, all of which is attributable to AmCoastal only. After reinstatement premiums of approximately $15.4 million, the Company, with its former subsidiary UPC has approximately $993 million of aggregate limit remaining after Hurricane Ian, based on our estimated ultimate net loss subject to the core catastrophe reinsurance program.
Effective January 1, 2023, we renewed ourAmCoastal’s all other perils (AOP) catastrophe excess of loss agreement. The agreement
provides protection from catastrophe loss events other than named windstorms and earthquakes up to $101,000,000.$172,000,000 in the aggregate. This agreement provides sufficient coverage for a 1-in-450-year return period, indicating that the probability of a single occurrence exceeding protection purchased is no more than 0.2%.
During the third quarterIIC’s core catastrophe reinsurance program provides coverage up to an exhaustion point of 2022, one of our private reinsurers who held a 100% share of the $15,000,000 in excess of $15,000,000 layer on our all other perils catastrophe excess of loss agreement notified us of their intent to terminate the agreement due to the contractual provision regarding the change in UPC's statutory surplus being greater than 25%. We agreed to a termination and commutation date of September 30, 2022 for this contract. This change resulted in approximately $1,300,000 of ceded premium savings that would have otherwise been due$82,000,000 in the fourth quarteraggregate, with a retention of 2022 and$3,000,000 per occurrence. Based on IIC’s PML, the Company retaining allprogram provides sufficient coverage for a 1-in-130-year return period, indicating the riskprobability of a single occurrence exceeding protection purchased is no more than 0.8%. IIC’s program also provides sufficient coverage for any non-hurricane catastrophe losses up to $30,000,000, excluding any quota share recoveries.a 1-in-100-year event followed by a 1-in-50-year event in the same treaty year, the probability of which is less than 0.1%.
AMERICAN COASTAL INSURANCE CORPORATION
The table below outlines our quota share agreements in effect for the sixthree months ended June 30, 2023March 31, 2024 and 2022.2023.
| | | | | | | | | | | | | | |
| Reinsurer | Companies in Scope (1) | Effective Dates | Cession Rate | States in Scope |
| External third-party | AmCoastal | 06/01/2023 - 06/01/2024 | 40% (2)(1) | Florida |
| External third-party | UPC, FSIC & AmCoastal | 06/01/2022 - 06/01/2023 | 10% (2)(1) | Florida, Louisiana, Texas |
| TypTap | UPC | 06/01/2022 - 06/01/2023 | 100% (3)(2) | Georgia, North Carolina, South Carolina |
External third-party | UPC, FSIC & AmCoastal | 12/31/2021 - 12/31/2022 | 8% (2)
| Florida, Louisiana, Texas |
HCPCI | UPC | 12/31/2021 - 06/01/2022 | 85% | Georgia, North Carolina, South Carolina |
External third-party | UPC & FSIC | 12/31/2021 - 12/31/2022 | 25% (4)
| Florida, Louisiana, Texas |
HCPCI / TypTap (5)
| UPC | 06/01/2021 - 06/01/2022 | 100% (3)
| Connecticut, New Jersey, Massachusetts, Rhode Island |
External third-party | UPC, FSIC & AmCoastal (6)
| 06/01/2021 - 06/01/2022 | 15% (2)
| Florida, Georgia, Louisiana, North Carolina, South Carolina, Texas |
IIC | UPC | 12/31/2020 - 12/31/2022 | 100% | New York |
(1) Effective May 31, 2022, FSIC was merged into UPC, with UPC being the surviving entity.
(2) This treaty provides coverage for all catastrophe perils and attritional losses incurred. For all catastrophe perils, the quota share agreement provides ground- up protection effectively reducing our retention for catastrophe losses.
(3)(2) This treaty providesprovided coverage on our in-force, new and renewal policies until these states arewere transitioned to HCPCI or TypTap upon renewal.
(4) This treaty provides coverage on non-catastrophe losses on policies in-force on the effective date of the agreement.
(5) Cessions are split 50% to HCPCI and 50% to TypTap.
(6) This treaty was amended effective December 31, 2020 to include AmCoastal.
Reinsurance costs as a percentage of gross earned premium during the three and six month periods ended June 30,March 31, 2024 and 2023 and 2022 were as follows:
| | | 2024 | | | | 2024 | | 2023 |
| | | 2023 | | 2022 |
| Three Months Ended June 30, | | | | |
| | Three Months Ended March 31, | |
| | Three Months Ended March 31, | |
| | Three Months Ended March 31, | |
| Non-at-Risk | |
| Non-at-Risk | |
| Non-at-Risk | Non-at-Risk | | (0.5) | % | | (0.6) | % | | (0.3) | % | | (0.5) | % |
| Quota Share | Quota Share | | (14.4) | % | | (14.2) | % | Quota Share | | (29.8) | % | | (6.1) | % |
| All Other | All Other | | (32.5) | % | | (35.4) | % | All Other | | (29.2) | % | | (33.0) | % |
| Total Ceding Ratio | Total Ceding Ratio | | (47.4) | % | | (50.2) | % | Total Ceding Ratio | | (59.3) | % | | (39.6) | % |
| | Six Months Ended June 30, | |
| Non-at-Risk | | (0.5) | % | | (0.6) | % |
| Quota Share | | (10.5) | % | | (14.9) | % |
| All Other | | (32.8) | % | | (36.0) | % |
| Total Ceding Ratio | | (43.8) | % | | (51.5) | % |
Reinsurance costs as a percent of gross earned premium for our personal residential property and casualty insurance policies (personal lines) and commercial residential property and casualty insurance policies (commercial lines) operating segments during the three and six month periods ended June 30,March 31, 2024 and 2023 and 2022 were as follows:
AMERICAN COASTAL INSURANCE CORPORATION
| | | Personal | | | | Personal | | Commercial |
| | 2024 | | | | 2024 | | 2023 | | 2024 | | 2023 |
| | | Personal | | Commercial |
| | 2023 | | 2022 | | 2023 | | 2022 |
| Three Months Ended June 30, | | | | | | | | |
| | Three Months Ended March 31, | |
| | Three Months Ended March 31, | |
| | Three Months Ended March 31, | |
| Non-at-Risk | |
| Non-at-Risk | |
| Non-at-Risk | Non-at-Risk | | (2) | % | | (1.1) | % | | (0.4) | % | | (0.5) | % | | (2.7) | % | | (1.6) | % | | (0.2) | % | | (0.4) | % |
| Quota Share | Quota Share | | — | % | | — | % | | (15.6) | % | | (16.3) | % | Quota Share | | — | % | | — | % | | (31.5) | % | | (6.7) | % |
| All Other | All Other | | (23.9) | % | | (18.5) | % | | (33.2) | % | | (37.8) | % | All Other | | (26.1) | % | | (28.8) | % | | (29.2) | % | | (33.3) | % |
| Total Ceding Ratio | Total Ceding Ratio | | (25.9) | % | | (19.6) | % | | (49.2) | % | | (54.6) | % | Total Ceding Ratio | | (28.8) | % | | (30.4) | % | | (60.9) | % | | (40.4) | % |
| | Six Months Ended June 30, | |
| Non-at-Risk | | (1.8) | % | | (1.2) | % | | (0.4) | % | | (0.5) | % |
| Quota Share | | — | % | | — | % | | (11.4) | % | | (17.0) | % |
| All Other | | (26.4) | % | | (18.3) | % | | (33.3) | % | | (38.6) | % |
| Total Ceding Ratio | | (28.2) | % | | (19.5) | % | | (45.1) | % | | (56.1) | % |
Please note that the sum of the percentages above will not reconcile to the consolidated percentages as they are calculated using each operating segments’ gross earned premium rather than our consolidated gross earned premium.
We amortize our ceded unearned premiums over the annual agreement period, and we record that amortization in ceded premiums earned on our Unaudited Condensed Consolidated Statements of Comprehensive Loss.Income. The table below summarizes the amounts of our ceded premiums written under the various types of agreements, as well as the amortization of ceded unearned premiums:
| | | | | | | | | | | | | | | | | | | | | | | |
| Three Months Ended
June 30, | | Six Months Ended
June 30, |
| 2023 | | 2022 | | 2023 | | 2022 |
| Quota Share | $ | (118,956) | | | $ | (17,944) | | | $ | (131,199) | | | $ | (41,072) | |
| Excess-of-loss | (219,201) | | | (172,733) | | | (238,496) | | | (178,240) | |
| Equipment, identity theft, and cyber security | (847) | | | (1,035) | | | (1,667) | | | (1,781) | |
| | | | | | | |
| Ceded premiums written | $ | (339,004) | | | $ | (191,712) | | | $ | (371,362) | | | $ | (221,093) | |
| Change in ceded unearned premiums | 263,974 | | | 126,761 | | | 239,180 | | | 91,155 | |
| Ceded premiums earned | $ | (75,030) | | | $ | (64,951) | | | $ | (132,182) | | | $ | (129,938) | |
AMERICAN COASTAL INSURANCE CORPORATION
| | | | | | | | | | | | | | | |
| | | Three Months Ended March 31, |
| | | | | 2024 | | 2023 |
| Quota Share | | | | | $ | (58,094) | | | $ | (12,243) | |
| Excess-of-loss | | | | | (19,829) | | | (19,295) | |
| Equipment, identity theft, and cyber security | | | | | (783) | | | (820) | |
| | | | | | | |
| Ceded premiums written | | | | | $ | (78,706) | | | $ | (32,358) | |
| Change in ceded unearned premiums | | | | | (21,386) | | | (24,794) | |
| Ceded premiums earned | | | | | $ | (100,092) | | | $ | (57,152) | |
The breakdown of our ceded premiums written under the various types of agreements, as well as the amortization of ceded unearned premiums for our personal lines and commercial lines operating segments can be seen in the tables below. These values can be reconciled to the table above.
Commercial Lines Operating Segment Impact
| | Three Months Ended
June 30, | | Six Months Ended
June 30, |
| 2023 | | 2022 | | 2023 | | 2022 |
| | | Three Months Ended March 31, | |
| | | Three Months Ended March 31, | |
| | | Three Months Ended March 31, | |
| | | | | 2024 | | | | | | | 2024 | | 2023 |
| Quota Share | Quota Share | $ | (118,956) | | | $ | (17,944) | | | $ | (131,199) | | | $ | (41,072) | |
| Excess-of-loss | Excess-of-loss | (211,599) | | | (158,335) | | | (229,899) | | | (164,189) | |
| Equipment, identity theft, and cyber security | Equipment, identity theft, and cyber security | (643) | | | (858) | | | (1,173) | | | (1,436) | |
| | Ceded premiums written | Ceded premiums written | $ | (331,198) | | | $ | (177,137) | | | $ | (362,271) | | | $ | (206,697) | |
| | Ceded premiums written | |
| | Ceded premiums written | |
| Change in ceded unearned premiums | Change in ceded unearned premiums | 259,373 | | | 115,366 | | | 237,072 | | | 82,904 | |
| Ceded premiums earned | Ceded premiums earned | $ | (71,825) | | | $ | (61,771) | | | $ | (125,199) | | | $ | (123,793) | |
AMERICAN COASTAL INSURANCE CORPORATION
Personal Lines Operating Segment
| | | | Three Months Ended March 31, | |
| | | Three Months Ended March 31, | |
| | | Three Months Ended March 31, | |
| | | | | 2024 | | | | | | | 2024 | | 2023 |
| | Three Months Ended
June 30, | | Six Months Ended
June 30, |
| 2023 | | 2022 | | 2023 | | 2022 |
| | Excess-of-loss | |
| Excess-of-loss | |
| Excess-of-loss | Excess-of-loss | (7,602) | | | (14,404) | | | (8,597) | | | (14,051) | |
| Equipment, identity theft, and cyber security | Equipment, identity theft, and cyber security | (204) | | | (177) | | | (494) | | | (345) | |
| | Ceded premiums written | Ceded premiums written | $ | (7,806) | | | $ | (14,581) | | | $ | (9,091) | | | $ | (14,396) | |
| | Ceded premiums written | |
| | Ceded premiums written | |
| Change in ceded unearned premiums | Change in ceded unearned premiums | 4,601 | | | 11,401 | | | 2,108 | | | 8,251 | |
| Ceded premiums earned | Ceded premiums earned | $ | (3,205) | | | $ | (3,180) | | | $ | (6,983) | | | $ | (6,145) | |
Current year catastrophe losses disaggregated between namenamed and numbered storms and all other catastrophe loss events are shown in the following table.
| | | 2024 | | | | 2024 | | 2023 |
| | Number of Events | | | | Number of Events | | Incurred Loss and LAE (1) | | Combined Ratio Impact | | Number of Events | | Incurred Loss and LAE (1) | | Combined Ratio Impact |
| | | 2023 | | 2022 |
| | Number of Events | | Incurred Loss and LAE (1) | | Combined Ratio Impact | | Number of Events | | Incurred Loss and LAE (1) | | Combined Ratio Impact |
| Three Months Ended June 30, | | | | | | | | | | | | |
| | Three Months Ended March 31, | |
| | Three Months Ended March 31, | |
| | Three Months Ended March 31, | |
| Current period catastrophe losses incurred | Current period catastrophe losses incurred | |
| Current period catastrophe losses incurred | |
| Current period catastrophe losses incurred | |
| Named and numbered storms | |
| Named and numbered storms | |
| Named and numbered storms | Named and numbered storms | | — | | | $ | — | | | — | % | | — | | | $ | — | | | — | % | | — | | | $ | | $ | — | | | — | | — | % | | — | | | $ | | $ | — | | | — | | — | % |
| All other catastrophe loss events | All other catastrophe loss events | | 5 | | | 6,540 | | | 7.9 | % | | 7 | | | (2,113) | | | (3.3) | % | All other catastrophe loss events | | 6 | | | 754 | | 754 | | | 1.1 | | 1.1 | % | | 3 | | | 2,615 | | 2,615 | | | 3.0 | | 3.0 | % |
| Total | Total | | 5 | | | $ | 6,540 | | | 7.9 | % | | 7 | | | $ | (2,113) | | | (3.3) | % | Total | | 6 | | | $ | | $ | 754 | | | 1.1 | | 1.1 | % | | 3 | | | $ | | $ | 2,615 | | | 3.0 | | 3.0 | % |
| | Six Months Ended June 30, | |
| Current period catastrophe losses incurred | |
| Named and numbered storms | | — | | | $ | — | | | — | % | | — | | | $ | — | | | — | % |
| All other catastrophe loss events | | 8 | | | 9,155 | | | 5.4 | % | | 10 | | | 3,416 | | | 2.8 | % |
| Total | | 8 | | | $ | 9,155 | | | 5.4 | % | | 10 | | | $ | 3,416 | | | 2.8 | % |
(1) Incurred loss and LAE is equal to losses and LAE paid plus the change in case and incurred but not reported reserves. Shown net of losses ceded to reinsurers. Incurred loss and LAE and number of events includes the development on storms during the year in which it occurred.
AMERICAN COASTAL INSURANCE CORPORATION
The impact of the current year catastrophes to our personal lines and commercial lines operating segments can be seen in the tables below. Please note that the catastrophe events may have impacted both operating segments. As a result, the sum of the number of events in the tables below will not reconcile to the consolidated number of events above. In addition, the combined ratio impact is calculated using each segment's net premiums earned and sum of the ratios in the tables below will not reconcile to the ratios above.
AMERICAN COASTAL INSURANCE CORPORATION
Commercial Lines Operating Segment
| | | 2024 | | | | 2024 | | 2023 |
| | Number of Events | | | | Number of Events | | Incurred Loss and LAE (1) | | Combined Ratio Impact | | Number of Events | | Incurred Loss and LAE (1) | | Combined Ratio Impact |
| | | 2023 | | 2022 |
| | Number of Events | | Incurred Loss and LAE (1) | | Combined Ratio Impact | | Number of Events | | Incurred Loss and LAE (1) | | Combined Ratio Impact |
| Three Months Ended June 30, | | | | | | | | | | | | |
| | Three Months Ended March 31, | |
| | Three Months Ended March 31, | |
| | Three Months Ended March 31, | |
| Current period catastrophe losses incurred | Current period catastrophe losses incurred | |
| Current period catastrophe losses incurred | |
| Current period catastrophe losses incurred | |
| Named and numbered storms | |
| Named and numbered storms | |
| Named and numbered storms | Named and numbered storms | | — | | | $ | — | | | — | % | | — | | | $ | — | | | — | % | | — | | | $ | | $ | — | | | — | | — | % | | — | | | $ | | $ | — | | | — | | — | % |
| All other catastrophe loss events | All other catastrophe loss events | | 5 | | | 6,201 | | | 8.4 | % | | 3 | | | (2,587) | | | (5.0) | % | All other catastrophe loss events | | 2 | | | 211 | | 211 | | | 0.3 | | 0.3 | % | | 1 | | | 2,097 | | 2,097 | | | 2.7 | | 2.7 | % |
| Total | Total | | 5 | | | $ | 6,201 | | | 8.4 | % | | 3 | | | $ | (2,587) | | | (5.0) | % | Total | | 2 | | | $ | | $ | 211 | | | 0.3 | | 0.3 | % | | 1 | | | $ | | $ | 2,097 | | | 2.7 | | 2.7 | % |
| | Six Months Ended June 30, | |
| Current period catastrophe losses incurred | |
| Named and numbered storms | | — | | | $ | — | | | — | % | | — | | | $ | — | | | — | % |
| All other catastrophe loss events | | 6 | | | 8,298 | | | 5.4 | % | | 6 | | | 518 | | | 0.5 | % |
| Total | | 6 | | | $ | 8,298 | | | 5.4 | % | | 6 | | | $ | 518 | | | 0.5 | % |
(1) Incurred loss and LAE is equal to losses and LAE paid plus the change in case and incurred but not reported reserves. Shown net of losses ceded to reinsurers. Incurred loss and LAE and number of events includes the development on storms during the year in which it occurred.
Personal Lines Operating Segment
| | | 2024 | | | | 2024 | | 2023 |
| | Number of Events | | | | Number of Events | | Incurred Loss and LAE (1) | | Combined Ratio Impact | | Number of Events | | Incurred Loss and LAE (1) | | Combined Ratio Impact |
| | | 2023 | | 2022 |
| | Number of Events | | Incurred Loss and LAE (1) | | Combined Ratio Impact | | Number of Events | | Incurred Loss and LAE (1) | | Combined Ratio Impact |
| Three Months Ended June 30, | | | | | | | | | | | | |
| | Three Months Ended March 31, | |
| | Three Months Ended March 31, | |
| | Three Months Ended March 31, | |
| Current period catastrophe losses incurred | Current period catastrophe losses incurred | |
| Current period catastrophe losses incurred | |
| Current period catastrophe losses incurred | |
| Named and numbered storms | |
| Named and numbered storms | |
| Named and numbered storms | Named and numbered storms | | — | | | $ | — | | | — | % | | — | | | $ | — | | | — | % | | — | | | $ | | $ | — | | | — | | — | % | | — | | | $ | | $ | — | | | — | | — | % |
| All other catastrophe loss events | All other catastrophe loss events | | — | | | 340 | | | 3.7 | % | | 3 | | | 474 | | | 3.6 | % | All other catastrophe loss events | | 5 | | | 543 | | 543 | | | 8.9 | | 8.9 | % | | 3 | | | 518 | | 518 | | | 6.0 | | 6.0 | % |
| Total | Total | | — | | | $ | 340 | | | 3.7 | % | | 3 | | | $ | 474 | | | 3.6 | % | Total | | 5 | | | $ | | $ | 543 | | | 8.9 | | 8.9 | % | | 3 | | | $ | | $ | 518 | | | 6.0 | | 6.0 | % |
| | Six Months Ended June 30, | |
| Current period catastrophe losses incurred | |
| Named and numbered storms | | — | | | $ | — | | | — | % | | — | | | $ | — | | | — | % |
| All other catastrophe loss events | | 3 | | | 858 | | | 4.8 | % | | 6 | | | 2,898 | | | 11.4 | % |
| Total | | 3 | | | $ | 858 | | | 4.8 | % | | 6 | | | $ | 2,898 | | | 11.4 | % |
(1) Incurred loss and LAE is equal to losses and LAE paid plus the change in case and incurred but not reported reserves. Shown net of losses ceded to reinsurers. Incurred loss and LAE and number of events includes the development on storms during the year in which it occurred.
See Note 9 in our Notes to Unaudited Condensed Consolidated Financial Statements for additional information regarding our reinsurance program.
Unpaid Losses and Loss Adjustments
We generally use the term “loss(es)” to collectively refer to both loss and LAE. We establish reserves for both reported and unreported unpaid losses that have occurred at or before the balance sheet date for amounts we estimate we will be required to pay in the future, including provisions for claims that have been reported but are unpaid at the balance sheet date and for obligations on claims that have been incurred but not reported at the balance sheet date. Our policy is to establish these loss reserves after considering all information known to us at each reporting period. At any given point in time, our loss reserve represents our best estimate of the ultimate settlement and administration costs of our insured claims incurred and unpaid.
Unpaid losses and LAE totaled $534,676,000$279,556,000 and $842,958,000$370,221,000 as of June 30, 2023March 31, 2024 and December 31, 2022,2023, respectively. Of this total, $513,118,000$258,379,000 and $816,489,000,$347,738,000, respectively, is related to our commercial lines operating segment. The
AMERICAN COASTAL INSURANCE CORPORATION
remaining $21,558,000$21,177,000 and $26,469,000,$22,483,000, respectively, is related to our personal lines operating segment. On a consolidated basis, this balance has decreased from year end as we continue to settle claims related to Hurricane Ian which made landfall in the third quarter of 2022.
Since the process of estimating loss reserves requires significant judgment due to a number of variables, such as fluctuations in inflation, judicial decisions, legislative changes and changes in claims handling procedures, our ultimate liability will likely differ from these estimates. We revise our reserve for unpaid losses as additional information becomes available, and reflect adjustments, if any, in our earnings in the periods in which we determine the adjustments as necessary.
AMERICAN COASTAL INSURANCE CORPORATION
See Note 10 in our Notes to Unaudited Condensed Consolidated Financial Statements for additional information regarding our losses and loss adjustments.
AMERICAN COASTAL INSURANCE CORPORATION
On February 10, 2023, we announced that a solvent run-off for UPC was unlikely and on February 27, 2023, UPC was placed into receivership with the DFS, which divested our ownership of UPC. As a result, UPC, as well as the activities related directly to supporting the business conducted by UPC, qualifies as a discontinued operation. For more information regarding the results of our discontinued operations, see Note 3 in our Notes to Consolidated Financial Statements.
RESULTS OF OPERATIONS - COMPARISON OF THE THREE MONTH PERIODS ENDED JUNE 30,MARCH 31, 2024 AND 2023 AND 2022
Net earningsincome attributable to ACIC for the three months ended June 30, 2023 increased $86,808,000,March 31, 2024 decreased $243,681,000, or 125.8%91.2%, to net income of $17,779,000 for the second quarter of 2023$23,599,000 from a net loss of $69,029,000$267,280,000 for the same period in 2022.2023. Of this income, $20,352,000$23,599,000 is attributable to continuing operations for the three months ended June 30, 2023, an increaseMarch 31, 2024, a decrease of $33,663,000$6,768,000 from a net loss of $13,311,000$30,367,000 for the same period in 2022. of2023. Drivers of net income from continuing operations during the second quarter of 20232024 include increased gross premiums earned a decrease in our provision for taxesand decreased expenses driven by the recognition of a valuation allowance against our deferred tax assets during 2022 and decreases in both operatingpolicy acquisition costs and administrative costs, as described below. This waslosses and LAE incurred, partially offset by increases in loss and LAE driven by increased catastrophe losses, and increased policy acquisition costs,lower revenues as described below. In additionthe result of higher ceded premiums earned. During the first quarter of 2024, none of our net income was attributable to continuing operations, we recognized a loss from discontinued operations, compared to $236,913,000 of $2,573,000, driven by the deconsolidation of UPC and activities related directlynet income attributable to supporting the business conducted by UPC.discontinued operations in 2023.
Revenue
Our gross written premiums increased $36,253,000,$10,335,000, or 17.5%5.5%, to $243,885,000$197,458,000 for the second quarterthree months ended June 30, 2023March 31, 2024 from $207,632,000$187,123,000 for the same period in 2022.2023. This increase was driven primarily by an increase in our commercial premiums written in Florida, as we continue to focus on transitioning towards a specialtyour commercial book of business. In addition, we saw an increase in written premiums across our personal lines underwriter.business, due primarily to rate increases. The breakdown of the quarter-over-quarter changes in both direct written and assumed premiums by state and gross written premium by line of business are shown in the table below.
| | ($ in thousands) | ($ in thousands) | | Three Months Ended June 30, | ($ in thousands) | | Three Months Ended March 31, |
| 2023 | | 2022 | | Change |
| | 2024 | | | | 2024 | | 2023 | | Change |
Direct Written and Assumed Premium by State (1) | Direct Written and Assumed Premium by State (1) | | | | | | |
| Florida | |
| Florida | |
| Florida | Florida | | $ | 236,766 | | | $ | 179,188 | | | $ | 57,578 | |
| New York | New York | | 7,063 | | | 4,984 | | | 2,079 | |
| Texas | Texas | | — | | | 1,803 | | | (1,803) | |
| South Carolina | | — | | | (78) | | | 78 | |
| Total direct written premium by state | | 243,829 | | | 185,897 | | | 57,932 | |
| Total direct written premium by region | |
Assumed premium (2) | Assumed premium (2) | | 56 | | | 21,735 | | | (21,679) | |
| Total gross written premium by state | | $ | 243,885 | | | $ | 207,632 | | | $ | 36,253 | |
| Total gross written premium by region | |
| | Gross Written Premium by Line of Business | Gross Written Premium by Line of Business | |
| Gross Written Premium by Line of Business | |
| Gross Written Premium by Line of Business | |
| Commercial property | |
| Commercial property | |
| Commercial property | Commercial property | | 236,822 | | | 181,067 | | | 55,755 | |
| Personal property | Personal property | | $ | 7,063 | | | $ | 26,565 | | | $ | (19,502) | |
| Total gross written premium by line of business | Total gross written premium by line of business | | $ | 243,885 | | | $ | 207,632 | | | $ | 36,253 | |
(1) We are no longer writing in Texas or South Carolina as of May 31, 2022.
(2) Assumed premium written for 2023 and 2024 primarily included commercial property business assumed from unaffiliated insurers. Assumed premium written for 2022 includes New York personal property business assumed from our former subsidiary, UPC totaling $11,863,000.
| | Three Months Ended June 30, |
New and Renewal Policies(1) by State (2) | 2023 | | 2022 | | Change |
| Three Months Ended March 31, | | | Three Months Ended March 31, |
New and Renewal Policies (1) By State | | New and Renewal Policies (1) By State | 2024 | | 2023 | | Change |
| Florida | Florida | 1,457 | | | 1,956 | | | (499) | |
| New York | New York | 4,563 | | | 10,991 | | | (6,428) | |
| Texas | — | | | 14 | | | (14) | |
| South Carolina | — | | | 1 | | | (1) | |
| | Total | Total | 6,020 | | | 12,962 | | | (6,942) | |
| Total | |
| Total | |
AMERICAN COASTAL INSURANCE CORPORATION
(1) Only includes new and renewal homeowner, commercial and dwelling fire policies written during the quarter.
(2) We are no longer writing in Texas or South Carolina as of May 31, 2022.
AMERICAN COASTAL INSURANCE CORPORATION
Expenses
Expenses for the three months ended June 30, 2023 increased $7,043,000,March 31, 2024 decreased $14,264,000, or 13.5%25.0%, to $59,036,000$42,800,000 from $51,993,000$57,064,000 for the same period in 2022.2023. The increasedecrease in expenses was primarily due to an increase in loss and LAE and policy acquisition costs. Operating and underwriting expenses and general and administrative expenses decreased in the second quarter of 2023 compared to the second quarter of 2022. The details of these changes can be seen below.
The calculations of our loss ratios and underlying loss ratios are shown below.
| | | | | | | | | | | | | | | | | |
| Three Months Ended June 30, |
| 2023 | | 2022 | | Change |
| Net loss and LAE | $ | 20,915 | | | $ | 14,032 | | | $ | 6,883 | |
| % of Gross earned premiums | 13.2 | % | | 10.8 | % | | 2.4 pts |
| % of Net earned premiums | 25.1 | % | | 21.7 | % | | 3.4 pts |
| Less: | | | | | |
| Current year catastrophe losses | $ | 6,540 | | | $ | (2,112) | | | $ | 8,652 | |
| Prior year reserve unfavorable development | (5,151) | | | (3,877) | | | (1,274) | |
Underlying loss and LAE (1) | $ | 19,526 | | | $ | 20,021 | | | $ | (495) | |
| % of Gross earned premiums | 12.3 | % | | 15.5 | % | | (3.2) pts |
| % of Net earned premiums | 23.5 | % | | 31.0 | % | | (7.5) pts |
(1) Underlying loss and LAE is a non-GAAP measure and is reconciled above to Net loss and LAE, the most directly comparable GAAP measure. Additional information regarding non-GAAP financial measures presented in this document is in the "Definitions of Non-GAAP Measures" section of this Form 10-Q.
The calculations of our expense ratios are shown below. | | | | | | | | | | | | | | | | | |
| Three Months Ended June 30, |
| 2023 | | 2022 | | Change |
| Policy acquisition costs | $ | 25,545 | | | $ | 23,570 | | | $ | 1,975 | |
| Operating and underwriting | 3,274 | | | 3,820 | | | (546) | |
| General and administrative | 6,583 | | | 8,208 | | | (1,625) | |
| Total Operating Expenses | $ | 35,402 | | | $ | 35,598 | | | $ | (196) | |
| % of Gross earned premiums | 22.4 | % | | 27.5 | % | | (5.1) pts |
| % of Net earned premiums | 42.6 | % | | 55.2 | % | | (12.6) pts |
Loss and LAE increased by $6,883,000, or 49.1%, to $20,915,000 for the second quarter of 2023 from $14,032,000 for the second quarter of 2022. Loss and LAE expense as a percentage of net earned premiums increased 3.4 points to 25.1% for the second quarter of 2023, compared to 21.7% for the second quarter of 2022. Excluding catastrophe losses and reserve development, our gross underlying loss and LAE ratio for the second quarter of 2023 would have been 12.3%, a decrease of 3.2 points from 15.5% during the second quarter of 2022.
Policy acquisition costs increased by $1,975,000, or 8.4%, to $25,545,000 for the second quarter of 2023 from $23,570,000 for the second quarter of 2022, primarily due to an increase in external management fees incurred of $4,878,000 related to our commercial lines gross written premium during the second quarter of 2023. In addition, we experienced increases in agent commissions, policy administration fees and premium taxes of $1,009,000, $149,000 and $658,000, respectively, driven by increased written premium quarter-over-quarter. These increases were partially offset by an increase in ceding commission income of $4,837,000 driven by our commercial lines quota share coverage entered into in the second quarter of 2023.
Operating and underwriting expenses decreased by $546,000, or 14.3%, to $3,274,000 for the second quarter of 2023 from $3,820,000 for the second quarter of 2022, driven by a decrease in investments in technology of $766,000 quarter-over-quarter.
General and administrative expenses decreased by $1,625,000, or 19.8%, to $6,583,000 for the second quarter of 2023 from $8,208,000 for the second quarter of 2022, driven by the a decrease in salary related expenses of $863,000, driven by decreased headcount quarter-over-quarter. In addition,policy acquisition costs for professional services provided by external vendors decreased $624,000 quarter-over-quarter.
AMERICAN COASTAL INSURANCE CORPORATION
Commercial Lines Operating Segment Results
Pretax earnings attributable to our commercial lines operating segment for the three months ended June 30, 2023 increased $6,595,000, or 35.1%, to pre-tax income of $25,381,000 for the second quarter of 2023 from pre-tax income of $18,786,000 for the same period in 2022. The change in earnings was primarily driven by increased gross written premiums quarter-over-quarter. This was partially offset by increased loss and LAE and policy acquisition costs quarter-over-quarter. The details of these changes are described below.
Revenue
Our gross written premiums attributable to our commercial lines operating segment increased $55,755,000, or 30.8%, to $236,822,000 for the second quarter ended June 30, 2023 from $181,067,000 for the same period in 2022. This increase was driven primarily by an increase in written premiums in the state of Florida, as we focus on increasing commercial written premiums and transitioning towards a specialty commercial lines underwriter. The breakdown of the commercial lines operating segment quarter-over-quarter changes in both direct written and assumed premiums by state are shown in the table below.
| | | | | | | | | | | | | | | | | | | | |
| ($ in thousands) | | Three Months Ended June 30, |
| | 2023 | | 2022 | | Change |
Direct Written and Assumed Premium by State (1) | | | | | | |
| Florida | | $ | 236,766 | | | $ | 179,188 | | | $ | 57,578 | |
| Texas | | — | | | 1,803 | | | (1,803) | |
| South Carolina | | — | | | (78) | | | 78 | |
| Total direct written premium by state | | 236,766 | | | 180,913 | | | 55,853 | |
Assumed premium (2) | | 56 | | | 154 | | | (98) | |
| Total gross written premium by state | | $ | 236,822 | | | $ | 181,067 | | | $ | 55,755 | |
(1) We are no longer writing in Texas or South Carolina as of May 31, 2022.
(2) Assumed premium written for 2022 and 2021 is primarily commercial property business assumed from unaffiliated insurers.
| | | | | | | | | | | | | | | | | |
| Three Months Ended June 30, |
New and Renewal Policies(1) by State (2) | 2023 | | 2022 | | Change |
| Florida | 1,457 | | | 1,956 | | | (499) | |
| Texas | — | | | 14 | | | (14) | |
| South Carolina | — | | | 1 | | | (1) | |
| Total | 1,457 | | | 1,971 | | | (514) | |
(1) Only includes new and renewal commercial policies written during the year.
(2) We are no longer writing in Texas or South Carolina as of May 31, 2022.
AMERICAN COASTAL INSURANCE CORPORATION
Expenses
Expenses attributable to our commercial lines operating segment for the three months ended June 30, 2023 increased $12,233,000, or 38.6%, to $43,903,000 from $31,670,000 for the same period in 2022. The increase in expenses was primarily due to an increase in loss and LAE and policy acquisition costs in the second quarter of 2023 compared to the second quarter of 2022. The details of these changes can be seen below.
The calculations of our commercial lines operating segment loss ratios and underlying loss ratios are shown below.
| | | | | | | | | | | | | | | | | |
| Three Months Ended June 30, |
| 2023 | | 2022 | | Change |
| Net loss and LAE | $ | 16,245 | | | $ | 8,194 | | | $ | 8,051 | |
| % of Gross earned premiums | 11.1 | % | | 7.2 | % | | 3.9 pts |
| % of Net earned premiums | 22.0 | % | | 15.9 | % | | 6.1 pts |
| Less: | | | | | |
| Current year catastrophe losses | $ | 6,201 | | | $ | (2,587) | | | $ | 8,788 | |
| Prior year reserve (favorable) development | (5,337) | | | (1,886) | | | (3,451) | |
Underlying loss and LAE (1) | $ | 15,381 | | | $ | 12,667 | | | $ | 2,714 | |
| % of Gross earned premiums | 10.5 | % | | 11.2 | % | | (0.7) pts |
| % of Net earned premiums | 20.8 | % | | 24.6 | % | | (3.8) pts |
(1) Underlying loss and LAE is a non-GAAP measure and is reconciled above to Net loss and LAE, the most directly comparable GAAP measure. Additional information regarding non-GAAP financial measures presented in this document is in the "Definitions of Non-GAAP Measures" section of this Form 10-Q.
The calculations of our commercial lines operating segment expense ratios are shown below. | | | | | | | | | | | | | | | | | |
| Three Months Ended June 30, |
| 2023 | | 2022 | | Change |
| Policy acquisition costs | $ | 23,526 | | | $ | 19,928 | | | $ | 3,598 | |
| Operating and underwriting | 1,501 | | | 1,127 | | | 374 | |
| General and administrative | 2,631 | | | 2,421 | | | 210 | |
| Total Operating Expenses | $ | 27,658 | | | $ | 23,476 | | | $ | 4,182 | |
| % of Gross earned premiums | 19.0 | % | | 20.7 | % | | (1.7) pts |
| % of Net earned premiums | 37.4 | % | | 45.6 | % | | (8.2) pts |
Loss and LAE attributable to our commercial lines operating segment increased by $8,051,000, or 98.3%, to $16,245,000 for the second quarter of 2023 from $8,194,000 for the second quarter of 2022. Loss and LAE expense as a percentage of net earned premiums increased 6.1 points to 22.0% for the second quarter of 2023, compared to 15.9% for the second quarter of 2022. Excluding catastrophe losses and reserve development, our gross underlying loss and LAE ratio for the second quarter of 2023 would have been 10.5%, a decrease of 0.7 points from 11.2% during the second quarter of 2022.
Policy acquisition costs attributable to our commercial lines operating segment increased by $3,598,000, or 18.1%, to $23,526,000 for the second quarter of 2023 from $19,928,000 for the second quarter of 2022, driven by increases in external management fees of $4,879,000, premium taxes of $591,000 and agent commissions of $391,000, all as a result of increased gross written premiums quarter-over-quarter. This was partially offset by increased ceding commission income of $2,246,000 related to our quota share reinsurance agreements, driven by new agreements as a part of our 2023 core catastrophe reinsurance program.
Operating and underwriting expenses attributable to our commercial lines operating segment increased by $374,000, or 33.2%, to $1,501,000 for the second quarter of 2023 from $1,127,000 for the second quarter of 2022, driven by a $749,000 increase in underwriting expenses quarter-over-quarter, partially offset by decreased allocations of expenses for investments in technology of $361,000 quarter-over-quarter.
General and administrative expenses attributable to our commercial lines operating segment increased by $210,000, or 8.7%, to $2,631,000 for the second quarter of 2023 from $2,421,000 for the second quarter of 2022, driven by a $369,000 increase in allocated external professional services costs for the second quarter of 2023 compared to the same period in 2022. This was partially offset by a decrease in salary related expenses of $133,000, driven by decreased headcount quarter-over-quarter.
AMERICAN COASTAL INSURANCE CORPORATION
Personal Lines Operating Segment Results
Pretax earnings attributable to our personal lines operating segment for the three months ended June 30, 2023 increased $2,389,000, or 64.1%, to a pre-tax loss of $1,336,000 for the second quarter of 2023 from a pre-tax loss of $3,725,000 for the same period in 2022. The change in pretax earnings was primarily driven by a decrease in expenses, partially offset by a decrease in gross premiums written and earned quarter-over-quarter as described below. The details of the change in these expenses are described below.
Revenue
Our gross written premiums attributable to our personal lines operating segment decreased $19,502,000, or 73.4%, to $7,063,000 for the second quarter ended June 30, 2023 from $26,565,000 for the same period in 2022. This decrease was driven primarily by a decrease in assumed premiums, driven by the termination of our quota share agreement between our former subsidiary, UPC and IIC effective December 31, 2022. The change in personal lines direct written and assumed premiums and new and renewal policies of the personal lines operating segment quarter-over-quarter can be seen below.
| | | | | | | | | | | | | | | | | | | | |
| ($ in thousands, policies in ones) | | Three Months Ended June 30, |
| | 2023 | | 2022 | | Change |
| | | | | | |
| | | | | | |
| | | | | | |
| Direct Written Premium | | $ | 7,063 | | | $ | 4,984 | | | $ | 2,079 | |
| Assumed Premiums | | — | | | 21,581 | | | (21,581) | |
| Total gross written premium | | $ | 7,063 | | | $ | 26,565 | | | $ | (19,502) | |
| | | | | | |
New and Renewal Policies (1) | | 4,563 | | | 10,991 | | | (6,428) | |
(1) Only includes new and renewal homeowner and dwelling fire policies written during the quarter.
AMERICAN COASTAL INSURANCE CORPORATION
Expenses
Expenses attributable to our personal lines operating segment for the three months ended June 30, 2023 decreased $5,241,000, or 30.2%, to $12,130,000 from $17,371,000 for the same period in 2022. The decrease in expenses is attributable to a decrease in general and administrative expenses and policy acquisition costs. Loss and LAE incurred also decreased, driven by decreased non-catastrophe losses. Operating and underwriting expenses also decreased quarter-over-quarter. The details of these changes are described below.
The calculations of our personal lines operating segment loss ratios and underlying loss ratios are shown below.
| | | | | | | | | | | | | | | | | |
| Three Months Ended June 30, |
| 2023 | | 2022 | | Change |
| Net loss and LAE | $ | 4,670 | | | $ | 5,838 | | | $ | (1,168) | |
| % of Gross earned premiums | 37.7 | % | | 35.9 | % | | 1.8 pts |
| % of Net earned premiums | 50.9 | % | | 44.6 | % | | 6.3 pts |
| Less: | | | | | |
| Current year catastrophe losses | $ | 340 | | | $ | 475 | | | $ | (135) | |
| Prior year reserve (favorable) development | 186 | | | (1,991) | | | 2,177 | |
Underlying loss and LAE (1) | $ | 4,144 | | | $ | 7,354 | | | $ | (3,210) | |
| % of Gross earned premiums | 33.5 | % | | 45.2 | % | | (11.7) pts |
| % of Net earned premiums | 45.2 | % | | 56.2 | % | | (11.0) pts |
(1) Underlying loss and LAE is a non-GAAP measure and is reconciled above to Net loss and LAE, the most directly comparable GAAP measure. Additional information regarding non-GAAP financial measures presented in this document is in the "Definitions of Non-GAAP Measures" section of this Form 10-Q.
The calculations of our personal lines operating segment expense ratios are shown below. | | | | | | | | | | | | | | | | | |
| Three Months Ended June 30, |
| 2023 | | 2022 | | Change |
| Policy acquisition costs | $ | 2,019 | | | $ | 3,642 | | | $ | (1,623) | |
| Operating and underwriting | 1,669 | | | 2,606 | | | (937) | |
| General and administrative | 3,772 | | | 5,285 | | | (1,513) | |
| Total Operating Expenses | $ | 7,460 | | | $ | 11,533 | | | $ | (4,073) | |
| % of Gross earned premiums | 60.2 | % | | 70.9 | % | | (10.7) pts |
| % of Net earned premiums | 81.2 | % | | 88.1 | % | | (6.9) pts |
Loss and LAE attributable to our personal lines operating segment decreased by $1,168,000, or 20.0%, to $4,670,000 for the second quarter of 2023 from $5,838,000 for the second quarter of 2022. Loss and LAE expense as a percentage of net earned premiums increased 6.3 points to 50.9% for the second quarter of 2023, compared to 44.6% for the second quarter of 2022. Excluding catastrophe losses and reserve development, our gross underlying loss and LAE ratio for the second quarter of 2023 would have been 33.5%, a decrease of 11.7 points from 45.2% during the second quarter of 2022.
Policy acquisition costs attributable to our personal lines operating segment decreased by $1,623,000, or 44.6%, to $2,019,000 for the second quarter of 2023 from $3,642,000 for the second quarter of 2022, primarily due to a decrease in reinsurance commissions of $2,591,000, driven by the termination of the quota share agreement between our former subsidiary UPC and IIC. This was partially offset by increased agent commissions and policy administration fees of $618,000 and $167,000, respectively, which fluctuate in conjunction with the quarter-over-quarter increase in personal lines direct gross written premium.
Operating and underwriting expenses attributable to our personal lines operating segment decreased by $937,000, or 36.0%, to $1,669,000 for the second quarter of 2023 from $2,606,000 for the second quarter of 2022, due to decreased investments in technology of $397,000 and decreased underwriting expenses of $188,000 quarter-over-quarter. We also experienced decreased operating costs such as utilities, printing and postage of $216,000 quarter-over-quarter.
General and administrative expenses attributable to our personal lines operating segment decreased by $1,513,000, or 28.6%, to $3,772,000 for the second quarter of 2023 from $5,285,000 for the second quarter of 2022, driven by a $730,000 decrease in salary related expenses as a result of lower headcount quarter-over-quarter. In addition, costs for professional services provided by external vendors decreased $739,000 quarter-over-quarter.
AMERICAN COASTAL INSURANCE CORPORATION
RESULTS OF OPERATIONS - COMPARISON OF THE SIX MONTH PERIODS ENDED JUNE 30, 2023 AND 2022
Net earnings attributable to ACIC for the six months ended June 30, 2023 increased $387,260,000, or 378.9%, to net income of $285,059,000 from a net loss of $102,201,000 for the same period in 2022. Of this income, $50,719,000 is attributable to continuing operations for the six months ended June 30, 2023, an increase of $64,303,000 from a net loss of $13,584,000 for the same period in 2022. Drivers of net income from continuing operations during 2023 include increased gross premiums earned, a decrease in our provision for taxes driven by the recognition of a valuation allowance against our deferred tax assets during 2022 and decreased operating and administrative costs as well as decreased loss and LAE incurred, as described below. In addition to continuing operations, we recognized income from discontinued operations of $234,340,000, driven by the deconsolidation of UPC and activities related directly to supporting the business conducted by UPC.
Revenue
Our gross written premiums increased $80,962,000, or 23.1%, to $431,008,000 for the six months ended June 30, 2023 from $350,046,000 for the same period in 2022. This increase was driven primarily by an increase in our commercial premiums written, as we focus on transitioning towards a specialty commercial lines underwriter. The breakdown of the quarter-over-quarter changes in both direct written and assumed premiums by state and gross written premium by line of business are shown in the table below.
| | | | | | | | | | | | | | | | | | | | |
| ($ in thousands) | | Six Months Ended June 30, |
| | 2023 | | 2022 | | Change |
Direct Written and Assumed Premium by State (1) | | | | | | |
| Florida | | $ | 413,377 | | | $ | 304,952 | | | $ | 108,425 | |
| New York | | 17,545 | | | 9,667 | | | 7,878 | |
| South Carolina | | — | | | 15 | | | (15) | |
| Texas | | (9) | | | 3,789 | | | (3,798) | |
| Total direct written premium by region | | 430,913 | | | 318,423 | | | 112,490 | |
Assumed premium (2) | | 95 | | | 31,623 | | | (31,528) | |
| Total gross written premium by region | | $ | 431,008 | | | $ | 350,046 | | | $ | 80,962 | |
| | | | | | |
| Gross Written Premium by Line of Business | | | | | | |
| Commercial property | | 413,463 | | | 309,031 | | | 104,432 | |
| Personal property | | $ | 17,545 | | | $ | 41,015 | | | $ | (23,470) | |
| Total gross written premium by line of business | | $ | 431,008 | | | $ | 350,046 | | | $ | 80,962 | |
(1) We are no longer writing in Texas or South Carolina as of May 31, 2022.
(2) Assumed premium written for 2023 primarily included commercial property business assumed from unaffiliated insurers. Assumed premium written for 2022 includes New York personal property business assumed from our former subsidiary, UPC totaling $21,630,000.
| | | | | | | | | | | | | | | | | |
| Six Months Ended June 30, |
New and Renewal Policies (1) By State (2) | 2023 | | 2022 | | Change |
| Florida | 2,614 | | | 3,428 | | | (814) | |
| New York | 10,700 | | | 20,943 | | | (10,243) | |
| Texas | — | | | 32 | | | (32) | |
| South Carolina | — | | | 2 | | | (2) | |
| Total | 13,314 | | | 24,405 | | | (11,091) | |
(1) Only includes new and renewal homeowner, commercial and dwelling fire policies written during the quarter.
(2) We are no longer writing in Texas or South Carolina as of May 31, 2022.
AMERICAN COASTAL INSURANCE CORPORATION
Expenses
Expenses for the six months ended June 30, 2023 increased $3,354,000, or 3.0%, to $116,100,000 from $112,746,000 for the same period in 2022. The increase in expenses was primarily due to an increase in policy acquisition costs year-over-year. Loss and LAE incurred, operating and underwriting and general and administrative expenses all decreased year-over-year.quarter-over-quarter. The details of these changes can be seen below.
| | Six Months Ended June 30, |
| 2023 | | 2022 | | Change |
| Three Months Ended March 31, | | | Three Months Ended March 31, |
| 2024 | | 2023 | | Change |
| Net loss and LAE | Net loss and LAE | $ | 37,327 | | | $ | 40,347 | | | $ | (3,020) | |
| % of Gross earned premiums | % of Gross earned premiums | 12.3 | % | | 16.0 | % | | (3.7) pts | % of Gross earned premiums | 9.4 | % | | 11.5 | % | | (2.1) pts |
| % of Net earned premiums | % of Net earned premiums | 21.9 | % | | 33.0 | % | | (11.1) pts | % of Net earned premiums | 23.1 | % | | 18.9 | % | | 4.2 pts |
| Less: | Less: | |
| Current year catastrophe losses | Current year catastrophe losses | $ | 9,155 | | | $ | 3,416 | | | $ | 5,739 | |
| Current year catastrophe losses | |
| Current year catastrophe losses | |
| Prior year reserve (favorable) development | Prior year reserve (favorable) development | (8,316) | | | (6,941) | | | (1,375) | |
Underlying loss and LAE (1) | Underlying loss and LAE (1) | $ | 36,488 | | | $ | 43,872 | | | $ | (7,384) | |
| % of Gross earned premiums | % of Gross earned premiums | 12.1 | % | | 17.4 | % | | (5.3) pts | % of Gross earned premiums | 9.2 | % | | 11.7 | % | | (2.5) pts |
| % of Net earned premiums | % of Net earned premiums | 21.4 | % | | 35.9 | % | | (14.5) pts | % of Net earned premiums | 22.7 | % | | 19.4 | % | | 3.3 pts |
(1) Underlying loss and LAE is a non-GAAP measure and is reconciled above to net loss and LAE, the most directly comparable GAAP measure. Additional information regarding non-GAAP financial measures presented in this document is in the "Definitions of Non-GAAP Measures" section of this Form 10-Q.
The calculations of our expense ratios are shown below. | | Six Months Ended June 30, |
| 2023 | | 2022 | | Change |
| Three Months Ended March 31, | | | Three Months Ended March 31, |
| 2024 | | 2023 | | Change |
| Policy acquisition costs | Policy acquisition costs | $ | 52,517 | | | $ | 43,878 | | | $ | 8,639 | |
| Operating and underwriting | Operating and underwriting | 5,442 | | | 7,527 | | | (2,085) | |
| General and administrative | General and administrative | 15,376 | | | 16,272 | | | (896) | |
| Total operating expenses | Total operating expenses | $ | 73,335 | | | $ | 67,677 | | | $ | 5,658 | |
| % of Gross earned premiums | % of Gross earned premiums | 24.2 | % | | 26.8 | % | | (2.6) pts | % of Gross earned premiums | 14.3 | % | | 26.3 | % | | (12.0) pts |
| % of Net earned premiums | % of Net earned premiums | 43.0 | % | | 55.3 | % | | (12.3) pts | % of Net earned premiums | 35.2 | % | | 43.4 | % | | (8.2) pts |
Loss and LAE decreased $3,020,000,$506,000, or 7.5%3.1%, to $37,327,000$15,906,000 for the sixthree months ended June 30, 2023March 31, 2024 from $40,347,000$16,412,000 for the same period in 2022.2023. Loss and LAE expense as a percentage of net earned premiums decreased 11.1increased 4.2 points to 21.9%23.1% for the sixthree months ended June 30, 2023,March 31, 2024, compared to 33.0%18.9% for the same period in 2022.2023. Excluding catastrophe losses and reserve development, our gross underlying loss and LAE ratio for the sixthree months ended June 30, 2023March 31, 2024 was 12.1%9.2%, a decrease of 5.32.5 points from 17.4%11.7% during the sixthree months ended June 30, 2022.March 31, 2023.
Policy acquisition costs increased $8,639,000,decreased $15,179,000, or 19.7%56.3%, to $52,517,000$11,793,000 for the sixthree months ended June 30, 2023March 31, 2024 from $43,878,000$26,972,000 for the same period in 2022.2023. The primary driver of the increasedecrease was an increase in external management fees incurredceding commission income of $12,415,000 related to$17,321,000, driven by our commercial lines gross written premium duringquota share coverage effective June 1, 2023. This was partially offset by an increase in ceding commission incomeexternal management fees incurred of $3,861,000 driven by$1,599,000 and premium taxes of $556,000 related primarily to our increased commercial lines quota share coverage entered into in the second quarter of 2023.gross written premium during 2024.
Operating expenses decreased $2,085,000,increased $641,000, or 27.7%29.6%, to $5,442,000$2,809,000 for the sixthree months ended June 30, 2023March 31, 2024 from $7,527,000$2,168,000 for the same period in 2022,2023, primarily due to increased underwriting costs quarter-over-quarter totaling $1,120,000. This was partially offset by decreased investments in technology of $1,271,000. We also experienced decreased operatingoverhead costs such as rent, printing, postage and utilities printing and postagetotaling $328,000 as a result of $484,000 year-over-year.cost saving initiatives implemented.
General and administrative expenses decreased $896,000,increased $780,000, or 5.5%8.9%, to $15,376,000$9,573,000 for the sixthree months ended June 30, 2023March 31, 2024 from $16,272,000$8,793,000 for the same period in 20222023 driven by a $477,000 decreaseincreased external legal and audit fees in tax related expenses year-over-year. In addition, depreciation and amortization expense decreased $501,000 year-over-year.
AMERICAN COASTAL INSURANCE CORPORATION
Commercial Lines Operating Segment Results
Pretax earnings attributable to our commercial lines operating segment for the sixthree months ended June 30, 2023 increased $33,932,000,March 31, 2024 decreased $6,124,000, or 111.7%15.7%, to pre-tax income of $64,300,000$32,795,000 from pre-tax income of $30,368,000$38,919,000 for the same period in 2022.2023. The change in earnings was primarily driven by increased gross writtenceded premiums, driven by changes in our quota share contracts effective June 1, 2023, increased general and administrative expenses and increased operating expenses, the details of which are described below. This increase was partially offset by increased policy acquisition costs and loss and LAE incurred during 2023 comparedgross premiums earned quarter-over-quarter as we continue to the same period in 2022. The details of these changes are described below.focus on our specialty commercial lines underwriting.
Revenue
Our gross written premiums attributable to our commercial lines operating segment increased $104,432,000,$7,960,000, or 33.8%4.5%, to $413,463,000$184,601,000 for the sixthree months ended June 30, 2023March 31, 2024 from $309,031,000$176,641,000 for the same period in 2022.2023. This increase was driven primarily by an increase in written premiums in the state of Florida, as weour continued focus on increasing commercial written premiums and transitioning to aour specialty commercial lines underwriter.underwriting. The breakdown of the commercial lines operating segment year-over-year changes in both direct written and assumed premiums by state are shown in the table below.
| | ($ in thousands) | ($ in thousands) | | Six Months Ended June 30, | ($ in thousands) | | Three Months Ended March 31, |
| 2023 | | 2022 | | Change |
| | 2024 | | | | 2024 | | 2023 | | Change |
Direct Written and Assumed Premium by State (1) | Direct Written and Assumed Premium by State (1) | | | | | | |
| Florida | Florida | | $ | 413,377 | | | $ | 304,952 | | | $ | 108,425 | |
| South Carolina | | — | | | 15 | | | (15) | |
| Florida | |
| Florida | |
| Texas | Texas | | (9) | | | 3,789 | | | (3,798) | |
| Total direct written premium by region | Total direct written premium by region | | 413,368 | | | 308,756 | | | 104,612 | |
Assumed premium (2) | Assumed premium (2) | | 95 | | | 275 | | | (180) | |
| Total gross written premium by region | Total gross written premium by region | | $ | 413,463 | | | $ | 309,031 | | | $ | 104,432 | |
(1) We are no longer writing in Texas or South Carolina as of May 31, 2022.
(2) Assumed premium written for 20232024 and 20222023 is primarily commercial property business assumed from unaffiliated insurers.
| | | | | | | | | | | | | | | | | |
| Six Months Ended June 30, |
New and Renewal Policies(1) by State (2) | 2023 | | 2022 | | Change |
| Florida | 2,614 | | | 3,428 | | | (814) | |
| Texas | — | | | 32 | | | (32) | |
| South Carolina | — | | | 2 | | | (2) | |
| Total | 2,614 | | | 3,462 | | | (848) | |
| | | | | | | | | | | | | | | | | |
| Three Months Ended March 31, |
New and Renewal Policies(1) by State | 2024 | | 2023 | | Change |
| Florida | 1,062 | | | 1,157 | | | (95) | |
| | | | | |
| | | | | |
| Total | 1,062 | | | 1,157 | | | (95) | |
(1) Only includes new and renewal commercial policies written during the year.
(2) We are no longer writing in Texas or South Carolina as of May 31, 2022.
AMERICAN COASTAL INSURANCE CORPORATION
Expenses
Expenses attributable to our commercial lines operating segment for the sixthree months ended June 30, 2023 increased $19,929,000,March 31, 2024 decreased $8,663,000, or 30.2%20.7%, to $85,820,000$33,254,000 from $65,891,000$41,917,000 for the same period in 2022.2023. The increasedecrease in expenses was primarily due to an increasea decrease in policy acquisition costs and loss and LAE expenses during 2023 compared to the same period in 2022.incurred. This was partially offset by increased operating and administrative costs. The details of these changes quarter-over-quarter can be seen below.
The calculations of our commercial lines operating segment loss ratios and underlying loss ratios are shown below.
| | Six Months Ended June 30, |
| 2023 | | 2022 | | Change |
| Three Months Ended March 31, | | | Three Months Ended March 31, |
| 2024 | | 2023 | | Change |
| Net loss and LAE | Net loss and LAE | $ | 30,146 | | | $ | 22,308 | | | $ | 7,838 | |
| % of Gross earned premiums | % of Gross earned premiums | 10.8 | % | | 10.1 | % | | 0.7 pts | % of Gross earned premiums | 7.2 | % | | 10.5 | % | | (3.3) pts |
| % of Net earned premiums | % of Net earned premiums | 19.7 | % | | 23.0 | % | | (3.3) pts | % of Net earned premiums | 18.4 | % | | 17.7 | % | | 0.7 pts |
| Less: | Less: | |
| Current year catastrophe losses | Current year catastrophe losses | $ | 8,298 | | | $ | 518 | | | $ | 7,780 | |
| Current year catastrophe losses | |
| Current year catastrophe losses | |
| Prior year reserve (favorable) development | Prior year reserve (favorable) development | (8,107) | | | (3,689) | | | (4,418) | |
Underlying loss and LAE (1) | Underlying loss and LAE (1) | $ | 29,955 | | | $ | 25,479 | | | $ | 4,476 | |
| % of Gross earned premiums | % of Gross earned premiums | 10.8 | % | | 11.5 | % | | (0.7) pts | % of Gross earned premiums | 7.1 | % | | 11.0 | % | | (3.9) pts |
| % of Net earned premiums | % of Net earned premiums | 19.6 | % | | 26.3 | % | | (6.7) pts | % of Net earned premiums | 18.2 | % | | 18.5 | % | | (0.3) pts |
(1) Underlying loss and LAE is a non-GAAP measure and is reconciled above to Net loss and LAE, the most directly comparable GAAP measure. Additional information regarding non-GAAP financial measures presented in this document is in the "Definitions of Non-GAAP Measures" section of this Form 10-Q.
The calculations of our commercial lines operating segment expense ratios are shown below.
| | | | | | | | | | | | | | | | | |
| Six Months Ended June 30, |
| 2023 | | 2022 | | Change |
| Policy acquisition costs | $ | 48,692 | | | $ | 36,606 | | | $ | 12,086 | |
| Operating and underwriting | 1,597 | | | 2,236 | | | (639) | |
| General and administrative | 5,385 | | | 4,741 | | | 644 | |
| Total Operating Expenses | $ | 55,674 | | | $ | 43,583 | | | $ | 12,091 | |
| % of Gross earned premiums | 20.0 | % | | 19.7 | % | | 0.3 pts |
| % of Net earned premiums | 36.5 | % | | 45.0 | % | | (8.5) pts |
| | | | | | | | | | | | | | | | | |
| Three Months Ended March 31, |
| 2024 | | 2023 | | Change |
| Policy acquisition costs | $ | 12,181 | | | $ | 25,166 | | | $ | (12,985) | |
| Operating and underwriting | 2,187 | | | 96 | | | 2,091 | |
| General and administrative | 7,333 | | | 2,754 | | | 4,579 | |
| Total Operating Expenses | $ | 21,701 | | | $ | 28,016 | | | $ | (6,315) | |
| % of Gross earned premiums | 13.5 | % | | 21.2 | % | | (7.7) pts |
| % of Net earned premiums | 34.6 | % | | 35.6 | % | | (1.0) pts |
Loss and LAE attributable to our commercial lines operating segment increaseddecreased by $7,838,000,$2,348,000, or 35.1%16.9%, to $30,146,000$11,553,000 for the sixthree months ended June 30, 2023March 31, 2024 from $22,308,000$13,901,000 for the same period in 2022.2023. Loss and LAE expense as a percentage of net earned premiums decreased 3.3increased 0.7 points to 19.7%18.4% for the sixthree months ended June 30, 2023March 31, 2024 compared to 23.0%17.7% for the same period in 2022.2023. Excluding catastrophe losses and reserve development, our gross underlying loss and LAE ratio for the sixthree months ended June 30, 2023March 31, 2024 would have been 10.8%7.1%, a decrease of 0.73.9 points from 11.5%11.0% during the same period in 2022.2023.
Policy acquisition costs attributable to our commercial lines operating segment increaseddecreased by $12,086,000,$12,985,000, or 33.0%51.6%, to $48,692,000$12,181,000 for the sixthree months ended June 30, 2023March 31, 2024 from $36,606,000$25,166,000 for the same period in 2022,2023, driven by a $12,415,000$17,311,000 increase in ceding commission income related to our quota share agreements effective June 1, 2023. This was partially offset by an $3,823,000 increase in external management fees and commissions and a $509,000 increase in premium tax expense, all as a result of increased gross written premiums year-over-year.quarter-over-quarter.
Operating and underwriting expenses attributable to our commercial lines operating segment decreasedincreased by $639,000,$2,091,000, or 28.6%2,178.1%, to $1,597,000$2,187,000 for the sixthree months ended June 30, 2023March 31, 2024 from $2,236,000$96,000 for the same period in 2022,2023, driven by a $557,000 decrease$1,050,000 increase in allocationsunderwriting expenses and a $1,041,000 increase in allocation of overhead expenses for investments in technology.2024.
General and administrative expenses attributable to our commercial lines operating segment increased by $644,000,$4,579,000, or 13.6%166.3%, to $5,385,000$7,333,000 for the sixthree months ended 20232024 from $4,741,000$2,754,000 for the same period in 2022,2023, driven by a $765,000$2,728,000 increase in allocated salaries and a $1,777,000 increase in allocated external fees related tosuch as legal, audit, actuarial and tax services provided during the year.
AMERICAN COASTAL INSURANCE CORPORATION
Personal Lines Operating Segment Results
Pretax earnings attributable to our personal lines operating segment for the sixthree months ended June 30, 2023March 31, 2024 increased $11,839,000,$3,013,000, or 78.5%158.0%, to a pre-tax lossincome of $3,243,000$1,106,000 from a pre-tax loss of $15,082,000$1,907,000 for the same period in 2022.2023. The change in pretax earnings was primarily driven by a decrease in expenses, the details of which are described below. These decreases were partially offset by a decrease in gross writtennet premiums writtenearned quarter-over-quarter and earned year-over-year as described below. The details of the changes in these expenses are described below.increased losses and LAE, driven by increased non-catastrophe losses quarter-over-quarter.
Revenue
Our gross written premiums attributable to our personal lines operating segment decreased $23,470,000increased $2,375,000 or 57.2%22.7%, to $17,545,000$12,857,000 for the sixthree months ended June 30, 2023March 31, 2024 from $41,015,000$10,482,000 for the same period in 2022.2023. This decreaseincrease was driven primarily by a decrease in assumed premiums, driven by the terminationrate increases on our personal lines book of our quota share agreement between our former subsidiary, UPC and IIC effective December 31, 2022.business. The change in personal lines direct written and assumed premiums and new and renewal policies of the personal lines operating segment year-over-yearquarter-over-quarter can be seen below.
| | ($ in thousands) | ($ in thousands) | | Six Months Ended June 30, | ($ in thousands) | | Three Months Ended March 31, |
| 2023 | | 2022 | | Change |
| | 2024 | | | | 2024 | | 2023 | | Change |
| | | Direct Written Premium | Direct Written Premium | | $ | 17,545 | | | $ | 9,667 | | | $ | 7,878 | |
| Assumed Premiums | | — | | | 31,348 | | | (31,348) | |
| Total gross written premium by region | | $ | 17,545 | | | $ | 41,015 | | | $ | (23,470) | |
| | Direct Written Premium | |
| | Direct Written Premium | |
| | Total gross written premium | |
| Total gross written premium | |
| Total gross written premium | |
| New and Renewal Policies (1) | New and Renewal Policies (1) | | 10,700 | | | 20,943 | | | (10,243) | |
New and Renewal Policies (1) | |
New and Renewal Policies (1) | |
(1) Only includes new and renewal homeowner and dwelling fire policies written during the year.
AMERICAN COASTAL INSURANCE CORPORATION
Expenses
Expenses attributable to our personal lines operating segment for the sixthree months ended June 30, 2023March 31, 2024 decreased $16,770,000,$5,581,000, or 40.8%45.9%, to $24,302,000$6,591,000 from $41,072,000$12,172,000 for the same period in 2022.2023. The decrease in expenses is attributable to a decrease in policy acquisition costs, operating and administrative costs, the details of which are described below. These decreases were partially offset by increased loss and LAE incurred, and policy acquisition costs. General and administrative and operating and underwriting expenses also decreased year-over-year. The details of these changes are described below.driven by increased non-catastrophe losses.
The calculations of our personal lines operating segment loss ratios and underlying loss ratios are shown below.
| | Six Months Ended June 30, |
| 2023 | | 2022 | | Change |
| Three Months Ended March 31, | | | Three Months Ended March 31, |
| 2024 | | 2023 | | Change |
| Net loss and LAE | Net loss and LAE | $ | 7,181 | | | $ | 18,039 | | | $ | (10,858) | |
| % of Gross earned premiums | % of Gross earned premiums | 28.9 | % | | 57.2 | % | | (28.3) pts | % of Gross earned premiums | 50.9 | % | | 20.2 | % | | 30.7 pts |
| % of Net earned premiums | % of Net earned premiums | 40.2 | % | | 71.1 | % | | (30.9) pts | % of Net earned premiums | 71.4 | % | | 29.0 | % | | 42.4 pts |
| Less: | Less: | |
| Current year catastrophe losses | Current year catastrophe losses | $ | 858 | | | $ | 2,898 | | | $ | (2,040) | |
| Current year catastrophe losses | |
| Current year catastrophe losses | |
| Prior year reserve (favorable) development | Prior year reserve (favorable) development | (209) | | | (3,252) | | | 3,043 | |
Underlying loss and LAE (1) | Underlying loss and LAE (1) | $ | 6,532 | | | $ | 18,393 | | | $ | (11,861) | |
| % of Gross earned premiums | % of Gross earned premiums | 26.3 | % | | 58.3 | % | | (32.0) pts | % of Gross earned premiums | 49.0 | % | | 19.2 | % | | 29.8 pts |
| % of Net earned premiums | % of Net earned premiums | 36.5 | % | | 72.4 | % | | (35.9) pts | % of Net earned premiums | 68.7 | % | | 27.5 | % | | 41.2 pts |
(1) Underlying loss and LAE is a non-GAAP measure and is reconciled above to Net loss and LAE, the most directly comparable GAAP measure. Additional information regarding non-GAAP financial measures presented in this document is in the "Definitions of Non-GAAP Measures" section of this Form 10-Q.
The calculations of our personal lines operating segment expense ratios are shown below. | | Six Months Ended June 30, |
| 2023 | | 2022 | | Change |
| Three Months Ended March 31, | | | Three Months Ended March 31, |
| 2024 | | 2023 | | Change |
| Policy acquisition costs | Policy acquisition costs | $ | 3,825 | | | $ | 7,272 | | | $ | (3,447) | |
| Operating and underwriting | Operating and underwriting | 3,617 | | | 5,113 | | | (1,496) | |
| General and administrative | General and administrative | 9,679 | | | 10,648 | | | (969) | |
| Total Operating Expenses | Total Operating Expenses | $ | 17,121 | | | $ | 23,033 | | | $ | (5,912) | |
| % of Gross earned premiums | % of Gross earned premiums | 69.0 | % | | 73.0 | % | | (4.0) pts | % of Gross earned premiums | 26.2 | % | | 77.6 | % | | (51.4) pts |
| % of Net earned premiums | % of Net earned premiums | 95.9 | % | | 90.7 | % | | 5.2 pts | % of Net earned premiums | 36.7 | % | | 111.5 | % | | (74.8) pts |
Loss and LAE attributable to our personal lines operating segment decreasedincreased by $10,858,000,$1,842,000, or 60.2%73.4%, to $7,181,000$4,353,000 for the sixthree months ended June 30, 2023March 31, 2024 from $18,039,000$2,511,000 for the same period in 2022.2023. Loss and LAE expense as a percentage of net earned premiums increased 30.942.4 points to 40.2%71.4% for the sixthree months ended June 30, 2023,March 31, 2024, compared to 71.1%29.0% for the same period in 2022.2023. Excluding catastrophe losses and reserve development, our gross underlying loss and LAE ratio for the sixthree months ended June 30, 2023March 31, 2024 would have been 26.3%49.0%, a decreasean increase of 32.029.8 points from 58.3%19.2% for the same period in 2022.2023.
Policy acquisition costs attributable to our personal lines operating segment decreased by $3,447,000,$2,194,000, or 47.4%121.5%, to $3,825,000$(388,000) for the sixthree months ended June 30, 2023March 31, 2024 from $7,272,000$1,806,000 for the same period in 2022,2023, primarily due to a $2,214,000 decrease in reinsurance commissions of $5,121,000,agent commission expense in 2024, driven by the terminationcollection of the quota share agreement between our former subsidiary UPC and IIC. This was partially offset by increasedpreviously unearned agent commissions and policy administration fees of $884,000 and $284,000, respectively, which fluctuate in conjunction with the year-over-year increase in personal lines direct gross written premium.commissions.
Operating and underwriting expenses attributable to our personal lines operating segment decreased by $1,496,000,$1,412,000, or 29.3%72.5%, to $3,617,000$536,000 for the sixthree months ended June 30, 2023March 31, 2024 from $5,113,000$1,948,000 for the same period in 2022,2023, due to decreased allocation of investments in technology of $699,000 and decreased underwriting expenses of $310,000 year-over-year.$1,070,000. We also experienced decreased operating costs such as utilities, printing and postage of $188,000 year-over-year.$375,000 quarter-over-quarter.
General and administrative expenses attributable to our personal lines operating segment decreased $969,000,$3,817,000, or 9.1%64.6%, to $9,679,000$2,090,000 for the sixthree months ended June 30, 2023March 31, 2024 from $10,648,000$5,907,000 for the same period in 2022,2023, driven costs for professionalby a $3,363,000 decrease in allocated salaries and a $586,000 decrease in allocated external fees such as legal, audit, actuarial and tax services provided by external vendors decreasing $877,000 year-over-year.during the year.
AMERICAN COASTAL INSURANCE CORPORATION
LIQUIDITY AND CAPITAL RESOURCES
We generate cash through premium collections, reinsurance recoveries, investment income, the sale or maturity of invested assets, the incurrence of debt and the issuance of additional shares of our stock. We use our cash to pay reinsurance premiums, claims and related costs, policy acquisition costs, salaries and employee benefits, other expenses and stockholder dividends, acquire subsidiaries and pay associated costs, as well as to repay debts, repurchase stock and purchase investments.
As a holding company, we do not conduct any business operations of our own and, as a result, we rely on cash dividends or intercompany loans from our management subsidiaries to pay our general and administrative expenses. Insurance regulatory authorities heavily regulate our insurance subsidiaries, including restricting any dividends paid by our insurance subsidiaries and requiring approval of any management fees our insurance subsidiaries pay to our management subsidiaries for services rendered; however, nothing restricts our non-insurance company subsidiaries from paying us dividends other than state corporate laws regarding solvency. Our management subsidiaries pay us dividends primarily using cash from the collection of management fees from our insurance subsidiaries, pursuant to the management agreements in effect between those entities. In accordance with state laws, our insurance subsidiaries may pay dividends or make distributions out of that part of their statutory surplus derived from their net operating profit and their net realized capital gains. The Risk-Based Capital (RBC) guidelines published by the National Association of Insurance Commissioners may further restrict our insurance subsidiaries’ ability to pay dividends or make distributions if the amount of the intended dividend or distribution would cause their respective surplus as it regards policyholders to fall below minimum RBC guidelines. See Note 14 in our Notes to Unaudited Condensed Consolidated Financial Statements for additional information.
During the three and six months ended June 30, 2023,March 31, 2024, the Company made no capital contributions to its subsidiaries. During the three and six months ended June 30, 2022, the Company made capital contributions of $31,000,000 and $39,000,000, respectively to our former insurance subsidiary, UPC anda capital contribution of $3,200,000 and $11,200,000, respectively$1,265,000 to our former insuranceits reinsurance subsidiary, FSIC.UPC Re. We may make future contributions of capital to our insurance subsidiaries as circumstances require. The Company made no capital contributions to its subsidiaries during the three months ended March 31, 2023.
As described in Note 1 in theNotes to Unaudited Condensed Consolidated Financial Statements above, substantial doubt existed about the Company’s ability to continue as a going concern within the twelve-month period subsequent to the date that our Form 10-K was previously issued. However, as of June 30,In September 2023, the Company entered into an equity distribution agreement (the “Agreement”) with Raymond James & Associates, Inc., as agent (the “Agent”), of up to 8,000,000 shares of the Company’s common stock, par value $0.0001 per share (the “Shares”). Sales of the Shares under the Agreement will be made in sales deemed to be “at the market offerings”. The Agent is not required to sell any specific amount of Shares but has concluded thatagreed to act as the events describedCompany’s sales agent for a commission equal to 3.0% of the gross proceeds from the sales of the Shares. As of March 31, 2024, 4,373,000 shares had been sold under the Agreement resulting in Note 1 have alleviatedcommissions paid of approximately $1,181,000 and net proceeds of approximately $38,190,000. The Agreement will terminate upon the issuance and sale of all Shares subject to the Agreement, or the Agreement may be suspended or discontinued at any time. The Company does not plan to sell additional shares under the at-the-market program to which this substantial doubt. Accordingly,Agreement relates during the unaudited condensed consolidated interim financial statements have been prepared on a basis that assumes the Company will continue as a going concern and which contemplates the realizationfirst half of assets and satisfaction of liabilities and commitments in the ordinary course of business.2024.
Cash Flows for the sixthree months ended June 30,March 31, 2024 and 2023 and 2022 (in millions)
AMERICAN COASTAL INSURANCE CORPORATION
Operating Activities
AMERICAN COASTAL INSURANCE CORPORATION
The principal cash inflows from our operating activities come from premium collections, reinsurance recoveries and investment income. The principal cash outflows from our operating activities are the result of claims and related costs, reinsurance premiums, policy acquisition costs and salaries and employee benefits. A primary liquidity concern with respect to these cash flows is the risk of large magnitude catastrophe events.
During the sixthree months ended June 30, 2023,March 31, 2024, we experienced cash outflowsinflows of $232,823,000$124,484,000 compared to cash inflowsoutflows of $8,286,000$104,164,000 during the sixthree months ended June 30, 2022.March 31, 2023. This change in outflows was driven by the continued payment of claims, partiallynormal business operations, such as premium collections. Claims payments were offset by recoveries receivedreinsurance recovery collections, with the net outflow from these activities totaling approximately $6,685,000. In addition, during the year,first quarter of 2023, we disposed of UPC, resulting in a decreasegain on disposal adjustment of $238,440,000. There was no similar transaction in our unpaid loss & loss adjustment expenses of $68,330,000 net of reinsurance recoverables. In addition, the Company experienced outflows from reinsurance contract payments which resulted in a net increase in our unearned paid premiums of $98,532,000. The remainder of these outflows can be attributed to normal business processes.2024.
Investing Activities
The principal cash inflows from our investing activities come from repayments of principal, proceeds from maturities and sales of investments. We closely monitor and manage these risks through our comprehensive investment risk management process. The principal cash outflows relate to sales of investments. The primary liquidity concerns with respect to these cash flows are the risk of default by debtors and market disruption. During the sixthree months ended June 30, 2023,March 31, 2024, net salespurchases of investments totaled $258,736,000$2,005,000 compared to net sales of investments of $83,661,000$195,082,000 during the sixthree months ended June 30, 2022. This wasMarch 31, 2023. These net sales in 2023 were offset by the disposition of $232,582,000 in cash related to the receivership of cash held by UPC at the time of receivership.UPC.
Financing Activities
The principal cash outflows from our financing activities come from repayments of debt and payments of dividends. The primary liquidity concern with respect to these cash flows is market disruption in the cost and availability of credit. We believe our current capital resources, together with cash provided from our operations, are sufficient to meet currently anticipated working capital requirements. During the sixthree months ended June 30, 2023,March 31, 2024, cash provided by financing activities totaled $11,398,000, compared to no cash was used in financing activities compared to $21,685,000 for the sixthree months ended June 30, 2022.March 31, 2023. The decreaseincrease in outflowinflow in 20232024 can be attributed to no dividend payment being made in the first quarterproceeds received from the issuance of 2023. In addition, no repayments of borrowings were made in 2023 as we no longer holdour common stock under our at the debt associated with our former subsidiary, UPC. Finally, in 2022 we returned capital attributable to the noncontrolling interest of JIC. This was a one-time return of capital.market program described above.
OFF-BALANCE SHEET ARRANGEMENTS
At June 30, 2023,March 31, 2024, we did not have any off-balance sheet arrangements or material changes to our contractual obligations during the quarter.
Item 3. Quantitative and Qualitative Disclosures About Market Risk
We are exposed to market risks, including interest rate risk related to changes in interest rates in our fixed-maturity securities, credit risk related to changes in the financial condition of the issuers of our fixed-maturities and equity price risk related to changes in equity security prices. These risks are disclosed in Part II, Item 7A. "Quantitative and Qualitative Disclosures about Market Risk" of our Annual Report on Form 10-K for the year ended December 31, 2022.2023.
We held no equity securities as of December 31, 2023. During the first quarter of 2024, we began investing in equity securities. As of March 31, 2024, our equity portfolio consists of mutual funds totaling $6,214,000. We had no other material changes in our market risk during the sixthree months ended June 30, 2023.March 31, 2024.
Item 4. Controls and Procedures
We maintain a set of disclosure controls and procedures designed to ensure that the information required to be disclosed in reports we file or submit under the Securities Exchange Act of 1934, as amended (Exchange Act), is recorded, processed, summarized and reported within the time periods specified in the Securities and Exchange Commission's rules and forms. We designed our disclosure controls with the objective of ensuring we accumulate and communicate this information to our management, including our principal executive officer and principal financial officer, as appropriate, to allow timely decisions regarding required disclosure.
AMERICAN COASTAL INSURANCE CORPORATION
Under the supervision and with the participation of our management, including our principal executive officer and principal financial officer, we conducted an evaluation of the effectiveness of the design and operations of our disclosure controls and procedures, as such term is defined in Rules 13a-15(e) and 15d-15(e) under the Exchange Act, as of the end of the period covered by this report. Based on our evaluation, our principal executive officer and principal financial officer concluded that
AMERICAN COASTAL INSURANCE CORPORATION
our disclosure controls and procedures were effective at the reasonable assurance level as of the end of the period covered by this report.
Subsequent to that evaluation, our management, including our principal executive officer and principal financial officer, concluded that, as of March 31, 2023, our disclosure controls and procedures were not effective due to thea material weakness in our internal control over financial reporting described below.
Existence of Material Weakness as of March 31, 2023
TheDuring the second quarter of 2023, the Company identified a material weakness in its internal control over financial reporting related to the reporting of the discontinued operations.operations as of March 31, 2023. Specifically, the Company’s controls over the review of significant unusual transactions, including the effects of the transactions on the preparation of the Company's tax provision were not designed effectively. The Company did not have sufficient, experienced accounting resources to effectively review the accounting for and reporting of significant, unusual transactions. As a result of the material weakness, management’s review control did not detect an error in the accounting related to the recording of the discontinued operations and as a result, net income was understated by $6.4 million. TheIn 2023, the Company restated its consolidated interim financial statements as of and for the three months ended March 31, 2023 to reflect the correction of this error in this Amended Report.error.
Remediation Plan
Since identifying the material weakness related to management’s review controls related to significant, unusual and complex transactions in the preparation of the Company's financial statements, management has begun remediation of the process and controls in place to measure and record transactions and their related effects to income tax accounting to enhance the effectiveness of the design and operation of those controls. The Company will focus on the accounting and disclosure for unusual and complex transactions such as discontinued operations and will continue to augment existing staff with additional skilled accounting resources and strengthen the review process to improve the design and operation of financial reporting and corresponding internal controls.
These remediation measures require validation and testing of the design and operating effectiveness of internal control over
a sustained period of financial reporting to reachingreach a determination that the material weakness has been remediated. As we continue to validate and test our internal control over financial reporting, we may determine that additional measures or modifications to the remediation plan are necessary or appropriate.
Changes in Internal Control over Financial Reporting
During the sixthree months ended June 30, 2023,March 31, 2024, there was no change in our internal control over financial reporting (as defined in Rules 13a-15(f) and 15d-15(f) under the Exchange Act) identified in connection with the evaluation of our internal control performed during the fiscal year ended December 31, 2022,2023, that has materially affected, or is reasonably likely to materially affect, our internal control over financial reporting, except as noted above with respect to the identification of the material weakness.reporting.
PART II. OTHER INFORMATION
Item 1. Legal Proceedings
We are involved in routine claims-related legal actions arising in the ordinary course of business. We accrue amounts resulting from claims-related legal actions in unpaid losses and loss adjustment expenses during the period that we determine an unfavorable outcome becomes probable and we can estimate the amounts. Management makes revisions to our estimates based on its analysis of subsequent information that we receive regarding various factors, including: (i) per claim information; (ii) company and industry historical loss experience; (iii) judicial decisions and legal developments in the awarding of damages; and (iv) trends in general economic conditions, including the effects of inflation.
At June 30,On October 20, 2023, we received notice that the Company isDFS filed a notice of claim and demand for tender of insurance policy limits under our director and officer insurance to carriers participating in our director and officer’s insurance program (the “Claim”). The Claim alleges that former officers and directors of UPC were involved in legal proceedings whereby on August 18, 2021, Jacqueline A. Miraglia filed suit in the United States District Court for the District of Delaware against United Insurance Holdings Corp. alleging violations arising under Title VII of the Civil Rights Act of 1964 and the Age Discrimination in Employment Act of 1967, and sought damages in an unspecified amount. On September 27, 2022, venue was transferred to the United States District Court for the Middle District of Florida, Tampa Division and in November, 2022, the plaintiff amended the complaint to add Skyway Claims Services as a defendant. On July 6, 2023, the Company entered into a Settlement Agreement and General Release, whichwrongful acts that resulted in an immaterial paymentUPCs insolvency and demands immediate tender of our director and officer’s policy limit of $40,000,000 where we have a retention of $1,500,000. The former directors and officers of UPC deny the allegations. Although no litigation has arisen from the Claim, litigation is anticipated. The directors and officers plan to vigorously defend against the plaintiff and did not involve an admissionClaim; however, due to our indemnification obligation, during 2023 we accrued the policy retention amount of any wrongdoing by any party.$1,500,000. This claim remains open as of March 31, 2024.
AMERICAN COASTAL INSURANCE CORPORATION
Item 1A. Risk Factors
There have been no material changes to the risk factors previously disclosed in Part I. Item 1A "Risk Factors" of our Annual Report on Form 10-K for the year ended December 31, 2022,2023, except as set forth below.
We have identified a material weakness inThe insurance industry is heavily regulated and further restrictive regulation may reduce our internal control over financial reporting,profitability and limit our management has concluded that our internal control over financial reporting and disclosure controls and procedures were not effective as of the end of the period covered by this report. While we are working to remediate the identified material weakness, we cannot assure you that additional material weaknesses or significant deficiencies will not occur in the future. If we fail to maintain an effective system of internal controls, we may not be able to accurately report our financial results or prevent fraud. As a result, our stockholders could lose confidence in our financial reporting, which could harm our business and the trading price of our common stock.growth.
The Sarbanes-Oxley Actinsurance industry is extensively regulated and supervised. Insurance regulatory authorities generally design insurance rules and regulations to protect the interests of 2002,policyholders, and not necessarily the interests of insurers, their stockholders, and other investors. This regulation relates to authorization for lines of business, capital and surplus requirements, investment limitations, underwriting limitations, transactions with affiliates, dividend limitations, changes in control, premium rates and a variety of other financial and non-financial components of an insurance company's business. We are subject to comprehensive regulation and supervision by state insurance departments in New York and Florida, the states in which our insurance subsidiaries are domiciled, as well as all states in which they are licensed. The regulations of each state are unique and complex and subject to change, and certain states may have regulations that conflict with the regulations of other states in which we operate. As a result, we are subject to the risk that compliance with the regulations in one state may not result in compliance with the regulations in another state.
We strive to maintain all required licenses and approvals. However, we may not fully comply with the wide variety of applicable laws and regulations. The relevant authority's interpretation of the laws and regulations also may change from time to time. Regulatory authorities have relatively broad discretion to impose fines, and grant, renew or the Sarbanes-Oxley Act, requires, among other things, that we maintain effective disclosure controlsrevoke licenses and procedures and internal control over financial reporting. As disclosed in this Amended Report, in the course of preparing our interim financial statements for the fiscal quarter ended June 30, 2023, we identified a material weakness in our internal control over financial reporting, which existed as of March 31, 2023. The material weakness was caused by inadequate controls over our tax processes, described in more detail under the heading Part I — Item 4. Controls and Procedures in this Amended Report. We have commenced efforts to remediate the material weakness as described in more detail under the heading Part I — Item 4. Controls and Procedures in this Amended Report. The material weakness in our internal control over financial reporting will not be considered remediated until the controls operate for a sufficient period of time and management has concluded, through testing, that these controls operate effectively.approvals. If we do not successfully remediatehave the required licenses and approvals or do not comply with applicable regulatory requirements, these authorities could preclude or temporarily suspend us from carrying on some or all of our activities or impose substantial fines. In addition, we may face individual and class action lawsuits by insured and other parties for alleged violations of certain of these laws or regulations.
State statutes and administrative rules generally require each insurance company to register with the department of insurance in its state of domicile and to furnish information concerning the operations of the companies within the holding company system. Failure to comply with such requirements may materially affect the operations, management or financial condition of the insurers.As part of its registration, each insurance company must identify material weakness,agreements, relationships and transactions with affiliates, including loans, investments, asset transfers, transactions outside of the ordinary course of business, certain management, service, and cost sharing agreements, reinsurance transactions, dividends, and other financial and non-financial components of an insurer’s business. Some states impose restrictions or if other material weaknessesrequire prior regulatory approval of specific corporate actions, which may adversely affect our ability to operate, innovate, obtain necessary rate adjustments in a timely manner or other deficiencies arisegrow our business profitably. For example, the Florida Office of Insurance Regulation (the “Office”) notified our subsidiary, American Coastal Insurance Company and its officers and directors, that it was required to show why those officers and directors were not a substantial contributing cause of the insolvency of our former subsidiary, United Property & Casualty Insurance Company, pursuant to section 624.4073 Fla. Stat., which prohibits officers and directors of insolvent insurers from serving as officers or directors of another insurer unless that officer or director demonstrates that their actions or omissions were not a significant contributing cause of the insolvency.We have been in discussions with the Office and continue working with the Office on this issue. Our ability to comply with these laws and regulations, and to obtain necessary regulatory action in a timely manner is, and will continue to be, critical to our success.
Currently, the federal government’s role in regulating or dictating the policies of insurance companies is limited. However, from time to time Congress has considered and may in the future we may be unable to accurately report our financial results, which could cause our financial results to be materially misstated and require restatement. In such case, we may be unable to maintain compliance with securities law requirements regarding timely filingconsider proposals that would increase the role of periodic reportsthe federal government in insurance regulation, either in addition to applicable stock exchange listing requirements, investorsor in lieu of state regulation. For example, the Dodd-Frank Act established a Federal Insurance Office (FIO) within the U.S. Department of Treasury Department to collect data on the insurance industry, recommend changes to the state system of insurance regulation and preempt certain state insurance laws. The potential impact on our business as a result of the Dodd-Frank Act and the FIO’s current and future recommendations remains unclear; however, the implementation of any federal insurance regulations that constrain our business opportunities or reduce investment flexibility could negatively impact our business.
In recent years, the state insurance regulatory framework has come under increased federal scrutiny. Changes in federal legislation, regulation and/or administrative policies in several areas, including changes in financial services regulation and federal taxation, could negatively affect the insurance industry and us. In addition, Congress and some federal agencies from time to time investigate the current condition of insurance regulation in the United States to determine whether to impose federal or national regulation or to allow an optional federal charter, similar to the option available to most banks. Further, the
AMERICAN COASTAL INSURANCE CORPORATION
NAIC and state insurance regulators continually reexamine existing laws and regulations, specifically focusing on modifications to holding company regulations, interpretations of existing laws and the development of new laws and regulations. We cannot predict what effect, if any, proposed or future legislation or NAIC initiatives may lose confidencehave on the manner in which we conduct our financial reportingbusiness.
As part of potential, or future, industry-wide investigations, we may from time to time receive requests for information from government agencies and authorities at the state or federal level. If we are subpoenaed for information by government agencies and authorities, potential outcomes could include law enforcement proceedings or settlements resulting in fines, penalties and/or changes in business practices that could cause a material adverse effect on our results of operations. In addition, these investigations may result in changes to laws and regulations affecting the industry.
Changes to insurance laws or regulations, or new insurance laws and regulations, may be more restrictive than current laws or regulations and could significantly increase our compliance costs, which could have a material adverse effect on our results of operations and our stock priceprospects for future growth. Additionally, our failure to comply with certain provisions of applicable insurance laws and regulations could result in significant fines or penalties being levied against us and may decline as a result. We cannot assure you that the measures we have taken to date, or any measures we may take in the future, will be sufficient to remediate the control deficiencies that led tocause a material weakness inadverse effect on our internal control overresults of operations or financial reporting or that they will prevent or avoid potential future material weaknesses.condition.
Item 2. Unregistered Sales of Equity Securities and Use of Proceeds
During the sixthree months ended June 30, 2023,March 31, 2024, we did not sell any unregistered equity securities or repurchase any of our equity securities.
Item 3. Defaults Upon Senior Securities
None.
Item 4. Mine Safety Disclosures
Not applicable.
Item 5. Other Information
None.
Item 6. Exhibits
The following exhibits are filed or furnished herewith or are incorporated herein by reference:
AMERICAN COASTAL INSURANCE CORPORATION
| | | | | | | | |
| Exhibit | | Description |
| | |
| | Second Certificate of Amendment of Certificate of Incorporation.Employment Agreement, dated January 17, 2024, between American Coastal Insurance Corporation and Svetlana Castle (included as Exhibit 3.110.1 to the Form 8-K filed on July 14, 2023,January 18, 2024 and incorporated herein by reference.)reference). |
| | |
| | First Amendment to the Amended And Restated Bylaws. (included as Exhibit 3.2 to the Form 8-K filed on July 14, 2023, and incorporated herein by reference.) |
| | |
| | Certification of Principal Executive Officer pursuant to Section 302 of the Sarbanes-Oxley Act. |
| | |
| | Certification of Principal Financial Officer pursuant to Section 302 of the Sarbanes-Oxley Act. |
| | |
| | Certification of Principal Executive Officer pursuant to Section 906 of the Sarbanes-Oxley Act. |
| | |
| | Certification of Principal Financial Officer pursuant to Section 906 of the Sarbanes-Oxley Act. |
| | |
| 101.INS | | XBRL Instance Document - the instance document does not appear in the Interactive Data File because its XBRL tags are embedded within the Inline XBRL document |
| | |
| 101.SCH | | Inline XBRL Taxonomy Extension Schema |
| | |
| 101.CAL | | Inline XBRL Taxonomy Extension Calculation Linkbase |
| | |
| 101.DEF | | Inline XBRL Taxonomy Extension Definition Linkbase |
| | |
| 101.LAB | | Inline XBRL Taxonomy Extension Label Linkbase |
| | |
| 101.PRE | | Inline XBRL Taxonomy Extension Presentation Linkbase |
| | |
| 104 | | Cover Page Interactive Data File (embedded within the Inline XBRL document and included in Exhibit 101). |
AMERICAN COASTAL INSURANCE CORPORATION
SIGNATURES
Pursuant to the requirements of the Securities Exchange Act of 1934, the Registrant has duly caused this report to be signed on its behalf by the undersigned thereunto duly authorized.
| | | | | | | | |
| | AMERICAN COASTAL INSURANCE CORPORATION |
| | |
August 21, 2023May 10, 2024 | By: | /s/ R. Daniel Peed |
| | R. Daniel Peed, Chief Executive Officer
(principal executive officer and duly authorized officer) |
| | | | | | | | |
August 21, 2023May 10, 2024 | By: | /s/ B. Bradford MartzSvetlana Castle |
| | B. Bradford Martz,Svetlana Castle, Chief Financial Officer and President
(principal financial officer and principal accounting officer) |