
| ☒ | QUARTERLY REPORT PURSUANT TO SECTION 13 OR 15(d) OF THE SECURITIES EXCHANGE ACT OF 1934. | ||||
| ☐ | TRANSITION REPORT PURSUANT TO SECTION 13 OR 15(d) OF THE SECURITIES EXCHANGE ACT OF 1934. | ||||
| Delaware | ||||||||
(State or other Jurisdiction of Incorporation or Organization) | (I.R.S. Employer Identification Number) | |||||||
| Title of each class | Trading symbol(s) | Name of each exchange on which registered | ||||||
| Common Stock | KKR | New York Stock Exchange | ||||||
| 6.00% Series C Mandatory Convertible Preferred Stock | KKR PR C | New York Stock Exchange | ||||||
| 4.625% Subordinated Notes due 2061 of KKR Group Finance Co. IX LLC | KKRS | New York Stock Exchange | ||||||
Large accelerated filer | ☒ | Accelerated filer | ☐ | |||||||||||
Non-accelerated filer | ☐ | Smaller reporting company | ☐ | |||||||||||
| Emerging growth company | ||||||||||||||
| ☐ | ||||||||||||||
| Page | |||||||||
| Item 1. | |||||||||
| Item 2. | |||||||||
| Item 3. | |||||||||
| Item 4. | |||||||||
| Item 1. | |||||||||
| Item 1A. | |||||||||
| Item 2. | |||||||||
| Item 3. | |||||||||
| Item 4. | |||||||||
| Item 5. | |||||||||
| Item 6. | |||||||||
| September 30, 2022 | December 31, 2021 | ||||||||||
| Assets | |||||||||||
| Asset Management | |||||||||||
| Cash and Cash Equivalents | $ | 6,911,691 | $ | 6,699,668 | |||||||
| Restricted Cash and Cash Equivalents | 201,194 | 134,298 | |||||||||
| Investments | 89,720,859 | 88,775,514 | |||||||||
| Due from Affiliates | 1,370,693 | 1,224,283 | |||||||||
| Other Assets | 5,177,042 | 2,886,313 | |||||||||
| 103,381,479 | 99,720,076 | ||||||||||
| Insurance | |||||||||||
| Cash and Cash Equivalents | $ | 4,147,146 | $ | 3,391,934 | |||||||
| Restricted Cash and Cash Equivalents | 369,834 | 300,404 | |||||||||
| Investments | 118,772,273 | 123,763,675 | |||||||||
| Reinsurance Recoverable | 26,163,181 | 25,062,256 | |||||||||
| Insurance Intangible Assets | 1,632,083 | 1,407,149 | |||||||||
| Other Assets | 7,730,393 | 5,053,518 | |||||||||
| Separate Account Assets | 4,052,251 | 5,586,428 | |||||||||
| 162,867,161 | 164,565,364 | ||||||||||
| Total Assets | $ | 266,248,640 | $ | 264,285,440 | |||||||
| Liabilities and Equity | |||||||||||
| Asset Management | |||||||||||
| Debt Obligations | $ | 38,257,833 | $ | 36,669,755 | |||||||
| Due to Affiliates | 444,872 | 462,722 | |||||||||
| Accrued Expenses and Other Liabilities | 7,135,124 | 7,896,897 | |||||||||
| 45,837,829 | 45,029,374 | ||||||||||
| Insurance | |||||||||||
| Policy Liabilities | $ | 135,733,868 | $ | 126,520,044 | |||||||
| Debt Obligations | 1,920,906 | 1,908,006 | |||||||||
| Funds Withheld Payable at Interest | 21,063,577 | 23,460,253 | |||||||||
| Accrued Expenses and Other Liabilities | 4,927,883 | 3,263,566 | |||||||||
| Reinsurance Liabilities | 729,531 | 378,549 | |||||||||
| Separate Account Liabilities | 4,052,251 | 5,586,428 | |||||||||
| 168,428,016 | 161,116,846 | ||||||||||
| Total Liabilities | 214,265,845 | 206,146,220 | |||||||||
| September 30, 2017 | December 31, 2016 | ||||||
| Assets | |||||||
| Cash and Cash Equivalents | $ | 2,436,566 | $ | 2,508,902 | |||
| Cash and Cash Equivalents Held at Consolidated Entities | 1,329,735 | 1,624,758 | |||||
| Restricted Cash and Cash Equivalents | 44,175 | 212,155 | |||||
| Investments | 37,251,837 | 31,409,765 | |||||
| Due from Affiliates | 484,004 | 250,452 | |||||
| Other Assets | 2,759,322 | 2,996,865 | |||||
| Total Assets | $ | 44,305,639 | $ | 39,002,897 | |||
| Liabilities and Equity | |||||||
| Debt Obligations | $ | 20,290,714 | $ | 18,544,075 | |||
| Due to Affiliates | 379,809 | 359,479 | |||||
| Accounts Payable, Accrued Expenses and Other Liabilities | 3,769,682 | 2,981,260 | |||||
| Total Liabilities | 24,440,205 | 21,884,814 | |||||
| Commitments and Contingencies | |||||||
| Redeemable Noncontrolling Interests | 570,134 | 632,348 | |||||
| Equity | |||||||
Series A Preferred Units (13,800,000 units issued and outstanding as of September 30, 2017 and December 31, 2016) | 332,988 | 332,988 | |||||
Series B Preferred Units (6,200,000 units issued and outstanding as of September 30, 2017 and December 31, 2016) | 149,566 | 149,566 | |||||
KKR & Co. L.P. Capital - Common Unitholders (473,134,387 and 452,380,335 common units issued and outstanding as of September 30, 2017 and December 31, 2016, respectively) | 6,380,654 | 5,457,279 | |||||
| Total KKR & Co. L.P. Partners' Capital | 6,863,208 | 5,939,833 | |||||
| Noncontrolling Interests | 12,432,092 | 10,545,902 | |||||
| Total Equity | 19,295,300 | 16,485,735 | |||||
| Total Liabilities and Equity | $ | 44,305,639 | $ | 39,002,897 | |||
| September 30, 2022 | December 31, 2021 | ||||||||||
| Commitments and Contingencies (See Note 24) | |||||||||||
| Redeemable Noncontrolling Interests | $ | 82,133 | $ | 82,491 | |||||||
| Stockholders' Equity | |||||||||||
| Series C Mandatory Convertible Preferred Stock, $0.01 par value. 22,999,974 and 23,000,000 shares, issued and outstanding as of September 30, 2022 and December 31, 2021, respectively. | $ | 1,115,792 | $ | 1,115,792 | |||||||
| Series I Preferred Stock, $0.01 par value. 1 share authorized, 1 share issued and outstanding as of September 30, 2022 and December 31, 2021. | — | — | |||||||||
| Series II Preferred Stock, $0.01 par value. 499,999,999 shares authorized, 258,726,163 shares issued and outstanding as of December 31, 2021. (See Note 1) | — | 2,587 | |||||||||
| Common Stock, $0.01 par value. 3,500,000,000 shares authorized, 859,833,444 and 595,663,618 shares, issued and outstanding as of September 30, 2022 and December 31, 2021, respectively. | 8,598 | 5,957 | |||||||||
| Additional Paid-In Capital | 16,015,645 | 8,997,435 | |||||||||
| Retained Earnings | 6,365,963 | 7,670,182 | |||||||||
| Accumulated Other Comprehensive Income (Loss) ("AOCI") | (6,054,953) | (209,789) | |||||||||
| Total KKR & Co. Inc. Stockholders' Equity | 17,451,045 | 17,582,164 | |||||||||
| Noncontrolling Interests (See Note 22) | 34,449,617 | 40,474,565 | |||||||||
| Total Equity | 51,900,662 | 58,056,729 | |||||||||
| Total Liabilities and Equity | $ | 266,248,640 | $ | 264,285,440 | |||||||
| September 30, 2022 | |||||||||||||||||||||||
| Consolidated CLOs | Consolidated Funds and Other Investment Vehicles | Other VIEs | Total | ||||||||||||||||||||
| Assets | |||||||||||||||||||||||
| Asset Management | |||||||||||||||||||||||
| Cash and Cash Equivalents | $ | 732,922 | $ | 2,324,606 | $ | — | $ | 3,057,528 | |||||||||||||||
| Restricted Cash and Cash Equivalents | — | 123,413 | — | 123,413 | |||||||||||||||||||
| Investments | 21,500,342 | 52,481,494 | — | 73,981,836 | |||||||||||||||||||
| Other Assets | 144,882 | 771,333 | — | 916,215 | |||||||||||||||||||
| 22,378,146 | 55,700,846 | — | 78,078,992 | ||||||||||||||||||||
| Insurance | |||||||||||||||||||||||
| Cash and Cash Equivalents | — | — | 1,161,874 | 1,161,874 | |||||||||||||||||||
| Investments | — | — | 24,215,391 | 24,215,391 | |||||||||||||||||||
| Accrued Investment Income | — | — | 230,324 | 230,324 | |||||||||||||||||||
| Other Assets | — | — | 2,164,350 | 2,164,350 | |||||||||||||||||||
| — | — | 27,771,939 | 27,771,939 | ||||||||||||||||||||
| Total Assets | $ | 22,378,146 | $ | 55,700,846 | $ | 27,771,939 | $ | 105,850,931 | |||||||||||||||
| Liabilities | |||||||||||||||||||||||
| Asset Management | |||||||||||||||||||||||
| Debt Obligations | $ | 21,118,566 | $ | 6,520,275 | $ | — | $ | 27,638,841 | |||||||||||||||
| Accrued Expenses and Other Liabilities | 554,661 | 601,416 | — | 1,156,077 | |||||||||||||||||||
| 21,673,227 | 7,121,691 | — | 28,794,918 | ||||||||||||||||||||
| Insurance | |||||||||||||||||||||||
| Accrued Expenses and Other Liabilities | — | — | 1,124,146 | 1,124,146 | |||||||||||||||||||
| Total Liabilities | $ | 21,673,227 | $ | 7,121,691 | $ | 1,124,146 | $ | 29,919,064 | |||||||||||||||
| September 30, 2017 | |||||||||||
| Consolidated CFEs | Consolidated KKR Funds and Other Entities | Total | |||||||||
| Assets | |||||||||||
| Cash and Cash Equivalents Held at Consolidated Entities | $ | 930,268 | $ | 399,467 | $ | 1,329,735 | |||||
| Restricted Cash and Cash Equivalents | — | 8,928 | 8,928 | ||||||||
| Investments | 15,500,898 | 8,934,607 | 24,435,505 | ||||||||
| Due from Affiliates | — | 5,118 | 5,118 | ||||||||
| Other Assets | 203,987 | 202,798 | 406,785 | ||||||||
| Total Assets | $ | 16,635,153 | $ | 9,550,918 | $ | 26,186,071 | |||||
| Liabilities | |||||||||||
| Debt Obligations | $ | 15,083,900 | $ | 817,069 | $ | 15,900,969 | |||||
| Accounts Payable, Accrued Expenses and Other Liabilities | 839,097 | 239,215 | 1,078,312 | ||||||||
| Total Liabilities | $ | 15,922,997 | $ | 1,056,284 | $ | 16,979,281 | |||||
| December 31, 2021 | |||||||||||||||||||||||
| Consolidated CLOs | Consolidated Funds and Other Investment Vehicles | Other VIEs | Total | ||||||||||||||||||||
| Assets | |||||||||||||||||||||||
| Asset Management | |||||||||||||||||||||||
| Cash and Cash Equivalents | $ | 1,215,992 | $ | 1,085,958 | $ | — | $ | 2,301,950 | |||||||||||||||
| Restricted Cash and Cash Equivalents | — | 90,255 | — | 90,255 | |||||||||||||||||||
| Investments | 22,076,809 | 46,780,595 | — | 68,857,404 | |||||||||||||||||||
| Other Assets | 173,329 | 641,946 | — | 815,275 | |||||||||||||||||||
| 23,466,130 | 48,598,754 | — | 72,064,884 | ||||||||||||||||||||
| Insurance | |||||||||||||||||||||||
| Cash and Cash Equivalents | — | — | 1,406,974 | 1,406,974 | |||||||||||||||||||
| Investments | — | — | 20,043,016 | 20,043,016 | |||||||||||||||||||
| Accrued Investment Income | — | — | 100,693 | 100,693 | |||||||||||||||||||
| Other Assets | — | — | 506,777 | 506,777 | |||||||||||||||||||
| — | — | 22,057,460 | 22,057,460 | ||||||||||||||||||||
| Total Assets | $ | 23,466,130 | $ | 48,598,754 | $ | 22,057,460 | $ | 94,122,344 | |||||||||||||||
| Liabilities | |||||||||||||||||||||||
| Asset Management | |||||||||||||||||||||||
| Debt Obligations | $ | 21,271,084 | $ | 6,291,292 | $ | — | $ | 27,562,376 | |||||||||||||||
| Accrued Expenses and Other Liabilities | 1,367,778 | 691,288 | — | 2,059,066 | |||||||||||||||||||
| 22,638,862 | 6,982,580 | — | 29,621,442 | ||||||||||||||||||||
| Insurance | |||||||||||||||||||||||
| Accrued Expenses and Other Liabilities | — | — | 594,946 | 594,946 | |||||||||||||||||||
| Total Liabilities | $ | 22,638,862 | $ | 6,982,580 | $ | 594,946 | $ | 30,216,388 | |||||||||||||||
| December 31, 2016 | |||||||||||
| Consolidated CFEs | Consolidated KKR Funds and Other Entities | Total | |||||||||
| Assets | |||||||||||
| Cash and Cash Equivalents Held at Consolidated Entities | $ | 1,158,641 | $ | 466,117 | $ | 1,624,758 | |||||
| Restricted Cash and Cash Equivalents | 86,777 | 95,105 | 181,882 | ||||||||
| Investments | 13,950,897 | 8,979,341 | 22,930,238 | ||||||||
| Due from Affiliates | — | 5,555 | 5,555 | ||||||||
| Other Assets | 153,283 | 430,326 | 583,609 | ||||||||
| Total Assets | $ | 15,349,598 | $ | 9,976,444 | $ | 25,326,042 | |||||
| Liabilities | |||||||||||
| Debt Obligations | $ | 13,858,288 | $ | 1,612,799 | $ | 15,471,087 | |||||
| Accounts Payable, Accrued Expenses and Other Liabilities | 722,714 | 316,121 | 1,038,835 | ||||||||
| Total Liabilities | $ | 14,581,002 | $ | 1,928,920 | $ | 16,509,922 | |||||
| Three Months Ended September 30, | Nine Months Ended September 30, | ||||||||||||||||||||||||||||
| 2022 | 2021 | 2022 | 2021 | ||||||||||||||||||||||||||
| Revenues | |||||||||||||||||||||||||||||
| Asset Management | |||||||||||||||||||||||||||||
| Fees and Other | $ | 673,929 | $ | 718,968 | $ | 2,069,704 | $ | 1,887,805 | |||||||||||||||||||||
| Capital Allocation-Based Income (Loss) | (572,863) | 1,526,667 | (2,442,080) | 5,736,707 | |||||||||||||||||||||||||
| 101,066 | 2,245,635 | (372,376) | 7,624,512 | ||||||||||||||||||||||||||
| Insurance | |||||||||||||||||||||||||||||
| Net Premiums | 480,462 | 974,903 | 627,104 | 1,698,912 | |||||||||||||||||||||||||
| Policy Fees | 320,206 | 310,381 | 964,349 | 824,326 | |||||||||||||||||||||||||
| Net Investment Income | 1,094,877 | 758,381 | 2,839,371 | 1,919,659 | |||||||||||||||||||||||||
| Net Investment-Related Gains (Losses) | (173,830) | 162,127 | (968,836) | 32,983 | |||||||||||||||||||||||||
| Other Income | 35,632 | 31,938 | 102,888 | 82,160 | |||||||||||||||||||||||||
| 1,757,347 | 2,237,730 | 3,564,876 | 4,558,040 | ||||||||||||||||||||||||||
| Total Revenues | 1,858,413 | 4,483,365 | 3,192,500 | 12,182,552 | |||||||||||||||||||||||||
| Expenses | |||||||||||||||||||||||||||||
| Asset Management | |||||||||||||||||||||||||||||
| Compensation and Benefits | 244,502 | 1,012,837 | 779,050 | 3,419,057 | |||||||||||||||||||||||||
| Occupancy and Related Charges | 18,683 | 17,438 | 55,693 | 51,289 | |||||||||||||||||||||||||
| General, Administrative and Other | 212,513 | 203,977 | 701,010 | 608,270 | |||||||||||||||||||||||||
| 475,698 | 1,234,252 | 1,535,753 | 4,078,616 | ||||||||||||||||||||||||||
| Insurance | |||||||||||||||||||||||||||||
| Net Policy Benefits and Claims | 1,087,731 | 1,697,046 | 1,768,384 | 3,593,563 | |||||||||||||||||||||||||
| Amortization of Policy Acquisition Costs | 8,222 | (16,900) | 13,693 | (57,409) | |||||||||||||||||||||||||
| Interest Expense | 26,141 | 22,437 | 58,330 | 44,482 | |||||||||||||||||||||||||
| Insurance Expenses | 158,280 | 89,534 | 406,088 | 242,591 | |||||||||||||||||||||||||
| General, Administrative and Other | 178,443 | 158,873 | 516,549 | 371,656 | |||||||||||||||||||||||||
| 1,458,817 | 1,950,990 | 2,763,044 | 4,194,883 | ||||||||||||||||||||||||||
| Total Expenses | 1,934,515 | 3,185,242 | 4,298,797 | 8,273,499 | |||||||||||||||||||||||||
| Investment Income (Loss) - Asset Management | |||||||||||||||||||||||||||||
| Net Gains (Losses) from Investment Activities | (379,180) | 2,116,647 | (1,350,388) | 8,032,900 | |||||||||||||||||||||||||
| Dividend Income | 294,415 | 121,484 | 1,104,120 | 323,051 | |||||||||||||||||||||||||
| Interest Income | 500,234 | 402,839 | 1,244,339 | 1,151,548 | |||||||||||||||||||||||||
| Interest Expense | (391,520) | (278,166) | (1,002,005) | (794,978) | |||||||||||||||||||||||||
| Total Investment Income (Loss) | 23,949 | 2,362,804 | (3,934) | 8,712,521 | |||||||||||||||||||||||||
| Income (Loss) Before Taxes | (52,153) | 3,660,927 | (1,110,231) | 12,621,574 | |||||||||||||||||||||||||
| Income Tax Expense (Benefit) | 27,434 | 379,282 | (128,836) | 1,161,688 | |||||||||||||||||||||||||
| Three Months Ended September 30, | Nine Months Ended September 30, | ||||||||||||||
| 2017 | 2016 | 2017 | 2016 | ||||||||||||
| Revenues | |||||||||||||||
| Fees and Other | $ | 692,877 | $ | 687,056 | $ | 2,340,617 | $ | 1,426,618 | |||||||
| Expenses | |||||||||||||||
| Compensation and Benefits | 368,513 | 358,161 | 1,234,317 | 780,062 | |||||||||||
| Occupancy and Related Charges | 15,267 | 16,405 | 44,150 | 49,159 | |||||||||||
| General, Administrative and Other | 146,467 | 136,551 | 421,522 | 413,437 | |||||||||||
| Total Expenses | 530,247 | 511,117 | 1,699,989 | 1,242,658 | |||||||||||
| Investment Income (Loss) | |||||||||||||||
| Net Gains (Losses) from Investment Activities | 108,779 | 735,144 | 1,085,655 | 9,089 | |||||||||||
| Dividend Income | 20,774 | 73,105 | 100,144 | 167,987 | |||||||||||
| Interest Income | 317,134 | 256,505 | 893,832 | 753,194 | |||||||||||
| Interest Expense | (211,959 | ) | (255,105 | ) | (597,403 | ) | (607,812 | ) | |||||||
| Total Investment Income (Loss) | 234,728 | 809,649 | 1,482,228 | 322,458 | |||||||||||
| Income (Loss) Before Taxes | 397,358 | 985,588 | 2,122,856 | 506,418 | |||||||||||
| Income Tax / (Benefit) | 18,420 | 10,826 | 77,500 | 18,761 | |||||||||||
| Net Income (Loss) | 378,938 | 974,762 | 2,045,356 | 487,657 | |||||||||||
Net Income (Loss) Attributable to Redeemable Noncontrolling Interests | 20,876 | 3,121 | 64,196 | 4,616 | |||||||||||
Net Income (Loss) Attributable to Noncontrolling Interests | 196,158 | 611,288 | 1,137,585 | 353,044 | |||||||||||
| Net Income (Loss) Attributable to KKR & Co. L.P. | 161,904 | 360,353 | 843,575 | 129,997 | |||||||||||
Net Income Attributable to Series A Preferred Unitholders | 5,822 | 5,822 | 17,466 | 11,515 | |||||||||||
Net Income Attributable to Series B Preferred Unitholders | 2,519 | 2,379 | 7,557 | 2,379 | |||||||||||
| Net Income (Loss) Attributable to KKR & Co. L.P. Common Unitholders | $ | 153,563 | $ | 352,152 | $ | 818,552 | $ | 116,103 | |||||||
| Net Income (Loss) Attributable to KKR & Co. L.P. Per Common Unit | |||||||||||||||
| Basic | $ | 0.33 | $ | 0.79 | $ | 1.76 | $ | 0.26 | |||||||
| Diluted | $ | 0.30 | $ | 0.73 | $ | 1.63 | $ | 0.24 | |||||||
| Weighted Average Common Units Outstanding | |||||||||||||||
| Basic | 471,758,886 | 445,989,300 | 463,941,084 | 448,149,747 | |||||||||||
| Diluted | 506,873,177 | 479,975,675 | 501,615,635 | 483,134,985 | |||||||||||
| Three Months Ended September 30, | Nine Months Ended September 30, | ||||||||||||||||||||||||||||
| 2022 | 2021 | 2022 | 2021 | ||||||||||||||||||||||||||
| Net Income (Loss) | (79,587) | 3,281,645 | (981,395) | 11,459,886 | |||||||||||||||||||||||||
| Net Income (Loss) Attributable to Redeemable Noncontrolling Interests | 1,601 | 1,519 | 1,546 | 2,856 | |||||||||||||||||||||||||
| Net Income (Loss) Attributable to Noncontrolling Interests | (6,792) | 2,123,569 | (41,341) | 7,315,362 | |||||||||||||||||||||||||
| Net Income (Loss) Attributable to KKR & Co. Inc. | (74,396) | 1,156,557 | (941,600) | 4,141,668 | |||||||||||||||||||||||||
| Series A Preferred Stock Dividends | — | — | — | 23,656 | |||||||||||||||||||||||||
| Series B Preferred Stock Dividends | — | 7,953 | — | 12,991 | |||||||||||||||||||||||||
| Series C Mandatory Convertible Preferred Stock Dividends | 17,250 | 17,250 | 51,750 | 51,750 | |||||||||||||||||||||||||
| Net Income (Loss) Attributable to KKR & Co. Inc. Common Stockholders | $ | (91,646) | $ | 1,131,354 | $ | (993,350) | $ | 4,053,271 | |||||||||||||||||||||
| Net Income (Loss) Attributable to KKR & Co. Inc. Per Share of Common Stock | |||||||||||||||||||||||||||||
| Basic | $ | (0.11) | $ | 1.94 | $ | (1.40) | $ | 6.98 | |||||||||||||||||||||
| Diluted | $ | (0.11) | $ | 1.80 | $ | (1.40) | $ | 6.52 | |||||||||||||||||||||
| Weighted Average Shares of Common Stock Outstanding | |||||||||||||||||||||||||||||
| Basic | 859,833,444 | 583,030,506 | 711,908,107 | 580,742,033 | |||||||||||||||||||||||||
| Diluted | 859,833,444 | 637,416,100 | 711,908,107 | 629,620,055 | |||||||||||||||||||||||||
| Three Months Ended September 30, | Nine Months Ended September 30, | |||||||||||||||||||||||||||||||
| 2022 | 2021 | 2022 | 2021 | |||||||||||||||||||||||||||||
| Net Income (Loss) | $ | (79,587) | $ | 3,281,645 | $ | (981,395) | $ | 11,459,886 | ||||||||||||||||||||||||
| Other Comprehensive Income (Loss), Net of Tax: | ||||||||||||||||||||||||||||||||
| Unrealized Gains (Losses) on Available-For-Sale Securities and Other | (2,241,482) | (141,762) | (9,002,927) | (338,067) | ||||||||||||||||||||||||||||
| Foreign Currency Translation Adjustments | (38,396) | (12,873) | (180,050) | (24,365) | ||||||||||||||||||||||||||||
| Comprehensive Income (Loss) | (2,359,465) | 3,127,010 | (10,164,372) | 11,097,454 | ||||||||||||||||||||||||||||
| Comprehensive Income (Loss) Attributable to Redeemable Noncontrolling Interests | 1,601 | 1,519 | 1,546 | 2,856 | ||||||||||||||||||||||||||||
| Comprehensive Income (Loss) Attributable to Noncontrolling Interests | (822,333) | 2,037,025 | (4,550,095) | 7,105,634 | ||||||||||||||||||||||||||||
| Comprehensive Income (Loss) Attributable to KKR & Co. Inc. | $ | (1,538,733) | $ | 1,088,466 | $ | (5,615,823) | $ | 3,988,964 | ||||||||||||||||||||||||
| Three Months Ended September 30, | Nine Months Ended September 30, | ||||||||||||||
| 2017 | 2016 | 2017 | 2016 | ||||||||||||
| Net Income (Loss) | $ | 378,938 | $ | 974,762 | $ | 2,045,356 | $ | 487,657 | |||||||
| Other Comprehensive Income (Loss), Net of Tax: | |||||||||||||||
| Foreign Currency Translation Adjustments | 10,001 | 2,452 | 47,097 | 679 | |||||||||||
| Comprehensive Income (Loss) | 388,939 | 977,214 | 2,092,453 | 488,336 | |||||||||||
| Less: Comprehensive Income (Loss) Attributable to Redeemable Noncontrolling Interests | 20,876 | 3,121 | 64,196 | 4,616 | |||||||||||
| Less: Comprehensive Income (Loss) Attributable to Noncontrolling Interests | 199,904 | 612,656 | 1,161,651 | 351,547 | |||||||||||
| Comprehensive Income (Loss) Attributable to KKR & Co. L.P. | $ | 168,159 | $ | 361,437 | $ | 866,606 | $ | 132,173 | |||||||
KKR & CO. INC. CONDENSED CONSOLIDATED STATEMENTS OF CHANGES IN EQUITY (UNAUDITED) (Amounts in Thousands, Except Share and Per Share Data) | |||||||||||||||||||||||
| Three Months Ended September 30, 2022 | Nine Months Ended September 30, 2022 | ||||||||||||||||||||||
| Amounts | Shares | Amounts | Shares | ||||||||||||||||||||
| Series C Mandatory Convertible Preferred Stock | |||||||||||||||||||||||
| Beginning of Period | $ | 1,115,792 | 22,999,974 | $ | 1,115,792 | 23,000,000 | |||||||||||||||||
| Conversion of Series C Mandatory Convertible Preferred Stock | — | — | — | (26) | |||||||||||||||||||
| End of Period | 1,115,792 | 22,999,974 | 1,115,792 | 22,999,974 | |||||||||||||||||||
| Series I Preferred Stock | |||||||||||||||||||||||
| Beginning of Period | — | 1 | — | 1 | |||||||||||||||||||
| End of Period | — | 1 | — | 1 | |||||||||||||||||||
| Series II Preferred Stock | |||||||||||||||||||||||
| Beginning of Period | — | — | 2,587 | 258,726,163 | |||||||||||||||||||
| Cancellation of Series II Preferred Stock - Holdings Merger (See Note 1) | — | — | (2,582) | (258,259,143) | |||||||||||||||||||
| Cancellation of Series II Preferred Stock | — | — | (5) | (467,020) | |||||||||||||||||||
| End of Period | — | — | — | — | |||||||||||||||||||
| Common Stock | |||||||||||||||||||||||
| Beginning of Period | 8,598 | 859,833,444 | 5,957 | 595,663,618 | |||||||||||||||||||
| Exchange of KKR Holdings Units | — | — | 5 | 467,020 | |||||||||||||||||||
| Holdings Merger (See Note 1) | — | — | 2,667 | 266,759,143 | |||||||||||||||||||
| Net Delivery of Common Stock | — | — | 21 | 2,134,807 | |||||||||||||||||||
| Conversion of Series C Mandatory Convertible Preferred Stock | — | — | — | 30 | |||||||||||||||||||
| Repurchases of Common Stock | — | — | (52) | (5,191,174) | |||||||||||||||||||
| End of Period | 8,598 | 859,833,444 | 8,598 | 859,833,444 | |||||||||||||||||||
| Additional Paid-In Capital | |||||||||||||||||||||||
| Beginning of Period | 15,948,026 | 8,997,435 | |||||||||||||||||||||
| Exchange of KKR Holdings Units | — | 14,811 | |||||||||||||||||||||
| Holdings Merger (See Note 1) | — | 8,131,679 | |||||||||||||||||||||
| Tax Effects - Holdings Merger and Other (See Note 1) | 1,180 | (1,064,790) | |||||||||||||||||||||
| Net Delivery of Common Stock | — | (34,895) | |||||||||||||||||||||
| Repurchases of Common Stock | — | (346,599) | |||||||||||||||||||||
| Equity-Based Compensation | 66,439 | 166,167 | |||||||||||||||||||||
| Change in KKR & Co. Inc.'s Ownership Interest | — | 151,837 | |||||||||||||||||||||
| End of Period | 16,015,645 | 16,015,645 | |||||||||||||||||||||
| Retained Earnings | |||||||||||||||||||||||
| Beginning of Period | 6,590,883 | 7,670,182 | |||||||||||||||||||||
| Net Income (Loss) Attributable to KKR & Co. Inc. | (74,396) | (941,600) | |||||||||||||||||||||
| Series C Mandatory Convertible Preferred Stock Dividends ($0.75 and $2.25 per share for the three and nine months ended September 30, 2022, respectively) | (17,250) | (51,750) | |||||||||||||||||||||
| Common Stock Dividends ($0.155 and $0.455 per share for the three and nine months ended September 30, 2022, respectively) | (133,274) | (310,869) | |||||||||||||||||||||
| End of Period | 6,365,963 | 6,365,963 | |||||||||||||||||||||
| Accumulated Other Comprehensive Income (Loss) (net of tax) | |||||||||||||||||||||||
| Beginning of Period | (4,590,616) | (209,789) | |||||||||||||||||||||
| Other Comprehensive Income (Loss) | (1,464,337) | (4,674,223) | |||||||||||||||||||||
| Exchange of KKR Holdings Units | — | (1,946) | |||||||||||||||||||||
| Holdings Merger (See Note 1) | — | (1,172,442) | |||||||||||||||||||||
| Change in KKR & Co. Inc.'s Ownership Interest | — | 3,447 | |||||||||||||||||||||
| End of Period | (6,054,953) | (6,054,953) | |||||||||||||||||||||
| Total KKR & Co. Inc. Stockholders' Equity | 17,451,045 | 17,451,045 | |||||||||||||||||||||
| Noncontrolling Interests (See Note 22) | 34,449,617 | 34,449,617 | |||||||||||||||||||||
| Total Equity | $ | 51,900,662 | $ | 51,900,662 | |||||||||||||||||||
| Redeemable Noncontrolling Interests (See Note 23) | $ | 82,133 | $ | 82,133 | |||||||||||||||||||
| Three Months Ended September 30, 2021 | Nine Months Ended September 30, 2021 | ||||||||||||||||||||||
| Amounts | Shares | Amounts | Shares | ||||||||||||||||||||
| Series A and B Preferred Stock | |||||||||||||||||||||||
| Beginning of Period | $ | 149,566 | 6,200,000 | $ | 482,554 | 20,000,000 | |||||||||||||||||
| Redemption of Series A Preferred Stock | — | — | (332,988) | (13,800,000) | |||||||||||||||||||
| Redemption of Series B Preferred Stock | (149,566) | (6,200,000) | (149,566) | (6,200,000) | |||||||||||||||||||
| End of Period | — | — | — | — | |||||||||||||||||||
| Series C Mandatory Convertible Preferred Stock | |||||||||||||||||||||||
| Beginning of Period | 1,115,792 | 23,000,000 | 1,115,792 | 23,000,000 | |||||||||||||||||||
| End of Period | 1,115,792 | 23,000,000 | 1,115,792 | 23,000,000 | |||||||||||||||||||
| Series I Preferred Stock | |||||||||||||||||||||||
| Beginning of Period | — | 1 | — | 1 | |||||||||||||||||||
| End of Period | — | 1 | — | 1 | |||||||||||||||||||
| Series II Preferred Stock | |||||||||||||||||||||||
| Beginning of Period | 2,710 | 271,027,751 | 2,756 | 275,626,493 | |||||||||||||||||||
| Cancellation of Series II Preferred Stock | — | — | (46) | (4,598,742) | |||||||||||||||||||
| End of Period | 2,710 | 271,027,751 | 2,710 | 271,027,751 | |||||||||||||||||||
| Common Stock | |||||||||||||||||||||||
| Beginning of Period | 5,830 | 583,030,973 | 5,729 | 572,893,738 | |||||||||||||||||||
| Private Placement Share Issuance | — | — | 9 | 964,871 | |||||||||||||||||||
| Exchange of KKR Holdings Units | — | — | 46 | 4,598,742 | |||||||||||||||||||
| Net Delivery of Common Stock | — | — | 73 | 7,249,400 | |||||||||||||||||||
| Clawback of Transfer Restricted Shares | — | (4,294) | — | (12,077) | |||||||||||||||||||
| Repurchases of Common Stock | — | — | (27) | (2,667,995) | |||||||||||||||||||
| End of Period | 5,830 | 583,026,679 | 5,830 | 583,026,679 | |||||||||||||||||||
| Additional Paid-In Capital | |||||||||||||||||||||||
| Beginning of Period | 8,700,224 | 8,687,817 | |||||||||||||||||||||
| Private Placement Share Issuance | — | 38,454 | |||||||||||||||||||||
| Exchange of KKR Holdings Units | — | 125,188 | |||||||||||||||||||||
| Tax Effects - Exchange of KKR Holdings Units and Other | (6,038) | (1,623) | |||||||||||||||||||||
| Net Delivery of Common Stock | — | (106,987) | |||||||||||||||||||||
| Repurchases of Common Stock | — | (135,903) | |||||||||||||||||||||
| Equity-Based Compensation | 41,491 | 128,731 | |||||||||||||||||||||
| End of Period | 8,735,677 | 8,735,677 | |||||||||||||||||||||
| Retained Earnings | |||||||||||||||||||||||
| Beginning of Period | 6,200,585 | 3,440,782 | |||||||||||||||||||||
| Net Income (Loss) Attributable to KKR & Co. Inc. | 1,156,557 | 4,141,668 | |||||||||||||||||||||
| Series A Preferred Stock Dividends ($0.00 and $0.843750 per share for the three and nine months ended September 30, 2021, respectively) | — | (11,644) | |||||||||||||||||||||
| Redemption of Series A Preferred Stock | — | (12,012) | |||||||||||||||||||||
| Series B Preferred Stock Dividends ($0.406250 and $1.218750 per share for the three and nine months ended September 30, 2021, respectively) | (2,519) | (7,557) | |||||||||||||||||||||
| Redemption of Series B Preferred Stock | (5,434) | (5,434) | |||||||||||||||||||||
| Series C Mandatory Convertible Preferred Stock Dividends ($0.75 and $2.25 per share for the three and nine months ended September 30, 2021, respectively) | (17,250) | (51,750) | |||||||||||||||||||||
| Common Stock Dividends ($0.145 and $0.425 per share for the three and nine months ended September 30, 2021, respectively) | (84,539) | (246,653) | |||||||||||||||||||||
| End of Period | 7,247,400 | 7,247,400 | |||||||||||||||||||||
| Accumulated Other Comprehensive Income (Loss) (net of tax) | |||||||||||||||||||||||
| Beginning of Period | (106,348) | (18,612) | |||||||||||||||||||||
| Other Comprehensive Income (Loss) | (68,091) | (152,704) | |||||||||||||||||||||
| Exchange of KKR Holdings Units | — | (3,123) | |||||||||||||||||||||
| End of Period | (174,439) | (174,439) | |||||||||||||||||||||
| Total KKR & Co. Inc. Stockholders' Equity | 16,932,970 | 16,932,970 | |||||||||||||||||||||
| Noncontrolling Interests (See Note 22) | 40,031,244 | 40,031,244 | |||||||||||||||||||||
| Total Equity | $ | 56,964,214 | $ | 56,964,214 | |||||||||||||||||||
| Redeemable Noncontrolling Interests (See Note 23) | $ | 93,339 | $ | 93,339 | |||||||||||||||||||
| KKR & Co. L.P. | |||||||||||||||||||||||||||||
Common Units | Capital - Common Unitholders | Accumulated Other Comprehensive Income (Loss) | Total Capital - Common Units | Capital - Series A Preferred Units | Capital - Series B Preferred Units | Noncontrolling Interests | Total Equity | Redeemable Noncontrolling Interests | |||||||||||||||||||||
| Balance at January 1, 2016 | 457,834,875 | $ | 5,575,981 | $ | (28,799 | ) | $ | 5,547,182 | $ | — | $ | — | $ | 43,731,774 | $ | 49,278,956 | $ | 188,629 | |||||||||||
| Net Income (Loss) | 116,103 | 116,103 | 11,515 | 2,379 | 353,044 | 483,041 | 4,616 | ||||||||||||||||||||||
| Other Comprehensive Income (Loss)- Foreign Currency Translation (Net of Tax) | 2,176 | 2,176 | (1,497 | ) | 679 | ||||||||||||||||||||||||
| Deconsolidation of Funds | — | (34,240,240 | ) | (34,240,240 | ) | ||||||||||||||||||||||||
| Exchange of KKR Holdings L.P. Units and Other Securities to KKR & Co. L.P. Common Units | 4,655,059 | 54,674 | (480 | ) | 54,194 | (54,194 | ) | — | |||||||||||||||||||||
| Tax Effects Resulting from Exchange of KKR Holdings L.P. Units and delivery of KKR & Co. L.P. Common Units and Other | (158 | ) | (89 | ) | (247 | ) | (247 | ) | |||||||||||||||||||||
| Net Delivery of Common Units - Equity Incentive Plan | 5,098,522 | (28,234 | ) | (28,234 | ) | (28,234 | ) | ||||||||||||||||||||||
| Equity Based Compensation | 148,257 | 148,257 | 37,775 | 186,032 | |||||||||||||||||||||||||
| Unit Repurchases | (21,387,836 | ) | (291,903 | ) | (291,903 | ) | (291,903 | ) | |||||||||||||||||||||
| Equity Issued in connection with Preferred Unit Offering | — | 332,988 | 149,566 | 482,554 | |||||||||||||||||||||||||
| Capital Contributions | — | 1,948,552 | 1,948,552 | 223,739 | |||||||||||||||||||||||||
| Capital Distributions | (213,483 | ) | (213,483 | ) | (11,515 | ) | (2,379 | ) | (1,164,758 | ) | (1,392,135 | ) | (21,774 | ) | |||||||||||||||
| Balance at September 30, 2016 | 446,200,620 | $ | 5,361,237 | $ | (27,192 | ) | $ | 5,334,045 | $ | 332,988 | $ | 149,566 | $ | 10,610,456 | $ | 16,427,055 | $ | 395,210 | |||||||||||
| KKR & Co. L.P. | |||||||||||||||||||||||||||||
Common Units | Capital - Common Unitholders | Accumulated Other Comprehensive Income (Loss) | Total Capital - Common Units | Capital - Series A Preferred Units | Capital - Series B Preferred Units | Noncontrolling Interests | Total Equity | Redeemable Noncontrolling Interests | |||||||||||||||||||||
| Balance at January 1, 2017 | 452,380,335 | $ | 5,506,375 | $ | (49,096 | ) | $ | 5,457,279 | $ | 332,988 | $ | 149,566 | $ | 10,545,902 | $ | 16,485,735 | $ | 632,348 | |||||||||||
| Net Income (Loss) | 818,552 | 818,552 | 17,466 | 7,557 | 1,137,585 | 1,981,160 | 64,196 | ||||||||||||||||||||||
| Other Comprehensive Income (Loss)- Foreign Currency Translation (Net of Tax) | 23,031 | 23,031 | 24,066 | 47,097 | |||||||||||||||||||||||||
| Changes in Consolidation | — | (71,657 | ) | (71,657 | ) | (315,057 | ) | ||||||||||||||||||||||
| Transfer of interests under common control (See Note 15) | 12,269 | (1,988 | ) | 10,281 | (10,281 | ) | — | ||||||||||||||||||||||
| Exchange of KKR Holdings L.P. Units and Other Securities to KKR & Co. L.P. Common Units | 14,524,298 | 198,970 | (1,615 | ) | 197,355 | (197,355 | ) | — | |||||||||||||||||||||
| Tax Effects Resulting from Exchange of KKR Holdings L.P. Units and Other | (8,093 | ) | 498 | (7,595 | ) | (7,595 | ) | ||||||||||||||||||||||
| Net Delivery of Common Units - Equity Incentive Plan | 6,229,754 | (37,304 | ) | (37,304 | ) | (37,304 | ) | ||||||||||||||||||||||
| Equity Based Compensation | 149,840 | 149,840 | 127,864 | 277,704 | |||||||||||||||||||||||||
| Unit Repurchases | — | — | |||||||||||||||||||||||||||
| Capital Contributions | — | 2,486,848 | 2,486,848 | 189,172 | |||||||||||||||||||||||||
| Capital Distributions | (230,785 | ) | (230,785 | ) | (17,466 | ) | (7,557 | ) | (1,610,880 | ) | (1,866,688 | ) | (525 | ) | |||||||||||||||
| Balance at September 30, 2017 | 473,134,387 | $ | 6,409,824 | $ | (29,170 | ) | $ | 6,380,654 | $ | 332,988 | $ | 149,566 | $ | 12,432,092 | $ | 19,295,300 | $ | 570,134 | |||||||||||
| Nine Months Ended September 30, | |||||||||||||||||||||||||||||||||||
| 2022 | 2021 | ||||||||||||||||||||||||||||||||||
| Operating Activities | |||||||||||||||||||||||||||||||||||
| Net Income (Loss) | $ | (981,395) | $ | 11,459,886 | |||||||||||||||||||||||||||||||
| Adjustments to Reconcile Net Income (Loss) to Net Cash Provided (Used) by Operating Activities: | |||||||||||||||||||||||||||||||||||
| Equity-Based and Other Non-Cash Compensation | 559,621 | 296,323 | |||||||||||||||||||||||||||||||||
| Net Realized (Gains) Losses - Asset Management | (1,158,582) | (1,532,956) | |||||||||||||||||||||||||||||||||
| Change in Unrealized (Gains) Losses - Asset Management | 2,508,970 | (6,499,944) | |||||||||||||||||||||||||||||||||
| Capital Allocation-Based (Income) Loss - Asset Management | 2,442,080 | (5,736,707) | |||||||||||||||||||||||||||||||||
| Net Realized (Gains) Losses - Insurance | 235,888 | 642,557 | |||||||||||||||||||||||||||||||||
| Net Accretion and Amortization | 330,781 | 324,692 | |||||||||||||||||||||||||||||||||
| Interest Credited to Policyholder Account Balances (net of Policy Fees) - Insurance | 1,009,636 | 938,415 | |||||||||||||||||||||||||||||||||
| Other Non-Cash Amounts | 37,268 | 101,904 | |||||||||||||||||||||||||||||||||
| Cash Flows Due to Changes in Operating Assets and Liabilities: | |||||||||||||||||||||||||||||||||||
| Reinsurance Transactions and Acquisitions, Net of Cash Provided - Insurance | 715,716 | 1,041,130 | |||||||||||||||||||||||||||||||||
| Change in Premiums, Notes Receivable and Reinsurance Recoverable, Net of Reinsurance Premiums Payable - Insurance | 795,488 | 435,715 | |||||||||||||||||||||||||||||||||
| Change in Deferred Policy Acquisition Costs - Insurance | (368,144) | (307,031) | |||||||||||||||||||||||||||||||||
| Change in Policy Liabilities and Accruals, Net - Insurance | (286,072) | (583,875) | |||||||||||||||||||||||||||||||||
| Change in Consolidation | (66,593) | (24,183) | |||||||||||||||||||||||||||||||||
| Change in Due from / to Affiliates | (163,667) | (243,120) | |||||||||||||||||||||||||||||||||
| Change in Other Assets | 1,462,938 | 669,361 | |||||||||||||||||||||||||||||||||
| Change in Accrued Expenses and Other Liabilities | (2,783,578) | 2,608,487 | |||||||||||||||||||||||||||||||||
| Investments Purchased - Asset Management | (32,517,281) | (55,435,501) | |||||||||||||||||||||||||||||||||
| Proceeds from Investments - Asset Management | 23,595,202 | 48,286,348 | |||||||||||||||||||||||||||||||||
| Net Cash Provided (Used) by Operating Activities | (4,631,724) | (3,558,499) | |||||||||||||||||||||||||||||||||
| Investing Activities | |||||||||||||||||||||||||||||||||||
| Acquisition of Global Atlantic, Net of Cash Acquired (See Note 3) | — | (473,779) | |||||||||||||||||||||||||||||||||
| Acquisition of KJRM, Net of Cash Acquired (See Note 3) | (1,690,702) | — | |||||||||||||||||||||||||||||||||
| Purchases of Fixed Assets | (58,584) | (82,515) | |||||||||||||||||||||||||||||||||
| Investments Purchased - Insurance | (37,207,043) | (38,215,238) | |||||||||||||||||||||||||||||||||
| Proceeds from Investments - Insurance | 28,301,478 | 32,463,286 | |||||||||||||||||||||||||||||||||
| Other Investing Activities, Net - Insurance | (26,311) | (708,992) | |||||||||||||||||||||||||||||||||
| Net Cash Provided (Used) by Investing Activities | (10,681,162) | (7,017,238) | |||||||||||||||||||||||||||||||||
| Financing Activities | |||||||||||||||||||||||||||||||||||
| Series A and B Preferred Stock Dividends | — | (19,201) | |||||||||||||||||||||||||||||||||
| Series C Mandatory Convertible Preferred Stock Dividends | (51,750) | (51,750) | |||||||||||||||||||||||||||||||||
| Common Stock Dividends | (310,869) | (246,653) | |||||||||||||||||||||||||||||||||
| Distributions to Redeemable Noncontrolling Interests | (1,905) | (1,362) | |||||||||||||||||||||||||||||||||
| Distributions to Noncontrolling Interests | (5,759,604) | (3,975,764) | |||||||||||||||||||||||||||||||||
| Contributions from Noncontrolling Interests | 11,033,195 | 8,875,106 | |||||||||||||||||||||||||||||||||
| Redemption of Series A and B Preferred Stock | — | (500,000) | |||||||||||||||||||||||||||||||||
| Net Delivery of Common Stock (Equity Incentive Plans) | (34,874) | (106,914) | |||||||||||||||||||||||||||||||||
| Repurchases of Common Stock | (346,651) | (135,930) | |||||||||||||||||||||||||||||||||
| Private Placement Share Issuance | — | 38,463 | |||||||||||||||||||||||||||||||||
| Proceeds from Debt Obligations | 17,191,850 | 20,615,117 | |||||||||||||||||||||||||||||||||
| Repayment of Debt Obligations | (12,328,191) | (13,881,246) | |||||||||||||||||||||||||||||||||
| Financing Costs Paid | (32,559) | (93,914) | |||||||||||||||||||||||||||||||||
| Additions to Contractholder Deposit Funds - Insurance | 16,629,841 | 11,331,510 | |||||||||||||||||||||||||||||||||
| Withdrawals from Contractholder Deposit Funds - Insurance | (9,863,212) | (6,264,316) | |||||||||||||||||||||||||||||||||
| Reinsurance Transactions, Net of Cash Provided - Insurance | 54,749 | 524,724 | |||||||||||||||||||||||||||||||||
| Nine Months Ended September 30, | |||||||
| 2017 | 2016 | ||||||
| Operating Activities | |||||||
| Net Income (Loss) | $ | 2,045,356 | $ | 487,657 | |||
| Adjustments to Reconcile Net Income (Loss) to Net Cash Provided (Used) by Operating Activities: | |||||||
| Equity Based Compensation | 271,226 | 186,032 | |||||
| Net Realized (Gains) Losses on Investments | 2,662 | (354,105 | ) | ||||
| Change in Unrealized (Gains) Losses on Investments | (1,088,317 | ) | 345,016 | ||||
| Carried Interest Allocated as a result of Changes in Fund Fair Value | (1,224,235 | ) | (602,695 | ) | |||
| Other Non-Cash Amounts | 11,121 | 29,465 | |||||
| Cash Flows Due to Changes in Operating Assets and Liabilities: | |||||||
| Change in Cash and Cash Equivalents Held at Consolidated Entities | 367,713 | (56,992 | ) | ||||
| Change in Due from / to Affiliates | (230,948 | ) | (157,793 | ) | |||
| Change in Other Assets | (66,260 | ) | (50,166 | ) | |||
| Change in Accounts Payable, Accrued Expenses and Other Liabilities | 1,176,047 | 442,025 | |||||
| Investments Purchased | (29,464,933 | ) | (14,323,221 | ) | |||
| Proceeds from Investments | 25,981,898 | 13,498,957 | |||||
| Net Cash Provided (Used) by Operating Activities | (2,218,670 | ) | (555,820 | ) | |||
| Investing Activities | |||||||
| Change in Restricted Cash and Cash Equivalents | 167,980 | 32,953 | |||||
| Purchase of Fixed Assets | (70,849 | ) | (8,177 | ) | |||
| Development of Oil and Natural Gas Properties | (1,041 | ) | (1,588 | ) | |||
| Net Cash Provided (Used) by Investing Activities | 96,090 | 23,188 | |||||
| Financing Activities | |||||||
| Distributions to Partners | (230,785 | ) | (213,483 | ) | |||
| Distributions to Redeemable Noncontrolling Interests | (525 | ) | (21,774 | ) | |||
| Contributions from Redeemable Noncontrolling Interests | 189,172 | 223,739 | |||||
| Distributions to Noncontrolling Interests | (1,610,880 | ) | (1,164,758 | ) | |||
| Contributions from Noncontrolling Interests | 2,482,649 | 1,726,529 | |||||
| Issuance of Preferred Units (net of issuance costs) | — | 482,554 | |||||
| Preferred Unit Distributions | (25,023 | ) | (13,894 | ) | |||
| Net Delivery of Common Units - Equity Incentive Plan | (37,304 | ) | (28,234 | ) | |||
| Unit Repurchases | — | (291,903 | ) | ||||
| Proceeds from Debt Obligations | 8,848,735 | 5,339,824 | |||||
| Repayment of Debt Obligations | (7,557,245 | ) | (4,353,147 | ) | |||
| Financing Costs Paid | (8,550 | ) | (3,761 | ) | |||
| Net Cash Provided (Used) by Financing Activities | 2,050,244 | 1,681,692 | |||||
| Net Increase/(Decrease) in Cash and Cash Equivalents | (72,336 | ) | 1,149,060 | ||||
| Cash and Cash Equivalents, Beginning of Period | 2,508,902 | 1,047,740 | |||||
| Cash and Cash Equivalents, End of Period | $ | 2,436,566 | $ | 2,196,800 | |||
| Nine Months Ended September 30, | |||||||||||||||||||||||||||||||||||
| 2022 | 2021 | ||||||||||||||||||||||||||||||||||
| Other Financing Activity, Net - Insurance | 471,007 | 18,244 | |||||||||||||||||||||||||||||||||
| Net Cash Provided (Used) by Financing Activities | 16,651,027 | 16,126,114 | |||||||||||||||||||||||||||||||||
| Effect of exchange rate changes on cash, cash equivalents and restricted cash | (234,580) | (31,022) | |||||||||||||||||||||||||||||||||
| Net Increase/(Decrease) in Cash, Cash Equivalents and Restricted Cash | $ | 1,103,561 | $ | 5,519,355 | |||||||||||||||||||||||||||||||
| Cash, Cash Equivalents and Restricted Cash, Beginning of Period | 10,526,304 | 6,993,457 | |||||||||||||||||||||||||||||||||
| Cash, Cash Equivalents and Restricted Cash, End of Period | $ | 11,629,865 | $ | 12,512,812 | |||||||||||||||||||||||||||||||
| Cash, Cash Equivalents and Restricted Cash are comprised of the following: | |||||||||||||||||||||||||||||||||||
| Beginning of the Period | |||||||||||||||||||||||||||||||||||
| Asset Management | |||||||||||||||||||||||||||||||||||
| Cash and Cash Equivalents | $ | 6,699,668 | $ | 6,507,874 | |||||||||||||||||||||||||||||||
| Restricted Cash and Cash Equivalents | 134,298 | 485,583 | |||||||||||||||||||||||||||||||||
| Total Asset Management | 6,833,966 | 6,993,457 | |||||||||||||||||||||||||||||||||
| Insurance | |||||||||||||||||||||||||||||||||||
| Cash and Cash Equivalents | $ | 3,391,934 | $ | — | |||||||||||||||||||||||||||||||
| Restricted Cash and Cash Equivalents | 300,404 | — | |||||||||||||||||||||||||||||||||
| Total Insurance | 3,692,338 | — | |||||||||||||||||||||||||||||||||
| Cash, Cash Equivalents and Restricted Cash, Beginning of Period | $ | 10,526,304 | $ | 6,993,457 | |||||||||||||||||||||||||||||||
| End of the Period | |||||||||||||||||||||||||||||||||||
| Asset Management | |||||||||||||||||||||||||||||||||||
| Cash and Cash Equivalents | $ | 6,911,691 | $ | 7,256,382 | |||||||||||||||||||||||||||||||
| Restricted Cash and Cash Equivalents | 201,194 | 140,618 | |||||||||||||||||||||||||||||||||
| Total Asset Management | 7,112,885 | 7,397,000 | |||||||||||||||||||||||||||||||||
| Insurance | |||||||||||||||||||||||||||||||||||
| Cash and Cash Equivalents | $ | 4,147,146 | $ | 4,717,240 | |||||||||||||||||||||||||||||||
| Restricted Cash and Cash Equivalents | 369,834 | 398,572 | |||||||||||||||||||||||||||||||||
| Total Insurance | 4,516,980 | 5,115,812 | |||||||||||||||||||||||||||||||||
| Cash, Cash Equivalents and Restricted Cash, End of Period | $ | 11,629,865 | $ | 12,512,812 | |||||||||||||||||||||||||||||||
| Nine Months Ended September 30, | Nine Months Ended September 30, | ||||||||||||||||||||||||||||||||
| 2017 | 2016 | 2022 | 2021 | ||||||||||||||||||||||||||||||
| Supplemental Disclosures of Cash Flow Information | Supplemental Disclosures of Cash Flow Information | ||||||||||||||||||||||||||||||||
| Payments for Interest | $ | 577,428 | $ | 600,701 | Payments for Interest | $ | 1,112,596 | $ | 876,412 | ||||||||||||||||||||||||
| Payments for Income Taxes | $ | 34,633 | $ | 21,335 | Payments for Income Taxes | $ | 556,195 | $ | 463,983 | ||||||||||||||||||||||||
| Payments for Operating Lease Liabilities | Payments for Operating Lease Liabilities | $ | 37,533 | $ | 35,124 | ||||||||||||||||||||||||||||
| Supplemental Disclosures of Non-Cash Investing and Financing Activities | Supplemental Disclosures of Non-Cash Investing and Financing Activities | ||||||||||||||||||||||||||||||||
| Non-Cash Contributions of Equity Based Compensation | $ | 277,704 | $ | 186,032 | |||||||||||||||||||||||||||||
| Non-Cash Contributions from Noncontrolling Interests | $ | 4,199 | $ | 222,023 | |||||||||||||||||||||||||||||
| Equity-Based and Other Non-Cash Contributions | Equity-Based and Other Non-Cash Contributions | $ | 459,327 | $ | 235,381 | ||||||||||||||||||||||||||||
| Non-Cash Contribution from Noncontrolling Interests | Non-Cash Contribution from Noncontrolling Interests | $ | 84,786 | $ | 845,943 | ||||||||||||||||||||||||||||
| Debt Obligations - Net Gains (Losses), Translation and Other | $ | (460,740 | ) | $ | (243,384 | ) | Debt Obligations - Net Gains (Losses), Translation and Other | $ | 3,056,342 | $ | 272,410 | ||||||||||||||||||||||
| Tax Effects Resulting from Exchange of KKR Holdings L.P. Units and delivery of KKR & Co. L.P. Common Units | $ | (7,595 | ) | $ | (247 | ) | |||||||||||||||||||||||||||
| Holdings Merger (See Note 1) | Holdings Merger (See Note 1) | $ | 6,959,322 | $ | — | ||||||||||||||||||||||||||||
| Tax Effects - Exchange of KKR Holdings L.P. Units and Other (See Note 1) | Tax Effects - Exchange of KKR Holdings L.P. Units and Other (See Note 1) | $ | (1,064,790) | $ | (1,623) | ||||||||||||||||||||||||||||
| Changes in Consolidation and Other | |||||||||||||||||||||||||||||||||
| Cash and Cash Equivalents Held at Consolidated Entities | $ | (2,244 | ) | $ | (270,458 | ) | |||||||||||||||||||||||||||
| Restricted Cash and Cash Equivalents | $ | — | $ | (54,064 | ) | ||||||||||||||||||||||||||||
| Right-of-Use Assets obtained in Exchange for new Operating Lease Liabilities | Right-of-Use Assets obtained in Exchange for new Operating Lease Liabilities | $ | 47,032 | $ | 44,754 | ||||||||||||||||||||||||||||
| Investments Acquired through Reinsurance Agreements | Investments Acquired through Reinsurance Agreements | $ | 2,697,956 | $ | 16,133,534 | ||||||||||||||||||||||||||||
| Policyholder Liabilities and Accruals Acquired through Reinsurance Agreements | Policyholder Liabilities and Accruals Acquired through Reinsurance Agreements | $ | 965,829 | $ | 3,455,904 | ||||||||||||||||||||||||||||
| Contractholder Deposit Funds Acquired through Reinsurance Agreements | Contractholder Deposit Funds Acquired through Reinsurance Agreements | $ | 2,544,504 | $ | 14,809,751 | ||||||||||||||||||||||||||||
| Change in Consolidation | Change in Consolidation | ||||||||||||||||||||||||||||||||
| Investments | $ | (174,906 | ) | $ | (35,686,489 | ) | Investments | $ | (57,440) | $ | (64,957) | ||||||||||||||||||||||
| Due From Affiliates | $ | (3,536 | ) | $ | 147,427 | Due From Affiliates | $ | — | $ | (3,735) | |||||||||||||||||||||||
| Other Assets | $ | (298,097 | ) | $ | (532,226 | ) | Other Assets | $ | (59,675) | $ | (46,352) | ||||||||||||||||||||||
| Debt Obligations | $ | — | $ | (2,355,305 | ) | Debt Obligations | $ | (50,339) | $ | (26,165) | |||||||||||||||||||||||
| Due to Affiliates | $ | — | $ | 329,083 | Due to Affiliates | $ | (174) | $ | (238) | ||||||||||||||||||||||||
| Accounts Payable, Accrued Expenses and Other Liabilities | $ | (114,573 | ) | $ | (129,348 | ) | |||||||||||||||||||||||||||
| Accrued Expenses and Other Liabilities | Accrued Expenses and Other Liabilities | $ | (4,162) | $ | (11,626) | ||||||||||||||||||||||||||||
| Noncontrolling Interests | $ | (71,657 | ) | $ | (34,240,240 | ) | Noncontrolling Interests | $ | — | $ | (78,840) | ||||||||||||||||||||||
| Redeemable Noncontrolling Interests | $ | (315,057 | ) | $ | — | ||||||||||||||||||||||||||||
| Three Months Ended September 30, | Nine Months Ended September 30, | ||||||||||||||
| 2017 | 2016 | 2017 | 2016 | ||||||||||||
| Balance at the beginning of the period | $ | 4,683,673 | $ | 4,018,305 | $ | 4,293,337 | $ | 4,347,153 | |||||||
Net income (loss) attributable to noncontrolling interests held by KKR Holdings (1) | 115,434 | 284,834 | 637,146 | 86,659 | |||||||||||
Other comprehensive income (loss), net of tax (2) | 4,676 | 231 | 18,429 | (37 | ) | ||||||||||
Impact of the exchange of KKR Holdings units to KKR & Co. L.P. common units (3) | (43,553 | ) | (22,930 | ) | (184,254 | ) | (53,908 | ) | |||||||
| Equity based compensation | 23,807 | 7,822 | 127,864 | 27,469 | |||||||||||
| Capital contributions | 39 | 69 | 2,989 | 207 | |||||||||||
| Capital distributions | (58,347 | ) | (57,420 | ) | (177,701 | ) | (176,632 | ) | |||||||
Transfer of interests under common control (See Note 15 "Equity") | — | — | 7,919 | — | |||||||||||
| Balance at the end of the period | $ | 4,725,729 | $ | 4,230,911 | $ | 4,725,729 | $ | 4,230,911 | |||||||
| Three Months Ended September 30, | Nine Months Ended September 30, | ||||||||||||||
| 2017 | 2016 | 2017 | 2016 | ||||||||||||
| Net income (loss) | $ | 378,938 | $ | 974,762 | $ | 2,045,356 | $ | 487,657 | |||||||
| Less: Net income (loss) attributable to Redeemable Noncontrolling Interests | 20,876 | 3,121 | 64,196 | 4,616 | |||||||||||
| Less: Net income (loss) attributable to Noncontrolling Interests in consolidated entities | 80,724 | 326,454 | 500,439 | 266,385 | |||||||||||
Less: Net income (loss) attributable to Series A and Series B Preferred Unitholders | 8,341 | 8,201 | 25,023 | 13,894 | |||||||||||
Plus: Income tax / (benefit) attributable to KKR Management Holdings Corp. | 6,063 | 3,187 | 30,571 | (8,376 | ) | ||||||||||
| Net income (loss) attributable to KKR & Co. L.P. Common Unitholders and KKR Holdings | $ | 275,060 | $ | 640,173 | $ | 1,486,269 | $ | 194,386 | |||||||
| Net income (loss) attributable to noncontrolling interests held by KKR Holdings | $ | 115,434 | $ | 284,834 | $ | 637,146 | $ | 86,659 | |||||||
| Three Months Ended September 30, | Nine Months Ended September 30, | ||||||||||||||
| 2017 | 2016 | 2017 | 2016 | ||||||||||||
| Management Fees | $ | 178,942 | $ | 152,491 | $ | 517,393 | $ | 468,390 | |||||||
| Transaction Fees | 181,280 | 113,056 | 581,410 | 277,776 | |||||||||||
| Monitoring Fees | 41,848 | 23,367 | 145,203 | 99,388 | |||||||||||
| Fee Credits | (70,641 | ) | (46,975 | ) | (207,396 | ) | (106,506 | ) | |||||||
| Carried Interest | 337,459 | 414,864 | 1,224,235 | 602,695 | |||||||||||
| Incentive Fees | 2,519 | 3,800 | 3,637 | 6,045 | |||||||||||
| Oil and Gas Revenue | 12,441 | 16,191 | 47,096 | 47,977 | |||||||||||
| Consulting Fees | 9,029 | 10,262 | 29,039 | 30,853 | |||||||||||
| Total Fees and Other | $ | 692,877 | $ | 687,056 | $ | 2,340,617 | $ | 1,426,618 | |||||||
| Cash consideration paid by KKR | $ | 2,914,455 | |||
| GA Co-Investors and GA Rollover Investors | 1,824,239 | ||||
| Total Purchase Price | $ | 4,738,694 | |||
| February 1, 2021 | |||||||||||
| ($ in thousands) | |||||||||||
| Consideration Transferred | |||||||||||
| Cash Consideration paid by KKR | $ | 2,914,455 | |||||||||
| GA Co-Investors | 978,296 | ||||||||||
| GA Rollover Investors | 845,943 | ||||||||||
Settlement of pre-existing relationships(1) | (60,200) | ||||||||||
Total Consideration Transferred(2) | $ | 4,678,494 | |||||||||
| Recognized Amounts of Identifiable Assets Acquired and Liabilities Assumed: | |||||||||||
| Cash, Cash Equivalents and Restricted Cash | $ | 3,358,772 | |||||||||
| Investments | 99,544,755 | ||||||||||
| Reinsurance Recoverable | 15,753,030 | ||||||||||
| Insurance Intangible Assets | 1,024,520 | ||||||||||
Other Assets(3) | 3,325,652 | ||||||||||
| Separate Account Assets | 5,371,060 | ||||||||||
| Policy Liabilities | (100,374,765) | ||||||||||
| Debt Obligations | (1,450,920) | ||||||||||
| Funds Withheld Payable at Interest | (13,800,969) | ||||||||||
| Accrued Expenses and Other Liabilities | (2,735,811) | ||||||||||
| Reinsurance Liabilities | (180,573) | ||||||||||
| Separate Account Liabilities | (5,371,060) | ||||||||||
| Total Identifiable Net Assets | 4,463,691 | ||||||||||
Redeemable non-controlling interests(4) | (91,845) | ||||||||||
Other Noncontrolling interests(4) | (190,405) | ||||||||||
| Goodwill | $ | 497,053 | |||||||||
| Fair Value | Average Useful Life | |||||||||||||
| ($ in thousands) | (in years) | |||||||||||||
| VOBA (included within Insurance Intangible Assets) | $ | 1,024,520 | 28.6 | |||||||||||
| Negative VOBA (included within Policy Liabilities) | (1,273,414) | 22.2 | ||||||||||||
| Total VOBA | $ | (248,894) | ||||||||||||
| Value of Distribution Agreements Acquired | $ | 250,000 | 16 to 21 | |||||||||||
| Trade Names | 50,000 | 15 to 18 | ||||||||||||
| State Insurance Licenses | 10,000 | Indefinite | ||||||||||||
| Total Identifiable Other Intangible Assets (included within Other Assets) | $ | 310,000 | ||||||||||||
| Three Months Ended | Nine Months Ended | |||||||||||||||||||||||||
| September 30, 2021 | September 30, 2021 | |||||||||||||||||||||||||
| Total Revenues | $ | 4,483,365 | $ | 12,696,730 | ||||||||||||||||||||||
| Net Income Attributable to KKR & Co. Inc. Common Stockholders | $ | 1,131,354 | $ | 4,147,132 | ||||||||||||||||||||||
| Three Months Ended September 30, | Nine Months Ended September 30, | ||||||||||||||||||||||||||||||||||||||||
| 2022 | 2021 | 2022 | 2021 | ||||||||||||||||||||||||||||||||||||||
| Management Fees | $ | 419,876 | $ | 349,249 | $ | 1,236,151 | $ | 931,624 | |||||||||||||||||||||||||||||||||
| Fee Credits | (136,996) | (164,720) | (388,315) | (322,402) | |||||||||||||||||||||||||||||||||||||
| Transaction Fees | 328,483 | 437,619 | 973,310 | 978,399 | |||||||||||||||||||||||||||||||||||||
| Monitoring Fees | 29,683 | 29,823 | 99,605 | 98,164 | |||||||||||||||||||||||||||||||||||||
| Incentive Fees | 1,402 | 6,962 | 15,600 | 13,092 | |||||||||||||||||||||||||||||||||||||
| Expense Reimbursements | 10,733 | 34,857 | 77,612 | 122,642 | |||||||||||||||||||||||||||||||||||||
| Consulting Fees | 20,748 | 25,178 | 55,741 | 66,286 | |||||||||||||||||||||||||||||||||||||
| Total Fees and Other | 673,929 | 718,968 | 2,069,704 | 1,887,805 | |||||||||||||||||||||||||||||||||||||
| Carried Interest | (477,681) | 1,216,433 | (1,999,678) | 4,553,527 | |||||||||||||||||||||||||||||||||||||
| General Partner Capital Interest | (95,182) | 310,234 | (442,402) | 1,183,180 | |||||||||||||||||||||||||||||||||||||
| Total Capital Allocation-Based Income (Loss) | (572,863) | 1,526,667 | (2,442,080) | 5,736,707 | |||||||||||||||||||||||||||||||||||||
| Total Revenues - Asset Management | $ | 101,066 | $ | 2,245,635 | $ | (372,376) | $ | 7,624,512 | |||||||||||||||||||||||||||||||||
| Three Months Ended September 30, 2022 | Three Months Ended September 30, 2021 | |||||||||||||||||||||||||||||||||||||||||||
| Net Realized Gains (Losses) | Net Unrealized Gains (Losses) | Total | Net Realized Gains (Losses) | Net Unrealized Gains (Losses) | Total | |||||||||||||||||||||||||||||||||||||||
Private Equity (1) | $ | 265,176 | $ | (263,720) | $ | 1,456 | $ | 296,410 | $ | 647,448 | $ | 943,858 | ||||||||||||||||||||||||||||||||
Credit (1) | (91,950) | (131,594) | (223,544) | 74,945 | (117,354) | (42,409) | ||||||||||||||||||||||||||||||||||||||
Investments of Consolidated CFEs (1) | (29,402) | 30,765 | 1,363 | 23,198 | (15,013) | 8,185 | ||||||||||||||||||||||||||||||||||||||
Real Assets (1) | 23,210 | (266,029) | (242,819) | 61,807 | 575,891 | 637,698 | ||||||||||||||||||||||||||||||||||||||
Equity Method - Other (1) | 40,696 | (166,024) | (125,328) | 311,420 | (137,281) | 174,139 | ||||||||||||||||||||||||||||||||||||||
Other Investments (1) | (18,159) | (332,946) | (351,105) | (118,844) | 199,961 | 81,117 | ||||||||||||||||||||||||||||||||||||||
Foreign Exchange Forward Contracts and Options (2) | 190,047 | 403,719 | 593,766 | (2,777) | 323,916 | 321,139 | ||||||||||||||||||||||||||||||||||||||
Securities Sold Short (2) | 23,523 | 78 | 23,601 | (21,031) | 2,579 | (18,452) | ||||||||||||||||||||||||||||||||||||||
Other Derivatives (2) | (13,905) | 18,687 | 4,782 | (17,687) | 6,577 | (11,110) | ||||||||||||||||||||||||||||||||||||||
Debt Obligations and Other (3) | (60,242) | (1,110) | (61,352) | 2,190 | 20,292 | 22,482 | ||||||||||||||||||||||||||||||||||||||
| Net Gains (Losses) From Investment Activities | $ | 328,994 | $ | (708,174) | $ | (379,180) | $ | 609,631 | $ | 1,507,016 | $ | 2,116,647 | ||||||||||||||||||||||||||||||||
| Nine Months Ended September 30, 2022 | Nine Months Ended September 30, 2021 | |||||||||||||||||||||||||||||||||||||||||||
| Net Realized Gains (Losses) | Net Unrealized Gains (Losses) | Total | Net Realized Gains (Losses) | Net Unrealized Gains (Losses) | Total | |||||||||||||||||||||||||||||||||||||||
Private Equity (1) | $ | 689,141 | $ | (2,192,262) | $ | (1,503,121) | $ | 1,322,179 | $ | 3,479,827 | $ | 4,802,006 | ||||||||||||||||||||||||||||||||
Credit (1) | (145,416) | (630,558) | (775,974) | 130,191 | (11,864) | 118,327 | ||||||||||||||||||||||||||||||||||||||
Investments of Consolidated CFEs (1) | (26,248) | (1,713,464) | (1,739,712) | 44,954 | 173,775 | 218,729 | ||||||||||||||||||||||||||||||||||||||
Real Assets (1) | 283,773 | 958,473 | 1,242,246 | 148,581 | 1,243,725 | 1,392,306 | ||||||||||||||||||||||||||||||||||||||
Equity Method - Other (1) | 94,989 | (484,292) | (389,303) | 410,491 | 305,085 | 715,576 | ||||||||||||||||||||||||||||||||||||||
Other Investments (1) | 18,744 | (700,176) | (681,432) | (354,349) | 908,906 | 554,557 | ||||||||||||||||||||||||||||||||||||||
Foreign Exchange Forward Contracts and Options (2) | 331,889 | 485,642 | 817,531 | (29,727) | 282,030 | 252,303 | ||||||||||||||||||||||||||||||||||||||
Securities Sold Short (2) | 83,075 | 20,422 | 103,497 | 36,517 | 21,313 | 57,830 | ||||||||||||||||||||||||||||||||||||||
Other Derivatives (2) | (30,527) | 61,015 | 30,488 | (125,376) | 83,805 | (41,571) | ||||||||||||||||||||||||||||||||||||||
Debt Obligations and Other (3) | (140,838) | 1,686,230 | 1,545,392 | (50,505) | 13,342 | (37,163) | ||||||||||||||||||||||||||||||||||||||
| Net Gains (Losses) From Investment Activities | $ | 1,158,582 | $ | (2,508,970) | $ | (1,350,388) | $ | 1,532,956 | $ | 6,499,944 | $ | 8,032,900 | ||||||||||||||||||||||||||||||||
| Three Months Ended September 30, | Nine Months Ended September 30, | ||||||||||||||||||||||
| 2022 | 2021 | 2022 | 2021 | ||||||||||||||||||||
| Fixed maturity securities – interest and other income | $ | 820,530 | $ | 632,314 | $ | 2,257,169 | $ | 1,512,377 | |||||||||||||||
| Mortgage and other loan receivables | 411,215 | 247,917 | 1,108,919 | 617,334 | |||||||||||||||||||
| Investments in transportation and other leased assets | 73,192 | 56,317 | 207,585 | 146,004 | |||||||||||||||||||
| Investments in renewable energy | 70,300 | 62,468 | 139,937 | 96,400 | |||||||||||||||||||
| Investments in real estate | 41,261 | 4,501 | 75,118 | 10,028 | |||||||||||||||||||
| Short-term and other investment income | 33,669 | 23,285 | 84,166 | 41,349 | |||||||||||||||||||
| Income assumed from funds withheld receivable at interest | 24,104 | 24,441 | 67,206 | 57,554 | |||||||||||||||||||
| Policy loans | 7,011 | 3,203 | 21,977 | 22,138 | |||||||||||||||||||
| Equity securities – dividends and other income | — | 764 | — | 23 | |||||||||||||||||||
| Income ceded to funds withheld payable at interest | (238,817) | (160,073) | (657,280) | (273,611) | |||||||||||||||||||
| Gross investment income | 1,242,465 | 895,137 | 3,304,797 | 2,229,596 | |||||||||||||||||||
| Less investment expenses: | |||||||||||||||||||||||
| Investment management and administration | 87,282 | 88,789 | 296,069 | 190,458 | |||||||||||||||||||
| Transportation and renewable energy asset depreciation and maintenance | 54,233 | 47,331 | 157,042 | 117,749 | |||||||||||||||||||
| Interest expense on derivative collateral and repurchase agreements | 6,073 | 636 | 12,315 | 1,730 | |||||||||||||||||||
| Net investment income | $ | 1,094,877 | $ | 758,381 | $ | 2,839,371 | $ | 1,919,659 | |||||||||||||||
| Three Months Ended September 30, 2017 | Three Months Ended September 30, 2016 | ||||||||||||||||||||||
Net Realized Gains (Losses) | Net Unrealized Gains (Losses) | Total | Net Realized Gains (Losses) | Net Unrealized Gains (Losses) | Total | ||||||||||||||||||
Private Equity (1) | $ | 74,483 | $ | 77,299 | $ | 151,782 | $ | 172,390 | $ | 37,465 | $ | 209,855 | |||||||||||
Credit and Other (1) | (46,946 | ) | 35,882 | (11,064 | ) | (262,826 | ) | 256,137 | (6,689 | ) | |||||||||||||
Investments of Consolidated CFEs (1) | (83,797 | ) | 43,905 | (39,892 | ) | (18,697 | ) | 40,049 | 21,352 | ||||||||||||||
Real Assets (1) | 24,479 | 56,217 | 80,696 | 28,803 | 70,700 | 99,503 | |||||||||||||||||
Foreign Exchange Forward Contracts and Options (2) | (26,043 | ) | (69,046 | ) | (95,089 | ) | 41,254 | (63,997 | ) | (22,743 | ) | ||||||||||||
Securities Sold Short (2) | (7,785 | ) | 14,369 | 6,584 | 232,448 | 29,545 | 261,993 | ||||||||||||||||
Other Derivatives (2) | (148 | ) | (5,049 | ) | (5,197 | ) | (17,224 | ) | 14,472 | (2,752 | ) | ||||||||||||
Debt Obligations and Other (3) | 18,343 | 2,616 | 20,959 | 112,469 | 62,156 | 174,625 | |||||||||||||||||
| Net Gains (Losses) From Investment Activities | $ | (47,414 | ) | $ | 156,193 | $ | 108,779 | $ | 288,617 | $ | 446,527 | $ | 735,144 | ||||||||||
| Nine Months Ended September 30, 2017 | Nine Months Ended September 30, 2016 | ||||||||||||||||||||||
| Net Realized Gains (Losses) | Net Unrealized Gains (Losses) | Total | Net Realized Gains (Losses) | Net Unrealized Gains (Losses) | Total | ||||||||||||||||||
Private Equity (1) | $ | 202,549 | $ | 372,335 | $ | 574,884 | $ | 370,266 | $ | (412,303 | ) | $ | (42,037 | ) | |||||||||
Credit and Other (1) | (633,145 | ) | 740,499 | 107,354 | (284,992 | ) | (104,028 | ) | (389,020 | ) | |||||||||||||
Investments of Consolidated CFEs (1) | (88,677 | ) | 71,952 | (16,725 | ) | (239,502 | ) | 547,099 | 307,597 | ||||||||||||||
Real Assets (1) | (34,208 | ) | 233,608 | 199,400 | 41,158 | 66,927 | 108,085 | ||||||||||||||||
Foreign Exchange Forward Contracts and Options (2) | (7,975 | ) | (311,427 | ) | (319,402 | ) | 41,829 | (75,398 | ) | (33,569 | ) | ||||||||||||
Securities Sold Short (2) | 497,926 | 66,037 | 563,963 | 231,474 | (10,343 | ) | 221,131 | ||||||||||||||||
Other Derivatives (2) | (6,027 | ) | (10,602 | ) | (16,629 | ) | (35,613 | ) | 40,081 | 4,468 | |||||||||||||
Debt Obligations and Other (3) | 66,895 | (74,085 | ) | (7,190 | ) | 229,485 | (397,051 | ) | (167,566 | ) | |||||||||||||
| Net Gains (Losses) From Investment Activities | $ | (2,662 | ) | $ | 1,088,317 | $ | 1,085,655 | $ | 354,105 | $ | (345,016 | ) | $ | 9,089 | |||||||||
| Three Months Ended September 30, | Nine Months Ended September 30, | ||||||||||||||||||||||
| 2022 | 2021 | 2022 | 2021 | ||||||||||||||||||||
| Realized gains (losses) on equity investments | $ | — | $ | 51,520 | $ | — | $ | 76,645 | |||||||||||||||
| Realized gains (losses) on available-for-sale fixed maturity debt securities | (8,277) | (15,026) | (539,000) | (88,300) | |||||||||||||||||||
| Credit loss allowances on available-for-sale securities | (15,065) | (3,809) | (32,109) | 21,287 | |||||||||||||||||||
| Credit loss allowances on mortgage and other loan receivables | (12,112) | (69,386) | (50,495) | (250,690) | |||||||||||||||||||
| Allowances on unfunded commitments | 1,292 | (3,677) | (2,086) | (15,372) | |||||||||||||||||||
| Unrealized gains (losses) on fixed maturity securities classified as trading | (720,418) | (133,118) | (2,748,542) | (130,228) | |||||||||||||||||||
| Unrealized gains (losses) on investments recognized under the fair-value option | (22,995) | 303,021 | (63,923) | 350,442 | |||||||||||||||||||
| Unrealized gains (losses) on real estate investments recognized at fair value under investment company accounting | (34,479) | 9,997 | 88,609 | 20,264 | |||||||||||||||||||
| Net gains (losses) on derivative instruments | 655,304 | 40,792 | 2,370,404 | 70,098 | |||||||||||||||||||
| Realized gains (losses) on funds withheld at interest, payable portfolio | 3,652 | (12,272) | 5,992 | (31,384) | |||||||||||||||||||
| Realized gains (losses) on funds withheld at interest, receivable portfolio | 3,858 | 2,633 | 7,296 | 10,250 | |||||||||||||||||||
| Other realized gains (losses) | (24,590) | (8,548) | (4,982) | (29) | |||||||||||||||||||
| Net investment-related gains (losses) | $ | (173,830) | $ | 162,127 | $ | (968,836) | $ | 32,983 | |||||||||||||||
| Three Months Ended September 30, 2022 | Nine Months Ended September 30, 2022 | ||||||||||||||||||||||||||||||||||
| Corporate | Structured | Total | Corporate | Structured | Total | ||||||||||||||||||||||||||||||
| Balance, as of beginning of period | $ | 7,842 | $ | 94,451 | $ | 102,293 | $ | 3,238 | $ | 84,895 | $ | 88,133 | |||||||||||||||||||||||
| Initial impairments for credit losses recognized on securities not previously impaired | 669 | 11,903 | 12,572 | 791 | 47,858 | 48,649 | |||||||||||||||||||||||||||||
| Initial credit loss allowance recognized on purchased credit deteriorated ("PCD") securities | — | — | — | — | 707 | 707 | |||||||||||||||||||||||||||||
| Accretion of initial credit loss allowance on PCD securities | — | 581 | 581 | — | 1,449 | 1,449 | |||||||||||||||||||||||||||||
| Reductions due to sales (or maturities, pay downs or prepayments) during the period of securities previously identified as credit impaired | — | (3,352) | (3,352) | — | (7,811) | (7,811) | |||||||||||||||||||||||||||||
| Net additions / reductions for securities previously impaired | 121 | 2,372 | 2,493 | 4,603 | (21,143) | (16,540) | |||||||||||||||||||||||||||||
| Write-offs of credit losses previous recognized | (7,841) | — | (7,841) | (7,841) | — | (7,841) | |||||||||||||||||||||||||||||
| Balance, as of end of period | $ | 791 | $ | 105,955 | $ | 106,746 | $ | 791 | $ | 105,955 | $ | 106,746 | |||||||||||||||||||||||
| Three Months Ended September 30, 2021 | Nine Months Ended September 30, 2021 | ||||||||||||||||||||||||||||||||||
| Corporate | Structured | Total | Corporate | Structured | Total | ||||||||||||||||||||||||||||||
Balance, as of beginning of period(1) | $ | — | $ | 91,646 | $ | 91,646 | $ | — | $ | 120,895 | $ | 120,895 | |||||||||||||||||||||||
| Initial impairments for credit losses recognized on securities not previously impaired | — | 19,921 | 19,921 | — | 47,530 | 47,530 | |||||||||||||||||||||||||||||
| Initial credit loss allowance recognized on purchased credit deteriorated ("PCD") securities | — | 1,576 | 1,576 | — | 7,204 | 7,204 | |||||||||||||||||||||||||||||
| Accretion of initial credit loss allowance on PCD securities | — | 1,879 | 1,879 | — | 2,200 | 2,200 | |||||||||||||||||||||||||||||
| Reductions due to sales (or maturities, pay downs or prepayments) during the period of securities previously identified as credit impaired | — | (2,510) | (2,510) | — | (12,612) | (12,612) | |||||||||||||||||||||||||||||
| Net additions / reductions for securities previously impaired | — | (16,112) | (16,112) | — | (68,817) | (68,817) | |||||||||||||||||||||||||||||
| Balance, as of end of period | $ | — | $ | 96,400 | $ | 96,400 | $ | — | $ | 96,400 | $ | 96,400 | |||||||||||||||||||||||
| Three Months Ended September 30, 2022 | Nine Months Ended September 30, 2022 | ||||||||||||||||||||||||||||||||||||||||||||||
| Commercial Mortgage Loans | Residential Mortgage Loans | Consumer and Other Loan Receivables | Total | Commercial Mortgage Loans | Residential Mortgage Loans | Consumer and Other Loan Receivables | Total | ||||||||||||||||||||||||||||||||||||||||
| Balance, as of beginning of period | $ | 103,944 | $ | 96,194 | $ | 211,747 | $ | 411,885 | $ | 65,970 | $ | 72,082 | $ | 236,025 | $ | 374,077 | |||||||||||||||||||||||||||||||
| Net provision (release) | 26,817 | (891) | (13,814) | 12,112 | 64,791 | 23,221 | (37,517) | 50,495 | |||||||||||||||||||||||||||||||||||||||
| Charge-offs | — | — | (671) | (671) | — | — | (1,246) | (1,246) | |||||||||||||||||||||||||||||||||||||||
| Balance, as of end of period | $ | 130,761 | $ | 95,303 | $ | 197,262 | $ | 423,326 | $ | 130,761 | $ | 95,303 | $ | 197,262 | $ | 423,326 | |||||||||||||||||||||||||||||||
| Three Months Ended September 30, 2021 | Nine Months Ended September 30, 2021 | ||||||||||||||||||||||||||||||||||||||||||||||
| Commercial Mortgage Loans | Residential Mortgage Loans | Consumer and Other Loan Receivables | Total | Commercial Mortgage Loans | Residential Mortgage Loans | Consumer and Other Loan Receivables | Total | ||||||||||||||||||||||||||||||||||||||||
Balance, as of beginning of period (1) | $ | 58,255 | $ | 76,536 | $ | 163,135 | $ | 297,926 | $ | 58,203 | $ | 62,056 | $ | — | $ | 120,259 | |||||||||||||||||||||||||||||||
| Net provision (release) | 17,750 | (2,793) | 54,429 | 69,386 | 17,802 | 10,888 | 222,000 | 250,690 | |||||||||||||||||||||||||||||||||||||||
| Loans purchased with credit deterioration | — | — | — | — | — | 799 | 838 | 1,637 | |||||||||||||||||||||||||||||||||||||||
| Charge-offs | — | (3,162) | 5,274 | 2,112 | — | (3,162) | — | (3,162) | |||||||||||||||||||||||||||||||||||||||
| Balance, as of end of period | $ | 76,005 | $ | 70,581 | $ | 222,838 | $ | 369,424 | $ | 76,005 | $ | 70,581 | $ | 222,838 | $ | 369,424 | |||||||||||||||||||||||||||||||
| Three Months Ended September 30, | Nine Months Ended September 30, | ||||||||||||||||||||||
| 2022 | 2021 | 2022 | 2021 | ||||||||||||||||||||
| AFS fixed maturity securities: | |||||||||||||||||||||||
| Proceeds from voluntary sales | $ | 807,228 | $ | 7,440,645 | $ | 10,869,470 | $ | 12,766,887 | |||||||||||||||
| Gross gains | 8,007 | 16,816 | 18,203 | 38,061 | |||||||||||||||||||
| Gross losses | (14,676) | (30,086) | (547,123) | (103,190) | |||||||||||||||||||
| September 30, 2022 | December 31, 2021 | |||||||||||||||||||||||||||||
| September 30, 2017 | December 31, 2016 | |||||||||||||||||||||||||||||
| Asset Management | Asset Management | |||||||||||||||||||||||||||||
| Private Equity | $ | 3,896,535 | $ | 2,915,667 | Private Equity | $ | 26,542,743 | $ | 25,685,750 | |||||||||||||||||||||
| Credit | 6,427,635 | 4,847,936 | Credit | 7,532,222 | 7,949,573 | |||||||||||||||||||||||||
| Investments of Consolidated CFEs | 15,500,898 | 13,950,897 | Investments of Consolidated CFEs | 21,500,342 | 22,076,809 | |||||||||||||||||||||||||
| Real Assets | 2,278,699 | 1,807,128 | Real Assets | 16,659,585 | 12,500,749 | |||||||||||||||||||||||||
| Equity Method | 3,524,781 | 2,728,995 | ||||||||||||||||||||||||||||
| Carried Interest | 2,697,294 | 2,384,177 | ||||||||||||||||||||||||||||
| Other | 2,925,995 | 2,774,965 | ||||||||||||||||||||||||||||
| Equity Method - Other | Equity Method - Other | 6,849,902 | 4,877,592 | |||||||||||||||||||||||||||
| Equity Method - Capital Allocation-Based Income | Equity Method - Capital Allocation-Based Income | 7,032,596 | 11,539,945 | |||||||||||||||||||||||||||
| Other Investments | Other Investments | 3,603,469 | 4,145,096 | |||||||||||||||||||||||||||
| Investments - Asset Management | Investments - Asset Management | $ | 89,720,859 | $ | 88,775,514 | |||||||||||||||||||||||||
| Insurance | Insurance | |||||||||||||||||||||||||||||
Fixed maturity securities, available-for-sale, at fair value(1) | Fixed maturity securities, available-for-sale, at fair value(1) | $ | 58,547,851 | $ | 68,870,886 | |||||||||||||||||||||||||
| Mortgage and other loan receivables | Mortgage and other loan receivables | 35,420,094 | 28,876,759 | |||||||||||||||||||||||||||
Fixed maturity securities, trading, at fair value(2) | Fixed maturity securities, trading, at fair value(2) | 10,247,034 | 13,753,573 | |||||||||||||||||||||||||||
| Other investments | Other investments | 10,830,743 | 8,208,566 | |||||||||||||||||||||||||||
| Funds withheld receivable at interest | Funds withheld receivable at interest | 2,893,785 | 2,999,448 | |||||||||||||||||||||||||||
| Policy loans | Policy loans | 812,844 | 765,310 | |||||||||||||||||||||||||||
| Equity securities at fair value | Equity securities at fair value | 19,922 | 289,133 | |||||||||||||||||||||||||||
| Investments - Insurance | Investments - Insurance | $ | 118,772,273 | $ | 123,763,675 | |||||||||||||||||||||||||
| Total Investments | $ | 37,251,837 | $ | 31,409,765 | Total Investments | $ | 208,493,132 | $ | 212,539,189 | |||||||||||||||||||||
| Cost or amortized cost | Allowance for Credit Losses (2)(3) | Gross unrealized | Fair value | ||||||||||||||||||||||||||
| As of September 30, 2022 | gains | losses | |||||||||||||||||||||||||||
| AFS fixed maturity securities portfolio by type: | |||||||||||||||||||||||||||||
| U.S. government and agencies | $ | 366,638 | $ | — | $ | — | $ | (71,841) | $ | 294,797 | |||||||||||||||||||
| U.S. state, municipal and political subdivisions | 5,298,283 | — | 138 | (1,271,381) | 4,027,040 | ||||||||||||||||||||||||
| Corporate | 41,326,728 | (791) | 18,021 | (8,538,465) | 32,805,493 | ||||||||||||||||||||||||
| Residential mortgage-backed securities ("RMBS") | 7,478,505 | (86,208) | 17,823 | (676,064) | 6,734,056 | ||||||||||||||||||||||||
| Commercial mortgage-backed securities ("CMBS") | 7,352,398 | (10,809) | 245 | (740,518) | 6,601,316 | ||||||||||||||||||||||||
| Collateralized bond obligations ("CBOs") | 3,060,155 | (35) | — | (223,969) | 2,836,151 | ||||||||||||||||||||||||
| Collateralized loan obligations ("CLOs") | 2,771,874 | (4,366) | 25 | (209,329) | 2,558,204 | ||||||||||||||||||||||||
All other structured securities(1) | 2,884,368 | (4,537) | 6,005 | (195,042) | 2,690,794 | ||||||||||||||||||||||||
| Total AFS fixed maturity securities | $ | 70,538,949 | $ | (106,746) | $ | 42,257 | $ | (11,926,609) | $ | 58,547,851 | |||||||||||||||||||
| Cost or amortized cost | Allowance for Credit Losses (2)(3) | Gross unrealized | Fair value | ||||||||||||||||||||||||||
| As of December 31, 2021 | gains | losses | |||||||||||||||||||||||||||
| AFS fixed maturity securities portfolio by type: | |||||||||||||||||||||||||||||
| U.S. government and agencies | $ | 785,144 | $ | — | $ | 4,171 | $ | (4,768) | $ | 784,547 | |||||||||||||||||||
| U.S. state, municipal and political subdivisions | 5,122,651 | — | 42,286 | (55,240) | 5,109,697 | ||||||||||||||||||||||||
| Corporate | 41,433,757 | (3,238) | 190,516 | (688,648) | 40,932,387 | ||||||||||||||||||||||||
| RMBS | 7,703,030 | (50,975) | 126,662 | (113,359) | 7,665,358 | ||||||||||||||||||||||||
| CMBS | 5,952,656 | (282) | 16,332 | (56,523) | 5,912,183 | ||||||||||||||||||||||||
| CBOs | 3,111,620 | (22,160) | 6,862 | (27,466) | 3,068,856 | ||||||||||||||||||||||||
| CLOs | 2,985,098 | (639) | 6,554 | (5,776) | 2,985,237 | ||||||||||||||||||||||||
All other structured securities(1) | 2,425,540 | (10,839) | 19,990 | (22,070) | 2,412,621 | ||||||||||||||||||||||||
| Total AFS fixed maturity securities | $ | 69,519,496 | $ | (88,133) | $ | 413,373 | $ | (973,850) | $ | 68,870,886 | |||||||||||||||||||
| As of September 30, 2022 | Cost or amortized cost (net of allowance) | Fair value | ||||||||||||
| Due in one year or less | $ | 551,784 | $ | 544,880 | ||||||||||
| Due after one year through five years | 9,386,813 | 8,791,184 | ||||||||||||
| Due after five years through ten years | 9,487,091 | 8,504,053 | ||||||||||||
| Due after ten years | 27,565,170 | 19,287,213 | ||||||||||||
| Subtotal | 46,990,858 | 37,127,330 | ||||||||||||
| RMBS | 7,392,297 | 6,734,056 | ||||||||||||
| CMBS | 7,341,589 | 6,601,316 | ||||||||||||
| CBOs | 3,060,120 | 2,836,151 | ||||||||||||
| CLOs | 2,767,508 | 2,558,204 | ||||||||||||
| All other structured securities | 2,879,831 | 2,690,794 | ||||||||||||
| Total AFS fixed maturity securities | $ | 70,432,203 | $ | 58,547,851 | ||||||||||
| Nine Months Ended September 30, | |||||||||||
| 2022 | 2021 | ||||||||||
| Purchase price of PCD securities acquired during the current period | $ | 24,005 | $ | 1,726,900 | |||||||
| Allowance for credit losses at acquisition | 707 | 128,099 | |||||||||
| Discount (premium) attributable to other factors | 1,710 | 308,053 | |||||||||
| Par value | $ | 26,422 | $ | 2,163,052 | |||||||
| Less than 12 months | 12 months or more | Total | ||||||||||||||||||||||||||||||||||||
| As of September 30, 2022 | Fair value | Unrealized losses | Fair value | Unrealized losses | Fair value | Unrealized losses | ||||||||||||||||||||||||||||||||
| AFS fixed maturity securities portfolio by type: | ||||||||||||||||||||||||||||||||||||||
| U.S. government and agencies | $ | 190,438 | $ | (53,005) | $ | 104,360 | $ | (18,836) | $ | 294,798 | $ | (71,841) | ||||||||||||||||||||||||||
| U.S. state, municipal and political subdivisions | 3,326,504 | (1,051,622) | 682,195 | (219,759) | 4,008,699 | (1,271,381) | ||||||||||||||||||||||||||||||||
| Corporate | 21,318,062 | (5,654,193) | 9,481,979 | (2,884,272) | 30,800,041 | (8,538,465) | ||||||||||||||||||||||||||||||||
| RMBS | 4,664,201 | (426,928) | 1,511,761 | (249,136) | 6,175,962 | (676,064) | ||||||||||||||||||||||||||||||||
| CBOs | 1,887,915 | (145,811) | 948,236 | (78,158) | 2,836,151 | (223,969) | ||||||||||||||||||||||||||||||||
| CMBS | 5,407,270 | (529,159) | 1,162,325 | (211,359) | 6,569,595 | (740,518) | ||||||||||||||||||||||||||||||||
| CLOs | 2,357,254 | (185,863) | 190,452 | (23,466) | 2,547,706 | (209,329) | ||||||||||||||||||||||||||||||||
| All other structured securities | 1,891,789 | (118,688) | 539,752 | (76,354) | 2,431,541 | (195,042) | ||||||||||||||||||||||||||||||||
| Total AFS fixed maturity securities in a continuous loss position | $ | 41,043,433 | $ | (8,165,269) | $ | 14,621,060 | $ | (3,761,340) | $ | 55,664,493 | $ | (11,926,609) | ||||||||||||||||||||||||||
| Less than 12 months | 12 months or more | Total | ||||||||||||||||||||||||||||||||||||
| As of December 31, 2021 | Fair value | Unrealized losses | Fair value | Unrealized losses | Fair value | Unrealized losses | ||||||||||||||||||||||||||||||||
| AFS fixed maturity securities portfolio by type: | ||||||||||||||||||||||||||||||||||||||
| U.S. government and agencies | $ | 311,096 | $ | (4,768) | $ | — | $ | — | $ | 311,096 | $ | (4,768) | ||||||||||||||||||||||||||
| U.S. state, municipal and political subdivisions | 2,802,309 | (55,240) | — | — | 2,802,309 | (55,240) | ||||||||||||||||||||||||||||||||
| Corporate | 30,385,514 | (688,648) | — | — | 30,385,514 | (688,648) | ||||||||||||||||||||||||||||||||
| RMBS | 3,196,876 | (113,359) | — | — | 3,196,876 | (113,359) | ||||||||||||||||||||||||||||||||
| CBOs | 2,152,790 | (27,466) | — | — | 2,152,790 | (27,466) | ||||||||||||||||||||||||||||||||
| CMBS | 3,405,774 | (56,523) | — | — | 3,405,774 | (56,523) | ||||||||||||||||||||||||||||||||
| CLOs | 1,172,330 | (5,776) | — | — | 1,172,330 | (5,776) | ||||||||||||||||||||||||||||||||
| All other structured securities | 1,348,356 | (22,070) | — | — | 1,348,356 | (22,070) | ||||||||||||||||||||||||||||||||
| Total AFS fixed maturity securities in a continuous loss position | $ | 44,775,045 | $ | (973,850) | $ | — | $ | — | $ | 44,775,045 | $ | (973,850) | ||||||||||||||||||||||||||
| September 30, 2022 | December 31, 2021 | ||||||||||
Commercial mortgage loans(1) | $ | 18,479,742 | $ | 13,824,772 | |||||||
Residential mortgage loans(1) | 10,955,269 | 8,724,904 | |||||||||
| Consumer loans | 5,445,370 | 5,617,925 | |||||||||
Other loan receivables(2)(3) | 963,039 | 1,083,235 | |||||||||
| Total mortgage and other loan receivables | 35,843,420 | 29,250,836 | |||||||||
Allowance for credit losses(4) | (423,326) | (374,077) | |||||||||
| Total mortgage and other loan receivables, net of allowance for loan losses | $ | 35,420,094 | $ | 28,876,759 | |||||||
| Years | Residential | Commercial | Total mortgage loans | ||||||||||||||
| Remainder of 2022 | $ | 115,605 | $ | 399,377 | $ | 514,982 | |||||||||||
| 2023 | 126,160 | 1,441,199 | 1,567,359 | ||||||||||||||
| 2024 | 533,435 | 2,277,465 | 2,810,900 | ||||||||||||||
| 2025 | 17,027 | 3,390,721 | 3,407,748 | ||||||||||||||
| 2026 | 890,254 | 3,259,760 | 4,150,014 | ||||||||||||||
| 2027 | 955,188 | 2,843,765 | 3,798,953 | ||||||||||||||
| 2028 and thereafter | 8,317,600 | 4,867,455 | 13,185,055 | ||||||||||||||
| Total | $ | 10,955,269 | $ | 18,479,742 | $ | 29,435,011 | |||||||||||
| Mortgage loans - carrying value by geographic region | September 30, 2022 | December 31, 2021 | |||||||||
| Pacific | $ | 7,252,784 | $ | 6,675,064 | |||||||
| West South Central | 3,594,519 | 2,675,890 | |||||||||
| South Atlantic | 8,002,247 | 4,996,043 | |||||||||
| Middle Atlantic | 3,708,296 | 3,142,973 | |||||||||
| East North Central | 1,262,908 | 590,911 | |||||||||
| Mountain | 3,151,942 | 1,957,099 | |||||||||
| New England | 1,298,758 | 1,099,157 | |||||||||
| East South Central | 740,228 | 1,035,764 | |||||||||
| West North Central | 363,474 | 350,546 | |||||||||
| Other regions | 59,855 | 26,229 | |||||||||
| Total by geographic region | $ | 29,435,011 | $ | 22,549,676 | |||||||
| Mortgage loans - carrying value by property type | September 30, 2022 | December 31, 2021 | |||||||||
| Residential | $ | 10,955,269 | $ | 8,724,904 | |||||||
| Office building | 4,654,349 | 4,185,146 | |||||||||
| Apartment | 9,341,546 | 6,194,819 | |||||||||
| Industrial | 2,938,321 | 1,981,713 | |||||||||
| Retail | 650,903 | 780,071 | |||||||||
| Other property types | 705,783 | 483,560 | |||||||||
| Warehouse | 188,840 | 199,463 | |||||||||
| Total by property type | $ | 29,435,011 | $ | 22,549,676 | |||||||
| Nine Months Ended September 30, | |||||||||||
| 2021 | |||||||||||
| Purchase price of PCD loans acquired during the current period | $ | 4,231,426 | |||||||||
| Allowance for credit losses at acquisition | 121,895 | ||||||||||
| Discount (premium) attributable to other factors | (136,174) | ||||||||||
| Par value | $ | 4,217,147 | |||||||||
| As of September 30, 2022 | |||||||||||||||||||||||||||||||||||||||||
| Performance status | 2022 | 2021 | 2020 | 2019 | 2018 | Prior | Total | ||||||||||||||||||||||||||||||||||
| Commercial mortgage loans | |||||||||||||||||||||||||||||||||||||||||
| Current | $ | 5,539,353 | $ | 6,763,595 | $ | 929,246 | $ | 1,533,917 | $ | 1,294,281 | $ | 2,419,350 | $ | 18,479,742 | |||||||||||||||||||||||||||
| 30 to 59 days past due | — | — | — | — | — | — | — | ||||||||||||||||||||||||||||||||||
| 60 to 89 days past due | — | — | — | — | — | — | — | ||||||||||||||||||||||||||||||||||
| Over 90 days past due | — | — | — | — | — | — | — | ||||||||||||||||||||||||||||||||||
| Total commercial mortgage loans | $ | 5,539,353 | $ | 6,763,595 | $ | 929,246 | $ | 1,533,917 | $ | 1,294,281 | $ | 2,419,350 | $ | 18,479,742 | |||||||||||||||||||||||||||
| Residential mortgage loans | |||||||||||||||||||||||||||||||||||||||||
| Current | $ | 1,897,046 | $ | 5,002,374 | $ | 1,884,802 | $ | 278,805 | $ | 15,119 | $ | 1,530,375 | $ | 10,608,521 | |||||||||||||||||||||||||||
| 30 to 59 days past due | 9,608 | 33,064 | 4,334 | 1,305 | 645 | 77,467 | 126,423 | ||||||||||||||||||||||||||||||||||
| 60 to 89 days past due | 1,233 | 10,727 | 3,646 | 752 | — | 24,391 | 40,749 | ||||||||||||||||||||||||||||||||||
| Over 90 days past due | 1,489 | 22,399 | 11,178 | 8,673 | 2,587 | 133,250 | 179,576 | ||||||||||||||||||||||||||||||||||
| Total residential mortgage loans | $ | 1,909,376 | $ | 5,068,564 | $ | 1,903,960 | $ | 289,535 | $ | 18,351 | $ | 1,765,483 | $ | 10,955,269 | |||||||||||||||||||||||||||
| Total mortgage loans | $ | 7,448,729 | $ | 11,832,159 | $ | 2,833,206 | $ | 1,823,452 | $ | 1,312,632 | $ | 4,184,833 | $ | 29,435,011 | |||||||||||||||||||||||||||
| As of December 31, 2021 | |||||||||||||||||||||||||||||||||||||||||
| Performance status | 2021 | 2020 | 2019 | 2018 | 2017 | Prior | Total | ||||||||||||||||||||||||||||||||||
| Commercial mortgage loans | |||||||||||||||||||||||||||||||||||||||||
| Current | $ | 6,831,655 | $ | 976,369 | $ | 1,883,908 | $ | 1,373,865 | $ | 817,954 | $ | 1,941,021 | $ | 13,824,772 | |||||||||||||||||||||||||||
| 30 to 59 days past due | — | — | — | — | — | — | — | ||||||||||||||||||||||||||||||||||
| 60 to 89 days past due | — | — | — | — | — | — | — | ||||||||||||||||||||||||||||||||||
| Over 90 days past due | — | — | — | — | — | — | — | ||||||||||||||||||||||||||||||||||
| Total commercial mortgage loans | $ | 6,831,655 | $ | 976,369 | $ | 1,883,908 | $ | 1,373,865 | $ | 817,954 | $ | 1,941,021 | $ | 13,824,772 | |||||||||||||||||||||||||||
| Residential mortgage loans | |||||||||||||||||||||||||||||||||||||||||
| Current | $ | 4,505,537 | $ | 1,576,342 | $ | 393,153 | $ | 123,995 | $ | 65,070 | $ | 1,711,156 | $ | 8,375,253 | |||||||||||||||||||||||||||
| 30 to 59 days past due | 24,955 | 6,028 | 5,818 | 1,155 | 739 | 75,104 | 113,799 | ||||||||||||||||||||||||||||||||||
| 60 to 89 days past due | 4,247 | 1,243 | 607 | — | — | 27,028 | 33,125 | ||||||||||||||||||||||||||||||||||
| Over 90 days past due | 5,305 | 14,272 | 21,985 | 2,686 | — | 158,479 | 202,727 | ||||||||||||||||||||||||||||||||||
| Total residential mortgage loans | $ | 4,540,044 | $ | 1,597,885 | $ | 421,563 | $ | 127,836 | $ | 65,809 | $ | 1,971,767 | $ | 8,724,904 | |||||||||||||||||||||||||||
| Total mortgage loans | $ | 11,371,699 | $ | 2,574,254 | $ | 2,305,471 | $ | 1,501,701 | $ | 883,763 | $ | 3,912,788 | $ | 22,549,676 | |||||||||||||||||||||||||||
| Performance status | September 30, 2022 | December 31, 2021 | |||||||||
| Consumer loans | |||||||||||
| Current | $ | 5,347,354 | $ | 5,556,923 | |||||||
| 30 to 59 days past due | 54,454 | 34,048 | |||||||||
| 60 to 89 days past due | 27,227 | 16,817 | |||||||||
| Over 90 days past due | 16,335 | 10,137 | |||||||||
| Total consumer loans | $ | 5,445,370 | $ | 5,617,925 | |||||||
| Loan-to-value as of September 30, 2022, by year of origination | Carrying value loan-to-value 70% and less | Carrying value loan-to-value 71% - 90% | Carrying value loan-to-value over 90% | Total carrying value | ||||||||||||||||||||||
| 2022 | $ | 5,174,067 | $ | 365,286 | $ | — | $ | 5,539,353 | ||||||||||||||||||
| 2021 | 4,744,972 | 2,018,623 | — | 6,763,595 | ||||||||||||||||||||||
| 2020 | 771,593 | 122,593 | 35,060 | 929,246 | ||||||||||||||||||||||
| 2019 | 1,360,360 | 173,557 | — | 1,533,917 | ||||||||||||||||||||||
| 2018 | 1,259,505 | 34,776 | — | 1,294,281 | ||||||||||||||||||||||
| 2017 | 722,333 | 44,548 | — | 766,881 | ||||||||||||||||||||||
| Prior | 1,652,469 | — | — | 1,652,469 | ||||||||||||||||||||||
| Total commercial mortgage loans | $ | 15,685,299 | $ | 2,759,383 | $ | 35,060 | $ | 18,479,742 | ||||||||||||||||||
| Loan-to-value as of December 31, 2021, by year of origination | Carrying value loan-to-value 70% and less | Carrying value loan-to-value 71% - 90% | Carrying value loan-to-value over 90% | Total carrying value | |||||||||||||||||||
| 2021 | $ | 4,910,170 | $ | 1,921,485 | $ | — | $ | 6,831,655 | |||||||||||||||
| 2020 | 819,406 | 121,997 | 34,966 | 976,369 | |||||||||||||||||||
| 2019 | 1,747,656 | 136,252 | — | 1,883,908 | |||||||||||||||||||
| 2018 | 1,324,807 | 49,058 | — | 1,373,865 | |||||||||||||||||||
| 2017 | 772,989 | 44,965 | — | 817,954 | |||||||||||||||||||
| 2016 | 425,926 | 2,440 | — | 428,366 | |||||||||||||||||||
| Prior | 1,497,503 | 15,152 | — | 1,512,655 | |||||||||||||||||||
| Total commercial mortgage loans | $ | 11,498,457 | $ | 2,291,349 | $ | 34,966 | $ | 13,824,772 | |||||||||||||||
| September 30, 2022 | December 31, 2021 | ||||||||||
Investments in real estate(1) | $ | 4,202,597 | $ | 1,564,853 | |||||||
Investments in renewable energy(2) | 3,420,210 | 3,573,811 | |||||||||
Investments in transportation and other leased assets(3) | 2,767,770 | 2,663,759 | |||||||||
| Other investment partnerships | 257,905 | 234,301 | |||||||||
| FHLB common stock and other investments | 182,261 | 171,842 | |||||||||
| Total other investments | $ | 10,830,743 | $ | 8,208,566 | |||||||
| Investment in common stock | Funding agreements issued to FHLB member banks | Collateral | |||||||||||||||||||||||||||||||||
| September 30, 2022 | December 31, 2021 | September 30, 2022 | December 31, 2021 | September 30, 2022 | December 31, 2021 | ||||||||||||||||||||||||||||||
| FHLB Indianapolis | $ | 80,512 | $ | 80,640 | $ | 1,610,025 | $ | 1,619,765 | $ | 2,362,537 | $ | 2,577,698 | |||||||||||||||||||||||
| FHLB Des Moines | 31,120 | 34,600 | 532,467 | 620,006 | 838,297 | 1,004,530 | |||||||||||||||||||||||||||||
| FHLB Boston | 17,520 | 22,520 | 322,922 | 326,639 | 436,645 | 553,384 | |||||||||||||||||||||||||||||
| Total | $ | 129,152 | $ | 137,760 | $ | 2,465,414 | $ | 2,566,410 | $ | 3,637,479 | $ | 4,135,612 | |||||||||||||||||||||||
| As of September 30, 2022 | Overnight | <30 Days | 30 - 90 Days | > 90 Days | Total | |||||||||||||||||||||||||||
| Corporate Securities | $ | — | $ | — | $ | — | $ | 810,946 | $ | 810,946 | ||||||||||||||||||||||
| Total borrowing | $ | — | $ | — | $ | — | $ | 810,946 | $ | 810,946 | ||||||||||||||||||||||
| As of December 31, 2021 | Overnight | <30 Days | 30 - 90 Days | > 90 Days | Total | |||||||||||||||||||||||||||
| Corporate Securities | $ | — | $ | — | $ | — | $ | 312,965 | $ | 312,965 | ||||||||||||||||||||||
| Total borrowing | $ | — | $ | — | $ | — | $ | 312,965 | $ | 312,965 | ||||||||||||||||||||||
| Three Months Ended September 30, 2022 | Derivatives | Hedged items | Net | ||||||||||||||
| 2029 Senior Notes | $ | (25,777) | $ | 25,777 | $ | — | |||||||||||
| 2031 Senior Notes | (36,636) | 36,636 | — | ||||||||||||||
| FHLB funding agreement liabilities | (12,060) | 12,060 | — | ||||||||||||||
| FABN liabilities | (145,075) | 145,075 | — | ||||||||||||||
| Nine Months Ended September 30, 2022 | Derivatives | Hedged items | Net | ||||||||||||||
| 2029 Senior Notes | $ | (72,001) | $ | 72,001 | $ | — | |||||||||||
| 2031 Senior Notes | (108,087) | 108,087 | — | ||||||||||||||
| FHLB funding agreement liabilities | (52,326) | 52,326 | — | ||||||||||||||
| FABN liabilities | (374,468) | 374,468 | — | ||||||||||||||
| Three Months Ended September 30, 2021 | Derivatives | Hedged items | Net | ||||||||||||||
| 2029 Senior Notes | $ | (4,016) | $ | 4,016 | $ | — | |||||||||||
| 2031 Senior Notes | (7,023) | 7,023 | — | ||||||||||||||
| FHLB funding agreement liabilities | 1,324 | (1,324) | — | ||||||||||||||
| Nine Months Ended September 30, 2021 | Derivatives | Hedged items | Net | ||||||||||||||
| 2029 Senior Notes | $ | (16,364) | $ | 16,364 | $ | — | |||||||||||
| 2031 Senior Notes | (3,986) | 3,986 | — | ||||||||||||||
| FHLB funding agreement liabilities | (5,954) | 5,954 | — | ||||||||||||||
| As of September 30, 2022 | As of December 31, 2021 | ||||||||||||||||||||||
| Carrying value | Fair value of hedge adjustments | Carrying value | Fair value of hedge adjustments | ||||||||||||||||||||
| 2029 Senior Notes | $ | 403,044 | $ | (90,156) | $ | 473,890 | $ | (18,808) | |||||||||||||||
| 2031 Senior Notes | 534,886 | (115,113) | 644,439 | (5,561) | |||||||||||||||||||
| FHLB funding agreement liabilities | 1,174,359 | (67,327) | 1,070,770 | (16,092) | |||||||||||||||||||
| FABN liabilities | 4,608,996 | (372,494) | — | — | |||||||||||||||||||
| Three Months Ended September 30, | Nine Months Ended September 30, | ||||||||||||||||||||||
| 2022 | 2021 | 2022 | 2021 | ||||||||||||||||||||
| FX forward derivative: | |||||||||||||||||||||||
| Net investment-related gains (losses) | $ | 98,263 | $ | 12,086 | $ | 216,691 | $ | 13,768 | |||||||||||||||
| AOCI | (10,652) | 766 | 7,997 | 399 | |||||||||||||||||||
| Amortization - excluded component | 11,941 | 593 | 17,471 | 1,206 | |||||||||||||||||||
| Hedged available-for-sale securities: | |||||||||||||||||||||||
| Net investment-related gains (losses) | (105,645) | (8,590) | (205,746) | (11,306) | |||||||||||||||||||
| September 30, 2022 | December 31, 2021 | ||||||||||||||||||||||
| Notional value of foreign currency forward | $ | 2,403,559 | $ | 1,754,555 | |||||||||||||||||||
| As of September 30, 2022 | Notional Value | Derivative Assets | Derivative Liabilities | |||||||||||||||||
| Asset Management | ||||||||||||||||||||
| Foreign Exchange Contracts and Options | $ | 15,020,028 | $ | 1,016,135 | $ | 242,117 | ||||||||||||||
| Other Derivatives | 1,247,992 | 39,887 | 20,249 | |||||||||||||||||
| Total Asset Management | $ | 1,056,022 | $ | 262,366 | ||||||||||||||||
| Insurance | ||||||||||||||||||||
| Equity market contracts | $ | 39,471,819 | $ | 579,918 | $ | 217,106 | ||||||||||||||
| Interest rate contracts | 11,139,171 | 170,402 | 935,385 | |||||||||||||||||
| Foreign currency contracts | 3,279,137 | 373,757 | 95,233 | |||||||||||||||||
| Credit risk contracts | 107,754 | — | 308 | |||||||||||||||||
Impact of netting(1) | (273,803) | (273,803) | ||||||||||||||||||
| Fair value included within derivative assets and derivative liabilities | 850,274 | 974,229 | ||||||||||||||||||
| Embedded derivative – indexed universal life products | — | 315,889 | ||||||||||||||||||
| Embedded derivative – annuity products | — | 1,472,814 | ||||||||||||||||||
| Fair value included within policy liabilities | — | 1,788,703 | ||||||||||||||||||
| Embedded derivative – funds withheld at interest | (21,954) | (3,419,586) | ||||||||||||||||||
| Total Insurance | $ | 828,320 | $ | (656,654) | ||||||||||||||||
| Fair value included within total assets and liabilities | $ | 1,884,342 | $ | (394,288) | ||||||||||||||||
| Balance at December 31, 2016 | $ | 2,384,177 | ||
| Carried Interest Allocated as a result of Changes in Fund Fair Value | 1,224,235 | |||
| Cash Proceeds Received | (911,118 | ) | ||
| Balance at September 30, 2017 | $ | 2,697,294 | ||
| As of December 31, 2021 | Notional Value | Derivative Assets | Derivative Liabilities | ||||||||||||||
| Asset Management | |||||||||||||||||
| Foreign Exchange Contracts and Options | $ | 12,822,521 | $ | 590,637 | $ | 319,511 | |||||||||||
| Other Derivatives | 505,725 | 491 | 45,003 | ||||||||||||||
| Total Asset Management | $ | 591,128 | $ | 364,514 | |||||||||||||
| Insurance | |||||||||||||||||
| Equity market contracts | $ | 31,294,053 | $ | 1,216,843 | $ | 186,754 | |||||||||||
| Interest rate contracts | 16,692,035 | 198,658 | 101,245 | ||||||||||||||
| Foreign currency contracts | 1,517,434 | 32,464 | 7,639 | ||||||||||||||
| Credit risk contracts | 107,754 | — | 1,540 | ||||||||||||||
Impact of netting(1) | (152,015) | (152,015) | |||||||||||||||
| Fair value included within derivative assets and derivative liabilities | 1,295,950 | 145,163 | |||||||||||||||
| Embedded derivative – indexed universal life products | — | 557,276 | |||||||||||||||
| Embedded derivative – annuity products | — | 1,983,949 | |||||||||||||||
| Fair value included within policy liabilities | — | 2,541,225 | |||||||||||||||
| Embedded derivative – funds withheld at interest | 31,740 | (49,491) | |||||||||||||||
| Total Insurance | $ | 1,327,690 | $ | 2,636,897 | |||||||||||||
| Fair value included within total assets and liabilities | $ | 1,918,818 | $ | 3,001,411 | |||||||||||||
| Derivative contracts not designated as hedges | Three Months Ended September 30, | Nine Months Ended September 30, | |||||||||||||||||||||
| 2022 | 2021 | 2022 | 2021 | ||||||||||||||||||||
| Asset Management | |||||||||||||||||||||||
| Net Gains (Losses) from Investment Activities: | |||||||||||||||||||||||
| Foreign Exchange Contracts and Options | $ | 593,766 | $ | 321,139 | 817,531 | $ | 252,303 | ||||||||||||||||
| Other Derivatives | 4,782 | (11,110) | 30,488 | (41,571) | |||||||||||||||||||
| Total included in Net Gains (Losses) from Investment Activities | $ | 598,548 | $ | 310,029 | $ | 848,019 | $ | 210,732 | |||||||||||||||
| Insurance | |||||||||||||||||||||||
| Net investment-related gains (losses): | |||||||||||||||||||||||
| Funds withheld receivable embedded derivatives | $ | 3,211 | $ | (10,001) | $ | (64,130) | $ | 68,449 | |||||||||||||||
| Funds withheld payable embedded derivatives | 836,395 | 103,971 | 3,380,530 | 48,799 | |||||||||||||||||||
| Equity index options | (156,561) | (25,854) | (884,786) | 275,035 | |||||||||||||||||||
| Equity future contracts | 37,247 | 1,783 | 199,432 | (171,982) | |||||||||||||||||||
| Interest rate contracts and other | (107,494) | (24,135) | (331,395) | (149,274) | |||||||||||||||||||
| Credit risk contracts | 370 | (196) | 705 | (254) | |||||||||||||||||||
| Total included in net investment-related gains (losses) | $ | 613,168 | $ | 45,568 | $ | 2,300,356 | $ | 70,773 | |||||||||||||||
| Derivative contracts designated as hedges | Three Months Ended September 30, | Nine Months Ended September 30, | |||||||||||||||||||||
| 2022 | 2021 | 2022 | 2021 | ||||||||||||||||||||
| Insurance | |||||||||||||||||||||||
| Revenues | |||||||||||||||||||||||
| Net investment-related gains (losses): | |||||||||||||||||||||||
| Foreign currency forwards | $ | 42,136 | $ | (4,776) | $ | 70,048 | $ | (675) | |||||||||||||||
| Total included in net investment-related gains (losses) | $ | 42,136 | $ | (4,776) | $ | 70,048 | $ | (675) | |||||||||||||||
| Expenses | |||||||||||||||||||||||
| Net policy benefits and claims: | |||||||||||||||||||||||
| Interest rate swaps | $ | (171,447) | $ | 74 | $ | (426,794) | $ | (6,552) | |||||||||||||||
| Total included in net policy benefits and claims | $ | (171,447) | $ | 74 | $ | (426,794) | $ | (6,552) | |||||||||||||||
| Interest expense: | |||||||||||||||||||||||
| Interest rate swaps | $ | (62,413) | $ | (7,923) | $ | (180,087) | $ | (14,307) | |||||||||||||||
| Total included in interest expense | $ | (62,413) | $ | (7,923) | $ | (180,087) | $ | (14,307) | |||||||||||||||
| As of September 30, 2022 | Gross amount recognized | Gross amounts offset in the statements of financial position(1) | Net amounts presented in the statements of financial condition | Collateral (received) / pledged | Net amount after collateral | ||||||||||||||||||||||||
| Derivative assets (excluding embedded derivatives) | $ | 1,124,077 | $ | (273,803) | $ | 850,274 | $ | (429,796) | $ | 420,478 | |||||||||||||||||||
| Derivative liabilities (excluding embedded derivatives) | $ | 1,248,032 | $ | (273,803) | $ | 974,229 | $ | 255,108 | $ | 719,121 | |||||||||||||||||||
| As of December 31, 2021 | Gross amount recognized | Gross amounts offset in the statements of financial position(1) | Net amounts presented in the statements of financial condition | Collateral (received) / pledged | Net amount after collateral | ||||||||||||||||||||||||
| Derivative assets (excluding embedded derivatives) | $ | 1,447,965 | $ | (152,015) | $ | 1,295,950 | $ | (1,086,061) | $ | 209,889 | |||||||||||||||||||
| Derivative liabilities (excluding embedded derivatives) | $ | 297,178 | $ | (152,015) | $ | 145,163 | $ | 49,860 | $ | 95,303 | |||||||||||||||||||
| September 30, 2022 | |||||||||||||||||||||||
| Level I | Level II | Level III | Total | ||||||||||||||||||||
| Asset Management | |||||||||||||||||||||||
| Private Equity | $ | 1,299,454 | $ | 169,993 | $ | 25,073,296 | $ | 26,542,743 | |||||||||||||||
| Credit | 89,638 | 1,997,745 | 5,444,839 | 7,532,222 | |||||||||||||||||||
| Investments of Consolidated CFEs | — | 21,500,342 | — | 21,500,342 | |||||||||||||||||||
| Real Assets | — | 1,073,537 | 15,586,048 | 16,659,585 | |||||||||||||||||||
| Equity Method - Other | 454,611 | 891,076 | 1,561,621 | 2,907,308 | |||||||||||||||||||
| Other Investments | 422,335 | 47,711 | 3,133,423 | 3,603,469 | |||||||||||||||||||
| Total Investments | $ | 2,266,038 | $ | 25,680,404 | $ | 50,799,227 | $ | 78,745,669 | |||||||||||||||
| Foreign Exchange Contracts and Options | — | 1,016,135 | — | 1,016,135 | |||||||||||||||||||
| Other Derivatives | 266 | 26,371 | 13,250 | 39,887 | |||||||||||||||||||
| Total Assets at Fair Value - Asset Management | $ | 2,266,304 | $ | 26,722,910 | $ | 50,812,477 | $ | 79,801,691 | |||||||||||||||
| Insurance | |||||||||||||||||||||||
| AFS fixed maturity securities: | |||||||||||||||||||||||
| U.S. government and agencies | $ | 212,032 | $ | 82,765 | $ | — | $ | 294,797 | |||||||||||||||
| U.S. state, municipal and political subdivisions | — | 4,027,040 | — | 4,027,040 | |||||||||||||||||||
| Corporate | — | 24,827,591 | 7,977,902 | 32,805,493 | |||||||||||||||||||
| Structured securities | — | 20,018,218 | 1,402,303 | 21,420,521 | |||||||||||||||||||
| Total AFS fixed maturity securities | $ | 212,032 | $ | 48,955,614 | $ | 9,380,205 | $ | 58,547,851 | |||||||||||||||
| Trading fixed maturity securities: | |||||||||||||||||||||||
| U.S. government and agencies | $ | 157,936 | $ | 57,510 | $ | — | $ | 215,446 | |||||||||||||||
| U.S. state, municipal and political subdivisions | — | 525,889 | — | 525,889 | |||||||||||||||||||
| Corporate | — | 5,568,632 | 633,147 | 6,201,779 | |||||||||||||||||||
| Structured securities | — | 2,760,029 | 543,891 | 3,303,920 | |||||||||||||||||||
| Total trading fixed maturity securities | $ | 157,936 | $ | 8,912,060 | $ | 1,177,038 | $ | 10,247,034 | |||||||||||||||
| Equity securities | 2,607 | — | 17,315 | 19,922 | |||||||||||||||||||
Mortgage and other loan receivables(2) | — | — | 870,475 | 870,475 | |||||||||||||||||||
Other investments(3) | — | — | 4,253,873 | 4,253,873 | |||||||||||||||||||
| Funds withheld receivable at interest | — | — | (21,954) | (21,954) | |||||||||||||||||||
| Reinsurance recoverable | — | — | 1,069,497 | 1,069,497 | |||||||||||||||||||
| Derivative assets: | |||||||||||||||||||||||
| Equity market contracts | 90,387 | 489,531 | — | 579,918 | |||||||||||||||||||
| Interest rate contracts | 12,287 | 158,115 | — | 170,402 | |||||||||||||||||||
| Foreign currency contracts | — | 373,757 | — | 373,757 | |||||||||||||||||||
Impact of netting(4) | (51,954) | (221,849) | — | (273,803) | |||||||||||||||||||
| Total derivative assets | $ | 50,720 | $ | 799,554 | $ | — | $ | 850,274 | |||||||||||||||
| Separate account assets | 4,052,251 | — | — | 4,052,251 | |||||||||||||||||||
| Total Assets at Fair Value - Insurance | $ | 4,475,546 | $ | 58,667,228 | $ | 16,746,449 | $ | 79,889,223 | |||||||||||||||
| Total Assets at Fair Value | $ | 6,741,850 | $ | 85,390,138 | $ | 67,558,926 | $ | 159,690,914 | |||||||||||||||
| December 31, 2021 | ||||||||||||||||||||||||||||||||||||||
| September 30, 2017 | Level I | Level II | Level III | Total | ||||||||||||||||||||||||||||||||||
| Level I | Level II | Level III | Total | |||||||||||||||||||||||||||||||||||
| Asset Management | Asset Management | |||||||||||||||||||||||||||||||||||||
| Private Equity | $ | 1,194,887 | $ | 93,524 | $ | 2,608,124 | $ | 3,896,535 | Private Equity | $ | 2,044,380 | $ | 318,736 | $ | 23,322,634 | $ | 25,685,750 | |||||||||||||||||||||
| Credit | — | 1,694,761 | 4,732,874 | 6,427,635 | Credit | — | 2,122,912 | 5,826,661 | 7,949,573 | |||||||||||||||||||||||||||||
| Investments of Consolidated CFEs | — | 10,090,782 | 5,410,116 | 15,500,898 | Investments of Consolidated CFEs | — | 22,076,809 | — | 22,076,809 | |||||||||||||||||||||||||||||
| Real Assets | 36,751 | 39,948 | 2,202,000 | 2,278,699 | Real Assets | — | 1,111,219 | 11,389,530 | 12,500,749 | |||||||||||||||||||||||||||||
| Equity Method | — | 205,460 | 555,538 | 760,998 | ||||||||||||||||||||||||||||||||||
| Other | 1,117,473 | 38,511 | 1,770,011 | 2,925,995 | ||||||||||||||||||||||||||||||||||
| Total | 2,349,111 | 12,162,986 | 17,278,663 | 31,790,760 | ||||||||||||||||||||||||||||||||||
| Equity Method - Other | Equity Method - Other | 482,061 | 105,647 | 1,013,807 | 1,601,515 | |||||||||||||||||||||||||||||||||
| Other Investments | Other Investments | 759,002 | 146,081 | 3,240,013 | 4,145,096 | |||||||||||||||||||||||||||||||||
| Total Investments | Total Investments | $ | 3,285,443 | $ | 25,881,404 | $ | 44,792,645 | $ | 73,959,492 | |||||||||||||||||||||||||||||
| Foreign Exchange Contracts and Options | — | 100,460 | — | 100,460 | Foreign Exchange Contracts and Options | — | 590,637 | — | 590,637 | |||||||||||||||||||||||||||||
| Other Derivatives | — | 7,020 | 55,877 | (1) | 62,897 | Other Derivatives | — | 12 | 479 | (1) | 491 | |||||||||||||||||||||||||||
| Total Assets | $ | 2,349,111 | $ | 12,270,466 | $ | 17,334,540 | $ | 31,954,117 | ||||||||||||||||||||||||||||||
| Total Assets at Fair Value - Asset Management | Total Assets at Fair Value - Asset Management | $ | 3,285,443 | $ | 26,472,053 | $ | 44,793,124 | $ | 74,550,620 | |||||||||||||||||||||||||||||
| Insurance | Insurance | |||||||||||||||||||||||||||||||||||||
| AFS fixed maturity securities: | AFS fixed maturity securities: | |||||||||||||||||||||||||||||||||||||
| U.S. government and agencies | U.S. government and agencies | $ | 500,325 | $ | 284,222 | $ | — | $ | 784,547 | |||||||||||||||||||||||||||||
| U.S. state, municipal and political subdivisions | U.S. state, municipal and political subdivisions | — | 5,109,697 | — | 5,109,697 | |||||||||||||||||||||||||||||||||
| Corporate | Corporate | — | 33,281,727 | 7,650,660 | 40,932,387 | |||||||||||||||||||||||||||||||||
| Structured securities | Structured securities | — | 21,215,854 | 828,401 | 22,044,255 | |||||||||||||||||||||||||||||||||
| Total AFS fixed maturity securities | Total AFS fixed maturity securities | $ | 500,325 | $ | 59,891,500 | $ | 8,479,061 | $ | 68,870,886 | |||||||||||||||||||||||||||||
| Trading fixed maturity securities: | Trading fixed maturity securities: | |||||||||||||||||||||||||||||||||||||
| U.S. government and agencies | U.S. government and agencies | $ | 371,366 | $ | 252,266 | $ | — | $ | 623,632 | |||||||||||||||||||||||||||||
| U.S. state, municipal and political subdivisions | U.S. state, municipal and political subdivisions | — | 879,463 | — | 879,463 | |||||||||||||||||||||||||||||||||
| Corporate | Corporate | — | 8,486,922 | 565,025 | 9,051,947 | |||||||||||||||||||||||||||||||||
| Structured securities | Structured securities | — | 2,779,757 | 418,774 | 3,198,531 | |||||||||||||||||||||||||||||||||
| Total trading fixed maturity securities | Total trading fixed maturity securities | $ | 371,366 | $ | 12,398,408 | $ | 983,799 | $ | 13,753,573 | |||||||||||||||||||||||||||||
| Equity securities | Equity securities | 256,196 | — | 32,937 | 289,133 | |||||||||||||||||||||||||||||||||
Mortgage and other loan receivables(2) | Mortgage and other loan receivables(2) | — | — | 832,674 | 832,674 | |||||||||||||||||||||||||||||||||
Other investments(3) | Other investments(3) | — | — | 1,603,345 | 1,603,345 | |||||||||||||||||||||||||||||||||
| Funds withheld receivable at interest | Funds withheld receivable at interest | — | — | 31,740 | 31,740 | |||||||||||||||||||||||||||||||||
| Reinsurance recoverable | Reinsurance recoverable | — | — | 1,293,791 | 1,293,791 | |||||||||||||||||||||||||||||||||
| Derivative assets: | Derivative assets: | |||||||||||||||||||||||||||||||||||||
| Equity market contracts | Equity market contracts | 66,510 | 1,150,333 | — | 1,216,843 | |||||||||||||||||||||||||||||||||
| Interest rate contracts | Interest rate contracts | 44,472 | 154,186 | — | 198,658 | |||||||||||||||||||||||||||||||||
| Foreign currency contracts | Foreign currency contracts | — | 32,464 | — | 32,464 | |||||||||||||||||||||||||||||||||
Impact of netting(4) | Impact of netting(4) | (25,588) | (126,427) | — | (152,015) | |||||||||||||||||||||||||||||||||
| Total derivative assets | Total derivative assets | $ | 85,394 | $ | 1,210,556 | $ | — | $ | 1,295,950 | |||||||||||||||||||||||||||||
| Separate account assets | Separate account assets | 5,586,428 | — | — | 5,586,428 | |||||||||||||||||||||||||||||||||
| Total Assets at Fair Value - Insurance | Total Assets at Fair Value - Insurance | $ | 6,799,709 | $ | 73,500,464 | $ | 13,257,347 | $ | 93,557,520 | |||||||||||||||||||||||||||||
| Total Assets at Fair Value | Total Assets at Fair Value | $ | 10,085,152 | $ | 99,972,517 | $ | 58,050,471 | $ | 168,108,140 | |||||||||||||||||||||||||||||
| December 31, 2016 | |||||||||||||||
| Level I | Level II | Level III | Total | ||||||||||||
| Private Equity | $ | 1,240,108 | $ | 116,000 | $ | 1,559,559 | $ | 2,915,667 | |||||||
| Credit | — | 1,557,575 | 3,290,361 | 4,847,936 | |||||||||||
| Investments of Consolidated CFEs | — | 8,544,677 | 5,406,220 | 13,950,897 | |||||||||||
| Real Assets | — | — | 1,807,128 | 1,807,128 | |||||||||||
| Equity Method | — | 220,896 | 570,522 | 791,418 | |||||||||||
| Other | 994,677 | 12,715 | 1,767,573 | 2,774,965 | |||||||||||
| Total | 2,234,785 | 10,451,863 | 14,401,363 | 27,088,011 | |||||||||||
| Foreign Exchange Contracts and Options | — | 240,627 | — | 240,627 | |||||||||||
| Other Derivatives | — | 81,593 | — | 81,593 | |||||||||||
| Total Assets | $ | 2,234,785 | $ | 10,774,083 | $ | 14,401,363 | $ | 27,410,231 | |||||||
| September 30, 2022 | |||||||||||||||||||||||
| Level I | Level II | Level III | Total | ||||||||||||||||||||
| Asset Management | |||||||||||||||||||||||
| Securities Sold Short | $ | 87,894 | $ | — | $ | — | $ | 87,894 | |||||||||||||||
| Foreign Exchange Contracts and Options | — | 242,117 | — | 242,117 | |||||||||||||||||||
| Unfunded Revolver Commitments | — | — | 108,195 | (1) | 108,195 | ||||||||||||||||||
| Other Derivatives | — | 20,249 | — | 20,249 | |||||||||||||||||||
| Debt Obligations of Consolidated CFEs | — | 21,118,566 | — | 21,118,566 | |||||||||||||||||||
| Total Liabilities at Fair Value - Asset Management | $ | 87,894 | $ | 21,380,932 | $ | 108,195 | $ | 21,577,021 | |||||||||||||||
| Insurance | |||||||||||||||||||||||
| Policy liabilities | $ | — | $ | — | $ | 417,863 | $ | 417,863 | |||||||||||||||
| Closed block policy liabilities | — | — | 1,096,478 | 1,096,478 | |||||||||||||||||||
| Funds withheld payable at interest | — | — | (3,419,586) | (3,419,586) | |||||||||||||||||||
| Derivative instruments payable: | |||||||||||||||||||||||
| Equity market contracts | 95,111 | 121,995 | — | 217,106 | |||||||||||||||||||
| Interest rate contracts | 18,025 | 917,360 | — | 935,385 | |||||||||||||||||||
| Foreign currency contracts | — | 95,233 | — | 95,233 | |||||||||||||||||||
| Credit contracts | — | 308 | — | 308 | |||||||||||||||||||
Impact of netting(2) | (51,954) | (221,849) | — | (273,803) | |||||||||||||||||||
| Total derivative instruments payable | 61,182 | 913,047 | — | 974,229 | |||||||||||||||||||
| Embedded derivative – indexed universal life products | — | — | 315,889 | 315,889 | |||||||||||||||||||
| Embedded derivative – annuity products | — | — | 1,472,814 | 1,472,814 | |||||||||||||||||||
| Total Liabilities at Fair Value - Insurance | $ | 61,182 | $ | 913,047 | $ | (116,542) | $ | 857,687 | |||||||||||||||
| Total Liabilities at Fair Value | $ | 149,076 | $ | 22,293,979 | $ | (8,347) | $ | 22,434,708 | |||||||||||||||
| December 31, 2021 | ||||||||||||||||||||||||||||||||||||||
| September 30, 2017 | Level I | Level II | Level III | Total | ||||||||||||||||||||||||||||||||||
| Level I | Level II | Level III | Total | |||||||||||||||||||||||||||||||||||
| Asset Management | Asset Management | |||||||||||||||||||||||||||||||||||||
| Securities Sold Short | $ | 810,698 | $ | — | $ | — | $ | 810,698 | Securities Sold Short | $ | 249,383 | $ | — | $ | — | $ | 249,383 | |||||||||||||||||||||
| Foreign Exchange Contracts and Options | — | 243,595 | — | 243,595 | Foreign Exchange Contracts and Options | — | 319,511 | — | 319,511 | |||||||||||||||||||||||||||||
| Unfunded Revolver Commitments | — | — | 13,912 | (1) | 13,912 | Unfunded Revolver Commitments | — | — | 64,276 | (1) | 64,276 | |||||||||||||||||||||||||||
| Other Derivatives | — | 28,421 | 50,400 | (2) | 78,821 | Other Derivatives | — | 45,003 | — | 45,003 | ||||||||||||||||||||||||||||
| Debt Obligations of Consolidated CFEs | — | 9,788,717 | 5,295,183 | 15,083,900 | Debt Obligations of Consolidated CFEs | — | 21,271,084 | — | 21,271,084 | |||||||||||||||||||||||||||||
| Total Liabilities | $ | 810,698 | $ | 10,060,733 | $ | 5,359,495 | $ | 16,230,926 | ||||||||||||||||||||||||||||||
| Total Liabilities at Fair Value - Asset Management | Total Liabilities at Fair Value - Asset Management | $ | 249,383 | $ | 21,635,598 | $ | 64,276 | $ | 21,949,257 | |||||||||||||||||||||||||||||
| Insurance | Insurance | |||||||||||||||||||||||||||||||||||||
| Policy liabilities | Policy liabilities | $ | — | $ | — | $ | 519,454 | $ | 519,454 | |||||||||||||||||||||||||||||
| Closed block policy liabilities | Closed block policy liabilities | — | — | 1,350,224 | 1,350,224 | |||||||||||||||||||||||||||||||||
| Funds withheld payable at interest | Funds withheld payable at interest | — | — | (49,491) | (49,491) | |||||||||||||||||||||||||||||||||
| Derivative instruments payable: | Derivative instruments payable: | |||||||||||||||||||||||||||||||||||||
| Equity market contracts | Equity market contracts | 33,933 | 152,821 | — | 186,754 | |||||||||||||||||||||||||||||||||
| Interest rate contracts | Interest rate contracts | 14,009 | 87,236 | — | 101,245 | |||||||||||||||||||||||||||||||||
| Foreign currency contracts | Foreign currency contracts | — | 7,639 | — | 7,639 | |||||||||||||||||||||||||||||||||
| Credit contracts | Credit contracts | — | 1,540 | — | 1,540 | |||||||||||||||||||||||||||||||||
Impact of netting(2) | Impact of netting(2) | (25,588) | (126,427) | — | (152,015) | |||||||||||||||||||||||||||||||||
| Total derivative instruments payable | Total derivative instruments payable | 22,354 | 122,809 | — | 145,163 | |||||||||||||||||||||||||||||||||
| Embedded derivative – indexed universal life products | Embedded derivative – indexed universal life products | — | — | 557,276 | 557,276 | |||||||||||||||||||||||||||||||||
| Embedded derivative – annuity products | Embedded derivative – annuity products | — | — | 1,983,949 | 1,983,949 | |||||||||||||||||||||||||||||||||
| Total Liabilities at Fair Value - Insurance | Total Liabilities at Fair Value - Insurance | $ | 22,354 | $ | 122,809 | $ | 4,361,412 | $ | 4,506,575 | |||||||||||||||||||||||||||||
| Total Liabilities at Fair Value | Total Liabilities at Fair Value | $ | 271,737 | $ | 21,758,407 | $ | 4,425,688 | $ | 26,455,832 | |||||||||||||||||||||||||||||
| December 31, 2016 | |||||||||||||||
| Level I | Level II | Level III | Total | ||||||||||||
| Securities Sold Short | $ | 644,196 | $ | 3,038 | $ | — | $ | 647,234 | |||||||
| Foreign Exchange Contracts and Options | — | 75,218 | — | 75,218 | |||||||||||
| Unfunded Revolver Commitments | — | 9,023 | — | 9,023 | |||||||||||
| Other Derivatives | — | 44,015 | 56,000 | (2) | 100,015 | ||||||||||
| Debt Obligations of Consolidated CFEs | — | 8,563,547 | 5,294,741 | 13,858,288 | |||||||||||
| Total Liabilities | $ | 644,196 | $ | 8,694,841 | $ | 5,350,741 | $ | 14,689,778 | |||||||
| Three Months Ended September 30, 2022 | ||||||||||||||||||||||||||||||||||||||||||||||||||||||||||||||
| Balance, Beg. of Period | Transfers In / (Out) - Changes in Consolidation | Transfers In | Transfers Out | Net Purchases/Issuances/Sales/Settlements | Net Unrealized and Realized Gains (Losses) | Change in OCI | Balance, End of Period | Changes in Net Unrealized Gains (Losses) Included in Earnings related to Level III Assets and Liabilities still held as of the Reporting Date | Changes in Net Unrealized Gains (Losses) Included in OCI related to Level III Assets and Liabilities still held as of the Reporting Date | |||||||||||||||||||||||||||||||||||||||||||||||||||||
| Assets | ||||||||||||||||||||||||||||||||||||||||||||||||||||||||||||||
| Asset Management | ||||||||||||||||||||||||||||||||||||||||||||||||||||||||||||||
| Private Equity | $ | 22,918,721 | $ | (49,000) | $ | — | $ | — | $ | 2,251,233 | $ | (47,658) | $ | — | $ | 25,073,296 | $ | (180,571) | $ | — | ||||||||||||||||||||||||||||||||||||||||||
| Credit | 4,927,912 | 34,245 | — | (554) | 682,518 | (199,282) | — | 5,444,839 | (199,923) | — | ||||||||||||||||||||||||||||||||||||||||||||||||||||
| Real Assets | 15,951,741 | — | — | — | (14,403) | (351,290) | — | 15,586,048 | (452,358) | — | ||||||||||||||||||||||||||||||||||||||||||||||||||||
| Equity Method - Other | 1,474,357 | 156,183 | — | — | (656) | (68,263) | — | 1,561,621 | (68,229) | — | ||||||||||||||||||||||||||||||||||||||||||||||||||||
| Other Investments | 2,934,772 | 513,875 | — | (492) | (55,787) | (258,945) | — | 3,133,423 | (253,841) | — | ||||||||||||||||||||||||||||||||||||||||||||||||||||
| Other Derivatives | 41,939 | — | — | — | (33,907) | 5,218 | — | 13,250 | 729 | — | ||||||||||||||||||||||||||||||||||||||||||||||||||||
| Total Assets - Asset Management | $ | 48,249,442 | $ | 655,303 | $ | — | $ | (1,046) | $ | 2,828,998 | $ | (920,220) | $ | — | $ | 50,812,477 | $ | (1,154,193) | $ | — | ||||||||||||||||||||||||||||||||||||||||||
| Insurance | ||||||||||||||||||||||||||||||||||||||||||||||||||||||||||||||
| AFS fixed maturity securities: | ||||||||||||||||||||||||||||||||||||||||||||||||||||||||||||||
| Corporate fixed maturity securities | $ | 8,043,069 | $ | — | $ | — | $ | (23,071) | $ | 126,232 | $ | (103,994) | $ | (64,334) | $ | 7,977,902 | $ | — | $ | (80,146) | ||||||||||||||||||||||||||||||||||||||||||
| Structured securities | 1,283,879 | — | — | — | 150,387 | 4,007 | (35,970) | 1,402,303 | — | (35,910) | ||||||||||||||||||||||||||||||||||||||||||||||||||||
| Total AFS fixed maturity securities | 9,326,948 | — | — | (23,071) | 276,619 | (99,987) | (100,304) | 9,380,205 | — | (116,056) | ||||||||||||||||||||||||||||||||||||||||||||||||||||
| Trading fixed maturity securities: | ||||||||||||||||||||||||||||||||||||||||||||||||||||||||||||||
| Corporate fixed maturity securities | 667,014 | — | — | — | (6,766) | (27,101) | — | 633,147 | (26,661) | — | ||||||||||||||||||||||||||||||||||||||||||||||||||||
| Structured securities | 579,701 | — | 9,900 | (6,521) | (9,734) | (29,455) | — | 543,891 | (29,185) | — | ||||||||||||||||||||||||||||||||||||||||||||||||||||
| Total trading fixed maturity securities | 1,246,715 | — | 9,900 | (6,521) | (16,500) | (56,556) | — | 1,177,038 | (55,846) | — | ||||||||||||||||||||||||||||||||||||||||||||||||||||
| Equity securities | 17,317 | — | — | — | — | (2) | — | 17,315 | (2) | — | ||||||||||||||||||||||||||||||||||||||||||||||||||||
| Mortgage and other loan receivables | 905,663 | — | — | — | (17,532) | (17,656) | — | 870,475 | (17,258) | — | ||||||||||||||||||||||||||||||||||||||||||||||||||||
| Other investments | 4,011,106 | — | — | — | 281,471 | (38,704) | — | 4,253,873 | (39,632) | — | ||||||||||||||||||||||||||||||||||||||||||||||||||||
| Funds withheld receivable at interest | (25,166) | — | — | — | — | 3,212 | — | (21,954) | — | — | ||||||||||||||||||||||||||||||||||||||||||||||||||||
| Reinsurance recoverable | 1,103,684 | — | — | — | (3,626) | (30,561) | — | 1,069,497 | — | — | ||||||||||||||||||||||||||||||||||||||||||||||||||||
| Total Assets - Insurance | $ | 16,586,267 | $ | — | $ | 9,900 | $ | (29,592) | $ | 520,432 | $ | (240,254) | $ | (100,304) | $ | 16,746,449 | $ | (112,738) | $ | (116,056) | ||||||||||||||||||||||||||||||||||||||||||
| Total | $ | 64,835,709 | $ | 655,303 | $ | 9,900 | $ | (30,638) | $ | 3,349,430 | $ | (1,160,474) | $ | (100,304) | $ | 67,558,926 | $ | (1,266,931) | $ | (116,056) | ||||||||||||||||||||||||||||||||||||||||||
| Three Months Ended September 30, 2017 | |||||||||||||||||||||||||||||||
| Level III Investments | Level III Debt Obligations | ||||||||||||||||||||||||||||||
Private Equity | Credit | Investments of Consolidated CFEs | Real Assets | Equity Method | Other | Total | Debt Obligations of Consolidated CFEs | ||||||||||||||||||||||||
| Balance, Beg. of Period | $ | 2,394,498 | $ | 3,865,070 | $ | 5,447,250 | $ | 2,423,419 | $ | 571,575 | $ | 1,771,627 | $ | 16,473,439 | $ | 5,333,203 | |||||||||||||||
| Transfers Out Due to Deconsolidation of Funds | — | — | — | — | — | — | — | — | |||||||||||||||||||||||
| Transfers In | — | — | — | — | — | — | — | — | |||||||||||||||||||||||
| Transfers Out | — | (4,187 | ) | — | — | — | — | (4,187 | ) | — | |||||||||||||||||||||
| Asset Purchases / Debt Issuances | 98,955 | 1,112,297 | — | 62,453 | 4,457 | 35,700 | 1,313,862 | — | |||||||||||||||||||||||
| Sales / Paydowns | (56,193 | ) | (224,135 | ) | (17,022 | ) | (361,451 | ) | (28,864 | ) | (45,887 | ) | (733,552 | ) | — | ||||||||||||||||
| Settlements | — | 27,528 | — | — | — | — | 27,528 | (17,022 | ) | ||||||||||||||||||||||
| Net Realized Gains (Losses) | 7,182 | (6,896 | ) | — | 24,479 | 6,282 | (29,943 | ) | 1,104 | — | |||||||||||||||||||||
| Net Unrealized Gains (Losses) | 163,682 | (27,876 | ) | (20,112 | ) | 53,100 | 2,088 | 38,514 | 209,396 | (20,998 | ) | ||||||||||||||||||||
| Change in Other Comprehensive Income | — | (8,927 | ) | — | — | — | — | (8,927 | ) | — | |||||||||||||||||||||
| Balance, End of Period | $ | 2,608,124 | $ | 4,732,874 | $ | 5,410,116 | $ | 2,202,000 | $ | 555,538 | $ | 1,770,011 | $ | 17,278,663 | $ | 5,295,183 | |||||||||||||||
| Changes in Net Unrealized Gains (Losses) Included in Net Gains (Losses) from Investment Activities related to Level III Assets and Liabilities still held as of the Reporting Date | $ | 163,682 | $ | (40,131 | ) | $ | (20,112 | ) | $ | 68,239 | $ | 5,225 | $ | 38,514 | $ | 215,417 | $ | (20,998 | ) | ||||||||||||
| Nine Months Ended September 30, 2022 | ||||||||||||||||||||||||||||||||||||||||||||||||||||||||||||||
| Balance, Beg. of Period | Transfers In / (Out) - Changes in Consolidation | Transfers In | Transfers Out | Net Purchases/Issuances/Sales/Settlements | Net Unrealized and Realized Gains (Losses) | Change in OCI | Balance, End of Period | Changes in Net Unrealized Gains (Losses) Included in Earnings related to Level III Assets and Liabilities still held as of the Reporting Date | Changes in Net Unrealized Gains (Losses) Included in OCI related to Level III Assets and Liabilities still held as of the Reporting Date | |||||||||||||||||||||||||||||||||||||||||||||||||||||
| Assets | ||||||||||||||||||||||||||||||||||||||||||||||||||||||||||||||
| Asset Management | ||||||||||||||||||||||||||||||||||||||||||||||||||||||||||||||
| Private Equity | $ | 23,322,634 | $ | (49,000) | $ | — | $ | (138,220) | $ | 2,929,393 | $ | (991,511) | $ | — | $ | 25,073,296 | $ | (1,307,533) | $ | — | ||||||||||||||||||||||||||||||||||||||||||
| Credit | 5,826,661 | 34,245 | — | (88,646) | 124,050 | (447,003) | (4,468) | 5,444,839 | (374,990) | — | ||||||||||||||||||||||||||||||||||||||||||||||||||||
| Real Assets | 11,389,530 | — | — | — | 3,080,113 | 1,116,405 | — | 15,586,048 | 725,446 | — | ||||||||||||||||||||||||||||||||||||||||||||||||||||
| Equity Method - Other | 1,013,807 | 156,183 | — | — | 605,485 | (213,854) | — | 1,561,621 | (215,037) | — | ||||||||||||||||||||||||||||||||||||||||||||||||||||
| Other Investments | 3,240,013 | 513,875 | — | (839) | (125,702) | (493,924) | — | 3,133,423 | (468,891) | — | ||||||||||||||||||||||||||||||||||||||||||||||||||||
| Other Derivatives | 479 | — | — | — | 21,800 | (9,029) | — | 13,250 | (8,901) | — | ||||||||||||||||||||||||||||||||||||||||||||||||||||
| Total Assets - Asset Management | $ | 44,793,124 | $ | 655,303 | $ | — | $ | (227,705) | $ | 6,635,139 | $ | (1,038,916) | $ | (4,468) | $ | 50,812,477 | $ | (1,649,906) | $ | — | ||||||||||||||||||||||||||||||||||||||||||
| Insurance | ||||||||||||||||||||||||||||||||||||||||||||||||||||||||||||||
| AFS fixed maturity securities: | ||||||||||||||||||||||||||||||||||||||||||||||||||||||||||||||
| Corporate fixed maturity securities | $ | 7,652,134 | $ | — | $ | — | $ | (88,076) | $ | 874,870 | $ | (168,704) | $ | (292,322) | $ | 7,977,902 | $ | — | $ | (271,515) | ||||||||||||||||||||||||||||||||||||||||||
| Structured securities | 828,381 | — | 343,338 | — | 336,316 | (5,347) | (100,385) | 1,402,303 | — | (110,257) | ||||||||||||||||||||||||||||||||||||||||||||||||||||
| Total AFS fixed maturity securities | 8,480,515 | — | 343,338 | (88,076) | 1,211,186 | (174,051) | (392,707) | 9,380,205 | — | (381,772) | ||||||||||||||||||||||||||||||||||||||||||||||||||||
| Trading fixed maturity securities: | ||||||||||||||||||||||||||||||||||||||||||||||||||||||||||||||
| Corporate fixed maturity securities | 565,354 | — | — | (44,274) | 187,661 | (75,594) | — | 633,147 | (73,050) | — | ||||||||||||||||||||||||||||||||||||||||||||||||||||
| Structured securities | 418,774 | — | 115,882 | (31,741) | 112,313 | (71,337) | — | 543,891 | (71,865) | — | ||||||||||||||||||||||||||||||||||||||||||||||||||||
| Total trading fixed maturity securities | 984,128 | — | 115,882 | (76,015) | 299,974 | (146,931) | — | 1,177,038 | (144,915) | — | ||||||||||||||||||||||||||||||||||||||||||||||||||||
| Equity securities | 32,937 | — | — | — | — | (15,622) | — | 17,315 | (15,622) | — | ||||||||||||||||||||||||||||||||||||||||||||||||||||
| Mortgage and other loan receivables | 832,674 | — | — | — | 110,878 | (73,077) | — | 870,475 | (62,650) | — | ||||||||||||||||||||||||||||||||||||||||||||||||||||
| Other investments | 1,603,345 | — | — | — | 2,569,112 | 81,416 | — | 4,253,873 | 32,580 | — | ||||||||||||||||||||||||||||||||||||||||||||||||||||
| Funds withheld receivable at interest | 31,740 | — | — | — | 10,435 | (64,129) | — | (21,954) | — | — | ||||||||||||||||||||||||||||||||||||||||||||||||||||
| Reinsurance recoverable | 1,293,791 | — | — | — | (16,728) | (207,566) | — | 1,069,497 | — | — | ||||||||||||||||||||||||||||||||||||||||||||||||||||
| Total Assets - Insurance | $ | 13,259,130 | $ | — | $ | 459,220 | $ | (164,091) | $ | 4,184,857 | $ | (599,960) | $ | (392,707) | $ | 16,746,449 | $ | (190,607) | $ | (381,772) | ||||||||||||||||||||||||||||||||||||||||||
| Total | $ | 58,052,254 | $ | 655,303 | $ | 459,220 | $ | (391,796) | $ | 10,819,996 | $ | (1,638,876) | $ | (397,175) | $ | 67,558,926 | $ | (1,840,513) | $ | (381,772) | ||||||||||||||||||||||||||||||||||||||||||
| Three Months Ended September 30, 2016 | |||||||||||||||||||||||||||||||
| Level III Investments | Level III Debt Obligations | ||||||||||||||||||||||||||||||
Private Equity | Credit | Investments of Consolidated CFEs | Real Assets | Equity Method | Other | Total | Debt Obligations of Consolidated CFEs | ||||||||||||||||||||||||
| Balance, Beg. of Period | $ | 1,231,868 | $ | 2,672,179 | $ | 5,615,342 | $ | 1,819,709 | $ | 477,219 | $ | 1,495,697 | $ | 13,312,014 | $ | 5,506,281 | |||||||||||||||
| Transfers Out Due to Deconsolidation of Funds | — | — | — | — | — | — | — | — | |||||||||||||||||||||||
| Transfers In | — | 1,677 | — | — | — | — | 1,677 | — | |||||||||||||||||||||||
| Transfers Out | — | — | — | — | — | — | — | — | |||||||||||||||||||||||
| Asset Purchases / Debt Issuances | 253,736 | 616,041 | — | 59,963 | — | 46,233 | 975,973 | — | |||||||||||||||||||||||
| Sales / Paydowns | (43,789 | ) | (168,342 | ) | (8,993 | ) | (164,419 | ) | (725 | ) | (16,677 | ) | (402,945 | ) | — | ||||||||||||||||
| Settlements | — | 24,296 | — | — | — | — | 24,296 | (8,993 | ) | ||||||||||||||||||||||
| Net Realized Gains (Losses) | 17,386 | (518 | ) | — | 28,803 | 225 | (1,173 | ) | 44,723 | — | |||||||||||||||||||||
| Net Unrealized Gains (Losses) | 29,884 | 67,753 | (61,670 | ) | 70,700 | 28,465 | 54,798 | 189,930 | (61,697 | ) | |||||||||||||||||||||
| Change in Other Comprehensive Income | — | 5,926 | — | — | — | — | 5,926 | — | |||||||||||||||||||||||
| Balance, End of Period | $ | 1,489,085 | $ | 3,219,012 | $ | 5,544,679 | $ | 1,814,756 | $ | 505,184 | $ | 1,578,878 | $ | 14,151,594 | $ | 5,435,591 | |||||||||||||||
| Changes in Net Unrealized Gains (Losses) Included in Net Gains (Losses) from Investment Activities related to Level III Assets and Liabilities still held as of the Reporting Date | $ | 46,895 | $ | 67,140 | $ | (61,670 | ) | $ | 70,700 | $ | 28,465 | $ | 54,798 | $ | 206,328 | $ | (61,697 | ) | |||||||||||||
| Three Months Ended September 30, 2021 | |||||||||||||||||||||||||||||||||||||||||||||||||||||||||||
| Balance, Beg. of Period | Transfers In / (Out) - Changes in Consolidation | Transfers In | Transfers Out | Net Purchases/Issuances/Sales/Settlements | Net Unrealized and Realized Gains (Losses) | Change in OCI | Balance, End of Period | Changes in Net Unrealized Gains (Losses) Included in Earnings related to Level III Assets and Liabilities still held as of the Reporting Date | Changes in Net Unrealized Gains (Losses) Included in OCI related to Level III Assets and Liabilities still held as of the Reporting Date | ||||||||||||||||||||||||||||||||||||||||||||||||||
| Assets | |||||||||||||||||||||||||||||||||||||||||||||||||||||||||||
| Asset Management | |||||||||||||||||||||||||||||||||||||||||||||||||||||||||||
| Private Equity | $ | 19,023,638 | $ | — | $ | — | $ | (75,554) | $ | 1,636,915 | $ | 1,159,950 | $ | — | $ | 21,744,949 | $ | 1,094,045 | $ | — | |||||||||||||||||||||||||||||||||||||||
| Credit | 9,931,511 | — | — | — | 317,956 | (56,665) | 7,809 | 10,200,611 | (15,427) | 7,809 | |||||||||||||||||||||||||||||||||||||||||||||||||
| Real Assets | 8,717,571 | (174,658) | — | — | 2,454,477 | 635,794 | — | 11,633,184 | 609,092 | — | |||||||||||||||||||||||||||||||||||||||||||||||||
| Equity Method - Other | 1,067,844 | — | — | — | (75,143) | 16,167 | — | 1,008,868 | (22,455) | — | |||||||||||||||||||||||||||||||||||||||||||||||||
| Other Investments | 2,971,242 | — | — | — | 105,878 | 91,797 | — | 3,168,917 | 76,256 | — | |||||||||||||||||||||||||||||||||||||||||||||||||
| Other Derivatives | 1,875 | — | — | — | 13,152 | (14,984) | — | 43 | (14,984) | — | |||||||||||||||||||||||||||||||||||||||||||||||||
| Total Assets - Asset Management | $ | 41,713,681 | $ | (174,658) | $ | — | $ | (75,554) | $ | 4,453,235 | $ | 1,832,059 | $ | 7,809 | $ | 47,756,572 | $ | 1,726,527 | $ | 7,809 | |||||||||||||||||||||||||||||||||||||||
| Insurance | |||||||||||||||||||||||||||||||||||||||||||||||||||||||||||
| AFS fixed maturity securities: | |||||||||||||||||||||||||||||||||||||||||||||||||||||||||||
| Corporate fixed maturity securities | $ | 4,018,174 | $ | — | $ | 48,093 | $ | (29,400) | $ | 785,992 | $ | — | $ | 19,444 | $ | 4,842,303 | $ | — | $ | 1,236 | |||||||||||||||||||||||||||||||||||||||
| Structured securities | 175,936 | — | 16,309 | — | 2,460 | — | 2,282 | 196,987 | — | 1,682 | |||||||||||||||||||||||||||||||||||||||||||||||||
| Total AFS fixed maturity securities | 4,194,110 | — | 64,402 | (29,400) | 788,452 | — | 21,726 | 5,039,290 | — | 2,918 | |||||||||||||||||||||||||||||||||||||||||||||||||
| Trading fixed maturity securities: | |||||||||||||||||||||||||||||||||||||||||||||||||||||||||||
| Corporate fixed maturity securities | 1,009,357 | — | — | — | 368,624 | 6,984 | — | 1,384,965 | 4,926 | — | |||||||||||||||||||||||||||||||||||||||||||||||||
| Structured securities | 20,939 | — | 15,744 | — | 44,233 | 84 | — | 81,000 | 1,131 | — | |||||||||||||||||||||||||||||||||||||||||||||||||
| Total trading fixed maturity securities | 1,030,296 | — | 15,744 | — | 412,857 | 7,068 | — | 1,465,965 | 6,057 | — | |||||||||||||||||||||||||||||||||||||||||||||||||
| Equity securities | 97,029 | — | — | — | (90,855) | 22,689 | — | 28,863 | (10,074) | — | |||||||||||||||||||||||||||||||||||||||||||||||||
| Mortgage and other loan receivables | 1,224,789 | — | — | — | 58,303 | 5,386 | — | 1,288,478 | 2,047 | — | |||||||||||||||||||||||||||||||||||||||||||||||||
| Other investments | 491,635 | — | — | — | (33,619) | 337,212 | — | 795,228 | (22,496) | — | |||||||||||||||||||||||||||||||||||||||||||||||||
| Funds withheld receivable at interest | 78,450 | — | — | — | (437) | 2,480 | — | 80,493 | — | — | |||||||||||||||||||||||||||||||||||||||||||||||||
| Reinsurance recoverable | 1,288,097 | — | — | — | — | 37,390 | — | 1,325,487 | — | — | |||||||||||||||||||||||||||||||||||||||||||||||||
| Total Assets - Insurance | $ | 8,404,406 | $ | — | $ | 80,146 | $ | (29,400) | $ | 1,134,701 | $ | 412,225 | $ | 21,726 | $ | 10,023,804 | $ | (24,466) | $ | 2,918 | |||||||||||||||||||||||||||||||||||||||
| Total | $ | 50,118,087 | $ | (174,658) | $ | 80,146 | $ | (104,954) | $ | 5,587,936 | $ | 2,244,284 | $ | 29,535 | $ | 57,780,376 | $ | 1,702,061 | $ | 10,727 | |||||||||||||||||||||||||||||||||||||||
| Nine Months Ended September 30, 2017 | |||||||||||||||||||||||||||||||
| Level III Investments | Level III Debt Obligations | ||||||||||||||||||||||||||||||
Private Equity | Credit | Investments of Consolidated CFEs | Real Assets | Equity Method | Other | Total | Debt Obligations of Consolidated CFEs | ||||||||||||||||||||||||
| Balance, Beg. of Period | $ | 1,559,559 | $ | 3,290,361 | $ | 5,406,220 | $ | 1,807,128 | $ | 570,522 | $ | 1,767,573 | $ | 14,401,363 | $ | 5,294,741 | |||||||||||||||
| Transfers Out Due to Deconsolidation of Funds | — | (95,962 | ) | — | — | — | — | (95,962 | ) | — | |||||||||||||||||||||
| Transfers In | — | — | — | — | — | — | — | — | |||||||||||||||||||||||
| Transfers Out | — | (4,187 | ) | — | — | — | (1,496 | ) | (5,683 | ) | — | ||||||||||||||||||||
| Asset Purchases / Debt Issuances | 923,460 | 2,056,195 | — | 667,681 | 15,589 | 259,204 | 3,922,129 | — | |||||||||||||||||||||||
| Sales / Paydowns | (228,676 | ) | (942,459 | ) | (34,957 | ) | (469,092 | ) | (49,842 | ) | (188,623 | ) | (1,913,649 | ) | — | ||||||||||||||||
| Settlements | — | 46,653 | — | — | — | — | 46,653 | (34,957 | ) | ||||||||||||||||||||||
| Net Realized Gains (Losses) | 7,871 | (109,525 | ) | — | (34,208 | ) | 6,908 | (53,384 | ) | (182,338 | ) | — | |||||||||||||||||||
| Net Unrealized Gains (Losses) | 345,910 | 476,920 | 38,853 | 230,491 | 12,361 | (13,263 | ) | 1,091,272 | 35,399 | ||||||||||||||||||||||
| Change in Other Comprehensive Income | — | 14,878 | — | — | — | — | 14,878 | — | |||||||||||||||||||||||
| Balance, End of Period | $ | 2,608,124 | $ | 4,732,874 | $ | 5,410,116 | $ | 2,202,000 | $ | 555,538 | $ | 1,770,011 | $ | 17,278,663 | $ | 5,295,183 | |||||||||||||||
| Changes in Net Unrealized Gains (Losses) Included in Net Gains (Losses) from Investment Activities related to Level III Assets and Liabilities still held as of the Reporting Date | $ | 345,910 | $ | 367,269 | $ | 38,853 | $ | 175,183 | $ | 15,498 | $ | (13,263 | ) | $ | 929,450 | $ | 35,399 | ||||||||||||||
| Nine Months Ended September 30, 2021 | |||||||||||||||||||||||||||||||||||||||||||||||||||||||||||
| Balance, Beg. of Period | Transfers In / (Out) - Changes in Consolidation | Transfers In | Transfers Out | Net Purchases/Issuances/Sales/Settlements | Net Unrealized and Realized Gains (Losses) | Change in OCI | Balance, End of Period | Changes in Net Unrealized Gains (Losses) Included in Earnings related to Level III Assets and Liabilities still held as of the Reporting Date | Changes in Net Unrealized Gains (Losses) Included in OCI related to Level III Assets and Liabilities still held as of the Reporting Date | ||||||||||||||||||||||||||||||||||||||||||||||||||
| Assets | |||||||||||||||||||||||||||||||||||||||||||||||||||||||||||
| Asset Management | |||||||||||||||||||||||||||||||||||||||||||||||||||||||||||
| Private Equity | $ | 15,234,904 | $ | — | $ | 5,034 | $ | (504,112) | $ | 1,853,614 | $ | 5,155,509 | $ | — | $ | 21,744,949 | $ | 5,011,447 | $ | — | |||||||||||||||||||||||||||||||||||||||
| Credit | 9,172,848 | (1,021) | 86,135 | — | 875,871 | 59,611 | 7,167 | 10,200,611 | 134,588 | 7,167 | |||||||||||||||||||||||||||||||||||||||||||||||||
| Real Assets | 5,924,575 | (174,658) | 17,567 | — | 4,503,849 | 1,361,851 | — | 11,633,184 | 1,293,618 | — | |||||||||||||||||||||||||||||||||||||||||||||||||
| Equity Method - Other | 1,014,378 | — | — | (22,601) | (237,737) | 254,828 | — | 1,008,868 | 215,103 | — | |||||||||||||||||||||||||||||||||||||||||||||||||
| Other Investments | 2,341,981 | (2,879) | — | (115,274) | 380,337 | 564,752 | — | 3,168,917 | 616,584 | — | |||||||||||||||||||||||||||||||||||||||||||||||||
| Other Derivatives | 6,668 | — | — | — | 23,762 | (30,387) | — | 43 | (30,387) | — | |||||||||||||||||||||||||||||||||||||||||||||||||
| Total Assets - Asset Management | $ | 33,695,354 | $ | (178,558) | $ | 108,736 | $ | (641,987) | $ | 7,399,696 | $ | 7,366,164 | $ | 7,167 | $ | 47,756,572 | $ | 7,240,953 | $ | 7,167 | |||||||||||||||||||||||||||||||||||||||
| Insurance | |||||||||||||||||||||||||||||||||||||||||||||||||||||||||||
| AFS fixed maturity securities: | |||||||||||||||||||||||||||||||||||||||||||||||||||||||||||
| Corporate fixed maturity securities | $ | 3,504,578 | $ | — | $ | 76,277 | $ | (38,610) | $ | 1,298,035 | $ | — | $ | 2,023 | $ | 4,842,303 | $ | — | $ | (9,447) | |||||||||||||||||||||||||||||||||||||||
| Structured securities | 197,970 | — | 16,309 | — | (17,047) | — | (245) | 196,987 | — | 1,652 | |||||||||||||||||||||||||||||||||||||||||||||||||
| Total AFS fixed maturity securities | 3,702,548 | — | 92,586 | (38,610) | 1,280,988 | — | 1,778 | 5,039,290 | — | (7,795) | |||||||||||||||||||||||||||||||||||||||||||||||||
| Trading fixed maturity securities: | |||||||||||||||||||||||||||||||||||||||||||||||||||||||||||
| Corporate fixed maturity securities | 676,650 | — | — | — | 705,027 | 3,288 | — | 1,384,965 | 604 | — | |||||||||||||||||||||||||||||||||||||||||||||||||
| Structured securities | 14,661 | — | 15,744 | — | 50,208 | 387 | — | 81,000 | 1,337 | — | |||||||||||||||||||||||||||||||||||||||||||||||||
| Total trading fixed maturity securities | 691,311 | — | 15,744 | — | 755,235 | 3,675 | — | 1,465,965 | 1,941 | — | |||||||||||||||||||||||||||||||||||||||||||||||||
| Equity securities | 66,660 | — | — | — | (90,855) | 53,058 | — | 28,863 | 20,295 | — | |||||||||||||||||||||||||||||||||||||||||||||||||
| Mortgage and other loan receivables | 928,673 | — | — | — | 348,098 | 11,707 | — | 1,288,478 | 9,814 | — | |||||||||||||||||||||||||||||||||||||||||||||||||
| Other investments | 437,275 | — | 5,003 | — | (20,693) | 373,643 | — | 795,228 | 13,510 | — | |||||||||||||||||||||||||||||||||||||||||||||||||
| Funds withheld receivable at interest | — | — | — | — | 152 | 80,341 | — | 80,493 | — | — | |||||||||||||||||||||||||||||||||||||||||||||||||
| Reinsurance recoverable | — | — | — | — | — | 1,325,487 | — | 1,325,487 | — | — | |||||||||||||||||||||||||||||||||||||||||||||||||
| Total Assets - Insurance | $ | 5,826,467 | $ | — | $ | 113,333 | $ | (38,610) | $ | 2,272,925 | $ | 1,847,911 | $ | 1,778 | $ | 10,023,804 | $ | 45,560 | $ | (7,795) | |||||||||||||||||||||||||||||||||||||||
| Total | $ | 39,521,821 | $ | (178,558) | $ | 222,069 | $ | (680,597) | $ | 9,672,621 | $ | 9,214,075 | $ | 8,945 | $ | 57,780,376 | $ | 7,286,513 | $ | (628) | |||||||||||||||||||||||||||||||||||||||
| Nine Months Ended September 30, 2016 | |||||||||||||||||||||||||||||||
| Level III Investments | Level III Debt Obligations | ||||||||||||||||||||||||||||||
Private Equity | Credit | Investments of Consolidated CFEs | Real Assets | Equity Method | Other | Total | Debt Obligations of Consolidated CFEs | ||||||||||||||||||||||||
| Balance, Beg. of Period | $ | 18,903,538 | $ | 5,012,355 | $ | — | $ | 4,048,281 | $ | 891,606 | $ | 2,581,188 | $ | 31,436,968 | $ | — | |||||||||||||||
| Transfers Out Due to Deconsolidation of Funds | (17,856,098 | ) | (2,354,181 | ) | — | (2,628,999 | ) | — | (984,813 | ) | (23,824,091 | ) | — | ||||||||||||||||||
| Transfers In | — | 45,427 | 4,343,829 | — | — | — | 4,389,256 | 4,272,081 | |||||||||||||||||||||||
| Transfers Out | (104,000 | ) | (760 | ) | — | — | (311,270 | ) | — | (416,030 | ) | — | |||||||||||||||||||
| Asset Purchases / Debt Issuances | 507,812 | 1,170,140 | 1,026,801 | 513,734 | 18,992 | 249,903 | 3,487,382 | 990,450 | |||||||||||||||||||||||
| Sales / Paydowns | (43,789 | ) | (648,416 | ) | (23,910 | ) | (237,176 | ) | (61,111 | ) | (147,495 | ) | (1,161,897 | ) | — | ||||||||||||||||
| Settlements | — | 74,474 | — | — | — | — | 74,474 | (23,910 | ) | ||||||||||||||||||||||
| Net Realized Gains (Losses) | 17,386 | (9,113 | ) | — | 41,158 | (1,766 | ) | (8,588 | ) | 39,077 | — | ||||||||||||||||||||
| Net Unrealized Gains (Losses) | 64,236 | (74,384 | ) | 197,959 | 77,758 | (31,267 | ) | (111,317 | ) | 122,985 | 196,970 | ||||||||||||||||||||
| Change in Other Comprehensive Income | — | 3,470 | — | — | — | — | 3,470 | — | |||||||||||||||||||||||
| Balance, End of Period | $ | 1,489,085 | $ | 3,219,012 | $ | 5,544,679 | $ | 1,814,756 | $ | 505,184 | $ | 1,578,878 | $ | 14,151,594 | $ | 5,435,591 | |||||||||||||||
| Changes in Net Unrealized Gains (Losses) Included in Net Gains (Losses) from Investment Activities related to Level III Assets and Liabilities still held as of the Reporting Date | $ | 81,247 | $ | (74,997 | ) | $ | 197,959 | $ | 77,758 | $ | (31,267 | ) | $ | (135,067 | ) | $ | 115,633 | $ | 196,970 | ||||||||||||
| Three Months Ended September 30, 2022 | Nine Months Ended September 30, 2022 | ||||||||||||||||||||||||||||||||||
| Purchases | Issuances | Sales | Settlements | Net Purchases/ Issuances/ Sales/ Settlements | Purchases | Issuances | Sales | Settlements | Net Purchases/ Issuances/ Sales/ Settlements | ||||||||||||||||||||||||||
| Assets | |||||||||||||||||||||||||||||||||||
| Asset Management | |||||||||||||||||||||||||||||||||||
| Private Equity | $ | 2,387,838 | $ | — | $ | (136,605) | $ | — | $ | 2,251,233 | $ | 3,444,454 | $ | — | $ | (515,061) | $ | — | $ | 2,929,393 | |||||||||||||||
| Credit | 787,194 | — | (64,068) | (40,608) | 682,518 | 1,561,070 | — | (1,111,399) | (325,621) | 124,050 | |||||||||||||||||||||||||
| Real Assets | 372,844 | — | (336,859) | (50,388) | (14,403) | 4,750,162 | — | (1,619,661) | (50,388) | 3,080,113 | |||||||||||||||||||||||||
| Equity Method - Other | 177 | — | (833) | — | (656) | 612,343 | — | (6,858) | — | 605,485 | |||||||||||||||||||||||||
| Other Investments | 41,445 | — | (97,232) | — | (55,787) | 271,005 | — | (396,707) | — | (125,702) | |||||||||||||||||||||||||
| Other Derivatives | — | — | (33,907) | — | (33,907) | 55,707 | — | (33,907) | — | 21,800 | |||||||||||||||||||||||||
| Total Assets - Asset Management | $ | 3,589,498 | $ | — | $ | (669,504) | $ | (90,996) | $ | 2,828,998 | $ | 10,694,741 | $ | — | $ | (3,683,593) | $ | (376,009) | $ | 6,635,139 | |||||||||||||||
| Insurance | |||||||||||||||||||||||||||||||||||
| AFS fixed maturity securities: | |||||||||||||||||||||||||||||||||||
| Corporate fixed maturity securities | $ | 844,913 | $ | — | $ | (29,842) | $ | (688,839) | $ | 126,232 | $ | 2,441,634 | $ | — | $ | (158,346) | $ | (1,408,418) | $ | 874,870 | |||||||||||||||
| Structured securities | 176,822 | — | (13) | (26,422) | 150,387 | 531,082 | — | (13) | (194,753) | 336,316 | |||||||||||||||||||||||||
| Total AFS fixed maturity securities | 1,021,735 | — | (29,855) | (715,261) | 276,619 | 2,972,716 | — | (158,359) | (1,603,171) | 1,211,186 | |||||||||||||||||||||||||
| Trading fixed maturity securities: | |||||||||||||||||||||||||||||||||||
| Corporate fixed maturity securities | 31,633 | — | (5) | (38,394) | (6,766) | 250,288 | — | (606) | (62,021) | 187,661 | |||||||||||||||||||||||||
| Structured securities | 93 | — | (4,700) | (5,127) | (9,734) | 195,887 | — | (4,700) | (78,874) | 112,313 | |||||||||||||||||||||||||
| Total trading fixed maturity securities | 31,726 | — | (4,705) | (43,521) | (16,500) | 446,175 | — | (5,306) | (140,895) | 299,974 | |||||||||||||||||||||||||
| Mortgage and other loan receivables | 3,456 | — | — | (20,988) | (17,532) | 236,734 | — | (7,302) | (118,554) | 110,878 | |||||||||||||||||||||||||
| Other investments | 560,855 | — | (279,384) | — | 281,471 | 3,122,881 | — | (553,769) | — | 2,569,112 | |||||||||||||||||||||||||
| Funds withheld receivable at interest | — | — | — | — | — | — | 10,435 | — | — | 10,435 | |||||||||||||||||||||||||
| Reinsurance recoverable | — | — | — | (3,626) | (3,626) | — | — | — | (16,728) | (16,728) | |||||||||||||||||||||||||
| Total Assets - Insurance | $ | 1,617,772 | $ | — | $ | (313,944) | $ | (783,396) | $ | 520,432 | $ | 6,778,506 | $ | 10,435 | $ | (724,736) | $ | (1,879,348) | $ | 4,184,857 | |||||||||||||||
| Total | $ | 5,207,270 | $ | — | $ | (983,448) | $ | (874,392) | $ | 3,349,430 | $ | 17,473,247 | $ | 10,435 | $ | (4,408,329) | $ | (2,255,357) | $ | 10,819,996 | |||||||||||||||
| Three Months Ended September 30, 2021 | Nine Months Ended September 30, 2021 | |||||||||||||||||||||||||||||||||||||||||||||||||
| Purchases | Issuances | Sales | Settlements | Net Purchases/Issuances/Sales/Settlements | Purchases | Issuances | Sales | Settlements | Net Purchases/ Issuances/ Sales/ Settlements | |||||||||||||||||||||||||||||||||||||||||
| Assets | ||||||||||||||||||||||||||||||||||||||||||||||||||
| Asset Management | ||||||||||||||||||||||||||||||||||||||||||||||||||
| Private Equity | $ | 1,768,420 | $ | — | $ | (131,505) | $ | — | $ | 1,636,915 | $ | 2,147,332 | $ | — | $ | (293,718) | $ | — | $ | 1,853,614 | ||||||||||||||||||||||||||||||
| Credit | 1,895,171 | — | (1,579,340) | 2,125 | 317,956 | 4,476,350 | — | (3,440,035) | (160,444) | 875,871 | ||||||||||||||||||||||||||||||||||||||||
| Real Assets | 2,983,593 | — | (529,116) | — | 2,454,477 | 5,541,325 | — | (1,037,476) | — | 4,503,849 | ||||||||||||||||||||||||||||||||||||||||
| Equity Method - Other | 7,201 | — | (82,344) | — | (75,143) | 21,800 | — | (259,537) | — | (237,737) | ||||||||||||||||||||||||||||||||||||||||
| Other Investments | 257,463 | — | (151,585) | — | 105,878 | 588,865 | — | (208,528) | — | 380,337 | ||||||||||||||||||||||||||||||||||||||||
| Other Derivatives | 13,152 | — | — | — | 13,152 | 23,762 | — | — | — | 23,762 | ||||||||||||||||||||||||||||||||||||||||
| Total Assets - Asset Management | $ | 6,925,000 | $ | — | $ | (2,473,890) | $ | 2,125 | $ | 4,453,235 | $ | 12,799,434 | $ | — | $ | (5,239,294) | $ | (160,444) | $ | 7,399,696 | ||||||||||||||||||||||||||||||
| Insurance | ||||||||||||||||||||||||||||||||||||||||||||||||||
| AFS fixed maturity securities: | ||||||||||||||||||||||||||||||||||||||||||||||||||
| Corporate fixed maturity securities | $ | 2,155,228 | $ | — | $ | (13,846) | $ | (1,355,390) | $ | 785,992 | $ | 4,072,144 | $ | — | $ | (48,073) | $ | (2,726,036) | $ | 1,298,035 | ||||||||||||||||||||||||||||||
| Structured securities | 4,218 | — | — | (1,758) | 2,460 | 4,289 | — | — | (21,336) | (17,047) | ||||||||||||||||||||||||||||||||||||||||
| Total AFS fixed maturity securities | 2,159,446 | — | (13,846) | (1,357,148) | 788,452 | 4,076,433 | — | (48,073) | (2,747,372) | 1,280,988 | ||||||||||||||||||||||||||||||||||||||||
| Trading fixed maturity securities: | ||||||||||||||||||||||||||||||||||||||||||||||||||
| Corporate fixed maturity securities | 370,488 | — | (623) | (1,241) | 368,624 | 710,446 | — | (623) | (4,796) | 705,027 | ||||||||||||||||||||||||||||||||||||||||
| Structured securities | 44,594 | — | — | (361) | 44,233 | 52,735 | — | — | (2,527) | 50,208 | ||||||||||||||||||||||||||||||||||||||||
| Total trading fixed maturity securities | 415,082 | — | (623) | (1,602) | 412,857 | 763,181 | — | (623) | (7,323) | 755,235 | ||||||||||||||||||||||||||||||||||||||||
| Equity securities | — | — | (83,864) | (6,991) | (90,855) | — | — | (83,864) | (6,991) | (90,855) | ||||||||||||||||||||||||||||||||||||||||
| Mortgage and other loan receivables | 65,517 | — | (6,541) | (673) | 58,303 | 380,555 | — | (22,200) | (10,257) | 348,098 | ||||||||||||||||||||||||||||||||||||||||
| Other investments | 25,000 | — | (58,619) | — | (33,619) | 37,926 | — | (58,619) | — | (20,693) | ||||||||||||||||||||||||||||||||||||||||
| Funds withheld receivable at interest | — | (437) | — | — | (437) | — | 152 | — | — | 152 | ||||||||||||||||||||||||||||||||||||||||
| Total Assets - Insurance | $ | 2,665,045 | $ | (437) | $ | (163,493) | $ | (1,366,414) | $ | 1,134,701 | $ | 5,258,095 | $ | 152 | $ | (213,379) | $ | (2,771,943) | $ | 2,272,925 | ||||||||||||||||||||||||||||||
| Total | $ | 9,590,045 | $ | (437) | $ | (2,637,383) | $ | (1,364,289) | $ | 5,587,936 | $ | 18,057,529 | $ | 152 | $ | (5,452,673) | $ | (2,932,387) | $ | 9,672,621 | ||||||||||||||||||||||||||||||
| Three Months Ended September 30, 2022 | |||||||||||||||||||||||||||||
| Balance, Beg. of Period | Transfers In / (Out) - Changes in Consolidation | Transfers In | Transfers Out | Net Purchases/Sales/Settlements/Issuances | Net Unrealized and Realized Gains (Losses) | Change in OCI | Balance, End of Period | Changes in Net Unrealized Gains (Losses) Included in Earnings related to Level III Assets and Liabilities still held as of the Reporting Date | |||||||||||||||||||||
| Liabilities | |||||||||||||||||||||||||||||
| Asset Management | |||||||||||||||||||||||||||||
| Unfunded Revolver Commitments | $ | 95,798 | $ | — | $ | — | $ | — | $ | — | $ | 12,397 | $ | — | $ | 108,195 | $ | 12,397 | |||||||||||
| Total Liabilities - Asset Management | $ | 95,798 | $ | — | $ | — | $ | — | $ | — | $ | 12,397 | $ | — | $ | 108,195 | $ | 12,397 | |||||||||||
| Insurance | |||||||||||||||||||||||||||||
| Policy liabilities | $ | 454,034 | $ | — | $ | — | $ | — | $ | — | $ | (36,171) | $ | — | $ | 417,863 | $ | — | |||||||||||
| Closed block policy liabilities | 1,135,909 | — | — | — | (4,396) | (34,741) | (294) | 1,096,478 | — | ||||||||||||||||||||
| Funds withheld payable at interest | (2,583,191) | — | — | — | — | (836,395) | — | (3,419,586) | — | ||||||||||||||||||||
| Embedded derivative – indexed universal life products | 341,846 | — | — | — | (25) | (25,932) | — | 315,889 | — | ||||||||||||||||||||
| Embedded derivative – annuity products | 1,429,394 | — | — | — | 214,455 | (171,035) | — | 1,472,814 | — | ||||||||||||||||||||
| Total Liabilities - Insurance | $ | 777,992 | $ | — | $ | — | $ | — | $ | 210,034 | $ | (1,104,274) | $ | (294) | $ | (116,542) | $ | — | |||||||||||
| Total | $ | 873,790 | $ | — | $ | — | $ | — | $ | 210,034 | $ | (1,091,877) | $ | (294) | $ | (8,347) | $ | 12,397 | |||||||||||
| Nine Months Ended September 30, 2022 | |||||||||||||||||||||||||||||
| Balance, Beg. of Period | Transfers In / (Out) - Changes in Consolidation | Transfers In | Transfers Out | Net Purchases/Sales/Settlements/Issuances | Net Unrealized and Realized Gains (Losses) | Change in OCI | Balance, End of Period | Changes in Net Unrealized Gains (Losses) Included in Earnings related to Level III Assets and Liabilities still held as of the Reporting Date | |||||||||||||||||||||
| Liabilities | |||||||||||||||||||||||||||||
| Asset Management | |||||||||||||||||||||||||||||
| Unfunded Revolver Commitments | $ | 64,276 | $ | — | $ | — | $ | — | $ | (4,728) | $ | 48,647 | $ | — | $ | 108,195 | $ | 48,647 | |||||||||||
| Total Liabilities - Asset Management | $ | 64,276 | $ | — | $ | — | $ | — | $ | (4,728) | $ | 48,647 | $ | — | $ | 108,195 | $ | 48,647 | |||||||||||
| Insurance | |||||||||||||||||||||||||||||
| Policy liabilities | $ | 519,454 | $ | — | $ | — | $ | — | $ | — | $ | (101,591) | $ | — | $ | 417,863 | $ | — | |||||||||||
| Closed block policy liabilities | 1,350,224 | — | — | — | (17,368) | (241,820) | 5,442 | 1,096,478 | — | ||||||||||||||||||||
| Funds withheld payable at interest | (49,491) | — | — | — | 10,435 | (3,380,530) | — | (3,419,586) | — | ||||||||||||||||||||
| Embedded derivative – indexed universal life products | 557,276 | — | — | — | 2,993 | (244,380) | — | 315,889 | — | ||||||||||||||||||||
| Embedded derivative – annuity products | 1,983,949 | — | — | — | 480,121 | (991,256) | — | 1,472,814 | — | ||||||||||||||||||||
| Total Liabilities - Insurance | $ | 4,361,412 | $ | — | $ | — | $ | — | $ | 476,181 | $ | (4,959,577) | $ | 5,442 | $ | (116,542) | $ | — | |||||||||||
| Total | $ | 4,425,688 | $ | — | $ | — | $ | — | $ | 471,453 | $ | (4,910,930) | $ | 5,442 | $ | (8,347) | $ | 48,647 | |||||||||||
| Three Months Ended September 30, 2021 | |||||||||||||||||||||||||||||
| Balance, Beg. of Period | Transfers In / (Out) - Changes in Consolidation | Transfers In | Transfers Out | Net Purchases/Sales/Settlements/Issuances | Net Unrealized and Realized Gains (Losses) | Change in OCI | Balance, End of Period | Changes in Net Unrealized Gains (Losses) Included in Earnings related to Level III Assets and Liabilities still held as of the Reporting Date | |||||||||||||||||||||
| Liabilities | |||||||||||||||||||||||||||||
| Asset Management | |||||||||||||||||||||||||||||
| Unfunded Revolver Commitments | $ | 40,050 | $ | — | $ | — | $ | — | $ | — | $ | 10,860 | $ | — | $ | 50,910 | $ | 10,860 | |||||||||||
| Total Liabilities - Asset Management | $ | 40,050 | $ | — | $ | — | $ | — | $ | — | $ | 10,860 | $ | — | $ | 50,910 | $ | 10,860 | |||||||||||
| Insurance | |||||||||||||||||||||||||||||
| Policy liabilities | $ | 548,377 | $ | — | $ | — | $ | — | $ | — | $ | (3,548) | $ | — | $ | 544,829 | $ | — | |||||||||||
| Closed block policy liabilities | 1,341,262 | — | — | — | — | 32,941 | 710 | 1,374,913 | — | ||||||||||||||||||||
| Funds withheld payable at interest | 55,172 | — | — | — | — | (91,927) | — | (36,755) | — | ||||||||||||||||||||
| Embedded derivative – indexed universal life products | 495,353 | — | — | — | 108 | (5,448) | — | 490,013 | — | ||||||||||||||||||||
| Embedded derivative – annuity products | 1,521,447 | — | — | — | 81,926 | 49,341 | — | 1,652,714 | — | ||||||||||||||||||||
| Total Liabilities - Insurance | $ | 3,961,611 | $ | — | $ | — | $ | — | $ | 82,034 | $ | (18,641) | $ | 710 | $ | 4,025,714 | $ | — | |||||||||||
| Total | $ | 4,001,661 | $ | — | $ | — | $ | — | $ | 82,034 | $ | (7,781) | $ | 710 | $ | 4,076,624 | $ | 10,860 | |||||||||||
| Nine Months Ended September 30, 2021 | |||||||||||||||||||||||||||||
| Balance, Beg. of Period | Transfers In / (Out) - Changes in Consolidation | Transfers In | Transfers Out | Net Purchases/Sales/Settlements/Issuances | Net Unrealized and Realized Gains (Losses) | Change in OCI | Balance, End of Period | Changes in Net Unrealized Gains (Losses) Included in Earnings related to Level III Assets and Liabilities still held as of the Reporting Date | |||||||||||||||||||||
| Liabilities | |||||||||||||||||||||||||||||
| Asset Management | |||||||||||||||||||||||||||||
| Unfunded Revolver Commitments | $ | 46,340 | $ | — | $ | — | $ | — | $ | 628 | $ | 3,942 | $ | — | $ | 50,910 | $ | 3,942 | |||||||||||
| Total Liabilities - Asset Management | $ | 46,340 | $ | — | $ | — | $ | — | $ | 628 | $ | 3,942 | $ | — | $ | 50,910 | $ | 3,942 | |||||||||||
| Insurance | |||||||||||||||||||||||||||||
| Policy liabilities | $ | 637,800 | $ | — | $ | — | $ | — | $ | — | $ | (92,971) | $ | — | $ | 544,829 | $ | — | |||||||||||
| Closed block policy liabilities | 1,395,746 | — | — | — | — | (22,205) | 1,372 | 1,374,913 | — | ||||||||||||||||||||
| Funds withheld payable at interest | 59,230 | — | — | — | — | (95,985) | — | (36,755) | — | ||||||||||||||||||||
| Embedded derivative – indexed universal life products | 386,746 | — | — | — | (393) | 103,660 | — | 490,013 | — | ||||||||||||||||||||
| Embedded derivative – annuity products | 1,024,601 | — | — | — | 208,027 | 420,086 | — | 1,652,714 | — | ||||||||||||||||||||
| Total Liabilities - Insurance | $ | 3,504,123 | $ | — | $ | — | $ | — | $ | 207,634 | $ | 312,585 | $ | 1,372 | $ | 4,025,714 | $ | — | |||||||||||
| Total | $ | 3,550,463 | $ | — | $ | — | $ | — | $ | 208,262 | $ | 316,527 | $ | 1,372 | $ | 4,076,624 | $ | 3,942 | |||||||||||
| Three Months Ended September 30, 2022 | Nine Months Ended September 30, 2022 | ||||||||||||||||||||||
| Issuances | Settlements | Net Issuances/Settlements | Issuances | Settlements | Net Issuances/Settlements | ||||||||||||||||||
| Liabilities | |||||||||||||||||||||||
| Asset Management | |||||||||||||||||||||||
| Unfunded Revolver Commitments | $ | 9,400 | $ | (9,400) | $ | — | $ | 26,490 | $ | (31,218) | $ | (4,728) | |||||||||||
| Total Liabilities - Asset Management | $ | 9,400 | $ | (9,400) | $ | — | $ | 26,490 | $ | (31,218) | $ | (4,728) | |||||||||||
| Insurance | |||||||||||||||||||||||
| Closed block policy liabilities | $ | — | $ | (4,396) | $ | (4,396) | $ | — | $ | (17,368) | $ | (17,368) | |||||||||||
| Funds withheld payable at interest | — | — | — | 10,435 | — | 10,435 | |||||||||||||||||
| Embedded derivative – indexed universal life products | 5,687 | (5,712) | (25) | 18,063 | (15,070) | 2,993 | |||||||||||||||||
| Embedded derivative – annuity products | 214,455 | — | 214,455 | 480,121 | — | 480,121 | |||||||||||||||||
| Total Liabilities - Insurance | $ | 220,142 | $ | (10,108) | $ | 210,034 | $ | 508,619 | $ | (32,438) | $ | 476,181 | |||||||||||
| Total | $ | 229,542 | $ | (19,508) | $ | 210,034 | $ | 535,109 | $ | (63,656) | $ | 471,453 | |||||||||||
| Three Months Ended September 30, 2021 | Nine Months Ended September 30, 2021 | ||||||||||||||||||||||
| Issuances | Settlements | Net Issuances/Settlements | Issuances | Settlements | Net Issuances/Settlements | ||||||||||||||||||
| Liabilities | |||||||||||||||||||||||
| Asset Management | |||||||||||||||||||||||
| Unfunded Revolver Commitments | $ | 11,319 | $ | (11,319) | $ | — | $ | 12,486 | $ | (11,858) | $ | 628 | |||||||||||
| Total Liabilities - Asset Management | $ | 11,319 | $ | (11,319) | $ | — | $ | 12,486 | $ | (11,858) | $ | 628 | |||||||||||
| Insurance | |||||||||||||||||||||||
| Embedded derivative – indexed universal life products | $ | 4,775 | $ | (4,667) | $ | 108 | $ | 14,853 | $ | (15,246) | $ | (393) | |||||||||||
| Embedded derivative – annuity products | 81,926 | — | 81,926 | 208,027 | — | 208,027 | |||||||||||||||||
| Total Liabilities - Insurance | $ | 86,701 | $ | (4,667) | $ | 82,034 | $ | 222,880 | $ | (15,246) | $ | 207,634 | |||||||||||
| Total | $ | 98,020 | $ | (15,986) | $ | 82,034 | $ | 235,366 | $ | (27,104) | $ | 208,262 | |||||||||||
| Three Months Ended September 30, | Nine Months Ended September 30, | ||||||||||||||
| 2017 | 2016 | 2017 | 2016 | ||||||||||||
| Assets, at fair value: | |||||||||||||||
Transfers from Level I to Level II (1) | $ | 53,416 | $ | — | $ | 53,416 | $ | 73,600 | |||||||
Transfers from Level II to Level I (4) | $ | 33,634 | $ | — | $ | 33,634 | $ | — | |||||||
Transfers from Level II to Level III (2) | $ | — | $ | 1,677 | $ | — | $ | 4,389,256 | |||||||
Transfers from Level III to Level II (3) | $ | 4,187 | $ | — | $ | 4,187 | $ | 312,030 | |||||||
Transfers from Level III to Level I (4) | $ | — | $ | — | $ | 1,496 | $ | 104,000 | |||||||
| Liabilities, at fair value: | |||||||||||||||
Transfers from Level II to Level III (5) | $ | — | $ | — | $ | — | $ | 4,272,081 | |||||||
| Level III Assets | Fair Value September 30, 2022 | Valuation Methodologies | Unobservable Input(s) (1) | Weighted Average (2) | Range | Impact to Valuation from an Increase in Input (3) | ||||||||||||||||||||||||||||||||
| ASSET MANAGEMENT | ||||||||||||||||||||||||||||||||||||||
| Private Equity | $ | 25,073,296 | ||||||||||||||||||||||||||||||||||||
| Private Equity | $ | 22,354,498 | Inputs to market comparables, discounted cash flow and transaction price | Illiquidity Discount | 6.5% | 5.0% - 15.0% | Decrease | |||||||||||||||||||||||||||||||
| Weight Ascribed to Market Comparables | 29.0% | 0.0% - 75.0% | (4) | |||||||||||||||||||||||||||||||||||
| Weight Ascribed to Discounted Cash Flow | 68.2% | 0.0% - 100.0% | (5) | |||||||||||||||||||||||||||||||||||
| Weight Ascribed to Transaction Price | 2.8% | 0.0% - 100.0% | (6) | |||||||||||||||||||||||||||||||||||
| Market comparables | Enterprise Value/LTM EBITDA Multiple | 16.8x | 7.6x - 52.8x | Increase | ||||||||||||||||||||||||||||||||||
| Enterprise Value/Forward EBITDA Multiple | 14.9x | 6.8x - 30.0x | Increase | |||||||||||||||||||||||||||||||||||
| Discounted cash flow | Weighted Average Cost of Capital | 9.9% | 6.3% - 13.9% | Decrease | ||||||||||||||||||||||||||||||||||
| Enterprise Value/LTM EBITDA Exit Multiple | 14.1x | 6.0x - 27.6x | Increase | |||||||||||||||||||||||||||||||||||
Fair Value September 30, 2017 | Valuation Methodologies | Unobservable Input(s) (1) | Weighted Average (2) | Range | Impact to Valuation from an Increase in Input (3) | ||||||||||||||||||||||||||||||||||||||||||||||
| Private Equity | $ | 2,608,124 | |||||||||||||||||||||||||||||||||||||||||||||||||
| Private Equity | $ | 1,154,227 | Inputs to market comparables, discounted cash flow and transaction price | Illiquidity Discount | 9.2% | 5.0% - 15.0% | Decrease | ||||||||||||||||||||||||||||||||||||||||||||
| Weight Ascribed to Market Comparables | 48.3% | 0.0% - 50.0% | (4) | ||||||||||||||||||||||||||||||||||||||||||||||||
| Weight Ascribed to Discounted Cash Flow | 49.6% | 0.0% - 100.0% | (5) | ||||||||||||||||||||||||||||||||||||||||||||||||
| Weight Ascribed to Transaction Price | 2.1% | 0.0% - 100.0% | (6) | ||||||||||||||||||||||||||||||||||||||||||||||||
| Market comparables | Enterprise Value/LTM EBITDA Multiple | 13.6x | 6.4x - 26.1x | Increase | |||||||||||||||||||||||||||||||||||||||||||||||
| Enterprise Value/Forward EBITDA Multiple | 11.9x | 5.7x - 22.0x | Increase | ||||||||||||||||||||||||||||||||||||||||||||||||
| Discounted cash flow | Weighted Average Cost of Capital | 9.6% | 6.8% - 13.8% | Decrease | |||||||||||||||||||||||||||||||||||||||||||||||
| Enterprise Value/LTM EBITDA Exit Multiple | 10.6x | 5.6x - 14.9x | Increase | ||||||||||||||||||||||||||||||||||||||||||||||||
| Level III Assets | Level III Assets | Fair Value September 30, 2022 | Valuation Methodologies | Unobservable Input(s) (1) | Weighted Average (2) | Range | Impact to Valuation from an Increase in Input (3) | ||||||||||||||||||||||||||||||||||||||||||||
| Growth Equity | $ | 1,453,897 | Inputs to market comparables, discounted cash flow and milestones | Illiquidity Discount | 10.9% | 8.0% - 20.0% | Decrease | Growth Equity | $ | 2,718,798 | Inputs to market comparables, discounted cash flow and milestones | Illiquidity Discount | 8.6% | 5.0% - 15.0% | Decrease | ||||||||||||||||||||||||||||||||||||
| Weight Ascribed to Market Comparables | 26.9% | 0.0% - 100.0% | (4) | Weight Ascribed to Market Comparables | 28.7% | 0.0% - 100.0% | (4) | ||||||||||||||||||||||||||||||||||||||||||||
| Weight Ascribed to Discounted Cash Flow | 4.9% | 0.0% - 75.0% | (5) | Weight Ascribed to Discounted Cash Flow | 0.0% | 0.0% - 5.0% | (5) | ||||||||||||||||||||||||||||||||||||||||||||
| Weight Ascribed to Milestones | 68.2% | 0.0% - 100.0% | (6) | Weight Ascribed to Milestones | 71.3% | 0.0% - 100.0% | (6) | ||||||||||||||||||||||||||||||||||||||||||||
| Scenario Weighting | Base | 51.9% | 30.0% - 80.0% | Increase | Scenario Weighting | Base | 76.0% | 60.0% - 80.0% | Increase | ||||||||||||||||||||||||||||||||||||||||||
| Downside | 22.1% | 5.0% - 40.0% | Decrease | Downside | 4.8% | 0.0% - 25.0% | Decrease | ||||||||||||||||||||||||||||||||||||||||||||
| Upside | 26.0% | 10.0% - 45.0% | Increase | Upside | 19.2% | 10.0% - 25.0% | Increase | ||||||||||||||||||||||||||||||||||||||||||||
| Credit | $ | 4,732,874 | Yield Analysis | Yield | 11.6% | 3.6% - 37.6% | Decrease | Credit | $ | 5,444,839 | Yield Analysis | Yield | 10.8% | 7.0% - 48.1% | Decrease | ||||||||||||||||||||||||||||||||||||
| Net Leverage | 4.9x | 0.6x - 20.7x | Decrease | Net Leverage | 6.2x | 0.1x - 31.5x | Decrease | ||||||||||||||||||||||||||||||||||||||||||||
| EBITDA Multiple | 10.1x | 0.1x - 17.1x | Increase | EBITDA Multiple | 12.6x | 0.3x - 33.0x | Increase | ||||||||||||||||||||||||||||||||||||||||||||
| Investments of Consolidated CFEs | $ | 5,410,116 | (9) | ||||||||||||||||||||||||||||||||||||||||||||||||
| Debt Obligations of Consolidated CFEs | $ | 5,295,183 | Discounted cash flow | Yield | 5.5% | 1.9% - 27.9% | Decrease | ||||||||||||||||||||||||||||||||||||||||||||
| Real Assets | $ | 2,202,000 | (10) | Real Assets | $ | 15,586,048 | |||||||||||||||||||||||||||||||||||||||||||||
| Energy | $ | 1,097,636 | Discounted cash flow | Weighted Average Cost of Capital | 10.1% | 9.2% - 16.1% | Decrease | Energy | $ | 1,751,872 | Inputs to market comparables and discounted cash flow | Weight Ascribed to Market Comparables | 43.4% | 0.0% - 50.0% | (4) | ||||||||||||||||||||||||||||||||||||
| Weight Ascribed to Discounted Cash Flow | 56.6% | 50.0% - 100.0% | (5) | ||||||||||||||||||||||||||||||||||||||||||||||||
| Market comparables | Enterprise Value/LTM EBITDA Multiple | 4.5x | 4.5x - 4.5x | Increase | |||||||||||||||||||||||||||||||||||||||||||||||
| Enterprise Value/Forward EBITDA Multiple | 5.1x | 3.3x - 5.9x | Increase | ||||||||||||||||||||||||||||||||||||||||||||||||
| Discounted cash flow | Weighted Average Cost of Capital | 12.7% | 12.4% - 14.4% | Decrease | |||||||||||||||||||||||||||||||||||||||||||||||
| Average Price Per BOE (8) | $49.79 | $45.69 - $65.78 | Increase | ||||||||||||||||||||||||||||||||||||||||||||||||
| Infrastructure | Infrastructure | $ | 5,565,903 | Inputs to market comparables, discounted cash flow and transaction price | Illiquidity Discount | 5.7% | 5.0% - 10.0% | Decrease | |||||||||||||||||||||||||||||||||||||||||||
| Weight Ascribed to Market Comparables | 1.9% | 0.0% - 25.0% | (4) | ||||||||||||||||||||||||||||||||||||||||||||||||
| Weight Ascribed to Discounted Cash Flow | 84.2% | 0.0% - 100.0% | (5) | ||||||||||||||||||||||||||||||||||||||||||||||||
| Weight Ascribed to Transaction Price | 13.9% | 0.0% - 100.0% | (6) | ||||||||||||||||||||||||||||||||||||||||||||||||
| Market comparables | Enterprise Value/Forward EBITDA Multiple | 13.4x | 10.5x - 17.9x | Increase | |||||||||||||||||||||||||||||||||||||||||||||||
| Discounted cash flow | Weighted Average Cost of Capital | 7.9% | 5.1% - 9.0% | Decrease | |||||||||||||||||||||||||||||||||||||||||||||||
| Average Price Per BOE (8) | $38.97 | $31.77 - $41.84 | Increase | Enterprise Value/LTM EBITDA Exit Multiple | 8.2x | 1.4x - 14.6x | Increase | ||||||||||||||||||||||||||||||||||||||||||||
| Real Estate | $ | 881,465 | Inputs to direct income capitalization and discounted cash flow | Weight Ascribed to Direct Income Capitalization | 34.3% | 0.0% - 100.0% | (7) | Real Estate | $ | 8,268,273 | Inputs to direct income capitalization, discounted cash flow and transaction price | Weight Ascribed to Direct Income Capitalization | 23.3% | 0.0% - 100.0% | (7) | ||||||||||||||||||||||||||||||||||||
| Weight Ascribed to Discounted Cash Flow | 65.7% | 0.0% - 100.0% | (5) | Weight Ascribed to Discounted Cash Flow | 74.1% | 0.0% - 100.0% | (5) | ||||||||||||||||||||||||||||||||||||||||||||
| Direct income capitalization | Current Capitalization Rate | 5.8% | 2.9% - 8.7% | Decrease | Weight Ascribed to Transaction Price | 2.6% | 0.0% - 100.0% | (6) | |||||||||||||||||||||||||||||||||||||||||||
| Discounted cash flow | Unlevered Discount Rate | 9.2% | 4.5% - 20.0% | Decrease | Direct income capitalization | Current Capitalization Rate | 4.8% | 2.1% - 7.5% | Decrease | ||||||||||||||||||||||||||||||||||||||||||
| Discounted cash flow | Unlevered Discount Rate | 6.2% | 2.6% - 18.0% | Decrease | |||||||||||||||||||||||||||||||||||||||||||||||
| Other | $ | 1,770,011 | Inputs to market comparables, discounted cash flow and transaction price | Illiquidity Discount | 10.4% | 5.0% - 15.0% | Decrease | ||||||||||||||||||||||||||||||||||||||||||||
| Equity Method - Other | Equity Method - Other | $ | 1,561,621 | Inputs to market comparables, discounted cash flow and transaction price | Illiquidity Discount | 6.6% | 5.0% - 10.0% | Decrease | |||||||||||||||||||||||||||||||||||||||||||
| Weight Ascribed to Market Comparables | 40.5% | 0.0% - 100.0% | (4) | ||||||||||||||||||||||||||||||||||||||||||||||||
| Weight Ascribed to Discounted Cash Flow | 18.6% | 0.0% - 100.0% | (5) | ||||||||||||||||||||||||||||||||||||||||||||||||
| Weight Ascribed to Transaction Price | 40.9% | 0.0% - 100.0% | (6) | ||||||||||||||||||||||||||||||||||||||||||||||||
| Market comparables | Enterprise Value/LTM EBITDA Multiple | 19.1x | 4.5x - 42.0x | Increase | |||||||||||||||||||||||||||||||||||||||||||||||
| Enterprise Value/Forward EBITDA Multiple | 16.2x | 3.3x - 33.6x | Increase | ||||||||||||||||||||||||||||||||||||||||||||||||
| Discounted cash flow | Weighted Average Cost of Capital | 9.8% | 6.3% - 17.8% | Decrease | |||||||||||||||||||||||||||||||||||||||||||||||
| Enterprise Value/LTM EBITDA Exit Multiple | 19.4x | 6.0x - 42.0x | Increase | ||||||||||||||||||||||||||||||||||||||||||||||||
| Other Investments | Other Investments | $ | 3,133,423 | (9) | Inputs to market comparables, discounted cash flow and transaction price | Illiquidity Discount | 11.0% | 9.4% - 20.0% | Decrease | ||||||||||||||||||||||||||||||||||||||||||
| Weight Ascribed to Market Comparables | 26.5% | 0.0% - 100.0% | (4) | ||||||||||||||||||||||||||||||||||||||||||||||||
| Inputs to market comparables, discounted cash flow and transaction price | Weight Ascribed to Market Comparables | 27.1% | 0.0% - 100.0% | (4) | Weight Ascribed to Discounted Cash Flow | 48.0% | 0.0% - 100.0% | (5) | |||||||||||||||||||||||||||||||||||||||||||
| Weight Ascribed to Discounted Cash Flow | 48.3% | 0.0% - 100.0% | (5) | Weight Ascribed to Transaction Price | 25.5% | 0.0% - 100.0% | (6) | ||||||||||||||||||||||||||||||||||||||||||||
| Weight Ascribed to Transaction Price | 24.6% | 0.0% - 100.0% | (6) | Market comparables | Enterprise Value/LTM EBITDA Multiple | 12.6x | 4.8x - 24.0x | Increase | |||||||||||||||||||||||||||||||||||||||||||
| Enterprise Value/LTM EBITDA Multiple | 10.1x | 0.1x - 17.4x | Increase | Enterprise Value/Forward EBITDA Multiple | 12.8x | 7.2x - 21.8x | Increase | ||||||||||||||||||||||||||||||||||||||||||||
| Market comparables | Enterprise Value/Forward EBITDA Multiple | 9.9x | 4.6x - 15.1x | Increase | Discounted cash flow | Weighted Average Cost of Capital | 13.3% | 6.2% - 44.1% | Decrease | ||||||||||||||||||||||||||||||||||||||||||
| Weighted Average Cost of Capital | 11.3% | 5.5% - 21.1% | Decrease | Enterprise Value/LTM EBITDA Exit Multiple | 8.4x | 5.5x - 18.3x | Increase | ||||||||||||||||||||||||||||||||||||||||||||
| Discounted cash flow | Enterprise Value/LTM EBITDA Exit Multiple | 6.4x | 1.9x - 11.5x | Increase | |||||||||||||||||||||||||||||||||||||||||||||||
| Level III Assets | Fair Value September 30, 2022 | Valuation Methodologies | Unobservable Input(s) (1) | Weighted Average (2) | Range | Impact to Valuation from an Increase in Input (3) | ||||||||||||||||||||||||||||||||
| INSURANCE | ||||||||||||||||||||||||||||||||||||||
| Corporate fixed maturity securities | $ | 1,722,501 | Discounted cash flow | Discount Spread | 3.12% | —% - 5.87% | Decrease | |||||||||||||||||||||||||||||||
| Structured securities | $ | 103,539 | Discounted cash flow | Discount Spread | 3.53% | 3.10% - 6.27% | Decrease | |||||||||||||||||||||||||||||||
| Constant Prepayment Rate | 7.34% | 5.00% - 15.00% | Increase/Decrease | |||||||||||||||||||||||||||||||||||
| Constant Default Rate | 1.18% | 1.00% - 2.50% | Decrease | |||||||||||||||||||||||||||||||||||
| Loss Severity | 100% | Decrease | ||||||||||||||||||||||||||||||||||||
| Other investments | $ | 2,434,881 | Direct capitalization | Current Capitalization Rate | 5.43% | Decrease | ||||||||||||||||||||||||||||||||
| Vacancy rate | 3.32% | —% - 5.00% | Decrease | |||||||||||||||||||||||||||||||||||
| Discounted cash flow | Yield | 8% | Decrease | |||||||||||||||||||||||||||||||||||
| Rate | 6.42% | 5.25% - 6.70% | Decrease | |||||||||||||||||||||||||||||||||||
| Terminal capitalization rate | 5.13% | 3.95% - 5.50% | Decrease | |||||||||||||||||||||||||||||||||||
| Funds withheld receivable at interest | $ | (21,954) | Discounted cash flow | Duration/Weighted Average Life | 8.43 years | 0.0 years - 20.5 years | Increase | |||||||||||||||||||||||||||||||
| Contractholder Persistency | 7.17% | 3.80% - 16.50% | Increase | |||||||||||||||||||||||||||||||||||
| Nonperformance Risk | 0.65% - 1.90% | Decrease | ||||||||||||||||||||||||||||||||||||
| Reinsurance recoverable | $ | 1,069,497 | Present value of expenses paid from the open block plus the cost of capital held in support of the liabilities. | Expense assumption | The average expense assumption is between $8.23 and $78.00 per policy, increased by inflation. The annual inflation rate was increased from 2.00% to 2.50%. | Increase | ||||||||||||||||||||||||||||||||
| Unobservable inputs are a market participant’s view of the expenses, a risk margin on the uncertainty of the level of expenses and a cost of capital on the capital held in support of the liabilities. | Expense risk margin | 9.42% | Decrease | |||||||||||||||||||||||||||||||||||
| Cost of capital | 3.69% - 13.85% | Increase | ||||||||||||||||||||||||||||||||||||
| Discounted cash flow | Mortality Rate | 5.46% | Increase | |||||||||||||||||||||||||||||||||||
| Surrender Rate | 2.01% | Increase | ||||||||||||||||||||||||||||||||||||
| Level III Liabilities | Fair Value September 30, 2022 | Valuation Methodologies | Unobservable Input(s) (1) | Weighted Average (2) | Range | Impact to Valuation from an Increase in Input (3) | ||||||||||||||||||||||||||||||||
| ASSET MANAGEMENT | ||||||||||||||||||||||||||||||||||||||
| Unfunded Revolver Commitments | $ | 108,195 | Yield Analysis | Yield | 9.6% | 6.2% - 12.5% | Decrease | |||||||||||||||||||||||||||||||
| INSURANCE | ||||||||||||||||||||||||||||||||||||||
| Policy liabilities | $ | 417,863 | Present value of best estimate liability cash flows. Unobservable inputs include a market participant view of the risk margin included in the discount rate which reflects the variability of the cash flows. | Risk Margin Rate | 0.65% - 2.66% | Decrease | ||||||||||||||||||||||||||||||||
| Policyholder behavior is also a significant unobservable input, including surrender and mortality. | Surrender Rate | 3.48% - 6.67% | Increase | |||||||||||||||||||||||||||||||||||
| Mortality Rate | 3.65% - 9.08% | Increase | ||||||||||||||||||||||||||||||||||||
| Closed block policy liabilities | $ | 1,096,478 | Present value of expenses paid from the open block plus the cost of capital held in support of the liabilities. | Expense assumption | The average expense assumption is between $8.23 and $78.00 per policy, increased by inflation. The annual inflation rate was increased from 2.00% to 2.50%. | Increase | ||||||||||||||||||||||||||||||||
| Nonperformance Risk | 0.65% - 1.90% | Decrease | ||||||||||||||||||||||||||||||||||||
| Unobservable inputs are a market participant’s view of the expenses, a risk margin on the uncertainty of the level of expenses and a cost of capital on the capital held in support of the liabilities. | Expense Risk Margin | 9.42% | Decrease | |||||||||||||||||||||||||||||||||||
| Cost of Capital | 3.69% - 13.85% | Increase | ||||||||||||||||||||||||||||||||||||
| Discounted cash flow | Mortality Rate | 5.46% | Increase | |||||||||||||||||||||||||||||||||||
| Surrender Rate | 2.01% | Increase | ||||||||||||||||||||||||||||||||||||
| Funds withheld payable at interest | $ | (3,419,586) | Discounted cash flow | Duration/Weighted Average Life | 8.5 years | 0.0 years - 17.4 years | Decrease | |||||||||||||||||||||||||||||||
| Contractholder Persistency | 7.17% | 3.80% - 16.50% | Decrease | |||||||||||||||||||||||||||||||||||
| Nonperformance Risk | 0.65% - 1.90% | Decrease | ||||||||||||||||||||||||||||||||||||
| Embedded derivative – indexed universal life products | $ | 315,889 | Policy persistency is a significant unobservable input. | Lapse Rate | 3.41% | Decrease | ||||||||||||||||||||||||||||||||
| Mortality Rate | 0.71% | Decrease | ||||||||||||||||||||||||||||||||||||
| Future costs for options used to hedge the contract obligations | Option Budge Assumption | 3.65% | Increase | |||||||||||||||||||||||||||||||||||
| Nonperformance Risk | 0.65% - 1.90% | Decrease | ||||||||||||||||||||||||||||||||||||
| Level III Liabilities | Fair Value September 30, 2022 | Valuation Methodologies | Unobservable Input(s) (1) | Weighted Average (2) | Range | Impact to Valuation from an Increase in Input (3) | ||||||||||||||||||||||||||||||||
| Embedded derivative – annuity products | $ | 1,472,814 | Policyholder behavior is a significant unobservable input, including utilization and lapse. | Utilization: | ||||||||||||||||||||||||||||||||||
| Fixed-indexed annuity | 4.00% | Decrease | ||||||||||||||||||||||||||||||||||||
| Variable annuity | 4.27% | 2.43% - 32.35% | Decrease | |||||||||||||||||||||||||||||||||||
| Surrender Rate: | |||||||||||||||||||||||||||||||||||
| Fixed-indexed annuity | 10.26% | Decrease |
| Variable annuity | 3.41% - 42.95% | Decrease | |||||||||||||||||||||||||||||||||
| Mortality Rate: | |||||||||||||||||||||||||||||||||||
| Fixed-indexed annuity | 2.18% | Decrease | |||||||||||||||||||||||||||||||||
| Variable annuity | 1.43% - 7.68% | Decrease | |||||||||||||||||||||||||||||||||
| Future costs for options used to hedge the |
| Option Budge Assumption: | |||||||||||||||||||||||||||||||||||
| Retail RIA | 1.58% | Increase |
| Fixed-indexed annuity | 2.14% | Increase | |||||||||||||||||||||||||||||||||
| Variable annuity | n/a | ||||||||||||||||||||||||||||||||||
| Decrease |
(1)In determining certain of these inputs, management evaluates a variety of factors including economic conditions, industry and market developments, market valuations of comparable companies and company specific developments including exit strategies and realization opportunities. KKR has determined that market participants would take these inputs into account when valuing the investments and debt obligations. "LTM" means last twelve months, and "EBITDA" means earnings before interest, taxes, depreciation and amortization. (2)Inputs were weighted based on the fair value of the investments |
| Fair Value Hierarchy | |||||||||||||||||||||||||||||
| As of September 30, 2022 | Carrying Value | Level I | Level II | Level III | Fair Value | ||||||||||||||||||||||||
| ($ in thousands) | |||||||||||||||||||||||||||||
| Financial assets: | |||||||||||||||||||||||||||||
| Insurance | |||||||||||||||||||||||||||||
| Mortgage and other loan receivables | $ | 34,549,619 | $ | — | $ | — | $ | 32,435,175 | $ | 32,435,175 | |||||||||||||||||||
| Policy loans | 812,844 | — | — | 730,492 | 730,492 | ||||||||||||||||||||||||
| FHLB common stock and other investments | 171,759 | — | — | 171,759 | 171,759 | ||||||||||||||||||||||||
| Funds withheld receivables at interest | 2,915,739 | — | 2,915,739 | — | 2,915,739 | ||||||||||||||||||||||||
| Cash and cash equivalents | 4,147,146 | 4,147,146 | — | — | 4,147,146 | ||||||||||||||||||||||||
| Restricted cash and cash equivalents | 369,834 | 369,834 | — | — | 369,834 | ||||||||||||||||||||||||
| Total financial assets | $ | 42,966,941 | $ | 4,516,980 | $ | 2,915,739 | $ | 33,337,426 | $ | 40,770,145 | |||||||||||||||||||
| Financial liabilities: | |||||||||||||||||||||||||||||
| Insurance | |||||||||||||||||||||||||||||
| Other contractholder deposit funds | $ | 37,406,920 | $ | — | $ | 35,208,420 | $ | — | $ | 35,208,420 | |||||||||||||||||||
| Supplementary contracts without life contingencies | 12,326 | — | — | 12,524 | 12,524 | ||||||||||||||||||||||||
| Funding agreements | 2,465,414 | — | — | 2,398,436 | 2,398,436 | ||||||||||||||||||||||||
| Funds withheld payables at interest | 24,483,163 | — | 24,483,163 | — | 24,483,163 | ||||||||||||||||||||||||
| Debt obligations | 1,920,906 | — | — | 1,488,346 | 1,488,346 | ||||||||||||||||||||||||
| Securities sold under agreements to repurchase | 779,469 | — | 779,469 | — | 779,469 | ||||||||||||||||||||||||
| Total financial liabilities | $ | 67,068,198 | $ | — | $ | 60,471,052 | $ | 3,899,306 | $ | 64,370,358 | |||||||||||||||||||
| Fair Value Hierarchy | |||||||||||||||||||||||||||||
| As of December 31, 2021 | Carrying Value | Level I | Level II | Level III | Fair Value | ||||||||||||||||||||||||
| ($ in thousands) | |||||||||||||||||||||||||||||
| Financial assets: | |||||||||||||||||||||||||||||
| Insurance | |||||||||||||||||||||||||||||
| Mortgage and other loan receivables | $ | 28,044,085 | $ | — | $ | — | $ | 28,645,675 | $ | 28,645,675 | |||||||||||||||||||
| Policy loans | 765,310 | — | — | 754,530 | 754,530 | ||||||||||||||||||||||||
| FHLB common stock and other investments | 171,842 | — | — | 171,842 | 171,842 | ||||||||||||||||||||||||
| Funds withheld receivables at interest | 2,967,708 | — | 2,967,708 | — | 2,967,708 | ||||||||||||||||||||||||
| Cash and cash equivalents | 3,391,934 | 3,391,934 | — | — | 3,391,934 | ||||||||||||||||||||||||
| Restricted cash and cash equivalents | 300,404 | 300,404 | — | — | 300,404 | ||||||||||||||||||||||||
| Total financial assets | $ | 35,641,283 | $ | 3,692,338 | $ | 2,967,708 | $ | 29,572,047 | $ | 36,232,093 | |||||||||||||||||||
| Financial liabilities: | |||||||||||||||||||||||||||||
| Insurance | |||||||||||||||||||||||||||||
| Other contractholder deposit funds | $ | 30,295,965 | $ | — | $ | 28,419,520 | $ | — | $ | 28,419,520 | |||||||||||||||||||
| Supplementary contracts without life contingencies | 31,118 | — | — | 31,311 | 31,311 | ||||||||||||||||||||||||
| Funding agreements | 2,566,410 | — | — | 2,549,494 | 2,549,494 | ||||||||||||||||||||||||
| Funds withheld payables at interest | 23,509,744 | — | 23,509,744 | — | 23,509,744 | ||||||||||||||||||||||||
| Debt obligations | 1,908,006 | — | — | 1,953,631 | 1,953,631 | ||||||||||||||||||||||||
| Securities sold under agreements to repurchase | 300,446 | — | 300,446 | — | 300,446 | ||||||||||||||||||||||||
| Total financial liabilities | $ | 58,611,689 | $ | — | $ | 52,229,710 | $ | 4,534,436 | $ | 56,764,146 | |||||||||||||||||||
| September 30, 2022 | December 31, 2021 | ||||||||||||||||||||||||||||||||||||||||||||||
| Assets | |||||||||||||||||||||||||||||||||||||||||||||||
| Asset Management | |||||||||||||||||||||||||||||||||||||||||||||||
| Credit | $ | 1,012,948 | $ | 2,019,229 | |||||||||||||||||||||||||||||||||||||||||||
| Investments of Consolidated CFEs | 21,500,342 | 22,076,809 | |||||||||||||||||||||||||||||||||||||||||||||
| Real Assets | 201,989 | 182,858 | |||||||||||||||||||||||||||||||||||||||||||||
| Equity Method - Other | 2,907,308 | 1,601,515 | |||||||||||||||||||||||||||||||||||||||||||||
| Other Investments | 87,370 | 197,675 | |||||||||||||||||||||||||||||||||||||||||||||
| Total Asset Management | $ | 25,709,957 | $ | 26,078,086 | |||||||||||||||||||||||||||||||||||||||||||
| Insurance | |||||||||||||||||||||||||||||||||||||||||||||||
| Mortgage and other loan receivables | $ | 870,475 | $ | 832,674 | |||||||||||||||||||||||||||||||||||||||||||
| Other investments | 184,410 | 147,811 | |||||||||||||||||||||||||||||||||||||||||||||
| Reinsurance recoverable | 1,069,497 | 1,293,791 | |||||||||||||||||||||||||||||||||||||||||||||
| Total Insurance | $ | 2,124,382 | $ | 2,274,276 | |||||||||||||||||||||||||||||||||||||||||||
| Total Assets | $ | 27,834,339 | $ | 28,352,362 | |||||||||||||||||||||||||||||||||||||||||||
| Liabilities | |||||||||||||||||||||||||||||||||||||||||||||||
| Asset Management | |||||||||||||||||||||||||||||||||||||||||||||||
| Debt Obligations of Consolidated CFEs | $ | 21,118,566 | $ | 21,271,084 | |||||||||||||||||||||||||||||||||||||||||||
| Total Asset Management | $ | 21,118,566 | $ | 21,271,084 | |||||||||||||||||||||||||||||||||||||||||||
| Insurance | |||||||||||||||||||||||||||||||||||||||||||||||
| Policy liabilities | $ | 1,514,341 | $ | 1,869,678 | |||||||||||||||||||||||||||||||||||||||||||
| Total Insurance | $ | 1,514,341 | $ | 1,869,678 | |||||||||||||||||||||||||||||||||||||||||||
| Total Liabilities | $ | 22,632,907 | $ | 23,140,762 | |||||||||||||||||||||||||||||||||||||||||||
| September 30, 2017 | December 31, 2016 | ||||||
| Assets | |||||||
| Private Equity | $ | 573,555 | $ | 96,721 | |||
| Credit | 3,338,434 | 1,392,525 | |||||
| Investments of Consolidated CFEs | 15,500,898 | 13,950,897 | |||||
| Real Assets | 400,991 | 247,376 | |||||
| Equity Method | 760,998 | 791,418 | |||||
| Other | 374,271 | 240,343 | |||||
| Total | $ | 20,949,147 | $ | 16,719,280 | |||
| Liabilities | |||||||
| Debt Obligations of Consolidated CFEs | $ | 15,083,900 | $ | 13,858,288 | |||
| Total | $ | 15,083,900 | $ | 13,858,288 | |||
| Three Months Ended September 30, 2022 | Three Months Ended September 30, 2021 | |||||||||||||||||||||||||||||||||||||||||||||||||||||||||||||||||||||||||
| Net Realized Gains (Losses) | Net Unrealized Gains (Losses) | Total | Net Realized Gains (Losses) | Net Unrealized Gains (Losses) | Total | |||||||||||||||||||||||||||||||||||||||||||||||||||||||||||||||||||||
| Assets | ||||||||||||||||||||||||||||||||||||||||||||||||||||||||||||||||||||||||||
| Asset Management | ||||||||||||||||||||||||||||||||||||||||||||||||||||||||||||||||||||||||||
| Credit | $ | (33,528) | $ | (8,923) | $ | (42,451) | $ | 19,414 | $ | 7,639 | $ | 27,053 | ||||||||||||||||||||||||||||||||||||||||||||||||||||||||||||||
| Investments of Consolidated CFEs | (29,402) | 30,765 | 1,363 | 23,198 | (15,013) | 8,185 | ||||||||||||||||||||||||||||||||||||||||||||||||||||||||||||||||||||
| Real Assets | — | (5,084) | (5,084) | 391 | 7,591 | 7,982 | ||||||||||||||||||||||||||||||||||||||||||||||||||||||||||||||||||||
| Equity Method - Other | 17,381 | (108,899) | (91,518) | 293,819 | (263,841) | 29,978 | ||||||||||||||||||||||||||||||||||||||||||||||||||||||||||||||||||||
| Other Investments | 644 | (2,098) | (1,454) | 11,175 | 1,062 | 12,237 | ||||||||||||||||||||||||||||||||||||||||||||||||||||||||||||||||||||
| Total Asset Management | $ | (44,905) | $ | (94,239) | $ | (139,144) | $ | 347,997 | $ | (262,562) | $ | 85,435 | ||||||||||||||||||||||||||||||||||||||||||||||||||||||||||||||
| Insurance | ||||||||||||||||||||||||||||||||||||||||||||||||||||||||||||||||||||||||||
| Mortgage and other loan receivables | $ | — | $ | (17,086) | $ | (17,086) | $ | — | $ | 3,613 | $ | 3,613 | ||||||||||||||||||||||||||||||||||||||||||||||||||||||||||||||
| Other investments | — | 1,554 | 1,554 | — | 317,542 | 317,542 | ||||||||||||||||||||||||||||||||||||||||||||||||||||||||||||||||||||
| Total Insurance | $ | — | $ | (15,532) | $ | (15,532) | $ | — | $ | 321,155 | $ | 321,155 | ||||||||||||||||||||||||||||||||||||||||||||||||||||||||||||||
| Total Assets | $ | (44,905) | $ | (109,771) | $ | (154,676) | $ | 347,997 | $ | 58,593 | $ | 406,590 | ||||||||||||||||||||||||||||||||||||||||||||||||||||||||||||||
| Liabilities | ||||||||||||||||||||||||||||||||||||||||||||||||||||||||||||||||||||||||||
| Asset Management | ||||||||||||||||||||||||||||||||||||||||||||||||||||||||||||||||||||||||||
| Debt Obligations of Consolidated CFEs | $ | — | $ | (78,168) | $ | (78,168) | $ | 10,278 | $ | (10,437) | $ | (159) | ||||||||||||||||||||||||||||||||||||||||||||||||||||||||||||||
| Total Asset Management | $ | — | $ | (78,168) | $ | (78,168) | $ | 10,278 | $ | (10,437) | $ | (159) | ||||||||||||||||||||||||||||||||||||||||||||||||||||||||||||||
| Insurance | ||||||||||||||||||||||||||||||||||||||||||||||||||||||||||||||||||||||||||
| Policy liabilities | $ | — | $ | 43,578 | $ | 43,578 | $ | — | $ | (3,463) | $ | (3,463) | ||||||||||||||||||||||||||||||||||||||||||||||||||||||||||||||
| Total Insurance | $ | — | $ | 43,578 | $ | 43,578 | $ | — | $ | (3,463) | $ | (3,463) | ||||||||||||||||||||||||||||||||||||||||||||||||||||||||||||||
| Total Liabilities | $ | — | $ | (34,590) | $ | (34,590) | $ | 10,278 | $ | (13,900) | $ | (3,622) | ||||||||||||||||||||||||||||||||||||||||||||||||||||||||||||||
| Nine Months Ended September 30, 2022 | Nine Months Ended September 30, 2021 | |||||||||||||||||||||||||||||||||||||||||||||||||||||||||||||||||||||||||
| Net Realized Gains (Losses) | Net Unrealized Gains (Losses) | Total | Net Realized Gains (Losses) | Net Unrealized Gains (Losses) | Total | |||||||||||||||||||||||||||||||||||||||||||||||||||||||||||||||||||||
| Assets | ||||||||||||||||||||||||||||||||||||||||||||||||||||||||||||||||||||||||||
| Asset Management | ||||||||||||||||||||||||||||||||||||||||||||||||||||||||||||||||||||||||||
| Credit | $ | (95,485) | $ | (24,674) | $ | (120,159) | $ | 1,573 | $ | 15,543 | $ | 17,116 | ||||||||||||||||||||||||||||||||||||||||||||||||||||||||||||||
| Investments of Consolidated CFEs | (26,248) | (1,713,464) | (1,739,712) | 44,954 | 173,775 | 218,729 | ||||||||||||||||||||||||||||||||||||||||||||||||||||||||||||||||||||
| Real Assets | 85 | 19,131 | 19,216 | 566 | 18,448 | 19,014 | ||||||||||||||||||||||||||||||||||||||||||||||||||||||||||||||||||||
| Equity Method - Other | 19,562 | (279,790) | (260,228) | 368,931 | (71,179) | 297,752 | ||||||||||||||||||||||||||||||||||||||||||||||||||||||||||||||||||||
| Other Investments | 6,766 | (8,647) | (1,881) | 16,581 | 17,627 | 34,208 | ||||||||||||||||||||||||||||||||||||||||||||||||||||||||||||||||||||
| Total Asset Management | $ | (95,320) | $ | (2,007,444) | $ | (2,102,764) | $ | 432,605 | $ | 154,214 | $ | 586,819 | ||||||||||||||||||||||||||||||||||||||||||||||||||||||||||||||
| Insurance | ||||||||||||||||||||||||||||||||||||||||||||||||||||||||||||||||||||||||||
| Mortgage and other loan receivables | $ | — | $ | (70,881) | $ | (70,881) | $ | — | $ | 9,443 | $ | 9,443 | ||||||||||||||||||||||||||||||||||||||||||||||||||||||||||||||
| Other investments | — | 39,385 | 39,385 | — | 353,112 | 353,112 | ||||||||||||||||||||||||||||||||||||||||||||||||||||||||||||||||||||
| Total Insurance | $ | — | $ | (31,496) | $ | (31,496) | $ | — | $ | 362,555 | $ | 362,555 | ||||||||||||||||||||||||||||||||||||||||||||||||||||||||||||||
| Total Assets | $ | (95,320) | $ | (2,038,940) | $ | (2,134,260) | $ | 432,605 | $ | 516,769 | $ | 949,374 | ||||||||||||||||||||||||||||||||||||||||||||||||||||||||||||||
| Liabilities | ||||||||||||||||||||||||||||||||||||||||||||||||||||||||||||||||||||||||||
| Asset Management | ||||||||||||||||||||||||||||||||||||||||||||||||||||||||||||||||||||||||||
| Debt Obligations of Consolidated CFEs | $ | (785) | $ | 1,477,514 | $ | 1,476,729 | $ | 9,740 | $ | (82,107) | (72,367) | |||||||||||||||||||||||||||||||||||||||||||||||||||||||||||||||
| Total Asset Management | $ | (785) | $ | 1,477,514 | $ | 1,476,729 | $ | 9,740 | $ | (82,107) | $ | (72,367) | ||||||||||||||||||||||||||||||||||||||||||||||||||||||||||||||
| Insurance | ||||||||||||||||||||||||||||||||||||||||||||||||||||||||||||||||||||||||||
| Policy liabilities | $ | — | $ | 87,635 | $ | 87,635 | $ | — | $ | (89,184) | $ | (89,184) | ||||||||||||||||||||||||||||||||||||||||||||||||||||||||||||||
| Total Insurance | $ | — | $ | 87,635 | $ | 87,635 | $ | — | $ | (89,184) | $ | (89,184) | ||||||||||||||||||||||||||||||||||||||||||||||||||||||||||||||
| Total Liabilities | $ | (785) | $ | 1,565,149 | $ | 1,564,364 | $ | 9,740 | $ | (171,291) | $ | (161,551) | ||||||||||||||||||||||||||||||||||||||||||||||||||||||||||||||
| Nine Months Ended September 30, | |||||||||||
| 2022 | 2021 | ||||||||||
| Balance, as of beginning of period | $ | 447,886 | $ | — | |||||||
| Acquisition/reinsurance | — | 51,322 | |||||||||
| Deferrals | 361,864 | 259,203 | |||||||||
Amortized to expense during the period(1) | (69,104) | (13,016) | |||||||||
| Adjustment for unrealized investment-related losses (gains) during the period | (17,848) | 4,907 | |||||||||
| Balance, as of end of period | $ | 722,798 | $ | 302,416 | |||||||
| Nine Months Ended September 30, | |||||||||||
| 2022 | 2021 | ||||||||||
| Balance, as of beginning of period | $ | 959,263 | $ | 1,024,520 | |||||||
Amortized to expense during the period(1) | (49,978) | (47,866) | |||||||||
| Balance, as of end of period | $ | 909,285 | $ | 976,654 | |||||||
| Nine Months Ended September 30, | |||||||||||
| 2022 | 2021 | ||||||||||
| Balance, as of beginning of period | $ | 1,118,716 | $ | 1,273,414 | |||||||
Amortized to expense during the period(1) | (105,389) | (118,291) | |||||||||
| Balance, as of end of period | $ | 1,013,327 | $ | 1,155,123 | |||||||
| Nine Months Ended September 30, | |||||||||||
| 2022 | 2021 | ||||||||||
| Balance, as of beginning of period | $ | 33,603 | $ | — | |||||||
| Deferrals | 52,563 | 41,000 | |||||||||
Amortized to expense during the period(1) | (17,965) | (1,302) | |||||||||
| Adjustment for unrealized investment-related gains during the period | (68,201) | (4,100) | |||||||||
| Balance, as of end of period | $ | — | $ | 35,598 | |||||||
| September 30, 2022 | December 31, 2021 | ||||||||||
| Policy liabilities: | |||||||||||
| Direct | $ | 70,525,068 | $ | 67,131,818 | |||||||
| Assumed | 65,208,800 | 59,388,226 | |||||||||
| Total policy liabilities | 135,733,868 | 126,520,044 | |||||||||
Ceded(1) | (26,107,505) | (25,035,228) | |||||||||
| Net policy liabilities | $ | 109,626,363 | $ | 101,484,816 | |||||||
| As of September 30, 2022 | As of December 31, 2021 | ||||||||||||||||||||||||||||||||||
A.M. Best Rating(1) | Reinsurance recoverable and funds withheld receivable at interest(2) | Credit enhancements(3) | Net reinsurance credit exposure(4) | Reinsurance recoverable and funds withheld receivable at interest(2) | Credit enhancements(3) | Net reinsurance credit exposure(4) | |||||||||||||||||||||||||||||
| A++ | $ | 38,059 | $ | — | $ | 38,059 | $ | 7,911 | $ | — | $ | 7,911 | |||||||||||||||||||||||
| A+ | 1,813,199 | — | 1,813,199 | 1,989,426 | — | 1,989,426 | |||||||||||||||||||||||||||||
| A | 2,581,882 | — | 2,581,882 | 2,652,286 | — | 2,652,286 | |||||||||||||||||||||||||||||
| A- | 5,475,628 | 4,318,794 | 1,156,834 | 5,645,633 | 5,166,559 | 479,074 | |||||||||||||||||||||||||||||
| B++ | 51,917 | — | 51,917 | 33,410 | — | 33,410 | |||||||||||||||||||||||||||||
| B+ | — | — | — | 1,122 | — | 1,122 | |||||||||||||||||||||||||||||
| B | — | — | — | 9,227 | — | 9,227 | |||||||||||||||||||||||||||||
| B- | (207) | — | — | 1,274 | — | 1,274 | |||||||||||||||||||||||||||||
Not rated(5) | 19,214,936 | 16,744,782 | 2,470,154 | 17,698,613 | 18,323,795 | — | |||||||||||||||||||||||||||||
| Total | $ | 29,175,414 | $ | 21,063,576 | $ | 8,112,045 | $ | 28,038,902 | $ | 23,490,354 | $ | 5,173,730 | |||||||||||||||||||||||
| Three Months Ended September 30, | Nine Months Ended September 30, | ||||||||||||||||||||||
| 2022 | 2021 | 2022 | 2021 | ||||||||||||||||||||
| Net premiums: | |||||||||||||||||||||||
| Direct | $ | 21,236 | $ | 28,509 | $ | 85,842 | $ | 74,959 | |||||||||||||||
Assumed(1) | 829,585 | 1,908,614 | 1,533,459 | 3,778,810 | |||||||||||||||||||
| Ceded | (370,359) | (962,220) | (992,197) | (2,154,857) | |||||||||||||||||||
| Net premiums | $ | 480,462 | $ | 974,903 | $ | 627,104 | $ | 1,698,912 | |||||||||||||||
| Three Months Ended September 30, | Nine Months Ended September 30, | ||||||||||||||||||||||
| 2022 | 2021 | 2022 | 2021 | ||||||||||||||||||||
| Policy fees: | |||||||||||||||||||||||
| Direct | $ | 237,755 | $ | 233,029 | $ | 723,590 | $ | 614,910 | |||||||||||||||
Assumed(1) | 99,204 | 77,694 | 268,719 | 210,411 | |||||||||||||||||||
| Ceded | (16,753) | (342) | (27,960) | (995) | |||||||||||||||||||
| Net policy fees | $ | 320,206 | $ | 310,381 | $ | 964,349 | $ | 824,326 | |||||||||||||||
| Three Months Ended September 30, | Nine Months Ended September 30, | ||||||||||||||||||||||
| 2022 | 2021 | 2022 | 2021 | ||||||||||||||||||||
| Net policy benefits and claims: | |||||||||||||||||||||||
| Direct | $ | 429,511 | $ | 554,134 | $ | 695,543 | $ | 1,996,642 | |||||||||||||||
Assumed(1) | 1,146,895 | 2,254,670 | 2,180,471 | 3,987,189 | |||||||||||||||||||
| Ceded | (488,675) | (1,111,758) | (1,107,630) | (2,390,268) | |||||||||||||||||||
| Net policy benefits and claims | $ | 1,087,731 | $ | 1,697,046 | $ | 1,768,384 | $ | 3,593,563 | |||||||||||||||
| Three Months Ended September 30, 2017 | Three Months Ended September 30, 2016 | ||||||||||||||||||||||
Net Realized Gains (Losses) | Net Unrealized Gains (Losses) | Total | Net Realized Gains (Losses) | Net Unrealized Gains (Losses) | Total | ||||||||||||||||||
| Assets | |||||||||||||||||||||||
| Private Equity | $ | 2,981 | $ | (6,692 | ) | $ | (3,711 | ) | $ | — | $ | (446 | ) | $ | (446 | ) | |||||||
| Credit | 6,878 | (10,835 | ) | (3,957 | ) | (31,310 | ) | 12,376 | (18,934 | ) | |||||||||||||
| Investments of Consolidated CFEs | (83,797 | ) | 43,905 | (39,892 | ) | (18,697 | ) | 40,049 | 21,352 | ||||||||||||||
| Real Assets | 12,611 | 10,498 | 23,109 | 2,945 | (2,051 | ) | 894 | ||||||||||||||||
| Equity Method | 6,282 | (29 | ) | 6,253 | 225 | 42,525 | 42,750 | ||||||||||||||||
| Other | (5,457 | ) | 12,348 | 6,891 | (762 | ) | (11,016 | ) | (11,778 | ) | |||||||||||||
| Total | $ | (60,502 | ) | $ | 49,195 | $ | (11,307 | ) | $ | (47,599 | ) | $ | 81,437 | $ | 33,838 | ||||||||
| Liabilities | |||||||||||||||||||||||
| Debt Obligations of Consolidated CFEs | 13,403 | 24,483 | 37,886 | 107,844 | 68,658 | 176,502 | |||||||||||||||||
| Total | $ | 13,403 | $ | 24,483 | $ | 37,886 | $ | 107,844 | $ | 68,658 | $ | 176,502 | |||||||||||
| Nine Months Ended September 30, 2017 | Nine Months Ended September 30, 2016 | ||||||||||||||||||||||
Net Realized Gains (Losses) | Net Unrealized Gains (Losses) | Total | Net Realized Gains (Losses) | Net Unrealized Gains (Losses) | Total | ||||||||||||||||||
| Assets | |||||||||||||||||||||||
| Private Equity | $ | 3,670 | $ | 33,803 | $ | 37,473 | $ | — | $ | (2,744 | ) | $ | (2,744 | ) | |||||||||
| Credit | (401,720 | ) | 74,003 | (327,717 | ) | (26,293 | ) | (29,662 | ) | (55,955 | ) | ||||||||||||
| Investments of Consolidated CFEs | (88,677 | ) | 71,952 | (16,725 | ) | (239,502 | ) | 547,099 | 307,597 | ||||||||||||||
| Real Assets | 12,425 | 58,108 | 70,533 | 2,945 | 8,544 | 11,489 | |||||||||||||||||
| Equity Method | 6,908 | (3,075 | ) | 3,833 | (1,766 | ) | (58,572 | ) | (60,338 | ) | |||||||||||||
| Other | (27,602 | ) | 25,158 | (2,444 | ) | (2,578 | ) | (30,013 | ) | (32,591 | ) | ||||||||||||
| Total | $ | (494,996 | ) | $ | 259,949 | $ | (235,047 | ) | $ | (267,194 | ) | $ | 434,652 | $ | 167,458 | ||||||||
| Liabilities | |||||||||||||||||||||||
| Debt Obligations of Consolidated CFEs | 53,849 | (30,490 | ) | 23,359 | 210,386 | (378,505 | ) | (168,119 | ) | ||||||||||||||
| Total | $ | 53,849 | $ | (30,490 | ) | $ | 23,359 | $ | 210,386 | $ | (378,505 | ) | $ | (168,119 | ) | ||||||||
| Three Months Ended September 30, | Nine Months Ended September 30, | ||||||||||||||||||||||||||||||||||||||||||||||||||||
| 2022 | 2021 | 2022 | 2021 | ||||||||||||||||||||||||||||||||||||||||||||||||||
| Net Income (Loss) Available to KKR & Co. Inc. Common Stockholders - Basic | $ | (91,646) | $ | 1,131,354 | $ | (993,350) | $ | 4,053,271 | |||||||||||||||||||||||||||||||||||||||||||||
(+) Series C Mandatory Convertible Preferred Dividend (if dilutive) (1) | — | 17,250 | — | 51,750 | |||||||||||||||||||||||||||||||||||||||||||||||||
| Net Income (Loss) Available to KKR & Co. Inc. Common Stockholders - Diluted | $ | (91,646) | $ | 1,148,604 | $ | (993,350) | $ | 4,105,021 | |||||||||||||||||||||||||||||||||||||||||||||
| Three Months Ended September 30, | Nine Months Ended September 30, | ||||||||||||||
| 2017 | 2016 | 2017 | 2016 | ||||||||||||
| Net Income (Loss) Attributable to KKR & Co. L.P. Common Unitholders | $ | 153,563 | $ | 352,152 | $ | 818,552 | $ | 116,103 | |||||||
| Basic Net Income (Loss) Per Share of Common Stock | |||||||||||||||||||||||||||||||||||||||||||||||||||||
| Weighted Average Shares of Common Stock Outstanding - Basic | 859,833,444 | 583,030,506 | 711,908,107 | 580,742,033 | |||||||||||||||||||||||||||||||||||||||||||||||||
| Net Income (Loss) Attributable to KKR & Co. Inc. Per Share of Common Stock - Basic | $ | (0.11) | $ | 1.94 | $ | (1.40) | $ | 6.98 | |||||||||||||||||||||||||||||||||||||||||||||
| Basic Net Income (Loss) Per Common Unit | |||||||||||||||
| Weighted Average Common Units Outstanding - Basic | 471,758,886 | 445,989,300 | 463,941,084 | 448,149,747 | |||||||||||
| Net Income (Loss) Attributable to KKR & Co. L.P. Per Common Unit - Basic | $ | 0.33 | $ | 0.79 | $ | 1.76 | $ | 0.26 | |||||||
| Diluted Net Income (Loss) Per Share of Common Stock | |||||||||||||||||||||||||||||||||||||||||||||||||||||
| Weighted Average Shares of Common Stock Outstanding - Basic | 859,833,444 | 583,030,506 | 711,908,107 | 580,742,033 | |||||||||||||||||||||||||||||||||||||||||||||||||
| Incremental Common Shares: | |||||||||||||||||||||||||||||||||||||||||||||||||||||
Assumed vesting of dilutive equity awards (2) | — | 27,562,994 | — | 22,055,422 | |||||||||||||||||||||||||||||||||||||||||||||||||
Assumed conversion of Series C Mandatory Convertible Preferred Stock (1) | — | 26,822,600 | — | 26,822,600 | |||||||||||||||||||||||||||||||||||||||||||||||||
| Weighted Average Shares of Common Stock Outstanding - Diluted | 859,833,444 | 637,416,100 | 711,908,107 | 629,620,055 | |||||||||||||||||||||||||||||||||||||||||||||||||
| Net Income (Loss) Attributable to KKR & Co. Inc. Per Share of Common Stock - Diluted | $ | (0.11) | $ | 1.80 | $ | (1.40) | $ | 6.52 | |||||||||||||||||||||||||||||||||||||||||||||
| Diluted Net Income (Loss) Per Common Unit | |||||||||||||||
| Weighted Average Common Units Outstanding - Basic | 471,758,886 | 445,989,300 | 463,941,084 | 448,149,747 | |||||||||||
| Weighted Average Unvested Common Units and Other Exchangeable Securities | 35,114,291 | 33,986,375 | 37,674,551 | 34,985,238 | |||||||||||
| Weighted Average Common Units Outstanding - Diluted | 506,873,177 | 479,975,675 | 501,615,635 | 483,134,985 | |||||||||||
| Net Income (Loss) Attributable to KKR & Co. L.P. Per Common Unit - Diluted | $ | 0.30 | $ | 0.73 | $ | 1.63 | $ | 0.24 | |||||||
| Three Months Ended September 30, | Nine Months Ended September 30, | ||||||||||
| 2017 | 2016 | 2017 | 2016 | ||||||||
| Weighted Average KKR Holdings Units Outstanding | 341,214,527 | 357,528,999 | 346,716,489 | 358,853,469 | |||||||
| Three Months Ended September 30, | Nine Months Ended September 30, | |||||||||||||||||||||||||||||||||||||||||||||||||||||||||||||
| 2022 | 2021 | 2022 | 2021 | |||||||||||||||||||||||||||||||||||||||||||||||||||||||||||
| Weighted Average KKR Holdings Units | — | 271,027,751 | 143,082,708 | 272,674,225 | ||||||||||||||||||||||||||||||||||||||||||||||||||||||||||
| Weighted Average RHUs | 2,465,810 | 1,222,489 | 2,102,758 | 1,128,451 | ||||||||||||||||||||||||||||||||||||||||||||||||||||||||||
| Total | 2,465,810 | 272,250,240 | 145,185,466 | 273,802,676 | ||||||||||||||||||||||||||||||||||||||||||||||||||||||||||
| September 30, 2022 | December 31, 2021 | ||||||||||
| Asset Management | |||||||||||
Unsettled Investment Sales (1) | $ | 82,121 | $ | 182,267 | |||||||
| Receivables | 54,314 | 81,133 | |||||||||
Due from Broker (2) | 106,228 | 365,053 | |||||||||
| Deferred Tax Assets, net (See Note 18) | 52,145 | 85,770 | |||||||||
| Interest Receivable | 170,778 | 144,221 | |||||||||
Fixed Assets, net (3) | 843,630 | 820,143 | |||||||||
Foreign Exchange Contracts and Options (4) | 1,016,135 | 590,637 | |||||||||
Goodwill (5) | 546,144 | 83,500 | |||||||||
Intangible Assets (6) | 1,583,876 | 5,575 | |||||||||
| Derivative Assets | 39,887 | 491 | |||||||||
| Prepaid Taxes | 198,575 | 93,296 | |||||||||
| Prepaid Expenses | 59,839 | 29,290 | |||||||||
Operating Lease Right of Use Assets (7) | 229,339 | 228,363 | |||||||||
| Deferred Financing Costs | 17,404 | 17,953 | |||||||||
| Other | 176,627 | 158,621 | |||||||||
| Total Asset Management | $ | 5,177,042 | $ | 2,886,313 | |||||||
| Insurance | |||||||||||
Unsettled Investment Sales(1) | $ | 1,730,201 | $ | 941,427 | |||||||
| Deferred Tax Assets, net | 2,698,280 | 755,876 | |||||||||
| Derivative Assets | 850,274 | 1,295,950 | |||||||||
| Accrued Investment Income | 1,078,161 | 817,486 | |||||||||
Goodwill (9) | 501,496 | 501,496 | |||||||||
Intangible Assets and Deferred Sales Inducements(8) | 280,588 | 293,824 | |||||||||
Operating Lease Right of Use Assets(7) | 177,624 | 160,888 | |||||||||
| Premiums and Other Account Receivables | 113,700 | 86,524 | |||||||||
| Other | 109,265 | 96,093 | |||||||||
| Current Income Tax Recoverable | 190,804 | 103,954 | |||||||||
| Total Insurance | $ | 7,730,393 | $ | 5,053,518 | |||||||
| Total Other Assets | $ | 12,907,435 | $ | 7,939,831 | |||||||
| September 30, 2017 | December 31, 2016 | ||||||
Unsettled Investment Sales (1) | $ | 200,470 | $ | 144,600 | |||
| Receivables | 172,788 | 49,279 | |||||
Due from Broker (2) | 819,492 | 1,084,602 | |||||
Oil & Gas Assets, net (3) | 258,431 | 276,694 | |||||
| Deferred Tax Assets, net | 281,583 | 286,948 | |||||
| Interest Receivable | 215,338 | 158,511 | |||||
Fixed Assets, net (4) | 341,800 | 283,262 | |||||
Foreign Exchange Contracts and Options (5) | 100,460 | 240,627 | |||||
Intangible Assets, net (6) | 17,438 | 135,024 | |||||
Goodwill (6) | 83,500 | 89,000 | |||||
| Derivative Assets | 62,897 | 81,593 | |||||
| Deferred Transaction Related Expenses | 56,322 | 17,688 | |||||
| Prepaid Taxes | 46,085 | 46,996 | |||||
| Prepaid Expenses | 30,150 | 17,761 | |||||
| Deferred Financing Costs | 8,747 | 10,507 | |||||
| Other | 63,821 | 73,773 | |||||
| Total | $ | 2,759,322 | $ | 2,996,865 | |||
| September 30, 2022 | December 31, 2021 | ||||||||||
| Asset Management | |||||||||||
Amounts Payable to Carry Pool (1) | $ | 1,998,211 | $ | 3,650,312 | |||||||
Unsettled Investment Purchases (2) | 426,891 | 1,315,163 | |||||||||
Securities Sold Short (3) | 87,894 | 249,383 | |||||||||
| Derivative Liabilities | 20,249 | 45,003 | |||||||||
| Accrued Compensation and Benefits | 950,105 | 210,789 | |||||||||
| Interest Payable | 275,213 | 162,801 | |||||||||
Foreign Exchange Contracts and Options (4) | 242,117 | 319,511 | |||||||||
| Accounts Payable and Accrued Expenses | 236,313 | 187,564 | |||||||||
| Taxes Payable | 50,831 | 42,745 | |||||||||
| Uncertain Tax Positions | 57,306 | 78,226 | |||||||||
| Unfunded Revolver Commitments | 108,195 | 64,276 | |||||||||
Operating Lease Liabilities (5) | 233,953 | 230,995 | |||||||||
| Deferred Tax Liabilities, net (See Note 18) | 1,923,278 | 900,436 | |||||||||
| Other Liabilities | 524,568 | 439,693 | |||||||||
| Total Asset Management | $ | 7,135,124 | $ | 7,896,897 | |||||||
| Insurance | |||||||||||
Unsettled Investment Purchases(2) | $ | 1,500,351 | $ | 395,722 | |||||||
| Collateral on Derivative Instruments | 429,796 | 1,086,061 | |||||||||
| Accrued Expenses | 603,450 | 747,237 | |||||||||
| Securities Sold Under Agreements to Repurchase | 779,469 | 300,446 | |||||||||
| Derivative Liabilities | 974,229 | 145,163 | |||||||||
| Accrued Employee Related Expenses | 316,293 | 280,668 | |||||||||
Operating Lease Liabilities(5) | 198,052 | 180,574 | |||||||||
| Tax Payable to Former Parent Company | 66,352 | 74,423 | |||||||||
| Interest Payable | 32,321 | 12,930 | |||||||||
| Accounts and Commissions Payable | 18,311 | 26,054 | |||||||||
| Other Tax Related Liabilities | 9,259 | 14,288 | |||||||||
| Total Insurance | $ | 4,927,883 | $ | 3,263,566 | |||||||
| Total Accrued Expenses and Other Liabilities | $ | 12,063,007 | $ | 11,160,463 | |||||||
| September 30, 2017 | December 31, 2016 | ||||||
Amounts Payable to Carry Pool (1) | $ | 1,131,071 | $ | 987,994 | |||
Unsettled Investment Purchases (2) | 811,340 | 722,076 | |||||
Securities Sold Short (3) | 810,698 | 647,234 | |||||
| Derivative Liabilities | 78,821 | 100,015 | |||||
| Accrued Compensation and Benefits | 269,826 | 20,764 | |||||
| Interest Payable | 150,781 | 114,894 | |||||
Foreign Exchange Contracts and Options (4) | 243,595 | 75,218 | |||||
| Accounts Payable and Accrued Expenses | 131,556 | 114,854 | |||||
| Deferred Rent | 18,789 | 19,144 | |||||
| Taxes Payable | 32,271 | 12,514 | |||||
| Redemptions Payable | — | 4,021 | |||||
Due to Broker (5) | — | 83,206 | |||||
| Other Liabilities | 90,934 | 79,326 | |||||
| Total | $ | 3,769,682 | $ | 2,981,260 | |||
| September 30, 2022 | December 31, 2021 | ||||||||||
| Investments - Asset Management | $ | 7,032,596 | $ | 11,539,945 | |||||||
| Due from (to) Affiliates, net | 1,160,053 | 1,046,210 | |||||||||
| Maximum Exposure to Loss - Asset Management | $ | 8,192,649 | $ | 12,586,155 | |||||||
| Other Investment in Partnership - Insurance | $ | 214,396 | $ | 190,106 | |||||||
| Investment in Renewable Partnerships - Insurance | 30,146 | 30,760 | |||||||||
| Maximum Exposure to Loss - Insurance | $ | 244,542 | $ | 220,866 | |||||||
| Total Maximum Exposure to Loss | $ | 8,437,191 | $ | 12,807,021 | |||||||
| September 30, 2017 | December 31, 2016 | ||||||
| Investments | $ | 4,151,598 | $ | 3,632,162 | |||
| Due from (to) Affiliates, net | 134,308 | (60,604 | ) | ||||
| Maximum Exposure to Loss | $ | 4,285,906 | $ | 3,571,558 | |||
| September 30, 2017 | December 31, 2016 | |||||||||||||||||||||||
| Financing Available | Borrowing Outstanding | Fair Value | Financing Available | Borrowing Outstanding | Fair Value | |||||||||||||||||||
| Revolving Credit Facilities: | ||||||||||||||||||||||||
| Corporate Credit Agreement | $ | 1,000,000 | $ | — | $ | — | $ | 1,000,000 | $ | — | $ | — | ||||||||||||
| KCM Credit Agreement | 488,256 | — | — | 500,000 | — | — | ||||||||||||||||||
| KCM Short-Term Credit Agreement | 750,000 | — | — | — | — | — | ||||||||||||||||||
| Notes Issued: | ||||||||||||||||||||||||
KKR Issued 6.375% Notes Due 2020 (1) | — | 498,243 | 556,655 | (10) | — | 497,804 | 562,960 | (10) | ||||||||||||||||
KKR Issued 5.500% Notes Due 2043 (2) | — | 491,412 | 564,560 | (10) | — | 491,158 | 502,800 | (10) | ||||||||||||||||
KKR Issued 5.125% Notes Due 2044 (3) | — | 990,283 | 1,081,200 | (10) | — | 990,009 | 955,240 | (10) | ||||||||||||||||
KFN Issued 5.500% Notes Due 2032 (4) | — | 367,852 | 377,656 | — | — | — | ||||||||||||||||||
KFN Issued 7.500% Notes Due 2042 (5) | — | — | — | — | 123,008 | 116,699 | (11) | |||||||||||||||||
KFN Issued Junior Subordinated Notes (6) | — | 235,684 | 201,400 | — | 250,154 | 210,084 | ||||||||||||||||||
| Other Consolidated Debt Obligations: | ||||||||||||||||||||||||
Fund Financing Facilities and Other (7) | 2,028,972 | 2,623,340 | 2,623,340 | (12) | 2,039,532 | 2,333,654 | 2,333,654 | (12) | ||||||||||||||||
CLO Senior Secured Notes (8) | — | 9,499,495 | 9,499,495 | — | 8,279,812 | 8,279,812 | ||||||||||||||||||
CLO Subordinated Notes (8) | — | 289,222 | 289,222 | — | 283,735 | 283,735 | ||||||||||||||||||
CMBS Debt Obligations (9) | — | 5,295,183 | 5,295,183 | — | 5,294,741 | 5,294,741 | ||||||||||||||||||
| $ | 4,267,228 | $ | 20,290,714 | $ | 20,488,711 | $ | 3,539,532 | $ | 18,544,075 | $ | 18,539,725 | |||||||||||||
| September 30, 2022 | December 31, 2021 | |||||||||||||||||||||||||||||||||||||
| Financing Available | Borrowing Outstanding | Fair Value | Financing Available | Borrowing Outstanding | Fair Value | |||||||||||||||||||||||||||||||||
| Revolving Credit Facilities: | ||||||||||||||||||||||||||||||||||||||
| Corporate Credit Agreement | $ | 1,500,000 | $ | — | $ | — | $ | 1,000,000 | $ | — | $ | — | ||||||||||||||||||||||||||
| KCM Credit Agreement | 723,067 | — | — | 728,799 | — | — | ||||||||||||||||||||||||||||||||
| KCM 364-Day Revolving Credit Agreement | 750,000 | — | — | 750,000 | — | — | ||||||||||||||||||||||||||||||||
Notes Issued: (1) | ||||||||||||||||||||||||||||||||||||||
KKR ¥25 billion (or $173.0 million) 0.509% Notes Due 2023 | (4) | — | 172,856 | 172,886 | — | 216,881 | 216,818 | |||||||||||||||||||||||||||||||
KKR ¥5 billion (or $34.6 million) 0.764% Notes Due 2025 | (4) | — | 34,318 | 34,487 | — | 43,082 | 43,452 | |||||||||||||||||||||||||||||||
KKR ¥36.4 billion (or $251.9 million) 1.054% Notes Due 2027 | (4) | — | 250,529 | 250,550 | — | — | — | |||||||||||||||||||||||||||||||
KKR €650 million (or $632.5 million) 1.625% Notes Due 2029 | (5) | — | 626,547 | 524,289 | — | 729,048 | 776,926 | |||||||||||||||||||||||||||||||
| KKR $750 million 3.750% Notes Due 2029 | (4) | — | 744,000 | 669,000 | — | 743,333 | 825,540 | |||||||||||||||||||||||||||||||
KKR ¥4.9 billion (or $33.9 million) 1.244% Notes Due 2029 | (4) | — | 33,404 | 33,589 | — | — | — | |||||||||||||||||||||||||||||||
| KKR $750 million 4.850% Notes Due 2032 | (4) | — | 741,433 | 690,090 | — | — | — | |||||||||||||||||||||||||||||||
KKR ¥6.2 billion (or $42.9 million) 1.437% Notes Due 2032 | (4) | — | 42,324 | 42,236 | — | — | — | |||||||||||||||||||||||||||||||
KKR ¥7.5 billion (or $51.9 million) 1.553% Notes Due 2034 | (4) | — | 51,240 | 50,743 | — | — | — | |||||||||||||||||||||||||||||||
KKR ¥5.5 billion (or $38.1 million) 1.795% Notes Due 2037 | (4) | — | 37,457 | 36,893 | — | — | — | |||||||||||||||||||||||||||||||
KKR ¥10.3 billion (or $71.3 million) 1.595% Notes Due 2038 | (4) | — | 70,320 | 66,127 | — | 88,505 | 92,198 | |||||||||||||||||||||||||||||||
KKR $500 million 5.500% Notes Due 2043 (6) | (4) | — | 491,927 | 451,810 | — | 491,153 | 661,351 | |||||||||||||||||||||||||||||||
KKR $1.0 billion 5.125% Notes Due 2044 (6) | (4) | — | 964,785 | 836,235 | — | 951,462 | 1,237,888 | |||||||||||||||||||||||||||||||
| KKR $500 million 3.625% Notes Due 2050 | (4) | — | 492,686 | 347,755 | — | 492,486 | 535,550 | |||||||||||||||||||||||||||||||
KKR $750 million 3.500% Notes Due 2050 (6) | (4) | — | 736,328 | 509,665 | — | 735,905 | 784,650 | |||||||||||||||||||||||||||||||
| KKR $750 million 3.250% Notes Due 2051 | (4) | — | 739,745 | 489,195 | — | 739,481 | 747,900 | |||||||||||||||||||||||||||||||
| KKR $500 million 4.625% Notes Due 2061 | (5) | — | 486,310 | 365,600 | — | 486,044 | 523,200 | |||||||||||||||||||||||||||||||
| KFN $500 million 5.500% Notes Due 2032 | (2) | — | 495,389 | 431,939 | — | 495,025 | 487,779 | |||||||||||||||||||||||||||||||
| KFN $120 million 5.200% Notes Due 2033 | (2) | — | 118,743 | 100,094 | — | 118,654 | 115,535 | |||||||||||||||||||||||||||||||
KFN $70 million 5.400% Notes Due 2033 | (2) | — | 69,025 | 59,197 | — | 68,957 | 68,532 | |||||||||||||||||||||||||||||||
KFN Issued Junior Subordinated Notes (3) | (2) | — | 237,135 | 194,404 | — | 236,138 | 178,335 | |||||||||||||||||||||||||||||||
| 2,973,067 | 7,636,501 | 6,356,784 | 2,478,799 | 6,636,154 | 7,295,654 | |||||||||||||||||||||||||||||||||
Other Debt Obligations(6) | 5,728,978 | 30,621,332 | 30,621,332 | 4,941,755 | 30,033,601 | 30,033,601 | ||||||||||||||||||||||||||||||||
| $ | 8,702,045 | $ | 38,257,833 | $ | 36,978,116 | $ | 7,420,554 | $ | 36,669,755 | $ | 37,329,255 | |||||||||||||||||||||||||||
| Financing Available | Borrowing Outstanding | Fair Value | Weighted Average Interest Rate | Weighted Average Remaining Maturity in Years | |||||||||||||||||||||||||
Financing Facilities of Consolidated Funds and Other (1) | $ | 5,728,978 | $ | 9,502,766 | $ | 9,502,766 | 4.2% | 5.4 | |||||||||||||||||||||
| Debt Obligations of Consolidated CLOs | — | 21,118,566 | 21,118,566 | (2) | 10.1 | ||||||||||||||||||||||||
| $ | 5,728,978 | $ | 30,621,332 | $ | 30,621,332 | ||||||||||||||||||||||||
Borrowing Outstanding | Weighted Average Interest Rate | Weighted Average Remaining Maturity in Years | ||||||
| Senior Secured Notes of Consolidated CLOs | $ | 9,499,495 | 2.7 | % | 11.6 | |||
| Subordinated Notes of Consolidated CLOs | 289,222 | (1) | 11.5 | |||||
| Debt Obligations of Consolidated CMBS Vehicles | 5,295,183 | 4.4 | % | 26.9 | ||||
| $ | 15,083,900 | |||||||
| September 30, 2022 | December 31, 2021 | ||||||||||||||||||||||||||||||||||
| Financing Available | Borrowing Outstanding | Fair Value(2) | Financing Available | Borrowing Outstanding | Fair Value(2) | ||||||||||||||||||||||||||||||
| Revolving Credit Facilities: | |||||||||||||||||||||||||||||||||||
| Global Atlantic revolving credit facility, due August 2026 | $ | 800,000 | $ | 200,000 | $ | 200,000 | $ | 1,000,000 | $ | — | $ | — | |||||||||||||||||||||||
| Notes Issued and Others: | |||||||||||||||||||||||||||||||||||
| Global Atlantic senior notes, due October 2029 | 500,000 | 424,950 | 500,000 | 539,350 | |||||||||||||||||||||||||||||||
| Global Atlantic senior notes, due June 2031 | 650,000 | 476,840 | 650,000 | 644,800 | |||||||||||||||||||||||||||||||
| Global Atlantic subordinated debentures, due October 2051 | 750,000 | 565,650 | 750,000 | 761,475 | |||||||||||||||||||||||||||||||
| 2,100,000 | $ | 1,667,440 | 1,900,000 | $ | 1,945,625 | ||||||||||||||||||||||||||||||
Purchase accounting adjustments(1) | 44,063 | 51,050 | |||||||||||||||||||||||||||||||||
| Debt issuance costs, net of accumulated amortization | (17,888) | (18,675) | |||||||||||||||||||||||||||||||||
| Fair value loss (gain) of hedged debt obligations, recognized in earnings | (205,269) | (24,369) | |||||||||||||||||||||||||||||||||
| $ | 1,920,906 | $ | 1,908,006 | ||||||||||||||||||||||||||||||||
| Three Months Ended September 30, | Nine Months Ended September 30, | ||||||||||||||
| 2017 | 2016 | 2017 | 2016 | ||||||||||||
| Equity Incentive Plan Units | $ | 54,921 | $ | 50,270 | $ | 149,840 | $ | 148,257 | |||||||
| KKR Holdings Principal Awards | 17,622 | 7,425 | 89,869 | 21,138 | |||||||||||
| Other Exchangeable Securities | — | 3,460 | — | 10,306 | |||||||||||
| Discretionary Compensation | 6,185 | 397 | 37,995 | 6,331 | |||||||||||
Total (1) | $ | 78,728 | $ | 61,552 | $ | 277,704 | $ | 186,032 | |||||||
| Year | Unrecognized Expense (in millions) | |||
| Remainder of 2017 | $ | 40.1 | ||
| 2018 | 128.7 | |||
| 2019 | 75.4 | |||
| 2020 | 23.9 | |||
| 2021 | 5.1 | |||
| 2022 | 1.5 | |||
| 2023 | 0.9 | |||
| Total | $ | 275.6 | ||
| Shares | Weighted Average Grant Date Fair Value | ||||||||||
| Balance, January 1, 2022 | 19,307,041 | $ | 41.21 | ||||||||
| Granted | 847,666 | 57.10 | |||||||||
| Vested | (3,846,900) | 33.51 | |||||||||
| Forfeitures | (444,554) | 46.63 | |||||||||
| Balance, September 30, 2022 | 15,863,253 | $ | 43.77 | ||||||||
| Units | Weighted Average Grant Date Fair Value | |||||
| Balance, January 1, 2017 | 37,498,333 | $ | 13.85 | |||
| Granted | 3,635,101 | 15.67 | ||||
| Vested | (8,326,078 | ) | 14.79 | |||
| Forfeited | (1,734,984 | ) | 13.72 | |||
| Balance, September 30, 2017 | 31,072,372 | $ | 13.82 | |||
| Weighted Average | Range | |||||||||||||
| $25.70 | $19.87 - $66.80 | |||||||||||||
| $43.04 | $37.93 - $76.31 | |||||||||||||
| 0.55% | 0.41% - 3.46% | |||||||||||||
| 28.16% | 28.00% - 38.00% | |||||||||||||
| 1.41% | 0.76% - 1.53% | |||||||||||||
| 10.59% | ||||||||||||||
| Shares | Weighted Average Grant Date Fair Value | ||||||||||
| Balance, January 1, 2022 | 21,370,847 | $ | 25.03 | ||||||||
| Granted | 550,000 | 51.74 | |||||||||
| Vested | (175,000) | 19.87 | |||||||||
| Forfeitures | (507,887) | 21.21 | |||||||||
| Balance, September 30, 2022 | 21,237,960 | $ | 25.85 | ||||||||
| Grant Date Fair Value | $48.91 | ||||||||||
| Closing KKR share price as of valuation date | $75.76 | ||||||||||
| Risk Free Rate | 1.42 | % | |||||||||
| Volatility | 28.0 | % | |||||||||
| Dividend Yield | 0.77 | % | |||||||||
| Expected Cost of Equity | 9.36 | % | |||||||||
| Nine Months Ended | |||||||||||
| September 30, 2022 | September 30, 2021 | ||||||||||
| Outstanding amount as of beginning of period | $ | 145,000 | $ | — | |||||||
| Pre-acquisition awards converted to book-value awards on February 1, 2021 | — | 89,000 | |||||||||
| Granted | 27,191 | 57,213 | |||||||||
| Forfeited | (4,647) | (5,508) | |||||||||
| Impact of change in book value on outstanding awards | — | 6,597 | |||||||||
| Vested and issued | (49,405) | (31,086) | |||||||||
| Outstanding amount as of end of period | $ | 118,139 | $ | 116,216 | |||||||
| Year | Unrecognized Expense (in millions) | |||
| Remainder of 2017 | $ | 17.4 | ||
| 2018 | 63.0 | |||
| 2019 | 57.3 | |||
| 2020 | 52.4 | |||
| 2021 | 17.1 | |||
| Total | $ | 207.2 | ||
| Units | Weighted Average Grant Date Fair Value | |||||
| Balance, January 1, 2017 | 28,245,886 | $ | 12.10 | |||
| Granted | — | — | ||||
| Vested | (5,968,939 | ) | 13.97 | |||
| Forfeited | (1,537,807 | ) | 11.76 | |||
| Balance, September 30, 2017 | 20,739,140 | $ | 11.59 | |||
| September 30, 2022 | December 31, 2021 | |||||||||||||||||
| Amounts due from unconsolidated investment funds | Amounts due from unconsolidated investment funds | $ | 1,204,863 | $ | 1,109,769 | |||||||||||||
| Amounts due from portfolio companies | Amounts due from portfolio companies | 165,830 | 114,514 | |||||||||||||||
| September 30, 2017 | December 31, 2016 | |||||||||||||||||
| Amounts due from portfolio companies | $ | 105,277 | $ | 66,940 | ||||||||||||||
| Amounts due from unconsolidated investment funds | 371,726 | 170,219 | ||||||||||||||||
| Amounts due from related entities | 7,001 | 13,293 | ||||||||||||||||
| Due from Affiliates | $ | 484,004 | $ | 250,452 | Due from Affiliates | $ | 1,370,693 | $ | 1,224,283 | |||||||||
| September 30, 2022 | December 31, 2021 | ||||||||||||||||
Amounts due to current and former employees under the tax receivable agreement (1) | $ | 400,062 | $ | 399,163 | |||||||||||||
| Amounts due to unconsolidated investment funds | 44,810 | 63,559 | |||||||||||||||
| Due to Affiliates | $ | 444,872 | $ | 462,722 | |||||||||||||
| September 30, 2017 | December 31, 2016 | ||||||
| Amounts due to KKR Holdings in connection with the tax receivable agreement | $ | 141,891 | $ | 128,091 | |||
| Amounts due to unconsolidated investment funds | 237,418 | 230,823 | |||||
| Amounts due to related entities | 500 | 565 | |||||
| Due to Affiliates | $ | 379,809 | $ | 359,479 | |||
| Three Months Ended September 30, | Nine Months Ended September 30, | ||||||||||||||||||||||||||||
| 2022 | 2021 | 2022 | 2021 | ||||||||||||||||||||||||||
| Asset Management | |||||||||||||||||||||||||||||
Management Fees (1) | $ | 670,534 | $ | 559,016 | $ | 1,950,389 | $ | 1,478,878 | |||||||||||||||||||||
| Transaction and Monitoring Fees, Net | 167,455 | 249,670 | 580,794 | 645,108 | |||||||||||||||||||||||||
| Fee Related Performance Revenues | 49,924 | 9,897 | 71,974 | 34,760 | |||||||||||||||||||||||||
| Fee Related Compensation | (199,780) | (184,224) | (585,748) | (485,760) | |||||||||||||||||||||||||
| Other Operating Expenses | (146,370) | (104,772) | (409,489) | (309,483) | |||||||||||||||||||||||||
| Fee Related Earnings | 541,763 | 529,587 | 1,607,920 | 1,363,503 | |||||||||||||||||||||||||
| Realized Performance Income | 497,860 | 432,784 | 1,837,925 | 1,222,403 | |||||||||||||||||||||||||
| Realized Performance Income Compensation | (322,927) | (274,955) | (1,180,990) | (797,965) | |||||||||||||||||||||||||
Realized Investment Income (2) | 284,979 | 447,565 | 911,221 | 1,277,701 | |||||||||||||||||||||||||
| Realized Investment Income Compensation | (42,747) | (67,142) | (136,683) | (191,663) | |||||||||||||||||||||||||
| Asset Management Segment Operating Earnings | 958,928 | 1,067,839 | 3,039,393 | 2,873,979 | |||||||||||||||||||||||||
| Insurance | |||||||||||||||||||||||||||||
Net Investment Income (1) (2) | 1,054,757 | 771,982 | 2,881,567 | 1,977,383 | |||||||||||||||||||||||||
| Net Cost of Insurance | (642,443) | (436,415) | (1,664,664) | (1,076,566) | |||||||||||||||||||||||||
| General, Administrative and Other | (161,242) | (139,489) | (472,795) | (338,325) | |||||||||||||||||||||||||
| Pre-tax Insurance Operating Earnings | 251,072 | 196,078 | 744,108 | 562,492 | |||||||||||||||||||||||||
| Income Taxes | (44,468) | (9,046) | (125,927) | (63,148) | |||||||||||||||||||||||||
| Net Income Attributable to Noncontrolling Interest | (79,582) | (72,043) | (238,118) | (193,570) | |||||||||||||||||||||||||
| Insurance Segment Operating Earnings | 127,022 | 114,989 | 380,063 | 305,774 | |||||||||||||||||||||||||
| Total Segment Operating Earnings | $ | 1,085,950 | $ | 1,182,828 | $ | 3,419,456 | $ | 3,179,753 | |||||||||||||||||||||
(1) Includes intersegment management fees of $83.0 million and $46.7 million, for the three months ended September 30, 2022 and 2021, respectively, and $211.3 million and $108.5 million for the nine months ended September 30, 2022 and 2021, respectively. | |||||||||||||||||||||||||||||
(2) Includes intersegment interest expense and income of $44.0 million and $10.8 million, for the three months ended September 30, 2022 and 2021, respectively, and $104.3 million and $11.9 million for the nine months ended September 30, 2022 and 2021, respectively. | |||||||||||||||||||||||||||||
| As of | |||||||||||||||||||||||||||||
| September 30, 2022 | September 30, 2021 | ||||||||||||||||||||||||||||
| Segment Assets: | |||||||||||||||||||||||||||||
| Asset Management | $ | 31,244,274 | $ | 31,853,573 | |||||||||||||||||||||||||
| Insurance | 165,521,042 | 164,436,876 | |||||||||||||||||||||||||||
| Total Segment Assets | $ | 196,765,316 | $ | 196,290,449 | |||||||||||||||||||||||||
| Three Months Ended September 30, | Nine Months Ended September 30, | ||||||||||||||||||||||||||||
| Noncash expenses excluded from Segment Operating Earnings | 2022 | 2021 | 2022 | 2021 | |||||||||||||||||||||||||
| Equity Based Compensation and Other | |||||||||||||||||||||||||||||
| Asset Management | $ | 109,509 | $ | 62,510 | $ | 332,986 | $ | 188,269 | |||||||||||||||||||||
| Insurance | 41,102 | 40,086 | 94,711 | 64,061 | |||||||||||||||||||||||||
| Total Non-cash expenses | $ | 150,611 | $ | 102,596 | $ | 427,697 | $ | 252,330 | |||||||||||||||||||||
| As of and for the Three Months Ended September 30, 2017 | |||||||||||||||||||
Private Markets | Public Markets | Capital Markets | Principal Activities | Total Reportable Segments | |||||||||||||||
| Segment Revenues | |||||||||||||||||||
| Management, Monitoring and Transaction Fees, Net | |||||||||||||||||||
| Management Fees | $ | 153,841 | $ | 79,113 | $ | — | $ | — | $ | 232,954 | |||||||||
| Monitoring Fees | 14,342 | — | — | — | 14,342 | ||||||||||||||
| Transaction Fees | 82,258 | 11,469 | 85,440 | — | 179,167 | ||||||||||||||
| Fee Credits | (59,854 | ) | (10,893 | ) | — | — | (70,747 | ) | |||||||||||
| Total Management, Monitoring and Transaction Fees, Net | 190,587 | 79,689 | 85,440 | — | 355,716 | ||||||||||||||
| Performance Income (Loss) | |||||||||||||||||||
| Realized Incentive Fees | — | 4,074 | — | — | 4,074 | ||||||||||||||
| Realized Carried Interest | 419,438 | — | — | — | 419,438 | ||||||||||||||
| Unrealized Carried Interest | (96,571 | ) | 36,933 | — | — | (59,638 | ) | ||||||||||||
| Total Performance Income (Loss) | 322,867 | 41,007 | — | — | 363,874 | ||||||||||||||
| Investment Income (Loss) | |||||||||||||||||||
| Net Realized Gains (Losses) | — | — | — | 76,053 | 76,053 | ||||||||||||||
| Net Unrealized Gains (Losses) | — | — | — | (50,902 | ) | (50,902 | ) | ||||||||||||
| Total Realized and Unrealized | — | — | — | 25,151 | 25,151 | ||||||||||||||
| Interest Income and Dividends | — | — | — | 70,557 | 70,557 | ||||||||||||||
| Interest Expense | — | — | — | (45,613 | ) | (45,613 | ) | ||||||||||||
| Net Interest and Dividends | — | — | — | 24,944 | 24,944 | ||||||||||||||
| Total Investment Income (Loss) | — | — | — | 50,095 | 50,095 | ||||||||||||||
| Total Segment Revenues | 513,454 | 120,696 | 85,440 | 50,095 | 769,685 | ||||||||||||||
| Segment Expenses | |||||||||||||||||||
| Compensation and Benefits | |||||||||||||||||||
| Cash Compensation and Benefits | 63,482 | 16,257 | 16,924 | 33,958 | 130,621 | ||||||||||||||
| Realized Performance Income Compensation | 176,075 | 1,630 | — | — | 177,705 | ||||||||||||||
| Unrealized Performance Income Compensation | (36,379 | ) | 16,553 | — | — | (19,826 | ) | ||||||||||||
| Total Compensation and Benefits | 203,178 | 34,440 | 16,924 | 33,958 | 288,500 | ||||||||||||||
| Occupancy and Related Charges | 8,537 | 1,535 | 760 | 3,840 | 14,672 | ||||||||||||||
| Other Operating Expenses | 42,376 | 7,672 | 6,293 | 14,176 | 70,517 | ||||||||||||||
| Total Segment Expenses | 254,091 | 43,647 | 23,977 | 51,974 | 373,689 | ||||||||||||||
| Income (Loss) attributable to noncontrolling interests | — | — | 1,046 | — | 1,046 | ||||||||||||||
| Economic Net Income (Loss) | $ | 259,363 | $ | 77,049 | $ | 60,417 | $ | (1,879 | ) | $ | 394,950 | ||||||||
| Total Assets | $ | 2,123,892 | $ | 1,313,920 | $ | 458,269 | $ | 11,451,918 | $ | 15,347,999 | |||||||||
| As of and for the Three Months Ended September 30, 2016 | |||||||||||||||||||
Private Markets | Public Markets | Capital Markets | Principal Activities | Total Reportable Segments | |||||||||||||||
| Segment Revenues | |||||||||||||||||||
| Management, Monitoring and Transaction Fees, Net | |||||||||||||||||||
| Management Fees | $ | 117,795 | $ | 83,713 | $ | — | $ | — | $ | 201,508 | |||||||||
| Monitoring Fees | 11,091 | — | — | — | 11,091 | ||||||||||||||
| Transaction Fees | 53,223 | 10,748 | 47,383 | — | 111,354 | ||||||||||||||
| Fee Credits | (37,127 | ) | (10,265 | ) | — | — | (47,392 | ) | |||||||||||
| Total Management, Monitoring and Transaction Fees, Net | 144,982 | 84,196 | 47,383 | — | 276,561 | ||||||||||||||
| Performance Income (Loss) | |||||||||||||||||||
| Realized Incentive Fees | — | 3,659 | — | — | 3,659 | ||||||||||||||
| Realized Carried Interest | 350,469 | — | — | — | 350,469 | ||||||||||||||
| Unrealized Carried Interest | 53,339 | 17,012 | — | — | 70,351 | ||||||||||||||
| Total Performance Income (Loss) | 403,808 | 20,671 | — | — | 424,479 | ||||||||||||||
| Investment Income (Loss) | |||||||||||||||||||
| Net Realized Gains (Losses) | — | — | — | 170,078 | 170,078 | ||||||||||||||
| Net Unrealized Gains (Losses) | — | — | — | 136,740 | 136,740 | ||||||||||||||
| Total Realized and Unrealized | — | — | — | 306,818 | 306,818 | ||||||||||||||
| Interest Income and Dividends | — | — | — | 71,185 | 71,185 | ||||||||||||||
| Interest Expense | — | — | — | (47,506 | ) | (47,506 | ) | ||||||||||||
| Net Interest and Dividends | — | — | — | 23,679 | 23,679 | ||||||||||||||
| Total Investment Income (Loss) | — | — | — | 330,497 | 330,497 | ||||||||||||||
| Total Segment Revenues | 548,790 | 104,867 | 47,383 | 330,497 | 1,031,537 | ||||||||||||||
| Segment Expenses | |||||||||||||||||||
| Compensation and Benefits | |||||||||||||||||||
| Cash Compensation and Benefits | 47,858 | 22,022 | 7,803 | 24,284 | 101,967 | ||||||||||||||
| Realized Performance Income Compensation | 157,688 | 1,463 | — | — | 159,151 | ||||||||||||||
| Unrealized Performance Income Compensation | 22,588 | 6,805 | — | — | 29,393 | ||||||||||||||
| Total Compensation and Benefits | 228,134 | 30,290 | 7,803 | 24,284 | 290,511 | ||||||||||||||
| Occupancy and Related Charges | 9,248 | 2,570 | 330 | 3,729 | 15,877 | ||||||||||||||
| Other Operating Expenses | 32,031 | 8,894 | 3,552 | 10,646 | 55,123 | ||||||||||||||
| Total Segment Expenses | 269,413 | 41,754 | 11,685 | 38,659 | 361,511 | ||||||||||||||
| Income (Loss) attributable to noncontrolling interests | — | — | 760 | — | 760 | ||||||||||||||
| Economic Net Income (Loss) | $ | 279,377 | $ | 63,113 | $ | 34,938 | $ | 291,838 | $ | 669,266 | |||||||||
| Total Assets | $ | 1,835,166 | $ | 1,179,955 | $ | 403,609 | $ | 10,119,919 | $ | 13,538,649 | |||||||||
| As of and for the Nine Months Ended September 30, 2017 | |||||||||||||||||||
Private Markets | Public Markets | Capital Markets | Principal Activities | Total Reportable Segments | |||||||||||||||
| Segment Revenues | |||||||||||||||||||
| Management, Monitoring and Transaction Fees, Net | |||||||||||||||||||
| Management Fees | $ | 419,606 | $ | 251,201 | $ | — | $ | — | $ | 670,807 | |||||||||
| Monitoring Fees | 58,072 | — | — | — | 58,072 | ||||||||||||||
| Transaction Fees | 237,392 | 41,040 | 300,235 | — | 578,667 | ||||||||||||||
| Fee Credits | (177,254 | ) | (33,894 | ) | — | — | (211,148 | ) | |||||||||||
| Total Management, Monitoring and Transaction Fees, Net | 537,816 | 258,347 | 300,235 | — | 1,096,398 | ||||||||||||||
| Performance Income (Loss) | |||||||||||||||||||
| Realized Incentive Fees | — | 8,384 | — | — | 8,384 | ||||||||||||||
| Realized Carried Interest | 890,310 | — | — | — | 890,310 | ||||||||||||||
| Unrealized Carried Interest | 305,945 | 71,762 | — | — | 377,707 | ||||||||||||||
| Total Performance Income (Loss) | 1,196,255 | 80,146 | — | — | 1,276,401 | ||||||||||||||
| Investment Income (Loss) | |||||||||||||||||||
| Net Realized Gains (Losses) | — | — | — | 162,684 | 162,684 | ||||||||||||||
| Net Unrealized Gains (Losses) | — | — | — | 461,111 | 461,111 | ||||||||||||||
| Total Realized and Unrealized | — | — | — | 623,795 | 623,795 | ||||||||||||||
| Interest Income and Dividends | — | — | — | 195,275 | 195,275 | ||||||||||||||
| Interest Expense | — | — | — | (134,348 | ) | (134,348 | ) | ||||||||||||
| Net Interest and Dividends | — | — | — | 60,927 | 60,927 | ||||||||||||||
| Total Investment Income (Loss) | — | — | — | 684,722 | 684,722 | ||||||||||||||
| Total Segment Revenues | 1,734,071 | 338,493 | 300,235 | 684,722 | 3,057,521 | ||||||||||||||
| Segment Expenses | |||||||||||||||||||
| Compensation and Benefits | |||||||||||||||||||
| Cash Compensation and Benefits | 183,943 | 58,991 | 57,053 | 105,591 | 405,578 | ||||||||||||||
| Realized Performance Income Compensation | 374,335 | 3,354 | — | — | 377,689 | ||||||||||||||
| Unrealized Performance Income Compensation | 126,677 | 30,485 | — | — | 157,162 | ||||||||||||||
| Total Compensation and Benefits | 684,955 | 92,830 | 57,053 | 105,591 | 940,429 | ||||||||||||||
| Occupancy and Related Charges | 24,174 | 5,140 | 2,052 | 11,082 | 42,448 | ||||||||||||||
| Other Operating Expenses | 97,255 | 24,244 | 15,320 | 40,265 | 177,084 | ||||||||||||||
| Total Segment Expenses | 806,384 | 122,214 | 74,425 | 156,938 | 1,159,961 | ||||||||||||||
| Income (Loss) attributable to noncontrolling interests | — | — | 3,810 | — | 3,810 | ||||||||||||||
| Economic Net Income (Loss) | $ | 927,687 | $ | 216,279 | $ | 222,000 | $ | 527,784 | $ | 1,893,750 | |||||||||
| Total Assets | $ | 2,123,892 | $ | 1,313,920 | $ | 458,269 | $ | 11,451,918 | $ | 15,347,999 | |||||||||
| As of and for the Nine Months Ended September 30, 2016 | |||||||||||||||||||
Private Markets | Public Markets | Capital Markets | Principal Activities | Total Reportable Segments | |||||||||||||||
| Segment Revenues | |||||||||||||||||||
| Management, Monitoring and Transaction Fees, Net | |||||||||||||||||||
| Management Fees | $ | 354,376 | $ | 245,349 | $ | — | $ | — | $ | 599,725 | |||||||||
| Monitoring Fees | 52,126 | — | — | — | 52,126 | ||||||||||||||
| Transaction Fees | 114,021 | 17,768 | 144,214 | — | 276,003 | ||||||||||||||
| Fee Credits | (93,042 | ) | (16,230 | ) | — | — | (109,272 | ) | |||||||||||
| Total Management, Monitoring and Transaction Fees, Net | 427,481 | 246,887 | 144,214 | — | 818,582 | ||||||||||||||
| Performance Income (Loss) | |||||||||||||||||||
| Realized Incentive Fees | — | 9,897 | — | — | 9,897 | ||||||||||||||
| Realized Carried Interest | 749,194 | 3,838 | — | — | 753,032 | ||||||||||||||
| Unrealized Carried Interest | (131,386 | ) | (3,370 | ) | — | — | (134,756 | ) | |||||||||||
| Total Performance Income (Loss) | 617,808 | 10,365 | — | — | 628,173 | ||||||||||||||
| Investment Income (Loss) | |||||||||||||||||||
| Net Realized Gains (Losses) | — | — | — | 370,594 | 370,594 | ||||||||||||||
| Net Unrealized Gains (Losses) | — | — | — | (725,699 | ) | (725,699 | ) | ||||||||||||
| Total Realized and Unrealized | — | — | — | (355,105 | ) | (355,105 | ) | ||||||||||||
| Interest Income and Dividends | — | — | — | 253,756 | 253,756 | ||||||||||||||
| Interest Expense | — | — | — | (144,497 | ) | (144,497 | ) | ||||||||||||
| Net Interest and Dividends | — | — | — | 109,259 | 109,259 | ||||||||||||||
| Total Investment Income (Loss) | — | — | — | (245,846 | ) | (245,846 | ) | ||||||||||||
| Total Segment Revenues | 1,045,289 | 257,252 | 144,214 | (245,846 | ) | 1,200,909 | |||||||||||||
| Segment Expenses | |||||||||||||||||||
| Compensation and Benefits | |||||||||||||||||||
| Cash Compensation and Benefits | 142,500 | 61,193 | 23,374 | 72,689 | 299,756 | ||||||||||||||
| Realized Performance Income Compensation | 317,178 | 5,493 | — | — | 322,671 | ||||||||||||||
| Unrealized Performance Income Compensation | (47,377 | ) | (1,347 | ) | — | — | (48,724 | ) | |||||||||||
| Total Compensation and Benefits | 412,301 | 65,339 | 23,374 | 72,689 | 573,703 | ||||||||||||||
| Occupancy and Related Charges | 27,212 | 7,252 | 1,901 | 11,121 | 47,486 | ||||||||||||||
| Other Operating Expenses | 95,166 | 28,102 | 10,870 | 32,404 | 166,542 | ||||||||||||||
| Total Segment Expenses | 534,679 | 100,693 | 36,145 | 116,214 | 787,731 | ||||||||||||||
| Income (Loss) attributable to noncontrolling interests | — | — | 2,002 | — | 2,002 | ||||||||||||||
| Economic Net Income (Loss) | $ | 510,610 | $ | 156,559 | $ | 106,067 | $ | (362,060 | ) | $ | 411,176 | ||||||||
| Total Assets | $ | 1,835,166 | $ | 1,179,955 | $ | 403,609 | $ | 10,119,919 | $ | 13,538,649 | |||||||||
| Three Months Ended September 30, | Nine Months Ended September 30, | ||||||||||||||||||||||||||||
| 2022 | 2021 | 2022 | 2021 | ||||||||||||||||||||||||||
| Total GAAP Revenues | $ | 1,858,413 | $ | 4,483,365 | $ | 3,192,500 | $ | 12,182,552 | |||||||||||||||||||||
| Impact of Consolidation and Other | 207,822 | 134,524 | 593,340 | 392,883 | |||||||||||||||||||||||||
| Asset Management Adjustments: | |||||||||||||||||||||||||||||
| Capital Allocation-Based Income (Loss) (GAAP) | 572,863 | (1,526,667) | 2,442,080 | (5,736,707) | |||||||||||||||||||||||||
| Realized Carried Interest | 496,494 | 413,114 | 1,799,870 | 1,183,826 | |||||||||||||||||||||||||
| Realized Investment Income | 284,979 | 447,565 | 911,221 | 1,277,701 | |||||||||||||||||||||||||
| Capstone Fees | (20,748) | (25,178) | (55,743) | (66,286) | |||||||||||||||||||||||||
| Expense Reimbursements | (10,733) | (34,857) | (77,612) | (122,642) | |||||||||||||||||||||||||
| Insurance Adjustments: | |||||||||||||||||||||||||||||
| Net Premiums | (480,462) | (974,903) | (627,104) | (1,698,912) | |||||||||||||||||||||||||
| Policy Fees | (320,206) | (310,381) | (964,349) | (824,326) | |||||||||||||||||||||||||
| Other Income | (35,632) | (31,938) | (102,888) | (82,160) | |||||||||||||||||||||||||
| Investment Gains and Losses | (11,584) | (156,909) | 176,559 | 83,153 | |||||||||||||||||||||||||
| Derivative Gains and Losses | 184,303 | 53,179 | 945,996 | 47,151 | |||||||||||||||||||||||||
Total Segment Revenues (1) | $ | 2,725,509 | $ | 2,470,914 | $ | 8,233,870 | $ | 6,636,233 | |||||||||||||||||||||
| Three Months Ended September 30, | Nine Months Ended September 30, | ||||||||||||||||||||||||||||
| 2022 | 2021 | 2022 | 2021 | ||||||||||||||||||||||||||
| Income (Loss) Before Tax (GAAP) | $ | (52,153) | $ | 3,660,927 | $ | (1,110,231) | $ | 12,621,574 | |||||||||||||||||||||
| Impact of Consolidation and Other | 97,699 | (1,472,312) | (168,246) | (4,985,859) | |||||||||||||||||||||||||
| Interest Expense | 83,335 | 63,446 | 229,414 | 185,100 | |||||||||||||||||||||||||
Equity-based compensation - KKR Holdings(1) | 19,500 | 8,764 | 119,834 | 35,734 | |||||||||||||||||||||||||
| Asset Management Adjustments: | |||||||||||||||||||||||||||||
| Net Unrealized (Gains) Losses | 233,265 | (598,304) | 1,734,293 | (2,890,326) | |||||||||||||||||||||||||
| Unrealized Carried Interest | 1,094,782 | (911,156) | 3,946,182 | (3,872,150) | |||||||||||||||||||||||||
| Unrealized Carried Interest Compensation (Carry Pool) | (468,785) | 397,449 | (1,629,011) | 1,667,447 | |||||||||||||||||||||||||
Strategic Corporate Transaction-Related Charges(2) | 17,925 | 7,362 | 88,129 | 17,497 | |||||||||||||||||||||||||
| Equity-based compensation | 50,566 | 44,488 | 156,259 | 138,196 | |||||||||||||||||||||||||
| Equity-based compensation - Performance based | 58,943 | 18,022 | 176,727 | 50,073 | |||||||||||||||||||||||||
Insurance Adjustments:(3) | |||||||||||||||||||||||||||||
| Net (Gains) Losses from Investments and Derivatives | (54,585) | (75,241) | (120,033) | 183,842 | |||||||||||||||||||||||||
| Strategic Corporate Transaction-Related Charges | 4,413 | 3,931 | 14,120 | 15,947 | |||||||||||||||||||||||||
| Equity-based and Other Compensation | 41,102 | 40,086 | 94,711 | 64,061 | |||||||||||||||||||||||||
| Amortization of Acquired Intangibles | 4,411 | 4,412 | 13,235 | 11,765 | |||||||||||||||||||||||||
| Income Taxes | (44,468) | (9,046) | (125,927) | (63,148) | |||||||||||||||||||||||||
| Total Segment Operating Earnings | $ | 1,085,950 | $ | 1,182,828 | $ | 3,419,456 | $ | 3,179,753 | |||||||||||||||||||||
| As of | |||||||||||||||||
| September 30, 2022 | September 30, 2021 | ||||||||||||||||
| Total GAAP Assets | $ | 266,248,640 | $ | 265,799,650 | |||||||||||||
| Impact of Consolidation and Reclassifications | (67,485,113) | (65,946,515) | |||||||||||||||
| Carry Pool Reclassifications | (1,998,211) | (3,562,686) | |||||||||||||||
| Total Segment Assets | $ | 196,765,316 | $ | 196,290,449 | |||||||||||||
| Three Months Ended | Nine Months Ended | ||||||||||||||
| September 30, 2017 | September 30, 2016 | September 30, 2017 | September 30, 2016 | ||||||||||||
| Fees and Other | $ | 692,877 | $ | 687,056 | $ | 2,340,617 | $ | 1,426,618 | |||||||
| Plus: Management fees relating to consolidated funds and placement fees | 54,012 | 49,017 | 153,414 | 131,335 | |||||||||||
| Less: Fee credits relating to consolidated funds | 106 | 417 | 3,752 | 2,766 | |||||||||||
| Plus: Net realized and unrealized carried interest - consolidated funds | 22,341 | 5,956 | 43,782 | 15,581 | |||||||||||
| Plus: Total investment income (loss) | 50,095 | 330,497 | 684,722 | (245,846 | ) | ||||||||||
| Less: Revenue earned by oil & gas producing entities | 12,441 | 16,191 | 47,096 | 47,977 | |||||||||||
| Less: Reimbursable expenses | 27,506 | 12,064 | 87,131 | 46,583 | |||||||||||
| Less: Other | 9,587 | 12,317 | 27,035 | 29,453 | |||||||||||
| Total Segment Revenues | $ | 769,685 | $ | 1,031,537 | $ | 3,057,521 | $ | 1,200,909 | |||||||
| Three Months Ended | Nine Months Ended | ||||||||||||||
| September 30, 2017 | September 30, 2016 | September 30, 2017 | September 30, 2016 | ||||||||||||
| Total Expenses | $ | 530,247 | $ | 511,117 | $ | 1,699,989 | $ | 1,242,658 | |||||||
| Less: Equity based compensation | 72,250 | 61,552 | 271,226 | 186,032 | |||||||||||
| Less: Reimbursable expenses and placement fees | 37,508 | 18,255 | 132,491 | 72,887 | |||||||||||
| Less: Operating expenses relating to consolidated funds, CFEs and other entities | 21,858 | 20,141 | 56,517 | 85,093 | |||||||||||
| Less: Expenses incurred by oil & gas producing entities | 10,725 | 17,782 | 34,826 | 56,000 | |||||||||||
| Less: Intangible amortization | 2,473 | 22,112 | 13,901 | 35,640 | |||||||||||
| Less: Other | 11,744 | 9,764 | 31,067 | 19,275 | |||||||||||
| Total Segment Expenses | $ | 373,689 | $ | 361,511 | $ | 1,159,961 | $ | 787,731 | |||||||
| Three Months Ended | Nine Months Ended | ||||||||||||||
| September 30, 2017 | September 30, 2016 | September 30, 2017 | September 30, 2016 | ||||||||||||
| Net Income (Loss) Attributable to KKR & Co. L.P. Common Unitholders | $ | 153,563 | $ | 352,152 | $ | 818,552 | $ | 116,103 | |||||||
| Plus: Preferred Distributions | 8,341 | 8,201 | 25,023 | 13,894 | |||||||||||
| Plus: Net income (loss) attributable to noncontrolling interests held by KKR Holdings L.P. | 115,434 | 284,834 | 637,146 | 86,659 | |||||||||||
| Plus: Non-cash equity-based charges | 78,728 | 61,552 | 277,704 | 186,032 | |||||||||||
Plus: Amortization of intangibles, placement fees and other, net (1) | 20,464 | (48,299 | ) | 57,825 | (10,273 | ) | |||||||||
| Plus: Income tax (benefit) | 18,420 | 10,826 | 77,500 | 18,761 | |||||||||||
| Economic Net Income (Loss) | $ | 394,950 | $ | 669,266 | $ | 1,893,750 | $ | 411,176 | |||||||
| As of September 30, | |||||||
| 2017 | 2016 | ||||||
| Total Assets | $ | 44,305,639 | $ | 37,984,599 | |||
Less: Impact of consolidation of funds and other entities (1) | 27,524,641 | 23,013,503 | |||||
| Less: Carry pool reclassification from liabilities | 1,131,071 | 1,121,510 | |||||
| Less: Impact of KKR Management Holdings Corp. | 301,928 | 310,937 | |||||
| Total Segment Assets | $ | 15,347,999 | $ | 13,538,649 | |||
| (1) Includes accounting basis difference for oil & natural gas properties of $19,358 and $5,966 as of September 30, 2017 and 2016, respectively. | |||||||
| Three Months Ended September 30, | Nine Months Ended September 30, | ||||||||||||||||||||||||||||||||||||||||||||||
| 2022 | 2021 | 2022 | 2021 | ||||||||||||||||||||||||||||||||||||||||||||
| Shares of common stock repurchased | — | — | 5,191,174 | 2,667,995 | |||||||||||||||||||||||||||||||||||||||||||
| Equity awards for common stock retired | — | — | 596,437 | 2,366,447 | |||||||||||||||||||||||||||||||||||||||||||
| Three Months Ended September 30, 2022 | |||||||||||||||||
| Noncontrolling Interests in Consolidated Entities and Other | Noncontrolling Interests Held by KKR Holdings | Total Noncontrolling Interests | |||||||||||||||
| Balance at the beginning of the period | $ | 33,664,541 | $ | — | $ | 33,664,541 | |||||||||||
Net income (loss) attributable to noncontrolling interests (1) | (6,792) | — | (6,792) | ||||||||||||||
Other comprehensive income (loss), net of tax (2) | (815,541) | — | (815,541) | ||||||||||||||
| Equity-based and other non-cash compensation | 65,179 | — | 65,179 | ||||||||||||||
| Capital contributions | 3,685,933 | — | 3,685,933 | ||||||||||||||
| Capital distributions | (2,143,703) | — | (2,143,703) | ||||||||||||||
| Balance at the end of the period | $ | 34,449,617 | $ | — | $ | 34,449,617 | |||||||||||
| Nine Months Ended September 30, 2022 | |||||||||||||||||
| Noncontrolling Interests in Consolidated Entities and Other | Noncontrolling Interests Held by KKR Holdings | Total Noncontrolling Interests | |||||||||||||||
| Balance at the beginning of the period | $ | 32,043,699 | $ | 8,430,866 | $ | 40,474,565 | |||||||||||
Net income (loss) attributable to noncontrolling interests (1) | 271,678 | (313,019) | (41,341) | ||||||||||||||
Other comprehensive income (loss), net of tax (2) | (3,434,340) | (1,074,414) | (4,508,754) | ||||||||||||||
Exchange of KKR Holdings Units to Common Stock (3) | — | (12,865) | (12,865) | ||||||||||||||
| Equity-based and other non-cash compensation | 193,907 | 100,334 | 294,241 | ||||||||||||||
| Capital contributions | 11,117,981 | — | 11,117,981 | ||||||||||||||
| Capital distributions | (5,588,024) | (171,580) | (5,759,604) | ||||||||||||||
Holdings Merger (4) | — | (6,959,322) | (6,959,322) | ||||||||||||||
| Change in KKR & Co. Inc.'s Ownership Interest | (155,284) | — | (155,284) | ||||||||||||||
| Balance at the end of the period | $ | 34,449,617 | $ | — | $ | 34,449,617 | |||||||||||
| Three Months Ended September 30, 2021 | ||||||||||||||||||||
| Noncontrolling Interests in Consolidated Entities and Other | Noncontrolling Interests Held by KKR Holdings | Total Noncontrolling Interests | ||||||||||||||||||
| Balance at the beginning of the period | $ | 28,402,888 | $ | 7,935,515 | $ | 36,338,403 | ||||||||||||||
Net income (loss) attributable to noncontrolling interests (1) | 1,452,730 | 670,839 | 2,123,569 | |||||||||||||||||
Other comprehensive income (loss), net of tax (2) | (54,640) | (31,904) | (86,544) | |||||||||||||||||
| Equity-based and other non-cash compensation | 32,255 | 8,764 | 41,019 | |||||||||||||||||
| Capital contributions | 3,658,497 | — | 3,658,497 | |||||||||||||||||
| Capital distributions | (1,981,504) | (49,844) | (2,031,348) | |||||||||||||||||
| Changes in consolidation | (12,352) | — | (12,352) | |||||||||||||||||
| Balance at the end of the period | $ | 31,497,874 | $ | 8,533,370 | $ | 40,031,244 | ||||||||||||||
| Nine Months Ended September 30, 2021 | ||||||||||||||||||||
| Noncontrolling Interests in Consolidated Entities and Other | Noncontrolling Interests Held by KKR Holdings | Total Noncontrolling Interests | ||||||||||||||||||
| Balance at the beginning of the period | $ | 20,570,716 | $ | 6,512,382 | $ | 27,083,098 | ||||||||||||||
Net income (loss) attributable to noncontrolling interests (1) | 4,889,401 | 2,425,961 | 7,315,362 | |||||||||||||||||
Other comprehensive income (loss), net of tax (2) | (132,351) | (77,377) | (209,728) | |||||||||||||||||
Exchange of KKR Holdings Units to Common Stock(3) | — | (122,065) | (122,065) | |||||||||||||||||
| Equity-based and other non-cash compensation | 71,993 | 35,734 | 107,727 | |||||||||||||||||
| Capital contributions | 9,721,024 | 25 | 9,721,049 | |||||||||||||||||
| Capital distributions | (3,734,474) | (241,290) | (3,975,764) | |||||||||||||||||
Impact of Acquisition (5) | 190,405 | — | 190,405 | |||||||||||||||||
| Changes in consolidation | (78,840) | — | (78,840) | |||||||||||||||||
| Balance at the end of the period | $ | 31,497,874 | $ | 8,533,370 | $ | 40,031,244 | ||||||||||||||
| Three Months Ended September 30, | Nine Months Ended September 30, | |||||||||||||||||||||||||||||||||||||||||||
| 2022 | 2021 | 2022 | 2021 | |||||||||||||||||||||||||||||||||||||||||
| Net income (loss) | $ | (79,587) | $ | 3,281,645 | $ | (981,395) | $ | 11,459,886 | ||||||||||||||||||||||||||||||||||||
| (-) Net income (loss) attributable to Redeemable Noncontrolling Interests | 1,601 | 1,519 | 1,546 | 2,856 | ||||||||||||||||||||||||||||||||||||||||
| (-) Net income (loss) attributable to Noncontrolling Interests in consolidated entities and other | (6,792) | 1,452,730 | 271,678 | 4,889,401 | ||||||||||||||||||||||||||||||||||||||||
| (-) Series A and B Preferred Stock Dividends | — | 7,953 | — | 36,647 | ||||||||||||||||||||||||||||||||||||||||
| (-) Series C Mandatory Convertible Preferred Stock Dividends | 17,250 | 17,250 | 51,750 | 51,750 | ||||||||||||||||||||||||||||||||||||||||
| (+) Income tax expense (benefit) attributable to KKR & Co. Inc. | (45,975) | 311,745 | (313,679) | 1,104,628 | ||||||||||||||||||||||||||||||||||||||||
| Net income (loss) attributable to KKR & Co. Inc. Common Stockholders and KKR Holdings | $ | (137,621) | $ | 2,113,938 | $ | (1,620,048) | $ | 7,583,860 | ||||||||||||||||||||||||||||||||||||
| Net income (loss) attributable to Noncontrolling Interests held by KKR Holdings | $ | — | $ | 670,839 | $ | (313,019) | $ | 2,425,961 | ||||||||||||||||||||||||||||||||||||
| September 30, 2017 | December 31, 2016 | ||||||
| Finite-Lived Intangible Assets | $ | 74,524 | $ | 251,768 | |||
| Accumulated Amortization | (57,086 | ) | (116,744 | ) | |||
| Intangible Assets, Net | $ | 17,438 | $ | 135,024 | |||
| Nine Months Ended | |||
| September 30, 2017 | |||
| Balance, Beginning of Period | $ | 135,024 | |
| Amortization Expense | (13,891 | ) | |
| Foreign Exchange | 1,938 | ||
Other (1) | (105,633 | ) | |
| Balance, End of Period | $ | 17,438 | |
| (1) Represents the removal of intangible assets in connection with the PAAMCO Prisma transaction. | |||
Investment Period (1) | Amount ($ in millions) | |||||||||||||||||||||
| Start Date | End Date | Commitment (2) | Uncalled Commitments | Percentage Committed by General Partner | Invested | Realized | Remaining Cost (3) | Remaining Fair Value | ||||||||||||||
| Private Markets | ||||||||||||||||||||||
| Private Equity and Growth Equity | ||||||||||||||||||||||
Asian Fund III (4) | 4/2017 | 4/2023 | $ | 9,000.0 | $ | 9,000.0 | 5.6% | $ | — | $ | — | $ | — | $ | — | |||||||
Americas Fund XII (4) | 1/2017 | 1/2023 | 13,500.0 | 13,500.0 | 7.2% | — | — | — | 5.6 | |||||||||||||
Health Care Strategic Growth Fund (4) | 12/2016 | 12/2021 | 1,214.9 | 1,214.9 | 12.3% | — | — | — | — | |||||||||||||
Next Generation Technology Growth Fund (4) | 3/2016 | 3/2021 | 658.9 | 431.3 | 22.5% | 227.6 | — | 227.6 | 325.1 | |||||||||||||
European Fund IV (4) | 12/2014 | 12/2020 | 3,537.4 | 1,507.5 | 5.6% | 2,059.6 | 29.2 | 2,038.7 | 2,629.8 | |||||||||||||
Asian Fund II (4) | 4/2013 | 4/2017 | 5,825.0 | 1,012.7 | 1.3% | 5,782.0 | 1,469.1 | 4,749.0 | 7,070.8 | |||||||||||||
North America Fund XI (4) | 9/2012 | 1/2017 | 8,718.4 | 874.2 | 2.9% | 9,268.2 | 4,344.4 | 6,743.5 | 11,525.2 | |||||||||||||
| China Growth Fund | 11/2010 | 11/2016 | 1,010.0 | — | 1.0% | 1,010.0 | 565.0 | 665.3 | 801.4 | |||||||||||||
| E2 Investors (Annex Fund) | 8/2009 | 11/2013 | 195.8 | — | 4.9% | 195.8 | 195.7 | 18.1 | 1.7 | |||||||||||||
| European Fund III | 3/2008 | 3/2014 | 6,165.5 | 838.2 | 4.6% | 5,327.3 | 6,989.1 | 2,029.3 | 3,427.6 | |||||||||||||
| Asian Fund | 7/2007 | 4/2013 | 3,983.3 | — | 2.5% | 3,945.9 | 7,681.6 | 813.8 | 917.2 | |||||||||||||
| 2006 Fund | 9/2006 | 9/2012 | 17,642.2 | 337.7 | 2.1% | 17,304.5 | 26,586.4 | 4,957.8 | 6,960.9 | |||||||||||||
| European Fund II | 11/2005 | 10/2008 | 5,750.8 | — | 2.1% | 5,750.8 | 8,467.3 | — | 58.4 | |||||||||||||
| Millennium Fund | 12/2002 | 12/2008 | 6,000.0 | — | 2.5% | 6,000.0 | 13,305.4 | 444.9 | 610.6 | |||||||||||||
| Total Private Equity and Growth Equity | 83,202.2 | 28,716.5 | 56,871.7 | 69,633.2 | 22,688.0 | 34,334.3 | ||||||||||||||||
Co-Investment Vehicles and Other (4) | Various | Various | 6,674.1 | 1,830.0 | Various | 5,042.9 | 2,712.0 | 3,686.4 | 4,848.5 | |||||||||||||
| Total Private Equity and Growth Equity | 89,876.3 | 30,546.5 | 61,914.6 | 72,345.2 | 26,374.4 | 39,182.8 | ||||||||||||||||
| Real Assets | ||||||||||||||||||||||
Energy Income and Growth Fund (4) | 9/2013 | 9/2018 | 1,974.2 | 667.7 | 12.9% | 1,336.5 | 284.1 | 1,072.6 | 1,132.7 | |||||||||||||
| Natural Resources Fund | Various | Various | 887.4 | 2.8 | Various | 884.6 | 113.4 | 794.9 | 151.9 | |||||||||||||
Global Energy Opportunities (4) | Various | Various | 979.2 | 613.2 | Various | 405.5 | 59.0 | 291.0 | 315.0 | |||||||||||||
Global Infrastructure Investors (4) | 9/2011 | 10/2014 | 1,040.2 | 59.9 | 4.8% | 1,011.3 | 844.8 | 604.2 | 775.9 | |||||||||||||
Global Infrastructure Investors II (4) | 10/2014 | 10/2020 | 3,045.4 | 1,820.2 | 4.1% | 1,412.3 | 192.9 | 1,221.0 | 1,532.5 | |||||||||||||
Real Estate Partners Americas (4) | 5/2013 | 5/2017 | 1,229.1 | 363.3 | 16.3% | 993.7 | 776.0 | 562.2 | 631.9 | |||||||||||||
Real Estate Partners Americas II (4) | 5/2017 | (5) | 782.7 | 782.7 | 19.2% | — | — | — | — | |||||||||||||
Real Estate Partners Europe (4) | 9/2015 | 6/2020 | 721.2 | 594.7 | 9.2% | 132.6 | 12.0 | 125.4 | 158.1 | |||||||||||||
Real Estate Credit Opportunity Partners (4) | 2/2017 | 2/2019 | 1,090.0 | 918.0 | 4.6% | 172.0 | — | 172.0 | 184.4 | |||||||||||||
| Co-Investment Vehicles and Other | Various | Various | 1,401.9 | 11.8 | Various | 1,390.1 | 511.9 | 1,387.7 | 1,799.8 | |||||||||||||
| Real Assets | $ | 13,151.3 | $ | 5,834.3 | $ | 7,738.6 | $ | 2,794.1 | $ | 6,231.0 | $ | 6,682.2 | ||||||||||
| Unallocated Commitments | 3,041.1 | 3,041.1 | Various | — | — | — | — | |||||||||||||||
| Private Markets Total | $ | 106,068.7 | $ | 39,421.9 | $ | 69,653.2 | $ | 75,139.3 | $ | 32,605.4 | $ | 45,865.0 | ||||||||||
Investment Period (1) | Amount ($ in millions) | |||||||||||||||||||||||||||||||||||||
| Start Date | End Date | Commitment (2) | Uncalled Commitments | Percentage Committed by General Partner | Invested | Realized | Remaining Cost (3) | Remaining Fair Value | Gross Accrued Carried Interest | |||||||||||||||||||||||||||||
| Private Equity Business Line | ||||||||||||||||||||||||||||||||||||||
| North America Fund XIII | 6/2021 | 8/2027 | $ | 18,400 | $ | 14,337 | 3% | $ | 4,063 | $ | — | $ | 4,063 | $ | 4,049 | $ | — | |||||||||||||||||||||
| Americas Fund XII | 1/2017 | 6/2021 | 13,500 | 1,632 | 4% | 12,366 | 4,948 | 11,293 | 18,804 | 1,454 | ||||||||||||||||||||||||||||
| North America Fund XI | 9/2012 | 1/2017 | 8,718 | 410 | 3% | 9,769 | 22,579 | 2,556 | 3,450 | 236 | ||||||||||||||||||||||||||||
2006 Fund (4) | 9/2006 | 9/2012 | 17,642 | 247 | 2% | 17,309 | 36,207 | 973 | 1,189 | 97 | ||||||||||||||||||||||||||||
Millennium Fund (4) | 12/2002 | 12/2008 | 6,000 | — | 3% | 6,000 | 14,123 | — | 6 | 1 | ||||||||||||||||||||||||||||
| European Fund VI | 3/2022 | 6/2028 | 6,904 | 6,904 | 11% | — | — | — | — | — | ||||||||||||||||||||||||||||
| European Fund V | 3/2019 | 2/2022 | 6,307 | 1,004 | 2% | 5,372 | 912 | 5,213 | 5,711 | 211 | ||||||||||||||||||||||||||||
| European Fund IV | 12/2014 | 3/2019 | 3,510 | 62 | 6% | 3,577 | 5,122 | 1,798 | 2,322 | 117 | ||||||||||||||||||||||||||||
European Fund III (4) | 3/2008 | 3/2014 | 5,500 | 140 | 5% | 5,360 | 10,604 | 669 | 91 | (28) | ||||||||||||||||||||||||||||
European Fund II (4) | 11/2005 | 10/2008 | 5,751 | — | 2% | 5,751 | 8,507 | — | 34 | — | ||||||||||||||||||||||||||||
| Asian Fund IV | 7/2020 | 7/2026 | 14,735 | 10,424 | 4% | 4,351 | 41 | 4,295 | 4,889 | 4 | ||||||||||||||||||||||||||||
| Asian Fund III | 4/2017 | 7/2020 | 9,000 | 1,616 | 6% | 7,813 | 5,031 | 6,548 | 10,880 | 810 | ||||||||||||||||||||||||||||
| Asian Fund II | 4/2013 | 4/2017 | 5,825 | 5 | 1% | 7,120 | 6,246 | 4,074 | 2,386 | (346) | ||||||||||||||||||||||||||||
Asian Fund (4) | 7/2007 | 4/2013 | 3,983 | — | 3% | 3,974 | 8,728 | 110 | 16 | 3 | ||||||||||||||||||||||||||||
China Growth Fund (4) | 11/2010 | 11/2016 | 1,010 | — | 1% | 1,010 | 1,056 | 330 | 180 | (17) | ||||||||||||||||||||||||||||
| Next Generation Technology Growth Fund II | 12/2019 | 5/2022 | 2,088 | 360 | 7% | 1,925 | 306 | 1,779 | 2,414 | 121 | ||||||||||||||||||||||||||||
| Next Generation Technology Growth Fund | 3/2016 | 12/2019 | 659 | 4 | 22% | 666 | 863 | 359 | 1,108 | 88 | ||||||||||||||||||||||||||||
| Health Care Strategic Growth Fund II | 5/2021 | 5/2027 | 3,789 | 3,657 | 4% | 132 | — | 132 | 150 | — | ||||||||||||||||||||||||||||
| Health Care Strategic Growth Fund | 12/2016 | 5/2021 | 1,331 | 339 | 11% | 1,122 | 196 | 1,012 | 1,552 | 77 | ||||||||||||||||||||||||||||
| Global Impact Fund II | 6/2022 | 6/2028 | 1,854 | 1,854 | 8% | — | — | — | — | — | ||||||||||||||||||||||||||||
| Global Impact Fund | 2/2019 | 3/2022 | 1,242 | 350 | 8% | 1,042 | 174 | 935 | 1,462 | 99 | ||||||||||||||||||||||||||||
| Co-Investment Vehicles and Other | Various | Various | 18,843 | 6,791 | Various | 12,280 | 7,734 | 8,614 | 10,706 | 1,095 | ||||||||||||||||||||||||||||
| Core Investment Vehicles | Various | Various | 24,621 | 12,148 | 31% | 13,289 | 828 | 12,931 | 20,274 | 138 | ||||||||||||||||||||||||||||
Unallocated Commitments (5) | N/A | N/A | 4,383 | 4,383 | Various | — | — | — | — | — | ||||||||||||||||||||||||||||
| Total Private Equity | $ | 185,595 | $ | 66,667 | $ | 124,291 | $ | 134,205 | $ | 67,684 | $ | 91,673 | $ | 4,160 | ||||||||||||||||||||||||
| Real Assets Business Line | ||||||||||||||||||||||||||||||||||||||
| Energy Income and Growth Fund II | 6/2018 | 3/2022 | $ | 994 | $ | — | 20% | $ | 1,187 | $ | 193 | $ | 1,024 | $ | 1,702 | $ | 43 | |||||||||||||||||||||
| Energy Income and Growth Fund | 9/2013 | 6/2018 | 1,974 | — | 13% | 1,974 | 1,024 | 1,030 | 696 | — | ||||||||||||||||||||||||||||
Natural Resources Fund (4) | Various | Various | 887 | — | Various | 887 | 131 | 173 | 44 | — | ||||||||||||||||||||||||||||
| Global Energy Opportunities | Various | Various | 915 | 62 | Various | 520 | 185 | 320 | 216 | — | ||||||||||||||||||||||||||||
| Global Infrastructure Investors IV | 8/2021 | 8/2027 | 16,487 | 12,163 | 2% | 4,385 | 61 | 4,369 | 4,295 | 9 | ||||||||||||||||||||||||||||
| Global Infrastructure Investors III | 6/2018 | 6/2021 | 7,151 | 1,379 | 4% | 6,037 | 1,521 | 5,253 | 5,596 | 73 | ||||||||||||||||||||||||||||
| Global Infrastructure Investors II | 10/2014 | 6/2018 | 3,039 | 127 | 4% | 3,163 | 4,434 | 1,206 | 1,637 | 46 | ||||||||||||||||||||||||||||
| Global Infrastructure Investors | 9/2011 | 10/2014 | 1,040 | — | 5% | 1,050 | 2,228 | — | — | — | ||||||||||||||||||||||||||||
| Asia Pacific Infrastructure Investors II | 9/2022 | 9/2028 | 5,492 | 5,492 | 7% | — | — | — | — | — | ||||||||||||||||||||||||||||
| Asia Pacific Infrastructure Investors | 1/2020 | 9/2022 | 3,792 | 1,709 | 7% | 2,367 | 396 | 2,117 | 2,287 | 43 | ||||||||||||||||||||||||||||
| Diversified Core Infrastructure Fund | 12/2020 | (6) | 8,059 | 3,550 | 6% | 4,524 | 155 | 4,524 | 4,602 | — | ||||||||||||||||||||||||||||
| Real Estate Partners Americas III | 12/2020 | 1/2025 | 4,253 | 1,907 | 5% | 2,401 | 164 | 2,327 | 2,576 | — | ||||||||||||||||||||||||||||
| Real Estate Partners Americas II | 5/2017 | 12/2020 | 1,921 | 255 | 8% | 1,901 | 2,476 | 585 | 811 | 78 | ||||||||||||||||||||||||||||
| Real Estate Partners Americas | 5/2013 | 5/2017 | 1,229 | 138 | 16% | 1,021 | 1,408 | 93 | 60 | 1 | ||||||||||||||||||||||||||||
| Real Estate Partners Europe II | 12/2019 | 3/2024 | 2,042 | 760 | 10% | 1,373 | 254 | 1,260 | 1,344 | 36 | ||||||||||||||||||||||||||||
| Real Estate Partners Europe | 9/2015 | 12/2019 | 703 | 119 | 9% | 663 | 613 | 292 | 336 | 12 | ||||||||||||||||||||||||||||
| Asia Real Estate Partners | 6/2019 | 7/2023 | 1,682 | 1,195 | 15% | 490 | 9 | 471 | 659 | 14 | ||||||||||||||||||||||||||||
| Real Estate Credit Opportunity Partners II | 4/2019 | 6/2022 | 950 | 378 | 5% | 595 | 114 | 595 | 599 | 12 | ||||||||||||||||||||||||||||
| Real Estate Credit Opportunity Partners | 2/2017 | 4/2019 | 1,130 | 122 | 4% | 1,008 | 394 | 1,008 | 1,041 | 13 | ||||||||||||||||||||||||||||
| Property Partners Americas | 12/2019 | (6) | 2,569 | 347 | 19% | 2,222 | 159 | 2,222 | 3,083 | 1 | ||||||||||||||||||||||||||||
| Co-Investment Vehicles and Other | Various | Various | 5,663 | 1,402 | Various | 4,322 | 1,740 | 3,684 | 3,803 | 18 | ||||||||||||||||||||||||||||
| Total Real Assets | $ | 71,972 | $ | 31,105 | $ | 42,090 | $ | 17,659 | $ | 32,553 | $ | 35,387 | $ | 399 | ||||||||||||||||||||||||
| Amount | Fair Value of Investments | ||||||||||||||||||||||||||||||||||||||||
| Private Equity and Real Assets Business Lines Investment Funds | Commitment (2) | Invested | Realized (4) | Unrealized | Total Value | Gross IRR (5) | Net IRR (5) | Gross Multiple of Invested Capital (5) | |||||||||||||||||||||||||||||||||
| ($ in millions) | |||||||||||||||||||||||||||||||||||||||||
Legacy Funds (1) | |||||||||||||||||||||||||||||||||||||||||
| 1976 Fund | $ | 31 | $ | 31 | $ | 537 | $ | — | $ | 537 | 39.5 | % | 35.5 | % | 17.1 | ||||||||||||||||||||||||||
| 1980 Fund | 357 | 357 | 1,828 | — | 1,828 | 29.0 | % | 25.8 | % | 5.1 | |||||||||||||||||||||||||||||||
| 1982 Fund | 328 | 328 | 1,291 | — | 1,291 | 48.1 | % | 39.2 | % | 3.9 | |||||||||||||||||||||||||||||||
| 1984 Fund | 1,000 | 1,000 | 5,964 | — | 5,964 | 34.5 | % | 28.9 | % | 6.0 | |||||||||||||||||||||||||||||||
| 1986 Fund | 672 | 672 | 9,081 | — | 9,081 | 34.4 | % | 28.9 | % | 13.5 | |||||||||||||||||||||||||||||||
| 1987 Fund | 6,130 | 6,130 | 14,949 | — | 14,949 | 12.1 | % | 8.9 | % | 2.4 | |||||||||||||||||||||||||||||||
| 1993 Fund | 1,946 | 1,946 | 4,143 | — | 4,143 | 23.6 | % | 16.8 | % | 2.1 | |||||||||||||||||||||||||||||||
| 1996 Fund | 6,012 | 6,012 | 12,477 | — | 12,477 | 18.0 | % | 13.3 | % | 2.1 | |||||||||||||||||||||||||||||||
| Subtotal - Legacy Funds | 16,475 | 16,475 | 50,269 | — | 50,269 | 26.1 | % | 19.9 | % | 3.1 | |||||||||||||||||||||||||||||||
| Included Funds | |||||||||||||||||||||||||||||||||||||||||
| European Fund (1999) | 3,085 | 3,085 | 8,758 | — | 8,758 | 26.9 | % | 20.2 | % | 2.8 | |||||||||||||||||||||||||||||||
| Millennium Fund (2002) | 6,000 | 6,000 | 14,123 | 6 | 14,129 | 22.0 | % | 16.1 | % | 2.4 | |||||||||||||||||||||||||||||||
| European Fund II (2005) | 5,751 | 5,751 | 8,507 | 34 | 8,541 | 6.1 | % | 4.5 | % | 1.5 | |||||||||||||||||||||||||||||||
| 2006 Fund (2006) | 17,642�� | 17,309 | 36,207 | 1,189 | 37,396 | 11.9 | % | 9.3 | % | 2.2 | |||||||||||||||||||||||||||||||
| Asian Fund (2007) | 3,983 | 3,974 | 8,728 | 16 | 8,744 | 18.9 | % | 13.7 | % | 2.2 | |||||||||||||||||||||||||||||||
| European Fund III (2008) | 5,500 | 5,360 | 10,604 | 91 | 10,695 | 16.4 | % | 11.3 | % | 2.0 | |||||||||||||||||||||||||||||||
| E2 Investors (Annex Fund) (2009) | 196 | 196 | 200 | — | 200 | 0.6 | % | 0.5 | % | 1.0 | |||||||||||||||||||||||||||||||
| China Growth Fund (2010) | 1,010 | 1,010 | 1,056 | 180 | 1,236 | 5.1 | % | 1.1 | % | 1.2 | |||||||||||||||||||||||||||||||
| Natural Resources Fund (2010) | 887 | 887 | 131 | 44 | 175 | (24.5) | % | (26.2) | % | 0.2 | |||||||||||||||||||||||||||||||
| Global Infrastructure Investors (2011) | 1,040 | 1,050 | 2,228 | — | 2,228 | 17.6 | % | 15.6 | % | 2.1 | |||||||||||||||||||||||||||||||
| North America Fund XI (2012) | 8,718 | 9,769 | 22,579 | 3,450 | 26,029 | 24.4 | % | 19.8 | % | 2.7 | |||||||||||||||||||||||||||||||
| Asian Fund II (2013) | 5,825 | 7,120 | 6,246 | 2,386 | 8,632 | 5.7 | % | 4.1 | % | 1.2 | |||||||||||||||||||||||||||||||
| Real Estate Partners Americas (2013) | 1,229 | 1,021 | 1,408 | 60 | 1,468 | 16.3 | % | 11.5 | % | 1.4 | |||||||||||||||||||||||||||||||
| Energy Income and Growth Fund (2013) | 1,974 | 1,974 | 1,024 | 696 | 1,720 | (4.5) | % | (7.0) | % | 0.9 | |||||||||||||||||||||||||||||||
| Global Infrastructure Investors II (2014) | 3,039 | 3,163 | 4,434 | 1,637 | 6,071 | 19.5 | % | 16.8 | % | 1.9 | |||||||||||||||||||||||||||||||
| European Fund IV (2015) | 3,510 | 3,577 | 5,122 | 2,322 | 7,444 | 23.3 | % | 17.9 | % | 2.1 | |||||||||||||||||||||||||||||||
| Real Estate Partners Europe (2015) | 703 | 663 | 613 | 336 | 949 | 13.5 | % | 9.5 | % | 1.4 | |||||||||||||||||||||||||||||||
| Next Generation Technology Growth Fund (2016) | 659 | 666 | 863 | 1,108 | 1,971 | 34.1 | % | 29.1 | % | 3.0 | |||||||||||||||||||||||||||||||
| Health Care Strategic Growth Fund (2016) | 1,331 | 1,122 | 196 | 1,552 | 1,748 | 25.5 | % | 16.5 | % | 1.6 | |||||||||||||||||||||||||||||||
| Americas Fund XII (2017) | 13,500 | 12,366 | 4,948 | 18,804 | 23,752 | 27.5 | % | 22.2 | % | 1.9 | |||||||||||||||||||||||||||||||
| Real Estate Credit Opportunity Partners (2017) | 1,130 | 1,008 | 394 | 1,041 | 1,435 | 9.9 | % | 8.6 | % | 1.4 | |||||||||||||||||||||||||||||||
| Core Investment Vehicles (2017) | 24,621 | 13,289 | 828 | 20,274 | 21,102 | 21.3 | % | 20.0 | % | 1.6 | |||||||||||||||||||||||||||||||
| Asian Fund III (2017) | 9,000 | 7,813 | 5,031 | 10,880 | 15,911 | 33.7 | % | 26.3 | % | 2.0 | |||||||||||||||||||||||||||||||
| Real Estate Partners Americas II (2017) | 1,921 | 1,901 | 2,476 | 811 | 3,287 | 31.4 | % | 26.4 | % | 1.7 | |||||||||||||||||||||||||||||||
| Global Infrastructure Investors III (2018) | 7,151 | 6,037 | 1,521 | 5,596 | 7,117 | 9.7 | % | 7.1 | % | 1.2 | |||||||||||||||||||||||||||||||
| Global Impact Fund (2019) | 1,242 | 1,042 | 174 | 1,462 | 1,636 | 33.4 | % | 24.4 | % | 1.6 | |||||||||||||||||||||||||||||||
| European Fund V (2019) | 6,307 | 5,372 | 912 | 5,711 | 6,623 | 15.1 | % | 10.6 | % | 1.2 | |||||||||||||||||||||||||||||||
| Energy Income and Growth Fund II (2019) | 994 | 1,187 | 193 | 1,702 | 1,895 | 32.3 | % | 29.3 | % | 1.6 | |||||||||||||||||||||||||||||||
| Asia Real Estate Partners (2019) | 1,682 | 490 | 9 | 659 | 668 | 33.4 | % | 16.1 | % | 1.4 | |||||||||||||||||||||||||||||||
| Next Generation Technology Growth Fund II (2019) | 2,088 | 1,925 | 306 | 2,414 | 2,720 | 28.1 | % | 21.6 | % | 1.4 | |||||||||||||||||||||||||||||||
| Real Estate Credit Opportunity Partners II (2019) | 950 | 595 | 114 | 599 | 713 | 12.7 | % | 11.5 | % | 1.2 | |||||||||||||||||||||||||||||||
| Asia Pacific Infrastructure Investors (2020) | 3,792 | 2,367 | 396 | 2,287 | 2,683 | 17.8 | % | 10.5 | % | 1.1 | |||||||||||||||||||||||||||||||
| Asian Fund IV (2020) | 14,735 | 4,351 | 41 | 4,889 | 4,930 | 16.4 | % | 6.7 | % | 1.1 | |||||||||||||||||||||||||||||||
| Real Estate Partners Europe II (2020) | 2,042 | 1,373 | 254 | 1,344 | 1,598 | 20.4 | % | 11.3 | % | 1.2 | |||||||||||||||||||||||||||||||
Real Estate Partners Americas III (2021) (3) | 4,253 | 2,401 | 164 | 2,576 | 2,740 | — | — | — | |||||||||||||||||||||||||||||||||
Health Care Strategic Growth Fund II (2021) (3) | 3,789 | 132 | — | 150 | 150 | — | — | — | |||||||||||||||||||||||||||||||||
Global Infrastructure Investors IV (2021) (3) | 16,487 | 4,385 | 61 | 4,295 | 4,356 | — | — | — | |||||||||||||||||||||||||||||||||
North America Fund XIII (2021) (3) | 18,400 | 4,063 | — | 4,049 | 4,049 | — | — | — | |||||||||||||||||||||||||||||||||
European Fund VI (2022) (3) | 6,904 | — | — | — | — | — | — | — | |||||||||||||||||||||||||||||||||
Global Impact Fund II (2022) (3) | 1,854 | — | — | — | — | — | — | — | |||||||||||||||||||||||||||||||||
Asia Pacific Infrastructure Investors II (2022) (3) | 5,492 | — | — | — | — | — | — | — | |||||||||||||||||||||||||||||||||
| Subtotal - Included Funds | 220,416 | 145,794 | 150,849 | 104,650 | 255,499 | 16.3 | % | 12.5 | % | 1.8 | |||||||||||||||||||||||||||||||
| All Funds | $ | 236,891 | $ | 162,269 | $ | 201,118 | $ | 104,650 | $ | 305,768 | 25.6 | % | 18.8 | % | 1.9 | ||||||||||||||||||||||||||
| Amount | Fair Value of Investments | |||||||||||||||||||||||||
| Private Markets Investment Funds | Commitment | Invested (5) | Realized (5) | Unrealized | Total Value | Gross IRR (5) | Net IRR (5) | Multiple of Invested Capital (5) | ||||||||||||||||||
| ($ in millions) | ||||||||||||||||||||||||||
| Total Investments | ||||||||||||||||||||||||||
Legacy Funds (1) | ||||||||||||||||||||||||||
| 1976 Fund | $ | 31.4 | $ | 31.4 | $ | 537.2 | $ | — | $ | 537.2 | 39.5 | % | 35.5 | % | 17.1 | |||||||||||
| 1980 Fund | 356.8 | 356.8 | 1,827.8 | — | 1,827.8 | 29.0 | % | 25.8 | % | 5.1 | ||||||||||||||||
| 1982 Fund | 327.6 | 327.6 | 1,290.7 | — | 1,290.7 | 48.1 | % | 39.2 | % | 3.9 | ||||||||||||||||
| 1984 Fund | 1,000.0 | 1,000.0 | 5,963.5 | — | 5,963.5 | 34.5 | % | 28.9 | % | 6.0 | ||||||||||||||||
| 1986 Fund | 671.8 | 671.8 | 9,080.7 | — | 9,080.7 | 34.4 | % | 28.9 | % | 13.5 | ||||||||||||||||
| 1987 Fund | 6,129.6 | 6,129.6 | 14,949.2 | — | 14,949.2 | 12.1 | % | 8.9 | % | 2.4 | ||||||||||||||||
| 1993 Fund | 1,945.7 | 1,945.7 | 4,143.3 | — | 4,143.3 | 23.6 | % | 16.8 | % | 2.1 | ||||||||||||||||
| 1996 Fund | 6,011.6 | 6,011.6 | 12,476.9 | — | 12,476.9 | 18.0 | % | 13.3 | % | 2.1 | ||||||||||||||||
| Subtotal - Legacy Funds | 16,474.5 | 16,474.5 | 50,269.3 | — | 50,269.3 | 26.1 | % | 19.9 | % | 3.1 | ||||||||||||||||
| Included Funds | ||||||||||||||||||||||||||
European Fund (1999) (2) | 3,085.4 | 3,085.4 | 8,757.7 | — | 8,757.7 | 26.9 | % | 20.2 | % | 2.8 | ||||||||||||||||
| Millennium Fund (2002) | 6,000.0 | 6,000.0 | 13,305.4 | 610.6 | 13,916.0 | 21.9 | % | 16.0 | % | 2.3 | ||||||||||||||||
European Fund II (2005) (2) | 5,750.8 | 5,750.8 | 8,467.3 | 58.4 | 8,525.7 | 6.1 | % | 4.5 | % | 1.5 | ||||||||||||||||
| 2006 Fund (2006) | 17,642.2 | 17,304.5 | 26,586.4 | 6,960.9 | 33,547.3 | 11.5 | % | 8.9 | % | 1.9 | ||||||||||||||||
| Asian Fund (2007) | 3,983.3 | 3,945.9 | 7,681.6 | 917.2 | 8,598.8 | 19.0 | % | 13.7 | % | 2.2 | ||||||||||||||||
European Fund III (2008) (2) | 6,165.5 | 5,327.3 | 6,989.1 | 3,427.6 | 10,416.7 | 16.9 | % | 11.6 | % | 2.0 | ||||||||||||||||
E2 Investors (Annex Fund) (2009) (2) | 195.8 | 195.8 | 195.7 | 1.7 | 197.4 | 0.2 | % | (0.5 | )% | 1.0 | ||||||||||||||||
| China Growth Fund (2010) | 1,010.0 | 1,010.0 | 565.0 | 801.4 | 1,366.4 | 11.5 | % | 5.9 | % | 1.4 | ||||||||||||||||
| Natural Resources Fund (2010) | 887.4 | 884.6 | 113.4 | 151.9 | 265.3 | (31.2 | )% | (33.7 | )% | 0.3 | ||||||||||||||||
Global Infrastructure Investors (2011) (2) | 1,040.2 | 1,011.3 | 844.8 | 775.9 | 1,620.7 | 14.5 | % | 12.5 | % | 1.6 | ||||||||||||||||
| North America Fund XI (2012) | 8,718.4 | 9,268.2 | 4,344.4 | 11,525.2 | 15,869.6 | 26.5 | % | 20.7 | % | 1.7 | ||||||||||||||||
| Asian Fund II (2013) | 5,825.0 | 5,782.0 | 1,469.1 | 7,070.8 | 8,539.9 | 25.9 | % | 18.7 | % | 1.5 | ||||||||||||||||
| Real Estate Partners Americas (2013) | 1,229.1 | 993.7 | 776.0 | 631.9 | 1,407.9 | 21.1 | % | 15.7 | % | 1.4 | ||||||||||||||||
| Energy Income and Growth Fund (2013) | 1,974.2 | 1,336.5 | 284.1 | 1,132.7 | 1,416.8 | 3.0 | % | 0.4 | % | 1.1 | ||||||||||||||||
Global Infrastructure Investors II (2014) (2) | 3,045.4 | 1,412.3 | 192.9 | 1,532.5 | 1,725.4 | 18.5 | % | 14.0 | % | 1.2 | ||||||||||||||||
European Fund IV (2015) (2) | 3,537.4 | 2,059.6 | 29.2 | 2,629.8 | 2,659.0 | 26.5 | % | 19.3 | % | 1.3 | ||||||||||||||||
Real Estate Partners Europe (2015) (2) (3) | 721.2 | 132.6 | 12.0 | 158.1 | 170.1 | — | — | — | ||||||||||||||||||
Next Generation Technology Growth Fund (2016) (3) | 658.9 | 227.6 | — | 325.1 | 325.1 | — | — | — | ||||||||||||||||||
Health Care Strategic Growth Fund (2016) (3) | 1,214.9 | — | — | — | — | — | — | — | ||||||||||||||||||
Americas Fund XII (2017) (3) | 13,500.0 | — | — | 5.6 | 5.6 | — | — | — | ||||||||||||||||||
Real Estate Credit Opportunity Partners (2017) (3) | 1,090.0 | 172.0 | — | — | 184.4 | 184.4 | — | — | — | |||||||||||||||||
Asian Fund III (2017) (3) | 9,000.0 | — | — | — | — | — | — | — | ||||||||||||||||||
Real Estate Partners Americas II (2017) (3) | 782.7 | — | — | — | — | — | — | — | — | |||||||||||||||||
| Subtotal - Included Funds | 97,057.8 | 65,900.1 | 80,614.1 | 38,901.7 | 119,515.8 | 15.7 | % | 11.5 | % | 1.8 | ||||||||||||||||
| All Funds | $ | 113,532.3 | $ | 82,374.6 | $ | 130,883.4 | $ | 38,901.7 | $ | 169,785.1 | 25.6 | % | 18.8 | % | 2.1 | |||||||||||
| Amount | Fair Value of Investments | |||||||||||||||||||
| Private Markets Investment Funds | Commitment | Invested (5) | Realized (5) | Unrealized | Total Value | Multiple of Invested Capital (5) | ||||||||||||||
| ($ in millions) | ||||||||||||||||||||
Realized/Partially Realized Investments (4) | ||||||||||||||||||||
Legacy Funds (1) | ||||||||||||||||||||
| 1976 Fund | $ | 31.4 | $ | 31.4 | $ | 537.2 | $ | — | $ | 537.2 | 17.1 | |||||||||
| 1980 Fund | 356.8 | 356.8 | 1,827.8 | — | 1,827.8 | 5.1 | ||||||||||||||
| 1982 Fund | 327.6 | 327.6 | 1,290.7 | — | 1,290.7 | 3.9 | ||||||||||||||
| 1984 Fund | 1,000.0 | 1,000.0 | 5,963.5 | — | 5,963.5 | 6.0 | ||||||||||||||
| 1986 Fund | 671.8 | 671.8 | 9,080.7 | — | 9,080.7 | 13.5 | ||||||||||||||
| 1987 Fund | 6,129.6 | 6,129.6 | 14,949.2 | — | 14,949.2 | 2.4 | ||||||||||||||
| 1993 Fund | 1,945.7 | 1,945.7 | 4,143.3 | — | 4,143.3 | 2.1 | ||||||||||||||
| 1996 Fund | 6,011.6 | 6,011.6 | 12,476.9 | — | 12,476.9 | 2.1 | ||||||||||||||
| Subtotal - Legacy Funds | 16,474.5 | 16,474.5 | 50,269.3 | — | 50,269.3 | 3.1 | ||||||||||||||
| Included Funds | ||||||||||||||||||||
European Fund (1999) (2) | 3,085.4 | 3,085.4 | 8,757.7 | — | 8,757.7 | 2.8 | ||||||||||||||
| Millennium Fund (2002) | 6,000.0 | 5,599.4 | 13,305.4 | 610.6 | 13,916.0 | 2.5 | ||||||||||||||
European Fund II (2005) (2) | 5,750.8 | 5,245.4 | 8,467.3 | 58.4 | 8,525.7 | 1.6 | ||||||||||||||
| 2006 Fund (2006) | 17,642.2 | 15,439.7 | 26,586.4 | 5,159.9 | 31,746.3 | 2.1 | ||||||||||||||
| Asian Fund (2007) | 3,983.3 | 3,118.2 | 7,681.6 | 344.8 | 8,026.4 | 2.6 | ||||||||||||||
European Fund III (2008) (2) | 6,165.5 | 3,897.0 | 6,989.1 | 1,933.8 | 8,922.9 | 2.3 | ||||||||||||||
E2 Investors (Annex Fund) (2009) (2) | 195.8 | 94.8 | 195.7 | — | 195.7 | 2.1 | ||||||||||||||
| China Growth Fund (2010) | 1,010.0 | 427.5 | 565.0 | 179.5 | 744.5 | 1.7 | ||||||||||||||
| Natural Resources Fund (2010) | 887.4 | 886.9 | 113.4 | 151.9 | 265.3 | 0.3 | ||||||||||||||
Global Infrastructure Investors (2011) (2) | 1,040.2 | 1,011.2 | 844.8 | 775.9 | 1,620.7 | 1.6 | ||||||||||||||
| North America Fund XI (2012) | 8,718.4 | 5,164.7 | 4,344.4 | 5,905.4 | 10,249.8 | 2.0 | ||||||||||||||
| Asian Fund II (2013) | 5,825.0 | 2,738.7 | 1,469.1 | 3,940.7 | 5,409.8 | 2.0 | ||||||||||||||
| Real Estate Partners Americas (2013) | 1,229.1 | 800.9 | 776.0 | 440.1 | 1,216.1 | 1.5 | ||||||||||||||
| Energy Income and Growth Fund (2013) | 1,974.2 | 1,336.5 | 284.1 | 1,132.7 | 1,416.8 | 1.1 | ||||||||||||||
Global Infrastructure Investors II (2014) (2) | 3,045.4 | 599.6 | 192.9 | 538.1 | 731.0 | 1.2 | ||||||||||||||
European Fund IV (2015) (2) | 3,537.4 | — | — | — | — | — | ||||||||||||||
Real Estate Partners Europe (2015) (2) (3) (4) | 721.2 | — | — | — | — | — | ||||||||||||||
Next Generation Technology Growth Fund (2016) (3) (4) | 658.9 | — | — | — | — | — | ||||||||||||||
Health Care Strategic Growth Fund (2016) (3) (4) | 1,214.9 | — | — | — | — | — | ||||||||||||||
Americas Fund XII (2017) (3) (4) | 13,500.0 | — | — | — | — | — | ||||||||||||||
Real Estate Credit Opportunity Partners (2017) (3) (4) | 1,090.0 | — | — | — | — | — | ||||||||||||||
Asian Fund III (2017) (3) (4) | 9,000.0 | — | — | — | — | — | ||||||||||||||
Real Estate Partners Americas II (2017) (3) (4) | 782.7 | — | — | — | — | — | ||||||||||||||
| Subtotal - Included Funds | 97,057.8 | 49,445.9 | 80,572.9 | 21,171.8 | 101,744.7 | 2.1 | ||||||||||||||
| All Realized/Partially Realized Investments | $ | 113,532.3 | $ | 65,920.4 | $ | 130,842.2 | $ | 21,171.8 | $ | 152,014.0 | 2.3 | |||||||||
The gross |
| Leveraged Credit Strategy | Inception Date | Gross Returns | Net Returns | Benchmark (1) | Benchmark Gross Returns | |||||||||||||||||||||||||||||||||
| Bank Loans Plus High Yield | Jul 2008 | 6.41 | % | 5.81 | % | 65% S&P/LSTA Loan Index, 35% BoAML HY Master II Index (2) | 5.04 | % | ||||||||||||||||||||||||||||||
Opportunistic Credit (3) | May 2008 | 9.94 | % | 8.29 | % | 50% S&P/LSTA Loan Index, 50% BoAML HY Master II Index (3) | 5.19 | % | ||||||||||||||||||||||||||||||
| Bank Loans | Apr 2011 | 4.74 | % | 4.16 | % | S&P/LSTA Loan Index (4) | 3.69 | % | ||||||||||||||||||||||||||||||
| High-Yield | Apr 2011 | 5.10 | % | 4.52 | % | BoAML HY Master II Index (5) | 4.42 | % | ||||||||||||||||||||||||||||||
European Leveraged Loans (6) | Sep 2009 | 3.88 | % | 3.37 | % | CS Inst West European Leveraged Loan Index (7) | 2.98 | % | ||||||||||||||||||||||||||||||
European Credit Opportunities (6) | Sept 2007 | 4.56 | % | 3.74 | % | S&P European Leveraged Loans (All Loans) (8) | 3.49 | % | ||||||||||||||||||||||||||||||
| ($ in millions) | Inception Date | Gross Returns | Net Returns | Benchmark (1) | Benchmark Gross Returns | ||||||||
| Bank Loans Plus High Yield | Jul 2008 | 8.04 | % | 7.40 | % | 65% S&P/ LSTA, 35% BoAML HY Master II Index (2) | 6.47 | % | |||||
Opportunistic Credit (3) | May 2008 | 13.18 | % | 11.14 | % | BoAML HY Master II Index (3) | 6.79 | % | |||||
| Bank Loans | Apr 2011 | 5.49 | % | 4.87 | % | S&P/ LSTA Loan Index (4) | 4.24 | % | |||||
| High Yield | Apr 2011 | 7.28 | % | 6.69 | % | BoAML HY Master II Index (5) | 6.80 | % | |||||
| Bank Loans Conservative | Apr 2011 | 4.80 | % | 4.19 | % | S&P/ LSTA BB-B Loan Index (6) | 4.24 | % | |||||
European Leveraged Loans (7) | Sep 2009 | 5.60 | % | 5.07 | % | CS Inst West European Leveraged Loan Index (8) | 4.88 | % | |||||
| High Yield Conservative | Apr 2011 | 6.65 | % | 6.08 | % | BoAML HY BB-B Constrained | 6.69 | % | |||||
European Credit Opportunities (7) | Sept 2007 | 5.80 | % | 4.89 | % | S&P LSTA European Leveraged Loans (All Loans) | 4.44 | % | |||||
(3)The Opportunistic Credit strategy invests in high-yield securities and corporate loans with no preset allocation. The benchmark used for purposes of comparison for the Opportunistic Credit strategy presented herein is based on 50% S&P/LSTA Loan Index and 50% BoAML HY Master II Index. Funds within this strategy may utilize third-party financing facilities to enhance investment returns. In cases where financing facilities are used, the amounts drawn on the facility are deducted from the assets of the fund in the calculation of net asset value, which tends to increase returns when net asset value grows over time and decrease returns when net asset value decreases over time. (4)Performance is based on a composite of portfolios that |
| Amount | Fair Value of Investments | |||||||||||||||||||||||||||||||||||||||||||||||||||||||||||||||||||
| Credit and Liquid Strategies Investment Funds | Inception Date | Commitment | Invested (1) | Realized (1) | Unrealized | Total Value | Gross IRR (2) | Net IRR (2) | Multiple of Invested Capital (3) | Gross Accrued Carried Interest | ||||||||||||||||||||||||||||||||||||||||||||||||||||||||||
| ($ in Millions) | ||||||||||||||||||||||||||||||||||||||||||||||||||||||||||||||||||||
| Dislocation Opportunities Fund | May 2020 | $ | 2,967 | $ | 2,299 | $ | 682 | $ | 1,950 | $ | 2,632 | 12.1 | % | 9.4 | % | 1.1 | $ | 35 | ||||||||||||||||||||||||||||||||||||||||||||||||||
| Special Situations Fund II | Dec 2014 | 3,525 | 3,241 | 2,215 | 1,552 | 3,767 | 4.2 | % | 2.2 | % | 1.2 | — | ||||||||||||||||||||||||||||||||||||||||||||||||||||||||
| Special Situations Fund | Dec 2012 | 2,274 | 2,273 | 1,701 | 388 | 2,089 | (1.9) | % | (3.8) | % | 0.9 | — | ||||||||||||||||||||||||||||||||||||||||||||||||||||||||
| Mezzanine Partners | Mar 2010 | 1,023 | 990 | 1,165 | 116 | 1,281 | 8.7 | % | 5.5 | % | 1.3 | (20) | ||||||||||||||||||||||||||||||||||||||||||||||||||||||||
| Asset-Based Finance Partners | Aug 2020 | 2,059 | 555 | 14 | 597 | 611 | 11.4 | % | 8.0 | % | 1.1 | 9 | ||||||||||||||||||||||||||||||||||||||||||||||||||||||||
| Private Credit Opportunities Partners II | Dec 2015 | 2,245 | 1,754 | 696 | 1,291 | 1,987 | 4.5 | % | 2.8 | % | 1.1 | — | ||||||||||||||||||||||||||||||||||||||||||||||||||||||||
| Lending Partners III | Apr 2017 | 1,498 | 805 | 460 | 775 | 1,235 | 15.5 | % | 12.7 | % | 1.5 | 32 | ||||||||||||||||||||||||||||||||||||||||||||||||||||||||
| Lending Partners II | Jun 2014 | 1,336 | 1,179 | 1,149 | 127 | 1,276 | 2.9 | % | 1.5 | % | 1.1 | — | ||||||||||||||||||||||||||||||||||||||||||||||||||||||||
| Lending Partners | Dec 2011 | 460 | 420 | 451 | 19 | 470 | 3.5 | % | 1.8 | % | 1.1 | — | ||||||||||||||||||||||||||||||||||||||||||||||||||||||||
| Lending Partners Europe II | Jun 2019 | 837 | 637 | 66 | 570 | 636 | 14.7 | % | 10.6 | % | 1.0 | 2 | ||||||||||||||||||||||||||||||||||||||||||||||||||||||||
| Lending Partners Europe | Mar 2015 | 848 | 662 | 379 | 248 | 627 | (1.7) | % | (4.2) | % | 0.9 | — | ||||||||||||||||||||||||||||||||||||||||||||||||||||||||
| Asia Credit | Dec 2020 | 1,084 | 271 | — | 286 | 286 | N/A | N/A | N/A | — | ||||||||||||||||||||||||||||||||||||||||||||||||||||||||||
| Other Alternative Credit Vehicles | Various | 14,011 | 7,308 | 5,648 | 3,716 | 9,364 | N/A | N/A | N/A | 24 | ||||||||||||||||||||||||||||||||||||||||||||||||||||||||||
| All Funds | $ | 34,167 | $ | 22,394 | $ | 14,626 | $ | 11,635 | $ | 26,261 | $ | 82 | ||||||||||||||||||||||||||||||||||||||||||||||||||||||||
| Amount | Fair Value of Investments | ||||||||||||||||||||||||||||||
Public Markets Investment Funds | Inception Date | Commitment | Invested (1) | Realized (1) | Unrealized | Total Value | Gross IRR (2) | Net IRR (2) | Multiple of Invested Capital (3) | ||||||||||||||||||||||
| ($ in Millions) | |||||||||||||||||||||||||||||||
| Special Situations Fund | Dec-12 | $ | 2,274.3 | $ | 2,231.6 | $ | 690.1 | $ | 2,024.7 | $ | 2,714.8 | 7.0 | % | 4.9 | % | 1.2 | |||||||||||||||
| Special Situations Fund II | Dec-14 | 3,285.8 | 1,347.6 | — | 1,320.1 | 1,320.1 | (1.2 | )% | (4.2 | )% | 1.0 | ||||||||||||||||||||
| Mezzanine Partners | Mar-10 | 1,022.8 | 921.9 | 812.5 | 488.6 | 1,301.1 | 12.8 | % | 8.0 | % | 1.4 | ||||||||||||||||||||
| Private Credit Opportunities Partners II | Dec-15 | 732.9 | 105.8 | — | 137.4 | 137.4 | N/A | N/A | N/A | ||||||||||||||||||||||
| Lending Partners | Dec-11 | 460.2 | 405.3 | 321.0 | 195.7 | 516.7 | 7.7 | % | 6.3 | % | 1.3 | ||||||||||||||||||||
| Lending Partners II | Jun-14 | 1,335.9 | 1,136.7 | 258.9 | 1,158.6 | 1,417.5 | 15.2 | % | 12.8 | % | 1.2 | ||||||||||||||||||||
| Lending Partners III | Apr-17 | 795.8 | 35.8 | — | 41.9 | 41.9 | N/A | N/A | N/A | ||||||||||||||||||||||
| Lending Partners Europe | Mar-15 | 847.6 | 324.1 | 42.3 | 344.7 | 387.0 | 22.3 | % | 14.7 | % | 1.2 | ||||||||||||||||||||
| Revolving Credit Partners | May-15 | 510.0 | — | 27.6 | (12.0 | ) | 15.6 | (4) | (4) | (4) | |||||||||||||||||||||
| Other Alternative Credit Vehicles | Various | 5,093.1 | 3,421.0 | 1,945.4 | 2,696.7 | 4,642.1 | N/A | N/A | N/A | ||||||||||||||||||||||
| Unallocated Commitments | Various | 1,400.0 | — | — | — | — | N/A | N/A | N/A | ||||||||||||||||||||||
| All Funds | $ | 17,758.4 | $ | 9,929.8 | $ | 4,097.8 | $ | 8,396.4 | $ | 12,494.2 | |||||||||||||||||||||
| ($ in millions) | AUM | FPAUM | Typical Management Fee Rate | Incentive Fee / Carried Interest | Preferred Return | Duration of Capital | ||||||||||||||||||||||||||||||||
| Leveraged Credit: | ||||||||||||||||||||||||||||||||||||||
| Leveraged Credit SMAs/Funds | $ | 78,256 | $ | 75,479 | 0.15% - 1.10% | Various (1) | Various (1) | Subject to redemptions | ||||||||||||||||||||||||||||||
| CLOs | 23,951 | 23,951 | 0.40% - 0.50% | Various (1) | Various (1) | 10-14 Years (2) | ||||||||||||||||||||||||||||||||
| Total Leveraged Credit | 102,207 | 99,430 | ||||||||||||||||||||||||||||||||||||
Alternative Credit: (3) | ||||||||||||||||||||||||||||||||||||||
| Private Credit | 59,574 | 51,361 | 0.30% - 1.50% (4) | 10.00 - 20.00% | 5.00 - 8.00% | 8-15 Years (2) | ||||||||||||||||||||||||||||||||
| SIG | 7,773 | 3,959 | 0.50% - 1.75% | 10.00 - 20.00% | 7.00 - 12.00% | 7-15 Years (2) | ||||||||||||||||||||||||||||||||
| Total Alternative Credit | 67,347 | 55,320 | ||||||||||||||||||||||||||||||||||||
Hedge Funds (5) | 26,624 | 26,624 | 0.50% - 2.00% | Various (1) | Various (1) | Subject to redemptions | ||||||||||||||||||||||||||||||||
BDCs (6) | 16,800 | 16,800 | 0.60% | 8.00% | 7.00% | Indefinite | ||||||||||||||||||||||||||||||||
| Total | $ | 212,978 | $ | 198,174 | ||||||||||||||||||||||||||||||||||
| ($ in millions) | AUM | FPAUM | Typical Management Fee Rate | Incentive Fee / Carried Interest | Preferred Return | Duration of Capital | ||||||||||
| Leveraged Credit: | ||||||||||||||||
| Leveraged Credit SMAs/Funds | $ | 10,394 | $ | 9,719 | 0.35%-1.50% | Various (1) | Various (1) | Subject to redemptions | ||||||||
| CLO’s | 9,803 | 9,803 | 0.40%-0.50% | Various (1) | Various (1) | 10-14 Years (2) | ||||||||||
| Total Leveraged Credit | 20,197 | 19,522 | ||||||||||||||
Alternative Credit: (3) | ||||||||||||||||
| Special Situations | 8,080 | 4,574 | 0.90%-1.75% (4) | 10.00-20.00% | 8.00-12.00% | 8-15 Years (2) | ||||||||||
| Private Credit | 8,764 | 4,728 | 0.50%-1.50% | 10.00-20.00% | 5.00-8.00% | 8-15 Years (2) | ||||||||||
| Total Alternative Credit | 16,844 | 9,302 | ||||||||||||||
Hedge Funds (5) | 24,438 | 18,942 | 0.50%-2.00% | Various (1) | Various (1) | Subject to redemptions | ||||||||||
Business Development Companies (6) | 4,251 | 4,251 | 1.00% | 10.00% | 7.00% | 7 years | ||||||||||
| Total | $ | 65,730 | $ | 52,017 | ||||||||||||
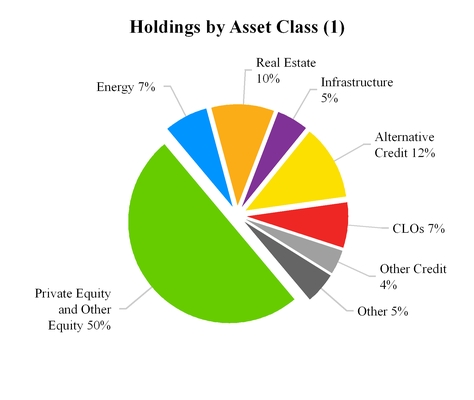
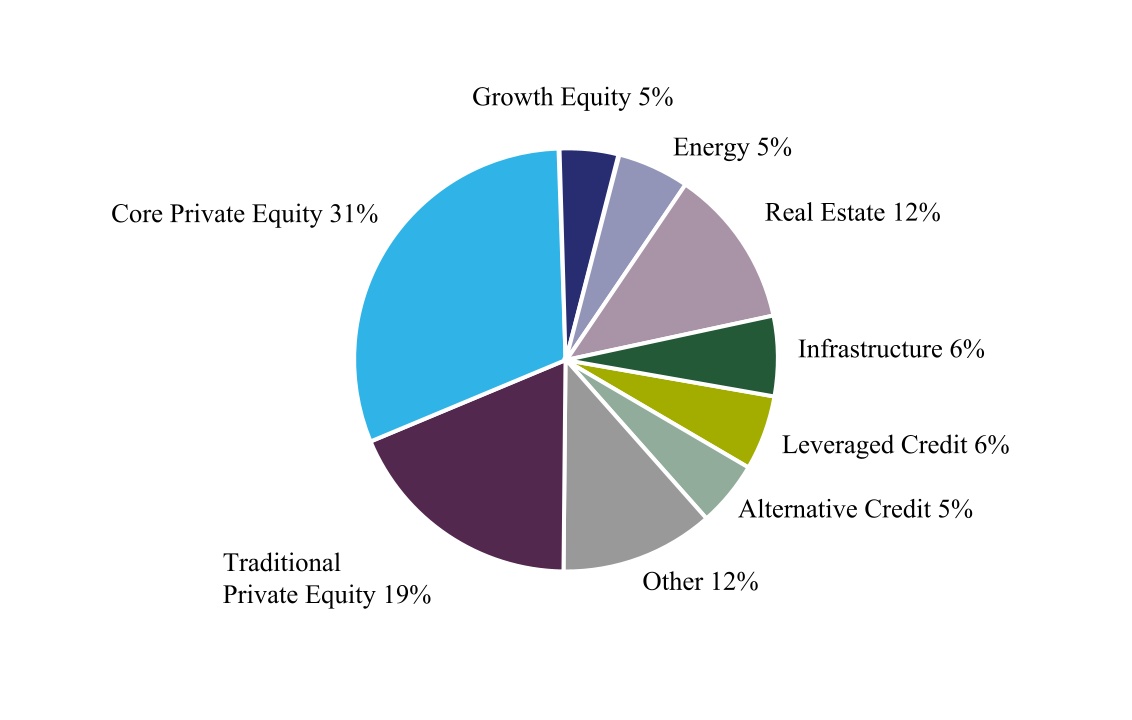
| Three Months Ended September 30, | Nine Months Ended September 30, | |||||||||||||||||||||||||
| 2022 | 2021 | 2022 | 2021(4) | |||||||||||||||||||||||
| ($ in millions) | ||||||||||||||||||||||||||
| Individual market channel: | ||||||||||||||||||||||||||
| Fixed-rate annuities | $ | 1,206 | $ | 854 | $ | 3,726 | $ | 3,437 | ||||||||||||||||||
| Fixed-indexed annuities | 1,261 | 809 | 3,282 | 2,305 | ||||||||||||||||||||||
| Variable annuities | 12 | 17 | 34 | 40 | ||||||||||||||||||||||
Total retirement products(1) | $ | 2,479 | $ | 1,680 | $ | 7,042 | $ | 5,782 | ||||||||||||||||||
| Life insurance products | $ | 7 | $ | 11 | $ | 26 | $ | 28 | ||||||||||||||||||
| Preneed life | 72 | 64 | 210 | 164 | ||||||||||||||||||||||
| Institutional market channel: | ||||||||||||||||||||||||||
| Block | — | 16,010 | 2,782 | 17,099 | ||||||||||||||||||||||
| Flow & pension risk transfer | 2,571 | 1,050 | 6,413 | 3,443 | ||||||||||||||||||||||
Funding agreements(3) | — | 1,500 | 2,000 | 2,200 | ||||||||||||||||||||||
Total institutional channel(2) | $ | 2,571 | $ | 18,560 | $ | 11,195 | $ | 22,742 | ||||||||||||||||||
| Reserves as of September 30, 2022 | |||||||||||||||||||||||||||||||||||
| Individual market | Institutional market(5) | Total | Ceded | Total, net | Percentage of total | ||||||||||||||||||||||||||||||
| ($ in millions, except percentages, if applicable) | |||||||||||||||||||||||||||||||||||
Fixed-rate annuity(1) | $ | 22,691 | $ | 45,432 | $ | 68,123 | $ | (17,465) | $ | 50,658 | 48.7 | % | |||||||||||||||||||||||
Fixed-indexed annuity(1) | 22,514 | 7,566 | 30,080 | (3,088) | 26,992 | 21.5 | % | ||||||||||||||||||||||||||||
| Variable annuity | 2,538 | 3,272 | 5,810 | (646) | 5,164 | 4.2 | % | ||||||||||||||||||||||||||||
Indexed universal life(1) | 13,521 | — | 13,521 | (167) | 13,354 | 9.7 | % | ||||||||||||||||||||||||||||
| Preneed life | 2,854 | — | 2,854 | — | 2,854 | 2.0 | % | ||||||||||||||||||||||||||||
Other life insurance(2) | 583 | 10,165 | 10,748 | (3,672) | 7,076 | 7.7 | % | ||||||||||||||||||||||||||||
Funding agreements(3) | 2,099 | 5,406 | 7,505 | — | 7,505 | 5.4 | % | ||||||||||||||||||||||||||||
| Closed block | — | 1,098 | 1,098 | (1,057) | 41 | 0.8 | % | ||||||||||||||||||||||||||||
Other corporate(4) | — | 47 | 47 | (47) | — | — | % | ||||||||||||||||||||||||||||
| Total reserves | $ | 66,800 | $ | 72,986 | $ | 139,786 | $ | (26,142) | $ | 113,644 | 100.0 | % | |||||||||||||||||||||||
| Total general account | $ | 64,491 | $ | 71,243 | $ | 135,734 | $ | (26,142) | $ | 109,592 | 97.1 | % | |||||||||||||||||||||||
| Total separate account | 2,309 | 1,743 | 4,052 | — | 4,052 | 2.9 | % | ||||||||||||||||||||||||||||
| Total reserves | $ | 66,800 | $ | 72,986 | $ | 139,786 | $ | (26,142) | $ | 113,644 | 100.0 | % | |||||||||||||||||||||||
| Three Months Ended | Nine Months Ended | |||||||||||||||
| ($ in thousands) | September 30, 2017 | September 30, 2016 | September 30, 2017 | September 30, 2016 | ||||||||||||
| Distributable Segment Revenues | ||||||||||||||||
| Fees and Other, Net | ||||||||||||||||
| Management Fees | $ | 232,954 | $ | 201,508 | $ | 670,807 | $ | 599,725 | ||||||||
| Monitoring Fees | 14,342 | 11,091 | 58,072 | 52,126 | ||||||||||||
| Transaction Fees | 179,167 | 111,354 | 578,667 | 276,003 | ||||||||||||
| Fee Credits | (70,747 | ) | (47,392 | ) | (211,148 | ) | (109,272 | ) | ||||||||
| Total Fees and Other, Net | 355,716 | 276,561 | 1,096,398 | 818,582 | ||||||||||||
| Realized Performance Income (Loss) | ||||||||||||||||
| Incentive Fees | 4,074 | 3,659 | 8,384 | 9,897 | ||||||||||||
| Carried Interest | 419,438 | 350,469 | 890,310 | 753,032 | ||||||||||||
| Total Realized Performance Income (Loss) | 423,512 | 354,128 | 898,694 | 762,929 | ||||||||||||
| Realized Investment Income (Loss) | ||||||||||||||||
| Net Realized Gains (Losses) | 76,053 | 170,078 | 162,684 | 370,594 | ||||||||||||
| Interest Income and Dividends | 70,557 | 71,185 | 195,275 | 253,756 | ||||||||||||
| Interest Expense | (45,613 | ) | (47,506 | ) | (134,348 | ) | (144,497 | ) | ||||||||
| Total Realized Investment Income (Loss) | 100,997 | 193,757 | 223,611 | 479,853 | ||||||||||||
| Total Distributable Segment Revenues | $ | 880,225 | $ | 824,446 | $ | 2,218,703 | $ | 2,061,364 | ||||||||
| Three Months Ended | Nine Months Ended | |||||||||||||||
| ($ in thousands) | September 30, 2017 | September 30, 2016 | September 30, 2017 | September 30, 2016 | ||||||||||||
| Distributable Segment Expenses | ||||||||||||||||
| Compensation and Benefits | ||||||||||||||||
| Cash Compensation and Benefits | $ | 130,621 | $ | 101,967 | $ | 405,578 | $ | 299,756 | ||||||||
| Performance Income Compensation | 177,705 | 159,151 | 377,689 | 322,671 | ||||||||||||
| Total Compensation and Benefits | 308,326 | 261,118 | 783,267 | 622,427 | ||||||||||||
| Occupancy and Related Charges | 14,672 | 15,877 | 42,448 | 47,486 | ||||||||||||
| Other Operating Expenses | 70,517 | 55,123 | 177,084 | 166,542 | ||||||||||||
| Total Distributable Segment Expenses | $ | 393,515 | $ | 332,118 | $ | 1,002,799 | $ | 836,455 | ||||||||
| Three Months Ended | Nine Months Ended | |||||||||||||||
| ($ in thousands except per unit data) | September 30, 2017 | September 30, 2016 | September 30, 2017 | September 30, 2016 | ||||||||||||
| After-tax Distributable Earnings | ||||||||||||||||
| Distributable Segment Revenues | $ | 880,225 | $ | 824,446 | $ | 2,218,703 | $ | 2,061,364 | ||||||||
| Distributable Segment Expenses | 393,515 | 332,118 | 1,002,799 | 836,455 | ||||||||||||
| Income (Loss) attributable to Noncontrolling Interests | 1,046 | 760 | 3,810 | 2,002 | ||||||||||||
| Income taxes paid | 12,869 | 21,869 | 54,228 | 71,191 | ||||||||||||
| Preferred distributions | 8,341 | 8,201 | 25,023 | 13,894 | ||||||||||||
| After-tax Distributable Earnings | $ | 464,454 | $ | 461,498 | $ | 1,132,843 | $ | 1,137,822 | ||||||||
| Per Adjusted Unit Eligible for Distribution | $ | 0.57 | $ | 0.57 | $ | 1.39 | $ | 1.41 | ||||||||
| Three Months Ended | Nine Months Ended | |||||||||||||||
| ($ in thousands) | September 30, 2017 | September 30, 2016 | September 30, 2017 | September 30, 2016 | ||||||||||||
| Fees and Other | $ | 692,877 | $ | 687,056 | $ | 2,340,617 | $ | 1,426,618 | ||||||||
| Plus: Management fees relating to consolidated funds and placement fees | 54,012 | 49,017 | 153,414 | 131,335 | ||||||||||||
| Less: Fee credits relating to consolidated funds | 106 | 417 | 3,752 | 2,766 | ||||||||||||
| Plus: Net realized and unrealized carried interest - consolidated funds | 22,341 | 5,956 | 43,782 | 15,581 | ||||||||||||
| Plus: Total investment income (loss) | 50,095 | 330,497 | 684,722 | (245,846 | ) | |||||||||||
| Less: Revenue earned by oil & gas producing entities | 12,441 | 16,191 | 47,096 | 47,977 | ||||||||||||
| Less: Reimbursable expenses | 27,506 | 12,064 | 87,131 | 46,583 | ||||||||||||
| Less: Other | 9,587 | 12,317 | 27,035 | 29,453 | ||||||||||||
| Total Segment Revenues | $ | 769,685 | $ | 1,031,537 | $ | 3,057,521 | $ | 1,200,909 | ||||||||
| Less: Unrealized Carried Interest | (59,638 | ) | 70,351 | 377,707 | (134,756 | ) | ||||||||||
| Less: Net Unrealized Gains (Losses) | (50,902 | ) | 136,740 | 461,111 | (725,699 | ) | ||||||||||
| Total Distributable Segment Revenues | $ | 880,225 | $ | 824,446 | $ | 2,218,703 | $ | 2,061,364 | ||||||||
| Three Months Ended | Nine Months Ended | |||||||||||||||
| ($ in thousands) | September 30, 2017 | September 30, 2016 | September 30, 2017 | September 30, 2016 | ||||||||||||
| Total Expenses | $ | 530,247 | $ | 511,117 | $ | 1,699,989 | $ | 1,242,658 | ||||||||
| Less: Equity based compensation | 72,250 | 61,552 | 271,226 | 186,032 | ||||||||||||
| Less: Reimbursable expenses and placement fees | 37,508 | 18,255 | 132,491 | 72,887 | ||||||||||||
| Less: Operating expenses relating to consolidated funds, CFEs and other entities | 21,858 | 20,141 | 56,517 | 85,093 | ||||||||||||
| Less: Expenses incurred by oil & gas producing entities | 10,725 | 17,782 | 34,826 | 56,000 | ||||||||||||
| Less: Intangible amortization | 2,473 | 22,112 | 13,901 | 35,640 | ||||||||||||
| Less: Other | 11,744 | 9,764 | 31,067 | 19,275 | ||||||||||||
| Total Segment Expenses | $ | 373,689 | $ | 361,511 | $ | 1,159,961 | $ | 787,731 | ||||||||
| Less: Unrealized Performance Income Compensation | (19,826 | ) | 29,393 | 157,162 | (48,724 | ) | ||||||||||
| Total Distributable Segment Expenses | $ | 393,515 | $ | 332,118 | $ | 1,002,799 | $ | 836,455 | ||||||||
| Three Months Ended | Nine Months Ended | |||||||||||||||
| ($ in thousands) | September 30, 2017 | September 30, 2016 | September 30, 2017 | September 30, 2016 | ||||||||||||
| Net Income (Loss) Attributable to KKR & Co. L.P. Common Unitholders | $ | 153,563 | $ | 352,152 | $ | 818,552 | $ | 116,103 | ||||||||
| Plus: Preferred Distributions | 8,341 | 8,201 | 25,023 | 13,894 | ||||||||||||
| Plus: Net income (loss) attributable to noncontrolling interests held by KKR Holdings L.P. | 115,434 | 284,834 | 637,146 | 86,659 | ||||||||||||
| Plus: Non-cash equity-based charges | 78,728 | 61,552 | 277,704 | 186,032 | ||||||||||||
| Plus: Amortization of intangibles, placement fees and other, net | 20,464 | (48,299 | ) | 57,825 | (10,273 | ) | ||||||||||
| Plus: Income tax (benefit) | 18,420 | 10,826 | 77,500 | 18,761 | ||||||||||||
| Economic Net Income (Loss) | 394,950 | 669,266 | 1,893,750 | 411,176 | ||||||||||||
| Plus: Income attributable to segment noncontrolling interests | 1,046 | 760 | 3,810 | 2,002 | ||||||||||||
| Less: Total investment income (loss) | 50,095 | 330,497 | 684,722 | (245,846 | ) | |||||||||||
| Less: Net performance income (loss) | 205,995 | 235,935 | 741,550 | 354,226 | ||||||||||||
| Plus: Expenses of Principal Activities Segment | 51,974 | 38,659 | 156,938 | 116,214 | ||||||||||||
| Fee Related Earnings | 191,880 | 142,253 | 628,226 | 421,012 | ||||||||||||
| Plus: Net interest and dividends | 24,944 | 23,679 | 60,927 | 109,259 | ||||||||||||
| Less: Expenses of Principal Activities Segment | 51,974 | 38,659 | 156,938 | 116,214 | ||||||||||||
| Plus: Realized performance income (loss), net | 245,807 | 194,977 | 521,005 | 440,258 | ||||||||||||
| Plus: Net realized gains (losses) | 76,053 | 170,078 | 162,684 | 370,594 | ||||||||||||
| Less: Income taxes paid | 12,869 | 21,869 | 54,228 | 71,191 | ||||||||||||
| Less: Preferred distributions | 8,341 | 8,201 | 25,023 | 13,894 | ||||||||||||
| Less: Income attributable to segment noncontrolling interests | 1,046 | 760 | 3,810 | 2,002 | ||||||||||||
| After-tax Distributable Earnings | $ | 464,454 | $ | 461,498 | $ | 1,132,843 | $ | 1,137,822 | ||||||||
| Three Months Ended | |||||||||||||||||
| September 30, 2022 | September 30, 2021 | Change | |||||||||||||||
| ($ in thousands) | |||||||||||||||||
| Revenues | |||||||||||||||||
| Asset Management | |||||||||||||||||
| Fees and Other | $ | 673,929 | $ | 718,968 | $ | (45,039) | |||||||||||
| Capital Allocation-Based Income (Loss) | (572,863) | 1,526,667 | (2,099,530) | ||||||||||||||
| 101,066 | 2,245,635 | (2,144,569) | |||||||||||||||
| Insurance | |||||||||||||||||
| Net Premiums | 480,462 | 974,903 | (494,441) | ||||||||||||||
| Policy Fees | 320,206 | 310,381 | 9,825 | ||||||||||||||
| Net Investment Income | 1,094,877 | 758,381 | 336,496 | ||||||||||||||
| Net Investment-Related Gains (Losses) | (173,830) | 162,127 | (335,957) | ||||||||||||||
| Other Income | 35,632 | 31,938 | 3,694 | ||||||||||||||
| 1,757,347 | 2,237,730 | (480,383) | |||||||||||||||
| Total Revenues | 1,858,413 | 4,483,365 | (2,624,952) | ||||||||||||||
| Expenses | |||||||||||||||||
| Asset Management | |||||||||||||||||
| Compensation and Benefits | 244,502 | 1,012,837 | (768,335) | ||||||||||||||
| Occupancy and Related Charges | 18,683 | 17,438 | 1,245 | ||||||||||||||
| General, Administrative and Other | 212,513 | 203,977 | 8,536 | ||||||||||||||
| 475,698 | 1,234,252 | (758,554) | |||||||||||||||
| Insurance | |||||||||||||||||
| Net Policy Benefits and Claims | 1,087,731 | 1,697,046 | (609,315) | ||||||||||||||
| Amortization of Policy Acquisition Costs | 8,222 | (16,900) | 25,122 | ||||||||||||||
| Interest Expense | 26,141 | 22,437 | 3,704 | ||||||||||||||
| Insurance Expenses | 158,280 | 89,534 | 68,746 | ||||||||||||||
| General, Administrative and Other | 178,443 | 158,873 | 19,570 | ||||||||||||||
| 1,458,817 | 1,950,990 | (492,173) | |||||||||||||||
| Total Expenses | 1,934,515 | 3,185,242 | (1,250,727) | ||||||||||||||
| Investment Income (Loss) - Asset Management | |||||||||||||||||
| Net Gains (Losses) from Investment Activities | (379,180) | 2,116,647 | (2,495,827) | ||||||||||||||
| Dividend Income | 294,415 | 121,484 | 172,931 | ||||||||||||||
| Interest Income | 500,234 | 402,839 | 97,395 | ||||||||||||||
| Interest Expense | (391,520) | (278,166) | (113,354) | ||||||||||||||
| Total Investment Income (Loss) | 23,949 | 2,362,804 | (2,338,855) | ||||||||||||||
| Income (Loss) Before Taxes | (52,153) | 3,660,927 | (3,713,080) | ||||||||||||||
| Income Tax Expense (Benefit) | 27,434 | 379,282 | (351,848) | ||||||||||||||
| Three Months Ended | |||||||||||
| September 30, 2017 | September 30, 2016 | Change | |||||||||
| ($ in thousands) | |||||||||||
| Revenues | |||||||||||
| Fees and Other | $ | 692,877 | $ | 687,056 | $ | 5,821 | |||||
| Expenses | |||||||||||
| Compensation and Benefits | 368,513 | 358,161 | 10,352 | ||||||||
| Occupancy and Related Charges | 15,267 | 16,405 | (1,138 | ) | |||||||
| General, Administrative and Other | 146,467 | 136,551 | 9,916 | ||||||||
| Total Expenses | 530,247 | 511,117 | 19,130 | ||||||||
| Investment Income (Loss) | |||||||||||
| Net Gains (Losses) from Investment Activities | 108,779 | 735,144 | (626,365 | ) | |||||||
| Dividend Income | 20,774 | 73,105 | (52,331 | ) | |||||||
| Interest Income | 317,134 | 256,505 | 60,629 | ||||||||
| Interest Expense | (211,959 | ) | (255,105 | ) | 43,146 | ||||||
| Total Investment Income (Loss) | 234,728 | 809,649 | (574,921 | ) | |||||||
| Income (Loss) Before Taxes | 397,358 | 985,588 | (588,230 | ) | |||||||
| Income Taxes | 18,420 | 10,826 | 7,594 | ||||||||
| Net Income (Loss) | 378,938 | 974,762 | (595,824 | ) | |||||||
| Net Income (Loss) Attributable to Redeemable Noncontrolling Interests | 20,876 | 3,121 | 17,755 | ||||||||
| Net Income (Loss) Attributable to Noncontrolling Interests | 196,158 | 611,288 | (415,130 | ) | |||||||
| Net Income (Loss) Attributable to KKR & Co. L.P. | 161,904 | 360,353 | (198,449 | ) | |||||||
| Less: Net Income Attributable to Series A Preferred Unitholders | 5,822 | 5,822 | — | ||||||||
| Less: Net Income Attributable to Series B Preferred Unitholders | 2,519 | 2,379 | 140 | ||||||||
| Net Income (Loss) Attributable to KKR & Co. L.P. Common Unitholders | $ | 153,563 | $ | 352,152 | $ | (198,589 | ) | ||||
| Three Months Ended | |||||||||||||||||
| September 30, 2022 | September 30, 2021 | Change | |||||||||||||||
| ($ in thousands) | |||||||||||||||||
| Net Income (Loss) | (79,587) | 3,281,645 | (3,361,232) | ||||||||||||||
| Net Income (Loss) Attributable to Redeemable Noncontrolling Interests | 1,601 | 1,519 | 82 | ||||||||||||||
| Net Income (Loss) Attributable to Noncontrolling Interests | (6,792) | 2,123,569 | (2,130,361) | ||||||||||||||
| Net Income (Loss) Attributable to KKR & Co. Inc. | (74,396) | 1,156,557 | (1,230,953) | ||||||||||||||
| Series A Preferred Stock Dividends | — | — | — | ||||||||||||||
| Series B Preferred Stock Dividends | — | 7,953 | (7,953) | ||||||||||||||
| Series C Mandatory Convertible Preferred Stock Dividends | 17,250 | 17,250 | — | ||||||||||||||
| Net Income (Loss) Attributable to KKR & Co. Inc. Common Stockholders | $ | (91,646) | $ | 1,131,354 | $ | (1,223,000) | |||||||||||
| Three Months Ended | ||||||||||||||||||||
| September 30, 2022 | September 30, 2021 | Change | ||||||||||||||||||
| ($ in thousands) | ||||||||||||||||||||
| Management Fees | $ | 419,876 | $ | 349,249 | $ | 70,627 | ||||||||||||||
| Fee Credits | (136,996) | (164,720) | 27,724 | |||||||||||||||||
| Transaction Fees | 328,483 | 437,619 | (109,136) | |||||||||||||||||
| Monitoring Fees | 29,683 | 29,823 | (140) | |||||||||||||||||
| Incentive Fees | 1,402 | 6,962 | (5,560) | |||||||||||||||||
| Expense Reimbursements | 10,733 | 34,857 | (24,124) | |||||||||||||||||
| Consulting Fees | 20,748 | 25,178 | (4,430) | |||||||||||||||||
| Total Fees and Other | 673,929 | 718,968 | (45,039) | |||||||||||||||||
| Carried Interest | (477,681) | 1,216,433 | (1,694,114) | |||||||||||||||||
| General Partner Capital Interest | (95,182) | 310,234 | (405,416) | |||||||||||||||||
| Total Capital Allocation-Based Income (Loss) | (572,863) | 1,526,667 | (2,099,530) | |||||||||||||||||
| Total Revenues - Asset Management | $ | 101,066 | $ | 2,245,635 | $ | (2,144,569) | ||||||||||||||
| Three Months Ended | ||||||||||||
| September 30, 2017 | September 30, 2016 | Change | ||||||||||
| Management Fees | $ | 178,942 | $ | 152,491 | $ | 26,451 | ||||||
| Transaction Fees | 181,280 | 113,056 | 68,224 | |||||||||
| Monitoring Fees | 41,848 | 23,367 | 18,481 | |||||||||
| Fee Credits | (70,641 | ) | (46,975 | ) | (23,666 | ) | ||||||
| Carried Interest | 337,459 | 414,864 | (77,405 | ) | ||||||||
| Incentive Fees | 2,519 | 3,800 | (1,281 | ) | ||||||||
| Oil and Gas Revenue | 12,441 | 16,191 | (3,750 | ) | ||||||||
| Consulting Fees | 9,029 | 10,262 | (1,233 | ) | ||||||||
| Total Fees and Other | $ | 692,877 | $ | 687,056 | $ | 5,821 | ||||||
| Three Months Ended September 30, | |||||||
| 2017 | 2016 | ||||||
| ($ in thousands) | |||||||
| Private Equity Investments | $ | 151,782 | $ | 209,855 | |||
| Credit & Other Investments | (11,064 | ) | (6,689 | ) | |||
| Investments of Consolidated CFE's | (39,892 | ) | 21,352 | ||||
| Real Assets Investments | 80,696 | 99,503 | |||||
| Debt Obligations | 20,959 | 174,625 | |||||
| Other Net Gains (Losses) from Investment Activities | (93,702 | ) | 236,498 | ||||
| Net Gains (Losses) from Investment Activities | $ | 108,779 | $ | 735,144 | |||
| Three Months Ended | ||||||||||||||||||||||||||||||||
| September 30, 2022 | September 30, 2021 | Change | ||||||||||||||||||||||||||||||
| ($ in thousands) | ||||||||||||||||||||||||||||||||
| Impacts of assumption review, by statement of income line item: | ||||||||||||||||||||||||||||||||
| Policy fees | $ | (14) | $ | 182 | $ | (196) | ||||||||||||||||||||||||||
| Policy benefits and claims | (23,079) | 20,904 | (43,983) | |||||||||||||||||||||||||||||
| Amortization of policy acquisition costs | 7,686 | (2,119) | 9,805 | |||||||||||||||||||||||||||||
| Income tax impact | 3,236 | (3,983) | 7,219 | |||||||||||||||||||||||||||||
| Total assumption review impact on net income | $ | (12,171) | $ | 14,984 | $ | (27,155) | ||||||||||||||||||||||||||
| Assumption review impact on adjustments to derive insurance segment adjusted operating earnings | (157) | (97) | (60) | |||||||||||||||||||||||||||||
| Non-controlling interests' share of assumption review impact | 4,749 | (5,734) | 10,483 | |||||||||||||||||||||||||||||
| Total assumption review impact on insurance segment adjusted operating earnings | $ | (7,579) | $ | 9,153 | $ | (16,732) | ||||||||||||||||||||||||||
| Three Months Ended | |||||||||||||||||||||||||||||||||||
| September 30, 2022 | September 30, 2021 | Change | |||||||||||||||||||||||||||||||||
| ($ in thousands) | |||||||||||||||||||||||||||||||||||
| Net Premiums | $ | 480,462 | $ | 974,903 | $ | (494,441) | |||||||||||||||||||||||||||||
| Policy Fees | 320,206 | 310,381 | 9,825 | ||||||||||||||||||||||||||||||||
| Net Investment Income | 1,094,877 | 758,381 | 336,496 | ||||||||||||||||||||||||||||||||
| Net Investment-Related Losses | (173,830) | 162,127 | (335,957) | ||||||||||||||||||||||||||||||||
| Other Income | 35,632 | 31,938 | 3,694 | ||||||||||||||||||||||||||||||||
| Total Insurance Revenues | $ | 1,757,347 | $ | 2,237,730 | $ | (480,383) | |||||||||||||||||||||||||||||
| Three Months Ended | |||||||||||||||||
| September 30, 2022 | September 30, 2021 | Change | |||||||||||||||
| ($ in thousands) | |||||||||||||||||
| Funds withheld payable at interest embedded derivatives | $ | 836,395 | $ | 103,971 | $ | 732,424 | |||||||||||
| Equity futures contracts | 37,247 | 1,783 | 35,464 | ||||||||||||||
| Foreign currency forwards | 42,136 | (4,776) | 46,912 | ||||||||||||||
| Credit risk contracts | 370 | (196) | 566 | ||||||||||||||
| Equity index options | (156,561) | (25,854) | (130,707) | ||||||||||||||
| Interest rate contracts | (107,494) | (24,135) | (83,359) | ||||||||||||||
| Funds withheld receivable embedded derivatives | 3,211 | (10,001) | 13,212 | ||||||||||||||
| Net gains on derivative instruments | 655,304 | 40,792 | 614,512 | ||||||||||||||
| Net other investment gains (losses) | (829,134) | 121,335 | (950,469) | ||||||||||||||
| Net investment-related gains (losses) | $ | (173,830) | $ | 162,127 | $ | (335,957) | |||||||||||
| Three Months Ended | |||||||||||||||||
| September 30, 2022 | September 30, 2021 | Change | |||||||||||||||
| ($ in thousands) | |||||||||||||||||
| Realized gains (losses) on investments not supporting asset-liability matching strategies | $ | 27,634 | $ | 51,492 | $ | (23,858) | |||||||||||
| Realized gains (losses) on equity investments | — | 51,520 | (51,520) | ||||||||||||||
| Realized gains (losses) on available-for-sale fixed maturity debt securities | (8,277) | (15,026) | 6,749 | ||||||||||||||
| Credit loss allowances | (25,885) | (76,872) | 50,987 | ||||||||||||||
| Unrealized gains (losses) on fixed maturity securities classified as trading | (720,418) | (133,118) | (587,300) | ||||||||||||||
| Unrealized gains (losses) on investments classified as trading or accounted under a fair-value option | (22,995) | 303,021 | (326,016) | ||||||||||||||
| Unrealized gains (losses) on real estate investments recognized at fair value under investment company accounting | (34,479) | 9,997 | (44,476) | ||||||||||||||
| Realized gains (losses) on funds withheld at interest payable portfolio | 3,652 | (12,272) | 15,924 | ||||||||||||||
| Realized gains (losses) on funds withheld at interest receivable portfolio | 3,858 | 2,633 | 1,225 | ||||||||||||||
| Other | (52,224) | (60,040) | 7,816 | ||||||||||||||
| Net other investment gains (losses) | $ | (829,134) | $ | 121,335 | $ | (950,469) | |||||||||||
| Nine Months Ended | |||||||||||||||||
| September 30, 2022 | September 30, 2021 | Change | |||||||||||||||
| ($ in thousands) | |||||||||||||||||
| Revenues | |||||||||||||||||
| Asset Management | |||||||||||||||||
| Fees and Other | $ | 2,069,704 | $ | 1,887,805 | $ | 181,899 | |||||||||||
| Capital Allocation-Based Income (Loss) | (2,442,080) | 5,736,707 | (8,178,787) | ||||||||||||||
| (372,376) | 7,624,512 | (7,996,888) | |||||||||||||||
| Insurance | |||||||||||||||||
| Net Premiums | 627,104 | 1,698,912 | (1,071,808) | ||||||||||||||
| Policy Fees | 964,349 | 824,326 | 140,023 | ||||||||||||||
| Net Investment Income | 2,839,371 | 1,919,659 | 919,712 | ||||||||||||||
| Net Investment-Related Gains (Losses) | (968,836) | 32,983 | (1,001,819) | ||||||||||||||
| Other Income | 102,888 | 82,160 | 20,728 | ||||||||||||||
| 3,564,876 | 4,558,040 | (993,164) | |||||||||||||||
| Total Revenues | 3,192,500 | 12,182,552 | (8,990,052) | ||||||||||||||
| Expenses | |||||||||||||||||
| Asset Management | |||||||||||||||||
| Compensation and Benefits | 779,050 | 3,419,057 | (2,640,007) | ||||||||||||||
| Occupancy and Related Charges | 55,693 | 51,289 | 4,404 | ||||||||||||||
| General, Administrative and Other | 701,010 | 608,270 | 92,740 | ||||||||||||||
| 1,535,753 | 4,078,616 | (2,542,863) | |||||||||||||||
| Insurance | |||||||||||||||||
| Net Policy Benefits and Claims | 1,768,384 | 3,593,563 | (1,825,179) | ||||||||||||||
| Amortization of Policy Acquisition Costs | 13,693 | (57,409) | 71,102 | ||||||||||||||
| Interest Expense | 58,330 | 44,482 | 13,848 | ||||||||||||||
| Insurance Expenses | 406,088 | 242,591 | 163,497 | ||||||||||||||
| General, Administrative and Other | 516,549 | 371,656 | 144,893 | ||||||||||||||
| 2,763,044 | 4,194,883 | (1,431,839) | |||||||||||||||
| Total Expenses | 4,298,797 | 8,273,499 | (3,974,702) | ||||||||||||||
| Investment Income (Loss) - Asset Management | |||||||||||||||||
| Net Gains (Losses) from Investment Activities | (1,350,388) | 8,032,900 | (9,383,288) | ||||||||||||||
| Dividend Income | 1,104,120 | 323,051 | 781,069 | ||||||||||||||
| Interest Income | 1,244,339 | 1,151,548 | 92,791 | ||||||||||||||
| Interest Expense | (1,002,005) | (794,978) | (207,027) | ||||||||||||||
| Total Investment Income (Loss) | (3,934) | 8,712,521 | (8,716,455) | ||||||||||||||
| Income (Loss) Before Taxes | (1,110,231) | 12,621,574 | (13,731,805) | ||||||||||||||
| Income Tax Expense (Benefit) | (128,836) | 1,161,688 | (1,290,524) | ||||||||||||||
| Nine Months Ended | |||||||||||
| September 30, 2017 | September 30, 2016 | Change | |||||||||
| ($ in thousands) | |||||||||||
| Revenues | |||||||||||
| Fees and Other | $ | 2,340,617 | $ | 1,426,618 | $ | 913,999 | |||||
| Expenses | |||||||||||
| Compensation and Benefits | 1,234,317 | 780,062 | 454,255 | ||||||||
| Occupancy and Related Charges | 44,150 | 49,159 | (5,009 | ) | |||||||
| General, Administrative and Other | 421,522 | 413,437 | 8,085 | ||||||||
| Total Expenses | 1,699,989 | 1,242,658 | 457,331 | ||||||||
| Investment Income (Loss) | |||||||||||
| Net Gains (Losses) from Investment Activities | 1,085,655 | 9,089 | 1,076,566 | ||||||||
| Dividend Income | 100,144 | 167,987 | (67,843 | ) | |||||||
| Interest Income | 893,832 | 753,194 | 140,638 | ||||||||
| Interest Expense | (597,403 | ) | (607,812 | ) | 10,409 | ||||||
| Total Investment Income (Loss) | 1,482,228 | 322,458 | 1,159,770 | ||||||||
| Income (Loss) Before Taxes | 2,122,856 | 506,418 | 1,616,438 | ||||||||
| Income Taxes | 77,500 | 18,761 | 58,739 | ||||||||
| Net Income (Loss) | 2,045,356 | 487,657 | 1,557,699 | ||||||||
| Net Income (Loss) Attributable to Redeemable Noncontrolling Interests | 64,196 | 4,616 | 59,580 | ||||||||
| Net Income (Loss) Attributable to Noncontrolling Interests | 1,137,585 | 353,044 | 784,541 | ||||||||
| Net Income (Loss) Attributable to KKR & Co. L.P. | 843,575 | 129,997 | 713,578 | ||||||||
| Less: Net Income Attributable to Series A Preferred Unitholders | 17,466 | 11,515 | 5,951 | ||||||||
| Less: Net Income Attributable to Series B Preferred Unitholders | 7,557 | 2,379 | 5,178 | ||||||||
| Net Income (Loss) Attributable to KKR & Co. L.P. Common Unitholders | $ | 818,552 | $ | 116,103 | $ | 702,449 | |||||
| Nine Months Ended | |||||||||||||||||
| September 30, 2022 | September 30, 2021 | Change | |||||||||||||||
| ($ in thousands) | |||||||||||||||||
| Net Income (Loss) | (981,395) | 11,459,886 | (12,441,281) | ||||||||||||||
| Net Income (Loss) Attributable to Redeemable Noncontrolling Interests | 1,546 | 2,856 | (1,310) | ||||||||||||||
| Net Income (Loss) Attributable to Noncontrolling Interests | (41,341) | 7,315,362 | (7,356,703) | ||||||||||||||
| Net Income (Loss) Attributable to KKR & Co. Inc. | (941,600) | 4,141,668 | (5,083,268) | ||||||||||||||
| Series A Preferred Stock Dividends | — | 23,656 | (23,656) | ||||||||||||||
| Series B Preferred Stock Dividends | — | 12,991 | (12,991) | ||||||||||||||
| Series C Mandatory Convertible Preferred Stock Dividends | 51,750 | 51,750 | — | ||||||||||||||
| Net Income (Loss) Attributable to KKR & Co. Inc. Common Stockholders | $ | (993,350) | $ | 4,053,271 | $ | (5,046,621) | |||||||||||
| Nine Months Ended | ||||||||||||||||||||
| September 30, 2022 | September 30, 2021 | Change | ||||||||||||||||||
| ($ in thousands) | ||||||||||||||||||||
| Management Fees | $ | 1,236,151 | $ | 931,624 | $ | 304,527 | ||||||||||||||
| Fee Credits | (388,315) | (322,402) | (65,913) | |||||||||||||||||
| Transaction Fees | 973,310 | 978,399 | (5,089) | |||||||||||||||||
| Monitoring Fees | 99,605 | 98,164 | 1,441 | |||||||||||||||||
| Incentive Fees | 15,600 | 13,092 | 2,508 | |||||||||||||||||
| Expense Reimbursements | 77,612 | 122,642 | (45,030) | |||||||||||||||||
| Consulting Fees | 55,741 | 66,286 | (10,545) | |||||||||||||||||
| Total Fees and Other | 2,069,704 | 1,887,805 | 181,899 | |||||||||||||||||
| Carried Interest | (1,999,678) | 4,553,527 | (6,553,205) | |||||||||||||||||
| General Partner Capital Interest | (442,402) | 1,183,180 | (1,625,582) | |||||||||||||||||
| Total Capital Allocation-Based Income (Loss) | (2,442,080) | 5,736,707 | (8,178,787) | |||||||||||||||||
| Total Revenues - Asset Management | $ | (372,376) | $ | 7,624,512 | $ | (7,996,888) | ||||||||||||||
| Nine Months Ended | ||||||||||||
| September 30, 2017 | September 30, 2016 | Change | ||||||||||
| Management Fees | $ | 517,393 | $ | 468,390 | $ | 49,003 | ||||||
| Transaction Fees | 581,410 | 277,776 | 303,634 | |||||||||
| Monitoring Fees | 145,203 | 99,388 | 45,815 | |||||||||
| Fee Credits | (207,396 | ) | (106,506 | ) | (100,890 | ) | ||||||
| Carried Interest | 1,224,235 | 602,695 | 621,540 | |||||||||
| Incentive Fees | 3,637 | 6,045 | (2,408 | ) | ||||||||
| Oil and Gas Revenue | 47,096 | 47,977 | (881 | ) | ||||||||
| Consulting Fees | 29,039 | 30,853 | (1,814 | ) | ||||||||
| Total Fees and Other | $ | 2,340,617 | $ | 1,426,618 | $ | 913,999 | ||||||
| Nine Months Ended September 30, | |||||||
| 2017 | 2016 | ||||||
| ($ in thousands) | |||||||
| Private Equity Investments | $ | 574,884 | $ | (42,037 | ) | ||
| Credit & Other Investments | 107,354 | (389,020 | ) | ||||
| Investments of Consolidated CFE's | (16,725 | ) | 307,597 | ||||
| Real Assets Investments | 199,400 | 108,085 | |||||
| Debt Obligations | (7,190 | ) | (167,566 | ) | |||
| Other Net Gains (Losses) from Investment Activities | 227,932 | 192,030 | |||||
| Net Gains (Losses) from Investment Activities | $ | 1,085,655 | $ | 9,089 | |||
| Nine Months Ended | ||||||||||||||||||||
| September 30, 2022 | September 30, 2021 | Change | ||||||||||||||||||
| ($ in thousands) | ||||||||||||||||||||
| Impacts of assumption review, by statement of income line item: | ||||||||||||||||||||
| Policy fees | $ | (14) | $ | 182 | $ | (196) | ||||||||||||||
| Policy benefits and claims | (23,079) | 20,904 | (43,983) | |||||||||||||||||
| Amortization of policy acquisition costs | 7,686 | (2,119) | 9,805 | |||||||||||||||||
| Income tax impact | 3,236 | (3,983) | 7,219 | |||||||||||||||||
| Total assumption review impact on net income | $ | (12,171) | $ | 14,984 | $ | (27,155) | ||||||||||||||
| Assumption review impact on adjustments to derive insurance segment adjusted operating earnings | (157) | (97) | (60) | |||||||||||||||||
| Non-controlling interests' share of assumption review impact | 4,749 | (5,734) | 10,483 | |||||||||||||||||
| Total assumption review impact on insurance segment adjusted operating earnings | $ | (7,579) | $ | 9,153 | $ | (16,732) | ||||||||||||||
| Nine Months Ended | ||||||||||||||||||||
| September 30, 2022 | September 30, 2021 | Change | ||||||||||||||||||
| ($ in thousands) | ||||||||||||||||||||
| Net Premiums | $ | 627,104 | $ | 1,698,912 | $ | (1,071,808) | ||||||||||||||
| Policy Fees | 964,349 | 824,326 | 140,023 | |||||||||||||||||
| Net Investment Income | 2,839,371 | 1,919,659 | 919,712 | |||||||||||||||||
| Net Investment-Related Gains | (968,836) | 32,983 | (1,001,819) | |||||||||||||||||
| Other Income | 102,888 | 82,160 | 20,728 | |||||||||||||||||
| Total Insurance Revenues | $ | 3,564,876 | $ | 4,558,040 | $ | (993,164) | ||||||||||||||
| Nine Months Ended | ||||||||||||||||||||
| September 30, 2022 | September 30, 2021 | Change | ||||||||||||||||||
| ($ in thousands) | ||||||||||||||||||||
| Funds withheld payable embedded derivatives | $ | 3,380,530 | $ | 48,799 | $ | 3,331,731 | ||||||||||||||
| Equity futures contracts | 199,432 | (171,982) | 371,414 | |||||||||||||||||
| Foreign currency forwards | 70,048 | (675) | 70,723 | |||||||||||||||||
| Credit risk contracts | 705 | (254) | 959 | |||||||||||||||||
| Equity index options | (884,786) | 275,035 | (1,159,821) | |||||||||||||||||
| Interest rate contracts | (331,395) | (149,274) | (182,121) | |||||||||||||||||
| Funds withheld receivable embedded derivatives | (64,130) | 68,449 | (132,579) | |||||||||||||||||
| Net gains on derivative instruments | 2,370,404 | 70,098 | 2,300,306 | |||||||||||||||||
| Net other investment losses | (3,339,240) | (37,115) | (3,302,125) | |||||||||||||||||
| Net investment-related gains | $ | (968,836) | $ | 32,983 | $ | (1,001,819) | ||||||||||||||
| Nine Months Ended | ||||||||||||||||||||
| September 30, 2022 | September 30, 2021 | Change | ||||||||||||||||||
| ($ in thousands) | ||||||||||||||||||||
| Realized gains (losses) on investments not supporting asset-liability matching strategies | $ | 87,198 | $ | 98,933 | $ | (11,735) | ||||||||||||||
| Realized gains (losses) on equity investments | — | 76,645 | (76,645) | |||||||||||||||||
| Realized gains (losses) on available-for-sale fixed maturity debt securities | (539,000) | (88,300) | (450,700) | |||||||||||||||||
| Credit loss allowances | (84,690) | (244,775) | 160,085 | |||||||||||||||||
| Unrealized gains (losses) on fixed maturity securities classified as trading | (2,748,542) | (130,228) | (2,618,314) | |||||||||||||||||
| Unrealized gains (losses) on investments classified as trading or fair-value option | (63,923) | 350,442 | (414,365) | |||||||||||||||||
| Unrealized gains (losses) on real estate investments recognized at fair value under investment company accounting | 88,609 | 20,264 | 68,345 | |||||||||||||||||
| Realized gains (losses) on funds withheld at interest, payable | 5,992 | (31,384) | 37,376 | |||||||||||||||||
| Realized gains (losses) on funds withheld at interest, receivable | 7,296 | 10,250 | (2,954) | |||||||||||||||||
| Other | (92,180) | (98,962) | 6,782 | |||||||||||||||||
| Net investment-related gains | $ | (3,339,240) | $ | (37,115) | $ | (3,302,125) | ||||||||||||||
| (Amounts in thousands, except per share amounts) | ||||||||||||||
| As of | As of | |||||||||||||
| September 30, 2022 | December 31, 2021 | |||||||||||||
| Assets | ||||||||||||||
| Asset Management | ||||||||||||||
| Cash and Cash Equivalents | $ | 6,911,691 | $ | 6,699,668 | ||||||||||
| Investments | 89,720,859 | 88,775,514 | ||||||||||||
| Other Assets | 6,748,929 | 4,244,894 | ||||||||||||
| 103,381,479 | 99,720,076 | |||||||||||||
| Insurance | ||||||||||||||
| Cash and Cash Equivalents | 4,147,146 | 3,391,934 | ||||||||||||
| Investments | 118,772,273 | 123,763,675 | ||||||||||||
| Other Assets | 39,947,742 | 37,409,755 | ||||||||||||
| 162,867,161 | 164,565,364 | |||||||||||||
| Total Assets | $ | 266,248,640 | $ | 264,285,440 | ||||||||||
| Liabilities and Equity | ||||||||||||||
| Asset Management | ||||||||||||||
| Debt Obligations | $ | 38,257,833 | $ | 36,669,755 | ||||||||||
| Other Liabilities | 7,579,996 | 8,359,619 | ||||||||||||
| 45,837,829 | 45,029,374 | |||||||||||||
| Insurance | ||||||||||||||
| Debt Obligations | 1,920,906 | 1,908,006 | ||||||||||||
| Other Liabilities | 166,507,110 | 159,208,840 | ||||||||||||
| 168,428,016 | 161,116,846 | |||||||||||||
| Total Liabilities | $ | 214,265,845 | $ | 206,146,220 | ||||||||||
| Redeemable Noncontrolling Interests | 82,133 | 82,491 | ||||||||||||
| Stockholders' Equity | ||||||||||||||
| Stockholders' Equity - Series C Mandatory Convertible Preferred Stock | 1,115,792 | 1,115,792 | ||||||||||||
| Stockholders' Equity - Common Stock | 16,335,253 | 16,466,372 | ||||||||||||
| Noncontrolling Interests | 34,449,617 | 40,474,565 | ||||||||||||
| Total Equity | 51,900,662 | 58,056,729 | ||||||||||||
| Total Liabilities and Equity | $ | 266,248,640 | $ | 264,285,440 | ||||||||||
| KKR & Co. Inc. Stockholders' Equity - Common Stock Per Outstanding Share of Common Stock | $ | 19.00 | $ | 27.64 | ||||||||||
| (Amounts in thousands, except common unit and per common unit amounts) | ||||||||
| As of | As of | |||||||
| September 30, 2017 | December 31, 2016 | |||||||
| Assets | ||||||||
| Cash and Cash Equivalents | $ | 2,436,566 | $ | 2,508,902 | ||||
| Investments | 37,251,837 | 31,409,765 | ||||||
| Other | 4,617,236 | 5,084,230 | ||||||
| Total Assets | 44,305,639 | 39,002,897 | ||||||
| Liabilities and Equity | ||||||||
| Debt Obligations | 20,290,714 | 18,544,075 | ||||||
| Other Liabilities | 4,149,491 | 3,340,739 | ||||||
| Total Liabilities | 24,440,205 | 21,884,814 | ||||||
| Redeemable Noncontrolling Interests | 570,134 | 632,348 | ||||||
| Equity | ||||||||
| Series A Preferred Units | 332,988 | 332,988 | ||||||
| Series B Preferred Units | 149,566 | 149,566 | ||||||
| KKR & Co. L.P. Capital - Common Unitholders | 6,380,654 | 5,457,279 | ||||||
| Noncontrolling Interests | 12,432,092 | 10,545,902 | ||||||
| Total Equity | 19,295,300 | 16,485,735 | ||||||
| Total Liabilities and Equity | $ | 44,305,639 | $ | 39,002,897 | ||||
| KKR & Co. L.P. Capital Per Outstanding Common Unit - Basic | $ | 13.49 | $ | 12.06 | ||||
| Three Months Ended September 30, 2016 | Nine Months Ended September 30, 2016 | |||||||
| Private Markets | $ | 4,856 | $ | 14,515 | ||||
| Public Markets | 3,400 | 10,103 | ||||||
| Capital Markets | 739 | 2,188 | ||||||
| Principal Activities | (8,995 | ) | (26,806 | ) | ||||
| Total Economic Net Income | $ | — | $ | — | ||||
| Expense Allocation | ||||||
| Segment | 2017 | 2016 | ||||
| Private Markets | 59.6 | % | 61.6 | % | ||
| Public Markets | 9.0 | % | 10.1 | % | ||
| Capital Markets | 5.7 | % | 5.7 | % | ||
| Principal Activities | 25.7 | % | 22.6 | % | ||
| Total Reportable Segments | 100.0 | % | 100.0 | % | ||
| Allocation basis | Cumulative revenue since 2009 | Revenue earned in 2015, 2014, 2013 & 2012 | ||||
| Three Months Ended | |||||||||||
| September 30, 2017 | September 30, 2016 | Change | |||||||||
| ($ in thousands) | |||||||||||
| Segment Revenues | |||||||||||
| Management, Monitoring and Transaction Fees, Net | |||||||||||
| Management Fees | $ | 153,841 | $ | 117,795 | $ | 36,046 | |||||
| Monitoring Fees | 14,342 | 11,091 | 3,251 | ||||||||
| Transaction Fees | 82,258 | 53,223 | 29,035 | ||||||||
| Fee Credits | (59,854 | ) | (37,127 | ) | (22,727 | ) | |||||
| Total Management, Monitoring and Transaction Fees, Net | 190,587 | 144,982 | 45,605 | ||||||||
| Performance Income | |||||||||||
| Realized Incentive Fees | — | — | — | ||||||||
| Realized Carried Interest | 419,438 | 350,469 | 68,969 | ||||||||
| Unrealized Carried Interest | (96,571 | ) | 53,339 | (149,910 | ) | ||||||
| Total Performance Income | 322,867 | 403,808 | (80,941 | ) | |||||||
| Investment Income (Loss) | |||||||||||
| Net Realized Gains (Losses) | — | — | — | ||||||||
| Net Unrealized Gains (Losses) | — | — | — | ||||||||
| Total Realized and Unrealized | — | — | — | ||||||||
| Interest Income and Dividends | — | — | — | ||||||||
| Interest Expense | — | — | — | ||||||||
| Net Interest and Dividends | — | — | — | ||||||||
| Total Investment Income (Loss) | — | — | — | ||||||||
| Total Segment Revenues | 513,454 | 548,790 | (35,336 | ) | |||||||
| Segment Expenses | |||||||||||
| Compensation and Benefits | |||||||||||
| Cash Compensation and Benefits | 63,482 | 47,858 | 15,624 | ||||||||
| Realized Performance Income Compensation | 176,075 | 157,688 | 18,387 | ||||||||
| Unrealized Performance Income Compensation | (36,379 | ) | 22,588 | (58,967 | ) | ||||||
| Total Compensation and Benefits | 203,178 | 228,134 | (24,956 | ) | |||||||
| Occupancy and related charges | 8,537 | 9,248 | (711 | ) | |||||||
| Other operating expenses | 42,376 | 32,031 | 10,345 | ||||||||
| Total Segment Expenses | 254,091 | 269,413 | (15,322 | ) | |||||||
| Income (Loss) attributable to noncontrolling interests | — | — | — | ||||||||
| Economic Net Income (Loss) | $ | 259,363 | $ | 279,377 | $ | (20,014 | ) | ||||
| Assets Under Management | $ | 87,609,800 | $ | 75,181,600 | $ | 12,428,200 | |||||
| Fee Paying Assets Under Management | $ | 61,706,500 | $ | 44,010,300 | $ | 17,696,200 | |||||
| Capital Invested | $ | 2,972,300 | $ | 2,370,600 | $ | 601,700 | |||||
| Uncalled Commitments | $ | 39,421,900 | $ | 31,839,100 | $ | 7,582,800 | |||||
| Three Months Ended | |||||||||||||||||||||||
| September 30, 2022 | September 30, 2021 | Change | |||||||||||||||||||||
| ($ in thousands) | |||||||||||||||||||||||
| Management Fees | $ | 670,534 | $ | 559,016 | $ | 111,518 | |||||||||||||||||
| Transaction and Monitoring Fees, Net | 167,455 | 249,670 | (82,215) | ||||||||||||||||||||
| Fee Related Performance Revenues | 49,924 | 9,897 | 40,027 | ||||||||||||||||||||
| Fee Related Compensation | (199,780) | (184,224) | (15,556) | ||||||||||||||||||||
| Other Operating Expenses | (146,370) | (104,772) | (41,598) | ||||||||||||||||||||
| Fee Related Earnings | 541,763 | 529,587 | 12,176 | ||||||||||||||||||||
| Realized Performance Income | 497,860 | 432,784 | 65,076 | ||||||||||||||||||||
| Realized Performance Income Compensation | (322,927) | (274,955) | (47,972) | ||||||||||||||||||||
| Realized Investment Income | 284,979 | 447,565 | (162,586) | ||||||||||||||||||||
| Realized Investment Income Compensation | (42,747) | (67,142) | 24,395 | ||||||||||||||||||||
| Asset Management Segment Operating Earnings | $ | 958,928 | $ | 1,067,839 | $ | (108,911) | |||||||||||||||||
| Three Months Ended | ||||||||||||||||||||
| September 30, 2022 | September 30, 2021 | Change | ||||||||||||||||||
| ($ in thousands) | ||||||||||||||||||||
| Management Fees | ||||||||||||||||||||
| Private Equity | $ | 295,234 | $ | 261,906 | $ | 33,328 | ||||||||||||||
| Real Assets | 178,652 | 123,786 | 54,866 | |||||||||||||||||
| Credit and Liquid Strategies | 196,648 | 173,324 | 23,324 | |||||||||||||||||
| Total Management Fees | $ | 670,534 | $ | 559,016 | $ | 111,518 | ||||||||||||||
| Three Months Ended | ||||||||||||||||||||
| September 30, 2022 | September 30, 2021 | Change | ||||||||||||||||||
| ($ in thousands) | ||||||||||||||||||||
| Transaction and Monitoring Fees, Net | ||||||||||||||||||||
| Private Equity | $ | 41,436 | $ | 43,368 | $ | (1,932) | ||||||||||||||
| Real Assets | 6,730 | 5,843 | 887 | |||||||||||||||||
| Credit and Liquid Strategies | 3,224 | 4,397 | (1,173) | |||||||||||||||||
| Capital Markets | 116,065 | 196,062 | (79,997) | |||||||||||||||||
| Total Transaction and Monitoring Fees, Net | $ | 167,455 | $ | 249,670 | $ | (82,215) | ||||||||||||||
| Three Months Ended | ||||||||||||||||||||
| September 30, 2022 | September 30, 2021 | Change | ||||||||||||||||||
| ($ in thousands) | ||||||||||||||||||||
| Fee Related Performance Revenues | ||||||||||||||||||||
| Private Equity | $ | — | $ | — | $ | — | ||||||||||||||
| Real Assets | 39,284 | 1,568 | 37,716 | |||||||||||||||||
| Credit and Liquid Strategies | 10,640 | 8,329 | 2,311 | |||||||||||||||||
| Total Fee Related Performance Revenues | $ | 49,924 | $ | 9,897 | $ | 40,027 | ||||||||||||||
| Three Months Ended | ||||||||||||||||||||
| September 30, 2022 | September 30, 2021 | Change | ||||||||||||||||||
| ($ in thousands) | ||||||||||||||||||||
| Realized Performance Income | ||||||||||||||||||||
| Private Equity | $ | 484,560 | $ | 401,902 | $ | 82,658 | ||||||||||||||
| Real Assets | 11,934 | 11,212 | 722 | |||||||||||||||||
| Credit and Liquid Strategies | 1,366 | 19,670 | (18,304) | |||||||||||||||||
| Total Realized Performance Income | $ | 497,860 | $ | 432,784 | $ | 65,076 | ||||||||||||||
| Three Months Ended | ||||||||||||||||||||
| September 30, 2022 | September 30, 2021 | Change | ||||||||||||||||||
| ($ in thousands) | ||||||||||||||||||||
| Private Equity | ||||||||||||||||||||
| North America Fund XI | $ | 363,384 | $ | 72,313 | $ | 291,071 | ||||||||||||||
| 2006 Fund | 64,189 | 81,356 | (17,167) | |||||||||||||||||
| Asian Fund III | 53,204 | — | 53,204 | |||||||||||||||||
| Co-Investment Vehicles and Other | 3,783 | 22,514 | (18,731) | |||||||||||||||||
| Americas Fund XII | — | 207,559 | (207,559) | |||||||||||||||||
| Next Generation Technology Growth Fund | — | 18,160 | (18,160) | |||||||||||||||||
Total Realized Carried Interest (1) | 484,560 | 401,902 | 82,658 | |||||||||||||||||
| Incentive Fees | — | — | — | |||||||||||||||||
| Total Realized Performance Income | $ | 484,560 | $ | 401,902 | $ | 82,658 | ||||||||||||||
| Three Months Ended | ||||||||||||||||||||
| September 30, 2022 | September 30, 2021 | Change | ||||||||||||||||||
| ($ in thousands) | ||||||||||||||||||||
| Real Assets | ||||||||||||||||||||
| Global Infrastructure Investors II | $ | 8,502 | $ | — | $ | 8,502 | ||||||||||||||
| Real Estate Partners Americas II | 3,432 | — | 3,432 | |||||||||||||||||
| Real Estate Partners Europe | — | 11,212 | (11,212) | |||||||||||||||||
Total Realized Carried Interest (1) | 11,934 | 11,212 | 722 | |||||||||||||||||
| Incentive Fees | — | — | — | |||||||||||||||||
| Total Realized Performance Income | $ | 11,934 | $ | 11,212 | $ | 722 | ||||||||||||||
| Three Months Ended | ||||||||||||||||||||
| September 30, 2022 | September 30, 2021 | Change | ||||||||||||||||||
| ($ in thousands) | ||||||||||||||||||||
| Credit and Liquid Strategies | ||||||||||||||||||||
| Alternative Credit Vehicles | $ | — | $ | — | $ | — | ||||||||||||||
Total Realized Carried Interest (1) | — | — | — | |||||||||||||||||
| Incentive Fees | 1,366 | 19,670 | (18,304) | |||||||||||||||||
| Total Realized Performance Income | $ | 1,366 | $ | 19,670 | $ | (18,304) | ||||||||||||||
| Three Months Ended | ||||||||||||||||||||
| September 30, 2022 | September 30, 2021 | Change | ||||||||||||||||||
| ($ in thousands) | ||||||||||||||||||||
| Realized Investment Income | ||||||||||||||||||||
| Net Realized Gains (Losses) | $ | 162,716 | $ | 389,837 | $ | (227,121) | ||||||||||||||
| Interest Income and Dividends | 122,263 | 57,728 | 64,535 | |||||||||||||||||
| Total Realized Investment Income | $ | 284,979 | $ | 447,565 | $ | (162,586) | ||||||||||||||
| As of | ||||||||||||||||||||
| September 30, 2022 | June 30, 2022 | Change | ||||||||||||||||||
| ($ in millions) | ||||||||||||||||||||
| Assets Under Management | $ | 496,219 | $ | 490,692 | $ | 5,527 | ||||||||||||||
| Fee Paying Assets Under Management | $ | 397,627 | $ | 384,470 | $ | 13,157 | ||||||||||||||
| Uncalled Commitments | $ | 112,589 | $ | 115,300 | $ | (2,711) | ||||||||||||||
| Three Months Ended | ||||||||||||||||||||
| September 30, 2022 | September 30, 2021 | Change | ||||||||||||||||||
| ($ in millions) | ||||||||||||||||||||
| Capital Invested | $ | 15,683 | $ | 24,415 | $ | (8,732) | ||||||||||||||
| ($ in millions) | |||||
| June 30, 2022 | $ | 171,541 | |||
| New Capital Raised | 1,006 | ||||
| Distributions and Other | (4,507) | ||||
| Change in Value | (2,570) | ||||
| September 30, 2022 | $ | 165,470 | |||
| Three Months Ended September 30, | |||||||||||||||||||
| 2017 | 2016 | ||||||||||||||||||
| ($ in thousands) | |||||||||||||||||||
| Realized Carried Interest | Unrealized Carried Interest | Total Carried Interest | Realized Carried Interest | Unrealized Carried Interest | Total Carried Interest | ||||||||||||||
| North America Fund XI | $ | 90,394 | $ | 48,982 | $ | 139,376 | $ | 14,845 | $ | 139,705 | $ | 154,550 | |||||||
| Co-Investment Vehicles and Other | 16,255 | 51,948 | 68,203 | 705 | 25,985 | 26,690 | |||||||||||||
| European Fund III | 4,500 | 38,143 | 42,643 | — | 22,529 | 22,529 | |||||||||||||
| European Fund IV | — | 24,365 | 24,365 | — | 1,339 | 1,339 | |||||||||||||
| Asian Fund II | — | 21,801 | 21,801 | — | 86,365 | 86,365 | |||||||||||||
| Asian Fund | — | 21,268 | 21,268 | 95,883 | (71,490 | ) | 24,393 | ||||||||||||
| Global Infrastructure Investors II | — | 7,155 | 7,155 | — | — | — | |||||||||||||
| Next Generation Technology Growth | — | 5,885 | 5,885 | — | 943 | 943 | |||||||||||||
| Global Infrastructure Investors | — | 3,145 | 3,145 | 16,845 | (10,383 | ) | 6,462 | ||||||||||||
| Real Estate Partners Americas | 10,365 | (7,439 | ) | 2,926 | — | 1,970 | 1,970 | ||||||||||||
| Millennium Fund | — | 2,370 | 2,370 | — | (15,889 | ) | (15,889 | ) | |||||||||||
| E2 Investors | — | — | — | — | (234 | ) | (234 | ) | |||||||||||
| European Fund | — | — | — | — | (2,102 | ) | (2,102 | ) | |||||||||||
| European Fund II | 2,142 | (2,146 | ) | (4 | ) | 63,721 | (62,304 | ) | 1,417 | ||||||||||
| 2006 Fund | 295,782 | (301,978 | ) | (6,196 | ) | 155,612 | (64,174 | ) | 91,438 | ||||||||||
| China Growth Fund | — | (7,597 | ) | (7,597 | ) | 2,858 | 5,265 | 8,123 | |||||||||||
| Management Fee Refunds | — | (2,473 | ) | (2,473 | ) | — | (4,186 | ) | (4,186 | ) | |||||||||
Total (1) | $ | 419,438 | $ | (96,571 | ) | $ | 322,867 | $ | 350,469 | $ | 53,339 | $ | 403,808 | ||||||
| ($ in thousands) | |||
| June 30, 2017 | $ | 84,984,000 | |
| New Capital Raised | 4,287,200 | ||
| Distributions | (3,798,300 | ) | |
| Change in Value | 2,136,900 | ||
| September 30, 2017 | $ | 87,609,800 | |
| ($ in millions) | |||||
| June 30, 2022 | $ | 113,789 | |||
| New Capital Raised | 5,721 | ||||
Acquisitions and Other(1) | 1,049 | ||||
| Distributions and Other | (1,812) | ||||
| Change in Value | (976) | ||||
| September 30, 2022 | $ | 117,771 | |||
| ($ in millions) | |||||
| June 30, 2022 | $ | 205,362 | |||
| New Capital Raised | 6,709 | ||||
Acquisitions and Other(1) | 7,997 | ||||
| Distributions and Other | (3,791) | ||||
| Redemptions | (1,420) | ||||
| Change in Value | (1,879) | ||||
| September 30, 2022 | $ | 212,978 | |||
| ($ in millions) | |||||
| June 30, 2022 | $ | 98,316 | |||
| New Capital Raised | 2,135 | ||||
| Distributions and Other | (936) | ||||
| Change in Value | (416) | ||||
| September 30, 2022 | $ | 99,099 | |||
| ($ in thousands) | |||
| June 30, 2017 | $ | 62,008,900 | |
| New Capital Raised | 1,202,900 | ||
| Distributions and Other | (1,968,700 | ) | |
| Change in Value | 463,400 | ||
| September 30, 2017 | $ | 61,706,500 | |
| ($ in millions) | |||||
| June 30, 2022 | $ | 93,258 | |||
| New Capital Raised | 9,764 | ||||
Acquisitions and Other(1) | 1,049 | ||||
| Distributions and Other | (1,353) | ||||
| Net Changes in Fee Base of Certain Funds | (1,125) | ||||
| Change in Value | (1,239) | ||||
| September 30, 2022 | $ | 100,354 | |||
| ($ in millions) | |||||
| June 30, 2022 | $ | 192,896 | |||
| New Capital Raised | 4,392 | ||||
Acquisitions and Other(1) | 7,997 | ||||
| Distributions and Other | (4,103) | ||||
| Redemptions | (1,420) | ||||
| Change in Value | (1,588) | ||||
| September 30, 2022 | $ | 198,174 | |||
| Three Months Ended | |||||||||||||||||
| September 30, 2022 | September 30, 2021 | Change | |||||||||||||||
| ($ in thousands) | |||||||||||||||||
| Net Investment Income | $ | 1,054,757 | $ | 771,982 | $ | 282,775 | |||||||||||
| Net Cost of Insurance | (642,443) | (436,415) | (206,028) | ||||||||||||||
| General, Administrative and Other | (161,242) | (139,489) | (21,753) | ||||||||||||||
| Pre-tax Insurance Operating Earnings | 251,072 | 196,078 | 54,994 | ||||||||||||||
| Income Taxes | (44,468) | (9,046) | (35,422) | ||||||||||||||
| Net Income Attributable to Noncontrolling Interests | (79,582) | (72,043) | (7,539) | ||||||||||||||
| Insurance Segment Operating Earnings | $ | 127,022 | $ | 114,989 | $ | 12,033 | |||||||||||
| Three Months Ended | |||||||||||||||||||||||
| September 30, 2022 | September 30, 2021 | Change | |||||||||||||||||||||
| ($ in thousands) | |||||||||||||||||||||||
| Asset Management Segment Operating Earnings | $ | 958,928 | $ | 1,067,839 | $ | (108,911) | |||||||||||||||||
| Insurance Segment Operating Earnings | 127,022 | 114,989 | 12,033 | ||||||||||||||||||||
| Distributable Operating Earnings | 1,085,950 | 1,182,828 | (96,878) | ||||||||||||||||||||
| Interest Expense | (83,335) | (63,446) | (19,889) | ||||||||||||||||||||
| Preferred Dividends | — | (2,519) | 2,519 | ||||||||||||||||||||
| Net Income Attributable to Noncontrolling Interests | (4,932) | (6,072) | 1,140 | ||||||||||||||||||||
| Income Taxes Paid | (173,949) | (185,645) | 11,696 | ||||||||||||||||||||
| After-tax Distributable Earnings | $ | 823,734 | $ | 925,146 | $ | (101,412) | |||||||||||||||||
| Nine Months Ended | |||||||||||
| September 30, 2017 | September 30, 2016 | Change | |||||||||
| ($ in thousands) | |||||||||||
| Segment Revenues | |||||||||||
| Management, Monitoring and Transaction Fees, Net | |||||||||||
| Management Fees | $ | 419,606 | $ | 354,376 | $ | 65,230 | |||||
| Monitoring Fees | 58,072 | 52,126 | 5,946 | ||||||||
| Transaction Fees | 237,392 | 114,021 | 123,371 | ||||||||
| Fee Credits | (177,254 | ) | (93,042 | ) | (84,212 | ) | |||||
| Total Management, Monitoring and Transaction Fees, Net | 537,816 | 427,481 | 110,335 | ||||||||
| Performance Income | |||||||||||
| Realized Incentive Fees | — | — | — | ||||||||
| Realized Carried Interest | 890,310 | 749,194 | 141,116 | ||||||||
| Unrealized Carried Interest | 305,945 | (131,386 | ) | 437,331 | |||||||
| Total Performance Income | 1,196,255 | 617,808 | 578,447 | ||||||||
| Investment Income (Loss) | |||||||||||
| Net Realized Gains (Losses) | — | — | — | ||||||||
| Net Unrealized Gains (Losses) | — | — | — | ||||||||
| Total Realized and Unrealized | — | — | — | ||||||||
| Interest Income and Dividends | — | — | — | ||||||||
| Interest Expense | — | — | — | ||||||||
| Net Interest and Dividends | — | — | — | ||||||||
| Total Investment Income (Loss) | — | — | — | ||||||||
| Total Segment Revenues | 1,734,071 | 1,045,289 | 688,782 | ||||||||
| Segment Expenses | |||||||||||
| Compensation and Benefits | |||||||||||
| Cash Compensation and Benefits | 183,943 | 142,500 | 41,443 | ||||||||
| Realized Performance Income Compensation | 374,335 | 317,178 | 57,157 | ||||||||
| Unrealized Performance Income Compensation | 126,677 | (47,377 | ) | 174,054 | |||||||
| Total Compensation and Benefits | 684,955 | 412,301 | 272,654 | ||||||||
| Occupancy and related charges | 24,174 | 27,212 | (3,038 | ) | |||||||
| Other operating expenses | 97,255 | 95,166 | 2,089 | ||||||||
| Total Segment Expenses | 806,384 | 534,679 | 271,705 | ||||||||
| Income (Loss) attributable to noncontrolling interests | — | — | — | ||||||||
| Economic Net Income (Loss) | $ | 927,687 | $ | 510,610 | $ | 417,077 | |||||
| Assets Under Management | $ | 87,609,800 | $ | 75,181,600 | $ | 12,428,200 | |||||
| Fee Paying Assets Under Management | $ | 61,706,500 | $ | 44,010,300 | $ | 17,696,200 | |||||
| Capital Invested | $ | 11,079,800 | $ | 5,475,300 | $ | 5,604,500 | |||||
| Uncalled Commitments | $ | 39,421,900 | $ | 31,839,100 | $ | 7,582,800 | |||||
| Nine Months Ended | |||||||||||||||||||||||
| September 30, 2022 | September 30, 2021 | Change | |||||||||||||||||||||
| ($ in thousands) | |||||||||||||||||||||||
| Management Fees | $ | 1,950,389 | $ | 1,478,878 | $ | 471,511 | |||||||||||||||||
| Transaction and Monitoring Fees, Net | 580,794 | 645,108 | (64,314) | ||||||||||||||||||||
| Fee Related Performance Revenues | 71,974 | 34,760 | 37,214 | ||||||||||||||||||||
| Fee Related Compensation | (585,748) | (485,760) | (99,988) | ||||||||||||||||||||
| Other Operating Expenses | (409,489) | (309,483) | (100,006) | ||||||||||||||||||||
| Fee Related Earnings | 1,607,920 | 1,363,503 | 244,417 | ||||||||||||||||||||
| Realized Performance Income | 1,837,925 | 1,222,403 | 615,522 | ||||||||||||||||||||
| Realized Performance Income Compensation | (1,180,990) | (797,965) | (383,025) | ||||||||||||||||||||
| Realized Investment Income | 911,221 | 1,277,701 | (366,480) | ||||||||||||||||||||
| Realized Investment Income Compensation | (136,683) | (191,663) | 54,980 | ||||||||||||||||||||
| Asset Management Segment Operating Earnings | $ | 3,039,393 | $ | 2,873,979 | $ | 165,414 | |||||||||||||||||
| Nine Months Ended | ||||||||||||||||||||
| September 30, 2022 | September 30, 2021 | Change | ||||||||||||||||||
| ($ in thousands) | ||||||||||||||||||||
| Management Fees | ||||||||||||||||||||
| Private Equity | $ | 876,517 | $ | 694,924 | $ | 181,593 | ||||||||||||||
| Real Assets | 494,172 | 296,032 | 198,140 | |||||||||||||||||
| Credit and Liquid Strategies | 579,700 | 487,922 | 91,778 | |||||||||||||||||
| Total Management Fees | $ | 1,950,389 | $ | 1,478,878 | $ | 471,511 | ||||||||||||||
| Nine Months Ended | ||||||||||||||||||||
| September 30, 2022 | September 30, 2021 | Change | ||||||||||||||||||
| ($ in thousands) | ||||||||||||||||||||
| Transaction and Monitoring Fees, Net | ||||||||||||||||||||
| Private Equity | $ | 91,301 | $ | 96,443 | $ | (5,142) | ||||||||||||||
| Real Assets | 15,929 | 12,896 | 3,033 | |||||||||||||||||
| Credit and Liquid Strategies | 17,642 | 8,569 | 9,073 | |||||||||||||||||
| Capital Markets | 455,922 | 527,200 | (71,278) | |||||||||||||||||
| Total Transaction and Monitoring Fees, Net | $ | 580,794 | $ | 645,108 | $ | (64,314) | ||||||||||||||
| Nine Months Ended September 30, | |||||||||||||||||||
| 2017 | 2016 | ||||||||||||||||||
| ($ in thousands) | |||||||||||||||||||
| Realized Carried Interest | Unrealized Carried Interest | Total Carried Interest | Realized Carried Interest | Unrealized Carried Interest | Total Carried Interest | ||||||||||||||
| North America Fund XI | $ | 129,576 | $ | 333,354 | $ | 462,930 | $ | 61,898 | $ | 146,192 | $ | 208,090 | |||||||
| 2006 Fund | 511,935 | (347,899 | ) | 164,036 | 351,115 | (329,865 | ) | 21,250 | |||||||||||
| Co-Investment Vehicles and Other | 23,088 | 137,510 | 160,598 | 7,245 | 6,829 | 14,074 | |||||||||||||
| European Fund III | 83,045 | 42,260 | 125,305 | 35,231 | 92,783 | 128,014 | |||||||||||||
| Asian Fund II | 29,351 | 93,419 | 122,770 | — | 168,145 | 168,145 | |||||||||||||
| European Fund IV | — | 68,274 | 68,274 | — | (197 | ) | (197 | ) | |||||||||||
| Asian Fund | 17,846 | 15,771 | 33,617 | 126,820 | (41,251 | ) | 85,569 | ||||||||||||
| Global Infrastructure Investors II | — | 25,453 | 25,453 | — | (272 | ) | (272 | ) | |||||||||||
| Global Infrastructure Investors | 14,772 | 9,012 | 23,784 | 16,845 | 7,079 | 23,924 | |||||||||||||
| Real Estate Partners Americas | 12,050 | (60 | ) | 11,990 | — | 5,035 | 5,035 | ||||||||||||
| Next Generation Technology Growth | — | 8,165 | 8,165 | — | 943 | 943 | |||||||||||||
| Millennium Fund | 28,266 | (22,140 | ) | 6,126 | 59,707 | (84,129 | ) | (24,422 | ) | ||||||||||
| European Fund | — | — | — | 1,503 | (4,395 | ) | (2,892 | ) | |||||||||||
| E2 Investors | — | (306 | ) | (306 | ) | — | 1,328 | 1,328 | |||||||||||
| China Growth Fund | 20,130 | (23,315 | ) | (3,185 | ) | 2,858 | 9,845 | 12,703 | |||||||||||
| European Fund II | 20,251 | (25,940 | ) | (5,689 | ) | 85,972 | (98,410 | ) | (12,438 | ) | |||||||||
| Management Fee Refunds | — | (7,613 | ) | (7,613 | ) | — | (11,046 | ) | (11,046 | ) | |||||||||
Total (1) | $ | 890,310 | $ | 305,945 | $ | 1,196,255 | $ | 749,194 | $ | (131,386 | ) | $ | 617,808 | ||||||
| ($ in thousands) | |||
| December 31, 2016 | $ | 73,815,500 | |
| New Capital Raised | 15,367,500 | ||
| Distributions and Other | (9,166,800 | ) | |
| Change in Value | 7,593,600 | ||
| September 30, 2017 | $ | 87,609,800 | |
| ($ in thousands) | |||
| December 31, 2016 | $ | 52,204,800 | |
| New Capital Raised | 14,653,000 | ||
| Distributions and Other | (3,719,400 | ) | |
| Net Changes in Fee Base of Certain Funds | (2,418,800 | ) | |
| Change in Value | 986,900 | ||
| September 30, 2017 | $ | 61,706,500 | |
| Three Months Ended | ||||||||||||
| September 30, 2017 | September 30, 2016 | Change | ||||||||||
| ($ in thousands) | ||||||||||||
| Segment Revenues | ||||||||||||
| Management, Monitoring and Transaction Fees, Net | ||||||||||||
| Management Fees | $ | 79,113 | $ | 83,713 | $ | (4,600 | ) | |||||
| Monitoring Fees | — | — | — | |||||||||
| Transaction Fees | 11,469 | 10,748 | 721 | |||||||||
| Fee Credits | (10,893 | ) | (10,265 | ) | (628 | ) | ||||||
| Total Management, Monitoring and Transaction Fees, Net | 79,689 | 84,196 | (4,507 | ) | ||||||||
| Performance Income | ||||||||||||
| Realized Incentive Fees | 4,074 | 3,659 | 415 | |||||||||
| Realized Carried Interest | — | — | — | |||||||||
| Unrealized Carried Interest | 36,933 | 17,012 | 19,921 | |||||||||
| Total Performance Income | 41,007 | 20,671 | 20,336 | |||||||||
| Investment Income (Loss) | ||||||||||||
| Net Realized Gains (Losses) | — | — | — | |||||||||
| Net Unrealized Gains (Losses) | — | — | — | |||||||||
| Total Realized and Unrealized | — | — | — | |||||||||
| Interest Income and Dividends | — | — | — | |||||||||
| Interest Expense | — | — | — | |||||||||
| Net Interest and Dividends | — | — | — | |||||||||
| Total Investment Income (Loss) | — | — | — | |||||||||
| Total Segment Revenues | 120,696 | 104,867 | 15,829 | |||||||||
| Segment Expenses | ||||||||||||
| Compensation and Benefits | ||||||||||||
| Cash Compensation and Benefits | 16,257 | 22,022 | (5,765 | ) | ||||||||
| Realized Performance Income Compensation | 1,630 | 1,463 | 167 | |||||||||
| Unrealized Performance Income Compensation | 16,553 | 6,805 | 9,748 | |||||||||
| Total Compensation and Benefits | 34,440 | 30,290 | 4,150 | |||||||||
| Occupancy and related charges | 1,535 | 2,570 | (1,035 | ) | ||||||||
| Other operating expenses | 7,672 | 8,894 | (1,222 | ) | ||||||||
| Total Segment Expenses | 43,647 | 41,754 | 1,893 | |||||||||
| Income (Loss) attributable to noncontrolling interests | — | — | — | |||||||||
| Economic Net Income (Loss) | $ | 77,049 | $ | 63,113 | $ | 13,936 | ||||||
| Assets Under Management | $ | 65,729,700 | $ | 55,920,200 | $ | 9,809,500 | ||||||
| Fee Paying Assets Under Management | $ | 52,016,500 | $ | 49,143,500 | $ | 2,873,000 | ||||||
| Capital Invested | $ | 1,639,200 | $ | 1,484,400 | $ | 154,800 | ||||||
| Uncalled Commitments | $ | 7,828,600 | $ | 6,428,200 | $ | 1,400,400 | ||||||
| ($ in thousands) | |||
| June 30, 2017 | $ | 63,499,000 | |
| New Capital Raised | 3,392,200 | ||
| Distributions | (1,273,400 | ) | |
| Redemptions | (559,500 | ) | |
| Change in Value | 671,400 | ||
| September 30, 2017 | $ | 65,729,700 | |
| ($ in thousands) | |||
| June 30, 2017 | $ | 50,637,300 | |
| New Capital Raised | 2,950,000 | ||
| Distributions | (1,752,100 | ) | |
| Redemptions | (559,500 | ) | |
| Change in Value | 740,800 | ||
| September 30, 2017 | $ | 52,016,500 | |
| Nine Months Ended | ||||||||||||
| September 30, 2017 | September 30, 2016 | Change | ||||||||||
| ($ in thousands) | ||||||||||||
| Segment Revenues | ||||||||||||
| Management, Monitoring and Transaction Fees, Net | ||||||||||||
| Management Fees | $ | 251,201 | $ | 245,349 | $ | 5,852 | ||||||
| Monitoring Fees | — | — | — | |||||||||
| Transaction Fees | 41,040 | 17,768 | 23,272 | |||||||||
| Fee Credits | (33,894 | ) | (16,230 | ) | (17,664 | ) | ||||||
| Total Management, Monitoring and Transaction Fees, Net | 258,347 | 246,887 | 11,460 | |||||||||
| Performance Income | ||||||||||||
| Realized Incentive Fees | 8,384 | 9,897 | (1,513 | ) | ||||||||
| Realized Carried Interest | — | 3,838 | (3,838 | ) | ||||||||
| Unrealized Carried Interest | 71,762 | (3,370 | ) | 75,132 | ||||||||
| Total Performance Income | 80,146 | 10,365 | 69,781 | |||||||||
| Investment Income (Loss) | ||||||||||||
| Net Realized Gains (Losses) | — | — | — | |||||||||
| Net Unrealized Gains (Losses) | — | — | — | |||||||||
| Total Realized and Unrealized | — | — | — | |||||||||
| Interest Income and Dividends | — | — | — | |||||||||
| Interest Expense | — | — | — | |||||||||
| Net Interest and Dividends | — | — | — | |||||||||
| Total Investment Income (Loss) | — | — | — | |||||||||
| Total Segment Revenues | 338,493 | 257,252 | 81,241 | |||||||||
| Segment Expenses | ||||||||||||
| Compensation and Benefits | ||||||||||||
| Cash Compensation and Benefits | 58,991 | 61,193 | (2,202 | ) | ||||||||
| Realized Performance Income Compensation | 3,354 | 5,493 | (2,139 | ) | ||||||||
| Unrealized Performance Income Compensation | 30,485 | (1,347 | ) | 31,832 | ||||||||
| Total Compensation and Benefits | 92,830 | 65,339 | 27,491 | |||||||||
| Occupancy and related charges | 5,140 | 7,252 | (2,112 | ) | ||||||||
| Other operating expenses | 24,244 | 28,102 | (3,858 | ) | ||||||||
| Total Segment Expenses | 122,214 | 100,693 | 21,521 | |||||||||
| Income (Loss) attributable to noncontrolling interests | — | — | — | |||||||||
| Economic Net Income (Loss) | $ | 216,279 | $ | 156,559 | $ | 59,720 | ||||||
| Assets Under Management | $ | 65,729,700 | $ | 55,920,200 | $ | 9,809,500 | ||||||
| Fee Paying Assets Under Management | $ | 52,016,500 | $ | 49,143,500 | $ | 2,873,000 | ||||||
| Capital Invested | $ | 3,825,900 | $ | 3,049,400 | $ | 776,500 | ||||||
| Uncalled Commitments | $ | 7,828,600 | $ | 6,428,200 | $ | 1,400,400 | ||||||
| ($ in thousands) | |||
| December 31, 2016 | $ | 55,740,200 | |
| New Capital Raised | 7,608,900 | ||
| Impact of Other Transactions | 3,811,400 | ||
| Distributions | (2,516,200 | ) | |
| Redemptions | (2,029,600 | ) | |
| Change in Value | 3,115,000 | ||
| September 30, 2017 | $ | 65,729,700 | |
| ($ in thousands) | |||
| December 31, 2016 | $ | 49,268,600 | |
| New Capital Raised | 7,630,100 | ||
| Impact of Other Transactions | (1,600,000 | ) | |
| Distributions | (3,794,600 | ) | |
| Redemptions | (2,029,600 | ) | |
| Change in Value | 2,542,000 | ||
| September 30, 2017 | $ | 52,016,500 | |
| Three Months Ended | ||||||||||||
| September 30, 2017 | September 30, 2016 | Change | ||||||||||
| ($ in thousands) | ||||||||||||
| Segment Revenues | ||||||||||||
| Management, Monitoring and Transaction Fees, Net | ||||||||||||
| Management Fees | $ | — | $ | — | $ | — | ||||||
| Monitoring Fees | — | — | — | |||||||||
| Transaction Fees | 85,440 | 47,383 | 38,057 | |||||||||
| Fee Credits | — | — | — | |||||||||
| Total Management, Monitoring and Transaction Fees, Net | 85,440 | 47,383 | 38,057 | |||||||||
| Performance Income | ||||||||||||
| Realized Incentive Fees | — | — | — | |||||||||
| Realized Carried Interest | — | — | — | |||||||||
| Unrealized Carried Interest | — | — | — | |||||||||
| Total Performance Income | — | — | — | |||||||||
| Investment Income (Loss) | ||||||||||||
| Net Realized Gains (Losses) | — | — | — | |||||||||
| Net Unrealized Gains (Losses) | — | — | — | |||||||||
| Total Realized and Unrealized | — | — | — | |||||||||
| Interest Income and Dividends | — | — | — | |||||||||
| Interest Expense | — | — | — | |||||||||
| Net Interest and Dividends | — | — | — | |||||||||
| Total Investment Income (Loss) | — | — | — | |||||||||
| Total Segment Revenues | 85,440 | 47,383 | 38,057 | |||||||||
| Segment Expenses | ||||||||||||
| Compensation and Benefits | ||||||||||||
| Cash Compensation and Benefits | 16,924 | 7,803 | 9,121 | |||||||||
| Realized Performance Income Compensation | — | — | — | |||||||||
| Unrealized Performance Income Compensation | — | — | — | |||||||||
| Total Compensation and Benefits | 16,924 | 7,803 | 9,121 | |||||||||
| Occupancy and related charges | 760 | 330 | 430 | |||||||||
| Other operating expenses | 6,293 | 3,552 | 2,741 | |||||||||
| Total Segment Expenses | 23,977 | 11,685 | 12,292 | |||||||||
| Income (Loss) attributable to noncontrolling interests | 1,046 | 760 | 286 | |||||||||
| Economic Net Income (Loss) | $ | 60,417 | $ | 34,938 | $ | 25,479 | ||||||
| Syndicated Capital | $ | 533,300 | $ | 537,000 | $ | (3,700 | ) | |||||
| Nine Months Ended | ||||||||||||||||||||
| September 30, 2022 | September 30, 2021 | Change | ||||||||||||||||||
| ($ in thousands) | ||||||||||||||||||||
| Fee Related Performance Revenues | ||||||||||||||||||||
| Private Equity | $ | — | $ | — | $ | — | ||||||||||||||
| Real Assets | 42,709 | 4,821 | 37,888 | |||||||||||||||||
| Credit and Liquid Strategies | 29,265 | 29,939 | (674) | |||||||||||||||||
| Total Fee Related Performance Revenues | $ | 71,974 | $ | 34,760 | $ | 37,214 | ||||||||||||||
| Nine Months Ended | ||||||||||||||||||||
| September 30, 2022 | September 30, 2021 | Change | ||||||||||||||||||
| ($ in thousands) | ||||||||||||||||||||
| Realized Performance Income | ||||||||||||||||||||
| Private Equity | $ | 1,722,529 | $ | 1,112,541 | $ | 609,988 | ||||||||||||||
| Real Assets | 97,244 | 57,225 | 40,019 | |||||||||||||||||
| Credit and Liquid Strategies | 18,152 | 52,637 | (34,485) | |||||||||||||||||
| Total Realized Performance Income | $ | 1,837,925 | $ | 1,222,403 | $ | 615,522 | ||||||||||||||
| Nine Months Ended | ||||||||||||
| September 30, 2017 | September 30, 2016 | Change | ||||||||||
| ($ in thousands) | ||||||||||||
| Segment Revenues | ||||||||||||
| Management, Monitoring and Transaction Fees, Net | ||||||||||||
| Management Fees | $ | — | $ | — | $ | — | ||||||
| Monitoring Fees | — | — | — | |||||||||
| Transaction Fees | 300,235 | 144,214 | 156,021 | |||||||||
| Fee Credits | — | — | — | |||||||||
| Total Management, Monitoring and Transaction Fees, Net | 300,235 | 144,214 | 156,021 | |||||||||
| Performance Income | ||||||||||||
| Realized Incentive Fees | — | — | — | |||||||||
| Realized Carried Interest | — | — | — | |||||||||
| Unrealized Carried Interest | — | — | — | |||||||||
| Total Performance Income | — | — | — | |||||||||
| Investment Income (Loss) | ||||||||||||
| Net Realized Gains (Losses) | — | — | — | |||||||||
| Net Unrealized Gains (Losses) | — | — | — | |||||||||
| Total Realized and Unrealized | — | — | — | |||||||||
| Interest Income and Dividends | — | — | — | |||||||||
| Interest Expense | — | — | — | |||||||||
| Net Interest and Dividends | — | — | — | |||||||||
| Total Investment Income (Loss) | — | — | — | |||||||||
| Total Segment Revenues | 300,235 | 144,214 | 156,021 | |||||||||
| Segment Expenses | ||||||||||||
| Compensation and Benefits | ||||||||||||
| Cash Compensation and Benefits | 57,053 | 23,374 | 33,679 | |||||||||
| Realized Performance Income Compensation | — | — | — | |||||||||
| Unrealized Performance Income Compensation | — | — | — | |||||||||
| Total Compensation and Benefits | 57,053 | 23,374 | 33,679 | |||||||||
| Occupancy and related charges | 2,052 | 1,901 | 151 | |||||||||
| Other operating expenses | 15,320 | 10,870 | 4,450 | |||||||||
| Total Segment Expenses | 74,425 | 36,145 | 38,280 | |||||||||
| Income (Loss) attributable to noncontrolling interests | 3,810 | 2,002 | 1,808 | |||||||||
| Economic Net Income (Loss) | $ | 222,000 | $ | 106,067 | $ | 115,933 | ||||||
| Syndicated Capital | $ | 2,167,600 | $ | 1,213,500 | $ | 954,100 | ||||||
| Nine Months Ended | ||||||||||||||||||||
| September 30, 2022 | September 30, 2021 | Change | ||||||||||||||||||
| ($ in thousands) | ||||||||||||||||||||
| Private Equity | ||||||||||||||||||||
| North America Fund XI | $ | 926,496 | $ | 365,772 | $ | 560,724 | ||||||||||||||
| Core Investment Vehicles | 262,219 | 80,937 | 181,282 | |||||||||||||||||
| 2006 Fund | 144,764 | 215,741 | (70,977) | |||||||||||||||||
| Americas Fund XII | 122,277 | 207,559 | (85,282) | |||||||||||||||||
| Asian Fund III | 104,601 | 110,515 | (5,914) | |||||||||||||||||
| European Fund IV | 86,233 | 43,976 | 42,257 | |||||||||||||||||
| Co-Investment Vehicles and Other | 51,883 | 68,252 | (16,369) | |||||||||||||||||
| Next Generation Technology Growth Fund | — | 18,160 | (18,160) | |||||||||||||||||
| European Fund III | — | 353 | (353) | |||||||||||||||||
Total Realized Carried Interest (1) | 1,698,473 | 1,111,265 | 587,208 | |||||||||||||||||
| Incentive Fees | 24,056 | 1,276 | 22,780 | |||||||||||||||||
| Total Realized Performance Income | $ | 1,722,529 | $ | 1,112,541 | $ | 609,988 | ||||||||||||||
| Nine Months Ended | ||||||||||||||||||||
| September 30, 2022 | September 30, 2021 | Change | ||||||||||||||||||
| ($ in thousands) | ||||||||||||||||||||
| Real Assets | ||||||||||||||||||||
| Real Estate Partners Americas II | $ | 88,742 | $ | — | $ | 88,742 | ||||||||||||||
| Global Infrastructure Investors II | 8,502 | 36,215 | (27,713) | |||||||||||||||||
| Real Estate Partners Europe | — | 14,690 | (14,690) | |||||||||||||||||
| Co-Investment Vehicles and Other | — | 3,283 | (3,283) | |||||||||||||||||
| Global Infrastructure Investors | — | 3,037 | (3,037) | |||||||||||||||||
Total Realized Carried Interest (1) | 97,244 | 57,225 | 40,019 | |||||||||||||||||
| Incentive Fees | — | — | — | |||||||||||||||||
| Total Realized Performance Income | $ | 97,244 | $ | 57,225 | $ | 40,019 | ||||||||||||||
| Nine Months Ended | ||||||||||||||||||||
| September 30, 2022 | September 30, 2021 | Change | ||||||||||||||||||
| ($ in thousands) | ||||||||||||||||||||
| Credit and Liquid Strategies | ||||||||||||||||||||
| Alternative Credit Vehicles | $ | 4,153 | $ | 15,336 | $ | (11,183) | ||||||||||||||
Total Realized Carried Interest (1) | 4,153 | 15,336 | (11,183) | |||||||||||||||||
| Incentive Fees | 13,999 | 37,301 | (23,302) | |||||||||||||||||
| Total Realized Performance Income | $ | 18,152 | $ | 52,637 | $ | (34,485) | ||||||||||||||
| Three Months Ended | ||||||||||||
| September 30, 2017 | September 30, 2016 | Change | ||||||||||
| ($ in thousands) | ||||||||||||
| Segment Revenues | ||||||||||||
| Management, Monitoring and Transaction Fees, Net | ||||||||||||
| Management Fees | $ | — | $ | — | $ | — | ||||||
| Monitoring Fees | — | — | — | |||||||||
| Transaction Fees | — | — | — | |||||||||
| Fee Credits | — | — | — | |||||||||
| Total Management, Monitoring and Transaction Fees, Net | — | — | — | |||||||||
| Performance Income | ||||||||||||
| Realized Incentive Fees | — | — | — | |||||||||
| Realized Carried Interest | — | — | — | |||||||||
| Unrealized Carried Interest | — | — | — | |||||||||
| Total Performance Income | — | — | — | |||||||||
| Investment Income (Loss) | ||||||||||||
| Net Realized Gains (Losses) | 76,053 | 170,078 | (94,025 | ) | ||||||||
| Net Unrealized Gains (Losses) | (50,902 | ) | 136,740 | (187,642 | ) | |||||||
| Total Realized and Unrealized | 25,151 | 306,818 | (281,667 | ) | ||||||||
| Interest Income and Dividends | 70,557 | 71,185 | (628 | ) | ||||||||
| Interest Expense | (45,613 | ) | (47,506 | ) | 1,893 | |||||||
| Net Interest and Dividends | 24,944 | 23,679 | 1,265 | |||||||||
| Total Investment Income (Loss) | 50,095 | 330,497 | (280,402 | ) | ||||||||
| Total Segment Revenues | 50,095 | 330,497 | (280,402 | ) | ||||||||
| Segment Expenses | ||||||||||||
| Compensation and Benefits | ||||||||||||
| Cash Compensation and Benefits | 33,958 | 24,284 | 9,674 | |||||||||
| Realized Performance Income Compensation | — | — | — | |||||||||
| Unrealized Performance Income Compensation | — | — | — | |||||||||
| Total Compensation and Benefits | 33,958 | 24,284 | 9,674 | |||||||||
| Occupancy and related charges | 3,840 | 3,729 | 111 | |||||||||
| Other operating expenses | 14,176 | 10,646 | 3,530 | |||||||||
| Total Segment Expenses | 51,974 | 38,659 | 13,315 | |||||||||
| Income (Loss) attributable to noncontrolling interests | — | — | — | |||||||||
| Economic Net Income (Loss) | $ | (1,879 | ) | $ | 291,838 | $ | (293,717 | ) | ||||
| Nine Months Ended | ||||||||||||||||||||
| September 30, 2022 | September 30, 2021 | Change | ||||||||||||||||||
| ($ in thousands) | ||||||||||||||||||||
| Realized Investment Income | ||||||||||||||||||||
| Net Realized Gains (Losses) | $ | 435,260 | $ | 1,026,310 | $ | (591,050) | ||||||||||||||
| Interest Income and Dividends | 475,961 | 251,391 | 224,570 | |||||||||||||||||
| Total Realized Investment Income | $ | 911,221 | $ | 1,277,701 | $ | (366,480) | ||||||||||||||
| Nine Months Ended | ||||||||||||
| September 30, 2017 | September 30, 2016 | Change | ||||||||||
| ($ in thousands) | ||||||||||||
| Segment Revenues | ||||||||||||
| Management, Monitoring and Transaction Fees, Net | ||||||||||||
| Management Fees | $ | — | $ | — | $ | — | ||||||
| Monitoring Fees | — | — | — | |||||||||
| Transaction Fees | — | — | — | |||||||||
| Fee Credits | — | — | — | |||||||||
| Total Management, Monitoring and Transaction Fees, Net | — | — | — | |||||||||
| Performance Income | ||||||||||||
| Realized Incentive Fees | — | — | — | |||||||||
| Realized Carried Interest | — | — | — | |||||||||
| Unrealized Carried Interest | — | — | — | |||||||||
| Total Performance Income | — | — | — | |||||||||
| Investment Income (Loss) | ||||||||||||
| Net Realized Gains (Losses) | 162,684 | 370,594 | (207,910 | ) | ||||||||
| Net Unrealized Gains (Losses) | 461,111 | (725,699 | ) | 1,186,810 | ||||||||
| Total Realized and Unrealized | 623,795 | (355,105 | ) | 978,900 | ||||||||
| Interest Income and Dividends | 195,275 | 253,756 | (58,481 | ) | ||||||||
| Interest Expense | (134,348 | ) | (144,497 | ) | 10,149 | |||||||
| Net Interest and Dividends | 60,927 | 109,259 | (48,332 | ) | ||||||||
| Total Investment Income (Loss) | 684,722 | (245,846 | ) | 930,568 | ||||||||
| Total Segment Revenues | 684,722 | (245,846 | ) | 930,568 | ||||||||
| Segment Expenses | ||||||||||||
| Compensation and Benefits | ||||||||||||
| Cash Compensation and Benefits | 105,591 | 72,689 | 32,902 | |||||||||
| Realized Performance Income Compensation | — | — | — | |||||||||
| Unrealized Performance Income Compensation | — | — | — | |||||||||
| Total Compensation and Benefits | 105,591 | 72,689 | 32,902 | |||||||||
| Occupancy and related charges | 11,082 | 11,121 | (39 | ) | ||||||||
| Other operating expenses | 40,265 | 32,404 | 7,861 | |||||||||
| Total Segment Expenses | 156,938 | 116,214 | 40,724 | |||||||||
| Income (Loss) attributable to noncontrolling interests | — | — | — | |||||||||
| Economic Net Income (Loss) | $ | 527,784 | $ | (362,060 | ) | $ | 889,844 | |||||
| As of | ||||||||||||||||||||
| September 30, 2022 | December 31, 2021 | Change | ||||||||||||||||||
| ($ in millions) | ||||||||||||||||||||
| Assets Under Management | $ | 496,219 | $ | 470,555 | $ | 25,664 | ||||||||||||||
| Fee Paying Assets Under Management | $ | 397,627 | $ | 357,389 | $ | 40,238 | ||||||||||||||
| Uncalled Commitments | $ | 112,589 | $ | 111,822 | $ | 767 | ||||||||||||||
| Nine Months Ended | ||||||||||||||||||||
| September 30, 2022 | September 30, 2021 | Change | ||||||||||||||||||
| ($ in millions) | ||||||||||||||||||||
| Capital Invested | $ | 55,710 | $ | 49,833 | $ | 5,877 | ||||||||||||||
| ($ in millions) | |||||
| December 31, 2021 | $ | 173,745 | |||
| New Capital Raised | 15,894 | ||||
| Distributions and Other | (12,539) | ||||
| Change in Value | (11,630) | ||||
| September 30, 2022 | $ | 165,470 | |||
| ($ in millions) | |||||
| December 31, 2021 | $ | 83,303 | |||
| New Capital Raised | 26,947 | ||||
Acquisitions and Other(1) | 13,779 | ||||
| Distributions and Other | (4,990) | ||||
| Change in Value | (1,268) | ||||
| September 30, 2022 | $ | 117,771 | |||
| ($ in millions) | |||||
| December 31, 2021 | $ | 213,507 | |||
| New Capital Raised | 22,120 | ||||
Acquisitions and Other(1) | 7,997 | ||||
| Distributions and Other | (11,406) | ||||
| Redemptions | (4,088) | ||||
| Change in Value | (15,152) | ||||
| September 30, 2022 | $ | 212,978 | |||
| ($ in millions) | |||||
| December 31, 2021 | $ | 87,890 | |||
| New Capital Raised | 17,272 | ||||
| Distributions and Other | (3,405) | ||||
| Net Changes in Fee Base of Certain Funds | (1,573) | ||||
| Change in Value | (1,085) | ||||
| September 30, 2022 | $ | 99,099 | |||
| ($ in millions) | |||||
| December 31, 2021 | $ | 66,965 | |||
| New Capital Raised | 28,826 | ||||
Acquisitions and Other(1) | 13,779 | ||||
| Distributions and Other | (3,626) | ||||
| Net Changes in Fee Base of Certain Funds | (1,125) | ||||
| Change in Value | (4,465) | ||||
| September 30, 2022 | $ | 100,354 | |||
| ($ in millions) | |||||
| December 31, 2021 | $ | 202,534 | |||
| New Capital Raised | 17,172 | ||||
Acquisitions and Other(1) | 7,997 | ||||
| Distributions and Other | (11,128) | ||||
| Redemptions | (4,088) | ||||
| Change in Value | (14,313) | ||||
| September 30, 2022 | $ | 198,174 | |||
| Nine Months Ended | |||||||||||||||||
| September 30, 2022 | September 30, 2021 | Change | |||||||||||||||
| ($ in thousands) | |||||||||||||||||
| Net Investment Income | $ | 2,881,567 | $ | 1,977,383 | $ | 904,184 | |||||||||||
| Net Cost of Insurance | (1,664,664) | (1,076,566) | (588,098) | ||||||||||||||
| General, Administrative and Other | (472,795) | (338,325) | (134,470) | ||||||||||||||
| Pre-tax Insurance Operating Earnings | 744,108 | 562,492 | 181,616 | ||||||||||||||
| Income Taxes | (125,927) | (63,148) | (62,779) | ||||||||||||||
| Net Income Attributable to Noncontrolling Interests | (238,118) | (193,570) | (44,548) | ||||||||||||||
| Insurance Segment Operating Earnings | $ | 380,063 | $ | 305,774 | $ | 74,289 | |||||||||||
| Nine Months Ended | |||||||||||||||||||||||
| September 30, 2022 | September 30, 2021 | Change | |||||||||||||||||||||
| ($ in thousands) | |||||||||||||||||||||||
| Asset Management Segment Operating Earnings | $ | 3,039,393 | $ | 2,873,979 | $ | 165,414 | |||||||||||||||||
| Insurance Segment Operating Earnings | 380,063 | 305,774 | 74,289 | ||||||||||||||||||||
| Distributable Operating Earnings | 3,419,456 | 3,179,753 | 239,703 | ||||||||||||||||||||
| Interest Expense | (229,414) | (185,100) | (44,314) | ||||||||||||||||||||
| Preferred Dividends | — | (19,201) | 19,201 | ||||||||||||||||||||
| Net Income Attributable to Noncontrolling Interests | (17,083) | (14,678) | (2,405) | ||||||||||||||||||||
| Income Taxes Paid | (540,909) | (449,814) | (91,095) | ||||||||||||||||||||
| After-tax Distributable Earnings | $ | 2,632,050 | $ | 2,510,960 | $ | 121,090 | |||||||||||||||||
| As of | |||||||||||||||||
| September 30, 2022 | December 31, 2021 | ||||||||||||||||
| ($ in thousands) | |||||||||||||||||
| (+) | Cash and Short-term Investments | $ | 4,248,213 | $ | 4,869,203 | ||||||||||||
| (+) | Investments | 17,685,528 | 17,763,542 | ||||||||||||||
| (+) | Net Unrealized Carried Interest (1) | 2,672,647 | 4,967,401 | ||||||||||||||
| (+) | Other Assets, Net (2) | 6,637,886 | 4,706,108 | ||||||||||||||
| (+) | Global Atlantic Book Value | 3,563,911 | 3,372,498 | ||||||||||||||
| (-) | Debt Obligations - KKR (excluding KFN and Global Atlantic) | 6,830,070 | 5,836,267 | ||||||||||||||
| (-) | Debt Obligations - KFN | 948,517 | 948,517 | ||||||||||||||
| (-) | Tax Liabilities, Net | 1,710,896 | 2,697,317 | ||||||||||||||
| (-) | Other Liabilities | 1,671,451 | 774,711 | ||||||||||||||
| (-) | Noncontrolling Interests | 30,759 | 33,058 | ||||||||||||||
| Book Value | $ | 23,616,492 | $ | 25,388,882 | |||||||||||||
| Book Value Per Adjusted Share | $ | 26.56 | $ | 28.77 | |||||||||||||
| Adjusted Shares | 889,121,824 | 882,589,036 | |||||||||||||||
| As of | ||||||||||||||
| September 30, 2022 | December 31, 2021 | |||||||||||||
| ($ in thousands) | ||||||||||||||
| Private Equity Business Line | $ | 2,352,336 | $ | 4,697,134 | ||||||||||
| Real Assets Business Line | 220,848 | 159,709 | ||||||||||||
| Credit and Liquid Strategies Business Line | 99,463 | 110,558 | ||||||||||||
| Total | $ | 2,672,647 | $ | 4,967,401 | ||||||||||
| As of September 30, 2022 | ||||||||||||||||||||
| ($ in thousands) | ||||||||||||||||||||
Investments (1) | Cost | Fair Value | Fair Value as a Percentage of Total Investments | |||||||||||||||||
| Traditional Private Equity | $ | 1,805,833 | $ | 3,277,068 | 18.5 | % | ||||||||||||||
| Core Private Equity | 2,685,259 | 5,436,110 | 30.7 | % | ||||||||||||||||
| Growth Equity | 292,429 | 805,866 | 4.6 | % | ||||||||||||||||
| Private Equity Total | 4,783,521 | 9,519,044 | 53.8 | % | ||||||||||||||||
| Energy | 894,614 | 969,901 | 5.5 | % | ||||||||||||||||
| Real Estate | 1,815,588 | 2,146,540 | 12.1 | % | ||||||||||||||||
| Infrastructure | 924,238 | 1,082,905 | 6.1 | % | ||||||||||||||||
| Real Assets Total | 3,634,440 | 4,199,346 | 23.7 | % | ||||||||||||||||
| Leveraged Credit | 1,281,300 | 1,009,867 | 5.7 | % | ||||||||||||||||
| Alternative Credit | 882,023 | 881,922 | 5.0 | % | ||||||||||||||||
| Credit Total | 2,163,323 | 1,891,789 | 10.7 | % | ||||||||||||||||
| Other | 2,410,323 | 2,075,349 | 11.8 | % | ||||||||||||||||
| Total Investments | $ | 12,991,607 | $ | 17,685,528 | 100.0 | % | ||||||||||||||
| As of September 30, 2022 | ||||||||||||||||||||
| ($ in thousands) | ||||||||||||||||||||
Top 20 Investments: (1) | Cost | Fair Value | ||||||||||||||||||
| USI, Inc. | $ | 531,425 | $ | 1,250,310 | ||||||||||||||||
| PetVet Care Centers, LLC | 243,211 | 1,143,092 | ||||||||||||||||||
| Heartland Dental, LLC | 320,656 | 833,705 | ||||||||||||||||||
| Exact Group B.V. | 213,362 | 468,972 | ||||||||||||||||||
| Arnott's Biscuits Limited | 250,841 | 430,578 | ||||||||||||||||||
| 1-800 Contacts Inc. | 300,178 | 390,217 | ||||||||||||||||||
| Internet Brands, Inc. | 340,312 | 373,695 | ||||||||||||||||||
| Barracuda Networks, Inc. | 344,083 | 344,083 | ||||||||||||||||||
| Crescent Energy Company (NYSE: CRGY) | 539,992 | 341,233 | ||||||||||||||||||
| Teaching Strategies, LLC | 307,162 | 307,162 | ||||||||||||||||||
| Fiserv, Inc. (NASDAQ: FISV) | 127,010 | 273,049 | ||||||||||||||||||
| ERM Worldwide Group Limited | 228,710 | 251,581 | ||||||||||||||||||
| Resolution Life Group Holdings, L.P. | 262,191 | 228,659 | ||||||||||||||||||
| Roompot B.V. | 193,578 | 212,607 | ||||||||||||||||||
| Atlantic Aviation FBO Inc. | 170,274 | 186,672 | ||||||||||||||||||
| Viridor Limited | 132,023 | 169,225 | ||||||||||||||||||
| The Bay Clubs Company, LLC | 160,127 | 160,127 | ||||||||||||||||||
| Veresen Midstream | 92,602 | 152,365 | ||||||||||||||||||
| GenesisCare Pty Ltd. | 196,104 | 142,986 | ||||||||||||||||||
| PortAventura | 155,803 | 141,831 | ||||||||||||||||||
| Total Top 20 Investments | $ | 5,109,644 | $ | 7,802,149 | ||||||||||||||||
| As of | As of | |||||||
| September 30, 2017 | December 31, 2016 | |||||||
| ($ in thousands, except per unit amounts) | ||||||||
| Cash and Short-term Investments | $ | 3,623,773 | $ | 3,387,673 | ||||
| Investments | 8,123,514 | 6,958,873 | ||||||
Unrealized Carry (1) | 1,474,693 | 1,213,692 | ||||||
| Other Assets | 1,964,794 | 1,611,678 | ||||||
| Corporate Real Estate | 161,225 | 161,225 | ||||||
| Total Assets | $ | 15,347,999 | $ | 13,333,141 | ||||
| Debt Obligations - KKR (ex-KFN) | $ | 2,000,000 | $ | 2,000,000 | ||||
| Debt Obligations - KFN | 639,767 | 398,560 | ||||||
| Preferred Shares - KFN | 373,750 | 373,750 | ||||||
| Other Liabilities | 596,079 | 244,676 | ||||||
| Total Liabilities | 3,609,596 | 3,016,986 | ||||||
| Noncontrolling Interests | 20,849 | 19,564 | ||||||
| Preferred Units | 500,000 | 500,000 | ||||||
| Book Value | $ | 11,217,554 | $ | 9,796,591 | ||||
| Book Value Per Outstanding Adjusted Unit | $ | 13.80 | $ | 12.15 | ||||
(1) Unrealized Carry | ||||||||
| Private Markets | $ | 1,347,729 | $ | 1,141,610 | ||||
| Public Markets | 126,964 | 72,082 | ||||||
| Total | $ | 1,474,693 | $ | 1,213,692 | ||||
| Three Months Ended | Nine Months Ended | ||||||||||||||||||||||||||||||||||
| September 30, 2022 | September 30, 2021 | September 30, 2022 | September 30, 2021 | ||||||||||||||||||||||||||||||||
| ($ in thousands) | |||||||||||||||||||||||||||||||||||
| Total GAAP Revenues | $ | 1,858,413 | $ | 4,483,365 | $ | 3,192,500 | $ | 12,182,552 | |||||||||||||||||||||||||||
| Impact of Consolidation and Other | 207,822 | 134,524 | 593,340 | 392,883 | |||||||||||||||||||||||||||||||
| Asset Management Adjustments: | |||||||||||||||||||||||||||||||||||
| Capital Allocation-Based Income (Loss) (GAAP) | 572,863 | (1,526,667) | 2,442,080 | (5,736,707) | |||||||||||||||||||||||||||||||
| Realized Carried Interest | 496,494 | 413,114 | 1,799,870 | 1,183,826 | |||||||||||||||||||||||||||||||
| Realized Investment Income | 284,979 | 447,565 | 911,221 | 1,277,701 | |||||||||||||||||||||||||||||||
| Capstone Fees | (20,748) | (25,178) | (55,743) | (66,286) | |||||||||||||||||||||||||||||||
| Expense Reimbursements | (10,733) | (34,857) | (77,612) | (122,642) | |||||||||||||||||||||||||||||||
| Insurance Adjustments: | |||||||||||||||||||||||||||||||||||
| Net Premiums | (480,462) | (974,903) | (627,104) | (1,698,912) | |||||||||||||||||||||||||||||||
| Policy Fees | (320,206) | (310,381) | (964,349) | (824,326) | |||||||||||||||||||||||||||||||
| Other Income | (35,632) | (31,938) | (102,888) | (82,160) | |||||||||||||||||||||||||||||||
| Investment Gains and Losses | (11,584) | (156,909) | 176,559 | 83,153 | |||||||||||||||||||||||||||||||
| Derivative Gains and Losses | 184,303 | 53,179 | 945,996 | 47,151 | |||||||||||||||||||||||||||||||
Total Segment Revenues (1) | $ | 2,725,509 | $ | 2,470,914 | $ | 8,233,870 | $ | 6,636,233 | |||||||||||||||||||||||||||
| Three Months Ended | Nine Months Ended | ||||||||||||||||||||||||||||
| September 30, 2022 | September 30, 2021 | September 30, 2022 | September 30, 2021 | ||||||||||||||||||||||||||
| ($ in thousands) | |||||||||||||||||||||||||||||
| Net Income (Loss) Attributable to KKR & Co. Inc. Common Stockholders (GAAP) | $ | (91,646) | $ | 1,131,354 | $ | (993,350) | $ | 4,053,271 | |||||||||||||||||||||
| Preferred Stock Dividends | 17,250 | 25,203 | 51,750 | 88,397 | |||||||||||||||||||||||||
| Net Income (Loss) Attributable to Noncontrolling Interests | (5,191) | 2,125,088 | (39,795) | 7,318,218 | |||||||||||||||||||||||||
| Income Tax Expense (Benefit) | 27,434 | 379,282 | (128,836) | 1,161,688 | |||||||||||||||||||||||||
| Income (Loss) Before Tax (GAAP) | $ | (52,153) | $ | 3,660,927 | $ | (1,110,231) | $ | 12,621,574 | |||||||||||||||||||||
| Impact of Consolidation and Other | 92,767 | (1,478,384) | (185,329) | (5,000,537) | |||||||||||||||||||||||||
Equity-based Compensation - KKR Holdings(1) | 19,500 | 8,764 | 119,834 | 35,734 | |||||||||||||||||||||||||
| Preferred Stock Dividends | — | (2,519) | — | (19,201) | |||||||||||||||||||||||||
| Income Taxes Paid | (173,949) | (185,645) | (540,909) | (449,814) | |||||||||||||||||||||||||
| Asset Management Adjustments: | |||||||||||||||||||||||||||||
| Net Unrealized (Gains) Losses | 233,265 | (598,304) | 1,734,293 | (2,890,326) | |||||||||||||||||||||||||
| Unrealized Carried Interest | 1,094,782 | (911,156) | 3,946,182 | (3,872,150) | |||||||||||||||||||||||||
| Unrealized Carried Interest Compensation (Carry Pool) | (468,785) | 397,449 | (1,629,011) | 1,667,447 | |||||||||||||||||||||||||
Strategic Corporate Transaction-Related Charges (2) | 17,925 | 7,362 | 88,129 | 17,497 | |||||||||||||||||||||||||
| Equity-based Compensation | 50,566 | 44,488 | 156,259 | 138,196 | |||||||||||||||||||||||||
| Equity-based Compensation - Performance based | 58,943 | 18,022 | 176,727 | 50,073 | |||||||||||||||||||||||||
Insurance Adjustments:(3) | |||||||||||||||||||||||||||||
Net (Gains) Losses from Investments and Derivatives(3) | (54,585) | (75,241) | (120,033) | 183,842 | |||||||||||||||||||||||||
Strategic Corporate Transaction-Related Charges(3) | 4,413 | 3,931 | 14,120 | 15,947 | |||||||||||||||||||||||||
Equity-based and Other Compensation(3) | 41,102 | 40,086 | 94,711 | 64,061 | |||||||||||||||||||||||||
Amortization of Acquired Intangibles(3) | 4,411 | 4,412 | 13,235 | 11,765 | |||||||||||||||||||||||||
Income Taxes(3) | (44,468) | (9,046) | (125,927) | (63,148) | |||||||||||||||||||||||||
| After-tax Distributable Earnings | $ | 823,734 | $ | 925,146 | $ | 2,632,050 | $ | 2,510,960 | |||||||||||||||||||||
| Interest Expense | 83,335 | 63,446 | 229,414 | 185,100 | |||||||||||||||||||||||||
| Preferred Stock Dividends | — | 2,519 | — | 19,201 | |||||||||||||||||||||||||
| Net Income Attributable to Noncontrolling Interests | 4,932 | 6,072 | 17,083 | 14,678 | |||||||||||||||||||||||||
| Income Taxes Paid | 173,949 | 185,645 | 540,909 | 449,814 | |||||||||||||||||||||||||
| Distributable Operating Earnings | $ | 1,085,950 | $ | 1,182,828 | $ | 3,419,456 | $ | 3,179,753 | |||||||||||||||||||||
| Insurance Segment Operating Earnings | (127,022) | (114,989) | (380,063) | (305,774) | |||||||||||||||||||||||||
| Realized Performance Income | (497,860) | (432,784) | (1,837,925) | (1,222,403) | |||||||||||||||||||||||||
| Realized Performance Income Compensation | 322,927 | 274,955 | 1,180,990 | 797,965 | |||||||||||||||||||||||||
| Realized Investment Income | (284,979) | (447,565) | (911,221) | (1,277,701) | |||||||||||||||||||||||||
| Realized Investment Income Compensation | 42,747 | 67,142 | 136,683 | 191,663 | |||||||||||||||||||||||||
| Fee Related Earnings | $ | 541,763 | $ | 529,587 | $ | 1,607,920 | $ | 1,363,503 | |||||||||||||||||||||
| Insurance Segment Operating Earnings | 127,022 | 114,989 | 380,063 | 305,774 | |||||||||||||||||||||||||
| Realized Performance Income | 497,860 | 432,784 | 1,837,925 | 1,222,403 | |||||||||||||||||||||||||
| Realized Performance Income Compensation | (322,927) | (274,955) | (1,180,990) | (797,965) | |||||||||||||||||||||||||
| Realized Investment Income | 284,979 | 447,565 | 911,221 | 1,277,701 | |||||||||||||||||||||||||
| Realized Investment Income Compensation | (42,747) | (67,142) | (136,683) | (191,663) | |||||||||||||||||||||||||
| Depreciation and Amortization | 9,045 | 6,064 | 24,411 | 18,257 | |||||||||||||||||||||||||
| Adjusted EBITDA | $ | 1,094,995 | $ | 1,188,892 | $ | 3,443,867 | $ | 3,198,010 | |||||||||||||||||||||
| As of | |||||||||||
| September 30, 2022 | December 31, 2021 | ||||||||||
| ($ in thousands) | |||||||||||
| KKR & Co. Inc. Stockholders' Equity - Series I and II Preferred Stock, Common Stock | $ | 16,335,253 | $ | 16,466,372 | |||||||
| Series C Mandatory Convertible Preferred Stock | 1,115,792 | 1,115,792 | |||||||||
| Impact of Consolidation and Other | 381,772 | (1,048,569) | |||||||||
| KKR Holdings and Other Exchangeable Securities | 181,508 | 8,595,510 | |||||||||
| Accumulated Other Comprehensive Income (AOCI) and Other (Insurance) | 5,602,167 | 259,777 | |||||||||
| Book Value | $ | 23,616,492 | $ | 25,388,882 | |||||||
| As of | |||||||||||
| September 30, 2022 | December 31, 2021 | ||||||||||
| GAAP Shares of Common Stock Outstanding | 859,833,444 | 595,663,618 | |||||||||
| Adjustments: | |||||||||||
| KKR Holdings Units | — | 258,726,163 | |||||||||
Exchangeable Securities (1) | 2,465,810 | 1,376,655 | |||||||||
Common Stock - Series C Mandatory Convertible Preferred Stock (2) | 26,822,570 | 26,822,600 | |||||||||
Adjusted Shares (3) | 889,121,824 | 882,589,036 | |||||||||
Unvested Equity Awards and Exchangeable Securities (4) | 35,300,207 | 39,000,561 | |||||||||
| As of September 30, 2017 | |||||||||||
| Investments | Cost | Carrying Value | Carrying Value as a Percentage of Total Investments | ||||||||
| Private Equity Co-Investments and Other Equity | $ | 2,281,693 | $ | 2,697,619 | 33.2 | % | |||||
| Private Equity Funds | 1,026,481 | 1,348,599 | 16.6 | % | |||||||
| Private Equity Total | 3,308,174 | 4,046,218 | 49.8 | % | |||||||
| Energy | 933,568 | 549,607 | 6.8 | % | |||||||
Real Estate (1) | 744,935 | 795,042 | 9.8 | % | |||||||
| Infrastructure | 285,695 | 370,318 | 4.6 | % | |||||||
| Real Assets Total | 1,964,198 | 1,714,967 | 21.2 | % | |||||||
| Special Situations | 810,251 | 820,148 | 10.1 | % | |||||||
| Direct Lending | 100,188 | 97,111 | 1.2 | % | |||||||
| Mezzanine | 34,681 | 39,052 | 0.5 | % | |||||||
| Alternative Credit Total | 945,120 | 956,311 | 11.8 | % | |||||||
CLOs (1) | 951,194 | 578,587 | 7.1 | % | |||||||
| Liquid Credit | 143,349 | 152,699 | 1.9 | % | |||||||
| Specialty Finance | 283,898 | 209,755 | 2.6 | % | |||||||
| Credit Total | 2,323,561 | 1,897,352 | 23.4 | % | |||||||
| Other | 439,839 | 464,977 | 5.6 | % | |||||||
| Total Investments | $ | 8,035,772 | $ | 8,123,514 | 100.0 | % | |||||
| As of September 30, 2017 | |||||||||||
Significant Investments: (2) | Cost | Carrying Value | Carrying Value as a Percentage of Total Investments | ||||||||
| First Data Corporation (NYSE: FDC) | $ | 956,454 | $ | 1,279,098 | 15.7 | % | |||||
| USI, Inc. (financial services sector) | 500,111 | 503,711 | 6.2 | % | |||||||
| KKR Real Estate Finance Trust Inc. (NYSE: KREF) | 324,997 | 325,000 | 4.0 | % | |||||||
| PortAventura Entertainment S.A. (hotels/leisure sector) | 233,132 | 255,821 | 3.1 | % | |||||||
| Natural Gas Midstream Investment (infrastructure sector) | 150,330 | 209,728 | 2.6 | % | |||||||
| Total Significant Investments | 2,165,024 | 2,573,358 | 31.6 | % | |||||||
| Other Investments | 5,870,748 | 5,550,156 | 68.4 | % | |||||||
| Total Investments | $ | 8,035,772 | $ | 8,123,514 | 100.0 | % | |||||
| (1) Includes approximately $305.1 million and $325.0 million of CLOs and our ownership of KKR Real Estate Finance Trust Inc., respectively, that are not held for investment purposes and are held at cost. | |||||||||||
| (2) The significant investments include the top five investments (other than investments expected to be syndicated or transferred in connection with new fundraising) based on their carrying values as of September 30, 2017. The carrying value figures include the co-investment and the limited partner and/or general partner interests held by KKR in the underlying investment, if applicable. | |||||||||||
| As of September 30, 2017 | |||||||||||||||||||||||
| (Amounts in thousands) | |||||||||||||||||||||||
| CONDENSED CONSOLIDATED STATEMENTS OF FINANCIAL CONDITION (GAAP BASIS) | 1 | 2 | 3 | 4 | 5 | TOTAL REPORTABLE SEGMENTS BALANCE SHEET | |||||||||||||||||
| Assets | |||||||||||||||||||||||
| Cash and Cash Equivalents | $ | 2,436,566 | — | — | 1,187,207 | — | — | $ | 3,623,773 | Cash and Short-term Investments | |||||||||||||
| Investments | 37,251,837 | (26,522,559 | ) | (1,131,071 | ) | (1,474,693 | ) | — | — | 8,123,514 | Investments | ||||||||||||
| — | — | 1,474,693 | — | — | 1,474,693 | Unrealized Carry | |||||||||||||||||
| Other Assets | 4,617,236 | (1,002,082 | ) | — | (1,348,432 | ) | — | (301,928 | ) | 1,964,794 | Other Assets | ||||||||||||
| — | — | 161,225 | — | — | 161,225 | Corporate Real Estate | |||||||||||||||||
| Total Assets | $ | 44,305,639 | (27,524,641 | ) | (1,131,071 | ) | — | — | (301,928 | ) | $ | 15,347,999 | |||||||||||
| Liabilities and Equity | |||||||||||||||||||||||
| Debt Obligations | $ | 20,290,714 | (17,650,947 | ) | — | (639,767 | ) | — | — | $ | 2,000,000 | Debt Obligations - KKR (ex-KFN) | |||||||||||
| — | — | 639,767 | — | — | 639,767 | Debt Obligations - KFN | |||||||||||||||||
| — | — | 373,750 | — | — | 373,750 | Preferred Shares - KFN | |||||||||||||||||
| Other Liabilities | 4,149,491 | (2,245,511 | ) | (1,131,071 | ) | — | — | (176,830 | ) | 596,079 | Other Liabilities | ||||||||||||
| Total Liabilities | 24,440,205 | (19,896,458 | ) | (1,131,071 | ) | 373,750 | — | (176,830 | ) | 3,609,596 | |||||||||||||
| Redeemable Noncontrolling Interests | 570,134 | (570,134 | ) | — | — | — | — | — | |||||||||||||||
| Equity | |||||||||||||||||||||||
| Series A Preferred Units | 332,988 | — | — | (332,988 | ) | — | — | — | |||||||||||||||
| Series B Preferred Units | 149,566 | — | — | (149,566 | ) | — | — | — | |||||||||||||||
| KKR & Co. L.P. Capital - Common Unitholders | 6,380,654 | 166,480 | — | (17,446 | ) | 4,812,964 | (125,098 | ) | 11,217,554 | Book Value | |||||||||||||
| Noncontrolling Interests | 12,432,092 | (7,224,529 | ) | — | (373,750 | ) | (4,812,964 | ) | — | 20,849 | Noncontrolling Interests | ||||||||||||
| — | — | 500,000 | — | — | 500,000 | Preferred Units | |||||||||||||||||
| Total Liabilities and Equity | $ | 44,305,639 | (27,524,641 | ) | (1,131,071 | ) | — | — | (301,928 | ) | $ | 15,347,999 | |||||||||||
| 1 | IMPACT OF CONSOLIDATION OF INVESTMENT VEHICLES AND OTHER ENTITIES | ||||||||||||||||||||||
| 2 | CARRY POOL RECLASSIFICATION | ||||||||||||||||||||||
| 3 | OTHER RECLASSIFICATIONS | ||||||||||||||||||||||
| 4 | NONCONTROLLING INTERESTS HELD BY KKR HOLDINGS L.P. AND OTHER | ||||||||||||||||||||||
| 5 | EQUITY IMPACT OF KKR MANAGEMENT HOLDINGS CORP. | ||||||||||||||||||||||
| As of December 31, 2016 | |||||||||||||||||||||||
| (Amounts in thousands) | |||||||||||||||||||||||
| CONDENSED CONSOLIDATED STATEMENTS OF FINANCIAL CONDITION (GAAP BASIS) | 1 | 2 | 3 | 4 | 5 | TOTAL REPORTABLE SEGMENTS BALANCE SHEET | |||||||||||||||||
| Assets | |||||||||||||||||||||||
| Cash and Cash Equivalents | $ | 2,508,902 | — | — | 878,771 | — | — | $ | 3,387,673 | Cash and Short-term Investments | |||||||||||||
| Investments | 31,409,765 | (22,249,206 | ) | (987,994 | ) | (1,213,692 | ) | — | — | 6,958,873 | Investments | ||||||||||||
| — | — | 1,213,692 | — | — | 1,213,692 | Unrealized Carry | |||||||||||||||||
| Other Assets | 5,084,230 | (2,118,364 | ) | — | (1,039,996 | ) | — | (314,192 | ) | 1,611,678 | Other Assets | ||||||||||||
| — | — | 161,225 | — | — | 161,225 | Corporate Real Estate | |||||||||||||||||
| Total Assets | $ | 39,002,897 | (24,367,570 | ) | (987,994 | ) | — | — | (314,192 | ) | $ | 13,333,141 | |||||||||||
| Liabilities and Equity | |||||||||||||||||||||||
| Debt Obligations | $ | 18,544,075 | (16,145,515 | ) | — | (398,560 | ) | — | — | $ | 2,000,000 | Debt Obligations - KKR (ex-KFN) | |||||||||||
| — | — | 398,560 | — | — | 398,560 | Debt Obligations - KFN | |||||||||||||||||
| — | — | 373,750 | — | — | 373,750 | Preferred Shares - KFN | |||||||||||||||||
| Other Liabilities | 3,340,739 | (1,945,039 | ) | (987,994 | ) | — | — | (163,030 | ) | 244,676 | Other Liabilities | ||||||||||||
| Total Liabilities | 21,884,814 | (18,090,554 | ) | (987,994 | ) | 373,750 | — | (163,030 | ) | 3,016,986 | |||||||||||||
| Redeemable Noncontrolling Interests | 632,348 | (632,348 | ) | — | — | — | — | ||||||||||||||||
| Equity | |||||||||||||||||||||||
| Series A Preferred Units | 332,988 | — | — | (332,988 | ) | — | — | ||||||||||||||||
| Series B Preferred Units | 149,566 | — | — | (149,566 | ) | — | — | ||||||||||||||||
| KKR & Co. L.P. Capital - Common Unitholders | 5,457,279 | 118,635 | — | (17,446 | ) | 4,389,285 | (151,162 | ) | 9,796,591 | Book Value | |||||||||||||
| Noncontrolling Interests | 10,545,902 | (5,763,303 | ) | — | (373,750 | ) | (4,389,285 | ) | — | 19,564 | Noncontrolling Interests | ||||||||||||
| — | — | 500,000 | — | — | 500,000 | Preferred Units | |||||||||||||||||
| Total Liabilities and Equity | $ | 39,002,897 | (24,367,570 | ) | (987,994 | ) | — | — | (314,192 | ) | $ | 13,333,141 | |||||||||||
| 1 | IMPACT OF CONSOLIDATION OF INVESTMENT VEHICLES AND OTHER ENTITIES | ||||||||||||||||||||||
| 2 | CARRY POOL RECLASSIFICATION | ||||||||||||||||||||||
| 3 | OTHER RECLASSIFICATIONS | ||||||||||||||||||||||
| 4 | NONCONTROLLING INTERESTS HELD BY KKR HOLDINGS L.P. AND OTHER | ||||||||||||||||||||||
| 5 | EQUITY IMPACT OF KKR MANAGEMENT HOLDINGS CORP. | ||||||||||||||||||||||
| As of | As of | |||
| September 30, 2017 | December 31, 2016 | |||
| GAAP Common Units Outstanding - Basic | 473,134,387 | 452,380,335 | ||
| Adjustments: | ||||
Unvested Common Units (1) | 31,116,886 | 37,519,436 | ||
Other Exchangeable Securities (2) | 3,987,713 | 4,600,320 | ||
| GAAP Common Units Outstanding - Diluted | 508,238,986 | 494,500,091 | ||
| Adjustments: | ||||
KKR Holdings Units (3) | 339,845,707 | 353,757,398 | ||
| Adjusted Units | 848,084,693 | 848,257,489 | ||
| Adjustments: | ||||
| Unvested Common Units | (31,116,886 | ) | (37,519,436 | ) |
| Adjusted Units Eligible for Distribution | 816,967,807 | 810,738,053 | ||
| Adjustments: | ||||
Vested Other Exchangeable Securities (2) | (3,987,713 | ) | (4,600,320 | ) |
| Outstanding Adjusted Units | 812,980,094 | 806,137,733 | ||
Uncalled Commitments | |||
| Private Markets | ($ in thousands) | ||
| Americas Fund XII | $ | 975,000 | |
| Asian Fund III | 500,000 | ||
| Health Care Strategic Growth Fund | 150,000 | ||
| Real Estate Partners Americas II | 150,000 | ||
| Next Generation Technology Growth Fund | 97,100 | ||
| Energy Income and Growth | 86,400 | ||
| European Fund IV | 79,800 | ||
| Global Infrastructure Investors II | 74,200 | ||
| Real Estate Partners Europe | 58,300 | ||
| Real Estate Credit Opportunity Partners | 45,000 | ||
| Other Private Markets Vehicles | 332,500 | ||
| Total Private Markets Commitments | 2,548,300 | ||
| Public Markets | |||
| Special Situations Fund II | 173,700 | ||
| Lending Partners Europe | 26,700 | ||
| Lending Partners III | 24,700 | ||
| Other Public Markets Vehicles | 164,000 | ||
| Total Public Markets Commitments | 389,100 | ||
| Total Uncalled Commitments | $ | 2,937,400 | |
| Uncalled Commitments | |||||
| Private Equity | ($ in millions) | ||||
| Core Investment Vehicles | $ | 3,717 | |||
| European Fund VI | 750 | ||||
| Asian Fund IV | 393 | ||||
| North America Fund XIII | 389 | ||||
| Global Impact Fund II | 145 | ||||
| Health Care Strategic Growth Fund II | 137 | ||||
| Next Generation Technology Growth Fund II | 26 | ||||
| Other Private Equity Vehicles | 1,884 | ||||
| Total Private Equity Commitments | 7,441 | ||||
| Real Assets | |||||
| Asia Pacific Infrastructure Investors II | 357 | ||||
| Global Infrastructure Investors IV | 345 | ||||
| Asia Real Estate Partners | 176 | ||||
| Diversified Core Infrastructure Fund | 150 | ||||
| Asia Pacific Infrastructure Investors | 107 | ||||
| Real Estate Partners Americas III | 96 | ||||
| Real Estate Partners Europe II | 78 | ||||
| Real Estate Credit Opportunity Partners II | 20 | ||||
| Other Real Assets Vehicles | 391 | ||||
| Total Real Assets Commitments | 1,720 | ||||
| Credit and Liquid Strategies | |||||
| Asset-Based Finance Partners | 101 | ||||
| Asia Credit | 97 | ||||
| Dislocation Opportunities Fund | 96 | ||||
| Lending Partners Europe II | 13 | ||||
| Lending Partners III | 12 | ||||
| Other Credit and Liquid Strategies Vehicles | 1,184 | ||||
| Total Credit and Liquid Strategies Commitments | 1,503 | ||||
| Total Uncalled Commitments | $ | 10,664 | |||
| Payments due by Period | ||||||||||||||||||||
| Types of Contractual Obligations | <1 Year | 1-3 Years | 3-5 Years | >5 Years | Total | |||||||||||||||
| ($ in millions) | ||||||||||||||||||||
Uncalled commitments to investment funds (1) | $ | 2,937.4 | $ | — | $ | — | $ | — | $ | 2,937.4 | ||||||||||
Debt payment obligations (2) | — | 500.0 | — | 2,139.8 | 2,639.8 | |||||||||||||||
Interest obligations on debt (3) | 143.2 | 282.5 | 218.8 | 2,027.3 | 2,671.8 | |||||||||||||||
Underwriting commitments (4) | 137.3 | — | — | — | 137.3 | |||||||||||||||
Lending commitments (5) | 118.4 | — | — | — | 118.4 | |||||||||||||||
Purchase commitments (6) | 77.6 | 15.5 | 0.3 | — | 93.4 | |||||||||||||||
| Lease obligations | 51.7 | 95.0 | 31.9 | 17.0 | 195.6 | |||||||||||||||
Corporate real estate (7) | — | 292.5 | — | — | 292.5 | |||||||||||||||
| Total Contractual Obligations of KKR | 3,465.6 | 1,185.5 | 251.0 | 4,184.1 | 9,086.2 | |||||||||||||||
Plus: Uncalled commitments of consolidated funds (8) | 2,285.1 | — | — | — | 2,285.1 | |||||||||||||||
Plus: Debt payment obligations of consolidated funds and CFEs (9) | 740.7 | 1,475.2 | 606.4 | 14,101.2 | 16,923.5 | |||||||||||||||
Plus: Interest obligations of consolidated funds and CFEs (10) | 567.1 | 1,132.6 | 1,054.2 | 2,257.8 | 5,011.7 | |||||||||||||||
| Total Consolidated Contractual Obligations | $ | 7,058.5 | $ | 3,793.3 | $ | 1,911.6 | $ | 20,543.1 | $ | 33,306.5 | ||||||||||
| September 30, 2022 | ||||||||||||||
Hypothetical change(1) | ||||||||||||||
| +50 Basis points | -50 Basis points | |||||||||||||
| ($ in thousands) | ||||||||||||||
| Total estimated AOCI sensitivity (point in time) | $ | (1,126,584) | $ | 1,211,764 | ||||||||||
| Issuer Purchases of Common Units | |||||||||||||
| (amounts in thousands, except unit and per unit amounts) | |||||||||||||
| Total Number of Units Purchased | Average Price Paid Per Units | Cumulative Number of Units Purchased as Part of Publicly Announced Plans or Programs | Approximate Dollar Value of Units that May Yet Be Purchased Under the Plans or Programs | ||||||||||
Month #1 (July 1, 2017 to July 31, 2017) | — | $ | — | 31,674,162 | $ | 291,225 | |||||||
Month #2 (August 1, 2017 to August 31, 2017) | — | $ | — | 31,674,162 | $ | 291,225 | |||||||
Month #3 (September 1, 2017 to September 30, 2017) | — | $ | — | 31,674,162 | $ | 291,225 | |||||||
| Total through September 30, 2017 | — | ||||||||||||
| Purchases subsequent to September 30, 2017: | |||||||||||||
(October 1, 2017 to October 26, 2017) | — | $ | — | 31,674,162 | $ | 291,225 | |||||||
| Total through October 26, 2017 | — | ||||||||||||
| Issuer Purchases of Common Stock | |||||||||||||||||||||||
| (amounts in thousands, except share and per share amounts) | |||||||||||||||||||||||
| Total Number of Shares Purchased | Average Price Paid Per Share | Total Number of Shares Purchased as Part of Publicly Announced Plans or Programs | Approximate Dollar Value of Shares that May Yet Be Purchased Under the Plans or Programs (1) | ||||||||||||||||||||
| Month #1 (July 1, 2022 to July 31, 2022) | — | $ | — | — | $ | 108,475 | |||||||||||||||||
| Month #2 (August 1, 2022 to August 31, 2022) | — | $ | — | — | $ | 108,475 | |||||||||||||||||
| Month #3 (September 1, 2022 to September 30, 2022) | — | $ | — | — | $ | 108,475 | |||||||||||||||||
| Total through September 30, 2022 | — | ||||||||||||||||||||||
| (1) Amounts have been reduced by retirements of equity awards occurring after May 3, 2018. On May 6, 2020, KKR announced the increase to the total available amount under the repurchase program to $500 million. On December 27, 2021, KKR announced the increase to the total available amount under the repurchase program to $500 million. The repurchase program does not have an expiration date. | |||||||||||||||||||||||
| Exhibit No. | Description of Exhibit | |||||||
| 2.2 | ||||||||
| 3.1 | ||||||||
| 3.2 | ||||||||
| 10.1 | ||||||||
| 10.2† | ||||||||
| 31.1 | ||||||||
| 31.2 | ||||||||
| 31.3 | ||||||||
| 32.1 | ||||||||
| 32.2 | ||||||||
| 32.3 | ||||||||
| 101 | Interactive data files pursuant to Rule 405 of Regulation | |||||||
| 104 | Cover page interactive data file, formatted in Inline XBRL and contained in Exhibit 101. | |||||||
| KKR & CO. | |||||||||||
| /s/ ROBERT H. LEWIN | |||||||||||
| Robert H. Lewin | |||||||||||
| Chief Financial Officer | |||||||||||
| (principal financial and accounting | |||||||||||
| DATE: | November | ||||||||||