UNITED STATES
SECURITIES AND EXCHANGE COMMISSION
WASHINGTON, D.C. 20549
Form 10-Q
(Mark One)
|
| |
| x | QUARTERLY REPORT PURSUANT TO SECTION 13 OR 15(d) OF THE SECURITIES EXCHANGE ACT OF 1934 |
FOR THE QUARTERLY PERIOD ENDED SEPTEMBER 30, 20162017 OR
|
| |
| ¨ | TRANSITION REPORT PURSUANT TO SECTION 13 OR 15(d) OF THE SECURITIES EXCHANGE ACT OF 1934 |
FOR THE TRANSITION PERIOD FROM TO
Commission File Number: 001-35107
APOLLO GLOBAL MANAGEMENT, LLC
(Exact name of Registrant as specified in its charter)
|
| | |
| Delaware | | 20-8880053 |
| (State or other jurisdiction of incorporation or organization) | | (I.R.S. Employer Identification No.) |
9 West 57th Street, 43rd Floor
New York, New York 10019
(Address of principal executive offices) (Zip Code)
(212) 515-3200
(Registrant’s telephone number, including area code)
Indicate by check mark whether the Registrant (1) has filed all reports required to be filed by Section 13 or 15(d) of the Securities Exchange Act of 1934 during the preceding 12 months (or for such shorter period that the Registrant was required to file such reports), and (2) has been subject to such filing requirements for the past 90 days. Yes x No ¨
Indicate by check mark whether the registrant has submitted electronically and posted on its corporate Web site, if any, every Interactive Data File required to be submitted and posted pursuant to Rule 405 of Regulation S-T (§232.405 of this chapter) during the preceding 12 months (or for such shorter period that the registrant was required to submit and post such files). Yes x No ¨
Indicate by check mark whether the Registrant is a large accelerated filer, an accelerated filer, a non-accelerated filer or a smaller reporting company. See the definitions of “large accelerated filer”, “accelerated filer” and “smaller reporting company” in Rule 12b-2 of the Exchange Act.
|
| | | | | | |
| Large accelerated filer | | Tx | | Accelerated filer | | ¨ |
| Non-accelerated filer | | o (Do not check if a smaller reporting company) | | Smaller reporting company | | ¨ |
| | | | Emerging growth company | | ¨ |
| If an emerging growth company, indicate by check mark if the registrant has elected not to use the extended transition period for complying with any new or revised financial accounting standards provided pursuant to Section 13(a) of the Exchange Act. | | |
| ¨ |
Indicate by check mark whether the Registrant is a shell company (as defined in Rule 12b-2 of the Exchange Act). Yes ¨ No Tx
As of November 3, 20162, 2017 there were 185,479,663193,540,853 Class A shares and 1 Class B share outstanding.
|
| | |
| | TABLE OF CONTENTS | |
| | | Page |
| PART I | | |
| | | |
| ITEM 1. | | |
| | | |
| | | |
| | | |
| | | |
| | | |
| | | |
| | | |
| | | |
| | | |
| | | |
| | | |
| | | |
| | | |
| | | |
| | | |
| ITEM 1A. | | |
| | | |
| ITEM 2. | | |
| | | |
| ITEM 3. | | |
| | | |
| ITEM 4. | | |
| | | |
| PART II | | |
| | | |
| ITEM 1. | | |
| | | |
| ITEM 1A. | | |
| | | |
| ITEM 2. | | |
| | | |
| ITEM 3. | | |
| | | |
| ITEM 4. | | |
| | | |
| ITEM 5. | | |
| | | |
| ITEM 6. | | |
| | |
| |
Forward-Looking Statements
This quarterly report may contain forward-looking statements that are within the meaning of Section 27A of the Securities Act of 1933, as amended (the “Securities Act”), and Section 21E of the Securities Exchange Act of 1934, as amended (the “Exchange Act”). These statements include, but are not limited to, discussions related to Apollo’s expectations regarding the performance of its business, liquidity and capital resources and the other non-historical statements in the discussion and analysis. These forward-looking statements are based on management’s beliefs, as well as assumptions made by, and information currently available to, management. When used in this quarterly report, the words “believe,” “anticipate,” “estimate,” “expect,” “intend” and similar expressions are intended to identify forward-looking statements. Although management believes that the expectations reflected in these forward-looking statements are reasonable, it can give no assurance that these expectations will prove to have been correct. These statements are subject to certain risks, uncertainties and assumptions, including risks relating to our dependence on certain key personnel, our ability to raise new private equity, credit or real estateassets funds, market conditions generally, our ability to manage our growth, fund performance, changes in our regulatory environment and tax status, the variability of our revenues, net income and cash flow, our use of leverage to finance our businesses and investments by our funds and litigation risks, among others. We believe these factors include but are not limited to those described under the section entitled “Risk Factors” in the Company’s
Annual Report on Form 10-K filed with the United States Securities and Exchange Commission (the “SEC”) on February 29, 201613, 2017 (the “2015“2016 Annual Report”); as such factors may be updated from time to time in our periodic filings with the SEC, which are accessible on the SEC’s website at www.sec.gov. These factors should not be construed as exhaustive and should be read in conjunction with the other cautionary statements that are included in this quarterly report and in our other filings. We undertake no obligation to publicly update or review any forward-looking statements, whether as a result of new information, future developments or otherwise, except as required by applicable law.
Terms Used in This Report
In this quarterly report, references to “Apollo,” “we,” “us,” “our” and the “Company” refer collectively to Apollo Global Management, LLC, a Delaware limited liability company, and its subsidiaries, including the Apollo Operating Group and all of its subsidiaries, or as the context may otherwise require;
“AMH” refers to Apollo Management Holdings, L.P., a Delaware limited partnership, that is an indirect subsidiary of Apollo Global Management, LLC;
“Apollo funds”, “our funds” and references to the “funds” we manage, refer to the funds (including the parallel funds and alternative investment vehicles of such funds), partnerships, accounts, including strategic investment accounts or “SIAs,” alternative asset companies and other entities for which subsidiaries of the Apollo Operating Group provide investment management or advisory services;
“Apollo Operating Group” refers to (i) the limited partnerships through which our Managing Partners currently operate our businesses and (ii) one or more limited partnerships formed for the purpose of, among other activities, holding certain of our gains or losses on our principal investments in the funds, which we refer to as our “principal investments”;
“Assets Under Management”, or “AUM”, refers to the assets we manage or advise forof the funds, partnerships and accounts to which we provide investment management, advisory, or advisorycertain other investment-related services, including, without limitation, capital that such funds, partnerships and accounts have the right to call from investors pursuant to capital commitments. Our AUM equals the sum of:
| |
| (i) | the fair value of the investments of the private equity funds, partnerships and accounts we manage or advise plus the capital that such funds, partnerships and accounts are entitled to call from investors pursuant to capital commitments; |
| |
| (ii) | the net asset value, or “NAV,” of the credit funds, partnerships and accounts for which we provide investment management or advisory services, other than certain collateralized loan obligations (“CLOs”) and collateralized debt obligations (“CDOs”), which have a fee-generating basis other than the mark-to-market value of the underlying assets, plus used or available leverage and/or capital commitments; |
| |
| (iii) | the gross asset value or net asset value of the real estateassets funds, partnerships and accounts we manage, and the structured portfolio company investments of the funds, partnerships and accounts we manage or advise, which includes the leverage used by such structured portfolio company investments; |
| |
| (iv) | the incremental value associated with the reinsurance investments of the portfolio company assets we manage or advise; and |
| |
| (v) | the fair value of any other assets that we manage or advise for the funds, partnerships and accounts to which we provide investment management, advisory, or advisorycertain other investment-related services, plus unused credit facilities, including capital commitments to such funds, partnerships and accounts for investments that may require pre-qualification or other conditions before investment plus any other capital commitments to such funds, partnerships and accounts available for investment that are not otherwise included in the clauses above. |
Our AUM measure includes Assets Under Management for which we charge either nonominal or nominalzero fees. In addition ourOur AUM measure also includes certain assets for which we do not have investment discretion.discretion, including certain assets for which we earn only investment-related service fees, rather than management or advisory fees. Our definition of AUM is not based on any definition of Assets Under Management contained in our operating agreement or in any of our Apollo fund management agreements. We consider multiple factors for determining what should be included in our definition of AUM. Such factors include but are not limited to (1) our ability to influence the investment decisions for existing and available assets; (2) our ability to generate income from the underlying assets in our funds; and (3) the AUM measures that we use internally or believe are used by other investment managers. Given the differences in the investment strategies and structures among other alternative investment managers, our calculation of AUM may differ from the calculations employed by other investment managers and, as a result, this measure may not be directly comparable to similar measures presented by other investment managers. Our calculation also differs from the manner in which our related partiesaffiliates registered with the SEC report “Regulatory Assets Under Management” on Form ADV and Form PF in various ways;
“Fee-Generating AUM” consists of assets we manage or advise forof the funds, partnerships and accounts to which we provide investment management, advisory, or advisorycertain other investment-related services and on which we earn management fees, monitoring fees or other investment-related fees pursuant to management or other fee agreements on a basis that varies among the Apollo funds, partnerships and accounts we manage or advise.accounts. Management fees are normally based on “net asset value,” “gross assets,” “adjusted par asset value,” “adjusted cost of all unrealized portfolio investments,” “capital commitments,” “adjusted assets,” “stockholders’ equity,” “invested capital” or “capital contributions,” each as defined in the applicable management agreement. Monitoring fees, also referred to as advisory fees, with respect to the structured portfolio company investments of the funds, partnerships and accounts we manage or advise, are generally based on the total value of such structured portfolio company investments, which normally includes leverage, less any portion of such total value that is already considered in Fee-Generating AUM;
“Non-Fee-Generating AUM” refers to AUM that does not produce management fees or monitoring fees. This measure generally includes the following:
| |
| (i) | fair value above invested capital for those funds that earn management fees based on invested capital; |
| |
| (ii) | net asset values related to general partner and co-investment interests; |
| |
| (iii) | unused credit facilities; |
| |
| (iv) | available commitments on those funds that generate management fees on invested capital; |
| |
| (v) | structured portfolio company investments that do not generate monitoring fees; and |
| |
| (vi) | the difference between gross asset and net asset value for those funds that earn management fees based on net asset value. |
“Carry-Eligible AUM” refers to the AUM that may eventually produce carried interest income. All funds for which we are entitled to receive a carried interest income allocation are included in Carry-Eligible AUM, which consists of the following:
| |
| (i) | “Carry-Generating AUM”, which refers to invested capital of the funds, partnerships and accounts we manage, advise, or advise,to which we provide certain other investment-related services, that is currently above its hurdle rate or preferred return, and profit of such funds, partnerships and accounts is being allocated to the general partner in accordance with the applicable limited partnership agreements or other governing agreements; |
| |
| (ii) | “AUM Not Currently Generating Carry”, which refers to invested capital of the funds, partnerships and accounts we manage, advise, or adviseto which we provide certain other investment-related services, that is currently below its hurdle rate or preferred return; and |
| |
| (iii) | “Uninvested Carry-Eligible AUM”, which refers to capital of the funds, partnerships and accounts we manage, advise, or adviseto which we provide certain other investment-related services, that is available for investment or reinvestment subject to the provisions of applicable limited partnership agreements or other governing agreements, which capital is not currently part of the NAV or fair value of investments that may eventually produce carried interest income allocable to the general partner. |
“AUM with Future Management Fee Potential” refers to the committed uninvested capital portion of total AUM not
currently earning management fees. The amount depends on the specific terms and conditions of each fund;
We use AUM and capital deployed as a performance measure of our funds’ investment activities, as well as to monitor fund size in relation to professional resource and infrastructure needs. Non-Fee-Generating AUM includes assets on which we could earn carried interest income;
“Advisory” refers to certain assets advised by Apollo Asset Management Europe PC LLP, (“AAME”), a wholly-owned subsidiary of Apollo;Apollo Asset Management Europe LLP (collectively, “AAME”). The AAME entities are subsidiaries of Apollo. Until AAME receives full authorization by the UK Financial Conduct Authority (“FCA”), references to AAME in this report mean AAME and Apollo Management International LLP, an existing FCA authorized and regulated subsidiary of Apollo in the United Kingdom;
“capital deployed” or “deployment” is the aggregate amount of capital that has been invested during a given period (which may, in certain cases, include leverage) by (i) our drawdown funds, (ii) SIAs that have a defined maturity date and (iii) funds and SIAs in our real estateassets debt strategy;
“carried interest”, “carried interest income” and “incentive income” refer to interests granted to Apollo by an Apollo fund that entitle Apollo to receive allocations, distributions or fees which are based on the performance of such fund or its underlying investments;
“Contributing Partners” refer to those of our partners and their related parties (other than our Managing Partners) who indirectly beneficially own (through Holdings) Apollo Operating Group units;
“drawdown” refers tocommitment-based funds and certain SIAs in which investors make a commitment to provide capital at the formation of such funds and SIAs and deliver capital when called as investment opportunities become available. It includes assets of Athene Holding Ltd. (“Athene Holding”) and its subsidiaries (collectively “Athene”) managed by Athene Asset Management, L.P. (“Athene Asset Management” or “AAM”) that are invested in commitment-based funds;
“gross IRR” of a private equity fund represents the cumulative investment-related cash flows (i) for a given investment for the fund or funds which made such investment, and (ii) for a given fund, in the relevant fund itself (and not any one investor in the fund), in each case, on the basis of the actual timing of investment inflows and outflows (for unrealized investments assuming disposition on September 30, 20162017 or other date specified) aggregated on a gross basis quarterly, and the return is annualized and compounded before management fees, carried interest and certain other fund expenses (including interest incurred by the fund itself) and measures the returns on the fund’s investments as a whole without regard to whether all of the returns would, if distributed, be payable to the fund’s investors;investors. In addition, gross IRRs at the fund level will differ from those at the individual investor level as a result of, among other factors, timing of investor-level inflows and outflows. Gross IRR does not represent the return to any fund investor;
“gross IRR” of a credit fund represents the annualized return of a fund based on the actual timing of all cumulative fund cash flows before management fees, carried interest income allocated to the general partner and certain other fund expenses. Calculations may include certain investors that do not pay fees. The terminal value is the net asset value as of the reporting date. Non-U.S. dollar denominated (“USD”) fund cash flows and residual values are converted to USD using the spot rate as of the reporting date;date. In addition, gross IRRs at the fund level will differ from those at the individual investor level as a result of, among other factors, timing of investor-level inflows and outflows. Gross IRR does not represent the return to any fund investor;
“gross IRR” of a real estateassets fund represents the cumulative investment-related cash flows in the fund itself (and not any one investor in the fund), on the basis of the actual timing of cash inflows and outflows (for unrealized investments assuming disposition on September 30, 20162017 or other date specified) starting on the date that each investment closes, and the return is annualized and compounded before management fees, carried interest, and certain other fund expenses (including interest incurred by the fund itself) and measures the returns on the fund’s investments as a whole without regard to whether all of the returns would, if distributed, be payable to the fund’s investors. Non-USD fund cash flows and residual values are converted to USD using the spot rate as of the reporting date;date. In addition, gross IRRs at the fund level will differ from those at the individual investor level as a result of, among other factors, timing of investor-level inflows and outflows. Gross IRR does not represent the return to any fund investor;
“gross return” of a credit or real estateassets fund is the monthly or quarterly time-weighted return that is equal to the percentage change in the value of a fund’s portfolio, adjusted for all contributions and withdrawals (cash flows) before the effects of management fees, incentive fees allocated to the general partner, or other fees and expenses. Returns of Athene sub-advised portfolios and CLOs represent the gross returns on invested assets, which exclude cash. Returns over multiple periods are calculated by geometrically linking each period’s return over time;
“Holdings” means AP Professional Holdings, L.P., a Cayman Islands exempted limited partnership through which our Managing Partners and Contributing Partners indirectly beneficially own their interests in the Apollo Operating Group units;
“inflows” represents (i) at the individual segment level, subscriptions, commitments, and other increases in available capital, such as acquisitions or leverage, net of inter-segment transfers, and (ii) on an aggregate basis, the sum of inflows across the private equity, credit and real estateassets segments;
“liquid/performing” includes CLOs and other performing credit vehicles, hedge fund style credit funds, structured credit funds and SIAs, as well as sub-advised managed accounts owned by or related to Athene. Certain commitment-based SIAs are included as the underlying assets are liquid;
“Managing Partners” refer to Messrs. Leon Black, Joshua Harris and Marc Rowan collectively and, when used in reference to holdings of interests in Apollo or Holdings, includes certain related parties of such individuals;
“net IRR” of a private equity fund means the gross IRR applicable to a fund, including returns for related parties which may not pay fees or carried interest, net of management fees, certain fund expenses (including interest incurred or earned by the fund itself) and realized carried interest all offset to the extent of interest income, and measures returns at the fund level on amounts that, if distributed, would be paid to investors of the fund. To the extent that an Apollo private equitya fund exceeds all requirements detailed within the applicable fund agreement, the estimated unrealized value is adjusted such that a percentage of up to 20.0% of the unrealized gain is allocated to the general partner of thesuch fund, thereby reducing the balance attributable to fund investors. In addition, net IRR at the fund level will differ from that at the individual investor level as a result of, among other factors, timing of investor-level inflows and outflows. Net IRR does not represent the return to any fund investor;
“net IRR” of a credit fund represents the annualized return of a fund after management fees, carried interest income allocated to the general partner and certain other fund expenses, calculated on investors that pay such fees. The terminal value is the net asset value as of the reporting date. Non-USD fund cash flows and residual values are converted to USD using the spot rate as of the reporting date;date. In addition, net IRR at the fund level will differ from that at the individual investor level as a result of, among other factors, timing of investor-level inflows and outflows. Net IRR does not represent the return to any fund investor;
“net IRR” of a real estateassets fund represents the cumulative cash flows in the fund (and not any one investor in the fund), on the basis of the actual timing of cash inflows received from and outflows paid to investors of the fund (assuming the ending net asset value as of September 30, 20162017 or other date specified is paid to investors), excluding certain non-fee and non-carry bearing parties, and the return is annualized and compounded after management fees, carried interest, and certain other expenses (including interest incurred by the fund itself) and measures the returns to investors of the fund as a whole. Non-USD fund cash flows and residual values are converted to USD using the spot rate as of the reporting date;date. In addition, net IRR at the fund level will differ from that at the individual investor level as a result of, among other factors, timing of investor-level inflows and outflows. Net IRR does not represent the return to any fund investor;
“net return” of a credit or real estateassets fund represents the gross return after management fees, incentive fees allocated to the general partner, or other fees and expenses. Returns of Athene sub-advised portfolios and CLOs represent the gross or net returns on invested assets, which exclude cash. Returns over multiple periods are calculated by geometrically linking each period’s return over time;
“our manager” means AGM Management, LLC, a Delaware limited liability company that is controlled by our Managing Partners;
“permanent capital vehicles” refers to (a) assets that are owned by or related to Athene (“ATH”) or AGER Bermuda Holding Ltd. (“AGER”), (b) assets that are owned by or related to MidCap FinCo LimitedDesignated Activity Company (“MidCap”) and managed by Apollo, Capital Management, L.P., (c) assets of publicly traded vehicles managed by Apollo such as Apollo Investment Corporation (“AINV”), Apollo Commercial Real Estate Finance, Inc. (“ARI”), Apollo Tactical Income Fund Inc. (“AIF”), and Apollo Senior Floating Rate Fund Inc. (“AFT”), in each case that do not have redemption provisions or a requirement to return capital to investors upon exiting the investments made with such capital, except as required by applicable law and (d) a non-traded business development company sub-advised by Apollo.from which Apollo earns certain investment-related service fees. The investment management arrangementsagreements of AINV, AIF and AFT have one year terms, are reviewed annually and remain in effect only if approved by the boards of directors of such companies or by the affirmative vote of the holders of a majority of the outstanding voting shares of such companies, including in either case, approval by a majority of the directors who are not “interested persons” as defined in the Investment Company Act of 1940. In
addition, the investment management arrangementsagreements of AINV, AIF and AFT may be terminated in certain circumstances upon 60 days’ written notice. The investment management arrangementagreement of ARI has a one year term and is reviewed annually by ARI’s board of directors and may be terminated under certain circumstances by an affirmative vote of at least two-thirds of ARI’s independent directors. The investment management or advisory arrangements between MidCap and Apollo Capital Management, L.P. and Athene and Athene Asset Management,Apollo, may also be terminated under certain circumstances. The agreement pursuant to which Apollo earns certain investment-related service fees from a non-traded business development company may be terminated under certain limited circumstances;
“private equity fund appreciation (depreciation)” refers to gain (loss) and income for the traditional private equity funds (as defined below), Apollo Natural Resources Partners, L.P. (“ANRP I”), Apollo Natural Resources Partners II, L.P. (“ANRP II”), Apollo Special Situations Fund, L.P. and AION Capital Partners Limited (“AION”) for the periods presented on a total return basis before giving effect to fees and expenses. The performance percentage is determined by dividing (a) the change in the fair value of investments over the period presented, minus the change in invested capital over the period presented, plus the realized value for the period presented, by (b) the beginning unrealized value for the period presented plus the change in invested capital for the period presented. Returns over multiple periods are calculated by geometrically linking each period’s return over time;
“private equity investments” refer to (i) direct or indirect investments in existing and future private equity funds managed or sponsored by Apollo, (ii) direct or indirect co-investments with existing and future private equity funds managed or sponsored by Apollo, (iii) direct or indirect investments in securities which are not immediately capable of resale in a public market that Apollo identifies but does not pursue through its private equity funds, and (iv) investments of the type described in (i) through (iii) above made by Apollo funds;
“Realized Value” refers to all cash investment proceeds received by the relevant Apollo fund, including interest and dividends, but does not give effect to management fees, expenses, incentive compensation or carried interest to be paid by such Apollo fund;
“Remaining Cost” represents the initial investment of the general partner and limited partner investorsfund in a fund,portfolio investment, reduced for any return of capital distributed to date excluding management fees, expenses, and any accrued preferred return;on such portfolio investment;
“Strategic Investors” referInvestor” refers to the California Public Employees’ Retirement System, or “CalPERS,” and an affiliate of the Abu Dhabi Investment Authority, or “ADIA”“CalPERS”;
“Total Invested Capital” refers to the aggregate cash invested by the relevant Apollo fund and includes capitalized costs relating to investment activities, if any, but does not give effect to cash pending investment or available for reserves;
“Total Value” represents the sum of the total Realized Value and Unrealized Value of investments;
“traditional private equity funds” refers to Apollo Investment Fund I, L.P. (“Fund I”), AIF II, L.P. (“Fund II”), a mirrored investment account established to mirror Fund I and Fund II for investments in debt securities (“MIA”), Apollo Investment Fund III, L.P. (together with its parallel funds, “Fund III”), Apollo Investment Fund IV, L.P. (together with its parallel funds,fund, “Fund IV”), Apollo Investment Fund V, L.P. (together with its parallel funds and alternative investment vehicles, “Fund V”), Apollo Investment Fund VI, L.P. (together with its parallel funds and alternative investment vehicles, “Fund VI”), Apollo Investment Fund VII, L.P. (together with its parallel funds and alternative investment vehicles, “Fund VII”) and, Apollo Investment Fund VIII, L.P. (together with its parallel funds and alternative investment vehicles, “Fund VIII”) and Apollo Investment Fund IX, L.P. (together with its parallel funds and alternative investment vehicles, “Fund IX”);
“Unrealized Value” refers to the fair value consistent with valuations determined in accordance with generally accepted accounting principles in the United States of America (“U.S. GAAP”), for investments not yet realized and may include pay in kind, accrued interest and dividends receivable, if any. In addition, amounts include committed and funded amounts for certain investments; and
“Vintage Year” refers to the year in which a fund’s final capital raise has occurred.occurred, or, for certain funds, the year in which a fund’s investment period commences as per its governing agreements.
PART I—FINANCIAL INFORMATION
ITEM 1. FINANCIAL STATEMENTS
APOLLO GLOBAL MANAGEMENT, LLC
CONDENSED CONSOLIDATED STATEMENTS OF FINANCIAL CONDITION (UNAUDITED)
AS OF SEPTEMBER 30, 20162017 AND DECEMBER 31, 20152016
(dollars in thousands, except share data) | | | | As of
September 30, 2016 | | As of
December 31, 2015 | As of
September 30, 2017 | | As of
December 31, 2016 |
| Assets: | | | | | | |
| Cash and cash equivalents | $ | 926,932 |
| | $ | 612,505 |
| $ | 930,848 |
| | $ | 806,329 |
|
| Cash and cash equivalents held at consolidated funds | 6,014 |
| | 4,817 |
| 10,195 |
| | 7,335 |
|
| Restricted cash | 4,776 |
| | 5,700 |
| 4,165 |
| | 4,680 |
|
| U.S. Treasury securities, at fair value | | 198,900 |
| | — |
|
| Investments | 1,390,998 |
| | 1,154,749 |
| 1,708,064 |
| | 1,494,744 |
|
| Assets of consolidated variable interest entities: | | | | | | |
| Cash and cash equivalents | 53,489 |
| | 56,793 |
| 44,226 |
| | 41,318 |
|
| Investments, at fair value | 946,534 |
| | 910,566 |
| 1,170,550 |
| | 913,827 |
|
| Other assets | 49,733 |
| | 63,413 |
| 63,723 |
| | 46,666 |
|
| Carried interest receivable | 991,815 |
| | 643,907 |
| 1,577,984 |
| | 1,257,105 |
|
| Due from related parties | 297,719 |
| | 247,835 |
| 287,352 |
| | 254,853 |
|
| Deferred tax assets | 596,228 |
| | 646,207 |
| 591,754 |
| | 572,263 |
|
| Other assets | 112,432 |
| | 95,844 |
| 164,588 |
| | 118,860 |
|
| Goodwill | 88,852 |
| | 88,852 |
| 88,852 |
| | 88,852 |
|
| Intangible assets, net | 24,693 |
| | 28,620 |
| 19,153 |
| | 22,721 |
|
| Total Assets | $ | 5,490,215 |
| | $ | 4,559,808 |
| $ | 6,860,354 |
| | $ | 5,629,553 |
|
| Liabilities and Shareholders’ Equity | | | | | | |
| Liabilities: | | | | | | |
| Accounts payable and accrued expenses | $ | 116,277 |
| | $ | 92,012 |
| $ | 79,062 |
| | $ | 57,465 |
|
| Accrued compensation and benefits | 122,143 |
| | 54,836 |
| 144,664 |
| | 52,754 |
|
| Deferred revenue | 204,516 |
| | 177,875 |
| 155,081 |
| | 174,893 |
|
| Due to related parties | 661,515 |
| | 594,536 |
| 643,401 |
| | 638,126 |
|
| Profit sharing payable | 466,055 |
| | 295,674 |
| 710,873 |
| | 550,148 |
|
| Debt | 1,355,994 |
| | 1,025,255 |
| 1,361,044 |
| | 1,352,447 |
|
| Liabilities of consolidated variable interest entities: | | | | | | |
| Debt, at fair value | 838,704 |
| | 801,270 |
| 972,632 |
| | 786,545 |
|
| Other liabilities | 54,801 |
| | 85,982 |
| 85,403 |
| | 68,034 |
|
| Other liabilities | 59,345 |
| | 43,387 |
| 116,211 |
| | 81,613 |
|
| Total Liabilities | 3,879,350 |
| | 3,170,827 |
| 4,268,371 |
| | 3,762,025 |
|
| Commitments and Contingencies (see note 13) |
|
| |
|
| |
| Commitments and Contingencies (see note 14) | |
|
| |
|
|
| Shareholders’ Equity: | | | | | | |
| Apollo Global Management, LLC shareholders’ equity: | | | | | | |
Class A shares, no par value, unlimited shares authorized, 184,743,799 and 181,078,937 shares issued and outstanding at September 30, 2016 and December 31, 2015, respectively | — |
| | — |
| |
| Class B shares, no par value, unlimited shares authorized, 1 share issued and outstanding at September 30, 2016 and December 31, 2015 | — |
| | — |
| |
| Preferred shares (11,000,000 and 0 shares issued and outstanding as of September 30, 2017 and December 31, 2016, respectively) | | 264,398 |
| | — |
|
| Class A shares, no par value, unlimited shares authorized, 193,540,853 and 185,460,294 shares issued and outstanding at September 30, 2017 and December 31, 2016, respectively | | — |
| | — |
|
| Class B shares, no par value, unlimited shares authorized, 1 share issued and outstanding at September 30, 2017 and December 31, 2016 | | — |
| | — |
|
| Additional paid in capital | 1,876,342 |
| | 2,005,509 |
| 1,627,767 |
| | 1,830,025 |
|
| Accumulated deficit | (1,147,798 | ) | | (1,348,384 | ) | (560,613 | ) | | (986,186 | ) |
| Accumulated other comprehensive loss | (5,450 | ) | | (7,620 | ) | (2,061 | ) | | (8,723 | ) |
| Total Apollo Global Management, LLC shareholders’ equity | 723,094 |
| | 649,505 |
| 1,329,491 |
| | 835,116 |
|
| Non-Controlling Interests in consolidated entities | 94,500 |
| | 86,561 |
| 149,736 |
| | 90,063 |
|
| Non-Controlling Interests in Apollo Operating Group | 793,271 |
| | 652,915 |
| 1,112,756 |
| | 942,349 |
|
| Total Shareholders’ Equity | 1,610,865 |
| | 1,388,981 |
| 2,591,983 |
| | 1,867,528 |
|
| Total Liabilities and Shareholders’ Equity | $ | 5,490,215 |
| | $ | 4,559,808 |
| $ | 6,860,354 |
| | $ | 5,629,553 |
|
See accompanying notes to condensed consolidated financial statements.
APOLLO GLOBAL MANAGEMENT, LLC
CONDENSED CONSOLIDATED STATEMENTS OF OPERATIONS (UNAUDITED)
FOR THE THREE AND NINE MONTHS ENDED SEPTEMBER 30, 20162017 AND 20152016
(dollars in thousands, except share data)
| | | | For the Three Months Ended
September 30, | | For the Nine Months Ended
September 30, | For the Three Months Ended
September 30, | | For the Nine Months Ended
September 30, |
| | 2016 | | 2015 | | 2016 | | 2015 | 2017 | | 2016 | | 2017 | | 2016 |
| Revenues: | | | | | | | | | | | | | | |
| Management fees from related parties | | $ | 301,443 |
| | $ | 274,313 |
| | $ | 852,291 |
| | $ | 775,171 |
|
| Advisory and transaction fees from related parties, net | $ | 29,801 |
| | $ | 9,276 |
| | $ | 102,699 |
| | $ | 34,269 |
| 16,209 |
| | 29,801 |
| | 54,905 |
| | 102,699 |
|
| Management fees from related parties | 274,313 |
| | 238,563 |
| | 775,171 |
| | 694,036 |
| |
| Carried interest income (loss) from related parties | 199,617 |
| | (54,571 | ) | | 407,134 |
| | 119,714 |
| |
| Carried interest income from related parties | | 346,580 |
| | 199,617 |
| | 833,459 |
| | 407,134 |
|
| Total Revenues | 503,731 |
| | 193,268 |
| | 1,285,004 |
| | 848,019 |
| 664,232 |
| | 503,731 |
| | 1,740,655 |
| | 1,285,004 |
|
| Expenses: | | | | | | | | | | | | | | |
| Compensation and benefits: | | | | | | | | | | | | | | |
| Salary, bonus and benefits | 92,591 |
| | 93,514 |
| | 290,013 |
| | 270,017 |
| 108,853 |
| | 92,591 |
| | 316,011 |
| | 290,013 |
|
| Equity-based compensation | 26,163 |
| | 31,404 |
| | 74,203 |
| | 73,786 |
| 24,485 |
| | 26,163 |
| | 70,332 |
| | 74,203 |
|
| Profit sharing expense | 90,152 |
| | (20,329 | ) | | 179,767 |
| | 89,935 |
| 137,296 |
| | 90,152 |
| | 339,679 |
| | 179,767 |
|
| Total Compensation and Benefits | 208,906 |
| | 104,589 |
| | 543,983 |
| | 433,738 |
| 270,634 |
| | 208,906 |
| | 726,022 |
| | 543,983 |
|
| Interest expense | 12,832 |
| | 7,529 |
| | 30,505 |
| | 22,454 |
| 13,303 |
| | 12,832 |
| | 39,497 |
| | 30,505 |
|
| General, administrative and other | 32,403 |
| | 21,645 |
| | 92,970 |
| | 65,972 |
| 68,149 |
| | 58,566 |
| | 189,918 |
| | 187,285 |
|
| Professional fees | 11,816 |
| | 17,218 |
| | 50,955 |
| | 51,907 |
| |
| Occupancy | 9,701 |
| | 10,137 |
| | 29,221 |
| | 30,226 |
| |
| Placement fees | 1,953 |
| | 2,617 |
| | 5,781 |
| | 5,802 |
| 5,397 |
| | 1,953 |
| | 12,560 |
| | 5,781 |
|
| Depreciation and amortization | 4,646 |
| | 11,176 |
| | 14,139 |
| | 33,347 |
| |
| Total Expenses | 282,257 |
| | 174,911 |
| | 767,554 |
| | 643,446 |
| 357,483 |
| | 282,257 |
| | 967,997 |
| | 767,554 |
|
| Other Income: | | | | | | | | | | | | | | |
| Net gains from investment activities | 17,746 |
| | 80,950 |
| | 50,287 |
| | 107,492 |
| 68,932 |
| | 17,746 |
| | 102,936 |
| | 50,287 |
|
| Net gains from investment activities of consolidated variable interest entities | 800 |
| | 911 |
| | 2,817 |
| | 8,039 |
| 845 |
| | 800 |
| | 11,085 |
| | 2,817 |
|
| Income from equity method investments | 23,213 |
| | 2,021 |
| | 64,356 |
| | 18,079 |
| 47,488 |
| | 23,213 |
| | 102,877 |
| | 64,356 |
|
| Interest income | 1,192 |
| | 818 |
| | 3,073 |
| | 2,403 |
| 1,504 |
| | 1,192 |
| | 2,929 |
| | 3,073 |
|
| Other income (loss), net | (40 | ) | | 93 |
| | 485 |
| | 6,742 |
| 25,387 |
| | (40 | ) | | 44,776 |
| | 485 |
|
| Total Other Income | 42,911 |
| | 84,793 |
| | 121,018 |
| | 142,755 |
| 144,156 |
| | 42,911 |
| | 264,603 |
| | 121,018 |
|
| Income before income tax provision | 264,385 |
| | 103,150 |
| | 638,468 |
| | 347,328 |
| 450,905 |
| | 264,385 |
| | 1,037,261 |
| | 638,468 |
|
| Income tax provision | (29,667 | ) | | (6,591 | ) | | (62,508 | ) | | (21,197 | ) | (16,542 | ) | | (29,667 | ) | | (54,926 | ) | | (62,508 | ) |
| Net Income | 234,718 |
| | 96,559 |
| | 575,960 |
| | 326,131 |
| 434,363 |
| | 234,718 |
| | 982,335 |
| | 575,960 |
|
| Net income attributable to Non-Controlling Interests | (140,099 | ) | | (55,508 | ) | | (340,077 | ) | | (197,725 | ) | (231,411 | ) | | (140,099 | ) | | (542,507 | ) | | (340,077 | ) |
| Net Income Attributable to Apollo Global Management, LLC | $ | 94,619 |
| | $ | 41,051 |
| | $ | 235,883 |
| | $ | 128,406 |
| 202,952 |
| | 94,619 |
| | 439,828 |
| | 235,883 |
|
| Net income attributable to Preferred Shareholders | | (4,383 | ) | | — |
| | (9,155 | ) | | — |
|
| Net Income Attributable to Apollo Global Management, LLC Class A Shareholders | | $ | 198,569 |
| | $ | 94,619 |
| | $ | 430,673 |
| | $ | 235,883 |
|
| Distributions Declared per Class A Share | $ | 0.37 |
| | $ | 0.42 |
| | $ | 0.90 |
| | $ | 1.61 |
| $ | 0.52 |
| | $ | 0.37 |
| | $ | 1.46 |
| | $ | 0.90 |
|
| Net Income Per Class A Share: | | | | | | | | | | | | | | |
| Net Income Available to Class A Share – Basic | $ | 0.50 |
| | $ | 0.20 |
| | $ | 1.24 |
| | $ | 0.60 |
| $ | 1.00 |
| | $ | 0.50 |
| | $ | 2.19 |
| | $ | 1.24 |
|
| Net Income Available to Class A Share – Diluted | $ | 0.50 |
| | $ | 0.20 |
| | $ | 1.24 |
| | $ | 0.60 |
| $ | 1.00 |
| | $ | 0.50 |
| | $ | 2.19 |
| | $ | 1.24 |
|
| Weighted Average Number of Class A Shares Outstanding – Basic | 184,438,515 |
| | 176,169,986 |
| | 183,602,982 |
| | 170,879,302 |
| 192,882,082 |
| | 184,438,515 |
| | 190,014,240 |
| | 183,602,982 |
|
| Weighted Average Number of Class A Shares Outstanding – Diluted | 184,438,515 |
| | 176,169,986 |
| | 183,602,982 |
| | 170,879,302 |
| 192,882,082 |
| | 184,438,515 |
| | 190,014,240 |
| | 183,602,982 |
|
See accompanying notes to condensed consolidated financial statements.
APOLLO GLOBAL MANAGEMENT, LLC
CONDENSED CONSOLIDATED STATEMENTS OF
COMPREHENSIVE INCOME (UNAUDITED)
FOR THE THREE AND NINE MONTHS ENDED SEPTEMBER 30, 20162017 AND 20152016
(dollars in thousands, except share data)
| | | | For the Three Months Ended
September 30, | | For the Nine Months Ended
September 30, | For the Three Months Ended
September 30, | | For the Nine Months Ended
September 30, |
| | 2016 | | 2015 | | 2016 | | 2015 | 2017 | | 2016 | | 2017 | | 2016 |
| Net Income | $ | 234,718 |
| | $ | 96,559 |
| | $ | 575,960 |
| | $ | 326,131 |
| $ | 434,363 |
| | $ | 234,718 |
| | $ | 982,335 |
| | $ | 575,960 |
|
| Other Comprehensive Income, net of tax: | | | | | | | | | | | | | | |
| Allocation of currency translation adjustment of consolidated CLOs and funds (net of taxes of $0.1 million and $0.1 million for Apollo Global Management, LLC for the three months ended September 30, 2016 and 2015, respectively, and $0.3 million and $0.7 million for Apollo Global Management, LLC for the nine months ended September 30, 2016 and 2015, respectively, and $0.0 million for Non-Controlling Interests in Apollo Operating Group for the three and nine months ended September 30, 2016 and 2015) | 1,144 |
| | 386 |
| | 3,103 |
| | (10,505 | ) | |
| Net gain from change in fair value of cash flow hedge instruments | 26 |
| | 26 |
| | 79 |
| | 78 |
| |
| Net income (loss) on available-for-sale securities | 900 |
| | (572 | ) | | 450 |
| | (786 | ) | |
| Total Other Comprehensive Income (Loss), net of tax | 2,070 |
| | (160 | ) | | 3,632 |
| | (11,213 | ) | |
| Currency translation adjustments, net of tax | | 5,643 |
| | 1,144 |
| | 14,583 |
| | 3,103 |
|
| Net gain from change in fair value of cash flow hedge instruments, net of tax | | 27 |
| | 26 |
| | 78 |
| | 79 |
|
| Net income on available-for-sale securities | | 290 |
| | 900 |
| | 189 |
| | 450 |
|
| Total Other Comprehensive Income, net of tax | | 5,960 |
| | 2,070 |
| | 14,850 |
| | 3,632 |
|
| Comprehensive Income | 236,788 |
| | 96,399 |
| | 579,592 |
| | 314,918 |
| 440,323 |
| | 236,788 |
| | 997,185 |
| | 579,592 |
|
| Comprehensive Income attributable to Non-Controlling Interests | (140,644 | ) | | (58,241 | ) | | (341,539 | ) | | (192,153 | ) | (236,410 | ) | | (140,644 | ) | | (550,695 | ) | | (341,539 | ) |
| Comprehensive Income Attributable to Apollo Global Management, LLC | $ | 96,144 |
| | $ | 38,158 |
| | $ | 238,053 |
| | $ | 122,765 |
| $ | 203,913 |
| | $ | 96,144 |
| | $ | 446,490 |
| | $ | 238,053 |
|
See accompanying notes to condensed consolidated financial statements.
APOLLO GLOBAL MANAGEMENT, LLC
CONDENSED CONSOLIDATED STATEMENTS OF CHANGES
IN SHAREHOLDERS’ EQUITY (UNAUDITED)
FOR THE NINE MONTHS ENDED SEPTEMBER 30, 20162017 AND 20152016
(dollars in thousands, except share data)
| | | | Apollo Global Management, LLC Shareholders | | | | | | | | | Apollo Global Management, LLC Shareholders | | | | | | | | |
| | Class A Shares | | Class B Shares | | Additional Paid in Capital | | Accumulated Deficit | | Appropriated Partners’ Capital | | Accumulated Other Comprehensive Loss | | Total Apollo Global Management, LLC Shareholders’ Equity | | Non- Controlling Interests in Consolidated Entities | | Non- Controlling Interests in Apollo Operating Group | | Total Shareholders’ Equity | Class A Shares | | Class B Shares | | Preferred Shares | | Additional Paid in Capital | | Accumulated Deficit | | Accumulated Other Comprehensive Loss | | Total Apollo Global Management, LLC Shareholders’ Equity | | Non-Controlling Interests in Consolidated Entities | | Non-Controlling Interests in Apollo Operating Group | | Total Shareholders’ Equity |
| Balance at January 1, 2015 | 163,046,554 |
| | 1 |
| | $ | 2,254,283 |
| | $ | (1,400,661 | ) | | $ | 933,166 |
| | $ | (306 | ) | | $ | 1,786,482 |
| | $ | 3,222,195 |
| | $ | 934,784 |
| | $ | 5,943,461 |
| |
| Cumulative effect adjustment from adoption of accounting guidance | — |
| | — |
| | 1,771 |
| | (3,350 | ) | | (933,166 | ) | | — |
| | (934,745 | ) | | (3,134,518 | ) | | — |
| | (4,069,263 | ) | |
| Dilution impact of issuance of Class A shares | — |
| | — |
| | 1,862 |
| | — |
| | — |
| | — |
| | 1,862 |
| | — |
| | — |
| | 1,862 |
| |
| Capital increase related to equity-based compensation | — |
| | — |
| | 49,952 |
| | — |
| | — |
| | — |
| | 49,952 |
| | — |
| | — |
| | 49,952 |
| |
| Capital contributions | — |
| | — |
| | — |
| | — |
| | — |
| | — |
| | — |
| | 5,671 |
| | — |
| | 5,671 |
| |
| Distributions | — |
| | — |
| | (301,368 | ) | | — |
| | — |
| | — |
| | (301,368 | ) | | (16,163 | ) | | (377,663 | ) | | (695,194 | ) | |
| Payments related to deliveries of Class A shares for RSUs and restricted shares | 9,478,427 |
| | — |
| | 4,921 |
| | (53,019 | ) | | — |
| | — |
| | (48,098 | ) | | — |
| | — |
| | (48,098 | ) | |
| Exchange of AOG Units for Class A shares | 6,483,121 |
| | — |
| | 39,260 |
| | — |
| | — |
| | — |
| | 39,260 |
| | — |
| | (23,146 | ) | | 16,114 |
| |
| Net income | — |
| | — |
| | — |
| | 128,406 |
| | — |
| | — |
| | 128,406 |
| | 11,218 |
| | 186,507 |
| | 326,131 |
| |
| Allocation of currency translation adjustment of consolidated CLOs and fund entities | — |
| | — |
| | — |
| | — |
| | — |
| | (4,889 | ) | | (4,889 | ) | | (5,616 | ) | | — |
| | (10,505 | ) | |
| Net gain from change in fair value of cash flow hedge instruments | — |
| | — |
| | — |
| | — |
| | — |
| | 34 |
| | 34 |
| | — |
| | 44 |
| | 78 |
| |
| Net loss on available-for-sale securities | — |
| | — |
| | — |
| | — |
| | — |
| | (786 | ) | | (786 | ) | | — |
| | — |
| | (786 | ) | |
| Balance at September 30, 2015 | 179,008,102 |
| | 1 |
| | $ | 2,050,681 |
| | $ | (1,328,624 | ) | | $ | — |
| | $ | (5,947 | ) | | $ | 716,110 |
| | $ | 82,787 |
| | $ | 720,526 |
| | $ | 1,519,423 |
| |
| Balance at January 1, 2016 | 181,078,937 |
| | 1 |
| | $ | 2,005,509 |
| | $ | (1,348,384 | ) | | $ | — |
| | $ | (7,620 | ) | | $ | 649,505 |
| | $ | 86,561 |
| | $ | 652,915 |
| | $ | 1,388,981 |
| 181,078,937 |
| | 1 |
| | $ | — |
| | $ | 2,005,509 |
| | $ | (1,348,384 | ) | | $ | (7,620 | ) | | $ | 649,505 |
| | $ | 86,561 |
| | $ | 652,915 |
| | $ | 1,388,981 |
|
| Dilution impact of issuance of Class A shares | — |
| | — |
| | 340 |
| | — |
| | — |
| | — |
| | 340 |
| | — |
| | — |
| | 340 |
| — |
| | — |
| | — |
| | 340 |
| | — |
| | — |
| | 340 |
| | — |
| | — |
| | 340 |
|
| Capital increase related to equity-based compensation | — |
| | — |
| | 53,910 |
| | — |
| | — |
| | — |
| | 53,910 |
| | — |
| | — |
| | 53,910 |
| — |
| | — |
| | — |
| | 53,910 |
| | — |
| | — |
| | 53,910 |
| | — |
| | — |
| | 53,910 |
|
| Capital contributions | — |
| | — |
| | — |
| | — |
| | — |
| | — |
| | — |
| | 12,933 |
| | — |
| | 12,933 |
| — |
| | — |
| | — |
| | — |
| | — |
| | — |
| | — |
| | 12,933 |
| | — |
| | 12,933 |
|
| Distributions | — |
| | — |
| | (172,095 | ) | | — |
| | — |
| | — |
| | (172,095 | ) | | (10,555 | ) | | (194,371 | ) | | (377,021 | ) | — |
| | — |
| | — |
| | (172,095 | ) | | — |
| | — |
| | (172,095 | ) | | (10,555 | ) | | (194,371 | ) | | (377,021 | ) |
| Payments related to deliveries of Class A shares for RSUs and restricted shares | 4,245,086 |
| | — |
| | 41 |
| | (35,297 | ) | | — |
| | — |
| | (35,256 | ) | | — |
| | — |
| | (35,256 | ) | |
| Payments related to issuances of Class A shares for equity-based awards | | 4,245,086 |
| | — |
| | — |
| | 41 |
| | (35,297 | ) | | — |
| | (35,256 | ) | | — |
| | — |
| | (35,256 | ) |
| Repurchase of Class A Shares | | (954,447 | ) | | — |
| | — |
| | (12,902 | ) | | — |
| | — |
| | (12,902 | ) | | — |
| | — |
| | (12,902 | ) |
| Exchange of AOG Units for Class A shares | | 374,223 |
| | — |
| | — |
| | 1,539 |
| | — |
| | — |
| | 1,539 |
| | — |
| | (1,251 | ) | | 288 |
|
| Net income | | — |
| | — |
| | — |
| | — |
| | 235,883 |
| | — |
| | 235,883 |
| | 3,891 |
| | 336,186 |
| | 575,960 |
|
| Currency translation adjustments, net of tax | | — |
| | — |
| | — |
| | — |
| | — |
| | 1,683 |
| | 1,683 |
| | 1,670 |
| | (250 | ) | | 3,103 |
|
| Net gain from change in fair value of cash flow hedge instruments | | — |
| | — |
| | — |
| | — |
| | — |
| | 37 |
| | 37 |
| | — |
| | 42 |
| | 79 |
|
| Net loss on available-for-sale securities | | — |
| | — |
| | — |
| | — |
| | — |
| | 450 |
| | 450 |
| | — |
| | — |
| | 450 |
|
| Balance at September 30, 2016 | | 184,743,799 |
| | 1 |
| | $ | — |
| | $ | 1,876,342 |
| | $ | (1,147,798 | ) | | $ | (5,450 | ) | | $ | 723,094 |
| | $ | 94,500 |
| | $ | 793,271 |
| | $ | 1,610,865 |
|
| Balance at January 1, 2017 | | 185,460,294 |
| | 1 |
| | $ | — |
| | $ | 1,830,025 |
| | $ | (986,186 | ) | | $ | (8,723 | ) | | $ | 835,116 |
| | $ | 90,063 |
| | $ | 942,349 |
| | $ | 1,867,528 |
|
| Adoption of new accounting guidance | | — |
| | — |
| | — |
| | — |
| | 22,901 |
| | — |
| | 22,901 |
| | — |
| | — |
| | 22,901 |
|
| Dilution impact of issuance of Class A shares | | — |
| | — |
| | — |
| | (295 | ) | | — |
| | — |
| | (295 | ) | | — |
| | — |
| | (295 | ) |
| Equity issued in connection with Preferred shares offering | | — |
| | — |
| | 264,398 |
| | — |
| | — |
| | — |
| | 264,398 |
| | — |
| | — |
| | 264,398 |
|
| Capital increase related to equity-based compensation | | — |
| | — |
| | — |
| | 52,442 |
| | — |
| | — |
| | 52,442 |
| | — |
| | — |
| | 52,442 |
|
| Capital contributions | | — |
| | — |
| | — |
| | — |
| | — |
| | — |
| | — |
| | 43,758 |
| | — |
| | 43,758 |
|
| Distributions | | — |
| | — |
| | (9,155 | ) | | (288,726 | ) | | — |
| | — |
| | (297,881 | ) | | (4,570 | ) | | (329,172 | ) | | (631,623 | ) |
| Payments related to issuances of Class A shares for equity-based awards | | 2,096,389 |
| | — |
| | — |
| | — |
| | (28,001 | ) | | — |
| | (28,001 | ) | | — |
| | — |
| | (28,001 | ) |
| Repurchase of Class A shares | (954,447 | ) | | — |
| | (12,902 | ) | | — |
| | — |
| | — |
| | (12,902 | ) | | — |
| | — |
| | (12,902 | ) | (233,248 | ) | | — |
| | — |
| | (6,903 | ) | | — |
| | — |
| | (6,903 | ) | | — |
| | — |
| | (6,903 | ) |
| Exchange of AOG Units for Class A shares | 374,223 |
| | — |
| | 1,539 |
| | — |
| | — |
| | — |
| | 1,539 |
| | — |
| | (1,251 | ) | | 288 |
| 6,217,418 |
| | — |
| | — |
| | 41,224 |
| | — |
| | — |
| | 41,224 |
| | — |
| | (30,631 | ) | | 10,593 |
|
| Net income | — |
| | — |
| | — |
| | 235,883 |
| | — |
| | — |
| | 235,883 |
| | 3,891 |
| | 336,186 |
| | 575,960 |
| — |
| | — |
| | 9,155 |
| | — |
| | 430,673 |
| | — |
| | 439,828 |
| | 8,967 |
| | 533,540 |
| | 982,335 |
|
| Allocation of currency translation adjustment of consolidated CLOs and fund entities | — |
| | — |
| | — |
| | — |
| | — |
| | 1,683 |
| | 1,683 |
| | 1,670 |
| | (250 | ) | | 3,103 |
| |
| Currency translation adjustments, net of tax | | — |
| | — |
| | — |
| | — |
| | — |
| | 6,436 |
| | 6,436 |
| | 11,518 |
| | (3,371 | ) | | 14,583 |
|
| Net gain from change in fair value of cash flow hedge instruments | — |
| | — |
| | — |
| | — |
| | — |
| | 37 |
| | 37 |
| | — |
| | 42 |
| | 79 |
| — |
| | — |
| | — |
| | — |
| | — |
| | 37 |
| | 37 |
| | — |
| | 41 |
| | 78 |
|
| Net income on available-for-sale securities | — |
| | — |
| | — |
| | — |
| | — |
| | 450 |
| | 450 |
| | — |
| | — |
| | 450 |
| — |
| | — |
| | — |
| | — |
| | — |
| | 189 |
| | 189 |
| | — |
| | — |
| | 189 |
|
| Balance at September 30, 2016 | 184,743,799 |
| | 1 |
| | $ | 1,876,342 |
| | $ | (1,147,798 | ) | | $ | — |
| | $ | (5,450 | ) | | $ | 723,094 |
| | $ | 94,500 |
| | $ | 793,271 |
| | $ | 1,610,865 |
| |
| Balance at September 30, 2017 | | 193,540,853 |
| | 1 |
| | $ | 264,398 |
| | $ | 1,627,767 |
| | $ | (560,613 | ) | | $ | (2,061 | ) | | $ | 1,329,491 |
| | $ | 149,736 |
| | $ | 1,112,756 |
| | $ | 2,591,983 |
|
See accompanying notes to condensed consolidated financial statements.
APOLLO GLOBAL MANAGEMENT, LLC
CONDENSED CONSOLIDATED STATEMENTS OF CASH FLOWS (UNAUDITED)
FOR THE NINE MONTHS ENDED SEPTEMBER 30, 20162017 AND 20152016
(dollars in thousands, except share data)
| | | | For the Nine Months Ended September 30, | For the Nine Months Ended
September 30, |
| | 2016 | | 2015 | 2017 | | 2016 |
| Cash Flows from Operating Activities: | | | | | | |
| Net income | $ | 575,960 |
| | $ | 326,131 |
| $ | 982,335 |
| | $ | 575,960 |
|
| Adjustments to reconcile net income to net cash provided by operating activities: | | | | | | |
| Equity-based compensation | 74,203 |
| | 73,786 |
| 70,332 |
| | 74,203 |
|
| Depreciation and amortization | 14,139 |
| | 33,347 |
| 15,241 |
| | 14,139 |
|
| Unrealized gains from investment activities | (50,084 | ) | | (108,252 | ) | (107,803 | ) | | (50,084 | ) |
| Cash distributions of earnings from equity method investments | 17,079 |
| | 24,617 |
| |
| Satisfaction of contingent obligations | (10,096 | ) | | — |
| |
| Income from equity method investments | (64,356 | ) | | (18,079 | ) | (102,877 | ) | | (64,356 | ) |
| Change in fair value of contingent obligations | | 4,619 |
| | 11,736 |
|
| Deferred taxes, net | 52,184 |
| | 17,277 |
| 49,817 |
| | 52,184 |
|
| Other non-cash amounts included in net income, net | 970 |
| | (44,379 | ) | 1,310 |
| | (10,766 | ) |
| Changes in assets and liabilities: | | | | |
| Cash flows due to changes in operating assets and liabilities: | | | | |
| Carried interest receivable | (348,815 | ) | | 258,317 |
| (325,786 | ) | | (348,815 | ) |
| Due from related parties | (49,863 | ) | | (18,481 | ) | (47,536 | ) | | (49,863 | ) |
| Accounts payable and accrued expenses | 24,306 |
| | 15,506 |
| 21,597 |
| | 24,306 |
|
| Accrued compensation and benefits | 65,602 |
| | 71,790 |
| 91,910 |
| | 65,602 |
|
| Deferred revenue | 29,168 |
| | 4,092 |
| (17,285 | ) | | 29,168 |
|
| Due to related parties | 68,726 |
| | (9,285 | ) | (12,776 | ) | | 68,726 |
|
| Profit sharing payable | 168,741 |
| | (53,671 | ) | 179,703 |
| | 168,741 |
|
| Other assets and other liabilities, net | (8,082 | ) | | (7,786 | ) | (14,409 | ) | | (8,082 | ) |
| Cash distributions of earnings from equity method investments | | 41,335 |
| | 17,079 |
|
| Satisfaction of contingent obligation | | (23,597 | ) | | (10,096 | ) |
| Apollo Fund and VIE related: | | | | | | |
| Net realized and unrealized (gains) losses from investing activities and debt | 621 |
| | (11,517 | ) | (10,111 | ) | | 621 |
|
| Change in cash held at consolidated variable interest entities | 4,139 |
| | 284,890 |
| 2,157 |
| | 4,139 |
|
| Purchases of investments | (396,810 | ) | | (388,616 | ) | (517,652 | ) | | (396,810 | ) |
| Proceeds from sale of investments | 422,922 |
| | 264,522 |
| 385,035 |
| | 422,922 |
|
| Changes in other assets and other liabilities, net | (17,483 | ) | | (148,449 | ) | 1,925 |
| | (17,483 | ) |
| Net Cash Provided by Operating Activities | $ | 573,171 |
| | $ | 565,760 |
| $ | 667,484 |
| | $ | 573,171 |
|
| Cash Flows from Investing Activities: | | | | | | |
| Purchases of fixed assets | $ | (4,921 | ) | | $ | (5,015 | ) | $ | (5,929 | ) | | $ | (4,921 | ) |
| Purchase of investments | (44,530 | ) | | (25,000 | ) | (14,774 | ) | | (44,530 | ) |
| Purchase of U.S. Treasury securities | | (198,868 | ) | | — |
|
| Cash contributions to equity method investments | (188,572 | ) | | (136,421 | ) | (116,233 | ) | | (188,572 | ) |
| Cash distributions from equity method investments | 68,685 |
| | 38,855 |
| 80,360 |
| | 68,685 |
|
| Issuance of related party loans | (3,906 | ) | | (25,016 | ) | (5,834 | ) | | (3,906 | ) |
| Repayment of related party loans | | 17,700 |
| | — |
|
| Other investing activities | 919 |
| | 2,182 |
| (626 | ) | | 919 |
|
| Net Cash Used in Investing Activities | $ | (172,325 | ) | | $ | (150,415 | ) | $ | (244,204 | ) | | $ | (172,325 | ) |
| Cash Flows from Financing Activities: | | | | | | |
| Issuance of Preferred shares (net of issuance costs) | | $ | 264,398 |
| | $ | — |
|
| Distributions to Preferred Shareholders | | (9,155 | ) | | — |
|
| Principal repayments of debt | $ | (200,000 | ) | | $ | — |
| (30 | ) | | (200,000 | ) |
| Issuance of debt | 532,706 |
| | — |
| — |
| | 532,706 |
|
| Satisfaction of tax receivable agreement | — |
| | (48,420 | ) | (17,895 | ) | | — |
|
| Purchase of Class A shares | (13,003 | ) | | (3,050 | ) | (18,463 | ) | | (13,003 | ) |
| Payments related to deliveries of Class A shares for RSUs | (35,297 | ) | | (53,019 | ) | |
| Payments related to issuances of Class A shares for RSUs | | (28,001 | ) | | (35,297 | ) |
| Distributions paid | (172,095 | ) | | (275,850 | ) | (288,726 | ) | | (172,095 | ) |
| Distributions paid to Non-Controlling Interests in Apollo Operating Group | (194,371 | ) | | (377,663 | ) | (329,172 | ) | | (194,371 | ) |
| Other financing activities | (11,926 | ) | | (21,968 | ) | (2,949 | ) | | (11,926 | ) |
| Apollo Fund and VIE related: | | | | | | |
| Distributions paid to Non-Controlling Interests in consolidated variable interest entities | (4,133 | ) | | (6,794 | ) | |
| Contributions from Non-Controlling Interests in consolidated variable interest entities | 12,897 |
| | 5,524 |
| |
| Issuance of debt | | 534,595 |
| | — |
|
| Principal repayment of debt | | (442,640 | ) | | — |
|
| Distributions paid to Non-Controlling Interests in consolidated entities | | (347 | ) | | (4,133 | ) |
| Contributions from Non-Controlling Interests in consolidated entities | | 42,484 |
| | 12,897 |
|
| Net Cash Used in Financing Activities | $ | (85,222 | ) | | $ | (781,240 | ) | $ | (295,901 | ) | | $ | (85,222 | ) |
| Net Increase (Decrease) in Cash and Cash Equivalents | 315,624 |
| | (365,895 | ) | |
| Net Increase in Cash and Cash Equivalents | | 127,379 |
| | 315,624 |
|
| Cash and Cash Equivalents, Beginning of Period | 617,322 |
| | 1,205,663 |
| 813,664 |
| | 617,322 |
|
| Cash and Cash Equivalents, End of Period | $ | 932,946 |
| | $ | 839,768 |
| $ | 941,043 |
| | $ | 932,946 |
|
| Supplemental Disclosure of Cash Flow Information: | | | | | | |
| Interest paid | $ | 20,045 |
| | $ | 19,189 |
| $ | 32,207 |
| | $ | 20,045 |
|
| Interest paid by consolidated variable interest entities | 13,911 |
| | 15,007 |
| 9,026 |
| | 13,911 |
|
| Income taxes paid | 5,806 |
| | 6,354 |
| 8,070 |
| | 5,806 |
|
| Supplemental Disclosure of Non-Cash Investing Activities: | | | | | | |
| Non-cash contributions to equity method investments | $ | 1,231 |
| | $ | 35,074 |
| $ | — |
| | $ | 1,231 |
|
| Non-cash distributions from equity method investments | (4,496 | ) | | (5,909 | ) | (26,167 | ) | | (4,496 | ) |
| Non-cash purchases of other investments, at fair value | | 25,091 |
| | — |
|
| Supplemental Disclosure of Non-Cash Financing Activities: | | | | | | |
| Declared and unpaid distributions | $ | — |
| | $ | (25,518 | ) | |
| Capital increases related to equity-based compensation | 53,910 |
| | 49,952 |
| $ | 52,442 |
| | $ | 53,910 |
|
| Other non-cash financing activities | 364 |
| | 1,832 |
| (296 | ) | | 364 |
|
| Adjustments related to exchange of Apollo Operating Group units: | | | | | | |
| Deferred tax assets | $ | 1,807 |
| | $ | 60,648 |
| $ | 46,539 |
| | $ | 1,807 |
|
| Due to related parties | (1,519 | ) | | (44,534 | ) | |
| Due to affiliates | | (35,946 | ) | | (1,519 | ) |
| Additional paid in capital | (288 | ) | | (16,114 | ) | (10,593 | ) | | (288 | ) |
| Non-Controlling Interest in Apollo Operating Group | 1,251 |
| | 23,146 |
| 30,631 |
| | 1,251 |
|
| Net Assets Deconsolidated from Consolidated Variable Interest Entities and Funds: | | | | |
| Cash and cash equivalents | $ | — |
| | $ | 760,491 |
| |
| Investments, at fair value | — |
| | 16,930,227 |
| |
| Other Assets | — |
| | 280,428 |
| |
| Debt, at fair value | — |
| | (13,229,570 | ) | |
| Other liabilities | — |
| | (529,080 | ) | |
| Non-Controlling interest in consolidated entities | — |
| | (3,134,518 | ) | |
| Appropriated Partners' Capital | — |
| | (929,708 | ) | |
See accompanying notes to condensed consolidated financial statements.
APOLLO GLOBAL MANAGEMENT, LLC
NOTES TO CONDENSED CONSOLIDATED
FINANCIAL STATEMENTS
(dollars in thousands, except share data, except where noted)
1. ORGANIZATION
Apollo Global Management, LLC (“AGM”, together with its consolidated subsidiaries, the “Company” or “Apollo”) is a global alternative investment manager whose predecessor was founded in 1990. Its primary business is to raise, invest and manage private equity, credit and real estateassets funds as well as strategic investment accounts, on behalf of pension, endowment and sovereign wealth funds, as well as other institutional and individual investors. For these investment management services, Apollo receives management fees generally related to the amount of assets managed, transaction and advisory fees and carried interest income related to the performance of the respective funds that it manages. Apollo has three primary business segments:
Private equity—primarily invests in control equity and related debt instruments, convertible securities and distressed debt investments;
Credit—primarily invests in non-control corporate and structured debt instruments including performing, stressed and distressed investments across the capital structure; and
Real estateassets—primarily invests in real estate equity for the acquisition and recapitalization of real estate assets, portfolios, platforms and operating companies, and real estate debt including first mortgage and mezzanine loans, preferred equity and commercial mortgage backed securities.
Organization of the Company
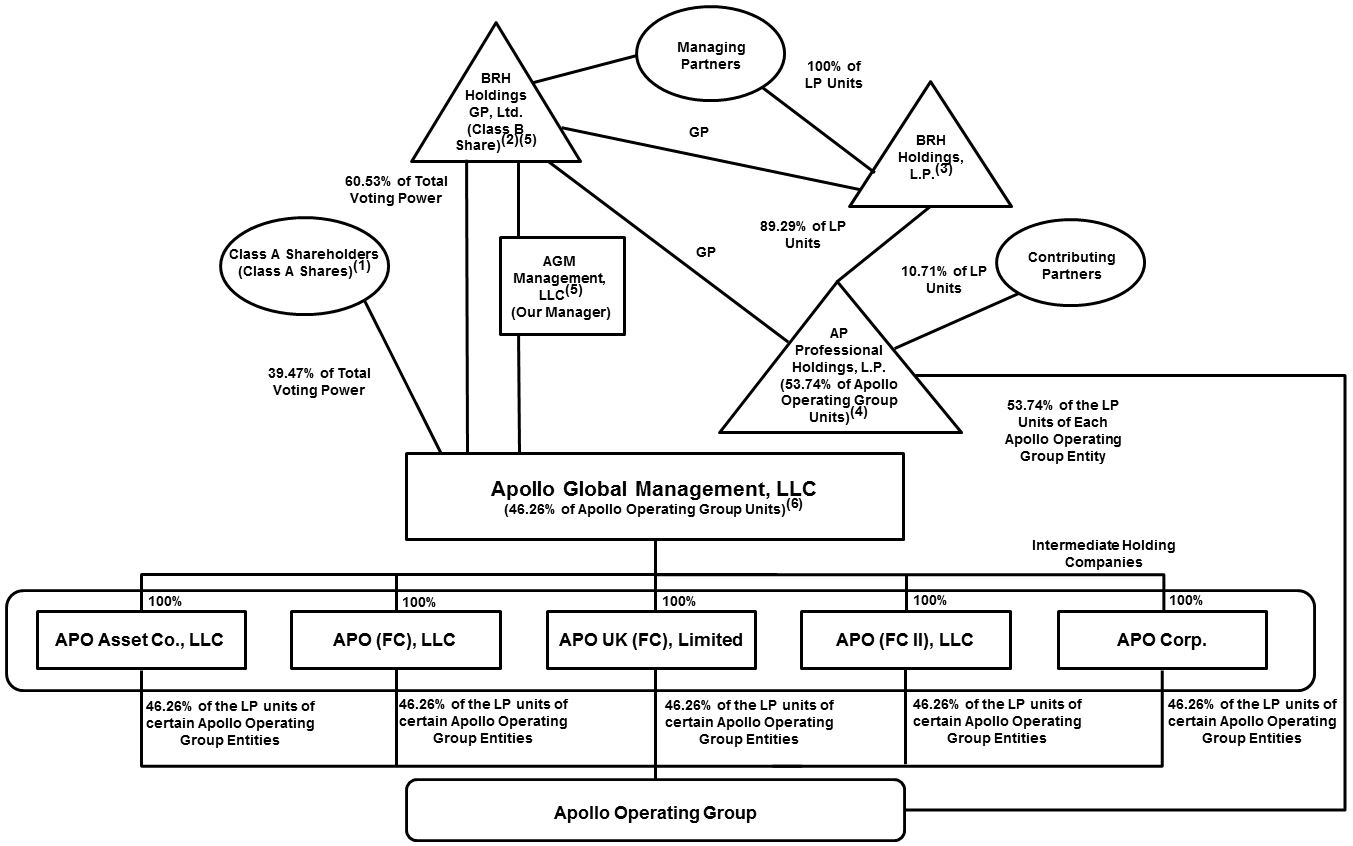
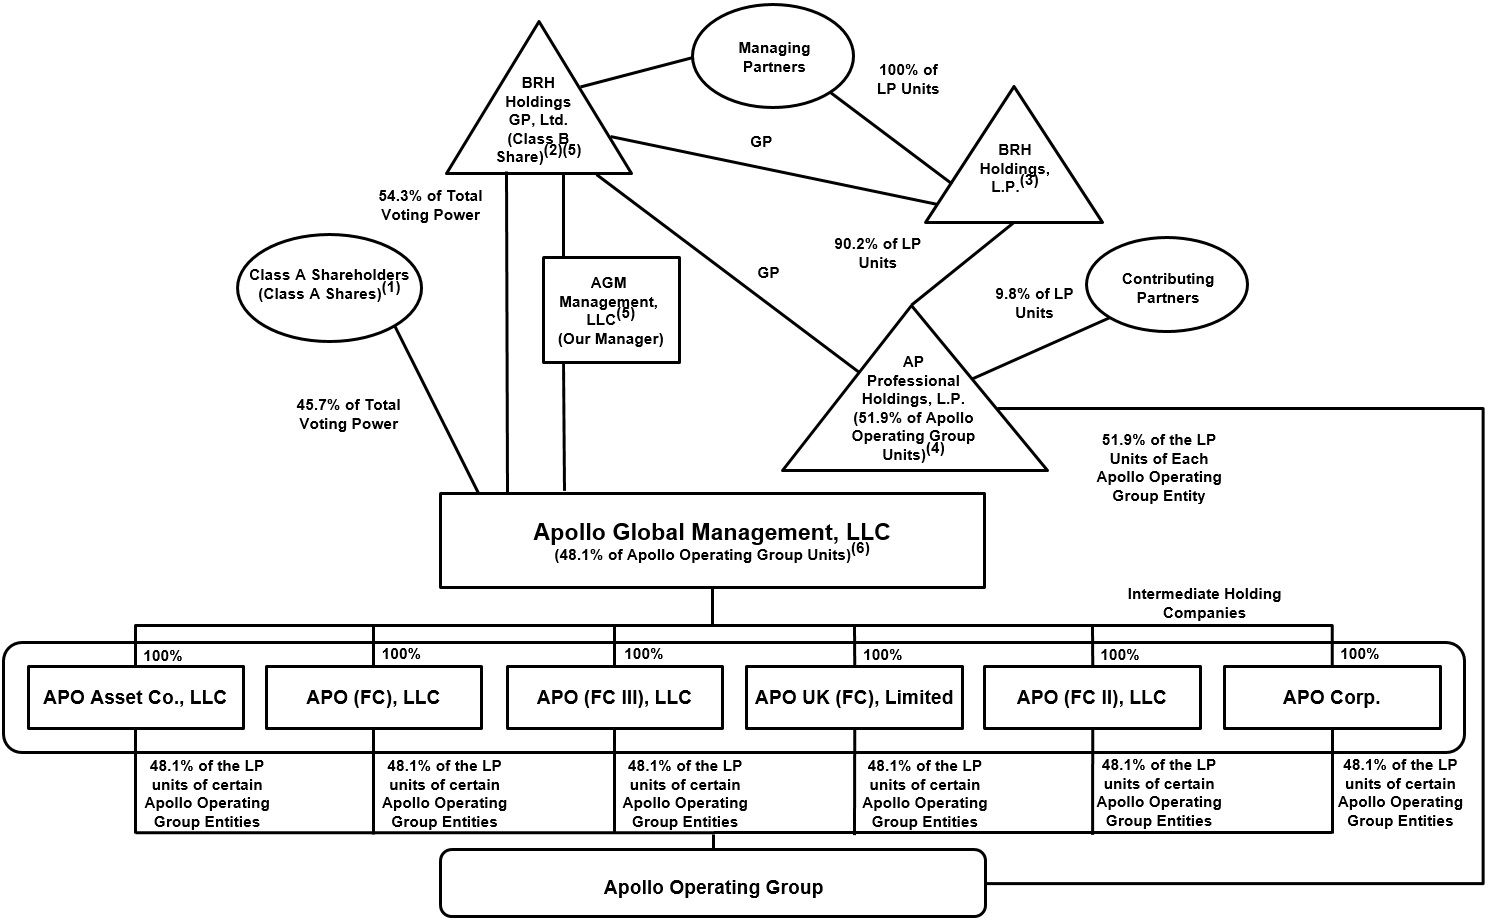
The Company was formed as a Delaware limited liability company on July 3, 2007 and completed a reorganization of its predecessor businesses on July 13, 2007 (the “2007 Reorganization”). The Company is managed and operated by its manager, AGM Management, LLC, which in turn is indirectly wholly-owned and controlled by Leon Black, Joshua Harris and Marc Rowan, ourits Managing Partners.
As of September 30, 2016,2017, the Company owned, through fivesix intermediate holding companies that include APO Corp., a Delaware corporation that is a domestic corporation for U.S. federal income tax purposes, APO Asset Co., LLC, a Delaware limited liability company that is a disregarded entity for U.S. federal income tax purposes, APO (FC), LLC, an Anguilla limited liability company that is treated as a corporation for U.S. federal income tax purposes, APO (FC II), LLC, an Anguilla limited liability company that is treated as a corporation for U.S. federal income tax purposes, and APO UK (FC), Limited, a United Kingdom incorporated company that is treated as a corporation for U.S. federal income tax purposes, and APO (FC III), LLC, a Cayman Islands limited liability company (collectively, the “Intermediate Holding Companies”), 46.1%48.1% of the economic interests of, and operated and controlled all of the businesses and affairs of, the Apollo Operating Group through its wholly-owned subsidiaries.
AP Professional Holdings, L.P., a Cayman Islands exempted limited partnership (“Holdings”), is the entity through which the Managing Partners and certain of the Company’s other partners (the “Contributing Partners”) indirectly beneficially own interests in each of the partnerships that comprise the Apollo Operating Group (“AOG Units”). As of September 30, 2016,2017, Holdings owned the remaining 53.9%51.9% of the economic interests in the Apollo Operating Group. The Company consolidates the financial results of the Apollo Operating Group and its consolidated subsidiaries. Holdings’ ownership interest in the Apollo Operating Group is reflected as a Non-Controlling Interest in the accompanying condensed consolidated financial statements.
2. SUMMARY OF SIGNIFICANT ACCOUNTING POLICIES
Basis of Presentation
The accompanying unaudited condensed consolidated financial statements are prepared in accordance with U.S. GAAP for interim financial information and instructions to the Quarterly Report on Form 10-Q. The condensed consolidated financial statements and these notes are unaudited and exclude some of the disclosures required in annual financial statements. Management believes it has made all necessary adjustments (consisting only of normal recurring items) so that the condensed consolidated financial statements are presented fairly and that estimates made in preparing its condensed consolidated financial statements are reasonable and prudent. The operating results presented for interim periods are not necessarily indicative of the results that may be expected for any other interim period or for the entire year. These condensed consolidated financial statements should be read in conjunction with the annual financial statements included in the 2016 Annual Report.
The condensed consolidated financial statements include the accounts of the Company, its wholly-owned or majority-owned subsidiaries, the consolidated entities which are considered to be variable interest entities (“VIEs”) and for which the Company is considered the primary beneficiary, and certain entities which are not considered VIEs but which the Company controls through a majority voting interest. Intercompany accounts and transactions, if any, have been eliminated upon consolidation. These condensed consolidated financial statements should be read in conjunction
APOLLO GLOBAL MANAGEMENT, LLC
NOTES TO CONDENSED CONSOLIDATED
FINANCIAL STATEMENTS
(dollars in thousands, except share data, except where noted)
withCompany is considered the consolidated financial statements ofprimary beneficiary, and certain entities which are not considered VIEs but which the Company for the year ended December 31, 2015 included in the 2015 Annual Report.controls through a majority voting interest.
Intercompany accounts and transactions, if any, have been eliminated upon consolidation.
Certain reclassifications, when applicable, have been made to the prior period’s condensed consolidated financial statements and notes to conform to the current period’s presentation and are disclosed accordingly.
Principles of Consolidation—
The types of entities with which Apollo is involved generally include subsidiaries (e.g., general partners and management companies related to the funds the Company manages), entities that have all the attributes of an investment company (e.g., funds) and securitization vehicles (e.g., collateralized loan obligations)CLOs). Each of these entities is assessed for consolidation on a case by case basis depending on the specific facts and circumstances surrounding that entity.
In February 2015, the Financial Accounting Standards Board (“FASB”) issued new consolidation guidance which changes the analysis that a reporting entity must perform to determine whether it should consolidate certain types of legal entities. During the second quarter of 2015, the Company elected to adopt this new guidance using the modified retrospective method, which resulted in an effective date of adoption of January 1, 2015. Restatement of prior period results is not required. Amounts presented for the three and nine months ended September 30, 2015 in the condensed consolidated statements of operations reflect the adoption of this accounting guidance as of January 1, 2015.
Pursuant to the new consolidation guidance, the Company first evaluates whether it holds a variable interest in an entity. Fees that are customary and commensurate with the level of services provided, and where the Company doesn’tdoes not hold other economic interests in the entity that would absorb more than an insignificant amount of the expected losses or returns of the entity, would not be considered a variable interest. Apollo factors in all economic interests including proportionate interests through related parties, to determine if feessuch interests are considered a variable interest. As Apollo’s interests in many of these entities are solely through market rate performance fees and/or insignificant indirect interests through related parties, Apollo is not considered to have a variable interest in many of these entities under the new guidance and no further consolidation analysis is performed. For entities where the Company has determined that it does hold a variable interest, the Company performs an assessment to determine whether each of those entities qualify as a variable interest entity (“VIE”).VIE.
The determination as to whether an entity qualifies as a VIE depends on the facts and circumstances surrounding each entity and therefore certain of Apollo’s funds may qualify as VIEs under the variable interest model whereas others may qualify as voting interest entities (“VOE”s)VOEs”) under the voting interest model. The granting of substantive kick-out rights is a key consideration in determining whether a limited partnership or similar entity is a VIE and whether or not that entity should be consolidated.
Under the voting interest model, Apollo consolidates those entities it controls through a majority voting interest. Apollo does not consolidate those VOEs in which substantive kick-out rights have been granted to the unrelated investors to either dissolve the fund or remove the general partner.
Under the variable interest model, Apollo consolidates those entities where it is determined that the Company is the primary beneficiary of the entity. The Company is determined to be the primary beneficiary when it has a controlling financial interest in the VIE, which is defined as possessing both (i) the power to direct the activities of the VIE that most significantly impact the VIE’s economic performance and (ii) the obligation to absorb losses of the VIE or the right to receive benefits from the VIE that could potentially be significant to the VIE. When Apollo alone is not considered to have a controlling financial interest in the VIE but Apollo and its related parties under common control in the aggregate have a controlling financial interest in the VIE, Apollo will still be deemed the primary beneficiary if it is the party that is most closely associated with the VIE. When Apollo and its related parties not under common control in the aggregate have a controlling financial interest in the VIE then Apollo would be deemed to be the primary beneficiary if substantially all the activities of the entity are performed on behalf of Apollo.
Apollo determines whether it is the primary beneficiary of a VIE at the time it becomes initially involved with the VIE and reconsiders that conclusion continuously. Investments and redemptions (either by Apollo, related parties of Apollo or third parties) or amendments to the governing documents of the respective entity may affect an entity’s status as a VIE or the determination of the primary beneficiary.
Assets and liabilities of the consolidated VIEs are primarily shown in separate sections within the condensed consolidated statements of financial condition ascondition. Changes in the fair value of September 30, 2016the consolidated VIEs’ assets and December 31, 2015.liabilities and related interest, dividend and other income and expenses are presented within net gains from investment activities of consolidated variable interest entities in the condensed consolidated statements of operations. The portion attributable to Non-Controlling Interests is reported within net income attributable to Non-Controlling Interests in the condensed consolidated statements of operations. For additional disclosures regarding VIEs, see note 4.4.
Deferred Revenue—Under the voting interest model, Apollo earns management fees subjectconsolidates those entities it controls through a majority voting interest. Apollo does not consolidate those VOEs in which substantive kick-out rights have been granted to the Management Fee Offset. When advisoryunrelated investors to either dissolve the fund or remove the general partner.
Fair Value of Financial Instruments
The fair value of a financial instrument is the price that would be received to sell an asset or paid to transfer a liability in an orderly transaction between market participants at the measurement date under current market conditions.
Except for the Company’s debt obligations (as described in note 9), Apollo’s financial instruments are recorded at fair value or at amounts whose carrying values approximate fair value. See “Investments, at Fair Value” below. While Apollo’s valuations of portfolio investments are based on assumptions that Apollo believes are reasonable under the circumstances, the actual realized gains or losses will depend on, among other factors, future operating results, the value of the assets and transaction fees are earned bymarket conditions at the management company, the Management Fee Offset reduces the management fee obligation of
APOLLO GLOBAL MANAGEMENT, LLC
NOTES TO CONDENSED CONSOLIDATED
FINANCIAL STATEMENTS
(dollars in thousands, except share data, except where noted)
time of disposition, any related transaction costs and the fund. Whentiming and manner of sale, all of which may ultimately differ significantly from the management company receives cash for advisory and transaction fees, a certain percentageassumptions on which the valuations were based. Financial instruments’ carrying values generally approximate fair value because of such advisory and/the short-term nature of those instruments or transaction fees, as applicable, is allocated as a credit to reduce future management fees, otherwise payable by such fund. Such credit is classified as deferred revenue in the condensed consolidated statements of financial condition. A portion of any excess advisory and transaction fees may be required to be returnedvariable interest rates related to the limited partners of certain funds upon such fund’s liquidation. As the management fees earned by the management company are presented on a gross basis, any Management Fee Offsets calculated are presented as a reduction to advisory and transaction fees from related parties in the condensed consolidated statements of operations.borrowings.
Additionally, Apollo earns advisory fees pursuant to the terms of the advisory agreements with certain of the portfolio companies that are owned by the funds. When Apollo receives a payment from a portfolio company that exceeds the advisory fees earned at that point in time, the excess payment is classified as deferred revenue in the condensed consolidated statements of financial condition. The advisory agreements with the portfolio companies vary in duration and the associated fees are received monthly, quarterly or annually. Deferred revenue is reversed and recognized as revenue over the period that the agreed upon services are performed.
Under the terms of the funds’ partnership agreements, Apollo is normally required to bear organizational expenses over a set dollar amount and placement fees or costs in connection with the offering and sale of interests in the funds to investors. The placement fees are payable to placement agents, who are independent third parties that assist in identifying potential investors, securing commitments to invest from such potential investors, preparing or revising offering and marketing materials, developing strategies for attempting to secure investments by potential investors and/or providing feedback and insight regarding issues and concerns of potential investors, when a limited partner either commits or funds a commitment to a fund. In certain instances the placement fees are paid over a period of time. Based on the management agreements with the funds, Apollo considers placement fees and organizational costs paid in determining if cash has been received in excess of the management fees earned. Placement fees and organizational costs are normally the obligation of Apollo but can be paid for by the funds. When these costs are paid by the fund, the resulting obligations are included within deferred revenue. The deferred revenue balance will also be reduced during future periods when management fees are earned but not paid.
Investments, at Fair Value—The Company follows Hierarchy
U.S. GAAP attributable to fair value measurementsestablishes a hierarchical disclosure framework which among other things, requires enhanced disclosures about investments that are measuredprioritizes and reportedranks the level of market price observability used in measuring financial instruments at fair value. Investments, at fair value represent investmentsMarket price observability is affected by a number of factors, including the type of financial instrument, the characteristics specific to the financial instrument and the state of the consolidated funds, investmentsmarketplace, including the existence and transparency of the consolidated VIEstransactions between market participants. Financial instruments with readily available quoted prices in active markets generally will have a higher degree of market price observability and certain financiala lesser degree of judgment used in measuring fair value.
Financial instruments for which the fair value option has been elected. The unrealized gains and losses resulting from changes in the fair value are reflected as net gains (losses) from investment activities and net gains (losses) from investment activities of the consolidated VIEs in the condensed consolidated statements of operations. In accordance with U.S. GAAP, investments measured and reported at fair value are classified and disclosed based on the observability of inputs used in onethe determination of the following categories:fair values, as follows:
Level I—- Quoted prices are available in active markets for identical investmentsfinancial instruments as of the reporting date. The typetypes of investmentsfinancial instruments included in Level I include listed equities and listed derivatives. As required by U.S. GAAP, thedebt. The Company does not adjust the quoted price for these investments,financial instruments, even in situations where the Company holds a large position and the sale of such position would likely deviate from the quoted price.
Level II—- Pricing inputs are other than quoted prices in active markets, which are either directly or indirectly observable as of the reporting date, and fair value is determined through the use of models or other valuation methodologies. InvestmentsFinancial instruments that are generally included in this category include corporate bonds and loans, less liquid and restricted equity securities and certain over-the-counter derivatives where the fair value is based on observable inputs. These investmentsfinancial instruments exhibit higher levels of liquid market observability as compared to Level III investments. The Company subjects broker quotes to various criteria in making the determination as to whether a particular investment would qualify for treatment as a Level II investment. These criteria include, but are not limited to, the number and quality of broker quotes, the standard deviation of obtained broker quotes, and the percentage deviation from independent pricing services.financial instruments.
Level III—- Pricing inputs are unobservable for the investmentfinancial instrument and includes situations where there is little observable market activity for the investment.financial instrument. The inputs into the determination of fair value may require significant management judgment or estimation. InvestmentsFinancial instruments that are included in this category generally include general and limited partner interests in corporate private equity and real estateassets funds, opportunistic credit funds, distressed debt and non-investment grade residual interests in securitizations
APOLLO GLOBAL MANAGEMENT, LLC
NOTES TO CONDENSED CONSOLIDATED
FINANCIAL STATEMENTS
(dollars in thousands, except share data, except where noted)
and CDOs and CLOs where the fair value is based on observable inputs as well as unobservable inputs.
When a security is valued based on broker quotes, the Company subjects those quotes to various criteria in making the determination as to whether a particular investmentfinancial instrument would qualify for treatmentclassification as a Level II or Level III investment.III. These criteria include, but are not limited to, the number and quality of the broker quotes, the standard deviations of the observed broker quotes, and the percentage deviation from independent pricing services.
In certain cases, the inputs used to measure fair value may fall into different levels of the fair value hierarchy. In such cases, an investment’sa financial instrument’s level within the fair value hierarchy is based on the lowest level of input that is significant to the fair value measurement. The Company’s assessment of the significance of a particular input to the fair value measurement in its entirety requires judgment and considers factors specific to the investmentfinancial instrument when the fair value is based on unobservable inputs.
In cases where an investment or financial instrument that is measured and reported at fair value is transferredTransfers between levels of the fair value hierarchy the Company accounts for the transferare recognized as of the end of the reporting period.
On a quarterly basis, Apollo utilizes valuation committees consisting of members from senior management, to review and approve the valuation results related to the investments of the funds it manages. For certain publicly traded vehicles, a review is performed by an independent board of directors. The Company also retains independent valuation firms to provide third-party valuation consulting services to Apollo, which consist of certain limited procedures that management identifies and requests them to perform. The limited procedures provided by the independent valuation firms assist management with validating their valuation results or determining fair value. The Company performs various back-testing procedures to validate their valuation approaches, including comparisons between expected and observed outcomes, forecast evaluations and variance analyses. However, because of the inherent uncertainty of valuation, those estimated values may differ significantly from the values that would have been used had a ready market for the investments existed, and the differences could be material.
Derivatives—The Company recognizes derivatives as assets or liabilities on its condensed consolidated statements of financial condition at fair value. On the date the Company enters into a derivative contract, it designates and documents the derivative contract as one of the following: (a) a hedge of a recognized asset or liability (“fair value hedge”), (b) a hedge of a forecasted transaction or of the variability of cash flows to be received or paid related to a recognized asset or liability (“cash flow hedge”), (c) a hedge of a net investment in a foreign operation (“net investment hedge”) or (d) a derivative instrument not designated as a hedging instrument (“freestanding derivative”). The Company did not have any freestanding derivatives or derivatives designated as fair value or cash flow hedges as of September 30, 2016 or December 31, 2015. In May 2014, the Company entered into a treasury rate lock agreement (“rate lock”) to mitigate the risk of changes in the treasury rate ahead of the final pricing of the 2024 Senior Notes. The rate lock was designated as a cash flow hedge at inception. The Company settled the rate lock in connection with the issuance of the 2024 Senior Notes in May 2014. The Company incurred a $1.0 million loss on settlement of the rate lock during the three months ended June 30, 2014 that is being reclassified out of other comprehensive income into interest expense over the term of the 2024 Senior Notes. For net investment hedges, the Company records changes in the fair value of the derivative in the cumulative translation adjustment section of other comprehensive income to the extent it is effective as a hedge. The fair values of the derivative instruments are reflected in other assets and other liabilities on the condensed consolidated statements of financial condition.
The Company formally documents at inception its hedge relationships, including identification of the hedging instruments and the hedged items, its risk management objectives, strategy for undertaking the hedge transaction and the Company’s method for evaluating effectiveness of its hedged transactions. At least quarterly, the Company also formally assesses whether the derivatives it designated in each hedging relationship are expected to be, and have been, highly effective in offsetting changes in estimated fair values of the hedged items. The ineffective portion of a net investment hedge, if any, is recognized in current period earnings.
The Company has elected to not offset derivative assets and liabilities or financial assets in its condensed consolidated statements of financial condition, even when an enforceable master netting agreement is in place that provides the Company the right to offset derivative assets and liabilities in the same currency by specific derivative type or, in the event of default by the counterparty, to offset derivative assets and liabilities with the same counterparty.
Equity Method Investments—For investments in entities over which the Company exercises significant influence but which do not meet the requirements for consolidation and for which the Company has not elected the fair value option, the Company uses the equity method of accounting, whereby the Company records its share of the underlying income or loss of such entities. The carrying amounts of equity method investments are reflected in investments in the condensed consolidated statements of
APOLLO GLOBAL MANAGEMENT, LLC
NOTES TO CONDENSED CONSOLIDATED
FINANCIAL STATEMENTS
(dollars in thousands, except share data, except where noted)
financial condition. As the underlying entities that the Company manages and invests in are, for U.S. GAAP purposes, primarily investment companies which reflect their investments at estimated fair value, the carrying value of the Company’s equity method investments in such entities approximates fair value.
Private Equity Investments
The value of liquid investments in Apollo’s private equity funds, where the primary market is an exchange (whether foreign or domestic) is determined using period end market prices. Such prices are generally based on the close price on the date of determination.
Valuation approaches used to estimate the fair value of investments in Apollo’s private equity funds that are less liquid include the market approach and the income approach. The market approach provides an indication of fair value based on a comparison of the subject company to comparable publicly traded companies and transactions in the industry. The market approach is driven more by current market conditions, including actual trading levels of similar companies and, to the extent available, actual
APOLLO GLOBAL MANAGEMENT, LLC
NOTES TO CONDENSED CONSOLIDATED
FINANCIAL STATEMENTS
(dollars in thousands, except share data, except where noted)
transaction data of similar companies. Judgment is required by management when assessing which companies are similar to the subject company being valued. Consideration may also be given to such factors as the Company’s historical and projected financial data, valuations given to comparable companies, the size and scope of the Company’s operations, the Company’s strengths, weaknesses, expectations relating to the market’s receptivity to an offering of the Company’s securities, applicable restrictions on transfer, industry and market information and assumptions, general economic and market conditions and other factors deemed relevant. The income approach provides an indication of fair value based on the present value of cash flows that a business or security is expected to generate in the future. The most widely used methodology in the income approach is a discounted cash flow method. Inherent in the discounted cash flow method are assumptions of expected results, the determination of a terminal value and a calculated discount rate.
Credit Investments
The majority of investments in Apollo’s credit funds are valued based on quoted market prices and valuation models. Quoted market prices are valued based on the average of the “bid” and the “ask” quotes provided by multiple brokers wherever possible without any adjustments. Apollo will designate certain brokers to use to value specific securities. In order to determine the designated brokers, Apollo considers the following: (i) brokers with which Apollo has previously transacted, (ii) the underwriter of the security and (iii) active brokers indicating executable quotes. In addition, when valuing a security based on broker quotes wherever possible Apollo tests the standard deviation amongst the quotes received and the variance between the concluded fair value and the value provided by a pricing service. When broker quotes are not available Apollo considers the use of pricing service quotes or other sources to mark a position. When relying on a pricing service as a primary source, Apollo (i) analyzes how the price has moved over the measurement period, (ii) reviews the number of brokers included in the pricing service’s population and (iii) validates the valuation levels with Apollo’s pricing team and traders.
Debt and equity securities that are not publicly traded or whose market prices are not readily available are valued at fair value utilizing a model based approach to determine fair value. When determining fair value when no observable market value exists, the value attributed to an investment is based on the price that would be received to sell an asset or paid to transfer a liability in an orderly transaction between market participants at the measurement date. Valuation approaches used to estimate the fair value of illiquid credit investments also may include the market approach and the income approach, as previously described above. The valuation approaches used consider, as applicable, market risks, credit risks, counterparty risks and foreign currency risks.
Real Assets Investments
The estimated fair value of commercial mortgage-backed securities (“CMBS”) in Apollo’s real assets funds is determined by reference to market prices provided by certain dealers who make a market in these financial instruments. Broker quotes are only indicative of fair value and may not necessarily represent what the funds would receive in an actual trade for the applicable instrument. Additionally, the loans held-for-investment are stated at the principal amount outstanding, net of deferred loan fees and costs for certain investments. The loans in Apollo’s real assets funds are evaluated for possible impairment on a quarterly basis. For Apollo’s real assets funds, valuations of non-marketable underlying investments are determined using methods that include, but are not limited to (i) discounted cash flow estimates or comparable analysis prepared internally, (ii) third party appraisals or valuations by qualified real estate appraisers and (iii) contractual sales value of investments/properties subject to bona fide purchase contracts. Methods (i) and (ii) also incorporate consideration of the use of the income, cost, or sales comparison approaches of estimating property values.
TheCertain of the private equity, credit, and real assets funds may also enter into foreign currency exchange contracts, total return swap contracts, credit default swap contracts, and other derivative contracts, which may include options, caps, collars and floors. Foreign currency exchange contracts are marked-to-market by recognizing the difference between the contract exchange rate and the current market rate as unrealized appreciation or depreciation. If securities are held at the end of this period, the changes in value are recorded in income as unrealized. Realized gains or losses are recognized when contracts are settled. Total return swap and credit default swap contracts are recorded at fair value as an asset or liability with changes in fair value recorded as unrealized appreciation or depreciation. Realized gains or losses are recognized at the termination of the contract based on the difference between the close-out price of the total return or credit default swap contract and the original contract price. Forward contracts are valued based on market rates obtained from counterparties or prices obtained from recognized financial data service providers.
Real Estate InvestmentsValuation Process
On a quarterly basis, Apollo utilizes valuation committees consisting of members from senior management, to review and approve the valuation results related to the investments of the funds it manages. For certain publicly traded vehicles managed by the Company, a review is performed by an independent board of directors. The estimated fair valueCompany also retains independent valuation firms to provide third-party valuation consulting services to Apollo, which consist of commercial mortgage-backed securities (“CMBS”) in Apollo’s real estate funds is determined by reference to market prices provided by certain dealers who make a market in these financial instruments. Brokerlimited procedures that management
APOLLO GLOBAL MANAGEMENT, LLC
NOTES TO CONDENSED CONSOLIDATED
FINANCIAL STATEMENTS
(dollars in thousands, except share data, except where noted)
quotes are only indicative ofidentifies and requests them to perform. The limited procedures provided by the independent valuation firms assist management with validating their valuation results or determining fair value and may not necessarily represent what the funds would receive in an actual trade for the applicable instrument. Additionally, the loans held-for-investment are stated at the principal amount outstanding, net of deferred loan fees and costs for certain investments.value. The Company evaluates its loans for possible impairment on a quarterly basis. For Apollo’s real estate funds, valuations of non-marketable underlying investments are determined using methods that include, but are not limitedperforms various back-testing procedures to (i) discounted cash flow estimates or comparable analysis prepared internally, (ii) third party appraisals or valuations by qualified real estate appraisersvalidate their valuation approaches, including comparisons between expected and (iii) contractual sales value of investments/properties subject to bona fide purchase contracts. Methods (i)observed outcomes, forecast evaluations and (ii) also incorporate considerationvariance analyses. However, because of the useinherent uncertainty of the income, cost, or sales comparison approaches of estimating property values.
Fair Value of Financial Instruments
The fair value of a financial instrument is the price that would be received to sell an asset or paid to transfer a liability in an orderly transaction between market participants at the measurement date under current market conditions.
Except for the Company’s debt obligations (as described in note 9), Apollo’s financial instruments are recorded at fair value or at amounts whose carryingvaluation, those estimated values approximate fair value. See “Investments, at Fair Value” above. While Apollo’s valuations of portfolio investments are based on assumptions that Apollo believes are reasonable under the circumstances, the actual realized gains or losses will depend on, among other factors, future operating results, the value of the assets and market conditions at the time of disposition, any related transaction costs and the timing and manner of sale, all of which may ultimately differ significantly from the assumptions on which the valuations were based. Financial instruments’ carrying values generally approximate fair value because of the short-term nature of those instruments or variable interest rates related to the borrowings.
Fair Value Option—Apollo has elected the fair value optionthat would have been used had a ready market for the Company’s investment in Athene Holding, assets and liabilities of the consolidated VIEsinvestments existed, and the Company’s investments in certain CLOs. Such election is irrevocable and is applied to financial instruments on an individual basis at initial recognition. Apollo has applied the fair value option for certain corporate loans, other investments and debt obligations held by the consolidated VIEs that otherwise would not have been carried at fair value. See notes 3, 4, and 5 for further disclosure on the investments in Athene Holding and financial instruments of the consolidated VIEs for which the fair value option has been elected.differences could be material.
Financial Instruments held by Consolidated VIEs
The Company elected the fair value option for the assets and liabilities of the consolidated CLOs.
During the second quarter of 2015, the Company adopted the measurement alternative included in the collateralized financing entity (“CFE”) guidance using a modified retrospective approach by recording a cumulative-effect adjustment to shareholders’ equity as of January 1, 2015. Restatement of prior period results is not required. Amounts presented for the three and nine months ended September 30, 2015 in the condensed consolidated statements of operations reflect the adoption of this accounting guidance as of January 1, 2015. The Company measures both the financial assets and financial liabilities of the consolidated CLOs in its condensed consolidated financial statements using the fair value of the financial assets of the consolidated CLOs, which are more observable than the fair value of the financial liabilities of the consolidated CLOs. As a result, the financial assets of the consolidated CLOs are measured at fair value and the financial liabilities are measured in consolidation as: (i) the sum of the fair value of the financial assets and the carrying value of any non-financial assets that are incidental to the operations of the CLOs less (ii) the sum of the fair value of any beneficial interests retained by the reporting entityCompany (other than those that represent compensation for services) and the Company’s carrying value of any beneficial interests that represent compensation for services. The resulting amount is allocated to the individual financial liabilities (other than the beneficial interest retained by the Company) using a reasonable and consistent methodology. Under the measurement alternative, the Company’s condensed consolidated net income (loss) attributable to Apollo Global Management, LLC reflects the Company’s own economic interests in the consolidated CLOs including (i) changes in the fair value of the beneficial interests retained by the Company and (ii) beneficial interests that represent compensation for collateral management services.
APOLLO GLOBAL MANAGEMENT, LLC
NOTES TO CONDENSED CONSOLIDATED
FINANCIAL STATEMENTS
(dollars in thousands, except share data, except where noted)
The consolidated VIEs hold investments that could be traded over-the-counter. Investments in securities that are traded on a securities exchange or comparable over-the-counter quotation systems are valued based on the last reported sale price at that date. If no sales of such investments are reported on such date, and in the case of over-the-counter securities or other investments for which the last sale date is not available, valuations are based on independent market quotations obtained from market participants, recognized pricing services or other sources deemed relevant, and the prices are based on the average of the “bid” and “ask” prices, or at ascertainable prices at the close of business on such day. Market quotations are generally based on valuation pricing models or market transactions of similar securities adjusted for security-specific factors such as relative capital structure priority and interest and yield risks, among other factors. When market quotations are not available, a model based approach is used to determine fair value.
The consolidated VIEs also have debt obligations that are recorded at fair value. As previously noted, the Company measures the debt obligations of the consolidated CLOs on the basis of the fair value of the financial assets of the consolidated CLOs.
Fair Value Option
Apollo has elected the fair value option for the Company’s investment in Athene Holding, the assets and liabilities of certain of its consolidated VIEs (including CLOs), the Company’s U.S. Treasury securities with original maturities greater than three months when purchased, and certain of the Company’s other investments. Such election is irrevocable and is applied to financial instruments on an individual basis at initial recognition. Apollo has applied the fair value option for certain corporate loans, other investments and debt obligations held by the consolidated VIEs that otherwise would not have been carried at fair value. See notes 3, 4, and 5 for further disclosure on the investments in Athene Holding and financial instruments of the consolidated VIEs and other investments for which the fair value option has been elected.
Cash and Cash Equivalents
Apollo considers all highly liquid short-term investments with original maturities of three months or less when purchased to be cash equivalents. Cash and cash equivalents include money market funds and U.S. treasury securities with original maturities of three months or less when purchased. Interest income from cash and cash equivalents is recorded in interest income in the condensed consolidated statements of operations. The carrying values of the money market funds and U.S. treasury securities of $428.1 million as of September 30, 2017, which approximate their fair values due to their short-term nature and are categorized as Level I within the fair value hierarchy. Substantially all of the Company’s cash on deposit is in interest bearing accounts with major financial institutions and exceed insured limits.
U.S. Treasury securities, at fair value
U.S. Treasury securities, at fair value includes U.S. Treasury bills with original maturities greater than three months when purchased. These securities are recorded at fair value. Interest income on such securities is separately presented from the overall change in fair value and is recognized in interest income in the condensed consolidated statements of operations. Any
APOLLO GLOBAL MANAGEMENT, LLC
NOTES TO CONDENSED CONSOLIDATED
FINANCIAL STATEMENTS
(dollars in thousands, except share data, except where noted)
remaining change in fair value of such securities, that is not recognized as interest income, is recognized in net gains from investment activities in the condensed consolidated statements of operations.
Investments, at Fair Value
Investments, at fair value represent investments of the consolidated funds, investments of the consolidated VIEs and certain financial instruments for which the fair value option has been elected.
The unrealized gains and losses resulting from changes in the fair value of the consolidated VIEs are reflected as net gains from investment activities of consolidated variable interest entities in the condensed consolidated statements of operations.
Net gains from investment activities in the condensed consolidated statements of operations include both realized gains and losses and the change in unrealized gains and losses in the Company’sinvestments, at fair value between the opening reporting date and the closing reporting date.
Equity Method Investments
For investments in entities over which the Company exercises significant influence but which do not meet the requirements for consolidation and for which the Company has not elected the fair value option, the Company uses the equity method of accounting, whereby the Company records its share of the underlying income or loss of such entities. The Company’s share of the underlying net income or loss of such entities is recorded in income from equity method investments in the condensed consolidated statements of operations. The carrying amounts of equity method investments are recorded in investments in the condensed consolidated statements of financial condition. As the underlying entities that the Company manages and invests in are, for U.S. GAAP purposes, primarily investment companies which reflect their investments at estimated fair value, the carrying value of the Company’s equity method investments in such entities approximates fair value.
Revenues
Revenues are reported in three separate categories that include (i) advisory and transaction fees from related parties, net, which relate to the investments of the funds the Company manages and may include individual monitoring agreements the Company has with the portfolio companies and debt investment vehicles of the private equity funds and credit funds it manages; (ii) management fees from related parties, which are based on committed capital, invested capital, net asset value, gross assets or as otherwise defined in the respective agreements; and (iii) carried interest income from related parties, which is normally based on the performance of the funds the Company manages that are subject to preferred return.
Management Fees from Related Parties—Management fees for private equity, credit, and real assets funds are recognized in the period during which the related services are performed in accordance with the contractual terms of the related agreement, and are generally based upon (1) a percentage of the capital committed during the commitment period, and thereafter based on the remaining invested capital of unrealized investments, or (2) net asset value, gross assets or as otherwise defined in the respective agreements. Included in management fees are certain expense reimbursements where the Company is considered the principal under the agreements and is required to record the expense and related reimbursement revenue on a gross basis.
Advisory and Transaction Fees from Related Parties, Net—Advisory and transaction fees, including directors’ fees, are recognized when the underlying services rendered are substantially completed in accordance with the terms of the transaction and advisory agreements. Additionally, during the normal course of business, the Company incurs certain costs related to certain transactions that are not consummated (“broken deal costs”). These costs (e.g., research costs, due diligence costs, professional fees, legal fees and other related items) are determined to be broken deal costs upon management’s decision to no longer pursue the transaction. In accordance with the related fund agreement, in the event the deal is deemed broken, all of the costs are reimbursed by the funds and then included as a component of the calculation of the Management Fee Offset (described below). If a deal is successfully completed, Apollo is reimbursed by the fund or fund’s portfolio company for all costs incurred and no offset is generated. As the Company acts as an agent for the funds it manages, any transaction costs incurred and paid by the Company on behalf of the respective funds relating to successful or broken deals are presentedrecorded net on the Company’s condensed consolidated statements of operations, and any receivable from the respective funds is presentedrecorded in due from related parties on the condensed consolidated statements of financial condition.
Advisory and transaction fees from related parties, net, also includes underwriting fees. Underwriting fees include gains, losses and fees, net of syndicate expenses, arising from securities offerings in which one of the Company’s subsidiaries participates in the underwriter syndicate. Underwriting fees are recognized at the time the underwriting is completed and the
APOLLO GLOBAL MANAGEMENT, LLC
NOTES TO CONDENSED CONSOLIDATED
FINANCIAL STATEMENTS
(dollars in thousands, except share data, except where noted)
income is reasonably assured and are included in the condensed consolidated statements of operations. Underwriting fees recognized but not received are includedrecorded in other assets on the condensed consolidated statements of financial condition.
As a result of providing advisory services to certain private equity and credit portfolio companies, Apollo is generally entitled to receive fees for transactions related to the acquisition, in certain cases, and disposition of portfolio companies as well as ongoing monitoring of portfolio company operations and directors’ fees. The amounts due from portfolio companies are includedrecorded in due from related parties, which is discussed further in note 12.13. Under the terms of the limited partnership agreements for certain funds, the management fee payable by the funds may be subject to a reduction based on a certain percentage of such advisory and transaction fees, net of applicable broken deal costs (“Management Fee Offset”). Advisory and transaction fees from related parties are presented net of the Management Fee Offset in the condensed consolidated statements of operations.
Management Fees from Related Parties—Management fees for private equity, credit, and real estate funds are recognized in the period during which the related services are performed in accordance with the contractual terms of the related agreement, and are generally based upon (1) a percentage of the capital committed during the commitment period, and thereafter based on the remaining invested capital of unrealized investments, or (2) net asset value, gross assets or as otherwise defined in the respective agreements. Included in management fees are certain expense reimbursements where the Company is considered the principal under the agreements and is required to record the expense and related reimbursement revenue on a gross basis.
Carried Interest Income (Loss) from Related Parties—Apollo is entitled to an incentive return that can normally amount to as much as 20% of the total returns on a fund’s capital, depending upon performance. Performance-basedPerformance fees are assessed as a percentage of the investment performance of the funds. The carried interest income from related parties for any period is based upon an assumed liquidation of the fund’s net assets on the reporting date, and distribution of the net proceeds in accordance with the fund’s income allocation provisions. Carried interest receivable is presented separately in the condensed consolidated statements of financial condition. The carried interest income from related parties may be subject to reversal to the extent that the carried interest income recorded exceeds the amount due to the general partner based on a fund’s cumulative investment returns.
APOLLO GLOBAL MANAGEMENT, LLC
NOTES TO CONDENSED CONSOLIDATED
FINANCIAL STATEMENTS
(dollars in thousands, except share data, except where noted)
When applicable, the accrual for potential repayment of previously received carried interest income, which is a component of due to related parties, represents all amounts previously distributed to the general partner that would need to be repaid to the Apollo funds if these funds were to be liquidated based on the current fair value of the underlying funds’ investments as of the reporting date. The actual general partner obligation, however, would not become payable or realized until the end of a fund’s life.
Carried interest income from related parties also includes a quarterly performance fee on the pre-incentive fee net investment income (“AINV Part I Fees”) of AINV. For purposes of the AINV Part I Fees, the net investment income of AINV includes interest income, dividend income and certain other income but excludes any realized and unrealized capital gains or losses. Such AINV Part I Fees are paid quarterly and are not subject to repayment.
Deferred Revenue—Apollo earns management fees subject to the Management Fee Offset (described above). When advisory and transaction fees are earned by the management company, the Management Fee Offset reduces the management fee obligation of the fund. When the Company receives cash for advisory and transaction fees, a certain percentage of such advisory and/or transaction fees, as applicable, is allocated as a credit to reduce future management fees, otherwise payable by such fund. Such credit is recorded as deferred revenue in the condensed consolidated statements of financial condition. A portion of any excess advisory and transaction fees may be required to be returned to the limited partners of certain funds upon such fund’s liquidation. As the management fees earned by the Company are presented on a gross basis, any Management Fee Offsets calculated are presented as a reduction to advisory and transaction fees from related parties in the condensed consolidated statements of operations.
Additionally, Apollo earns advisory fees pursuant to the terms of the advisory agreements with certain of the portfolio companies that are owned by the funds Apollo manages. When Apollo receives a payment from a portfolio company that exceeds the advisory fees earned at that point in time, the excess payment is recorded as deferred revenue in the condensed consolidated statements of financial condition. The advisory agreements with the portfolio companies vary in duration and the associated fees are received monthly, quarterly or annually. Deferred revenue is reversed and recognized as revenue over the period that the agreed upon services are performed.
Under the terms of the funds’ partnership agreements, Apollo is normally required to bear organizational expenses over a set dollar amount and placement fees or costs in connection with the offering and sale of interests in the funds it manages to investors. The placement fees are payable to placement agents, who are independent third parties that assist in identifying potential investors, securing commitments to invest from such potential investors, preparing or revising offering and marketing materials, developing strategies for attempting to secure investments by potential investors and/or providing feedback and insight regarding issues and concerns of potential investors, when a limited partner either commits or funds a commitment to a fund. In certain instances the placement fees are paid over a period of time. Based on the management agreements with the funds, Apollo considers placement fees and organizational costs paid in determining if cash has been received in excess of the management fees earned. Placement fees and organizational costs are normally the obligation of Apollo but can be paid for by the funds. When these costs are paid by the fund, the resulting obligations are included within deferred revenue. The deferred revenue balance will also be reduced during future periods when management fees are earned but not paid.
APOLLO GLOBAL MANAGEMENT, LLC
NOTES TO CONDENSED CONSOLIDATED
FINANCIAL STATEMENTS
(dollars in thousands, except share data, except where noted)
Compensation and Benefits
Equity-Based Compensation—Equity-based awards granted to employees as compensation are measured based on the grant date fair value of the award. Equity-based awards that do not require future service (i.e., vested awards) are expensed immediately. Equity-based employee awards that require future service are expensed over the relevant service period. The Company estimates forfeitures for equity-based awards that are not expected to vest. Equity-based awards granted to non-employees for services provided to related parties are remeasured to fair value at the end of each reporting period and expensed over the relevant service period.
Salaries, Bonus and Benefits—Salaries, bonus and benefits include base salaries, discretionary and non-discretionary bonuses, severance and employee benefits. Bonuses are generally accrued over the related service period.401(k) Savings Plan
The Company sponsors a 401(k) savings plan (the “401(k) Plan”) whereby U.S.-based employees are entitled to participate in the plan401(k) Plan based upon satisfying certain eligibility requirements. The Company may provide discretionary contributions from time to time. NoEffective contributions relating to this plan were made byJanuary 1, 2017, the Company formatches 50% of eligible annual employee contributions up to 3% of the eligible employees’ annual compensation. Matching contributions vest after three and nine months ended September 30, 2016 and 2015.years of service.
Profit Sharing Expense—
Profit sharing expense and profit sharing payable primarily consistsconsist of a portion of carried interest recognized in one or moreearned from certain funds that is allocated to employees, former employees and Contributing Partners. Profit sharing expense isamounts are recognized on an accrued basis as the related carried interest income is earned. ProfitAccordingly, profit sharing expenseamounts can be reversed during periods when there is a decline in carried interest income that was previously recognized.
Profit sharing amounts are generally not paid until the related carried interest is distributed to the general partner upon realization of the fund’s investments. Under certain profit sharing arrangements, a portion of the carried interest distributed to the general partner is allocated by issuance of restricted shares, rather than cash to employees. Prior to distribution of the carried interest to the general partner, the Company records the value of the restricted shares expected to be granted in other assets and other liabilities within the condensed consolidated statements of financial condition. Upon distribution of the carried interest to the general partner, the general partner expects to purchase the Class A restricted shares on behalf of employees and simultaneously grant those shares to the employee. Such shares are recorded as equity-based compensation expense over the relevant service period.
Additionally, profit sharing amounts previously distributed may be subject to clawback from employees, former employees and Contributing Partners. When applicable, the accrual for potential clawback of previously distributed profit sharing amounts, which is a component of due from related parties on the condensed consolidated statements of financial condition, represents all amounts previously distributed to employees, former employees and Contributing Partners that would need to be returned to the general partner if the Apollo funds were to be liquidated based on the current fair value of the underlying funds’ investments as of the reporting date. The actual general partner receivable, however, would not become realized until the end of a fund’s life.
Changes in the fair value of theProfit sharing payable also includes contingent consideration obligations that were recognized in connection with certain Apollo acquisitionsacquisitions. Changes in the fair value of the contingent consideration obligations are reflected in the Company’s condensed consolidated statements of operations as profit sharing expense.
The Company has a performance based incentive arrangement for certain Apollo partners and employees designed to more closely align compensation on an annual basis with the overall realized performance of the Company. This arrangement enables certain partners and employees to earn discretionary compensation based on carried interest realizations earned by the Company in a given year, which amounts are reflected in profit sharing expense in the accompanying condensed consolidated financial statements.
General, Administrative and Other Income (Loss)
Net Gains (Losses) from Investment Activities—Net gains (losses) from investment activities include both realized gains and losses and the change in unrealized gains and losses in the Company’sinvestments, at fair value between the opening reporting date and the closing reporting date.
Net Gains (Losses) from Investment Activities of Consolidated Variable Interest Entities—Changes in the fair value of the consolidated VIEs’ assets and liabilities and related interest, dividendGeneral, administrative and other incomeprimarily includes professional fees, occupancy, depreciation and expenses are presented within net gains (losses) from investment activitiesamortization, travel, information technology, and administration expenses. For the three and nine months ended September 30, 2016, the presentation of consolidated variable interest entitiesprofessional fees, occupancy, and are attributable to Non-Controlling Interests indepreciation and amortization was combined with general, administrative and other on the condensed consolidated statements of operations.
Income from Equity Method Investments—Income from equity method investments includes the Company’s share of net income generated from its investments in the private equity, credit and real estate funds it manages, which are not consolidated, but in which the Company exerts significant influence.
APOLLO GLOBAL MANAGEMENT, LLC
NOTES TO CONDENSED CONSOLIDATED
FINANCIAL STATEMENTS
(dollars in thousands, except share data, except where noted)
Other Income (Loss), Net—Other income (loss), net includes the recognition of gains (losses) arising from the remeasurement of foreign currency denominated assets and liabilities, reversal of a portion of the tax receivable agreement liability (see note 12), gains arising from extinguishment of contingent consideration obligations and other miscellaneous non-operating income and expenses.
Non-Controlling Interests—For entities that are consolidated, but not 100% owned, a portion of the income or loss and corresponding equity is allocatedoperations to owners other than Apollo. The aggregate of the income or loss and corresponding equity that is not owned by the Company is included in Non-Controlling Interests in the condensed consolidated financial statements. The Non-Controlling Interests relating to Apollo Global Management, LLC primarily include the ownership interest in the Apollo Operating Group held by the Managing Partners and Contributing Partners through their limited partner interests in Holdings and other ownership interests in consolidated entities. Non-Controlling Interests also include limited partner interests of Apollo managed funds in certain consolidated VIEs.
Non-Controlling Interests are presented as a separate component of shareholders’ equity on the Company’s condensed consolidated statements of financial condition. The primary components of Non-Controlling Interests are separately presented in the Company’s condensed consolidated statements of changes in shareholders’ equity to clearly distinguish the interest in the Apollo Operating Group and other ownership interests in the consolidated entities. Net income (loss) includes the net income (loss) attributableconform to the holders of Non-Controlling Interests on the Company’s condensed consolidated statements of operations. Profits and losses are allocated to Non-Controlling Interests in proportion to their relative ownership interests regardless of their basis.
Net Income (Loss) Per Class A Share—As Apollo has issued participating securities, U.S. GAAP requires use of the two-class method of computing earnings per share for all periods presented for each class of common stock and participating security as if all earnings for the period had been distributed. Under the two-class method, during periods of net income, the net income is first reduced for distributions declared on all classes of securities to arrive at undistributed earnings. During periods of net losses, the net loss is reduced for distributions declared on participating securities only if the security has the right to participate in the earnings of the entity and an objectively determinable contractual obligation to share in net losses of the entity. Participating securities include vested and unvested restricted share units (“RSUs”) that participate in distributions, as well as unvested restricted shares.
Whether during a period of net income or net loss, under the two-class method the remaining earnings are allocated to Class A shares and participating securities to the extent that each security shares in earnings as if all of the earnings for the period had been distributed. Earnings or losses allocated to each class of security are then divided by the applicable weighted average outstanding shares to arrive at basic earnings per share. For the diluted earnings, the denominator includes all outstanding Class A shares and includes the number of additional Class A shares that would have been outstanding if the dilutive potential Class A shares had been issued. The numerator is adjusted for any changes in income or loss that would result from the issuance of these potential Class A shares.current presentation.
Use of Estimates
The preparation of the condensed consolidated financial statements requires management to make estimates and assumptions that affect the reported amounts of assets and liabilities at the date of the condensed consolidated financial statements, the disclosure of contingent assets and liabilities at the date of the condensed consolidated financial statements and the reported amounts of revenues and expenses during the reporting periods. Apollo’s most significant estimates include goodwill, intangible assets, income taxes, carried interest income from related parties, contingent consideration obligationsobligation related to acquisitions,an acquisition, non-cash compensation, and fair value of investments and debt. Actual results could differ materially from those estimates.
APOLLO GLOBAL MANAGEMENT, LLC
NOTES TO CONDENSED CONSOLIDATED
FINANCIAL STATEMENTS
(dollars in thousands, except share data, except where noted)
Recent Accounting Pronouncements
In May 2014, the FASBFinancial Accounting Standards Board (“FASB”) issued guidance to establish a comprehensive and converged standard on revenue recognition to enable financial statement users to better understand and consistently analyze an entity’s revenue across industries, transactions, and geographies. The core principle of the new guidance isrequires that an entity should recognize revenue to depict the transfer of promised goods or services to customers in an amount that reflects the consideration to which the entity expects to be entitled in exchange for those goods or services. As such, thisservices (i.e., the transaction price). When determining the transaction price under the new guidance, could impactan entity may include variable consideration only to the timingextent that it is probable that a significant reversal in the amount of cumulative revenue recognition.recognized would not occur when the uncertainty associated with the variable consideration is resolved. The new guidance also requires improved disclosures to help users of financial statements better understand the nature, amount, timing, and uncertainty of revenue that is recognized. The new guidance will apply to all entities. In August 2015, the FASB issued its final standard formally amending the effective date of the new revenue recognition guidance. The amended guidance defers the effective date
APOLLO GLOBAL MANAGEMENT, LLC
NOTES TO CONDENSED CONSOLIDATED
FINANCIAL STATEMENTS
(dollars in thousands, except share data, except where noted)
of the new guidance to interim reporting periods within annual reporting periods beginning after December 15, 2017. Entities
Upon adoption, the guidance currently applied by the Company in which it recognizes carried interest income on an assumed liquidation basis at each reporting date will no longer be permitted. The Company expects the recognition of carried interest income from incentive fees, which are permitteda form of variable consideration, to applybe deferred until such fees are probable to not be significantly reversed. Incentive fees are carried interest income that is not a capital allocation to the general partner or investment manager.
Carried interest income that is a capital allocation to the general partner or investment manager, represents the remaining portion of carried interest income on the Company’s consolidated statements of operations. The determination of which carried interests are considered capital allocations is primarily based on the terms of the agreement. In connection with the adoption of the new revenue guidance, early, butthe Company will apply a new accounting policy for its carried interest income that is a capital allocation. The Company intends to account for such carried interest income as a financial instrument under the equity method of accounting. The pattern and amount of recognition under the new policy is not beforeexpected to differ materially from the original effective dateCompany’s existing recognition for such fees. Such carried interest income will be reported as a separate line item within revenue (i.e., interim periodsseparate from incentive fees). As capital allocation related carried interest income and the related general partner investment are considered to be a single unit of account under the Company’s new accounting policy, the equity method income associated with the general partner interests will be combined with the associated carried interest income and reported within annual periods beginning after December 15, 2016). revenue.
The Company is currently in the process of evaluatingimplementing the impact thatnew revenue guidance and is continuing to evaluate the effect this guidance will have on its condensed consolidated financial statements,other revenue streams, including the timing of the recognition of carried interest income.
In August 2014, the FASB issued guidance regarding management’s responsibility to evaluate whether there is substantial doubt about an entity’s ability to continue as a going concernmanagement fees and to provide related footnote disclosures. The new guidance requires that management evaluate each annualadvisory and interim reporting period whether conditions exist that give rise to substantial doubt about the entity’s ability to continue as a going concern within one year from the financial statement issuance date, and if so, provide related disclosures. Substantial doubt exists when conditions and events, considered in the aggregate, indicate that it is probable that a company will be unable to meet its obligations as they become due within one year after the financial statement issuance date. The new guidance applies to all companies. The guidance is effective for annual reporting periods ending after December 15, 2016, and for annual and interim periods thereafter. Early adoption is permitted. This guidance is not expected to have an impact on the condensed consolidated financial statements of the Company.
In May 2015, the FASB issued guidance to eliminate diversity in practice related to how certain investments measured at net asset value are categorized within the fair value hierarchy. The guidance removes the requirement to categorize within the fair value hierarchy all investments for which fair value is measured using the net asset value per share practical expedient. The guidance is effective for interim and annual reporting periods in fiscal years beginning after December 15, 2015. Pursuant to the guidance, a reporting entity should apply the amendments retrospectively to all periods presented. The retrospective approach requires that an investment for which fair value is measured using the net asset value per share practical expedient be removed from the fair value hierarchy in all periods presented in an entity’s financial statements. The Company adopted the guidance for the quarter ended March 31, 2016 and applied the guidance retrospectively. Adoption of the guidance did not have a material impact on the Company’s condensed consolidated financial statements. See note 5 for further disclosure related to the adoption of this guidance.
In January 2016, the FASB issued guidance that revises the accounting related to the classification and measurement of investments in equity securitiestransaction fees, as well as the presentationany principal versus agent considerations for certain fair value changes in financial liabilities measured at fair value, and amends certain disclosure requirements. The guidance requires that all equity investments, except those accounted for under the equity method of accounting or those resulting in the consolidation of the investee, be accounted for at fair value with all fair value changes recognized in income. For financial liabilities measured using the fair value option, the guidance requires that any change in fair value caused by a change in instrument-specific credit risk be presented separately in other comprehensive income until the liability is settled or reaches maturity. The guidance is effective for interim and annual reporting periods in fiscal years beginning after December 15, 2017, with early adoption permitted for certain provisions. A reporting entity would generally record a cumulative-effect adjustment to beginning retained earnings as of the beginning of the first reporting period in which the guidance is adopted.revenue gross versus net. The Company is inwill adopt the process of evaluating the impact that thisnew revenue recognition guidance will have on its condensed consolidated financial statements.effective January 1, 2018.
In February 2016, the FASB issued guidance that amends the accounting for leases. The amended guidance requires recognition of a lease asset and a lease liability by lessees for leases classified as operating leases. The recognition, measurement, and presentation of expenses and cash flows arising from a lease by a lessee have not significantly changed from existing guidance and accounting applied by a lessor is largely unchanged from existing guidance. The amended guidance is effective for interim and annual reporting periods in fiscal years beginning after December 15, 2018. Early application is permitted for all entities.
The Company expects its total assets and total liabilities on its condensed consolidated statements of financial condition to increase upon adoption of this guidance as a result of recording a lease asset and lease liability related to our operating leases. The Company is in the process of evaluatingcontinuing to evaluate the impact that this guidance will have on its condensed consolidated financial statements. The Company expects to adopt the new leasing guidance on January 1, 2019.
In March 2016, the FASB issued amended guidance that amendson stock compensation. The amendments are intended to simplify several aspects of the principal versus agent considerationsaccounting for reporting revenue gross versus net.share-based payment transactions, including the accounting for excess tax benefits, forfeitures, and cash flows. The amended guidance affects entitiesrequires that enter into contracts with customersall excess tax benefits and deficiencies related to transfer goods or servicesshare-based payment transactions be recognized through the income tax provision (benefit) in exchange for consideration. Underthe condensed consolidated statement of operations. Further, the amended guidance when another party is involved in providing goods or services to a customer,permits an entity must determine whetherto make an accounting policy election either to estimate the naturenumber of its promise isforfeitures expected to provide the specified good or service itself (that is, the entity is a principal)occur or to arrangeaccount for that good or service to be provided by the other party (that is, the entity is an agent). An entity is a principal if it controls the specified good or service before that good or service is transferred to a customer.forfeitures when they occur. The amended guidance includes indicatorsalso requires excess tax benefits related to assist an entityshare-based payment transactions to be presented as operating activities and employee taxes paid to be presented as financing activities in determining whether it controls a specified good or service before it is transferred to the customer.condensed consolidated statement of cash flows. The amended guidance affectsis effective for interim and annual reporting periods in fiscal years beginning after December 15, 2016. The Company adopted the guidance induring the new revenue standard issued in May 2014, which is not yet effective. The effective date and transition requirements for the amended guidance are the same as the effective date and transition requirements for the new revenue standard. The Company is in the processfirst quarter of evaluating the impact that this guidance will have on its condensed consolidated financial statements.2017.
APOLLO GLOBAL MANAGEMENT, LLC
NOTES TO CONDENSED CONSOLIDATED
FINANCIAL STATEMENTS
(dollars in thousands, except share data, except where noted)
In March 2016,Amendments relating to the FASB issued guidance that amends the accounting for employee share-based payment awards. The amended guidance affects all entities that issue share-based payment awards to their employees. The amended guidance affects several aspects of accounting for share-based payment transactions including: (1) accounting for income taxes: all excess tax benefits and tax deficiencies should be recognized as income tax expense or benefit in the statements of operations, (2) classificationrecognition of excess tax benefits onin the condensed consolidated statements of operations and impacts to the condensed consolidated statements of cash flows:flows have been applied prospectively, with the exception of a $22.9 million cumulative effect adjustment, as of January 1, 2017, to deferred tax assets with a corresponding decrease to accumulated deficit relating to previously unrecognized excess tax benefits should be classified along with other income tax cash flows asbenefits.
For forfeitures, the Company made an operating activity, (3) forfeitures: an entity can make an entity-wide accounting policy election to eitherno longer estimate forfeitures in determining the number of equity-based awards that are expected to vest or accountvest. Under the Company’s new policy, forfeitures are accounted for forfeitures when they occur, (4) minimum statutory tax withholding requirements: the threshold to qualify for equity classification permits withholding up to the maximum statutory tax rates in the applicable jurisdictions; and (5) classificationoccur. Any adjustments have been reflected prospectively as of employee taxes paid on the statements of cash flows when an employer withholds shares for tax-withholding purposes: cash paid by an employer when directly withholding shares for tax-withholding purposes should be classified as a financing activity. The amended guidance is effective for interim and annual reporting periods in fiscal years beginning after December 15, 2016. Early adoption is permitted. The Company is in the process of evaluating the impact that this guidance will have on its condensed consolidated financial statements.January 1, 2017.
In August 2016, the FASB issued guidance intended to reduce diversity in practice in how certain cash receipts and payments are classified in the statementstatements of cash flows, including debt prepayment or extinguishment costs, the settlement of contingent liabilities arising from a business combination, proceeds from insurance settlements, and distributions from certain equity method investments.flows. The guidance is effective for interim and annual periods beginning after December 15, 2017. Early adoption is permitted. The Company is inearly adopted the processguidance during the first quarter of evaluating the impact that2017. Adoption of this guidance willdid not have an impact on itsthe Company’s condensed consolidated financial statements.
In October 2016, the FASB issued guidance that amends the consolidation guidance issued in February 2015. Under the amended guidance a decision maker will need to consider only its proportionate indirect interest in a VIE that is held through a related party under common control. Under the originally issued guidance, a decision maker treats the interest of the related party under common control in the VIE as if the decision maker held the interest itself. The amended guidance is effective for interim and annual reporting periods in fiscal years beginning after December 15, 2016. The Company adopted the guidance during the first quarter of 2017. Adoption of this guidance did not have an impact on the Company’s condensed consolidated financial statements.
In November 2016, the FASB issued guidance to reduce diversity in practice in the classification and presentation of changes in restricted cash on the statements of cash flows. The new guidance requires that a statement of cash flows explain the change during the period in the total of cash, cash equivalents, and amounts generally described as restricted cash. Entities will also be required to reconcile such total to amounts on the Company’s condensed consolidated statements of financial condition and disclose the nature of the restrictions. The guidance is effective for interim and annual periods beginning after December 15, 2017. Early adoption is permitted for all entities.permitted. The Company is in the process of evaluating the impact that this guidance will have on its condensed consolidated financial statements.
3. INVESTMENTS
The following table represents Apollo’s investments:
| | | | As of
September 30, 2016 | | As of
December 31, 2015 | As of
September 30, 2017 | | As of
December 31, 2016 |
| Investments, at fair value | $ | 619,684 |
| | $ | 539,080 |
| $ | 852,350 |
| | $ | 708,080 |
|
| Equity method investments | 771,314 |
| | 615,669 |
| 855,714 |
| | 786,664 |
|
| Total Investments | $ | 1,390,998 |
| | $ | 1,154,749 |
| $ | 1,708,064 |
| | $ | 1,494,744 |
|
Investments, at Fair Value
Investments, at fair value, consist of investments for which the fair value option has been elected and include the Company’s investment in Athene Holding, investments held by the Company’s consolidated funds, investments in debt of unconsolidated CLOs, and other investments held by the Company. See note 5 for further discussion regarding investments, at fair value.
APOLLO GLOBAL MANAGEMENT, LLC
NOTES TO CONDENSED CONSOLIDATED
FINANCIAL STATEMENTS
(dollars in thousands, except share data, except where noted)
Net Gains from Investment Activities
The following table presents the realized and net change in unrealized gains on investments, at fair value for the three and nine months ended September 30, 20162017 and 2015:2016:
| | | | For the Three Months Ended September 30, | | For the Nine Months Ended September 30, | For the Three Months Ended September 30, | | For the Nine Months Ended September 30, |
| | 2016 | | 2015 | | 2016 | | 2015 | 2017 | | 2016 | | 2017 | | 2016 |
| Realized gains on sales of investments | $ | 472 |
| | $ | 33 |
| | $ | 375 |
| | $ | 187 |
| $ | 162 |
| | $ | 472 |
| | $ | 14 |
| | $ | 375 |
|
Net change in unrealized gains due to changes in fair value(1) | 17,274 |
| | 80,917 |
| | 49,912 |
| | 107,305 |
| 68,770 |
| | 17,274 |
| | 102,922 |
| | 49,912 |
|
| Net gains from investment activities | $ | 17,746 |
| | $ | 80,950 |
| | $ | 50,287 |
| | $ | 107,492 |
| $ | 68,932 |
| | $ | 17,746 |
| | $ | 102,936 |
| | $ | 50,287 |
|
| |
| (1) | Primarily relates to the Company’s investment in Athene Holding. See note 5 for further information regarding the Company’s investment in Athene Holding. |
Equity Method Investments
Apollo’s equity method investments include its investments in Apollothe private equity, credit and real estateassets funds it manages, which are not consolidated, but in which the Company exerts significant influence. Apollo’s share of net income generated by these investments is recorded within income from equity method investments in the condensed consolidated statements of operations.
Equity method investments excluding those for which the fair value option was elected, as of September 30, 20162017 and December 31, 20152016 consisted of the following:
| | | | Equity Held as of | Equity Held as of |
| | September 30, 2016(5) | | December 31, 2015(5) | September 30, 2017 | (5) | December 31, 2016 | (5) |
Private Equity(1)(2) | $ | 410,018 |
| | $ | 273,074 |
| $ | 495,409 |
| | $ | 428,581 |
| |
Credit(1)(3) | 330,529 |
| | 313,116 |
| 330,918 |
| | 327,012 |
| |
| Real Estate | 30,767 |
| | 29,479 |
| |
| Real Assets | | 29,387 |
| | 31,071 |
| |
Total equity method investments(4) | $ | 771,314 |
| | $ | 615,669 |
| $ | 855,714 |
| | $ | 786,664 |
| |
| |
| (1) | As of September 30, 2017, equity method investments include Fund VIII (Private Equity) and MidCap (Credit) of $340.3 million and $79.9 million, respectively, representing an ownership percentage of 2.2% and 4.3%, respectively. As of December 31, 2016, equity method investments include Fund VIII (Private Equity) and MidCap (Credit) of $242.8$260.9 million and $81.0$79.5 million, respectively, representing an ownership percentage of 2.2% and 4.7%, respectively. As of December 31, 2015, equity method investments include Fund VIII (Private Equity) and MidCap (Credit) of $116.4 million and $79.3 million, respectively, representing an ownership percentage of 2.2% and 4.9%4.3%, respectively. |
| |
| (2) | The value of the Company’sequity method investment in AP Alternative Assets, L.P. (“AAA”) was $52,687$51.8 million and $57,159$66.8 million as of September 30, 2017 and December 31, 2016, respectively. The value of the Company’s investment in AAA was $51.9 million and $64.9 million based on the quoted market price as of September 30, 20162017 and December 31, 2015,2016, respectively. |
| |
| (3) | The equity method investment in AINV was $56.6 million and $58.6 million as of September 30, 2017 and December 31, 2016, respectively. The value of the Company’s investment in AINV was $51,534$54.3 million and $41,833$52.1 million based on the quoted market price as of September 30, 20162017 and December 31, 2015,2016, respectively. |
| |
| (4) | Certain funds invest across multiple segments. The presentation in the table above is based on the classification of the majority of such funds’ investments. |
| |
| (5) | Some amounts are included a quarter in arrears. |
APOLLO GLOBAL MANAGEMENT, LLC
NOTES TO CONDENSED CONSOLIDATED
FINANCIAL STATEMENTS
(dollars in thousands, except share data, except where noted)
As of September 30, 20162017 and for the three and nine months ended September 30, 2016,2017, no equity method investment held by Apollo met the significance criteria as defined by the SEC. The following tables present summarized financial information of Athene Holding, for which the fair value option was elected, for the three and nine months ended September 30, 2016 and 2015. Although the following disclosure is not required by the significance criteria for the quarterthree and nine months ended September 30, 2016, for consistency purposes2017, the Company chose to continue to include this information as it was includeddisclosed in its quarterly report on Form 10-Q2016 Annual Report. The following table presents summarized financial information of Athene Holding for the quarterthree and nine months ended JuneSeptember 30, 2016.2017 and 2016:
| | | | For the Three Months Ended September 30, | | For the Nine Months Ended September 30, | For the Three Months Ended September 30, | | For the Nine Months Ended September 30, |
| | 2016(1) | | 2015(1) | | 2016(1) | | 2015(1) | 2017 | (1) | 2016 | | 2017 | (1) | 2016 |
| | in millions | (in millions) |
| Statements of Operations | | | | | | | | | | | | | | |
| Revenues | $ | 1,047 |
| | $ | 544 |
| | $ | 2,818 |
| | $ | 2,554 |
| $ | 1,763 |
| | $ | 1,272 |
| | $ | 4,448 |
| | $ | 3,039 |
|
| Expenses | 839 |
| | 413 |
| | 2,309 |
| | 1,981 |
| 1,426 |
| | 1,234 |
| | 3,320 |
| | 2,708 |
|
| Income before income tax provision | 208 |
| | 131 |
| | 509 |
| | 573 |
| |
| Income before income tax provision (benefit) | | 337 |
| | 38 |
| | 1,128 |
| | 331 |
|
| Income tax provision (benefit) | 16 |
| | 27 |
| | (29 | ) | | 62 |
| 11 |
| | (88 | ) | | 54 |
| | (73 | ) |
| Net income | 192 |
| | 104 |
| | 538 |
| | 511 |
| |
| Net income attributable to Non-Controlling Interests | — |
| | — |
| | — |
| | (46 | ) | |
| Net income available to Athene common shareholders | $ | 192 |
| | $ | 104 |
| | $ | 538 |
| | $ | 465 |
| |
| Net income available to Athene Holding common shareholders | | $ | 326 |
| | $ | 126 |
| | $ | 1,074 |
| | $ | 404 |
|
| |
| (1) | The financial statement information for the three and nine months ended September 30, 2016 and 20152017 is presented a quarter in arrears and is comprised of the financial information for the three and nine months ended June 30, 2016 and 2015,2017, which represents the latest available financial information as of the date of this report. |
4. VARIABLE INTEREST ENTITIES
As described in note 2, the Company consolidates entities that are VIEs for which the Company has been designated as the primary beneficiary. There is no recourse to the Company for the consolidated VIEs’ liabilities.
Consolidated Variable Interest Entities
Apollo has consolidated VIEs in accordance with the policy described in note 2. Through its role as investment manager of these VIEs, the Company determined that Apollo has the power to direct the activities that most significantly impact the economic performance of these VIEs. Additionally, Apollo determined that its interests, both directly and indirectly from these VIEs, represent rights to returns that could potentially be significant to such VIEs. As a result, Apollo determined that it is the primary beneficiary and therefore should consolidate the VIEs.
Consolidated CLOs
Certain CLOs are consolidated by Apollo as the Company is considered to hold a controlling financial interest through direct and indirect interests in these CLOs exclusive of management and performance based fees received. Through its role as collateral manager of these VIEs, the Company determined that Apollo has the power to direct the activities that most significantly impact the economic performance of these VIEs. These CLOs were formed for the sole purpose of issuing collateralized notes to investors. The assets of these VIEs are primarily comprised of senior secured loans and the liabilities are primarily comprised of debt.
The assets of these consolidated CLOs are not available to creditors of the Company. In addition, the investors in these consolidated CLOs have no recourse against the assets of the Company. The Company measures both the financial assets and the financial liabilities of the CLOs using the fair value of the financial assets as further described in note 2. The Company has elected the fair value option for financial instruments held by its consolidated CLOs, which includes investments in loans and corporate bonds, as well as debt obligations and contingent obligations held by such consolidated CLOs. Other assets include amounts due from brokers and interest receivables. Other liabilities include payables for securities purchased, which represent open trades within the consolidated VIEs and primarily relate to corporate loans that are expected to settle within the next 60 days. From time to time, Apollo makes investments in certain consolidated CLOs denominated in foreign currencies. As of September 30, 2017 and December 31, 2016, the Company held investments of $46.6 million and $41.3 million, respectively, in consolidated foreign currency denominated CLOs, which eliminate in consolidation.
APOLLO GLOBAL MANAGEMENT, LLC
NOTES TO CONDENSED CONSOLIDATED
FINANCIAL STATEMENTS
(dollars in thousands, except share data, except where noted)
and December 31, 2015, the Company held an investment of $44.2 million and $42.3 million, respectively, in consolidated foreign currency denominated CLOs, which eliminates in consolidation.
Net Gains from Investment Activities of Consolidated Variable Interest Entities
The following table presents net gains from investment activities of the consolidated VIEs for the three and nine months ended September 30, 20162017 and 2015: 2016:
| | | | For the Three Months Ended September 30, | | For the Nine Months Ended September 30, | For the Three Months Ended
September 30, | | For the Nine Months Ended
September 30, | |
| | 2016 | | 2015 | | 2016 | | 2015 | 2017 | (1) | 2016 | (1) | 2017 | (1) | 2016 | (1) |
| Net gains (losses) from investment activities | $ | 9,466 |
| | $ | (1,558 | ) | | $ | 7,341 |
| | $ | 8,516 |
| $ | (272 | ) | | $ | 9,466 |
| | $ | 9,244 |
| | $ | 7,341 |
| |
| Net gains (losses) from debt | (7,745 | ) | | 9,727 |
| | (9,182 | ) | | 2,798 |
| 635 |
| | (7,745 | ) | | 3,319 |
| | (9,182 | ) | |
| Interest and other income | 11,404 |
| | 9,994 |
| | 34,913 |
| | 28,042 |
| 9,977 |
| | 11,404 |
| | 26,420 |
| | 34,913 |
| |
| Interest and other expenses | (12,325 | ) | | (17,252 | ) | | (30,255 | ) | | (31,317 | ) | (9,495 | ) | | (12,325 | ) | | (27,898 | ) | | (30,255 | ) | |
| Net gains from investment activities of consolidated variable interest entities | $ | 800 |
| | $ | 911 |
| | $ | 2,817 |
| | $ | 8,039 |
| $ | 845 |
| | $ | 800 |
| | $ | 11,085 |
| | $ | 2,817 |
| |
| |
| (1) | Amounts reflect consolidation eliminations. |
Senior Secured Notes, Subordinated Notes and Subordinated NoteSecured Borrowingss——Included within debt are amounts due to third-party institutions by the consolidated VIEs. The following table summarizes the principal provisions of the debt of the consolidated VIEs as of September 30, 20162017 and December 31, 2015:2016:
| | | | As of September 30, 2016 | | As of December 31, 2015 | As of September 30, 2017 | | As of December 31, 2016 |
| | Principal Outstanding | | Weighted Average Interest Rate | | Weighted Average Remaining Maturity in Years | | Principal Outstanding | | Weighted Average Interest Rate | | Weighted Average Remaining Maturity in Years | Principal Outstanding | | Weighted Average Interest Rate | | Weighted Average Remaining Maturity in Years | | Principal Outstanding | | Weighted Average Interest Rate | | Weighted Average Remaining Maturity in Years |
Senior Secured Notes(2)(3) | $ | 761,340 |
| | 1.91 | % | | 11.3 | | $ | 735,792 |
| | 2.17 | % | | 12.1 | $ | 794,748 |
| | 1.68 | % | | 12.4 | | $ | 704,976 |
| | 1.83 | % | | 12.3 |
Subordinated Notes(2)(3) | 85,225 |
| | N/A |
| (1) | 14.4 | | 82,365 |
| | N/A |
| (1) | 15.1 | 98,602 |
| | N/A |
| (1) | 22.7 | | 87,794 |
| | N/A |
| (1) | 19.2 |
Secured Borrowings(4) | | 90,461 |
| | 3.00 | % | | 9.5 | | — |
| | N/A |
| | N/A |
| Total | $ | 846,565 |
| | | | $ | 818,157 |
| | | | $ | 983,811 |
| | | | $ | 792,770 |
| | | |
| |
| (1) | The subordinated notes do not have contractual interest rates but instead receive distributions from the excess cash flows of the VIEs. |
| |
| (2) | The fair value of Senior Secured Notes, and Subordinated Notes and Secured Borrowings as of September 30, 20162017 and December 31, 20152016 was $838.7$972.6 million and $801.3$786.5 million, respectively. |
| |
| (3) | The debt at fair value of the consolidated VIEs is collateralized by assets of the consolidated VIEs and assets of one vehicle may not be used to satisfy the liabilities of another vehicle. As of September 30, 20162017 and December 31, 2015,2016, the fair value of the assets of the consolidated VIE assetsVIEs was $1,049.8$1,278.5 million and $1,030.8$1,001.8 million, respectively. This collateral consisted of cash and cash equivalents, investments, at fair value, and other assets. |
| |
| (4) | Secured borrowings consist of a consolidated VIE’s obligation through a repurchase agreement redeemable at maturity with a third party lender. The fair value of the secured borrowings as of September 30, 2017 was $90.5 million. |
The consolidated VIEs’ debt obligations contain various customary loan covenants as described above.covenants. As of September 30, 2016,2017, the Company was not aware of any instances of non-compliance with any of these covenants.
Variable Interest Entities Which are Not Consolidated
The Company holds variable interests in certain VIEs which are not consolidated, as it has been determined that Apollo is not the primary beneficiary.
APOLLO GLOBAL MANAGEMENT, LLC
NOTES TO CONDENSED CONSOLIDATED
FINANCIAL STATEMENTS
(dollars in thousands, except share data, except where noted)
The following tables presenttable presents the carrying amounts of the assets and liabilities of the VIEs for which Apollo has concluded that it holds a significant variable interest, but that it is not the primary beneficiary as of September 30, 20162017 and December 31, 2015.2016. In addition, the tables presenttable presents the maximum exposure to losses relating to these VIEs.
|
| | | | | | | | | | | | |
| | As of September 30, 2016 |
| | Total Assets | | Total Liabilities | | Apollo Exposure | |
| Total | $ | 6,960,498 |
| (1) | $ | 2,764,793 |
| (2) | $ | 262,352 |
| (3) |
|
| | | | | | | |
| | As of
September 30, 2017 | | As of
December 31, 2016 |
| Assets: | | | |
| Cash | $ | 334,339 |
| | $ | 231,922 |
|
| Investments | 7,389,027 |
| | 7,253,872 |
|
| Receivables | 68,390 |
| | 37,541 |
|
| Total Assets | $ | 7,791,756 |
| | $ | 7,523,335 |
|
| | | | |
| Liabilities: | | | |
| Debt and other payables | $ | 3,089,584 |
| | $ | 2,818,459 |
|
| Total Liabilities | $ | 3,089,584 |
| | $ | 2,818,459 |
|
| | | | |
Apollo Exposure(1) | $ | 282,240 |
| | $ | 272,191 |
|
| |
| (1) | Consists of $327.9 million in cash, $6,609.0 million in investments and $23.5 million in receivables. |
| |
(2) | Represents $2,764.8 million in debt and other payables. |
| |
(3) | Represents Apollo’s direct investment in those entities in which Apollo holds a significant variable interest and certain other investments. Additionally, cumulative carried interest income is subject to reversal in the event of future losses. The maximum amount of future reversal of carried interest income from all of Apollo’s funds, including those entities in which Apollo holds a significant variable interest, was $2.7$3.6 billion and $2.9 billion as of September 30, 2017 and December 31, 2016, respectively, as discussed in note 13. |
|
| | | | | | | | | | | | |
| | As of December 31, 2015 |
| | Total Assets | | Total Liabilities | | Apollo Exposure | |
| Total | $ | 5,378,456 |
| (1) | $ | 1,626,743 |
| (2) | $ | 202,146 |
| (3) |
| |
(1) | Consists of $219.8 million in cash, $5,149.0 million in investments and $9.6 million in receivables. |
| |
(2) | Represents $1,626.7 million in debt and other payables. |
| |
(3) | Represents Apollo’s direct investment in those entities in which Apollo holds a significant variable interest. Additionally, cumulative carried interest income is subject to reversal in the event of future losses. The maximum amount of future reversal of carried interest income from all of Apollo’s funds, including those entities in which Apollo holds a significant variable interest, was $2.4 billion as of December 31, 2015.14. |
5. FAIR VALUE MEASUREMENTS OF FINANCIAL INSTRUMENTS
The following tables summarize the valuation of the Company’s financial assets and financial liabilities for which therecorded at fair value option has been elected by the fair value hierarchy level as of September 30, 20162017 and December 31, 2015, respectively:2016.
| | | | As of September 30, 2016 | As of September 30, 2017 |
| | Level I(1) | | Level II(1) | | Level III | | Total | | Cost of Investments, at Fair Value | Level I(1) | | Level II(1) | | Level III | | Total | | Cost |
| Assets | | | | | | | | | | | | | | | | | | |
| U.S. Treasury securities, at fair value | | $ | 198,900 |
| | $ | — |
| | $ | — |
| | $ | 198,900 |
| | $ | 198,868 |
|
| Investments, at fair value: | | | | | | | | | | | | | | | | | | |
| Investments of Consolidated Apollo Funds | $ | 968 |
| | $ | 13,334 |
| | $ | 321 |
| | $ | 14,623 |
| | $ | 14,869 |
| |
| Investments of consolidated Apollo funds | | 1,077 |
| | 237 |
| | 664 |
| | 1,978 |
| | 1,827 |
|
| Other investments | — |
| | — |
| | 46,232 |
| | 46,232 |
| | 45,340 |
| — |
| | — |
| | 64,726 |
| | 64,726 |
| | 62,464 |
|
Investment in Athene Holding(2) | — |
| | — |
| | 558,829 |
| | 558,829 |
| | 387,526 |
| — |
| | 785,646 |
| | — |
| | 785,646 |
| | 387,526 |
|
| Total investments, at fair value | 968 |
| | 13,334 |
| | 605,382 |
| | 619,684 |
| (7) | $ | 447,735 |
| 1,077 |
| | 785,883 |
| | 65,390 |
| | 852,350 |
| (7) | 451,817 |
|
Investments of VIEs, at fair value(3) | — |
| | 834,834 |
| | 106,534 |
| | 941,368 |
| |
|
| — |
| | 1,029,599 |
| | 135,577 |
| | 1,165,176 |
| |
|
|
Investments of VIEs, valued using NAV(4) | — |
| | — |
| | — |
| | 5,166 |
| | | |
| Investments of VIEs, valued using NAV | | — |
| | — |
| | — |
| | 5,374 |
| | |
| Total investments of VIEs, at fair value | — |
| | 834,834 |
| | 106,534 |
| | 946,534 |
| | | — |
| | 1,029,599 |
| | 135,577 |
| | 1,170,550 |
| | |
| Derivative assets | — |
| | 965 |
| | — |
| | 965 |
| | | — |
| | 439 |
| | — |
| | 439 |
| | |
| Total Assets | $ | 968 |
| | $ | 849,133 |
| | $ | 711,916 |
| | $ | 1,567,183 |
| | | $ | 199,977 |
| | $ | 1,815,921 |
| | $ | 200,967 |
| | $ | 2,222,239 |
| | |
| | | | | | | | | | | | | | | | | | | |
| Liabilities | | | | | | | | | | | | | | | | | | |
| Liabilities of consolidated Apollo funds | | $ | 21 |
| | $ | 596 |
| | $ | — |
| | $ | 617 |
| | |
Liabilities of VIEs, at fair value(3)(5) | $ | — |
| | $ | 838,704 |
| | $ | 11,807 |
| | $ | 850,511 |
| | | — |
| | 972,632 |
| | 12,416 |
| | 985,048 |
| | |
Contingent consideration obligations(6) | — |
| | — |
| | 81,219 |
| | 81,219 |
| | | — |
| | — |
| | 87,300 |
| | 87,300 |
| | |
| Derivative liabilities | — |
| | 1,429 |
| | — |
| | 1,429 |
| | | |
Derivative liabilities(4) | | — |
| | 1,439 |
| | — |
| | 1,439 |
| | |
| Total Liabilities | $ | — |
| | $ | 840,133 |
| | $ | 93,026 |
| | $ | 933,159 |
| | | $ | 21 |
| | $ | 974,667 |
| | $ | 99,716 |
| | $ | 1,074,404 |
| | |
APOLLO GLOBAL MANAGEMENT, LLC
NOTES TO CONDENSED CONSOLIDATED
FINANCIAL STATEMENTS
(dollars in thousands, except share data, except where noted)
| | | | As of December 31, 2015 | As of December 31, 2016 |
| | Level I(1) | | Level II(1) | | Level III | | Total | | Cost of Investments,
at Fair Value | Level I(1) | | Level II(1) | | Level III | | Total | | Cost |
| Assets | | | | | | | | | | | | | | | | | | |
| Investments, at fair value: | | | | | | | | | | | | | | | | | | |
| Investments of Consolidated Apollo Funds | $ | — |
| | $ | 26,913 |
| | $ | 1,634 |
| | $ | 28,547 |
| | $ | 29,344 |
| |
| Investments of consolidated Apollo funds | | $ | 3,336 |
| | $ | 1,475 |
| | $ | 567 |
| | $ | 5,378 |
| | $ | 5,463 |
|
| Other investments | — |
| | — |
| | 434 |
| | 434 |
| | 831 |
| — |
| | — |
| | 45,154 |
| | 45,154 |
| | 47,690 |
|
Investment in Athene Holding(2) | — |
| | — |
| | 510,099 |
| | 510,099 |
| | 387,526 |
| — |
| | 657,548 |
| | — |
| | 657,548 |
| | 387,526 |
|
| Total investments, at fair value | — |
| | 26,913 |
| | 512,167 |
| | 539,080 |
| (7) | $ | 417,701 |
| 3,336 |
| | 659,023 |
| | 45,721 |
| | 708,080 |
| (7) | 440,679 |
|
Investments of VIEs, at fair value(4)(3) | — |
| | 803,412 |
| | 100,941 |
| | 904,353 |
| |
|
| — |
| | 816,167 |
| | 92,474 |
| | 908,641 |
| |
|
|
Investments of VIEs, valued using NAV (4) | — |
| | — |
| | — |
| | 6,213 |
| | | — |
| | — |
| | — |
| | 5,186 |
| | |
| Total investments of VIEs, at fair value | — |
| | 803,412 |
| | 100,941 |
| | 910,566 |
| | | — |
| | 816,167 |
| | 92,474 |
| | 913,827 |
| | |
| Derivative assets | | — |
| | 1,360 |
| | — |
| | 1,360 |
| | |
| Total Assets | $ | — |
| | $ | 830,325 |
| | $ | 613,108 |
| | $ | 1,449,646 |
| | | $ | 3,336 |
| | $ | 1,476,550 |
| | $ | 138,195 |
| | $ | 1,623,267 |
| | |
| | | | | | | | | | | | | | | | | | | |
| Liabilities | | | | | | | | | | | | | | | | | | |
Liabilities of VIEs, at fair value(3)(5) | $ | — |
| | $ | 801,270 |
| | $ | 11,411 |
| | $ | 812,681 |
| | | $ | — |
| | $ | 786,545 |
| | $ | 11,055 |
| | $ | 797,600 |
| | |
Contingent consideration obligations(6) | — |
| | — |
| | 79,579 |
| | 79,579 |
| | | — |
| | — |
| | 106,282 |
| | 106,282 |
| | |
Derivative liabilities(4) | | — |
| | 1,167 |
| | — |
| | 1,167 |
| | |
| Total Liabilities | $ | — |
| | $ | 801,270 |
| | $ | 90,990 |
| | $ | 892,260 |
| | | $ | — |
| | $ | 787,712 |
| | $ | 117,337 |
| | $ | 905,049 |
| | |
| |
| (1) | All Level I and Level II assets and liabilities were valued using third party pricing.pricing, with the exception of the investment in Athene Holding. |
| |
| (2) | See note 1213 for further disclosure regarding the investment in Athene Holding. |
| |
| (3) | See note 4 for further disclosure regarding VIEs. |
| |
| (4) | Pursuant to the adoptionDerivative liabilities are presented as a component of amended fair value guidance effective January 1, 2016, investments for which fair value is based on NAV are no longer required to be included in the fair value hierarchy. As such, prior periods have been recast to conform with the current period presentation. The fair value amounts presented in this table are intended to permit reconciliation of the fair value hierarchy disclosure to the amounts presentedOther liabilities in the condensed consolidated statementstatements of financial condition. See note 2 for further discussion of the newly adopted accounting guidance. |
| |
| (5) | As of September 30, 2016, liabilities of VIEs, at fair value included debt and other liabilities of $838.7 million and $11.8 million, respectively. As of December 31, 2015, liabilities of VIEs, at fair value included debt and other liabilities of $801.3 million and $11.4 million, respectively. Other liabilities include contingent obligations classified as Level III. |
| |
| (6) | See note 1314 for further disclosure regarding contingent consideration obligations. |
| |
| (7) | See note 3 to our condensed consolidated financial statements for further detail regarding our investments at fair value and reconciliation to the condensed consolidated statements of financial condition. |
There were no transfers of financial assets or liabilities between Level I and Level II for the three and nine months ended September 30, 20162017 and 2015.
APOLLO GLOBAL MANAGEMENT, LLC
NOTES TO CONDENSED CONSOLIDATED
FINANCIAL STATEMENTS
(dollars in thousands, except share data, except where noted)
2016.
The following tables summarize the changes in fair value in financial assets measured at fair value for which Level III inputs have been used to determine fair value for the three months ended September 30, 20162017 and 2015, respectively:2016:
| | | | For the Three Months Ended September 30, 2016 | For the Three Months Ended September 30, 2017 |
| | Investments of Consolidated Apollo Funds | | Other Investments | | Investment in Athene Holding | | Investments of Consolidated VIEs | | Total | Investments of Consolidated Apollo Funds | | Other Investments | | Investments of Consolidated VIEs | | Total |
| Balance, Beginning of Period | $ | 2,853 |
| | $ | 44,753 |
| | $ | 542,437 |
| | $ | 112,690 |
| | $ | 702,733 |
| $ | 624 |
| | $ | 53,098 |
| | $ | 170,666 |
| | $ | 224,388 |
|
| Purchases | — |
| | 334 |
| | — |
| | 11,040 |
| | 11,374 |
| — |
| | 10,075 |
| | 21,729 |
| | 31,804 |
|
| Sales of investments/distributions | (1,361 | ) | | — |
| | — |
| | (11,204 | ) | | (12,565 | ) | — |
| | — |
| | (21,119 | ) | | (21,119 | ) |
| Net realized gains | 15 |
| | — |
| | — |
| | 86 |
| | 101 |
| — |
| | — |
| | 154 |
| | 154 |
|
| Changes in net unrealized gains (losses) | 107 |
| | 939 |
| | 16,392 |
| | (215 | ) | | 17,223 |
| |
| Changes in net unrealized gains | | 40 |
| | 18 |
| | 1,791 |
| | 1,849 |
|
| Cumulative translation adjustment | — |
| | 206 |
| | — |
| | 1,004 |
| | 1,210 |
| — |
| | 1,535 |
| | 3,145 |
| | 4,680 |
|
Transfer into Level III(1) | — |
| | — |
| | — |
| | 8,755 |
| | 8,755 |
| |
Transfer out of Level III(1) | (1,293 | ) | | — |
| | — |
| | (15,622 | ) | | (16,915 | ) | |
| Transfer out of Level III | | — |
| | — |
| | (40,789 | ) | | (40,789 | ) |
| Balance, End of Period | $ | 321 |
| | $ | 46,232 |
| | $ | 558,829 |
| | $ | 106,534 |
| | $ | 711,916 |
| $ | 664 |
| | $ | 64,726 |
| | $ | 135,577 |
| | $ | 200,967 |
|
| Change in net unrealized gains included in net gains from investment activities related to investments still held at reporting date | $ | 51 |
| | $ | 939 |
| | $ | 16,392 |
| | $ | — |
| | $ | 17,382 |
| $ | 40 |
| | $ | 18 |
| | $ | — |
| | $ | 58 |
|
| Change in net unrealized losses included in net gains from investment activities of consolidated VIEs related to investments still held at reporting date | — |
| | — |
| | — |
| | (358 | ) | | (358 | ) | |
| Change in net unrealized gains included in net gains from investment activities of consolidated VIEs related to investments still held at reporting date | | — |
| | — |
| | 1,330 |
| | 1,330 |
|
APOLLO GLOBAL MANAGEMENT, LLC
NOTES TO CONDENSED CONSOLIDATED
FINANCIAL STATEMENTS
(dollars in thousands, except share data, except where noted)
|
| | | | | | | | | | | | | | | | | | | |
| | For the Three Months Ended September 30, 2016 |
| | Investments of Consolidated Apollo Funds | | Other Investments | | Investment in Athene Holding | | Investments of Consolidated VIEs | | Total |
| Balance, Beginning of Period | $ | 2,853 |
| | $ | 44,753 |
| | $ | 542,437 |
| | $ | 112,690 |
| | $ | 702,733 |
|
| Purchases | — |
| | 334 |
| | — |
| | 11,040 |
| | 11,374 |
|
| Sale of investments/distributions | (1,361 | ) | | — |
| | — |
| | (11,204 | ) | | (12,565 | ) |
| Net realized gains | 15 |
| | — |
| | — |
| | 86 |
| | 101 |
|
| Changes in net unrealized gains (losses) | 107 |
| | 939 |
| | 16,392 |
| | (215 | ) | | 17,223 |
|
| Cumulative translation adjustment | — |
| | 206 |
| | — |
| | 1,004 |
| | 1,210 |
|
Transfer into Level III(1) | — |
| | — |
| | — |
| | 8,755 |
| | 8,755 |
|
Transfer out of Level III(1) | (1,293 | ) | | — |
| | — |
| | (15,622 | ) | | (16,915 | ) |
| Balance, End of Period | $ | 321 |
| | $ | 46,232 |
| | $ | 558,829 |
| | $ | 106,534 |
| | $ | 711,916 |
|
| Change in net unrealized gains included in net gains from investment activities related to investments still held at reporting date | $ | 51 |
| | $ | 939 |
| | $ | 16,392 |
| | $ | — |
| | $ | 17,382 |
|
| Change in net unrealized losses included in net gains from investment activities of consolidated VIEs related to investments still held at reporting date | — |
| | — |
| | — |
| | (358 | ) | | (358 | ) |
| |
| (1) | Transfers between Level II and III were a result of subjecting the broker quotes on these financial assets to various criteria which include the number and quality of broker quotes, the standard deviation of obtained broker quotes and the percentage deviation from independent pricing services. |
|
| | | | | | | | | | | | | | | | | | | | | | | |
| | For the Three Months Ended September 30, 2015 |
| | Investments of Consolidated Apollo Funds | | Other Investments | | Investment in Athene Holding | | Investment in RCAP(3) | | Investments of Consolidated VIEs | | Total |
Balance, Beginning of Period(1) | $ | 2,003 |
| | $ | 629 |
| | $ | 414,726 |
| | $ | — |
| | $ | 124,699 |
| | $ | 542,057 |
|
| Purchases | 1,945 |
| | 3 |
| | — |
| | 25,000 |
| | 4,562 |
| | 31,510 |
|
| Sale of investments/Distributions | (2,482 | ) | | (54 | ) | | — |
| | — |
| | (5,184 | ) | | (7,720 | ) |
| Net realized gains (losses) | 12 |
| | — |
| | — |
| | — |
| | 2 |
| | 14 |
|
| Changes in net unrealized gains (losses) | 18 |
| | (109 | ) | | 81,216 |
| | — |
| | 2,027 |
| | 83,152 |
|
| Cumulative translation adjustment | — |
| | — |
| | — |
| | — |
| | 325 |
| | 325 |
|
Transfer into Level III(2) | 3,147 |
| | — |
| | — |
| | — |
| | 21,411 |
| | 24,558 |
|
Transfer out of Level III(2) | (1,222 | ) | | — |
| | — |
| | — |
| | (26,257 | ) | | (27,479 | ) |
Balance, End of Period(1) | $ | 3,421 |
| | $ | 469 |
| | $ | 495,942 |
| | $ | 25,000 |
| | $ | 121,585 |
| | $ | 646,417 |
|
| Change in net unrealized gains (losses) included in net gains from investment activities related to investments still held at reporting date | $ | (315 | ) | | $ | (109 | ) | | $ | 81,216 |
| | $ | — |
| | $ | — |
| | $ | 80,792 |
|
| Change in net unrealized gains included in net gains from investment activities of consolidated VIEs related to investments still held at reporting date | — |
| | — |
| | — |
| | — |
| | 2,448 |
| | 2,448 |
|
| |
(1) | Pursuant to the adoption of amended fair value guidance effective January 1, 2016, investments for which fair value is based on NAV are no longer required to be included in the fair value hierarchy. As such, prior periods have been recast to conform with the current period presentation. See note 2 for further discussion of the newly adopted accounting guidance. |
| |
(2) | Transfers between Level II and III were a result of subjecting the broker quotes on these financial assets to various criteria which include the number and quality of broker quotes, the standard deviation of obtained broker quotes and the percentage deviation from independent pricing services. |
| |
(3) | Represents Apollo’s investment in preferred stock of RCS Capital Corporation (“RCAP”), which was sold in November 2015. |
APOLLO GLOBAL MANAGEMENT, LLC
NOTES TO CONDENSED CONSOLIDATED
FINANCIAL STATEMENTS
(dollars in thousands, except share data, except where noted)
The following tables summarize the changes in fair value in financial assets measured at fair value for which Level III inputs have been used to determine fair value for the nine months ended September 30, 20162017 and 20152016, respectively::
| | | | For the Nine Months Ended September 30, 2016 | For the Nine Months Ended September 30, 2017 |
| | Investments of Consolidated Apollo Funds | | Other Investments | | Investment in Athene Holding | | Investments of Consolidated VIEs | | Total | Investments of Consolidated Apollo Funds | | Other Investments | | Investments of Consolidated VIEs | | Total |
Balance, Beginning of Period (1) | $ | 1,634 |
| | $ | 434 |
| | $ | 510,099 |
| | $ | 100,941 |
| | $ | 613,108 |
| $ | 567 |
| | $ | 45,154 |
| | $ | 92,474 |
| | $ | 138,195 |
|
| Purchases | 1,382 |
| | 44,530 |
| | — |
| | 60,832 |
| | 106,744 |
| — |
| | 14,774 |
| | 107,969 |
| | 122,743 |
|
| Sale of investments/Distributions | (1,803 | ) | | — |
| | — |
| | (54,496 | ) | | (56,299 | ) | |
| Sale of investments/distributions | | (8 | ) | | — |
| | (53,920 | ) | | (53,928 | ) |
| Net realized gains (losses) | (96 | ) | | — |
| | — |
| | 3,132 |
| | 3,036 |
| (14 | ) | | — |
| | 340 |
| | 326 |
|
| Changes in net unrealized gains (losses) | 224 |
| | 528 |
| | 48,730 |
| | (2,629 | ) | | 46,853 |
| 59 |
| | (386 | ) | | 9,600 |
| | 9,273 |
|
| Cumulative translation adjustment | — |
| | 740 |
| | — |
| | 2,469 |
| | 3,209 |
| — |
| | 5,184 |
| | 10,334 |
| | 15,518 |
|
Transfer into Level III(2)(1) | 1,495 |
| | — |
| | — |
| | 30,173 |
| | 31,668 |
| 60 |
| | — |
| | 9,569 |
| | 9,629 |
|
Transfer out of Level III(2)(1) | (2,515 | ) | | — |
| | — |
| | (33,888 | ) | | (36,403 | ) | — |
| | — |
| | (40,789 | ) | | (40,789 | ) |
| Balance, End of Period | $ | 321 |
| | $ | 46,232 |
| | $ | 558,829 |
| | $ | 106,534 |
| | $ | 711,916 |
| $ | 664 |
| | $ | 64,726 |
| | $ | 135,577 |
| | $ | 200,967 |
|
| Change in net unrealized gains included in net gains from investment activities related to investments still held at reporting date | $ | 56 |
| | $ | 528 |
| | $ | 48,730 |
| | $ | — |
| | $ | 49,314 |
| |
| Change in net unrealized gains (losses) included in net gains from investment activities related to investments still held at reporting date | | $ | 45 |
| | $ | (386 | ) | | $ | — |
| | $ | (341 | ) |
| Change in net unrealized gains included in net gains from investment activities of consolidated VIEs related to investments still held at reporting date | — |
| | — |
| | — |
| | 441 |
| | 441 |
| — |
| | — |
| | 9,351 |
| | 9,351 |
|
| |
| (1) | Pursuant to the adoption of amended fair value guidance effective January 1, 2016, investments for which fair value is based on NAV are no longer required to be included in the fair value hierarchy. See note 2 for further discussion of the newly adopted accounting guidance. |
| |
(2) | Transfers between Level II and III were a result of subjecting the broker quotes on these financial assets to various criteria which include the number and quality of broker quotes, the standard deviation of obtained broker quotes and the percentage deviation from independent pricing services. |
|
| | | | | | | | | | | | | | | | | | | | | | | | | | | |
| | For the Nine Months Ended September 30, 2015 |
| | Investments of Consolidated Apollo Funds | | Other Investments | | Investment in Athene Holding | | AAA/Athene Receivable | | Investment in RCAP(3) | | Investments of Consolidated VIEs | | Total |
Balance, Beginning of Period (1) | $ | 4,359 |
| | $ | 600 |
| | $ | 324,514 |
| | $ | 61,292 |
| | $ | — |
| | $ | 2,522,913 |
| | $ | 2,913,678 |
|
| Adoption of accounting guidance | — |
| | — |
| | — |
| | — |
| | — |
| | (2,407,923 | ) | | (2,407,923 | ) |
| Fees | — |
| | — |
| | — |
| | 1,942 |
| | — |
| | — |
| | 1,942 |
|
| Purchases | 4,424 |
| | 272 |
| | — |
| | — |
| | 25,000 |
| | 25,923 |
| | 55,619 |
|
| Sale of investments/Distributions | (5,085 | ) | | (101 | ) | | — |
| | — |
| | — |
| | (13,477 | ) | | (18,663 | ) |
| Net realized gains (losses) | 36 |
| | — |
| | — |
| | — |
| | — |
| | 1,419 |
| | 1,455 |
|
| Changes in net unrealized gains (losses) | (23 | ) | | (302 | ) | | 108,194 |
| | — |
| | — |
| | 3,986 |
| | 111,855 |
|
| Cumulative translation adjustment | — |
| | — |
| | — |
| | — |
| | — |
| | (9,519 | ) | | (9,519 | ) |
Transfer into Level III(2) | 4,951 |
| | — |
| | — |
| | — |
| | — |
| | 53,887 |
| | 58,838 |
|
Transfer out of Level III(2) | (5,241 | ) | | — |
| | — |
| | — |
| | — |
| | (55,624 | ) | | (60,865 | ) |
| Settlement of receivable | — |
| | — |
| | 63,234 |
| | (63,234 | ) | | — |
| | — |
| | — |
|
Balance, End of Period(1) | $ | 3,421 |
| | $ | 469 |
| | $ | 495,942 |
| | $ | — |
| | $ | 25,000 |
| | $ | 121,585 |
| | $ | 646,417 |
|
| Change in net unrealized gains (losses) included in net gains from investment activities related to investments still held at reporting date | $ | (353 | ) | | $ | (302 | ) | | $ | 108,194 |
| | $ | — |
| | $ | — |
| | $ | — |
| | $ | 107,539 |
|
| Change in net unrealized gains included in net gains from investment activities of consolidated VIEs related to investments still held at reporting date | — |
| | — |
| | — |
| | — |
| | — |
| | 4,333 |
| | 4,333 |
|
| |
(1) | Pursuant to the adoption of amended fair value guidance effective January 1, 2016, investments for which fair value is based on NAV are no longer required to be included in the fair value hierarchy. As such, prior periods have been recast to conform with the current period presentation. See note 2 for further discussion of the newly adopted accounting guidance. |
APOLLO GLOBAL MANAGEMENT, LLC
NOTES TO CONDENSED CONSOLIDATED
FINANCIAL STATEMENTS
(dollars in thousands, except share data, except where noted)
|
| | | | | | | | | | | | | | | | | | | |
| | For the Nine Months Ended September 30, 2016 |
| | Investments of Consolidated Apollo Funds | | Other Investments | | Investment in Athene Holding | | Investments of Consolidated VIEs | | Total |
Balance, Beginning of Period | $ | 1,634 |
| | $ | 434 |
| | $ | 510,099 |
| | $ | 100,941 |
| | $ | 613,108 |
|
| Purchases | 1,382 |
| | 44,530 |
| | — |
| | 60,832 |
| | 106,744 |
|
| Sale of investments/distributions | (1,803 | ) | | — |
| | — |
| | (54,496 | ) | | (56,299 | ) |
| Net realized gains (losses) | (96 | ) | | — |
| | — |
| | 3,132 |
| | 3,036 |
|
| Changes in net unrealized gains (losses) | 224 |
| | 528 |
| | 48,730 |
| | (2,629 | ) | | 46,853 |
|
| Cumulative translation adjustment | — |
| | 740 |
| | — |
| | 2,469 |
| | 3,209 |
|
Transfer into Level III(1) | 1,495 |
| | — |
| | — |
| | 30,173 |
| | 31,668 |
|
Transfer out of Level III(1) | (2,515 | ) | | — |
| | — |
| | (33,888 | ) | | (36,403 | ) |
| Balance, End of Period | $ | 321 |
| | $ | 46,232 |
| | $ | 558,829 |
| | $ | 106,534 |
| | $ | 711,916 |
|
| Change in net unrealized gains included in net gains from investment activities related to investments still held at reporting date | $ | 56 |
| | $ | 528 |
| | $ | 48,730 |
| | $ | — |
| | $ | 49,314 |
|
| Change in net unrealized gains included in net gains from investment activities of consolidated VIEs related to investments still held at reporting date | — |
| | — |
| | — |
| | 441 |
| | 441 |
|
| |
(2)(1) | Transfers between Level II and III were a result of subjecting the broker quotes on these financial assets to various criteria which include the number and quality of broker quotes, the standard deviation of obtained broker quotes and the percentage deviation from independent pricing services. |
| |
(3) | Represents Apollo’s investment in preferred stock of RCAP, which was sold in November 2015. |
The following table summarizes the changes in fair value in financial liabilities measured at fair value for which Level III inputs have been used to determine fair value for the three months ended September 30, 20162017 and 2015, respectively:2016:
|
| | | | | | | | | | | | | | | | | | | | | | | |
| | For the Three Months Ended September 30, |
| | 2016 | | 2015 |
| | Liabilities of Consolidated VIEs | | Contingent Consideration Obligations | | Total | | Liabilities of Consolidated VIEs | | Contingent Consideration Obligations | | Total |
| Balance, Beginning of Period | $ | 11,671 |
| | $ | 70,967 |
| | $ | 82,638 |
| | $ | 11,714 |
| | $ | 92,968 |
| | $ | 104,682 |
|
| Additions | — |
| | — |
| | — |
| | — |
| | — |
| | — |
|
| Payments | — |
| | (3,109 | ) | | (3,109 | ) | | — |
| | (3,026 | ) | | (3,026 | ) |
Changes in net unrealized (gains) losses(1) | 136 |
| | 13,361 |
| | 13,497 |
| | — |
| | (8,336 | ) | | (8,336 | ) |
| Cumulative translation adjustment | — |
| | — |
| | — |
| | 32 |
| | — |
| | 32 |
|
| Transfers into Level III | — |
| | — |
| | — |
| | — |
| | — |
| | — |
|
| Transfers out of Level III | — |
| | — |
| | — |
| | — |
| | — |
| | — |
|
| Balance, End of Period | $ | 11,807 |
| | $ | 81,219 |
| | $ | 93,026 |
| | $ | 11,746 |
| | $ | 81,606 |
| | $ | 93,352 |
|
| Change in net unrealized gains included in net gains from investment activities of consolidated VIEs related to liabilities still held at reporting date | $ | 136 |
| | $ | — |
| | $ | 136 |
| | $ | — |
| | $ | — |
| | $ | — |
|
|
| | | | | | | | | | | | | | | | | | | | | | | |
| | For the Three Months Ended September 30, |
| | 2017 | | 2016 |
| | Liabilities of Consolidated VIEs | | Contingent Consideration Obligations | | Total | | Liabilities of Consolidated VIEs | | Contingent Consideration Obligations | | Total |
| Balance, Beginning of Period | $ | 12,007 |
| | $ | 86,900 |
| | $ | 98,907 |
| | $ | 11,671 |
| | $ | 70,967 |
| | $ | 82,638 |
|
| Payments/extinguishment | — |
| | (6,776 | ) | | (6,776 | ) | | — |
| | (3,109 | ) | | (3,109 | ) |
Changes in net unrealized losses(1) | 409 |
| | 7,176 |
| | 7,585 |
| | 136 |
| | 13,361 |
| | 13,497 |
|
| Balance, End of Period | $ | 12,416 |
| | $ | 87,300 |
| | $ | 99,716 |
| | $ | 11,807 |
| | $ | 81,219 |
| | $ | 93,026 |
|
| Change in net unrealized gains included in net gains from investment activities of consolidated VIEs related to liabilities still held at reporting date | $ | 409 |
| | $ | — |
| | $ | 409 |
| | $ | 136 |
| | $ | — |
| | $ | 136 |
|
| |
| (1) | Changes in fair value of contingent consideration obligations are recorded in profit sharing expense in the condensed consolidated statements of operations. |
APOLLO GLOBAL MANAGEMENT, LLC
NOTES TO CONDENSED CONSOLIDATED
FINANCIAL STATEMENTS
(dollars in thousands, except share data, except where noted)
The following table summarizes the changes in fair value in financial liabilities measured at fair value for which Level III inputs have been used to determine fair value for the nine months ended September 30, 20162017 and 2015, respectively:2016:
|
| | | | | | | | | | | | | | | | | | | | | | | |
| | For the Nine Months Ended September 30, |
| | 2016 | | 2015 |
| | Liabilities of Consolidated VIEs | | Contingent Consideration Obligations | | Total | | Liabilities of Consolidated VIEs | | Contingent Consideration Obligations | | Total |
| Balance, Beginning of Period | $ | 11,411 |
| | $ | 79,579 |
| | $ | 90,990 |
| | $ | 12,343,021 |
| | $ | 96,126 |
| | $ | 12,439,147 |
|
| Adoption of accounting guidance | — |
| | — |
| | — |
| | (11,433,815 | ) | | — |
| | (11,433,815 | ) |
| Payments/Extinguishment | — |
| | (10,096 | ) | | (10,096 | ) | | — |
| | (12,746 | ) | | (12,746 | ) |
| Net realized gains | — |
| | — |
| | — |
| | — |
| | — |
| | — |
|
Changes in net unrealized (gains) losses(1) | 396 |
| | 11,736 |
| | 12,132 |
| | (8,244 | ) | | (1,774 | ) | | (10,018 | ) |
| Cumulative translation adjustment | — |
| | — |
| | — |
| | (92,258 | ) | | — |
| | (92,258 | ) |
| Transfers into Level III | — |
| | — |
| | — |
| | — |
| | — |
| | — |
|
| Transfers out of Level III | — |
| | — |
| | — |
| | (796,958 | ) | | — |
| | (796,958 | ) |
| Balance, End of Period | $ | 11,807 |
| | $ | 81,219 |
| | $ | 93,026 |
| | $ | 11,746 |
| | $ | 81,606 |
| | $ | 93,352 |
|
| Change in net unrealized gains included in net gains from investment activities of consolidated VIEs related to liabilities still held at reporting date | $ | 396 |
| | $ | — |
| | $ | 396 |
| | $ | — |
| | $ | — |
| | $ | — |
|
|
| | | | | | | | | | | | | | | | | | | | | | | | | | | |
| | For the Nine Months Ended September 30, |
| | 2017 | | 2016 |
| | Liabilities of Consolidated Apollo Funds | | Liabilities of Consolidated VIEs | | Contingent Consideration Obligations | | Total | | Liabilities of Consolidated VIEs | | Contingent Consideration Obligations | | Total |
| Balance, Beginning of Period | $ | — |
| | $ | 11,055 |
| | $ | 106,282 |
| | $ | 117,337 |
| | $ | 11,411 |
| | $ | 79,579 |
| | $ | 90,990 |
|
| Additions | 97 |
| | — |
| | — |
| | 97 |
| | — |
| | — |
| | — |
|
| Payments/extinguishment | (94 | ) | | — |
| | (23,597 | ) | | (23,691 | ) | | — |
| | (10,096 | ) | | (10,096 | ) |
| Net realized gains | (10 | ) | | — |
| | — |
| | (10 | ) | | — |
| | — |
| | — |
|
Changes in net unrealized losses(1) | 7 |
| | 1,361 |
| | 4,615 |
| | 5,983 |
| | 396 |
| | 11,736 |
| | 12,132 |
|
| Balance, End of Period | $ | — |
| | $ | 12,416 |
| | $ | 87,300 |
| | $ | 99,716 |
| | $ | 11,807 |
| | $ | 81,219 |
| | $ | 93,026 |
|
| Change in net unrealized gains included in net gains from investment activities of consolidated VIEs related to liabilities still held at reporting date | $ | — |
| | $ | 1,361 |
| | $ | — |
| | $ | 1,361 |
| | $ | 396 |
| | $ | — |
| | $ | 396 |
|
| |
| (1) | Changes in fair value of contingent consideration obligations are recorded in profit sharing expense in the condensed consolidated statements of operations. |
The following tables summarize the quantitative inputs and assumptions used for financial assets and liabilities categorized as Level III under the fair value hierarchy as of September 30, 2017 and December 31, 2016:
|
| | | | | | | | | | | |
| | As of September 30, 2017 |
| | Fair Value | | Valuation Techniques | | Unobservable Inputs | | Ranges | | Weighted Average |
| Financial Assets | | | | | | | | | |
| Investments of consolidated Apollo funds | $ | 664 |
| | Third party pricing(1) | | N/A | | N/A | | N/A |
| Investments in other | 47,602 |
| | Third party pricing(1) | | N/A | | N/A | | N/A |
| 17,124 |
| | Other | | N/A | | N/A | | N/A |
| Investments of consolidated VIEs: | | | | | | | | | |
| Corporate loans/bonds/CLO notes | 13,548 |
| | Third party pricing(1) | | N/A | | N/A | | N/A |
| Equity securities | 122,029 |
| | Book value multiple | | Book value multiple | | 0.76x | | 0.76x |
| | Discounted cash flow | | Discount rate | | 12.8% | | 12.8% |
| Total investments of consolidated VIEs | 135,577 |
| | | | | | | | |
| Total Financial Assets | $ | 200,967 |
| | | | | | | | |
| Financial Liabilities | | | | | | | | | |
| Liabilities of consolidated VIEs | 12,416 |
| | Other | | N/A | | N/A | | N/A |
| Contingent consideration obligation | 87,300 |
| | Discounted cash flow | | Discount rate | | 17.3% | | 17.3% |
| Total Financial Liabilities | $ | 99,716 |
| | | | | | | | |
| |
| (1) | These securities are valued primarily using unadjusted broker quotes. |
APOLLO GLOBAL MANAGEMENT, LLC
NOTES TO CONDENSED CONSOLIDATED
FINANCIAL STATEMENTS
(dollars in thousands, except share data, except where noted)
The following tables summarize the quantitative inputs and assumptions used for financial assets and liabilities categorized as Level III under the fair value hierarchy as of September 30, 2016 and December 31, 2015, respectively:
|
| | | | | | | | | | | |
| | As of September 30, 2016 |
| | Fair Value | | Valuation Techniques | | Unobservable Inputs | | Ranges | | Weighted Average |
| Financial Assets | | | | | | | | | |
| Investments of Consolidated Apollo Funds | $ | 321 |
| | Third Party Pricing(1) | | N/A | | N/A | | N/A |
| Investments in Other | 46,232 |
| | Third Party Pricing (1) | | N/A | | N/A | | N/A |
| Investment in Athene Holding | 558,829 |
| | Book Value Multiple | | Book Value Multiple | | 1.20x | | 1.20x |
| Investments of Consolidated VIEs: | | | | | | | | | |
| Bank Debt Term Loans | 11,519 |
| | Third Party Pricing(1) | | N/A | | N/A | | N/A |
| Corporate Loans/Bonds/CLO Notes | 17,825 |
| | Third Party Pricing(1) | | N/A | | N/A | | N/A |
| Equity Securities | 77,190 |
| | Transaction | | N/A | | N/A | | N/A |
| Total Investments of Consolidated VIEs | 106,534 |
| | | | | | | | |
| Total Financial Assets | $ | 711,916 |
| | | | | | | | |
| Financial Liabilities | | | | | | | | | |
| Liabilities of Consolidated VIEs: | | | | | | | | | |
| Contingent Obligation | $ | 11,807 |
| | Other | | N/A | | N/A | | N/A |
| Contingent Consideration Obligation | 81,219 |
| | Discounted Cash Flow | | Discount Rate | | 10.5% - 17.8% | | 17.6% |
| Total Financial Liabilities | $ | 93,026 |
| | | | | | | | |
|
| | | | | | | | | | | |
| | As of December 31, 2016 |
| | Fair Value | | Valuation Techniques | | Unobservable Inputs | | Ranges | | Weighted Average |
| Financial Assets | | | | | | | | | |
| Investments of consolidated Apollo funds | $ | 567 |
| | Third party pricing(1) | | N/A | | N/A | | N/A |
| Investments in other | 45,154 |
| | Third party pricing(1) | | N/A | | N/A | | N/A |
| Investments of consolidated VIEs: | | | | | | | | | |
| Bank debt term loans | 4,701 |
| | Third party pricing(1) | | N/A | | N/A | | N/A |
| Corporate loans/bonds/CLO notes | 15,496 |
| | Third party pricing(1) | | N/A | | N/A | | N/A |
| Equity securities | 72,277 |
| | Transaction | | N/A | | N/A | | N/A |
| Total investments of consolidated VIEs | 92,474 |
| | | | | | | | |
| Total Financial Assets | $ | 138,195 |
| | | | | | | | |
| Financial Liabilities | | | | | | | | | |
| Liabilities of consolidated VIEs | $ | 11,055 |
| | Other | | N/A | | N/A | | N/A |
| Contingent consideration obligation | 106,282 |
| | Discounted cash flow | | Discount rate | | 13.0% - 17.3% | | 17.2% |
| Total Financial Liabilities | $ | 117,337 |
| | | | | | | | |
| |
| (1) | These securities are valued primarily using unadjusted broker quotes. |
|
| | | | | | | | | | | |
| | As of December 31, 2015 |
| | Fair Value | | Valuation Techniques | | Unobservable Inputs | | Ranges | | Weighted Average |
| Financial Assets | | | | | | | | | |
| Investments of Consolidated Apollo Funds | $ | 1,634 |
| | Third Party Pricing(1) | | N/A | | N/A | | N/A |
| Investments in Other | 434 |
| | Other | | N/A | | N/A | | N/A |
| Investment in Athene Holding | 510,099 |
| | Book Value Multiple | | Book Value Multiple | | 1.18x | | 1.18x |
| Investments of Consolidated VIEs: | | | | | | | | | |
| Bank Debt Term Loans | 15,776 |
| | Third Party Pricing(1) | | N/A | | N/A | | N/A |
| Corporate Loans/Bonds/CLO Notes | 22,409 |
| | Third Party Pricing(1) | | N/A | | N/A | | N/A |
| Equity Securities | 62,756 |
| | Market Comparable Companies | | Comparable Multiples | | 0.60x | | 0.60x |
| | Discounted Cash Flow | | Discount Rate | | 14.6% | | 14.6% |
Total Investments of Consolidated VIEs (2) | 100,941 |
| | | | | | | | |
| Total Financial Assets | $ | 613,108 |
| | | | | | | | |
| Financial Liabilities | | | | | | | | | |
| Liabilities of Consolidated VIEs: | | | | | | | | | |
| Contingent Obligation | $ | 11,411 |
| | Other | | N/A | | N/A | | N/A |
| Contingent Consideration Obligation | 79,579 |
| | Discounted Cash Flow | | Discount Rate | | 11.0% - 18.5% | | 17.0% |
| Total Financial Liabilities | $ | 90,990 |
| | | | | | | | |
| |
(1) | These securities are valued primarily using unadjusted broker quotes. |
| |
(2) | Pursuant to the adoption of amended fair value guidance effective January 1, 2016, investments for which fair value is based on NAV are no longer required to be included in the fair value hierarchy. As such, prior periods have been recast to conform with the current period presentation. See note 2 for further discussion of the newly adopted accounting guidance. |
Investment in Athene Holding and AAA/Athene Receivable
As of September 30, 20162017 and December 31, 2015,2016 the fair value of Apollo’s investment in Athene Holding was estimated underusing the closing market price of Athene Holding shares of $53.84 and $47.99, respectively, less a discount due to a lack of marketability (“DLOM”) of 7.0% and 9.5%, respectively, as applicable. The DLOM was derived based on the average remaining lock up restrictions on the shares of Athene Holding held by Apollo (14.3 months and 23.3 months as of September 30, 2017 and December 31, 2016, respectively) and the estimated volatility in such shares of Athene Holding. Due to the limited trading history in Athene Holding shares, the historical share price volatility of a representative set of Athene Holding’s publicly traded insurance peers was calculated over a period equivalent to the remaining average lock up on the shares of Athene Holding held by Apollo and used as a proxy to estimate the projected volatility in Athene Holding’s shares. The fair value of Apollo’s investment in Athene Holding as of September 30, 2017 and December 31, 2016 after the application of the DLOM was estimated at a price of $50.19 and $43.43 per share, respectively.
As of December 31, 2016, Apollo changed the valuation method used to value the opportunistic investment in Athene Holding from the U.S. GAAP book value multiple approach by applying a book value multiple to the U.S. GAAP book value per shareuse of the closing market price of shares of Athene Holding, adjusted for a DLOM in order to reflect the post IPO sales restriction on such shares of Athene Holding. The adjustment for the conversion of all Athene management incentive shares was added to Athene’s
APOLLO GLOBAL MANAGEMENT, LLC
NOTES TO CONDENSED CONSOLIDATED
FINANCIAL STATEMENTS
(dollars in thousands, except share data, except where noted)
U.S. GAAP book value excluding accumulated other comprehensive income (“AOCI”) for purposes of determining U.S. GAAP book value per share. ApolloDLOM is calculated a multiple for public company peers of Athene by dividing each peer’s market capitalization by its reported U.S. GAAP equity, excluding AOCI. A regression analysis was then prepared based on the calculated multipleremaining length of each peer relative to its expected return on U.S. GAAP equity, excluding AOCI, relative to Athene. Duringsuch sales restrictions and the nine months ended September 30, 2016, Athene experienced significant business growth in its reinsurance and retail channels and made further progress in preparing for its initial public offering (“Athene IPO”). In addition, and in connection with the process of preparing for the Athene IPO, feedback was received from a range of sources which supported the Company’s view of an increase in value relating to recent developments at Athene. The adjustment to peer multiples in the valuationestimated market price volatility of the investment in Athene Holding reflects these developments. As a result, Apollo concluded it was appropriate to apply a multiple of 1.20 to Athene’s U.S. GAAP book value, in estimating the fair value of Athene Holding at September 30, 2016.associated shares.
As of September 30, 2016 and December 31, 2015, the significant unobservable input used in the fair value measurement of the investment in Athene Holding was the U.S. GAAP book value multiple. This input in isolation can cause significant increases or decreases in fair value. Specifically, when the U.S. GAAP book value multiple method is used to determine fair value, the significant input used in the valuation model is the U.S. GAAP book value multiple itself. An increase in the U.S. GAAP book value multiple can significantly increase the fair value of an investment; conversely a decrease in the U.S. GAAP book value multiple can significantly decrease the fair value of an investment. The sensitivity of the valuation to changes in the multiple is directly proportional to the change in the multiple itself.
Investments of Consolidated Apollo Funds
The Company is the sole investor in the Apollo Senior Loan Fund, L.P. and Apollo Alternative Credit Long Short Fund L.P. and therefore consolidates the assets and liabilities of these funds. These funds invest in U.S. denominated senior secured loans, senior secured bonds and other income generating fixed-income investments. Amounts related to these consolidated Apollo funds are primarily presented in net gains (losses) from investment activities on the condensed consolidated statements of operations and in investments in the condensed consolidated statements of financial condition.
Other Investments
Other investments primarily consists of Apollo’s investments in debt of unconsolidated CLOs. The change in the fair value related to these investments is presented in net gains (losses) from investment activities on the condensed consolidated statements of operations.
Consolidated VIEs
Investments
TheAs of September 30, 2017, the significant unobservable inputs used in the fair value measurement of the equity securities as of December 31, 2015 include the discount rate applied and the book value multiples applied in the valuation models. These unobservable
APOLLO GLOBAL MANAGEMENT, LLC
NOTES TO CONDENSED CONSOLIDATED
FINANCIAL STATEMENTS
(dollars in thousands, except share data, except where noted)
inputs in isolation can cause significant increases or decreases in fair value. Specifically, when a discounted cash flow model is used to determine fair value, the significant input used in the valuation model is the discount rate applied to present value the projected cash flows. Increases in the discount rate can significantly lower the fair value of an investment; conversely decreases in the discount rate can significantly increase the fair value of an investment. The discount rate is determined based on the market rates an investor would expect for a similar investment with similar risks. When a comparable multiple model is used to determine fair value, the comparable multiples are generally multiplied by the underlying companies’ earnings before interest, taxes, depreciation and amortization (“EBITDA”) to establish the total enterprise value of the company. The comparable multiple is determined based on the implied trading multiple of public industry peers.
Liabilities
As of September 30, 20162017 and December 31, 2015,2016, the debt obligations of the consolidated CLOs were measured on the basis of the fair value of the financial assets of the CLOs as the financial assets were determined to be more observable and, as a result, categorized as Level II in the fair value hierarchy. See note 2 for further discussion of the Company’s adoption of CFE guidance.
APOLLO GLOBAL MANAGEMENT, LLC
NOTES TO CONDENSED CONSOLIDATED
FINANCIAL STATEMENTS
(dollars in thousands, except share data, except where noted)
Contingent Consideration Obligations
The significant unobservable input used in the fair value measurement of the contingent consideration obligations is the discount rate applied in the valuation models. This input in isolation can cause significant increases or decreases in fair value. Specifically, when a discounted cash flow model is used to determine fair value, the significant input used in the valuation model is the discount rate applied to present value the projected cash flows. Increases in the discount rate can significantly lower the fair value of the contingent consideration obligations; conversely, a decrease in the discount rate can significantly increase the fair value of the contingent consideration obligations. The discount rate was based on the hypothetical cost of equity forin connection with the Company.acquisition of Stone Tower Capital, LLC (together with its related management companies, “Stone Tower”). See note 1314 for further discussion of the contingent consideration obligations.
Net Investment Hedge
To manage the potential exposure from adverse changes in currency exchange rates arising from the Company’s net investment in foreign operations related to Bremer Kreditbank AG, the German subsidiary of Belgian KBC Group NV (“BKB Bank”) during June 2016, the Company entered into a foreign currency option contract to hedge a portion of the net investment in the Company’s non-U.S. dollar denominated foreign operations related to BKB Bank. As of September 30, 2016, the notional amount of the net investment hedge was €17.6 million. The gains and losses due to changes in fair value attributable to foreign currency derivatives designated as net investment hedges are recognized in other comprehensive income (loss), net of tax. No portion of the net investment hedge was subsequently reclassified to net income or deemed ineffective for the three months ended September 30, 2016. The resulting loss on derivative assets was $0.3 million for the three months ended September 30, 2016 and $0.4 million for the nine months ended September 30, 2016. The resulting gain on derivative liabilities was $3.3 thousand for the three months ended September 30, 2016 and there was a resulting loss on derivative liabilities of $25.0 thousand for the nine months ended September 30, 2016.
6. CARRIED INTEREST RECEIVABLE
Carried interest receivable from private equity, credit and real estateassets funds consisted of the following:
| | | | As of September 30, 2016 | | As of December 31, 2015 | As of September 30, 2017 | | As of December 31, 2016 |
| Private Equity | $ | 577,391 |
| | $ | 373,871 |
| $ | 1,128,460 |
| | $ | 798,465 |
|
| Credit | 390,626 |
| | 240,844 |
| 413,990 |
| | 426,114 |
|
| Real Estate | 23,798 |
| | 29,192 |
| |
| Real Assets | | 35,534 |
| | 32,526 |
|
| Total carried interest receivable | $ | 991,815 |
| | $ | 643,907 |
| $ | 1,577,984 |
| | $ | 1,257,105 |
|
The table below provides a roll-forward of the carried interest receivable balance for the nine months ended September 30, 2016:2017:
| | | | Private Equity | | Credit | | Real Estate | | Total | Private Equity | | Credit | | Real Assets | | Total |
| Carried interest receivable, January 1, 2016 | $ | 373,871 |
| | $ | 240,844 |
| | $ | 29,192 |
| | $ | 643,907 |
| |
| Carried interest receivable, January 1, 2017 | | $ | 798,465 |
| | $ | 426,114 |
| | $ | 32,526 |
| | $ | 1,257,105 |
|
| Change in fair value of funds | 203,786 |
| | 239,427 |
| | 7,776 |
| | 450,989 |
| 651,808 |
| | 165,987 |
| | 10,585 |
| | 828,380 |
|
| Fund distributions to the Company | (266 | ) | | (89,645 | ) | | (13,170 | ) | | (103,081 | ) | (321,813 | ) | | (178,111 | ) | | (7,577 | ) | | (507,501 | ) |
| Carried interest receivable, September 30, 2016 | $ | 577,391 |
| | $ | 390,626 |
| | $ | 23,798 |
| | $ | 991,815 |
| |
| Carried interest receivable, September 30, 2017 | | $ | 1,128,460 |
| | $ | 413,990 |
| | $ | 35,534 |
| | $ | 1,577,984 |
|
The change in fair value of funds includesexcludes the reversal of previously realized carried interest income due to the general partner obligation to return previously distributed carried interest income. The general partner obligation is recognized based upon a hypothetical liquidation of a fund’s net assets as of the reporting date. The actual determination and any required payment of any such general partner obligation would not take place until the final disposition of a fund’s investments based on the contractual termination of the fund or as otherwise set forth in the respective limited partnership agreement of the fund. See note 1213 for further disclosure regarding the general partner obligation.
APOLLO GLOBAL MANAGEMENT, LLC
NOTES TO CONDENSED CONSOLIDATED
FINANCIAL STATEMENTS
(dollars in thousands, except share data, except where noted)
The timing of the payment of carried interest due to the general partner or investment manager varies depending on the terms of the applicable fund agreements. Generally, carried interest with respect to the private equity funds and certain credit and real estateassets funds is payable and is distributed to the fund’s general partner upon realization of an investment if the fund’s cumulative returns are in excess of the preferred return. For most credit funds, carried interest is payable based on realizations after the end of the relevant fund’s fiscal year or fiscal quarter, subject to certain return thresholds, or “high water marks,” having been achieved.
7. PROFIT SHARING PAYABLE
Profit sharing payable from private equity, credit and real estate funds consisted of the following:
| | | | As of
September 30, 2016 | | As of
December 31, 2015 | As of September 30, 2017 | | As of December 31, 2016 |
| Private Equity | $ | 186,516 |
| | $ | 118,963 |
| $ | 427,456 |
| | $ | 268,170 |
|
| Credit | 265,895 |
| | 165,392 |
| 269,233 |
| | 268,855 |
|
| Real Estate | 13,644 |
| | 11,319 |
| |
| Real Assets | | 14,184 |
| | 13,123 |
|
| Total profit sharing payable | $ | 466,055 |
| | $ | 295,674 |
| $ | 710,873 |
| | $ | 550,148 |
|
The table below provides a roll-forward of the profit sharing payable balance for the nine months ended September 30, 2016:2017:
| | | | Private Equity | | Credit | | Real Estate | | Total | Private Equity | | Credit | | Real Assets | | Total |
| Profit sharing payable, January 1, 2016 | $ | 118,963 |
| | $ | 165,392 |
| | $ | 11,319 |
| | $ | 295,674 |
| |
| Profit sharing payable, January 1, 2017 | | $ | 268,170 |
| | $ | 268,855 |
| | $ | 13,123 |
| | $ | 550,148 |
|
Profit sharing expense(1)(2) | 69,247 |
| | 134,413 |
| | 6,840 |
| | 210,500 |
| 266,881 |
| | 73,909 |
| | 3,680 |
| | 344,470 |
|
| Payments/other | (1,694 | ) | | (33,910 | ) | | (4,515 | ) | | (40,119 | ) | (107,595 | ) | | (73,531 | ) | | (2,619 | ) | | (183,745 | ) |
| Profit sharing payable, September 30, 2016 | $ | 186,516 |
| | $ | 265,895 |
| | $ | 13,644 |
| | $ | 466,055 |
| |
| Profit sharing payable, September 30, 2017 | | $ | 427,456 |
| | $ | 269,233 |
| | $ | 14,184 |
| | $ | 710,873 |
|
| |
| (1) | Includes (i) changes in amounts payable to employees and former employees entitled to a share of carried interest income in Apollo’s funds and (ii) changes to the fair value of the contingent consideration obligations recognized in connection with certain Apollo acquisitions. See notes 5 and 1314 for further disclosure regarding the contingent consideration obligations. |
| |
| (2) | The Company has recorded a receivable from the Contributing Partners, certain employees and former employees for the potential return of profit sharing distributions that would be due if certain funds were liquidated in the amount of $45.5$43.9 million and $14.7$39.3 million as of September 30, 20162017 and December 31, 2015,2016, respectively. Profit sharing expense excludes the potential return of these profit sharing distributions. See note 1213 for further discussion regarding the potential return of profit sharing distributions. |
8. INCOME TAXES
The Company is treated as a partnership for income tax purposes and is therefore not subject to U.S. federal, state and local income taxes. APO Corp., a wholly-owned subsidiary of the Company, isCertain consolidated entities are, or are treated as, corporations for U.S. and non-U.S. tax purposes and therefore subject to U.S. federal, state, and local corporate income taxes.tax. Certain other subsidiaries of the Company are subject to New York City Unincorporated Business Tax (“NYC UBT”) attributable to the Company’s operations apportioned to New York City. In addition, certain non-U.S. subsidiaries of the Company are subject to income taxes in their local jurisdictions.
The Company’s income tax provision totaled $29.7$16.5 million and $6.6$29.7 million for the three months ended September 30, 20162017 and 2015,2016, respectively, and $62.5$54.9 million and $21.2$62.5 million for the nine months ended September 30, 20162017 and 2015,2016, respectively. The Company’s effective tax rate was approximately 11.2%3.7% and 6.4%11.2% for the three months ended September 30, 20162017 and 2015,2016, respectively, and approximately5.3% and 9.8% and 6.1% for the nine months ended September 30, 20162017 and 2015,2016, respectively.
Under U.S. GAAP, a tax benefit from an uncertain tax position may be recognized when it is more likely than not that the position will be sustained upon examination, including resolutions of any related appeals or litigation processes, based on the technical merits of the position. Based upon the Company’s review of its federal, state, local and foreign income tax returns and tax filing positions, the Company determined that no unrecognized tax benefits for uncertain tax positions were required to be recorded. In addition, the Company does not believe that it has any tax positions for which it is reasonably possible that it will be required to record significant amounts of unrecognized tax benefits within the next twelve months.
The Company’s primary jurisdictions in which it operates are the United States, New York State, New York City, California and the United Kingdom. There are no unremitted earnings with respect to the United Kingdom and other foreign entities
APOLLO GLOBAL MANAGEMENT, LLC
NOTES TO CONDENSED CONSOLIDATED
FINANCIAL STATEMENTS
(dollars in thousands, except share data, except where noted)
The Company’s primary jurisdictions in which it operates aredue to the United States, New York State, New York City, California and the United Kingdom.flow-through nature of these entities. In the normal course of business, the Company is subject to examination by federal and certain state, local and foreign tax authorities. With a few exceptions, as of September 30, 2016,2017, the Company’s U.S. federal, state, local and foreign income tax returns for the years 2013 through 2016 are open under the general statute of limitations provisions and therefore subject to examination. Currently, the Internal Revenue Service is examining the tax return of a subsidiarycertain subsidiaries for the 2011 and 2012 tax year.years. The State and City of New York isare examining certain subsidiaries’ tax returns for tax years 2011 to 2013.
The Company has recorded a deferred tax asset for the future amortization of tax basis intangibles as a result of the 2007 Reorganization. The Company recorded additional deferred tax assets as a result of the step-up in tax basis of intangibles from subsequent exchanges of AOG Units for Class A shares. A related tax receivable agreement liability was recorded in due to related parties in the condensed consolidated statements of financial condition for the expected payments under the tax receivable agreement entered into by and among APO Corp., the Managing Partners, the Contributing Partners, and other parties thereto (as amended, the “tax receivable agreement”) (see note 12)13). The increases in the deferred tax asset less the related liability resulted in increases to additional paid-inpaid in capital which were recorded in the condensed consolidated statements of changes in shareholders’ equity for the nine months ended September 30, 20162017 and 2015.2016. The amortization period for these tax basis intangibles is 15 years and the deferred tax assets will reverse over the same period.
Pursuant to an exchange agreement between Apollo, Holdings and the other parties thereto (as amended, the “Exchange Agreement”), the holders of the AOG Units (and certain permitted transferees thereof) may, upon notice and subject to the applicable vesting and minimum retained ownership requirements, transfer restrictions and other terms of the Exchange Agreement, exchange their AOG Units for the Company’s Class A shares on a one-for-one basis a limited number of times each year, subject to customary conversion rate adjustments for splits, distributions and reclassifications. Pursuant to the Exchange Agreement, a holder of AOG Units must simultaneously exchange one partnership unit in each of the Apollo Operating Group partnerships to effectuate an exchange for one Class A share. As a holder exchanges its AOG Units, the Company’s indirect interest in the Apollo Operating Group is correspondingly increased.
The tablestable below presentpresents the impact to the deferred tax asset, tax receivable agreement liability and additional paid-inpaid in capital related to the exchange of AOG Units for Class A shares during the nine months ended September 30, 20162017 and 2015.2016.
| | | | | For the Nine Months Ended September 30, 2016 | | | | | | | |
Exchange of AOG Units for Class A shares | | Increase in Deferred Tax Asset | | Increase in Tax Receivable Agreement Liability | | Increase to Additional Paid In Capital | | Increase in Deferred Tax Asset | | Increase in Tax Receivable Agreement Liability | | Increase to Additional Paid In Capital |
| For the Nine Months Ended September 30, 2017 | | | $ | 46,539 |
| | $ | 35,946 |
| | $ | 10,593 |
|
| For the Nine Months Ended September 30, 2016 | | $ | 1,807 |
| | $ | 1,519 |
| | $ | 288 |
| | $ | 1,807 |
| | $ | 1,519 |
| | $ | 288 |
|
9. DEBT
Debt consisted of the following:
|
| | | | | | | | | | | | | | | | | | | | | |
| | As of September 30, 2017 | | As of December 31, 2016 |
| | Outstanding Balance | | Fair Value | | Annualized Weighted Average Interest Rate | | Outstanding Balance | | Fair Value | | Annualized Weighted Average Interest Rate |
2013 AMH Credit Facilities - Term Facility(1) | $ | 299,627 |
| | $ | 298,875 |
| (3) | 2.28 | % | | $ | 299,543 |
| | $ | 298,500 |
| (3) | 1.82 | % |
2024 Senior Notes(1) | 495,697 |
| | 510,604 |
| (4) | 4.00 |
| | 495,208 |
| | 498,336 |
| (4) | 4.00 |
|
2026 Senior Notes(1) | 495,550 |
| | 519,618 |
| (4) | 4.40 |
| | 495,165 |
| | 497,923 |
| (4) | 4.40 |
|
2014 AMI Term Facility I(2) | 16,199 |
| | 16,199 |
| (3) | 2.00 |
| | 14,449 |
| | 14,449 |
| (3) | 2.00 |
|
2014 AMI Term Facility II(2) | 18,283 |
| | 18,283 |
| (3) | 1.75 |
| | 16,306 |
| | 16,306 |
| (3) | 1.75 |
|
2016 AMI Term Facility I(2) | 20,050 |
| | 20,050 |
| (3) | 1.75 |
| | 17,852 |
| | 17,852 |
| (3) | 1.75 |
|
2016 AMI Term Facility II(2) | 15,638 |
| | 15,638 |
| (3) | 2.00 |
| | 13,924 |
| | 13,924 |
| (3) | 2.00 |
|
| Total Debt | $ | 1,361,044 |
| | $ | 1,399,267 |
| | | | $ | 1,352,447 |
| | $ | 1,357,290 |
| | |
|
| | | | | | | | | | | | |
| | | For the Nine Months Ended September 30, 2015 |
Exchange of AOG Units for Class A shares | | Increase in Deferred Tax Asset | | Increase in Tax Receivable Agreement Liability | | Increase to Additional Paid In Capital |
| For the Nine Months Ended September 30, 2015 | | $ | 60,648 |
| | $ | 44,534 |
| | $ | 16,114 |
|
APOLLO GLOBAL MANAGEMENT, LLC
NOTES TO CONDENSED CONSOLIDATED
FINANCIAL STATEMENTS
(dollars in thousands, except share data, except where noted)
9. DEBT
Debt consisted of the following:
|
| | | | | | | | | | | | | | | | | | | | | |
| | As of September 30, 2016 | | As of December 31, 2015 |
| | Outstanding Balance | | Fair Value | | Annualized Weighted Average Interest Rate | | Outstanding Balance | | Fair Value | | Annualized Weighted Average Interest Rate |
2013 AMH Credit Facilities - Term Facility(1) | $ | 299,515 |
| | $ | 300,750 |
| (5) | 1.73 | % | | $ | 499,327 |
| | $ | 501,300 |
| (5) | 1.44 | % |
2024 Senior Notes(2) | 495,044 |
| | 515,659 |
| (6) | 4.00 |
| | 494,555 |
| | 495,300 |
| (6) | 4.00 |
|
2026 Senior Notes(3) | 495,037 |
| | 526,895 |
| (6) | 4.40 |
| | — |
| | — |
| | — |
|
2014 AMI Term Facility I(4) | 15,048 |
| | 15,048 |
| (5) | 2.01 |
| | 14,543 |
| | 14,549 |
| (5) | 2.15 |
|
2014 AMI Term Facility II(4) | 17,414 |
| | 17,414 |
| (5) | 1.75 |
| | 16,830 |
| | 16,830 |
| (5) | 1.85 |
|
2016 AMI Term Facility I(4) | 19,065 |
| | 19,065 |
| (5) | 1.75 |
| | — |
| | — |
| | — |
|
2016 AMI Term Facility II(4) | 14,871 |
| | 14,871 |
| (5) | 2.00 |
| | — |
| | — |
| | — |
|
| Total Debt | $ | 1,355,994 |
| | $ | 1,409,702 |
| | | | $ | 1,025,255 |
| | $ | 1,027,979 |
| | |
| |
| (1) | Includes impact of any amortization of note discount, as applicable. Outstanding balance is presented net of unamortized debt issuance costs, of $0.5 million and $0.7 million as of September 30, 2016 and December 31, 2015, respectively.which are presented in the following table: |
|
| | | | | | | |
| | As of September 30, 2017 | | As of December 31, 2016 |
| 2013 AMH Credit Facilities - Term Facility | $ | 373 |
| | $ | 457 |
|
| 2024 Senior Notes | $ | 3,637 |
| | $ | 4,051 |
|
| 2026 Senior Notes | $ | 4,069 |
| | $ | 4,420 |
|
| |
| (2) | Includes impact of any amortization of note discount. Outstanding balance is presented net of unamortized debt issuance costs of $4.2 million and $4.6 million as of September 30, 2016 and December 31, 2015, respectively. |
| |
(3) | Includes impact of any amortization of note discount. Outstanding balance is presented net of unamortized debt issuance costs of $4.5 million as of September 30, 2016. |
| |
(4) | Apollo Management International LLP (“AMI”), a subsidiary of the Company, entered into the following five year credit agreements and proceeds from the borrowings were used to fund the Company’s investment in European CLOs it manages: |
|
| | | | | | |
AgreementFacility | | Agreement Date | | Loan Amount |
| 2014 AMI Term Facility I | | July 3, 2014 | | € | 13,39413,686 |
|
| 2014 AMI Term Facility II | | December 9, 2014 | | € | 15,50015,475 |
|
| 2016 AMI Term Facility I | | January 18, 2016 | | € | 16,970 |
|
| 2016 AMI Term Facility II | | June 22, 2016 | | € | 13,236 |
|
| |
(5)(3) | Fair value is based on obtained broker quotes and these notes would be classified as a Level III liability within the fair value hierarchy based on the number and quality of broker quotes obtained, the standard deviations of the observed broker quotes and the percentage deviation from independent pricing services. For instances where broker quotes are not available, a discounted cash flow method is used to obtain a fair value. |
| |
(6)(4) | Fair value is based on obtained broker quotes and these notes would be classified as a Level II liability within the fair value hierarchy based on the number and quality of broker quotes obtained, the standard deviations of the observed broker quotes and the percentage deviation from independent pricing services. |
2013 AMH Credit Facilities—On December 18, 2013, AMH and its subsidiaries and certain other subsidiaries of the Company (collectively, the “Borrowers”) entered into new credit facilities (the “2013 AMH Credit Facilities”) with JPMorgan Chase Bank, N.A. The 2013 AMH Credit Facilities provide for (i) a term loan facility to AMH (the “Term Facility”) that includes $750 million of the term loan from third-party lenders and $271.7 million of the term loan held by a subsidiary of the Company and (ii) a $500 million revolving credit facility (the “Revolver Facility”), in each case, with an original maturity date of January 18, 2019. On March 11, 2016, the maturity date of both the Term Facility and the Revolver Facility was extended by two years to January 18, 2021. The extension was determined to be a modification of the 2013 AMH Credit Facilities in accordance with U.S. GAAP.
Interest on the borrowings is based on an adjusted LIBOR rate or alternate base rate, in each case plus an applicable margin, and undrawn revolving commitments bear a commitment fee. In connection with the issuance of the 2024 Senior Notes and the 2026 Senior Notes (as defined below), $250 million of the proceeds and $200 million of the proceeds, respectively, were used to repay a portion of the Term Facility outstanding with third party lenders at par. The interest rate on the $300 million Term Facility as of September 30, 20162017 was 1.98%2.45% and the commitment fee as of September 30, 20162017 on the $500 million undrawn
APOLLO GLOBAL MANAGEMENT, LLC
NOTES TO CONDENSED CONSOLIDATED
FINANCIAL STATEMENTS
(dollars in thousands, except share data, except where noted)
Revolver Facility was 0.125%. The $300 million carrying value of debt that is recorded on the condensed consolidated statements of financial condition at September 30, 20162017 is the amount for which the Company expectsis obligated to settle the 2013 AMH Credit Facilities.
As of September 30, 2016,2017, the 2013 AMH Credit Facilities were guaranteed by AMH and its subsidiaries, Apollo Management, L.P., Apollo Capital Management, L.P., Apollo International Management, L.P., AAA Holdings, L.P., Apollo Principal Holdings I, L.P., Apollo Principal Holdings II, L.P., Apollo Principal Holdings III, L.P., Apollo Principal Holdings IV, L.P., Apollo Principal Holdings V, L.P., Apollo Principal Holdings VI, L.P., Apollo Principal Holdings VII, L.P., Apollo Principal Holdings VIII, L.P., Apollo Principal Holdings IX, L.P., Apollo Principal Holdings X, L.P., Apollo Principal Holdings XI, LLC, Apollo Principal Holdings XII, L.P., ST Holdings GP, LLC and ST Management Holdings, LLC. The 2013 AMH Credit Facilities contain affirmative and negative covenants which limit the ability of the Borrowers, the guarantors and certain of their subsidiaries to, among other things, incur indebtedness and create liens. Additionally, the 2013 AMH Credit Facilities contain financial covenants which require the Borrowers and their subsidiaries to maintain (1) at least $40 billion of Fee-Generating Assets Under Management and (2) a maximum total net leverage ratio of not more than 4.00 to 1.00 (subject to customary equity cure rights). The 2013 AMH Credit Facilities also contain customary events of default, including events of default arising from non-payment, material misrepresentations, breaches of covenants, cross default to material indebtedness, bankruptcy and changes in control of the Company.
APOLLO GLOBAL MANAGEMENT, LLC
NOTES TO CONDENSED CONSOLIDATED
FINANCIAL STATEMENTS
(dollars in thousands, except share data, except where noted)
Borrowings under the Revolver Facility may be used for working capital and general corporate purposes, including, without limitation, permitted acquisitions. In addition, the Borrowers may incur incremental facilities in respect of the Revolver Facility and the Term Facility in an aggregate amount not to exceed $500 million plus additional amounts so long as the Borrowers are in compliance with a net leverage ratio not to exceed 3.75 to 1.00. As of September 30, 20162017 and December 31, 2015,2016, the Revolver Facility was undrawn.
2024 Senior Notes—On May 30, 2014, AMH issued $500 million in aggregate principal amount of its 4.000% Senior Notes due 2024 (the “2024 Senior Notes”), at an issue price of 99.722% of par. Interest on the 2024 Senior Notes is payable semi-annually in arrears on May 30 and November 30 of each year. The 2024 Senior Notes will mature on May 30, 2024. The discount will be amortized into interest expense on the condensed consolidated statements of operations over the term of the 2024 Senior Notes. The face amount of $500 million related to the 2024 Senior Notes is the amount for which the Company is obligated to settle the 2024 Senior Notes.
2026 Senior Notes—On May 27, 2016, AMH issued $500 million in aggregate principal amount of its 4.400% Senior Notes due 2026 (the “2026 Senior Notes”), at an issue price of 99.912% of par. Interest on the 2026 Senior Notes is payable semi-annually in arrears on May 27 and November 27 of each year. The 2026 Senior Notes will mature on May 27, 2026. The discount on will be amortized into interest expense on the condensed consolidated statements of operations over the term of the 2026 Senior Notes. The face amount of $500 million related to the 2026 Senior Notes is the amount for which the Company is obligated to settle the 2026 Senior Notes.
As of September 30, 2016,2017, the 2026 Senior Notes and the 2024 Senior Notes were guaranteed by Apollo Principal Holdings I, L.P., Apollo Principal Holdings II, L.P., Apollo Principal Holdings III, L.P., Apollo Principal Holdings IV, L.P., Apollo Principal Holdings V, L.P., Apollo Principal Holdings VI, L.P., Apollo Principal Holdings VII, L.P., Apollo Principal Holdings VIII, L.P., Apollo Principal Holdings IX, L.P., Apollo Principal Holdings X, L.P., Apollo Principal Holdings XI, LLC, Apollo Principal Holdings XII, L.P., AMH Holdings (Cayman), L.P. and any other entity that is required to become a guarantor of the notes under the terms of the indentures governing the 2026 Senior Notes and the 2024 Senior Notes (the “Indentures”). The Indentures include covenants that restrict the ability of AMH and, as applicable, the guarantors to incur indebtedness secured by liens on voting stock or profit participating equity interests of their respective subsidiaries or merge, consolidate or sell, transfer or lease assets. The Indentures also provide for customary events of default.
APOLLO GLOBAL MANAGEMENT, LLC
NOTES TO CONDENSED CONSOLIDATED
FINANCIAL STATEMENTS
(dollars in thousands, except share data, except where noted)
The following table presents the interest expense incurred related to the Company’s debt for the three and nine months ended September 30, 20162017 and 2015:2016:
| | | | For the Three Months Ended September 30, | | For the Nine Months Ended September 30, | For the Three Months Ended September 30, | | For the Nine Months Ended September 30, |
| | 2016 | | 2015 | | 2016 | | 2015 | 2017 | | 2016 | | 2017 | | 2016 |
Interest Expense:(1) | | | | | | | | | | | | | | |
| 2013 AMH Term Facility | $ | 1,696 |
| | $ | 2,182 |
| | $ | 6,408 |
| | $ | 6,398 |
| $ | 2,150 |
| | $ | 1,696 |
| | $ | 6,109 |
| | $ | 6,408 |
|
| 2024 Senior Notes | 5,192 |
| | 5,190 |
| | 15,572 |
| | 15,569 |
| 5,163 |
| | 5,192 |
| | 15,489 |
| | 15,572 |
|
| 2026 Senior Notes | 5,630 |
| | — |
| | 7,744 |
| | — |
| 5,628 |
| | 5,630 |
| | 16,885 |
| | 7,744 |
|
| AMI Term Facilities | 314 |
| | 157 |
| | 781 |
| | 487 |
| 362 |
| | 314 |
| | 1,014 |
| | 781 |
|
| Total Interest Expense | $ | 12,832 |
| | $ | 7,529 |
| | $ | 30,505 |
| | $ | 22,454 |
| $ | 13,303 |
| | $ | 12,832 |
| | $ | 39,497 |
| | $ | 30,505 |
|
| |
| (1) | Debt issuance costs incurred in connection with the issuance of the 2013 AMH Term Facility, the 2024 Senior Notes and the 2026 Senior Notes are amortized into interest expense over the term of the debt arrangement. |
10. NET INCOME (LOSS) PER CLASS A SHARE
U.S. GAAP requires use of the two-class method of computing earnings per share for all periods presented for each class of common stock and participating security as if all earnings for the period had been distributed. Under the two-class method, during periods of net income, the net income is first reduced for distributions declared on all classes of securities to arrive at undistributed earnings. During periods of undistributed losses, the undistributed loss is allocated to a participating security only if the security has the right to participate in the earnings of the entity and an objectively determinable contractual obligation to share in net losses of the entity.
APOLLO GLOBAL MANAGEMENT, LLC
NOTES TO CONDENSED CONSOLIDATED
FINANCIAL STATEMENTS
(dollars in thousands, except share data, except where noted)
The remaining undistributed earnings are allocated to Class A shares and participating securities to the extent that each security shares in earnings as if all of the earnings for the period had been distributed. Earnings or losses allocated to each class of security are then divided by the applicable number of shares to arrive at basic earnings per share. For the diluted earnings, the denominator includes all outstanding Class A shares and includes the number of additional Class A shares that would have been outstanding if the dilutive Class A shares had been issued. The numerator is adjusted for any changes in income or loss that would result if the dilutive Class A shares were issued.
APOLLO GLOBAL MANAGEMENT, LLC
NOTES TO CONDENSED CONSOLIDATED
FINANCIAL STATEMENTS
(dollars in thousands, except share data, except where noted)
The table below presents basic and diluted net income (loss) per Class A share using the two-class method for the three and nine months ended September 30, 20162017 and 2015:2016:
| | | | Basic and Diluted | | Basic and Diluted | |
| | For the Three Months Ended September 30, | | For the Nine Months Ended September 30, | | For the Three Months Ended
September 30, | | For the Nine Months Ended
September 30, | |
| | 2016 | | 2015 | | 2016 | | 2015 | | 2017 | | 2016 | | 2017 | | 2016 | |
| Numerator: | | | | | | | | | | | | | | | | |
| Net income attributable to Apollo Global Management, LLC | $ | 94,619 |
| | $ | 41,051 |
| | $ | 235,883 |
| | $ | 128,406 |
| | |
| Net income attributable to Apollo Global Management, LLC Class A Shareholders | | $ | 198,569 |
| | $ | 94,619 |
| | $ | 430,673 |
| | $ | 235,883 |
| |
Distributions declared on Class A shares | (68,356 | ) | (1) | (74,812 | ) | (1) | (165,802 | ) | (1) | (276,021 | ) | (1) | (100,641 | ) |
| (68,356 | ) | | (279,307 | ) | | (165,802 | ) | |
Distributions on participating securities(3)(2) | (2,404 | ) | | (5,113 | ) | | (6,293 | ) | | (25,347 | ) | | (3,265 | ) | | (2,404 | ) | | (9,419 | ) | | (6,293 | ) | |
| Earnings allocable to participating securities | (849 | ) | | — |
| | (2,637 | ) | | — |
| | (3,218 | ) | (3) | (849 | ) | | (5,129 | ) | | (2,637 | ) | |
| Undistributed income (loss) attributable to Class A shareholders: Basic and Diluted | $ | 23,010 |
| | $ | (38,874 | ) | | $ | 61,151 |
| | $ | (172,962 | ) | | |
| Undistributed income attributable to Class A shareholders: Basic and Diluted | | $ | 91,445 |
| | $ | 23,010 |
| | $ | 136,818 |
| | $ | 61,151 |
| |
| Denominator: | | | | | | | | | | | | | | | | |
| Weighted average number of Class A shares outstanding: Basic and Diluted | 184,438,515 |
| | 176,169,986 |
| | 183,602,982 |
| | 170,879,302 |
| | 192,882,082 |
| | 184,438,515 |
| | 190,014,240 |
| | 183,602,982 |
| |
Net Income per Class A Share: Basic and Diluted(2)(4) | | | | | | | | | | | | | | | | |
| Distributed Income | $ | 0.37 |
| | $ | 0.42 |
| | $ | 0.90 |
| | $ | 1.61 |
| | $ | 0.52 |
| | $ | 0.37 |
| | $ | 1.46 |
| | $ | 0.90 |
| |
| Undistributed Income (Loss) | 0.13 |
| | (0.22 | ) | | 0.34 |
| | (1.01 | ) | | |
| Undistributed Income | | 0.48 |
| | 0.13 |
| | 0.73 |
| | 0.34 |
| |
| Net Income per Class A Share: Basic and Diluted | $ | 0.50 |
| | $ | 0.20 |
| | $ | 1.24 |
| | $ | 0.60 |
| | $ | 1.00 |
| | $ | 0.50 |
| | $ | 2.19 |
| | $ | 1.24 |
| |
| |
| (1) | See note 12 for information regarding the quarterly distributions declared and paid during 20162017 and 2015.2016. |
| |
| (2) | For the three and nine months ended September 30, 2016 and 2015, all of the classes of securities were determined to be anti-dilutive. |
| |
(3) | Participating securities consist of vested and unvested RSUs that have rights to distributions and unvested restricted shares. |
| |
| (3) | No allocation of undistributed losses was made to the participating securities as the holders do not have a contractual obligation to share in the losses of the Company with Class A shareholders. |
| |
| (4) | For the three and nine months ended September 30, 2017 and 2016, all of the classes of securities were determined to be anti-dilutive. |
The Company has granted RSUs that provide the right to receive, subject to vesting, Class A shares of Apollo Global Management, LLC, pursuant to the Company’s 2007 Omnibus Equity Incentive Plan (the “2007 Equity Plan”). Certain RSU grants to employees provide the right to receive distribution equivalents on vested RSUs on an equal basis any time a distribution is declared. The Company refers to these RSU grants as “Plan Grants.” For certain Plan Grants, distribution equivalents are paid in January of the calendar year next following the calendar year in which a distribution on Class A shares was declared. In addition, certain RSU grants to employees provide that both vested and unvested RSUs participate in distribution equivalents on an equal basis with the Class A shareholders any time a distribution is declared. The Company refers to these as “Bonus Grants.”
Any distribution equivalent paid to an employee will not be returned to the Company upon forfeiture of the award by the employee. Vested and unvested RSUs that are entitled to non-forfeitable distribution equivalents qualify as participating securities and are included in the Company’s basic and diluted earnings per share computations using the two-class method. The holder of an RSU participating security would have a contractual obligation to share in the losses of the entity if the holder is obligated to fund the losses of the issuing entity or if the contractual principal or mandatory redemption amount of the participating security is reduced as a result of losses incurred by the issuing entity. Because the RSU participating securities do not have a mandatory redemption amount and the holders of the participating securities are not obligated to fund losses, neither the vested RSUs nor the unvested RSUs are subject to any contractual obligation to share in losses of the Company.
Holders of AOG Units are subject to the vesting requirements and transfer restrictions set forth in the agreements with the respective holders, and may a limited number of times each year, upon notice (subject to the terms of the Exchange Agreement), exchange their AOG
APOLLO GLOBAL MANAGEMENT, LLC
NOTES TO CONDENSED CONSOLIDATED
FINANCIAL STATEMENTS
(dollars in thousands, except share data, except where noted)
Units for Class A shares on a one-for-one basis. An AOG Unit holder must exchange one unit in each of the Apollo Operating Group partnerships to effectuate an exchange for one Class A share.
Apollo Global Management, LLC has one Class B share outstanding, which is held by BRH Holdings GP, Ltd. (“BRH”). The voting power of the Class B share is reduced on a one vote per one AOG Unit basis in the event of an exchange of AOG Units for Class A shares, as discussed above. The Class B share has no net income (loss) per share as it does not participate in Apollo’s earnings (losses) or distributions. The Class B share has no distribution or liquidation rights. The Class B share has voting rights on a pari passu basis with the Class A shares. The Class B share represented 60.7%54.3% and 61.7%60.7% of the total voting power of the Company’s shares entitled to vote as of September 30, 2017 and 2016, and 2015, respectively.
APOLLO GLOBAL MANAGEMENT, LLC
NOTES TO CONDENSED CONSOLIDATED
FINANCIAL STATEMENTS
(dollars in thousands, except share data, except where noted)
The following table summarizes the anti-dilutive securities for the three and nine months ended September 30, 20162017 and 2015,2016, respectively.
| | | | For the Three Months Ended September 30, | | For the Nine Months Ended September 30, | For the Three Months Ended
September 30, | | For the Nine Months Ended
September 30, |
| | 2016 | | 2015 | | 2016 | | 2015 | 2017 | | 2016 | | 2017 | | 2016 |
| Weighted average vested RSUs | 873,973 |
| | 8,358,613 |
| | 1,780,166 |
| | 11,553,100 |
| 210,642 |
| | 873,973 |
| | 554,881 |
| | 1,780,166 |
|
| Weighted average unvested RSUs | 5,867,075 |
| | 4,877,577 |
| | 6,054,283 |
| | 4,849,464 |
| 6,196,601 |
| | 5,867,075 |
| | 6,334,220 |
| | 6,054,283 |
|
| Weighted average unexercised options | 222,920 |
| | 227,086 |
| | 222,920 |
| | 228,475 |
| 210,420 |
| | 222,920 |
| | 214,587 |
| | 222,920 |
|
| Weighted average AOG Units outstanding | 215,869,166 |
| | 218,272,537 |
| | 216,034,309 |
| | 220,719,479 |
| 209,522,593 |
| | 215,869,166 |
| | 212,224,998 |
| | 216,034,309 |
|
| Weighted average unvested restricted shares | 67,101 |
| | 101,717 |
| | 85,388 |
| | 86,516 |
| 400,606 |
| | 67,101 |
| | 240,411 |
| | 85,388 |
|
11. EQUITY-BASED COMPENSATION
Equity-based awards granted to employees as compensation are measured based on the grant date fair value of the award. Equity-based awards that do not require future service (i.e., vested awards) are expensed immediately. Equity-based employee awards that require future service are expensed over the relevant service period. Equity-based awards granted to non-employees for services provided to related parties are remeasured to fair value at the end of each reporting period and expensed over the relevant service period.
RSUs
The Company grants RSUs under the 2007 Equity Plan. These grants are accounted for as a grant of equity awards in accordance with U.S. GAAP. The fair value of all grants after March 29, 2011 is based on the grant date fair value, which considers the public share price of the Company. For Plan Grants, the grant date fair value is based on the grant date public share price of the Company’s Class A shares discounted primarily for transfer restrictions and lack of distributions until vested. For Bonus Grants, the grant date fair value is based on the grant date public share price of the Company’s Class A shares discounted primarily for transfer restrictions and insubject to certain cases timing of distributions.discounts, as applicable. The following table summarizes the weighted average discounts for Plan Grants and Bonus Grants for the three and nine months ended September 30, 20162017 and 2015.2016.
| | | | | For the Three Months Ended September 30, | | For the Nine Months Ended September 30, | | For the Three Months Ended September 30, | | For the Nine Months Ended September 30, |
| | | 2016 | | 2015 | | 2016 | | 2015 | | 2017 | | 2016 | | 2017 | | 2016 |
| Plan Grants: | | | | | | | | | | | | | | | | |
Discount for the lack of distributions until vested(1) | | 8.2 | % | | 26.1 | % | | 10.1 | % | | 26.2 | % | | 12.9 | % | | 8.2 | % | | 12.0 | % | | 10.1 | % |
Marketability discount for transfer restrictions(2) | | 5.8 | % | | 3.8 | % | | 5.8 | % | | 3.9 | % | | 4.0 | % | | 5.8 | % | | 3.5 | % | | 5.8 | % |
| Bonus Grants: | | | | | | | | | | | | | | | | |
Marketability discount for transfer restrictions(2) | | 3.0 | % | | 2.3 | % | | 3.4 | % | | 2.2 | % | | 2.3 | % | | 3.0 | % | | 2.3 | % | | 3.4 | % |
| |
| (1) | Based on the present value of a growing annuity calculation. |
| |
| (2) | Based on the Finnerty Model calculation. |
The estimated total grant date fair value of the grants is charged to compensation expense on a straight-line basis over the vesting period, which for Plan Grants is generally up to six years, with the first installment vesting one year after grant and quarterly vesting thereafter, and for Bonus Grants is generally annual vesting over three years. The fair value of grants made during the nine months ended September 30, 2017 and 2016 was $32.3 million and 2015 was $2.8 million, and $18.2 million, respectively.
The following table presents the forfeiture rate and compensation expense recognized for the three and nine months ended September 30, 2016 and 2015:
|
| | | | | | | | | | | | | | | | |
| | | For the Three Months Ended September 30, | | For the Nine Months Ended September 30, |
| | | 2016 | | 2015 | | 2016 | | 2015 |
| Actual Forfeiture rate | | 2.7 | % | | 0.9 | % | | 6.6 | % | | 1.3 | % |
| Equity-based compensation | | $ | 16,724 |
| | $ | 16,330 |
| | $ | 52,564 |
| | $ | 49,860 |
|
APOLLO GLOBAL MANAGEMENT, LLC
NOTES TO CONDENSED CONSOLIDATED
FINANCIAL STATEMENTS
(dollars in thousands, except share data, except where noted)
In addition, the Company provides for the vesting of RSUs when certain performance metrics have been achieved. In accordance with U.S. GAAP, equity-based compensation expense is recognized only when certain performance metrics are met or deemed probable. Accordingly, for the three and nine months ended September 30, 2017, no equity-based compensation expense was recognized relating to these RSUs.
The following table presents the forfeiture rate and equity-based compensation expense recognized for the three and nine months ended September 30, 2017 and 2016:
|
| | | | | | | | | | | | | | | | |
| | | For the Three Months Ended September 30, | | For the Nine Months Ended September 30, |
| | | 2017 | | 2016 | | 2017 | | 2016 |
| Actual forfeiture rate | | 2.3 | % | | 2.7 | % | | 9.3 | % | | 6.6 | % |
| Equity-based compensation | | $ | 17,106 |
| | $ | 16,724 |
| | $ | 50,807 |
| | $ | 52,564 |
|
The following table summarizes RSU activity for the nine months ended September 30, 2016:2017:
| | | | Unvested | | Weighted Average Grant Date Fair Value | | Vested | | Total Number
of RSUs
Outstanding | | Unvested | | Weighted Average Grant Date Fair Value | | Vested | | Total Number of RSUs Outstanding | |
| Balance at January 1, 2016 | 11,040,143 |
| | $ | 16.40 |
| | 6,294,053 |
| | 17,334,196 |
| (1) | |
| Balance at January 1, 2017 | | 9,391,566 |
| | $ | 15.80 |
| | 2,752,455 |
| | 12,144,021 |
| (1) |
| Granted | 172,822 |
| | 16.16 |
| | — |
| | 172,822 |
| | 1,519,021 |
| | 21.29 |
| | — |
| | 1,519,021 |
| |
| Forfeited | (742,744 | ) | | 14.88 |
| | — |
| | (742,744 | ) | | (1,016,156 | ) | | 17.80 |
| | — |
| | (1,016,156 | ) | |
| Issued | — |
| | 16.73 |
| | (6,654,452 | ) | | (6,654,452 | ) | | — |
| | 18.29 |
| | (3,285,664 | ) | | (3,285,664 | ) | |
| Vested | (1,370,998 | ) | | 16.58 |
| | 1,370,998 |
| | — |
| | (859,553 | ) | | 17.29 |
| | 859,553 |
| | — |
| |
| Balance at September 30, 2016 | 9,099,223 |
| | $ | 16.50 |
| | 1,010,599 |
| | 10,109,822 |
| (1) | |
| Balance at September 30, 2017 | | 9,034,878 |
| (2) | $ | 16.36 |
| | 326,344 |
| | 9,361,222 |
| (1) |
| |
| (1) | Amount excludes RSUs which have vested and have been issued in the form of Class A shares. |
| |
| (2) | RSUs were expected to vest over the weighted average period of 2.1 years. |
Restricted Share Awards—Athene Holding
The Company has granted Athene Holding restricted share awards to certain employees of the Company. Separately, Athene Holding has also granted restricted share awards to certain employees of the Company. Both awards are collectively referred to as the “AHL Awards”. Certain of the AHL Awards function similarly to options as they are exchangeable for Class A shares of Athene Holding upon payment of a conversion price and the satisfaction of certain other conditions. The awards granted are either subject to time-based vesting conditions that generally vest over three to five years or vest upon achieving certain metrics, such as attainment of certain rates of return and realized cash received by certain investors in Athene Holding upon sale of their shares.
The Company records the AHL Awards in other assets and other liabilities in the condensed consolidated statements of financial condition. The fair value of the asset is amortized through equity-based compensation over the vesting period. The fair value of the liability is remeasured each period with any changes in fair value recorded in compensation expense in the condensed consolidated statements of operations. For AHL Awards granted by Athene Holding, compensation expense related to amortization of the asset is offset, with certain limited exceptions, by related management fees earned by the Company from Athene.
The grant date fair value of the AHL Awards is based on the share price of Athene Holding, less discounts for transfer restrictions. The AHL Awards that function similarly to options were valued using a multiple-scenario model, which considers the price volatility of the underlying share price of Athene Holding, time to expiration and the risk-free rate, while the other awards were valued using the share price of Athene Holding less any discounts for transfer restrictions.
Units Expected to Vest—As ofThe following table summarizes the management fees, equity-based compensation expense and actual forfeiture rates for the AHL Awards for the three and nine months ended September 30, 2016, approximately 8,700,000 RSUs were expected2017 and 2016:
APOLLO GLOBAL MANAGEMENT, LLC
NOTES TO CONDENSED CONSOLIDATED
FINANCIAL STATEMENTS
(dollars in thousands, except share data, except where noted)
|
| | | | | | | | | | | | | | | |
| | For the Three Months Ended September 30, | | For the Nine Months Ended September 30, |
| | 2017 | | 2016 | | 2017 | | 2016 |
| Management fees | $ | 2,393 |
| | $ | 4,015 |
| | $ | 4,531 |
| | $ | 9,179 |
|
| Equity-based compensation | $ | 3,528 |
| | $ | 4,093 |
| | $ | 6,983 |
| | $ | 9,441 |
|
| Actual forfeiture rate | — | % | | 0.4 | % | | — | % | | 0.8 | % |
Equity-Based Compensation Allocation
Equity-based compensation is allocated based on ownership interests. Therefore, the amortization of equity-based compensation is allocated to vest overshareholders’ equity attributable to Apollo Global Management, LLC and the next 2.8 years.Non-Controlling Interests, which results in a difference in the amounts charged to equity-based compensation expense and the amounts credited to shareholders’ equity attributable to Apollo Global Management, LLC in the Company’s condensed consolidated financial statements.
Below is a reconciliation of the equity-based compensation allocated to Apollo Global Management, LLC for the nine months ended September 30, 2017 and 2016:
|
| | | | | | | | | | | | | | |
| | For the Nine Months Ended September 30, 2017 |
| | Total Amount | | Non-Controlling Interest % in Apollo Operating Group | | Allocated to Non-Controlling Interest in Apollo Operating Group(1) | | Allocated to Apollo Global Management, LLC |
| RSUs, share options and restricted share awards | $ | 54,901 |
| | — | % | | $ | — |
| | $ | 54,901 |
|
| AHL Awards | 6,983 |
| | 51.9 |
| | 3,624 |
| | 3,359 |
|
| Other equity-based compensation awards | 8,448 |
| | 51.9 |
| | 4,385 |
| | 4,063 |
|
| Total equity-based compensation | $ | 70,332 |
| | | | 8,009 |
| | 62,323 |
|
Less other equity-based compensation awards(2) | | | | | (8,009 | ) | | (9,881 | ) |
| Capital increase related to equity-based compensation | | | | | $ | — |
| | $ | 52,442 |
|
|
| | | | | | | | | | | | | | |
| | For the Nine Months Ended September 30, 2016 |
| | Total Amount | | Non-Controlling Interest % in Apollo Operating Group | | Allocated to Non-Controlling Interest in Apollo Operating Group(1) | | Allocated to Apollo Global Management, LLC |
| RSUs, share options and restricted share awards | $ | 55,260 |
| | — | % | | $ | — |
| | $ | 55,260 |
|
| AHL Awards | 9,441 |
| | 53.9 |
| | 5,093 |
| | 4,348 |
|
| Other equity-based compensation awards | 9,502 |
| | 53.9 |
| | 5,127 |
| | 4,375 |
|
| Total equity-based compensation | $ | 74,203 |
| | | | 10,220 |
| | 63,983 |
|
Less other equity-based compensation awards(2) | | | | | (10,220 | ) | | (10,073 | ) |
| Capital increase related to equity-based compensation | | | | | $ | — |
| | $ | 53,910 |
|
| |
| (1) | Calculated based on average ownership percentage for the period considering Class A share issuances during the period. |
| |
| (2) | Includes equity-based compensation reimbursable by certain funds and distributions related to forfeited RSUs. |
APOLLO GLOBAL MANAGEMENT, LLC
NOTES TO CONDENSED CONSOLIDATED
FINANCIAL STATEMENTS
(dollars in thousands, except share data, except where noted)
12. EQUITY
Class A Shares
Class A shares represent limited liability company interests in the Company. Holders of Class A shares are entitled to participate in distributions from the Company on a pro rata basis. Class A shareholders do not elect the Company’s manager or the manager’s executive committee and have only limited voting rights.
Issuance of Class A Shares - RSUs
During the nine months ended September 30, 20162017 and 2015,2016, the Company issued Class A shares in settlement of vested RSUs. The Company has generally allowed holders of vested RSUs and exercised share options to settle their tax liabilities by reducing the number of Class A shares issued to them, which the Company refers to as “net share settlement.” Additionally, the Company has generally allowed holders of share options to settle their exercise price by reducing the number of Class A shares issued to them at the time of exercise by an amount sufficient to cover the exercise price. The net share settlement results in a liability for the Company and a corresponding accumulated deficit adjustment. This adjustment for the nine months ended September 30, 2016 and 2015 was $35.3 million and $53.0 million, respectively.
The issuancetable below summarizes the reduction of Class A shares to be issued to employees in settlement of vested RSUsconnection with net share settlements under the 2007 Equity Plan and exercised share options does not cause a transfer of amounts in the condensed consolidated statements of changes in shareholders’ equity to the Class A shareholders. The issuance of Class A shares in settlement of vested RSUs causes the income allocated to the Non-Controlling Interests to shift to the Class A shareholders from the date of issuance forward. The table below summarizes the issuances of Class A shares in settlement of vested RSUs and exercised share options for the three and nine months ended September 30, 20162017 and 2015:2016:
| | | | | For the Three Months Ended September 30, | | For the Nine Months Ended September 30, | For the Nine Months Ended September 30, |
| | | 2016 | | 2015 | | 2016 | | 2015 | 2017 | | 2016 |
Reduction of Class A shares issued(1) | | 1,196,549 |
| | 2,407,275 |
|
| Class A shares issued | | 435,787 |
| | 2,377,034 |
| | 4,246,760 |
| | 9,253,602 |
| 2,097,249 |
| | 4,246,760 |
|
Gross value of shares(1) | | $ | 13,636 |
| | $ | 77,103 |
| | $ | 96,437 |
| | $ | 261,566 |
| |
Gross value of shares(2) | | $ | 76,803 |
| | $ | 96,437 |
|
| |
| (1) | Cash paid for tax liabilities associated with net share settlement was $28.0 million and $35.3 million for the nine months ended September 30, 2017 and 2016, respectively. |
| |
| (2) | Based on the closing price of a Class A share at the time of issuance. |
Share Repurchase ProgramPlan
In February 2016, Apollo adopted a programplan to repurchase up to $250 million in the aggregate of its Class A shares, including up to $150 million in the aggregate of its outstanding Class A shares through a share repurchase program and up to $100 million through net share settlement of equity-based awards granted under the 2007 Equity Plan. During the nine months ended September 30, 2017, the Company repurchased and canceled 233,248 Class A shares for $6.9 million. During the nine months ended September 30, 2016, the Company repurchased and canceled 1.0 million954,447 Class A shares for $12.9 million.
Preferred Share Issuance
On March 7, 2017, Apollo issued 11,000,0006.375% Series A Preferred shares (the “Preferred shares”) for gross proceeds of $275.0 million, or $264.4 million net of issuance costs. When, as and in connection with net share settlements, reducedif declared by the manager of Apollo, distributions on the Preferred shares will be payable quarterly on March 15, June 15, September 15 and December 15 of each year, beginning on June 15, 2017, at a rate per annum equal to 6.375%. Distributions on the Preferred shares are discretionary and non-cumulative.
Subject to certain exceptions, unless distributions have been declared and paid or declared and set apart for payment on the Preferred shares for a quarterly distribution period, during the remainder of that distribution period, Apollo may not declare or pay or set apart payment for distributions on any Class A shares and any other equity securities that the Company may issue in the future ranking, as to the payment of distributions, junior to the Preferred shares (“Junior Shares”) and Apollo may not repurchase any Junior Shares. These restrictions are not applicable during the initial distribution period, which is the period from March 7, 2017, the original issue date, to but excluding June 15, 2017.
The Preferred shares may be issuedredeemed at Apollo’s option, in whole or in part, at any time on or after March 15, 2022 at a price of $25.00 per Preferred share, plus declared and unpaid distributions to, employees underbut excluding, the 2007 Equity Planredemption date, without
APOLLO GLOBAL MANAGEMENT, LLC
NOTES TO CONDENSED CONSOLIDATED
FINANCIAL STATEMENTS
(dollars in thousands, except share data, except where noted)
payment of any undeclared distributions. Holders of Preferred shares will have no right to require the redemption of the Preferred shares and there is no maturity date.
If a certain change of control event or a certain tax redemption event occurs prior to March 15, 2022, the Preferred shares may be redeemed at Apollo’s option, in whole but not in part, upon at least 30 days’ notice, within 60 days of the occurrence of such change of control event or such tax redemption event, as applicable, at a price of $25.25 per Preferred share, plus declared and unpaid distributions to, but excluding, the redemption date, without payment of any undeclared distributions. If (i) a change of control event occurs (whether before, on or after March 15, 2022) and (ii) Apollo does not give notice prior to the 31st day following the change of control event to redeem all the outstanding Preferred shares, the distribution rate per annum on the Preferred shares will increase by 2.4 million5.00%, beginning on the 31st day following such change of control event.
The Preferred shares are not convertible into Class A shares resultingand have no voting rights, except in limited circumstances as provided in the Company’s limited liability company agreement. In connection with the issuance of the Preferred shares, certain Apollo Operating Group entities issued for the benefit of Apollo a payment byseries of preferred units with economic terms that mirror those of the Preferred shares.
On August 2, 2017, Apollo declared a cash distribution of $0.398438 per Series A Preferred share. The distributions on the Series A Preferred shares were $4.4 million and $9.2 million for the three and nine months ended September 30, 2017, respectively.
Distributions
In addition to other distributions such as payments pursuant to the tax receivable agreement, the table below presents information regarding the quarterly distributions which were made at the sole discretion of the manager of the Company of $35.3 million to satisfy the applicable withholding obligation.during 2017 and 2016 (in millions, except per share data):
Restricted Share Awards—Athene HoldingAthene Holding has granted restricted share awards (“AHL Awards”) to certain employees of Apollo, which function similarly to options as they are exchangeable for Class A shares of Athene Holding upon payment of a conversion price and the satisfaction of certain other conditions. Certain of the awards granted are subject to time-based vesting conditions that generally vest over five years and achieving certain metrics, such as attainment of certain rates of return and realized cash received by certain |
| | | | | | | | | | | | | | | | | | | | | | |
Distribution Declaration Date | | Distribution per Class A Share | | Distribution Payment Date | | Distribution to Class A Shareholders | | Distribution to Non-Controlling Interest Holders in the Apollo Operating Group | | Total Distributions from Apollo Operating Group | | Distribution Equivalents on Participating Securities |
| February 3, 2016 | | $ | 0.28 |
| | February 29, 2016 | | $ | 51.4 |
| | $ | 60.5 |
| | $ | 111.9 |
| | $ | 2.1 |
|
| May 6, 2016 | | 0.25 |
| | May 31, 2016 | | 46.0 |
| | 54.0 |
| | 100.0 |
| | 1.8 |
|
| August 3, 2016 | | 0.37 |
| | August 31, 2016 | | 68.4 |
| | 79.9 |
| | 148.3 |
| | 2.4 |
|
| October 28, 2016 | | 0.35 |
| | November 30, 2016 | | 64.9 |
| | 75.4 |
| | 140.3 |
| | 2.1 |
|
| For the year ended December 31, 2016 | | $ | 1.25 |
| | | | $ | 230.7 |
| | $ | 269.8 |
| | $ | 500.5 |
| | $ | 8.4 |
|
| February 3, 2017 | | $ | 0.45 |
| | February 28, 2017 | | $ | 84.2 |
| | $ | 97.0 |
| | $ | 181.2 |
| | $ | 2.9 |
|
April 13, 2017(1) | | — |
| | April 13, 2017 | | — |
| | 20.5 |
| | 20.5 |
| | — |
|
| April 28, 2017 | | 0.49 |
| | May 31, 2017 | | 94.5 |
| | 102.9 |
| | 197.4 |
| | 3.3 |
|
| August 2, 2017 | | 0.52 |
| | August 31, 2017 | | 100.6 |
| | 108.8 |
| | 209.4 |
| | 3.2 |
|
| For the nine months ended September 30, 2017 | | $ | 1.46 |
| | | | $ | 279.3 |
| | $ | 329.2 |
| | $ | 608.5 |
| | $ | 9.4 |
|
| |
| (1) | On April 13, 2017, the Company made a $0.10 per AOG Unit pro rata distribution to the Non-Controlling Interest holders in the Apollo Operating Group in connection with a payment made under the tax receivable agreement. See note 13 for more information regarding the tax receivable agreement. |
APOLLO GLOBAL MANAGEMENT, LLC
NOTES TO CONDENSED CONSOLIDATED
FINANCIAL STATEMENTS
(dollars in thousands, except share data, except where noted)
investorsNon-Controlling Interests
The table below presents equity interests in Athene Holding upon saleApollo’s consolidated, but not wholly-owned, subsidiaries and funds. Net income and comprehensive income attributable to Non-Controlling Interests consisted of the following:
|
| | | | | | | | | | | | | | | |
| | For the Three Months Ended September 30, | | For the Nine Months Ended September 30, |
| | 2017 | | 2016 | | 2017 | | 2016 |
| Net income (loss) attributable to Non-Controlling Interests in consolidated entities: | | | | | | | |
Interest in management companies and a co-investment vehicle(1) | $ | 1,637 |
| | $ | 260 |
| | $ | 3,264 |
| | $ | 4,804 |
|
| Other consolidated entities | (589 | ) | | (482 | ) | | 5,703 |
| | (913 | ) |
| Net income (loss) attributable to Non-Controlling Interests in consolidated entities | $ | 1,048 |
| | $ | (222 | ) | | $ | 8,967 |
| | $ | 3,891 |
|
| | | | | | | | |
| Net income attributable to Non-Controlling Interests in the Apollo Operating Group: | | | | | | | |
| Net income | $ | 434,363 |
| | $ | 234,718 |
| | $ | 982,335 |
| | $ | 575,960 |
|
| Net (income) loss attributable to Non-Controlling Interests in consolidated entities | (1,048 | ) | | 222 |
| | (8,967 | ) | | (3,891 | ) |
| Net income after Non-Controlling Interests in consolidated entities | 433,315 |
| | 234,940 |
| | 973,368 |
| | 572,069 |
|
| Adjustments: | | | | | | | |
Income tax provision(2) | 16,542 |
| | 29,667 |
| | 54,926 |
| | 62,508 |
|
NYC UBT and foreign tax benefit(3) | (2,595 | ) | | (4,419 | ) | | (7,014 | ) | | (11,715 | ) |
| Net income in non-Apollo Operating Group entities | 16 |
| | 66 |
| | 18 |
| | 85 |
|
| Net income attributable to Preferred Shareholders | (4,383 | ) | | — |
| | (9,155 | ) | | — |
|
| Total adjustments | 9,580 |
| | 25,314 |
| | 38,775 |
| | 50,878 |
|
| Net income after adjustments | 442,895 |
| | 260,254 |
| | 1,012,143 |
| | 622,947 |
|
| Weighted average ownership percentage of Apollo Operating Group | 52.0 | % | | 53.9 | % | | 52.7 | % | | 54.0 | % |
| Net income attributable to Non-Controlling Interests in Apollo Operating Group | $ | 230,363 |
| | $ | 140,321 |
| | $ | 533,540 |
| | $ | 336,186 |
|
| | | | | | | | |
| Net Income attributable to Non-Controlling Interests | $ | 231,411 |
| | $ | 140,099 |
| | $ | 542,507 |
| | $ | 340,077 |
|
| Other comprehensive income attributable to Non-Controlling Interests | 4,999 |
| | 545 |
| | 8,188 |
| | 1,462 |
|
| Comprehensive Income Attributable to Non-Controlling Interests | $ | 236,410 |
| | $ | 140,644 |
| | $ | 550,695 |
| | $ | 341,539 |
|
| |
| (1) | Reflects the remaining interest held by certain individuals who receive an allocation of income from certain of the credit funds managed by Apollo. |
| |
| (2) | Reflects all taxes recorded in our condensed consolidated statements of operations. Of this amount, U.S. federal, state, and local corporate income taxes attributable to APO Corp. are added back to income of the Apollo Operating Group before calculating Non-Controlling Interests as the income allocable to the Apollo Operating Group is not subject to such taxes. |
| |
| (3) | Reflects NYC UBT and foreign taxes that are attributable to the Apollo Operating Group and its subsidiaries related to its operations in the U.S. as partnerships and in non-U.S. jurisdictions as corporations. As such, these amounts are considered in the income attributable to the Apollo Operating Group. |
13. RELATED PARTY TRANSACTIONS AND INTERESTS IN CONSOLIDATED ENTITIES
Management fees, transaction and advisory fees and reimbursable expenses from the funds the Company manages and their shares. The AHL Awardsportfolio companies are not convertible into Class A shares of Athene Holding until the completion of an initial public offering of Athene Holding.
The AHL Awards, are accounted for as a prepaid compensation asset within other assets and deferred revenueincluded in due from related parties in the condensed consolidated statements of financial condition. FromThe Company also typically facilitates the datepayment of grant,certain operating costs incurred by the deferred revenue is recognizedfunds that it manages as management fees and the prepaid compensation asset is recognizedwell as compensation expense over the vesting period. The fair value of the awards to employees is based on the grant date fair value, which utilizes the share price of Athene Holding, less discounts for transfer restrictions. Shares granted as part of the AHL Awards were valued using a multiple-scenario model, which considers the price volatility of the underlying stock price of Athene Holding, time to expiration and the risk-free rate. The awards grantedtheir related parties. These costs are recognized as liability awardsnormally reimbursed by such funds and are remeasured each period to reflect the fair value of the prepaid compensation asset and deferred revenue. Any changesincluded in fair value are recorded in management fees and equity-based compensation expense in the condensed consolidated statements of operations.
The following table presents the equity-based compensation expense that was recognized in the condensed consolidated statements of operationsdue from related to AHL Awards granted to employees of Athene Asset Management for the three and nine months ended September 30, 2016 and 2015:parties.
|
| | | | | | | | | | | | | | | | |
| | | For the Three Months Ended September 30, | | For the Nine Months Ended September 30, |
| | | 2016 | | 2015 | | 2016 | | 2015 |
| Equity-based compensation | | $ | 4,093 |
| | $ | 13,331 |
| | $ | 9,441 |
| | $ | 19,592 |
|
Equity-Based Compensation Allocation
Equity-based compensation is allocated based on ownership interests. Therefore, the amortization of equity-based compensation is allocated to shareholders’ equity attributable to Apollo Global Management, LLC and the Non-Controlling Interests, which results in a difference in the amounts charged to equity-based compensation expense and the amounts credited to shareholders’ equity attributable to Apollo Global Management, LLC in the Company’s condensed consolidated financial statements.
Below is a reconciliation of the equity-based compensation allocated to Apollo Global Management, LLC for the nine months ended September 30, 2016:
|
| | | | | | | | | | | | | | |
| | Total Amount | | Non- Controlling Interest % in Apollo Operating Group | | Allocated to Non- Controlling Interest in Apollo Operating Group(1) | | Allocated to Apollo Global Management, LLC |
| RSUs and Share Options | $ | 55,260 |
| | — | % | | $ | — |
| | $ | 55,260 |
|
| AHL Awards | 9,441 |
| | 53.9 |
| | 5,093 |
| | 4,348 |
|
| Other equity-based compensation awards | 9,502 |
| | 53.9 |
| | 5,127 |
| | 4,375 |
|
| Total equity-based compensation | $ | 74,203 |
| | | | 10,220 |
| | 63,983 |
|
Less other equity-based compensation awards(2) | | | | | (10,220 | ) | | (10,073 | ) |
| Capital increase related to equity-based compensation | | | | | $ | — |
| | $ | 53,910 |
|
| |
(1) | Calculated based on average ownership percentage for the period considering Class A share issuances during the period. |
| |
(2) | Includes equity-based compensation reimbursable by certain funds. |
APOLLO GLOBAL MANAGEMENT, LLC
NOTES TO CONDENSED CONSOLIDATED
FINANCIAL STATEMENTS
(dollars in thousands, except share data, except where noted)
Below is a reconciliation of the equity-based compensation allocated to Apollo Global Management, LLC for the nine months ended September 30, 2015:
|
| | | | | | | | | | | | | | |
| | Total Amount | | Non- Controlling Interest % in Apollo Operating Group | | Allocated to Non- Controlling Interest in Apollo Operating Group(1) | | Allocated to Apollo Global Management, LLC |
| RSUs and Share Options | $ | 50,305 |
| | — | % | | $ | — |
| | $ | 50,305 |
|
| AHL Awards | 19,592 |
| | 54.7 |
| | 10,718 |
| | 8,874 |
|
| Other equity-based compensation awards | 3,889 |
| | 54.7 |
| | 2,128 |
| | 1,761 |
|
| Total equity-based compensation | $ | 73,786 |
| | | | 12,846 |
| | 60,940 |
|
Less other equity-based compensation awards(2) | | | | | (12,846 | ) | | (10,988 | ) |
| Capital increase related to equity-based compensation | | | | | $ | — |
| | $ | 49,952 |
|
| |
(1) | Calculated based on average ownership percentage for the period considering Class A share issuances during the period. |
| |
(2) | Includes equity-based compensation reimbursable by certain funds. |
12. RELATED PARTY TRANSACTIONS AND INTERESTS IN CONSOLIDATED ENTITIES
The Company typically facilitates the initial payment of certain operating costs incurred by the funds that it manages as well as their related parties. These costs are normally reimbursed by such funds and are included in due from related parties.
Due from related parties and due to related parties are comprised of the following:
| | | | As of
September 30, 2016 | | As of
December 31, 2015 | As of
September 30, 2017 | | As of
December 31, 2016 |
| Due from Related Parties: | | | | | | |
| Due from private equity funds | $ | 23,368 |
| | $ | 21,532 |
| $ | 17,883 |
| | $ | 19,089 |
|
| Due from portfolio companies | 44,254 |
| | 36,424 |
| 40,028 |
| | 34,339 |
|
| Due from credit funds | 136,352 |
| | 124,660 |
| 136,856 |
| | 112,516 |
|
| Due from Contributing Partners, employees and former employees | 73,968 |
| | 42,491 |
| 66,344 |
| | 72,305 |
|
| Due from real estate funds | 19,777 |
| | 22,728 |
| |
| Due from real assets funds | | 26,241 |
| | 16,604 |
|
| Total Due from Related Parties | $ | 297,719 |
| | $ | 247,835 |
| $ | 287,352 |
| | $ | 254,853 |
|
| Due to Related Parties: | | | | | | |
| Due to Managing Partners and Contributing Partners in connection with the tax receivable agreement | $ | 507,680 |
| | $ | 506,162 |
| |
| Due to Managing Partners and Contributing Partners | | $ | 524,593 |
| | $ | 506,542 |
|
| Due to private equity funds | 78,435 |
| | 16,293 |
| 43,059 |
| | 56,880 |
|
| Due to credit funds | 68,806 |
| | 57,981 |
| 75,463 |
| | 66,859 |
|
| Due to real estate funds | 282 |
| | 580 |
| |
| Due to real assets funds | | 286 |
| | 281 |
|
| Distributions payable to employees | 6,312 |
| | 13,520 |
| — |
| | 7,564 |
|
| Total Due to Related Parties | $ | 661,515 |
| | $ | 594,536 |
| $ | 643,401 |
| | $ | 638,126 |
|
Tax Receivable Agreement and Other
Subject to certain restrictions, each of the Managing Partners and Contributing Partners has the right to exchange their vested AOG Units for the Company’s Class A shares. Certain Apollo Operating Group entities have made an election under Section 754 of the U.S. Internal Revenue Code of 1986, as amended (the “Internal Revenue Code”), which will result in an adjustment to the tax basis of the assets owned by the Apollo Operating Group at the time of the exchange. These exchanges will result in increases in tax deductions that will reduce the amount of tax that APO Corp. will otherwise be required to pay in the future.
APOLLO GLOBAL MANAGEMENT, LLC
NOTES TO CONDENSED CONSOLIDATED
FINANCIAL STATEMENTS
(dollars in thousands, except share data, except where noted)
The tax receivable agreement provides for the payment to the Managing Partners and Contributing Partners of 85% of the amount of cash savings, if any, in U.S. federal, state, local and foreign income taxes that APO Corp. would realize as a result of the increases in tax basis of assets that resulted from the 2007 Reorganization and exchanges of AOG Units for Class A shares. APO Corp. retains the benefit from the remaining 15% of actual cash tax savings. If the Company does not make the required annual payment on a timely basis as outlined in the tax receivable agreement, interest is accrued on the balance until the payment date. These payments are expected to occur approximately over the next 15 years.
As a result of the exchanges of AOG Units for Class A shares during the three and nine months ended September 30, 2016 and 2015, a $1.5 million and a $44.5 million liability was recorded, respectively, to estimate the amount of the future expected payments to be made by APO Corp. to the Managing Partners and Contributing Partners pursuant to the tax receivable agreement.
In April 2015,2017, Apollo made a $17.9 million cash paymentspayment pursuant to the tax receivable agreement resulting from the realized tax benefit for each precedingthe 2016 tax year. IncludedAdditionally, in connection with this payment, the Company made a corresponding pro rata distribution of $20.5 million ($0.10 per AOG Unit) to the Non-Controlling Interest holders in the payments was interest paid to the Managing Partners and Contributing Partners. There were no such cash payments made in 2016. The table below presents the cash payments made during 2015.
|
| | | | | | | | | | | | |
| Date | | Cash Payment | | Interest Paid to Managing Partners | | Interest Paid to Contributing Partners |
| April, 2015 | | $ | 48,420 |
| | $ | 13,090 |
| | $ | 555 |
|
Pursuant to the tax receivable agreement, the Managing Partners and Contributing Partners who exchanged AOG Units for Class A shares will receive payment from APO Corp. of 85% of the amount of the actual cash tax savings, if any, in U.S. federal, state, local and foreign income tax that APO Corp. realizes as a result of these increases in tax deductions and tax basis, and certain other tax benefits, including imputed interest expense. APO Corp. retains the benefit from the remaining 15% of actual cash tax savings.
Distributions
In addition to other distributions such as payments pursuant to the tax receivable agreement, the table below presents information regarding the quarterly distributions which were made at the sole discretion of the manager of the Company during 2015 and 2016 (in millions, except per share data):
|
| | | | | | | | | | | | | | | | | | | | | | |
Distribution Declaration Date | | Distribution per Class A Share | | Distribution Payment Date | | Distribution to Class A Shareholders | | Distribution to Non-Controlling Interest Holders in the Apollo Operating Group | | Total Distributions from Apollo Operating Group | | Distribution Equivalents on Participating Securities |
| February 5, 2015 | | $ | 0.86 |
| | February 27, 2015 | | $ | 144.4 |
| | $ | 191.3 |
| | $ | 335.7 |
| | $ | 15.3 |
|
| April 11, 2015 | | — |
| | April 11, 2015 | | — |
| | 22.4 |
| (1) | 22.4 |
| | — |
|
| May 7, 2015 | | 0.33 |
| | May 29, 2015 | | 56.8 |
| | 72.8 |
| | 129.6 |
| | 4.9 |
|
| July 29, 2015 | | 0.42 |
| | August 31, 2015 | | 74.8 |
| | 91.2 |
| | 166.0 |
| | 5.1 |
|
| October 28, 2015 | | 0.35 |
| | November 30, 2015 | | 63.4 |
| | 75.7 |
| | 139.1 |
| | 3.1 |
|
| For the year ended December 31, 2015 | | $ | 1.96 |
| | | | $ | 339.4 |
| | $ | 453.4 |
| | $ | 792.8 |
| | $ | 28.4 |
|
| February 3, 2016 | | $ | 0.28 |
| | February 29, 2016 | | $ | 51.4 |
| | $ | 60.5 |
| | $ | 111.9 |
| | $ | 2.1 |
|
| May 6, 2016 | | 0.25 |
| | May 31, 2016 | | 46.0 |
| | 54.0 |
| | 100.0 |
| | 1.8 |
|
| August 3, 2016 | | 0.37 |
| | August 31, 2016 | | 68.4 |
| | 79.9 |
| | 148.3 |
| | 2.4 |
|
| For the nine months ended September 30, 2016 | | $ | 0.90 |
| | | | $ | 165.8 |
| | $ | 194.4 |
| | $ | 360.2 |
| | $ | 6.3 |
|
| |
(1) | On April 11, 2015, the Company made a $0.10 distribution per AOG Unit to the Non-Controlling Interest holders in the Apollo Operating Group. |
APOLLO GLOBAL MANAGEMENT, LLC
NOTES TO CONDENSED CONSOLIDATED
FINANCIAL STATEMENTS
(dollars in thousands, except share data, except where noted)
Apollo Operating Group.
Due from Contributing Partners, Employees and Former Employees
As of September 30, 20162017 and December 31, 2015,2016, due from Contributing Partners, Employees and Former Employees includes various amounts due to the Company including employee loans and return of profit sharing distributions. As of September 30, 20162017 and December 31, 2015,2016, the balance included interest-bearing employee loans receivable of $25.9$15.3 million and $25.0$26.1 million, respectively. The outstanding principal amount of the loans as well as all accrued and unpaid interest is required to be repaid at the earlier of the eighth anniversary of the date of the relevant loan or at the date of the relevant employee’s resignation from the Company.
The Company recorded a receivable from the Contributing Partners and certain employees and former employees for the potential return of profit sharing distributions that would be due if certain funds were liquidated as of September 30, 2017 and December 31, 2016 with respect to Fund VI, Fund VII, Fund V, Apollo Credit Liquidity Fund, L.P. (“ACLF”), ANRP I and a performance-based incentive plan of $19.0 million, $12.9 million, $5.5 million, $4.9 million, $1.3$43.9 million and $1.9$39.3 million, respectively. The $12.9 million clawback
Table of profit sharing with respect to Fund VII was recorded during the nine months ended September 30, 2016, of which $11.0 million pertained to periods prior to December 31, 2015. The receivable with respect to ACLF, Fund V, ANRP I and a performance-based incentive plan was $6.9 million, $4.9 million, $1.3 million and $1.6 million, respectively, as of December 31, 2015.Contents APOLLO GLOBAL MANAGEMENT, LLC
NOTES TO CONDENSED CONSOLIDATED
FINANCIAL STATEMENTS
(dollars in thousands, except share data, except where noted)
Indemnity
Carried interest income from certain funds that the Company manages can be distributed to the Company on a current basis, but is subject to repayment by the subsidiary of the Apollo Operating Group that acts as general partner of the fund in the event that certain specified return thresholds are not ultimately achieved. The Managing Partners, Contributing Partners and certain other investment professionals have personally guaranteed, subject to certain limitations, the obligation of these subsidiaries in respect of this general partner obligation. Such guarantees are several and not joint and are limited to a particular Managing Partner’s or Contributing Partner’s distributions. AnPursuant to an existing shareholders agreement, includes clauses that the Company willhas agreed to indemnify each of the Company’s Managing Partners and certain Contributing Partners against all amounts that they pay pursuant to any of these personal guarantees in favor of certain funds that the Company manages (including costs and expenses related to investigating the basis for or objecting to any claims made in respect of the guarantees) for all interests that the Company’s Managing Partners and Contributing Partners have contributed or sold to the Apollo Operating Group.
Accordingly, in the event that the Company’s Managing Partners, Contributing Partners and certain investment professionals are required to pay amounts in connection with a general partner obligation for the return of previously made distributions, the Company will be obligated to reimburse the Company’s Managing Partners and certain Contributing Partners for the indemnifiable percentage of amounts that they are required to pay even though the Company did not receive the certain distribution to which that general partner obligation related. The Company recorded an indemnification liability of $5.1$10.2 million and $4.6$5.9 million, respectively, as of September 30, 20162017 and December 31, 2015.2016.
Due to Private Equity Funds
Based upon a hypothetical liquidation of Fund VI, Fund V and ANRP Icertain of the private equity funds the Company manages, as of September 30, 2017 and December 31, 2016, the Company has recorded a general partner obligation to return previously distributed carried interest income, which represents amounts due to these funds. As such, thereThere was a general partner obligation to return previously distributed carried interest income with respect to Fund VI, Fund V and ANRP I of $56.0 million, $12.0$42.2 million and $3.4$56.0 million accrued as of September 30, 2016, respectively. As of2017 and December 31, 2015, the Company accrued a general partner obligation to return previously distributed carried interest income with respect to Fund V and ANRP I of $10.8 million and $3.4 million,2016, respectively. The actual determination and any required payment of a general partner obligation would not take place until the final disposition of the fund’s investments based on contractual termination of the fund or as otherwise set forth in the respective limited partnership agreement or other governing document of the fund.
Due to Credit Funds
Based upon a hypothetical liquidation of certain of ourthe credit funds the Company manages, as of September 30, 20162017 and December 31, 2015,2016, the Company has recorded a general partner obligation to return previously distributed carried interest income, which represents amounts due to these funds. As such, there was a general partner obligation to return previously distributed carried interest income with respect to ACLF, Apollo Asia Private Credit Fund, L.P. (“APC”) and certain SIAs within the credit segment of $24.7 million, $2.1$69.3 million and $36.7$60.6 million accrued as of September 30, 2016, respectively. As of2017 and December 31, 2015, the Company accrued a general partner obligation to return previously distributed carried interest income with respect to ACLF, Apollo Credit Opportunity Fund II, L.P. (“COF II”), APC and certain SIAs within the credit segment of $25.6 million, $0.4 million, $2.1 million and $29.7
APOLLO GLOBAL MANAGEMENT, LLC
NOTES TO CONDENSED CONSOLIDATED
FINANCIAL STATEMENTS
(dollars in thousands, except share data, except where noted)
million accrued,2016, respectively. The actual determination and any required payment of a general partner obligation would not take place until the final disposition of the fund’s investments based on contractual termination of the fund or as otherwise set forth in the respective limited partnership agreement or other governing document of the fund.
Athene
Athene Holding iswas founded in 2009 to capitalize on favorable market conditions in the ultimate parent of variousdislocated life insurance company operating subsidiaries. Throughsector. Athene Holding, through its subsidiaries, is a leading retirement services company that issues, reinsures and acquires retirement savings products designed for the increasing number of individuals and institutions seeking to fund retirement needs. The products and services offered by Athene include fixed and fixed indexed annuity products; reinsurance services offered to third-party annuity providers; and institutional products, such as funding agreements. Athene Holding provides insurance products focused primarilybecame an effective registrant under the Exchange Act on December 9, 2016. Athene Holding currently trades on the retirement market and its business centers primarily on issuing or reinsuring fixed indexed annuities.New York Stock Exchange (NYSE) under the symbol “ATH”.
The Company through its consolidated subsidiary, Athene Asset Management, provides asset management and advisory services to Athene, including asset allocation services, direct asset management services, risk management, asset and liability matching management, mergers and acquisitions, asset diligence hedging and other asset management services, and receives a gross management fee ofservices.
The Company, through its consolidated subsidiary Athene Asset Management, or AAM, earns 0.40% per annumyear on all assets under managementthat it manages in accounts owned by Athene in the U.S. and Bermuda or relatedin accounts supporting reinsurance ceded to U.S. and Bermuda subsidiaries of Athene Holding by third-party insurers (the “Athene North American Accounts”) withup to $65.846 billion
APOLLO GLOBAL MANAGEMENT, LLC
NOTES TO CONDENSED CONSOLIDATED
FINANCIAL STATEMENTS
(dollars in thousands, except share data, except where noted)
(the level of assets in the Athene North American Accounts as of December 31, 2016) and 0.30% per year on all assets in excess of $65.846 billion, respectively, subject to certain limiteddiscounts and exceptions. Another
The Company, through its consolidated subsidiary, of the Company, AAME, provides investment advisory services to Athene with respect to its German group companies. Such German group companies are currently subsidiaries of AGER, a strategic platform established to acquire or reinsure blocks of insurance business in the German and broader European life insurance market. Apollo receives a gross advisory fee of 0.10% per annum on the assets of Athene’s German group companies that it advises, with respect to which it advises.certain limited exceptions.
The Company, through AAM, provides sub-advisory services with respect to a portion of the assets in the Athene North American Accounts. In addition, fromApollo, through AAME, sub-advises certain assets of a German subsidiary of Athene (such assets, together with the assets of Athene’s other German group companies collectively, the “Athene European Accounts”).
From time to time, Athene also invests in funds and investment vehicles that Apollo manages. The Company refers to such assets which are invested directly as “Athene Assets Directly Invested.”
The Company broadly refers to “Athene Sub-Advised” assets under managementAUM as those assets in the Athene North American Accounts which the Company explicitly sub-advises as well as Athene Assets Directly Invested. The Company broadly refers to “AGER Sub-Advised” AUM as those assets in the Athene European Accounts which the Company explicitly sub-advises as well as those assets in the Athene European Accounts which are invested directly in funds and investment vehicles Apollo manages (“Athene Assets Directly Invested”).manages.
With respect to assets inlimited exceptions, the Athene Accounts whichsub-advisory fee arrangements between the Company explicitly sub-advises,and Athene and the Company earns up to 0.40% per annum on assets up to $10 billion and 0.35% per annum on all such assets in excess of $10 billion,fee arrangements with certain limited exceptions. These fees are in addition to the gross management fee of 0.40% per annum paid to Athene Asset Management. A majority of the assets in the Athene Accounts which the Company explicitly sub-advises are in accounts that invest in high-grade credit asset classes, such as CLO debt, commercial mortgage backed securities and insurance-linked securities.
With respect to Athene Assets Directly Invested Apollo receives management fees and carried interest, if applicable, directly fromare presented in the relevant funds under the investment management agreements and other governing documents of such funds. Fees paid to the Company related to such fund investments vary from 0% per annum to 1.75% per annum with respect to management fees and 0% to 20% with respect to carried interest. These fees are in addition to the gross management fee of 0.40% per annum paid to Athene Asset Management.following table:
The Company refers to the portion of the Athene Asset Management assets under management that is not Athene Sub-Advised as “Athene Non-Sub-Advised”. Athene Asset Management and other Apollo subsidiaries incur all expenses associated with their provision of services to Athene. |
| | |
| As of
September 30, 2017 |
Athene North American Accounts sub-advised by AAM(1): | |
| Assets up to $10.0 billion | 0.40 | % |
| Assets between $10.0 billion to $12.4 billion | 0.35 | % |
| Assets between $12.4 billion to $16.0 billion | 0.40 | % |
| Assets in excess of $16.0 billion | 0.35 | % |
| |
| Athene European Accounts sub-advised by AAME | 0.35 | % |
| |
Athene Assets Directly Invested(2) | 0% to 1.75% |
|
| |
| (1) | The sub-advisory fees with respect to the assets in the Athene North American Accounts are in addition to the fee earned by the Company described above. |
| |
| (2) | With respect to Athene Assets Directly Invested, Apollo earns carried interest of 0% to 20% in addition to the fees presented above. The fees set forth above with respect to the Athene Assets Directly Invested, and the carried interest that Apollo earns on such assets, are in addition to the fees described above, with certain limited exceptions. |
Apollo, as general partner of AAA Investments, is generally entitled to a carried interest that allocatesequal to it 20% of the realized returns (net of related expenses, including borrowing costs) on the investments of AAA Investments, except that Apollo is not entitled to receive any carried interest with respect to the shares of Athene Holding that were acquired (and not in satisfaction of prior commitments to buy such shares) by AAA Investments in the contribution of certain assets by AAA to Athene in October 2012. CarriedApollo may elect to receive payment of carried interest receivable from AAA Investments will be paidin cash or in common shares of Athene Holding (valued at the then fair market value); and if there is a distributionApollo elects to receive payment of such carried interest in kind ofcash, then common shares of Athene Holding (unlessshall be distributed to Apollo and immediately sold by Apollo to pay for such paymentcarried interest in shares would violate Section 16(b) ofcash. The following table presents the Exchange Act) or paid in cash if AAA sells the shares of Athene Holding. For the three and nine months ended September 30, 2016, the Company recorded carried interest income taking into account the related profit sharing expense, of $5.5 million and $16.5 million, respectively,earned from AAA Investments, which is recorded in the condensed consolidated statements of operations. For the three and nine months ended September 30, 2015, the Company recorded carried interest income less the related profit sharing expense of $24.8 million and $28.4 million, respectively, from AAA Investments, which is recorded in the condensed consolidated statements of operations. As of September 30, 2016 and December 31, 2015, the Company had a $210.9 million and $185.5 million carried interest receivable, respectively, related to AAA Investments. As of September 30, 2016 and December 31, 2015, the Company had a related profit sharing payable of $71.8 million and $62.8 million, respectively, recorded in profit sharing payable in the condensed consolidated statements of financial condition.Investments:
For the three and nine months ended September 30, 2016, Apollo earned revenues in the aggregate totaling $111.7 million and $322.6 million, respectively, consisting of management fees, sub-advisory and monitoring fees and carried interest income from Athene after considering the related profit sharing expense and changes in the market value of the Athene Holding |
| | | | | | | | | | | | | | | |
| | For the Three Months Ended September 30, | | For the Nine Months Ended September 30, |
| | 2017 | | 2016 | | 2017 | | 2016 |
| | (in millions) |
Carried interest income from AAA Investments, net(1) | $ | 14.5 |
| | $ | 5.5 |
| | $ | 27.0 |
| | $ | 16.5 |
|
APOLLO GLOBAL MANAGEMENT, LLC
NOTES TO CONDENSED CONSOLIDATED
FINANCIAL STATEMENTS
(dollars in thousands, except share data, except where noted)
| |
| (1) | Net of related profit sharing expense. |
shares owned directly by Apollo, which is recordedThe following table presents the revenues earned in the condensed consolidated statements of operations. For the threeaggregate from Athene and nine months ended September 30, 2015, Apollo earned revenues in the aggregate totaling $218.4 million and $425.0 million, respectively, consistingAGER:
|
| | | | | | | | | | | | | | | |
| | For the Three Months Ended September 30, | | For the Nine Months Ended September 30, |
| | 2017 | | 2016 | | 2017 | | 2016 |
| | (in millions) |
Revenues earned in aggregate from Athene and AGER, net(1) | $ | 181.0 |
| | $ | 111.7 |
| | $ | 434.2 |
| | $ | 322.6 |
|
| |
| (1) | Consisting of management fees, sub-advisory and monitoring fees, sub-advisory fees, carried interest income from Athene and AGER (net of related profit sharing expense) and changes in the market value of the Athene Holding shares owned directly by Apollo. These amounts exclude the deferred revenue recognized as management fees associated with the vesting of AHL Awards granted to employees of Apollo as further described in note 11. |
The following table presents carried interest income from Athene after considering the relatedreceivable and profit sharing expense and changes in the market value of the Athene Holding shares owned directly by Apollo, which is recorded in the condensed consolidated statements of operations. These amounts exclude the deferred revenue recognized as management fees associated with the vesting of AHL Awards granted to employees of Athene Asset Management as further described in note 11.payable from AAA Investments:
|
| | | | | | | |
| | As of
September 30, 2017 | | As of
December 31, 2016 |
| Carried interest receivable | $ | 187,106 |
| | $ | 229,829 |
|
| Profit sharing payable | 53,689 |
| | 80,579 |
|
The Company had an approximate 9.1%Company’s economic ownership interest in Athene Holding is comprised of the following:
|
| | | | | | |
| | As of
September 30, 2017 | (1) | As of
December 31, 2016 | (1) |
| Indirect interest in Athene Holding: | | | | |
| Interest in AAA | 2.2 | % | | 2.2 | % | |
| Plus: Interest in AAA Investments | 0.1 | % | | 0.1 | % | |
| Total Interest in AAA and AAA Investments | 2.3 | % | | 2.3 | % | |
| Multiplied by: AAA Investments’ interest in Athene Holding | 26.2 | % | | 39.4 | % | |
| Indirect interest in Athene Holding | 0.5 | % | | 0.9 | % | |
| | | | | |
| Plus: Direct interest in Athene Holding | 8.3 | % | | 8.0 | % | |
| Total interest in Athene Holding | 8.8 | % | | 8.9 | % | |
| |
| (1) | Ownership interest percentages are based on approximate share count as of the reporting date. |
AAA Investments Credit Agreement
On April 30, 2015, Apollo entered into a revolving credit agreement with AAA Investments (“AAA Investments Credit Agreement”). Under the terms of the AAA Investments Credit Agreement, the Company shall make available to AAA Investments one or more advances at the discretion of AAA Investments in the aggregate amount not to exceed a balance of $10.0 million at an applicable rate of LIBOR plus 1.5%. The Company receives an annual commitment fee of 0.125% on the unused portion of the loan. As of September 30, 2017 and December 31, 2016, which comprises Apollo’s direct 8.0% economic ownership interest in Athene Holding plus an additional 1.1% economic ownership interest, which is calculated as$4.0 million had been advanced by the sum ofCompany and remained outstanding on the Company’s approximate 2.2% economic ownership interest in AAA and the Company’s approximate 0.06% economic ownership interest in AAA Investments multiplied by AAA Investments’ approximate 46.3% economic ownership interest in Athene, calculated without giving effect to restricted common shares issued under Athene’s management equity plan as of September 30, 2016.Credit Agreement.
The Company had an approximate 9.2% economic ownership interest in Athene Holding as of December 31, 2015, which comprises Apollo’s direct ownership of 8.0% of the economic equity of Athene Holding plus an additional 1.2% economic ownership interest, which is calculated as the sum of the Company’s approximate 2.4% economic ownership interest in AAA and the Company’s approximate 0.06% economic ownership interest in AAA Investments, multiplied by AAA Investments’ approximate 46.3% economic ownership interest in Athene, calculated without giving effect to restricted common shares issued under Athene’s management equity plan as of December 31, 2015.
Regulated Entities
Apollo Global Securities, LLC (“AGS”) is a registered broker dealer with the SEC and is a member of the Financial Industry Regulatory Authority, subject to the minimum net capital requirements of the SEC. AGS was in compliance with these requirements at September 30, 2016.2017. From time to time, this entity is involved in transactions with related parties of Apollo, including portfolio companies of the funds Apollo manages, whereby AGS earns underwriting and transaction fees for its services.
Interests in Consolidated Entities
The table below presents equity interests in Apollo’s consolidated, but not wholly-owned, subsidiaries and funds. Net income and comprehensive income attributable to Non-Controlling Interests consisted of the following:
|
| | | | | | | | | | | | | | | |
| | For the Three Months Ended September 30, | | For the Nine Months Ended September 30, |
| | 2016 | | 2015 | | 2016 | | 2015 |
Interest in management companies and a co-investment vehicle(1) | $ | (260 | ) | | $ | (1,120 | ) | | $ | (4,804 | ) | | $ | (7,726 | ) |
| Other consolidated entities | 482 |
| | (1,596 | ) | | 913 |
| | (3,492 | ) |
| Net (income) loss attributable to Non-Controlling Interests in consolidated entities | 222 |
| | (2,716 | ) | | (3,891 | ) | | (11,218 | ) |
Net income attributable to Appropriated Partners’ Capital(2) | — |
| | 2,555 |
| | — |
| | — |
|
| Net income attributable to Non-Controlling Interests in the Apollo Operating Group | (140,321 | ) | | (55,347 | ) | | (336,186 | ) | | (186,507 | ) |
| Net Income attributable to Non-Controlling Interests | $ | (140,099 | ) | | $ | (55,508 | ) | | $ | (340,077 | ) | | $ | (197,725 | ) |
Net income attributable to Appropriated Partners’ Capital(3) | — |
| | (2,555 | ) | | — |
| | — |
|
| Other comprehensive (income) loss attributable to Non-Controlling Interests | (545 | ) | | (178 | ) | | (1,462 | ) | | 5,572 |
|
| Comprehensive Income Attributable to Non-Controlling Interests | $ | (140,644 | ) | | $ | (58,241 | ) | | $ | (341,539 | ) | | $ | (192,153 | ) |
| |
(1) | Reflects the remaining interest held by certain individuals who receive an allocation of income from certain of our credit funds. |
| |
(2) | Reflects net income of the consolidated CLOs classified as VIEs. |
| |
(3) | Appropriated Partners’ Capital is included in total Apollo Global Management, LLC shareholders’ equity and is therefore not a component of comprehensive income attributable to Non-Controlling Interests on the condensed consolidated statements of comprehensive income. |
APOLLO GLOBAL MANAGEMENT, LLC
NOTES TO CONDENSED CONSOLIDATED
FINANCIAL STATEMENTS
(dollars in thousands, except share data, except where noted)
13.Other Transactions
The Company recognized $6.2 million of other income in the condensed consolidated statement of operations from the assignment of a CLO collateral management agreement to a related party during the three months ended September 30, 2017.
14. COMMITMENTS AND CONTINGENCIES
Investment Commitments—As a limited partner, general partner and manager of the Apollo funds, Apollo had unfunded capital commitments as of September 30, 20162017 and December 31, 20152016 of $548.3 million$1.5 billion and $566.3 million,$0.6 billion, respectively.
Apollo has an ongoing obligation to acquire additional common units of AAA in an amount equal to 25% of the aggregate after-tax cash distributions, if any, that are made by AAA to the Company pursuant to the carried interest distribution rights that are applicable to investments made through AAA Investments. In addition, on April 30, 2015, Apollo entered into a revolving credit agreement with AAA Investments (“AAA Investments Credit Agreement”). Under the terms of the AAA Investments Credit Agreement, the Company shall make available to AAA Investments one or more advances at the discretion of AAA Investments in the aggregate amount not to exceed a balance of $10.0 million at an applicable rate of LIBOR plus 1.5%. The Company receives an annual commitment fee of 0.125% on the unused portion of the loan. As of September 30, 2016, no advance on the AAA Investments Credit Agreement had been made by the Company.
Debt Covenants—Apollo’s debt obligations contain various customary loan covenants. As of September 30, 2016,2017, the Company was not aware of any instances of non-compliance with the financial covenants contained in the documents governing the Company’s debt obligations.
Guarantees—Apollo entered into an agreement to guarantee 20% of a consolidated VIE’s outstanding secured borrowings of $90.5 million with a third party lending institution. The amount guaranteed by Apollo as of September 30, 2017 was $18.1 million.
Litigation and Contingencies—Apollo is, from time to time, party to various legal actions arising in the ordinary course of business including claims and lawsuits, reviews, investigations or proceedings by governmental and self regulatoryself-regulatory agencies regarding its business.
Various state attorneys general and federal and state agencies have initiated industry-wide investigations into the use of placement agents in connection with the solicitation of investments, particularly with respect to investments by public pension funds. Certain affiliates of Apollo have received subpoenas and other requests for information from various government regulatory agencies and investors in Apollo’s funds, seeking information regarding the use of placement agents. California Public Employees’ Retirement System (“CalPERS”), one of Apollo’s Strategic Investors, announced on October 14, 2009, that it had initiated a special review of placement agents and related issues. The report of the CalPERS’ Special Review was issued on March 14, 2011. That report does not allege any wrongdoing on the part of Apollo or its affiliates. Apollo is continuing to cooperate with all such investigations and other reviews. In addition, on May 6, 2010, the California Attorney General filed a civil complaint against Alfred Villalobos and his company, Arvco Capital Research, LLC (“Arvco”) (a placement agent that Apollo has used) and Federico Buenrostro Jr., the former CEO of CalPERS, alleging conduct in violation of certain California laws in connection with CalPERS’s purchase of securities in various funds managed by Apollo and another asset manager. Apollo is not a party to the civil lawsuit and the lawsuit does not allege any misconduct on the part of Apollo. Likewise, on April 23, 2012, the SEC filed a lawsuit alleging securities fraud on the part of Arvco, as well as Messrs. Buenrostro and Villalobos, in connection with their activities concerning certain CalPERS investments in funds managed by Apollo. This lawsuit also does not allege wrongdoing on the part of Apollo, and alleges that Apollo was defrauded by Arvco, Villalobos, and Buenrostro. On March 14, 2013, the United States Department of Justice unsealed an indictment against Messrs. Villalobos and Buenrostro alleging, among other crimes, fraud in connection with those same activities; again, Apollo is not accused of any wrongdoing and in fact is alleged to have been defrauded by the defendants. The criminal action was set for trial in a San Francisco federal court in July 2014, but was put on hold after Mr. Buenrostro pleaded guilty on July 11, 2014. As part of Mr. Buenrostro’s plea agreement, he admitted to taking cash and other bribes from Mr. Villalobos in exchange for several improprieties, including attempting to influence CalPERS’ investing decisions and improperly preparing disclosure letters to satisfy Apollo’s requirements. There is no suggestion that Apollo was aware that Mr. Buenrostro had signed the letters with a corrupt motive. The government has indicated that they will file new charges against Mr. Villalobos incorporating Mr. Buenrostro’s admissions. On August 7, 2014, the government filed a superseding indictment against Mr. Villalobos asserting additional charges. Trial had been scheduled for February 23, 2015, but Mr. Villalobos passed away on January 13, 2015. Additionally, on April 15, 2013, Mr. Villalobos, Arvco and related entities (the “Arvco Debtors”) brought a civil action in the United States Bankruptcy Court for the District of Nevada (the “Bankruptcy Court”) against Apollo. The action is related to the ongoing bankruptcy proceedings of the Arvco Debtors. This action alleges that Arvco served as a placement agent for Apollo in connection with several funds associated with Apollo, and seeks to recover purported fees the Arvco Debtors claim Apollo has not paid them for a portion of Arvco’s placement agent services. In addition, the Arvco Debtors allege that Apollo has interfered with the Arvco Debtors’ commercial relationships with third parties, purportedly causing the Arvco Debtors to lose business and to incur fees and expenses in the defense of various investigations and litigations. The Arvco Debtors also seek compensation from Apollo for these alleged lost profits and fees and expenses. The Arvco Debtors’ complaint asserts various theories of recovery under the Bankruptcy Code and common law. Apollo denies the merit of all of the Arvco Debtors’ claims and will vigorously contest them. The Bankruptcy Court had stayed this action pending the result in the criminal case against Mr. Villalobos but lifted the stay on May 1, 2015; in light of Mr. Villalobos’s death, the criminal case was dismissed. On August 25, 2016, Christina Lovato, in her capacity as the
APOLLO GLOBAL MANAGEMENT, LLC
NOTES TO CONDENSED CONSOLIDATED
FINANCIAL STATEMENTS
(dollars in thousands, except share data, except where noted)
2016, Christina Lovato, in her capacity as the Chapter 7 Trustee for the Arvco Debtors, filed an amended complaint. On March 20, 2017, the court granted Apollo’s motion to dismiss the equitable claims asserted in the amended complaint, leaving just two breach of contract claims remaining. On October 20, 2017, Apollo moved for summary judgment as to the trustee’s remaining claims and a counterclaim by Apollo that seeks indemnification for attorneys’ fees and expenses. No estimate of possible loss, if any, can be made at this time.
On June 18, 2014, BOKF N.A. (the “First Lien Trustee”), the successor indenture trustee under the indenture governing the First Lien Notes issued by Momentive Performance Materials, Inc. (“Momentive”), commenced a lawsuit in the Supreme Court for the State of New York, New York County against AGM and members of an ad hoc group of Second Lien Noteholders (including, but not limited to, Euro VI (BC) S.a.r.l.). The First Lien Trustee amended its complaint on July 2, 2014 (the “First Lien Intercreditor Action”). In the First Lien Intercreditor Action, the First Lien Trustee seeks, among other things, a declaration that the defendants violated an intercreditor agreement entered into between holders of the First Lien Notes and holders of the second lien notes. On July 16, 2014, the successor indenture trustee under the indenture governing the 1.5 Lien Notes (the “1.5 Lien Trustee,” and, together with the First Lien Trustee, the “Indenture Trustees”) filed an action in the Supreme Court of the State of New York, New York County that is substantially similar to the First Lien Intercreditor Action (the “1.5 Lien Intercreditor Action,” and, together with the First Lien Intercreditor Action, the “Intercreditor Actions”). AGM subsequently removed the Intercreditor Actions to federal district court, and the Intercreditor Actions were automatically referred to the Bankruptcy Court adjudicating the Momentive chapter 11 bankruptcy cases. The Indenture Trustees then filed motions with the Bankruptcy Court to remand the Intercreditor Actions back to the state court (the “Remand Motions”). On September 9, 2014, the Bankruptcy Court denied the Remand Motions. On August 15, 2014, the defendants in the Intercreditor Actions (including AGM) filed a motion to dismiss the 1.5 Lien Intercreditor Action and a motion for judgment on the pleadings in the First Lien Intercreditor Action (the “Dismissal Motions”). On September 30, 2014, the Bankruptcy Court granted the Dismissal Motions. In its order granting the Dismissal Motions, the Bankruptcy Court gave the Indenture Trustees until mid-November 2014 to move to amend some, but not all, of the claims alleged in their respective complaints. On November 14, 2014, the Indenture Trustees moved to amend their respective complaints pursuant to the Bankruptcy Court’s order (the “Motions to Amend”). On January 9, 2015, the defendants filed their oppositions to the Motions to Amend. On January 16, 2015, the Bankruptcy Court denied the Motions to Amend (the “Dismissal Order”), but gave the Indenture Trustees until March 2, 2015 to seek to amend their respective complaints. On March 2, 2015, the First Lien Trustee filed a motion seeking to amend its complaint. On April 10, 2015, the defendants, including AGM and Euro VI (BC) S.a.r.l., filed an opposition to the First Lien Trustee’s motion to amend. Instead of moving again to amend its complaint, the 1.5 Lien Trustee chose to appeal the Dismissal Order (the “1.5 Lien Appeal”). On March 30, 2015, the 1.5 Lien Trustee filed its Statement of Issues and Designation of Record on Appeal. On March 31, 2015, because the legal issues presented in the 1.5 Lien Appeal are substantially similar to those presented in the First Lien Intercreditor Action, the parties in the 1.5 Lien Appeal submitted a joint stipulation and proposed order to the District Court staying the briefing schedule on the 1.5 Lien Appeal pending the outcome of the First Lien Trustee’s most recent motion to amend. On April 13, 2015, the Defendants filed their Counter-Designation of the Record on Appeal in the 1.5 Lien Appeal. On May 8, 2015, the Bankruptcy Court denied the motion to amend filed on March 2, 2015 by the First Lien Trustee. On May 27, 2015, the First Lien Trustee filed a notice of appeal from the orders of the Bankruptcy Court dismissing the First Lien Intercreditor Action and denying the First Lien Trustee’s motions to amend (the “First Lien Appeal”). On June 2, 2015, the First Lien Trustee filed its Statement of Issues and Designation of Record on Appeal. On June 24, 2015, the defendants filed their Counter-Designation of the Record on Appeal in the First Lien Appeal. On July 31, 2015, the 1.5 Lien Trustee sent a letter to the federal district court hearing the 1.5 Lien Appeal asking the court to consolidate the 1.5 Lien Appeal with the First Lien Appeal which had been assigned to a different judge (the “Consolidation Request”). On April 8, 2016, the court granted the Consolidation Request. On May 20, 2016, the Indenture Trustees filed their opening appellate brief. The Appellees filed their response brief on July 14, 2016, and the Indenture Trustees filed their reply brief on August 5, 2016. TheOn October 2, 2017, the court has not yet setstayed the Intercreditor Actions pending a datedecision by the U.S. Court of Appeals for oral argument.the Second Circuit in an appeal concerning the Momentive chapter 11 bankruptcy cases. On October 20, 2017, the Second Circuit issued its ruling in the appeal concerning the Momentive chapter 11 bankruptcy cases, but no further proceedings have been held in the Intercreditor Actions. Apollo is unable at this time to assess a potential risk of loss. In addition, Apollo does not believe that AGM is a proper defendant in these actions.
There areAs at September 30, 2017, there still were several pending actions concerning transactions related to Caesars Entertainment Corporation (“Caesars Entertainment”), Caesars Entertainment Operating Company, Inc. (“CEOC”), and certain of itstheir respective subsidiaries. However, on October 6, 2017 all of the conditions precedent to the effectiveness of the Plan (as defined below in A.) were fulfilled and the Plan became effective. As a result, the cases referred to below in B., C., D., F., G. and H. have been dismissed with prejudice (the case referred to below in E. had previously been dismissed) and the release of claims running in favor of the Apollo Released Parties (as defined below in A.) have become effective. The descriptions of the cases set forth below are as at September 30, 2017 and are subject to this post-September 30, 2017 update.
| |
A. | In re: Caesars Entertainment Operating Company, Inc. bankruptcy proceedings, No. 15-10047 (Del. Bankr.) (the “Delaware Bankruptcy Action”) and No. 15-01145 (N.D. Ill. Bankr.) (the “Illinois Bankruptcy Action”). On January 12, 2015, three holders of CEOC second lien notes filed an involuntary bankruptcy petition against CEOC in the United States Bankruptcy Court for the District of Delaware (the “Involuntary Petition”). On January 15, 2015, CEOC and certain of its affiliates (collectively the “Debtors”) filed for Chapter 11 bankruptcy in the Northern District of Illinois. On February 2, 2015, the court in the Delaware Bankruptcy Action ordered that all bankruptcy proceedings relating to the Debtors should take place in the Illinois Bankruptcy Action. The Bankruptcy Court held an evidentiary hearing to determine whether the Debtors’ petition date was January 12, 2015 or January 15, 2015; this motion has not yet been ruled on by the Bankruptcy Court, pursuant to the Plan the Involuntary Petition will be dismissed as moot. Certain of the Debtors’ creditors have indicated in filings with the Bankruptcy Court that an investigation into certain acts and transactions that |
APOLLO GLOBAL MANAGEMENT, LLC
NOTES TO CONDENSED CONSOLIDATED
FINANCIAL STATEMENTS
(dollars in thousands, except share data, except where noted)
| |
| A. | In re: Caesars Entertainment Operating Company, Inc. bankruptcy proceedings, No. 15-01145 (N.D. Ill. Bankr.) (the “Illinois Bankruptcy Action”). On January 17, 2017, an order was entered in the Illinois Bankruptcy Action confirming a plan of reorganization for CEOC and its debtor subsidiaries (the “Plan”) which, inter alia, grants broad releases to Apollo and others. The Plan is likely to become effective in the third quarter of 2017 after the conditions to its effectiveness have been satisfied. On the effective date of the Plan (the “Plan Effective Date”), the Apollo Released Parties (as defined below) will be released from the claims in the WSFS Action, the UMB Action, the Trilogy Action, the Danner Action, the BOKF Action, the UMB SDNY Action, the Wilmington Trust Action and the CEOC Action (each as defined below). |
Background: On January 12, 2015, three holders of CEOC second lien notes filed an involuntary bankruptcy petition against CEOC in the United States Bankruptcy Court for the District of Delaware (the “Delaware Bankruptcy Action”). On January 15, 2015, CEOC and certain of its affiliates (collectively the “Debtors”) filed the Illinois Bankruptcy Action under Chapter 11 in the Northern District of Illinois. On February 2, 2015, the court in the Delaware Bankruptcy Action ordered that all bankruptcy proceedings relating to the Debtors should take place in the Illinois Bankruptcy Action. The Illinois Bankruptcy Court held an evidentiary hearing to determine whether the Debtors’ petition date was January 12, 2015 or January 15, 2015; this motion has not yet been ruled on by the Illinois Bankruptcy Court, and pursuant to the Plan this motion will be dismissed as moot. Certain of the Debtors’ creditors indicated in filings with the Illinois Bankruptcy Court that an investigation into certain acts and transactions that predated the Debtors’ bankruptcy filing could lead to claims against a number of parties, including Apollo. To date, noAGM and certain of its affiliates. No such claims have beenwere brought by the Debtors’ prepetition creditors against Apollo.Apollo in the Illinois Bankruptcy Action. On May 13, 2016, the Official Committee of Second Priority Noteholders (the “Second Lien Noteholders Committee”) filed a motion seeking an Order granting it standing to commence, prosecute and settle claims on behalf of the Debtors’ estates (the “Standing Motion”). The proposed complaint filed with the Standing Motion names Apollo and many others as defendants (see also “H” below). On or about September 27, 2016, Caesars Entertainment and the Debtors announced that they had received confirmations from representatives of the Debtors’ major creditor groups of those groups’ support for a term sheet that describes the key economic terms of a proposed consensual chapter 11 plan for the Debtors. On October 4, 2016, the Debtors filed the Third Amended Joint Plan of Reorganization (the “Plan”).which subsequently was amended and became the Plan. As part of the Plan, and in connection with the merger between Caesars Entertainment and Caesars Acquisition Company (“CAC”), funds managed by Apollo will not retain any of their equity interests in the merged Caesars Entertainment on account of their pre-merger Caesars Entertainment shares. Such equity interests would, instead, be for the benefit of CEOC’s creditors. Funds managed by Apollo will, however, retain their equity interests in the merged Caesars Entertainment on account of their CAC shares. The voting deadline on the Plan iswas November 21, 2016, and approximately 90% in dollar amount of the hearing on whether to confirmDebtors’ creditors voted in favor of the Plan is scheduled to begin on January 17, 2017.Plan. On October 17, 2016, the Bankruptcy Court granted the Debtors’ requested injunction of the WSFS, Trilogy, Danner, UMB, Wilmington Trust and BOKF Actions (defined below “B”, “C”, “D”, “F” and “G”) (the “105 Injunction”) through Plan confirmation. Caesars Entertainment and the Debtors are hopeful that there will befirst omnibus hearing after Plan confirmation, and effectiveness ofby order dated January 26, 2017 the 105 Injunction was extended to, inter alia, the Plan in 2017. IfEffective Date. At the confirmation hearing, no creditor presented any objection to the Plan. As noted above, the Plan iswas confirmed by the Illinois Bankruptcy Court and becomeswill become effective it would provideafter the conditions to its effectiveness have been satisfied. The Plan provides several parties, including, AGM and certain associated entities and individualsof its affiliates (collectively referred to as the "Apollo Released Parties") with a release of claims that the Debtors and the Debtors’ creditors have or may have against any or all of the Apollo Released Parties, including those described below in the WSFS Action, the Trilogy Action, the Danner Action, the UMB Action, the BOKF Action, the Wilmington Trust Action and the CEOC Action.
| |
| B. | Wilmington Savings Fund Society, FSB v. Caesars Entertainment Corp. et al., No. 10004-CVG (Del. Ch.) (the “WSFS Action”). On August 4, 2014, Wilmington Savings Fund Society, FSB (“WSFS”), as trustee for certain CEOC second-lien notes, sued Caesars Entertainment, CEOC, other Caesars Entertainment-affiliated entities, and certain of Caesars Entertainment’s directors, including Marc Rowan, Eric Press, David Sambur (each an Apollo Partner) and JeffJeffrey Benjamin (a consultant to Apollo), in Delaware’s Court of Chancery (the “Delaware Court”). WSFS (i) asserts claims (against some or all of the defendants) for fraudulent conveyance, breach of fiduciary duty, breach of contract, corporate waste, and aiding and abetting related to certain transactions among CEOC and othercertain of its subsidiaries and Caesars Entertainment and certain of its affiliates, and (ii) requests (among other things) that the courtDelaware Court unwind the challenged transactions and award damages. WSFS served a subpoena for documents on Apollo on September 11, 2014, but Apollo’s response was stayed during the pendency of motions to dismiss under a September 23, 2014 stipulated order. On March 18, 2015, the Delaware Court denied Defendants’ motion to dismiss. Apollo served responses and objections to WSFS’ subpoena on March 25, 2015. Caesars Entertainment answered the complaint on April 1, 2015. During the pendency of CEOC’s bankruptcy proceedings, the WSFS Action has been automatically stayed with respect to CEOC. WSFS additionally advised the Bankruptcy Court that, during CEOC’s bankruptcy proceedings, WSFS would only pursue claims in the WSFS Action relating to whether Caesars Entertainment remains liable on a guarantee of certain of CEOC’s second priority notes. On July 17, 2015, WSFS served supplemental subpoenas to several entities affiliated with Apollo. Apollo has substantially completed its production of non-privileged documents responsive to those subpoenas. On March 11, 2016, WSFS filed a motion for partial summary judgment (the “Summary Judgment Motion”) on its breach of contract claim against Caesars Entertainment. On April 25, 2016, Caesars Entertainment filed a joint Cross-Motion for Partial Summary Judgment and answering brief in opposition to WSFS’ Summary Judgment Motion (the “Cross-Motion”). WSFS filed its joint reply and opposition to Caesars Entertainment’s Cross-Motion on May 25, 2016, and Caesars Entertainment filed a reply to WSFS’ opposition on June 9, 2016. On June 15, 2016, the Bankruptcy Court issued a temporary restraining order and preliminary injunction pursuant to Section 105(a) of the Bankruptcy Code enjoining the plaintiffs in the WSFS Action from prosecuting actions against Caesars Entertainment until August 29, 2016. On October 17, 2016, after several motions and appeals relating to extending the stay past August 29, 2016, the Bankruptcy Court granted the Debtors’ renewed injunction request, staying the WSFS Action through Plan confirmation. Pursuant to the Plan, the Apollo Released Parties will be released from all claims relating to the WSFS Action. |
APOLLO GLOBAL MANAGEMENT, LLC
NOTES TO CONDENSED CONSOLIDATED
FINANCIAL STATEMENTS
(dollars in thousands, except share data, except where noted)
subpoena on March 25, 2015. Caesars Entertainment answered the complaint on April 1, 2015. During the pendency of CEOC’s bankruptcy proceedings, the WSFS Action has been automatically stayed with respect to CEOC. WSFS additionally advised the Illinois Bankruptcy Court that, during CEOC’s bankruptcy proceedings, WSFS would only pursue claims in the WSFS Action relating to whether Caesars Entertainment remains liable on a guarantee of certain of CEOC’s second priority notes. On July 17, 2015, WSFS served supplemental subpoenas to several entities affiliated with AGM, and AGM and these entities have substantially completed their production of non-privileged documents responsive to those subpoenas. On March 11, 2016, WSFS filed a motion for partial summary judgment (the “Summary Judgment Motion”) on its breach of contract claim against Caesars Entertainment. On April 25, 2016, Caesars Entertainment filed a joint Cross-Motion for Partial Summary Judgment and answering brief in opposition to WSFS’ Summary Judgment Motion (the “Cross-Motion”). WSFS filed its joint reply and opposition to Caesars Entertainment’s Cross-Motion on May 25, 2016, and Caesars Entertainment filed a reply to WSFS’ opposition on June 9, 2016. On June 15, 2016, the Illinois Bankruptcy Court issued a temporary restraining order and preliminary injunction pursuant to Section 105(a) of the Bankruptcy Code enjoining the plaintiffs in the WSFS Action from prosecuting actions against Caesars Entertainment until August 29, 2016. On October 17, 2016, the Illinois Bankruptcy Court granted the 105 Injunction staying the WSFS Action initially through the first omnibus hearing after Plan confirmation, and now through, inter alia, the Plan Effective Date. Pursuant to the Plan, the Apollo Released Parties will be released from all claims relating to the WSFS Action. As aforementioned, the Plan was confirmed by an order dated January 17, 2017.
| |
| C. | Trilogy Portfolio Company, L.L.C., et al. v. Caesars Entertainment Corp., et al., No. 14-cv-7091 (S.D.N.Y.) (the “Trilogy Action”). On September 3, 2014, institutional investors allegedly holding approximately $137 million in CEOC unsecured senior notes sued CEOC and Caesars Entertainment in federal court in New York (the “New York Court”) for breach of contract and the implied covenant of good faith, Trust Indenture Act (“TIA”) violations, and a declaratory judgment challenging the August 2014 private financing transaction in which a portion of outstanding senior unsecured notes were purchased by Caesars Entertainment, and a majority of the noteholders agreed to amend the indenture to terminate Caesars Entertainment’s guarantee of the notes and modify certain restrictions on CEOC’s ability to sell assets. Caesars Entertainment and CEOC filed a motion to dismiss on November 12, 2014. On January 15, 2015, the New York Court granted the motion with respect to a TIA claim by Trilogy but otherwise denied the motion. On January 30, 2015, plaintiffs filed an amended complaint seeking relief against Caesars Entertainment only, and Caesars Entertainment answered on February 12, 2015. On October 2, 2014, a related putative class action complaint was filed on behalf of the holders of these notes captioned Danner v. Caesars Entertainment Corp., et al., No. 14-cv-7973 (S.D.N.Y.) (the “Danner Action”), against Caesars Entertainment alleging claims similar to those in the Trilogy Action. On February 19, 2015, plaintiffs filed an amended complaint, and Caesars Entertainment answered the amended complaint on February 25, 2015. In March 2015, each of Trilogy and Danner served subpoenas for documents on Apollo. Apollo produced responsive, non-privileged documents in response to those subpoenas. In July 2015, Trilogy and Danner served subpoenas for depositions on Apollo and those depositions were completed on September 22, 2015. On October 23, 2015, Trilogy and Danner filed motions for partial summary judgment, related to TIA and breach of contract claims. On December 29, 2015, the New York Court denied the motions for partial summary judgment. On March 23, 2016, the judge presiding over the Trilogy and Danner Actions announced that she was retiring from the bench effective April 28, 2016. A new judge was assigned to preside over the Trilogy and Danner Actions (in addition to the BOKF, UMB SDNY and Wilmington Trust Actions, defined below). On April 6, 2016, the parties agreed to a renewed summary judgment schedule for the Trilogy, Danner, BOKF, UMB SDNY (as defined below) and Wilmington Trust Actions. The moving parties submitted their briefs to the New York Court on May 10, 2016. Opposition briefs were filed on May 31, 2016. Reply briefs were filed on June 14, 2016. On June 15, 2016, the Illinois Bankruptcy Court issued a temporary restraining order and preliminary injunction pursuant to Section 105(a) of the Bankruptcy Code, enjoining the plaintiffs in the Trilogy and Danner Actions from prosecuting actions against Caesars Entertainment until August 29, 2016. On October 17, 2016, the Illinois Bankruptcy Court granted the 105 Injunction, staying the Trilogy and Danner Actions initially through the first omnibus hearing after Plan confirmation and now by order dated January 26, 2017 through, inter alia, the Plan Effective Date. Pursuant to the Plan, the Apollo Released Parties will be released from all claims relating to the Trilogy and Danner Actions. As aforementioned, the Plan was confirmed by an order dated January 17, 2017. |
APOLLO GLOBAL MANAGEMENT, LLC
NOTES TO CONDENSED CONSOLIDATED
FINANCIAL STATEMENTS
(dollars in thousands, except share data, except where noted)
in which a portion of outstanding senior unsecured notes were purchased by Caesars Entertainment, and a majority of the noteholders agreed to amend the indenture to terminate Caesars Entertainment’s guarantee of the notes and modify certain restrictions on CEOC’s ability to sell assets. Caesars Entertainment and CEOC filed a motion to dismiss on November 12, 2014. On January 15, 2015, the New York Court granted the motion with respect to a TIA claim by Trilogy but otherwise denied the motion. On January 30, 2015, plaintiffs filed an amended complaint seeking relief against Caesars Entertainment only, and Caesars Entertainment answered on February 12, 2015. On October 2, 2014, a related putative class action complaint was filed on behalf of the holders of these notes captioned Danner v. Caesars Entertainment Corp., et al., No. 14-cv-7973 (S.D.N.Y.) (the “Danner Action”), against Caesars Entertainment alleging claims similar to those in the Trilogy Action. On February 19, 2015, plaintiffs filed an amended complaint, and Caesars Entertainment answered the amended complaint on February 25, 2015. In March 2015, each of Trilogy and Danner served subpoenas for documents on Apollo. Apollo produced responsive, non-privileged documents in response to those subpoenas. In July 2015, Trilogy and Danner served subpoenas for depositions on Apollo and those depositions were completed on September 22, 2015. On October 23, 2015, Trilogy and Danner filed motions for partial summary judgment, related to TIA and breach of contract claims. On December 29, 2015, the New York Court denied the motions for partial summary judgment. On March 23, 2016, the judge presiding over the Trilogy and Danner Actions announced that she was retiring from the bench effective April 28, 2016. A new judge was assigned to preside over the Trilogy and Danner Actions (in addition to the BOKF, UMB SDNY, and Wilmington Trust Actions, defined below). On April 6, 2016, the parties agreed to a renewed summary judgment schedule for the Trilogy, Danner, BOKF, UMB SDNY (as defined below) and Wilmington Trust Actions. The moving parties submitted their briefs to the New York Court on May 10, 2016. Opposition briefs were filed on May 31, 2016. Reply briefs were filed on June 14, 2016. On June 15, 2016, the Bankruptcy Court issued a temporary restraining order and preliminary injunction pursuant to Section 105(a) of the Bankruptcy Code, enjoining the plaintiffs in the Trilogy and Danner Actions from prosecuting actions against Caesars Entertainment until August 29, 2016. On October 17, 2016, after several motions and appeals relating to extending the stay past August 29, 2016, the Bankruptcy Court granted the Debtors’ renewed injunction request, staying the Trilogy and Danner Actions through Plan confirmation. Pursuant to the Plan, the Apollo Released Parties will be released from all claims relating to the Trilogy and Danner Actions.
| |
| D. | UMB Bank v. Caesars Entertainment Corporation, et al., No. 10393 (Del. Ch.) (the “UMB Action”). On November 25, 2014, UMB Bank, as trustee for certain CEOC notes, sued Caesars Entertainment, CEOC, other Caesars Entertainment-affiliated entities and certain of Caesars Entertainment’s directors, including Marc Rowan, Eric Press, David Sambur (each an Apollo Partner) and Jeffrey Benjamin (an Apollo consultant), in the Delaware Court. The UMB Action alleges claims for actual and constructive fraudulent conveyance and transfer, insider preferences, illegal dividends, breach of contract, intentional interference with contractual relations, breach of fiduciary duty, aiding and abetting breach of fiduciary duty, usurpation of corporate opportunities, and unjust enrichment. The UMB Action seeks appointment of a receiver for CEOC, a constructive trust, and other relief. The UMB Action has been assigned to the same judge overseeing the WSFS Action. The UMB Action has effectively been stayed since April 7, 2016, and on October 17, 2016, the Bankruptcy Court stayed the UMB Action through Plan confirmation. Pursuant to the Plan, the Apollo Released Parties will be released from all claims relating to the UMB Action. |
APOLLO GLOBAL MANAGEMENT, LLC
NOTES TO CONDENSED CONSOLIDATED
FINANCIAL STATEMENTS
(dollars in thousands, except share data, except where noted)
duty, usurpation of corporate opportunities, and unjust enrichment. The UMB Action seeks appointment of a receiver for CEOC, a constructive trust and other relief. The UMB Action has been assigned to the same judge overseeing the WSFS Action. The UMB Action has effectively been stayed since April 7, 2016, and on October 17, 2016, the Illinois Bankruptcy Court granted the 105 Injunction staying the UMB Action initially through the first omnibus hearing after Plan confirmation and now by order dated January 26, 2017 through, inter alia, the Plan Effective Date. Pursuant to the Plan, the Apollo Released Parties will be released from all claims relating to the UMB Action. As aforementioned, the Plan was confirmed by an order dated January 17, 2017.
| |
| E. | Koskie v. Caesars Acquisition Company, et al., No. A-14-711712-C (Clark Cnty Nev. Dist. Ct.) (the “Koskie Action”). On December 30, 2014, Nicholas Koskie brought a shareholder class action on behalf of shareholders of Caesars Acquisition Company (“CAC”) against CAC, Caesars Entertainment, and members of CAC’s Board of Directors, including Marc Rowan and David Sambur (each an Apollo partner). The lawsuit challenges CACCAC’s and Caesars Entertainment’s plan to merge, alleging that the proposed transaction will not give CAC shareholders fair value. Koskie asserts claims for breach of fiduciary duty relating to the director defendants’ interrelationships with the entities involved the proposed transaction. The deadline for CAC to respond to this lawsuitcase has been adjourned indefinitely by agreement ofdismissed for failure to prosecute, and the parties.time granted to the plaintiff to refile has passed without there being any refiling. |
| |
| F. | BOKF, N.A. v. Caesars Entertainment Corporation, No. 15-156 (S.D.N.Y) (the “BOKF Action”). On March 3, 2015, BOKF, N.A., as trustee for certain CEOC notes, sued Caesars Entertainment in the New York Court. The lawsuit alleges claims for breach of contract, intentional interference with contractual relations and a declaratory judgment, and seeks to enforce Caesars Entertainment’s guarantee of certain CEOC notes. The BOKF Action has been assigned to the same judge in the New York Court as the Trilogy and Danner Actions. On March 25, 2015, Caesars Entertainment filed an answer to the complaint. On May 19, 2015, BOKF sent the courtNew York Court a letter requesting permission to file a partial summary judgment motion on Counts II and V of its complaint, related to the validity and enforceability of Caesars Entertainment’s guarantee of certain notes issued by CEOC and alleged violations of the Trust Indenture Act, 15 U.S.C. §§ 76aaa, et seq. The Trilogy and Danner plaintiffs did not join BOKF’s request to file for partial summary judgment. On May 28, 2015, the New York Court granted BOKF permission to move for partial summary judgment. On June 15, 2015, another related complaint captioned UMB Bank, N.A. v. Caesars Entertainment Corp., et al., No. 15-cv-4634 (S.D.N.Y.) (the “UMB SDNY Action”) was filed by UMB Bank, N.A., solely in its capacity as Indenture Trustee of certain first lien notes (“UMB”), against Caesars Entertainment alleging claims similar to those alleged in the BOKF, Trilogy and Danner Actions. On June 16, 2015, UMB sent a letter to the New York Court requesting permission to file a partial summary judgment motion on the same schedule with BOKF. On June 26, 2015, BOKF and UMB filed partial summary judgment motions (the “Partial Summary Judgment Motions”). On July 24, 2015, Caesars Entertainment filed its opposition to the Partial Summary Judgment Motions, and on August 7, 2015, BOKF and UMB filed reply briefs in further support of the Partial Summary Judgment Motions. On August 27, 2015, the New York Court denied the Partial Summary Judgment Motions and certified its opinion for an interlocutory appeal to the United States Court of Appeals for the Second Circuit. On December 22, 2015, the Second Circuit declined to hear the interlocutory appeal. Separately, on November 20, 2015, BOKF and UMB filed a second set of motions for partial summary judgment, on the issue of the disputed contract interpretation related to indenture release provisions. On January 5, 2016 the New York Court denied these motions. At a hearing on February 22, 2016, the New York Court bifurcated the trial in the BOKF and UMB SDNY Actions and scheduled the trial on the breach of contract and TIA claims to begin on March 14, 2016. The New York Court ordered a separate trial on the claims for breach of the covenant of good faith and fair dealing and tortious interference with contract to begin at a later date to be determined. On February 26, 2016, the Illinois Bankruptcy Court granted the stay request as to the BOKF Action until May 9, 2016, resulting in a stay of the trial on the breach of contract and TIA claims in the BOKF and UMB SDNY Actions. On February 24, 2016, Caesars Entertainment filed a motion for partial summary judgment to dispose of the claims for (1) breach of the implied covenant of good faith and fair dealing brought by BOKF and UMB, and (2) intentional interference with contractual relations brought by BOKF. The moving parties submitted their briefs on May 10, 2016. Opposition briefs were filed on May 31, 2016. Reply briefs were filed on June 14, 2016. On June 15, 2016, the Illinois Bankruptcy Court issued a temporary restraining order and preliminary injunction pursuant to Section 105(a) of the Bankruptcy Code, enjoining the plaintiffs in the BOKF Action from prosecuting actions against Caesars Entertainment until August 29, 2016. On October 17, 2016, after several motions and appeals relating to extending the stay past August 29, 2016, the Illinois Bankruptcy Court granted the 105 Injunction staying the BOKF Action initially through the first omnibus hearing after Plan confirmation and now by order dated January 26, 2017 through, inter alia, the Plan Effective Date. Pursuant to the Plan, the Apollo Released Parties will be released from all claims relating to the BOKF Action. As aforementioned, the Plan was confirmed by an order dated January 17, 2017. |
APOLLO GLOBAL MANAGEMENT, LLC
NOTES TO CONDENSED CONSOLIDATED
FINANCIAL STATEMENTS
(dollars in thousands, except share data, except where noted)
The Trilogy and Danner plaintiffs did not join BOKF’s request to file for partial summary judgment. On May 28, 2015, the court granted BOKF permission to move for partial summary judgment. On June 15, 2015, another related complaint captioned UMB Bank, N.A. v. Caesars Entertainment Corp., et al., No. 15-cv-4634 (S.D.N.Y.) (the “UMB SDNY Action”) was filed by UMB Bank, N.A., solely in its capacity as Indenture Trustee of certain first lien notes (“UMB”), against Caesars Entertainment alleging claims similar to those alleged in the BOKF, Trilogy and Danner Actions. On June 16, 2015, UMB sent a letter to the court requesting permission to file a partial summary judgment motion on the same schedule with BOKF. On June 26, 2015, BOKF and UMB filed partial summary judgment motions (the “Partial Summary Judgment Motions”). On July 24, 2015, Caesars Entertainment filed its opposition to the Partial Summary Judgment Motions, and on August 7, 2015, BOKF and UMB filed reply briefs in further support of the Partial Summary Judgment Motions. On August 27, 2015, the Court denied the Partial Summary Judgment Motions and certified its opinion for an interlocutory appeal to the United States Court of Appeals for the Second Circuit. On December 22, 2015, the Second Circuit declined to hear the interlocutory appeal. Separately, on November 20, 2015, BOKF and UMB filed a second set of motions for partial summary judgment, on the issue of the disputed contract interpretation related to indenture release provisions. On January 5, 2016 the District Court denied these motions. At a hearing on February 22, 2016, the Court bifurcated the trial in the BOKF and UMB SDNY Actions and scheduled the trial on the breach of contract and TIA claims to begin on March 14, 2016. The Court ordered a separate trial on the claims for breach of the covenant of good faith and fair dealing and tortious interference with contract to begin at a later date to be determined. On February 26, 2016, the Bankruptcy Court granted the stay request as to the BOKF Action until May 9, 2016, resulting in a stay of the trial on the breach of contract and TIA claims in the BOKF and UMB SDNY Actions. On February 24, 2016, Caesars Entertainment filed a motion for partial summary judgment to dispose of the claims for (1) breach of the implied covenant of good faith and fair dealing brought by BOKF and UMB, and (2) intentional interference with contractual relations brought by BOKF. The moving parties submitted their briefs on May 10, 2016. Opposition briefs were filed on May 31, 2016. Reply briefs were filed on June 14, 2016. On June 15, 2016, the Bankruptcy Court issued a temporary restraining order and preliminary injunction pursuant to Section 105(a) of the Bankruptcy Code, enjoining the plaintiffs in the BOKF Action from prosecuting actions against Caesars Entertainment until August 29, 2016. On October 17, 2016, after several motions and appeals relating to extending the stay past August 29, 2016, the Bankruptcy Court granted the Debtors’ renewed injunction request, staying the BOKF Action through Plan confirmation. Pursuant to the Plan, the Apollo Released Parties will be released from all claims relating to the BOKF Action.
| |
| G. | Wilmington Trust, National Association v. Caesars Entertainment Corporation, No. 15-cv-08280 (S.D.N.Y.) (the “Wilmington Trust Action”). On October 20, 2015, Wilmington Trust, N.A., solely in its capacity as Indenture Trustee for the 10.75% Notes due 2016 (“Wilmington Trust”), sued Caesars Entertainment in the New York Court alleging claims similar to those alleged in the BOKF, UMB, Trilogy, and Danner Actions. The parties cross-moved for partial summary judgment on the same schedule as the Trilogy Action. Caesars Entertainment arguesargued that its actions did not violate the TIA and that its guarantee of the 10.75% Notes was automatically released under a certain clause contained in the indenture governing the 10.75% Notes. Wilmington Trust has argued that Caesars Entertainment’s actions constituted an improper out-of-court reorganization under the TIA and that Caesars Entertainment’s guarantee was not released because the necessary conditions precedent did not occur. Although the temporary restraining order and preliminary injunction issued by the Illinois Bankruptcy Court did not apply to the Wilmington Trust Action, on July 6, 2016, Wilmington Trust and Caesars Entertainment filed a stipulation staying the Wilmington Trust Action until August 29, 2016. The New York Court scheduled oral argument for August 30, 2016. A motion was made by CEOC and the other Debtors to the Illinois Bankruptcy Court to extend the stay beyond August 29, 2016, which motion was denied. On October 17, 2016, after several motions and appeals relating to extending the stay past August 29, 2016, theIllinois Bankruptcy Court granted the Debtors’ renewed injunction request,105 Injunction staying the Wilmington Trust Action initially through the first omnibus hearing after Plan confirmation.confirmation and now by order dated January 26, 2017 through, inter alia, the Plan Effective Date. Pursuant to the Plan, the Apollo Released Parties will be released from all claims relating to the Wilmington Trust Action. As aforementioned, the Plan was confirmed by an order dated January 17, 2017. |
| |
| H. | CEOC v. Caesars Entertainment et al., Illinois Bankruptcy Court (the “CEOC Action”). On or about August 9, 2016, CEOC and certain of the other Debtors commenced a “placeholder” lawsuit against Caesars Entertainment, Apollo Global Management, LLC,AGM, Caesars Entertainment directors (including Messrs. Rowan, Sambur, Press and Benjamin) and certain of its officers, and many others to, inter alia, prevent the statute of limitations from running respecting any claimsclaim owned by a Debtor’s estate. This lawsuit basically asserts the claims identified in the Examiner’s Report and has been stayed by an order of the Bankruptcy Court. Pursuant to the Plan, the Apollo Released Parties will be released from all claims relating to the CEOC Actions.Action. As aforementioned, the Plan was confirmed by an order dated January 17, 2017. |
APOLLO GLOBAL MANAGEMENT, LLC
NOTES TO CONDENSED CONSOLIDATED
FINANCIAL STATEMENTS
(dollars in thousands, except share data, except where noted)
Apollo believes that the claims in the WSFS Action, the UMB Action, the Trilogy Action, the Danner Action, the Koskie Action, the BOKF Action, the UMB SDNY Action, the Wilmington Trust Action and the CEOC Action are without merit. For this reason, and because of pending bankruptcy proceedings involving CEOC and certain of its subsidiaries,the confirmed Plan has not become effective yet, no reasonable estimate of possible loss, if any, can be made at this time.
The Bankruptcy Court administering the CEOC bankruptcy proceedings appointed an examiner (the “Examiner”) to report on certain transactions engaged in by CEOC and certain of its subsidiaries. The Examiner issued his report on March 16, 2016. The Examiner’s report states that potential claims may exist against “Apollo” and persons affiliated with it relating to certain transactions that occurred in the years preceding CEOC’s bankruptcy filing, principally relating to Bankruptcy Code fraudulent conveyance claims as well as aiding and abetting claims. Apollo and persons affiliated with it deny any wrongdoing and deny any liability in connection with such transactions, and if any new claim is asserted against any of them, such claim will be vigorously contested.
Following the January 16, 2014 announcement that CEC Entertainment, Inc. (“CEC”) had entered into a merger agreement with certain entities affiliated with Apollo (the “Merger Agreement”), four putative shareholder class actions were filed in the District Court of Shawnee County, Kansas on behalf of purported stockholders of CEC against, among others, CEC, its directors and Apollo and certain of its affiliates, which include Queso Holdings Inc., Q Merger Sub Inc., Apollo Management VIII, L.P., and AP VIII Queso Holdings, L.P. The first purported class action, which is captioned Hilary Coyne v. Richard M. Frank et al., Case No. 14C57, was filed on January 21, 2014 (the “Coyne Action”). The second purported class action, which was captioned John Solak v. CEC Entertainment, Inc. et al., Civil Action No. 14C55, was filed on January 22, 2014 (the “Solak Action”). The Solak Action was dismissed for lack of prosecution on October 14, 2014. The third purported class action, which is captioned Irene Dixon v. CEC Entertainment, Inc. et al., Case No. 14C81, was filed on January 24, 2014 and additionally names as defendants Apollo Management VIII, L.P. and AP VIII Queso Holdings, L.P. (the “Dixon Action”). The fourth purported class action, which is captioned Louisiana Municipal Public Employees’ Retirement System v. Frank, et al., Case No. 14C97, was filed on January 31, 2014 (the “LMPERS Action”) (together with the Coyne and Dixon Actions, the “Shareholder Actions”). A fifth purported class action, which was captioned McCullough v. Frank, et al., Case No. CC-14-00622-B, was filed in the County Court of Dallas County, Texas on February 7, 2014. This action was dismissed for want of prosecution on May 21, 2014. Each of the Shareholder Actions alleges, among other things, that CEC’s directors breached their fiduciary duties to CEC’s stockholders in connection with their consideration and approval of the Merger Agreement, including by agreeing to an inadequate price, agreeing to impermissible deal protection devices, and filing materially deficient disclosures regarding the transaction. Each of the Shareholder Actions
APOLLO GLOBAL MANAGEMENT, LLC
NOTES TO CONDENSED CONSOLIDATED
FINANCIAL STATEMENTS
(dollars in thousands, except share data, except where noted)
further alleges that Apollo and certain of its affiliates aided and abetted those alleged breaches. As filed, the Shareholder Actions seek, among other things, rescission of the various transactions associated with the merger, damages and attorneys’ and experts’ fees and costs. On February 7, 2014 and February 11, 2014, the plaintiffs in the Shareholder Actions pursued a consolidated action for damages after the transaction closed. Thereafter, the Shareholder Actions were consolidated under the caption In re CEC Entertainment, Inc. Stockholder Litigation, Case No. 14C57, and the parties engaged in limited discovery. On July 21, 2015, a consolidated class action complaint was brought by Twin City Pipe Trades Pension Trust in the Shareholder Actions that did not name as defendants Apollo, Queso Holdings Inc., Q Merger Sub Inc., Apollo Management VIII, L.P., or AP VIII Queso Holdings, L.P., continued to assert claims against CEC and its former directors, and added The Goldman Sachs Group Inc. (“Goldman Sachs”) as a defendant. The consolidated complaint alleges, among other things, that CEC’s former directors breached their fiduciary duties to CEC’s stockholders by conducting a deficient sales process, agreeing to impermissible deal protection devices, and filing materially deficient disclosures regarding the transaction. It further alleges that two members of the board who also served as the senior managers of CEC had material conflicts of interest and that Goldman Sachs aided and abetted the board’s breaches as a result of various conflicts of interest facing the bank. The consolidated complaint seeks, among other things, to recover damages, attorneys’ fees and costs. On October 22, 2015, the parties to the consolidated action moved to dismiss the complaint. On March 1, 2017, the special master appointed by the Kansas court to oversee pre-trial proceedings recommended that the Kansas court grant defendants’ motions to dismiss the complaint. On March 30, 2017, plaintiff moved for leave to amend the consolidated complaint. The proposed amended consolidated complaint does not name as defendants CEC or its former directors, and purports to substitute Goldman, Sachs & Co. in place of the Goldman Sachs Group Inc. on the claim for aiding and abetting breach of fiduciary duty. On June 1, 2017, the Court granted the parties’ joint motion to dismiss all claims against CEC and the former directors, and dismissed the former CEC directors from the action. Although Apollo cannot predict the ultimate outcome of the consolidated action, and therefore no reasonable estimate of possible loss, if any, can be made at this time, Apollo believes that such action is without merit.
On June 12, 2015, a putative class action was commenced in the United States District Court for the Northern District of California (“California Court”) by Rachel Silva (“Silva”) and Don Hudson (“Hudson”), on behalf of themselves and all others similarly situated, against Aviva plc; Athene Annuity and Life Company f/k/a Aviva Life and Annuity Company (“Aviva”); Athene USA Corporation f/k/a Aviva USA Corporation; Athene Holding; Athene Life Re Ltd.; Athene Asset Management; and AGM. The original complaint in this action alleged violations of the Racketeer Influenced and Corrupt Organizations Act, 18 U.S.C. Sections 1962(c) and (d). The plaintiffs alleged that commencing in 2007 and continuing thereafter, Aviva and its then management engaged in a scheme to, among other things, falsely represent the financial strength of and hide the true financial condition of Aviva by, among other things, allegedly ceding risky liabilities to Aviva’s undercapitalized subsidiaries and affiliates, misvaluing assets, and failing to make required disclosures to purchasers of policies, and that after Athene Holding purchased all of the outstanding stock
APOLLO GLOBAL MANAGEMENT, LLC
NOTES TO CONDENSED CONSOLIDATED
FINANCIAL STATEMENTS
(dollars in thousands, except share data, except where noted)
of Aviva’s parent effective October 2, 2013 the scheme was “unwound and rewound” so as to continue, and that as a result thereof some of the purchasers of annuity products issued by Aviva were charged an excessive price and were damaged as a result thereof. All defendants (except Aviva plc) (a) moved to transfer this action to the United States District Court for the Southern District of Iowa (“Iowa Court”) and (b) moved to dismiss this action. Aviva plc separately moved to dismiss the action for lack of jurisdiction over it. The California Court granted the motion to transfer to the Iowa Court and denied without prejudice the motions to dismiss. Plaintiff Hudson moved for leave to amend the complaint, which motion was granted by the Iowa Court. The amended complaint removed Silva as a named plaintiff and removed Aviva plc as a defendant, but otherwise substantively makes the same or similar allegations. The Defendants have moved to dismiss the amended complaint, and that motion has been fully briefed. The Court has not set a date for argument on this motion yet. If the action is not dismissed, Athene Asset Management and AGM (and the other defendants) will deny the material allegations of the amended complaint and will vigorously defend themselves against these claims. Although neither Athene Asset Management nor AGM can predict the ultimate outcome of this action, each believes that it is without merit, and because this action is in its early stages, no reasonable estimate of possible loss, if any, can be made at this time.
As has been reported in the press, as part of an industry-wide review of private equity advisers, the SEC has focused recently on the disclosure to limited partners of the acceleration of certain special fees. The Company provided information about this topic to the staff of the SEC in connection with the SEC’s periodic examination of the Company in 2013. On July 27, 2015, the Company received an informal request for additional information from the staff of the SEC on this topic and certain ancillary issues. The Company fully and voluntarily cooperated with the informal requests. On August 23, 2016, four Apollo private equity fund advisers that are subsidiaries of the Company (the “Settling Advisers”) consented to the entry of an order by the SEC settling these matters, while neither admitting nor denying the SEC allegations. In the SEC order, the SEC alleged that the Settling Advisers did not provide sufficient pre-commitment disclosure regarding the possibility of accelerating monitoring fees upon termination of such fee agreements. The SEC recognized in the order, however, that such fees were disclosed to limited partners in a variety of other forms following the commitment of capital. In fact, during the period at issue, Apollo disclosed each accelerated fee in detailed schedules provided on a regular basis to each fund’s limited partner advisory committee. The order also alleged (1) that one of the Settling Advisers did not properly disclose, in the footnotes of the financial statements of a $10.4 billion fund, the allocation of $3 million of interest on a loan from the fund to its general partner of the fund and the fund, of cash that was then due to be distributed to the general partner (which loan was fully disclosed), and (2) that the Settling Advisers failed adequately to supervise a former investment professional in connection with improper travel and expense reimbursements, although the order acknowledged that Apollo identified the issue, fully remediated it, and self-reported the issue to the SEC. The Settling Advisers agreed as part of the settlement to pay disgorgement of $37,527,000 (plus prejudgment interest of $2,727,552) to limited partners of those funds and a civil monetary penalty of $12,500,000 to the SEC.
In January 2016, the Company received an informal request for information from the staff of the SEC concerning the use of designated lender counsel with respect to financing buyout transactions, an issue covered in the press. The Company is fully cooperating with the SEC’s request for information.
After the announcement of the execution of the Agreement and Plan of Merger among Apollo Commercial Real Estate Finance, Inc., Apollo Residential Mortgage, Inc. and Arrow Merger Sub, Inc. (“Merger Sub���Sub”), two putative class action lawsuits challenging the proposed merger, captioned Aivasian v. Apollo Residential Mortgage, Inc., et al., No. 24-C-16-001532, and Wiener v. Apollo Residential Mortgage, Inc., et al., No. 24-C-16-001837, were filed in the Circuit Court for Baltimore City. A putative class and derivative lawsuit was later filed in the same Court, captioned Crago v. Apollo Residential Mortgage, Inc., et al., No. 24-C-16-002610. Following a hearing on May 6, 2016, the Court entered orders among other things, consolidating the three actions under the caption In Re Apollo Residential Mortgage, Inc. Shareholder Litigation, Case No.: 24-C-16-002610. The plaintiffs have designated the Crago complaint as the operative complaint. The operative complaint includes both direct and derivative claims, names as defendants AGM, AMTG, the board of directors of AMTG (the “AMTG Board”), ARI, Merger Sub and Athene Holding and alleges, among other things, that the members of the AMTG Board breached their fiduciary duties to AMTG’s stockholders and that the other defendants aided and abetted such fiduciary breaches. The operative complaint further alleges, among other things, that the proposed merger involves inadequate consideration, was the result of an inadequate and conflicted sales process, and includes unreasonable deal protection devices that purportedly preclude competing offers. It also alleges that the transactions with Athene Holding are unfair and that the registration statement on Form S-4 filed with the SEC on April 6, 2016 contains materially misleading disclosures and omits certain material information. The operative complaint seeks, among other things, certification of the proposed class, declaratory relief, preliminary and permanent injunctive relief, including enjoining or rescinding the merger, unspecified damages, and an award of other unspecified attorneys’ and other fees and costs. On May 6, 2016, counsel for the plaintiffs filed with the Court a stipulation seeking the appointment of interim co-lead counsel, which stipulation was approved by the Court on June 9, 2016. Defendants’ motions to dismiss have beenwere fully briefed on October 31, 2016, and oral argument
APOLLO GLOBAL MANAGEMENT, LLC
NOTES TO CONDENSED CONSOLIDATED
FINANCIAL STATEMENTS
(dollars in thousands, except share data, except where noted)
is scheduled for was held on December 8, 2016. Apollo believes that the claims asserted in the complaints are without merit. For this reason, and because the claims are in their early stages, no reasonable estimate of possible loss, if any, can be made at this time.
Following the MarchOn August 14, 2016 announcement that The Fresh Market, Inc. (“TFM”) had entered into a merger agreement with certain entities affiliated with Apollo (the “TFM Merger Agreement”), six putative shareholder class actions were filed in four courts (one in the Superior Court of Guilford County, North Carolina; two in the United States District Court for the District of Delaware; one in the United States District Court for the Middle District of North Carolina; and two in2017, the Court of Chancery forgranted the State of Delaware). Additionally, one individual action demanding inspection of booksdefendants’ motions and records was filedissued an opinion dismissing the operative complaint in its entirety with prejudice. The time to appeal the Court of Chancery fororder dismissing the State of Delawarelawsuit has expired, and two petitions for appraisal of stock were also filed in the Court of Chancery for the State of Delaware. The first purported class action, captioned Dolores Balint v. The Fresh Market, Inc., et. al., Case No. 16-CVS-4144, was filed on March 23, 2016 in the North Carolina Superior Court (the “Balint Action”). The complaint named as defendants TFM, its officers and directors and certain affiliates of AGM, Pomegranate Holdings, Inc. (“Pomegranate Holdings”) and Pomegranate Merger Sub, Inc. (“Pomegranate Merger Sub”). The Balint action was voluntarily dismissed by the plaintiff on April 13, 2016. The second purported class action, captioned Ross DeAmbrogio v. The Fresh Market, Inc., et. al., Case No. 1:16-cv-00239-LPS, was filed April 7, 2016 in the United States District Court for the District of Delaware and named as defendants TFM and its officers and directors (the “DeAmbrogio Action”). The Plaintiff in the DeAmbrogio Action filed a stipulation of voluntary dismissal and anticipated application for an award of attorneys’ fees and expenses on June 29, 2016. The third purported class action, captioned John Solak v. The Fresh Market, Inc., et. al., Case No. 1:16-cv-00249-SLR, was filed April 8, 2016 in the United States District Court for the District of Delaware and named as defendants TFM, its officers and directors, AGM, Pomegranate Holdings, Pomegranate Merger Sub and Apollo Management VIII, L.P. (the “Solak Action”). The Plaintiff in the Solak Action filed a stipulation of voluntary dismissal and anticipated application for an award of attorneys’ fees and expenses on June 28, 2016. The fourth purported class action, captioned Ronald Jantz v. Ray Berry, et. al., Case No. 1:16-cv-0307-CCE-JEP, was filed April 11, 2016 in the United States District Court for the Middle District of North Carolina and named as defendants TFM and its officers and directors (the “Jantz Action”). The Plaintiff in the Jantz Action filed a stipulation of voluntary dismissal on July 8, 2016. The fifth purported class action, captioned Bruce S. Sherman, et. al. v. The Fresh Market, Inc., et. al., Case No. 12205-VCG, was filed April 14, 2016 in the Chancery Court for the State of Delaware and named as defendants TFM, its officers and directors, AGM, Pomegranate Holdings, Pomegranate Merger Sub and Apollo Management VIII, L.P. (the “Sherman Action”). The Sherman Action alleges, among other things, that the TFM officers and directors breached their fiduciary duties to the TFM shareholders in connection with their consideration and approval of the TFM Merger Agreement, including by agreeing to an inadequate price and by filing materially deficient disclosures regarding the transaction. The Sherman Action further alleges that TFM, AGM, Apollo Management VIII, L.P., Pomegranate Holdings and Pomegranate Merger Sub, aided and abetted in those alleged breaches. The sixth action, an individual action captioned Elizabeth Morrison v. The Fresh Market, Inc., Case No. 12243-VCG, was filed April 22, 2016 in the Chancery Court for the State of Delaware and named only TFM as a defendant (the “Morrison Action”). The Morrison Action sought only the right to inspect certain books and records of TFM pursuant to Section 220 of the Delaware Corporate Code. The Plaintiff in the Morrison Action filed a stipulation of voluntary dismissal on August 10, 2016 and the case was administratively closed by the Court thereafter. The seventh action, a Petition for Appraisal of Stock captioned Hudson Bay Master Fund, Ltd. and Brigade Leveraged Capital Structures Fund, Ltd. v. The Fresh Market, Inc., Case No. 12372-VCG, was filed May 23, 2016 and names only TFM as the respondent (the “Hudson Bay Action”). The Hudson Bay Action was filed on behalf of holders of 1,660,000 shares of common stock of TFM and seeks a determination of the fair value of the shares of the common stock of TFM under Section 262 of the Delaware Corporate Code. The eighth action, a second Petition for Appraisal of Stock captioned Verition Multi-Strategy Master Ltd. and Verition Partners Master Fund Ltd. v. The Fresh Market, Inc. was filed August 22, 2016 and names only TFM as the respondent (the “Verition Action”). The Verition Action was filed on behalf of holders of 1,198,318 shares of common stock of TFM and seeks a determination of the fair value of the shares of the common stock of TFM under Section 262 of the Delaware Corporate Code. The Verition Action hasno appeals have been consolidated with the Hudson Bay Action and the two will proceed together under the caption, In re Appraisal of The Fresh Market, Inc., Case No. 12372-VCG. The ninth action, another purported shareholder class action, captioned Elizabeth Morrison v. Ray Berry, et. al., Case No. 12808-VCG, was filed October 6, 2016 in the Chancery Court for the State of Delaware and named as defendants TFM’s officers and directors (the “Morrison Fiduciary Duty Action”). This action was filed by the same plaintiff who filed the Morrison Action. Like the Sherman Action, the Morrison Fiduciary Duty Action alleges, among other things, that the TFM officers and directors breached their fiduciary duties to the TFM shareholders in connection with their consideration and approval of the TFM Merger Agreement, including by engaging in a sale process that improperly favored AGM and/or Apollo Management VIII, L.P., by agreeing to an inadequate price and by filing materially deficient disclosures regarding the transaction. The Morrison Fiduciary Duty Action further alleges that former TFM director, Brett Berry, aided and abetted in those alleged breaches. The Court has not yet set a schedule for resolving either the Sherman Action or the Morrison Fiduciary Duty Action on the merits. The Court in the Hudson Bay Action and the Verition Action has scheduled a trial on the merits to take place in November 2017. Because each of the pending actions is in thefiled.
APOLLO GLOBAL MANAGEMENT, LLC
NOTES TO CONDENSED CONSOLIDATED
FINANCIAL STATEMENTS
(dollars in thousands, except share data, except where noted)
early stages, no reasonable estimate of possible loss, if any, can be made. Apollo believes that each of these actions is without merit.
On March 4, 2016, the Public Employees Retirement System of Mississippi filed a putative securities class action against Sprouts Farmers Market, Inc. (“SFM”), several SFM directors (including Andrew Jhawar, an Apollo partner), AP Sprouts Holdings, LLC and AP Sprouts Holdings (Overseas), L.P. (the “AP Entities”), which are controlled by entities managed by Apollo affiliates, and two underwriters of a March 2015 secondary offering of SFM common stock. The AP Entities sold SFM common stock in the March 2015 secondary offering. The complaint, filed in Arizona Superior Court and captioned Public Employees Retirement System of Mississippi v. Sprouts Farmers Market, Inc. (CV2016-050480), alleges that SFM filed a materially misleading registration statement for the secondary offering that incorporated alleged misrepresentations in SFM’s 2014 annual report regarding SFM’s business prospects, and failed to disclose alleged accelerating produce deflation. The two causes of action against the AP Entities are for alleged violations of Sections 11 and 15 of the Securities Act of 1933. Plaintiff seeks, among other things, compensatory damages for alleged losses sustained from a decline in SFM’s stock price. On March 24, 2016, defendantsDefendants removed the case to United
APOLLO GLOBAL MANAGEMENT, LLC
NOTES TO CONDENSED CONSOLIDATED
FINANCIAL STATEMENTS
(dollars in thousands, except share data, except where noted)
States District Court for the District of Arizona. Plaintiff's April 18, 2016Arizona, but the court granted plaintiff's motion to remand the case to state court, which the defendants have appealed. Meanwhile, defendants moved to dismiss the action in state court, but the court denied that motion was fully briefed as of May 27, 2016.and the case is proceeding to discovery. Because this action is in its early stages, no reasonable estimate of possible loss, if any, can be made at this time.
As has been reported in the press, on May 13, 2016, ARM Manager, LLC ("ARM Manager") a subsidiary of AGM, and AMTG, were among several entities that received subpoenas from the New York State Department of Financial Services requesting documents relating to seller-financed real estate contracts. As AMTG’s successor in the merger of the residential mortgage real estate investment trust we managed, Apollo Residential Mortgage, Inc., with ARI (“the ARI/AMTG transaction”), ARI and ARM Manager are cooperating fully with the requests.
Between February 25 and March 23, 2016, plaintiffs filed five putative class actions in the Superior Court of Maricopa County, Arizona, on behalf of purported stockholders of Apollo Education Group, Inc. The actions were captioned as follows: Casey v. Apollo Education Group, Inc., et al., CV2016-051605 (Ariz. Super. Ct. Feb. 25, 2016); Miglio v. Apollo Education Group, Inc., et al., CV2016-003718 (Ariz. Super. Ct. Feb. 26, 2016); Wagner v. Apollo Education Group, Inc., et al., CV2016-001905 (Ariz. Super. Ct. Mar. 9, 2016); Ladouceur v. Apollo Education Group, Inc., et al., CV2016-002148 (Ariz. Super. Ct. Mar. 17, 2016); Simkhovich v. Apollo Education Group, Inc., et al., CV2016-002339 (Ariz. Super. Ct. Mar. 23, 2016).(“AEG”) asserting claims for breaches of fiduciary duties and aiding and abetting the alleged breaches in connection with a proposed acquisition of AEG. The defendants include, among others, Apollo Education Group, Inc. (“AEG”),AEG, members of AEG’s board of directors, AGM, Fund VIII, AP VIII Queso Holdings, L.P., which is a subsidiaryand certain subsidiaries of funds affiliated with Apollo Management VIII, L.P., and AGM, and Socrates Merger Sub, Inc., which is a wholly owned subsidiary of AP VIII Queso Holdings, L.P. The complaints allege that AEG’s directors breached their fiduciary duties to AEG’s stockholdersmanaged by entering into a merger agreement that provides for AEG to be acquired by AP VIII Queso Holdings, L.P., and Socrates Merger Sub, Inc. Plaintiffs claim that AEG’s directors engaged in a flawed sales process, agreed to a price that does not adequately compensate AEG’s stockholders, and agreed to certain unfair deal protection terms in connection with the merger agreement. Two of the complaints further allege (1) that AEG’s directors breached their fiduciary duty of candor by filing a materially incomplete and misleading preliminary proxy statement, and (2) that the sales process was flawed because of certain alleged conflicts with AEG’s financial advisors. All the complaints allege that AP VIII Queso Holdings, L.P., and Socrates Merger Sub, Inc., aided and abetted the alleged breaches. The complaints that name as defendants AGM and Fund VIII, allege that those entities also aided and abetted the alleged breaches. No amount of damages is specified in any of the complaints.Apollo. On April 12, 2016, the Court consolidated all the actions under the following caption: In re Apollo Education Group, Inc. Shareholder Litigation, Lead Case No. CV2016-001905 (Ariz. Super. Ct.). TheShortly thereafter, the parties have informed the Court that they havehad entered into a memorandum of understanding providing for thea settlement of the suit. The settlement contemplated by the memorandum willthat would, among other things, (i) provide for the dismissal with prejudice on the merits and release of any and all claims by the proposed class against Defendants. The settlement also willthe Defendants; and (ii) recognize that the pendency of the suit was, in part, a factor in the decision by the purchasers of AEG to increase the price offered to acquire all of the outstanding shares of AEG’s common stock from $9.50 per share to $10.00 per share. TheOn April 10, 2017, the parties filed settlement is contingent uponpapers for the Court’s review following the consummation of the merger agreement Plaintiffs’ takingon February 1, 2017, the completion by plaintiffs of three confirmatory discovery depositions on February 27, 2017, and the execution of definitivea stipulation of settlement papers, certification ofby the parties. On October 6, 2017, the Court entered an Order and Final Judgment in which it (i) decreed that the class notice had been provided to the proposed class pursuant to and court approval.in the manner directed by the Order for Notice and Hearing entered on May 23, 2017 and June 29, 2017, (ii) certified the non-opt-out settlement class, and (iii) fully and finally approved the settlement in all respects, including the dismissal of the action with prejudice in full and final discharge of any and all claims by the class against the defendants. The parties askedOrder and Final Judgment further provides for the courtagreed upon award of $2.1 million to extend the deadlineplaintiffs’ counsel for fees and expenses and that amount has in fact been paid by which the Plaintiffs must file an amended consolidated complaint or designate an operative complaint until November 8, 2016. The Court responded with an order explaining that the case will be dismissed on December 9, 2016, unless the parties submit a stipulated judgment or stipulated dismissal before that date, or the court otherwise extends the deadline for good cause. Because this action is in its early stages, no reasonable estimate of possible loss, if any, can be made at this time. Apollo Education Group.
On June 20, 2016 Banca Carige S.p.A. (“Carige”) commenced a lawsuit in the Court of Genoa (Italy) (No. 8965/2016), against its former Chairman, its former Chief Executive Officer, AGM and certain entities (the “Apollo Entities”) organized and
APOLLO GLOBAL MANAGEMENT, LLC
NOTES TO CONDENSED CONSOLIDATED
FINANCIAL STATEMENTS
(dollars in thousands, except share data, except where noted)
owned by investment funds managed by affiliates of AGM. The complaint alleges that AGM and the Apollo Entities (i) aided and abetted breaches of fiduciary duty to Carige allegedly committed by Carige’s former Chairman and former CEO in connection with the sale to the Apollo Entities of Carige subsidiaries engaged in the insurance business; and (ii) took wrongful actions aimed at weakening Banca Carige’s financial condition supposedly to facilitate an eventual acquisition of Carige. The causes of action are based in tort under Italian law. Carige purportedly seeks damages of €450 million in connection with the sale of the insurance businesses and €800 million for other losses. The first hearing has been scheduled forhearings were held on May 9,17, 2017 and on June 14, 2017. Based on the allegations made in the complaint, Apollo believes that there is no merit to Carige’s claims. Additionally, as the case is in its early stages, no reasonable estimate of possible loss, if any, can be made at this time.
FollowingOn December 12, 2016, the August 26,CORE Litigation Trust (the “Trust”), which was created under the Chapter 11 reorganization plan for CORE Media and other affiliated entities, including CORE Entertainment, Inc. (“CORE”), approved by the Southern District of New York Bankruptcy Court on September 22, 2016, announcement that Rackspace Hosting, Inc.commenced an action in California Superior Court for Los Angeles County, captioned Core Litigation Trust v. Apollo Global Management, LLC, et al., Case No. BC 643732, which was removed to the United States District Court for the Central District of California on February 3, 2017. On April 5, 2017, the C.D. Cal. District Court granted Defendants’ motion to transfer the case to the Southern District of New York (“Rackspace”SDNY”) hadand denied the Trust’s motion to remand the action to California state court, without prejudice to the Trust refiling its remand motion in the SDNY. On April 20, 2017, the SDNY District Court referred the case to the SDNY Bankruptcy Court. On July 17, 2017, the SDNY Bankruptcy Court granted the Trust’s motion for mandatory abstention and remanded the case to Los Angeles County Superior Court. On October 3, 2017, the Los Angeles County Superior Court granted defendants’ motion to stay all proceedings in the California state court action on forum non conveniens grounds in favor of litigating the case in New York state court. The Trust has not yet filed an action in New York state court. The Trust’s complaint asserts claims for inducing the breach of and tortiously interfering with $360 million in loans under the 2011 loan agreements entered into a merger agreement withbetween CORE and certain entities organizedFirst and owned by investmentSecond Lien Lenders (the “Lenders”), who assigned their loan-agreement claims to the Trust as part of CORE’s Chapter 11 plan of reorganization. The complaint names as defendants: (i) AGM, (ii) Apollo Global Securities, LLC, (iii) other AGM subsidiaries, (iv) the funds managed by AGMApollo that were the beneficial owners of CORE Media (the “Apollo Merger Entities”“CORE Funds”), on October 11, 2016, a putative shareholder class action was filed(v) certain affiliated-entities through which the CORE Funds owned their beneficial interest in CORE Media, (vi) Twenty-First Century Fox, Inc. (“Fox”) and certain Fox affiliates, and (vii) Endemol USA Holding, Inc. (“Endemol”) and certain Endemol-affiliated entities. The Trust alleges that defendants’ participation in certain transactions related to CORE, including the Court of ChanceryDecember 12, 2014 formation of the Statejoint venture through which the CORE Funds and Fox beneficially owned CORE Media and Endemol Shine, induced CORE to breach the loan agreements and tortiously interfered with CORE’s performance of Delawareits obligations under the loan agreements. The Trust seeks unspecified
APOLLO GLOBAL MANAGEMENT, LLC
NOTES TO CONDENSED CONSOLIDATED
FINANCIAL STATEMENTS
(dollars in thousands, except share data, except where noted)
compensatory and named as defendants Rackspace, the directors of Rackspace, AGM and thepunitive damages. Apollo Merger Entities. The case is captioned Shawn Luger v. Rackspace Hosting, Inc., et al., Civil Action No. 12819-CB. The complaint purports to assert a claim against the directors of Rackspace for allegedly breaching their fiduciary duty of disclosure In connection with the Definitive Proxy Statement filed by Rackspace with the SEC on September 30, 2016 (the “Rackspace Proxy Statement”), and also purports to assert a claim against Rackspace, AGM and the Apollo Merger Entities for allegedly aiding and abetting this alleged breach of fiduciary duty by the directors of Rackspace. The complaint alleges, among other things, that the Rackspace Proxy Statement failed to provide material information and/or omitted material information concerning the proposed acquisition of Rackspace. The complaint seeks to enjoin the consummation of the proposed acquisition of Rackspace, or to rescind it (or award rescissory damages) in the event it is consummated, and requests an award to the class of compensatory damages, an award to plaintiff of costs, attorneys’ fees and expert fees, and other equitable relief. AGM and the Apollo Merger Entities believebelieves these claims are without merit. AsBecause this action is in its early stages, no reasonable estimate of possible loss, if any, can be made at this time.
In December 2016, the Company received a subpoena from the SEC principally concerning the Company's disclosure of IRR calculations for certain private equity funds, costs associated with a European service provider, and certain personnel changes. These topics generally track matters with which the Company is familiar and has previously examined. The Company is fully cooperating with the SEC in this matter.
On August 3, 2017, a putative class action was commenced in the United States District Court for the Middle District of Florida against AGM, Gareth Turner (an Apollo Partner) and Mark Beith (a former Apollo Principal) by Michael McEvoy on behalf of a class of current and former employees of subsidiaries of CEVA Group, LLC (“CEVA Group”) who purchased restricted Class A shares in CEVA Investment Limited (“CIL”), the former parent company of CEVA Group. The complaint alleges that the defendants breached fiduciary duties to and defrauded the plaintiffs by inducing them to purchase shares in CIL and subsequently participating in a debt restructuring of CEVA Group in which shareholders of CIL did not receive a recovery. The complaint purports to seek damages in excess of €14 million. On October 18, 2017, the bankruptcy trustee for CIL filed a motion in the Bankruptcy Court for the Southern District of New York to prevent Mr. McEvoy and his counsel from continuing to prosecute the Florida action on the basis that the relevant claims belong to the CIL bankruptcy estate. The Bankruptcy Court has not yet ruled on the motion. Based on the allegations in the complaint, Apollo believes that there is no merit to the claims. Additionally, as the case is in its early stages, no reasonable estimate of possible loss, if any, can be made at this time.
Between July 25 and August 15, 2017, plaintiffs filed three purported stockholder class actions in the Nevada state and federal court against ClubCorp Holdings Inc. (“ClubCorp”), the directors of ClubCorp, and AGM, in connection with the proposed acquisition of ClubCorp. The cases in the District Court for Clark County, Nevada were originally captioned Meng v. ClubCorp Holdings, Inc., et al., No. A-17-758912-B (“Meng”); Baum v. Affeldt, et al., No. A-17-759227-C (“Baum”); and Solak v. Affeldt, et al., No. A-17-759987-B (“Solak”). On August 16, 2017, the Meng and Baum actions were consolidated with two other similar actions that did not name AGM as a defendant. The consolidated action is captioned In re ClubCorp Holdings Shareholder Litigation, Case No. A-17-758912-B (“In re ClubCorp”). On September 21, 2017, the Solak action was consolidated into In re ClubCorp. On October 12, 2017, plaintiffs in In re ClubCorp filed a consolidated amended complaint. The complaint purports to assert claims against the directors of ClubCorp for allegedly breaching their fiduciary duties of loyalty, due care, good faith, and candor owed to the plaintiff and the public stockholders of ClubCorp. The complaint includes allegations that the directors, among other things, agreed to a transaction at an unreasonably low price, failed to take the necessary steps to maximize stockholder value, gave preferential severance benefits to certain executives, agreed to preclusive deal protection provisions, and included materially incomplete and misleading information in the proxy statement recommending that stockholders vote in favor of the acquisition. The complaint also purports to assert a claim against AGM for aiding and abetting the directors’ purported breach of fiduciary duty. Because this action is in the early stages, no reasonable estimate of possible loss, if any, can be made.
Commitments and Contingencies—Apollo leases office space and certain office equipment under various lease and sublease arrangements, which expire on various dates through 2025. As these leases expire, it can be expected that in the normal course of business, they will be renewed or replaced. Certain lease agreements contain renewal options, rent escalation provisions based on certain costs incurred by the landlord or other inducements provided by the landlord. Rent expense is accrued to recognize lease escalation provisions and inducements provided by the landlord, if any, on a straight-line basis over the lease term and renewal periods where applicable. Apollo has entered into various operating lease service agreements in respect of certain assets.
As of September 30, 2016,2017, the approximate aggregate minimum future payments required for operating leases were as follows:
|
| | | | | | | | | | | | | | | | | | | | | | | | | | | |
| | Remaining 2016 | | 2017 | | 2018 | | 2019 | | 2020 | | Thereafter | | Total |
| Aggregate minimum future payments | $ | 9,385 |
| | $ | 35,104 |
| | $ | 31,118 |
| | $ | 30,359 |
| | $ | 13,796 |
| | $ | 10,326 |
| | $ | 130,088 |
|
|
| | | | | | | | | | | | | | | | | | | | | | | | | | | |
| | Remaining 2017 | | 2018 | | 2019 | | 2020 | | 2021 | | Thereafter | | Total |
| Aggregate minimum future payments | $ | 9,266 |
| | $ | 34,643 |
| | $ | 33,702 |
| | $ | 15,563 |
| | $ | 6,055 |
| | $ | 13,313 |
| | $ | 112,542 |
|
The Company received $19.0 million in proceeds in connection with the early termination of a lease during the three months ended September 30, 2017 which was recorded in other income (loss), net on the condensed consolidated statements of operations.
APOLLO GLOBAL MANAGEMENT, LLC
NOTES TO CONDENSED CONSOLIDATED
FINANCIAL STATEMENTS
(dollars in thousands, except share data, except where noted)
Expenses related to non-cancellable contractual obligations for premises, equipment, auto and other assets were $10.0$8.5 million and $10.6$10.0 million for the three months ended September 30, 20162017 and 2015,2016, respectively, and $30.1$28.3 million and $31.6$30.1 million for the nine months ended September 30, 20162017 and 2015,2016, respectively.
Other long-term obligations relate to payments with respect to certain consulting agreements entered into by Apollo Investment Consulting LLC, a subsidiary of Apollo, as well as long-term service contracts. A significant portion of these costs are reimbursable by funds or portfolio companies. As of September 30, 2016,2017, fixed and determinable payments due in connection with these obligations were as follows:
|
| | | | | | | | | | | | | | | | | | | | | | | | | | | |
| | Remaining 2016 | | 2017 | | 2018 | | 2019 | | 2020 | | Thereafter | | Total |
| Other long-term obligations | $ | 6,127 |
| | $ | 9,417 |
| | $ | 6,734 |
| | $ | 4,030 |
| | $ | 1,701 |
| | $ | 1,701 |
| | $ | 29,710 |
|
|
| | | | | | | | | | | | | | | | | | | | | | | | | | | |
| | Remaining 2017 | | 2018 | | 2019 | | 2020 | | 2021 | | Thereafter | | Total |
| Other long-term obligations | $ | 8,291 |
| | $ | 12,413 |
| | $ | 3,525 |
| | $ | 1,956 |
| | $ | 1,956 |
| | $ | 1,611 |
| | $ | 29,752 |
|
Contingent Obligations—Carried interest income with respect to private equity funds and certain credit and real estateassets funds is subject to reversal in the event of future losses to the extent of the cumulative carried interest recognized in income to date. If all of the existing investments became worthless, the amount of cumulative revenues that have been recognized by Apollo through September 30, 20162017 and that would be reversed approximates $2.7$3.6 billion. Management views the possibility of all of the investments becoming worthless as remote. Carried interest income is affected by changes in the fair values of the underlying
APOLLO GLOBAL MANAGEMENT, LLC
NOTES TO CONDENSED CONSOLIDATED
FINANCIAL STATEMENTS
(dollars in thousands, except share data, except where noted)
investments in the funds that Apollo manages. Valuations, on an unrealized basis, can be significantly affected by a variety of external factors including, but not limited to, bond yields and industry trading multiples. Movements in these items can affect valuations quarter to quarter even if the underlying business fundamentals remain stable.
Additionally, at the end of the life of certain funds that the Company manages, there could be a payment due to a fund by the Company if the Company, as general partner, has received more carried interest income than was ultimately earned. The general partner obligation amount, if any, will depend on final realized values of investments at the end of the life of each fund or as otherwise set forth in the respective limited partnership agreement of the fund. See note 1213 to our condensed consolidated financial statements for further details regarding the general partner obligation.
Certain funds may not generate carried interest income as a result of unrealized and realized losses that are recognized in the current and prior reporting period. In certain cases, carried interest income will not be generated until additional unrealized and realized gains occur. Any appreciation would first cover the deductions for invested capital, unreturned organizational expenses, operating expenses, management fees and priority returns based on the terms of the respective fund agreements.
One of the Company’s subsidiaries, AGS, provides underwriting commitments in connection with securities offerings to the portfolio companies of the funds Apollo manages. As of September 30, 2016,2017, there were no underwriting commitments outstanding related to such offerings.
As of September 30, 2016,2017, one of the Company’s subsidiaries had an unfunded contingent commitmentcommitments of $80.3$29.8 million, to facilitate fundingfundings at closing by a lead arrangerarrangers for a syndicated term loanloans issued by a portfolio companycompanies of a fundfunds managed by Apollo. The commitment expirescommitments expired on November 11, 2016. As of November 4, 2016, the unfunded commitment was approximately $4.6 million.2, 2017 and were not funded.
Contingent Consideration—In connection with the acquisition of Stone Tower in April 2012, the Company agreed to pay the former owners of Stone Tower a specified percentage of any future carried interest income earned from certain of the Stone Tower funds, CLOs, and strategic investment accounts. This contingent consideration liability was determined based on the present value of estimated future carried interest payments, and is recorded in profit sharing payable in the condensed consolidated statements of financial condition. The fair value of the remaining contingent obligation was $81.2$87.3 million and $70.9$106.3 million as of September 30, 20162017 and December 31, 2015,2016, respectively.
In connection with the Gulf Stream acquisition, the Company agreed to make payments to the former owners of Gulf Stream under a contingent consideration obligation which required the Company to transfer cash to the former owners of Gulf Stream based on a specified percentage of carried interest income. There was no contingent liability as the Gulf Stream liabilities had been satisfied as of September 30, 2016. The contingent liability had a fair value of $8.7 million as of December 31, 2015, which was recorded in profit sharing payable in the condensed consolidated statements of financial condition.
The contingent consideration obligations will be remeasured to fair value at each reporting period until the obligations are satisfied.satisfied and are characterized as Level III liabilities. The changes in the fair value of the contingent consideration obligations is reflected in profit sharing expense in the condensed consolidated statements of operations.
The contingent consideration obligations are measured at fair value and are characterized as Level III liabilities. See note 5 for further information regarding fair value measurements.
14.15. SEGMENT REPORTING
Apollo conducts its business primarily in the United States and substantially all of its revenues are generated domestically. Apollo’s business is conducted through three reportable segments: private equity, credit and real estate.assets. Segment
APOLLO GLOBAL MANAGEMENT, LLC
NOTES TO CONDENSED CONSOLIDATED
FINANCIAL STATEMENTS
(dollars in thousands, except share data, except where noted)
information is utilized by our Managing Partners, who operate collectively as our chief operating decision maker, to assess performance and to allocate resources. These segments were established based on the nature of investment activities in each underlying fund, including the specific type of investment made the frequency of trading, and the level of control over the investment.
The performance is measured by the Company’s chief operating decision maker on an unconsolidated basis because management makes operating decisions and assesses the performance of each of Apollo’s business segments based on financial and operating metrics and data that exclude the effects of consolidation of any of the affiliated funds.
APOLLO GLOBAL MANAGEMENT, LLC
NOTES TO CONDENSED CONSOLIDATED
FINANCIAL STATEMENTS
(dollars in thousands, except share data, except where noted)
Economic Income (Loss)
Economic Income, or “EI”, is a key performance measure used by management in evaluating the performance of Apollo’s private equity, credit and real estateassets segments. Management believes the components of EI, such as the amount of management fees, advisory and transaction fees and carried interest income, are indicative of the Company’s performance. Management uses EI in making key operating decisions such as the following:
Decisions related to the allocation of resources such as staffing decisions including hiring and locations for deployment of the new hires;
Decisions related to capital deployment such as providing capital to facilitate growth for the business and/or to facilitate expansion into new businesses; and
Decisions relating to expenses, such as determining annual discretionary bonuses and equity-based compensation awards to its employees. With respect to compensation, management seeks to align the interests of certain professionals and selected other individuals with those of the investors in such funds and those of the Company’s shareholders by providing such individuals a profit sharing interest in the carried interest income earned in relation to the funds. To achieve that objective, a certain amount of compensation is based on the Company’s performance and growth for the year.
EI is a measure of profitability and has certain limitations in that it does not take into account certain items included under U.S. GAAP. EI represents segment income (loss) before income tax (provision) benefitprovision excluding transaction-related charges arising from the 2007 private placement, and any acquisitions. Transaction-related charges include equity-based compensation charges, the amortization of intangible assets, contingent consideration and certain other charges associated with acquisitions. In addition, segment data excludes non-cash revenue and expense related to equity awards granted by unconsolidated related parties to employees of the Company, compensation and administrative related expense reimbursements, as well as the assets, liabilities and operating results of the funds and VIEs that are included in the condensed consolidated financial statements.
Economic Income (Loss) for the three and nine months ended September 30, 2015 includes a recast of salary, bonus and benefits due to management’s change in allocation methodology among the segments during the first quarter of 2016. All prior periods have been recast to conform to the current presentation. Impact to the combined segments’ total Economic Income (Loss) for all periods was zero.
|
| | | | | | | | | | | | | | | |
| | Impact on Economic Income (Loss) |
| | For the Three Months Ended September 30, 2015 |
| | Private Equity Segment | | Credit Segment | | Real Estate Segment | | Total
Reportable
Segments |
| Total Economic Income (Loss), as previously presented | $ | (6,790 | ) | | $ | 112,752 |
| | $ | (768 | ) | | $ | 105,194 |
|
| Impact of reclassification | (5,774 | ) | | 4,298 |
| | 1,476 |
| | — |
|
| Total Economic Income, as currently presented | $ | (12,564 | ) | | $ | 117,050 |
| | $ | 708 |
| | $ | 105,194 |
|
|
| | | | | | | | | | | | | | | |
| | Impact on Economic Income (Loss) |
| | For the Nine Months Ended September 30, 2015 |
| | Private Equity Segment | | Credit Segment | | Real Estate Segment | | Total
Reportable
Segments |
| Total Economic Income (Loss), as previously presented | $ | 115,318 |
| | $ | 253,707 |
| | $ | (4,229 | ) | | $ | 364,796 |
|
| Impact of reclassification | (13,130 | ) | | 9,061 |
| | 4,069 |
| | — |
|
| Total Economic Income (Loss), as currently presented | $ | 102,188 |
| | $ | 262,768 |
| | $ | (160 | ) | | $ | 364,796 |
|
APOLLO GLOBAL MANAGEMENT, LLC
NOTES TO CONDENSED CONSOLIDATED
FINANCIAL STATEMENTS
(dollars in thousands, except share data, except where noted)
The following table presentstables present financial data for Apollo’s reportable segments as of and for the three months ended September 30, 20162017 and 2015:2016. Prior period financial data has been updated to conform to the current presentation.
| | | | As of and for the Three Months Ended September 30, 2016 | As of and for the Three Months Ended September 30, 2017 |
| | Private Equity Segment | | Credit Segment | | Real Estate Segment | | Total Reportable Segments | Private Equity Segment | | Credit Segment | | Real Assets Segment | | Total Reportable Segments |
| Revenues: | | | | | | | | | | | | | | |
| Management fees from related parties | | $ | 76,079 |
| | $ | 187,885 |
| | $ | 18,470 |
| | $ | 282,434 |
|
| Advisory and transaction fees from related parties, net | $ | 26,601 |
| | $ | 2,612 |
| | $ | 1,038 |
| | $ | 30,251 |
| 10,572 |
| | 4,219 |
| | 1,418 |
| | 16,209 |
|
| Management fees from related parties | 91,545 |
| | 151,386 |
| | 15,554 |
| | 258,485 |
| |
| Carried interest income from related parties: | | | | | | | | |
Unrealized gains(1) | 75,019 |
| | 91,502 |
| | 963 |
| | 167,484 |
| |
| Realized gains | 9,844 |
| | 20,500 |
| | 5,499 |
| | 35,843 |
| |
| Carried interest income (loss) from related parties: | | | | | | | | |
Unrealized(1) | | 286,589 |
| | 4,179 |
| | (5,169 | ) | | 285,599 |
|
| Realized | | 21,859 |
| | 32,131 |
| | 6,985 |
| | 60,975 |
|
| Total carried interest income from related parties | | 308,448 |
| | 36,310 |
| | 1,816 |
| | 346,574 |
|
Total Revenues(2) | 203,009 |
| | 266,000 |
| | 23,054 |
| | 492,063 |
| 395,099 |
| | 228,414 |
| | 21,704 |
| | 645,217 |
|
| Expenses: | | | | | | | | | | | | | | |
| Compensation and benefits: | | | | | | | | | | | | | | |
| Salary, bonus and benefits | 32,532 |
| | 45,143 |
| | 9,129 |
| | 86,804 |
| 31,467 |
| | 59,027 |
| | 10,513 |
| | 101,007 |
|
| Equity-based compensation | 6,645 |
| | 8,834 |
| | 675 |
| | 16,154 |
| 6,335 |
| | 9,925 |
| | 798 |
| | 17,058 |
|
| Profit sharing expense | 26,500 |
| | 45,797 |
| | 4,494 |
| | 76,791 |
| |
| Profit sharing expense: | | | | | | | | |
| Unrealized | | 96,992 |
| | 2,266 |
| | (4,812 | ) | | 94,446 |
|
| Realized | | 17,394 |
| | 14,643 |
| | 3,636 |
| | 35,673 |
|
Realized: Equity-based(3) | | 808 |
| | 518 |
| | — |
| | 1,326 |
|
| Total profit sharing expense | | 115,194 |
| | 17,427 |
| | (1,176 | ) | | 131,445 |
|
| Total compensation and benefits | 65,677 |
| | 99,774 |
| | 14,298 |
| | 179,749 |
| 152,996 |
| | 86,379 |
| | 10,135 |
| | 249,510 |
|
| Other expenses | 18,448 |
| | 29,884 |
| | 4,674 |
| | 53,006 |
| |
| Non-compensation expenses: | | | | | | | | |
| General, administrative and other | | 19,699 |
| | 35,709 |
| | 5,520 |
| | 60,928 |
|
| Placement fees | | 2,257 |
| | 3,140 |
| | — |
| | 5,397 |
|
| Total non-compensation expenses | | 21,956 |
| | 38,849 |
| | 5,520 |
| | 66,325 |
|
Total Expenses(2) | 84,125 |
| | 129,658 |
| | 18,972 |
| | 232,755 |
| 174,952 |
| | 125,228 |
| | 15,655 |
| | 315,835 |
|
| Other Income (Loss): | | | | | | | | |
| Net interest expense | (4,188 | ) | | (6,172 | ) | | (1,168 | ) | | (11,528 | ) | |
| Other Income: | | | | | | | | |
| Income (loss) from equity method investments | | 39,875 |
| | 8,222 |
| | (83 | ) | | 48,014 |
|
| Net gains from investment activities | 1,191 |
| | 16,171 |
| | — |
| | 17,362 |
| 7,959 |
| | 60,570 |
| | — |
| | 68,529 |
|
| Income from equity method investments | 14,384 |
| | 8,036 |
| | 499 |
| | 22,919 |
| |
| Other income (loss), net | 103 |
| | (4,977 | ) | | (29 | ) | | (4,903 | ) | |
Total Other Income (Loss)(2) | 11,490 |
| | 13,058 |
| | (698 | ) | | 23,850 |
| |
| Net interest loss | | (4,374 | ) | | (5,972 | ) | | (1,163 | ) | | (11,509 | ) |
| Other income, net | | 7,344 |
| | 16,318 |
| | 2,044 |
| | 25,706 |
|
Total Other Income(2) | | 50,804 |
| | 79,138 |
| | 798 |
| | 130,740 |
|
| Non-Controlling Interests | — |
| | (510 | ) | | — |
| | (510 | ) | — |
| | (1,751 | ) | | — |
| | (1,751 | ) |
Economic Income(2) | $ | 130,374 |
| | $ | 148,890 |
| | $ | 3,384 |
| | $ | 282,648 |
| $ | 270,951 |
| | $ | 180,573 |
| | $ | 6,847 |
| | $ | 458,371 |
|
Total Assets(2) | $ | 1,840,504 |
| | $ | 2,480,601 |
| | $ | 187,897 |
| | $ | 4,509,002 |
| $ | 2,660,333 |
| | $ | 2,772,296 |
| | $ | 226,273 |
| | $ | 5,658,902 |
|
| |
| (1) | Included in unrealized carried interest gains (losses)income (loss) from related parties for the three months ended September 30, 20162017 was a reversal of previously realized carried interest income due to the general partner obligation to return previously distributed carried interest income. See note 1213 for further details regarding the general partner obligation. |
| |
| (2) | Refer below for a reconciliation of total revenues, total expenses, other income and total assets for Apollo’s total reportable segments to total consolidated revenues, total consolidated expenses, total consolidated other income (loss) and total assets. |
| |
| (3) | Relates to amortization of restricted share awards granted under certain profit sharing arrangements (see note 2). The following table presents the related unamortized deferred equity-based compensation recorded in other assets, as well as liabilities for restricted share awards expected to be granted recorded in other liabilities, both within the condensed consolidated statements of financial condition: |
APOLLO GLOBAL MANAGEMENT, LLC
NOTES TO CONDENSED CONSOLIDATED
FINANCIAL STATEMENTS
(dollars in thousands, except share data, except where noted)
|
| | | | | | | | | | | | | | | |
| | For the Three Months Ended September 30, 2015 |
| | Private
Equity
Segment | | Credit
Segment | | Real
Estate
Segment | | Total
Reportable
Segments |
| Revenues: | | | | | | | |
| Advisory and transaction fees from related parties, net | $ | 4,736 |
| | $ | 4,141 |
| | $ | 399 |
| | $ | 9,276 |
|
| Management fees from related parties | 71,876 |
| | 141,706 |
| | 13,176 |
| | 226,758 |
|
| Carried interest income from related parties: | | | | | | | |
Unrealized gains (losses)(1) | (167,364 | ) | | (15,056 | ) | | 3,334 |
| | (179,086 | ) |
| Realized gains | 102,138 |
| | 22,331 |
| | 46 |
| | 124,515 |
|
Total Revenues(2) | 11,386 |
| | 153,122 |
| | 16,955 |
| | 181,463 |
|
| Expenses: | | | | | | |
|
|
| Compensation and benefits: | | | | | | |
|
|
| Salary, bonus and benefits | 32,957 |
| | 52,647 |
| | 8,506 |
| | 94,110 |
|
| Equity-based compensation | 6,974 |
| | 6,896 |
| | 1,068 |
| | 14,938 |
|
| Profit sharing expense | (26,044 | ) | | 12,739 |
| | 1,312 |
| | (11,993 | ) |
| Total compensation and benefits | 13,887 |
| | 72,282 |
| | 10,886 |
| | 97,055 |
|
| Other expenses | 17,326 |
| | 31,333 |
| | 5,753 |
| | 54,412 |
|
Total Expenses(2) | 31,213 |
| | 103,615 |
| | 16,639 |
| | 151,467 |
|
| Other Income: | | | |
| | | | |
| Net interest expense | (2,425 | ) | | (3,003 | ) | | (759 | ) | | (6,187 | ) |
| Net gains from investment activities | 5,904 |
| | 75,340 |
| | — |
| | 81,244 |
|
| Income (loss) from equity method investments | 3,827 |
| | (1,949 | ) | | 1,147 |
| | 3,025 |
|
| Other income (loss), net | (43 | ) | | (148 | ) | | 4 |
| | (187 | ) |
Total Other Income(2) | 7,263 |
| | 70,240 |
| | 392 |
| | 77,895 |
|
| Non-Controlling Interests | — |
| | (2,697 | ) | | — |
| | (2,697 | ) |
Economic Income (Loss)(2) | $ | (12,564 | ) | | $ | 117,050 |
| | $ | 708 |
| | $ | 105,194 |
|
|
| | | | | | | |
| | As of
September 30, 2017 | | As of
December 31, 2016 |
| Unamortized deferred equity-based compensation | $ | 90,289 |
| | $ | 42,619 |
|
| Liabilities for restricted share awards expected to be granted | 80,283 |
| | 40,472 |
|
|
| | | | | | | | | | | | | | | |
| | For the Three Months Ended September 30, 2016 |
| | Private Equity Segment | | Credit Segment | | Real Assets Segment | | Total Reportable Segments |
| Revenues: | | | | | | | |
| Management fees from related parties | $ | 91,545 |
| | $ | 151,386 |
| | $ | 15,554 |
| | $ | 258,485 |
|
| Advisory and transaction fees from related parties, net | 26,601 |
| | 2,612 |
| | 1,038 |
| | 30,251 |
|
| Carried interest income from related parties: | | | | | | | |
Unrealized(1) | 75,019 |
| | 91,502 |
| | 963 |
| | 167,484 |
|
| Realized | 9,844 |
| | 20,500 |
| | 5,499 |
| | 35,843 |
|
| Total carried interest income from related parties | 84,863 |
| | 112,002 |
| | 6,462 |
| | 203,327 |
|
Total Revenues(2) | 203,009 |
| | 266,000 |
| | 23,054 |
| | 492,063 |
|
| Expenses: | | | | | | | |
| Compensation and benefits: | | | | | | | |
| Salary, bonus and benefits | 32,532 |
| | 45,143 |
| | 9,129 |
| | 86,804 |
|
| Equity-based compensation | 6,645 |
| | 8,834 |
| | 675 |
| | 16,154 |
|
| Profit sharing expense: | | | | | | | |
| Unrealized | 19,234 |
| | 36,809 |
| | 432 |
| | 56,475 |
|
| Realized | 7,266 |
| | 8,988 |
| | 4,062 |
| | 20,316 |
|
| Total profit sharing expense | 26,500 |
| | 45,797 |
| | 4,494 |
| | 76,791 |
|
| Total compensation and benefits | 65,677 |
| | 99,774 |
| | 14,298 |
| | 179,749 |
|
| Non-compensation expenses: | | | | | | | |
| General, administrative and other | 18,118 |
| | 29,161 |
| | 4,674 |
| | 51,953 |
|
| Placement fees | 330 |
| | 723 |
| | — |
| | 1,053 |
|
| Total non-compensation expenses | 18,448 |
| | 29,884 |
| | 4,674 |
| | 53,006 |
|
Total Expenses(2) | 84,125 |
| | 129,658 |
| | 18,972 |
| | 232,755 |
|
| Other Income (Loss): | | | |
| | | | |
| Income from equity method investments | 14,384 |
| | 8,036 |
| | 499 |
| | 22,919 |
|
| Net gains from investment activities | 1,191 |
| | 16,171 |
| | — |
| | 17,362 |
|
| Net interest loss | (4,188 | ) | | (6,172 | ) | | (1,168 | ) | | (11,528 | ) |
| Other income (loss), net | 103 |
| | (4,977 | ) | | (29 | ) | | (4,903 | ) |
Total Other Income (Loss)(2) | 11,490 |
| | 13,058 |
| | (698 | ) | | 23,850 |
|
| Non-Controlling Interests | — |
| | (510 | ) | | — |
| | (510 | ) |
Economic Income(2) | 130,374 |
| | 148,890 |
| | 3,384 |
| | 282,648 |
|
| |
| (1) | Included in unrealized carried interest gains (losses)income from related parties for the three months ended September 30, 20152016 was a reversal of previously realized carried interest income due to the general partner obligation to return previously distributed carried interest income. See note 1213 for further detaildetails regarding the general partner obligation. |
| |
| (2) | Refer below for a reconciliation of total revenues, total expenses and other income for Apollo’s total reportable segments to total consolidated revenues, total consolidated expenses and total consolidated other income (loss).income. |
APOLLO GLOBAL MANAGEMENT, LLC
NOTES TO CONDENSED CONSOLIDATED
FINANCIAL STATEMENTS
(dollars in thousands, except share data, except where noted)
The following table reconciles total consolidated revenues to total revenues for Apollo’s reportable segments to total consolidated revenues for the three months ended September 30, 20162017 and 2015:2016:
| | | | For the Three Months Ended September 30, | For the Three Months Ended September 30, |
| | 2016 | | 2015 | 2017 | | 2016 |
| Total Reportable Segments Revenues | $ | 492,063 |
| | $ | 181,463 |
| |
| Total Consolidated Revenues | | $ | 664,232 |
| | $ | 503,731 |
|
Equity awards granted by unconsolidated related parties and reimbursable expenses(1) | 18,217 |
| | 14,272 |
| (19,832 | ) | | (18,217 | ) |
Adjustments related to consolidated funds and VIEs(1) | (937 | ) | | (945 | ) | 817 |
| | 937 |
|
Other(1) | (5,612 | ) | | (1,522 | ) | — |
| | 5,612 |
|
| Total Consolidated Revenues | $ | 503,731 |
| | $ | 193,268 |
| |
| Total Reportable Segments Revenues | | $ | 645,217 |
| | $ | 492,063 |
|
| |
| (1) | Represents advisory fees, management fees and carried interest income earned from consolidated VIEs which are eliminated in consolidation. Includes non-cash revenues related to equity awards granted by unconsolidated related parties to employees of the Company and certain compensation and administrative related expense reimbursements. |
The following table reconciles total consolidated expenses to total expenses for Apollo’s reportable segments to total consolidated expenses for the three months ended September 30, 20162017 and 2015:2016:
| | | | For the Three Months Ended September 30, | For the Three Months Ended September 30, |
| | 2016 | | 2015 | 2017 | | 2016 |
| Total Reportable Segments Expenses | $ | 232,755 |
| | $ | 151,467 |
| |
| Total Consolidated Expenses | | $ | 357,483 |
| | $ | 282,257 |
|
Equity awards granted by unconsolidated related parties and reimbursable expenses(1) | 19,688 |
| | 14,544 |
| (19,832 | ) | | (19,688 | ) |
Transaction-related compensation charges(1) | 14,276 |
| | (6,686 | ) | (7,543 | ) | | (14,276 | ) |
| Reclassification of interest expenses | 12,832 |
| | 7,529 |
| (13,302 | ) | | (12,832 | ) |
Amortization of transaction-related intangibles(1) | 2,212 |
| | 8,570 |
| (971 | ) | | (2,212 | ) |
Other(1) | 494 |
| | (513 | ) | — |
| | (494 | ) |
| Total Consolidated Expenses | $ | 282,257 |
| | $ | 174,911 |
| |
| Total Reportable Segments Expenses | | $ | 315,835 |
| | $ | 232,755 |
|
| |
| (1) | Represents the addition of expenses of consolidated funds and VIEs, transaction-related charges, non-cash expenses related to equity awards granted by unconsolidated related parties to employees of the Company and certain compensation and administrative expenses. Transaction-related charges include equity-based compensation charges, the amortization of intangible assets, contingent consideration and certain other charges associated with acquisitions. |
The following table reconciles total consolidated other income to total other income for Apollo’s reportable segments to total consolidated other income for the three months ended September 30, 20162017 and 2015:2016:
| | | | For the Three Months Ended September 30, | For the Three Months Ended September 30, |
| | 2016 | | 2015 | 2017 | | 2016 |
| Total Reportable Segments Other Income | $ | 23,850 |
| | $ | 77,895 |
| |
| Non-Controlling Interests | (510 | ) | | (2,697 | ) | |
| Total other income, net | 23,340 |
| | 75,198 |
| |
| Total Consolidated Other Income | | $ | 144,156 |
| | $ | 42,911 |
|
| Reclassification of interest expense | 12,832 |
| | 7,529 |
| (13,302 | ) | | (12,832 | ) |
Adjustments related to consolidated funds and VIEs(1) | 533 |
| | 8 |
| (227 | ) | | (533 | ) |
| Other | 6,206 |
| | 2,058 |
| 113 |
| | (5,696 | ) |
| Total Consolidated Other Income | $ | 42,911 |
| | $ | 84,793 |
| |
| Total Reportable Segments Other Income | | $ | 130,740 |
| | $ | 23,850 |
|
| |
| (1) | Represents the addition of other income of consolidated funds and VIEs. |
APOLLO GLOBAL MANAGEMENT, LLC
NOTES TO CONDENSED CONSOLIDATED
FINANCIAL STATEMENTS
(dollars in thousands, except share data, except where noted)
The following table presents the reconciliation of Economic Income to income before income tax provision reported in the condensed consolidated statementstatements of operations to Economic Income for the three months ended September 30, 20162017 and 2015:2016:
|
| | | | | | | |
| | For the Three Months Ended September 30, |
| | 2017 | | 2016 |
| Income before income tax provision | $ | 450,905 |
| | $ | 264,385 |
|
| Adjustments: | | | |
| Net (income) loss attributable to Non-Controlling Interests in consolidated entities | (1,048 | ) | | 222 |
|
Transaction-related charges, net(1) | 8,514 |
| | 18,041 |
|
| Total consolidation adjustments and other | 7,466 |
| | 18,263 |
|
| Economic Income | $ | 458,371 |
| | $ | 282,648 |
|
| |
| (1) | Transaction-related charges include equity-based compensation charges, the amortization of intangible assets, contingent consideration and certain other charges associated with acquisitions. Equity-based compensation adjustment includes non-cash revenues and expenses related to equity awards granted by unconsolidated related parties to employees of the Company. |
APOLLO GLOBAL MANAGEMENT, LLC
NOTES TO CONDENSED CONSOLIDATED
FINANCIAL STATEMENTS
(dollars in thousands, except share data, except where noted)
The following tables present financial data for Apollo’s reportable segments as of and for the nine months ended September 30, 2017 and 2016. Prior period financial data has been updated to conform to the current presentation.
|
| | | | | | | |
| | For the Three Months Ended September 30, |
| | 2016 | | 2015 |
| Economic Income | $ | 282,648 |
| | $ | 105,194 |
|
| Adjustments: | | | |
| Net income (loss) attributable to Non-Controlling Interests in consolidated entities and appropriated partners’ capital | (222 | ) | | 161 |
|
Transaction-related charges(1) | (18,041 | ) | | (2,205 | ) |
| Total consolidation adjustments and other | (18,263 | ) |
| (2,044 | ) |
| Income before income tax provision | $ | 264,385 |
| | $ | 103,150 |
|
|
| | | | | | | | | | | | | | | |
| | As of and for the Nine Months Ended September 30, 2017 |
| | Private Equity Segment | | Credit Segment | | Real Assets Segment | | Total Reportable Segments |
| Revenues: | | | | | | | |
| Management fees from related parties | $ | 230,752 |
| | $ | 516,083 |
| | $ | 54,560 |
| | $ | 801,395 |
|
| Advisory and transaction fees from related parties, net | 41,646 |
| | 10,484 |
| | 2,775 |
| | 54,905 |
|
| Carried interest income (loss) from related parties: | | | | | | | |
Unrealized(1) | 351,836 |
| | 37,422 |
| | (1,639 | ) | | 387,619 |
|
| Realized | 313,817 |
| | 120,186 |
| | 12,224 |
| | 446,227 |
|
| Total carried interest income from related parties | 665,653 |
| | 157,608 |
| | 10,585 |
| | 833,846 |
|
Total Revenues(2) | 938,051 |
| | 684,175 |
| | 67,920 |
| | 1,690,146 |
|
| Expenses: | | | | | | | |
| Compensation and benefits: | | | | | | | |
| Salary, bonus and benefits | 93,230 |
| | 173,153 |
| | 27,905 |
| | 294,288 |
|
| Equity-based compensation | 21,134 |
| | 28,255 |
| | 1,980 |
| | 51,369 |
|
| Profit sharing expense: | | | | | | | |
| Unrealized | 117,025 |
| | 17,408 |
| | (2,848 | ) | | 131,585 |
|
| Realized | 145,783 |
| | 51,168 |
| | 6,528 |
| | 203,479 |
|
| Realized: Equity-based | 1,270 |
| | 1,387 |
| | — |
| | 2,657 |
|
| Total profit sharing expense | 264,078 |
| | 69,963 |
| | 3,680 |
| | 337,721 |
|
| Total compensation and benefits | 378,442 |
| | 271,371 |
| | 33,565 |
| | 683,378 |
|
| Non-compensation expenses: | | | | | | | |
| General, administrative and other | 53,676 |
| | 99,559 |
| | 15,299 |
| | 168,534 |
|
| Placement fees | 3,732 |
| | 8,828 |
| | — |
| | 12,560 |
|
| Total non-compensation expenses | 57,408 |
| | 108,387 |
| | 15,299 |
| | 181,094 |
|
Total Expenses(2) | 435,850 |
| | 379,758 |
| | 48,864 |
| | 864,472 |
|
| Other Income: | | | | | | | |
| Income from equity method investments | 81,951 |
| | 20,561 |
| | 1,935 |
| | 104,447 |
|
| Net gains from investment activities | 11,255 |
| | 91,365 |
| | — |
| | 102,620 |
|
| Net interest loss | (12,952 | ) | | (18,978 | ) | | (3,634 | ) | | (35,564 | ) |
| Other income, net | 25,915 |
| | 16,888 |
| | 2,347 |
| | 45,150 |
|
Total Other Income(2) | 106,169 |
| | 109,836 |
| | 648 |
| | 216,653 |
|
| Non-Controlling Interests | — |
| | (3,244 | ) | | — |
| | (3,244 | ) |
Economic Income(2) | $ | 608,370 |
| | $ | 411,009 |
| | $ | 19,704 |
| | $ | 1,039,083 |
|
Total Assets(2) | $ | 2,660,333 |
| | $ | 2,772,296 |
| | $ | 226,273 |
| | $ | 5,658,902 |
|
| |
| (1) | Included in unrealized carried interest income (loss) from related parties for the nine months ended September 30, 2017 was a reversal of previously realized carried interest income due to the general partner obligation to return previously distributed carried interest income. See note 13 for further details regarding the general partner obligation. |
| |
| (2) | Refer below for a reconciliation of total revenues, total expenses, other income and total assets for Apollo’s total reportable segments to total consolidated revenues, total consolidated expenses, total consolidated other income (loss) and total assets. |
APOLLO GLOBAL MANAGEMENT, LLC
NOTES TO CONDENSED CONSOLIDATED
FINANCIAL STATEMENTS
(dollars in thousands, except share data, except where noted)
|
| | | | | | | | | | | | | | | |
| | For the Nine Months Ended September 30, 2016 |
| | Private Equity Segment | | Credit Segment | | Real Assets Segment | | Total Reportable Segments |
| Revenues: | | | | | | | |
| Management fees from related parties | $ | 242,981 |
| | $ | 445,149 |
| | $ | 42,921 |
| | $ | 731,051 |
|
| Advisory and transaction fees from related parties, net | 87,615 |
| | 10,058 |
| | 5,476 |
| | 103,149 |
|
| Carried interest income (loss) from related parties: | | | | | | | |
Unrealized(1) | 136,529 |
| | 150,720 |
| | (4,151 | ) | | 283,098 |
|
| Realized | 10,110 |
| | 105,698 |
| | 11,938 |
| | 127,746 |
|
| Total carried interest income from related parties | 146,639 |
| | 256,418 |
| | 7,787 |
| | 410,844 |
|
Total Revenues(2) | 477,235 |
| | 711,625 |
| | 56,184 |
| | 1,245,044 |
|
| Expenses: | | | | | | | |
| Compensation and benefits: | | | | | | | |
| Salary, bonus and benefits | 96,170 |
| | 151,464 |
| | 26,062 |
| | 273,696 |
|
| Equity-based compensation | 20,795 |
| | 25,694 |
| | 2,107 |
| | 48,596 |
|
| Profit sharing expense: | | | | | | | |
| Unrealized | 29,403 |
| | 61,626 |
| | (1,400 | ) | | 89,629 |
|
| Realized | 7,398 |
| | 62,764 |
| | 8,240 |
| | 78,402 |
|
| Total profit sharing expense | 36,801 |
| | 124,390 |
| | 6,840 |
| | 168,031 |
|
| Total compensation and benefits | 153,766 |
| | 301,548 |
| | 35,009 |
| | 490,323 |
|
| Non-compensation expenses: | | | | | | | |
| General, administrative and other | 54,400 |
| | 95,193 |
| | 16,239 |
| | 165,832 |
|
| Placement fees | 2,409 |
| | 2,113 |
| | 21 |
| | 4,543 |
|
| Total non-compensation expenses | 56,809 |
| | 97,306 |
| | 16,260 |
| | 170,375 |
|
Total Expenses(2) | 210,575 |
| | 398,854 |
| | 51,269 |
| | 660,698 |
|
| Other Income (Loss): | | | |
| | | | |
| Income from equity method investments | 40,311 |
| | 21,824 |
| | 1,631 |
| | 63,766 |
|
| Net gains from investment activities | 3,542 |
| | 45,819 |
| | — |
| | 49,361 |
|
| Net interest loss | (9,868 | ) | | (14,542 | ) | | (2,895 | ) | | (27,305 | ) |
| Other income (loss), net | 320 |
| | (5,512 | ) | | (14 | ) | | (5,206 | ) |
Total Other Income (Loss)(2) | 34,305 |
| | 47,589 |
| | (1,278 | ) | | 80,616 |
|
| Non-Controlling Interests | — |
| | (5,070 | ) | | — |
| | (5,070 | ) |
Economic Income(2) | $ | 300,965 |
| | $ | 355,290 |
| | $ | 3,637 |
| | $ | 659,892 |
|
| |
| (1) | Included in unrealized carried interest income (loss) from related parties for the nine months ended September 30, 2016 was a reversal of previously realized carried interest income due to the general partner obligation to return previously distributed carried interest income. See note 13 for further details regarding the general partner obligation. |
| |
| (2) | Refer below for a reconciliation of total revenues, total expenses and other income for Apollo’s total reportable segments to total consolidated revenues, total consolidated expenses and total consolidated other income (loss). |
APOLLO GLOBAL MANAGEMENT, LLC
NOTES TO CONDENSED CONSOLIDATED
FINANCIAL STATEMENTS
(dollars in thousands, except share data, except where noted)
The following table reconciles total consolidated revenues to total revenues for Apollo’s reportable segments for the nine months ended September 30, 2017 and 2016:
|
| | | | | | | |
| | For the Nine Months Ended September 30, |
| | 2017 | | 2016 |
| Total Consolidated Revenues | $ | 1,740,655 |
| | $ | 1,285,004 |
|
Equity awards granted by unconsolidated related parties and reimbursable expenses(1) | (53,234 | ) | | (51,275 | ) |
Adjustments related to consolidated funds and VIEs(1) | 2,725 |
| | 2,800 |
|
Other(1) | — |
| | 8,515 |
|
| Total Reportable Segments Revenues | $ | 1,690,146 |
| | $ | 1,245,044 |
|
| |
| (1) | Represents advisory fees, management fees and carried interest income earned from consolidated VIEs which are eliminated in consolidation. Includes non-cash revenues related to equity awards granted by unconsolidated related parties to employees of the Company and certain compensation and administrative related expense reimbursements. |
The following table reconciles total consolidated expenses to total expenses for Apollo’s reportable segments for the nine months ended September 30, 2017 and 2016:
|
| | | | | | | |
| | For the Nine Months Ended September 30, |
| | 2017 | | 2016 |
| Total Consolidated Expenses | $ | 967,997 |
| | $ | 767,554 |
|
Equity awards granted by unconsolidated related parties and reimbursable expenses(1) | (53,234 | ) | | (52,980 | ) |
Transaction-related compensation charges(1) | (6,409 | ) | | (16,799 | ) |
| Reclassification of interest expenses | (39,496 | ) | | (30,505 | ) |
Amortization of transaction-related intangibles(1) | (4,381 | ) | | (6,608 | ) |
Other(1) | (5 | ) | | 36 |
|
| Total Reportable Segments Expenses | $ | 864,472 |
| | $ | 660,698 |
|
| |
| (1) | Represents the addition of expenses of consolidated funds and VIEs, transaction-related charges, non-cash expenses related to equity awards granted by unconsolidated related parties to employees of the Company and certain compensation and administrative expenses. Transaction-related charges include equity-based compensation charges, the amortization of intangible assets, contingent consideration and certain other charges associated with acquisitions. |
The following table reconciles total consolidated other income to total other income for Apollo’s reportable segments for the nine months ended September 30, 2017 and 2016:
|
| | | | | | | |
| | For the Nine Months Ended September 30, |
| | 2017 | | 2016 |
| Total Consolidated Other Income | $ | 264,603 |
| | $ | 121,018 |
|
| Reclassification of interest expense | (39,496 | ) | | (30,505 | ) |
Adjustments related to consolidated funds and VIEs(1) | (8,433 | ) | | (2,077 | ) |
| Other | (21 | ) | | (7,820 | ) |
| Total Reportable Segments Other Income | $ | 216,653 |
| | $ | 80,616 |
|
| |
| (1) | Represents the addition of other income of consolidated funds and VIEs. |
APOLLO GLOBAL MANAGEMENT, LLC
NOTES TO CONDENSED CONSOLIDATED
FINANCIAL STATEMENTS
(dollars in thousands, except share data, except where noted)
The following table presents the reconciliation of income before income tax provision reported in the condensed consolidated statements of operations to Economic Income for the nine months ended September 30, 2017 and 2016:
|
| | | | | | | |
| | For the Nine Months Ended September 30, |
| | 2017 | | 2016 |
| Income before income tax provision | $ | 1,037,261 |
| | $ | 638,468 |
|
| Adjustments: | | | |
| Net income attributable to Non-Controlling Interests in consolidated entities | (8,967 | ) | | (3,891 | ) |
Transaction-related charges, net(1) | 10,789 |
| | 25,315 |
|
| Total consolidation adjustments and other | 1,822 |
| | 21,424 |
|
| Economic Income | $ | 1,039,083 |
| | $ | 659,892 |
|
| |
| (1) | Transaction-related charges include equity-based compensation charges, the amortization of intangible assets, contingent consideration and certain other charges associated with acquisitions. Equity-based compensation adjustment includes non-cash revenues and expenses related to equity awards granted by unconsolidated related parties to employees of the Company. |
The following table presents the reconciliation of Apollo’s total reportable segment assets to total assets as of September 30, 2017 and December 31, 2016:
| | | | As of
September 30, 2016 | As of
September 30, 2017 | | As of
December 31, 2016 |
| Total reportable segment assets | $ | 4,509,002 |
| $ | 5,658,902 |
| | $ | 4,694,643 |
|
Adjustments(1) | 981,213 |
| 1,201,452 |
| | 934,910 |
|
| Total assets | $ | 5,490,215 |
| $ | 6,860,354 |
| | $ | 5,629,553 |
|
| |
| (1) | Represents the addition of assets of consolidated funds and VIEs and consolidation elimination adjustments. |
APOLLO GLOBAL MANAGEMENT, LLC
NOTES TO CONDENSED CONSOLIDATED
FINANCIAL STATEMENTS
(dollars in thousands, except share data, except where noted)
The following table presents financial data for Apollo’s reportable segments as of and for the nine months ended September 30, 2016 and 2015:
|
| | | | | | | | | | | | | | | |
| | As of and for the Nine Months Ended September 30, 2016 |
| | Private Equity Segment | | Credit Segment | | Real Estate Segment | | Total Reportable Segments |
| Revenues: | | | | | | | |
| Advisory and transaction fees from related parties, net | $ | 87,615 |
| | $ | 10,058 |
| | $ | 5,476 |
| | $ | 103,149 |
|
| Management fees from related parties | 242,981 |
| | 445,149 |
| | 42,921 |
| | 731,051 |
|
| Carried interest income (loss) from related parties: | | | | | | | |
Unrealized gains (losses)(1) | 136,529 |
| | 150,720 |
| | (4,151 | ) | | 283,098 |
|
| Realized gains | 10,110 |
| | 105,698 |
| | 11,938 |
| | 127,746 |
|
Total Revenues(2) | 477,235 |
| | 711,625 |
| | 56,184 |
| | 1,245,044 |
|
| Expenses: | | | | | | | |
| Compensation and benefits: | | | | | | | |
| Salary, bonus and benefits | 96,170 |
| | 151,464 |
| | 26,062 |
| | 273,696 |
|
| Equity-based compensation | 20,795 |
| | 25,694 |
| | 2,107 |
| | 48,596 |
|
| Profit sharing expense | 36,801 |
| | 124,390 |
| | 6,840 |
| | 168,031 |
|
| Total compensation and benefits | 153,766 |
| | 301,548 |
| | 35,009 |
| | 490,323 |
|
| Other expenses | 56,809 |
| | 97,306 |
| | 16,260 |
| | 170,375 |
|
Total Expenses(2) | 210,575 |
| | 398,854 |
| | 51,269 |
| | 660,698 |
|
| Other Income (Loss): | | | | | | | |
| Net interest expense | (9,868 | ) | | (14,542 | ) | | (2,895 | ) | | (27,305 | ) |
| Net gains from investment activities | 3,542 |
| | 45,819 |
| | — |
| | 49,361 |
|
| Income from equity method investments | 40,311 |
| | 21,824 |
| | 1,631 |
| | 63,766 |
|
| Other income (loss), net | 320 |
| | (5,512 | ) | | (14 | ) | | (5,206 | ) |
Total Other Income (Loss)(2) | 34,305 |
| | 47,589 |
| | (1,278 | ) | | 80,616 |
|
| Non-Controlling Interests | — |
| | (5,070 | ) | | — |
| | (5,070 | ) |
Economic Income(2) | $ | 300,965 |
| | $ | 355,290 |
| | $ | 3,637 |
| | $ | 659,892 |
|
Total Assets(2) | $ | 1,840,504 |
| | $ | 2,480,601 |
| | $ | 187,897 |
| | $ | 4,509,002 |
|
| |
(1) | Included in unrealized carried interest gains (losses) from related parties for the nine months ended September 30, 2016 was a reversal of previously realized carried interest income due to the general partner obligation to return previously distributed carried interest income. See note 12 for further details regarding the general partner obligation. |
| |
(2) | Refer below for a reconciliation of total revenues, total expenses, other income and total assets for Apollo’s total reportable segments to total consolidated revenues, total consolidated expenses, total consolidated other income (loss) and total assets. |
APOLLO GLOBAL MANAGEMENT, LLC
NOTES TO CONDENSED CONSOLIDATED
FINANCIAL STATEMENTS
(dollars in thousands, except share data, except where noted)
|
| | | | | | | | | | | | | | | |
| | For the Nine Months Ended September 30, 2015 |
| | Private
Equity
Segment | | Credit
Segment | | Real
Estate
Segment | | Total
Reportable
Segments |
| Revenues: | | | | | | | |
| Advisory and transaction fees from related parties, net | $ | 17,490 |
| | $ | 13,913 |
| | $ | 2,866 |
| | $ | 34,269 |
|
| Management fees from related parties | 220,742 |
| | 421,790 |
| | 36,212 |
| | 678,744 |
|
| Carried interest income from related parties: | | | | | | | |
Unrealized gains (losses)(1) | (265,147 | ) | | (67,748 | ) | | 3,974 |
| | (328,921 | ) |
| Realized gains | 336,175 |
| | 108,748 |
| | 3,712 |
| | 448,635 |
|
Total Revenues(2) | 309,260 |
| | 476,703 |
| | 46,764 |
| | 832,727 |
|
| Expenses: | | | | | | | |
| Compensation and benefits: | | | | | | | |
| Salary, bonus and benefits | 93,792 |
| | 153,557 |
| | 23,996 |
| | 271,345 |
|
| Equity-based compensation | 23,467 |
| | 18,794 |
| | 3,151 |
| | 45,412 |
|
| Profit sharing expense | 60,796 |
| | 26,853 |
| | 4,062 |
| | 91,711 |
|
| Total compensation and benefits | 178,055 |
| | 199,204 |
| | 31,209 |
| | 408,468 |
|
| Other expenses | 48,973 |
| | 95,514 |
| | 17,242 |
| | 161,729 |
|
Total Expenses(2) | 227,028 |
| | 294,718 |
| | 48,451 |
| | 570,197 |
|
| Other Income: | | | |
| | | | |
| Net interest expense | (7,439 | ) | | (10,107 | ) | | (2,157 | ) | | (19,703 | ) |
| Net gains from investment activities | 5,904 |
| | 100,387 |
| | — |
| | 106,291 |
|
| Income (loss) from equity method investments | 18,588 |
| | (2,654 | ) | | 2,283 |
| | 18,217 |
|
| Other income, net | 2,903 |
| | 1,923 |
| | 1,401 |
| | 6,227 |
|
Total Other Income(2) | 19,956 |
| | 89,549 |
| | 1,527 |
| | 111,032 |
|
| Non-Controlling Interests | — |
| | (8,766 | ) | | — |
| | (8,766 | ) |
Economic Income (Loss)(2) | $ | 102,188 |
| | $ | 262,768 |
| | $ | (160 | ) | | $ | 364,796 |
|
| |
(1) | Included in unrealized carried interest gains from related parties for the nine months ended September 30, 2015 was a reversal of previously realized carried interest income due to the general partner obligation to return previously distributed carried interest income. See note 12 for further detail regarding the general partner obligation. |
| |
(2) | Refer below for a reconciliation of total revenues, total expenses and other income for Apollo’s total reportable segments to total consolidated revenues, total consolidated expenses and total consolidated other income (loss). |
APOLLO GLOBAL MANAGEMENT, LLC
NOTES TO CONDENSED CONSOLIDATED
FINANCIAL STATEMENTS
(dollars in thousands, except share data, except where noted)
The following table reconciles total revenues for Apollo’s reportable segments to total consolidated revenues for the nine months ended September 30, 2016 and 2015:
|
| | | | | | | |
| | For the Nine Months Ended September 30, |
| | 2016 | | 2015 |
| Total Reportable Segments Revenues | $ | 1,245,044 |
| | $ | 832,727 |
|
Equity awards granted by unconsolidated related parties and reimbursable expenses(1) | 51,275 |
| | 22,559 |
|
Adjustments related to consolidated funds and VIEs(1) | (2,800 | ) | | (2,768 | ) |
Other(1) | (8,515 | ) | | (4,499 | ) |
| Total Consolidated Revenues | $ | 1,285,004 |
| | $ | 848,019 |
|
| |
(1) | Represents advisory fees, management fees and carried interest income earned from consolidated VIEs which are eliminated in consolidation. Includes non-cash revenues related to equity awards granted by unconsolidated related parties to employees of the Company and certain compensation and administrative related expense reimbursements. |
The following table reconciles total expenses for Apollo’s reportable segments to total consolidated expenses for the nine months ended September 30, 2016 and 2015:
|
| | | | | | | |
| | For the Nine Months Ended September 30, |
| | 2016 | | 2015 |
| Total Reportable Segments Expenses | $ | 660,698 |
| | $ | 570,197 |
|
Equity awards granted by unconsolidated related parties and reimbursable expenses(1) | 52,980 |
| | 23,481 |
|
Transaction-related compensation charges(1) | 16,799 |
| | 2,156 |
|
| Reclassification of interest expenses | 30,505 |
| | 22,454 |
|
Amortization of transaction-related intangibles(1) | 6,608 |
| | 25,440 |
|
Other(1) | (36 | ) | | (282 | ) |
| Total Consolidated Expenses | $ | 767,554 |
| | $ | 643,446 |
|
| |
(1) | Represents the addition of expenses of consolidated funds and VIEs, transaction-related charges, non-cash expenses related to equity awards granted by unconsolidated related parties to employees of the Company and certain compensation and administrative expenses. Transaction-related charges include equity-based compensation charges, the amortization of intangible assets, contingent consideration and certain other charges associated with acquisitions. |
The following table reconciles total other income for Apollo’s reportable segments to total consolidated other income for the nine months ended September 30, 2016 and 2015:
|
| | | | | | | |
| | For the Nine Months Ended September 30, |
| | 2016 | | 2015 |
| Total Reportable Segments Other Income | $ | 80,616 |
| | $ | 111,032 |
|
| Non-Controlling Interests | (5,070 | ) | | (8,766 | ) |
| Total other income, net | 75,546 |
| | 102,266 |
|
| Reclassification of interest expense | 30,505 |
| | 22,454 |
|
Adjustments related to consolidated funds and VIEs(1) | 2,077 |
| | 6,383 |
|
| Other | 12,890 |
| | 11,652 |
|
| Total Consolidated Other Income | $ | 121,018 |
| | $ | 142,755 |
|
| |
(1) | Represents the addition of other income of consolidated funds and VIEs. |
APOLLO GLOBAL MANAGEMENT, LLC
NOTES TO CONDENSED CONSOLIDATED
FINANCIAL STATEMENTS
(dollars in thousands, except share data, except where noted)
The following table presents the reconciliation of Economic Income to income before income tax provision reported in the condensed consolidated statements of operations for the nine months ended September 30, 2016 and 2015:
|
| | | | | | | |
| | For the Nine Months Ended September 30, |
| | 2016 | | 2015 |
| Economic Income | $ | 659,892 |
| | $ | 364,796 |
|
| Adjustments: | | | |
| Net income attributable to Non-Controlling Interests in consolidated entities and appropriated partners’ capital | 3,891 |
| | 11,218 |
|
Transaction-related charges(1) | (25,315 | ) | | (28,686 | ) |
| Total consolidation adjustments and other | (21,424 | ) | | (17,468 | ) |
| Income before income tax provision | $ | 638,468 |
| | $ | 347,328 |
|
| |
(1) | Transaction-related charges include equity-based compensation charges, the amortization of intangible assets, contingent consideration and certain other charges associated with acquisitions. Equity-based compensation adjustment includes non-cash revenues and expenses related to equity awards granted by unconsolidated related parties to employees of the Company. |
15.16. SUBSEQUENT EVENTS
On October 28, 2016,November 1, 2017, the Company declared a cash distribution of $0.35$0.39 per Class A share, which will be paid on November 30, 20162017 to holders of record on November 21, 2016.2017.
On November 1, 2016,2017, the Company issued 376,692 Class A shares in settlementdeclared a cash distribution of vested RSUs. These issuances caused the Company’s ownership interest in the Apollo Operating Group$0.398438 per Preferred share, which will be paid on December 15, 2017 to increase from 46.1% to 46.2%.holders of record on December 1, 2017.
ITEM 1A. UNAUDITED SUPPLEMENTAL PRESENTATION OF STATEMENTS
OF FINANCIAL CONDITION
APOLLO GLOBAL MANAGEMENT, LLC
CONSOLIDATING STATEMENTS OF FINANCIAL CONDITION (Unaudited)
(dollars in thousands, except share data) |
| | | | | | | | | | | | | | | |
| | As of September 30, 2017 |
| | Apollo Global Management, LLC and Consolidated Subsidiaries | | Consolidated Funds and VIEs | | Eliminations | | Consolidated |
| Assets: | | | | | | | |
| Cash and cash equivalents | $ | 930,848 |
| | $ | — |
| | $ | — |
| | $ | 930,848 |
|
| Cash and cash equivalents held at consolidated funds | — |
| | 10,195 |
| | — |
| | 10,195 |
|
| Restricted cash | 4,165 |
| | — |
| | — |
| | 4,165 |
|
| U.S. Treasury securities, at fair value | 198,900 |
| | — |
| | — |
| | 198,900 |
|
| Investments | 1,792,228 |
| | 1,978 |
| | (86,142 | ) | | 1,708,064 |
|
| Assets of consolidated variable interest entities: | | | | | | | |
| Cash and cash equivalents | — |
| | 44,226 |
| | — |
| | 44,226 |
|
| Investments, at fair value | — |
| | 1,170,867 |
| | (317 | ) | | 1,170,550 |
|
| Other assets | — |
| | 63,723 |
| | — |
| | 63,723 |
|
| Carried interest receivable | 1,580,158 |
| | — |
| | (2,174 | ) | | 1,577,984 |
|
| Due from related parties | 288,154 |
| | — |
| | (802 | ) | | 287,352 |
|
| Deferred tax assets | 591,754 |
| | — |
| | — |
| | 591,754 |
|
| Other assets | 164,690 |
| | 14 |
| | (116 | ) | | 164,588 |
|
| Goodwill | 88,852 |
| | — |
| | — |
| | 88,852 |
|
| Intangible assets, net | 19,153 |
| | — |
| | — |
| | 19,153 |
|
| Total Assets | $ | 5,658,902 |
| | $ | 1,291,003 |
| | $ | (89,551 | ) | | $ | 6,860,354 |
|
| Liabilities and Shareholders’ Equity | | | | | | | |
| Liabilities: | | | | | | | |
| Accounts payable and accrued expenses | $ | 79,062 |
| | $ | — |
| | $ | — |
| | $ | 79,062 |
|
| Accrued compensation and benefits | 144,664 |
| | — |
| | — |
| | 144,664 |
|
| Deferred revenue | 155,081 |
| | — |
| | — |
| | 155,081 |
|
| Due to related parties | 643,401 |
| | — |
| | — |
| | 643,401 |
|
| Profit sharing payable | 710,873 |
| | — |
| | — |
| | 710,873 |
|
| Debt | 1,361,044 |
| | — |
| | — |
| | 1,361,044 |
|
| Liabilities of consolidated variable interest entities: | | | | | | | |
| Debt, at fair value | — |
| | 1,019,270 |
| | (46,638 | ) | | 972,632 |
|
| Other liabilities | — |
| | 85,520 |
| | (117 | ) | | 85,403 |
|
| Due to related parties | — |
| | 2,977 |
| | (2,977 | ) | | — |
|
| Other liabilities | 115,586 |
| | 625 |
| | — |
| | 116,211 |
|
| Total Liabilities | 3,209,711 |
| | 1,108,392 |
| | (49,732 | ) | | 4,268,371 |
|
| | | | | | | | |
| Shareholders’ Equity: | | | | | | | |
| Apollo Global Management, LLC shareholders’ equity: | | | | | | | |
| Preferred shares | 264,398 |
| | — |
| | — |
| | 264,398 |
|
| Additional paid in capital | 1,627,767 |
| | — |
| | — |
| | 1,627,767 |
|
| Accumulated deficit | (560,616 | ) | | 19,307 |
| | (19,304 | ) | | (560,613 | ) |
| Accumulated other comprehensive loss | (2,234 | ) | | (647 | ) | | 820 |
| | (2,061 | ) |
| Total Apollo Global Management, LLC shareholders’ equity | 1,329,315 |
| | 18,660 |
| | (18,484 | ) | | 1,329,491 |
|
| Non-Controlling Interests in consolidated entities | 7,120 |
| | 163,951 |
| | (21,335 | ) | | 149,736 |
|
| Non-Controlling Interests in Apollo Operating Group | 1,112,756 |
| | — |
| | — |
| | 1,112,756 |
|
| Total Shareholders’ Equity | 2,449,191 |
| | 182,611 |
| | (39,819 | ) | | 2,591,983 |
|
| Total Liabilities and Shareholders’ Equity | $ | 5,658,902 |
| | $ | 1,291,003 |
| | $ | (89,551 | ) | | $ | 6,860,354 |
|
APOLLO GLOBAL MANAGEMENT, LLC
CONSOLIDATING STATEMENTS OF FINANCIAL CONDITION (Unaudited)
(dollars in thousands, except share data)
|
| | | | | | | | | | | | | | | |
| | As of September 30, 2016 |
| | Apollo Global Management, LLC and Consolidated Subsidiaries | | Consolidated Funds and VIEs | | Eliminations | | Consolidated |
| Assets: | | | | | | | |
| Cash and cash equivalents | $ | 926,932 |
| | $ | — |
| | $ | — |
| | $ | 926,932 |
|
| Cash and cash equivalents held at consolidated funds | — |
| | 6,014 |
| | — |
| | 6,014 |
|
| Restricted cash | 4,776 |
| | — |
| | — |
| | 4,776 |
|
| Investments | 1,470,080 |
| | 14,622 |
| | (93,704 | ) | | 1,390,998 |
|
| Assets of consolidated variable interest entities: | | | | | | | |
| Cash and cash equivalents | — |
| | 53,489 |
| | — |
| | 53,489 |
|
| Investments, at fair value | — |
| | 946,836 |
| | (302 | ) | | 946,534 |
|
| Other assets | — |
| | 49,733 |
| | — |
| | 49,733 |
|
| Carried interest receivable | 993,074 |
| | — |
| | (1,259 | ) | | 991,815 |
|
| Due from related parties | 298,455 |
| | — |
| | (736 | ) | | 297,719 |
|
| Deferred tax assets | 596,228 |
| | — |
| | — |
| | 596,228 |
|
| Other assets | 105,912 |
| | 6,653 |
| | (133 | ) | | 112,432 |
|
| Goodwill | 88,852 |
| | — |
| | — |
| | 88,852 |
|
| Intangible assets, net | 24,693 |
| | — |
| | — |
| | 24,693 |
|
| Total Assets | $ | 4,509,002 |
| | $ | 1,077,347 |
| | $ | (96,134 | ) | | $ | 5,490,215 |
|
| Liabilities and Shareholders’ Equity | | | | | | | |
| Liabilities: | | | | | | | |
| Accounts payable and accrued expenses | $ | 116,277 |
| | $ | — |
| | $ | — |
| | $ | 116,277 |
|
| Accrued compensation and benefits | 122,143 |
| | — |
| | — |
| | 122,143 |
|
| Deferred revenue | 204,516 |
| | — |
| | — |
| | 204,516 |
|
| Due to related parties | 661,515 |
| | — |
| | — |
| | 661,515 |
|
| Profit sharing payable | 466,055 |
| | — |
| | — |
| | 466,055 |
|
| Debt | 1,355,994 |
| | — |
| | — |
| | 1,355,994 |
|
| Liabilities of consolidated variable interest entities: | | | | | | | |
| Debt, at fair value | — |
| | 882,884 |
| | (44,180 | ) | | 838,704 |
|
| Other liabilities | — |
| | 54,934 |
| | (133 | ) | | 54,801 |
|
| Due to related parties | — |
| | 1,995 |
| | (1,995 | ) | | — |
|
| Other liabilities | 58,189 |
| | 1,156 |
| | — |
| | 59,345 |
|
| Total Liabilities | 2,984,689 |
| | 940,969 |
| | (46,308 | ) | | 3,879,350 |
|
| | | | | | | | |
| Shareholders’ Equity: | | | | | | | |
| Apollo Global Management, LLC shareholders’ equity: | | | | | | | |
| Additional paid in capital | 1,876,342 |
| | — |
| | — |
| | 1,876,342 |
|
| Accumulated deficit | (1,147,801 | ) | | 28,933 |
| | (28,930 | ) | | (1,147,798 | ) |
| Accumulated other comprehensive income (loss) | (3,733 | ) | | (1,754 | ) | | 37 |
| | (5,450 | ) |
| Total Apollo Global Management, LLC shareholders’ equity | 724,808 |
| | 27,179 |
| | (28,893 | ) | | 723,094 |
|
| Non-Controlling Interests in consolidated entities | 6,234 |
| | 109,199 |
| | (20,933 | ) | | 94,500 |
|
| Non-Controlling Interests in Apollo Operating Group | 793,271 |
| | — |
| | — |
| | 793,271 |
|
| Total Shareholders’ Equity | 1,524,313 |
| | 136,378 |
| | (49,826 | ) | | 1,610,865 |
|
| Total Liabilities and Shareholders’ Equity | $ | 4,509,002 |
| | $ | 1,077,347 |
| | $ | (96,134 | ) | | $ | 5,490,215 |
|
APOLLO GLOBAL MANAGEMENT, LLC
CONSOLIDATING STATEMENTS OF FINANCIAL CONDITION (Unaudited)
(dollars in thousands, except share data)
| | | | As of December 31, 2015 | As of December 31, 2016 |
| | Apollo Global Management, LLC and Consolidated Subsidiaries | | Consolidated Funds and VIEs | | Eliminations | | Consolidated | Apollo Global Management, LLC and Consolidated Subsidiaries | | Consolidated Funds and VIEs | | Eliminations | | Consolidated |
| Assets: | | | | | | | | | | | | | | |
| Cash and cash equivalents | $ | 612,505 |
| | $ | — |
| | $ | — |
| | $ | 612,505 |
| $ | 806,329 |
| | $ | — |
| | $ | — |
| | $ | 806,329 |
|
| Cash and cash equivalents held at consolidated funds | — |
| | 4,817 |
| | — |
| | 4,817 |
| — |
| | 7,335 |
| | — |
| | 7,335 |
|
| Restricted cash | 5,700 |
| | — |
| | — |
| | 5,700 |
| 4,680 |
| | — |
| | — |
| | 4,680 |
|
| Investments | 1,223,407 |
| | 28,547 |
| | (97,205 | ) | | 1,154,749 |
| 1,567,388 |
| | 5,378 |
| | (78,022 | ) | | 1,494,744 |
|
| Assets of consolidated variable interest entities: | | | | | | | | | | | | | | |
| Cash and cash equivalents | — |
| | 56,793 |
| | — |
| | 56,793 |
| — |
| | 41,318 |
| | — |
| | 41,318 |
|
| Investments, at fair value | — |
| | 910,858 |
| | (292 | ) | | 910,566 |
| — |
| | 914,110 |
| | (283 | ) | | 913,827 |
|
| Other assets | — |
| | 63,413 |
| | — |
| | 63,413 |
| — |
| | 46,666 |
| | — |
| | 46,666 |
|
| Carried interest receivable | 643,907 |
| | — |
| | — |
| | 643,907 |
| 1,258,887 |
| | — |
| | (1,782 | ) | | 1,257,105 |
|
| Due from related parties | 248,972 |
| | — |
| | (1,137 | ) | | 247,835 |
| 255,342 |
| | — |
| | (489 | ) | | 254,853 |
|
| Deferred tax assets | 646,207 |
| | — |
| | — |
| | 646,207 |
| 572,263 |
| | — |
| | — |
| | 572,263 |
|
| Other assets | 93,452 |
| | 2,636 |
| | (244 | ) | | 95,844 |
| 118,181 |
| | 768 |
| | (89 | ) | | 118,860 |
|
| Goodwill | 88,852 |
| | — |
| | — |
| | 88,852 |
| 88,852 |
| | — |
| | — |
| | 88,852 |
|
| Intangible assets, net | 28,620 |
| | — |
| | — |
| | 28,620 |
| 22,721 |
| | — |
| | — |
| | 22,721 |
|
| Total Assets | $ | 3,591,622 |
| | $ | 1,067,064 |
| | $ | (98,878 | ) | | $ | 4,559,808 |
| $ | 4,694,643 |
| | $ | 1,015,575 |
| | $ | (80,665 | ) | | $ | 5,629,553 |
|
| Liabilities and Shareholders’ Equity | | | | | | | | | | | | | | |
| Liabilities: | | | | | | | | | | | | | | |
| Accounts payable and accrued expenses | $ | 92,012 |
| | $ | — |
| | $ | — |
| | $ | 92,012 |
| $ | 57,465 |
| | $ | — |
| | $ | — |
| | $ | 57,465 |
|
| Accrued compensation and benefits | 54,836 |
| | — |
| | — |
| | 54,836 |
| 52,754 |
| | — |
| | — |
| | 52,754 |
|
| Deferred revenue | 177,875 |
| | — |
| | — |
| | 177,875 |
| 174,893 |
| | — |
| | — |
| | 174,893 |
|
| Due to related parties | 594,536 |
| | — |
| | — |
| | 594,536 |
| 638,126 |
| | — |
| | — |
| | 638,126 |
|
| Profit sharing payable | 295,674 |
| | — |
| | — |
| | 295,674 |
| 550,148 |
| | — |
| | — |
| | 550,148 |
|
| Debt | 1,025,255 |
| | — |
| | — |
| | 1,025,255 |
| 1,352,447 |
| | — |
| | — |
| | 1,352,447 |
|
| Liabilities of consolidated variable interest entities: | | | | | | | | | | | | | | |
| Debt, at fair value | — |
| | 843,584 |
| | (42,314 | ) | | 801,270 |
| — |
| | 827,854 |
| | (41,309 | ) | | 786,545 |
|
| Other liabilities | — |
| | 86,226 |
| | (244 | ) | | 85,982 |
| — |
| | 68,123 |
| | (89 | ) | | 68,034 |
|
| Due to related parties | — |
| | 1,137 |
| | (1,137 | ) | | — |
| — |
| | 2,271 |
| | (2,271 | ) | | — |
|
| Other liabilities | 38,750 |
| | 4,637 |
| | — |
| | 43,387 |
| 81,568 |
| | 45 |
| | — |
| | 81,613 |
|
| Total Liabilities | 2,278,938 |
| | 935,584 |
| | (43,695 | ) | | 3,170,827 |
| 2,907,401 |
| | 898,293 |
| | (43,669 | ) | | 3,762,025 |
|
| | | | | | | | | | | | | | | |
| Shareholders’ Equity: | | | | | | | | | | | | | | |
| Apollo Global Management, LLC shareholders’ equity: | | | | | | | | | | | | | | |
| Additional paid in capital | 2,005,509 |
| | — |
| | — |
| | 2,005,509 |
| 1,830,025 |
| | — |
| | — |
| | 1,830,025 |
|
| Accumulated deficit | (1,348,386 | ) | | 34,468 |
| | (34,466 | ) | | (1,348,384 | ) | (986,187 | ) | | 16,131 |
| | (16,130 | ) | | (986,186 | ) |
| Accumulated other comprehensive income (loss) | (5,171 | ) | | (2,496 | ) | | 47 |
| | (7,620 | ) | |
| Accumulated other comprehensive loss | | (5,750 | ) | | (3,029 | ) | | 56 |
| | (8,723 | ) |
| Total Apollo Global Management, LLC shareholders’ equity | 651,952 |
| | 31,972 |
| | (34,419 | ) | | 649,505 |
| 838,088 |
| | 13,102 |
| | (16,074 | ) | | 835,116 |
|
| Non-Controlling Interests in consolidated entities | 7,817 |
| | 99,508 |
| | (20,764 | ) | | 86,561 |
| 6,805 |
| | 104,180 |
| | (20,922 | ) | | 90,063 |
|
| Non-Controlling Interests in Apollo Operating Group | 652,915 |
| | — |
| | — |
| | 652,915 |
| 942,349 |
| | — |
| | — |
| | 942,349 |
|
| Total Shareholders’ Equity | 1,312,684 |
| | 131,480 |
| | (55,183 | ) | | 1,388,981 |
| 1,787,242 |
| | 117,282 |
| | (36,996 | ) | | 1,867,528 |
|
| Total Liabilities and Shareholders’ Equity | $ | 3,591,622 |
| | $ | 1,067,064 |
| | $ | (98,878 | ) | | $ | 4,559,808 |
| $ | 4,694,643 |
| | $ | 1,015,575 |
| | $ | (80,665 | ) | | $ | 5,629,553 |
|
| |
| ITEM 2. | MANAGEMENT’S DISCUSSION AND ANALYSIS OF FINANCIAL CONDITION AND RESULTS OF OPERATIONS |
The following discussion should be read in conjunction with Apollo Global Management, LLC’s condensed consolidated financial statements and the related notes included within this Quarterly Report on Form 10-Q. This discussion contains forward-looking statements that are subject to known and unknown risks and uncertainties. Actual results and the timing of events may differ significantly from those expressed or implied in such forward-looking statements due to a number of factors, including those included in the section of this report entitled “Risk Factors” in our Form 10-K for the year ended December 31, 20152016 filed with the SEC on February 29, 201613, 2017 (the “2015“2016 Annual Report”). The highlights listed below have had significant effects on many items within our condensed consolidated financial statements and affect the comparison of the current period’s activity with those of prior periods.
General
Our Businesses
Founded in 1990, Apollo is a leading global alternative investment manager. We are a contrarian, value-oriented investment manager in private equity, credit and real estateassets with significant distressed expertise and a flexible mandate in the majority of our funds which enables our funds to invest opportunistically across a company’s capital structure. We raise, invest and manage funds on behalf of some of the world’s most prominent pension, endowment and sovereign wealth funds as well as other institutional and individual investors. Apollo is led by our Managing Partners, Leon Black, Joshua Harris and Marc Rowan, who have worked together for more than 30 years and lead a team of 9741,024 employees, including 370381 investment professionals, as of September 30, 2016.2017.
Apollo conducts its business primarily in the United States and substantially all of its revenues are generated domestically. These businesses are conducted through the following three reportable segments:
| |
| (i) | Private equity—primarily invests in control equity and related debt instruments, convertible securities and distressed debt instruments; |
| |
| (ii) | Credit—primarily invests in non-control corporate and structured debt instruments including performing, stressed and distressed instruments across the capital structure; and |
| |
| (iii) | Real estateassets—primarily invests in real estate equity for the acquisition and recapitalization of real estate assets, portfolios, platforms and operating companies, and real estate debt including first mortgage and mezzanine loans, preferred equity and commercial mortgage backed securities. |
These business segments are differentiated based on the varying investment strategies. The performance is measured by management on an unconsolidated basis because management makes operating decisions and assesses the performance of each of Apollo’s business segments based on financial and operating metrics and data that exclude the effects of consolidation of any of the managed funds.
Our financial results vary since carried interest, which generally constitutes a large portion of the income we receive from the funds that we manage, as well as the transaction and advisory fees that we receive, can vary significantly from quarter to quarter and year to year. As a result, we emphasize long-term financial growth and profitability to manage our business.
In addition, the growth in our Fee-Generating AUM during the last year has primarily been in our credit segment. The average management fee rate for these new credit products is at market rates for such products and in certain cases is below our historical rates. Also, due to the complexity of these new product offerings, the Company has incurred and will continue to incur additional costs associated with managing these products. To date, these additional costs have been offset by realized economies of scale and ongoing cost management.
As of September 30, 2016,2017, we had total AUM of $188.6$241.6 billion across all of our businesses. More than 90% of our total AUM was in funds with a contractual life at inception of seven years or more, and 46%41% of such AUM was in permanent capital vehicles. As of September 30, 2017, Fund IX commitments totaled $24.7 billion. On December 31, 2013, Fund VIII held a final closing raising a total of $17.5 billion in third-party capital and approximately $880 million of additional capital from Apollo and affiliated investors, and as of September 30, 2016,2017, Fund VIII had $8.8$6.8 billion of uncalled commitments remaining. Additionally, Fund VII held a final closing in December 2008, raising a total of $14.7 billion, and as of September 30, 2016,2017, Fund VII had $2.5$2.1 billion of uncalled commitments remaining. We have consistently produced attractive long-term investment returns in our traditional private equity funds, generating a 39% gross IRR and a 25%
net IRR on a compound annual basis from inception through
September 30, 2016.2017. Apollo’s private equity fund appreciation was 2.6%7.3% and 7.3%18.1% for the three and nine months ended September 30, 2016,2017, respectively.
For our credit segment, total gross and net returns, excluding Athene and AGER assets that are managed by Athene Asset Management that areApollo but not directly invested in Apollo funds and investment vehicles or sub-advised by Apollo, were 3.9%1.9% and 3.5%1.6%, respectively, for the three months ended September 30, 20162017 and 9.0%6.0% and 7.9%5.1%, respectively, for the nine months ended September 30, 2016.2017.
For our real estateassets segment, total combined gross and net returns for AGRE U.S. Real Estate Fund, L.P. (“U.S. RE Fund I”) and Apollo U.S. RE Fund II, L.P. (“U.S. RE Fund II”) including co-investment capital were 1.4%3.8% and 1.3%3.3%, respectively, for the three months ended September 30, 20162017 and 6.0%13.5% and 5.0%11.5%, respectively, for the nine months ended September 30, 2016.2017.
For further detail related to fund performance metrics across all of our businesses, see “—The Historical Investment Performance of Our Funds.”
Holding Company Structure
The diagram below depicts our current organizational structure:
Note: The organizational structure chart above depicts a simplified version of the Apollo structure. It does not include all legal entities in the structure. Ownership percentages are as of the date of the filing of this Quarterly Report on Form 10-Q.November 2, 2017.
| |
| (1) | The Strategic Investors hold 24.26%Investor holds 9.0% of the Class A shares outstanding and 11.22%4.3% of the economic interests in the Apollo Operating Group. The Class A shares held by investors other than the Strategic InvestorsInvestor represent 39.47%45.7% of the total voting power of our shares entitled to vote and 35.04%43.8% of the economic interests in the Apollo Operating Group. Class A shares held by the Strategic InvestorsInvestor do not have voting rights. However, such Class A shares will become entitled to vote upon transfers by athe Strategic Investor in accordance with the agreements entered into in connection with the investments made by the Strategic Investors.Investor. |
| |
| (2) | Our Managing Partners own BRH Holdings GP, Ltd., which in turn holds our only outstanding Class B share. The Class B share represents 60.53%54.3% of the total voting power of our shares entitled to vote but no economic interest in Apollo Global Management, LLC. Our Managing Partners’ economic interests are instead represented by their indirect beneficial ownership, through Holdings, of 47.99%46.8% of the limited partner interests in the Apollo Operating Group. |
| |
| (3) | Through BRH Holdings, L.P., our Managing Partners indirectly beneficially own through estate planning vehicles, limited partner interests in Holdings. |
| |
| (4) | Holdings owns 53.74%51.9% of the limited partner interests in each Apollo Operating Group entity. The AOG Units held by Holdings are exchangeable for Class A shares. Our Managing Partners, through their interests in BRH and Holdings, beneficially own 47.99%46.8% of the AOG Units. Our Contributing Partners, through their ownership interests in Holdings, beneficially own 5.1% of the AOG Units. |
of the AOG Units. Our Contributing Partners, through their ownership interests in Holdings, beneficially own 5.75% of the AOG Units.
| |
| (5) | BRH Holdings GP, Ltd. is the sole member of AGM Management, LLC, our manager. The management of Apollo Global Management, LLC is vested in our manager as provided in our operating agreement. |
| |
| (6) | Represents 46.26%48.1% of the limited partner interests in each Apollo Operating Group entity, held through the Intermediate Holding Companies.intermediate holding companies. Apollo Global Management, LLC, also indirectly owns 100% of the general partner interests in each Apollo Operating Group entity. |
Each of the Apollo Operating Group partnerships holds interests in different businesses or entities organized in different jurisdictions.
Our structure is designed to accomplish a number of objectives, the most important of which are as follows:
We are a holding company that is qualified as a partnership for U.S. federal income tax purposes. Our Intermediate Holding Companiesintermediate holding companies enable us to maintain our partnership status and to meet the qualifying income exception.
We have historically used multiple management companies to segregate operations for business, financial and other reasons. Going forward, we may increase or decrease the number of our management companies or partnerships within the Apollo Operating Group based on our views regarding the appropriate balance between (a) administrative convenience and (b) continued business, financial, tax and other optimization.
Business Environment
As a global investment manager, we are affected by numerous factors, including the condition of financial markets and the economy. Price fluctuations within equity, credit, commodity, foreign exchange markets, as well as interest rates, which may be volatile and mixed across geographies, can significantly impact the valuation of our funds' investments and related income we may recognize.
In the U.S., the S&P 500 Index rose by 3.3%4.0% in the third quarter of 2016,2017, following an increase of 1.9%2.6% in the second quarter of 2016.2017. Outside the U.S., global equity markets also rose during the third quarter of 2016.2017. The MSCI All Country World ex USA Index rose 6.7%6.2% following a slight declinean increase of 0.8%5.8% in the second quarter of 2016.2017.
Conditions in the credit markets also have a significant impact on our business. Credit markets generally rose in the third quarter of 2016,2017, with the BofAML HY Master II Index increasing 5.5%2.0% and the S&P/LSTA Leveraged Loan Index increasing 3.1%1.0%. Benchmark interest rates increased slightlyremained stable in the third quarter, as investors expect central banks to raise interest rates given stronger global growth. Thewith the U.S. 10-year Treasury yield rose 11 basis points inremaining at 2.3%, as investors generally expect the thirdnext interest rate increase during the fourth quarter to finish the quarter at 1.6%.of 2017.
Foreign exchange rates can impact the valuations of our funds’ investments that are denominated in currencies other than the U.S. dollar. Relative to the U.S. dollar, the Euro appreciated 1.2%3.4% in the third quarter of 2016,2017, after depreciating 2.4% in the second quarter of 2016, while the British pound depreciated 2.5% in the third quarter of 2016, after depreciating byappreciating 7.3% in the second quarter of 2016.2017, while the British pound appreciated 2.9% in the third quarter of 2017, after appreciating by 3.8% in the second quarter of 2017. Commodities were generally mixed in the third quarter of 2016.2017, with energy prices rebounding. The price of crude oil declined slightlyincreased 12.2% during the third quarter compared toof 2017, following a significant increasedecline of 26.1% during9.0% in the second quarter of 2016.2017.
In terms of economic conditions in the U.S., the Bureau of Economic Analysis reported real GDP increased at an annual rate of 2.9%3.0% in the third quarter of 2016,2017, compared to a 1.4%3.1% increase in the second quarter of 2016.2017. As of October 2016, TheJuly 2017, the International Monetary Fund estimated that the U.S. economy will expand by 1.6%2.1% in 20162017 and by 2.2%2.1% in 2017.2018. Additionally, the U.S. unemployment rate stood at 5.0%4.2% as of September 30, 2016, slightly above2017, the 4.9% rate aslowest level since the financial crisis of June 30, 2016.2008.
Regardless of the market or economic environment at any given time, Apollo relies on its contrarian, value-oriented approach to consistently invest capital on behalf of its fund investors by focusing on opportunities that management believes are often overlooked by other investors. As such, Apollo’s global integrated investment platform deployed $4.3$3.3 billion and $16.5$12.8 billion of capital through the funds it manages during the third quarterthree and the 12twelve months ended September 30, 2016,2017, respectively. We believe Apollo’s expertise in credit and its focus on nine core industry sectors, combined with more than 2627 years of investment experience, has allowed Apollo to respond quickly to changing environments. Apollo’s core industry sectors include chemicals, manufacturing and industrial, natural resources, consumer and retail, consumer services, business services, financial services, leisure, and media and telecom and media/telecom/technology. Apollo believes that these attributes have contributed to the success of its private equity funds investing in buyouts and credit opportunities during both expansionary and recessionary economic periods.
In general, institutional investors continue to allocate capital towards alternative investment managers for more attractive risk-adjusted returns in a low interest rate environment, and we believe the business environment remains generally
accommodative to raise larger successor funds, launch new products, and pursue attractive strategic growth opportunities. As such, Apollo had $7.2$7.9 billion and $40.4$55.5 billion of capital inflows during the third quarterthree and the 12twelve months ended September 30, 2016,2017, respectively. While Apollo continues to attract capital inflows, it also continues to generate realizations for fund investors. Apollo returned $1.2$1.7 billion and $5.6$7.8 billion of capital and realized gains to the investors in the funds it manages during the third quarterthree and the 12twelve months ended September 30, 2016,2017, respectively.
Managing Business Performance
We believe that the presentation of Economic Income, (Loss), or EI, supplements a reader’s understanding of the economic operating performance of each of our segments.
Economic Income (Loss)
EI has certain limitations in that it does not take into account certain items included under U.S. GAAP. EI represents segment income (loss) before income tax (provision) benefitprovision excluding transaction-related charges arising from the 2007 private placement and any acquisitions. Transaction-related charges include equity-based compensation charges, the amortization of intangible assets, contingent consideration and certain other charges associated with acquisitions. In addition, segment data excludes non-cash revenue and expense related to equity awards granted by unconsolidated related parties to employees of the Company, compensation and administrative related expense reimbursements from unconsolidated related parties, as well as the assets, liabilities and operating results of the funds and VIEs that are included in the condensed consolidated financial statements. We believe the exclusion of the non-cash charges related to the 2007 Reorganization for equity-based compensation provides investors with a meaningful indication of our performance because these charges relate to the equity portion of our capital structure and not our core operating performance.
Economic Net Income (Loss) represents EI adjusted to reflect income tax (provision) benefitprovision on EI that has been calculated assuming that all income is allocated to Apollo Global Management, LLC, which would occur following an exchange of all AOG Units for Class A shares of Apollo Global Management, LLC. The economic assumptions and methodologies that impact the implied income tax (provision) benefitprovision are similar to those methodologies and certain assumptions used in calculating the income tax (provision) benefitprovision for Apollo’s condensed consolidated statements of operations under U.S. GAAP.
We further present EI based on what we refer ENI is net of preferred distributions, if any, to as our “Management Business” and “Incentive Business”. Management Business refers to the portion of the Company’s business that primarily generates non-incentive based components of EI including fees earned as manager of our funds and associated operating expenses, and is generally characterized by the predictability of its financial metrics. Incentive Business refers to the portion of the Company’s business that primarily generates incentive-based components of EI, including carried interest income and profit sharing expenses, as well as other revenue and expense items pertaining to the Company’s investments and debt.Series A Preferred shareholders.
We believe that EI is helpful for an understanding of our business and that investors should review the same supplemental financial measure that management uses to analyze our segment performance. This measure supplements and should be considered in addition to and not in lieu of the results of operations discussed below in “—Overview of Results of Operations” that have been prepared in accordance with U.S. GAAP. See note 1415 to the condensed consolidated financial statements for more details regarding management’s consideration of EI.
Management Business EI, which is a component of total EI, is the sum of (i) management fees, (ii) advisory and transaction fees, net and (iii) carried interest income earned from a publicly traded business development company we manage, less (x) salary, bonus, and benefits, (y) equity-based compensation, and (z) other associated operating expenses.
Incentive Business EI, which is a component of total EI, is the sum of (i) carried interest income (excluding carried interest income earned from a publicly traded business development company we manage), (ii) profit sharing expense, and (iii) other income (which includes items such as net gains from investment activities, income from equity method investments and net interest expense).
EI may not be comparable to similarly titled measures used by other companies and is not a measure of performance calculated in accordance with U.S. GAAP. We use EI as a measure of operating performance, not as a measure of liquidity. EI should not be considered in isolation or as a substitute for operating income, net income operating cash flows, investing and financing activities, or other income or cash flow statement data prepared in accordance with U.S. GAAP. The use of EI without consideration of related U.S. GAAP measures is not adequate due to the adjustments described above. Management compensates for these limitations by using EI as a supplemental measure to U.S. GAAP results, to provide a more complete understanding of our performance as management measures it. A reconciliation of EI to its most directly comparable U.S. GAAP measure of income (loss) before income tax (provision) benefitprovision can be found in the notes to our condensed consolidated financial statements.
Fee Related Earnings
Economic Income (Loss) forFee Related Earnings (“FRE”) is derived from our segment reported results and refers to a component of EI that is used as a supplemental measure to assess whether revenues that we believe are generally more stable and predictable in nature, primarily consisting of management fees, are sufficient to cover associated operating expenses and generate profits. FRE is the threesum across all segments of (i) management fees, (ii) advisory and nine months ended September 30, 2015 includestransaction fees, (iii) carried interest income earned from a recastpublicly traded business development company we manage and (iv) other income, net excluding gains (losses) arising from the reversal of a portion of the tax receivable agreement liability, less (y) salary, bonus and benefits, due to management’s change in allocation methodology among the segments in the current period. All prior periods have been recast to conform to the current presentation. The impact to the combined segments total Economic Income (Loss) for all periods was zero. The impact of this change to EI for each segment is reflected in note 14 to the condensed consolidated financial statements.excluding equity-based compensation and (z) other associated operating expenses.
Distributable Earnings
Distributable Earnings (“DE”), as well as DE After Taxes and Related Payables are derived from our segment reported results, and are supplemental non-U.S. GAAP measures to assess performance and the amount of earnings available for distribution to Class A shareholders, holders of RSUs that participate in distributions and holders of AOG Units. DE represents the amount of net realized earnings without the effects of the consolidation of any of the related funds. DE, which is a component of EI, is the sum across all segments of (i) total management fees and advisory and transaction fees, excluding monitoring fees received from Athene based on its capital and surplus (as defined in Apollo’s transaction advisory services agreement with Athene), (ii) other income (loss), excluding the gains (losses) arising from the reversal of a portion of the tax receivable agreement liability (iii) realized carried interest income, and (iv) realized investment income, less (x) compensation expense, excluding the expense related to equity-based awards, (y) realized profit sharing expense, and (z) non-compensation expenses, excluding depreciation and amortization expense. DE After Taxes and Related Payables represents DE less estimated current corporate, local and non-U.S. taxes as well as the payable under Apollo’s tax receivable agreement. DE After Taxes and Related Payables is net of preferred distributions, if any, to Series A Preferred shareholders. A reconciliation of DE and EI to their most directly comparable U.S. GAAP measure of income (loss) before income tax (provision) benefitprovision can be found in “—Summary of Non-U.S. GAAP Measures”.
Management Business DE, which is a component of total DE, includes all the components of Management Business EI except for those which are non-cash in nature, such as equity-based compensation as well as depreciation and amortization.
Incentive Business DE, which is a component of total DE, includes all the components of Incentive Business EI except for those which are non-cash in nature, such as unrealized carried interest income, associated non-cash profit sharing expense, unrealized investment income and other income.
The Company uses Management Business EI and Management Business DE to evaluate operating financial performance, including whether fee-related revenues are sufficient to adequately cover recurring operating expenses. The Company believes that Management Business EI and Management Business DE provide investors with additional insight into the operations of the Company as these measures provide a meaningful indication of the components of EI and DE that are generally steady and predictable in nature.
The Company uses Incentive Business EI and Incentive Business DE to evaluate incentive-based and investment-related financial performance. The Company believes that Incentive Business EI and Incentive Business DE provide investors with additional insight into the operations of the Company as these measures provide a meaningful indication of the components of EI and DE that are generally less predictable and more volatile in nature.
Fee-RelatedFee Related EBITDA
Fee-relatedFee related EBITDA is a non-U.S. GAAP measure derived from our segment reported results and is used to assess the performance of our operations as well as our ability to service current and future borrowings. Fee-relatedFee related EBITDA represents Management Business EIFRE plus amounts for equity-based compensation and depreciation and amortization. “Fee-related“Fee related EBITDA +100% of net realized carried interest” represents fee-related EBITDA plus realized carried interest less realized profit sharing, combiningsharing.
We use FRE, DE and Fee related EBITDA as measures of operating resultsperformance, not as measures of liquidity. These measures should not be considered in isolation or as a substitute for net income or other income data prepared in accordance with U.S. GAAP. The use of these measures without consideration of their related U.S. GAAP measures is not adequate due to the Management Business and Incentive Business.adjustments described above.
Operating Metrics
We monitor certain operating metrics that are common to the alternative investment management industry. These operating metrics include Assets Under Management, capital deployed and uncalled commitments.
Assets Under Management
The tabletables below presentspresent Fee-Generating and Non-Fee-Generating AUM by segment as of September 30, 20162017 and 20152016 and December 31, 2015:2016:
| | | | As of September 30, 2016 | As of September 30, 2017 |
| | Private Equity | | Credit | | Real Estate | | Total | Private Equity | | Credit | | Real Assets | | Total |
| | (in millions) | (in millions) |
| Fee-Generating | $ | 30,630 |
| | $ | 110,123 |
| | $ | 7,916 |
| | $ | 148,669 |
| $ | 30,067 |
| | $ | 126,907 |
| | $ | 9,284 |
| | $ | 166,258 |
|
| Non-Fee-Generating | 11,551 |
| | 25,273 |
| | 3,143 |
| | 39,967 |
| 40,402 |
| | 31,018 |
| | 3,887 |
| | 75,307 |
|
| Total Assets Under Management | $ | 42,181 |
| | $ | 135,396 |
| | $ | 11,059 |
| | $ | 188,636 |
| $ | 70,469 |
| | $ | 157,925 |
| | $ | 13,171 |
| | $ | 241,565 |
|
|
| | | | | | | | | | | | | | | |
| | As of September 30, 2016 |
| | Private Equity | | Credit | | Real Assets | | Total |
| | (in millions) |
| Fee-Generating | $ | 30,630 |
| | $ | 110,123 |
| | $ | 7,916 |
| | $ | 148,669 |
|
| Non-Fee-Generating | 11,551 |
| | 25,273 |
| | 3,143 |
| | 39,967 |
|
| Total Assets Under Management | $ | 42,181 |
| | $ | 135,396 |
| | $ | 11,059 |
| | $ | 188,636 |
|
|
| | | | | | | | | | | | | | | |
| | As of September 30, 2015 |
| | Private Equity | | Credit | | Real Estate | | Total |
| | (in millions) |
| Fee-Generating | $ | 29,300 |
| | $ | 94,666 |
| | $ | 7,102 |
| | $ | 131,068 |
|
| Non-Fee-Generating | 8,956 |
| | 18,115 |
| | 3,680 |
| | 30,751 |
|
| Total Assets Under Management | $ | 38,256 |
| | $ | 112,781 |
| | $ | 10,782 |
| | $ | 161,819 |
|
| | | | As of December 31, 2015 | As of December 31, 2016 |
| | Private Equity | | Credit | | Real Estate | | Total | Private Equity | | Credit | | Real Assets | | Total |
| | (in millions) | (in millions) |
| Fee-Generating | $ | 29,258 |
| | $ | 101,522 |
| | $ | 7,317 |
| | $ | 138,097 |
| $ | 30,722 |
| | $ | 111,781 |
| | $ | 8,295 |
| | $ | 150,798 |
|
| Non-Fee-Generating | 8,244 |
| | 19,839 |
| | 3,943 |
| | 32,026 |
| 12,906 |
| | 24,826 |
| | 3,158 |
| | 40,890 |
|
| Total Assets Under Management | $ | 37,502 |
| | $ | 121,361 |
| | $ | 11,260 |
| | $ | 170,123 |
| $ | 43,628 |
| | $ | 136,607 |
| | $ | 11,453 |
| | $ | 191,688 |
|
The table below presents AUM with Future Management Fee Potential, which is a component of Non-Fee-Generating AUM, for each of Apollo’s three segments as of September 30, 20162017 and 20152016 and December 31, 2015.2016.
| | | | As of
September 30, 2016 | | As of
September 30, 2015 | | As of
December 31, 2015 | As of
September 30, 2017 | | As of
September 30, 2016 | | As of
December 31, 2016 |
| | (in millions) | (in millions) |
| Private Equity | $ | 2,148 |
| | $ | 2,017 |
| | $ | 2,093 |
| $ | 25,796 |
| | $ | 2,148 |
| | $ | 1,977 |
|
| Credit | 7,818 |
| | 7,594 |
| | 5,763 |
| 8,565 |
| | 7,818 |
| | 6,533 |
|
| Real Estate | 927 |
| | 764 |
| | 986 |
| |
| Real Assets | | 874 |
| | 927 |
| | 639 |
|
| Total AUM with Future Management Fee Potential | $ | 10,893 |
| | $ | 10,375 |
| | $ | 8,842 |
| $ | 35,235 |
| | $ | 10,893 |
| | $ | 9,149 |
|
The following table presentstables present the components of Carry-Eligible AUM for each of Apollo’s three segments as of September 30, 20162017 and 20152016 and December 31, 2015:2016:
| | | | As of September 30, 2016 | As of September 30, 2017 |
| | Private Equity | | Credit | | Real Estate | | Total | Private Equity | | Credit | | Real Assets | | Total |
| | (in millions) | (in millions) |
| Carry-Generating AUM | $ | 19,063 |
| | $ | 31,648 |
| | $ | 697 |
| | $ | 51,408 |
| $ | 25,213 |
| | $ | 26,634 |
| | $ | 803 |
| | $ | 52,650 |
|
| AUM Not Currently Generating Carry | 1,225 |
| | 7,852 |
| | 509 |
| | 9,586 |
| 492 |
| | 15,722 |
| | 395 |
| | 16,609 |
|
| Uninvested Carry-Eligible AUM | 13,945 |
| | 8,549 |
| | 1,251 |
| | 23,745 |
| 34,290 |
| | 11,927 |
| | 1,281 |
| | 47,498 |
|
| Total Carry-Eligible AUM | $ | 34,233 |
| | $ | 48,049 |
| | $ | 2,457 |
| | $ | 84,739 |
| $ | 59,995 |
| | $ | 54,283 |
| | $ | 2,479 |
| | $ | 116,757 |
|
| | | | As of September 30, 2015 | As of September 30, 2016 |
| | Private Equity | | Credit | | Real Estate | | Total | Private Equity | | Credit | | Real Assets | | Total |
| | (in millions) | (in millions) |
| Carry-Generating AUM | $ | 10,302 |
| | $ | 17,211 |
| | $ | 553 |
| | $ | 28,066 |
| $ | 19,063 |
| | $ | 31,648 |
| | $ | 697 |
| | $ | 51,408 |
|
| AUM Not Currently Generating Carry | 5,239 |
| | 18,759 |
| | 829 |
| | 24,827 |
| 1,225 |
| | 7,852 |
| | 509 |
| | 9,586 |
|
| Uninvested Carry-Eligible AUM | 17,707 |
| | 9,849 |
| | 1,019 |
| | 28,575 |
| 13,945 |
| | 8,549 |
| | 1,251 |
| | 23,745 |
|
| Total Carry-Eligible AUM | $ | 33,248 |
| | $ | 45,819 |
| | $ | 2,401 |
| | $ | 81,468 |
| $ | 34,233 |
| | $ | 48,049 |
| | $ | 2,457 |
| | $ | 84,739 |
|
| | | | As of December 31, 2015 | As of December 31, 2016 |
| | Private Equity | | Credit | | Real Estate | | Total | Private Equity | | Credit | | Real Assets | | Total |
| | (in millions) | (in millions) |
| Carry-Generating AUM | $ | 9,461 |
| | $ | 16,923 |
| | $ | 516 |
| | $ | 26,900 |
| $ | 21,521 |
| | $ | 33,306 |
| | $ | 776 |
| | $ | 55,603 |
|
| AUM Not Currently Generating Carry | 6,793 |
| | 21,583 |
| | 865 |
| | 29,241 |
| 487 |
| | 7,219 |
| | 365 |
| | 8,071 |
|
| Uninvested Carry-Eligible AUM | 16,528 |
| | 8,701 |
| | 1,059 |
| | 26,288 |
| 13,136 |
| | 11,119 |
| | 976 |
| | 25,231 |
|
| Total Carry-Eligible AUM | $ | 32,782 |
| | $ | 47,207 |
| | $ | 2,440 |
| | $ | 82,429 |
| $ | 35,144 |
| | $ | 51,644 |
| | $ | 2,117 |
| | $ | 88,905 |
|
The following table presents AUM Not Currently Generating Carry for funds that have commenced investing capital for more than 24 months as of September 30, 20162017 and the corresponding appreciation required to reach the preferred return or high watermark in order to generate carried interest:
| | | Category / Fund | | Invested AUM Not Currently Generating Carry | | Investment Period Active > 24 Months | | Appreciation Required to Achieve Carry(1) | | Invested AUM Not Currently Generating Carry | | Investment Period Active > 24 Months | | Appreciation Required to Achieve Carry(1) |
| | | (in millions) | | | (in millions) | |
| Private Equity: | | | | | | | | | | |
| ANRP I | | $ | 868 |
| | $ | 868 |
| | 6% | |
| Other PE | | 357 |
| | 186 |
| | 39% | |
| Total Private Equity | | 1,225 |
| | 1,054 |
| | 12% | | $ | 492 |
| | $ | 459 |
| | 20% |
| Credit: | | | | | | | | | | |
| Drawdown | | 4,355 |
| | 4,165 |
| | 26% | | 4,175 |
| | 3,832 |
| | 31% |
| Liquid/Performing | | 3,497 |
| | 1,785 |
| | < 250bps | | 10,870 |
| | 7,756 |
| | < 250bps |
| — |
| | 250-500bps | 13 |
| | 250-500bps |
| 833 |
| | > 500bps | 455 |
| | > 500bps |
| MidCap, AINV, AFT, AIF | | | 677 |
| | 678 |
| | < 250bps |
| Total Credit | | 7,852 |
| | 6,783 |
| | 19% | | 15,722 |
| | 12,734 |
| | 11% |
| Real Estate: | | | | | | |
| Total Real Estate | | 509 |
| | 376 |
| | > 500bps | |
| Real Assets: | | | | | | |
| Total Real Assets | | | 395 |
| | 250 |
| | > 250bps |
| Total | | $ | 9,586 |
| | $ | 8,213 |
| | | $ | 16,609 |
| | $ | 13,443 |
| |
| |
| (1) | All investors in a given fund are considered in aggregate when calculating the appreciation required to achieve carry presented above. Appreciation required to achieve carry may vary by individual investor. |
The components of Fee-Generating AUM by segment as of September 30, 20162017 and 20152016 and December 31, 20152016 are presented below:
| | | | As of September 30, 2016 | As of September 30, 2017 |
| | Private Equity | | Credit | | Real Estate | | Total | Private Equity | | Credit | | Real Assets | | Total |
| | (in millions) | (in millions) |
| Fee-Generating AUM based on capital commitments | $ | 21,682 |
| | $ | 6,425 |
| | $ | 724 |
| | $ | 28,831 |
| $ | 21,803 |
| | $ | 8,749 |
| | $ | 784 |
| | $ | 31,336 |
|
| Fee-Generating AUM based on invested capital | 8,137 |
| | 4,302 |
| | 4,205 |
| | 16,644 |
| 7,443 |
| | 6,696 |
| | 4,882 |
| | 19,021 |
|
| Fee-Generating AUM based on gross/adjusted assets | 293 |
| | 88,606 |
| | 2,910 |
| | 91,809 |
| 821 |
| | 94,159 |
| | 3,563 |
| | 98,543 |
|
| Fee-Generating AUM based on NAV | 518 |
| | 10,790 |
| | 77 |
| | 11,385 |
| — |
| | 17,303 |
| | 55 |
| | 17,358 |
|
| Total Fee-Generating AUM | $ | 30,630 |
| (1) | $ | 110,123 |
| | $ | 7,916 |
| | $ | 148,669 |
| $ | 30,067 |
| (1) | $ | 126,907 |
| | $ | 9,284 |
| | $ | 166,258 |
|
| |
| (1) | The weighted average remaining life of the private equity funds excluding permanent capital vehicles at September 30, 2017 was 59 months. |
|
| | | | | | | | | | | | | | | |
| | As of September 30, 2016 |
| | Private Equity | | Credit | | Real Assets | | Total |
| | (in millions) |
| Fee-Generating AUM based on capital commitments | $ | 21,682 |
| | $ | 6,425 |
| | $ | 724 |
| | $ | 28,831 |
|
| Fee-Generating AUM based on invested capital | 8,137 |
| | 4,302 |
| | 4,205 |
| | 16,644 |
|
| Fee-Generating AUM based on gross/adjusted assets | 293 |
| | 88,606 |
| | 2,910 |
| | 91,809 |
|
| Fee-Generating AUM based on NAV | 518 |
| | 10,790 |
| | 77 |
| | 11,385 |
|
| Total Fee-Generating AUM | $ | 30,630 |
| (1) | $ | 110,123 |
| | $ | 7,916 |
| | $ | 148,669 |
|
| |
| (1) | The weighted average remaining life of the private equity funds excluding permanent capital vehicles at September 30, 2016 was 68 months. |
|
| | | | | | | | | | | | | | | |
| | As of September 30, 2015 |
| | Private Equity | | Credit | | Real Estate | | Total |
| | (in millions) |
| Fee-Generating AUM based on capital commitments | $ | 19,954 |
| | $ | 5,817 |
| | $ | 338 |
| | $ | 26,109 |
|
| Fee-Generating AUM based on invested capital | 8,691 |
| | 3,452 |
| | 4,277 |
| | 16,420 |
|
| Fee-Generating AUM based on gross/adjusted assets | 425 |
| | 77,183 |
| | 2,387 |
| | 79,995 |
|
| Fee-Generating AUM based on NAV | 230 |
| | 8,214 |
| | 100 |
| | 8,544 |
|
| Total Fee-Generating AUM | $ | 29,300 |
| (1) | $ | 94,666 |
| | $ | 7,102 |
| | $ | 131,068 |
|
| |
(1) | The weighted average remaining life of the private equity funds excluding permanent capital vehicles at September 30, 2015 was 69 months. |
| | | | As of December 31, 2015 | As of December 31, 2016 |
| | Private Equity | | Credit | | Real Estate | | Total | Private Equity | | Credit | | Real Assets | | Total |
| | (in millions) | (in millions) |
| Fee-Generating AUM based on capital commitments | $ | 20,315 |
| | $ | 5,787 |
| | $ | 376 |
| | $ | 26,478 |
| $ | 21,782 |
| | $ | 8,072 |
| | $ | 724 |
| | $ | 30,578 |
|
| Fee-Generating AUM based on invested capital | 8,094 |
| | 3,860 |
| | 4,180 |
| | 16,134 |
| 8,058 |
| | 4,212 |
| | 4,374 |
| | 16,644 |
|
| Fee-Generating AUM based on gross/adjusted assets | 506 |
| | 83,728 |
| | 2,671 |
| | 86,905 |
| 882 |
| | 88,196 |
| | 3,131 |
| | 92,209 |
|
| Fee-Generating AUM based on NAV | 343 |
| | 8,147 |
| | 90 |
| | 8,580 |
| — |
| | 11,301 |
| | 66 |
| | 11,367 |
|
| Total Fee-Generating AUM | $ | 29,258 |
| (1) | $ | 101,522 |
| | $ | 7,317 |
| | $ | 138,097 |
| $ | 30,722 |
| (1) | $ | 111,781 |
| | $ | 8,295 |
| | $ | 150,798 |
|
| |
| (1) | The weighted average remaining life of the private equity funds excluding permanent capital vehicles at December 31, 20152016 was 7366 months. |
The following table presents total AUM and Fee-Generating AUM amounts for our private equity segment:
|
| | | | | | | | | | | | | | | | | | | | | | | |
| | Total AUM | | Fee-Generating AUM |
| | As of
September 30, | | As of December 31, | | As of
September 30, | | As of December 31, |
| | 2017 | | 2016 | | 2016 | | 2017 | | 2016 | | 2016 |
| | (in millions) |
| Traditional Private Equity Funds | $ | 56,823 |
| | $ | 30,227 |
| | $ | 30,490 |
| | $ | 23,842 |
| | $ | 24,634 |
| | $ | 24,457 |
|
| Natural Resources | 4,702 |
| | 4,822 |
| | 5,223 |
| | 4,042 |
| | 4,046 |
| | 4,181 |
|
Other(1) | 8,944 |
| | 7,132 |
| | 7,915 |
| | 2,183 |
| | 1,950 |
| | 2,084 |
|
| Total | $ | 70,469 |
| | $ | 42,181 |
| | $ | 43,628 |
| | $ | 30,067 |
| | $ | 30,630 |
| | $ | 30,722 |
|
|
| | | | | | | | | | | | | | | | | | | | | | | |
| | Total AUM | | Fee-Generating AUM |
| | As of
September 30, | | As of December 31, | | As of
September 30, | | As of December 31, |
| | 2016 | | 2015 | | 2015 | | 2016 | | 2015 | | 2015 |
| | (in millions) |
| Traditional Private Equity Funds | $ | 30,227 |
| | $ | 31,927 |
| | $ | 30,665 |
| | $ | 24,634 |
| | $ | 25,365 |
| | $ | 24,826 |
|
| Natural Resources | 4,822 |
| | 2,563 |
| | 2,909 |
| | 4,046 |
| | 1,967 |
| | 2,436 |
|
Other(1) | 7,132 |
| | 3,766 |
| | 3,928 |
| | 1,950 |
| | 1,968 |
| | 1,996 |
|
| Total | $ | 42,181 |
| | $ | 38,256 |
| | $ | 37,502 |
| | $ | 30,630 |
| | $ | 29,300 |
| | $ | 29,258 |
|
| |
| (1) | Includes co-investments contributed to Athene by AAA through its investment in AAA Investments as discussed in note 1213 of the condensed consolidated financial statements. |
The following table presents total AUM and Fee-Generating AUM amounts for our credit segment by category type:
| | | | Total AUM | | Fee-Generating AUM | Total AUM | | Fee-Generating AUM |
| | As of
September 30, | | As of December 31, | | As of
September 30, | | As of December 31, | As of
September 30, | | As of December 31, | | As of
September 30, | | As of December 31, |
| | 2016 | | 2015 | | 2015 | | 2016 | | 2015 | | 2015 | 2017 | | 2016 | | 2016 | | 2017 | | 2016 | | 2016 |
| | (in millions) | (in millions) |
| Liquid/Performing | $ | 36,733 |
| | $ | 34,982 |
| | $ | 37,242 |
| | $ | 32,570 |
| | $ | 30,553 |
| | $ | 30,603 |
| $ | 41,765 |
| | $ | 36,733 |
| | $ | 35,684 |
| | $ | 36,176 |
| | $ | 32,570 |
| | $ | 31,562 |
|
| Drawdown | 20,954 |
| | 19,700 |
| | 19,112 |
| | 12,122 |
| | 10,857 |
| | 11,130 |
| 27,223 |
| | 20,954 |
| | 23,852 |
| | 17,253 |
| | 12,122 |
| | 13,645 |
|
Permanent capital vehicles ex Athene Non-Sub-Advised(1) | 11,866 |
| | 12,536 |
| | 15,058 |
| | 10,699 |
| | 7,693 |
| | 9,840 |
| 12,978 |
| | 11,866 |
| | 12,330 |
| | 12,165 |
| | 10,699 |
| | 11,460 |
|
Athene Non-Sub-Advised(1) | 56,532 |
| | 45,563 |
| | 49,949 |
| | 54,732 |
| | 45,563 |
| | 49,949 |
| 57,029 |
| | 51,497 |
| | 50,761 |
| | 57,029 |
| | 49,697 |
| | 50,761 |
|
Advisory(2) | 9,311 |
| | — |
| | — |
| | — |
| | — |
| | — |
| |
AGER Non-Sub-Advised(1) | | 6,747 |
| | 5,035 |
| | 4,353 |
| | 4,284 |
| | 5,035 |
| | 4,353 |
|
| Advisory | | 12,183 |
| | 9,311 |
| | 9,627 |
| | — |
| | — |
| | — |
|
| Total | $ | 135,396 |
| | $ | 112,781 |
| | $ | 121,361 |
| | $ | 110,123 |
| | $ | 94,666 |
| | $ | 101,522 |
| $ | 157,925 |
| | $ | 135,396 |
| | $ | 136,607 |
| | $ | 126,907 |
| | $ | 110,123 |
| | $ | 111,781 |
|
| |
| (1) | The Company refers to the portion of the AUM related to AGER that is not sub-advised by Apollo or invested in funds and or investment vehicles managed by Apollo as “AGER Non-Sub-Advised” AUM. Athene Non-Sub-Advised and AGER Non-Sub-Advised reflects total Athene-relatedcombined AUM of $71.8$81.9 billion less $15.3$18.1 billion of assets that were either sub-advised by Apollo or invested in funds and investment vehicles managed by Apollo. AtheneApollo included within other asset categories. AGER Non-Sub-Advised includes $5.0$4.2 billion of Athene AUM for which AAME a subsidiary of Apollo, provides investment advisory services. |
| |
(2) | Advisory refers to certain assets advised by AAME. |
The following table presents the Athene and AGER assets that were either sub-advised by Apollo or invested in funds and investment vehicles managed by Apollo:
| | | | Total AUM | Total AUM |
| | As of
September 30, | | As of December 31, | As of
September 30, | | As of December 31, |
| | 2016 | | 2015 | | 2015 | 2017 | | 2016 | | 2016 |
| | (in millions) | (in millions) |
| Private Equity | $ | 894 |
| | $ | 833 |
| | $ | 956 |
| $ | 1,190 |
| | $ | 894 |
| | $ | 1,099 |
|
| Credit | | | | | | | | | | |
| Liquid/Performing | 9,356 |
| | 9,016 |
| | 8,998 |
| 10,659 |
| | 9,356 |
| | 9,407 |
|
| Drawdown | 1,053 |
| | 902 |
| | 863 |
| 1,287 |
| | 1,053 |
| | 1,075 |
|
| Total Credit | 10,409 |
| | 9,918 |
| | 9,861 |
| 11,946 |
| | 10,409 |
| | 10,482 |
|
| Real Estate | | | | | | |
| Debt | 3,545 |
| | 3,460 |
| | 3,426 |
| |
| Equity | 434 |
| | 382 |
| | 340 |
| |
| Total Real Estate | 3,979 |
| | 3,842 |
| | 3,766 |
| |
| Real Assets | | | | | | |
| Real Estate Debt | | 4,553 |
| | 3,545 |
| | 3,698 |
|
| Real Estate Equity | | 407 |
| | 434 |
| | 439 |
|
| Total Real Assets | | 4,960 |
| | 3,979 |
| | 4,137 |
|
| Total | $ | 15,282 |
| | $ | 14,593 |
| | $ | 14,583 |
| $ | 18,096 |
| | $ | 15,282 |
| | $ | 15,718 |
|
The following table presents total AUM and Fee-Generating AUM amounts for our real estateassets segment:
| | | | Total AUM | | Fee-Generating AUM | Total AUM | | Fee-Generating AUM |
| | As of
September 30, | | As of December 31, | | As of
September 30, | | As of December 31, | As of
September 30, | | As of December 31, | | As of
September 30, | | As of December 31, |
| | 2016 | | 2015 | | 2015 | | 2016 | | 2015 | | 2015 | 2017 | | 2016 | | 2016 | | 2017 | | 2016 | | 2016 |
| | (in millions) | (in millions) |
| Debt | $ | 7,875 |
| | $ | 7,381 |
| | $ | 7,737 |
| | $ | 6,160 |
| | $ | 5,266 |
| | $ | 5,477 |
| $ | 9,835 |
| | $ | 7,875 |
| | $ | 8,604 |
| | $ | 7,436 |
| | $ | 6,160 |
| | $ | 6,577 |
|
| Equity | 3,184 |
| | 3,401 |
| | 3,523 |
| | 1,756 |
| | 1,836 |
| | 1,840 |
| 3,336 |
| | 3,184 |
| | 2,849 |
| | 1,848 |
| | 1,756 |
| | 1,718 |
|
| Total | $ | 11,059 |
| | $ | 10,782 |
| | $ | 11,260 |
| | $ | 7,916 |
| | $ | 7,102 |
| | $ | 7,317 |
| $ | 13,171 |
| | $ | 11,059 |
| | $ | 11,453 |
| | $ | 9,284 |
| | $ | 7,916 |
| | $ | 8,295 |
|
The following tables summarize changes in total AUM for each of Apollo’s three segments for the three and nine months ended September 30, 20162017 and 2015:2016:
| | | | For the Three Months Ended September 30, | For the Three Months Ended September 30, |
| | 2016 | | 2015 | 2017 | | 2016 |
| | Private Equity | | Credit | | Real Estate | | Total | | Private Equity | | Credit | | Real Estate | | Total | Private Equity | | Credit | | Real Assets | | Total | | Private Equity | | Credit | | Real Assets | | Total |
| | (in millions) | (in millions) |
Change in Total AUM(1): | | | | | | | | | | | | | | | | | | | | | | | | | | | | | | |
| Beginning of Period | $ | 41,181 |
| | $ | 133,884 |
| | $ | 11,201 |
| | $ | 186,266 |
| | $ | 39,264 |
| | $ | 112,680 |
| | $ | 10,554 |
| | $ | 162,498 |
| $ | 67,798 |
| | $ | 151,033 |
| | $ | 13,009 |
| | $ | 231,840 |
| | $ | 41,181 |
| | $ | 133,884 |
| | $ | 11,201 |
| | $ | 186,266 |
|
| Inflows | 1,448 |
| | 4,913 |
| | 820 |
| | 7,181 |
| | 1,112 |
| | 1,697 |
| | 480 |
| | 3,289 |
| 581 |
| | 6,640 |
| | 655 |
| | 7,876 |
| | 1,448 |
| | 4,913 |
| | 820 |
| | 7,181 |
|
Outflows(2) | (651 | ) | | (4,292 | ) | | (505 | ) | | (5,448 | ) | | (163 | ) | | (973 | ) | | (51 | ) | | (1,187 | ) | — |
| | (515 | ) | | (86 | ) | | (601 | ) | | (651 | ) | | (4,292 | ) | | (505 | ) | | (5,448 | ) |
| Net Flows | 797 |
| | 621 |
| | 315 |
| | 1,733 |
| | 949 |
| | 724 |
| | 429 |
| | 2,102 |
| 581 |
| | 6,125 |
| | 569 |
| | 7,275 |
| | 797 |
| | 621 |
| | 315 |
| | 1,733 |
|
| Realizations | (150 | ) | | (452 | ) | | (611 | ) | | (1,213 | ) | | (1,098 | ) | | (520 | ) | | (286 | ) | | (1,904 | ) | (384 | ) | | (981 | ) | | (335 | ) | | (1,700 | ) | | (150 | ) | | (452 | ) | | (611 | ) | | (1,213 | ) |
Market Activity(3)(4) | 353 |
| | 1,343 |
| | 154 |
| | 1,850 |
| | (859 | ) | | (103 | ) | | 85 |
| | (877 | ) | 2,474 |
| | 1,748 |
| | (72 | ) | | 4,150 |
| | 353 |
| | 1,343 |
| | 154 |
| | 1,850 |
|
| End of Period | $ | 42,181 |
| | $ | 135,396 |
| | $ | 11,059 |
| | $ | 188,636 |
| | $ | 38,256 |
| | $ | 112,781 |
| | $ | 10,782 |
| | $ | 161,819 |
| $ | 70,469 |
| | $ | 157,925 |
| | $ | 13,171 |
| | $ | 241,565 |
| | $ | 42,181 |
| | $ | 135,396 |
| | $ | 11,059 |
| | $ | 188,636 |
|
| |
| (1) | At the individual segment level, inflows include new subscriptions, commitments, capital raised, other increases in available capital, purchases, acquisitions, and portfolio company appreciation. Outflows represent redemptions, other decreases in available capital and portfolio company depreciation. Realizations represent fund distributions of realized proceeds. Market activity represents gains (losses), the impact of foreign exchange rate fluctuations and other income. |
| |
| (2) | Outflows for Total AUM include redemptions of $325.3$273.9 million and $31.4$325.3 million during the three months ended September 30, 2017 and 2016, respectively. |
| |
| (3) | Includes foreign exchange impacts of $88.0 million, $1.0 billion and 2015, respectively.$43.3 million for private equity, credit and real assets, respectively, during the three months ended September 30, 2017. |
| |
(3)(4) | Includes foreign exchange impacts of $17.1 million, $173.3 million and $(11.1) million for private equity, credit and real estate,assets, respectively, during the three months ended September 30, 2016. |
| |
(4) | Includes foreign exchange impacts of $(55.5) million, $16.6 million and $(17.7) million for private equity, credit and real estate, respectively, during the three months ended September 30, 2015. |
| | | | For the Nine Months Ended September 30, | For the Nine Months Ended September 30, |
| | 2016 | | 2015 | 2017 | | 2016 |
| | Private Equity | | Credit | | Real Estate | | Total | | Private Equity | | Credit | | Real Estate | | Total | Private Equity | | Credit | | Real Assets | | Total | | Private Equity | | Credit | | Real Assets | | Total |
| | (in millions) | (in millions) |
Change in Total AUM(1): | | | | | | | | | | | | | | | | | | | | | | | | | | | | | | |
| Beginning of Period | $ | 37,502 |
| | $ | 121,361 |
| | $ | 11,260 |
| | $ | 170,123 |
| | $ | 41,299 |
| | $ | 108,959 |
| | $ | 9,538 |
| | $ | 159,796 |
| $ | 43,628 |
| | $ | 136,607 |
| | $ | 11,453 |
| | $ | 191,688 |
| | $ | 37,502 |
| | $ | 121,361 |
| | $ | 11,260 |
| | $ | 170,123 |
|
| Inflows | 5,005 |
| | 21,071 |
| | 2,047 |
| | 28,123 |
| | 1,523 |
| | 7,436 |
| | 2,436 |
| | 11,395 |
| 24,648 |
| | 21,314 |
| | 2,935 |
| | 48,897 |
| | 5,005 |
| | 21,071 |
| | 2,047 |
| | 28,123 |
|
Outflows(2) | (1,100 | ) | | (8,619 | ) | | (505 | ) | | (10,224 | ) | | (783 | ) | | (2,557 | ) | | (71 | ) | | (3,411 | ) | (74 | ) | | (3,302 | ) | | (388 | ) | | (3,764 | ) | | (1,100 | ) | | (8,619 | ) | | (505 | ) | | (10,224 | ) |
| Net Flows | 3,905 |
| | 12,452 |
| | 1,542 |
| | 17,899 |
| | 740 |
| | 4,879 |
| | 2,365 |
| | 7,984 |
| 24,574 |
| | 18,012 |
| | 2,547 |
| | 45,133 |
| | 3,905 |
| | 12,452 |
| | 1,542 |
| | 17,899 |
|
| Realizations | (512 | ) | | (1,226 | ) | | (1,956 | ) | | (3,694 | ) | | (3,723 | ) | | (1,653 | ) | | (1,299 | ) | | (6,675 | ) | (2,794 | ) | | (2,125 | ) | | (1,114 | ) | | (6,033 | ) | | (512 | ) | | (1,226 | ) | | (1,956 | ) | | (3,694 | ) |
Market Activity(3)(4) | 1,286 |
| | 2,809 |
| | 213 |
| | 4,308 |
| | (60 | ) | | 596 |
| | 178 |
| | 714 |
| 5,061 |
| | 5,431 |
| | 285 |
| | 10,777 |
| | 1,286 |
| | 2,809 |
| | 213 |
| | 4,308 |
|
| End of Period | $ | 42,181 |
| | $ | 135,396 |
| | $ | 11,059 |
| | $ | 188,636 |
| | $ | 38,256 |
| | $ | 112,781 |
| | $ | 10,782 |
| | $ | 161,819 |
| $ | 70,469 |
| | $ | 157,925 |
| | $ | 13,171 |
| | $ | 241,565 |
| | $ | 42,181 |
| | $ | 135,396 |
| | $ | 11,059 |
| | $ | 188,636 |
|
| |
| (1) | At the individual segment level, inflows include new subscriptions, commitments, capital raised, other increases in available capital, purchases, acquisitions and portfolio company appreciation. Outflows represent redemptions, other decreases in available capital and portfolio company depreciation. Realizations represent fund distributions of realized proceeds. Market activity represents gains (losses), the impact of foreign exchange rate fluctuations and other income. |
| |
| (2) | Outflows for Total AUM include redemptions of $1,190.9$693.6 million and $468.8$1,190.9 million during the nine months ended September 30, 20162017 and 2015,2016, respectively. |
| |
| (3) | Includes foreign exchange impacts of $209.6 million, $2.8 billion and $133.3 million for private equity, credit and real assets, respectively, during the nine months ended September 30, 2017. |
| |
| (4) | Includes foreign exchange impacts of $58.3 million, $318.8 million and $(91.5) million for private equity, credit and real estate,assets, respectively, during the nine months ended September 30, 2016. |
| |
(4) | Includes foreign exchange impacts of $(73.4) million, $(288.3) million and $(82.2) million for private equity, credit and real estate, respectively, during the nine months ended September 30, 2015. |
Assets Under Management
Total AUM was $188.6$241.6 billion at September 30, 2016,2017, an increase of $2.3$9.7 billion, or 1.2%4.2%, compared to $186.3$231.8 billion at June 30, 2016.2017. The net increase was primarily due to:
Net flows of $1.7$7.3 billion primarily related to:
a $0.8 billion increase related to funds we manage in the private equity segment consisting of subscriptions attributable to ANRP II of $1.1 billion and co-investments for a Fund VIII transaction of $0.3 billion, and net segment transfers of $0.2 billion, offset by a decrease in leverage of $0.6 billion;
a $0.6$6.1 billion increase related to funds we manage in the credit segment primarily consisting of subscriptions of $3.0 billion related to our liquid/performing funds, Financial Credit Investment III, L.P. (“FCI III”) and Apollo European Principal Finance Fund III, L.P. (“EPF III") of $1.0 billion, $1.0 billion and $0.8 billion, respectively, an increase in AUM relating to Athene of $3.5$2.4 billion and an increase in AUM relating to Advisory assets of $0.5 billion;
a $0.6 billion increase related to funds we manage in the private equity segment primarily consisting of subscriptions attributable to Fund IX of $1.1 billion, offset by a decrease in leverage of $2.9 billion primarily resulting from the ARI/AMTG transaction, net segment transfers of $0.8 billion and redemptions of $0.3$0.4 billion; and
a $0.3$0.6 billion increase related to funds we manage in the real assets segment primarily consisting of net segment transfers and subscriptions of $0.2 billion and $0.2 billion, respectively.
Market activity of $4.2 billion primarily related to $2.5 billion and $1.7 billion of appreciation in the funds we manage in the private equity and credit segments, respectively.
Offsetting these increases were:
Realizations of $1.7 billion primarily related to:
$1.0 billion related to funds we manage in the credit segment primarily consisting of distributions of $0.7 billion from Apollo European Principal Finance Fund II, L.P. (“EPF II”);
$0.4 billion related to funds we manage in the private equity segment primarily consisting of distributions from our traditional private equity funds; and
$0.3 billion related to funds we manage in the real assets segment primarily consisting of distributions from our real estate debt funds.
Total AUM was $241.6 billion at September 30, 2017, an increase of $49.9 billion, or 26.0%, compared to $191.7 billion at December 31, 2016. The net increase was primarily due to:
Net flows of $45.1 billion primarily related to:
a $24.6 billion increase related to funds we manage in the private equity segment primarily consisting of subscriptions attributable to Fund IX of $24.7 billion;
an $18.0 billion increase related to funds we manage in the credit segment primarily consisting of a net increase in AUM relating to Athene and AGER of $8.0 billion and $2.5 billion, respectively, subscriptions of $7.4 billion primarily related to our liquid/performing funds, EPF III and FCI III of $4.1 billion, $1.5 billion and $1.5 billion, respectively, and an increase in AUM relating to Advisory assets of $2.2 billion, offset by net segment transfers of $2.3 billion; and
a $2.5 billion increase related to funds we manage in the real assets segment primarily consisting of net segment transfers of $0.6$1.7 billion primarily resulting from the ARI/AMTG transaction, and subscriptions of $0.2 billion, offset by a decrease in leverage of $0.5$0.9 billion.
Market activity of $1.9$10.8 billion primarily related to $1.3$5.4 billion and $0.4$5.1 billion of appreciation in the funds we manage in the credit and private equity segments, respectively.
Offsetting these increases were:
Realizations of $1.2$6.0 billion primarily related to:
$0.6 billion related to funds we manage in the real estate segment primarily consisting of distributions of $0.3 billion from our real estate equity funds and $0.3 billion from our real estate debt funds;
$0.5 billion related to funds we manage in the credit segment primarily consisting of distributions of $0.2 billion from our drawdown funds and $0.2 billion from our liquid/performing funds; and
$0.22.8 billion related to funds we manage in the private equity segment primarily consisting of distributions of $0.1$1.8 billion, $0.6 billion and $0.4 billion from our traditional private equity funds.
Total AUM was $188.6 billion at September 30, 2016, an increase of $18.5 billion, or 10.9%, compared to $170.1 billion at December 31, 2015. The net increase was primarily due to:
Net flows of $17.9 billion primarily related to:
a $12.5 billion increase related to funds, we manage in the credit segment primarily consisting of $7.9 billion of acquisitions primarily attributable to advisory mandates for AAME, subscriptions of $4.5 billion and an increase in AUM relating to Athene of $6.9 billion, offset by a decrease in leverage of $5.5 billion, redemptions of $1.2 billion and net segment transfers of $1.3 billion;
a $3.9 billion increase related to funds we manage in the private equity segment consisting of subscriptions attributable to co-investments for Fund VIII transactions of $2.7 billion and ANRP II of $1.5 billion; and
a $1.5 billion increase related to funds we manage in the real estate segment primarily consisting of subscriptions of $0.7 billion and net segment transfers of $1.1 billion, offset by a decrease in leverage of $0.3 billion.
Market activity of $4.3 billion primarily related to $2.8 billion and $1.3 billion of appreciation in the funds we manage in the credit and private equity segments, respectively.
Offsetting these increases were:
Realizations of $3.7 billion primarily related to:
$2.0 billion related to funds we manage in the real estate segment primarily consisting of distributions of $1.1 billion from our real estate debtnatural resources funds and $0.9 billion from our real estate equity funds;co-investment vehicles, respectively;
$1.22.1 billion related to funds we manage in the credit segment primarily consisting of distributions of $0.6$1.0 billion, $0.5 billion and $0.5$0.4 billion infrom EPF II, other drawdown funds and liquid/performing funds, respectively; and
$0.51.1 billion related to funds we manage in the private equityreal assets segment primarily consisting of distributions of $0.4$0.9 billion and $0.1 billion infrom our traditional private equity funds and co-investment vehicles, respectively.real estate debt funds.
The following tables summarize changes in Fee-Generating AUM for each of Apollo’s three segments for the three and nine months ended September 30, 20162017 and 2015: 2016:
| | | | For the Three Months Ended September 30, | For the Three Months Ended September 30, |
| | 2016 | | 2015 | 2017 | | 2016 |
| | Private Equity | | Credit | | Real Estate | | Total | | Private Equity | | Credit | | Real Estate | | Total | Private Equity | | Credit | | Real Assets | | Total | | Private Equity | | Credit | | Real Assets | | Total |
| | (in millions) | (in millions) |
Change in Fee-Generating AUM(1): | Change in Fee-Generating AUM(1): | | | | | | | | | | | | | | | Change in Fee-Generating AUM(1): | | | | | | | | | | | | | | |
| Beginning of Period | $ | 29,530 |
| | $ | 108,774 |
| | $ | 7,124 |
| | $ | 145,428 |
| | $ | 28,468 |
| | $ | 92,667 |
| | $ | 7,154 |
| | $ | 128,289 |
| $ | 30,011 |
| | $ | 121,271 |
| | $ | 9,672 |
| | $ | 160,954 |
| | $ | 29,530 |
| | $ | 108,774 |
| | $ | 7,124 |
| | $ | 145,428 |
|
| Inflows | 1,221 |
| | 3,220 |
| | 986 |
| | 5,427 |
| | 1,582 |
| | 2,573 |
| | 211 |
| | 4,366 |
| 71 |
| | 6,699 |
| | 252 |
| | 7,022 |
| | 1,221 |
| | 3,220 |
| | 986 |
| | 5,427 |
|
Outflows(2) | (112 | ) | | (2,215 | ) | | — |
| | (2,327 | ) | | (696 | ) | | (449 | ) | | — |
| | (1,145 | ) | (32 | ) | | (1,418 | ) | | (349 | ) | | (1,799 | ) | | (112 | ) | | (2,215 | ) | | — |
| | (2,327 | ) |
| Net Flows | 1,109 |
| | 1,005 |
| | 986 |
| | 3,100 |
| | 886 |
| | 2,124 |
| | 211 |
| | 3,221 |
| 39 |
| | 5,281 |
| | (97 | ) | | 5,223 |
| | 1,109 |
| | 1,005 |
| | 986 |
| | 3,100 |
|
| Realizations | — |
| | (326 | ) | | (250 | ) | | (576 | ) | | (49 | ) | | (404 | ) | | (304 | ) | | (757 | ) | — |
| | (533 | ) | | (300 | ) | | (833 | ) | | — |
| | (326 | ) | | (250 | ) | | (576 | ) |
Market Activity(3) | (9 | ) | | 670 |
| | 56 |
| | 717 |
| | (5 | ) | | 279 |
| | 41 |
| | 315 |
| 17 |
| | 888 |
| | 9 |
| | 914 |
| | (9 | ) | | 670 |
| | 56 |
| | 717 |
|
| End of Period | $ | 30,630 |
| | $ | 110,123 |
| | $ | 7,916 |
| | $ | 148,669 |
| | $ | 29,300 |
| | $ | 94,666 |
| | $ | 7,102 |
| | $ | 131,068 |
| $ | 30,067 |
| | $ | 126,907 |
| | $ | 9,284 |
| | $ | 166,258 |
| | $ | 30,630 |
| | $ | 110,123 |
| | $ | 7,916 |
| | $ | 148,669 |
|
| |
| (1) | At the individual segment level, inflows include new subscriptions, commitments, capital raised, other increases in available capital, purchases, acquisitions and portfolio company appreciation. Outflows represent redemptions, other decreases in available capital and portfolio company depreciation. Realizations represent fund distributions of realized proceeds. Market activity represents gains (losses), the impact of foreign exchange rate fluctuations and other income. |
| |
| (2) | Outflows for Fee-Generating AUM include redemptions of $359.9$191.3 million and $31.2$359.9 million during the three months ended September 30, 20162017 and 2015,2016, respectively. |
| |
| (3) | Includes foreign exchange impacts of $443.0 million and $25.6 million for credit and real assets, respectively, during the three months ended September 30, 2017, and foreign exchange impacts of $75.3 million and $(11.9) million for credit and real estate,assets, respectively, during the three months ended September 30, 2016, and foreign exchange impacts of $7.9 million and $(15.6) million for credit and real estate, respectively, during the three months ended September 30, 2015.2016. |
| | | | For the Nine Months Ended September 30, | For the Nine Months Ended September 30, |
| | 2016 | | 2015 | 2017 | | 2016 |
| | Private Equity | | Credit | | Real Estate | | Total | | Private Equity | | Credit | | Real Estate | | Total | Private Equity | | Credit | | Real Assets | | Total | | Private Equity | | Credit | | Real Assets | | Total |
| | (in millions) | (in millions) |
Change in Fee-Generating AUM(1): | Change in Fee-Generating AUM(1): | | | | | | | | | | | | | | | Change in Fee-Generating AUM(1): | | | | | | | | | | | | | | |
| Beginning of Period | $ | 29,258 |
| | $ | 101,522 |
| | $ | 7,317 |
| | $ | 138,097 |
| | $ | 30,285 |
| | $ | 92,192 |
| | $ | 6,237 |
| | $ | 128,714 |
| $ | 30,722 |
| | $ | 111,781 |
| | $ | 8,295 |
| | $ | 150,798 |
| | $ | 29,258 |
| | $ | 101,522 |
| | $ | 7,317 |
| | $ | 138,097 |
|
| Inflows | 1,914 |
| | 11,841 |
| | 1,799 |
| | 15,554 |
| | 1,583 |
| | 5,999 |
| | 1,951 |
| | 9,533 |
| 303 |
| | 18,194 |
| | 2,082 |
| | 20,579 |
| | 1,914 |
| | 11,841 |
| | 1,799 |
| | 15,554 |
|
Outflows(2) | (416 | ) | | (3,589 | ) | | (46 | ) | | (4,051 | ) | | (785 | ) | | (3,023 | ) | | (111 | ) | | (3,919 | ) | (557 | ) | | (4,601 | ) | | (364 | ) | | (5,522 | ) | | (416 | ) | | (3,589 | ) | | (46 | ) | | (4,051 | ) |
| Net Flows | 1,498 |
| | 8,252 |
| | 1,753 |
| | 11,503 |
| | 798 |
| | 2,976 |
| | 1,840 |
| | 5,614 |
| (254 | ) | | 13,593 |
| | 1,718 |
| | 15,057 |
| | 1,498 |
| | 8,252 |
| | 1,753 |
| | 11,503 |
|
| Realizations | (77 | ) | | (762 | ) | | (1,191 | ) | | (2,030 | ) | | (1,781 | ) | | (1,359 | ) | | (1,016 | ) | | (4,156 | ) | (503 | ) | | (1,180 | ) | | (889 | ) | | (2,572 | ) | | (77 | ) | | (762 | ) | | (1,191 | ) | | (2,030 | ) |
Market Activity(3) | (49 | ) | | 1,111 |
| | 37 |
| | 1,099 |
| | (2 | ) | | 857 |
| | 41 |
| | 896 |
| 102 |
| | 2,713 |
| | 160 |
| | 2,975 |
| | (49 | ) | | 1,111 |
| | 37 |
| | 1,099 |
|
| End of Period | $ | 30,630 |
| | $ | 110,123 |
| | $ | 7,916 |
| | $ | 148,669 |
| | $ | 29,300 |
| | $ | 94,666 |
| | $ | 7,102 |
| | $ | 131,068 |
| $ | 30,067 |
| | $ | 126,907 |
| | $ | 9,284 |
| | $ | 166,258 |
| | $ | 30,630 |
| | $ | 110,123 |
| | $ | 7,916 |
| | $ | 148,669 |
|
| |
| (1) | At the individual segment level, inflows include new subscriptions, commitments, capital raised, other increases in available capital, purchases, acquisitions and portfolio company appreciation. Outflows represent redemptions, other decreases in available capital and portfolio company depreciation. Realizations represent fund distributions of realized proceeds. Market activity represents gains (losses), the impact of foreign exchange rate fluctuations and other income. |
| |
| (2) | Outflows for Fee-Generating AUM include redemptions of $944.6$570.3 million and $441.4$944.6 million during the three and nine months ended September 30, 20162017 and 2015,2016, respectively. |
| |
| (3) | Includes foreign exchange impacts of $1.3 billion and $64.7 million for credit and real assets, respectively, during the nine months ended September 30, 2017, and foreign exchange impacts of $209.2 million and $(30.6) million for credit and real estate,assets, respectively, during the nine months ended September 30, 2016, and foreign exchange impacts of $(235.6) million and $(39.5) million for credit and real estate, respectively, during the nine months ended September 30, 2015.2016. |
Total Fee-Generating AUM was $148.7$166.3 billion at September 30, 2016,2017, an increase of $3.3$5.3 billion or 2.3%3.3%, compared to $145.4$161.0 billion at June 30, 2016.2017. The net increase was primarily due to:
Net flows of $3.1$5.2 billion primarily related to:
a $1.1 billion increase related to funds we manage in the private equity segment primarily consisting of subscriptions attributable to ANRP II of $1.1 billion;
a $1.0$5.3 billion increase related to funds we manage in the credit segment primarily consisting of a $1.7subscriptions of $2.5 billion primarily related to FCI III, EPF III and our liquid/performing funds of $1.0 billion, $0.8 billion and $0.6 billion, respectively, an increase in AUM relating to Athene Holding, subscriptions of $0.8$2.4 billion and fee-generating capital deployment of $0.8$1.4 billion. This was offset by a decreasefee-generating capital reduction of $1.4 billion and net segment transfers of $0.2 billion.
Market activity of $0.9 billion primarily related to appreciation in leveragethe funds we manage in the credit segment.
Offsetting these increases were:
Realizations of $0.8 billion $0.6primarily related to:
$0.5 billion related to funds we manage in the credit segment primarily driven by distributions of $0.3 billion and $0.1 billion from EPF II and our liquid/performing funds, respectively; and
$0.3 billion related to funds we manage in the real assets segment primarily driven by our real estate debt funds.
Total Fee-Generating AUM was $166.3 billion at September 30, 2017, an increase of $15.5 billion or 10.3%, compared to $150.8 billion at December 31, 2016. The net increase was primarily due to:
Net flows of $15.1 billion primarily related to:
a $13.6 billion increase related to funds we manage in the credit segment primarily consisting of an increase in AUM relating to Athene of $8.0 billion, subscriptions of $5.6 billion primarily related to our liquid/performing funds, EPF III and FCI III of $2.6 billion, $1.5 billion and $1.5 billion, respectively, and an increase in fee-generating capital deployment of $3.2 billion. This was offset by net segment transfers of $1.4 billion, fee-generating capital reduction resulting from the ARI/AMTG transaction of $0.2$1.3 billion and redemptions of $0.2$0.5 billion; and
a $1.0$1.7 billion increase related to funds we manage in the real estateassets segment primarily consisting of $0.6 billion of net segment transfers primarily resulting from the ARI/AMTG transactionof $1.5 billion and subscriptions of $0.2$0.6 billion. This was offset by fee-generating capital reduction of $0.3 billion.
Market activity of $0.7$3.0 billion primarily related to appreciation in the funds we manage in the credit segment.
Offsetting these increases were:
Realizations of $0.6$2.6 billion primarily related to:
$0.31.2 billion related to funds we manage in the credit segment primarily driven by distributions of $0.2 billion from our liquid/performing funds, including returns to CLO investors,EPF II and distributionsour permanent capital vehicles of $0.1$0.4 billion, from our drawdown funds;$0.3 billion and $0.2 billion, respectively;
$0.30.9 billion related to funds we manage in the real estateassets segment primarily driven by distributions of $0.2 billion from our real estate debt funds.
Total Fee-Generating AUM was $148.7 billion at September 30, 2016, an increase of $10.6 billion or 7.7%, compared to $138.1 billion at December 31, 2015. The net increase was primarily due to:
Net flows of $11.5 billion primarily related to:
an $8.3 billion increase related to funds we manage in the credit segment primarily consisting of a $5.1 billion increase in AUM relating to Athene Holding, subscriptions of $2.4 billion, $1.0 billion in new equity and origination at MidCap, and fee-generating capital deployment of $1.4 billion. This was partially offset by $0.9 billion of redemptions and $0.8 billion of net segment transfers;funds; and
a $1.8 billion increase related to funds we manage in the real estate segment primarily consisting of subscriptions of $0.4 billion and net segment transfers of $1.0 billion.
Market activity of $1.1 billion primarily related to appreciation in the funds we manage in the credit segment.
Offsetting these increases were:
Realizations of $2.0 billion primarily related to:
$1.20.5 billion related to funds we manage in the real estateprivate equity segment primarily driven by distributions of $0.8$0.3 billion from our real estate debt funds and $0.4 billion from our real estatetraditional private equity funds; and
$0.8 billion related to funds we manage in the credit segment primarily driven by certain of our liquid/performing funds, including returns to CLO investors, and distributions of $0.2 billion from permanent capital vehicles.funds.
Capital Deployed and Uncalled Commitments
Capital deployed is the aggregate amount of capital that has been invested during a given period by our drawdown funds, SIAs that have a defined maturity date and funds and SIAs in our real estate debt strategy. Uncalled commitments, by contrast, represents unfunded capital commitments that certain of Apollo’s funds and SIAs have received from fund investors to fund future or current fund investments and expenses.
Capital deployed and uncalled commitments are indicative of the pace and magnitude of fund capital that is deployed or will be deployed, and which therefore could result in future revenues that include management fees, transaction fees and incentive income to the extent they are fee-generating. Capital deployed and uncalled commitments can also give rise to future costs that are related to the hiring of additional resources to manage and account for the additional capital that is deployed or will be deployed. Management uses capital deployed and uncalled commitments as key operating metrics since we believe the results measure our fund’s investment activities.
Capital Deployed
The following table summarizes by segment the capital deployed for funds and SIAs with a defined maturity date and certain funds and SIAs in Apollo’s real estate debt strategy during the specified reporting periods:
| | | | For the Three Months Ended September 30, | | For the Nine Months Ended September 30, | For the Three Months Ended September 30, | | For the Nine Months Ended September 30, |
| | 2016 | | 2015 | | 2016 | | 2015 | 2017 | | 2016 | | 2017 | | 2016 |
| | (in millions) | | (in millions) | (in millions) |
| Private Equity | $ | 3,048 |
| | $ | 1,449 |
| | $ | 8,187 |
| | $ | 3,360 |
| $ | 1,129 |
| | $ | 3,048 |
| | $ | 3,417 |
| | $ | 8,187 |
|
| Credit | 729 |
| | 1,826 |
| | 2,686 |
| | 3,941 |
| 1,430 |
| | 729 |
| | 3,577 |
| | 2,686 |
|
Real Estate(1) | 567 |
| | 640 |
| | 1,550 |
| | 1,728 |
| |
Real Assets(1) | | 712 |
| | 567 |
| | 2,324 |
| | 1,550 |
|
| Total capital deployed | $ | 4,344 |
| | $ | 3,915 |
| | $ | 12,423 |
| | $ | 9,029 |
| $ | 3,271 |
| | $ | 4,344 |
| | $ | 9,318 |
| | $ | 12,423 |
|
| |
| (1) | Included in capital deployed is $690 million and $2,152 million for the three and nine months ended September 30, 2017, respectively, and $498 million and $1,405 million for the three and nine months ended September 30, 2016, respectively, and $569 million and $1,561 million for the three and nine months ended September 30, 2015, respectively, related to funds in Apollo’s real estate debt strategy. |
Uncalled Commitments
The following table summarizes the uncalled commitments by segment during the specified reporting periods:
| | | | As of
September 30, 2016 | | As of
December 31, 2015 | As of
September 30, 2017 | | As of
December 31, 2016 |
| | (in millions) | (in millions) |
| Private Equity | $ | 16,719 |
| | $ | 19,487 |
| $ | 37,786 |
| | $ | 16,079 |
|
| Credit | 8,887 |
| | 8,557 |
| 15,168 |
| | 11,816 |
|
| Real Estate | 1,507 |
| | 984 |
| |
| Real Assets | | 1,399 |
| | 1,414 |
|
Total uncalled commitments(1) | $ | 27,113 |
| | $ | 29,028 |
| $ | 54,353 |
| | $ | 29,309 |
|
| |
| (1) | As of September 30, 20162017 and December 31, 2015, $24.42016, $48.8 billion and $26.1$25.9 billion, respectively, represented the amount of capital available for investment or reinvestment subject to the provisions of the applicable limited partnership agreements or other governing agreements of our funds.the funds, partnerships and accounts we manage. These amounts exclude uncalled commitments which can only be called for fund fees and expenses. |
The Historical Investment Performance of Our Funds
Below we present information relating to the historical performance of our funds, including certain legacy Apollo funds that do not have a meaningful amount of unrealized investments, and in respect of which the general partner interest has not been contributed to us.
When considering the data presented below, you should note that the historical results of our funds are not indicative of the future results that you should expect from such funds, from any future funds we may raise or from your investment in our Class A shares.
An investment in our Class A shares is not an investment in any of the Apollo funds, and the assets and revenues of our funds are not directly available to us. The historical and potential future returns of the funds we manage are not directly linked to returns on our Class A shares. Therefore, you should not conclude that continued positive performance of the funds we manage will necessarily result in positive returns on an investment in our Class A shares. However, poor performance of the funds that we manage would cause a decline in our revenue from such funds, and would therefore have a negative effect on our performance and in all likelihood the value of our Class A shares.
Moreover, the historical returns of our funds should not be considered indicative of the future results you should expect from such funds or from any future funds we may raise. There can be no assurance that any Apollo fund will continue to achieve the same results in the future.
Finally, our private equity IRRs have historically varied greatly from fund to fund. For example, Fund IV generated a 12% gross IRR and a 9% net IRR since its inception through September 30, 2016,2017, while Fund V generated a 61% gross IRR and a 44% net IRR since its inception through September 30, 2016.2017. Accordingly, the IRR going forward for any current or future fund may vary considerably from the historical IRR generated by any particular fund, or for our private equity funds as a whole. Future returns will also be affected by the applicable risks, including risks of the industries and businesses in which a particular fund invests. See “Item 1A. Risk Factors—Risks Related to Our Businesses—The historical returns attributable to our funds should not be considered as indicative of the future results of our funds or of our future results or of any returns expected on an investment in our Class A shares” in the 20152016 Annual Report.
Investment Record
The following table summarizes the investment record by segment of Apollo’s significant drawdown funds and SIAs that have a defined maturity date in which investors make a commitment to provide capital at the formation of such funds and deliver capital when called as investment opportunities become available. The funds included in the investment record table below have greater than $500 million of AUM and/or form part of a flagship series of funds. The SIAs included in the investment record table below have greater than $200 million of AUM and did not predominantly invest in other Apollo funds or SIAs.
All amounts are as of September 30, 20162017, unless otherwise noted:
| | | | | | | | | | | | | | | | | | | | As of
September 30, 2016 | | | | | | | | | | | | | | | | | | As of
September 30, 2017 | |
| ($ in millions) | Vintage
Year | | Total AUM | | Committed
Capital | | Total Invested Capital(1) | | Realized Value(1) | | Remaining Cost(1) | | Unrealized Value(1) | | Total Value(1) | | Gross
IRR(1) | | Net
IRR(1) | | Vintage
Year | | Total AUM | | Committed
Capital | | Total Invested Capital(1) | | Realized Value(1) | | Remaining Cost(1) | | Unrealized Value(1) | | Total Value(1) | | Gross
IRR(1) | | Net
IRR(1) | |
| Private Equity: | | | | | | | | | | | | | | | | | | | | | | | | | | | | | | | | | | | | | | |
| Fund IX | | N/A | | $ | 24,729 |
| | $ | 24,729 |
| | $ | — |
| | $ | — |
| | $ | — |
| | $ | — |
| | $ | — |
| | — | % | | — | % | |
| Fund VIII | 2013 | | $ | 19,933 |
| | $ | 18,377 |
| | $ | 9,481 |
| | $ | 806 |
| | $ | 8,792 |
| | $ | 10,741 |
| | $ | 11,547 |
| | 27 | % | | 13 | % | | 2013 | | 22,318 |
| | 18,377 |
| | 12,023 |
| | 2,342 |
| | 10,411 |
| | 15,248 |
| | 17,590 |
| | 29 |
| | 19 |
| |
| Fund VII | 2008 | | 6,600 |
| | 14,677 |
| | 15,945 |
| | 28,890 |
| | 3,826 |
| | 4,009 |
| | 32,899 |
| | 35 |
| | 26 |
| | 2008 | | 5,901 |
| | 14,677 |
| | 16,173 |
| | 29,874 |
| | 3,499 |
| | 3,613 |
| | 33,487 |
| | 34 |
| | 26 |
| |
| Fund VI | 2006 | | 3,292 |
| | 10,136 |
| | 12,457 |
| | 17,961 |
| | 3,545 |
| | 2,661 |
| | 20,622 |
| | 12 |
| | 9 |
| | 2006 | | 3,551 |
| | 10,136 |
| | 12,457 |
| | 18,356 |
| | 3,151 |
| | 2,933 |
| | 21,289 |
| | 12 |
| | 10 |
| |
| Fund V | 2001 | | 365 |
| | 3,742 |
| | 5,192 |
| | 12,681 |
| | 154 |
| | 107 |
| | 12,788 |
| | 61 |
| | 44 |
| | 2001 | | 309 |
| | 3,742 |
| | 5,192 |
| | 12,697 |
| | 138 |
| | 52 |
| | 12,749 |
| | 61 |
| | 44 |
| |
Fund I, II, III, IV and MIA(3) | Various | | 37 |
| | 7,320 |
| | 8,753 |
| | 17,400 |
| | — |
| | 23 |
| | 17,423 |
| | 39 |
| | 26 |
| | |
Fund I, II, III, IV & MIA(3) | | Various | | 15 |
| | 7,320 |
| | 8,753 |
| | 17,400 |
| | — |
| | 1 |
| | 17,401 |
| | 39 |
| | 26 |
| |
Traditional Private Equity Funds(4) | | $ | 30,227 |
| | $ | 54,252 |
| | $ | 51,828 |
| | $ | 77,738 |
| | $ | 16,317 |
| | $ | 17,541 |
| | $ | 95,279 |
| | 39 | % | | 25 | % | | | $ | 56,823 |
| | $ | 78,981 |
| | $ | 54,598 |
| | $ | 80,669 |
| | $ | 17,199 |
| | $ | 21,847 |
| | $ | 102,516 |
| | 39 | % | | 25 | % | |
| ANRP II | | 2016 | | 3,505 |
| | 3,454 |
| | 970 |
| | 491 |
| | 751 |
| | 965 |
| | 1,456 |
| | 57 |
| | 32 |
| |
| ANRP I | | 2012 | | 1,197 |
| | 1,323 |
| | 1,095 |
| | 596 |
| | 752 |
| | 910 |
| | 1,506 |
| | 12 |
| | 8 |
| |
| AION | 2013 | | 724 |
| | 826 |
| | 324 |
| | 93 |
| | 264 |
| | 252 |
| | 345 |
| | 6 | % | | (8 | )% | | 2013 | | 726 |
| | 826 |
| | 407 |
| | 189 |
| | 265 |
| | 287 |
| | 476 |
| | 11 |
| | (1 | ) | |
| ANRP I | 2012 | | 1,400 |
| | 1,323 |
| | 998 |
| | 225 |
| | 846 |
| | 1,028 |
| | 1,253 |
| | 11 |
| | 6 |
| | |
| ANRP II | 2016 | | 3,422 |
| | 3,354 |
| | 518 |
| | 87 |
| | 462 |
| | 606 |
| | 693 |
| | NM |
| (2) | NM |
| (2) | |
Total Private Equity(9) | | $ | 35,773 |
| | $ | 59,755 |
| | $ | 53,668 |
| | $ | 78,143 |
| | $ | 17,889 |
| | $ | 19,427 |
| | $ | 97,570 |
| | | | | | | $ | 62,251 |
| | $ | 84,584 |
| | $ | 57,070 |
| | $ | 81,945 |
| | $ | 18,967 |
| | $ | 24,009 |
| | $ | 105,954 |
| | | | | |
| Credit: | | | | | | | | | | | | | | | | | | | | | | | | | | | | | | | | | | | | | | |
| Credit Opportunity Funds | | | | | | | | | | | | | | | | | | | | | | | | | | | | | | | | | | | | | | |
| COF III | 2014 | | $ | 3,130 |
| | $ | 3,426 |
| | $ | 3,889 |
| | $ | 1,081 |
| | $ | 2,571 |
| | $ | 2,305 |
| | $ | 3,386 |
| | (5 | )% | | (6 | )% | | 2014 | | $ | 3,186 |
| | $ | 3,426 |
| | $ | 4,769 |
| | $ | 2,676 |
| | $ | 2,258 |
| | $ | 2,113 |
| | $ | 4,789 |
| | — | % | | (1 | )% | |
| COF I and II | 2008 | | 457 |
| | 3,068 |
| | 3,787 |
| | 7,372 |
| | 137 |
| | 161 |
| | 7,533 |
| | 23 |
| | 20 |
| | |
| COF I & II | | 2008 | | 458 |
| | 3,068 |
| | 3,787 |
| | 7,397 |
| | 126 |
| | 177 |
| | 7,574 |
| | 23 |
| | 20 |
| |
| European Principal Finance Funds | | | | | | | | | | | | | | | | | | | | | | | | | | | | | | | | | | | | | | |
EPF II(5) | 2012 | | 4,137 |
| | 3,438 |
| | 3,465 |
| | 1,375 |
| | 2,089 |
| | 3,221 |
| | 4,596 |
| | 20 |
| | 11 |
| | |
EPF I(5) | 2007 | | 305 |
| | 1,450 |
| | 1,906 |
| | 3,134 |
| | — |
| | 70 |
| | 3,204 |
| | 23 |
| | 17 |
| | |
EPF III(5) | | 2017 | | 4,214 |
| | 4,272 |
| | 194 |
| | — |
| | 194 |
| | 199 |
| | 199 |
| | NM |
| (2) | NM |
| (2) |
EPF I & II(5) | | Various | | 3,863 |
| | 5,020 |
| | 5,971 |
| | 5,781 |
| | 1,532 |
| | 2,814 |
| | 8,595 |
| | 21 |
| | 14 |
| |
| Structured Credit Funds | | | | | | | | | | | | | | | | | | | | | | | | | | | | | | | | | | | | | | |
| FCI II | 2013 | | 2,517 |
| | 1,555 |
| | 1,884 |
| | 490 |
| | 1,625 |
| | 2,039 |
| | 2,529 |
| | 19 |
| | 15 |
| | |
| FCI | 2012 | | 1,043 |
| | 559 |
| | 1,194 |
| | 789 |
| | 790 |
| | 834 |
| | 1,623 |
| | 16 |
| | 13 |
| | |
| FCI III | | 2017 | | 1,912 |
| | 1,906 |
| | 118 |
| | 12 |
| | 96 |
| | 115 |
| | 127 |
| | NM |
| (2) | NM |
| (2) |
| FCI I & II | | Various | | 3,573 |
| | 2,114 |
| | 3,498 |
| | 1,926 |
| | 2,501 |
| | 2,604 |
| | 4,530 |
| | 14 |
| | 10 |
| |
SCRF III (12) | 2015 | | 1,086 |
| | 1,238 |
| | 1,423 |
| | 461 |
| | 786 |
| | 1,206 |
| | 1,667 |
| | 17 |
| | 14 |
| | 2015 | | 1,002 |
| | 1,238 |
| | 1,840 |
| | 1,604 |
| | 540 |
| | 560 |
| | 2,164 |
| | 18 |
| | 14 |
| |
SCRF I and II12) | Various | | 13 |
| | 222 |
| | 707 |
| | 872 |
| | 8 |
| | 14 |
| | 886 |
| | 27 |
| | 21 |
| | |
SCRF I & II(12) | | Various | | — |
| | 222 |
| | 707 |
| | 885 |
| | — |
| | — |
| | 885 |
| | 27 |
| | 21 |
| |
Other Drawdown Funds & SIAs(6) | Various | | 6,195 |
| | 8,184 |
| | 6,975 |
| | 7,055 |
| | 1,972 |
| | 1,771 |
| | 8,826 |
| | 9 |
| | 6 |
| | Various | | 7,126 |
| | 9,498 |
| | 8,959 |
| | 8,617 |
| | 2,673 |
| | 2,532 |
| | 11,149 |
| | 9 |
| | 7 |
| |
Total Credit(10) | | $ | 18,883 |
| | $ | 23,140 |
|
| $ | 25,230 |
| | $ | 22,629 |
| | $ | 9,978 |
| | $ | 11,621 |
| | $ | 34,250 |
| | | | | | | $ | 25,334 |
| | $ | 30,764 |
|
| $ | 29,843 |
| | $ | 28,898 |
| | $ | 9,920 |
| | $ | 11,114 |
| | $ | 40,012 |
| | | | | |
| Real Estate: | | | | | | | | | | | | | | | | | | | | |
| Real Assets: | | | | | | | | | | | | | | | | | | | | |
U.S. RE Fund II(7) | 2016 | | $ | 649 |
| | $ | 651 |
| | $ | 402 |
| | $ | 62 |
| | $ | 378 |
| | $ | 396 |
| | $ | 458 |
| | NM |
| (2) | NM |
| (2) | 2016 | | $ | 934 |
| | $ | 863 |
| | $ | 443 |
| | $ | 154 |
| | $ | 374 |
| | $ | 454 |
| | $ | 608 |
| | 21 | % | | 19 | % | |
U.S. RE Fund I(7) | 2012 | | 526 |
| | 651 |
| | 627 |
| | 560 |
| | 288 |
| | 346 |
| | 906 |
| | 17 | % | | 13 | % | | 2012 | | 474 |
| | 654 |
| | 636 |
| | 635 |
| | 245 |
| | 312 |
| | 947 |
| | 16 |
| | 13 |
| |
AGRE Debt Fund I(13) | 2011 | | 819 |
| | 1,803 |
| | 1,729 |
| | 1,146 |
| | 802 |
| | 742 |
| | 1,888 |
| | 7 |
| | 6 |
| | 2011 | | 1,152 |
| | 2,091 |
| | 2,084 |
| | 1,457 |
| | 861 |
| | 823 |
| | 2,280 |
| | 8 |
| | 7 |
| |
CPI Funds(8) | Various | | 677 |
| | 4,996 |
| | 2,527 |
| | 2,567 |
| | 359 |
| | 114 |
| | 2,681 |
| | 15 |
| | 12 |
| | Various | | 597 |
| | 5,011 |
| | 2,578 |
| | 2,621 |
| | 268 |
| | 84 |
| | 2,705 |
| | 15 |
| | 11 |
| |
Total Real Estate(11) | | $ | 2,671 |
| | $ | 8,101 |
| | $ | 5,285 |
| | $ | 4,335 |
| | $ | 1,827 |
| | $ | 1,598 |
| | $ | 5,933 |
| | | | | | |
Asia RE Fund(7) | | 2017 | | 586 |
| | 588 |
| | 175 |
| | 2 |
| | 173 |
| | 185 |
| | 187 |
| | NM |
| (2) | NM |
| (2) |
Total Real Assets(11) | | | $ | 3,743 |
| | $ | 9,207 |
| | $ | 5,916 |
| | $ | 4,869 |
| | $ | 1,921 |
| | $ | 1,858 |
| | $ | 6,727 |
| | | | | |
| |
| (1) | Refer to the definitions of Vintage Year, Total Invested Capital, Realized Value, Remaining Cost, Unrealized Value, Total Value, Gross IRR and Net IRR described elsewhere in this report. |
| |
| (2) | Returns have not been presented as the fund commenced investing capital less than 24 months prior to the period indicated and therefore such return information was deemed not meaningful. |
| |
| (3) | The general partners and managers of Funds I, II and MIA, as well as the general partner of Fund III, were excluded assets in connection with the 2007 Reorganization. As a result, Apollo did not receive the economics associated with these entities. The investment performance of these funds, combined with Fund IV, is presented to illustrate fund performance associated with Apollo’s Managing Partners and other investment professionals. |
| |
| (4) | Total IRR is calculated based on total cash flows for all funds presented. |
| |
| (5) | Funds are denominated in Euros and historical figures are translated into U.S. dollars at an exchange rate of €1.00 to $1.12$1.18 as of September 30, 2016.2017. |
| |
| (6) | Amounts presented have been aggregated for (i) drawdown funds with AUM greater than $500 million that do not form part of a flagship series of funds and (ii) SIAs with AUM greater than $200 million that do not predominantly invest in other Apollo funds or SIAs. Certain SIAs’ historical figures are denominated in Euros and translated into U.S. dollars at an exchange rate of €1.00 to $1.12$1.18 as of September 30, 2016.2017. Additionally, certain SIAs totaling $1.8 billion of AUM have been excluded from Total Invested Capital, Realized Value, Remaining Cost, Unrealized Value and Total Value. These SIAs have an open ended life and a significant turnover in their portfolio assets due to the ability to recycle capital. These SIAs had $9.0 billion of Total Invested Capital through September 30, 2016. |
and Total Value. These SIAs have an open ended life and a significant turnover in their portfolio assets due to the ability to recycle capital. These SIAs had $10.3 billion of Total Invested Capital through September 30, 2017.
| |
| (7) | U.S. RE Fund I, and U.S. RE Fund II closed-end private investment funds,and Asia RE Fund had $150$158 million, $390 million and $178$245 million of co-investment commitments raised as of September 30, 2016,2017, respectively, which are included in the figures in the table. A co-invest entity within U.S. RE Fund I is denominated in GBP and translated into U.S. dollars at an exchange rate of £1.00 to $1.30$1.34 as of September 30, 2016.2017. |
| |
| (8) | As part of the acquisition of Citi Property Investors (“CPI”), Apollo acquired general partner interests in fully invested funds. CPI Funds refers to CPI Capital Partners North America, CPI Capital Partners Asia Pacific, CPI Capital Partners Europe and other CPI funds or individual investments of which Apollo is not the general partner or manager and only receives fees pursuant to either a sub-advisory agreement or an investment management and administrative agreement. For CPI Capital Partners North America, CPI Capital Partners Asia Pacific and CPI Capital Partners Europe, the gross and net IRRs are presented in the investment record table since acquisition on November 12, 2010. The aggregate net IRR for these funds from their inception to September 30, 20162017 was (1)(2)%. This net IRR was primarily achieved during a period in which Apollo did not make the initial investment decisions and Apollo only became the general partner or manager of these funds upon completing the acquisition on November 12, 2010. |
| |
| (9) | Certain privatePrivate equity co-investment vehicles, and funds with AUM less than $500 million have been excluded. These co-investment vehicles and funds had $6.4$8.2 billion of aggregate AUM as of September 30, 2016.2017. |
| |
| (10) | Certain credit funds and SIAs with AUM less than $500 million and $200 million, respectively, have been excluded. These funds and SIAs had $2.1$1.7 billion of aggregate AUM as of September 30, 2016.2017. |
| |
| (11) | Certain accounts owned by or related to Athene, certain co-investment vehicles and certain funds with AUM less than $500 million have been excluded. These accounts, co-investment vehicles and funds had $5.0$5.3 billion of aggregate AUM as of September 30, 2016.2017. |
| |
| (12) | Remaining cost for certain of our credit funds may include physical cash called, invested or reserved for certain levered investments. |
| |
| (13) | The investorsinvestor in this U.S. Dollar denominated fund havehas chosen to make contributions and receive distributions in the local currency of each underlying investment. As a result, Apollo has not entered into foreign currency hedges for this fund and the returns presented include the impact of foreign currency gains or losses. The investor’s gross and net IRR, before the impact of foreign currency gains or losses, from the fund’s inception to September 30, 20162017 was 10% and 9%, respectively. |
Private Equity
The following table summarizes the investment record for distressed investments made in our traditional private equity fund portfolios, since the Company’s inception. All amounts are as of September 30, 2016:2017:
| | | | Total Invested
Capital | | Total Value | | Gross IRR | Total Invested
Capital | | Total Value | | Gross IRR |
| | (in millions) | | | (in millions) | | |
| Distressed for Control | $ | 6,899 |
| | $ | 18,066 |
| | 29 | % | $ | 7,885 |
| | $ | 18,777 |
| | 29 | % |
| Non-Control Distressed | 6,338 |
| | 8,855 |
| | 71 |
| 5,416 |
| | 8,414 |
| | 71 |
|
| Total | 13,237 |
| | 26,921 |
| | 49 |
| 13,301 |
| | 27,191 |
| | 49 |
|
Corporate Carve-outs, Opportunistic Buyouts and Other Credit(1) | 38,591 |
| | 68,358 |
| | 22 |
| 41,297 |
| | 75,325 |
| | 22 |
|
| Total | $ | 51,828 |
| | $ | 95,279 |
| | 39 | % | $ | 54,598 |
| | $ | 102,516 |
| | 39 | % |
| |
| (1) | Other Credit is defined as investments in debt securities of issuers other than portfolio companies that are not considered to be distressed. |
The following tables provide additional detail on the composition of the Fund VIII, Fund VII Fund VI and Fund VVI private equity portfolios based on investment strategy. Amounts for Fund I, II, III, IV and IVV are included in the table above but not presented below as their remaining value is less than $100 million or the fund has been liquidated. All amounts are as of September 30, 2016:2017:
Fund VIII(1)
| | | | Total Invested Capital | | Total Value | Total Invested Capital | | Total Value |
| | (in millions) | (in millions) |
| Corporate Carve-outs | $ | 2,283 |
|
| $ | 3,144 |
| $ | 2,318 |
|
| $ | 3,889 |
|
| Opportunistic Buyouts | 6,700 |
|
| 7,746 |
| 9,191 |
|
| 12,956 |
|
| Distressed | 498 |
|
| 657 |
| 514 |
|
| 745 |
|
| Total | $ | 9,481 |
| | $ | 11,547 |
| $ | 12,023 |
| | $ | 17,590 |
|
Fund VII(1)
| | | | Total Invested
Capital | | Total Value | Total Invested
Capital | | Total Value |
| | (in millions) | (in millions) |
| Corporate Carve-outs | $ | 2,299 |
|
| $ | 5,356 |
| $ | 2,252 |
|
| $ | 4,463 |
|
| Opportunistic Buyouts | 4,111 |
|
| 9,252 |
| 4,338 |
|
| 10,507 |
|
Distressed/Other Credit(2) | 9,535 |
|
| 18,291 |
| 9,583 |
|
| 18,517 |
|
| Total | $ | 15,945 |
| | $ | 32,899 |
| $ | 16,173 |
| | $ | 33,487 |
|
Fund VI
|
| | | | | | | |
| | Total Invested
Capital | | Total Value |
| | (in millions) |
| Corporate Carve-outs | $ | 3,216 |
|
| $ | 3,993 |
|
| Opportunistic Buyouts | 6,555 |
|
| 11,664 |
|
Distressed/Other Credit(2) | 2,686 |
|
| 4,965 |
|
| Total | $ | 12,457 |
| | $ | 20,622 |
|
Fund V
| | | | Total Invested
Capital | | Total Value | Total Invested
Capital | | Total Value |
| | (in millions) | (in millions) |
| Corporate Carve-outs | $ | 1,605 |
|
| $ | 4,958 |
| $ | 3,397 |
|
| $ | 5,819 |
|
| Opportunistic Buyouts | 2,165 |
|
| 5,333 |
| 6,374 |
|
| 10,496 |
|
| Distressed | 1,422 |
|
| 2,497 |
| |
Distressed/Other Credit(2) | | 2,686 |
|
| 4,974 |
|
| Total | $ | 5,192 |
| | $ | 12,788 |
| $ | 12,457 |
| | $ | 21,289 |
|
| |
| (1) | Committed capital less unfunded capital commitments for Fund VIII and Fund VII was $9.6$11.5 billion and $13.8$14.1 billion, respectively, which represents capital commitments from limited partners to invest in such funds less capital that is available for investment or reinvestment subject to the provisions of the applicable limited partnership agreement or other governing agreements. |
| |
| (2) | The Distresseddistressed investment strategy includes distressed for control, non-control distressed and other credit. |
During the recovery and expansionary periods of 1994 through 2000 and late 2003 through the first half of 2007, our private equity funds invested or committed to invest approximately $13.7 billion primarily in traditional and corporate partner buyouts. During the recessionary periods of 1990 through 1993, 2001 through late 2003 and the recessionary and post recessionary periods (beginning the second half of 2007 through September 30, 2016)2017), our private equity funds have invested $41.6$43.2 billion, of which $18.5$18.8 billion was in distressed buyouts and debt investments when the debt securities of quality companies traded at deep discounts to par value. Our average entry multiple for Fund VIII, VII and VI was 5.7x, 6.1x and V was 5.6x, 6.1x, 7.7x, and 6.6x, respectively, as of September 30, 2016, and actively investing funds may include committed investments not yet closed.2017. Our average entry multiple for a private equity fund is the average of the total enterprise value over an applicable adjusted earnings before interest, taxes,
depreciation and amortization which may incorporate certain adjustments based on the investment team’s estimate and we believe captures the true economics of our funds’ investments in portfolio companies. The average entry multiple of actively investing funds may include committed investments not yet closed.
Credit
The following table presents the AUM and gross and net returns information for Apollo’s credit segment by category type:
| | | | | | | | | | | | | | | | | | As of September 30, 2017 | | Gross Returns(1) | | Net Returns(1) |
| | As of September 30, 2016 | | Gross Returns(1) | | Net Returns(1) | AUM | | Fee-Generating AUM | | Carry-Eligible AUM | | Carry-Generating AUM | | For the Three Months Ended September 30, 2017 | | For the Nine Months Ended September 30, 2017 | | For the Three Months Ended September 30, 2017 | | For the Nine Months Ended September 30, 2017 |
| Category | AUM | | Fee-Generating AUM | | Carry-Eligible AUM | | Carry-Generating AUM | | For the Three Months Ended September 30, 2016 | | For the Nine Months Ended September 30, 2016 | | For the Three Months Ended September 30, 2016 | | For the Nine Months Ended September 30, 2016 | (in millions) | |
| | (in millions) | | |
| Liquid/Performing | $ | 36,733 |
| | $ | 32,570 |
| | $ | 19,661 |
| | $ | 15,009 |
| | 3.6% | | 7.9% | | 3.4% | | 7.4% | $ | 41,765 |
| | $ | 36,176 |
| | $ | 21,245 |
| | $ | 9,292 |
| | 1.4% | | 4.9% | | 1.3% | | 4.5% |
Drawdown(2) | 20,954 |
| | 12,122 |
| | 18,871 |
| | 7,785 |
| | 4.6 | | 13.0 | | 4.1 | | 11.3 | 27,223 |
| | 17,253 |
| | 22,634 |
| | 8,235 |
| | 2.7 | | 8.2 | | 2.2 | | 6.8 |
Permanent capital vehicles ex Athene Non-Sub-Advised(3) | 11,866 |
| | 10,699 |
| | 9,517 |
| | 8,854 |
| | 4.4 | | 6.7 | | 3.4 | | 3.9 | 12,978 |
| | 12,165 |
| | 10,404 |
| | 9,107 |
| | 2.9 | | 8.8 | | 2.0 | | 5.9 |
Athene Non-Sub-Advised(3) | 56,532 |
| | 54,732 |
| | — |
| | — |
| | N/A | | N/A | | N/A | | N/A | 57,029 |
| | 57,029 |
| | — |
| | — |
| | N/A | | N/A | | N/A | | N/A |
Advisory(4) | 9,311 |
| | — |
| | — |
| | — |
| | N/A | | N/A | | N/A | | N/A | |
AGER Non-Sub-Advised(3) | | 6,747 |
| | 4,284 |
| | — |
| | — |
| | N/A | | N/A | | N/A | | N/A |
| Advisory | | 12,183 |
| | — |
| | — |
| | — |
| | N/A | | N/A | | N/A | | N/A |
| Total Credit | $ | 135,396 |
| | $ | 110,123 |
| | $ | 48,049 |
| | $ | 31,648 |
| | 3.9% | | 9.0% | | 3.5% | | 7.9% | $ | 157,925 |
| | $ | 126,907 |
| | $ | 54,283 |
| | $ | 26,634 |
| | 1.9% | | 6.0% | | 1.6% | | 5.1% |
| |
| (1) | The gross and net returns for the three and nine months ended September 30, 20162017 for total credit excludes assets managed by AAM that are not directly invested in Apollo funds and investment vehicles or sub-advised by Apollo. |
| |
| (2) | As of September 30, 2016,2017, significant drawdown funds and SIAs had inception-to-date gross and net IRRs of 16.5%16.0% and 12.7%12.2%, respectively. Significant drawdown funds and SIAs include funds and SIAs with AUM greater than $200 million that do not predominantly invest in other Apollo funds or SIAs. |
| |
| (3) | Athene Non-Sub-Advised and AGER Non-Sub-Advised reflects total Athene-relatedcombined AUM of $71.8$81.9 billion less $15.3$18.1 billion of assets that were either sub-advised by Apollo or invested in funds and investment vehicles managed by Apollo. AtheneApollo included within other asset categories. AGER Non-Sub-Advised includes $5.0$4.2 billion of Athene AUM for which AAME a subsidiary of Apollo, provides investment advisory services. |
| |
(4) | Advisory refers to certain assets advised by AAME. AAME is a subsidiary of Apollo which provides asset allocation and risk management advisory services principally to certain of the insurance and bank institutions acquired by Apollo managed funds on either a cost reimbursement or low margin basis. |
Liquid/Performing
The following table summarizes the investment record for funds in the liquid/performing category within Apollo’s credit segment. The significant funds included in the investment record table below have greater than $200 million of AUM and do not predominantly invest in other Apollo funds or SIAs.
| | | | | | | | Net Returns | | | | | Net Returns |
| | Vintage
Year | | Total AUM | | For the Three Months Ended September 30, 2016 | | For the Nine Months Ended September 30, 2016 | | For the Three Months Ended September 30, 2015 | | For the Nine Months Ended September 30, 2015 | Vintage
Year | | Total AUM | | For the Three Months Ended September 30, 2017 | | For the Nine Months Ended September 30, 2017 | | For the Three Months Ended September 30, 2016 | | For the Nine Months Ended September 30, 2016 |
| Credit: | | (in millions) | | | | | | | | | | (in millions) | | | | | | | | |
Hedge Funds(1) | Various | | $ | 5,936 |
| | 3 | % | | 9 | % | | (1 | )% | | 2 | % | Various | | $ | 6,617 |
| | 1 | % | | 4 | % | | 3 | % | | 9 | % |
CLOs(2) | Various | | 13,460 |
| | 3 |
| | 7 |
| | — |
| | 3 |
| Various | | 11,937 |
| | 1 |
| | 3 |
| | 3 |
| | 7 |
|
| SIAs / Other | Various | | 17,337 |
| | 4 |
| | 8 |
| | (1 | ) | | 2 |
| Various | | 23,211 |
| | 2 |
| | 6 |
| | 4 |
| | 8 |
|
| Total | | $ | 36,733 |
| | | | | | | | | | $ | 41,765 |
| | | | | | | | |
| |
| (1) | Hedge Funds primarily includes Apollo Credit Strategies Master Fund Ltd., Apollo Credit Master Fund Ltd. and Apollo Credit Short Opportunities Fund. |
| |
| (2) | CLO returns are calculated based on gross return on invested assets, which excludes cash. Included within Total AUM of CLOs is $1.0 billion of AUM related to a standalone, self-managed asset management business established in connection with risk-retention rules, from which Apollo earns investment-related service fees, but for which Apollo does not provide management or advisory services. CLO returns exclude performance related to this AUM. |
Permanent Capital
The following table summarizes the investment record for our permanent capital vehicles by segment, excluding AAA,Athene-related and AGER-related assets managed or advised by Athene Asset Management and AAME:
| | | | | | | Total Returns(1) | | Total AUM | | Total Returns(1) |
| | IPO Year(2) | | Total AUM | | For the Three Months Ended September 30, 2016 | | For the Nine Months Ended September 30, 2016 | | For the Three Months Ended September 30, 2015 | | For the Nine Months Ended September 30, 2015 | | IPO Year(2) | | As of September 30, 2017 | | For the Three Months Ended September 30, 2017 | | For the Nine Months Ended September 30, 2017 | | For the Three Months Ended September 30, 2016 | | For the Nine Months Ended September 30, 2016 |
| Credit: | | (in millions) | | | | | | | | | | | (in millions) | | | | | | | | |
MidCap(3) | N/A | | $ | 6,665 |
| | NM |
| (4) | NM |
| (4) | NM |
| (4) | NM |
| (4) | N/A | | $ | 7,680 |
| | 3 | % | | 9 | % | | 3 | % | | 7 | % |
| AIF | 2013 | | 385 |
| | 10 % |
| | 20 | % | | (6 | )% | | (3 | ) % | | 2013 | | 390 |
| | 2 | | | 11 |
| | 10 |
| | 20 |
|
| AFT | 2011 | | 431 |
| | 9 |
| | 18 |
| | (10 | ) | | (1 | ) | | 2011 | | 431 |
| | 1 | | | 1 |
| | 9 |
| | 18 |
|
AINV(5)(4) | 2004 | | 4,315 |
| | 7 |
| | 22 |
| | (20 | ) | | (19 | ) | | 2004 | | 4,435 |
| | (2 | ) | | 12 |
| | 7 |
| | 22 |
|
| Real Estate: | | | | | | | | | | | | |
| Real Assets: | | | | | | | | | | | |
| ARI | 2009 | | 3,434 |
| | 5 | % | | 3 | % | | (2 | )% | | 4 | % | | 2009 | | 4,151 |
| | — |
| | 17 | % | | 5 | % | | 3 | % |
| Total | | $ | 15,230 |
| | | | | | | | | | | $ | 17,087 |
| | | | | | | | |
| |
| (1) | Total returns are based on the change in closing trading prices during the respective periods presented taking into account dividends and distributions, if any, as if they were reinvested without regard to commission. |
| |
| (2) | An IPO year represents the year in which the vehicle commenced trading on a national securities exchange. |
| |
| (3) | MidCap is not a publicly traded vehicle and therefore IPO year is not applicable. The returns presented are a gross return based on NAV. The net returns based on NAV were 2% and 2% for the three months ended September 30, 2017 and 2016, respectively, and 6% and 4% for the nine months ended September 30, 2017 and 2016, respectively. |
| |
| (4) | Returns have not been presented as the permanent capital vehicle commenced investing capital less than 24 months prior to the period indicated and therefore such return information was deemed not meaningful. |
| |
(5) | All amounts are as of June 30, 2016,2017 except for total returns. Refer to www.apolloic.com for the most recent financial information on AINV. The information contained on AINV’s website is not part of this report. Includes $1.4Included within Total AUM of AINV is $1.7 billion of AUM related to a non-traded business development company sub-advised by Apollo. Totalfrom which Apollo earns investment-related service fees, but for which Apollo does not provide management or advisory services. Net returns exclude performance of the non-traded business development company.related to this AUM. |
Athene and SIAs
As of September 30, 2016,2017, Apollo managed or advised $71.8$81.9 billion of total AUM in accounts owned by or related to Athene and AGER, of which approximately $15.3$18.1 billion was either sub-advised by Apollo or invested in Apollo funds and investment vehicles managed by Apollo. Of the approximately $15.3$18.1 billion of AUM, the vast majority were in sub-advisory managed accounts that manage high grade credit asset classes, such as CLO debt, commercial mortgage backed securities, and insurance-linked securities.
As of September 30, 2016,2017, Apollo managed approximately $19$21 billion of total AUM in SIAs, which include certain SIAs in the investment record tables above and capital deployed from certain SIAs across Apollo’s private equity, credit and real estateassets funds.
Overview of Results of Operations
Revenues
Advisory and Transaction Fees from Related Parties, Net. As a result of providing advisory services with respect to actual and potential private equity, credit, and real estateassets investments, we are entitled to receive fees for transactions related to the acquisition and, in certain instances, disposition of portfolio companies as well as fees for ongoing monitoring of portfolio company operations and directors’ fees. We also receive advisory fees for advisory services provided to certain credit funds. In addition, monitoring fees are generated on certain structured portfolio company investments. Under the terms of the limited partnership agreements for certain funds, the management fee payable by the funds may be subject to a reduction based on a certain percentage of such advisory and transaction fees, net of applicable broken deal costs (“Management Fee Offset”). Such amounts are presented as a reduction to advisory and transaction fees from related parties, net, in the condensed consolidated statements of operations. See note 2 to our condensed consolidated financial statements for more detail on advisory and transaction fees from related parties, net.
The Management Fee Offsets are calculated for each fund as follows:
65%-100% for private equity funds, gross advisory, transaction and other special fees;
65%-100% for certain credit funds, gross advisory, transaction and other special fees; and
100% for certain real estateassets funds, gross advisory, transaction and other special fees.
Management Fees from Related Parties. The significant growth of the assets we manage has had a positive effect on our revenues. Management fees are typically calculated based upon any of “net asset value,” “gross assets,” “adjusted par asset value,” “adjusted costs of all unrealized portfolio investments,” “capital commitments,” “invested capital,” “adjusted assets,” “capital contributions,” or “stockholders’ equity,” each as defined in the applicable limited partnership agreement and/or management agreement of the unconsolidated funds.
Carried Interest Income from Related Parties. The general partners of our funds, in general, are entitled to an incentive return that can normally amount to as much as 20% of the total returns on fund capital, depending upon performance of the underlying funds and subject to preferred returns and high water marks, as applicable. The carried interest income from related parties is recognized in accordance with U.S. GAAP guidance applicable to accounting for arrangement fees based on a formula. In applying the U.S. GAAP guidance, the carried interest from related parties for any period is based upon an assumed liquidation of the funds’ assets at the reporting date, and distribution of the net proceeds in accordance with the funds’ allocation provisions.
As of September 30, 2016,2017, approximately 53%54% of the value of our funds’ investments on a gross basis was determined using market-based valuation methods (i.e., reliance on broker or listed exchange quotes) and the remaining 47%46% was determined primarily by comparable company and industry multiples or discounted cash flow models. For our private equity, credit and real estateassets segments, the percentage determined using market-based valuation methods as of September 30, 20162017 was 16%23%, 73%72% and 46%40%, respectively. See “Item 1A. Risk Factors—Risks Related to Our Businesses—Our private equity funds’ performance, and our performance, may be adversely affected by the financial performance of our funds’ portfolio companies and the industries in which our funds invest” in the 20152016 Annual Report for a discussion regarding certain industry-specific risks that could affect the fair value of our private equity funds’ portfolio company investments.
Carried interest income fee rates can be as much as 20% for our private equity funds. In our private equity funds, the Company does not earn carried interest income until the investors in the fund have achieved cumulative investment returns on invested capital (including management fees and expenses) in excess of an 8% hurdle rate. Additionally, certain of our credit and real estateassets funds have various carried interest rates and hurdle rates. Certain of our credit and real estateassets funds allocate carried interest to the general partner in a similar manner as the private equity funds. In our private equity, certain credit and real estateassets funds, so long as the investors achieve their priority returns, there is a catch-up formula whereby the Company earns a priority return for a portion of the return until the Company’s carried interest income equates to its incentive fee rate for that fund; thereafter, the Company participates in returns from the fund at the carried interest income rate. Carried interest income is subject to reversal to the extent that the carried interest income distributed exceeds the amount due to the general partner based on a fund’s cumulative investment returns. The Company recognizes potential repayment of previously received carried interest income as a general partner obligation representing all amounts previously distributed to the general partner that would need to be repaid to the Apollo funds if these funds were to be liquidated based on the current fair value of the underlying funds’ investments as of the reporting date. The actual general partner obligation, however, would not become payable or realized until the end of a fund’s life or as otherwise set forth in the respective limited partnership agreement of the fund.
The table below presents an analysis of Apollo’s (i) carried interest receivable on an unconsolidated basis and (ii) realized and unrealized carried interest income (loss) for Apollo’s combined segments’ Incentive Businesssegments as of and for the three and nine months ended September 30, 2016:2017:
| | | | As of
September 30, 2016 | | For the Three Months Ended September 30, 2016 | | For the Nine Months Ended September 30, 2016 | As of
September 30, 2017 | | For the Three Months Ended September 30, 2017 | | For the Nine Months Ended September 30, 2017 |
| | Carried Interest Receivable on an Unconsolidated Basis | | Unrealized Carried Interest Income (Loss) | | Realized Carried Interest Income (Loss) | | Total Carried Interest Income (Loss) | | Unrealized
Carried Interest
Income (Loss) | | Realized
Carried Interest
Income (Loss) | | Total
Carried Interest
Income (Loss) | Carried Interest Receivable on an Unconsolidated Basis | | Unrealized Carried Interest Income (Loss) | | Realized Carried Interest Income | | Total Carried Interest Income (Loss) from Related Parties | | Unrealized Carried Interest Income (Loss) | | Realized Carried Interest Income | | Total Carried Interest Income (Loss) from Related Parties |
| | (in thousands) | (in thousands) |
| Private Equity Funds: | | | | | | | | | | | | | | | | | | | | | | | | | | |
Fund VIII(1) | $ | 263,167 |
| | $ | 126,586 |
| | $ | — |
| | $ | 126,586 |
| | $ | 263,167 |
| | $ | — |
| | $ | 263,167 |
| $ | 763,727 |
| | $ | 266,447 |
| | $ | 16,441 |
| | $ | 282,888 |
| | $ | 434,524 |
| | $ | 99,629 |
| | $ | 534,153 |
|
Fund VII(1) | 20,480 |
| | (51,144 | ) | | 9,844 |
| | (41,300 | ) | | (58,097 | ) | | 9,844 |
| | (48,253 | ) | 52,733 |
| | (544 | ) | | — |
| | (544 | ) | | (21,921 | ) | | 19,817 |
| | (2,104 | ) |
Fund VI(1) | — |
| (3) | (19,109 | ) | | — |
| | (19,109 | ) | | (108,551 | ) | | — |
| | (108,551 | ) | 47,929 |
| | 14,669 |
| | — |
| | 14,669 |
| | 90,166 |
| | — |
| | 90,166 |
|
| Fund IV and V | 4,416 |
| (3) | (1,881 | ) | | — |
| | (1,881 | ) | | (2,992 | ) | | 266 |
| | (2,726 | ) | — |
| (3) | (6,432 | ) | | — |
| | (6,432 | ) | | (13,079 | ) | | — |
| | (13,079 | ) |
| ANRP I and II | 21,014 |
| (3) | 15,596 |
| | — |
| | 15,596 |
| | 21,068 |
| | — |
| | 21,068 |
| 24,494 |
| (3) | (13,883 | ) | | — |
| | (13,883 | ) | | (71,073 | ) | | 52,873 |
| | (18,200 | ) |
AAA/Other(2)(5) | 268,314 |
| (3) | 4,971 |
| | — |
| | 4,971 |
| | 21,934 |
| | — |
| | 21,934 |
| 239,577 |
| | 26,332 |
| | 5,418 |
| | 31,750 |
| | (66,781 | ) | | 141,498 |
| | 74,717 |
|
| Total Private Equity Funds | 577,391 |
| | 75,019 |
| | 9,844 |
| | 84,863 |
| | 136,529 |
| | 10,110 |
| | 146,639 |
| 1,128,460 |
| | 286,589 |
| | 21,859 |
| | 308,448 |
| | 351,836 |
| | 313,817 |
| | 665,653 |
|
| Total Private Equity Funds, net of profit share | 390,854 |
| | 55,785 |
| | 2,578 |
| | 58,363 |
| | 107,126 |
| | 2,712 |
| | 109,838 |
| 701,004 |
| | 189,597 |
| | 4,465 |
| | 194,062 |
| | 234,811 |
| | 168,034 |
| | 402,845 |
|
| Credit Category: | | | | | | | | | | | | | | | | | | | | | | | | | | |
| Drawdown | 262,165 |
| (3) | 50,177 |
| | 9,367 |
| | 59,544 |
| | 92,361 |
| | 52,792 |
| | 145,153 |
| 312,030 |
| (3) | (7,294 | ) | | 23,698 |
| | 16,404 |
| | 16,151 |
| | 83,878 |
| | 100,029 |
|
| Liquid/Performing | 92,940 |
| | 33,215 |
| | 8,826 |
| | 42,041 |
| | 43,164 |
| | 35,390 |
| | 78,554 |
| 45,226 |
| | 5,301 |
| | 2,260 |
| | 7,561 |
| | (1,278 | ) | | 23,672 |
| | 22,394 |
|
| Permanent capital vehicles ex AAM | 36,780 |
| | 8,110 |
| | 2,307 |
| | 10,417 |
| | 15,195 |
| | 17,516 |
| | 32,711 |
| |
| Permanent capital vehicles | | 58,908 |
| | 6,172 |
| | 6,173 |
| | 12,345 |
| | 22,549 |
| | 12,636 |
| | 35,185 |
|
| Total Credit Funds | 391,885 |
| | 91,502 |
| | 20,500 |
| | 112,002 |
| | 150,720 |
| | 105,698 |
| | 256,418 |
| 416,164 |
| | 4,179 |
| | 32,131 |
| | 36,310 |
| | 37,422 |
| | 120,186 |
| | 157,608 |
|
| Total Credit Funds, net of profit share | 126,011 |
| | 54,693 |
| | 11,512 |
| | 66,205 |
| | 89,094 |
| | 42,934 |
| | 132,028 |
| 146,931 |
| | 1,913 |
| | 17,488 |
| | 19,401 |
| | 20,014 |
| | 69,018 |
| | 89,032 |
|
| Real Estate Funds: | | | | | | | | | | | | | | |
| Real Assets Funds: | | | | | | | | | | | | | | |
| CPI Funds | 753 |
| | (1,108 | ) | | 1,052 |
| | (56 | ) | | (633 | ) | | 1,052 |
| | 419 |
| 323 |
| | 4 |
| | — |
| | 4 |
| | (10 | ) | | — |
| | (10 | ) |
| U.S. RE Fund I & II | 16,011 |
| | (1,234 | ) | | 4,447 |
| | 3,213 |
| | (2,984 | ) | | 8,028 |
| | 5,044 |
| |
| U.S. RE Fund I and II | | 22,988 |
| | (2,440 | ) | | 4,080 |
| | 1,640 |
| | (1,270 | ) | | 8,111 |
| | 6,841 |
|
Other | 7,034 |
| | 3,305 |
| | — |
| | 3,305 |
| | (534 | ) | | 2,858 |
| | 2,324 |
| 12,223 |
| | (2,733 | ) | | 2,905 |
| | 172 |
| | (359 | ) | | 4,113 |
| | 3,754 |
|
| Total Real Estate Funds | 23,798 |
| | 963 |
| | 5,499 |
| | 6,462 |
| | (4,151 | ) | | 11,938 |
| | 7,787 |
| |
| Total Real Estate Funds, net of profit share | 10,154 |
| | 531 |
| | 1,437 |
| | 1,968 |
| | (2,751 | ) | | 3,698 |
| | 947 |
| |
| Total Real Assets Funds | | 35,534 |
| | (5,169 | ) | | 6,985 |
| | 1,816 |
| | (1,639 | ) | | 12,224 |
| | 10,585 |
|
| Total Real Assets Funds, net of profit share | | 21,350 |
| | (357 | ) | | 3,349 |
| | 2,992 |
| | 1,209 |
| | 5,696 |
| | 6,905 |
|
| Total | $ | 993,074 |
| | $ | 167,484 |
| | $ | 35,843 |
| | $ | 203,327 |
| | $ | 283,098 |
| | $ | 127,746 |
| | $ | 410,844 |
| $ | 1,580,158 |
| | $ | 285,599 |
| | $ | 60,975 |
| | $ | 346,574 |
| | $ | 387,619 |
| | $ | 446,227 |
| | $ | 833,846 |
|
| Total, net of profit share | $ | 527,019 |
| (4) | $ | 111,009 |
| | $ | 15,527 |
| | $ | 126,536 |
| | $ | 193,469 |
| | $ | 49,344 |
| | $ | 242,813 |
| $ | 869,285 |
| (4) | $ | 191,153 |
| | $ | 25,302 |
| | $ | 216,455 |
| | $ | 256,034 |
| | $ | 242,748 |
| | $ | 498,782 |
|
| |
| (1) | As of September 30, 2016,2017, the remaining investments and escrow cash of Fund VIII, Fund VII and Fund VI were valued at 115%, 99% and 77%97% of the fund’s unreturned capital, respectively, which were below the required escrow ratio of 115%. As a result, these funds are required to place in escrow current and future carried interest income distributions to the general partner until the specified return ratio of 115% is met (at the time of a future distribution) or upon liquidation. As of September 30, 2016,2017, Fund VI had $167.6 million of gross carried interest income, or $110.7 million net of profit sharing, in escrow. As of September 30, 2016,2017, Fund VII had $11.3$69.7 million of gross carried interest income, or $6.3 million net of profit sharing, in escrow. As of September 30, 2016, Fund VIII had $0.3 million of gross carried interest income, or $0.2$38.8 million net of profit sharing, in escrow. With respect to Fund VIII, Fund VII and Fund VI, realized carried interest income currently distributed to the general partner is limited to potential tax distributions per the fund’s partnership agreement. |
| |
| (2) | As of September 30, 2016, AAAAAA/Other includes $210.9$187.1 million of carried interest receivable, or $139.1$133.4 million net of profit sharing, from AAA Investments, L.P. which will be paidApollo may elect to receive in cash or in common shares of Athene Holding (valued at the then fair market value); and if there is a distributionApollo elects to receive payment of such carried interest in kind ofcash, then common shares of Athene Holding (unlessshall be distributed to Apollo and immediately sold by Apollo to pay for such paymentcarried interest in shares would violate Section 16(b) of the U.S. Securities Exchange Act of 1934, as amended), or paid in cash if AAA sells the shares of Athene Holding. In addition, Other includes certain SIAs.cash. |
| |
| (3) | As of September 30, 2016, Fund V, Fund VI, APC, ANRP I, ACLF,2017, certain credit funds and certain SIAs within the credit segmentprivate equity funds had $12.0 million, $56.0 million, $2.1 million, $3.4 million, $24.7$69.3 million and $36.7$42.2 million, respectively, in general partner obligations to return previously distributed carried interest income. The fair value gain on investments and income at the fund level needed to reverse the general partner obligations in Fund V, Fund VI, APC, ANRP I, ACLF,for certain credit funds and certain SIAs within the credit segmentprivate equity funds was $79.8 million, $417.4 million, $10.8 million, $67.6 million, $62.1$340.2 million and $244.3$164.4 million, respectively, as of September 30, 2016.2017. |
| |
| (4) | As of September 30, 2016 thereThere was a corresponding profit sharing payable of $466.1$710.9 million as of September 30, 2017, including profit sharing payable related to amounts in escrow and a contingent consideration obligationsobligation of $81.2$87.3 million. |
| |
| (5) | Other includes certain SIAs. |
The general partners of the private equity, credit and real estateassets funds listed in the table above were accruing carried interest income as of September 30, 2016.2017. The investment manager of AINV accrues carried interest in the management company business as it is earned. The general partners of certain of our credit funds accrue carried interest when the fair value of investments exceeds the cost basis of the individual investors’ investments in the fund, including any allocable share of expenses incurred in connection with such investments, which we refer to as “high water marks.” These high water marks are applied on an individual
investor basis. Certain of our credit funds have investors with various high water marks, the achievement of which is subject to market conditions and investment performance.
Carried interest income from our private equity funds and certain credit and real estateassets funds is subject to contingent repayment by the general partner in the event of future losses to the extent that the cumulative carried interest distributed from inception to date exceeds the amount computed as due to the general partner at the final distribution. These general partner obligations, if applicable, are included in due to related parties on the condensed consolidated statements of financial condition. As of September 30, 2016, there was $134.9 million of such general partner obligations related to our funds. Carried interest receivable is reported on a separate line item within the condensed consolidated statements of financial condition.
The following table summarizes our carried interest income since inception for our combined segments through September 30, 20162017:
|
| | | | | | | | | | | | | | | | | | | |
| | Carried Interest Income Since Inception(1) |
| | Undistributed by Fund and Recognized | | Distributed by Fund and Recognized(2) | | Total Undistributed and Distributed by Fund and Recognized(3) | | General Partner Obligation as of September 30, 2016(3) | | Maximum Carried Interest Income Subject to Potential Reversal(4) |
| | (in millions) |
| Private Equity Funds: | | | | | | | | | |
| Fund VIII | $ | 263.2 |
| | $ | — |
| | $ | 263.2 |
| | $ | — |
| | $ | 263.2 |
|
| Fund VII | 20.5 |
| | 3,091.8 |
| | 3,112.3 |
| | — |
| | 525.6 |
|
| Fund VI | — |
| | 1,658.9 |
| | 1,658.9 |
| | 56.0 |
| | 1,056.7 |
|
| Fund IV and V | 4.4 |
| | 2,053.1 |
| | 2,057.5 |
| | 12.0 |
| | 20.6 |
|
| ANRP I and II | 21.0 |
| | 6.1 |
| | 27.1 |
| | 3.4 |
| | 21.0 |
|
| AAA/Other | 268.3 |
| | 163.3 |
| | 431.6 |
| | — |
| | 268.3 |
|
| Total Private Equity Funds | 577.4 |
| | 6,973.2 |
| | 7,550.6 |
| | 71.4 |
| | 2,155.4 |
|
Credit Category(5): | | | | | | | | | |
| Drawdown | 262.2 |
| | 962.0 |
| | 1,224.2 |
| | 63.5 |
| | 346.7 |
|
| Liquid/Performing | 92.9 |
| | 433.9 |
| | 526.8 |
| | — |
| | 123.7 |
|
| Permanent capital vehicles ex AAM | 25.6 |
| | — |
| | 25.6 |
| | — |
| | 25.6 |
|
| Total Credit Funds | 380.7 |
| | 1,395.9 |
| | 1,776.6 |
| | 63.5 |
| | 496.0 |
|
| Real Estate Funds: | | | | | | | | | |
| CPI Funds | 0.8 |
| | 9.3 |
| | 10.1 |
| | — |
| | 0.8 |
|
| U.S. RE Fund I & II | 16.0 |
| | 12.7 |
| | 28.7 |
| | — |
| | 20.1 |
|
| Other | 7.0 |
| | 4.2 |
| | 11.2 |
| | — |
| | 7.2 |
|
| Total Real Estate Funds | 23.8 |
| | 26.2 |
| | 50.0 |
| | — |
| | 28.1 |
|
| Total | $ | 981.9 |
| | $ | 8,395.3 |
| | $ | 9,377.2 |
| | $ | 134.9 |
| | $ | 2,679.5 |
|
|
| | | | | | | | | | | | | | | | | | | |
| | Carried Interest Since Inception(1) |
| | Undistributed by Fund and Recognized | | Distributed by Fund and Recognized(2) | | Total Undistributed and Distributed by Fund and Recognized(3) | | General Partner Obligation as of September 30, 2017(3) | | Maximum Carried Interest Income Subject to Potential Reversal(4) |
| | (in millions) |
| Private Equity Funds: | | | | | | | | | |
| Fund VIII | $ | 763.7 |
| | $ | 104.3 |
| | $ | 868.0 |
| | $ | — |
| | $ | 830.4 |
|
| Fund VII | 52.7 |
| | 3,121.5 |
| | 3,174.2 |
| | — |
| | 704.0 |
|
| Fund VI | 47.9 |
| | 1,659.0 |
| | 1,706.9 |
| | — |
| | 1,160.6 |
|
| Fund IV and V | — |
| | 2,053.1 |
| | 2,053.1 |
| | 24.1 |
| | 10.6 |
|
| ANRP I and II | 24.5 |
| | 72.3 |
| | 96.8 |
| | 18.1 |
| | 48.0 |
|
| AAA/Other | 239.6 |
| | 354.5 |
| | 594.1 |
| | — |
| | 245.0 |
|
| Total Private Equity Funds | 1,128.4 |
| | 7,364.7 |
| | 8,493.1 |
| | 42.2 |
| | 2,998.6 |
|
Credit Category(5): | | | | | | | | | |
| Drawdown | 312.0 |
| | 1,040.2 |
| | 1,352.2 |
| | 69.3 |
| | 475.2 |
|
| Liquid/Performing | 45.2 |
| | 515.5 |
| | 560.7 |
| | — |
| | 76.7 |
|
| Permanent capital vehicles ex AAM | 49.6 |
| | — |
| | 49.6 |
| | — |
| | 49.6 |
|
| Total Credit Funds | 406.8 |
| | 1,555.7 |
| | 1,962.5 |
| | 69.3 |
| | 601.5 |
|
| Real Assets Funds: | | | | | | | | | |
| CPI Funds | 0.3 |
| | 9.7 |
| | 10.0 |
| | — |
| | 0.3 |
|
| U.S. RE Fund I and II | 23.0 |
| | 16.9 |
| | 39.9 |
| | — |
| | 33.3 |
|
Other(6) | 12.2 |
| | 7.9 |
| | 20.1 |
| | — |
| | 14.6 |
|
| Total Real Assets Funds | 35.5 |
| | 34.5 |
| | 70.0 |
| | — |
| | 48.2 |
|
| Total | $ | 1,570.7 |
| | $ | 8,954.9 |
| | $ | 10,525.6 |
| | $ | 111.5 |
| | $ | 3,648.3 |
|
| |
| (1) | Certain funds are denominated in Euros and historical figures are translated into U.S. dollars at an exchange rate of €1.00 to $1.12$1.18 as of September 30, 2016.2017. |
| |
| (2) | Amounts in “Distributed by Fund and Recognized” for the CPI, Gulf Stream Asset Management, LLC (“Gulf Stream”) and Stone Tower funds and SIAs are presented for activity subsequent to the respective acquisition dates. |
| |
| (3) | Amounts were computed based on the fair value of fund investments on September 30, 2016.2017. Carried interest income has been allocated to and recognized by the general partner. Based on the amount of carried interest income allocated, a portion is subject to potential reversal or, to the extent applicable, has been reduced by the general partner obligation to return previously distributed carried interest income or fees at September 30, 2016.2017. The actual determination and any required payment of any such general partner obligation would not take place until the final disposition of the fund’s investments based on contractual termination of the fund. |
| |
| (4) | Represents the amount of carried interest income that would be reversed if remaining fund investments became worthless on September 30, 2016.2017. Amounts subject to potential reversal of carried interest income include amounts undistributed by a fund (i.e., the carried interest receivable), as well as a portion of the amounts that have been distributed by a fund, net of taxes not subject to a general partner obligation to return previously distributed carried interest income, except for those funds that are gross of taxes as defined in the respective funds’ governing documents. |
| |
| (5) | Amounts exclude AINV, as carried interest income from this entity is not subject to contingent repayment. |
| |
| (6) | Other includes certain SIAs. |
Expenses
Compensation and Benefits. Our most significant expense is compensation and benefits expense. This consists of fixed salary, discretionary and non-discretionary bonuses, profit sharing expense associated with the carried interest income earned from private equity, credit and real estateassets funds and compensation expense associated with the vesting of non-cash equity-based awards.
Our compensation arrangements with certain partners and employees contain a significant performance-based incentive component. Therefore, as our net revenues increase, our compensation costs also rise or can be lower when net revenues decrease. In addition, our compensation costs reflect the increased investment in people as we expand geographically and create new funds.
In addition, certain professionals and selected other individuals have a profit sharing interest in the carried interest income earned in relation to our private equity, certain credit and real estateassets funds in order to better align their interests with our own and with those of the investors in these funds. Profit sharing expense is part of our compensation and benefits expense and is generally based upon a fixed percentage of private equity, credit and real estateassets carried interest income on a pre-tax and a pre-consolidated basis. Profit sharing expense can reverse during periods when there is a decline in carried interest income that was previously recognized. Profit sharing amounts are normally distributed to employees after the corresponding investment gains have been realized and generally before preferred returns are achieved for the investors. Therefore, changes in our unrealized gains (losses) for investments have the same effect on our profit sharing expense. Profit sharing expense increases when unrealized gains increase. Realizations only impact profit sharing expense to the extent that the effects on investments have not been recognized previously. If losses on other investments within a fund are subsequently realized, the profit sharing amounts previously distributed are normally subject to a general partner obligation to return carried interest income previously distributed back to the funds. This general partner obligation due to the funds would be realized only when the fund is liquidated, which generally occurs at the end of the fund’s term. However, indemnification obligations also exist for pre-reorganization realized gains, which, although our Managing Partners and Contributing Partners would remain personally liable, may indemnify our Managing Partners and Contributing Partners for 17.5% to 100% of the previously distributed profits regardless of the fund’s future performance. See note 1213 to our condensed consolidated financial statements for further discussion of indemnification.
Each Managing Partner receives $100,000 per year in base salary for services rendered to us. Additionally, our Managing Partners can receive other forms of compensation. In connection with the 2007 Reorganization, the Managing Partners and Contributing Partners received AOG Units with a vesting period of five to six years (all of which have fully vested) and certain employees were granted RSUs with a vesting period of typically six years (all of which have also fully vested). Managing Partners, Contributing Partners and certain employees have also been granted AAA restricted depositary units (“RDUs”) , or incentive units that provide the right to receive AAA RDUs, which both represent common units of AAA and generally vest over three years for employees and are fully-vested for Managing Partners and Contributing Partners on the grant date. In addition, AHL Awards (as defined in note 11 to our condensed consolidated financial statements) and other equity-based compensation awards have been granted to the Company and certain employees, which amortize over the respective vesting periods. In addition, the Company grants equity awards to certain employees, including RSUs, restricted Class A shares and options, that generally vest and become exercisable in quarterly installments or annual installments depending on the contract terms over a period of three to six years. See note 11 to our condensed consolidated financial statements for further discussion of AOG Units and other equity-based compensation.
Other Expenses. The balance of our other expenses includes interest, professional fees, placement fees, occupancy, depreciation and amortizationgeneral, administrative and other general operating expenses. Interest expense consists primarily of interest related to the 2013 AMH Credit Facilities, the 2024 Senior Notes and the 2026 Senior Notes as discussed in note 9 to our condensed consolidated financial statements. Placement fees are incurred in connection with our capital raising activities. General, administrative and other expenses includes occupancy expense, depreciation and amortization, professional fees and costs related to travel, information technology and administration. Occupancy expense represents charges related to office leases and associated expenses, such as utilities and maintenance fees. Depreciation and amortization of fixed assets is normally calculated using the straight-line method over their estimated useful lives, ranging from two to sixteen years, taking into consideration any residual value. Leasehold improvements are amortized over the shorter of the useful life of the asset or the expected term of the lease. Intangible assets are amortized based on the future cash flows over the expected useful lives of the assets. Other general operating expenses normally include costs related to travel, information technology and administration.
Other Income (Loss)
Net Gains (Losses) from Investment Activities. The performance of the consolidated Apollo funds has impacted our net gains (losses) from investment activities. Net gains (losses) from investment activities include both realized gains and losses and the change in unrealized gains and losses in our investment portfolio between the opening reporting date and the closing reporting date. Net unrealized gains (losses) are a result of changes in the fair value of unrealized investments and reversal of
unrealized gains (losses) due to dispositions of investments during the reporting period. Significant judgment and estimation goes into the assumptions that drive these models and the actual values realized with respect to investments could be materially different from values obtained based on the use of those models. The valuation methodologies applied impact the reported value of investment company holdings and their underlying portfolios in our condensed consolidated financial statements.
Net Gains (Losses) from Investment Activities of Consolidated Variable Interest Entities. Changes in the fair value of the consolidated VIEs’ assets and liabilities and related interest, dividend and other income and expenses subsequent to consolidation are presented within net gains (losses) from investment activities of consolidated variable interest entities and are attributable to Non-Controlling Interests in the condensed consolidated statements of operations.
Other Income (Losses), Net. Other income (losses), net includes gains (losses) arising from the remeasurement of foreign currency denominated assets and liabilities, reversal of a portion of the tax receivable agreement liability (see note 12 to our condensed consolidated financial statements), and other miscellaneous non-operating income and expenses.
Income Taxes. The Apollo Operating Group and its subsidiaries generally operate as partnerships for U.S. federal income tax purposes. As a result, except as described below, the Apollo Operating Group has not been subject to U.S. income taxes. However, thesethe U.S. entities, in some cases, are subject to NYC UBT, and non-U.S. entities, in some cases, are subject to non-U.S. corporate income taxes. In addition, APO Corp., a wholly-owned subsidiary of the Company, iscertain consolidated entities are, or are treated as, corporations for U.S. and non-U.S. tax purposes and therefore subject to U.S. federal, state, local and localforeign corporate income tax, and the Company’s (provision) benefittax. The Company's provision for income taxes is accounted for in accordance with U.S. GAAP.
Significant judgment is required in determining tax expensethe provision for income taxes and in evaluating income tax positions, including evaluating uncertainties. We recognize the income tax benefits of uncertain tax positions only where the position is “more likely than not” to be sustained upon examination, including resolutions of any related appeals or litigation, based on the technical merits of the position.positions. The tax benefit is measured as the largest amount of benefit that has a greater than 50% likelihood of being realized upon ultimate settlement. If a tax position is not considered more likely than not to be sustained, then no benefits of the position are recognized. The Company’s income tax positions are reviewed and evaluated quarterly to determine whether or not we have uncertain tax positions that require financial statement recognition.recognition or de-recognition.
Deferred tax assets and liabilities are recognized for the expected future tax consequences, using currently enacted tax rates, of differences between the carrying amount of assets and liabilities and their respective tax basis using currently enacted tax rates.basis. The effect on deferred tax assets and liabilities of a change in tax rates is recognized in income in the period when the change is enacted. Deferred tax assets are reduced by a valuation allowance when it is more likely than not that some portion or all of the deferred tax assets will not be realized.
Non-Controlling Interests
For entities that are consolidated, but not 100% owned, a portion of the income or loss and corresponding equity is allocated to owners other than Apollo. The aggregate of the income or loss and corresponding equity that is not owned by the Company is included in Non-Controlling Interests in the condensed consolidated financial statements. The Non-Controlling Interests relating to Apollo Global Management, LLC primarily include the 53.9%51.9% and 54.7%53.9% ownership interest in the Apollo Operating Group held by the Managing Partners and Contributing Partners through their limited partner interests in Holdings as of September 30, 20162017 and 2015,2016, respectively. Non-Controlling Interests also include limited partner interests in certain consolidated funds and VIEs.
The authoritative guidance for Non-Controlling Interests in the condensed consolidated financial statements requires reporting entities to present Non-Controlling Interest as equity and provides guidance on the accounting for transactions between an entity and Non-Controlling Interests. According to the guidance, (1) Non-Controlling Interests are presented as a separate component of shareholders’ equity on the Company’s condensed consolidated statements of financial condition, (2) net income (loss) includes the net income (loss) attributable to the Non-Controlling Interest holders on the Company’s condensed consolidated statements of operations, (3) the primary components of Non-Controlling Interest are separately presented in the Company’s condensed consolidated statements of changes in shareholders’ equity to clearly distinguish the interests in the Apollo Operating Group and other ownership interests in the consolidated entities and (4) profits and losses are allocated to Non-Controlling Interests in proportion to their ownership interests regardless of their basis.
Results of Operations
Below is a discussion of our condensed consolidated results of operations for the three and nine months ended September 30, 20162017 and 2015.2016. For additional analysis of the factors that affected our results at the segment level, see “—Segment Analysis” below:
| | | | For the Three Months Ended September 30, | | Amount
Change | | Percentage
Change | | For the Nine Months Ended September 30, | | Amount
Change | | Percentage
Change | For the Three Months Ended
September 30, | | Amount
Change | | Percentage
Change | | For the Nine Months Ended September 30, | | Amount
Change | | Percentage
Change |
| | 2016 | | 2015 | | 2016 | | 2015 | | 2017 | | 2016 | | 2017 | | 2016 | |
| Revenues: | (in thousands) | | | | (in thousands) | | | (in thousands) | | | | (in thousands) | | |
| Management fees from related parties | | $ | 301,443 |
| | $ | 274,313 |
| | $ | 27,130 |
| | 9.9 | % | | $ | 852,291 |
| | $ | 775,171 |
| | $ | 77,120 |
| | 9.9 | % |
| Advisory and transaction fees from related parties, net | $ | 29,801 |
| | $ | 9,276 |
| | $ | 20,525 |
| | 221.3 | % | | $ | 102,699 |
| | $ | 34,269 |
| | $ | 68,430 |
| | 199.7 | % | 16,209 |
| | 29,801 |
| | (13,592 | ) | | (45.6 | ) | | 54,905 |
| | 102,699 |
| | (47,794 | ) | | (46.5 | ) |
| Management fees from related parties | 274,313 |
| | 238,563 |
| | 35,750 |
| | 15.0 |
| | 775,171 |
| | 694,036 |
| | 81,135 |
| | 11.7 |
| |
| Carried interest income (loss) from related parties | 199,617 |
| | (54,571 | ) | | 254,188 |
| | NM |
| | 407,134 |
| | 119,714 |
| | 287,420 |
| | 240.1 |
| |
| Carried interest income from related parties | | 346,580 |
| | 199,617 |
| | 146,963 |
| | 73.6 |
| | 833,459 |
| | 407,134 |
| | 426,325 |
| | 104.7 |
|
| Total Revenues | 503,731 |
| | 193,268 |
| | 310,463 |
| | 160.6 |
| | 1,285,004 |
| | 848,019 |
| | 436,985 |
| | 51.5 |
| 664,232 |
| | 503,731 |
| | 160,501 |
| | 31.9 |
| | 1,740,655 |
| | 1,285,004 |
| | 455,651 |
| | 35.5 |
|
| Expenses: | | | | | | | | | | | | | | | | | | | | | | | | | | | | | | |
| Compensation and benefits: | | | | | | | | | | | | | | | | | | | | | | | | | | | | | | |
| Salary, bonus and benefits | 92,591 |
| | 93,514 |
| | (923 | ) | | (1.0 | ) | | 290,013 |
| | 270,017 |
| | 19,996 |
| | 7.4 |
| 108,853 |
| | 92,591 |
| | 16,262 |
| | 17.6 |
| | 316,011 |
| | 290,013 |
| | 25,998 |
| | 9.0 |
|
| Equity-based compensation | 26,163 |
| | 31,404 |
| | (5,241 | ) | | (16.7 | ) | | 74,203 |
| | 73,786 |
| | 417 |
| | 0.6 |
| 24,485 |
| | 26,163 |
| | (1,678 | ) | | (6.4 | ) | | 70,332 |
| | 74,203 |
| | (3,871 | ) | | (5.2 | ) |
| Profit sharing expense | 90,152 |
| | (20,329 | ) | | 110,481 |
| | NM |
| | 179,767 |
| | 89,935 |
| | 89,832 |
| | 99.9 |
| 137,296 |
| | 90,152 |
| | 47,144 |
| | 52.3 |
| | 339,679 |
| | 179,767 |
| | 159,912 |
| | 89.0 |
|
| Total compensation and benefits | 208,906 |
| | 104,589 |
| | 104,317 |
| | 99.7 |
| | 543,983 |
| | 433,738 |
| | 110,245 |
| | 25.4 |
| 270,634 |
| | 208,906 |
| | 61,728 |
| | 29.5 |
| | 726,022 |
| | 543,983 |
| | 182,039 |
| | 33.5 |
|
| Interest expense | 12,832 |
| | 7,529 |
| | 5,303 |
| | 70.4 |
| | 30,505 |
| | 22,454 |
| | 8,051 |
| | 35.9 |
| 13,303 |
| | 12,832 |
| | 471 |
| | 3.7 |
| | 39,497 |
| | 30,505 |
| | 8,992 |
| | 29.5 |
|
| General, administrative and other | 32,403 |
| | 21,645 |
| | 10,758 |
| | 49.7 |
| | 92,970 |
| | 65,972 |
| | 26,998 |
| | 40.9 |
| 68,149 |
| | 58,566 |
| | 9,583 |
| | 16.4 |
| | 189,918 |
| | 187,285 |
| | 2,633 |
| | 1.4 |
|
| Professional fees | 11,816 |
| | 17,218 |
| | (5,402 | ) | | (31.4 | ) | | 50,955 |
| | 51,907 |
| | (952 | ) | | (1.8 | ) | |
| Occupancy | 9,701 |
| | 10,137 |
| | (436 | ) | | (4.3 | ) | | 29,221 |
| | 30,226 |
| | (1,005 | ) | | (3.3 | ) | |
| Placement fees | 1,953 |
| | 2,617 |
| | (664 | ) | | (25.4 | ) | | 5,781 |
| | 5,802 |
| | (21 | ) | | (0.4 | ) | 5,397 |
| | 1,953 |
| | 3,444 |
| | 176.3 |
| | 12,560 |
| | 5,781 |
| | 6,779 |
| | 117.3 |
|
| Depreciation and amortization | 4,646 |
| | 11,176 |
| | (6,530 | ) | | (58.4 | ) | | 14,139 |
| | 33,347 |
| | (19,208 | ) | | (57.6 | ) | |
| Total Expenses | 282,257 |
| | 174,911 |
| | 107,346 |
| | 61.4 |
| | 767,554 |
| | 643,446 |
| | 124,108 |
| | 19.3 |
| 357,483 |
| | 282,257 |
| | 75,226 |
| | 26.7 |
| | 967,997 |
| | 767,554 |
| | 200,443 |
| | 26.1 |
|
| Other Income: | | | | | | | | | | | | | | | | | | | | | | | | | | | | | | |
| Net gains from investment activities | 17,746 |
| | 80,950 |
| | (63,204 | ) | | (78.1 | ) | | 50,287 |
|
| 107,492 |
| | (57,205 | ) | | (53.2 | ) | 68,932 |
| | 17,746 |
| | 51,186 |
| | 288.4 |
| | 102,936 |
|
| 50,287 |
| | 52,649 |
| | 104.7 |
|
| Net gains from investment activities of consolidated variable interest entities | 800 |
| | 911 |
| | (111 | ) | | (12.2 | ) | | 2,817 |
|
| 8,039 |
| | (5,222 | ) | | (65.0 | ) | 845 |
| | 800 |
| | 45 |
| | 5.6 |
| | 11,085 |
|
| 2,817 |
| | 8,268 |
| | 293.5 |
|
| Income from equity method investments | 23,213 |
| | 2,021 |
| | 21,192 |
| | NM |
| | 64,356 |
|
| 18,079 |
| | 46,277 |
| | 256.0 |
| 47,488 |
| | 23,213 |
| | 24,275 |
| | 104.6 |
| | 102,877 |
|
| 64,356 |
| | 38,521 |
| | 59.9 |
|
| Interest income | 1,192 |
| | 818 |
| | 374 |
| | 45.7 |
| | 3,073 |
|
| 2,403 |
| | 670 |
| | 27.9 |
| 1,504 |
| | 1,192 |
| | 312 |
| | 26.2 |
| | 2,929 |
|
| 3,073 |
| | (144 | ) | | (4.7 | ) |
| Other income (loss), net | (40 | ) | | 93 |
| | (133 | ) | | NM |
| | 485 |
|
| 6,742 |
| | (6,257 | ) | | (92.8 | ) | 25,387 |
| | (40 | ) | | 25,427 |
| | NM |
| | 44,776 |
|
| 485 |
| | 44,291 |
| | NM |
|
| Total Other Income | 42,911 |
| | 84,793 |
| | (41,882 | ) | | (49.4 | ) | | 121,018 |
|
| 142,755 |
| | (21,737 | ) | | (15.2 | ) | 144,156 |
| | 42,911 |
| | 101,245 |
| | 235.9 |
| | 264,603 |
|
| 121,018 |
| | 143,585 |
| | 118.6 |
|
| Income before income tax provision | 264,385 |
| | 103,150 |
| | 161,235 |
| | 156.3 |
| | 638,468 |
|
| 347,328 |
| | 291,140 |
| | 83.8 |
| 450,905 |
| | 264,385 |
| | 186,520 |
| | 70.5 |
| | 1,037,261 |
|
| 638,468 |
| | 398,793 |
| | 62.5 |
|
| Income tax provision | (29,667 | ) | | (6,591 | ) | | (23,076 | ) | | 350.1 |
| | (62,508 | ) |
| (21,197 | ) | | (41,311 | ) | | 194.9 |
| (16,542 | ) | | (29,667 | ) | | 13,125 |
| | (44.2 | ) | | (54,926 | ) |
| (62,508 | ) | | 7,582 |
| | (12.1 | ) |
| Net Income | 234,718 |
| | 96,559 |
| | 138,159 |
| | 143.1 |
| | 575,960 |
|
| 326,131 |
| | 249,829 |
| | 76.6 |
| 434,363 |
| | 234,718 |
| | 199,645 |
| | 85.1 |
| | 982,335 |
|
| 575,960 |
| | 406,375 |
| | 70.6 |
|
| Net income attributable to Non-Controlling Interests | (140,099 | ) | | (55,508 | ) | | (84,591 | ) | | 152.4 |
| | (340,077 | ) |
| (197,725 | ) | | (142,352 | ) | | 72.0 |
| (231,411 | ) | | (140,099 | ) | | (91,312 | ) | | 65.2 |
| | (542,507 | ) |
| (340,077 | ) | | (202,430 | ) | | 59.5 |
|
| Net Income Attributable to Apollo Global Management, LLC | $ | 94,619 |
| | $ | 41,051 |
| | $ | 53,568 |
| | 130.5 | % | | $ | 235,883 |
|
| $ | 128,406 |
| | $ | 107,477 |
| | 83.7 | % | 202,952 |
| | 94,619 |
| | 108,333 |
| | 114.5 |
| | 439,828 |
|
| 235,883 |
| | 203,945 |
| | 86.5 |
|
| Net income attributable to Preferred Shareholders | | (4,383 | ) | | — |
| | (4,383 | ) | | NM |
| | (9,155 | ) | | — |
| | (9,155 | ) | | NM |
|
| Net Income Attributable to AGM Common Shareholders | | $ | 198,569 |
| | $ | 94,619 |
| | $ | 103,950 |
| | 109.9 | % | | $ | 430,673 |
| | $ | 235,883 |
| | $ | 194,790 |
| | 82.6 | % |
| |
| Note: | “NM” denotes not meaningful. Changes from negative to positive amounts and positive to negative amounts are not considered meaningful. Increases or decreases from zero and changes greater than 500% are also not considered meaningful. |
Revenues
Our revenues and other income include fixed components that result from measures of capital and asset valuations and variable components that result from realized and unrealized investment performance, as well as the value of successfully completed transactions.
Three Months Ended September 30, 20162017 Compared to Three Months Ended September 30, 20152016
Management fees from related parties increased by $27.1 million for the three months ended September 30, 2017 as compared to the three months ended September 30, 2016. This change was primarily attributable to increased management fees earned with respect to EPF III, Athene and FCI III of $20.5 million, $7.6 million and $6.7 million, respectively, offset by a decrease in management fees earned with respect to ANRP II of $12.7 million during the three months ended September 30, 2017 as compared to the same period in 2016. Management fees earned from EPF III and FCI III increased as a result of capital raises that occurred after September 30, 2016, as well as a one-time catch-up of management fees during the three months ended September 30, 2017 of $7.4 million and $4.9 million from EPF III and FCI III, respectively. Management fees earned from ANRP II decreased primarily as a result of a catch-up of management fees during the three months ended September 30, 2016 of $13.2 million.
Advisory and transaction fees from related parties, net, increaseddecreased by $20.5$13.6 million for the three months ended September 30, 20162017 as compared to the three months ended September 30, 2015.2016. This change was primarily attributable to an increasea decrease in net advisory and transaction fees earned with respect to Fund VIII’s portfolio companies of $20.3$15.3 million during the three months ended September 30, 20162017 as compared to the same period in 2016.
Carried interest income from related parties increased by $147.0 million for the three months ended September 30, 2017 as compared to the three months ended September 30, 2015.
Management fees from related parties increased by $35.8 million for the three months ended September 30, 2016 as compared to the three months ended September 30, 2015.2016. This change was primarily attributable to increased management fees earned with respect to ANRP II, Athene, MidCap, assets advised by AAME, and Credit Opportunity Fund III, L.P. (“COF III”) of
$22.3 million, $4.3 million, $3.0 million, $2.7 million and $1.9 million, respectively. The increase was also driven by an increase in reimbursable expenses during the three months ended September 30, 2016 as compared to the same period during 2015.
Carried interest income from related parties was $199.6 million for the three months ended September 30, 2016, as compared to a carried interest loss from related parties of $54.6 million for the three months ended September 30, 2015. The increase of $254.2 million was primarily attributable to increased carried interest income earned from our private equity andfunds of $223.6 million, offset by decreased carried interest income earned from our credit funds of $150.1$75.7 million and $104.7 million, respectively, during the three months ended September 30, 20162017 as compared to the same period in 2015.2016. For additional details regarding changes in carried interest income in each segment, see “—Segment Analysis” below.
Nine Months Ended September 30, 20162017 Compared to Nine Months Ended September 30, 20152016
Management fees from related parties increased by $77.1 million for the nine months ended September 30, 2017 as compared to the nine months ended September 30, 2016. This change was primarily attributable to increased management fees earned from EPF III, Athene and FCI III of $43.1 million, $24.2 million, and $10.0 million, respectively, during the nine months ended September 30, 2017 as compared to the same period during 2016. Management fees earned from EPF III and FCI III increased as a result of capital raises that occurred after September 30, 2016, as well as a one-time catch-up of management fees during the nine months ended September 30, 2017 of $10.8 million and $7.0 million from EPF III and FCI III, respectively.
Advisory and transaction fees from related parties, net, increaseddecreased by $68.4$47.8 million for the nine months ended September 30, 20162017 as compared to the nine months ended September 30, 2015.2016. This change was primarily attributable to an increasea decrease in net advisory and transaction fees earned with respect to Fund VIII’s portfolio companies of $79.7 million, offset by a decrease in net advisory and transaction fees earned with respect to Fund VII’s portfolio companies of $6.4$49.0 million during the nine months ended September 30, 20162017 as compared to the same period during 2016.
Carried interest income from related parties increased by $426.3 million for the nine months ended September 30, 2017 as compared to the nine months ended September 30, 2015.
Management fees from related parties increased by $81.1 million for the nine months ended September 30, 2016 as compared to the nine months ended September 30, 2015. This change was primarily attributable to increased management fees earned with respect to ANRP II, MidCap, advisory assets advised by AAME, COF III, Athene, ARI, Apollo U.S. RE Fund II, L.P. (“U.S. RE Fund II”) and a China-based investment fund we manage as a result of the Venator acquisition of $39.1 million, $9.9 million, $9.3 million, $6.7 million, $5.3 million, $5.1 million, $3.5 million and $1.2 million, respectively. The increase was also driven by an increase in reimbursable expenses during the nine months ended September 30, 2016 as compared to the same period during 2015.
Carried interest income from related parties increased by $287.4 million for the nine months ended September 30, 2016 as compared to the nine months ended September 30, 2015.2016. This change was primarily attributable to increased carried interest income earned from our credit and private equity funds of $215.4$519.0 million, and $75.6offset by decreased carried interest income earned from our credit funds of $98.8 million respectively, during the nine months ended September 30, 20162017 as compared to the same period in 2015.2016. For additional details regarding changes in carried interest income in each segment, see “—Segment Analysis” below.
Expenses
Three Months Ended September 30, 20162017 Compared to Three Months Ended September 30, 20152016
Compensation and benefits increased by $104.3$61.7 million for the three months ended September 30, 2016,2017, as compared to the three months ended September 30, 2015.2016. This change was primarily attributable to an increase in profit sharing expense of $110.5$47.1 million due to increased carried interest income during the three months ended September 30, 2016,2017, as compared to the same period in 2015.2016. In any period the blended profit sharing percentage is impacted by the respective profit sharing ratios of the funds generating carried interest in the period. In addition, this change was attributable to an increase in salary, bonus and benefits of $16.3 million for the three months ended September 30, 2017, as compared to the same period in 2016 as a result of an increase in headcount.
Included in profit sharing expense is $13.7 million and $10.4 million for the three months ended September 30, 2017 and 2016, respectively, related to a performance based incentive arrangement for certain Apollo partners and employees designed to more closely align compensation on an annual basis with the overall realized performance of the Company (referred to herein as the “Incentive Pool”). Allocations to participants in the Incentive Pool contain both a fixed component and a discretionary component, each of which may vary year to year. The Incentive Pool is separate from the fund related profit sharing expense and may result in greater variability in compensation and have a variable impact on the blended profit sharing percentage during a particular period. See “—Profit Sharing Expense” in the Critical Accounting Policies section for an overview of the Incentive Pool.
General, administrative and other expenses increased by $9.6 million for the three months ended September 30, 2017, as compared to the three months ended September 30, 2016 primarily due to an increase in professional fees during the three months ended September 30, 2017, as compared to the three months ended September 30, 2016.
Placement fees increased by $3.4 million for the three months ended September 30, 2017, as compared to the three months ended September 30, 2016 primarily as a result of placement fees related to the launches of EPF III and Fund IX of $2.6 million and $2.3 million, respectively, during the three months ended September 30, 2017.
Nine Months Ended September 30, 2017 Compared to Nine Months Ended September 30, 2016
Compensation and benefits increased by $182.0 million for the nine months ended September 30, 2017, as compared to the nine months ended September 30, 2016. This change was primarily attributable to an increase in profit sharing expense of $159.9 million due to increased carried interest income during the nine months ended September 30, 2017, as compared to the same period in 2016. In any period the blended profit sharing percentage is impacted by the respective profit sharing ratios of the funds generating carried interest in the period.
Included in profit sharing expense is $10.4$54.0 million and $20.9$41.9 million for the nine months ended September 30, 2017 and 2016, respectively, related to the Incentive Pool for the three months ended September 30, 2016 and 2015, respectively.Pool. The Incentive Pool is separate from the fund related profit sharing expense and may result in greater variability in compensation and have a variable impact on the blended profit sharing percentage during a particular period. See “—Profit Sharing Expense” in the Critical Accounting Policies section for an overview of the Incentive Pool.
Interest expense increased $5.3by $9.0 million for the threenine months ended September 30, 2017, as compared to the nine months ended September 30, 2016 as compared to the three months ended September 30, 2015primarily as a result of the issuance of the 2026 Senior Notes in May 2016, as described in note 9 to our condensed consolidated financial statements.
General, administrative and other expensesexpense increased by $10.8$2.6 million for the nine months ended September 30, 2017, as compared to the nine months ended September 30, 2016 primarily as a result of increased fund organizational expenses related to Fund IX during the nine months ended September 30, 2017, as compared to the same period in 2016.
Placement fees increased by $6.8 million for the nine months ended September 30, 2017, as compared to the nine months ended September 30, 2016 as a result of placement fees related to the launch of EPF III of $7.5 million during the nine months ended September 30, 2017.
Other Income (Loss)
Three Months Ended September 30, 2017 Compared to Three Months Ended September 30, 2016
Net gains from investment activities increased by $51.2 million for the three months ended September 30, 2016,2017, as compared to the three months ended September 30, 2015 primarily due to certain expenses where the Company is considered the principal under the relevant agreements and is required to record the expense and related reimbursement on a gross basis. The increase was also driven by an increase in technology and new fund organizational expenses during the three months ended September 30, 2016, as compared to the three months ended September 30, 2015.
Professional fees decreased by $5.4 million for the three months ended September 30, 2016, as compared to the three months ended September 30, 2015. This change was primarily attributable to a decrease in legal fees during the three months ended September 30, 2016 as compared to the same period in 2015.
Depreciation and amortization decreased by $6.5 million for the three months ended September 30, 2016, as compared to the three months ended September 30, 2015 as a result of certain intangibles in connection with the Company’s acquisition of Stone Tower Capital LLC and its related management companies being fully amortized at December 31, 2015.
Nine Months Ended September 30, 2016 Compared to Nine Months Ended September 30, 2015
Compensation and benefits increased by $110.2 million for the nine months ended September 30, 2016, as compared to the nine months ended September 30, 2015.2016. This change was primarily attributable to an increase in profit sharing expensethe fair value of $89.8 million due to increased carried interest incomethe Company’s investment in Athene Holding during the ninethree months ended September 30, 2016,2017, as compared to the same period in 2015. In any period the blended profit sharing percentage is impacted by the respective profit sharing ratios of the funds generating carried interest in the period. In addition, this change was attributable to an increase in salary, bonus and benefits of $20.0 million during the nine months ended September 30, 2016 as compared to the same period in 2015 as a result of an increase in headcount during the nine months ended September 30, 2016.
Included in profit sharing expense is $41.9 million and $53.6 million related to the Incentive Pool for the nine months ended September 30, 2016 and 2015, respectively.
Interest expense increased $8.1 million for the nine months ended September 30, 2016, as compared to the nine months ended September 30, 2015 as a result of the issuance of the 2026 Senior Notes in May 2016, as described in note 9 to our condensed consolidated financial statements.
General, administrative and other expenses increased by $27.0 million for the nine months ended September 30, 2016, as compared to the nine months ended September 30, 2015 primarily due to certain expenses where the Company is considered the principal under the relevant agreements and is required to record the expense and related reimbursement on a gross basis. The increase was also driven by an increase in technology and new fund organizational expenses during the nine months ended September 30, 2016, as compared to the nine months ended September 30, 2015.
Depreciation and amortization decreased by $19.2 million for the nine months ended September 30, 2016, as compared to the nine months ended September 30, 2015 as a result of certain intangibles in connection with the Company’s acquisition of Stone Tower Capital LLC and its related management companies being fully amortized at December 31, 2015.
Other Income (Loss)
Three Months Ended September 30, 2016 Compared to Three Months Ended September 30, 2015
Net gains from investment activities decreased by $63.2 million for the three months ended September 30, 2016, as compared to the three months ended September 30, 2015. This change was primarily attributable to an unrealized gain on the Company’s investment in Athene of $15.1 million during the three months ended September 30, 2016, compared to an unrealized gain on the Company’s investment in Athene of $74.9 million during the three months ended September 30, 2015. See note 5 to the condensed consolidated financial statements for further information regarding the Company’s investment in Athene.Athene Holding.
Income from equity method investments increased by $21.2$24.3 million for the three months ended September 30, 2016,2017, as compared to the three months ended September 30, 2015.2016. This change was primarily driven by increases in the value of investments held by certain Apollo funds and other entities in which the Company has a direct interest, mainly with respect to Fund VIII Fund VII, ANRP II, COF III, ANRP I, Apollo Energy Opportunity Fund, L.P. (“AEOF”) and MidCap of $12.5 million, $2.6 million, $2.5 million, $2.2 million, $1.9 million, $1.3 million and $1.1 million, respectively. These increases were offset by a decrease in the value of Apollo’s ownership interest in AAA of $8.9$21.4 million, during the three months ended September 30, 20162017 as compared to the same period in 2015.2016.
Other income, net increased by $25.4 million for the three months ended September 30, 2017, as compared to the three months ended September 30, 2016. This change was primarily attributable to $19.0 million in proceeds received in connection with the Company’s early termination of a lease during the three months ended September 30, 2017.
Nine Months Ended September 30, 20162017 Compared to Nine Months Ended September 30, 20152016
Net gains from investment activities decreasedincreased by $57.2$52.6 million for the nine months ended September 30, 2016,2017, as compared to the nine months ended September 30, 2015.2016. This change was primarily attributable to an unrealized gain onincrease in the fair value of the Company’s investment in Athene of $44.9 millionHolding during the nine months ended September 30, 2016,2017, as compared to an unrealized gain on the Company’s investmentsame period in Athene of $99.7 million during the nine months ended September 30, 2015.2016. See note 5 to the condensed consolidated financial statements for further information regarding the Company’s investment in Athene.Athene Holding.
Net gains from investment activities of consolidated VIEs decreasedincreased by $5.2$8.3 million for the nine months ended September 30, 2016,2017, as compared to the nine months ended September 30, 2015.2016. See note 4 to the condensed consolidated financial statements for details regarding net gains from investment activities of consolidated VIEs.
Income from equity method investments increased by $46.3$38.5 million for the nine months ended September 30, 2016,2017, as compared to the nine months ended September 30, 2015.2016. This change was primarily driven by increases in the value of investments held by certain Apollo funds and other entities in which the Company has a direct interest, mainly with respect to Fund VIII Apollo European Principal Finance Fund II, L.P. (“EPF II”) and ANRP IIAAA of $34.5 million, $5.2$29.5 million and $4.3 million, respectively. These increases were offset by a decrease in the value of Apollo’s ownership interest in AAA and Fund VII of $10.8 million and $7.1$6.5 million, respectively, during the nine months ended September 30, 20162017, as compared to the same period in 2015.2016.
Other income, net decreasedincreased by $6.3$44.3 million for the nine months ended September 30, 2016,2017, as compared to the nine months ended September 30, 2015. This change was2016 primarily driven by foreign exchange lossesattributable to $19.0 million in proceeds received in connection with the Company’s early termination of a lease during the nine months ended September 30, 2016, compared2017, in addition to foreign exchange gains$17.5 million in insurance proceeds received during the nine months ended September 30, 2015.2017 in connection with fees and expenses relating to a legal proceeding.
Net Income Attributable to Non-Controlling Interests and Preferred Shareholders
For information related to net income attributable to Non-Controlling Interests and net income attributable to preferred shareholders, see note 12 to the condensed consolidated financial statements.
Income Tax (Provision) BenefitProvision
The Apollo Operating Group and its subsidiaries generally operate as partnerships for U.S. federal income tax purposes. As a result, only a portion of the income we earn is subject to corporate-level tax in the United States and foreign jurisdictions. The provision for income taxes includes federal, state and local income taxes in the United States and foreign income taxes.
Three Months Ended September 30, 20162017 Compared to Three Months Ended September 30, 20152016
The Company records its income tax provision based on an estimated full-year effective tax rate. The effective tax rate was 11.2% and 6.4%decreased by $13.1 million for the three months ended September 30, 2016 and 2015, respectively. The income tax provision increased by $23.1 million for the three months ended September 30, 2016,2017, as compared to the three months ended September 30, 20152016. The decrease in the income tax provision was primarily due to aan overall change in the mix of earnings whichwhen comparing the amount of earnings that are subject to corporate-level taxation as well as an increase in Management Business incometo those earnings that are not subject to corporate-level taxation.tax as these earnings are passed through to Non-Controlling Interests and Class A shareholders. The differencesprovision for income taxes includes federal, state, local and foreign income taxes resulting in an effective income tax rate of 3.7% and 11.2% for the three months ended September 30, 2017 and 2016, respectively. The most significant reconciling items between our U.S. federal statutory income tax rate and our effective income tax rate were due to the following: (i) income passed through to Non-Controlling Interests; (ii) income passed through to Class A shareholders; and (iii) state and local income taxes including NYC UBT (see note 8 to the condensed consolidated financial statements for further details regarding the Company’s income tax provision).
Nine Months Ended September 30, 20162017 Compared to Nine Months Ended September 30, 20152016
The Company records its income tax provision based on an estimated full-year effective tax rate of 9.8% and 6.1% for the nine months ended September 30, 2016 and 2015, respectively. The income tax provision increaseddecreased by $41.3$7.6 million for the nine months ended September 30, 2016,2017, as compared to the nine months ended September 30, 20152016. The decrease was primarily due to aan overall change in the mix of earnings whichwhen comparing the amount of earnings that are subject to corporate-level taxation as well as an increase in Management Business incometo those earnings that are not subject to corporate-level taxation.tax as these earnings are passed through to Non-Controlling Interests and Class A shareholders. The differencesprovision for income taxes includes federal, state, local and foreign income taxes resulting in an effective income tax rate of 5.3% and 9.8% for the nine months ended September 30, 2017 and 2016, respectively. The most significant reconciling items between our U.S. federal statutory income tax rate and our effective income tax rate were due to the following: (i) income passed through to Non-Controlling Interests; (ii) income passed through to Class A shareholders; and (iii) state and local income taxes including NYC UBT (see note 8 to the condensed consolidated financial statements for further details regarding the Company’s income tax (provision) benefit)provision).
Non-Controlling Interests
Net income attributable to Non-Controlling Interests in the Apollo Operating Group consisted of the following:
|
| | | | | | | | | | | | | | | |
| | For the Three Months Ended September 30, | | For the Nine Months Ended September 30, |
| | 2016 | | 2015 | | 2016 | | 2015 |
| | (in thousands) |
| Net income | $ | 234,718 |
| | $ | 96,559 |
| | $ | 575,960 |
| | $ | 326,131 |
|
| Net (income) loss attributable to Non-Controlling Interests in consolidated entities | 222 |
| | (161 | ) | | (3,891 | ) | | (11,218 | ) |
| Net income after Non-Controlling Interests in consolidated entities | 234,940 |
| | 96,398 |
| | 572,069 |
| | 314,913 |
|
| Adjustments: | | | | | | | |
Income tax provision(1) | 29,667 |
| | 6,591 |
| | 62,508 |
| | 21,197 |
|
NYC UBT and foreign tax benefit(2) | (4,419 | ) | | (3,015 | ) | | (11,715 | ) | | (6,132 | ) |
| Net income in non-Apollo Operating Group entities | 66 |
| | 49 |
| | 85 |
| | 447 |
|
| Total adjustments | 25,314 |
| | 3,625 |
| | 50,878 |
| | 15,512 |
|
| Net income after adjustments | 260,254 |
| | 100,023 |
| | 622,947 |
| | 330,425 |
|
| Approximate weighted average ownership percentage of Apollo Operating Group | 53.9 | % | | 55.3 | % | | 54.0 | % | | 56.4 | % |
| Net income attributable to Non-Controlling Interests in Apollo Operating Group | $ | 140,321 |
| | $ | 55,347 |
| | $ | 336,186 |
| | $ | 186,507 |
|
| |
(1) | Reflects all taxes recorded in our condensed consolidated statements of operations. Of this amount, U.S. federal, state, and local corporate income taxes attributable to APO Corp. are added back to income of the Apollo Operating Group before calculating Non-Controlling Interests as the income allocable to the Apollo Operating Group is not subject to such taxes. |
| |
(2) | Reflects NYC UBT and foreign taxes that are attributable to the Apollo Operating Group and its subsidiaries related to its operations in the U.S. as partnerships and in non-U.S. jurisdictions as corporations. As such, these amounts are considered in the income attributable to the Apollo Operating Group. |
Segment Analysis
Discussed below are our results of operations for each of our reportable segments. They represent the segment information available and utilized by our executive management, which consists of our Managing Partners, who operate collectively as our chief operating decision maker, to assess performance and to allocate resources. Management divides its operations into three reportable segments: private equity, credit and real estate.assets. These segments were established based on the nature of investment activities in each underlying fund, including the specific type of investment made the frequency of trading, and the level of control over the investment. Segment results represent segment income (loss) before income tax (provision) benefitprovision excluding transaction-related charges arising from the 2007 private placement, and any acquisitions. Transaction-related charges include equity-based compensation charges, the amortization of intangible assets and contingent consideration and certain other charges associated with acquisitions. In addition, segment results excludesexclude non-cash revenue and expense related to equity awards granted by unconsolidated related parties to employees of the Company, as well as the assets, liabilities and operating results of the funds and VIEs that are included in the condensed consolidated financial statements.
Our financial results vary, since carried interest, which generally constitutes a large portion of the income from the funds that we manage, as well as the transaction and advisory fees that we receive, can vary significantly from quarter to quarter and year to year. As a result, we emphasize long-term financial growth and profitability to manage our business.
Private Equity
The following tablestable sets forth our segment statement of operations information and our supplemental performance measure, EI, for the Management Business and Incentive Business within our private equity segment for the three and nine months ended September 30, 20162017 and 2015, respectively.2016. Prior period financial data has been updated to conform to the current presentation.
| | | | For the Three Months Ended September 30, 2016 | | For the Three Months Ended September 30, 2015 | | | For the Three Months Ended September 30, | | Total Change | | Percentage Change | | For the Nine Months Ended September 30, | | Total Change | | Percentage Change |
| | Management | | Incentive | | Total | | Management | | Incentive | | Total | | Total Change | | Percentage Change | 2017 | | 2016 | | 2017 | | 2016 | |
| | (in thousands) | | | (in thousands) | | | | (in thousands) | | |
Private Equity(1): | | | | | | | | | | | | | | | | |
| Private Equity: | | | | | | | | | | | | | | | | |
| Revenues: | | | | | | | | | | | | | | | | | | | | | | | | | | | | | | |
| Management fees from related parties | | $ | 76,079 |
| | $ | 91,545 |
| | $ | (15,466 | ) | | (16.9 | )% | | $ | 230,752 |
| | $ | 242,981 |
| | $ | (12,229 | ) | | (5.0 | )% |
| Advisory and transaction fees from related parties, net | $ | 26,601 |
| | $ | — |
| | $ | 26,601 |
| | $ | 4,736 |
| | $ | — |
| | $ | 4,736 |
| | $ | 21,865 |
| | 461.7 | % | 10,572 |
| | 26,601 |
| | (16,029 | ) | | (60.3 | ) | | 41,646 |
| | 87,615 |
| | (45,969 | ) | | (52.5 | ) |
| Management fees from related parties | 91,545 |
| | — |
| | 91,545 |
| | 71,876 |
| | — |
| | 71,876 |
| | 19,669 |
| | 27.4 |
| |
| Carried interest income (loss) from related parties: | | | | | | | | | | | | | | | | |
Unrealized gains (losses)(2) | — |
| | 75,019 |
| | 75,019 |
| | — |
| | (167,364 | ) | | (167,364 | ) | | 242,383 |
| | NM |
| |
| Realized gains | — |
| | 9,844 |
| | 9,844 |
| | — |
| | 102,138 |
| | 102,138 |
| | (92,294 | ) | | (90.4 | ) | |
| Total carried interest income (loss) from related parties | — |
| | 84,863 |
| | 84,863 |
| | — |
| | (65,226 | ) | | (65,226 | ) | | 150,089 |
| | NM |
| |
| Carried interest income from related parties: | | | | | | | | | | | | | | | | |
Unrealized(1) | | 286,589 |
| | 75,019 |
| | 211,570 |
| | 282.0 |
| | 351,836 |
| | 136,529 |
| | 215,307 |
| | 157.7 |
|
| Realized | | 21,859 |
| | 9,844 |
| | 12,015 |
| | 122.1 |
| | 313,817 |
| | 10,110 |
| | 303,707 |
| | NM |
|
| Total carried interest income from related parties | | 308,448 |
| | 84,863 |
| | 223,585 |
| | 263.5 |
| | 665,653 |
|
| 146,639 |
| | 519,014 |
| | 353.9 |
|
| Total Revenues | 118,146 |
| | 84,863 |
| | 203,009 |
| | 76,612 |
| | (65,226 | ) | | 11,386 |
| | 191,623 |
| | NM |
| 395,099 |
| | 203,009 |
| | 192,090 |
| | 94.6 |
| | 938,051 |
| | 477,235 |
| | 460,816 |
| | 96.6 |
|
| Expenses: | | | | | | | | | | | | | | | | | | | | | | | | | | | | | | |
| Compensation and benefits: | | | | | | | | | | | | | | | | | | | | | | | | | | | | | | |
| Salary, bonus and benefits | 32,532 |
| | — |
| | 32,532 |
| | 32,957 |
| | — |
| | 32,957 |
| | (425 | ) | | (1.3 | ) | 31,467 |
| | 32,532 |
| | (1,065 | ) | | (3.3 | ) | | 93,230 |
| | 96,170 |
| | (2,940 | ) | | (3.1 | ) |
| Equity-based compensation | 6,645 |
| | — |
| | 6,645 |
| | 6,974 |
| | — |
| | 6,974 |
| | (329 | ) | | (4.7 | ) | 6,335 |
| | 6,645 |
| | (310 | ) | | (4.7 | ) | | 21,134 |
| | 20,795 |
| | 339 |
| | 1.6 |
|
| Profit sharing expense | — |
| | 26,500 |
| | 26,500 |
| | — |
| | (26,044 | ) | | (26,044 | ) | | 52,544 |
| | NM |
| |
| Profit sharing expense: | | | | | | | | | | | | | | | | |
| Unrealized | | 96,992 |
| | 19,234 |
| | 77,758 |
| | 404.3 |
| | 117,025 |
| | 29,403 |
| | 87,622 |
| | 298.0 |
|
| Realized | | 17,394 |
| | 7,266 |
| | 10,128 |
| | 139.4 |
| | 145,783 |
| | 7,398 |
| | 138,385 |
| | NM |
|
| Realized: Equity-based | | 808 |
| | — |
| | 808 |
| | NM |
| | 1,270 |
| | — |
| | 1,270 |
| | NM |
|
| Total profit sharing expense | | 115,194 |
| | 26,500 |
| | 88,694 |
| | 334.7 |
| | 264,078 |
| | 36,801 |
| | 227,277 |
| | NM |
|
| Total compensation and benefits | 39,177 |
| | 26,500 |
| | 65,677 |
| | 39,931 |
| | (26,044 | ) | | 13,887 |
| | 51,790 |
| | 372.9 |
| 152,996 |
| | 65,677 |
| | 87,319 |
| | 133.0 |
| | 378,442 |
| | 153,766 |
| | 224,676 |
| | 146.1 |
|
| Other expenses | 18,448 |
| | — |
| | 18,448 |
| | 17,326 |
| | — |
| | 17,326 |
| | 1,122 |
| | 6.5 |
| |
| Non-compensation expenses: | | | | | | | | | | | | | | | | |
| General, administrative and other | | 19,699 |
| | 18,118 |
| | 1,581 |
| | 8.7 |
| | 53,676 |
| | 54,400 |
| | (724 | ) | | (1.3 | ) |
| Placement fees | | 2,257 |
| | 330 |
| | 1,927 |
| | NM |
| | 3,732 |
| | 2,409 |
| | 1,323 |
| | 54.9 |
|
| Total non-compensation expenses | | 21,956 |
| | 18,448 |
| | 3,508 |
| | 19.0 |
| | 57,408 |
| | 56,809 |
| | 599 |
| | 1.1 |
|
| Total Expenses | 57,625 |
| | 26,500 |
| | 84,125 |
| | 57,257 |
| | (26,044 | ) | | 31,213 |
| | 52,912 |
| | 169.5 |
| 174,952 |
| | 84,125 |
| | 90,827 |
| | 108.0 |
| | 435,850 |
| | 210,575 |
| | 225,275 |
| | 107.0 |
|
| Other Income (Loss): | | | | | | | | | | | | | | | | |
| Net interest expense | — |
| | (4,188 | ) | | (4,188 | ) | | — |
| | (2,425 | ) | | (2,425 | ) | | (1,763 | ) | | 72.7 |
| |
| Other Income: | | | | | | | | | | | | | | | | |
| Income from equity method investments | | 39,875 |
| | 14,384 |
| | 25,491 |
| | 177.2 |
| | 81,951 |
| | 40,311 |
| | 41,640 |
| | 103.3 |
|
| Net gains from investment activities | — |
| | 1,191 |
| | 1,191 |
| | — |
| | 5,904 |
| | 5,904 |
| | (4,713 | ) | | (79.8 | ) | 7,959 |
| | 1,191 |
| | 6,768 |
| | NM |
| | 11,255 |
| | 3,542 |
| | 7,713 |
| | 217.8 |
|
| Income from equity method investments | — |
| | 14,384 |
| | 14,384 |
| | — |
| | 3,827 |
| | 3,827 |
| | 10,557 |
| | 275.9 |
| |
| Other income (loss), net | 103 |
| | — |
| | 103 |
| | (43 | ) | | — |
| | (43 | ) | | 146 |
| | NM |
| |
| Total Other Income (Loss) | 103 |
| | 11,387 |
| | 11,490 |
| | (43 | ) | | 7,306 |
| | 7,263 |
| | 4,227 |
| | 58.2 |
| |
| Economic Income (Loss) | $ | 60,624 |
| | $ | 69,750 |
| | $ | 130,374 |
| | $ | 19,312 |
| | $ | (31,876 | ) | | $ | (12,564 | ) | | $ | 142,938 |
| | NM |
| |
| Net interest loss | | (4,374 | ) | | (4,188 | ) | | (186 | ) | | 4.4 |
| | (12,952 | ) | | (9,868 | ) | | (3,084 | ) | | 31.3 |
|
| Other income, net | | 7,344 |
| | 103 |
| | 7,241 |
| | NM |
| | 25,915 |
| | 320 |
| | 25,595 |
| | NM |
|
| Total Other Income | | 50,804 |
| | 11,490 |
| | 39,314 |
| | 342.2 |
| | 106,169 |
| | 34,305 |
| | 71,864 |
| | 209.5 |
|
| Economic Income | | $ | 270,951 |
| | $ | 130,374 |
| | $ | 140,577 |
| | 107.8 | % | | $ | 608,370 |
| | $ | 300,965 |
| | $ | 307,405 |
| | 102.1 | % |
| |
| (1) | Prior period amounts have been recast to conform to the current presentation. See note 14 to our condensed consolidated financial statements for more detail on the reclassification within our three segments. |
| |
(2) | Included in unrealized carried interest income (loss) from related parties for the threenine months ended September 30, 20162017 and 20152016 was a reversal of previously realized carried interest income due to the general partner obligation to return previously distributed carried interest income. See note 12 to our condensed consolidated financial statements for further detail regarding the general partner obligation. |
|
| | | | | | | | | | | | | | | | | | | | | | | | | | | | | | |
| | For the Nine Months Ended September 30, 2016 | | For the Nine Months Ended September 30, 2015 | |
|
| | Management | | Incentive | | Total | | Management | | Incentive | | Total | | Total Change | | Percentage Change |
| | (in thousands) | | |
Private Equity(1): | | | | | | | | | | | | | | | |
| Revenues: | | | | | | | | | | | | | | | |
| Advisory and transaction fees from related parties, net | $ | 87,615 |
| | $ | — |
| | $ | 87,615 |
| | $ | 17,490 |
| | $ | — |
| | $ | 17,490 |
| | $ | 70,125 |
| | 400.9 | % |
| Management fees from related parties | 242,981 |
| | — |
| | 242,981 |
| | 220,742 |
| | — |
| | 220,742 |
| | 22,239 |
| | 10.1 |
|
| Carried interest income from related parties: | | | | | | | | | | | | | | | |
Unrealized gains (losses)(2) | — |
| | 136,529 |
| | 136,529 |
| | — |
| | (265,147 | ) | | (265,147 | ) | | 401,676 |
| | NM |
|
| Realized gains | — |
| | 10,110 |
| | 10,110 |
| | — |
| | 336,175 |
| | 336,175 |
| | (326,065 | ) | | (97.0 | ) |
| Total carried interest income from related parties | — |
| | 146,639 |
| | 146,639 |
|
| — |
|
| 71,028 |
|
| 71,028 |
| | 75,611 |
| | 106.5 |
|
| Total Revenues | 330,596 |
| | 146,639 |
| | 477,235 |
| | 238,232 |
| | 71,028 |
| | 309,260 |
| | 167,975 |
| | 54.3 |
|
| Expenses: | | | | | | | | | | | | | | | |
| Compensation and benefits: | | | | | | | | | | | | | | | |
| Salary, bonus and benefits | 96,170 |
| | — |
| | 96,170 |
| | 93,792 |
| | — |
| | 93,792 |
| | 2,378 |
| | 2.5 |
|
| Equity-based compensation | 20,795 |
| | — |
| | 20,795 |
| | 23,467 |
| | — |
| | 23,467 |
| | (2,672 | ) | | (11.4 | ) |
| Profit sharing expense | — |
| | 36,801 |
| | 36,801 |
| | — |
| | 60,796 |
| | 60,796 |
| | (23,995 | ) | | (39.5 | ) |
| Total compensation and benefits | 116,965 |
| | 36,801 |
| | 153,766 |
| | 117,259 |
| | 60,796 |
| | 178,055 |
| | (24,289 | ) | | (13.6 | ) |
| Other expenses | 56,809 |
| | — |
| | 56,809 |
| | 48,973 |
| | — |
| | 48,973 |
| | 7,836 |
| | 16.0 |
|
| Total Expenses | 173,774 |
| | 36,801 |
| | 210,575 |
| | 166,232 |
| | 60,796 |
| | 227,028 |
| | (16,453 | ) | | (7.2 | ) |
| Other Income: | | | | | | | | | | | | | | | |
| Net interest expense | — |
| | (9,868 | ) | | (9,868 | ) | | — |
| | (7,439 | ) | | (7,439 | ) | | (2,429 | ) | | 32.7 |
|
| Net gains from investment activities | — |
| | 3,542 |
| | 3,542 |
| | — |
| | 5,904 |
| | 5,904 |
| | (2,362 | ) | | (40.0 | ) |
| Income from equity method investments | — |
| | 40,311 |
| | 40,311 |
| | — |
| | 18,588 |
| | 18,588 |
| | 21,723 |
| | 116.9 |
|
| Other income, net | 320 |
| | — |
| | 320 |
| | 1,743 |
| | 1,160 |
| | 2,903 |
| | (2,583 | ) | | (89.0 | ) |
| Total Other Income | 320 |
| | 33,985 |
| | 34,305 |
| | 1,743 |
| | 18,213 |
| | 19,956 |
| | 14,349 |
| | 71.9 |
|
| Economic Income | $ | 157,142 |
| | $ | 143,823 |
| | $ | 300,965 |
| | $ | 73,743 |
| | $ | 28,445 |
| | $ | 102,188 |
| | $ | 198,777 |
| | 194.5 | % |
| |
(1) | Prior period amounts have been recast to conform to the current presentation. See note 14 to our condensed consolidated financial statements for more detail on the reclassification within our three segments. |
| |
(2) | Included in unrealized carried interest income from related parties for the nine months ended September 30, 2016 and 2015 was a reversal of previously realized carried interest income due to the general partner obligation to return previously distributed carried interest income. See note 1213 to our condensed consolidated financial statements for further detail regarding the general partner obligation. |
Revenues
Three Months Ended September 30, 20162017 Compared to Three Months Ended September 30, 20152016
Management fees from affiliates decreased by $15.5 million for the three months ended September 30, 2017, as compared to the three months ended September 30, 2016. This change was primarily attributable to a decrease in management fees earned with respect to ANRP II of $12.7 million during the three months ended September 30, 2017 as compared to the three months ended September 30, 2016 primarily due to a one-time catch-up of management fees during the three months ended September 30, 2016 of $13.2 million.
Advisory and transaction fees from related parties, net increaseddecreased by $21.9$16.0 million for the three months ended September 30, 2016,2017, as compared to the three months ended September 30, 2015.2016. This change was primarily attributable to an increasea decrease in net advisory and transaction fees earned with respect to Fund VIII’s portfolio companies of $20.3$15.3 million offset during the three months ended September 30, 20162017 as compared to the three months ended September 30, 2015.2016.
Management fees
Carried interest income from related parties increased by $19.7$223.6 million for the three months ended September 30, 2016,2017, as compared to the three months ended September 30, 2015. This change was primarily attributable to management fees earned with respect to ANRP II of $22.3 million during the three months ended September 30, 2016 in connection with capital raises for the fund during 2016, partially offset by a decrease in management fees earned with respect to ANRP I of $0.9 million during the three months ended September 30, 2016 as compared to the three months ended September 30, 2015.
Carried interest income from related parties increased by $150.1 million for the three months ended September 30, 2016, as compared to the three months ended September 30, 2015.2016. This change was primarily attributable to increases in carried interest income earned from Fund VIII, Fund VII and Fund VIIVI of $126.4$156.3 million, $40.8 million and $70.2$33.8 million, respectively. The increase in carried interest income earned from Fund VIII was primarily driven by appreciation in the value of privately held portfolio companies and the fund exiting the “catch-up” phase, in which the Company earns a disproportionate return (typically 80%) for a portion of the return until the Company’s carried interest equates to its 20% carried interest fee rate. The increase in carried interest income from Fund VII was due to lower depreciation in the fund’s publicprivate portfolio company holdings in the energy sector. This was partially offset by decreasescompanies. The increases in carried interest income earned from AAA/Other of $67.8 millionFund VII and Fund VI were primarily attributable to lowerdriven by appreciation in its investmentvalue in Athene.the funds’ public portfolio companies.
Nine Months Ended September 30, 20162017 Compared to Nine Months Ended September 30, 20152016
Management fees from related parties decreased by $12.2 million for the nine months ended September 30, 2017, as compared to the nine months ended September 30, 2016. This change was primarily attributable to decreases in management fees earned with respect to ANRP II during the nine months ended September 30, 2017 as compared to the nine months ended September 30, 2016 primarily due to a one-time catch-up of management fees during the nine months ended September 30, 2016 of $14.8 million.
Advisory and transaction fees from related parties, net increaseddecreased by $70.1$46.0 million for the nine months ended September 30, 2016,2017, as compared to the nine months ended September 30, 2015.2016. This change was primarily attributable to an increasea decrease in net advisory and transaction fees earned with respect to Fund VIII’s portfolio companies of $79.7 million offset by a decrease related to Fund VII’s portfolio companies of $6.4$49.0 million during the nine months ended September 30, 20162017 as compared to the nine months ended September 30, 2015.2016.
Management feesCarried interest income from related parties increased by $22.2$519.0 million for the nine months ended September 30, 2016,2017, as compared to the nine months ended September 30, 2015. This change was primarily attributable to management fees earned with respect to ANRP II of $39.1 million during the nine months ended September 30, 2016 in connection with capital raises for the fund during 2016, partially offset by decreases in management fees earned with respect to Fund VI, ANRP I and Fund VII of $5.9 million, $5.1 million and $3.2 million, respectively, during the nine months ended September 30, 2016 as compared to the nine months ended September 30, 2015.
Carried interest income from related parties increased by $75.6 million for the nine months ended September 30, 2016, as compared to the nine months ended September 30, 2015.2016. This change was primarily attributable to increases in carried interest income earned from Fund VIII, Fund VI and Fund VII of $262.8$271.0 million, which began accruing carried interest after meeting its preferred return threshold$198.7 million and $46.1 million, respectively, during the nine months ended September 30, 2017 as compared to the nine months ended September 30, 2016. This was partially offset by decreasesThe increase in carried interest income earned from Fund VIIVIII and Fund VI of $83.6 million and $80.9 million, respectively. The decrease in carried interest income earned from Fund VII was primarily driven primarily by a decreaseappreciation in carried interest income related to its privately heldvalue in the funds’ private portfolio companies partially offset by lower depreciation in its energy related public portfolio company holdings.companies. The decreaseincrease in carried interest income earned from Fund VI was primarily driven by itsappreciation in value in the fund’s public portfolio company holdings.companies.
Expenses
Three Months Ended September 30, 20162017 Compared to Three Months Ended September 30, 20152016
Compensation and benefits expense increased by $51.8$87.3 million for the three months ended September 30, 2016,2017, as compared to the three months ended September 30, 2015.2016. This change was primarily attributable to an increase in profit sharing expense of $52.5$88.7 million as a result of a corresponding increase in carried interest income as discusseddescribed above. In any period the blended profit sharing percentage is impacted by the respective profit sharing ratios of the funds that are generating carried interest in the period.
Included in profit sharing expense is $2.9$9.3 million and $17.4$2.9 million related to the Incentive Pool for the three months ended September 30, 20162017 and 2015,2016, respectively. The Incentive Pool is separate from the fund related profit sharing expense and may result in greater variability in compensation and have a variable impact on the blended profit sharing percentage during a particular quarter.period.
Other expensesGeneral, administrative and other increased by $1.1$1.6 million during the three months ended September 30, 2016,2017, as compared to the three months ended September 30, 2015. The2016. This change was primarily driven by an increase in general, administrative and other expense of $3.0 million primarily attributable to an increase in new fund organizational expenses. These increases were partially offset by a decrease in professional fees of $2.0 million primarily driven by decreased legal expenses during the three months ended September 30, 20162017, as compared to the same period in 2016.
Placement fees increased by $1.9 million during the three months ended September 30, 2017, as compared to the three months ended September 30, 2015.2016. This change was primarily driven by placement fees incurred in connection with capital raising activity relating to Fund IX of $2.3 million during the three months ended September 30, 2017.
Nine Months Ended September 30, 20162017 Compared to Nine Months Ended September 30, 20152016
Compensation and benefits expense decreasedincreased by $24.3$224.7 million for the nine months ended September 30, 20162017 as compared to the nine months ended September 30, 2015. This change was primarily attributable to a decrease in the Incentive Pool of $39.8 million. The Incentive Pool is separate from the fund related profit sharing expense and may result in greater variability in compensation and have a variable impact on the blended profit sharing percentage during a particular quarter. The decrease in the Incentive Pool was offset by an increase related to the profit sharing expense as a result of the corresponding increase in carried interest income as discussed above. In any period the blended profit sharing percentage is impacted by the respective profit sharing ratios of the funds that are generating carried interest in the period.
Other expenses increased by $7.8 million during the nine months ended September 30, 2016, as compared to the nine months ended September 30, 2015. The change was primarily driven by an increase in general, administrative and other expense of $7.2 million primarily driven by an increase in new fund organizational expenses and other miscellaneous expenses during the nine months ended September 30, 2016, as compared to the nine months ended September 30, 2015.
Other Income (Loss)
Three Months Ended September 30, 2016 Compared to Three Months Ended September 30, 2015
Net interest expense increased by $1.8 million for the three months ended September 30, 2016, as compared to the three months ended September 30, 2015, primarily due to additional interest expense incurred during the three months ended September 30, 2016 as a result of the issuance of the 2026 Senior Notes in May 2016, as described in note 9 to our condensed consolidated financial statements.
Net gains from investment activities decreased by $4.7 million for the three months ended September 30, 2016, as compared to the three months ended September 30, 2015, due to lower unrealized gains on the Company’s investment in Athene during the three months ended September 30, 2016. See note 5 to the condensed consolidated financial statements for further information regarding the Company’s investment in Athene.
Income from equity method investments increased by $10.6 million for the three months ended September 30, 2016, as compared to the three months ended September 30, 2015. This change was primarily attributable to increases in the income from Apollo’s equity ownership interest in Fund VIII, Fund VII, ANRP II and ANRP I of $12.5 million, $2.6 million, $2.5 million and $1.9 million, respectively, offset by a decrease in the income from Apollo’s equity ownership interest in AAA of $8.9 million during the three months ended September 30, 2016, as compared to the three months ended September 30, 2015.
Nine Months Ended September 30, 2016 Compared to Nine Months Ended September 30, 2015
Net interest expense increased by $2.4 million for the nine months ended September 30, 2016, as compared to the nine months ended September 30, 2015, primarily due to additional interest expense incurred during the nine months ended September 30, 2016 as a result of the issuance of the 2026 Senior Notes in May 2016, as described in note 9 to our condensed consolidated financial statements.
Net gains from investment activities decreased by $2.4 million for the nine months ended September 30, 2016, as compared to the nine months ended September 30, 2015, due to lower unrealized gains on the Company’s investment in Athene during the nine months ended September 30, 2016, as compared to the nine months ended September 30, 2015. See note 5 to the condensed consolidated financial statements for further information regarding the Company’s investment in Athene.
Income from equity method investments increased by $21.7 million for the nine months ended September 30, 2016, as compared to the nine months ended September 30, 2015. This change was primarily attributable to an increase in the income from Apollo’s equity ownership interest in Fund VIII, ANRP II and ANRP I of $34.5 million, $4.3 million and $2.6 million, respectively, offset by decreases in the income from Apollo’s ownership interest in AAA and Fund VII of $10.8 million and $7.1 million, respectively, during the nine months ended September 30, 2016, as compared to the nine months ended September 30, 2015.
Credit
The following tables sets forth segment statement of operations information and EI for the Management Business and Incentive Business within our credit segment for the three and nine months ended September 30, 2016 and 2015, respectively.
|
| | | | | | | | | | | | | | | | | | | | | | | | | | | | | | |
| | For the Three Months Ended September 30, 2016 | | For the Three Months Ended September 30, 2015 | | |
| | Management | | Incentive | | Total | | Management | | Incentive | | Total | | Total Change | | Percentage Change |
| | (in thousands) | | |
Credit(1): | | | | | | | | | | | | | | | |
| Revenues: | | | | | | | | | | | | | | | |
| Advisory and transaction fees from related parties, net | $ | 2,612 |
| | $ | — |
| | $ | 2,612 |
| | $ | 4,141 |
| | $ | — |
| | $ | 4,141 |
| | $ | (1,529 | ) | | (36.9 | )% |
| Management fees from related parties | 151,386 |
| | — |
| | 151,386 |
| | 141,706 |
| | — |
| | 141,706 |
| | 9,680 |
| | 6.8 |
|
| Carried interest income from related parties: | | | | | | | | | | | | | | | |
Unrealized gains (losses)(2) | — |
| | 91,502 |
| | 91,502 |
| | — |
| | (15,056 | ) | | (15,056 | ) | | 106,558 |
| | NM |
|
| Realized gains | 2,307 |
| | 18,193 |
| | 20,500 |
| | 9,285 |
| | 13,046 |
| | 22,331 |
| | (1,831 | ) | | (8.2 | ) |
| Total carried interest income from related parties | 2,307 |
| | 109,695 |
| | 112,002 |
| | 9,285 |
| | (2,010 | ) | | 7,275 |
| | 104,727 |
| | NM |
|
| Total Revenues | 156,305 |
| | 109,695 |
| | 266,000 |
| | 155,132 |
| | (2,010 | ) | | 153,122 |
| | 112,878 |
| | 73.7 |
|
| Expenses: | | | | | | | | | | | | | | | |
| Compensation and benefits: | | | | | | | | | | | | | | | |
| Salary, bonus and benefits | 45,143 |
| | — |
| | 45,143 |
| | 52,647 |
| | — |
| | 52,647 |
| | (7,504 | ) | | (14.3 | ) |
| Equity-based compensation | 8,834 |
| | — |
| | 8,834 |
| | 6,896 |
| | — |
| | 6,896 |
| | 1,938 |
| | 28.1 |
|
| Profit sharing expense | — |
| | 45,797 |
| | 45,797 |
| | — |
| | 12,739 |
| | 12,739 |
| | 33,058 |
| | 259.5 |
|
| Total compensation and benefits | 53,977 |
| | 45,797 |
| | 99,774 |
| | 59,543 |
| | 12,739 |
| | 72,282 |
| | 27,492 |
| | 38.0 |
|
| Other expenses | 29,884 |
| | — |
| | 29,884 |
| | 31,333 |
| | — |
| | 31,333 |
| | (1,449 | ) | | (4.6 | ) |
| Total Expenses | 83,861 |
| | 45,797 |
| | 129,658 |
| | 90,876 |
| | 12,739 |
| | 103,615 |
| | 26,043 |
| | 25.1 |
|
| Other Income (Loss): | | | | | | | | | | | | | | | |
| Net interest expense | — |
| | (6,172 | ) | | (6,172 | ) | | — |
| | (3,003 | ) | | (3,003 | ) | | (3,169 | ) | | 105.5 |
|
| Net gains from investment activities | — |
| | 16,171 |
| | 16,171 |
| | — |
| | 75,340 |
| | 75,340 |
| | (59,169 | ) | | (78.5 | ) |
| Income from equity method investments | — |
| | 8,036 |
| | 8,036 |
| | — |
| | (1,949 | ) | | (1,949 | ) | | 9,985 |
| | NM |
|
| Other income (loss), net | (4,314 | ) | | (663 | ) | | (4,977 | ) | | 157 |
| | (305 | ) | | (148 | ) | | (4,829 | ) | | NM |
|
| Total Other Income (Loss) | (4,314 | ) | | 17,372 |
| | 13,058 |
| | 157 |
| | 70,083 |
| | 70,240 |
| | (57,182 | ) | | (81.4 | ) |
| Non-Controlling Interests | (510 | ) | | — |
| | (510 | ) | | (2,697 | ) | | — |
| | (2,697 | ) | | 2,187 |
| | (81.1 | ) |
| Economic Income | $ | 67,620 |
| | $ | 81,270 |
| | $ | 148,890 |
| | $ | 61,716 |
| | $ | 55,334 |
| | $ | 117,050 |
| | $ | 31,840 |
| | 27.2 | % |
| |
(1) | Prior period amounts have been recast to conform to the current presentation. See note 14 to our condensed consolidated financial statements for more detail on the reclassification within our three segments. |
| |
(2) | Included in unrealized carried interest gains (losses) from related parties for the three months ended September 30, 2016 and 2015 was a reversal of previously realized carried interest income due to the general partner obligation to return previously distributed carried interest income. See note 12 to our condensed consolidated financial statements for further detail regarding the general partner obligation. |
|
| | | | | | | | | | | | | | | | | | | | | | | | | | | | | | |
| | For the Nine Months Ended September 30, 2016 | | For the Nine Months Ended September 30, 2015 | |
|
| | Management | | Incentive | | Total | | Management | | Incentive | | Total | | Total Change | | Percentage Change |
| | (in thousands) | | |
Credit(1): | | | | | | | | | | | | | | | |
| Revenues: | | | | | | | | | | | | | | | |
| Advisory and transaction fees from related parties, net | $ | 10,058 |
| | $ | — |
| | $ | 10,058 |
| | $ | 13,913 |
| | $ | — |
| | $ | 13,913 |
| | $ | (3,855 | ) | | (27.7 | )% |
| Management fees from related parties | 445,149 |
| | — |
| | 445,149 |
| | 421,790 |
| | — |
| | 421,790 |
| | 23,359 |
| | 5.5 |
|
| Carried interest income from related parties: | | | | | | | | | | | | | | | |
Unrealized gains (losses)(2) | — |
| | 150,720 |
| | 150,720 |
| | — |
| | (67,748 | ) | | (67,748 | ) | | 218,468 |
| | NM |
|
| Realized gains | 17,516 |
| | 88,182 |
| | 105,698 |
| | 30,874 |
| | 77,874 |
| | 108,748 |
| | (3,050 | ) | | (2.8 | ) |
| Total carried interest income from related parties | 17,516 |
| | 238,902 |
| | 256,418 |
|
| 30,874 |
|
| 10,126 |
|
| 41,000 |
| | 215,418 |
| | NM |
|
| Total Revenues | 472,723 |
| | 238,902 |
| | 711,625 |
| | 466,577 |
| | 10,126 |
| | 476,703 |
| | 234,922 |
| | 49.3 |
|
| Expenses: | | | | | | | | | | | | | | | |
| Compensation and benefits: | | | | | | | | | | | | | | | |
| Salary, bonus and benefits | 151,464 |
| | — |
| | 151,464 |
| | 153,557 |
| | — |
| | 153,557 |
| | (2,093 | ) | | (1.4 | ) |
| Equity-based compensation | 25,694 |
| | — |
| | 25,694 |
| | 18,794 |
| | — |
| | 18,794 |
| | 6,900 |
| | 36.7 |
|
| Profit sharing expense | — |
| | 124,390 |
| | 124,390 |
| | — |
| | 26,853 |
| | 26,853 |
| | 97,537 |
| | 363.2 |
|
| Total compensation and benefits | 177,158 |
| | 124,390 |
| | 301,548 |
| | 172,351 |
| | 26,853 |
| | 199,204 |
| | 102,344 |
| | 51.4 |
|
| Other expenses | 97,306 |
| | — |
| | 97,306 |
| | 95,514 |
| | — |
| | 95,514 |
| | 1,792 |
| | 1.9 |
|
| Total Expenses | 274,464 |
| | 124,390 |
| | 398,854 |
| | 267,865 |
| | 26,853 |
| | 294,718 |
| | 104,136 |
| | 35.3 |
|
| Other Income (Loss): | | | | | | | | | | | | | | | |
| Net interest expense | — |
| | (14,542 | ) | | (14,542 | ) | | — |
| | (10,107 | ) | | (10,107 | ) | | (4,435 | ) | | 43.9 |
|
| Net gains from investment activities | — |
| | 45,819 |
| | 45,819 |
| | — |
| | 100,387 |
| | 100,387 |
| | (54,568 | ) | | (54.4 | ) |
| Income (loss) from equity method investments | — |
| | 21,824 |
| | 21,824 |
| | — |
| | (2,654 | ) | | (2,654 | ) | | 24,478 |
| | NM |
|
| Other income (loss), net | (4,472 | ) | | (1,040 | ) | | (5,512 | ) | | 3,507 |
| | (1,584 | ) | | 1,923 |
| | (7,435 | ) | | NM |
|
| Total Other Income (Loss) | (4,472 | ) | | 52,061 |
| | 47,589 |
| | 3,507 |
| | 86,042 |
| | 89,549 |
| | (41,960 | ) | | (46.9 | ) |
| Non-Controlling Interests | (5,070 | ) | | — |
| | (5,070 | ) | | (8,766 | ) | | — |
| | (8,766 | ) | | 3,696 |
| | (42.2 | ) |
| Economic Income | $ | 188,717 |
| | $ | 166,573 |
| | $ | 355,290 |
| | $ | 193,453 |
| | $ | 69,315 |
| | $ | 262,768 |
| | $ | 92,522 |
| | 35.2 | % |
| |
(1) | Prior period amounts have been recast to conform to the current presentation. See note 14 to our condensed consolidated financial statements for more detail on the reclassification within our three segments.
|
| |
(2) | Included in unrealized carried interest gains (losses) from related parties for the nine months ended September 30, 2016 and 2015 was a reversal of previously realized carried interest income due to the general partner obligation to return previously distributed carried interest income. See note 12 to our condensed consolidated financial statements for further detail regarding the general partner obligation. |
Revenues
Three Months Ended September 30, 2016 Compared to Three Months Ended September 30, 2015
Advisory and transaction fees from related parties, net, decreased by $1.5 million for the three months ended September 30, 2016, as compared to the three months ended September 30, 2015. The change was primarily driven by a decrease in net advisory and transaction fees related to CLOs of $1.1 million during the three months ended September 30, 2016, as compared to the same period during 2015.
Management fees from related parties increased by $9.7 million for the three months ended September 30, 2016, as compared to the three months ended September 30, 2015. This change was primarily attributable to increases in management fees earned from Athene, MidCap, assets advised by AAME and COF III of $4.3 million, $3.0 million, $2.7 million and $1.9 million, respectively, offset by a decrease in management fees earned from AINV of $3.5 million during the three months ended September 30, 2016, as compared to the same period during 2015.
Carried interest income from related parties increased by $104.7 million for the three months ended September 30, 2016, as compared to the three months ended September 30, 2015. This change was primarily attributable to increases in carried interest income earned from Apollo Credit Master Fund Ltd., CLOs, Apollo Structured Credit Recovery Master Fund III, L.P. (“SCRF III”), ACLF and AEOF of $26.9 million, $15.2 million, $13.2 million, $12.0 million and $7.4 million, respectively, during the three months ended September 30, 2016, as compared to the same period during 2015.
The increase in carried interest income from Apollo Credit Master Fund Ltd. was primarily attributable to increases in the market value of certain of the fund’s investments in the energy and insurance industries, as well as a stronger loan market during the three months ended September 30, 2016, as compared to the three months ended September 30, 2015. Gains from the broad leveraged loan market contributed to an increase in carried interest income earned from CLOs as assets appreciated and income remained steady during the three months ended September 30, 2016. The increase in carried interest income earned from SCRF III was primarily attributable to positive performance of the fund’s structured credit investments supplemented by a strong
yield during the three months ended September 30, 2016 as compared to the three months ended September 30, 2015. The increase in carried interest income earned from ACLF was primarily attributable to appreciation in a consumer services investment in the fund’s portfolio, offset by lower depreciation in an energy investment during the three months ended September 30, 2016 as compared to the three months ended September 30, 2015. The increase in carried interest income earned from AEOF for the three months ended September 30, 2016 as compared to the three months ended September 30, 2015 was primarily attributable to appreciation in energy investments during the three months ended September 30, 2016, supplemented by significant interest income generated from the portfolio.
Nine Months Ended September 30, 2016 Compared to Nine Months Ended September 30, 2015
Advisory and transaction fees from related parties, net, decreased by $3.9 million during the nine months ended September 30, 2016, as compared to the nine months ended September 30, 2015. The decrease was primarily driven by a decrease in net advisory and transaction fees from CLOs, Financial European Principal Finance Fund, L.P. (“FCI II”), Apollo Credit Master Fund Ltd. and SCRF III of $0.7 million, $0.7 million, $0.7 million and $0.6 million, respectively during the nine months ended September 30, 2016, as compared to the same period during 2015.
Management fees from related parties increased by $23.4 million for the nine months ended September 30, 2016, as compared to the nine months ended September 30, 2015. This change was primarily attributable to increases in management fees earned from MidCap, advisory assets advised by AAME, COF III and Athene of $9.9 million, $9.3 million, $6.7 million and $5.3 million, respectively, offset by a decrease in management fees earned from AINV of $10.9 million during the nine months ended September 30, 2016, as compared to the same period during 2015.
Carried interest income from related parties increased by $215.4 million for the nine months ended September 30, 2016, as compared to the nine months ended September 30, 2015. This change was primarily attributable to increases in carried interest income earned from EPF II, Apollo Credit Master Fund Ltd., an SIA, SCRF III and ACLF of $61.5 million, $30.9 million, $27.5 million, $22.0 million and $18.1 million, respectively, during the nine months ended September 30, 2016, as compared to the same period in 2015.
The increase in carried interest income earned from EPF II was primarily attributable to appreciation of European and UK hotel assets and German commercial real estate investments offset by the depreciation of certain shipping investments in the fund’s portfolio for the nine months ended September 30, 2016, compared to the appreciation of European direct real estate investments in the fund’s portfolio offset by depreciation of a Spanish consumer bank investment in the fund’s portfolio during the nine months ended September 30, 2015. The increase in carried interest income from Apollo Credit Master Fund Ltd. was primarily attributable to gains from the leveraged loan market, as well as narrowing spreads in fixed-income instruments during the nine months ended September 30, 2016 as compared to the nine months ended September 30, 2015. The increase in carried interest income from the SIA was attributable to the depreciation of investments in energy and natural resources for the nine months ended September 30, 2015 that did not recur during the nine months ended September 30, 2016. The increase in carried interest income from SCRF III was attributable to stronger positive performance of the fund’s structured credit portfolio during the nine months ended September 30, 2016 compared to the nine months ended September 30, 2015. Appreciation in consumer services and energy investments contributed to an increase in carried interest income earned from ACLF during the nine months ended September 30, 2016, compared to depreciation in energy investments during the nine months ended September 30, 2015.
Expenses
Three Months Ended September 30, 2016 Compared to Three Months Ended September 30, 2015
Compensation and benefits expense increased by $27.5 million for the three months ended September 30, 2016, as compared to the three months ended September 30, 2015. This change was primarily due to increases in profit sharing expense of $33.1$227.3 million offset by decreases in salary, bonus and benefits of $7.5 million, during the three months ended September 30, 2016, as compared to the three months ended September 30, 2015. Profit sharing expense increased as a result of a corresponding increase in carried interest income as described above. In any period the blended profit sharing percentage is impacted by the respective profit sharing ratios of the funds generating carried interest in the period. The decrease in salary, bonus and benefits was primarily attributable to a change in compensation structure which resulted in a decrease in accrued discretionary annual cash bonuses and an increase in accrued annual compensation to be awarded as discretionary Bonus Grants during the three months ended September 30, 2016. See “Critical Accounting Policies—Equity-Based Compensation” for more information regarding this change.
Included in profit sharing expense is $5.7 million and $3.5 million related to the Incentive Pool for the three months ended September 30, 2016 and 2015, respectively. The Incentive Pool is separate from the fund related profit sharing expense and may result in greater variability in compensation and have a variable impact on the blended profit sharing percentage during a particular quarter.
Other expenses decreased by $1.4 million for the three months ended September 30, 2016, as compared to the three months ended September 30, 2015, primarily attributable to a decrease in professional fees of $4.2 million as a result of a decrease in legal fees. These decreases were partially offset by an increase in general and administrative expenses of $3.6 million as a result of an increase in technology expenses during the three months ended September 30, 2016, as compared to the three months ended September 30, 2015.
Nine Months Ended September 30, 2016 Compared to Nine Months Ended September 30, 2015
Compensation and benefits expense increased by $102.3 million for the nine months ended September 30, 2016, as compared to the nine months ended September 30, 2015. This change was primarily due to increases in profit sharing expense of $97.5 million during the nine months ended September 30, 2016, as compared to the nine months ended September 30, 2015. Profit sharing expense increased as a result of a corresponding increase in carried interest income as described above. In any period the blended profit sharing percentage is impacted by the respective profit sharing ratios of the funds generating carried interest in the period.
Included in profit sharing expense is $35.6$40.5 million and $10.6$2.9 million related to the Incentive Pool for the nine months ended September 30, 2017 and 2016, respectively. The Incentive Pool is separate from the fund related profit sharing expense and
may result in greater variability in compensation and 2015, respectively.have a variable impact on the blended profit sharing percentage during a particular period.
Placement fees increased by $1.3 million during the nine months ended September 30, 2017, as compared to the nine months ended September 30, 2016. This change was primarily driven by placement fees incurred during the nine months ended September 30, 2017 of $3.5 million in connection with capital raising activity relating to Fund IX. Placement fees during the nine months ended September 30, 2016 were primarily incurred in connection with capital raising activity relating to ANRP II of $2.1 million.
Other Income
Other Income
Three Months Ended September 30, 20162017 Compared to Three Months Ended September 30, 20152016
Net interest expenseIncome from equity method investments increased by $3.2$25.5 million for the three months ended September 30, 2016,2017, as compared to the three months ended September 30, 2015,2016. This change was primarily attributable to increases in the income from Apollo’s equity ownership interest in Fund VIII and Fund VII of $21.4 million and $3.0 million, respectively, during the three months ended September 30, 2017, as compared to the three months ended September 30, 2016.
Net gains from investment activities increased by $6.8 million for the three months ended September 30, 2017, as compared to the three months ended September 30, 2016. This change was primarily attributable to an increase in the fair value of the Company’s investment in Athene Holding during the three months ended September 30, 2017, as compared to the same period in 2016. See note 5 to the condensed consolidated financial statements for further information regarding the Company’s investment in Athene Holding.
Other income, net increased by $7.2 million for the three months ended September 30, 2017, as compared to the three months ended September 30, 2016. This change was primarily attributable to proceeds received in connection with the Company’s early termination of a lease which occurred during the three months ended September 30, 2017.
Nine Months Ended September 30, 2017 Compared to Nine Months Ended September 30, 2016
Income from equity method investments increased by $41.6 million for the nine months ended September 30, 2017, as compared to the nine months ended September 30, 2016. This change was primarily attributable to increases in income from Apollo’s equity ownership interest in Fund VIII, AAA and AION of $29.5 million, $6.5 million and $5.5 million, respectively, during the nine months ended September 30, 2017, as compared to the same period in 2016.
Net gains from investment activities increased by $7.7 million for the nine months ended September 30, 2017, as compared to the nine months ended September 30, 2016. This change was primarily attributable to an increase in the fair value of the Company’s investment in Athene Holding during the nine months ended September 30, 2017, as compared to the same period in 2016. See note 5 to the condensed consolidated financial statements for further information regarding the Company’s investment in Athene Holding.
Net interest loss increased by $3.1 million for the nine months ended September 30, 2017, as compared to the nine months ended September 30, 2016, primarily due to additional interest expense incurred during the threenine months ended September 30, 20162017 as a result of the issuance of the 2026 Senior Notes in May 2016, as described in note 9 to our condensed consolidated financial statements.
Net gains from investment activities decreased by $59.2 million for the three months ended September 30, 2016, as compared to the three months ended September 30, 2015. The decrease was primarily attributable to a decrease in unrealized gains of $59.8 million on the Company’s investment in Athene during the three months ended September 30, 2016, as compared to the three months ended September 30, 2015. See note 5 to the condensed consolidated financial statements for further information regarding the Company’s investment in Athene.
Income from equity method investmentsOther income, net increased by $10.0 million for the three months ended September 30, 2016, as compared to the three months ended September 30, 2015. This change was driven by increases in income from Apollo’s equity ownership interest in COF III, AEOF, an SIA and MidCap of $2.2 million, $1.3 million, $1.1 million and $1.1 million, respectively, as well as modest increases across most of our other equity method investments during the three months ended September 30, 2016, as compared to the same period during 2015.
Other loss, net was $5.0 million for the three months ended September 30, 2016, as compared to other income, net of $0.1 million for the three months ended September 30, 2015. The decrease of $4.8 million was primarily driven by a write-off of certain receivables during the three months ended September 30, 2016.
Nine Months Ended September 30, 2016 Compared to Nine Months Ended September 30, 2015
Net interest expense increased by $4.4$25.6 million for the nine months ended September 30, 2016,2017, as compared to the nine months ended September 30, 2015,2016. This change was primarily dueattributable to additional interest expense incurredproceeds received in connection with the Company’s early termination of a lease which occurred during the nine months ended September 30, 2016 as a result of the issuance of the 2026 Senior Notes2017, in May 2016, as describedaddition to $17.5 million in note 9 to our condensed consolidated financial statements.
Net gains from investment activities decreased by $54.6 million for the nine months ended September 30, 2016, as compared to the nine months ended September 30, 2015. The decrease was primarily attributable to a decrease in unrealized gains of $54.8 million on the Company’s investment in Atheneinsurance proceeds received during the nine months ended September 30, 2016. See note 52017 in connection with fees and expenses relating to the condensed consolidated financial statements for further information regarding the Company’s investment in Athene.
Income from equity method investments was $21.8 million for the nine months ended September 30, 2016, as compared to loss from equity method investments of $2.7 million for the nine months ended September 30, 2015. The increase of $24.5 million was driven by increases in income from Apollo’s equity ownership interest in EPF II, AEOF, COF III and MidCap of $5.2 million, $3.9 million, $3.0 million and $2.4 million, respectively, as well as modest increases across most of our other equity method investments during the nine months ended September 30, 2016, as compared to the same period in 2015.a legal proceeding.
Other loss, net was $5.5 million for the nine months ended September 30, 2016, as compared to other income, net of $1.9 million for the nine months ended September 30, 2015. The decrease of $7.4 million was primarily driven by a write-off of certain receivables during the nine months ended September 30, 2016.
Real EstateCredit
The following tablestable sets forth our segment statement of operations information and EI for the Management Business and Incentive Business within our real estatecredit segment for the three and nine months ended September 30, 20162017 and 2015, respectively.2016. Prior period financial data has been updated to conform to the current presentation.
| | | | For the Three Months Ended September 30, 2016 | | For the Three Months Ended September 30, 2015 | | | For the Three Months Ended September 30, | | Total Change | | Percentage Change | | For the Nine Months Ended September 30, | | Total Change | | Percentage Change |
| | Management | | Incentive | | Total | | Management | | Incentive | | Total | | Total Change | | Percentage Change | 2017 | | 2016 | | 2017 | | 2016 | |
| | (in thousands) | | | (in thousands) | | | | (in thousands) | | |
Real Estate(1): | | | | | | | | | | | | | | | | |
| Credit: | | | | | | | | | | | | | | | | |
| Revenues: | | | | | | | | | | | | | | | | | | | | | | | | | | | | | | |
| Management fees from related parties | | $ | 187,885 |
| | $ | 151,386 |
| | $ | 36,499 |
| | 24.1 | % | | $ | 516,083 |
| | $ | 445,149 |
| | $ | 70,934 |
| | 15.9 | % |
| Advisory and transaction fees from related parties, net | $ | 1,038 |
| | $ | — |
| | $ | 1,038 |
| | $ | 399 |
| | $ | — |
| | $ | 399 |
| | $ | 639 |
| | 160.2 | % | 4,219 |
| | 2,612 |
| | 1,607 |
| | 61.5 |
| | 10,484 |
| | 10,058 |
| | 426 |
| | 4.2 |
|
| Management fees from related parties | 15,554 |
| | — |
| | 15,554 |
| | 13,176 |
| | — |
| | 13,176 |
| | 2,378 |
| | 18.0 |
| |
| Carried interest income from related parties: | | | | | | | | | | | | | | | | | | | | | | | | | | | | | | |
| Unrealized gains | — |
| | 963 |
| | 963 |
| | — |
| | 3,334 |
| | 3,334 |
| | (2,371 | ) | | (71.1 | ) | |
| Realized gains | — |
| | 5,499 |
| | 5,499 |
| | — |
| | 46 |
| | 46 |
| | 5,453 |
| | NM |
| |
Unrealized(1) | | 4,179 |
| | 91,502 |
| | (87,323 | ) | | (95.4 | ) | | 37,422 |
| | 150,720 |
| | (113,298 | ) | | (75.2 | ) |
| Realized | | 32,131 |
| | 20,500 |
| | 11,631 |
| | 56.7 |
| | 120,186 |
| | 105,698 |
| | 14,488 |
| | 13.7 |
|
| Total carried interest income from related parties | — |
| | 6,462 |
| | 6,462 |
| | — |
| | 3,380 |
| | 3,380 |
| | 3,082 |
| | 91.2 |
| 36,310 |
| | 112,002 |
| | (75,692 | ) | | (67.6 | ) | | 157,608 |
|
| 256,418 |
| | (98,810 | ) | | (38.5 | ) |
| Total Revenues | 16,592 |
| | 6,462 |
| | 23,054 |
| | 13,575 |
| | 3,380 |
| | 16,955 |
| | 6,099 |
| | 36.0 |
| 228,414 |
| | 266,000 |
| | (37,586 | ) | | (14.1 | ) | | 684,175 |
| | 711,625 |
| | (27,450 | ) | | (3.9 | ) |
| Expenses: | | | | | | | | | | | | | | | | | | | | | | | | | | | | | | |
| Compensation and benefits: | | | | | | | | | | | | | | | | | | | | | | | | | | | | | | |
| Salary, bonus and benefits | 9,129 |
| | — |
| | 9,129 |
| | 8,506 |
| | — |
| | 8,506 |
| | 623 |
| | 7.3 |
| 59,027 |
| | 45,143 |
| | 13,884 |
| | 30.8 |
| | 173,153 |
| | 151,464 |
| | 21,689 |
| | 14.3 |
|
| Equity-based compensation | 675 |
| | — |
| | 675 |
| | 1,068 |
| | — |
| | 1,068 |
| | (393 | ) | | (36.8 | ) | 9,925 |
| | 8,834 |
| | 1,091 |
| | 12.4 |
| | 28,255 |
| | 25,694 |
| | 2,561 |
| | 10.0 |
|
| Profit sharing expense | — |
| | 4,494 |
| | 4,494 |
| | — |
| | 1,312 |
| | 1,312 |
| | 3,182 |
| | 242.5 |
| |
| Profit sharing expense: | | | | | | | | | | | | | | | | |
| Unrealized | | 2,266 |
| | 36,809 |
| | (34,543 | ) | | (93.8 | ) | | 17,408 |
| | 61,626 |
| | (44,218 | ) | | (71.8 | ) |
| Realized | | 14,643 |
| | 8,988 |
| | 5,655 |
| | 62.9 |
| | 51,168 |
| | 62,764 |
| | (11,596 | ) | | (18.5 | ) |
| Realized: Equity-based | | 518 |
| | — |
| | 518 |
| | NM |
| | 1,387 |
| | — |
| | 1,387 |
| | NM |
|
| Total profit sharing expense | | 17,427 |
| | 45,797 |
| | (28,370 | ) | | (61.9 | ) | | 69,963 |
| | 124,390 |
| | (54,427 | ) | | (43.8 | ) |
| Total compensation and benefits | 9,804 |
| | 4,494 |
| | 14,298 |
| | 9,574 |
| | 1,312 |
| | 10,886 |
| | 3,412 |
| | 31.3 |
| 86,379 |
| | 99,774 |
| | (13,395 | ) | | (13.4 | ) | | 271,371 |
| | 301,548 |
| | (30,177 | ) | | (10.0 | ) |
| Other expenses | 4,674 |
| | — |
| | 4,674 |
| | 5,753 |
| | — |
| | 5,753 |
| | (1,079 | ) | | (18.8 | ) | |
| Non-compensation expenses | | | | | | | | | | | | | | | | |
| General, administrative and other | | 35,709 |
| | 29,161 |
| | 6,548 |
| | 22.5 |
| | 99,559 |
| | 95,193 |
| | 4,366 |
| | 4.6 |
|
| Placement fees | | 3,140 |
| | 723 |
| | 2,417 |
| | 334.3 |
| | 8,828 |
| | 2,113 |
| | 6,715 |
| | 317.8 |
|
| Total non-compensation expenses | | 38,849 |
| | 29,884 |
| | 8,965 |
| | 30.0 |
| | 108,387 |
| | 97,306 |
| | 11,081 |
| | 11.4 |
|
| Total Expenses | 14,478 |
| | 4,494 |
| | 18,972 |
| | 15,327 |
| | 1,312 |
| | 16,639 |
| | 2,333 |
| | 14.0 |
| 125,228 |
| | 129,658 |
| | (4,430 | ) | | (3.4 | ) | | 379,758 |
| | 398,854 |
| | (19,096 | ) | | (4.8 | ) |
| Other Income (Loss): | | | | | | | | | | | | | | | | |
| Net interest expense | — |
| | (1,168 | ) | | (1,168 | ) | | — |
| | (759 | ) | | (759 | ) | | (409 | ) | | 53.9 |
| |
| Other Income: | | | | | | | | | | | | | | | | |
| Income from equity method investments | — |
| | 499 |
| | 499 |
| | — |
| | 1,147 |
| | 1,147 |
| | (648 | ) | | (56.5 | ) | 8,222 |
| | 8,036 |
| | 186 |
| | 2.3 |
| | 20,561 |
| | 21,824 |
| | (1,263 | ) | | (5.8 | ) |
| Net gains from investment activities | | 60,570 |
| | 16,171 |
| | 44,399 |
| | 274.6 |
| | 91,365 |
| | 45,819 |
| | 45,546 |
| | 99.4 |
|
| Net interest loss | | (5,972 | ) | | (6,172 | ) | | 200 |
| | (3.2 | ) | | (18,978 | ) | | (14,542 | ) | | (4,436 | ) | | 30.5 |
|
| Other income (loss), net | (29 | ) | | — |
| | (29 | ) | | 4 |
| | — |
| | 4 |
| | (33 | ) | | NM |
| 16,318 |
| | (4,977 | ) | | 21,295 |
| | NM |
| | 16,888 |
| | (5,512 | ) | | 22,400 |
| | NM |
|
| Total Other Income (Loss) | (29 | ) | | (669 | ) | | (698 | ) | | 4 |
| | 388 |
| | 392 |
| | (1,090 | ) | | NM |
| |
| Economic Income (Loss) | $ | 2,085 |
| | $ | 1,299 |
| | $ | 3,384 |
| | $ | (1,748 | ) | | $ | 2,456 |
| | $ | 708 |
| | $ | 2,676 |
| | 378.0 | % | |
| Total Other Income | | 79,138 |
| | 13,058 |
| | 66,080 |
| | NM |
| | 109,836 |
| | 47,589 |
| | 62,247 |
| | 130.8 |
|
| Non-Controlling Interest | | (1,751 | ) | | (510 | ) | | (1,241 | ) | | 243.3 |
| | (3,244 | ) | | (5,070 | ) | | 1,826 |
| | (36.0 | ) |
| Economic Income | | $ | 180,573 |
| | $ | 148,890 |
| | $ | 31,683 |
| | 21.3 | % | | $ | 411,009 |
| | $ | 355,290 |
| | $ | 55,719 |
| | 15.7 | % |
| |
| (1) | Prior period amounts have been recast to conformIncluded in unrealized carried interest income (loss) from related parties for the nine months ended September 30, 2017 and 2016 was a reversal of previously realized carried interest income due to the current presentation.general partner obligation to return previously distributed carried interest income. See note 1413 to our condensed consolidated financial statements for morefurther detail onregarding the reclassification within our three segments. |
|
| | | | | | | | | | | | | | | | | | | | | | | | | | | | | | |
| | For the Nine Months Ended September 30, 2016 | | For the Nine Months Ended September 30, 2015 | | |
| | Management | | Incentive | | Total | | Management | | Incentive | | Total | | Total Change | | Percentage Change |
| | (in thousands) | | |
Real Estate(1): | | | | | | | | | | | | | | | |
| Revenues: | | | | | | | | | | | | | | | |
| Advisory and transaction fees from related parties, net | $ | 5,476 |
| | $ | — |
| | $ | 5,476 |
| | $ | 2,866 |
| | $ | — |
| | $ | 2,866 |
| | $ | 2,610 |
| | 91.1 | % |
| Management fees from related parties | 42,921 |
| | — |
| | 42,921 |
| | 36,212 |
| | — |
| | 36,212 |
| | 6,709 |
| | 18.5 |
|
| Carried interest income from related parties: | | | | | | | | | | | | | | | |
| Unrealized gains (losses) | — |
| | (4,151 | ) | | (4,151 | ) | | — |
| | 3,974 |
| | 3,974 |
| | (8,125 | ) | | NM |
|
| Realized gains | — |
| | 11,938 |
| | 11,938 |
| | — |
| | 3,712 |
| | 3,712 |
| | 8,226 |
| | 221.6 |
|
| Total carried interest income from related parties | — |
| | 7,787 |
| | 7,787 |
| | — |
| | 7,686 |
| | 7,686 |
| | 101 |
| | 1.3 |
|
| Total Revenues | 48,397 |
| | 7,787 |
| | 56,184 |
| | 39,078 |
| | 7,686 |
| | 46,764 |
| | 9,420 |
| | 20.1 |
|
| Expenses: | | | | | | | | | | | | | | | |
| Compensation and benefits: | | | | | | | | | | | | | | | |
| Salary, bonus and benefits | 26,062 |
| | — |
| | 26,062 |
| | 23,996 |
| | — |
| | 23,996 |
| | 2,066 |
| | 8.6 |
|
| Equity-based compensation | 2,107 |
| | — |
| | 2,107 |
| | 3,151 |
| | — |
| | 3,151 |
| | (1,044 | ) | | (33.1 | ) |
| Profit sharing expense | — |
| | 6,840 |
| | 6,840 |
| | — |
| | 4,062 |
| | 4,062 |
| | 2,778 |
| | 68.4 |
|
| Total compensation and benefits | 28,169 |
| | 6,840 |
| | 35,009 |
| | 27,147 |
| | 4,062 |
| | 31,209 |
| | 3,800 |
| | 12.2 |
|
| Other expenses | 16,260 |
| | — |
| | 16,260 |
| | 17,242 |
| | — |
| | 17,242 |
| | (982 | ) | | (5.7 | ) |
| Total Expenses | 44,429 |
| | 6,840 |
| | 51,269 |
| | 44,389 |
| | 4,062 |
| | 48,451 |
| | 2,818 |
| | 5.8 |
|
| Other Income (Loss): | | | | | | | | | | | | | | | |
| Net interest expense | — |
| | (2,895 | ) | | (2,895 | ) | | — |
| | (2,157 | ) | | (2,157 | ) | | (738 | ) | | 34.2 |
|
| Income from equity method investments | — |
| | 1,631 |
| | 1,631 |
| | — |
| | 2,283 |
| | 2,283 |
| | (652 | ) | | (28.6 | ) |
| Other income, net | (14 | ) | | — |
| | (14 | ) | | 1,401 |
| | — |
| | 1,401 |
| | (1,415 | ) | | NM |
|
| Total Other Income (Loss) | (14 | ) | | (1,264 | ) | | (1,278 | ) | | 1,401 |
| | 126 |
| | 1,527 |
| | (2,805 | ) | | NM |
|
| Economic Income (Loss) | $ | 3,954 |
| | $ | (317 | ) | | $ | 3,637 |
| | $ | (3,910 | ) | | $ | 3,750 |
| | $ | (160 | ) | | $ | 3,797 |
| | NM |
|
| |
(1) | Prior period amounts have been recast to conform to the current presentation. See note 14 to our condensed consolidated financial statements for more detail on the reclassification within our three segments.general partner obligation. |
Revenues
Three Months Ended September 30, 20162017 Compared to Three Months Ended September 30, 20152016
Advisory and transactionManagement fees from related parties net, increased by $0.6$36.5 million for the three months ended September 30, 2016,2017, as compared to the three months ended September 30, 2015. This change was primarily attributable to increases in net advisory and transaction fees earned with respect to AGRE Debt Fund I, L.P. (“AGRE Debt Fund I”) of $0.7 million during the three months ended September 30, 2016, as compared to the three months ended September 30, 2015.
Management fees from related parties increased by $2.4 million for the three months ended September 30, 2016, as compared to the three months ended September 30, 2015.2016. This change was primarily attributable to increases in management fees earned with respect to ARIfrom EPF III, Athene and U.S. RE Fund IIFCI III of $1.9$20.5 million, $7.6 million and $1.1$6.7 million, respectively, offset by a decrease relatedduring the three months ended September 30, 2017, as compared to the CPI fundssame period during 2016. Management fees earned from EPF III and FCI III increased as a result of $0.9capital raises that occurred after September 30, 2016, as well as a one-time catch-up of management fees during the three months ended September 30, 2017 of $7.4 million and $4.9 million from EPF III and FCI III, respectively.
Advisory and transaction fees from affiliates, net, increased by $1.6 million during the three months ended September 30, 2016,2017, as compared to the three months ended September 30, 2015.2016. This change was primarily driven by an increase in net
advisory and transaction fees from FCI III of $2.0 million during the three months ended September 30, 2017, as compared to the same period during 2016.
Carried interest income from related parties increaseddecreased by $3.1$75.7 million for the three months ended September 30, 2016,2017, as compared to the three months ended September 30, 2015.2016. This change was primarily attributable to an increasedecreases in carried interest income earned from U.S. REEPF II, CLOs, Apollo Credit Master Fund Ltd and FCI II of $4.3$19.6 million, partially offset by a$11.7 million, $12.0 million and $6.2 million, respectively, during the three months ended September 30, 2017, as compared to the same period in 2016.
The decrease in carried interest income earned from London Prime Apartments Guernsey Holdings Limited (“London Prime Apartments”)EPF II was primarily attributable to decreased appreciation of $0.9 million duringEuropean and UK hotel assets and German commercial real estate investments in the fund’s portfolio for the three months ended September 30, 2016,2017 as compared to the same period during 2015. Carried interest income earned from certain funds, including U.S. Real Estate Fund I and II, includes an allocation of carried interest income from a strategic investment account that invests in the funds. The increase in carried interest income earned from U.S. RE Fund II is primarily the result of strong operating performance across many of the funds’ underlying properties and appreciation of several real estate investments during the three months ended September 30, 2016. The decrease in carried interest income earned from London Prime Apartments is primarilythe CLOs was due to depreciation ofunder-performance relative to each respective CLO hurdle rate and lower appreciation and gains from the British Pound againstleveraged loan markets during the U.S. Dollar whilethree months ended September 30,2017 as compared to the value ofsame period in 2016. The decrease in carried interest income earned from Apollo Credit Master Fund Ltd. was due to under-performance relative to the underlying properties remained relatively flatfund’s hurdle rate during the three months ended September 30, 2016,2017, as compared to the same period in 2016 as a result of lower appreciation on investments in the financial and technology sectors during the three months ended September 30, 2015.2017. The decrease in carried interest income related to FCI II was due to lower valuations of the fund’s life settlements portfolio during the three months ended September 30, 2017 as compared to the same period in 2016.
Nine Months Ended September 30, 20162017 Compared to Nine Months Ended September 30, 20152016
Advisory and transactionManagement fees from related parties net, increased by $2.6$70.9 million for the nine months ended September 30, 2016,2017, as compared to the nine months ended September 30, 2015. This change was primarily attributable to increases in net
advisory and transaction fees earned with respect to AGRE Debt Fund I of $2.5 million during the nine months ended September 30, 2016, as compared to the nine months ended September 30, 2015.
Management fees from related parties increased by $6.7 million for the nine months ended September 30, 2016, as compared to the nine months ended September 30, 2015.2016. This change was primarily attributable to increases in management fees earned with respect to ARI, U.S. RE Fund IIfrom EPF III, Athene and a China-based investment fund we manageFCI III of $43.1 million, $24.2 million and $10.0 million, respectively. Management fees earned from EPF III and FCI III increased as a result of capital raises that occurred after September 30, 2016, as well as a one-time catch-up of management fees during the Venator acquisitionnine months ended September 30, 2017 of $5.1 million, $3.5$10.8 million and $1.2$7.0 million respectively,from EPF III and FCI III, respectively. These increases were partially offset by a decrease related to the CPI fundsin management fees earned from EPF II of $3.4$17.7 million during the nine months ended September 30, 2017, as compared to the same period during 2016, primarily resulting from a step down in fee basis from committed capital to invested capital during the nine months ended September 30, 2017.
Carried interest income from related parties decreased by $98.8 million for the nine months ended September 30, 2017, as compared to the nine months ended September 30, 2015.
Carried interest income from related parties increased by $0.1 million for the nine months ended September 30, 2016, as compared to the nine months ended September 30, 2015.2016. This change was primarily attributable to an increasea decrease in carried interest income earned from U.S. Real EstateApollo Credit Master Fund Ltd, CLOs, EPF II, SCRF III and FCI II of $4.5$31.0 million, during the nine months ended September 30, 2016, as compared to the same period in 2015. This was offset by decreases in carried interest income earned from London Prime Apartments and CPI funds in Europe of $2.7$22.3 million, $13.2 million, $9.9 million and $2.0$9.8 million, respectively, during the nine months ended September 30, 2016,2017, as compared to the same period during 2015. Carried interest income earned from certain funds, including U.S. Real Estate Fund I and II, includes an allocation of carried interest income from a strategic investment account that invests in the funds. The increase in carried interest income earned from U.S. RE Fund II is primarily the result of strong operating performance across many of the funds’ underlying properties and appreciation of several real estate investments during the current period. 2016.
The decrease in carried interest income earned from London Prime Apartments is primarilyrelated to Apollo Credit Master Fund Ltd. was due to depreciationunder-performance relative to the fund’s hurdle rate during the nine months ended September 30, 2017, as compared to the same period in 2016 as a result of the British Pound against the U.S. Dollar and lower appreciation ofon investments in the underlying properties forfinancial and technology sectors during the current period.nine months ended September 30, 2017. The decrease in carried interest income earned from the CPI fundsCLOs was due to under-performance relative to each respective CLO hurdle rate and lower appreciation and gains from the leveraged loan markets during the nine months ended September 30,2017 as compared to the same period in Europe2016. The decrease in carried interest income from EPF II was primarily attributable to a publicly traded security that was soldlower appreciation of European and UK hotel assets in the first quarter of 2015 and generatedfund’s portfolio for the nine months ended September 30, 2017 as compared to the same period in 2016. The decrease in carried interest income related to SCRF III was attributable to carried interest income being generated at a slower rate as the fund began to unwind during that period.the nine months ended September 30, 2017. The decrease in carried interest income earned from FCI II was due to lower valuations of the fund’s life settlements portfolio during the nine months ended September 30, 2017 as compared to the same period in 2016.
Expenses
Three Months Ended September 30, 20162017 Compared to Three Months Ended September 30, 20152016
Compensation and benefits increasedexpense decreased by $3.4$13.4 million for the three months ended September 30, 2016,2017, as compared to the three months ended September 30, 2015.2016. This change was primarily attributabledue to an increasedecreases in profit sharing expense of $3.2$28.4 million, offset by increases in salary, bonus and benefits of $13.9 million during the three months ended September 30, 20162017, as compared to the three months ended September 30, 2015.2016 primarily due to increased headcount. Profit sharing expense increaseddecreased as a result of a corresponding increasedecrease in carried interest income as described above. In any period the blended profit sharing percentage is impacted by the respective profit sharing ratios of the funds generating carried interest in the period.
Included in profit sharing expense is $1.8$3.9 million and $5.7 million related to the Incentive Pool for the three months ended September 30, 2017 and 2016, respectively. The Incentive Pool is separate from the fund related profit sharing expense and
may result in greater variability in compensation and have a variable impact on the blended profit sharing percentage during a particular period.
General, administrative and other increased by $6.5 million during the three months ended September 30, 2017, as compared to the three months ended September 30, 2016. This change was primarily driven by an increase in professional fees during the three months ended September 30, 2017, as compared to the same period in 2016.
Placement fees increased by $2.4 million during the three months ended September 30, 2017, as compared to the three months ended September 30, 2016. This change was primarily driven by placement fees incurred in connection with capital raising activity relating to EPF III of $2.6 million during the three months ended September 30, 2017.
Nine Months Ended September 30, 2017 Compared to Nine Months Ended September 30, 2016
Compensation and benefits expense decreased by $30.2 million for the nine months ended September 30, 2017, as compared to the nine months ended September 30, 2016. This change was primarily attributable to a decrease in profit sharing expense of $54.4 million during the nine months ended September 30, 2017, as compared to the nine months ended September 30, 2016 as a result of a corresponding decrease in carried interest income as described above. In any period the blended profit sharing percentage is impacted by the respective profit sharing ratios of the funds generating carried interest in the period. The decrease in profit sharing expense was partially offset by an increase in salary, bonus and benefits of $21.7 million during the nine months ended September 30, 2017, as compared to the nine months ended September 30, 2016 primarily due to increased headcount.
Included in profit sharing expense is $12.5 million and $35.6 million related to the Incentive Pool for the nine months ended September 30, 2017 and 2016, respectively. The Incentive Pool is separate from the fund related profit sharing expense and may result in greater variability in compensation and have a variable impact on the blended profit sharing percentage during a particular quarter. period.
General, administrative and other increased by $4.4 million during the nine months ended September 30, 2017, as compared to the nine months ended September 30, 2016. The change was primarily driven by an increase in fund organizational expenses related to the launch of EPF III as well as an increase in professional fees during the nine months ended September 30, 2017, as compared to the same period in 2016.
Placement fees increased by $6.7 million during the nine months ended September 30, 2017, as compared to the nine months ended September 30, 2016. This change was primarily driven by placement fees incurred in connection with capital raising activity relating to EPF III of $7.5 million during the nine months ended September 30, 2017.
Other expenses decreasedIncome
Three Months Ended September 30, 2017 Compared to Three Months Ended September 30, 2016
Net gains from investment activities increased by $1.1$44.4 million duringfor the three months ended September 30, 2016,2017, as compared to the three months ended September 30, 2015,2016. This change was primarily attributable to a decreasean increase in professional feesthe fair value of $0.9 million as a result of a decreasethe Company’s investment in legal fees incurredAthene Holding during the three months ended September 30, 2016,2017, as compared to the same period in 2016. See note 5 to the condensed consolidated financial statements for further information regarding the Company’s investment in Athene Holding.
Other income (loss), net increased by $21.3 million for the three months ended September 30, 2017, as compared to the three months ended September 30, 2015.2016. This change was primarily attributable to proceeds received in connection with the Company’s early termination of a lease and the Company’s recognition of $6.2 million of other income from the assignment of a CLO collateral management agreement during the three months ended September 30, 2017.
Nine Months Ended September 30, 20162017 Compared to Nine Months Ended September 30, 20152016
Compensation and benefits increasedIncome from equity method investments decreased by $3.8$1.3 million for the nine months ended September 30, 2016,2017, as compared to the nine months ended September 30, 2015.2016. This change was primarily driven by a decrease in income from Apollo’s equity ownership interest in Apollo Energy Opportunity Fund, L.P. (“AEOF”) and EPF II of $4.3 million and $2.1 million, respectively, partially offset by an increase in income from Apollo’s equity ownership interest in AINV of $5.4 million during the nine months ended September 30, 2017, as compared to the same period in 2016.
Net gains from investment activities increased by $45.5 million for the nine months ended September 30, 2017, as compared to the nine months ended September 30, 2016. This change was primarily attributable to an increase in profit sharing expensethe fair value of $2.8 million and an increasethe Company’s investment in salary, bonus and benefits of $2.1 million as a result of a higher headcount, respectively, offset by decreases to equity based compensation of $1.0 million,Athene Holding during the nine months ended September 30, 20162017, as compared to the same period
in 2016. See note 5 to the condensed consolidated financial statements for further information regarding the Company’s investment in Athene Holding.
Net interest loss increased by $4.4 million for the nine months ended September 30, 2017, as compared to the nine months ended September 30, 2015.
Included in profit sharing expense is $3.5 million and $0.3 million related to the Incentive Pool for the nine months ended September 30, 2016, and 2015, respectively.
Other expenses decreased by $1.0 million during the nine months ended September 30, 2016, as compared to the nine months ended September 30, 2015. This change was primarily attributable to a decrease in professional fees of $2.0 million as a result of a decrease in legal fees, offset by an increase in general and administrative expenses of $1.2 million, primarily attributable to an increase in new fund organizational expenses during the nine months ended September 30, 2016, as compared to the nine months ended September 30, 2015.
Other Income (Loss)
Three Months Ended September 30, 2016 Compared to Three Months Ended September 30, 2015
Net interest expense increased by $0.4 million for the three months ended September 30, 2016, as compared to the three months ended September 30, 2015, primarily due to additional interest expense incurred during the threenine months ended September 30, 20162017 as a result of the issuance of the 2026 Senior Notes in May 2016, as described in note 9 to our condensed consolidated financial statements.
IncomeOther income (loss), net increased by $22.4 million for the nine months ended September 30, 2017, as compared to the nine months ended September 30, 2016. This change was primarily attributable to proceeds received in connection with the Company’s early termination of a lease and proceeds received from equity method investments decreasedthe assignment of a CLO collateral management agreement during the nine months ended September 30, 2017.
Non-Controlling Interests
For information related to Non-Controlling Interests, see note 12 to the condensed consolidated financial statements for further details.
Real Assets
The following table sets forth our segment statement of operations information and EI within our real assets segment for the three and nine months ended September 30, 2017 and 2016. Prior period financial data has been updated to conform to the current presentation.
|
| | | | | | | | | | | | | | | | | | | | | | | | | | | | | |
| | For the Three Months Ended September 30, | | Total Change | | Percentage Change | | For the Nine Months Ended September 30, | | Total Change | | Percentage Change |
| | 2017 | | 2016 | | | 2017 | | 2016 | | |
| | (in thousands) | | | | (in thousands) | | |
| Real Assets: | | | | | | | | | | | | | | | |
| Revenues: | | | | | | | | | | | | | | | |
| Management fees from related parties | $ | 18,470 |
| | $ | 15,554 |
| | $ | 2,916 |
| | 18.7 | % | | $ | 54,560 |
| | $ | 42,921 |
| | $ | 11,639 |
| | 27.1 | % |
| Advisory and transaction fees from related parties, net | 1,418 |
| | 1,038 |
| | 380 |
| | 36.6 |
| | 2,775 |
| | 5,476 |
| | (2,701 | ) | | (49.3 | ) |
| Carried interest income (loss) from related parties: | | | | | | | | | | | | | | | |
| Unrealized | (5,169 | ) | | 963 |
| | (6,132 | ) | | NM |
| | (1,639 | ) | | (4,151 | ) | | 2,512 |
| | (60.5 | ) |
| Realized | 6,985 |
| | 5,499 |
| | 1,486 |
| | 27.0 |
| | 12,224 |
| | 11,938 |
| | 286 |
| | 2.4 |
|
| Total carried interest income from related parties | 1,816 |
| | 6,462 |
| | (4,646 | ) | | (71.9 | ) | | 10,585 |
| | 7,787 |
| | 2,798 |
| | 35.9 |
|
| Total Revenues | 21,704 |
| | 23,054 |
| | (1,350 | ) | | (5.9 | ) | | 67,920 |
| | 56,184 |
| | 11,736 |
| | 20.9 |
|
| Expenses: | | | | | | | | | | | | |
| | |
| Compensation and benefits: | | | | | | | | | | | | |
| | |
| Salary, bonus and benefits | 10,513 |
| | 9,129 |
| | 1,384 |
| | 15.2 |
| | 27,905 |
| | 26,062 |
| | 1,843 |
| | 7.1 |
|
| Equity-based compensation | 798 |
| | 675 |
| | 123 |
| | 18.2 |
| | 1,980 |
| | 2,107 |
| | (127 | ) | | (6.0 | ) |
| Profit sharing expense: | | | | | | | | | | | | | | | |
| Unrealized | (4,812 | ) | | 432 |
| | (5,244 | ) | | NM |
| | (2,848 | ) | | (1,400 | ) | | (1,448 | ) | | 103.4 |
|
| Realized | 3,636 |
| | 4,062 |
| | (426 | ) | | (10.5 | ) | | 6,528 |
| | 8,240 |
| | (1,712 | ) | | (20.8 | ) |
| Total profit sharing expense | (1,176 | ) | | 4,494 |
| | (5,670 | ) | | NM |
| | 3,680 |
| | 6,840 |
| | (3,160 | ) | | (46.2 | ) |
| Total compensation and benefits | 10,135 |
| | 14,298 |
| | (4,163 | ) | | (29.1 | ) | | 33,565 |
| | 35,009 |
| | (1,444 | ) | | (4.1 | ) |
| Non-compensation expenses: | | | | | | | | | | | | | | | |
| General, administrative and other | 5,520 |
| | 4,674 |
| | 846 |
| | 18.1 |
| | 15,299 |
| | 16,239 |
| | (940 | ) | | (5.8 | ) |
| Placement fees | — |
| | — |
| | — |
| | NM |
| | — |
| | 21 |
| | (21 | ) | | (100.0 | ) |
| Total non-compensation expenses | 5,520 |
| | 4,674 |
| | 846 |
| | 18.1 |
| | 15,299 |
| | 16,260 |
| | (961 | ) | | (5.9 | ) |
| Total Expenses | 15,655 |
| | 18,972 |
| | (3,317 | ) | | (17.5 | ) | | 48,864 |
| | 51,269 |
| | (2,405 | ) | | (4.7 | ) |
| Other Income (Loss): | | | | | | | | | | | | | | | |
| Income (loss) from equity method investments | (83 | ) | | 499 |
| | (582 | ) | | NM |
| | 1,935 |
| | 1,631 |
| | 304 |
| | 18.6 |
|
| Net interest loss | (1,163 | ) | | (1,168 | ) | | 5 |
| | (0.4 | ) | | (3,634 | ) | | (2,895 | ) | | (739 | ) | | 25.5 |
|
| Other income (loss), net | 2,044 |
| | (29 | ) | | 2,073 |
| | NM |
| | 2,347 |
| | (14 | ) | | 2,361 |
| | NM |
|
| Total Other Income (Loss) | 798 |
| | (698 | ) | | 1,496 |
| | NM |
| | 648 |
| | (1,278 | ) | | 1,926 |
| | NM |
|
| Economic Income | $ | 6,847 |
| | $ | 3,384 |
| | $ | 3,463 |
| | 102.3 | % | | $ | 19,704 |
| | $ | 3,637 |
| | $ | 16,067 |
| | 441.8 | % |
Revenues
Three Months Ended September 30, 2017 Compared to Three Months Ended September 30, 2016
Management fees from related parties increased by $0.6$2.9 million for the three months ended September 30, 2016,2017, as compared to the three months ended September 30, 2015.2016. This change was driven by a decreaseprimarily attributable to increases in management fees earned with respect to ARI and Apollo Asia Real Estate Fund, L.P. (“Asia RE Fund”) of $2.5 million and $0.6 million, respectively, during the three months ended September 30, 2017, as compared to the same period during 2016, in connection with capital raises for the funds during 2017.
Carried interest income from Apollo’s equity ownershiprelated parties decreased by $4.6 million for the three months ended September 30, 2017, as compared to the three months ended September 30, 2016. Carried interest inincome earned from certain funds, including U.S. RE Fund I and II, includes an allocation of $0.8 million, offset by an increasecarried interest income from a strategic investment account that invests in the funds. This change was primarily attributable to decreases in carried interest income earned from Apollo’s equity ownership interest instrategic investment accounts and U.S. RE Fund II of $0.3$2.3 million and $1.1 million, respectively. The decrease in carried interest income earned from U.S. RE Fund II was primarily the result of stronger operating performance across many of the funds’ underlying properties and higher appreciation of several real estate investments during the three months ended September 30, 2016 as compared to the three months ended September 30, 2015.2017.
Nine Months Ended September 30, 20162017 Compared to Nine Months Ended September 30, 20152016
Management fees from related parties increased by $11.6 million for the nine months ended September 30, 2017, as compared to the nine months ended September 30, 2016. This change was primarily attributable to increases in management fees earned with respect to ARI and Asia RE Fund of $7.2 million and $2.8, respectively, during the nine months ended September 30, 2017, as compared to the nine months ended September 30, 2016, in connection with capital raises for the funds during 2017.
Advisory and transaction fees from related parties, net, decreased by $2.7 million for the nine months ended September 30, 2017, as compared to the nine months ended September 30, 2016. This change was primarily attributable to decreases in net advisory and transaction fees earned with respect to AGRE Debt Fund I, L.P. (“AGRE Debt Fund I”) and U.S. RE Fund II of $2.0 million and $0.4 million, respectively, during the nine months ended September 30, 2017, as compared to the nine months ended September 30, 2016.
Carried interest income from related parties increased by $2.8 million for the nine months ended September 30, 2017, as compared to the nine months ended September 30, 2016. This change was primarily attributable to an increase in carried interest income earned from U.S. RE Fund II of $3.3 million, partially offset by a decrease in carried interest income earned from U.S. RE Fund I of $1.5 million during the nine months ended September 30, 2017, as compared to the same period during 2016. The increase in carried interest income earned from U.S. RE Fund II was primarily due to strong operating performance across many of the fund’s underlying properties and appreciation of several real estate investments during the nine months ended September 30, 2017. The decrease in carried interest income earned from U.S. RE Fund I was primarily due to lower appreciation of several investments during the nine months ended September 30, 2017, as compared to the same period during 2016.
Expenses
Three Months Ended September 30, 2017 Compared to Three Months Ended September 30, 2016
Compensation and benefits decreased by $4.2 million for the three months ended September 30, 2017, as compared to the three months ended September 30, 2016. This change was primarily attributable to a decrease in profit sharing expense of $5.7 million during the three months ended September 30, 2017 as compared to the three months ended September 30, 2016 as a result of a corresponding decrease in carried interest income as described above. In any period the blended profit sharing percentage is impacted by the respective profit sharing ratios of the funds generating carried interest in the period. The decrease in profit sharing expense was partially offset by an increase in salary, bonus and benefits of $1.4 million during the three months ended September 30, 2017, as compared to the same period during 2016 primarily due to increased headcount.
Included in profit sharing expense is $0.5 million and $1.8 million related to the Incentive Pool for the three months ended September 30, 2017 and 2016, respectively. The Incentive Pool is separate from the fund related profit sharing expense and may result in greater variability in compensation and have a variable impact on the blended profit sharing percentage during a particular period.
General, administrative and other increased by $0.8 million during the three months ended September 30, 2017, as compared to the three months ended September 30, 2016. This change was primarily attributable to an increase in professional fees during the three months ended September 30, 2017, as compared to the three months ended September 30, 2016.
Nine Months Ended September 30, 2017 Compared to Nine Months Ended September 30, 2016
Compensation and benefits decreased by $1.4 million for the nine months ended September 30, 2017, as compared to the nine months ended September 30, 2016. This change was primarily attributable to a decrease in profit sharing expense of $3.2 million during the nine months ended September 30, 2017 as compared to the nine months ended September 30, 2016. In any period the blended profit sharing percentage is impacted by the respective profit sharing ratios of the funds generating carried interest in the period. The decrease in profit sharing expense was partially offset by an increase in salary, bonus and benefits of $1.8 million during the nine months ended September 30, 2017, as compared to the same period during 2016 primarily due to increased headcount.
Included in profit sharing expense is $0.9 million and $3.5 million related to the Incentive Pool for the nine months ended September 30, 2017 and 2016, respectively. The Incentive Pool is separate from the fund related profit sharing expense and may result in greater variability in compensation and have a variable impact on the blended profit sharing percentage during a particular period.
General, administrative and other decreased by $0.9 million during the nine months ended September 30, 2017, as compared to the nine months ended September 30, 2016. This change was primarily attributable to fund organizational expenses related to U.S. RE Fund II incurred during the nine months ended September 30, 2016.
Other Income (Loss)
Three Months Ended September 30, 2017 Compared to Three Months Ended September 30, 2016
Other income (loss), net increased by $2.1 million for the three months ended September 30, 2017, as compared to the three months ended September 30, 2016, primarily attributable to proceeds received in connection with the Company’s early termination of a lease during the three months ended September 30, 2017.
Nine Months Ended September 30, 2017 Compared to Nine Months Ended September 30, 2016
Net interest expenseloss increased by $0.7 million for the nine months ended September 30, 2016,2017, as compared to the nine months ended September 30, 2015,2016, primarily due to additional interest expense incurred during the nine months ended September 30, 20162017 primarily as a result of the issuance of the 2026 Senior Notes in May 2016, as described in note 9 to our condensed consolidated financial statements.
Income from equity method investments decreasedOther income (loss), net increased by $0.7$2.4 million for the nine months ended September 30, 2016,2017, as compared to the nine months ended September 30, 2015. This change was driven by2016, primarily attributable to proceeds received in connection with the Company’s early termination of a decrease in the income from Apollo’s equity ownership interest in U.S. RE Fund I and ARI of $0.6 million and $0.4 million, offset by an increase in the income from Apollo’s equity ownership interest in U.S. RE Fund II of $0.5 millionlease during the nine months ended September 30, 2016, as compared to the nine months ended September 30, 2015.2017.
Other income, net decreased by $1.4 million for the nine months ended September 30, 2016, as compared to the nine months ended September 30, 2015. The change was primarily driven by a bargain purchase gain in connection with the acquisition of Venator Real Estate Capital Partners during the nine months ended September 30, 2015 that did not recur in the current period.
Summary of Combined Results
The following table combines our Management Business and Incentive Business statements of operations information and EI for the three and nine months ended September 30, 2016 and 2015, respectively.
|
| | | | | | | | | | | | | | | |
| | For the Three Months Ended September 30, | | For the Nine Months Ended September 30, |
| | 2016 | | 2015 | | 2016 | | 2015 |
| | (in thousands) |
| Management Business: | | | | | | | |
| Advisory and transaction fees from related parties, net | $ | 30,251 |
| | $ | 9,276 |
| | $ | 103,149 |
| | $ | 34,269 |
|
| Management fees from related parties | 258,485 |
| | 226,758 |
| | 731,051 |
| | 678,744 |
|
| Carried interest income from related parties | 2,307 |
| | 9,285 |
| | 17,516 |
| | 30,874 |
|
| Total Management Business Revenues | 291,043 |
| | 245,319 |
| | 851,716 |
| | 743,887 |
|
| Salary, bonus and benefits | 86,804 |
| | 94,110 |
| | 273,696 |
| | 271,345 |
|
| Equity-based compensation | 16,154 |
| | 14,938 |
| | 48,596 |
| | 45,412 |
|
| Other expenses | 53,006 |
| | 54,412 |
| | 170,375 |
| | 161,729 |
|
| Total Management Business Expenses | 155,964 |
| | 163,460 |
| | 492,667 |
| | 478,486 |
|
| Other income (loss), net | (4,240 | ) | | 118 |
| | (4,166 | ) | | 6,651 |
|
| Non-Controlling Interests | (510 | ) | | (2,697 | ) | | (5,070 | ) | | (8,766 | ) |
| Management Business Economic Income | $ | 130,329 |
| | $ | 79,280 |
| | $ | 349,813 |
| | $ | 263,286 |
|
| Incentive Business: | | | | | | | |
| Carried interest income from related parties: | | | | | | | |
Unrealized gains (losses)(1) | $ | 167,484 |
| | $ | (179,086 | ) | | $ | 283,098 |
| | $ | (328,921 | ) |
| Realized gains | 33,536 |
| | 115,230 |
| | 110,230 |
| | 417,761 |
|
| Total Carried Interest Income (Loss) from related parties | 201,020 |
| | (63,856 | ) | | 393,328 |
| | 88,840 |
|
| Profit sharing expense: | | | | | | | |
| Unrealized profit sharing expense | 56,475 |
| | (79,858 | ) | | 89,629 |
| | (118,522 | ) |
| Realized profit sharing expense | 20,316 |
| | 67,865 |
| | 78,402 |
| | 210,233 |
|
| Total Profit Sharing Expense | 76,791 |
| | (11,993 | ) | | 168,031 |
| | 91,711 |
|
| Other Income: | | | | | | | |
| Net interest expense | (11,528 | ) | | (6,187 | ) | | (27,305 | ) | | (19,703 | ) |
| Other loss, net | (663 | ) | | (305 | ) | | (1,040 | ) | | (424 | ) |
| Net gains from investment activities | 17,362 |
| | 81,244 |
| | 49,361 |
| | 106,291 |
|
| Income from equity method investments | 22,919 |
| | 3,025 |
| | 63,766 |
| | 18,217 |
|
| Total Other Income | 28,090 |
| | 77,777 |
| | 84,782 |
| | 104,381 |
|
| Incentive Business Economic Income | $ | 152,319 |
| | $ | 25,914 |
| | $ | 310,079 |
| | $ | 101,510 |
|
| Economic Income | 282,648 |
| | 105,194 |
| | 659,892 |
| | 364,796 |
|
| Income tax provision on Economic Income | (51,896 | ) | | (1,156 | ) | | (107,253 | ) | | (12,545 | ) |
| Economic Net Income | $ | 230,752 |
| | $ | 104,038 |
| | $ | 552,639 |
| | $ | 352,251 |
|
| |
(1) | Included in unrealized carried interest income (losses) from related parties for the three and nine months ended September 30, 2016, and 2015 was a reversal of previously realized carried interest income due to the general partner obligation to return previously distributed carried interest income. See note 12 to our condensed consolidated financial statements for further detail regarding the general partner obligation. |
Summary of DistributableFee Related Earnings
The following table is a summary of DistributableFee Related Earnings for the three and nine months ended September 30, 20162017 and 2015.2016.
|
| | | | | | | | | | | | | | | |
| | For the Three Months Ended September 30, | | For the Nine Months Ended September 30, |
| | 2016 | | 2015 | | 2016 | | 2015 |
| | (in thousands) |
| Management Business Economic Income | $ | 130,329 |
| | $ | 79,280 |
| | $ | 349,813 |
| | $ | 263,286 |
|
| Less: Non-cash revenues | (842 | ) | | (842 | ) | | (2,527 | ) | | (4,469 | ) |
| Add back: Equity-based compensation | 16,154 |
| | 14,938 |
| | 48,596 |
| | 45,412 |
|
| Add back: Depreciation, amortization and other | 2,435 |
| | 2,606 |
| | 7,532 |
| | 7,907 |
|
| Management Business Distributable Earnings | $ | 148,076 |
| | $ | 95,982 |
| | $ | 403,414 |
| | $ | 312,136 |
|
| | | | | | | | |
| Incentive Business Economic Income | $ | 152,319 |
| | $ | 25,914 |
| | $ | 310,079 |
| | $ | 101,510 |
|
Less: Non-cash carried interest income(1) | — |
| | — |
| | — |
| | (29,900 | ) |
| Less: Net unrealized carried interest (income) loss | (111,009 | ) | | 99,228 |
| | (193,469 | ) | | 210,399 |
|
Less: Unrealized investment and other income(2) | (36,750 | ) | | (76,545 | ) | | (98,318 | ) | | (101,936 | ) |
| Incentive Business Distributable Earnings | $ | 4,560 |
| | $ | 48,597 |
| | $ | 18,292 |
| | $ | 180,073 |
|
| | | | | | | | |
| Distributable Earnings | $ | 152,636 |
| | $ | 144,579 |
| | $ | 421,706 |
| | $ | 492,209 |
|
Taxes and related payables(3) | (4,105 | ) | | (2,027 | ) | | (9,346 | ) | | (6,290 | ) |
| Distributable Earnings After Taxes and Related Payables | $ | 148,531 |
| | $ | 142,552 |
| | $ | 412,360 |
| | $ | 485,919 |
|
|
| | | | | | | | | | | | | | | |
| | For the Three Months Ended
September 30, | | For the Nine Months Ended
September 30, |
| | 2017 | | 2016 | | 2017 | | 2016 |
| | (in thousands) |
| Management Fees | $ | 282,434 |
| | $ | 258,485 |
| | $ | 801,395 |
| | $ | 731,051 |
|
| Advisory and Transaction Fees from Related Parties, net | 16,209 |
| | 30,251 |
| | 54,905 |
| | 103,149 |
|
Carried Interest Income from Related Parties(1) | 6,173 |
| | 2,307 |
| | 12,636 |
| | 17,516 |
|
| Salary, Bonus and Benefits | (101,007 | ) | | (86,804 | ) | | (294,288 | ) | | (273,696 | ) |
| Non-compensation Expenses | (66,325 | ) | | (53,006 | ) | | (181,094 | ) | | (170,375 | ) |
Other Income (Loss) attributable to Fee Related Earnings(2) | 26,456 |
| | (4,240 | ) | | 46,818 |
| | (4,166 | ) |
| Non-Controlling Interest | (1,751 | ) | | (510 | ) | | (3,244 | ) | | (5,070 | ) |
| Fee Related Earnings | $ | 162,189 |
| | $ | 146,483 |
| | $ | 437,128 |
| | $ | 398,409 |
|
| |
| (1) | Represents realized carried interest income settled by receipt of securities.earned from a publicly traded business development company we manage. |
| |
| (2) | Represents unrealized gains from our general partner investmentsIncludes $19.0 million in our fundsproceeds received in connection with the Company’s early termination of a lease during the three and other investments.nine months ended September 30, 2017. Includes $17.5 million in insurance proceeds received in connection with fees and expenses relating to a legal proceeding during the nine months ended September 30, 2017. |
| |
(3) | Represents the estimated current corporate, local and non-U.S. taxes as well as the payable under Apollo’s tax receivable agreement. |
Summary of Distributable Earnings
The following table is a reconciliation of Distributable Earnings per share of common and equivalents(1) to net distribution per share of common and equivalent for the three and nine months ended September 30, 20162017 and 2015.2016.
| | | | For the Three Months Ended September 30, | | For the Nine Months Ended September 30, | For the Three Months Ended September 30, | | For the Nine Months Ended September 30, |
| | 2016 | | 2015 | | 2016 | | 2015 | 2017 | | 2016 | | 2017 | | 2016 |
| | (in thousands, except per share data) | (in thousands, except per share data) |
| Distributable Earnings | | $ | 185,131 |
| | $ | 152,636 |
| | $ | 682,442 |
| | $ | 421,706 |
|
Taxes and related payables(2) | | (7,272 | ) | | (4,105 | ) | | (20,344 | ) | | (9,346 | ) |
| Preferred distributions | | (4,383 | ) | | — |
| | (9,155 | ) | | — |
|
| Distributable Earnings After Taxes and Related Payables | $ | 148,531 |
| | $ | 142,552 |
| | $ | 412,360 |
| | $ | 485,919 |
| 173,476 |
| | 148,531 |
| | 652,943 |
| | 412,360 |
|
| Add back: Tax and related payables attributable to common and equivalents | 3 |
| | 27 |
| | 9 |
| | 87 |
| 4,706 |
| | 3 |
| | 14,091 |
| | 9 |
|
Distributable Earnings before certain payables(2) | 148,534 |
| | 142,579 |
| | 412,369 |
| | 486,006 |
| |
Distributable Earnings before certain payables(3) | | 178,182 |
| | 148,534 |
| | 667,034 |
| | 412,369 |
|
| Percent to common and equivalents | 47 | % | | 47 | % | | 47 | % | | 47 | % | 49 | % | | 47 | % | | 49 | % | | 47 | % |
| Distributable Earnings before other payables attributable to common and equivalents | 69,821 |
| | 68,953 |
| | 193,841 |
| | 224,250 |
| 87,078 |
| | 69,821 |
| | 325,981 |
| | 193,841 |
|
| Less: Tax and related payables attributable to common and equivalents | (3 | ) | | (27 | ) | | (9 | ) | | (87 | ) | |
| Less: Taxes and related payables attributable to common and equivalents | | (4,706 | ) | | (3 | ) | | (14,091 | ) | | (9 | ) |
| Distributable Earnings attributable to common and equivalents | $ | 69,818 |
| | $ | 68,926 |
| | $ | 193,832 |
| | $ | 224,163 |
| $ | 82,372 |
| | $ | 69,818 |
| | $ | 311,890 |
| | $ | 193,832 |
|
Distributable Earnings per share of common and equivalent(3) | $ | 0.36 |
| | $ | 0.36 |
| | $ | 1.01 |
| | $ | 1.19 |
| |
Retained capital per share of common and equivalent(3)(4) | (0.01 | ) | | (0.01 | ) | | (0.04 | ) | | (0.09 | ) | |
Net distribution per share of common and equivalent(3) | $ | 0.35 |
| | $ | 0.35 |
| | $ | 0.97 |
| | $ | 1.10 |
| |
Distributable Earnings per share of common and equivalent(4) | | $ | 0.42 |
| | $ | 0.36 |
| | $ | 1.59 |
| | $ | 1.01 |
|
Retained capital per share of common and equivalent(4)(5) | | (0.03 | ) | | (0.01 | ) | | (0.19 | ) | | (0.04 | ) |
Net distribution per share of common and equivalent(4) | | $ | 0.39 |
| | $ | 0.35 |
| | $ | 1.40 |
| | $ | 0.97 |
|
| |
| (1) | Common and equivalents refers to Class A shares outstanding and RSUs that participate in distributions. |
| |
| (2) | Represents the estimated current corporate, local and non-U.S. taxes as well as the payable under Apollo’s tax receivable agreement. |
| |
| (3) | Distributable earnings before certain payables represents Distributable Earnings before the deduction for the estimated current corporate taxes and the payable under Apollo’s tax receivable agreement. |
| |
(3)(4) | Per share calculations are based on end of period Distributable Earnings Shares Outstanding, which consists of total Class A shares outstanding, AOG Units and RSUs that participate in distributions.distributions (collectively referred to as “common & equivalents”). |
| |
(4)(5) | Retained capital is withheld pro-rata from common and equivalent holders and AOG unitholders.Unit holders. |
Summary of Non-U.S. GAAP Measures
The table below sets forth a reconciliation of net income attributable Apollo Global Management, LLC Class A Shareholders to our non-U.S. GAAP performance measures to net income attributable to Apollo Global Management, LLC for the three and nine months ended September 30, 20162017 and 2015:2016:
| | | | For the Three Months Ended September 30, | | For the Nine Months Ended September 30, | For the Three Months Ended September 30, | | For the Nine Months Ended September 30, |
| | 2016 | | 2015 | | 2016 | | 2015 | 2017 | | 2016 | | 2017 | | 2016 |
| | (in thousands) | (in thousands) |
| Net Income Attributable to Apollo Global Management, LLC | $ | 94,619 |
| | $ | 41,051 |
| | $ | 235,883 |
| | $ | 128,406 |
| |
| Net income (loss) attributable to Non-Controlling Interests in consolidated entities and Appropriated Partners’ Capital | (222 | ) | | 161 |
| | 3,891 |
| | 11,218 |
| |
| Net Income Attributable to Apollo Global Management, LLC Class A Shareholders | | $ | 198,569 |
| | $ | 94,619 |
| | $ | 430,673 |
| | $ | 235,883 |
|
| Preferred distributions | | 4,383 |
| | — |
| | 9,155 |
| | — |
|
| Net income (loss) attributable to Non-Controlling Interests in consolidated entities | | 1,048 |
| | (222 | ) | | 8,967 |
| | 3,891 |
|
| Net income attributable to Non-Controlling Interests in the Apollo Operating Group | 140,321 |
| | 55,347 |
| | 336,186 |
| | 186,507 |
| 230,363 |
| | 140,321 |
| | 533,540 |
| | 336,186 |
|
| Net Income | $ | 234,718 |
| | $ | 96,559 |
| | $ | 575,960 |
| | $ | 326,131 |
| $ | 434,363 |
| | $ | 234,718 |
| | $ | 982,335 |
| | $ | 575,960 |
|
| Income tax provision | 29,667 |
| | 6,591 |
| | 62,508 |
| | 21,197 |
| 16,542 |
| | 29,667 |
| | 54,926 |
| | 62,508 |
|
| Income Before Income Tax Provision | $ | 264,385 |
| | $ | 103,150 |
| | $ | 638,468 |
| | $ | 347,328 |
| $ | 450,905 |
| | $ | 264,385 |
| | $ | 1,037,261 |
| | $ | 638,468 |
|
| Transaction-related charges and equity-based compensation | 18,041 |
| | 2,205 |
| | 25,315 |
| | 28,686 |
| 8,514 |
| | 18,041 |
| | 10,789 |
| | 25,315 |
|
| Net (income) loss attributable to Non-Controlling Interests in consolidated entities | 222 |
| | (161 | ) | | (3,891 | ) | | (11,218 | ) | (1,048 | ) | | 222 |
| | (8,967 | ) | | (3,891 | ) |
| Economic Income | $ | 282,648 |
| | $ | 105,194 |
| | $ | 659,892 |
| | $ | 364,796 |
| |
Economic Income(1) | | $ | 458,371 |
| | $ | 282,648 |
| | $ | 1,039,083 |
| | $ | 659,892 |
|
| Income tax provision on Economic Income | (51,896 | ) | | (1,156 | ) | | (107,253 | ) | | (12,545 | ) | (22,356 | ) | | (51,896 | ) | | (83,125 | ) | | (107,253 | ) |
| Preferred distributions | | (4,383 | ) | | — |
| | (9,155 | ) | | — |
|
| Economic Net Income | $ | 230,752 |
| | $ | 104,038 |
| | $ | 552,639 |
| | $ | 352,251 |
| $ | 431,632 |
| | $ | 230,752 |
| | $ | 946,803 |
| | $ | 552,639 |
|
| Preferred distributions | | 4,383 |
| | — |
| | 9,155 |
| | — |
|
| Income tax provision on Economic Income | 51,896 |
| | 1,156 |
| | 107,253 |
| | 12,545 |
| 22,356 |
| | 51,896 |
| | 83,125 |
| | 107,253 |
|
| Carried interest (income) loss from related parties | (201,020 | ) | | 63,856 |
| | (393,328 | ) | | (88,840 | ) | |
Carried interest income from related parties(2) | | (340,401 | ) | | (201,020 | ) | | (821,210 | ) | | (393,328 | ) |
| Profit sharing expense | 76,791 |
| | (11,993 | ) | | 168,031 |
| | 91,711 |
| 131,445 |
| | 76,791 |
| | 337,721 |
| | 168,031 |
|
| Other income | (28,090 | ) | | (77,777 | ) | | (84,782 | ) | | (104,381 | ) | |
Equity-based compensation(1) | 16,154 |
| | 14,938 |
| | 48,596 |
| | 45,412 |
| |
Depreciation and amortization(2) | 2,435 |
| | 2,606 |
| | 7,532 |
| | 7,907 |
| |
| Fee-Related EBITDA | $ | 148,918 |
| | $ | 96,824 |
| | $ | 405,941 |
| | $ | 316,605 |
| |
| Net realized carried interest income | 13,220 |
| | 47,365 |
| | 31,828 |
| | 207,528 |
| |
| Fee-Related EBITDA + 100% of Net Realized Carried Interest | $ | 162,138 |
| | $ | 144,189 |
| | $ | 437,769 |
| | $ | 524,133 |
| |
| Realized investment and other (income) loss | (8,660 | ) | | 1,232 |
| | (13,536 | ) | | 2,445 |
| |
Equity-based compensation(3) | | 17,058 |
| | 16,154 |
| | 51,369 |
| | 48,596 |
|
| Income from equity method investments | | (48,014 | ) | | (22,919 | ) | | (104,447 | ) | | (63,766 | ) |
| Net gains from investment activities | | (68,529 | ) | | (17,362 | ) | | (102,620 | ) | | (49,361 | ) |
| Net interest loss | | 11,509 |
| | 11,528 |
| | 35,564 |
| | 27,305 |
|
| Other | | 750 |
| | 663 |
| | 1,668 |
| | 1,040 |
|
| Fee Related Earnings | | $ | 162,189 |
| | $ | 146,483 |
| | $ | 437,128 |
| | $ | 398,409 |
|
| Depreciation, amortization and other, net | | 5,825 |
| | 2,435 |
| | 10,860 |
| | 7,532 |
|
| Fee Related EBITDA | | $ | 168,014 |
| | $ | 148,918 |
| | $ | 447,988 |
| | $ | 405,941 |
|
Net realized carried interest income(2) | | 19,129 |
| | 13,220 |
| | 230,112 |
| | 31,828 |
|
| Fee Related EBITDA + 100% of Net Realized Carried Interest | | $ | 187,143 |
| | $ | 162,138 |
| | $ | 678,100 |
| | $ | 437,769 |
|
| Non-cash revenues | (842 | ) | | (842 | ) | | (2,527 | ) | | (34,369 | ) | (842 | ) | | (842 | ) | | (2,527 | ) | | (2,527 | ) |
| Realized income from equity method investments | | 10,339 |
| | 3,767 |
| | 42,433 |
| | 15,007 |
|
| Net interest loss | | (11,509 | ) | | (11,528 | ) | | (35,564 | ) | | (27,305 | ) |
| Other | | — |
| | (899 | ) | | — |
| | (1,238 | ) |
| Distributable Earnings | $ | 152,636 |
| | $ | 144,579 |
| | $ | 421,706 |
| | $ | 492,209 |
| $ | 185,131 |
| | $ | 152,636 |
| | $ | 682,442 |
| | $ | 421,706 |
|
| Taxes and related payables | (4,105 | ) | | (2,027 | ) | | (9,346 | ) | | (6,290 | ) | (7,272 | ) | | (4,105 | ) | | (20,344 | ) | | (9,346 | ) |
| Preferred distributions | | (4,383 | ) | | — |
| | (9,155 | ) | | — |
|
| Distributable Earnings After Taxes and Related Payables | $ | 148,531 |
| | $ | 142,552 |
| | $ | 412,360 |
| | $ | 485,919 |
| $ | 173,476 |
| | $ | 148,531 |
| | $ | 652,943 |
| | $ | 412,360 |
|
| |
| (1) | See note 15 for more details regarding Economic Income for the combined segments. |
| |
| (2) | Excludes carried interest income from a publicly traded business development company we manage. |
| |
| (3) | Includes equity-based compensation related to RSUs (excluding RSUs granted in connection with the 2007 private placement), share options and restricted share options.awards. |
| |
(2) | Includes amortization of leasehold improvements. |
Liquidity and Capital Resources
Historical
Although we have managed our historical liquidity needs by looking at deconsolidated cash flows, our historical condensed consolidated statements of cash flows reflect the cash flows of Apollo, as well as those of the consolidated Apollo funds.funds and VIEs.
The primary cash flow activities of Apollo are:
Generating cash flow from operations;
Making investments in Apollo funds;
Meeting financing needs through credit agreements; and
Distributing cash flow to equity holders and Non-Controlling Interests.
Primary cash flow activities of the consolidated Apollo funds and VIEs are:
Raising capital from their investors, which have been reflected historically as Non-Controlling Interests of the consolidated subsidiaries in our financial statements;
Using capital to make investments;
Generating cash flow from operations through distributions, interest and the realization of investments;
Distributing cash flow to investors; and
Issuing debt to finance investments (CLOs).
While primarily met by cash flows generated through fee income and carried interest income received, working capital needs have also been met (to a limited extent) through borrowings as described in note 9 to the condensed consolidated financial statements.
We determine whether to make capital commitments to our funds in excess of our minimum required amounts based on a variety of factors, including estimates regarding our liquidity resources over the estimated time period during which commitments will have to be funded, estimates regarding the amounts of capital that may be appropriate for other funds that we are in the process of raising or are considering raising, and our general working capital requirements.
Cash Flows
Significant amounts from our condensed consolidated statements of cash flows for the nine months ended September 30, 20162017 and 20152016 are summarized and discussed within the table and corresponding commentary below:
| | | | For the Nine Months Ended September 30, | For the Nine Months Ended
September 30, |
| | 2016 | | 2015 | 2017 | | 2016 |
| | (in thousands) | (in thousands) |
| Operating Activities | $ | 573,171 |
| | $ | 565,760 |
| $ | 667,484 |
| | $ | 573,171 |
|
| Investing Activities | (172,325 | ) | | (150,415 | ) | (244,204 | ) | | (172,325 | ) |
| Financing Activities | (85,222 | ) | | (781,240 | ) | (295,901 | ) | | (85,222 | ) |
| Net Increase (Decrease) in Cash and Cash Equivalents | $ | 315,624 |
| | $ | (365,895 | ) | |
| Net Increase in Cash and Cash Equivalents | | $ | 127,379 |
| | $ | 315,624 |
|
Operating Activities
Our net cash provided by operating activities was $573.2$667.5 million and $565.8$573.2 million during the nine months ended September 30, 20162017 and 2015,2016, respectively. These amounts were primarily driven by:
net income of $576.0$982.3 million and $326.1$576.0 million during the nine months ended September 30, 20162017 and 2015,2016, respectively, as well as non-cash adjustments, net of $27.1$(69.4) million and $46.3$27.1 million, respectively;
a net (increase) decreaseincrease in our carried interest receivable of $(348.8)$(325.8) million and $258.3$(348.8) million during the nine months ended September 30, 20162017 and 2015,2016, respectively, due to a change in the fair value of our funds that generate carried interest of $451.0$828.4 million and $193.4$451.0 million during the nine months ended September 30, 2017 and 2016, and 2015, respectively, offset
offset by fund distributions to the Company of $507.5 million and $103.1 million and $463.5 million during the nine months ended September 30, 20162017 and 2015,2016, respectively;
purchases of investments held by consolidated VIEs in the amount of $396.8$517.7 million and $388.6$396.8 million, offset by proceeds from sales of investments held by consolidated VIEs in the amount of $422.9$385.0 million and $264.5$422.9 million during the nine months ended September 30, 20162017 and 2015,2016, respectively;
a net decreaseincrease in changes to other assets and other liabilities of consolidated VIEsdue from related parties in the amount of $17.5$47.5 million and $148.4$49.9 million during the nine months ended September 30, 2017 and 2016, respectively;
a net (decrease) increase in due to related parties in the amount of $(12.8) million and 2015,$68.7 million during the nine months ended September 30, 2017 and 2016, respectively;
a net increase in accrued compensation and benefits in the amount of $65.6$91.9 million and $71.8$65.6 million during the nine months ended September 30, 20162017 and 2015,2016, respectively;
a net increase (decrease) inpayments made towards the satisfaction of our profit sharing payablecontingent obligations of $168.7$23.6 million and $(53.7)$10.1 million during the nine months ended September 30, 2017 and 2016, and 2015, respectively, due to profit sharing expenserespectively;
a net (decrease) increase in deferred revenue in the amount of $210.5$(17.3) million and $102.7$29.2 million during the nine months ended September 30, 2017 and 2016, respectively; and 2015, respectively, offset by payments
a net increase in our profit sharing payable of $40.1$179.7 million and $170.9$168.7 million during the nine months ended September 30, 2017 and 2016, and 2015, respectively; and
an increase in cash held at consolidated variable interest entitiesrespectively, due to profit sharing expense of $4.1$344.5 million and $284.9$210.5 million during the nine months ended September 30, 2017 and 2016, respectively, offset by payments of $183.7 million and 2015,$40.1 million during the nine months ended September 30, 2017 and 2016, respectively.
Investing Activities
Our net cash used in investing activities was $172.3$(244.2) million and $150.4$(172.3) million during the nine months ended September 30, 20162017 and 2015,2016, respectively. These amounts were primarily driven by:
net cash contributions fromto our equity method investments of $119.9$35.9 million and $97.6$119.9 million during the nine months ended September 30, 2017 and 2016, respectively;
purchases of fixed assets of $5.9 million and 2015,$4.9 million during the nine months ended September 30, 2017 and 2016, respectively;
purchases of U.S. Treasury securities of $198.9 million the during the nine months ended September 30, 2017;
issuance of related party loans of $3.9$5.8 million and $25.0offset by repayment of related party loans of $17.7 million during the nine months ended September 30, 2016 and 2015, respectively;2017; and
purchases of investments in the amount of $14.8 million and $44.5 million and $25.0 million during the nine months ended September 30, 20162017 and 2015,2016, respectively.
Financing Activities
Our net cash used in financing activities was $85.2$(295.9) million and $781.2$(85.2) million during the nine months ended September 30, 20162017 and 2015,2016, respectively. These amounts were primarily driven by:
cash received, net of issuance costs, in connection with the issuance of Preferred shares of $264.4 million during the nine months ended September 30, 2017;
cash distributions paid to our Class A shareholders of $172.1$288.7 million and $275.9$172.1 million, during the nine months ended September 30, 20162017 and 2015,2016, respectively;
cash distributions paid to the Non-Controlling Interest holders in the Apollo Operating Group of $194.4$329.2 million and $377.7$194.4 million during the nine months ended September 30, 20162017 and 2015,2016, respectively;
payments made towards the satisfactioncash contributions from Non-Controlling Interest holders in consolidated VIEs of our tax receivable agreement liability of $48.4$42.5 million and $12.9 million during the nine months ended September 30, 2015;2017 and 2016, respectively;
cash used for purchases of Class A shares of $18.5 million and $13.0 million during the nine months ended September 30, 2016;2017 and 2016, respectively;
net distributions related to deliveriestax liabilities associated with issuances of Class A shares in settlement of RSUs of $35.3$28.0 million and $53.0$35.3 million during the nine months ended September 30, 2017 and 2016, and 2015, respectively;
issuance of debt of consolidated VIEs of $534.6 million offset by repayments of debt of consolidated VIEs of $442.6 million during the nine months ended September 30, 2017; and
issuance of debt of $532.7 million offset by repayments of debt of $200.0 million during the nine months ended September 30, 2016.
Distributions
In addition to other distributions such as payments pursuant to the tax receivable agreement, see note 12 to the condensed consolidated financial statements for information regarding the quarterly distributions which were made at the sole discretion of the Company’s manager during 20162017 and 2015.2016.
Future Cash Flows
Our ability to execute our business strategy, particularly our ability to increase our AUM, depends on our ability to establish new funds and to raise additional investor capital within such funds. Our liquidity will depend on a number of factors, such as our ability to project our financial performance, which is highly dependent on our funds and our ability to manage our projected costs, fund performance, our access to credit facilities, our being in compliance with existing credit agreements, as well as industry and market trends. Also during economic downturns the funds we manage might experience cash flow issues or liquidate entirely. In these situations we might be asked to reduce or eliminate the management fee and incentive fees we charge, which could adversely impact our cash flow in the future.
An increase in the fair value of our funds’ investments, by contrast, could favorably impact our liquidity through higher management fees where the management fees are calculated based on the net asset value, gross assets and adjusted assets. Additionally, higher carried interest income not yet realized would generally result when investments appreciate over their cost basis which would not have an impact on the Company’s cash flow.
As of September 30, 2016, Fund VIII’s,2017, Fund VII’s and Fund VI’s remaining investments and escrow cash were valued at 115%, 99% and 77%97% of the fund’s unreturned capital, respectively, which was below the required escrow ratio of 115%. As a result, these funds are required to place in escrow current and future carried interest income distributions to the general partner until the specified return ratio of 115% is met (at the time of a future distribution) or upon liquidation.
On April 20, 2010, the Company announced that it entered into a strategic relationship agreement with CalPERS. The strategic relationship agreement provides that Apollo will reduce fees charged to CalPERS on funds it manages, or in the future will manage, solely for CalPERS by $125 million over a five-year period or as close a period as required to provide CalPERS with that benefit. The agreement further provides that Apollo will not use a placement agent in connection with securing any future capital commitments from CalPERS. As of September 30, 2016,2017, the Company had reduced fees charged to CalPERS on the funds it manages by approximately $103.1$105.7 million.
Although we expect to pay distributions according to our distribution policy, we may not pay distributions according to our policy, or at all, if, among other things, we do not have the cash necessary to pay the intended distributions. To the extent we do not have cash on hand sufficient to pay distributions, we may have to borrow funds to pay distributions, or we may determine not to pay distributions. The declaration, payment and determination of the amount of our quarterly distributions are at the sole discretion of our manager.
In February 2016, Apollo adopted a programplan to repurchase up to $250 million in the aggregate of its Class A shares, including up to $150 million in the aggregate of its outstanding Class A shares through a share repurchase program and up to $100 million through a reduction of Class A shares to be issued to employees to satisfy associated tax obligations in connection with the settlement of equity-based awards granted under the Company’s 2007 Omnibus Equity Incentive Plan, (the “2007 Equity Plan”), which we refer to as net share settlement. Under the share repurchase program, shares may be repurchased from time to time in open market transactions, in privately negotiated transactions or otherwise, with the size and timing of these repurchases depending on legal requirements, price, market and economic conditions and other factors. During the nine months ended September 30, 2016, the Company repurchased and canceled 1.0 million Class A shares for $12.9 million and, in connection with net share settlements, reduced Class A shares to be issued to employees under the Plan by 2.4 million Class A shares resulting in a payment by the Company of $35.3 million to satisfy the applicable withholding obligation. See note 1112 to the condensed consolidated financial statements for further information regarding the Company’s share repurchase program and net share settlement during the three and nine months ended September 30, 2017 and 2016.
On March 11, 2016, it was announced that a subsidiary of Apollo Global Management, LLC intended to embark on a program to purchase $50 million of Apollo Investment Corporation’sAINV’s common stock, subject to certain regulatory approvals. Under the program, shares may be purchased from time to time in open market transactions and in accordance with applicable law. As of September 30, 2016,2017, Apollo Global Management, LLC hashad purchased approximately 871 thousand shares, or approximately $4.9 million of AINV’s common stock.
On April 14, 2017, Apollo made an unfunded commitment to AGER, a strategic platform established to acquire or reinsure blocks of insurance business in the German and broader European life insurance market. The unfunded commitment of €125 million to purchase new Class B-1 equity interests in AGER during the commitment period may be reduced to the extent that certain employees, officers, directors and advisors of the Company, AGER, Apollo and/or their respective affiliates hereafter commit to purchase from AGER more than €25 million of new equity interests in AGER. Apollo further committed to purchase new Class C-1 equity interests in AGER on the closing date that represent a profits interest in AGER which, upon meeting certain vesting triggers, will be convertible by Apollo into additional Class B-1 equity interests in AGER. Apollo and Athene will be
minority investors in AGER and long term strategic partners with aggregate voting powers of 35% and 10%, respectively. For more information regarding unfunded general partner commitments, see “—Contractual Obligations, Commitments and Contingencies”.
Carried interest income from our funds can be distributed to us on a current basis, but is subject to repayment by the subsidiaries of the Apollo Operating Group that act as general partner of such funds in the event that certain specified return thresholds are not ultimately achieved. The Managing Partners, Contributing Partners and certain other investment professionals have personally guaranteed, to the extent of their ownership interest, subject to certain limitations, the obligations of these subsidiaries in respect of this general partner obligation. Such guarantees are several and not joint and are limited to a particular Managing Partner’s or Contributing Partner’s distributions. Pursuant to the shareholders agreement dated July 13, 2007, as amended (the “Shareholders Agreement”), we agreed to indemnify each of our Managing Partners and certain Contributing Partners against all amounts that they pay pursuant to any of these personal guarantees in favor of Fund IV, Fund V and Fund VI (including costs and expenses related to investigating the basis for or objecting to any claims made in respect of the guarantees) for all interests that our Managing Partners and Contributing Partners have contributed or sold to the Apollo Operating Group.
Accordingly, in the event that our Managing Partners, Contributing Partners and certain investment professionals are required to pay amounts in connection with a general partner obligation to return previously distributed carried interest income with respect to Fund IV, Fund V and Fund VI, we will be obligated to reimburse our Managing Partners and certain Contributing Partners for the indemnifiable percentage of amounts that they are required to pay even though we did not receive the distribution to which that general partner obligation related.
On March 11, 2016, the maturity date of both the Term Facility and the Revolver Facility were extended by two years and as a result, the maturity date is now January 18, 2021. The extension was determined to be a modification of the 2013 AMH Credit Facilities in accordance with U.S. GAAP.
On May 27, 2016, AMH issued $500 million in aggregate principal amount of its 4.400% Senior Notes due 2026 (the “2026 Senior Notes”). The 2026 Senior Notes will mature on May 27, 2026. In connection with the issuance of the 2026 Senior Notes, $200 million of the proceeds were used to repay a portion of the Term Facility outstanding with third party lenders at par.Company has future debt obligations. See note 9 to the condensed consolidated financial statements for further information regarding the Company’s debt arrangements.
On October 28, 2016,March 7, 2017, Apollo issued 11,000,0006.375% Series A Preferred shares (the “Preferred shares”) for gross proceeds of $275.0 million, or $264.4 million net of issuance costs. See note 12 to the condensed consolidated financial statements for further information regarding the Company’s Preferred shares.
On November 1, 2017, the Company declared a cash distribution of $0.35$0.39 per Class A share, which will be paid on November 30, 20162017 to holders of record on November 21, 2016.
On November 1, 2016,2017. Also, the Company issued 376,692 Class A shares in settlementdeclared a cash distribution of vested RSUs. These issuances caused the Company’s ownership interest in the Apollo Operating Group$0.398438 per Preferred share, which will be paid on December 15, 2017 to increase from 46.1% to 46.2%.holders of record on December 1, 2017.
Athene
Athene Holding is the ultimate parent of various insurance company operating subsidiaries. Through its subsidiaries, Athene Holding provides insurance products focused primarily on the retirement market and its business centers primarily on issuing or reinsuring fixed indexed annuities. Apollo, through its subsidiaries, managed or advised $71.8 billion of AUM in accounts owned by or related to Athene (the “Athene Accounts”) as of September 30, 2016.
Investment Management and Sub-Advisory Agreements - Athene Asset Management
Apollo, through its consolidated subsidiary, AAM, provides asset management services to Athene with respect to assets in the Athene North American Accounts, including asset allocation services, direct asset management services, risk management, asset and liability matching management, mergers and acquisitions, asset diligence, hedging and other asset management services and receives management fees for providing these services. As of September 30, 2016, AAM managed $66.5 billion of AUM in the Athene Accounts on whichIn addition, the Company, earns a gross management fee of 0.40% per annum with certain limited exceptions.
AAM has offered to discount certain fees due from Athene. For the total dollar amount of all liabilities sourced through Athene’s organic distribution channels during 2016 in excess of $5.1 billion (subject to certain exceptions, “Excess Liabilities”), AAM, has agreed to discount fees as follows:
During 2016, a discount of 0.40% per annum multiplied by such Excess Liabilities. The 2016 discount relating to such Excess Liabilities is intended to reasonably approximate a full discount of the AAM fee on the assets relating to such Excess Liabilities during the remainder of the 2016 calendar year.
For 2017, a discount of 0.20% per annum multiplied by such Excess Liabilities, resulting in a reasonable approximation of a 0.20% fee on the assets relating to such Excess Liabilities during the 2017 calendar year.
For 2018 and thereafter, a discount of 0.075% per annum, resulting in a reasonable approximation of a 0.325% fee on the assets relating to such Excess Liabilities during the 2018 calendar year and thereafter.
Investment Advisory Agreement - Apollo Asset Management Europe, LLP
Apollo, through its consolidated subsidiary, AAME, provides investment advisory services to Athene and receives a gross fee of 0.10% per annum on the Athene assets it advises. As of September 30, 2016, AAME provided investment advisory services with respect to $5.3 billion of Athene AUM, of which $0.3 billion is sub-advised by the Company.
Sub-Advisory Agreement and Fund Investments
Apollo provides sub-advisory services with respect to a portion of the assets in the Athene Accounts, pursuant to a master sub-advisory agreement among Athene Asset Management and certain other Apollo subsidiaries. In addition from time to time, Athene also invests in funds and investment vehicles that Apollo manages. The Company broadly refers to “Athene Sub-Advised” AUM as those assets in the Athene Accounts which the Company explicitly sub-advises as well as those assets in the Athene Accounts which are invested directly in funds and investment vehicles Apollo manages (“Athene Assets Directly Invested”). As of September 30, 2016, the Athene Sub-Advised AUM totaled $15.3 billion, of which $2.4 billion was Athene Assets Directly Invested.
With respect to assets in the Athene Accounts which the Company explicitly sub-advises, the Company earns up to 0.40% per annum on assets up to $10 billion and 0.35% per annum on all such assets in excess of $10 billion, with certain limited
exceptions. These fees are in additionNorth American Accounts. See note 13 to the grosscondensed consolidated financial statements for more details regarding the fee rates of the investment management, sub-advisory and other fee of 0.40% per annum paidarrangements with respect to Athene Asset Management on these assets. A majority of the assets in the Athene Accounts which the Company explicitly sub-advises are in accounts that invest in high-grade credit asset classes, such as CLO debt, commercial mortgage backed securitiesNorth American Accounts.
Investment Advisory and insurance-linked securities.Sub-Advisory Agreements - AAME
With respect to Athene Assets Directly Invested, Apollo, receives management fees and carried interest, if applicable, directly from the relevant funds under thethrough AAME, provides investment management agreements and other governing documents of such funds. Fees paid to the Company related to such fund investments vary from 0% per annum to 1.75% per annumadvisory services with respect to management feescertain assets in the Athene European Accounts and 0%sub-advises certain assets in the Athene European Accounts. See note 13 to 20%the condensed consolidated financial statements for more details regarding the fee rates of the investment advisory, sub-advisory and other fee arrangements with respect to carried interest. These fees arethe assets in addition to the gross management fee of 0.40% per annum paid to Athene Asset Management on these assets.European Accounts.
Athene Non-Sub-Advised AUM and AGER Non-Sub-Advised AUM
The Company refers to the portion of the AUM in the Athene North American Accounts that is not Athene Sub-Advised AUM as “Athene Non-Sub-Advised” AUM. Accordingly,
AGER currently is the holding company of Athene’s German group companies. In addition, AGER has received subscriptions representing $2.6 billion from Athene and a number of global institutional investors for a capital raise conducted through a private placement. The closing of AGER is subject to regulatory approval. The Company refers to the portion of the AGER AUM that is not AGER Sub-Advised AUM as “AGER Non-Sub-Advised” AUM.
The following table presents the AUM for Athene and AGER as of September 30, 2016, 2017:
|
| | | | | | | | |
| | As of September 30, 2017 |
| | Sub-Advised
AUM(2) | | Non-Sub-Advised AUM | | Total
AUM |
| Athene | 16,947 |
| | 57,029 |
| | 73,976 |
|
AGER(1) | 1,149 |
| | 6,747 |
| | 7,896 |
|
| Total | 18,096 |
| | 63,776 |
| | 81,872 |
|
| |
| (1) | AUM relating to AGER includes $5.3 billion of AUM of Athene’s German group companies, for which AGER currently is the holding company, and $2.6 billion of AUM in connection with its capital raise. AUM related to Athene in the table above does not include AUM related to AGER. |
| |
| (2) | Of the total $18.1 billion Athene Sub-Advised AUM and AGER Sub-Advised AUM as of September 30, 2017, $3.0 billion was Athene Assets Directly Invested. |
Athene Non-Sub-Advised AUM totaled $56.5 billion, which includes the $5.0 billion of Athene AUM for which AAME provides investment advisory services. Apollo incurs all expenses associated with its provision of services to Athene.Holding Follow-on Offerings
In connection with the Athene Private Placement, Athene Holding amended its registration rights agreement to provide (i) investors who are party to such agreement, including AAA Investments, the potential opportunity for liquidity on their shares of Athene Holding through sales in registered public offerings over a 15 month period beginning on the date of Athene Holding’s initial public offering (the “Athene IPO”) and (ii) Athene Holding the right to cause certain investors who are party to the registration rights agreement to include in such offerings a certain percentage of their common shares of Athene Holding subject to the terms and conditions set forth in the agreement. However, pursuant to the registration rights agreement, any shares of Athene Holding held by Apollo (other than shares distributed to AAA in payment of carried interest to be sold for cash) will not be subject to such arrangements and instead will be subject to a lock-up period of two years following the effective date of the registration statement relating to the Athene IPO, but Athene Holding will not have the right to cause any shares owned by Apollo to be included in the Athene IPO or any follow-on offering. Apollo may elect to receive payment of carried interest in cash or in common shares of Athene Holding (valued at the fair market value); and if Apollo elects to receive payment of such carried interest in cash, then common shares of Athene Holding shall be distributed to Apollo and immediately sold by Apollo to pay for such carried interest in cash. On March 16, 2017 and May 22, 2017, AAA announced a conditional distribution of freely tradeable common shares of Athene Holding to its unitholders. The distribution was conditioned upon the pricing of an underwritten follow-on secondary offering of Class A common shares of Athene Holding. On March 28, 2017 and June 6, 2017, Athene Holding announced the base follow-on offering size of 27.5 million shares and 16.2 million shares of Athene Holding, respectively, at a price of $48.50 per share and $49.00 per share, respectively. The March and May offerings were subsequently increased to 31.6 million and 18.6 million shares of Athene Holding, respectively, after the underwriters’ exercise of a 15% over-allotment option.
Distributions to Managing Partners and Contributing Partners
The three Managing Partners who became employees of Apollo on July 13, 2007 each receive a $100,000 base salary. Additionally, our Managing Partners can receive other forms of compensation. Any additional consideration will be paid to them in their proportional ownership interest in Holdings. Additionally, as a result of the tax receivable agreement, 85% of any tax savings APO Corp. recognizes will be paid to the Managing Partners.
Subsequent to the 2007 Reorganization, the Contributing Partners retained ownership interests in subsidiaries of the Apollo Operating Group. Therefore, any distributions that flow up to management or general partner entities in which the Contributing Partners retained ownership interests are shared pro rata with the Contributing Partners who have a direct interest in such entities prior to flowing up to the Apollo Operating Group. These distributions are considered compensation expense.
The Contributing Partners are entitled to receive the following:
Profit sharing related to private equity carried interest income, from direct ownership of advisory entities. Any changes in fair value of the underlying fund investments would result in changes to Apollo Global Management, LLC’s profit sharing payable;
Additional consideration based on their proportional ownership interest in Holdings; and
As a result of the tax receivable agreement, 85% of any tax savings APO Corp. recognizes will be paid to the Contributing Partners.
Potential Future Costs
We may make grants of RSUs or other equity-based awards to employees and independent directors that we appoint in the future.
Critical Accounting Policies
This Management’s Discussion and Analysis of Financial Condition and Results of Operations is based upon the condensed consolidated financial statements, which have been prepared in accordance with U.S. GAAP. The preparation of financial statements in accordance with U.S. GAAP requires the use of estimates and assumptions that could affect the reported amounts of assets and liabilities, the disclosure of contingent assets and liabilities and the reported amounts of revenues and expenses. Actual results could differ from these estimates. A summary of our significant accounting policies is presented in note 2 to our condensed consolidated financial statements. The following is a summary of our accounting policies that are affected most by judgments, estimates and assumptions.
Consolidation
The types ofCompany assesses all entities with which Apolloit is involved generally include subsidiaries (e.g., general partners and management companies related to the funds the Company manages), entities that have all the attributes of an investment company (e.g., funds) and securitization vehicles (e.g., collateralized loan obligations). Each of these entities is assessed for consolidation on a case by case basis depending on the specific facts and circumstances surrounding thateach entity.
Pursuant to the consolidation guidance, the Company first evaluates whether it holds a variable interest in an entity. Fees that are customary and commensurate with the level of services provided, and where the Company doesn’t hold other economic interests in the entity that would absorb more than an insignificant amount of the expected losses or returns of the entity, would not be considered a variable interest. Apollo factors in all economic interests including proportionate interests through related parties, to determine if feessuch interests are to be considered a variable interest. As Apollo’s interestsinterest in many of these entities areis solely through market rate performance fees and/or insignificant indirect interests through related parties, Apollo is generally not considered to have a variable interest in many of these entities under the guidance and no further consolidation analysis is performed. For entities where the Company has determined that it does hold a variable interest, the Company performs an assessment to determine whether each of those entities qualify as a VIE.
The determination as to whether an entity qualifies as a VIE depends on the facts and circumstances surrounding each entity and therefore certain of Apollo’s funds may qualify as VIEs under the variable interest model whereas others may qualify as VOEs under the voting interest model. The granting of substantive kick-out rights is a key consideration in determining whether a limited partnership or similar entity is a VIE and whether or not that entity should be consolidated.
Under the voting interest model, Apollo consolidates those entities it controls through a majority voting interest. Apollo does not consolidate those VOEs in which substantive kick-out rights have been granted to the unaffiliated investors to either dissolve the fund or remove the general partner.
Under the variable interest model, Apollo consolidates those entities where it is determined that the Company is the primary beneficiary of the entity. The Company is determined to be the primary beneficiary if it holds a controlling financial interest in the VIE defined as possessing both (i) the power to direct the activities of the VIE that most significantly impact the VIE’s economic performance and (ii) the obligation to absorb losses of the VIE or the right to receive benefits from the VIE that could potentially be significant to the VIE. WhenIf Apollo alone is not considered to have a controlling financial interest in the VIE but Apollo and its related parties under common control in the aggregate have a controlling financial interest in the VIE, Apollo will still be deemed to be the primary beneficiary if it is the party within the related party group that is most closely associated with the VIE. WhenIf Apollo and its related parties not under common control in the aggregate have a controlling financial interest in a VIE, then Apollo is deemed to be the primary beneficiary if substantially all the activities of the entity are performed on behalf of Apollo.
Apollo determines whether it is the primary beneficiary of a VIE at the time it becomes initially involved with the VIE and reconsiders that conclusion continuously. Investments and redemptions (either by Apollo, related parties of Apollo or third parties) or amendments to the governing documents of the respective entity may affect an entity’s status as a VIE or the determination of the primary beneficiary.
The assessment of whether an entity is a VIE and the determination of whether Apollo should consolidate such VIE requires judgment by our management. Those judgments include, but are not limited to: (i) determining whether the total equity investment at risk is sufficient to permit the entity to finance its activities without additional subordinated financial support, (ii) evaluating whether the holders of equity investment at risk, as a group, can make decisions that have a significant effect on the success of the entity, (iii) determining whether the equity investors have proportionate voting rights to their obligations to absorb losses or rights to receive the expected residual returns from an entity and (iv) evaluating the nature of the relationship and activities of those related parties with shared power or under common control for purposes of determining which party within the related-party group is most closely associated with the VIE. Judgments are also made in determining whether a member in the equity group has a controlling financial interest including power to direct activities that most significantly impact the VIEs’
VIE’s economic performance and rights to receive benefits or obligations to absorb losses that could be potentially significant to the VIE. This analysis includesconsiders all relevant economic interests including proportionate interests held through related parties.
Revenue Recognition
Carried Interest Income (Loss) from Related Parties. We earn carried interest income from our funds as a result of such funds achieving specified performance criteria. Such carried interest income generally is earned based upon a fixed percentage of realized and unrealized gains of various funds after meeting any applicable hurdle rate or threshold minimum. Carried interest income from certain of the funds that we manage is subject to contingent repayment and is generally paid to us as particular investments made by the funds are realized. If, however, upon liquidation of a fund, the aggregate amount paid to us as carried interest exceeds the amount actually due to us based upon the aggregate performance of the fund, the excess (in certain cases net of taxes) is required to be returned by us to that fund. For a majority of our credit funds, once the annual carried interest income has been determined, there generally is no look-back to prior periods for a potential contingent repayment, however, carried interest income on certain other credit funds can be subject to contingent repayment at the end of the life of the fund. We have elected to adopt Method 2 from U.S. GAAP guidance applicable to accounting for management fees based on a formula, and under this method, we accrue carried interest income quarterly based on fair value of the underlying investments and separately assess if contingent repayment is necessary. The determination of carried interest income and contingent repayment considers both the terms of the respective partnership agreements and the current fair value of the underlying investments within the funds. Estimates and assumptions are made when determining the fair value of the underlying investments within the funds and could vary depending on the valuation methodology that is used. See “Investments, at Fair Value” below for further discussion related to significant estimates and assumptions used for determining fair value of the underlying investments in our private equity, credit and real estateassets funds.
Management Fees from Related Parties. The management fees related to our private equity funds are generally based on a fixed percentage of the committed capital or invested capital. The corresponding fee calculations that consider committed capital or invested capital are both objective in nature and therefore do not require the use of significant estimates or assumptions. Management fees related to our credit funds, by contrast, can be based on net asset value, gross assets, adjusted cost of all unrealized portfolio investments, capital commitments, adjusted assets, capital contributions, or stockholders’ equity all as defined in the respective partnership agreements. The credit management fee calculations that consider net asset value, gross assets, adjusted cost of all unrealized portfolio investments and adjusted assets are normally based on the terms of the respective partnership agreements and the current fair value of the underlying investments within the funds. Estimates and assumptions are made when determining the fair value of the underlying investments within the funds and could vary depending on the valuation methodology that is used. The management fees related to our real estateassets funds are generally based on a specific percentage of the funds’ stockholders’ equity or committed or net invested capital or the capital accounts of the limited partners. See “Investments, at Fair Value” below for further discussion related to significant estimates and assumptions used for determining fair value of the underlying investments in our private equity, credit and real estateassets funds.
Investments, at Fair Value
On a quarterly basis, Apollo utilizes valuation committees consisting of members from senior management, to review and approve the valuation results related to the investments of the funds it manages. For certain publicly traded vehicles managed by Apollo, a review is performed by an independent board of directors. The Company also retains independent valuation firms to provide third-party valuation consulting services to Apollo, which consist of certain limited procedures that management identifies and requests them to perform. The limited procedures provided by the independent valuation firms assist management with validating their valuation results or determining fair value. The Company performs various back-testing procedures to validate their valuation approaches, including comparisons between expected and observed outcomes, forecast evaluations and variance analyses. However, because of the inherent uncertainty of valuation, the estimated values may differ significantly from the values that would have been used had a ready market for the investments existed, and the differences could be material.
Private Equity Investments. The majority of the illiquid investments within our private equity funds are valued using the market approach, which provides an indication of fair value based on a comparison of the subject company to comparable publicly traded companies and transactions in the industry.
Market Approach. The market approach is driven by current market conditions, including actual trading levels of similar companies and, to the extent available, actual transaction data of similar companies. Judgment is required by management when assessing which companies are similar to the subject company being valued. Consideration may also be given to any of the following factors: (1) the subject company’s historical and projected financial data; (2) valuations given to comparable companies; (3) the size and scope of the subject company’s operations; (4) the subject company’s individual strengths and weaknesses; (5) expectations relating to the market’s receptivity to an offering of the subject company’s securities; (6) applicable restrictions on transfer; (7) industry and market information; (8) general economic and market conditions; and (9) other factors deemed relevant.
Market approach valuation models typically employ a multiple that is based on one or more of the factors described above. Enterprise value as a multiple of EBITDA is common and relevant for most companies and industries, however, other industry specific multiples are employed where available and appropriate.Sources for gaining additional knowledge related to comparable
companies include public filings, annual reports, analyst research reports, and press releases. Once a comparable company set is determined, we review certain aspects of the subject company’s performance and determine how its performance compares to the group and to certain individuals in the group. We compare certain measurements such as EBITDA margins, revenue growth over certain time periods, leverage ratios and growth opportunities. In addition, we compare our entry multiple and its relation to the comparable set at the time of acquisition to understand its relation to the comparable set on each measurement date.
Income Approach. For investments where the market approach does not provide adequate fair value information, we rely on the income approach. The income approach is also used to value investments or validate the market approach within our private equity funds. The income approach provides an indication of fair value based on the present value of cash flows that a business or security is expected to generate in the future. The most widely used methodology for the income approach is a discounted cash flow method. Inherent in the discounted cash flow method are significant assumptions related to the subject company’s expected results, the determination of a terminal value and a calculated discount rate, which is normally based on the subject company’s weighted average cost of capital, or “WACC.” The WACC represents the required rate of return on total capitalization, which is comprised of a required rate of return on equity, plus the current tax-effected rate of return on debt, weighted by the relative percentages of equity and debt that are typical in the industry. The most critical step in determining the appropriate WACC for each subject company is to select companies that are comparable in nature to the subject company and the credit quality of the subject company. Sources for gaining additional knowledge about the comparable companies include public filings, annual reports, analyst research reports, and press releases. The general formula then used for calculating the WACC considers the after-tax rate of return on debt capital and the rate of return on common equity capital, which further considers the risk-free rate of return, market beta, market risk premium and small stock premium, if applicable. The variables used in the WACC formula are inferred from the comparable market data obtained. The Company evaluates the comparable companies selected and concludes on WACC inputs based on the most comparable company or analyzes the range of data for the investment.
The value of liquid investments, where the primary market is an exchange (whether foreign or domestic), is determined using period end market prices. Such prices are generally based on the close price on the date of determination.
Credit Investments. The majority of investments in Apollo’s credit funds are valued based on quoted market prices and valuation models.
Quoted market prices are valued based on the average of the “bid” and the “ask” quotes provided by multiple brokers wherever possible without any adjustments. Apollo designates certain brokers to value specific securities. In order to determine the designated brokers, Apollo considers the following: (i) brokers with which Apollo has previously transacted, (ii) the underwriter of the security and (iii) active brokers indicating executable quotes. In addition, when valuing a security based on broker quotes wherever possible Apollo tests the standard deviation amongst the quotes received and the variance between the concluded fair value and the value provided by a pricing service. When broker quotes are not available, we use pricing service quotes or other sources to mark a position. When relying on a pricing service as a primary source, (i) Apollo analyzes how the price has moved over the measurement period, (ii) reviews the number of brokers included in the pricing service’s population and (iii) validates the valuation levels with Apollo’s pricing team and traders.
Debt and equity securities that are not publicly traded or whose market prices are not readily available are valued at fair value utilizing a model based approach is used to determine fair value. When determining fair value when no observable market value exists, the value attributed to an investment is based on the price that would be received to sell an asset or paid to transfer a liability in an orderly transaction between market participants at the measurement date. Valuation approaches used to estimate the fair value of illiquid credit investments also may include the market approach and the income approach, as previously described above. The valuation approaches used consider, as applicable, market risks, credit risks, counterparty risks and foreign currency risks.
The credit funds also enter into foreign currency exchange contracts, total return swap contracts, credit default swap contracts, and other derivative contracts, which may include options, caps, collars and floors. Foreign currency exchange contracts are marked-to-market by recognizing the difference between the contract exchange rate and the current market rate as unrealized appreciation or depreciation. If securities are held at the end of this period, the changes in value are recorded in income as unrealized. Realized gains or losses are recognized when contracts are settled. Total return swap and credit default swap contracts are recorded at fair value as an asset or liability, with changes in fair value recorded as unrealized appreciation or depreciation. Realized gains or losses are recognized at the termination of the contract based on the difference between the close-out price of the total return or credit default swap contract and the original contract price. Forward contracts are valued based on market rates obtained from counterparties or prices obtained from recognized financial data service providers.
Real EstateAssets Investments. For the CMBS portfolio of Apollo’s funds, the estimated fair value of the CMBS portfolio is determined by reference to market prices provided by certain dealers who make a market in these financial instruments. Broker quotes are only indicative of fair value and may not necessarily represent what the funds would receive in an actual trade for the applicable instrument. Additionally, the loans held-for-investment are stated at the principal amount outstanding, net of deferred loan fees and costs. The Company evaluates its loans in Apollo’s real assets funds are evaluated for possible impairment on a quarterly basis. For Apollo’s real estateassets funds, valuations of non-marketable underlying investments are determined using methods that include, but are not limited to (i) discounted cash flow estimates or comparable analysis prepared internally, (ii) third party appraisals or valuations by qualified real estate appraisers, and (iii) contractual sales value of investments/properties subject to bona fide purchase contracts. Methods (i) and (ii) also incorporate consideration of the use of the income, cost, or sales comparison approaches of estimating property values.
Certain of our funds may also enter into foreign currency exchange contracts, total return swap contracts, credit default swap contracts, and other derivative contracts, which may include options, caps, collars and floors. Foreign currency exchange contracts are marked-to-market by recognizing the difference between the contract exchange rate and the current market rate as unrealized appreciation or depreciation. If securities are held at the end of this period, the changes in value are recorded in income as unrealized gains or losses. Realized gains or losses are recognized when contracts are settled. Derivative contracts such as total
return swaps and credit default swaps are recorded at fair value as an asset or liability, with changes in fair value recorded as unrealized appreciation or depreciation. Realized gains or losses are recognized at the termination of the contract based on the difference between the close-out price of the total return or credit default swap contract and the original contract price. Forward contracts are valued based on market rates obtained from counterparties or prices obtained from recognized financial data service providers.
The fair values of the investments in our private equity, credit and real estate funds can be impacted by changes to the assumptions used in the underlying valuation models. For further discussion on the impact of changes to valuation assumptions see “Item 7A. Quantitative and Qualitative Disclosures About Market Risk—Sensitivity” in our 2016 Annual Report on Form 10-K for the year ended December 31, 2015 filed with the SEC on February 29, 2016.Report. There have been no material changes to the underlying valuation modelsapproaches utilized during the periods that our financial results are presented.presented in this report.
Fair Value of Financial Instruments
Except for the Company’s debt obligations (each as defined in note 9 to our condensed consolidated financial statements), Apollo’s financial instruments are recorded at fair value or at amounts whose carrying values approximate fair value. See “—Investments, at Fair Value” above. While Apollo’s valuations of portfolio investments are based on assumptions that Apollo believes are reasonable under the circumstances, the actual realized gains or losses will depend on, among other factors, future operating results, the value of the assets and market conditions at the time of disposition, any related transaction costs and the timing and manner of sale, all of which may ultimately differ significantly from the assumptions on which the valuations were based. Financial instruments’ carrying values generally approximate fair value because of the short-term nature of those instruments or variable interest rates related to the borrowings.
Profit Sharing Expense. Profit sharing expense is primarily a result of agreements with our Contributing Partners and employees to compensate them based on the ownership interest they have in the general partners of the Apollo funds. Therefore, changes in the fair value of the underlying investments in the funds we manage and advise affect profit sharing expense. The Contributing Partners and employees are allocated approximately 30% to 50% of the total carried interest income which is driven primarily by changes in fair value of the underlying fund’s investments and is treated as compensation expense. Additionally, profit sharing expenses paid may be subject to clawback from employees, former employees and Contributing Partners to the extent not indemnified. When applicable, the accrual for potential clawback of previously distributed profit sharing amounts, which is a component of due from related parties on the condensed consolidated statements of financial condition, represents all amounts previously distributed to employees, former employees and Contributing Partners that would need to be returned to the general partner if the Apollo funds were to be liquidated based on the current fair value of the underlying funds’ investments as of the reporting date. The actual general partner receivable, however, would not become realized until the end of a fund’s life.
Changes in the fair value of the contingent obligations that were recognized in connection with certain Apollo acquisitions are reflected in the Company’s condensed consolidated statements of operations as profit sharing expense.
The Company has adopted a performance based incentive arrangement for certain Apollo partners and employees designed to more closely align compensation on an annual basis with the overall realized performance of the Company. This arrangement, which we refer to herein as the “IncentiveIncentive Pool” enables certain partners and employees to earn discretionary compensation based on carried interest realizations earned by the Company in a given year, which amounts are reflected in profit sharing expense in the accompanying condensed consolidated financial statements. The Company adopted the Incentive Pool to attract and retain, and provide incentive to, partners and employees of the Company and to more closely align the overall compensation of partners and employees with the overall realized performance of the Company. Allocations to the Incentive Pool and to its participants contain both a fixed and a discretionary component and may vary year-to-year depending on the overall realized performance of the Company and the contributions and performance of each participant. There is no assurance that the Company will continue to compensate individuals through performance-based incentive arrangements in the future and there may be periods when the executive committee of the Company’s manager determines that allocations of realized carried interest income are not sufficient to compensate individuals, which may result in an increase in salary, bonus and benefits.
Fair Value Option. Apollo has elected the fair value option for the Company’s investment in Athene Holding, the assets and liabilities of thecertain of its consolidated VIEs and(including CLOs), the Company’s investments inU.S. Treasury securities with original maturities greater than three months when purchased and certain CLOs.of the Company’s other investments. Such election is irrevocable and is applied to financial instruments on an individual basis at initial recognition. Apollo has applied the fair value option for certain corporate loans, other investments and debt obligations held by the consolidated VIEs that otherwise would not have been carried at fair
value. See notes 3, 4, and 5 to the condensed consolidated financial statements for further disclosure on the investments in Athene Holding and financial instruments of the consolidated VIEs and other investments for which the fair value option has been elected.
Equity-Based Compensation. Equity-based compensation is accounted for in accordance with U.S. GAAP, which requires that the cost of employee services received in exchange for an award is generally measured based on the grant date fair value of the award. Equity-based awards that do not require future service (i.e., vested awards) are expensed immediately. Equity-based employee awards that require future service are recognized over the relevant service period. Further, as required under U.S. GAAP,As discussed in note 2, in connection with the adoption of new share-based payment guidance during the quarter ended March 31, 2017, the Company estimatesmade an accounting policy election to no longer estimate forfeitures using industry comparables or historical trends forin determining the number of equity-based awards that are not expected
to vest. Under the Company’s new policy, which was applied prospectively as of January 1, 2017, forfeitures are accounted for when they occur. Apollo’s equity-based awards consist of, or provide rights with respect to, AOG Units, RSUs, share options, restricted shares, AHL Awards and other equity-based compensation awards. For more information regarding Apollo’s equity-based compensation awards, see note 11 to our condensed consolidated financial statements. The Company’s assumptions made to determine the fair value on grant date and the estimated forfeiture rate are embodied in the calculations of compensation expense.
A significant part of our compensation expense is derived from amortization of RSUs. The fair value of all RSU grants after March 29, 2011 is based on the grant date fair value, which considers the public share price of the Company. RSUs are comprised of Plan Grants, which generally do not pay distributions until vested and, for grants made after 2011, the underlying shares are generally issued by March 15th after the year in which they vest, and Bonus Grants, which pay distributions on both vested and unvested grants and are generally issued after vesting on an approximate two-month lag. For Plan Grants, the grant date fair value is based on the public share price of the Company, and is discounted for transfer restrictions and lack of distributions until vested. For Bonus Grants, the grant date fair value is based on the public share price of the Company, and is discounted for transfer restrictions.
We utilizedutilize the present value of a growing annuity formula to calculate a discount for the lack of pre-vesting distributions on Plan Grant RSUs. The weighted average for the inputs utilized for the shares granted during the three and nine months ended September 30, 20162017 and 20152016 are presented in the table below for Plan Grants:
| | | | For the Three Months Ended September 30, | | For the Nine Months Ended September 30, | For the Three Months Ended
September 30, | | For the Nine Months Ended
September 30, |
| | 2016 | | 2015 | | 2016 | | 2015 | 2017 | | 2016 | | 2017 | | 2016 |
Distribution Yield(1) | 7.5% | | 11.0% | | 7.5% | | 11.0% | 6.0% | | 7.5% | | 6.1% | | 7.5% |
Cost of Equity Capital Rate(2) | 9.3% | | 8.8% | | 9.4% | | 9.1% | 10.5% | | 9.3% | | 11.0% | | 9.4% |
| |
| (1) | Calculated based on the historical distributions paid during the twelve months ended September 30, 20162017 and the Company’s Class A share price as of the measurement date of the grant on a weighted average basis. |
| |
| (2) | Assumes a discount rate that was equivalent to the opportunity cost of foregoing distributions on unvested Plan Grant RSUs as of the valuation date, based on the Capital Asset Pricing Model (“CAPM”). CAPM is a commonly used mathematical model for developing expected returns. |
The following table summarizes the weighted average discounts for Plan Grants for the three and nine months ended September 30, 20162017 and 2015:2016:
| | | | For the Three Months Ended September 30, | | For the Nine Months Ended September 30, | For the Three Months Ended
September 30, | | For the Nine Months Ended
September 30, |
| | 2016 | | 2015 | | 2016 | | 2015 | 2017 | | 2016 | | 2017 | | 2016 |
| Plan Grants: | | |
Discount for the lack of distributions until vested(1) | 8.2% | | 26.1% | | 10.1% | | 26.2% | 12.9% | | 8.2% | | 12.0% | | 10.1% |
| |
| (1) | Based on the present value of a growing annuity calculation. |
We utilizedutilize the Finnerty Model to calculate a marketability discount on the Plan Grant and Bonus Grant RSUs to account for the lag between vesting and issuance. The Finnerty Model provides for a valuation discount reflecting the holding period restriction embedded in a restricted security preventing its sale over a certain period of time.
The Finnerty Model proposes to estimate a discount for lack of marketability such as transfer restrictions by using an option pricing theory. This model has gained recognition through its ability to address the magnitude of the discount by considering the volatility of a company’s stock price and the length of restriction. The concept underpinning the Finnerty Model is that a restricted security cannot be sold over a certain period of time. Further simplified, a restricted share of equity in a company can be viewed as having forfeited a put on the average price of the marketable equity over the restriction period (also known as an “Asian Put Option”). If we price an Asian Put Option and compare this value to that of the assumed fully marketable underlying security, we can effectively estimate the marketability discount.
The inputs utilized in the Finnerty Model are (i) length of holding period, (ii) volatility and (iii) distribution yield. The weighted average for the inputs utilized for the shares granted during the three and nine months ended September 30, 20162017 and 20152016 are presented in the table below for Plan Grants and Bonus Grants:
| | | | For the Three Months Ended September 30, | | For the Nine Months Ended September 30, | For the Three Months Ended
September 30, | | For the Nine Months Ended
September 30, |
| | 2016 | | 2015 | | 2016 | | 2015 | 2017 | | 2016 | | 2017 | | 2016 |
| Plan Grants | | |
| Plan Grants: | | |
| Holding Period Restriction (in years) | 0.7 | | 0.6 | | 0.7 | | 0.6 | 0.6 | | 0.7 | | 0.6 | | 0.7 |
Volatility(1) | 31.6% | | 22.6% | | 31.7% | | 24.0% | 23.4% | | 31.6% | | 22.1% | | 31.7% |
Distribution Yield(2) | 7.5% | | 11.0% | | 7.5% | | 11.0% | 6.0% | | 7.5% | | 6.1% | | 7.5% |
| Bonus Grants | | |
| Bonus Grants: | | |
| Holding Period Restriction (in years) | 0.2 | | 0.2 | | 0.2 | | 0.2 | 0.2 | | 0.2 | | 0.2 | | 0.2 |
Volatility(1) | 28.1% | | 22.7% | | 33.4% | | 22.2% | 23.0% | | 28.1% | | 22.6% | | 33.4% |
Distribution Yield(2) | 7.5% | | 11.0% | | 7.5% | | 10.8% | 6.0% | | 7.5% | | 5.4% | | 7.5% |
| |
| (1) | The Company determined the expected volatility based on the volatility of the Company’s Class A share price as of the grant date with consideration to comparable companies. |
| |
| (2) | Calculated based on the historical distributions paid during the twelve months ended September 30, 20162017 and the Company’s Class A share price as of the measurement date of the grant on a weighted average basis. |
The following table summarizes the weighted average marketability discounts for Plan Grants and Bonus Grants for the three and nine months ended September 30, 20162017 and 2015:2016:
| | | | For the Three Months Ended September 30, | | For the Nine Months Ended September 30, | For the Three Months Ended
September 30, | | For the Nine Months Ended
September 30, |
| | 2016 | | 2015 | | 2016 | | 2015 | 2017 | | 2016 | | 2017 | | 2016 |
| Plan Grants: | | |
Marketability discount for transfer restrictions(1) | 5.8% | | 3.8% | | 5.8% | | 3.9% | 4.0% | | 5.8% | | 3.5% | | 5.8% |
| Bonus Grants: | | |
Marketability discount for transfer restrictions(1) | 3.0% | | 2.3% | | 3.4% | | 2.2% | 2.3% | | 3.0% | | 2.3% | | 3.4% |
| |
| (1) | Based on the Finnerty Model calculation. |
After the grant date fair value is determined, an estimated forfeiture rate is applied. The estimated fair value was determined and recognized over the vesting period on a straight-line basis. A 4.0% forfeiture rate is estimated for RSUs, based on the Company’s historical attrition rate as well as industry comparable rates. If employees are no longer associated with Apollo or if there is no turnover, we will revise our estimated compensation expense to the actual amount of expense based on the RSUs vested at the reporting date in accordance with U.S. GAAP.
Bonus Grants constitute a component of the discretionary annual compensation awarded to certain of our professionals. ForDuring 2016, the Company has increased the default portion of annual compensation to be awarded as a discretionary Bonus Grant relative to the portion awarded in previous years. The increase in the proportion of discretionary annual compensation awarded as a Bonus Grant will be offset by a decrease in discretionary annual cash bonuses. These changes are intended to further align the interests of Apollo’s employees and stakeholders and strengthen the long-term commitment of our partners and employees.
For certain funds, profit sharing participants are required to use a portion of their profit sharing distributions to purchase Class A shares of Apollo Global Management, LLC in the form of restricted Class A shares that vest over three years. Equity-based compensation expense is incurred over the vesting period.
Fair Value Measurements
See note 5 to our condensed consolidated financial statements for a discussion of the Company’s fair value measurements.
Recent Accounting Pronouncements
A list of recent accounting pronouncements that are relevant to Apollo and its industry is included in note 2 to our condensed consolidated financial statements.
Off-Balance Sheet Arrangements
In the normal course of business, we engage in off-balance sheet arrangements, including transactions in derivatives, guarantees, commitments, indemnifications and potential contingent repayment obligations. See note 1314 to our condensed consolidated financial statements for a discussion of guarantees and contingent obligations and note 2 for a discussion of derivatives.
Contractual Obligations, Commitments and Contingencies
As of September 30, 20162017, the Company’s material contractual obligations consisted of lease obligations, contractual commitments as part of the ongoing operations of the funds and debt obligations. Fixed and determinable payments due in connection with these obligations are as follows:
| | | | Remaining 2016 | | 2017 | | 2018 | | 2019 | | 2020 | | Thereafter | | Total | Remaining 2017 | | 2018 | | 2019 | | 2020 | | 2021 | | Thereafter | | Total |
| | (in thousands) | (in thousands) |
Operating lease obligations(1) | $ | 9,385 |
| | $ | 35,104 |
| | $ | 31,118 |
| | $ | 30,359 |
| | $ | 13,796 |
| | $ | 10,326 |
| | $ | 130,088 |
| $ | 9,266 |
| | $ | 34,643 |
| | $ | 33,702 |
| | $ | 15,563 |
| | $ | 6,055 |
| | $ | 13,313 |
| | $ | 112,542 |
|
Other long-term obligations(2)(1) | 6,127 |
| | 9,417 |
| | 6,734 |
| | 4,030 |
| | 1,701 |
| | 1,701 |
| | 29,710 |
| 8,291 |
| | 12,413 |
| | 3,525 |
| | 1,956 |
| | 1,956 |
| | 1,611 |
| | 29,752 |
|
2013 AMH Credit Facilities - Term Facility(3)(2) | 1,486 |
| | 5,945 |
| | 5,945 |
| | 5,945 |
| | 5,945 |
| | 300,297 |
| | 325,563 |
| 1,837 |
| | 7,347 |
| | 7,347 |
| | 7,347 |
| | 300,367 |
| | — |
| | 324,245 |
|
2013 AMH Credit Facilities - Revolver Facility(4)(3) | 156 |
| | 625 |
| | 625 |
| | 625 |
| | 625 |
| | 8 |
| | 2,664 |
| 156 |
| | 625 |
| | 625 |
| | 625 |
| | 8 |
| | — |
| | 2,039 |
|
2024 Senior Notes (5)(4) | 5,000 |
| | 20,000 |
| | 20,000 |
| | 20,000 |
| | 20,000 |
| | 568,333 |
| | 653,333 |
| 5,000 |
| | 20,000 |
| | 20,000 |
| | 20,000 |
| | 20,000 |
| | 548,333 |
| | 633,333 |
|
2026 Senior Notes (6)(5) | 5,500 |
| | 22,000 |
| | 22,000 |
| | 22,000 |
| | 22,000 |
| | 618,983 |
| | 712,483 |
| 5,500 |
| | 22,000 |
| | 22,000 |
| | 22,000 |
| | 22,000 |
| | 596,983 |
| | 690,483 |
|
| 2014 AMI Term Facility I | 75 |
| | 301 |
| | 301 |
| | 15,199 |
| | — |
| | — |
| | 15,876 |
| 81 |
| | 324 |
| | 324 |
| | 324 |
| | 16,460 |
| | — |
| | 17,513 |
|
| 2014 AMI Term Facility II | 76 |
| | 305 |
| | 305 |
| | 17,702 |
| | — |
| | — |
| | 18,388 |
| 80 |
| | 320 |
| | 320 |
| | 320 |
| | 320 |
| | 18,397 |
| | 19,757 |
|
| 2016 AMI Term Facility I | 83 |
| | 334 |
| | 334 |
| | 334 |
| | 334 |
| | 19,078 |
| | 20,497 |
| 88 |
| | 351 |
| | 351 |
| | 351 |
| | 20,063 |
| | — |
| | 21,204 |
|
| 2016 AMI Term Facility II | 74 |
| | 297 |
| | 297 |
| | 297 |
| | 297 |
| | 15,013 |
| | 16,275 |
| 78 |
| | 313 |
| | 313 |
| | 313 |
| | 15,787 |
| | — |
| | 16,804 |
|
| Obligations as of September 30, 2016 | $ | 27,962 |
| | $ | 94,328 |
| | $ | 87,659 |
| | $ | 116,491 |
| | $ | 64,698 |
| | $ | 1,533,739 |
| | $ | 1,924,877 |
| |
| Obligations as of September 30, 2017 | | $ | 30,377 |
| | $ | 98,336 |
| | $ | 88,507 |
| | $ | 68,799 |
| | $ | 403,016 |
| | $ | 1,178,637 |
| | $ | 1,867,672 |
|
| |
| (1) | The Company has entered into sublease agreements and is expected to contractually receive approximately $1.7 million over the life of the agreements. |
| |
(2) | Includes (i) payments on management service agreements related to certain assets and (ii) payments with respect to certain consulting agreements entered into by the Company. Note that a significant portion of these costs are reimbursable by funds. |
| |
(3)(2) | $300 million of the outstanding Term Facility matures in January 2021. The interest rate on the $300 million Term Facility as of September 30, 20162017 was 1.98%2.45%. See note 9 of the condensed consolidated financial statements for further discussion of the 2013 AMH Credit Facilities. |
| |
(4)(3) | The commitment fee as of September 30, 20162017 on the $500 million undrawn Revolver Facility was 0.125%. See note 9 of the condensed consolidated financial statements for further discussion of the 2013 AMH Credit Facilities. |
| |
(5)(4) | $500 million of the 2024 Senior Notes matures in May 2024. The interest rate on the 2024 Senior Notes as of September 30, 20162017 was 4.00%. See note 9 of the condensed consolidated financial statements for further discussion of the 2024 Senior Notes. |
| |
(6)(5) | $500 million of the 2026 Senior Notes matures in May 2026. The interest rate on the 2026 Senior Notes as of September 30, 20162017 was 4.40%. See note 9 of the condensed consolidated financial statements for further discussion of the 2026 Senior Notes. |
| |
| Note: | Due to the fact that the timing of certain amounts to be paid cannot be determined or for other reasons discussed below, the following contractual commitments have not been presented in the table above. |
| |
| (i) | As noted previously, we have entered into a tax receivable agreement with our Managing Partners and Contributing Partners which requires us to pay to our Managing Partners and Contributing Partners 85% of any tax savings received by APO Corp. from our step-up in tax basis. The tax savings achieved may not ensure that we have sufficient cash available to pay this liability and we might be required to incur additional debt to satisfy this liability. |
| |
| (ii) | Debt amounts related to the consolidated VIEs are not presented in the table above as the Company is not a guarantor of these non-recourse liabilities. |
| |
| (iii) | In connection with the Stone Tower and Gulf Stream acquisitions,acquisition, the Company agreed to pay the former owners of Stone Tower and Gulf Stream a specified percentage of any future carried interest income earned from certain of the Stone Tower and Gulf Stream funds, CLOs and strategic investment accounts. This contingent consideration liability is remeasured to fair value at each reporting period until the obligations are satisfied. See note 1314 to the condensed consolidated financial statements for further information regarding the contingent consideration liability. |
| |
| (iv) | Commitments from certain of our subsidiaries to contribute to the funds we manage and certain related parties. |
Commitments
Certain of our management companies and general partners are committed to contribute to the funds we manage and certain related parties. While a small percentage of these amounts are funded by us, the majority of these amounts have historically been funded by our related parties, including certain of our employees and certain Apollo funds. The table below presents the commitment and remaining commitment amounts of Apollo and its related parties, the percentage of total fund commitments of Apollo and its related parties, the commitment and remaining commitment amounts of Apollo only (excluding related parties), and the percentage of total fund commitments of Apollo only (excluding related parties) for each private equity, credit and real estateassets fund as of September 30, 20162017 as follows ($ in millions):
| | | Fund | Apollo and Related Party
Commitments | | % of Total Fund Commitments | | Apollo Only
(Excluding
Related Party)
Commitments | | Apollo Only
(Excluding
Related Party)
% of
Total Fund
Commitments | | Apollo and
Related Party
Remaining
Commitments | | Apollo Only
(Excluding
Related Party)
Remaining
Commitments | Apollo and Related Party Commitments | | % of Total Fund Commitments | | Apollo Only (Excluding Related Party) Commitments | | Apollo Only (Excluding Related Party) % of Total Fund Commitments | | Apollo and Related Party Remaining Commitments | | Apollo Only (Excluding Related Party) Remaining Commitments |
| Private Equity: | | | | | | | | | | | | | | | | | | | | | | |
Fund IX(1) | | $ | 1,847.5 |
| | 7.47 | % | | $ | 822.5 |
| | 3.33 | % | | $ | 1,847.5 |
| | $ | 822.5 |
|
| Fund VIII | $ | 1,543.5 |
| | 8.40 | % | | $ | 392.4 |
| | 2.14 | % | | $ | 745.2 |
| | $ | 189.9 |
| 1,543.5 |
| | 8.40 |
| | 395.5 |
| | 2.15 |
| | 583.3 |
| | 151.4 |
|
| Fund VII | 467.2 |
| | 3.18 |
| | 178.0 |
| | 1.21 |
| | 80.9 |
| | 29.6 |
| 467.2 |
| | 3.18 |
| | 178.1 |
| | 1.21 |
| | 70.5 |
| | 26.1 |
|
| Fund VI | 246.3 |
| | 2.43 |
| | 6.1 |
| | 0.06 |
| | 9.7 |
| | 0.2 |
| 246.3 |
| | 2.43 |
| | 6.1 |
| | 0.06 |
| | 9.7 |
| | 0.2 |
|
| Fund V | 100.0 |
| | 2.67 |
| | 0.5 |
| | 0.01 |
| | 6.3 |
| | — |
| 100.0 |
| | 2.67 |
| | 0.5 |
| | 0.01 |
| | 6.2 |
| | — |
|
| Fund IV | 100.0 |
| | 2.78 |
| | 0.2 |
| | 0.01 |
| | 0.5 |
| | — |
| 100.0 |
| | 2.78 |
| | 0.2 |
| | 0.01 |
| | 0.5 |
| | — |
|
| AION | 151.5 |
| | 18.34 |
| | 50.0 |
| | 6.05 |
| | 86.9 |
| | 28.4 |
| 151.5 |
| | 18.34 |
| | 50.0 |
| | 6.05 |
| | 74.3 |
| | 24.1 |
|
| ANRP I | 426.1 |
| | 32.21 |
| | 10.1 |
| | 0.76 |
| | 110.4 |
| | 2.7 |
| 426.1 |
| | 32.21 |
| | 10.1 |
| | 0.76 |
| | 77.3 |
| | 1.5 |
|
| ANRP II | 481.2 |
| | 14.35 |
| | 58.6 |
| | 1.75 |
| | 402.1 |
| | 47.6 |
| 581.2 |
| | 16.83 |
| | 28.0 |
| | 0.81 |
| | 412.8 |
| | 20.4 |
|
| A.A. Mortgage Opportunities, L.P. | 425.0 |
| | 84.46 |
| | — |
| | — |
| | 51.0 |
| | — |
| 425.0 |
| | 84.46 |
| | — |
| | — |
| | — |
| | — |
|
| Apollo Rose, L.P. | 299.1 |
| | 100.00 |
| | — |
| | — |
| | 134.8 |
| | — |
| 299.1 |
| | 100.00 |
| | — |
| | — |
| | 99.0 |
| | — |
|
| Champ, L.P. | 115.7 |
| | 100.00 |
| | 19.1 |
| | 16.55 |
| | 39.2 |
| | 2.0 |
| 122.0 |
| | 100.00 |
| | 19.5 |
| | 15.98 |
| | 12.4 |
| | 2.1 |
|
| Apollo Royalties Management, LLC | 104.3 |
| | 100.00 |
| | — |
| | — |
| | — |
| | — |
| 108.6 |
| | 100.00 |
| | — |
| | — |
| | — |
| | — |
|
| Other Private Equity | 7.5 |
| | Various |
| | 7.5 |
| | Various |
| | 5.0 |
| | 5.0 |
| 140.6 |
| | Various |
| | 10.6 |
| | Various |
| | 36.1 |
| | 1.7 |
|
| Credit: | | | | | | | | | | | | | | | | | | | | | | |
| COF III | 358.1 |
| | 10.45 |
| | 83.1 |
| | 2.43 |
| | 55.6 |
| | 13.3 |
| |
| COF II | 30.5 |
| | 1.93 |
| | 23.4 |
| | 1.48 |
| | 0.8 |
| | 0.6 |
| |
| Credit Opportunity Fund, L.P. (“COF I”) | 449.2 |
| | 30.26 |
| | 29.7 |
| | 2.00 |
| | 237.1 |
| | 4.2 |
| |
EPF II(2) | 427.7 |
| | 12.70 |
| | 63.0 |
| | 1.88 |
| | 143.8 |
| | 24.5 |
| |
| Apollo Credit Opportunity Fund III, L.P. (“COF III”) | | 358.1 |
| | 10.45 |
| | 83.1 |
| | 2.43 |
| | 95.0 |
| | 22.6 |
|
| Apollo Credit Opportunity Fund II, L.P. (“COF II”) | | 30.5 |
| | 1.93 |
| | 23.4 |
| | 1.48 |
| | — |
| | — |
|
| Apollo Credit Opportunity Fund I, L.P. (“COF I”) | | 449.2 |
| | 30.26 |
| | 29.7 |
| | 2.00 |
| | 237.1 |
| | 4.2 |
|
Apollo European Principal Finance Fund III, L.P. (“EPF III”)(2) | | 528.5 |
| | 12.37 |
| | 94.7 |
| | 2.22 |
| | 528.5 |
| | 94.7 |
|
Apollo European Principal Finance Fund II, L.P. (“EPF II”)(2) | | 412.2 |
| | 11.80 |
| | 63.8 |
| | 1.83 |
| | 101.7 |
| | 19.3 |
|
Apollo European Principal Finance Fund, L.P. (“EPF I”)(2) | 300.9 |
| | 20.74 |
| | 19.8 |
| | 1.37 |
| | 49.4 |
| | 4.6 |
| 317.4 |
| | 20.74 |
| | 20.9 |
| | 1.37 |
| | 51.6 |
| | 4.8 |
|
| FCI II | 244.6 |
| | 15.72 |
| | — |
| | — |
| | 66.2 |
| | — |
| |
| Financial Credit Investment, L.P. (“FCI”) | 95.3 |
| | 17.05 |
| | — |
| | — |
| | 56.2 |
| | — |
| |
| SCRF III | 230.2 |
| | 18.59 |
| | 3.6 |
| | 0.29 |
| | 83.1 |
| | 1.3 |
| |
| Apollo Structured Credit Recovery Master Fund II, Ltd. (“SCRF II”) | 7.8 |
| | 7.47 |
| | — |
| | — |
| | — |
| | — |
| |
| Financial Credit Investment III, L.P. (“FCI III”) | | 224.3 |
| | 11.76 |
| | 0.1 |
| | 0.01 |
| | 217.7 |
| | 0.1 |
|
| Financial Credit Investment II, L.P. (“FCI II”) | | 244.6 |
| | 15.73 |
| | — |
| | — |
| | 122.0 |
| | — |
|
| Financial Credit Investment I, L.P. (“FCI I”) | | 95.3 |
| | 17.05 |
| | — |
| | — |
| | 60.5 |
| | — |
|
| Apollo Structured Credit Recovery Master Fund III, L.P. (“SCRF III”) | | 230.2 |
| | 18.59 |
| | 3.6 |
| | 0.29 |
| | 121.3 |
| | 1.9 |
|
| MidCap | 1,672.6 |
| | 80.23 |
| | 110.9 |
| | 5.32 |
| | 379.0 |
| | 31.0 |
| 1,672.6 |
| | 80.23 |
| | 110.9 |
| | 5.32 |
| | 229.0 |
| | 31.0 |
|
| Apollo Moultrie Credit Fund, L.P. | 400.0 |
| | 100.00 |
| | — |
| | — |
| | 300.0 |
| | — |
| 400.0 |
| | 100.00 |
| | — |
| | — |
| | 160.0 |
| | — |
|
| Apollo/Palmetto Short-Maturity Loan Portfolio, L.P. | 300.0 |
| | 100.00 |
| | — |
| | — |
| | — |
| | — |
| 300.0 |
| | 100.00 |
| | — |
| | — |
| | — |
| | — |
|
| APC | 158.5 |
| | 69.06 |
| | 0.1 |
| | 0.04 |
| | 56.4 |
| | — |
| |
| AEOF | 125.5 |
| | 12.01 |
| | 25.5 |
| | 2.44 |
| | 77.0 |
| | 15.7 |
| |
| Apollo Asia Private Credit Fund, L.P. (“APC”) | | 158.5 |
| | 69.06 |
| | 0.1 |
| | 0.04 |
| | — |
| | — |
|
| Apollo Energy Opportunity Fund, L.P. (“AEOF”) | | 5.4 |
| | 0.52 |
| | 4.9 |
| | 0.47 |
| | 3.9 |
| | 3.6 |
|
AGER(2) | | 177.2 |
| | 6.90 |
| | 147.7 |
| | 5.75 |
| | 177.2 |
| | 147.7 |
|
| Other Credit | 359.1 |
| | Various |
| | 191.0 |
| | Various |
| | 265.9 |
| | 103.3 |
| 507.8 |
| | Various |
| | 229.8 |
| | Various |
| | 282.9 |
| | 104.5 |
|
| Real Estate: | | | | | | | | | | | | |
| Real Assets: | | | | | | | | | | | | |
| U.S. RE Fund II | 352.5 |
| | Various |
| | 7.6 |
| | Various |
| | 150.0 |
| | 3.5 |
| 400.4 |
| (3) | 46.44 |
| | 4.7 |
| | 0.55 |
| | 216.2 |
| | 2.6 |
|
| U.S. RE Fund I | 434.7 |
| (1) | 68.08 |
| | 16.6 |
| | 2.48 |
| | 127.6 |
| | 3.2 |
| 434.9 |
| (3) | 66.47 |
| | 16.6 |
| | 2.54 |
| | 123.9 |
| | 2.8 |
|
| CPI Capital Partners North America, L.P. | 7.6 |
| | 1.27 |
| | 2.1 |
| | 0.35 |
| | 0.6 |
| | 0.2 |
| 7.6 |
| | 1.27 |
| | 2.1 |
| | 0.35 |
| | 0.6 |
| | 0.2 |
|
CPI Capital Partners Europe, L.P.(2) | 6.1 |
| | 0.47 |
| | — |
| | — |
| | 0.5 |
| | — |
| 6.5 |
| | 0.47 |
| | — |
| | — |
| | 0.5 |
| | — |
|
| CPI Capital Partners Asia Pacific, L.P. | 6.9 |
| | 0.53 |
| | 0.5 |
| | 0.04 |
| | 0.1 |
| | — |
| 6.9 |
| | 0.53 |
| | 0.5 |
| | 0.04 |
| | 0.1 |
| | — |
|
| Apollo Asia Real Estate Fund, L.P. | 206.9 |
| | 73.39 |
| | 6.9 |
| | 2.44 |
| | 206.5 |
| | 6.9 |
| |
| Other Real Estate | 266.2 |
| | Various |
| | 1.7 |
| | Various |
| | 12.0 |
| | 0.5 |
| |
| Asia RE Fund | | 455.9 |
| (3) | 77.47 |
| | 8.4 |
| | 1.42 |
| | 344.0 |
| | 6.3 |
|
| Other Real Assets | | 79.4 |
| | Various |
| | 1.7 |
| | Various |
| | 11.5 |
| | 0.3 |
|
| Other: | | | | | | | | | | | | | | | | | | | | | | |
| Apollo SPN Investments I, L.P. | 34.5 |
| | 0.86 |
| | 34.5 |
| | 0.86 |
| | 30.1 |
| | 30.1 |
| 12.4 |
| | 0.31 |
| | 12.4 |
| | 0.31 |
| | 7.6 |
| | 7.6 |
|
| Total | $ | 10,942.8 |
| | | | $ | 1,342.5 |
| | | | $ | 3,969.9 |
| | $ | 548.3 |
| $ | 14,074.4 |
| | | | $ | 2,380.2 |
| | | | $ | 6,322.4 |
| | $ | 1,504.2 |
|
| |
| (1) | Apollo Only (Excluding Related Party) Remaining Commitments related to Fund IX are subject to future syndication to Apollo employees. |
| |
| (2) | Apollo’s commitment in these funds is denominated in Euros and translated into U.S. dollars at an exchange rate of €1.00 to $1.18 as of September 30, 2017. |
| |
| (3) | Figures for U.S. RE Fund I include base, additional, and co-investment commitments. A co-investment vehicle within U.S. RE Fund I is denominated in pound sterling and translated into U.S. dollars at an exchange rate of £1.00 to $1.30$1.34 as of September 30, 2016.2017. Figures for U.S. RE Fund II and Asia RE Fund include co-investment commitments. |
| |
(2) | Apollo’s commitment in these funds is denominated in Euros and translated into U.S. dollars at an exchange rate of €1.00 to $1.12 as of September 30, 2016. |
Apollo has an ongoing obligation to acquire additional common units of AAA in an amount equal to 25% of the aggregate after-tax cash distributions, if any, that are made by AAA to the Company pursuant to the carried interest distribution rights that are applicable to investments made through AAA Investments. In addition, onOn April 30, 2015, Apollo entered into the AAA Investments Credit Agreement. Under the terms of the AAA Investments Credit Agreement the Company shall make available to AAA Investments one or more advances at the discretion of AAA Investments in the aggregate amount not to exceed a balance of $10.0 million at an applicable rate of LIBOR plus 1.5%(see note 13 for further disclosure regarding this facility). The Company receives an annual commitment fee of 0.125% on the unused portion of the loan. As of September 30, 2016, no advance on the AAA Investments Credit Agreement was made by the Company.
The 2013 AMH Credit Facilities, 2024 Senior Notes and 2026 Senior Notes will have future impacts on our cash uses. See note 9 of our condensed consolidated financial statements for information regarding the Company’s debt arrangements.
In accordance with the Shareholders Agreement, we have indemnified the Managing Partners and certain Contributing Partners (at varying percentages) for any carried interest income distributed from Fund IV, Fund V and Fund VI that is subject to contingent repayment by the general partner. The Company recorded an indemnification liability of $5.1 million and $4.6 million, respectively, as of September 30, 2016 and December 31, 2015.
Contingent ObligationsObligation——Carried interest income inwith respect to private equity funds and certain credit and real estateassets funds is subject to reversal in the event of future losses to the extent of the cumulative carried interest recognized in income to date. If all of the existing investments became worthless, the amount of cumulative revenues recognized by Apollo through September 30, 2016 that would be reversed approximates $2.7 billion. Management views the possibility of all of the investments becoming worthless as remote. Carried interest income is affected by changes in the fair values of the underlying investments in the funds that Apollo manages. Valuations, on an unrealized basis, can be significantly affected by a variety of external factors including, but not limited to, bond yields and industry trading multiples. Movements in these items can affect valuations quarter to quarter even if the underlying business fundamentals remain stable.
Additionally, at the end of the life of certain funds that the Company manages, there could be a payment due to a fund by the Company if the Company as general partner has received more carried interest income than was ultimately earned. This general partner obligation amount, if any, will depend on final realized values of investments at the end of the life of each fund or as otherwise set forth in the respective limited partnership agreement or other governing document of the fund. As of September 30, 2016, the Company recorded a general partner obligation to return previously distributed carried interest income of $134.9 million. See note 1214 to theour condensed consolidated financial statements for further information regardinga description of our contingent obligation.
One of the general partner obligation.Company’s subsidiaries, AGS, provides underwriting commitments in connection with securities offerings to the portfolio companies of the funds Apollo manages. As of September 30, 2017, there were no underwriting commitments outstanding related to such offerings.
As of September 30, 2016,2017, one of the Company’s subsidiaries had an unfunded contingent commitmentcommitments of $80.3$29.8 million, to facilitate funding at closing by a lead arrangerarrangers for a syndicated term loanloans issued by a portfolio companycompanies of a fundfunds managed by Apollo. The commitment expirescommitments expired on November 11, 2016. As of November 4, 2016, the unfunded commitment was approximately $4.6 million.2, 2017.
| |
| ITEM 3. | QUANTITATIVE AND QUALITATIVE DISCLOSURES ABOUT MARKET RISK |
Our predominant exposure to market risk is related to our role as investment manager and general partner for our funds and the sensitivity to movements in the fair value of their investments and resulting impact on carried interest income and management fee revenues. Our direct investments in the funds also expose us to market risk whereby movements in the fair values of the underlying investments will increase or decrease both net gains (losses) from investment activities and income (loss) from equity method investments. For a discussion of the impact of market risk factors on our financial instruments see “Item 2. Management’s Discussion and Analysis of Financial Condition and Results of Operations—Critical Accounting Policies—Investments, at Fair Value.”
The fair value of our financial assets and liabilities of our funds may fluctuate in response to changes in the value of investments, foreign exchange, commodities and interest rates. The net effect of these fair value changes impacts the gains and losses from investments in our condensed consolidated statements of operations. However, the majority of these fair value changes are absorbed by the Non-Controlling Interests.
The Company is subject to a concentration risk related to the investors in its funds. Although there are more than 1,000 investors in Apollo’s active private equity, credit and real estateassets funds, no individual investor accounts for more than 10% of the total committed capital to Apollo’s active funds.
Risks are analyzed across funds from the “bottom up” and from the “top down” with a particular focus on asymmetric risk. We gather and analyze data, monitor investments and markets in detail, and constantly strive to better quantify, qualify and circumscribe relevant risks.
Each risk management process is subject to our overall risk tolerance and philosophy and our enterprise-wide risk management framework. This framework includes identifying, measuring and managing market, credit and operational risks at each segment, as well as at the fund and Company level.
Each segment runs its own investment and risk management process subject to our overall risk tolerance and philosophy:
The investment process of our private equity funds involves a detailed analysis of potential acquisitions, and investment management teams assigned to monitor the strategic development, financing and capital deployment decisions of each portfolio investment.
Our credit funds continuously monitor a variety of markets for attractive trading opportunities, applying a number of traditional and customized risk management metrics to analyze risk related to specific assets or portfolios, as well as, fund-wide risks.
At the direction of the Company’s manager, the Company has established a risk committee comprised of various members of senior management including the Company’s Chief Financial Officer, Chief Legal Officer, and the Company’s Chief Risk Officer. The risk committee is tasked with assisting the Company’s manager in monitoring and managing enterprise-wide
risk. The risk committee generally meets on a monthlyquarterly basis and reports to the executive committeesenior management of the Company’s manager at such times as the committee deems appropriate and at least on an annual basis.
On at least a monthly basis, the Company’s risk department provides a summary analysis of fund level market and credit risk to the portfolio managers of the Company’s funds and the heads of the various business segments. On a periodic basis, the Company’s risk department presents a consolidated summary analysis of fund level market and credit risk to the Company’s risk committee. In addition, the Company’s Chief Risk Officer reviews specific investments from the perspective of risk mitigation and discusses such analysis with the Company’s risk committee and/or the executive committee of the Company’s manager at such times as the Company’s Chief Risk Officer determines such discussions are warranted. On an annual basis, the Company’s Chief Risk Officer provides the executive committeesenior management of the Company’s manager with a comprehensive overview of risk management along with an update on current and future risk initiatives.
Impact on Management Fees—Our management fees are based on one of the following:
capital commitments to an Apollo fund;
capital invested in an Apollo fund;
the gross, net or adjusted asset value of an Apollo fund, as defined; or
as otherwise defined in the respective agreements.
Management fees could be impacted by changes in market risk factors and management could consider an investment permanently impaired as a result of (i) such market risk factors causing changes in invested capital or in market values to below cost, in the case of our private equity funds and certain credit funds or (ii) such market risk factors causing changes in gross or net asset value, for the credit funds. The proportion of our management fees that are based on NAV is dependent on the number and types of our funds in existence and the current stage of each fund’s life cycle.
Impact on Advisory and Transaction Fees—We earn transaction fees relating to the negotiation of private equity, credit and real estateassets transactions and may obtain reimbursement for certain out-of-pocket expenses incurred. Subsequently, on a quarterly or annual basis, ongoing advisory fees, and additional transaction fees in connection with additional purchases, dispositions, or follow-on transactions, may be earned. Management Fee Offsets and any broken deal costs, if applicable, are reflected as a reduction to advisory and transaction fees from related parties, net.parties. Advisory and transaction fees will be impacted by changes in market risk factors to the extent that they limit our opportunities to engage in private equity, credit and real estateassets transactions or impair our ability to consummate such transactions. The impact of changes in market risk factors on advisory and transaction fees is not readily predicted or estimated.
Impact on Carried Interest Income—We earn carried interest income from our funds as a result of such funds achieving specified performance criteria. Our carried interest income will be impacted by changes in market risk factors. However, several major factors will influence the degree of impact:
the performance criteria for each individual fund in relation to how that fund’s results of operations are impacted by changes in market risk factors;
whether such performance criteria are annual or over the life of the fund;
to the extent applicable, the previous performance of each fund in relation to its performance criteria; and
whether each funds’ carried interest distributions are subject to contingent repayment.
As a result, the impact of changes in market risk factors on carried interest income will vary widely from fund to fund. The impact is heavily dependent on the prior and future performance of each fund, and therefore is not readily predicted or estimated.
Market Risk—We are directly and indirectly affected by changes in market conditions. Market risk generally represents the risk that values of assets and liabilities or revenues and expenses will be adversely affected by changes in market conditions. Market risk is inherent in each of our investments and activities, including equity investments, loans, short-term borrowings, long-term debt, hedging instruments, credit default swaps and derivatives. Just a few of the market conditions that may shift from time to time, thereby exposing us to market risk, include fluctuations in interest and currency exchange rates, equity prices, changes in the implied volatility of interest rates and price deterioration. Volatility in debt and equity markets can impact our pace of capital deployment, the timing of receipt of transaction fee revenues and the timing of realizations. These market conditions could have an impact on the value of fund investments and rates of return. Accordingly, depending on the instruments or activities impacted, market risks can have wide ranging, complex adverse effects on our results from operations and our overall financial condition.
We monitor market risk using certain strategies and methodologies which management evaluates periodically for appropriateness. We intend to continue to monitor this risk going forward and continue to monitor our exposure to all market factors.
Interest Rate Risk—Interest rate risk represents exposure we and our funds have to instruments whose values vary with the change in interest rates. These instruments include, but are not limited to, loans, borrowings, investments in interest bearing securities and derivative instruments. We may seek to mitigate risks associated with the exposures by having our funds take offsetting positions in derivative contracts. Hedging instruments allow us to seek to mitigate risks by reducing the effect of movements in the level of interest rates, changes in the shape of the yield curve, as well as, changes in interest rate volatility. Hedging instruments used to mitigate these risks may include related derivatives such as options, futures and swaps.
Credit Risk—Certain of our funds are subject to certain inherent risks through their investments.
Certain of our entities invest substantially all of their excess cash in open-end money market funds and money market demand accounts, which are included in cash and cash equivalents. The money market funds invest primarily in government securities and other short-term, highly liquid instruments with a low risk of loss. We continually monitor the funds’ performance in order to manage any risk associated with these investments.
Certain of our funds hold derivative instruments that contain an element of risk in the event that the counterparties may be unable to meet the terms of such agreements. We seek to minimize our risk exposure by limiting the counterparties with which our funds enter into contracts to banks and investment banks who meet established credit and capital guidelines. As of September 30, 2016,2017, we do not expect any counterparty to default on its obligations and therefore do not expect to incur any loss due to counterparty default.
Foreign Exchange Risk—Foreign exchange risk represents exposures our funds have to changes in the values of current fund holdings and future cash flows denominated in other currencies and investments in non-U.S. companies. The types of investments exposed to this risk include investments in foreign subsidiaries, foreign currency-denominated loans, foreign currency-denominated transactions, and various foreign exchange derivative instruments whose values fluctuate with changes in currency exchange rates or foreign interest rates. Instruments used to mitigate this risk are foreign exchange options, currency swaps, futures and forwards. These instruments may be used to help insulate our funds against losses that may arise due to volatile movements in foreign exchange rates and/or interest rates.
In our capacity as investment manager of the funds we manage, we continuously monitor a variety of markets for attractive opportunities for managing risk. For example, certain of the funds we manage may put in place foreign exchange hedges or borrowings with respect to certain foreign currency denominated investments to provide a hedge against foreign exchange exposure.
Non-U.S. Operations—We conduct business throughout the world and are continuing to expand into foreign markets. We currently have offices outside the U.S. in Toronto, London, Frankfurt, Madrid, Luxembourg, Mumbai, Delhi, Singapore, Hong Kong and Shanghai and have been strategically growing our international presence. Our fund investments and our revenues are primarily derived from our U.S. operations. With respect to our non-U.S. operations, we are subject to risk of loss from currency fluctuations, social instability, changes in governmental policies or policies of central banks, expropriation, nationalization, unfavorable political and diplomatic developments and changes in legislation relating to non-U.S. ownership. Our funds also invest in the securities of companies which are located in non-U.S. jurisdictions. As we continue to expand globally, we will continue to focus on monitoring and managing these risk factors as they relate to specific non-U.S. investments.
| |
| ITEM 4. | CONTROLS AND PROCEDURES |
We maintain “disclosure controls and procedures”, as such term is defined in Rules 13a-15(e) and 15d-15(e) under the Exchange Act, that are designed to ensure that information required to be disclosed by us in reports that we file or submit under the Exchange Act is recorded, processed, summarized and reported within the time periods specified in Securities and Exchange Commission rules and forms, and that such information is accumulated and communicated to our management, including our Chief Executive Officer and Chief Financial Officer, as appropriate, to allow timely decisions regarding required disclosure. In designing disclosure controls and procedures, our management necessarily was required to apply its judgment in evaluating the cost-benefit relationship of possible disclosure controls and procedures. The design of any disclosure controls and procedures also is based in part upon certain assumptions about the likelihood of future events, and there can be no assurance that any design will succeed in achieving its stated goals under all potential future conditions. Any controls and procedures, no matter how well designed and operated, can provide only reasonable assurance of achieving the desired objectives.
Our management, including our Chief Executive Officer and Chief Financial Officer, evaluated the effectiveness of our disclosure controls and procedures pursuant to Rule 13a-15 under the Exchange Act as of the end of the period covered by this report. Based on that evaluation, our Chief Executive Officer and Chief Financial Officer have concluded that, as of the end
of the period covered by this report, our disclosure controls and procedures (as defined in Rule 13a-15(e) under the Exchange Act) are effective at the reasonable assurance level to accomplish their objectives of ensuring that information we are required to disclose in reports that we file or submit under the Exchange Act is recorded, processed, summarized and reported within the time periods specified in Securities and Exchange Commission rules and forms, and that such information is accumulated and communicated to our management, including our Chief Executive Officer and Chief Financial Officer, as appropriate, to allow timely decisions regarding required disclosure.
No changes in our internal control over financial reporting (as such term is defined in Rules 13a–15(f) and 15d–15(f) under the Exchange Act) occurred during our most recent quarter, that have materially affected, or are reasonably likely to materially affect, our internal control over financial reporting.
PART II—OTHER INFORMATION
See note 1314 to our condensed consolidated financial statements for a summary of the Company’s legal proceedings.
ITEM 1A.RISK FACTORS
For a discussion of our potential risks and uncertainties, see the information under the heading "Risk Factors" in our 2016 Annual Report, on Form 10-K for the year ended December 31, 2015 filed with the SEC on February 29, 2016, which is accessible on the Securities and Exchange Commission's website at www.sec.gov. There have been no material changes to the risk factors for the three months ended September 30, 2016.2017.
The risks described in our Form 10-K2016 Annual Report are not the only risks facing us. Additional risks and uncertainties not currently known to us or that we currently deem to be immaterial also may materially adversely affect our business, financial condition and/ or operating results.
| |
| ITEM 2. | UNREGISTERED SALE OF EQUITY SECURITIES |
On August 5, 2016,4, 2017 we issued 435,787233,248 Class A shares, net of taxes to Apollo Management Holdings, L.P., a subsidiary of Apollo Global Management, LLC, in connection with deliveriesissuances of shares to participants in the Company’s 2007 Omnibus Equity Incentive Plan (the “2007 Equity Plan”) for an aggregate purchase price of $7,892,103.$6.7 million, respectively. The issuance was exempt from registration under the Securities Act in accordance with Section 4(a)(2) and Rule 506(b) thereof, as transactions by the issuer not involving a public offering. We determined that the purchaser of Class A shares in the transactions, Apollo Management Holdings, L.P., was an accredited investor.
Issuer Purchases of Equity Securities
The following table sets forth purchases of our Class A shares made by us or on our behalf during the fiscal quarter ended September 30, 2016.2017.
|
| | | | | | | |
| Period | | Total Number of Class A Shares Purchased(1) | | Average Price
Paid per Share |
| July 1, 2016 through July 31, 2016 | | — |
| | $ | — |
|
| August 1, 2016 through August 31, 2016 | | 436 |
| | 18.15 |
|
| September 1, 2016 through September 30, 2016 | | — |
| | — |
|
| Total | | 436 |
| |
|
|
| | | | | | | | | | | | | | |
| Period | | Total Number of Class A Shares Purchased(1) | | Average Price Paid per Share | | Class A Shares Purchased as Part of Publicly Announced Plans or Programs | | Approximate Dollar Value of Units that May be Purchased Under the Plan or Programs |
| July 1, 2017 through July 31, 2017 | | — |
| | $ | — |
| | — |
| | $ | 137,062,230 |
|
| August 1, 2017 through August 31, 2017 | | 381,715 |
| | 29.35 |
| | 233,248 |
| | 130,216,401 |
|
| September 1, 2017 through September 30, 2017 | | — |
| | — |
| | — |
| | 130,216,401 |
|
| Total | | 381,715 |
| | | | 233,248 |
| | |
| |
| (1) | During the fiscal quarter ended September 30, 2016,2017, we repurchased 148,467 Class A shares at an average price paid per share of $29.35 in open-market transactions not pursuant to a publicly-announced repurchase plan or program. Such number of our Class A shares was equal to the number of Class A restricted shares issued under our equity incentive planthe 2007 Equity Plan during the quarter. All such repurchases were made in open-market transactions not pursuant to a publicly-announced repurchase plan or program. |
In February 2016, the Company announced its adoption of a program to repurchase up to $250 million in the aggregate of its Class A shares, including up to $150 million in the aggregate of its outstanding Class A shares through a share repurchase program and up to $100 million through a reduction of Class A shares to be issued to employees to satisfy associated tax obligations in connection with the settlement of equity-based awards granted under the 2007 Equity Plan, which we refer to as net share settlement. Under the share repurchase program, shares may be repurchased from time to time in open market transactions, in privately negotiated transactions or otherwise, with the size and timing of these repurchases depending on legal requirements, price, market and economic conditions and other factors. The Company expects that the share repurchase program, which has no expiration date, will be in effect until the maximum approved dollar amount has been used to repurchase Class A shares. The share
repurchase program does not require the Company to repurchase any specific number of Class A shares, and the share repurchase program may be suspended, extended, modified or discontinued at any time. Reductions of Class A shares issued to employees to satisfy associated tax obligations in connection with the settlement of equity-based awards granted under the 2007 Equity Plan are not included in the table. There were no share repurchases made as part of the share repurchase program during the three months ended September 30, 2016 and as of September 30, 2016, the approximate dollar value of Class A shares that may be purchased under the program is $137.1 million.
| |
| ITEM 3. | DEFAULTS UPON SENIOR SECURITIES |
Not applicable.
| |
| ITEM 4. | MINE SAFETY DISCLOSURES |
Not applicable.
None.
|
| | |
Exhibit Number | | Exhibit Description |
| | |
| 3.1 | |
|
| | |
| 3.2 | | |
| | |
| 4.1 | | |
| | | |
| 4.2 | | |
| | | |
| 4.3 | | |
| | | |
| 4.4 | | |
| | |
| 4.5 | | |
| | | |
| 4.6 | | |
| | | |
| 4.7 | |
|
| | | |
| 4.8 | | |
| | |
| 4.9 | | |
| | |
|
| | |
Exhibit Number | | Exhibit Description |
| |
| 10.1 | | |
| | |
| 10.2 | | Third |
| |
|
| | |
Exhibit
Number
| | Exhibit Description |
| | |
| 10.3 | | Third |
| | |
| 10.4 | | Third |
| | |
| 10.5 | | Third |
| | |
| +10.6 | | |
| | |
| 10.7 | | Agreement Among Principals, dated as of July 13, 2007, by and among Leon D. Black, Marc J. Rowan, Joshua J. Harris, Black Family Partners, L.P., MJR Foundation LLC, AP Professional Holdings, L.P. and BRH Holdings, L.P. (incorporated by reference to Exhibit 10.9 to the Registrant’s Registration Statement on Form S-1 (File No. 333-150141)). |
| | |
| 10.8 | | Shareholders Agreement, dated as of July 13, 2007, by and among Apollo Global Management, LLC, AP Professional Holdings, L.P., BRH Holdings, L.P., Black Family Partners, L.P., MJR Foundation LLC, Leon D. Black, Marc J. Rowan and Joshua J. Harris (incorporated by reference to Exhibit 10.10 to the Registrant’s Registration Statement on Form S-1 (File No. 333-150141)). |
| | |
| 10.9 | | FourthFifth Amended and Restated Exchange Agreement, dated as of May 5, 2016,April 28, 2017, by and among Apollo Global Management, LLC, Apollo Principal Holdings I, L.P., Apollo Principal Holdings II, L.P., Apollo Principal Holdings III, L.P., Apollo Principal Holdings IV, L.P., Apollo Principal Holdings V, L.P., Apollo Principal Holdings VI, L.P., Apollo Principal Holdings VII, L.P., Apollo Principal Holdings VIII, L.P., Apollo Principal Holdings IX, L.P., Apollo Principal Holdings X, L.P., Apollo Principal Holdings XI, LLC, Apollo Principal Holdings XII, L.P., AMH Holdings (Cayman), L.P. and the Apollo Principal Holders (as defined therein) from time to time party thereto (incorporated by reference to Exhibit 10.9 to the Registrant’s Form 10-Q for the period ended March 31, 20162017 (File No. 001-35107)). |
| | |
| 10.10 | | Amended and Restated Tax Receivable Agreement, dated as of May 6, 2013, by and among APO Corp., Apollo Principal Holdings II, L.P., Apollo Principal Holdings IV, L.P., Apollo Principal Holdings VI, Apollo Principal Holdings VIII, L.P., AMH Holdings (Cayman), L.P. and each Holder defined therein. (incorporated by reference to Exhibit 10.10 to the Registrant’s Form 10-Q for the period ended June 30, 2016 (File No. 001-35107)). |
| | |
+10.11 | | |
| | | |
+10.12 | | Employment Agreement with Marc J. Rowan (incorporated by reference to Exhibit 10.44 to the Registrant’s Form 10-Q for the period ended June 30, 2012 (File No. 001-35107)). |
| |
+10.13 | | Employment Agreement with Joshua J. Harris (incorporated by reference to Exhibit 10.45 to the Registrant’s Form 10-Q for the period ended June 30, 2012 (File No. 001-35107)). |
| |
10.14 | | Second Amended and Restated Limited Partnership Agreement of Apollo Principal Holdings V, L.P. dated as of April 14, 2010 (incorporated by reference to Exhibit 10.20 to the Registrant’s Registration Statement on Form S-1 (File No. 333-150141)). |
|
| | |
Exhibit Number | | Exhibit Description |
| | |
| 10.12 | | |
| | |
| 10.13 | | |
| |
| 10.14 | | |
| | |
| 10.15 | | Second |
| | |
| 10.16 | | Second |
| | |
| 10.17 | | Second |
| | |
| 10.18 | | Second |
| | |
| 10.19 | | |
| | | |
| 10.20 | | |
| | | |
| 10.21 | | |
| | |
| 10.22 | | |
| | |
10.2210.23 | | Settlement Agreement, dated December 14, 2008, by and among Huntsman Corporation, Jon M. Huntsman, Peter R. Huntsman, Hexion Specialty Chemicals, Inc., Hexion LLC, Nimbus Merger Sub, Inc., Craig O. Morrison, Leon Black, Joshua J. Harris and Apollo Global Management, LLC and certain of its affiliates (incorporated by reference to Exhibit 10.26 to the Registrant’s Registration Statement on Form S-1 (File No. 333-150141)). |
| |
|
| | |
Exhibit Number | | Exhibit Description |
| | |
10.2310.24 | | First Amendment and Joinder, dated as of August 18, 2009, to the Shareholders Agreement, dated as of July 13, 2007, by and among Apollo Global Management, LLC, AP Professional Holdings, L.P., BRH Holdings, L.P., Black Family Partners, L.P., MJR Foundation LLC, Leon D. Black, Marc J. Rowan and Joshua J. Harris (incorporated by reference to Exhibit 10.27 to the Registrant’s Registration Statement on Form S-1 (File No. 333-150141)). |
| | | |
10.2410.25 | | Joinder, dated as of May 5, 2016, to the Shareholders Agreement, dated as of July 13, 2007, as amended by the First Amendment and Joinder dated as of August 18, 2009, by and among Apollo Global Management, LLC, AP Professional Holdings, L.P., BRH Holdings, L.P., Black Family Partners, L.P., MJR Foundation LLC, MJH Partners, L.P., Leon D. Black, Marc J. Rowan and Joshua J. Harris, and, solely in connection with Article VII of the Agreement, APO Corp., APO Asset Co., LLC, APO (FC), LLC, Apollo Principal Holdings I, L.P., Apollo Principal Holdings II, L.P., Apollo Principal Holdings III, L.P., Apollo Principal Holdings IV, L.P., Apollo Principal Holdings V, L.P., Apollo Principal Holdings VI, L.P., Apollo Principal Holdings VII, L.P., Apollo Principal Holdings VIII, L.P., Apollo Principal Holdings IX, L.P. and Apollo Management Holdings, L.P. (incorporated by reference to Exhibit 10.24 to the Registrant’s Form 10-Q for the period ended March 31, 2016 (File No. 001-35107)). |
| | |
| 10.26 | | Joinder, dated as of May 3, 2017, to the Shareholders Agreement, dated as of July 13, 2007, as amended by the First Amendment and Joinder dated as of August 18, 2009, by and among Apollo Global Management, LLC, AP Professional Holdings, L.P., BRH Holdings, L.P., Black Family Partners, L.P., MJR Foundation LLC, MJH Partners, L.P., Leon D. Black, Marc J. Rowan and Joshua J. Harris, and, solely in connection with Article VII of the Agreement, APO Corp., APO Asset Co., LLC, APO (FC), LLC, Apollo Principal Holdings I, L.P., Apollo Principal Holdings II, L.P., Apollo Principal Holdings III, L.P., Apollo Principal Holdings IV, L.P., Apollo Principal Holdings V, L.P., Apollo Principal Holdings VI, L.P., Apollo Principal Holdings VII, L.P., Apollo Principal Holdings VIII, L.P., Apollo Principal Holdings IX, L.P. and Apollo Management Holdings, L.P. and as supplemented by the Joinder dated as of May 5, 2016, by and among Apollo Principal Holdings X, L.P., AMH Holdings (Cayman), L.P., Apollo Principal Holdings XI, LLC, APO (FC II), LLC and APO UK (FC), Limited (incorporated by reference to Exhibit 10.26 to the Registrant’s Form 10-Q for the period ended March 31, 2017 (File No. 001-35107)). |
| | |
10.2510.27 | | |
|
| | |
Exhibit
Number
| | Exhibit Description |
| |
| | |
+10.2610.28 | | |
| | |
+10.2710.29 | | |
| | |
+10.2810.30 | | |
| | |
+10.2910.31 | | |
| | |
+10.3010.32 | | |
|
| | |
Exhibit Number | | Exhibit Description |
| |
| | |
+10.3110.33 | | |
| | |
+10.3210.34 | | |
| | |
+10.3310.35 | | |
| | |
10.3410.36 | | |
| | |
+10.3510.37 | | |
| | |
| *+10.38 | | |
| | |
10.3610.39 | | Second |
| | | |
+10.3710.40 | | |
| |
|
| | |
Exhibit
Number
| | Exhibit Description |
| | |
+10.3810.41 | | |
| | | |
+10.3910.42 | | |
| | | |
+10.4010.43 | | |
| | | |
+10.4110.44 | | |
| | | |
+10.42 |
| | |
Exhibit Number | | Exhibit Description |
| |
| +10.45 | | |
| | | |
+10.4310.46 | | |
| | | |
+10.4410.47 | | |
| | | |
+10.4510.48 | | |
| | | |
10.4610.49 | | Credit Agreement, dated as of December 18, 2013, by and among Apollo Management Holdings, L.P., as the Term Facility Borrower and a Revolving Facility Borrower, the other Revolving Facility Borrowers party thereto, the other guarantors party thereto from time to time, the lenders party thereto from time to time, the issuing banks party thereto from time to time and JPMorgan Chase Bank, N.A., as administrative agent (incorporated by reference to Exhibit 10.50 to the Registrant’s Form 10-K for the period ended December 31, 2013 (File No. 001-35107)). |
| | | |
10.4710.50 | | Guarantor Joinder Agreement, dated as of January 30, 2015, by Apollo Principal Holdings X, L.P. to the Credit Agreement, dated as of December 18, 2013, by and among Apollo Management Holdings, L.P., as the Term Facility Borrower and a Revolving Facility Borrower, the other Revolving Facility Borrowers party thereto, the existing guarantors party thereto, the lenders party thereto from time to time, the issuing banks party thereto from time to time and JPMorgan Chase Bank, N.A., as administrative agent (incorporated by reference to Exhibit 10.49 to the Registrant’s Form 10-Q for the period ended March 31, 2015 (File No. 001-35107)). |
| | | |
|
| | |
Exhibit
Number
10.51 | | Exhibit Description |
| |
10.48 | | Guarantor Joinder Agreement, dated as of February 1, 2016, by Apollo Principal Holdings XI, LLC to the Credit Agreement, dated as of December 18, 2013, by and among Apollo Management Holdings, L.P., as the Term Facility Borrower and a Revolving Facility Borrower, the other Revolving Facility Borrowers party thereto, the existing guarantors party thereto, the lenders party thereto from time to time, the issuing banks party thereto from time to time and JPMorgan Chase Bank, N.A., as administrative agent (incorporated by reference to Exhibit 10.48 to the Registrant’s Form 10-Q for the period ended March 31, 2016 (File No. 001-35107)). |
| | | |
10.4910.52 | | Amendment No. 1, dated as of March 11, 2016, to the Credit Agreement, dated as of December 18, 2013, among Apollo Management Holdings, L.P., Apollo Management, L.P., Apollo Capital Management, L.P., Apollo International Management, L.P., AAA Holdings, L.P., Apollo Principal Holdings I, L.P., Apollo Principal Holdings II, L.P., Apollo Principal Holdings III, L.P., Apollo Principal Holdings IV, L.P., Apollo Principal Holdings V, L.P., Apollo Principal Holdings VI, L.P., Apollo Principal Holdings VII, L.P., Apollo Principal Holdings VIII, L.P., Apollo Principal Holdings IX L.P., Apollo Principal Holdings X, L.P., Apollo Principal Holdings XI, LLC, ST Holdings GP, LLC and ST Management Holdings, LLC, the guarantors party thereto, the lenders party thereto, the issuing banks party thereto, and JPMorgan Chase Bank, N.A., as administrative agent (incorporated by reference to the Registrant’s Form 8-K filed with the Securities and Exchange Commission on March 15, 2016 (File No. 001-35107)). |
| | |
|
| | |
Exhibit Number | | Exhibit Description |
| |
| 10.53 | | Guarantor Joinder Agreement, dated as of April 13, 2017, by Apollo Principal Holdings XII, L.P. to the Credit Agreement, dated as of December 18, 2013, as supplemented and as amended by Amendment No. 1 to the Credit Agreement dated as of March 11, 2016, among Apollo Management Holdings, L.P., as the Term Facility Borrower and a Revolving Facility Borrower, the other Revolving Facility Borrowers thereto, the existing guarantors party thereto, the lenders party thereto from time to time, the issuing banks party thereto from time to time, and JPMorgan Chase Bank, N.A., as administrative agent (incorporated by reference to Exhibit 10.52 to the Registrant’s Form 10-Q for the period ended March 31, 2017 (File No. 001-35107)). |
| | | |
+10.5010.54 | | |
| | | |
+10.5110.55 | | |
| | | |
+10.5210.56 | | |
| | | |
+10.5310.57 | | |
| | | |
+10.5410.58 | | |
| | | |
+10.5510.59 | | |
| | | |
+10.5610.60 | | |
| | | |
+10.5710.61 | | |
| | |
| +10.62 | | |
| | |
| +10.63 | | |
| | | |
|
| | |
Exhibit Number | | Exhibit Description |
| | |
| +10.64 | | |
| | |
| +10.65 | | |
| | |
| *31.1 | | |
| | |
| *31.2 | | |
| | |
| *32.1 | | |
| | |
| *32.2 | | |
| | |
| *101.INS | | XBRL Instance Document |
| | |
| *101.SCH | | XBRL Taxonomy Extension Scheme Document |
| | |
| *101.CAL | | XBRL Taxonomy Extension Calculation Linkbase Document |
| | |
| *101.DEF | | XBRL Taxonomy Extension Definition Linkbase Document |
| | |
| *101.LAB | | XBRL Taxonomy Extension Label Linkbase Document |
| | |
| *101.PRE | | XBRL Taxonomy Extension Presentation Linkbase Document |
|
| |
| + | Management contract or compensatory plan or arrangement. |
The agreements and other documents filed as exhibits to this report are not intended to provide factual information or other disclosure other than with respect to the terms of the agreements or other documents themselves, and you should not rely on them for that purpose. In particular, any representations and warranties made by us in these agreements or other documents were made solely within the specific context of the relevant agreement or document and may not describe the actual state of affairs as of the date they were made or at any other time.
SIGNATURES
Pursuant to the requirements of the Securities Exchange Act of 1934, the registrant has duly caused this report to be signed on its behalf by the undersigned, thereunto duly authorized.
|
| | | |
| | | | |
| | | Apollo Global Management, LLC |
| | | (Registrant) |
| | | |
Date: November 4, 20163, 2017 | By: | /s/ Martin Kelly |
| | | Name: | Martin Kelly |
| | | Title: | Chief Financial Officer (principal financial officer and authorized signatory) |