UNITED STATES
SECURITIES AND EXCHANGE COMMISSION
WASHINGTON, D.C. 20549
Form 10-Q
(Mark One)
|
| | | | |
| ☒ | QUARTERLY REPORT PURSUANT TO SECTION 13 OR 15(d) OF THE SECURITIES EXCHANGE ACT OF 1934 |
FOR THE QUARTERLY PERIOD ENDED SEPTEMBER 30, 20192020 OR
|
| | | | |
| ☐ | TRANSITION REPORT PURSUANT TO SECTION 13 OR 15(d) OF THE SECURITIES EXCHANGE ACT OF 1934 |
FOR THE TRANSITION PERIOD FROM TO
Commission File Number: 001-35107
APOLLO GLOBAL MANAGEMENT, INC.
(Exact name of Registrant as specified in its charter)
| | 20-8880053 | | | | | | |
| Delaware | | 20-8880053 |
| (State or other jurisdiction of incorporation or organization) | | (I.R.S. Employer Identification No.) |
9 West 57th Street,43rd Floor
New York,New York10019
(Address of principal executive offices) (Zip Code)
(212) (212) 515-3200
(Registrant’s telephone number, including area code)
Indicate by check mark whether the Registrant (1) has filed all reports required to be filed by Section 13 or 15(d) of the Securities Exchange Act of 1934 during the preceding 12 months (or for such shorter period that the Registrant was required to file such reports), and (2) has been subject to such filing requirements for the past 90 days. Yes ☒ No ☐
Indicate by check mark whether the registrant has submitted electronically every Interactive Data File required to be submitted pursuant to Rule 405 of Regulation S-T (§232.405 of this chapter) during the preceding 12 months (or for such shorter period that the registrant was required to submit such files). Yes ☒ No ☐
Indicate by check mark whether the Registrant is a large accelerated filer, an accelerated filer, a non-accelerated filer, a smaller reporting company or an emerging growth company. See the definitions of “large accelerated filer”, “accelerated filer”, “smaller reporting company” and “emerging growth company” in Rule 12b-2 of the Exchange Act.
|
| | | | | | | | | | | | | | | | | | | |
| Large accelerated filer | | ☒ | | Accelerated filer | | ☐ |
| Non-accelerated filer | | ☐ | | Smaller reporting company | | ☐ |
| | | | Emerging growth company | | ☐ |
| If an emerging growth company, indicate by check mark if the registrant has elected not to use the extended transition period for complying with any new or revised financial accounting standards provided pursuant to Section 13(a) of the Exchange Act. | | |
| ☐ |
Indicate by check mark whether the Registrant is a shell company (as defined in Rule 12b-2 of the Exchange Act). Yes ☐ No ☒
Securities registered pursuant to Section 12(b) of the Act:
|
| | | | | | | | | | | | | |
| Title of each class | | Trading Symbol(s) | | Name of each exchange on which registered |
| Class A Common Stock | | APO | | New York Stock Exchange |
| 6.375% Series A Preferred Stock | | APO.PR A | | New York Stock Exchange |
| 6.375% Series B Preferred Stock | | APO.PR B | | New York Stock Exchange |
Securities registered pursuant to Section 12(g) of the Act: None
As of November 4, 20192020 there were 222,462,062228,815,821 shares of Class A common stock, 1 share of Class B common stock and 1 share of Class C common stock of the registrant outstanding.
| | | | | | | | |
| TABLE OF CONTENTS | |
| | Page |
| PART I | | |
| | |
| TABLE OF CONTENTS | |
| | Page |
PART IITEM 1. | | |
| | |
ITEM 1. | | |
| | |
| | |
| | |
| | |
| | |
| | |
| | |
| | |
| | |
| | |
| | |
| | |
| | |
| | |
| | |
| ITEM 1A. | | |
| | |
| ITEM 2. | | |
| | |
| ITEM 3. | | |
| | |
| ITEM 4. | | |
| | |
| PART II | | |
| | |
| ITEM 1. | | |
| | |
| ITEM 1A. | | |
| | |
| ITEM 2. | | |
| | |
| ITEM 3. | | |
| | |
| ITEM 4. | | |
| | |
| ITEM 5. | | |
| | |
| ITEM 6. | | |
| |
| |
Forward-Looking Statements
This quarterly report may contain forward-looking statements that are within the meaning of Section 27A of the Securities Act of 1933, as amended (the “Securities Act”), and Section 21E of the Securities Exchange Act of 1934, as amended (the “Exchange Act”). These statements include, but are not limited to, discussions related to Apollo’s expectations regarding the performance of its business, liquidity and capital resources and the other non-historical statements in the discussion and analysis. These forward-looking statements are based on management’s beliefs, as well as assumptions made by, and information currently available to, management. When used in this quarterly report, the words “believe,” “anticipate,” “estimate,” “expect,” “intend” or future or conditional verbs, such as “will,” “should,” “could,” or “may,” and variations of such words or similar expressions are intended to identify forward-looking statements. Although management believes that the expectations reflected in these forward-looking statements are reasonable, it can give no assurance that these expectations will prove to be correct. These statements are subject to certain risks, uncertainties and assumptions, including risks relating to our dependence on certain key personnel, our ability to raise new credit, private equity, or real assets funds, the outbreak of the novel coronavirus disease 2019 (“COVID-19”), the impact of energy market dislocation, market conditions generally, our ability to manage our growth, fund performance, changes in our regulatory environment and tax status, the variability of our revenues, net income and cash flow, our use of leverage to finance our businesses and investments by our funds we manage and litigation risks, among others. Due to the COVID-19 pandemic, there has been uncertainty and disruption in the global economy and financial markets. While we are unable to accurately predict the full impact that COVID-19 will have on our results from operations, financial condition, liquidity and cash flows due to numerous uncertainties, including the duration and severity of the pandemic and containment measures, our compliance with these measures has impacted our day-to-day operations and could disrupt our business and operations, as well as that of the Apollo funds and their portfolio companies, for an indefinite period of time. We believe these factors include but are not limited to those described under the section entitled “Risk Factors” in the Company’s Annual Report on Form 10-K filed with the United States Securities and Exchange Commission (“SEC”) on March 1, 2019February 21, 2020 (the “2018“2019 Annual Report”) and quarterly report on Form 10-Q filed with the SEC on August 6, 2019;May 11, 2020, as such factors may be updated from time to time in our periodic filings with the SEC, which are accessible on the SEC’s website at www.sec.gov. These factors should not be construed as exhaustive and should be read in conjunction with the other cautionary statements that are included in this report and in our other filings with the SEC. We undertake no obligation to publicly update or review any forward-looking statements, whether as a result of new information, future developments or otherwise, except as required by applicable law.
Terms Used in This Report
Effective September 5, 2019, Apollo Global Management, Inc. converted from a Delaware limited liability company named Apollo Global Management, LLC (“AGM LLC”) to a Delaware corporation named Apollo Global Management, Inc. (“AGM Inc.” and such conversion, the “Conversion”). This quarterly report includes the results for AGM LLC prior to the Conversion and the results for AGM Inc. following the Conversion. In this quarterly report, references to “Apollo,” “we,” “us,” “our” and the “Company” refer collectively to (a) AGM Inc. and its subsidiaries, including the Apollo Operating Group and all of its subsidiaries, following the Conversion and (b) AGM LLC and its subsidiaries, including the Apollo Operating Group and all of its subsidiaries, prior to the Conversion, or as the context may otherwise require; and references to our Class A Common Stock (“Class A shares”), Class B Common Stock (“Class B share”), our 6.375% Series A Preferred Stock (“Series A Preferred shares”) and 6.375% Series B Preferred Stock (“Series B Preferred shares” and collectively with the Series A Preferred shares, the “Preferred shares”) for periods prior to the Conversion mean the Class A shares, Class B share, Series A preferredPreferred shares and Series B preferredPreferred shares of AGM LLC, respectively; and references to dividends to our stockholders for periods prior to the Conversion mean distributions to our shareholders;
“AMH” refers to Apollo Management Holdings, L.P., a Delaware limited partnership, that is an indirect subsidiary of Apollo Global Management,AGM Inc.;
“Apollo funds”, “our funds” and references to the “funds” we manage, refer to the funds (including the parallel funds and alternative investment vehicles of such funds), partnerships, accounts, including strategic investment accounts or “SIAs,” alternative asset companies and other entities for which subsidiaries of the Apollo Operating Group provide investment management or advisory services;
“Apollo Group” means (i) the Class C Stockholder and its affiliates, including their respective general partners, members and limited partners, (ii) Holdings and its affiliates, including their respective general partners, members and limited partners, (iii) with respect to each Managing Partner, such Managing Partner and such Managing Partner’s group (as defined in Section 13(d) of the Exchange Act), (iv) any former or current investment professional of or other employee of an Apollo employer (as defined below) or the Apollo Operating Group (or such other entity controlled by a member of the Apollo Operating Group) and any member of such person’s group, (v) any former or current executive officer of an Apollo employer or the Apollo Operating Group (or such other entity controlled by a member of the Apollo Operating Group) and any member of such
person’s group; and (vi) any former or current director of an Apollo employer or the Apollo Operating Group (or such other entity controlled by a member of the Apollo Operating Group) and any member of such person’s group. With respect to any person, Apollo employer means AGM Inc. or such successor thereto or such other entity controlled by AGM Inc. or its successor as may be such person’s employer at such time, but does not include any portfolio companies.
“Apollo Operating Group” refers to (i) the limited partnerships and limited liability companies through which our Managing Partners currently operate our businesses and (ii) one or more limited partnerships or limited liability companies formed for the purpose of, among other activities, holding certain of our gains or losses on our principal investments in the funds, which we refer to as our “principal investments”;
“Assets Under Management”, or “AUM”, refers to the assets of the funds, partnerships and accounts to which we provide investment management, advisory, or certain other investment-related services, including, without limitation, capital that such funds, partnerships and accounts have the right to call from investors pursuant to capital commitments. Our AUM equals the sum of:
| |
(i) | the net asset value, or “NAV,” plus used or available leverage and/or capital commitments, or gross assets plus capital commitments, of the credit funds, partnerships and accounts for which we provide investment management or advisory services, other than certain collateralized loan obligations (“CLOs”), collateralized debt obligations (“CDOs”), and certain permanent capital vehicles, which have a fee-generating basis other than the mark-to-market value of the underlying assets; |
| |
(ii) | the fair value of the investments of the private equity and real assets funds, partnerships and accounts we manage or advise plus the capital that such funds, partnerships and accounts are entitled to call from investors pursuant to capital commitments, plus portfolio |
(i)the net asset value, or “NAV,” plus used or available leverage and/or capital commitments, or gross assets plus capital commitments, of the credit funds, partnerships and accounts for which we provide investment management or advisory services, other than certain collateralized loan obligations (“CLOs”), collateralized debt obligations (“CDOs”), and certain permanent capital vehicles, which have a fee-generating basis other than the mark-to-market value of the underlying assets;
(ii)the fair value of the investments of the private equity and real assets funds, partnerships and accounts we manage or advise plus the capital that such funds, partnerships and accounts are entitled to call from investors pursuant to capital commitments, plus portfolio level financings; for certain permanent capital vehicles in real assets, gross asset value plus available financing capacity;
| |
(iii) | the gross asset value associated with the reinsurance investments of the portfolio company assets we manage or advise; and |
| |
(iv) | the fair value of any other assets that we manage or advise for the funds, partnerships and accounts to which we provide investment management, advisory, or certain other investment-related services, plus unused credit facilities, including capital commitments to such funds, partnerships and accounts for investments that may require pre-qualification or other conditions before investment plus any other capital commitments to such funds, partnerships and accounts available for investment that are not otherwise included in the clauses above. |
(iii)the gross asset value associated with the reinsurance investments of the portfolio company assets we manage or advise; and
(iv)the fair value of any other assets that we manage or advise for the funds, partnerships and accounts to which we provide investment management, advisory, or certain other investment-related services, plus unused credit facilities, including capital commitments to such funds, partnerships and accounts for investments that may require pre-qualification or other conditions before investment plus any other capital commitments to such funds, partnerships and accounts available for investment that are not otherwise included in the clauses above.
Our AUM measure includes Assets Under Management for which we charge either nominal or zero fees. Our AUM measure also includes assets for which we do not have investment discretion, including certain assets for which we earn only investment-related service fees, rather than management or advisory fees. Our definition of AUM is not based on any definition of Assets Under Management contained in our operating agreementgoverning documents or in any of our Apollo fund management agreements. We consider multiple factors for determining what should be included in our definition of AUM. Such factors include but are not limited to (1) our ability to influence the investment decisions for existing and available assets; (2) our ability to generate income from the underlying assets in our funds; and (3) the AUM measures that we use internally or believe are used by other investment managers. Given the differences in the investment strategies and structures among other alternative investment managers, our calculation of AUM may differ from the calculations employed by other investment managers and, as a result, this measure may not be directly comparable to similar measures presented by other investment managers. Our calculation also differs from the manner in which our affiliates registered with the SEC report “Regulatory Assets Under Management” on Form ADV and Form PF in various ways;
“Fee-Generating AUM” consists of assets of the funds, partnerships and accounts to which we provide investment management, advisory, or certain other investment-related services and on which we earn management fees, monitoring fees or other investment-related fees pursuant to management or other fee agreements on a basis that varies among the Apollo funds, partnerships and accounts. Management fees are normally based on “net asset value,” “gross assets,” “adjusted par asset value,” “adjusted cost of all unrealized portfolio investments,” “capital commitments,” “adjusted assets,” “stockholders’ equity,” “invested capital” or “capital contributions,” each as defined in the applicable management agreement. Monitoring fees, also referred to as advisory fees, with respect to the structured portfolio company investments of the funds, partnerships and accounts we manage or advise, are generally based on the total value of such structured portfolio company investments, which normally includes leverage, less any portion of such total value that is already considered in Fee-Generating AUM;
“Non-Fee-Generating AUM” refers to AUM that does not produce management fees or monitoring fees. This measure generally includes the following:
| |
(i) | fair value above invested capital for those funds that earn management fees based on invested capital; |
| |
(ii) | net asset values related to general partner and co-investment interests; |
| |
(iii) | unused credit facilities; |
| |
(iv) | available commitments on those funds that generate management fees on invested capital; |
| |
(v) | structured portfolio company investments that do not generate monitoring fees; and |
| |
(vi) | the difference between gross asset and net asset value for those funds that earn management fees based on net asset value. |
(i)fair value above invested capital for those funds that earn management fees based on invested capital;
(ii)net asset values related to general partner and co-investment interests;
(iii)unused credit facilities;
(iv)available commitments on those funds that generate management fees on invested capital;
(v)structured portfolio company investments that do not generate monitoring fees; and
(vi)the difference between gross asset and net asset value for those funds that earn management fees based on net asset value.
“Performance Fee-Eligible AUM” refers to the AUM that may eventually produce performance fees. All funds for which we are entitled to receive a performance fee allocation or incentive fee are included in Performance Fee-Eligible AUM, which consists of the following:
| |
(i) | “Performance Fee-Generating AUM”, which refers to invested capital of the funds, partnerships and accounts we manage, advise, or to which we provide certain other investment-related services, that is currently above its hurdle rate or preferred return, and profit of such funds, partnerships and accounts is being allocated to, or earned by, the general partner in accordance with the applicable limited partnership agreements or other governing agreements; |
(i) “Performance Fee-Generating AUM”, which refers to invested capital of the funds, partnerships and accounts we manage, advise, or to which we provide certain other investment-related services, that is currently above its hurdle rate or preferred return, and profit of such funds, partnerships and accounts is being allocated to, or earned by, the general partner in accordance with the applicable limited partnership agreements or other governing agreements;
| |
(ii) | “AUM Not Currently Generating Performance Fees”, which refers to invested capital of the funds, partnerships and accounts we manage, advise, or to which we provide certain other investment-related services, that is currently below its hurdle rate or preferred return; and |
| |
(iii) | “Uninvested Performance Fee-Eligible AUM”, which refers to capital of the funds, partnerships and accounts we manage, advise, or to which we provide certain other investment-related services, that is available for investment or reinvestment subject to the provisions of applicable limited partnership agreements or other governing agreements, which capital is not currently part of the NAV or fair value of investments that may eventually produce performance fees allocable to, or earned by, the general partner. |
(ii) “AUM Not Currently Generating Performance Fees”, which refers to invested capital of the funds, partnerships and accounts we manage, advise, or to which we provide certain other investment-related services, that is currently below its hurdle rate or preferred return; and
(iii) “Uninvested Performance Fee-Eligible AUM”, which refers to capital of the funds, partnerships and accounts we manage, advise, or to which we provide certain other investment-related services, that is available for investment or reinvestment subject to the provisions of applicable limited partnership agreements or other governing agreements, which capital is not currently part of the NAV or fair value of investments that may eventually produce performance fees allocable to, or earned by, the general partner.
“AUM with Future Management Fee Potential” refers to the committed uninvested capital portion of total AUM not
currently earning management fees. The amount depends on the specific terms and conditions of each fund;
We use AUM as a performance measure of our funds’ investment activities, as well as to monitor fund size in relation to professional resource and infrastructure needs. Non-Fee-Generating AUM includes assets on which we could earn performance fees;
“Advisory” refers to certain assets advised by Apollo Asset Management Europe PC LLP (“AAME PC”), a wholly-owned subsidiary of Apollo Asset Management Europe LLP (collectively, “AAME”(“AAME”). The AAME entitiesPC and AAME are subsidiaries of Apollo;Apollo and are collectively referred to herein as “ISGI”;
“Athene Holding” refers to Athene Holding Ltd. (together with its subsidiaries, “Athene”), a leading retirement services company that issues, reinsures and acquires retirement savings products designed for the increasing number of individuals and institutions seeking to fund retirement needs, and to which Apollo, through its consolidated subsidiary Apollo Insurance Solutions Group LLCLP (formerly known as Athene Asset Management LLC) (“ISG”), provides asset management and advisory services;
“Athora”Athora Holding” refers to Athora Holding, Ltd. (“Athora Holding” and together with its subsidiaries, “Athora”), a strategic platform established to acquirethat acquires or reinsurereinsures blocks of insurance business in the German and broader European life insurance market (collectively, the “Athora Accounts”). The Company, through its consolidated subsidiary, AAME,ISGI, provides investment advisory services to Athora. Athora Non-Sub-Advised Assets includes the Athora assets which are managed by Apollo but not sub-advised by Apollo nor invested in Apollo funds or investment vehicles. Athora Sub-Advised includes assets which the Company explicitly sub-advises as well as those assets in the Athora Accounts which are invested directly in funds and investment vehicles Apollo manages;
“capital deployed” or “deployment” isrepresents (i) the aggregate amount of capital that has been invested during a given period (which may, in certain cases, include(including leverage) by (i) our commitment based funds and (ii) SIAs that have a defined maturity date;date, (ii) purchases of investments (net of sales) by our subscription and contribution based funds and mandates (including leverage), (iii) investments originated by certain of our platform companies, net of syndications to our other funds and accounts, but including syndications to third parties, and (iv) third-party investment activity in opportunities sourced by our teams for which we earn a fee and in which we participate. Deployment excludes offsetting short positions, certain credit derivatives, certain short-dated government securities, and involuntary repayment of loans and bonds;
“Contributing Partners” refer to those of our partners and their related parties (other than our Managing Partners) who indirectly beneficially own (through Holdings) Apollo Operating Group units;
“drawdown capital deployed” or “drawdown deployment” is the aggregate amount of capital that has been invested during a given period (which may, in certain cases, include leverage) by (i) our commitment-based funds and (ii) SIAs that have a defined maturity date;
“Equity Plan” refers to the Company’s 2007 Omnibus Equity Incentive Plan, which effective as of July 22, 2019, was amended, restated and renamed the 2019 Omnibus Equity Incentive Plan;
“gross IRR” of a credit fund and the principal finance funds within the real assets segment represents the annualized return of a fund based on the actual timing of all cumulative fund cash flows before management fees, performance fees allocated to the general partner and certain other expenses. Calculations may include certain investors that do not pay fees. The terminal value is the net asset value as of the reporting date. Non-U.S. dollar denominated (“USD”) fund cash flows and residual values are converted to USD using the spot rate as of the reporting date. In addition, gross IRRs at the fund level will differ from those at the individual investor level as a result of, among other factors, timing of investor-level inflows and outflows. Gross IRR does not represent the return to any fund investor;
“gross IRR” of a private equity fund represents the cumulative investment-related cash flows (i) for a given investment for the fund or funds which made such investment, and (ii) for a given fund, in the relevant fund itself (and not any one investor in the fund), in each case, on the basis of the actual timing of investment inflows and outflows (for unrealized investments assuming disposition on September 30, 20192020 or other date specified) aggregated on a gross basis quarterly, and the return is annualized and compounded before management fees, performance fees and certain other expenses (including interest incurred by the fund itself) and measures the returns on the fund’s investments as a whole without regard to whether all of the returns would, if distributed, be payable to the fund’s investors. In addition, gross IRRs at the fund level will differ from those at the individual investor level as a result of, among other factors, timing of investor-level inflows and outflows. Gross IRR does not represent the return to any fund investor;
“gross IRR” of a real assets fund excluding the principal finance funds represents the cumulative investment-related cash flows in the fund itself (and not any one investor in the fund), on the basis of the actual timing of cash inflows and outflows (for unrealized investments assuming disposition on September 30, 20192020 or other date specified) starting on the date that each investment closes, and the return is annualized and compounded before management fees, performance fees, and certain other expenses (including interest incurred by the fund itself) and measures the returns on the fund’s investments as a whole without regard to whether all
of the returns would, if distributed, be payable to the fund’s investors. Non-USD fund cash flows and residual values are converted to USD using the spot rate as of the reporting date. In addition, gross IRRs at the fund level will differ from those at the individual investor level as a result of, among other factors, timing of investor-level inflows and outflows. Gross IRR does not represent the return to any fund investor;
“gross return” of a credit or real assets fund is the monthly or quarterly time-weighted return that is equal to the percentage change in the value of a fund’s portfolio, adjusted for all contributions and withdrawals (cash flows) before the effects of management fees, incentive fees allocated to the general partner, or other fees and expenses. Returns for credit funds are calculated for all funds and accounts in the respective strategies excluding assets for Athene, Athora and certain other entities where we manage or may manage a significant portion of the total company assets. Returns of CLOs represent the gross returns on assets. Returns over multiple periods are calculated by geometrically linking each period’s return over time;
“Holdings” means AP Professional Holdings, L.P., a Cayman Islands exempted limited partnership through which our Managing Partners and Contributing Partners indirectly beneficially own their interests in the Apollo Operating Group units;
“inflows” represents (i) at the individual segment level, subscriptions, commitments, and other increases in available capital, such as acquisitions or leverage, net of inter-segment transfers, and (ii) on an aggregate basis, the sum of inflows across the credit, private equity and real assets segments;
“Managing Partners” refer to Messrs. Leon Black, Joshua Harris and Marc Rowan collectively and, when used in reference to holdings of interests in Apollo or Holdings, includes certain related parties of such individuals;
“net IRR” of a credit fund and the principal finance funds within the real assets segment represents the annualized return of a fund after management fees, performance fees allocated to the general partner and certain other expenses, calculated on investors that pay such fees. The terminal value is the net asset value as of the reporting date. Non-USD fund cash flows and residual values are converted to USD using the spot rate as of the reporting date. In addition, net IRR at the fund level will differ from that at the individual investor level as a result of, among other factors, timing of investor-level inflows and outflows. Net IRR does not represent the return to any fund investor;
“net IRR” of a private equity fund means the gross IRR applicable to a fund, including returns for related parties which may not pay fees or performance fees, net of management fees, certain expenses (including interest incurred or earned by the fund itself) and realized performance fees all offset to the extent of interest income, and measures returns at the fund level on amounts that, if distributed, would be paid to investors of the fund. The timing of cash flows applicable to investments, management fees and certain expenses, may be adjusted for the usage of a fund’s subscription facility. To the extent that a fund exceeds all requirements detailed within the applicable fund agreement, the estimated unrealized value is adjusted such that a percentage of up to 20.0% of the unrealized gain is allocated to the general partner of such fund, thereby reducing the balance attributable to fund investors. In addition, net IRR at the fund level will differ from that at the individual investor level as a result of, among other factors, timing of investor-level inflows and outflows. Net IRR does not represent the return to any fund investor;
“net IRR” of a real assets fund excluding the principal finance funds represents the cumulative cash flows in the fund (and not any one investor in the fund), on the basis of the actual timing of cash inflows received from and outflows paid to investors of the fund (assuming the ending net asset value as of September 30, 20192020 or other date specified is paid to investors), excluding certain non-fee and non-performance fee bearing parties, and the return is annualized and compounded after management fees, performance fees, and certain other expenses (including interest incurred by the fund itself) and measures the returns to investors of the fund as a whole. Non-USD fund cash flows and residual values are converted to USD using the spot rate as of the reporting date. In addition, net IRR at the fund level will differ from that at the individual investor level as a result of, among other factors, timing of investor-level inflows and outflows. Net IRR does not represent the return to any fund investor;
“net return” of a credit or real assets fund represents the gross return after management fees, performance fees allocated to the general partner, or other fees and expenses. Returns over multiple periods are calculated by geometrically linking each period’s return over time;
“performance allocations”, “performance fees”, “performance revenues”, “incentive fees” and “incentive income” refer to interests granted to Apollo by an Apollo fund that entitle Apollo to receive allocations, distributions or fees which are based on the performance of such fund or its underlying investments;
“permanent capital vehicles” refers to (a) assets that are owned by or related to Athene or Athora, Holding Ltd. (“Athora Holding” and together with its subsidiaries, “Athora”), (b) assets that are owned by or related to MidCap FinCo Designated Activity Company (“MidCap”) and managed by Apollo, (c) assets of publicly traded vehicles managed by Apollo such as Apollo Investment Corporation (“AINV”), Apollo Commercial Real Estate Finance, Inc. (“ARI”), Apollo Tactical Income Fund Inc. (“AIF”), and Apollo Senior Floating Rate Fund Inc. (“AFT”), in each case that do not have redemption provisions or a requirement to return
capital to investors upon exiting the investments made with such capital, except as required by applicable law and (d) a non-traded business development company from which Apollo earns certain investment-related service fees. The investment management agreements of AINV, AIF and AFT have one year terms, are reviewed annually and remain in effect only if approved by the boards of directors of such companies or by the affirmative vote of the holders of a majority of the outstanding voting shares of such companies, including in either case, approval by a majority of the directors who are not “interested persons” as defined in the Investment Company Act of 1940.1940, as amended (the “Investment Company Act”). In addition, the investment management agreements of AINV, AIF and AFT may be terminated in certain circumstances upon 60 days’ written notice. The investment management agreement of ARI has a one year term and is reviewed annually by ARI’s board of directors and may be terminated under certain circumstances by an affirmative vote of at least two-thirds of ARI’s independent directors. The investment management or advisory arrangements between each of MidCap and Apollo, Athene and Apollo, and Athora and Apollo, may also be terminated under certain circumstances. The agreement pursuant to which Apollo earns certain investment-related service fees from a non-traded business development company may be terminated under certain limited circumstances;
“private equity fund appreciation (depreciation)” refers to gain (loss) and income for the traditional private equity funds (as defined below), Apollo Natural Resources Partners, L.P. (“ANRP(together with its alternative investment vehicles, “ANRP I”), Apollo Natural Resources Partners II, L.P. (“ANRP(together with its alternative investment vehicles, “ANRP II”), Apollo Natural Resources Partners III, L.P. (“ANRP(together with its parallel vehicles and alternative investment vehicles, “ANRP III”), Apollo Special Situations Fund, L.P., AION Capital Partners Limited (“AION”) and Apollo Hybrid Value Fund, L.P. (together with its parallel funds and
alternative investment vehicles, “Hybrid Value Fund”) for the periods presented on a total return basis before giving effect to fees and expenses. The performance percentage is determined by dividing (a) the change in the fair value of investments over the period presented, minus the change in invested capital over the period presented, plus the realized value for the period presented, by (b) the beginning unrealized value for the period presented plus the change in invested capital for the period presented. Returns over multiple periods are calculated by geometrically linking each period’s return over time;
“private equity investments” refer to (i) direct or indirect investments in existing and future private equity funds managed or sponsored by Apollo, (ii) direct or indirect co-investments with existing and future private equity funds managed or sponsored by Apollo, (iii) direct or indirect investments in securities which are not immediately capable of resale in a public market that Apollo identifies but does not pursue through its private equity funds, and (iv) investments of the type described in (i) through (iii) above made by Apollo funds;
“Realized Value” refers to all cash investment proceeds received by the relevant Apollo fund, including interest and dividends, but does not give effect to management fees, expenses, incentive compensation or performance fees to be paid by such Apollo fund;
“Redding Ridge” refers to Redding Ridge Asset Management, LLC and its subsidiaries, which is a standalone, self-managed asset management business established in connection with risk retention rules that manages CLOs and retains the required risk retention interests;
“Remaining Cost” represents the initial investment of the fund in a portfolio investment, reduced for any return of capital distributed to date on such portfolio investment;
“Strategic Investor” refers to the California Public Employees’ Retirement System, or “CalPERS”;
“Total Invested Capital” refers to the aggregate cash invested by the relevant Apollo fund and includes capitalized costs relating to investment activities, if any, but does not give effect to cash pending investment or available for reserves;reserves and excludes amounts, if any, invested on a financed basis with leverage facilities;
“Total Value” represents the sum of the total Realized Value and Unrealized Value of investments;
“traditional private equity funds” refers to Apollo Investment Fund I, L.P. (“Fund I”), AIF II, L.P. (“Fund II”), a mirrored investment account established to mirror Fund I and Fund II for investments in debt securities (“MIA”), Apollo Investment Fund III, L.P. (together with its parallel funds, “Fund III”), Apollo Investment Fund IV, L.P. (together with its parallel fund, “Fund IV”), Apollo Investment Fund V, L.P. (together with its parallel funds and alternative investment vehicles, “Fund V”), Apollo Investment Fund VI, L.P. (together with its parallel funds and alternative investment vehicles, “Fund VI”), Apollo Investment Fund VII, L.P. (together with its parallel funds and alternative investment vehicles, “Fund VII”), Apollo Investment Fund VIII, L.P. (together with its parallel funds and alternative investment vehicles, “Fund VIII”) and Apollo Investment Fund IX, L.P. (together with its parallel funds and alternative investment vehicles, “Fund IX”);
“Unrealized Value” refers to the fair value consistent with valuations determined in accordance with generally accepted accounting principles in the United States of America (“U.S. GAAP”), for investments not yet realized and may include payments in kind, accrued interest and dividends receivable, if any, and before the effect of certain taxes. In addition, amounts include committed and funded amounts for certain investments; and
“Vintage Year” refers to the year in which a fund’s final capital raise occurred, or, for certain funds, the year in which a fund’s investment period commences as perpursuant to its governing agreements.
PART I—I - FINANCIAL INFORMATION
ITEM 1.FINANCIAL STATEMENTS
APOLLO GLOBAL MANAGEMENT, INC.
CONDENSED CONSOLIDATED STATEMENTS OF FINANCIAL CONDITION (UNAUDITED)
AS OF SEPTEMBER 30, 20192020 AND DECEMBER 31, 20182019
(dollars in thousands, except share data)
| | | | | | | | | | | |
| As of
September 30, 2020 | | As of
December 31, 2019 |
| Assets: | | | |
| Cash and cash equivalents | $ | 1,838,646 | | | $ | 1,556,202 | |
| Restricted cash | 17,694 | | | 19,779 | |
| U.S. Treasury securities, at fair value | 0 | | | 554,387 | |
| Investments (includes performance allocations of $1,128,160 and $1,507,571 as of September 30, 2020 and December 31, 2019, respectively) | 3,977,069 | | | 3,609,859 | |
| Assets of consolidated variable interest entities: | | | |
| Cash and cash equivalents | 805,529 | | | 45,329 | |
| Investments, at fair value | 9,900,593 | | | 1,213,169 | |
| Other assets | 183,598 | | | 41,688 | |
| Incentive fees receivable | 1,028 | | | 2,414 | |
| Due from related parties | 487,453 | | | 415,069 | |
| Deferred tax assets, net | 678,799 | | | 473,165 | |
| Other assets | 318,724 | | | 326,449 | |
| Lease assets | 301,779 | | | 190,696 | |
| Goodwill | 116,958 | | | 93,911 | |
| Total Assets | $ | 18,627,870 | | | $ | 8,542,117 | |
| Liabilities and Stockholders’ Equity | | | |
| Liabilities: | | | |
| Accounts payable and accrued expenses | $ | 143,664 | | | $ | 94,364 | |
| Accrued compensation and benefits | 221,185 | | | 64,393 | |
| Deferred revenue | 120,075 | | | 84,639 | |
| Due to related parties | 712,186 | | | 501,387 | |
| Profit sharing payable | 666,734 | | | 758,669 | |
| Debt | 3,151,247 | | | 2,650,600 | |
| Liabilities of consolidated variable interest entities: | | | |
| Debt, at fair value | 5,646,884 | | | 850,147 | |
| Notes payable | 2,464,267 | | | 0 | |
| Other liabilities | 806,333 | | | 79,572 | |
| Other liabilities | 169,522 | | | 210,740 | |
| Lease liabilities | 336,769 | | | 209,479 | |
| Total Liabilities | 14,438,866 | | | 5,503,990 | |
| Commitments and Contingencies (see note 16) | | | |
| Stockholders’ Equity: | | | |
| Apollo Global Management, Inc. stockholders’ equity: | | | |
| | | |
| Series A Preferred Stock, 11,000,000 shares issued and outstanding as of September 30, 2020 and December 31, 2019 | 264,398 | | | 264,398 | |
| | | |
| Series B Preferred Stock, 12,000,000 shares issued and outstanding as of September 30, 2020 and December 31, 2019 | 289,815 | | | 289,815 | |
| | | |
| Class A Common Stock, $0.00001 par value, 90,000,000,000 shares authorized, 228,747,302 and 222,994,407 shares issued and outstanding as of September 30, 2020 and December 31, 2019, respectively | 0 | | | 0 | |
| | | |
|
| | | | | | | |
| | As of
September 30, 2019 | | As of
December 31, 2018 |
| Assets: | | | |
| Cash and cash equivalents | $ | 1,242,817 |
| | $ | 609,747 |
|
| Restricted cash | 19,777 |
| | 3,457 |
|
| U.S. Treasury securities, at fair value | 551,681 |
| | 392,932 |
|
| Investments (includes performance allocations of $1,480,577 and $912,182 as of September 30, 2019 and December 31, 2018, respectively) | 3,472,909 |
| | 2,722,612 |
|
| Assets of consolidated variable interest entities: | | | |
| Cash and cash equivalents | 41,799 |
| | 49,671 |
|
| Investments, at fair value | 1,163,981 |
| | 1,175,677 |
|
| Other assets | 39,088 |
| | 65,543 |
|
| Incentive fees receivable | 3,093 |
| | 6,792 |
|
| Due from related parties | 440,071 |
| | 378,108 |
|
| Deferred tax assets, net | 530,954 |
| | 306,094 |
|
| Other assets | 278,664 |
| | 192,169 |
|
| Lease assets | 190,618 |
| | — |
|
| Goodwill | 88,852 |
| | 88,852 |
|
| Total Assets | $ | 8,064,304 |
| | $ | 5,991,654 |
|
| Liabilities and Stockholders’ Equity | | | |
| Liabilities: | | | |
| Accounts payable and accrued expenses | $ | 96,820 |
| | $ | 70,878 |
|
| Accrued compensation and benefits | 166,161 |
| | 73,583 |
|
| Deferred revenue | 172,157 |
| | 111,097 |
|
| Due to related parties | 507,113 |
| | 425,435 |
|
| Profit sharing payable | 693,618 |
| | 452,141 |
|
| Debt | 2,348,440 |
| | 1,360,448 |
|
| Liabilities of consolidated variable interest entities: | | | |
| Debt, at fair value | 828,824 |
| | 855,461 |
|
| Other liabilities | 69,042 |
| | 78,977 |
|
| Other liabilities | 132,023 |
| | 111,794 |
|
| Lease liabilities | 207,673 |
| | — |
|
| Total Liabilities | 5,221,871 |
| | 3,539,814 |
|
| Commitments and Contingencies (see note 15) |
|
| |
|
|
| Stockholders’ Equity: | | | |
| Apollo Global Management, Inc. stockholders’ equity: | | | |
| Series A Preferred Shares, 11,000,000 shares issued and outstanding as of December 31, 2018 | — |
| | 264,398 |
|
| Series A Preferred Stock, 11,000,000 shares issued and outstanding as of September 30, 2019 | 264,398 |
| | — |
|
| Series B Preferred Shares, 12,000,000 shares issued and outstanding as of December 31, 2018 | — |
| | 289,815 |
|
| Series B Preferred Stock, 12,000,000 shares issued and outstanding as of September 30, 2019 | 289,815 |
| | — |
|
| Class A Shares, no par value, unlimited shares authorized, 201,400,500 shares issued and outstanding as of December 31, 2018 | — |
| | — |
|
| Class A Common Stock, $0.00001 par value, 90,000,000,000 shares authorized, 222,403,296 shares issued and outstanding as of September 30, 2019 | — |
| | — |
|
| Class B Shares, no par value, unlimited shares authorized, 1 share issued and outstanding as of December 31, 2018 | — |
| | — |
|
| Class B Common Stock, $0.00001 par value, 999,999,999 shares authorized, 1 share issued and outstanding as of September 30, 2019 | — |
| | — |
|
| Class C Common Stock, $0.00001 par value, 1 share authorized, 1 share issued and outstanding as of September 30, 2019 | — |
| | — |
|
| Additional paid in capital | 1,217,231 |
| | 1,299,418 |
|
| Retained earnings (accumulated deficit) | — |
| | (473,276 | ) |
| Accumulated other comprehensive loss | (6,827 | ) | | (4,159 | ) |
| Total Apollo Global Management, Inc. Stockholders’ equity | 1,764,617 |
| | 1,376,196 |
|
| Non-Controlling Interests in consolidated entities | 266,016 |
| | 271,522 |
|
| Non-Controlling Interests in Apollo Operating Group | 811,800 |
| | 804,122 |
|
| Total Stockholders’ Equity | 2,842,433 |
| | 2,451,840 |
|
| Total Liabilities and Stockholders’ Equity | $ | 8,064,304 |
| | $ | 5,991,654 |
|
| | | | | | | | | | | |
| Class B Common Stock, $0.00001 par value, 999,999,999 shares authorized, 1 share issued and outstanding as of September 30, 2020 and December 31, 2019 | 0 | | | 0 | |
| Class C Common Stock, $0.00001 par value, 1 share authorized, 1 share issued and outstanding as of September 30, 2020 and December 31, 2019 | 0 | | | 0 | |
| Additional paid in capital | 929,524 | | | 1,302,587 | |
| Accumulated deficit | (396,895) | | | 0 | |
| Accumulated other comprehensive income (loss) | 2,722 | | | (4,578) | |
| Total Apollo Global Management, Inc. Stockholders’ equity | 1,089,564 | | | 1,852,222 | |
| Non-Controlling Interests in consolidated entities | 1,688,906 | | | 281,904 | |
| Non-Controlling Interests in Apollo Operating Group | 1,410,534 | | | 904,001 | |
| Total Stockholders’ Equity | 4,189,004 | | | 3,038,127 | |
| Total Liabilities and Stockholders’ Equity | $ | 18,627,870 | | | $ | 8,542,117 | |
See accompanying notes to condensed consolidated financial statements.
APOLLO GLOBAL MANAGEMENT, INC.
CONDENSED CONSOLIDATED STATEMENTS OF OPERATIONS (UNAUDITED)
FOR THE THREE AND NINE MONTHS ENDED SEPTEMBER 30, 2020AND2019 AND 2018
(dollars in thousands, except share data)
| | | | | | | | | | | | | | | | | | | | | | | |
| For the Three Months Ended
September 30, | | For the Nine Months Ended
September 30, |
| | 2020 | | 2019 | | 2020 | | 2019 |
| Revenues: | | | | | | | |
| Management fees | $ | 433,570 | | | $ | 394,547 | | | $ | 1,240,127 | | | $ | 1,162,788 | |
| Advisory and transaction fees, net | 73,449 | | | 16,440 | | | 172,369 | | | 67,133 | |
| Investment income (loss): | | | | | | | |
| Performance allocations | 459,241 | | | 254,103 | | | (350,483) | | | 682,462 | |
| Principal investment income (loss) | 50,722 | | | 33,393 | | | (25,506) | | | 99,020 | |
| Total investment income (loss) | 509,963 | | | 287,496 | | | (375,989) | | | 781,482 | |
| Incentive fees | 1,292 | | | 4,238 | | | 21,016 | | | 5,674 | |
| Total Revenues | 1,018,274 | | | 702,721 | | | 1,057,523 | | | 2,017,077 | |
| Expenses: | | | | | | | |
| Compensation and benefits: | | | | | | | |
| Salary, bonus and benefits | 163,197 | | | 126,695 | | | 453,485 | | | 369,527 | |
| Equity-based compensation | 49,726 | | | 42,665 | | | 161,268 | | | 132,404 | |
| Profit sharing expense | 191,809 | | | 88,610 | | | (68,230) | | | 280,335 | |
| Total compensation and benefits | 404,732 | | | 257,970 | | | 546,523 | | | 782,266 | |
| Interest expense | 34,889 | | | 27,833 | | | 98,422 | | | 70,243 | |
| General, administrative and other | 90,822 | | | 85,313 | | | 259,073 | | | 238,814 | |
| Placement fees | 612 | | | 256 | | | 1,380 | | | 591 | |
| Total Expenses | 531,055 | | | 371,372 | | | 905,398 | | | 1,091,914 | |
| Other Income (Loss): | | | | | | | |
| Net gains (losses) from investment activities | 144,472 | | | (19,790) | | | (851,412) | | | 44,099 | |
| Net gains from investment activities of consolidated variable interest entities | 122,119 | | | 10,631 | | | 14,061 | | | 24,728 | |
| Interest income | 1,485 | | | 10,152 | | | 13,413 | | | 25,938 | |
| Other income (loss), net | 10,161 | | | (43,144) | | | (3,019) | | | (36,451) | |
| Total Other Income (Loss) | 278,237 | | | (42,151) | | | (826,957) | | | 58,314 | |
| Income (loss) before income tax (provision) benefit | 765,456 | | | 289,198 | | | (674,832) | | | 983,477 | |
| Income tax (provision) benefit | (89,357) | | | 231,896 | | | 66,173 | | | 195,345 | |
| Net Income (Loss) | 676,099 | | | 521,094 | | | (608,659) | | | 1,178,822 | |
| Net (income) loss attributable to Non-Controlling Interests | (403,700) | | | (157,824) | | | 331,169 | | | (501,672) | |
| Net Income (Loss) Attributable to Apollo Global Management, Inc. | 272,399 | | | 363,270 | | | (277,490) | | | 677,150 | |
| Series A Preferred Stock Dividends | (4,382) | | | (4,382) | | | (13,148) | | | (13,148) | |
| Series B Preferred Stock Dividends | (4,781) | | | (4,782) | | | (14,344) | | | (14,344) | |
| Net Income (Loss) Attributable to Apollo Global Management, Inc. Class A Common Stockholders | $ | 263,236 | | | $ | 354,106 | | | $ | (304,982) | | | $ | 649,658 | |
| Net Income (Loss) Per Share of Class A Common Stock: | | | | | | | |
| Net Income (Loss) Available to Class A Common Stock – Basic | $ | 1.11 | | | $ | 1.64 | | | $ | (1.41) | | | $ | 3.07 | |
| Net Income (Loss) Available to Class A Common Stock – Diluted | $ | 1.11 | | | $ | 1.63 | | | $ | (1.41) | | | $ | 3.06 | |
| Weighted Average Number of Shares of Class A Common Stock Outstanding – Basic | 227,771,678 | | | 205,797,643 | | | 227,395,847 | | | 202,087,827 | |
| Weighted Average Number of Shares of Class A Common Stock Outstanding – Diluted | 227,771,678 | | | 207,641,323 | | | 227,395,847 | | | 203,745,454 | |
|
| | | | | | | | | | | | | | | |
| | For the Three Months Ended
September 30, | | For the Nine Months Ended
September 30, |
| | 2019 | | 2018 | | 2019 | | 2018 |
| Revenues: | | | | | | | |
| Management fees | $ | 394,547 |
| | $ | 358,750 |
| | $ | 1,162,788 |
| | $ | 987,102 |
|
| Advisory and transaction fees, net | 16,440 |
| | 13,154 |
| | 67,133 |
| | 42,145 |
|
| Investment income: | | | | | | | |
| Performance allocations | 254,103 |
| | 124,856 |
| | 682,462 |
| | 129,776 |
|
| Principal investment income | 33,393 |
| | 16,153 |
| | 99,020 |
| | 25,334 |
|
| Total investment income | 287,496 |
| | 141,009 |
| | 781,482 |
| | 155,110 |
|
| Incentive fees | 4,238 |
| | 4,818 |
| | 5,674 |
| | 23,593 |
|
| Total Revenues | 702,721 |
| | 517,731 |
| | 2,017,077 |
| | 1,207,950 |
|
| Expenses: | | | | | | | |
| Compensation and benefits: | | | | | | | |
| Salary, bonus and benefits | 126,695 |
| | 112,722 |
| | 369,527 |
| | 343,623 |
|
| Equity-based compensation | 42,665 |
| | 50,334 |
| | 132,404 |
| | 123,643 |
|
| Profit sharing expense | 88,610 |
| | 63,059 |
| | 280,335 |
| | 121,327 |
|
| Total compensation and benefits | 257,970 |
| | 226,115 |
| | 782,266 |
| | 588,593 |
|
| Interest expense | 27,833 |
| | 15,209 |
| | 70,243 |
| | 44,168 |
|
| General, administrative and other | 85,313 |
| | 70,657 |
| | 238,814 |
| | 194,851 |
|
| Placement fees | 256 |
| | 746 |
| | 591 |
| | 1,384 |
|
| Total Expenses | 371,372 |
| | 312,727 |
| | 1,091,914 |
| | 828,996 |
|
| Other Income (Loss): | | | | | | | |
| Net gains (losses) from investment activities | (19,790 | ) | | 155,283 |
| | 44,099 |
| | 20,645 |
|
| Net gains from investment activities of consolidated variable interest entities | 10,631 |
| | 13,001 |
| | 24,728 |
| | 28,746 |
|
| Interest income | 10,152 |
| | 5,411 |
| | 25,938 |
| | 13,517 |
|
| Other income (loss), net | (43,144 | ) | | 3,085 |
| | (36,451 | ) | | 1,888 |
|
| Total Other Income (Loss) | (42,151 | ) | | 176,780 |
| | 58,314 |
| | 64,796 |
|
| Income before income tax (provision) benefit | 289,198 |
| | 381,784 |
| | 983,477 |
| | 443,750 |
|
| Income tax (provision) benefit | 231,896 |
| | (19,092 | ) | | 195,345 |
| | (46,596 | ) |
| Net Income | 521,094 |
| | 362,692 |
| | 1,178,822 |
| | 397,154 |
|
| Net income attributable to Non-Controlling Interests | (157,824 | ) | | (191,171 | ) | | (501,672 | ) | | (220,285 | ) |
| Net Income Attributable to Apollo Global Management, Inc. | 363,270 |
| | 171,521 |
| | 677,150 |
| | 176,869 |
|
| Series A Preferred Stock Dividends | (4,382 | ) | | (4,383 | ) | | (13,148 | ) | | (13,149 | ) |
| Series B Preferred Stock Dividends | (4,782 | ) | | (4,781 | ) | | (14,344 | ) | | (9,350 | ) |
| Net Income Attributable to Apollo Global Management, Inc. Class A Common Stockholders | $ | 354,106 |
| | $ | 162,357 |
| | $ | 649,658 |
| | $ | 154,370 |
|
| Net Income Per Share of Class A Common Stock: | | | | | | | |
| Net Income Available to Class A Common Stock – Basic | $ | 1.64 |
| | $ | 0.77 |
| | $ | 3.07 |
| | $ | 0.70 |
|
| Net Income Available to Class A Common Stock – Diluted | $ | 1.63 |
| | $ | 0.77 |
| | $ | 3.06 |
| | $ | 0.70 |
|
| Weighted Average Number of Shares of Class A Common Stock Outstanding – Basic | 205,797,643 |
| | 200,347,996 |
| | 202,087,827 |
| | 199,837,707 |
|
| Weighted Average Number of Shares of Class A Common Stock Outstanding – Diluted | 207,641,323 |
| | 200,347,996 |
| | 203,745,454 |
| | 199,837,707 |
|
See accompanying notes to condensed consolidated financial statements.
APOLLO GLOBAL MANAGEMENT, INC.
CONDENSED CONSOLIDATED STATEMENTS OF
COMPREHENSIVE INCOME (LOSS) (UNAUDITED)
FOR THE THREE AND NINE MONTHS ENDED SEPTEMBER 30, 20192020 AND 20182019
(dollars in thousands, except share data)
| | | | | | | | | | | | | | | | | | | | | | | |
| For the Three Months Ended
September 30, | | For the Nine Months Ended
September 30, |
| 2020 | | 2019 | | 2020 | | 2019 |
| Net Income (Loss) | $ | 676,099 | | | $ | 521,094 | | | $ | (608,659) | | | $ | 1,178,822 | |
| Other Comprehensive Income (Loss), net of tax: | | | | | | | |
| Currency translation adjustments, net of tax | 19,524 | | | (14,616) | | | 20,652 | | | (17,021) | |
| Net gain (loss) from change in fair value of cash flow hedge instruments | 52 | | | 50 | | | 153 | | | (1,862) | |
| Net gain (loss) on available-for-sale securities | 106 | | | (68) | | | (1,242) | | | 162 | |
| Total Other Comprehensive Income (Loss), net of tax | 19,682 | | | (14,634) | | | 19,563 | | | (18,721) | |
| Comprehensive Income (Loss) | 695,781 | | | 506,460 | | | (589,096) | | | 1,160,101 | |
| Comprehensive (Income) Loss attributable to Non-Controlling Interests | (416,781) | | | (144,825) | | | 318,906 | | | (485,619) | |
| Comprehensive Income (Loss) Attributable to Apollo Global Management, Inc. | $ | 279,000 | | | $ | 361,635 | | | $ | (270,190) | | | $ | 674,482 | |
|
| | | | | | | | | | | | | | | |
| | For the Three Months Ended
September 30, | | For the Nine Months Ended
September 30, |
| | 2019 | | 2018 | | 2019 | | 2018 |
| Net Income | $ | 521,094 |
| | $ | 362,692 |
| | $ | 1,178,822 |
| | $ | 397,154 |
|
| Other Comprehensive Income (Loss), net of tax: | | | | | | | |
| Currency translation adjustments, net of tax | (14,616 | ) | | (2,318 | ) | | (17,021 | ) | | (15,183 | ) |
| Net gain (loss) from change in fair value of cash flow hedge instruments | 50 |
| | 27 |
| | (1,862 | ) | | 79 |
|
| Net gain (loss) on available-for-sale securities | (68 | ) | | (309 | ) | | 162 |
| | (546 | ) |
| Total Other Comprehensive Income (Loss), net of tax | (14,634 | ) | | (2,600 | ) | | (18,721 | ) | | (15,650 | ) |
| Comprehensive Income | 506,460 |
| | 360,092 |
| | 1,160,101 |
| | 381,504 |
|
| Comprehensive Income attributable to Non-Controlling Interests | (144,825 | ) | | (189,041 | ) | | (485,619 | ) | | (206,426 | ) |
| Comprehensive Income Attributable to Apollo Global Management, Inc. | $ | 361,635 |
| | $ | 171,051 |
| | $ | 674,482 |
| | $ | 175,078 |
|
See accompanying notes to condensed consolidated financial statements.
APOLLO GLOBAL MANAGEMENT, INC.
CONDENSED CONSOLIDATED STATEMENTS OF CHANGES
IN STOCKHOLDERS’ EQUITY (UNAUDITED)
FOR THE THREE AND NINE MONTHS ENDED SEPTEMBER 30, 20192020 AND 20182019
(dollars in thousands, except share data)
The statements below for the three and nine months ended September 30, 2018 represent Apollo Global Management, Inc. as a limited liability company prior to the Conversion:
|
| | | | | | | | | | | | | | | | | | | | | | | | | | | | | | | | | | | | | | | | | |
| | Apollo Global Management, LLC Shareholders | | | | | | | | |
| | Class A Shares | | Class B Shares | | Series A Preferred Shares | | Series B Preferred Shares | | Additional
Paid in
Capital | | Accumulated Deficit | | Accumulated
Other
Comprehensive Loss | | Total Apollo
Global
Management,
LLC.
Shareholders’
Equity | | Non-
Controlling
Interests in
Consolidated
Entities | | Non-
Controlling
Interests in
Apollo
Operating
Group | | Total Shareholders’ Equity |
| Balance at July 1, 2018 | 201,585,096 |
| | 1 |
| | $ | 264,398 |
| | $ | 289,815 |
| | $ | 1,429,307 |
| | $ | (430,335 | ) | | $ | (3,130 | ) | | $ | 1,550,055 |
| | $ | 269,162 |
| | $ | 1,002,760 |
| | $ | 2,821,977 |
|
| Adoption of new accounting guidance | — |
| | — |
| | — |
| | — |
| | (34 | ) | | 33 |
| | — |
| | (1 | ) | | — |
| | — |
| | (1 | ) |
| Dilution impact of issuance of Class A shares | — |
| | — |
| | — |
| | — |
| | (14 | ) | | — |
| | — |
| | (14 | ) | | — |
| | — |
| | (14 | ) |
| Capital increase related to equity-based compensation | — |
| | — |
| | — |
| | — |
| | 37,173 |
| | — |
| | — |
| | 37,173 |
| | — |
| | — |
| | 37,173 |
|
| Distributions | — |
| | — |
| | (4,383 | ) | | (4,781 | ) | | (90,618 | ) | | — |
| | — |
| | (99,782 | ) | | (7,394 | ) | | (87,096 | ) | | (194,272 | ) |
| Payments related to issuances of Class A shares for equity-based awards | 216,022 |
| | — |
| | — |
| | — |
| | — |
| | (5,590 | ) | | — |
| | (5,590 | ) | | — |
| | — |
| | (5,590 | ) |
| Repurchase of Class A shares | (721,653 | ) | | — |
| | — |
| | — |
| | (25,538 | ) | | — |
| | — |
| | (25,538 | ) | | — |
| | — |
| | (25,538 | ) |
| Exchange of AOG Units for Class A shares | 10,000 |
| | — |
| | — |
| | — |
| | 55 |
| | — |
| | — |
| | 55 |
| | — |
| | (53 | ) | | 2 |
|
| Net income | — |
| | — |
| | 4,383 |
| | 4,781 |
| | — |
| | 162,357 |
| | — |
| | 171,521 |
| | 11,340 |
| | 179,831 |
| | 362,692 |
|
| Currency translation adjustments, net of tax | — |
| | — |
| | — |
| | — |
| | — |
| | — |
| | (329 | ) | | (329 | ) | | (1,729 | ) | | (260 | ) | | (2,318 | ) |
| Net gain from change in fair value of cash flow hedge instruments | — |
| | — |
| | — |
| | — |
| | — |
| | — |
| | 13 |
| | 13 |
| | — |
| | 14 |
| | 27 |
|
| Net loss on available-for-sale securities | — |
| | — |
| | — |
| | — |
| | — |
| | — |
| | (154 | ) | | (154 | ) | | — |
| | (155 | ) | | (309 | ) |
| Balance at September 30, 2018 | 201,089,465 |
| | 1 |
| | $ | 264,398 |
| | $ | 289,815 |
| | $ | 1,350,331 |
| | $ | (273,535 | ) | | $ | (3,600 | ) | | $ | 1,627,409 |
| | $ | 271,379 |
| | $ | 1,095,041 |
| | $ | 2,993,829 |
|
| | | | | | | | | | | | | | | | | | | | | | |
| Balance at January 1, 2018 | 195,267,669 |
| | 1 |
| | $ | 264,398 |
| | $ | — |
| | $ | 1,579,797 |
| | $ | (379,460 | ) | | $ | (1,809 | ) | | $ | 1,462,926 |
| | $ | 140,086 |
| | $ | 1,294,784 |
| | $ | 2,897,796 |
|
| Adoption of new accounting guidance | — |
| | — |
| | — |
| | — |
| | (34 | ) | | (8,116 | ) | | — |
| | (8,150 | ) | | — |
| | (11,210 | ) | | (19,360 | ) |
| Dilution impact of issuance of Class A shares | — |
| | — |
| | — |
| | — |
| | 90 |
| | — |
| | — |
| | 90 |
| | — |
| | — |
| | 90 |
|
| Equity issued in connection with Preferred shares offering | — |
| | — |
| | — |
| | 289,815 |
| | — |
| | — |
| | — |
| | 289,815 |
| | — |
| | — |
| | 289,815 |
|
| Capital increase related to equity-based compensation | — |
| | — |
| | — |
| | — |
| | 94,238 |
| | — |
| | — |
| | 94,238 |
| | — |
| | — |
| | 94,238 |
|
| Capital contributions | — |
| | — |
| | — |
| | — |
| | — |
| | — |
| | — |
| | — |
| | 146,518 |
| | — |
| | 146,518 |
|
| Distributions | — |
| | — |
| | (13,149 | ) | | (9,350 | ) | | (309,780 | ) | | — |
| | — |
| | (332,279 | ) | | (29,028 | ) | | (348,276 | ) | | (709,583 | ) |
| Payments related to issuances of Class A shares for equity-based awards | 2,202,634 |
| | — |
| | — |
| | — |
| | — |
| | (40,329 | ) | | — |
| | (40,329 | ) | | — |
| | — |
| | (40,329 | ) |
| Repurchase of Class A shares | (1,571,438 | ) | | — |
| | — |
| | — |
| | (54,266 | ) | | — |
| | — |
| | (54,266 | ) | | — |
| | — |
| | (54,266 | ) |
| Exchange of AOG Units for Class A shares | 5,190,600 |
| | — |
| | — |
| | — |
| | 40,286 |
| | — |
| | — |
| | 40,286 |
| | — |
| | (32,880 | ) | | 7,406 |
|
| Net income | — |
| | — |
| | 13,149 |
| | 9,350 |
| | — |
| | 154,370 |
| | — |
| | 176,869 |
| | 26,035 |
| | 194,250 |
| | 397,154 |
|
| Currency translation adjustments, net of tax | — |
| | — |
| | — |
| | — |
| | — |
| | — |
| | (1,558 | ) | | (1,558 | ) | | (12,232 | ) | | (1,393 | ) | | (15,183 | ) |
| Net gain from change in fair value of cash flow hedge instruments | — |
| | — |
| | — |
| | — |
| | — |
| | — |
| | 39 |
| | 39 |
| | — |
| | 40 |
| | 79 |
|
| Net loss on available-for-sale securities | — |
| | — |
| | — |
| | — |
| | — |
| | — |
| | (272 | ) | | (272 | ) | | — |
| | (274 | ) | | (546 | ) |
| Balance at September 30, 2018 | 201,089,465 |
| | 1 |
| | $ | 264,398 |
| | $ | 289,815 |
| | $ | 1,350,331 |
| | $ | (273,535 | ) | | $ | (3,600 | ) | | $ | 1,627,409 |
| | $ | 271,379 |
| | $ | 1,095,041 |
| | $ | 2,993,829 |
|
The statements below for the three and nine months ended September 30, 2019 represent Apollo Global Management, Inc. as a corporation subsequent to the Conversion:
| | | | | | | | | | | | | | | | | | | | | | | | | | | | | |
| Apollo Global Management, Inc. Stockholders |
| Class A Shares | | Class A Common Stock | | Class B Shares | | Class B Common Stock | | Class C Common Stock |
| Balance at July 1, 2019 | 200,435,587 | | | — | | | 1 | | | — | | | 0 | |
| Issuance of Class C Common Stock resulting from the Conversion | — | | | — | | | — | | | — | | | 1 |
| Payments related to issuances of Class A Common Stock for equity-based awards | 226,456 | | | — | | | — | | | — | | | — | |
| Repurchase of Class A Common Stock | (143,000) | | | — | | | — | | | — | | | — | |
| Exchange of AOG Units for Class A Common Stock | 21,884,253 | | | — | | | — | | | — | | | — | |
| Reclassifications resulting from the Conversion | (222,403,296) | | | 222,403,296 | | | (1) | | | 1 | | | — | |
| Balance as at September 30, 2019 | — | | | 222,403,296 | | | — | | | 1 | | | 1 | |
| | | | | | | | | |
| Balance at January 1, 2019 | 201,400,500 | | | — | | | 1 | | | — | | | 0 | |
| Issuances of Class C Common Stock resulting from the Conversion | — | | | — | | | — | | | — | | | 1 | |
| Payments related to issuances of Class A Common Stock for equity-based awards | 2,737,557 | | | — | | | — | | | — | | | — | |
| Repurchase of Class A Common Stock | (3,719,014) | | | — | | | — | | | — | | | — | |
| Exchange of AOG Units for Class A Common Stock | 21,984,253 | | | — | | | — | | | — | | | — | |
| Reclassifications resulting from the Conversion | (222,403,296) | | | 222,403,296 | | | (1) | | | 1 | | — | |
| Balance as at September 30, 2019 | — | | | 222,403,296 | | | — | | | 1 | | 1 |
|
| | | | | | | | | | | | | | |
| | Apollo Global Management, Inc. Stockholders |
| | Class A Shares | | Class A
Common Stock | | Class B Shares | | Class B
Common Stock | | Class C
Common Stock |
| Balance at July 1, 2019 | 200,435,587 |
| | — |
| | 1 |
| | — |
| | — |
|
| Issuance of Class C Common Stock resulting from the Conversion | — |
| | — |
| | — |
| | — |
| | 1 |
|
| Payments related to issuances of Class A Common Stock for equity-based awards | 226,456 |
| | — |
| | — |
| | — |
| | — |
|
| Repurchase of Class A Common Stock | (143,000 | ) | | — |
| | — |
| | — |
| | — |
|
| Exchange of AOG Units for Class A Common Stock | 21,884,253 |
| | — |
| | — |
| | — |
| | — |
|
| Reclassifications resulting from the Conversion | (222,403,296 | ) | | 222,403,296 |
| | (1 | ) | | 1 |
| | — |
|
| Balance at September 30, 2019 | — |
| | 222,403,296 |
| | — |
| | 1 |
| | 1 |
|
| | | | | | | | | | |
| Balance at January 1, 2019 | 201,400,500 |
| | — |
| | 1 |
| | — |
| | — |
|
| Issuance of Class C Common Stock resulting from the Conversion | — |
| | — |
| | — |
| | — |
| | 1 |
|
| Payments related to issuances of Class A Common Stock for equity-based awards | 2,737,557 |
| | — |
| | — |
| | — |
| | — |
|
| Repurchase of Class A Common Stock | (3,719,014 | ) | | — |
| | — |
| | — |
| | — |
|
| Exchange of AOG Units for Class A Common Stock | 21,984,253 |
| | — |
| | — |
| | — |
| | — |
|
| Reclassifications resulting from the Conversion | (222,403,296 | ) | | 222,403,296 |
| | (1 | ) | | 1 |
| | — |
|
| Balance at September 30, 2019 | — |
| | 222,403,296 |
| | — |
| | 1 |
| | 1 |
|
| | | | | | | | | | | | | | | | | | | | | | | | | | | | | | | | | | | | | | | | | | | | | | | | | | | | | | | | | | | | | | | | | | | | | | |
| | | | | | | Apollo Global Management, Inc. Stockholders | | | | | | | | |
| | | | | | | Series A Preferred Shares | | Series A Preferred Stock | | Series B Preferred Shares | | Series B Preferred Stock | | Additional
Paid in
Capital | | Retained Earnings (Accumulated Deficit) | | Accumulated
Other
Comprehensive Loss | | Total Apollo
Global
Management,
Inc.
Shareholders’
Equity | | Non-
Controlling
Interests in
Consolidated
Entities | | Non-
Controlling
Interests in
Apollo
Operating
Group | | Total Shareholders’ Equity |
| Balance at July 1, 2019 | | | | | | $ | 264,398 | | | $ | — | | | $ | 289,815 | | | $ | — | | | $ | 1,052,259 | | | $ | (222,007) | | | $ | (5,192) | | | $ | 1,379,273 | | | $ | 280,662 | | | $ | 881,055 | | | $ | 2,540,990 | |
| | | | | | | | | | | | | | | | | | | | | | | | | | |
| Dilution impact of issuance of Class A Common Stock | | | | | | — | | | — | | | — | | | — | | | 17 | | | — | | | — | | | 17 | | | — | | | — | | | 17 | |
| | | | | | | | | | | | | | | | | | | | | | | | | | |
| Capital increase related to equity-based compensation | | | | | | — | | | — | | | — | | | — | | | 33,867 | | | — | | | — | | | 33,867 | | | — | | | — | | | 33,867 | |
| Capital contributions | | | | | | — | | | — | | | — | | | — | | | — | | | — | | | — | | | — | | | 555 | | | — | | | 555 | |
| Dividends | | | | | | (4,382) | | | — | | | (4,782) | | | — | | | 22,824 | | | (127,629) | | | — | | | (113,969) | | | (10,944) | | | (122,899) | | | (247,812) | |
| Payments related to issuances of Class A Common Stock for equity-based awards | | | | | | — | | | — | | | — | | | — | | | 860 | | | (4,470) | | | — | | | (3,610) | | | — | | | — | | | (3,610) | |
| Repurchase of Class A Common Stock | | | | | | — | | | — | | | — | | | — | | | (4,610) | | | — | | | — | | | (4,610) | | | — | | | — | | | (4,610) | |
| Exchange of AOG Units for Class A Common Stock | | | | | | — | | | — | | | — | | | — | | | 112,014 | | | — | | | — | | | 112,014 | | | — | | | (95,438) | | | 16,576 | |
| Net income | | | | | | 4,382 | | | — | | | 4,782 | | | — | | | — | | | 354,106 | | | — | | | 363,270 | | | 7,083 | | | 150,741 | | | 521,094 | |
| Currency translation adjustments, net of tax | | | | | | — | | | — | | | — | | | — | | | — | | | — | | | (1,625) | | | (1,625) | | | (11,340) | | | (1,651) | | | (14,616) | |
| Net gain from change in fair value of cash flow hedge instruments | | | | | | — | | | — | | | — | | | — | | | — | | | — | | | 25 | | | 25 | | | — | | | 25 | | | 50 | |
| | | | | | | | | | | | | | | | | | | | | | | | | | |
| Net loss on available-for-sale securities | | | | | | — | | | — | | | — | | | — | | | — | | | — | | | (35) | | | (35) | | | — | | | (33) | | | (68) | |
| Reclassification resulting from the Conversion | | | | | | (264,398) | | | 264,398 | | | (289,815) | | | 289,815 | | | — | | | — | | | — | | | — | | | — | | | — | | | — | |
| Balance at September 30, 2019 | | | | | | $ | 0 | | | $ | 264,398 | | | $ | 0 | | | $ | 289,815 | | | $ | 1,217,231 | | | $ | 0 | | | $ | (6,827) | | | $ | 1,764,617 | | | $ | 266,016 | | | $ | 811,800 | | | $ | 2,842,433 | |
| | | | | | | | | | | | | | | | | | | | | | | | | | |
| | | | | | | | | | | | | | | | | | | | | | | | | | |
| | | | | | | | | | | | | | | | | | | | | | | | | | |
| | | | | | | | | | | | | | | | | | | | | | | | | | |
| | | | | | | | | | | | | | | | | | | | | | | | | | |
| | | | | | | | | | | | | | | | | | | | | | | | | | |
| | | | | | | | | | | | | | | | | | | | | | | | | | |
| | | | | | | | | | | | | | | | | | | | | | | | | | |
| | | | | | | | | | | | | | | | | | | | | | | | | | |
| | | | | | | | | | | | | | | | | | | | | | | | | | |
| | | | | | | | | | | | | | | | | | | | | | | | | | |
| | | | | | | | | | | | | | | | | | | | | | | | | | |
| | | | | | | | | | | | | | | | | | | | | | | | | | |
| | | | | | | | | | | | | | | | | | | | | | | | | | |
| | | | | | | | | | | | | | | | | | | | | | | | | | |
| | | | | | | | | | | | | | | | | | | | | | | | | | |
| | | | | | | | | | | | | | | | | | | | | | | | | | |
| | | | | | | | | | | | | | | | | | | | | | | | | | |
| | | | | | | | | | | | | | | | | | | | | | | | | | | | | | | | | | | | | | | | | | | | | | | | | | | | | | | | | | | | | | | | | | | | | | |
| | | | | | | Apollo Global Management, Inc. Stockholders | | | | | | | | |
| | | | | | | Series A Preferred Shares | | Series A Preferred Stock | | Series B Preferred Shares | | Series B Preferred Stock | | Additional
Paid in
Capital | | Retained Earnings (Accumulated Deficit) | | Accumulated
Other
Comprehensive Loss | | Total Apollo
Global
Management,
Inc.
Shareholders’
Equity | | Non-
Controlling
Interests in
Consolidated
Entities | | Non-
Controlling
Interests in
Apollo
Operating
Group | | Total Shareholders’ Equity |
| | | | | | | | | | | | | | | | | | | | | | | | | | |
| | | | | | | | | | | | | | | | | | | | | | | | | | |
| | | | | | | | | | | | | | | | | | | | | | | | | | |
| | | | | | | | | | | | | | | | | | | | | | | | | | |
| | | | | | | | | | | | | | | | | | | | | | | | | | |
| | | | | | | | | | | | | | | | | | | | | | | | | | |
| | | | | | | | | | | | | | | | | | | | | | | | | | |
| | | | | | | | | | | | | | | | | | | | | | | | | | |
| | | | | | | | | | | | | | | | | | | | | | | | | | |
| | | | | | | | | | | | | | | | | | | | | | | | | | |
| | | | | | | | | | | | | | | | | | | | | | | | | | |
| | | | | | | | | | | | | | | | | | | | | | | | | | |
| | | | | | | | | | | | | | | | | | | | | | | | | | |
| | | | | | | | | | | | | | | | | | | | | | | | | | |
| | | | | | | | | | | | | | | | | | | | | | | | | | |
| | | | | | | | | | | | | | | | | | | | | | | | | | |
| | | | | | | | | | | | | | | | | | | | | | | | | | |
| | | | | | | | | | | | | | | | | | | | | | | | | | |
| Balance at January 1, 2019 | | | | | | $ | 264,398 | | | $ | — | | | $ | 289,815 | | | $ | — | | | $ | 1,299,418 | | | $ | (473,276) | | | $ | (4,159) | | | $ | 1,376,196 | | | $ | 271,522 | | | $ | 804,122 | | | $ | 2,451,840 | |
| | | | | | | | | | | | | | | | | | | | | | | | | | |
| Dilution impact of issuance of Class A Common Stock | | | | | | — | | | — | | | — | | | — | | | (8) | | | — | | | — | | | (8) | | | — | | | — | | | (8) | |
| | | | | | | | | | | | | | | | | | | | | | | | | | |
| Capital increase related to equity-based compensation | | | | | | — | | | — | | | — | | | — | | | 102,189 | | | — | | | — | | | 102,189 | | | — | | | — | | | 102,189 | |
| Capital contributions | | | | | | — | | | — | | | — | | | — | | | — | | | — | | | — | | | — | | | 1,081 | | | — | | | 1,081 | |
| Dividends | | | | | | (13,148) | | | — | | | (14,344) | | | — | | | (191,796) | | | (127,629) | | | — | | | (346,917) | | | (14,103) | | | (374,619) | | | (735,639) | |
| Payments related to issuances of Class A Common Stock for equity-based awards | | | | | | — | | | — | | | — | | | — | | | 5,690 | | | (48,753) | | | — | | | (43,063) | | | — | | | — | | | (43,063) | |
| Repurchase of Class A Common Stock | | | | | | — | | | — | | | — | | | — | | | (110,726) | | | — | | | — | | | (110,726) | | | — | | | — | | | (110,726) | |
| Exchange of AOG Units for Class A Common Stock | | | | | | — | | | — | | | — | | | — | | | 112,464 | | | — | | | — | | | 112,464 | | | — | | | (95,806) | | | 16,658 | |
| Net income | | | | | | 13,148 | | | — | | | 14,344 | | | — | | | — | | | 649,658 | | | — | | | 677,150 | | | 20,888 | | | 480,784 | | | 1,178,822 | |
| Currency translation adjustments, net of tax | | | | | | — | | | — | | | — | | | — | | | — | | | — | | | (1,820) | | | (1,820) | | | (13,372) | | | (1,829) | | | (17,021) | |
| Net loss from change in fair value of cash flow hedge instruments | | | | | | — | | | — | | | — | | | — | | | — | | | — | | | (927) | | | (927) | | | — | | | (935) | | | (1,862) | |
| Net gain on available-for-sale securities | | | | | | — | | | — | | | — | | | — | | | — | | | — | | | 79 | | | 79 | | | — | | | 83 | | | 162 | |
| Reclassifications resulting from the Conversion | | | | | | (264,398) | | | 264,398 | | | (289,815) | | | 289,815 | | | — | | | — | | | — | | | — | | | — | | | — | | | — | |
| Balance at September 30, 2019 | | | | | | $ | 0 | | | $ | 264,398 | | | $ | 0 | | | $ | 289,815 | | | $ | 1,217,231 | | | $ | 0 | | | $ | (6,827) | | | $ | 1,764,617 | | | $ | 266,016 | | | $ | 811,800 | | | $ | 2,842,433 | |
|
| | | | | | | | | | | | | | | | | | | | | | | | | | | | | | | | | | | | | | | | | | | |
| | Apollo Global Management, Inc. Stockholders | | | | | | | | |
| | Series A Preferred Shares | | Series A Preferred Stock | | Series B Preferred Shares | | Series B Preferred Stock | | Additional
Paid in
Capital | | Retained Earnings (Accumulated
Deficit) | | Accumulated
Other
Comprehensive Loss | | Total Apollo
Global
Management,
Inc.
Stockholders’
Equity | | Non-
Controlling
Interests in
Consolidated
Entities | | Non-
Controlling
Interests in
Apollo
Operating
Group | | Total
Stockholders’
Equity |
| Balance at July 1, 2019 | $ | 264,398 |
| | $ | — |
| | $ | 289,815 |
| | $ | — |
| | $ | 1,052,259 |
| | $ | (222,007 | ) | | $ | (5,192 | ) | | $ | 1,379,273 |
| | $ | 280,662 |
| | $ | 881,055 |
| | $ | 2,540,990 |
|
| Dilution impact of issuance of Class A Common Stock | — |
| | — |
| | — |
| | — |
| | 17 |
| | — |
| | — |
| | 17 |
| | — |
| | — |
| | 17 |
|
| Capital increase related to equity-based compensation | — |
| | — |
| | — |
| | — |
| | 33,867 |
| | — |
| | — |
| | 33,867 |
| | — |
| | — |
| | 33,867 |
|
| Capital contributions | — |
| | — |
| | — |
| | — |
| | — |
| | — |
| | — |
| | — |
| | 555 |
| | — |
| | 555 |
|
| Dividends | (4,382 | ) | | — |
| | (4,782 | ) | | — |
| | 22,824 |
| | (127,629 | ) | | — |
| | (113,969 | ) | | (10,944 | ) | | (122,899 | ) | | (247,812 | ) |
| Payments related to issuances of Class A Common Stock for equity-based awards | — |
| | — |
| | — |
| | — |
| | 860 |
| | (4,470 | ) | | — |
| | (3,610 | ) | | — |
| | — |
| | (3,610 | ) |
| Repurchase of Class A Common Stock | — |
| | — |
| | — |
| | — |
| | (4,610 | ) | | — |
| | — |
| | (4,610 | ) | | — |
| | — |
| | (4,610 | ) |
| Exchange of AOG Units for Class A Common Stock | — |
| | — |
| | — |
| | — |
| | 112,014 |
| | — |
| | — |
| | 112,014 |
| | — |
| | (95,438 | ) | | 16,576 |
|
| Net income | 4,382 |
| | — |
| | 4,782 |
| | — |
| | — |
| | 354,106 |
| | — |
| | 363,270 |
| | 7,083 |
| | 150,741 |
| | 521,094 |
|
| Currency translation adjustments, net of tax | — |
| | — |
| | — |
| | — |
| | — |
| | — |
| | (1,625 | ) | | (1,625 | ) | | (11,340 | ) | | (1,651 | ) | | (14,616 | ) |
| Net gain from change in fair value of cash flow hedge instruments | — |
| | — |
| | — |
| | — |
| | — |
| | — |
| | 25 |
| | 25 |
| | — |
| | 25 |
| | 50 |
|
| Net loss on available-for-sale securities | — |
| | — |
| | — |
| | — |
| | — |
| | — |
| | (35 | ) | | (35 | ) | | — |
| | (33 | ) | | (68 | ) |
| Reclassifications resulting from the Conversion | (264,398 | ) | | 264,398 |
| | (289,815 | ) | | 289,815 |
| | — |
| | — |
| | — |
| | — |
| | — |
| | — |
| | — |
|
| Balance at September 30, 2019 | $ | — |
| | $ | 264,398 |
| | $ | — |
| | $ | 289,815 |
| | $ | 1,217,231 |
| | $ | — |
| | $ | (6,827 | ) | | $ | 1,764,617 |
| | $ | 266,016 |
| | $ | 811,800 |
| | $ | 2,842,433 |
|
| | | | | | | | | | | | | | | | | | | | | | | | | | | | | | | | | | | | | | | | | | | | | | | | | | | | | | | | | | | | | | | | | | | | | | | | | | | |
| | Apollo Global Management, Inc. Stockholders | | | | | | | | |
| | Class A Common Stock | | Class B Common Stock | | Class C Common Stock | | | | Series A Preferred Stock | | | | Series B Preferred Stock | | Additional
Paid in
Capital | | Accumulated
Deficit | | Accumulated
Other
Comprehensive Loss | | Total Apollo
Global
Management,
Inc.
Stockholders’
Equity | | Non-
Controlling
Interests in
Consolidated
Entities | | Non-
Controlling
Interests in
Apollo
Operating
Group | | Total
Stockholders’
Equity |
| Balance at July 1, 2020 | 229,189,715 | | | 1 | | | 1 | | | | | 264,398 | | | | | 289,815 | | | 1,032,442 | | | (653,745) | | | (3,879) | | | 929,031 | | | 2,107,870 | | | 1,205,036 | | | 4,241,937 | |
| Dilution impact of issuance of Class A Common Stock | — | | | — | | | — | | | | | — | | | | | — | | | (43) | | | — | | | — | | | (43) | | | — | | | — | | | (43) | |
| Capital increase related to equity-based compensation | — | | | — | | | — | | | | | — | | | | | — | | | 40,620 | | | — | | | — | | | 40,620 | | | — | | | — | | | 40,620 | |
| Capital contributions | — | | | — | | | — | | | | | — | | | | | — | | | — | | | — | | | — | | | — | | | 8,240 | | | — | | | 8,240 | |
| Dividends/ Distributions | — | | | — | | | — | | | | | (4,382) | | | | | (4,781) | | | (116,083) | | | 0 | | | — | | | (125,246) | | | (538,513) | | | (99,974) | | | (763,733) | |
| Payments related to issuances of Class A Common Stock for equity-based awards | 118,587 | | | — | | | — | | | | | — | | | | | — | | | 0 | | | (6,386) | | | — | | | (6,386) | | | — | | | — | | | (6,386) | |
| Repurchase of Class A Common Stock | (561,000) | | | — | | | — | | | | | — | | | | | — | | | (27,412) | | | — | | | — | | | (27,412) | | | — | | | — | | | (27,412) | |
| | | | | | | | | | | | | | | | | | | | | | | | | | | |
| Net income (loss) | — | | | — | | | — | | | | | 4,382 | | | | | 4,781 | | | — | | | 263,236 | | | — | | | 272,399 | | | 100,021 | | | 303,679 | | | 676,099 | |
| Currency translation adjustments, net of tax | — | | | — | | | — | | | | | — | | | | | — | | | — | | | — | | | 6,510 | | | 6,510 | | | 11,288 | | | 1,726 | | | 19,524 | |
| Net gain from change in fair value of cash flow hedge instruments | — | | | — | | | — | | | | | — | | | | | — | | | — | | | — | | | 28 | | | 28 | | | — | | | 24 | | | 52 | |
| Net loss on available-for-sale securities | — | | | — | | | — | | | | | — | | | | | — | | | — | | | — | | | 63 | | | 63 | | | — | | | 43 | | | 106 | |
| Balance at September 30, 2020 | 228,747,302 | | | 1 | | | 1 | | | | | $ | 264,398 | | | | | $ | 289,815 | | | $ | 929,524 | | | $ | (396,895) | | | $ | 2,722 | | | $ | 1,089,564 | | | $ | 1,688,906 | | | $ | 1,410,534 | | | $ | 4,189,004 | |
| | | | | | | | | | | | | | | | | | | | | | | | | | | |
| Balance at January 1, 2020 | 222,994,407 | | | 1 | | | 1 | | | | | 264,398 | | | | | 289,815 | | | 1,302,587 | | | 0 | | | (4,578) | | | 1,852,222 | | | 281,904 | | | 904,001 | | | 3,038,127 | |
| | | | | | | | | | | | | | | | | | | | | | | | | | | |
| Equity transaction with Athene Holding | — | | | — | | | — | | | | | — | | | | | — | | | (54,868) | | | — | | | — | | | (54,868) | | | — | | | 1,214,577 | | | 1,159,709 | |
| Consolidation of VIEs | — | | | — | | | — | | | | | — | | | | | — | | | — | | | — | | | — | | | — | | | 1,895,095 | | | — | | | 1,895,095 | |
| Dilution impact of issuance of Class A Common Stock | — | | | — | | | — | | | | | — | | | | | — | | | 8,286 | | | — | | | — | | | 8,286 | | | — | | | — | | | 8,286 | |
| | | | | | | | | | | | | | | | | | | | | | | | | | | |
| Capital increase related to equity-based compensation | — | | | — | | | — | | | | | — | | | | | — | | | 133,850 | | | — | | | — | | | 133,850 | | | — | | | — | | | 133,850 | |
| Capital contributions | — | | | — | | | — | | | | | — | | | | | — | | | — | | | — | | | — | | | — | | | 190,093 | | | — | | | 190,093 | |
| Dividends/ Distributions | — | | | — | | | — | | | | | (13,148) | | | | | (14,344) | | | (428,721) | | | 0 | | | — | | | (456,213) | | | (666,083) | | | (384,274) | | | (1,506,570) | |
| Payments related to issuances of Class A Common Stock for equity-based awards | 3,270,490 | | | — | | | — | | | | | — | | | | | — | | | 28,991 | | | (91,913) | | | — | | | (62,922) | | | — | | | — | | | (62,922) | |
| Repurchase of Class A Common Stock | (2,755,095) | | | — | | | — | | | | | — | | | | | — | | | (91,617) | | | — | | | — | | | (91,617) | | | — | | | — | | | (91,617) | |
| Exchange of AOG Units for Class A Common Stock | 5,237,500 | | | — | | | — | | | | | — | | | | | — | | | 31,016 | | | — | | | — | | | 31,016 | | | — | | | (16,967) | | | 14,049 | |
| Net income (loss) | — | | | — | | | — | | | | | 13,148 | | | | | 14,344 | | | — | | | (304,982) | | | — | | | (277,490) | | | (23,320) | | | (307,849) | | | (608,659) | |
| Currency translation adjustments, net of tax | — | | | — | | | — | | | | | — | | | | | — | | | — | | | — | | | 7,891 | | | 7,891 | | | 11,217 | | | 1,544 | | | 20,652 | |
| Net gain from change in fair value of cash flow hedge instruments | — | | | — | | | — | | | | | — | | | | | — | | | — | | | — | | | 82 | | | 82 | | | — | | | 71 | | | 153 | |
| Net loss on available-for-sale securities | — | | | — | | | — | | | | | — | | | | | — | | | — | | | — | | | (673) | | | (673) | | | — | | | (569) | | | (1,242) | |
| Balance at September 30, 2020 | 228,747,302 | | | 1 | | | 1 | | | | | $ | 264,398 | | | | | $ | 289,815 | | | $ | 929,524 | | | $ | (396,895) | | | $ | 2,722 | | | $ | 1,089,564 | | | $ | 1,688,906 | | | $ | 1,410,534 | | | $ | 4,189,004 | |
|
| | | | | | | | | | | | | | | | | | | | | | | | | | | | | | | | | | | | | | | | | | | |
| | Apollo Global Management, Inc. Stockholders | | | | | | | | |
| | Series A Preferred Shares | | Series A Preferred Stock | | Series B Preferred Shares | | Series B Preferred Stock | | Additional Paid in Capital | | Retained Earnings (Accumulated
Deficit) | | Accumulated Other Comprehensive Loss | | Total Apollo Global Management, Inc. Stockholders’ Equity | | Non- Controlling Interests in Consolidated Entities | | Non- Controlling Interests in Apollo Operating Group | | Total Stockholders’ Equity |
| Balance at January 1, 2019 | $ | 264,398 |
| | $ | — |
| | $ | 289,815 |
| | $ | — |
| | $ | 1,299,418 |
| | $ | (473,276 | ) | | $ | (4,159 | ) | | $ | 1,376,196 |
| | $ | 271,522 |
| | $ | 804,122 |
| | $ | 2,451,840 |
|
| Dilution impact of issuance of Class A Common Stock | — |
| | — |
| | — |
| | — |
| | (8 | ) | | — |
| | — |
| | (8 | ) | | — |
| | — |
| | (8 | ) |
| Capital increase related to equity-based compensation | — |
| | — |
| | — |
| | — |
| | 102,189 |
| | — |
| | — |
| | 102,189 |
| | — |
| | — |
| | 102,189 |
|
| Capital contributions | — |
| | — |
| | — |
| | — |
| | — |
| | — |
| | — |
| | — |
| | 1,081 |
| | — |
| | 1,081 |
|
| Dividends | (13,148 | ) | | — |
| | (14,344 | ) | | — |
| | (191,796 | ) | | (127,629 | ) | | — |
| | (346,917 | ) | | (14,103 | ) | | (374,619 | ) | | (735,639 | ) |
| Payments related to issuances of Class A Common Stock for equity-based awards | — |
| | — |
| | — |
| | — |
| | 5,690 |
| | (48,753 | ) | | — |
| | (43,063 | ) | | — |
| | — |
| | (43,063 | ) |
| Repurchase of Class A Common Stock | — |
| | — |
| | — |
| | — |
| | (110,726 | ) | | — |
| | — |
| | (110,726 | ) | | — |
| | — |
| | (110,726 | ) |
| Exchange of AOG Units for Class A Common Stock | — |
| | — |
| | — |
| | — |
| | 112,464 |
| | — |
| | — |
| | 112,464 |
| | — |
| | (95,806 | ) | | 16,658 |
|
| Net income | 13,148 |
| | — |
| | 14,344 |
| | — |
| | — |
| | 649,658 |
| | — |
| | 677,150 |
| | 20,888 |
| | 480,784 |
| | 1,178,822 |
|
| Currency translation adjustments, net of tax | — |
| | — |
| | — |
| | — |
| | — |
| | — |
| | (1,820 | ) | | (1,820 | ) | | (13,372 | ) | | (1,829 | ) | | (17,021 | ) |
| Net loss from change in fair value of cash flow hedge instruments | — |
| | — |
| | — |
| | — |
| | — |
| | — |
| | (927 | ) | | (927 | ) | | — |
| | (935 | ) | | (1,862 | ) |
| Net gain on available-for-sale securities | — |
| | — |
| | — |
| | — |
| | — |
| | — |
| | 79 |
| | 79 |
| | — |
| | 83 |
| | 162 |
|
| Reclassifications resulting from the Conversion | (264,398 | ) | | 264,398 |
| | (289,815 | ) | | 289,815 |
| | — |
| | — |
| | — |
| | — |
| | — |
| | — |
| | — |
|
| Balance at September 30, 2019 | $ | — |
| | $ | 264,398 |
| | $ | — |
| | $ | 289,815 |
| | $ | 1,217,231 |
| | $ | — |
| | $ | (6,827 | ) | | $ | 1,764,617 |
| | $ | 266,016 |
| | $ | 811,800 |
| | $ | 2,842,433 |
|
See accompanying notes to condensed consolidated financial statements.
APOLLO GLOBAL MANAGEMENT, INC.
CONDENSED CONSOLIDATED STATEMENTS OF CASH FLOWS (UNAUDITED)
FOR THE NINE MONTHS ENDED SEPTEMBER 30, 20192020 AND 20182019
(dollars in thousands, except share data)
| | | | | | | | | | | |
| For the Nine Months Ended
September 30, |
| 2020 | | 2019 |
| Cash Flows from Operating Activities: | | | |
| Net income (loss) | $ | (608,659) | | | $ | 1,178,822 | |
| Adjustments to reconcile net income (loss) to net cash provided by operating activities: | | | |
| Equity-based compensation | 161,268 | | | 132,404 | |
| Depreciation and amortization | 13,058 | | | 11,442 | |
| Unrealized (gains) losses from investment activities | 839,902 | | | (39,250) | |
| Principal investment (income) loss | 25,506 | | | (99,020) | |
| Performance allocations | 350,483 | | | (682,462) | |
| Change in fair value of contingent obligations | 3,629 | | | 23,740 | |
| Loss from change in tax receivable agreement liability | 0 | | | 38,575 | |
| Deferred taxes, net | (114,399) | | | (207,630) | |
| Net loss related to cash flow hedge instruments | 0 | | | (1,974) | |
| Non-cash lease expense | 32,991 | | | 34,592 | |
| Other non-cash amounts included in net income (loss), net | (6,550) | | | (24,686) | |
| Cash flows due to changes in operating assets and liabilities: | | | |
| Incentive fees receivable | 1,386 | | | 3,699 | |
| Due from related parties | (65,856) | | | (64,891) | |
| Accounts payable and accrued expenses | 49,300 | | | 25,942 | |
| Accrued compensation and benefits | 155,865 | | | 92,578 | |
| Deferred revenue | 38,805 | | | 69,395 | |
| Due to related parties | 1,601 | | | 56 | |
| Profit sharing payable | (82,695) | | | 219,564 | |
| Lease liability | (16,784) | | | (24,266) | |
| Other assets and other liabilities, net | (57,898) | | | (62,247) | |
| Cash distributions of earnings from principal investments | 16,538 | | | 34,311 | |
| Cash distributions of earnings from performance allocations | 220,948 | | | 193,833 | |
| Satisfaction of contingent obligations | (12,870) | | | (1,827) | |
| Apollo Fund and VIE related: | | | |
| Net realized and unrealized (gains) losses from investing activities and debt | 154,613 | | | (22,568) | |
| Cash transferred from consolidated VIEs | 502,153 | | | 0 | |
| Purchases of investments | (1,557,686) | | | (309,262) | |
| Proceeds from sale of investments | 1,691,247 | | | 301,591 | |
| Changes in other assets and other liabilities, net | (221,180) | | | 14,551 | |
| Net Cash Provided by Operating Activities | $ | 1,514,716 | | | $ | 835,012 | |
| Cash Flows from Investing Activities: | | | |
| Purchases of fixed assets | $ | (48,084) | | | $ | (18,600) | |
| Acquisitions | 48,518 | | | 0 | |
| Proceeds from sale of investments | 21,855 | | | 2,810 | |
| Purchase of investments | (528,462) | | | (15,048) | |
| Purchase of U.S. Treasury securities | (1,056,827) | | | (541,530) | |
| Proceeds from maturities of U.S. Treasury securities | 1,598,357 | | | 390,336 | |
| Cash contributions to equity method investments | (194,374) | | | (116,498) | |
| Cash distributions from equity method investments | 141,684 | | | 47,869 | |
|
| | | | | | | |
| | For the Nine Months Ended
September 30, |
| | 2019 | | 2018 |
| Cash Flows from Operating Activities: | | | |
| Net income | $ | 1,178,822 |
| | $ | 397,154 |
|
| Adjustments to reconcile net income to net cash provided by operating activities: | | | |
| Equity-based compensation | 132,404 |
| | 123,643 |
|
| Depreciation and amortization | 11,442 |
| | 11,215 |
|
| Unrealized gains from investment activities | (39,250 | ) | | (14,555 | ) |
| Principal investment income | (99,020 | ) | | (25,334 | ) |
| Performance allocations | (682,462 | ) | | (129,776 | ) |
| Change in fair value of contingent obligations | 23,740 |
| | (7,953 | ) |
| Loss from change in tax receivable agreement liability | 38,575 |
| | — |
|
| Deferred taxes, net | (207,630 | ) | | 38,682 |
|
| Net loss related to cash flow hedge instruments | (1,974 | ) | | — |
|
| Non-cash lease expense | 34,592 |
| | — |
|
| Other non-cash amounts included in net income, net | (24,686 | ) | | (18,768 | ) |
| Cash flows due to changes in operating assets and liabilities: | | | |
| Incentive fees receivable | 3,699 |
| | (258 | ) |
| Due from related parties | (64,891 | ) | | (65,697 | ) |
| Accounts payable and accrued expenses | 25,942 |
| | 13,135 |
|
| Accrued compensation and benefits | 92,578 |
| | 97,042 |
|
| Deferred revenue | 69,395 |
| | 56,426 |
|
| Due to related parties | 56 |
| | (912 | ) |
| Profit sharing payable | 219,564 |
| | 4,457 |
|
| Lease liability | (24,266 | ) | | — |
|
| Other assets and other liabilities, net | (62,247 | ) | | (7,075 | ) |
| Cash distributions of earnings from principal investments | 34,311 |
| | 55,913 |
|
| Cash distributions of earnings from performance allocations | 193,833 |
| | 350,012 |
|
| Satisfaction of contingent obligations | (1,827 | ) | | (6,947 | ) |
| Apollo Fund and VIE related: | | | |
| Net realized and unrealized gains from investing activities and debt | (22,568 | ) | | (33,341 | ) |
| Purchases of investments | (309,262 | ) | | (359,847 | ) |
| Proceeds from sale of investments | 301,591 |
| | 341,745 |
|
| Changes in other assets and other liabilities, net | 14,551 |
| | (48,071 | ) |
| Net Cash Provided by Operating Activities | $ | 835,012 |
| | $ | 770,890 |
|
| Cash Flows from Investing Activities: | | | |
| Purchases of fixed assets | $ | (18,600 | ) | | $ | (10,010 | ) |
| Proceeds from sale of investments | 2,810 |
| | 49,239 |
|
| Purchase of investments | (15,048 | ) | | (80,677 | ) |
| Purchase of U.S. Treasury securities | (541,530 | ) | | (449,865 | ) |
| Proceeds from maturities of U.S. Treasury securities | 390,336 |
| | 425,830 |
|
| Cash contributions to principal investments | (116,498 | ) | | (185,372 | ) |
| Cash distributions from principal investments | 47,869 |
| | 84,036 |
|
| Issuance of related party loans | (1,775 | ) | | (2,995 | ) |
| Other investing activities | 144 |
| | 210 |
|
| Net Cash Used in Investing Activities | $ | (252,292 | ) | | $ | (169,604 | ) |
| Cash Flows from Financing Activities: | | | |
| Principal repayments of debt | $ | (29 | ) | | $ | (300,000 | ) |
| Issuance of Preferred Stock, net of issuance costs | — |
| | 289,815 |
|
| Dividends to Preferred Stockholders | (27,492 | ) | | (22,499 | ) |
| Issuance of debt | 1,005,964 |
| | 303,267 |
|
| Satisfaction of tax receivable agreement | (37,234 | ) | | (50,267 | ) |
| Repurchase of Class A Common Stock | (110,726 | ) | | (81,858 | ) |
| Payments related to deliveries of Class A Common Stock for RSUs | (48,753 | ) | | (40,329 | ) |
| Dividends paid | (319,425 | ) | | (309,780 | ) |
| Distributions paid to Non-Controlling Interests in Apollo Operating Group | (374,619 | ) | | (348,276 | ) |
| Other financing activities | (18,401 | ) | | (8,138 | ) |
| Apollo Fund and VIE related: | | | |
| Principal repayment of debt | — |
| | (92,153 | ) |
| Distributions paid to Non-Controlling Interests in consolidated entities | (11,347 | ) | | (24,988 | ) |
| Contributions from Non-Controlling Interests in consolidated entities | 860 |
| | 147,189 |
|
| Net Cash Provided by (Used in) Financing Activities | $ | 58,798 |
| | $ | (538,017 | ) |
| Net Increase in Cash and Cash Equivalents, Restricted Cash and Cash Held at Consolidated Variable Interest Entities | 641,518 |
| | 63,269 |
|
| Cash and Cash Equivalents, Restricted Cash and Cash Held at Consolidated Variable Interest Entities, Beginning of Period | 662,875 |
| | 848,060 |
|
| Cash and Cash Equivalents, Restricted Cash and Cash Held at Consolidated Variable Interest Entities, End of Period | $ | 1,304,393 |
| | $ | 911,329 |
|
| Supplemental Disclosure of Cash Flow Information: | | | |
| Interest paid | $ | 54,584 |
| | $ | 33,692 |
|
| Interest paid by consolidated variable interest entities | 10,602 |
| | 12,979 |
|
| Income taxes paid | 42,253 |
| | 8,036 |
|
| Supplemental Disclosure of Non-Cash Investing Activities: | | | |
| Non-cash distributions from principal investments | $ | (1,098 | ) | | $ | (26,817 | ) |
| Non-cash purchases of other investments, at fair value | — |
| | 194,003 |
|
| Non-cash sales of other investments, at fair value | — |
| | (46,623 | ) |
| Supplemental Disclosure of Non-Cash Financing Activities: | | | |
| Capital increases related to equity-based compensation | $ | 102,189 |
| | $ | 94,238 |
|
| Issuance of restricted shares | 5,690 |
| | — |
|
| Other non-cash financing activities | (8 | ) | | 90 |
|
| Adjustments related to exchange of Apollo Operating Group units: | | | |
| Deferred tax assets | $ | 168,058 |
| | $ | 47,011 |
|
| Due to related parties | (39,092 | ) | | (39,605 | ) |
| Additional paid in capital | (16,658 | ) | | (7,406 | ) |
| Non-Controlling Interest in Apollo Operating Group | 95,806 |
| | 32,880 |
|
| | | | |
| Reconciliation of Cash and Cash Equivalents, Restricted Cash and Cash Held at Consolidated Variable Interest Entities to the Condensed Consolidated Statements of Financial Condition: | | | |
| Cash and cash equivalents | $ | 1,242,817 |
| | $ | 854,574 |
|
| Restricted cash | 19,777 |
| | 3,460 |
|
| Cash held at consolidated variable interest entities | 41,799 |
| | 53,295 |
|
| Total Cash and Cash Equivalents, Restricted Cash and Cash and Cash Equivalents Held at Consolidated Variable Interest Entities | $ | 1,304,393 |
| | $ | 911,329 |
|
| | | | | | | | | | | |
| Issuance of related party loans | (315) | | | (1,775) | |
| Repayment of related party loans | 9,040 | | | 0 | |
| Other investing activities | 1,141 | | | 144 | |
| Net Cash Used in Investing Activities | $ | (7,467) | | | $ | (252,292) | |
| Cash Flows from Financing Activities: | | | |
| Principal repayments of debt | $ | (16,990) | | | $ | (29) | |
| | | |
| Dividends to Preferred Stockholders | (27,492) | | | (27,492) | |
| Issuance of debt | 518,756 | | | 1,005,964 | |
| Satisfaction of tax receivable agreement | (48,195) | | | (37,234) | |
| Repurchase of Class A Common Stock | (91,617) | | | (110,726) | |
| Payments related to deliveries of Class A Common Stock for RSUs | (91,913) | | | (48,753) | |
| Dividends paid | (428,721) | | | (319,425) | |
| Distributions paid to Non-Controlling Interests in Apollo Operating Group | (384,274) | | | (374,619) | |
| Issuance of related party loans | (28,280) | | | 0 | |
| Repayment of related party loans | 28,280 | | | 0 | |
| Other financing activities | (9,890) | | | (18,401) | |
| Apollo Fund and VIE related: | | | |
| Issuance of debt | 830,838 | | | 0 | |
| Principal repayment of debt | (828,975) | | | 0 | |
| Issuances of debt within other liabilities of consolidated VIEs | 68,819 | | | 0 | |
| Distributions paid to Non-Controlling Interests in consolidated entities | (146,867) | | | (11,347) | |
| Contributions from Non-Controlling Interests in consolidated entities | 189,831 | | | 860 | |
| Net Cash Provided by (Used in) Financing Activities | $ | (466,690) | | | $ | 58,798 | |
| Net Increase (Decrease) in Cash and Cash Equivalents, Restricted Cash and Cash Held at Consolidated Variable Interest Entities | 1,040,559 | | | 641,518 | |
| Cash and Cash Equivalents, Restricted Cash and Cash Held at Consolidated Variable Interest Entities, Beginning of Period | 1,621,310 | | | 662,875 | |
| Cash and Cash Equivalents, Restricted Cash and Cash Held at Consolidated Variable Interest Entities, End of Period | $ | 2,661,869 | | | $ | 1,304,393 | |
| Supplemental Disclosure of Cash Flow Information: | | | |
| Interest paid | $ | 88,953 | | | $ | 54,584 | |
| Interest paid by consolidated variable interest entities | 134,460 | | | 10,602 | |
| Income taxes paid | 28,107 | | | 42,253 | |
| Supplemental Disclosure of Non-Cash Investing Activities: | | | |
| | | |
| Non-cash distributions from principal investments | $ | (4,678) | | | $ | (1,098) | |
| Non-cash purchases of other investments, at fair value | 1,153,316 | | | 0 | |
| Non-cash loss on Athene equity swap | (61,261) | | | 0 | |
| | | |
| Acquisition of goodwill | 663 | | | 0 | |
| Contingent consideration | (6,208) | | | 0 | |
| Supplemental Disclosure of Non-Cash Financing Activities: | | | |
| Capital increases related to equity-based compensation | $ | 133,850 | | | $ | 102,189 | |
| Issuance of restricted shares | 28,991 | | | 5,690 | |
| Non-cash issuance of AOG units to Athene | 1,214,577 | | | 0 | |
| Other non-cash financing activities | 8,286 | | | (8) | |
| Non-cash distributions paid to Non-Controlling Interests in consolidated variable interest entities | (515,558) | | | 0 | |
| Net Assets Transferred from Consolidated Variable Interest Entity: | | | |
| Investments, at fair value | $ | 9,061,907 | | | $ | 0 | |
| Other assets | 130,907 | | | 0 | |
| Debt, at fair value | (7,344,884) | | | 0 | |
| | | | | | | | | | | |
| Other liabilities | (967,575) | | | 0 | |
| Non-Controlling interest in consolidated entities related to acquisition | (1,382,509) | | | 0 | |
| Adjustments related to exchange of Apollo Operating Group units: | | | |
| Deferred tax assets | $ | 76,580 | | | $ | 168,058 | |
| Due to related parties | (62,531) | | | (39,092) | |
| Additional paid in capital | (14,049) | | | (16,658) | |
| Non-Controlling Interest in Apollo Operating Group | 16,967 | | | 95,806 | |
| | | |
| Reconciliation of Cash and Cash Equivalents, Restricted Cash and Cash and Cash Equivalents Held at Consolidated Variable Interest Entities to the Consolidated Statements of Financial Condition: | | | |
| Cash and cash equivalents | $ | 1,838,646 | | | $ | 1,242,817 | |
| Restricted cash | 17,694 | | | 19,777 | |
| Cash and cash equivalents held at consolidated variable interest entities | 805,529 | | | 41,799 | |
| Total Cash and Cash Equivalents, Restricted Cash and Cash and Cash Equivalents Held at Consolidated Variable Interest Entities | $ | 2,661,869 | | | $ | 1,304,393 | |
See accompanying notes to condensed consolidated financial statements.
APOLLO GLOBAL MANAGEMENT, INC.
NOTES TO CONDENSED CONSOLIDATED
FINANCIAL STATEMENTS
(dollars in thousands, except share data, except where noted)
1. ORGANIZATION
Apollo Global Management, Inc. (“AGM Inc.”, together with its consolidated subsidiaries, the “Company” or “Apollo”) is a global alternative investment manager whose predecessor was founded in 1990. Its primary business is to raise, invest and manage credit, private equity and real assets funds as well as strategic investment accounts, on behalf of pension, endowment and sovereign wealth funds, as well as other institutional and individual investors. For these investment management services, Apollo receives management fees generally related to the amount of assets managed, transaction and advisory fees, incentive fees and performance allocations related to the performance of the respective funds that it manages. Apollo has 3 primary business segments:
| |
• | •Credit—primarily invests in non-control corporate and structured debt instruments including performing, stressed and distressed investments across the capital structure; •Private equity—primarily invests in control equity and related debt instruments, convertible securities and distressed debt investments; and •—primarily invests in non-control corporate and structured debt instruments including performing, stressed and distressed investments across the capital structure; |
| |
• | Private equity—primarily invests in control equity and related debt instruments, convertible securities and distressed debt investments; and
|
| |
• | Real assets—primarily invests in (i) real estate equity and infrastructure equity for the acquisition and recapitalization of real estate and infrastructure assets, portfolios, platforms and operating companies, (ii) real estate and infrastructure debt including first mortgage and mezzanine loans, preferred equity and commercial mortgage backed securities and (iii) European performing and non-performing loans, and unsecured consumer loans. |
Organization of the Company
Effective September 5, 2019, Apollo Global Management,AGM Inc. converted from a Delaware limited liability company named Apollo Global Management, LLC to a Delaware corporation named Apollo Global Management, Inc. (the “Conversion”). The Company was formed as a Delaware limited liability company on July 3, 2007, and, until the Conversion, was managed by AGM Management, LLC, which is indirectly wholly-owned and controlled by Leon Black, Joshua Harris and Marc Rowan, its Managing Partners.
As of September 30, 2019,2020, the Company owned, through 6 intermediate holding companies, 55.2%52.9% of the economic interests of, and operated and controlled all of the businesses and affairs of, the Apollo Operating Group through its wholly owned subsidiaries.
AP Professional Holdings, L.P., a Cayman Islands exempted limited partnership (“Holdings”), is the entity through which the Managing Partners and certain of the Company’s other partners (the “Contributing Partners”) indirectly beneficially own interests in each of the entities that comprise the Apollo Operating Group (“AOG Units”).Group. As of September 30, 2019,2020, Holdings owned the remaining 44.8%40.4% of the economic interests in the Apollo Operating Group. The Company consolidates the financial results of the Apollo Operating Group and its consolidated subsidiaries. Holdings’ ownership interest in the Apollo Operating Group is reflected as a Non-Controlling Interest in the accompanying condensed consolidated financial statements.
Athene and Apollo Strategic Transaction
On February 28, 2020, pursuant to a transaction agreement (the “Transaction Agreement”) between Athene Holding, AGM Inc. and the entities that form the Apollo Operating Group, the Apollo Operating Group issued 29,154,519 non-voting equity interests of the Apollo Operating Group to Athene Holding. As a result, as of September 30, 2020, Athene Holding owned 6.7% of the economic interests in the Apollo Operating Group. See note 15 for further disclosure regarding the Transaction Agreement.
As noted further in note 15, Apollo purchased a 17% incremental equity ownership stake in Athene, bringing Apollo’s beneficial ownership in Athene to 28.0%, at the close of the transaction. This has resulted in Apollo’s indirect ownership in certain VIEs, through Athene, being considered significant such that the Company has the power to direct the activities that most significantly impact the economic performance of these VIEs. Accordingly, there has been a significant increase in consolidated VIE assets, liabilities and Non-Controlling Interests as of September 30, 2020 as compared to December 31, 2019.
APOLLO GLOBAL MANAGEMENT, INC.
NOTES TO CONDENSED CONSOLIDATED
FINANCIAL STATEMENTS
(dollars in thousands, except share data, except where noted)
Conversion to a Corporation
On September 4, 2019, AGM LLC notified the New York Stock Exchange (the “NYSE”) that a Certificate of Conversion (the “Certificate of Conversion”) had been filed with the Secretary of State of the State of Delaware. Effective at 12:01 a.m. (Eastern Time) on September 5, 2019 (the “Effective Time”), (i) each Class A share (“Class A Share”) representing limited liability company interests of AGM LLC outstanding immediately prior to the Effective Time converted into 1 issued and outstanding, fully paid and nonassessable share of Class A common stock, $0.00001 par value per share, of the Company (“Class A Common Stock”), (ii) the Class B share (the “Class B Share”) representing limited liability company interests of AGM LLC outstanding immediately prior to the Effective Time converted into 1 issued and outstanding, fully paid and nonassessable share of Class B common stock, $0.00001 par value per share, of the Company (the “Class B Common Stock”), (iii) each Series A preferred share (“Series A Preferred Share”) representing limited liability company interests of AGM LLC outstanding immediately prior to the Effective Time converted into 1 issued and outstanding, fully paid and nonassessable share of Series A preferred stock, having a liquidation preference of $25.00 per share, of the Company (“Series A Preferred Stock”), (iv) each Series B preferred share (“Series B Preferred Share”) representing limited liability company interests of AGM LLC outstanding immediately prior to the Effective Time converted into 1 issued and outstanding, fully paid and nonassessable share of Series B preferred stock, having a liquidation preference of $25.00 per share, of the Company (“Series B Preferred Stock”) and (v) AGM Management, LLC, a Delaware limited liability company (the “Former Manager”), was granted 1 issued and outstanding, fully paid and nonassessable share of Class C common stock, $0.00001 par value per share, of the Company (“Class C Common Stock”), which
APOLLO GLOBAL MANAGEMENT, INC.
NOTES TO CONDENSED CONSOLIDATED
FINANCIAL STATEMENTS
(dollars in thousands, except share data, except where noted)
bestows to its holder certain management rights over the Company. References to the Class A Common Stock, the Class B Common Stock, the Series A Preferred Stock and the Series B Preferred Stock for periods prior to the Conversion means Class A Shares, Class B Share, Series A Preferred Share and Series B Preferred Share of AGM LLC, respectively. Prior to the Effective Time, the Former Manager held all such management powers over the business and affairs of AGM LLC pursuant to the Third Amended and Restated Limited Liability Company Agreement of AGM LLC, dated as of March 19, 2018.
2. SUMMARY OF SIGNIFICANT ACCOUNTING POLICIES
Basis of Presentation
The accompanying unaudited condensed consolidated financial statements are prepared in accordance with generally accepted accounting principles in the United States of America (“U.S. GAAPGAAP”) for interim financial information and instructions to the Quarterly Report on Form 10-Q. The condensed consolidated financial statements and these notes are unaudited and exclude some of the disclosures required in annual financial statements. Management believes it has made all necessary adjustments (consisting only of normal recurring items) so that the condensed consolidated financial statements are presented fairly and that estimates made in preparing its condensed consolidated financial statements are reasonable and prudent. The operating results presented for interim periods are not necessarily indicative of the results that may be expected for any other interim period or for the entire year. These condensed consolidated financial statements should be read in conjunction with the annual financial statements included in the 20182019 Annual Report.
The condensed consolidated financial statements include the accounts of the Company, its wholly-owned or majority-owned subsidiaries, the consolidated entities which are considered to be variable interest entities (“VIEs”) and for which the Company is considered the primary beneficiary, and certain entities which are not considered VIEs but which the Company controls through a majority voting interest. Intercompany accounts and transactions, if any, have been eliminated upon consolidation.
Certain reclassifications, when applicable, have been made to the prior periods’ condensed consolidated financial statements and notes to conform to the current period’s presentation and are disclosed accordingly.
Consolidation
The types of entities with which Apollo is involved generally include subsidiaries (e.g., general partners and management companies related to the funds the Company manages), entities that have all the attributes of an investment company (e.g., funds) and securitization vehicles (e.g., CLOs). Each of these entities is assessed for consolidation on a case by case basis depending on the specific facts and circumstances surrounding that entity.
Pursuant to the consolidation guidance, the Company first evaluates whether it holds a variable interest in an entity. Fees that are customary and commensurate with the level of services provided, and where the Company does not hold other economic interests in the entity that would absorb more than an insignificant amount of the expected losses or returns of the
APOLLO GLOBAL MANAGEMENT, INC.
NOTES TO CONDENSED CONSOLIDATED
FINANCIAL STATEMENTS
(dollars in thousands, except share data, except where noted)
entity, would not be considered a variable interest. Apollo factors in all economic interests including proportionate interests through related parties, to determine if such interests are considered a variable interest. As Apollo’s interests in many of these entities are solely through market rate fees and/or insignificant indirect interests through related parties, Apollo is not considered to have a variable interest in many of these entities and no further consolidation analysis is performed. For entities where the Company has determined that it does hold a variable interest, the Company performs an assessment to determine whether each of those entities qualify as a VIE.
The determination as to whether an entity qualifies as a VIE depends on the facts and circumstances surrounding each entity and therefore certain of Apollo’s funds may qualify as VIEs under the variable interest model whereas others may qualify as voting interest entities (“VOEs”) under the voting interest model. The granting of substantive kick-out rights is a key consideration in determining whether a limited partnership or similar entity is a VIE and whether or not that entity should be consolidated.
Under the variable interest model, Apollo consolidates those entities where it is determined that the Company is the primary beneficiary of the entity. The Company is determined to be the primary beneficiary when it has a controlling financial interest in the VIE, which is defined as possessing both (i) the power to direct the activities of the VIE that most significantly impact the VIE’s economic performance and (ii) the obligation to absorb losses of the VIE or the right to receive benefits from the VIE that could potentially be significant to the VIE.significant. When Apollo alone is not considered to have a controlling financial interest in the VIE but Apollo and its related parties under common control in the aggregate have a controlling financial interest in the VIE, Apollo will be deemed the primary beneficiary if it is the party that is most closely associated with the VIE. When Apollo and its related parties not under common control in the aggregate have a controlling financial interest in the VIE, Apollo would be deemed to be the primary beneficiary if substantially all the activities of the entity are performed on behalf of Apollo.
APOLLO GLOBAL MANAGEMENT, INC.
NOTES TO CONDENSED CONSOLIDATED
FINANCIAL STATEMENTS
(dollars in thousands, except share data, except where noted)
Apollo determines whether it is the primary beneficiary of a VIE at the time it becomes initially involved with the VIE and reconsiders that conclusion continuously. Investments and redemptions (either by Apollo, related parties of Apollo or third parties) or amendments to the governing documents of the respective entity may affect an entity’s status as a VIE or the determination of the primary beneficiary.
Assets and liabilities of the consolidated VIEs are primarily shown in separate sections within the condensed consolidated statements of financial condition. Changes in the fair value of the consolidated VIEs’ assets and liabilities and related interest, dividend and other income and expenses are presented within net gains from investment activities of consolidated variable interest entities in the condensed consolidated statements of operations. The portion attributable to Non-Controlling Interests is reported within net income attributable to Non-Controlling Interests in the condensed consolidated statements of operations. For additional disclosures regarding VIEs, see note 5.6.
Under the voting interest model, Apollo consolidates those entities it controls through a majority voting interest. Apollo does not consolidate those VOEs in which substantive kick-out rights have been granted to the unrelated investors to either dissolve the fund or remove the general partner.
Cash and Cash Equivalents
Apollo considers all highly liquid short-term investments with original maturities of three months or less when purchased to be cash equivalents. Cash and cash equivalents include money market funds and U.S. Treasury securities with original maturities of three months or less when purchased. Interest income from cash and cash equivalents is recorded in interest income in the condensed consolidated statements of operations. The carrying values of the money market funds and U.S. Treasury securities were $302.3 million$1.5 billion and $231.8$253.5 million as of September 30, 20192020 and December 31, 2018,2019, respectively, which approximate their fair values due to their short-term nature and are categorized as Level I within the fair value hierarchy. Substantially all of the Company’s cash on deposit is in interest bearing accounts with major financial institutions and exceed insured limits.
Restricted Cash
Restricted cash includes cash held in reserve accounts used to make required payments in respect of the 2039 Senior Secured Guaranteed Notes. Restricted cash also includes cash deposited at a bank, which is pledged as collateral in connection with leased premises.
APOLLO GLOBAL MANAGEMENT, INC.
NOTES TO CONDENSED CONSOLIDATED
FINANCIAL STATEMENTS
(dollars in thousands, except share data, except where noted)
U.S. Treasury securities, at fair value
U.S. Treasury securities, at fair value includes U.S. Treasury bills with original maturities greater than three months when purchased. These securities are recorded at fair value. Interest income on such securities is separately presented from the overall change in fair value and is recognized in interest income in the condensed consolidated statements of operations. Any remaining change in fair value of such securities, that is not recognized as interest income, is recognized in net gains (losses) from investment activities in the condensed consolidated statements of operations.
Fair Value of Financial Instruments
Apollo has elected the fair value option for the Company’s investment in Athene Holding, the assets and liabilities of certain of its consolidated VIEs (including CLOs), the Company’s U.S. Treasury securities with original maturities greater than three months when purchased, and certain of the Company’s other investments. Such election is irrevocable and is applied to financial instruments on an individual basis at initial recognition.
The fair value of a financial instrument is the price that would be received to sell an asset or paid to transfer a liability in an orderly transaction between market participants at the measurement date under current market conditions.
Except for the Company’s debt obligations, financial instruments are generally recorded at fair value or at amounts whose carrying values approximate fair value. The actual realized gains or losses will depend on, among other factors, future operating results, the value of the assets and market conditions at the time of disposition, any related transaction costs and the timing and manner of sale, all of which may ultimately differ significantly from the assumptions on which the valuations were based.
APOLLO GLOBAL MANAGEMENT, INC.
NOTES TO CONDENSED CONSOLIDATED
FINANCIAL STATEMENTS
(dollars in thousands, except share data, except where noted)
Fair Value Hierarchy
U.S. GAAP establishes a hierarchical disclosure framework which prioritizes and ranks the level of market price observability used in measuring financial instruments at fair value. Market price observability is affected by a number of factors, including the type of financial instrument, the characteristics specific to the financial instrument and the state of the marketplace, including the existence and transparency of transactions between market participants. Financial instruments with readily available quoted prices in active markets generally will have a higher degree of market price observability and a lesser degree of judgment used in measuring fair value.
Financial instruments measured and reported at fair value are classified and disclosed based on the observability of inputs used in the determination of fair values, as follows:
Level I - Quoted prices are available in active markets for identical financial instruments as of the reporting date. The types of financial instruments included in Level I include listed equities and debt. The Company does not adjust the quoted price for these financial instruments, even in situations where the Company holds a large position and the sale of such position would likely deviate from the quoted price.
Level II - Pricing inputs are other than quoted prices in active markets, which are either directly or indirectly observable as of the reporting date, and fair value is determined through the use of models or other valuation methodologies. Financial instruments that are generally included in this category include corporate bonds and loans, less liquid and restricted equity securities and certain over-the-counter derivatives where the fair value is based on observable inputs. These financial instruments exhibit higher levels of liquid market observability as compared to Level III financial instruments.
Level III - Pricing inputs are unobservable for the financial instrument and includes situations where there is little observable market activity for the financial instrument. The inputs into the determination of fair value may require significant management judgment or estimation. Financial instruments that are included in this category generally include general and limited partner interests in corporate private equity and real assets funds, opportunistic credit funds, distressed debt and non-investment grade residual interests in securitizations and CDOs and CLOs where the fair value is based on observable inputs as well as unobservable inputs.
When a security is valued based on broker quotes, the Company subjects those quotes to various criteria in making the determination as to whether a particular financial instrument would qualify for classification as Level II or Level III. These
APOLLO GLOBAL MANAGEMENT, INC.
NOTES TO CONDENSED CONSOLIDATED
FINANCIAL STATEMENTS
(dollars in thousands, except share data, except where noted)
criteria include, but are not limited to, the number and quality of the broker quotes, the standard deviations of the observed broker quotes, and the percentage deviation from independentexternal pricing services.
In certain cases, the inputs used to measure fair value may fall into different levels of the fair value hierarchy. In such cases, a financial instrument’s level within the fair value hierarchy is based on the lowest level of input that is significant to the fair value measurement. The Company’s assessment of the significance of a particular input to the fair value measurement in its entirety requires judgment and considers factors specific to the financial instrument when the fair value is based on unobservable inputs.
Equity Method Investments
For investments in entities over which the Company exercises significant influence but which do not meet the requirements for consolidation and for which the Company has not elected the fair value option, the Company uses the equity method of accounting, whereby the Company records its share of the underlying income or loss of such entities. The Company’s share of the underlying net income or loss of such entities is recorded in principal investment income (loss) in the condensed consolidated statements of operations.
The carrying amounts of equity method investments are recorded in investments in the condensed consolidated statements of financial condition. As the underlying entities that the Company manages and invests in are, for U.S. GAAP purposes, primarily investment companies which reflect their investments at estimated fair value, the carrying value of the Company’s equity method investments in such entities approximates fair value.
APOLLO GLOBAL MANAGEMENT, INC.
NOTES TO CONDENSED CONSOLIDATED
FINANCIAL STATEMENTS
(dollars in thousands, except share data, except where noted)
Financial Instruments held by Consolidated VIEs
The Company measures both the financial assets and financial liabilities of the consolidated CLOs in its condensed consolidated financial statements using the fair value of the financial assets of the consolidated CLOs, which are more observable than the fair value of theor financial liabilities of the consolidated CLOs. As a result,CLOs, whichever are more observable.
Where financial assets are more observable, the financial assets of the consolidated CLOs are measured at fair value and the financial liabilities are measured in consolidation as: (i) the sum of the fair value of the financial assets and the carrying value of any non-financialnonfinancial assets that are incidental to the operations of the CLOs less (ii) the sum of the fair value of any beneficial interests retained by the Company (other than those that represent compensation for services) and the Company’s carrying value of any beneficial interests that represent compensation for services. The resulting amount is allocated to the individual financial liabilities (other than the beneficial interest retained by the Company) using a reasonable and consistent methodology.
Where financial liabilities are more observable, the financial liabilities of the consolidated CLOs are measured at fair value and the financial assets are measured in consolidation as: (i) the sum of the fair value of the financial liabilities, and the carrying value of any nonfinancial liabilities that are incidental to the operations of the CLOs less (ii) the carrying value of any nonfinancial assets that are incidental to the operations of the CLOs. The resulting amount is allocated to the individual financial assets using a reasonable and consistent methodology.
Under the measurement alternative, net income attributable to Apollo Global Management, Inc. reflects the Company’s own economic interests in the consolidated CLOs including (i) changes in the fair value of the beneficial interests retained by the Company and (ii) beneficial interests that represent compensation for collateral management services.
The consolidated VIEs hold investments that could be traded over-the-counter. Investments in securities that are traded on a securities exchange or comparable over-the-counter quotation systems are valued based on the last reported sale price at that date. If no sales of such investments are reported on such date, and in the case of over-the-counter securities or other investments for which the last sale date is not available, valuations are based on independent market quotations obtained from market participants, recognized pricing services or other sources deemed relevant, and the prices are based on the average of the “bid” and “ask” prices, or at ascertainable prices at the close of business on such day. Market quotations are generally based on valuation pricing models or market transactions of similar securities adjusted for security-specific factors such as relative capital structure priority and interest and yield risks, among other factors. When market quotations are not available, a model based approach is used to determine fair value.
Leases
The Company determines if an arrangement is a lease or contains a lease at inception. Operating leases are includedCertain consolidated VIEs have applied the fair value option for certain investments in lease assets and lease liabilities in the condensed consolidated statements of financial condition. The Company doesprivate debt securities that otherwise would not have any finance leases.
Lease assets represent the Company’s right to use an underlying asset for the lease termbeen carried at fair value with gains and lease liabilities represent the Company’s obligation to make lease payments arising from the lease. Lease assets and lease liabilities are recognized at the date of commencement of the lease (the “commencement date”) based on the present value of lease payments over the lease term. As most of the Company’s leases do not provide an implicit rate, the Company uses its derived incremental borrowing rate based on information available at commencement datelosses in determining the present value of lease payments. The determination of an appropriate incremental borrowing rate requires judgment. The Company determined its incremental borrowing rate based on consideration of market conditions, the Company’s overall creditworthiness, and recent debt and preferred equity issuances. The Company adjusts its rate accordingly based on the term of the leases.
Lease assets also include any lease payments made (e.g. pre-paid rent) and are reduced by any deferred rent liabilities arising from lease escalation provisions and lease incentives within the Company’s lease agreements. Accordingly, as of September 30, 2019, the difference between lease assets and lease liabilities represents the Company’s deferred rent liabilities that are netted against the lease asset amount. Certain lease agreements contain lease escalation or lease incentive provisions based on the terms of the arrangement with the landlord. Lease escalations and lease incentives, if any, are recognized on a straight-line basis over the lease term. The Company’s lease agreements may also include options to extend or terminate the lease. Options to extend would not be included in the lease term until it is reasonably certain that the Company will exercise that option. Lease expense is recognized on a straight-line basis over the lease term and is recorded within general, administrative and other in the condensed consolidated statements of operations. The Company has lease agreements with non-lease components (e.g. estimated operating expenses associated with the lease), which are accounted for separately.
Other Assets
Other assets primarily includes fixed assets, net deferred equity-based compensation and prepaid expenses. During 2019, the presentation of intangible assets, net was combined with other assets on the condensed consolidated statements of financial condition and the prior period was recast to conform to the current presentation.
APOLLO GLOBAL MANAGEMENT, INC.
NOTES TO CONDENSED CONSOLIDATED
FINANCIAL STATEMENTS
(dollars in thousands, except share data, except where noted)
Deferred Revenue
Apollo records deferred revenue, which is a type of contract liability, when consideration is received in advance of management services provided.
Apollo also earns management fees subject to the Management Fee Offset (described below). When advisory and transaction fees are earned by the management company, the Management Fee Offset reduces the management fee obligation of the fund. When the Company receives cash for advisory and transaction fees, a certain percentage of such advisory and/or transaction fees, as applicable, is allocated as a credit to reduce future management fees, otherwise payable by such fund. Such credit is recorded as deferred revenue in the condensed consolidated statements of financial condition. A portion of any excess advisory and transaction fees may be required to be returned to the limited partners of certain funds upon such fund’s liquidation. As the management fees earned by the Company are presented on a gross basis, any Management Fee Offsets calculated are presented as a reduction to advisory and transaction fees in the condensed consolidated statements of operations.
Additionally, Apollo earns advisory fees pursuant to the terms of the advisory agreements with certain of the portfolio companies that are owned by the funds Apollo manages. When Apollo receives a payment from a portfolio company that exceeds the advisory fees earned at that point in time, the excess payment is recorded as deferred revenue in the condensed consolidated statements of financial condition. The advisory agreements with the portfolio companies vary in duration and the associated fees are received monthly, quarterly or annually.
Deferred revenue is reversed and recognized as revenue over the period that the agreed upon services are performed. There was $77.1$78.7 million of revenue recognized during the nine months ended September 30, 20192020 that was previously deferred as of January 1, 2019.2020.
Under the terms of the funds’ partnership agreements, Apollo is normally required to bear organizational expenses over a set dollar amount and placement fees or costs in connection with the offering and sale of interests in the funds it manages to investors. The placement fees are payable to placement agents, who are independent third parties that assist in identifying potential investors, securing commitments to invest from such potential investors, preparing or revising offering and marketing materials, developing strategies for attempting to secure investments by potential investors and/or providing feedback and insight regarding issues and concerns of potential investors, when a limited partner either commits or funds a commitment to a fund. In certain instances the placement fees are paid over a period of time. Based on the management agreements with the funds, Apollo considers placement fees and organizational costs paid in determining if cash has been received in excess of the management fees earned. Placement fees and organizational costs are normally the obligation of Apollo but can be paid for by the funds. When these costs are paid by the fund, the resulting obligations are included within deferred revenue. The deferred revenue balance will also be reduced during future periods when management fees are earned but not paid.
Revenues
The Company’s revenues are reported in four separate categories that include (i) management fees; (ii) advisory and transaction fees, net; (iii) investment income, which is comprised of performance allocations and principal investment income; and (iv) incentive fees.
On January 1, 2018, the Company adopted new revenue guidance issued by the FASB for recognizing revenue from contracts with customers. The new revenue guidance requires that an entity should recognize revenue to depict the transfer of promised goods or services to customers in an amount that reflects the consideration to which the entity expects to be entitled in exchange for those goods or services (i.e., the transaction price). When determining the transaction price under the new revenue guidance, an entity may recognize variable consideration only to the extent that it is probable to not be significantly reversed. The new revenue guidance also requires improved disclosures to help users of financial statements better understand the nature, amount, timing, and uncertainty of revenue that is recognized.
The Company has concluded that its management fees, advisory and transaction fees, and incentive fees are within the scope of the new revenue guidance. For incentive fees, the new revenue guidance delays the timing of certain revenues compared to the prior accounting treatment. These amounts were previously recognized in carried interest income in the condensed consolidated statements of operations and are now recognized within a separate line, incentive fees.
Effective January 1, 2018, the Company implemented a change in accounting principle for performance allocations to be accounted for under guidance applicable to equity method investments, and therefore not within the scope of the new revenue guidance. The accounting change does not change the timing or amount of revenue recognized related to performance allocation arrangements. These amounts were previously recognized within carried interest income in the condensed consolidated statements of operations and carried interest receivable within the condensed consolidated statements of financial condition. As a result of
APOLLO GLOBAL MANAGEMENT, INC.
NOTES TO CONDENSED CONSOLIDATED
FINANCIAL STATEMENTS
(dollars in thousands, except share data, except where noted)
the change in accounting principle, the Company recognizes performance allocations within investment income along with the related principal investment income (as further described below) in the condensed consolidated statements of operations and within the investments line in the condensed consolidated statements of financial condition. The Company applied this change in accounting principle on a full retrospective basis.
Management Fees
Management fees are recognized over time during the periods in which the related services are performed in accordance with the contractual terms of the related agreement. Management fees are generally based on (1) a percentage of the capital committed during the commitment period, and thereafter based on the remaining invested capital of unrealized investments, or (2) net asset value, gross assets or as otherwise defined in the respective agreements. Included in management fees are certain expense reimbursements where the Company is considered the principal under the agreements and is required to record the expense and related reimbursement revenue on a gross basis.
Advisory and Transaction Fees, Net
Advisory fees, including management consulting fees and directors’ fees, are generally recognized over time as the underlying services are provided in accordance with the contractual terms of the related agreement. The Company receives such fees in exchange for ongoing management consulting services provided to portfolio companies of funds it manages. Transaction fees, including structuring fees and arranging fees are generally recognized at a point in time when the underlying services rendered are complete.
APOLLO GLOBAL MANAGEMENT, INC.
NOTES TO CONDENSED CONSOLIDATED
FINANCIAL STATEMENTS
(dollars in thousands, except share data, except where noted)
The amounts due from fund portfolio companies are recorded in due from related parties, which is discussed further in note 14.15. Under the terms of the limited partnership agreements for certain funds, the management fee payable by the funds may be subject to a reduction based on a certain percentage of such advisory and transaction fees, net of applicable broken deal costs (“Management Fee Offset”). Advisory and transaction fees are presented net of the Management Fee Offset in the condensed consolidated statements of operations.
Underwriting fees, which are also included within advisory and transaction fees, net, include gains, losses and fees, arising from securities offerings in which one of the Company’s subsidiaries participates in the underwriter syndicate. Underwriting fees are recognized at a point in time when the underwriting is completed. Underwriting fees recognized but not received are recorded in other assets on the condensed consolidated statements of financial condition.
During the normal course of business, the Company incurs certain costs related to certain transactions that are not consummated (“broken deal costs”). These costs (e.g., research costs, due diligence costs, professional fees, legal fees and other related items) are determined to be broken deal costs upon management’s decision to no longer pursue the transaction. In accordance with the related fund agreement, in the event the deal is deemed broken, all of the costs are reimbursed by the funds and then included as a component of the calculation of the Management Fee Offset. If a deal is successfully completed, Apollo is reimbursed by the fund or fund’s portfolio company for all costs incurred and no offset is generated. As the Company acts as an agent for the funds it manages, any transaction costs incurred and paid by the Company on behalf of the respective funds relating to successful or broken deals are recorded net on the Company’s condensed consolidated statements of operations, and any receivable from the respective funds is recorded in due from related parties on the condensed consolidated statements of financial condition.
Investment Income
Investment income is comprised of performance allocations and principal investment income.
Performance Allocations
Performance allocations are a type of performance revenue (i.e., income earned based on the extent to which an entity’s performance exceeds predetermined thresholds). Performance allocations are generally structured from a legal standpoint as an allocation of capital in which the Company’s capital account receives allocations of the returns of an entity when those returns exceed predetermined thresholds. The determination of which performance revenues are considered performance allocations is primarily based on the terms of an agreement with the entity.
As noted above, as a result of a change in accounting principle, theThe Company recognizes performance allocations within investment income along with the related principal investment income (as described further below) in the condensed
APOLLO GLOBAL MANAGEMENT, INC.
NOTES TO CONDENSED CONSOLIDATED
FINANCIAL STATEMENTS
(dollars in thousands, except share data, except where noted)
consolidated statements of operations and within the investments line in the condensed consolidated statements of financial condition.
When applicable, the Company may record a general partner obligation to return previously distributed performance allocations. The general partner obligation is based upon an assumed liquidation of a fund’s net assets as of the reporting date and is reported within due to related parties. The actual determination and any required payment of any such general partner obligation would not take place until the final disposition of a fund’s investments based on the contractual termination of the fund or as otherwise set forth in the respective limited partnership agreement or other governing document of the fund.
Principal Investment Income
Principal investment income includes the Company’s income or loss from equity method investments and certain other investments in entities in which the Company is generally eligible to receive performance allocations. Income from equity method investments includes the Company’s share of net income or loss generated from its investments, which are not consolidated, but in which the Company exerts significant influence. Prior to the change in accounting principle noted above, income from equity method investments was included within other income (loss) in the condensed consolidated statements of operations. All prior periods have been conformed to reflect this change in presentation.
Incentive Fees
Incentive fees are a type of performance revenue. Incentive fees differ from performance allocations in that incentive fees do not represent an allocation of capital but rather a contractual fee arrangement with the entity.
APOLLO GLOBAL MANAGEMENT, INC.
NOTES TO CONDENSED CONSOLIDATED
FINANCIAL STATEMENTS
(dollars in thousands, except share data, except where noted)
Incentive fees are considered a form of variable consideration under the new revenue recognition guidance as they are subject to clawback or reversal and therefore must be deferred until the fees are probable to not be significantly reversed. Accrued but unpaid incentive fees are reported within incentive fees receivable in the Company’s condensed consolidated statements of financial condition. As noted earlier, prior to the adoption of the new revenue recognition guidance, incentive fees were recognized on an assumed liquidation basis. The Company’s incentive fees primarily relate to the credit segment and are generally received from CLOs, managed accounts and AINV.
Compensation and Benefits
Equity-Based Compensation
Equity-based awards granted to employees and non-employees as compensation are measured based on the grant date fair value of the award. Equity-based awards that do not require future service (i.e., vested awards) are expensed immediately. Equity-based employee awards that require future service are expensed over the relevant service period. In addition, certain restricted share units (“RSUs”) granted by the Company vest based on both continued service and the Company’s receipt of performance revenues, within prescribed periods, sufficient to cover the associated equity-based compensation expense. In accordance with U.S. GAAP, equity-based compensation expense for such awards, if and when granted, will be recognized on an accelerated recognition method over the requisite service period to the extent the performance revenue metrics are met or deemed probable. The Company accounts for forfeitures of equity-based awards when they occur.
Profit Sharing
Profit sharing expense and profit sharing payable primarily consist of a portion of performance revenues earned from certain funds that are allocated to employees and former employees and Contributing Partners.employees. Profit sharing amounts are recognized as the related performance revenues are earned. Accordingly, profit sharing amounts can be reversed during periods when there is a decline in performance revenues that were previously recognized.
Profit sharing amounts are generally not paid until the related performance revenue is distributed to the general partner upon realization of the fund’s investments. Under certain profit sharing arrangements, the Company requires that a portion of certain of the performance revenues distributed to its employees be used to purchase restricted shares of Class A Common Stock issued under the Company’s 2007 Omnibus Equity Incentive Plan, which, effective as of July 22, 2019, was amended, restated and renamed the 2019 Omnibus Equity Incentive Plan (the “Equity Plan”).Plan. Prior to distribution of the performance revenue, the Company records the value of the equity-based awards expected to be granted in other assets and other liabilities within the condensed consolidated statements of financial condition. Such equity-based awards are recorded as equity-based compensation expense over the relevant service period once granted.
Additionally, profit sharing amounts previously distributed may be subject to clawback from employees and former employees and Contributing Partners.employees. When applicable, the accrual for potential clawback of previously distributed profit sharing amounts, which is a component of due from related parties on the condensed consolidated statements of financial condition, represents all amounts previously distributed to employees and former employees and Contributing Partners that would need to be
APOLLO GLOBAL MANAGEMENT, INC.
NOTES TO CONDENSED CONSOLIDATED
FINANCIAL STATEMENTS
(dollars in thousands, except share data, except where noted)
returned to the general partner if the Apollo funds were to be liquidated based on the fair value of the underlying funds’ investments as of the reporting date. The actual general partner receivable, however, would not become realized until the endfinal disposition of a fund’s life.investments based on the contractual termination of the fund or as otherwise set forth in the respective limited partnership agreement or other governing document of the fund.
Profit sharing payable also includes contingent consideration obligations that were recognized in connection with certain Apollo acquisitions. Changes in the fair value of the contingent consideration obligations are reflected in the Company’s condensed consolidated statements of operations as profit sharing expense.
The Company has a performance-based incentive arrangement for certain Apollo partners and employees designed to more closely align compensation on an annual basis with the overall realized performance of the Company. This arrangement enables certain partners and employees to earn discretionary compensation based on performance revenue earned by the Company in a given year, which amounts are reflected in profit sharing expense in the accompanying condensed consolidated financial statements. The Company may also use dividends it receives from investments in MidCap, ARI and AINV to compensate employees. These amounts are recorded as profit sharing expense in the Company’s condensed consolidated statements of operations.
APOLLO GLOBAL MANAGEMENT, INC.
NOTES TO CONDENSED CONSOLIDATED
FINANCIAL STATEMENTS
(dollars in thousands, except share data, except where noted)
401(k) Savings Plan
The Company sponsors a 401(k) savings plan (the “401(k) Plan”) whereby U.S.-based employees are entitled to participate in the 401(k) Plan based upon satisfying certain eligibility requirements. The Company matches 50% of eligible annual employee contributions up to 3% of the eligible employees’ annual compensation. Matching contributions vest after three years of service.
General, Administrative and Other
General, administrative and other primarily includes professional fees, occupancy, depreciation and amortization, travel, information technology and administration expenses.
Income Taxes
Prior to the Conversion, certain entities in the Apollo Operating Group operated as partnerships for U.S. federal income tax purposes. As a result, these members of the Apollo Operating Groupentities were not subject to U.S. federal income taxes. However, certain of these entities were subject to New York City unincorporated business taxes (“NYC UBT”) and certain non-U.S. entities were subject to non-U.S. corporate income taxes. Effective September 5, 2019, Apollo Global Management, LLC converted from a Delaware limited liability company to a Delaware corporation named Apollo Global Management, Inc. Subsequent to the Conversion, we expect thatgenerally all of the income the Company earns will beis subject to U.S. corporate income taxes, which could result in an overall higher income tax expense (or benefit) in periods subsequent to the Conversion.
Significant judgment is required in determining tax expense and in evaluating tax positions, including evaluating uncertainties. The Company recognizes the tax benefits of uncertain tax positions only where the position is “more likely than not” to be sustained upon examination, including resolutionsresolution of any related appeals or litigation processes, based on the technical merits of the position. The tax benefit is measured as the largest amount of benefit that has a greater than 50% likelihood of being realized upon ultimate settlement. If a tax position is not considered more likely than not to be sustained, then no benefits of the position are recognized. The Company’s tax positions are reviewed and evaluated quarterly to determine whether or not the Company has uncertain tax positions that require financial statement recognition.
Deferred tax assets and liabilities are recognized for the expected future tax consequences of differences between the carrying amount of assets and liabilities and their respective tax basis using currently enacted tax rates. The effect on deferred tax assets and liabilities of a change in tax rates is recognized in income in the period during which the change is enacted. Deferred tax assets are reduced by a valuation allowance when it is more likely than not that some portion or all of the deferred tax assets will not be realized.
Non-Controlling Interests
For entities that are consolidated, but not 100% owned, a portion of the income or loss and corresponding equity is allocated to owners other than Apollo. The aggregate of the income or loss and corresponding equity that is not owned by the Company is included in Non-Controlling Interests in the condensed consolidated financial statements. The Non-Controlling Interests relating to Apollo Global Management, Inc. primarily include the ownership interest in the Apollo Operating Group held by Managing Partners and Contributing Partners through their limited partner interests in Holdings. Additionally, Athene holds Non-Controlling Interests in the Apollo Operating Group as a result of the Transaction Agreement. Non-Controlling Interests also include ownership interests in certain consolidated funds and VIEs.
Non-Controlling Interests are presented as a separate component of stockholders’ equity on the Company’s condensed consolidated statements of financial condition. The primary components of Non-Controlling Interests are separately presented in the Company’s consolidated statements of changes in stockholders’ equity to clearly distinguish the interest in the Apollo Operating Group and other ownership interests in the consolidated entities. Net income includes the net income attributable to the holders of Non-Controlling Interests on the Company’s condensed consolidated statements of operations. Profits and losses are allocated to Non-Controlling Interests in proportion to their relative ownership interests regardless of their basis.
Use of Estimates
The preparation of the condensed consolidated financial statements requires management to make estimates and assumptions that affect the reported amounts of assets and liabilities at the date of the condensed consolidated financial
APOLLO GLOBAL MANAGEMENT, INC.
NOTES TO CONDENSED CONSOLIDATED
FINANCIAL STATEMENTS
(dollars in thousands, except share data, except where noted)
statements, the disclosure of contingent assets and liabilities at the date of the condensed consolidated financial statements and the reported amounts of revenues and expenses during the reporting periods. Apollo’s most significant estimates include goodwill, intangible assets, income taxes, performance allocations, incentive fees, contingent consideration obligation related to an acquisition, non-cash compensation, and fair value of investments and debt. Due to the COVID-19 pandemic, there has been uncertainty and disruption in the global economy and financial markets. The Company is unable to predict the adverse impact the COVID-19 pandemic will ultimately have. While such impact may change considerably over time, the estimates and assumptions affecting the Company’s condensed consolidated financial statements are based on information available as of September 30, 2020. Actual results could differ materially from those estimates.
APOLLO GLOBAL MANAGEMENT, INC.
NOTES TO CONDENSED CONSOLIDATED
FINANCIAL STATEMENTS
(dollars in thousands, except share data, except where noted)
Recent Accounting Pronouncements
Recently Issued Accounting Standards Effective on January 1, 2019
In February 2016, the FASB issued a new standard related to leases to increase transparency and comparability among organizations by requiring the recognition of right-of-use lease assets and lease liabilities on the statements of financial condition. The most significant among the changes in the standard is the recognition of right-of-use lease assets and lease liabilities by lessees for those leases classified as operating leases. Under the standard, disclosures are required to meet the objectives of enabling users of financial statements to assess the amount, timing, and uncertainty of cash flows arising from leases.
The Company adopted the standard effective January 1, 2019 under the simplified transition method. The simplified transition method allows companies to forgo the comparative reporting requirements initially required under the modified retrospective transition approach and apply the new guidance prospectively. The Company also elected to use the practical expedients available under the standard whereby the Company would not need to reassess whether an arrangement is or contains a lease, lease classification, and the accounting for initial direct costs.
The adoption of the standard had an impact on the Company’s condensed consolidated statements of financial condition but did not have an impact on the Company’s condensed consolidated statements of operations, condensed consolidated statements of cash flows or beginning accumulated deficit. The most significant impact was the recognition of right-of-use lease assets and lease liabilities for operating leases. Refer to the condensed consolidated statements of financial condition and note 8 for further information on the impact of the adoption of the standard on the Company’s condensed consolidated financial statements.
Recently Issued Accounting Standards Effective on January 1, 2020
In June 2016, the FASB issued guidance intended to provide financial statement users with more useful information about the expected credit losses on financial instruments held by a reporting entity at each reporting date. To achieve this objective, the new guidance replaces the incurred loss methodology in current U.S. GAAP with a methodology that reflects expected credit losses. The new guidance will affect entities to varying degrees depending on the credit quality of the assets held by the entity, their duration, and how the entity applies current U.S. GAAP. The new guidance is effective for the Company on January 1, 2020 and early adoption is permitted.2020. The new guidance isdid not expected to have a material impact on the condensed consolidated financial statements of the Company.
In January 2017, the FASB issued guidance intended to simplify the test for goodwill impairment. The new guidance removes the requirement to perform a hypothetical purchase price allocation to measure goodwill impairment (Step 2). Under the new guidance, a goodwill impairment is calculated as the amount by which a reporting unit’s carrying value exceeds its fair value, not to exceed the carrying amount of goodwill in the reporting unit. The guidance is effective for annual or any interim goodwill impairment tests in fiscal years beginning after December 15, 2019, and should be performed prospectively. Early adoption is permitted for interim or annual goodwill impairment tests performed afterThe guidance did not have a material impact on the condensed consolidated financial statements of the Company.
In August 2018, the FASB issued guidance which changes the fair value disclosure requirements. The guidance includes new fair value disclosure requirements and eliminates and modifies certain other fair value disclosure requirements. The Company previously early adopted the eliminated and modified disclosure requirements upon issuance of the guidance during the three month period ended September 30, 2018. The remaining guidance was adopted by the Company on January 1, 2017.2020 and did not have a material impact on the condensed consolidated financial statements of the Company.
In December 2019, the FASB issued guidance intended to simplify the accounting for income taxes. The new guidance eliminates certain exceptions to the existing approach in ASC 740, and clarifies other guidance within the standard. It is effective for the Company on January 1, 2021. The guidance is not expected to have a material impact on the condensed consolidated financial statements of the Company.
3. GOODWILL
The carrying value of goodwill was $117.0 million and $93.9 million as of September 30, 2020 and December 31, 2019, respectively. Goodwill primarily relates to the 2007 reorganization of the Company’s predecessor business (the “2007 Reorganization”) and the Company’s acquisition of Stone Tower Capital LLC and its related management companies (“Stone Tower”) in 2012. As of September 30, 2020, there was $92.2 million, $23.8 million and $1.0 million of goodwill related to the credit, private equity and real assets segments, respectively. As of December 31, 2019, there was $69.8 million, $23.1 million and $1.0 million of goodwill related to the credit, private equity and real assets segments, respectively.
On June 26, 2020, the Company acquired the remaining portion of the PK AirFinance platform. In connection with the acquisition, the Company recognized goodwill of $22.4 million as of the acquisition date. The Company recognized $27.4 million in total goodwill related to the acquisition of the PK AirFinance platform.
APOLLO GLOBAL MANAGEMENT, INC.
NOTES TO CONDENSED CONSOLIDATED
FINANCIAL STATEMENTS
(dollars in thousands, except share data, except where noted)
4. INVESTMENTS
The following table presents Apollo’s investments:
|
| | | | | | | |
| | As of
September 30, 2019 | | As of
December 31, 2018 |
| Investments, at fair value | $ | 959,095 |
| | $ | 900,959 |
|
| Equity method investments | 1,033,237 |
| | 909,471 |
|
| Performance allocations | 1,480,577 |
| | 912,182 |
|
| Total Investments | $ | 3,472,909 |
| | $ | 2,722,612 |
|
| | | | | | | | | | | |
| As of
September 30, 2020 | | As of
December 31, 2019 |
| Investments, at fair value | $ | 1,884,388 | | | $ | 1,053,556 | |
| Equity method investments | 964,521 | | | 1,048,732 | |
| Performance allocations | 1,128,160 | | | 1,507,571 | |
| Total Investments | $ | 3,977,069 | | | $ | 3,609,859 | |
Investments, at Fair Value
Investments, at fair value, consist of investments for which the fair value option has been elected and primarily include the Company’s investment in Athene Holding and investments in debt of unconsolidated CLOs. Changes in the fair value related to these investments are presented in net gains (losses) from investment activities except for certain investments for which the
APOLLO GLOBAL MANAGEMENT, INC.
NOTES TO CONDENSED CONSOLIDATED
FINANCIAL STATEMENTS
(dollars in thousands, except share data, except where noted)
Company is entitled to receive performance allocations. For those investments, changes in fair value are presented in principal investment income.
As of September 30, 2019 and forFor the three and nine months ended September 30, 2019, no equity method2020, the Company’s investment held by Apolloin Athene Holding, for which the fair value option was elected, met the significance criteria as defined by the SEC. AlthoughAs a result, the following disclosure is not required by the significance criteria for the nine months ended September 30, 2019, the Company chose to continue to include this information as it was disclosed in its 2018 Annual Report. The following table presents summarized financial information of Athene Holding:
| | | | | | | | | | | | | | | | | | | | | | | |
| | For the Three Months Ended September 30, | | For the Nine Months Ended September 30, |
| 2020 | | 2019 | | 2020 | | 2019 |
| (in millions) |
| Statements of Operations | | | | | | | |
| Revenues | $ | 3,275 | | | $ | 4,584 | | | $ | 6,124 | | | 13,002 | |
| Benefits and expenses | 2,251 | | | 4,305 | | | 5,401 | | | 11,233 | |
| Income before income taxes | 1,024 | | | 279 | | | 723 | | | 1,769 | |
| Income tax expense (benefit) | 140 | | | (14) | | | 124 | | | $ | 48 | |
| Net income | 884 | | | $ | 293 | | | 599 | | | 1,721 | |
| Net income attributable to noncontrolling interests | 232 | | | 0 | | | 151 | | | 0 | |
| Net income available to Athene shareholders | $ | 652 | | | 293 | | | $ | 448 | | | 1,721 | |
| Preferred stock dividends | 30 | | | 17 | | | 67 | | | 17 | |
| Net income available to Athene common shareholders | $ | 622 | | | 276 | | | $ | 381 | | | $ | 1,704 | |
|
| | | | | | | | | | | | | | | |
| | For the Three Months Ended September 30, | | For the Nine Months Ended September 30, |
| | 2019(1) | | 2018 | | 2019(1) | | 2018 |
| | (in millions) |
| Statements of Operations | | | | | | | |
| Revenues | $ | 3,369 |
| | $ | 2,576 |
| | $ | 9,484 |
| | $ | 5,389 |
|
| Expenses | 2,619 |
| | 1,897 |
| | 8,141 |
| | 4,067 |
|
| Income before income tax provision | 750 |
| | 679 |
| | 1,343 |
| | 1,322 |
|
| Income tax provision | 30 |
| | 56 |
| | 19 |
| | 165 |
|
| Net income | $ | 720 |
| | $ | 623 |
| | $ | 1,324 |
| | $ | 1,157 |
|
| |
(1) | The financial information for the three and nine months ended September 30, 2019 is presented a quarter in arrears and reflects the financial information for the three and nine months ended June 30, 2019, which represents the latest available financial information as of the date of this report. |
Net Gains (Losses) from Investment Activities
The following table presents the realized and net change in unrealized gains (losses) reported in net gains (losses) from investment activities:
|
| | | | | | | | | | | | | | | |
| | For the Three Months Ended September 30, | | For the Nine Months Ended September 30, |
| | 2019 | | 2018 | | 2019 | | 2018 |
| Realized gains on sales of investments, net | $ | — |
| | $ | 1 |
| | $ | 45 |
| | $ | 67 |
|
| Net change in unrealized gains (losses) due to changes in fair value | (19,790 | ) | | 155,282 |
| | 44,054 |
| | 20,578 |
|
| Net gains (losses) from investment activities | $ | (19,790 | ) | | $ | 155,283 |
| | $ | 44,099 |
| | $ | 20,645 |
|
| | | | | | | | | | | | | | | | | | | | | | | | | |
| | For the Three Months Ended September 30, | | For the Nine Months Ended September 30, | | |
| | 2020 | | 2019 | | 2020 | | 2019 | | |
| Realized gains on sales of investments, net | $ | 155 | | | $ | 0 | | | $ | 2,031 | | | $ | 45 | | | |
| Net change in unrealized gains (losses) due to changes in fair value | 144,317 | | | (19,790) | | | (853,443) | | | 44,054 | | | |
| Net gains (losses) from investment activities | $ | 144,472 | | | $ | (19,790) | | | $ | (851,412) | | | $ | 44,099 | | | |
Equity Method Investments
Apollo’s equity method investments include its investments in the credit, private equity and real assets funds it manages, which are not consolidated, but in which the Company exerts significant influence. Apollo’s share of net income
APOLLO GLOBAL MANAGEMENT, INC.
NOTES TO CONDENSED CONSOLIDATED
FINANCIAL STATEMENTS
(dollars in thousands, except share data, except where noted)
generated by these investments is recorded in principal investment income in the condensed consolidated statements of operations.
Equity method investments consisted of the following:
|
| | | | | | | | |
| | Equity Held as of |
| | September 30, 2019 | (4) | December 31, 2018 | (4) |
Credit(2) | $ | 311,108 |
| | $ | 279,888 |
| |
Private Equity(1) | 623,836 |
| | 534,818 |
| |
| Real Assets | 98,293 |
| | 94,765 |
| |
Total equity method investments(3) | $ | 1,033,237 |
| | $ | 909,471 |
| |
| |
(1) | The equity method investment in Fund VIII was $398.7 million and $356.6 million as of September 30, 2019 and December 31, 2018, respectively, representing an ownership percentage of 2.2% and 2.2% as of September 30, 2019 and December 31, 2018, respectively. |
| |
(2) | The equity method investment in AINV was $52.0 million and $53.9 million as of September 30, 2019 and December 31, 2018, respectively. The value of the Company’s investment in AINV was $47.2 million and $36.7 million based on the quoted market price of AINV as of September 30, 2019 and December 31, 2018, respectively. |
| | | | | | | | | | | | | | |
| | Equity Held as of |
| | September 30, 2020 | (4) | December 31, 2019 | (4) |
Credit(1) | $ | 247,775 | | | $ | 318,054 | | |
Private Equity(2) | 624,395 | | | 632,540 | | |
| Real Assets | 92,351 | | | 98,138 | | |
Total equity method investments(3) | $ | 964,521 | | | $ | 1,048,732 | | |
APOLLO GLOBAL MANAGEMENT, INC.(2) The equity method investment in Fund VIII was $326.6 million and $370.7 million as of September 30, 2020 and December 31, 2019, respectively, representing an ownership percentage of 2.2% and 2.2% as of September 30, 2020 and December 31, 2019, respectively.
NOTES TO CONDENSED CONSOLIDATED(3) Certain funds invest across multiple segments. The presentation in the table above is based on the classification of the majority of such funds’ investments.
FINANCIAL STATEMENTS
(dollars(4) Some amounts included are a quarter in thousands, except share data, except where noted)arrears.
| |
(3) | Certain funds invest across multiple segments. The presentation in the table above is based on the classification of the majority of such funds’ investments. |
| |
(4) | Some amounts included are a quarter in arrears. |
Performance Allocations
Performance allocations receivable recorded within investments in the condensed consolidated statements of financial condition from credit, private equity and real assets funds consisted of the following:
| | | | As of September 30, 2019 | | As of December 31, 2018 | | As of September 30, 2020 | | As of December 31, 2019 |
| Credit | $ | 371,184 |
| | $ | 241,896 |
| Credit | $ | 375,305 | | | $ | 418,517 | |
| Private Equity | 939,356 |
| | 520,892 |
| Private Equity | 610,269 | | | 822,531 | |
| Real Assets | 170,037 |
| | 149,394 |
| Real Assets | 142,586 | | | 266,523 | |
| Total performance allocations | $ | 1,480,577 |
| | $ | 912,182 |
| Total performance allocations | $ | 1,128,160 | | | $ | 1,507,571 | |
The table below provides a roll forward of the performance allocations balance:
|
| | | | | | | | | | | | | | | |
| | Credit | | Private Equity | | Real Assets | | Total |
| Performance allocations, January 1, 2019 | $ | 241,896 |
| | $ | 520,892 |
| | $ | 149,394 |
| | $ | 912,182 |
|
| Change in fair value of funds | 184,787 |
| | 553,723 |
| | 23,716 |
| | 762,226 |
|
| Fund distributions to the Company | (55,499 | ) | | (135,259 | ) | | (3,073 | ) | | (193,831 | ) |
| Performance allocations, September 30, 2019 | $ | 371,184 |
| | $ | 939,356 |
| | $ | 170,037 |
| | $ | 1,480,577 |
|
| | | | | | | | | | | | | | | | | | | | | | | |
| Credit | | Private Equity | | Real Assets | | Total |
| Performance allocations, January 1, 2020 | $ | 418,517 | | | $ | 822,531 | | | $ | 266,523 | | | $ | 1,507,571 | |
| Change in fair value of funds | 119,555 | | | (203,558) | | | (74,460) | | | (158,463) | |
| Fund distributions to the Company | (162,767) | | | (8,704) | | | (49,477) | | | (220,948) | |
| Performance allocations, September 30, 2020 | $ | 375,305 | | | $ | 610,269 | | | $ | 142,586 | | | $ | 1,128,160 | |
The change in fair value of funds excludes the reversal of previously realized performance allocations due to the general partner obligation to return previously distributed performance allocations, which is recorded in due to related parties in the condensed consolidated statements of financial condition. See note 1415 for further disclosure regarding the general partner obligation.
The timing of the payment of performance allocations due to the general partner or investment manager varies depending on the terms of the applicable fund agreements. Generally, performance allocations with respect to the private equity funds and certain credit and real assets funds are payable and are distributed to the fund’s general partner upon realization of an investment if the fund’s cumulative returns are in excess of the preferred return.
4. PROFIT SHARING PAYABLE
Profit sharing payable consisted of the following:
|
| | | | | | | |
| | As of September 30, 2019 | | As of December 31, 2018 |
| Credit | $ | 252,893 |
| | $ | 178,093 |
|
| Private Equity | 369,400 |
| | 205,617 |
|
| Real Assets | 71,325 |
| | 68,431 |
|
| Total profit sharing payable | $ | 693,618 |
| | $ | 452,141 |
|
APOLLO GLOBAL MANAGEMENT, INC.
NOTES TO CONDENSED CONSOLIDATED
FINANCIAL STATEMENTS
(dollars in thousands, except share data, except where noted)
Profit sharing payable consisted of the following:
| | | | | | | | | | | |
| As of September 30, 2020 | | As of December 31, 2019 |
| Credit | $ | 324,000 | | | $ | 314,125 | |
| Private Equity | 243,362 | | | 329,817 | |
| Real Assets | 99,372 | | | 114,727 | |
| Total profit sharing payable | $ | 666,734 | | | $ | 758,669 | |
The table below provides a roll forwardroll-forward of the profit sharing payable balance:
|
| | | | | | | | | | | | | | | |
| | Credit | | Private Equity | | Real Assets | | Total |
| Profit sharing payable, January 1, 2019 | $ | 178,093 |
| | $ | 205,617 |
| | $ | 68,431 |
| | $ | 452,141 |
|
| Profit sharing expense | 97,341 |
| | 212,303 |
| | 7,148 |
| | 316,792 |
|
| Payments/other | (22,541 | ) | | (48,520 | ) | | (4,254 | ) | | (75,315 | ) |
| Profit sharing payable, September 30, 2019 | $ | 252,893 |
| | $ | 369,400 |
| | $ | 71,325 |
| | $ | 693,618 |
|
| | | | | | | | | | | | | | | | | | | | | | | |
| Credit | | Private Equity | | Real Assets | | Total |
| Profit sharing payable, January 1, 2020 | $ | 314,125 | | | $ | 329,817 | | | $ | 114,727 | | | $ | 758,669 | |
| Profit sharing expense | 90,284 | | | (76,406) | | | 2,088 | | | 15,966 | |
| Payments/other | (80,409) | | | (10,049) | | | (17,443) | | | (107,901) | |
| Profit sharing payable, September 30, 2020 | $ | 324,000 | | | $ | 243,362 | | | $ | 99,372 | | | $ | 666,734 | |
Profit sharing expense includes (i) changes in amounts payable to employees and former employees entitled to a share of performance revenues in Apollo’s funds and (ii) changes to the fair value of the contingent consideration obligations recognized in connection with certain Apollo acquisitions. Profit sharing expense excludes the potential return of profit sharing distributions that would be due if certain funds were liquidated, which is recorded in due from related parties in the condensed consolidated statements of financial condition. See note 1415 for further disclosure regarding the potential return of profit sharing distributions.
As discussed in note 2, under certain profit sharing arrangements, the Company requires that a portion of certain of the performance revenues distributed to its employees be used to purchase restricted shares of Class A Common Stock issued under its Equity Plan. Prior to distribution of the performance revenues, the Company records the value of the equity-based awards expected to be granted in other assets and other liabilities within the condensed consolidated statements of financial condition. See note 78 for further disclosure regarding deferred equity-based compensation.
5.6. VARIABLE INTEREST ENTITIES
As described in note 2, the Company consolidates entities that are VIEs for which the Company has been designated as the primary beneficiary. There is no recourse to the Company for the consolidated VIEs’ liabilities.
Consolidated Variable Interest Entities
As noted further in note 15, Apollo purchased a 17% incremental equity ownership stake in Athene, bringing Apollo’s beneficial ownership in Athene to approximately 28.5% as of September 30, 2020. This has resulted in Apollo’s indirect ownership through Athene in several VIEs being considered significant and therefore Apollo has consolidated the financial positions and results of operations of such VIEs in accordance with the policy described in note 2. Through its role as investment manager of these VIEs,given that the Company determined that Apolloalso has the power to direct the activities that most significantly impact the economic performance of these VIEs. Additionally, Apollo determined that its interests, both directlyAccordingly, there has been a significant increase in consolidated VIE assets and indirectly from theseliabilities as of September 30, 2020 when compared to December 31, 2019.
Consolidated VIEs represent rights to returns that could potentially be significant to such VIEs. As a result, Apollo determined that it isinclude certain CLOs as well as certain funds managed by the primary beneficiary and therefore should consolidate the VIEs.
Certain CLOs are consolidated by Apollo as the Company is considered to hold a controlling financial interest through direct and indirect interests in these CLOs exclusive of management and performance-based fees received.Company. Through its role as collateral manager or general partner of these VIEs, the Company determined that Apollo has the power to direct the activities that most significantly impact the economic performance of these VIEs. These CLOs were formed forIn addition, the sole purpose of issuing collateralized notes to investors. The assets ofCompany’s combined interests in these VIEs are primarily comprised of senior secured loans and the liabilities are primarily comprised of debt.
significant. The assets of consolidated CLOs are not available to creditors of the Company. In addition,Company, and the investors in these consolidated CLOsVIEs have no recourse against the assets of the Company. There is no recourse to the Company for the consolidated VIEs’ liabilities.
The Company measures boththe fair value of the financial assets and the financial liabilities of the CLOs using the fair value of either the financial assets asor financial liabilities, whichever is more observable (see note 2 for further described in note 2.discussion). The Company has elected the fair value option for financial instruments held by its consolidated CLOs, which includes investments in loans and corporate bonds, as well as debt obligations and contingent obligations held by such consolidated CLOs.obligations. Other assets include amounts due from
APOLLO GLOBAL MANAGEMENT, INC.
NOTES TO CONDENSED CONSOLIDATED
FINANCIAL STATEMENTS
(dollars in thousands, except share data, except where noted)
brokers and interest receivables. Other liabilities include payables for securities purchased, which represent open trades within the consolidated CLOs and primarily relate to corporate loans that are expected to settle within 60 days.
The consolidated funds managed by the Company are investment companies and their investments, which include equity securities as well as debt securities, are held at fair value. Other assets of the consolidated funds include interest receivables and receivables from affiliates. Other liabilities include debt held at amortized cost as well as short-term payables.
Included within liabilities of the consolidated VIEs are notes payable related to certain funds managed by the Company. Each series of notes in a respective consolidated VIE participates in distributions from the VIE, including principal and interest from underlying investments, in accordance with the terms of the note series. Amounts allocated to the noteholders reflect amounts that would be distributed if the VIE’s affairs were wound up and its assets sold for cash equal to their respective carrying values, its liabilities satisfied in accordance with their terms, and all the remaining amounts distributed to the noteholders. The respective VIEs that issue the notes payable are marked at their prevailing net asset value, which approximates fair value.
Results from certain funds managed by the Company are reported on a three month lag based upon the availability of financial information.
Net Gains (Losses) from Investment Activities of Consolidated Variable Interest Entities
The following table presents net gains from investment activities of the consolidated VIEs:
| | | | | | | | | | | | | | | | | | | | | | | | | | | | |
| | For the Three Months Ended
September 30, | | For the Nine Months Ended
September 30, | | | |
| | 2020 | (1) | 2019 | (1) | 2020 | (1) | 2019 | (1) | | |
| Net gains (losses) from investment activities | $ | 142,247 | | | $ | 14,892 | | | $ | (358,497) | | | $ | 38,679 | | | | |
| Net gains (losses) from debt | 24,249 | | | (5,217) | | | 205,518 | | | (16,287) | | | | |
| Interest and other income | 81,663 | | | 7,357 | | | 317,714 | | | 20,772 | | | | |
| Interest and other expenses | (126,040) | | | (6,401) | | | (150,674) | | | (18,436) | | | | |
| Net gains from investment activities of consolidated variable interest entities | $ | 122,119 | | | $ | 10,631 | | | $ | 14,061 | | | $ | 24,728 | | | | |
(1)Amounts reflect consolidation eliminations.
Senior Secured Notes, Subordinated Notes and Secured Borrowings
Included within debt, at fair value and other liabilities are amounts due to third-party institutions by the consolidated VIEs. The following table summarizes the principal provisions of those amounts:
| | | | | | | | | | | | | | | | | | | | | | | | | | | | | | | | | | | |
| | As of September 30, 2020 | | As of December 31, 2019 |
| | Principal Outstanding | | Weighted Average Interest Rate | | Weighted Average Remaining Maturity in Years | | Principal Outstanding | | Weighted Average Interest Rate | | Weighted Average Remaining Maturity in Years |
Senior Secured Notes(2) | $ | 5,172,758 | | | 2.95 | % | | 6.0 | | $ | 757,628 | | | 1.56 | % | | 10.2 |
Subordinated Notes(2) | 606,721 | | | N/A | (1) | 22.2 | | 93,572 | | | N/A | (1) | 20.4 |
Secured Borrowings(2)(3) | 265,744 | | | 2.16 | % | | 0.4 | | 18,976 | | | 3.69 | % | | 7.8 |
| Total | $ | 6,045,223 | | | | | | | $ | 870,176 | | | | | |
(1)The subordinated notes do not have contractual interest rates but instead receive distributions from the excess cash flows of the VIEs.
(2)The notes and borrowings of the consolidated VIEs are collateralized by assets held by each respective vehicle and assets of one vehicle may not be used to satisfy the liabilities of another vehicle. As of September 30, 20192020 and December 31, 2018,2019, the Company held investmentsfair value of $42.2 millionthese consolidated VIEs’ assets were $6.2 billion and $44.2 million, respectively, in$1.3 billion, respectively.
(3)As of September 30, 2020 and December 31, 2019, secured borrowings consist of consolidated foreign currency denominated CLOs, which eliminate in consolidation.
APOLLO GLOBAL MANAGEMENT, INC.
NOTES TO CONDENSED CONSOLIDATED
FINANCIAL STATEMENTS
(dollars in thousands, except share data, except where noted)
Net Gains from Investment Activities of Consolidated Variable Interest Entities
III liability within the fair value hierarchy. The following table presents net gains from investment activitiesfair value of the consolidated VIEs:
|
| | | | | | | | | | | | | | | | |
| | For the Three Months Ended
September 30, | | For the Nine Months Ended
September 30, | |
| | 2019 | (1) | 2018 | (1) | 2019 | (1) | 2018 | (1) |
| Net gains from investment activities | $ | 14,892 |
| | $ | 17,898 |
| | $ | 38,679 |
| | $ | 23,211 |
| |
| Net gains (losses) from debt | (5,217 | ) | | (6,131 | ) | | (16,287 | ) | | 2,043 |
| |
| Interest and other income | 7,357 |
| | 8,391 |
| | 20,772 |
| | 27,118 |
| |
| Interest and other expenses | (6,401 | ) | | (7,157 | ) | | (18,436 | ) | | (23,626 | ) | |
| Net gains from investment activities of consolidated variable interest entities | $ | 10,631 |
| | $ | 13,001 |
| | $ | 24,728 |
| | $ | 28,746 |
| |
| |
(1) | Amounts reflect consolidation eliminations. |
Senior Secured Notes, Subordinated Notes and Secured Borrowings
Included within debt are amounts due to third-party institutions bysecured borrowing as of December 31, 2019 was $19.0 million. This secured borrowing was repaid during the consolidated VIEs. The following table summarizes the principal provisions of the debt of the consolidated VIEs:nine months ended September 30, 2020.
|
| | | | | | | | | | | | | | | | | |
| | As of September 30, 2019 | | As of December 31, 2018 |
| | Principal Outstanding | | Weighted Average Interest Rate | | Weighted Average Remaining Maturity in Years | | Principal Outstanding | | Weighted Average Interest Rate | | Weighted Average Remaining Maturity in Years |
Senior Secured Notes(2) | $ | 730,820 |
| | 1.67 | % | | 10.4 | | $ | 768,860 |
| | 1.67 | % | | 11.2 |
Subordinated Notes(2) | 90,951 |
| | N/A |
| (1) | 20.7 | | 95,686 |
| | N/A |
| (1) | 21.4 |
Secured Borrowings(2)(3) | 18,976 |
| | 3.82 | % | | 8.1 | | 18,976 |
| | 3.42 | % | | 8.8 |
| Total | $ | 840,747 |
| | | | | | $ | 883,522 |
| | | | |
| |
(1) | The subordinated notes do not have contractual interest rates but instead receive distributions from the excess cash flows of the VIEs. |
| |
(2) | The debt of the consolidated VIEs is collateralized by assets of the consolidated VIEs and assets of one vehicle may not be used to satisfy the liabilities of another vehicle. The fair value of the debt and collateralized assets of the Senior Secured Notes, Subordinated Notes and Secured Borrowings are presented below: |
|
| | | | | | | |
| | As of September 30, 2019 | | As of December 31, 2018 |
| Debt, at fair value | $ | 828,824 |
| | $ | 855,461 |
|
| Collateralized assets | $ | 1,244,868 |
| | $ | 1,290,891 |
|
| |
(3) | Secured borrowings consist of a consolidated VIE’s obligation through a repurchase agreement redeemable at maturity with a third party lender. The fair value of the secured borrowings as of September 30, 2019 and December 31, 2018 was $19.0 millionand $19.0 million, respectively.
|
The consolidated VIEs’ debt obligations contain various customary loan covenants. As of September 30, 2019,2020, the Company was not aware of any instances of non-compliance with any of these covenants.
As of September 30, 2019,2020, except for the secured borrowings, the contractual maturities for debt of the consolidated VIEs isare greater than 5 years.
Variable Interest Entities Which are Not Consolidated
The Company holds variable interests in certain VIEs which are not consolidated, as it has been determined that Apollo is not the primary beneficiary.
APOLLO GLOBAL MANAGEMENT, INC.
NOTES TO CONDENSED CONSOLIDATED
FINANCIAL STATEMENTS
(dollars in thousands, except share data, except where noted)
The following table presents the carrying amounts of the assets and liabilities of the VIEs for which Apollo has concluded that it holds a significant variable interest, but that it is not the primary beneficiary. In addition, the table presents the maximum exposure to losses relating to these VIEs.
| | | | | | | | | | | |
| As of
September 30, 2020 | | As of
December 31, 2019 |
| Assets: | | | |
| Cash | $ | 351,302 | | | $ | 222,481 | |
| Investments | 4,352,789 | | | 5,418,295 | |
| Receivables | 41,636 | | | 137,165 | |
| Total Assets | $ | 4,745,727 | | | $ | 5,777,941 | |
| | | |
| Liabilities: | | | |
| Debt and other payables | $ | 1,318,305 | | | $ | 3,449,227 | |
| | | |
| | | |
| Total Liabilities | $ | 1,318,305 | | | $ | 3,449,227 | |
| | | |
Apollo Exposure(1) | $ | 154,248 | | | $ | 250,521 | |
(1)Represents Apollo’s direct investment in those entities in which Apollo holds a significant variable interest and certain other investments. Additionally, cumulative performance allocations are subject to reversal in the event of future losses, as discussed in note 16.
|
| | | | | | | |
| | As of
September 30, 2019 | | As of
December 31, 2018 |
| Assets: | | | |
| Cash | $ | 136,966 |
| | $ | 404,660 |
|
| Investments | 5,802,434 |
| | 4,919,118 |
|
| Receivables | 78,748 |
| | 126,873 |
|
| Total Assets | $ | 6,018,148 |
| | $ | 5,450,651 |
|
| | | | |
| Liabilities: | | | |
| Debt and other payables | $ | 3,391,389 |
| | $ | 3,673,219 |
|
| Total Liabilities | $ | 3,391,389 |
| | $ | 3,673,219 |
|
| | | | |
Apollo Exposure(1) | $ | 261,111 |
| | $ | 244,894 |
|
| |
(1) | Represents Apollo’s direct investment in those entities in which Apollo holds a significant variable interest and certain other investments. Additionally, cumulative performance allocations are subject to reversal in the event of future losses, as discussed in note 15. |
6.APOLLO GLOBAL MANAGEMENT, INC.
NOTES TO CONDENSED CONSOLIDATED
FINANCIAL STATEMENTS
(dollars in thousands, except share data, except where noted)
7. FAIR VALUE MEASUREMENTS OF FINANCIAL INSTRUMENTS
The following tables summarize the Company’s financial assets and financial liabilities recorded at fair value by fair value hierarchy level:
| | | | | | | | | | | | | | | | | | | | | | | | | | | | | |
| | As of September 30, 2020 |
| Level I | | Level II | | Level III | | Total | | Cost |
| Assets | | | | | | | | | |
| U.S. Treasury securities, at fair value | $ | 1,164,867 | | | $ | 0 | | | $ | 0 | | | $ | 1,164,867 | | | $ | 1,164,802 | |
| Investments, at fair value: | | | | | | | | | |
| Investment in Athene Holding | 0 | | | 1,548,414 | | | 0 | | | 1,548,414 | | | 2,093,426 | |
| | | | | | | | | |
| Other investments | 0 | | | 45,011 | | | 290,963 | | (1) | 335,974 | | | 299,920 | |
| Total investments, at fair value | 0 | | | 1,593,425 | | | 290,963 | | | 1,884,388 | | | 2,393,346 | |
| Investments of VIEs, at fair value | 0 | | | 2,017,654 | | | 7,831,721 | | | 9,849,375 | | | |
| Investments of VIEs, valued using NAV | 0 | | | 0 | | | 0 | | | 51,218 | | | |
| Total investments of VIEs, at fair value | 0 | | | 2,017,654 | | | 7,831,721 | | | 9,900,593 | | | |
Derivative assets(2) | 0 | | | 123 | | | 0 | | | 123 | | | |
| Total Assets | $ | 1,164,867 | | | $ | 3,611,202 | | | $ | 8,122,684 | | | $ | 12,949,971 | | | |
| | | | | | | | | |
| Liabilities | | | | | | | | | |
| Debt of VIEs, at fair value | $ | 0 | | | $ | 1,504,205 | | | $ | 4,142,679 | | | $ | 5,646,884 | | | |
| Other liabilities of VIEs, at fair value | 0 | | | 0 | | | 23,025 | | | 23,025 | | | |
Contingent consideration obligations(3) | 0 | | | 0 | | | 103,273 | | | 103,273 | | | |
Derivative liabilities(2) | 0 | | | 89 | | | 0 | | | 89 | | | |
| Total Liabilities | $ | 0 | | | $ | 1,504,294 | | | $ | 4,268,977 | | | $ | 5,773,271 | | | |
|
| | | | | | | | | | | | | | | | | | | |
| | As of September 30, 2019 |
| | Level I | | Level II | | Level III | | Total | | Cost |
| Assets | | | | | | | | | |
| U.S. Treasury securities, at fair value | $ | 551,681 |
| | $ | — |
| | $ | — |
| | $ | 551,681 |
| | $ | 532,589 |
|
| Investments, at fair value: | | | | | | | | | |
| Investment in Athene Holding | 804,447 |
| | — |
| | — |
| | 804,447 |
| | 592,561 |
|
| Other investments | — |
| | 42,018 |
| | 112,630 |
| (1) | 154,648 |
| | 136,618 |
|
| Total investments, at fair value | 804,447 |
| | 42,018 |
| | 112,630 |
| | 959,095 |
| | 729,179 |
|
| Investments of VIEs, at fair value | — |
| | 864,734 |
| | 298,405 |
| | 1,163,139 |
| | |
| Investments of VIEs, valued using NAV | — |
| | — |
| | — |
| | 842 |
| | |
| Total investments of VIEs, at fair value | — |
| | 864,734 |
| | 298,405 |
| | 1,163,981 |
| | |
Derivative assets(2) | — |
| | 468 |
| | — |
| | 468 |
| | |
| Total Assets | $ | 1,356,128 |
| | $ | 907,220 |
| | $ | 411,035 |
| | $ | 2,675,225 |
| | |
| | | | | | | | | | |
| Liabilities | | | | | | | | | |
| Liabilities of VIEs, at fair value | $ | — |
| | $ | 828,824 |
| | $ | — |
| | $ | 828,824 |
| | |
Contingent consideration obligations(3) | — |
| | — |
| | 96,400 |
| | 96,400 |
| | |
Derivative liabilities(2) | — |
| | 89 |
| | — |
| | 89 |
| | |
| Total Liabilities | $ | — |
| | $ | 828,913 |
| | $ | 96,400 |
| | $ | 925,313 |
| | |
| | | | | | | | | | | | | | | | | | | | | | | | | | | | | |
| | As of December 31, 2019 |
| Level I | | Level II | | Level III | | Total | | Cost |
| Assets | | | | | | | | | |
| U.S. Treasury securities, at fair value | $ | 664,249 | | | $ | 0 | | | $ | 0 | | | $ | 664,249 | | | $ | 642,176 | |
| Investments, at fair value: | | | | | | | | | |
| Investment in Athene Holding | 897,052 | | | 0 | | | 0 | | | 897,052 | | | 590,110 | |
| Other investments | 0 | | | 43,094 | | | 113,410 | | (1) | 156,504 | | | 135,686 | |
| Total investments, at fair value | 897,052 | | | 43,094 | | | 113,410 | | | 1,053,556 | | | 725,796 | |
| Investments of VIEs, at fair value | 0 | | | 891,256 | | | 321,069 | | | 1,212,325 | | | |
| Investments of VIEs, valued using NAV | 0 | | | 0 | | | 0 | | | 844 | | | |
| Total investments of VIEs, at fair value | 0 | | | 891,256 | | | 321,069 | | | 1,213,169 | | | |
Derivative assets(2) | 0 | | | 249 | | | 0 | | | 249 | | | |
| Total Assets | $ | 1,561,301 | | | $ | 934,599 | | | $ | 434,479 | | | $ | 2,931,223 | | | |
| | | | | | | | | |
| Liabilities | | | | | | | | | |
| Liabilities of VIEs, at fair value | $ | 0 | | | $ | 850,147 | | | $ | 0 | | | $ | 850,147 | | | |
Contingent consideration obligations(3) | 0 | | | 0 | | | 112,514 | | | 112,514 | | | |
Derivative liabilities(2) | 0 | | | 93 | | | 0 | | | 93 | | | |
| Total Liabilities | $ | 0 | | | $ | 850,240 | | | $ | 112,514 | | | $ | 962,754 | | | |
(2) Derivative assets and derivative liabilities are presented as a component of Other assets and Other liabilities, respectively, in the condensed consolidated statements of financial condition.
(3) Profit sharing payable includes contingent obligations classified as Level III.
APOLLO GLOBAL MANAGEMENT, INC.
NOTES TO CONDENSED CONSOLIDATED
FINANCIAL STATEMENTS
(dollars in thousands, except share data, except where noted)
|
| | | | | | | | | | | | | | | | | | | |
| | As of December 31, 2018 |
| | Level I | | Level II | | Level III | | Total | | Cost |
| Assets | | | | | | | | | |
| U.S. Treasury securities, at fair value | $ | 392,932 |
| | $ | — |
| | $ | — |
| | $ | 392,932 |
| | $ | 390,336 |
|
| Investments, at fair value: | | | | | | | | | |
| Investment in Athene Holding | 761,807 |
| | — |
| | — |
| | 761,807 |
| | 592,572 |
|
| Other investments | — |
| | 42,782 |
| | 96,370 |
| (1) | 139,152 |
| | 124,379 |
|
| Total investments, at fair value | 761,807 |
| | 42,782 |
| | 96,370 |
| | 900,959 |
| | 716,951 |
|
| Investments of VIEs, at fair value | — |
| | 877,427 |
| | 295,987 |
| | 1,173,414 |
| | |
| Investments of VIEs, valued using NAV | — |
| | — |
| | — |
| | 2,263 |
| | |
| Total investments of VIEs, at fair value | — |
| | 877,427 |
| | 295,987 |
| | 1,175,677 |
| | |
Derivative assets(2) | — |
| | 388 |
| | — |
| | 388 |
| | |
| Total Assets | $ | 1,154,739 |
| | $ | 920,597 |
| | $ | 392,357 |
| | $ | 2,469,956 |
| | |
| | | | | | | | | | |
| Liabilities | | | | | | | | | |
| Liabilities of VIEs, at fair value | $ | — |
| | $ | 855,461 |
| | $ | — |
| | $ | 855,461 |
| | |
Contingent consideration obligations(3) | — |
| | — |
| | 74,487 |
| | 74,487 |
| | |
Derivative liabilities(2) | — |
| | 681 |
| | — |
| | 681 |
| | |
| Total Liabilities | $ | — |
| | $ | 856,142 |
| | $ | 74,487 |
| | $ | 930,629 |
| | |
| |
(1) | Other investments as of September 30, 2019 and December 31, 2018 excludes $25.0 million and $17.0 million, respectively, of performance allocations classified as Level III related to certain investments for which the Company has elected the fair value option. The Company’s policy is to account for performance allocations as investments. |
| |
(2) | Derivative assets and derivative liabilities are presented as a component of Other assets and Other liabilities, respectively, in the condensed consolidated statements of financial condition. |
| |
(3) | Profit sharing payable includes contingent obligations classified as Level III. |
The following tables summarize the changes in financial assets measured at fair value for which Level III inputs have been used to determine fair value:
| | | | | | | | | | | | | | | | | | | |
| | | | For the Three Months Ended September 30, 2020 |
| | | Other Investments | | Investments of Consolidated VIEs | | Total |
| Balance, Beginning of Period | | | $ | 267,353 | | | $ | 8,015,580 | | | $ | 8,282,933 | |
| Purchases | | | 18,507 | | | 95,943 | | | 114,450 | |
| Sales of investments/distributions | | | (12,477) | | | (185,327) | | | (197,804) | |
| Settlements | | | 0 | | | (196,746) | | | (196,746) | |
| Net realized gains | | | 0 | | | (328) | | | (328) | |
| Changes in net unrealized gains | | | 6,700 | | | 74,291 | | | 80,991 | |
| Cumulative translation adjustment | | | 10,239 | | | 27,366 | | | 37,605 | |
Transfer into Level III(1) | | | 641 | | | 8,829 | | | 9,470 | |
Transfer out of Level III(1) | | | 0 | | | (7,887) | | | (7,887) | |
| Balance, End of Period | | | $ | 290,963 | | | $ | 7,831,721 | | | $ | 8,122,684 | |
| Change in net unrealized gains included in net gains from investment activities related to investments still held at reporting date | | | $ | 6,700 | | | $ | 0 | | | $ | 6,700 | |
| Change in net unrealized gains included in net gains from investment activities of consolidated VIEs related to investments still held at reporting date | | | 0 | | | (57,888) | | | (57,888) | |
| | | | For the Three Months Ended September 30, 2019 | | For the Three Months Ended September 30, 2019 |
| | Other Investments | | Investments of Consolidated VIEs | | Total | | Other Investments | | Investments of Consolidated VIEs | | Total |
| Balance, Beginning of Period | $ | 114,439 |
| | $ | 301,066 |
| | $ | 415,505 |
| Balance, Beginning of Period | $ | 114,439 | | | $ | 301,066 | | | $ | 415,505 | |
| Sales of investments/distributions | (932 | ) | | — |
| | (932 | ) | |
| | Sale of investments/distributions | | Sale of investments/distributions | (932) | | | 0 | | | (932) | |
| | Changes in net unrealized gains | 1,484 |
| | 10,006 |
| | 11,490 |
| Changes in net unrealized gains | 1,484 | | | 10,006 | | | 11,490 | |
| Cumulative translation adjustment | (4,054 | ) | | (12,667 | ) | | (16,721 | ) | Cumulative translation adjustment | (4,054) | | | (12,667) | | | (16,721) | |
Transfer into Level III(1) | 1,693 |
| | — |
| | 1,693 |
| Transfer into Level III(1) | 1,693 | | | 0 | | | 1,693 | |
| | Balance, End of Period | $ | 112,630 |
| | $ | 298,405 |
| | $ | 411,035 |
| Balance, End of Period | $ | 112,630 | | | $ | 298,405 | | | $ | 411,035 | |
| Change in net unrealized gains included in net gains from investment activities related to investments still held at reporting date | $ | 1,484 |
| | $ | — |
| | $ | 1,484 |
| Change in net unrealized gains included in net gains from investment activities related to investments still held at reporting date | $ | 1,484 | | | $ | 0 | | | $ | 1,484 | |
| Change in net unrealized gains included in net gains from investment activities of consolidated VIEs related to investments still held at reporting date | — |
| | 10,005 |
| | 10,005 |
| Change in net unrealized gains included in net gains from investment activities of consolidated VIEs related to investments still held at reporting date | 0 | | | 10,005 | | | 10,005 | |
| | | | | | | | | | | | | | | | | | | |
| | | | For the Nine Months Ended September 30, 2020 |
| | | Other Investments | | Investments of Consolidated VIEs | | Total |
| Balance, Beginning of Period | | | $ | 113,410 | | | $ | 321,069 | | | $ | 434,479 | |
| Transfer in due to consolidation | | | 0 | | | 7,794,128 | | | 7,794,128 | |
| Purchases | | | 178,462 | | | 955,523 | | | 1,133,985 | |
| Sale of investments/distributions | | | (21,855) | | | (369,204) | | | (391,059) | |
| Settlements | | | 0 | | | (634,694) | | | (634,694) | |
| Net realized gains (losses) | | | 1,751 | | | (207) | | | 1,544 | |
| Changes in net unrealized gains (losses) | | | 5,519 | | | (260,265) | | | (254,746) | |
| Cumulative translation adjustment | | | 13,309 | | | 23,582 | | | 36,891 | |
Transfer into Level III(1) | | | 641 | | | 79,465 | | | 80,106 | |
Transfer out of Level III(1) | | | (274) | | | (77,676) | | | (77,950) | |
| Balance, End of Period | | | $ | 290,963 | | | $ | 7,831,721 | | | $ | 8,122,684 | |
| Change in net unrealized gains included in principal investment income related to investments still held at reporting date | | | $ | 5,519 | | | $ | 0 | | | $ | 5,519 | |
| Change in net unrealized gains included in net gains from investment activities of consolidated VIEs related to investments still held at reporting date | | | 0 | | | (105,191) | | | (105,191) | |
APOLLO GLOBAL MANAGEMENT, INC.
NOTES TO CONDENSED CONSOLIDATED
FINANCIAL STATEMENTS
(dollars in thousands, except share data, except where noted)
| | | | | | | | | | | | | | | | | |
| | For the Nine Months Ended September 30, 2019 |
| Other Investments | | Investments of Consolidated VIEs | | Total |
| Balance, Beginning of Period | $ | 96,370 | | | $ | 295,987 | | | $ | 392,357 | |
| Purchases | 15,048 | | | 0 | | | 15,048 | |
| Sale of investments/distributions | (2,810) | | | 0 | | | (2,810) | |
| | | | | |
| Changes in net unrealized gains | 8,057 | | | 21,178 | | | 29,235 | |
| Cumulative translation adjustment | (4,799) | | | (14,644) | | | (19,443) | |
Transfer into Level III(1) | 1,693 | | | 0 | | | 1,693 | |
Transfer out of Level III(1) | (929) | | | (4,116) | | | (5,045) | |
| Balance, End of Period | $ | 112,630 | | | $ | 298,405 | | | $ | 411,035 | |
| Change in net unrealized gains included in principal investment income related to investments still held at reporting date | $ | 8,057 | | | $ | 0 | | | $ | 8,057 | |
| Change in net unrealized gains included in net gains from investment activities of consolidated VIEs related to investments still held at reporting date | 0 | | | 21,178 | | | 21,178 | |
|
| | | | | | | | | | | |
| | For the Three Months Ended September 30, 2018 |
| | Other Investments | | Investments of Consolidated VIEs | | Total |
| Balance, Beginning of Period | $ | 60,871 |
| | $ | 268,623 |
| | $ | 329,494 |
|
| Purchases | 22,774 |
| | 7,162 |
| | 29,936 |
|
| Sale of investments/distributions | (20,972 | ) | | — |
| | (20,972 | ) |
| Net realized gains | 1 |
| | — |
| | 1 |
|
| Changes in net unrealized gains | 658 |
| | 11,701 |
| | 12,359 |
|
| Cumulative translation adjustment | 972 |
| | (9,056 | ) | | (8,084 | ) |
Transfer out of Level III(1) | (1,616 | ) | | — |
| | (1,616 | ) |
| Balance, End of Period | $ | 62,688 |
| | $ | 278,430 |
| | $ | 341,118 |
|
| Change in net unrealized gains included in net gains from investment activities related to investments still held at reporting date | $ | 592 |
| | $ | — |
| | $ | 592 |
|
| Change in net unrealized gains included in net gains from investment activities of consolidated VIEs related to investments still held at reporting date | — |
| | 11,701 |
| | 11,701 |
|
|
| | | | | | | | | | | |
| | For the Nine Months Ended September 30, 2019 |
| | Other Investments | | Investments of Consolidated VIEs | | Total |
| Balance, Beginning of Period | $ | 96,370 |
| | $ | 295,987 |
| | $ | 392,357 |
|
| Purchases | 15,048 |
| | — |
| | 15,048 |
|
| Sale of investments/distributions | (2,810 | ) | | — |
| | (2,810 | ) |
| Changes in net unrealized gains | 8,057 |
| | 21,178 |
| | 29,235 |
|
| Cumulative translation adjustment | (4,799 | ) | | (14,644 | ) | | (19,443 | ) |
Transfer into Level III(1) | 1,693 |
| | — |
| | 1,693 |
|
Transfer out of Level III(1) | (929 | ) | | (4,116 | ) | | (5,045 | ) |
| Balance, End of Period | $ | 112,630 |
| | $ | 298,405 |
| | $ | 411,035 |
|
| Change in net unrealized gains included in principal investment income related to investments still held at reporting date | $ | 8,057 |
| | $ | — |
| | $ | 8,057 |
|
| Change in net unrealized gains included in net gains from investment activities of consolidated VIEs related to investments still held at reporting date | — |
| | 21,178 |
| | 21,178 |
|
|
| | | | | | | | | | | |
| | For the Nine Months Ended September 30, 2018 |
| | Other Investments | | Investments of Consolidated VIEs | | Total |
Balance, Beginning of Period | $ | 35,701 |
| | $ | 132,348 |
| | $ | 168,049 |
|
| Purchases | 88,536 |
| | 144,984 |
| | 233,520 |
|
| Sale of investments/distributions | (49,288 | ) | | (14,205 | ) | | (63,493 | ) |
| Net realized gains (losses) | 416 |
| | (1,112 | ) | | (696 | ) |
| Changes in net unrealized gains | 2,078 |
| | 28,820 |
| | 30,898 |
|
| Cumulative translation adjustment | 43 |
| | (13,532 | ) | | (13,489 | ) |
Transfer into Level III(1) | 4,558 |
| | 18,783 |
| | 23,341 |
|
Transfer out of Level III(1) | (19,356 | ) | | (17,656 | ) | | (37,012 | ) |
| Balance, End of Period | $ | 62,688 |
| | $ | 278,430 |
| | $ | 341,118 |
|
| Change in net unrealized losses included in principal investment income related to investments still held at reporting date | $ | 2,012 |
| | $ | — |
| | $ | 2,012 |
|
| Change in net unrealized gains included in net gains from investment activities of consolidated VIEs related to investments still held at reporting date | — |
| | 27,664 |
| | 27,664 |
|
| |
(1) | (1)Transfers between Level II and III were a result of subjecting the broker quotes on these financial assets to various criteria which include the number and quality of broker quotes, the standard deviation of obtained broker quotes and the percentage deviation from independent pricing services. |
APOLLO GLOBAL MANAGEMENT, INC.
NOTES TO CONDENSED CONSOLIDATED
FINANCIAL STATEMENTS
(dollars in thousands, except share data, except where noted)
The following table summarizes the changes in fair value in financial liabilities measured at fair value for which Level III inputs have been used to determine fair value:
| | | | | | | | | | | | | | | | | | | | | | | | | | | | |
| | For the Three Months Ended September 30, | | | | |
| 2020 | | 2019 | | | | |
| Contingent Consideration Obligations | | Debt and Other Liabilities of Consolidated VIEs | | Total | | | Contingent Consideration Obligations | | | | |
| Balance, Beginning of Period | $ | 99,097 | | | $ | 4,258,747 | | | $ | 4,357,844 | | | | $ | 93,223 | | | | | |
| | | | | | | | | | | | |
| Issuances | 0 | | | 24,690 | | | 24,690 | | | | 0 | | | | | |
| Repayments | — | | | (42,025) | | | (42,025) | | | | (512) | | | | | |
| Net realized gains | 0 | | | (1,245) | | | (1,245) | | | | 0 | | | | | |
Changes in net unrealized (gains) losses(1) | 4,176 | | | (97,736) | | | (93,560) | | | | 3,689 | | | | | |
| Cumulative translation adjustment | 0 | | | 23,273 | | | 23,273 | | | | 0 | | | | | |
| Balance, End of Period | $ | 103,273 | | | $ | 4,165,704 | | | $ | 4,268,977 | | | | $ | 96,400 | | | | | |
| | | | For the Three Months Ended September 30, | | For the Nine Months Ended September 30, |
| | 2019 | | 2018 | | 2020 | | 2019 |
| | Contingent Consideration Obligations | | Contingent Consideration Obligations | | Contingent Consideration Obligations | | Debt and Other Liabilities of Consolidated VIEs | | Total | | Contingent Consideration Obligations |
| Balance, Beginning of Period | $ | 93,223 |
| | $ | 82,000 |
| Balance, Beginning of Period | $ | 112,514 | | | $ | 0 | | | $ | 112,514 | | | $ | 74,487 | |
| Payments | (512 | ) | | (4,383 | ) | |
| Transfer in due to consolidation | | Transfer in due to consolidation | 0 | | | 4,291,286 | | | 4,291,286 | | | 0 | |
| Issuances | | Issuances | 0 | | | 327,618 | | | 327,618 | | | 0 | |
| Repayments | | Repayments | (12,870) | | | (240,775) | | | (253,645) | | | (1,827) | |
| Net realized gains | | Net realized gains | 0 | | | 2,214 | | | 2,214 | | |
Changes in net unrealized (gains) losses(1) | 3,689 |
| | 83 |
| Changes in net unrealized (gains) losses(1) | 3,629 | | | (239,779) | | | (236,150) | | | 23,740 | |
| Cumulative translation adjustment | | Cumulative translation adjustment | 0 | | | 25,140 | | | 25,140 | | | 0 | |
| Balance, End of Period | $ | 96,400 |
| | $ | 77,700 |
| Balance, End of Period | $ | 103,273 | | | $ | 4,165,704 | | | $ | 4,268,977 | | | $ | 96,400 | |
|
(1)Changes in fair value of contingent consideration obligations are recorded in profit sharing expense in the condensed consolidated statements of operations.
|
| | | | | | | | | | | | | | | |
| | For the Nine Months Ended September 30, |
| | 2019 | | 2018 |
| | Contingent Consideration Obligations | | Liabilities of Consolidated VIEs & Apollo Funds | | Contingent Consideration Obligations | | Total |
| Balance, Beginning of Period | $ | 74,487 |
| | $ | 12,620 |
| | $ | 92,600 |
| | $ | 105,220 |
|
| Payments | (1,827 | ) | | (12,620 | ) | | (6,947 | ) | | (19,567 | ) |
Changes in net unrealized (gains) losses(1) | 23,740 |
| | — |
| | (7,953 | ) | | (7,953 | ) |
| Balance, End of Period | $ | 96,400 |
| | $ | — |
| | $ | 77,700 |
| | $ | 77,700 |
|
| |
(1) | Changes in fair value of contingent consideration obligations are recorded in profit sharing expense in the condensed consolidated statements of operations. |
APOLLO GLOBAL MANAGEMENT, INC.
NOTES TO CONDENSED CONSOLIDATED
FINANCIAL STATEMENTS
(dollars in thousands, except share data, except where noted)
The following tables summarize the quantitative inputs and assumptions used for financial assets and liabilities categorized as Level III under the fair value hierarchy:
|
| | | | | | | | | | | |
| | As of September 30, 2019 |
| | Fair Value | | Valuation Techniques | | Unobservable Inputs | | Ranges | | Weighted Average |
| Financial Assets | | | | | | | | | |
| Other investments | $ | 5,319 |
| | Third Party Pricing | | N/A | | N/A | | N/A |
| 107,311 |
| | Discounted cash flow | | Discount rate | | 15.0% - 16.0% | | 15.6% |
| Investments of consolidated VIEs: | | | | | | | | | |
| Equity securities | 298,405 |
| | Book value multiple | | Book value multiple | | 0.58x | | 0.58x |
| | Discounted cash flow | | Discount rate | | 11.9% | | 11.9% |
| Total Financial Assets | $ | 411,035 |
| | | | | | | | |
| Financial Liabilities | | | | | | | | | |
| Contingent consideration obligation | $ | 96,400 |
| | Discounted cash flow | | Discount rate | | 17.0% | | 17.0% |
| Total Financial Liabilities | $ | 96,400 |
| | | | | | | | |
| | | | | | | | | | | | | | | | | | | | | | | | | | | |
| | As of September 30, 2020 | |
| Fair Value | Valuation Techniques | | Unobservable Inputs | | Ranges | | Weighted Average (1) | |
| Financial Assets | | | | | | | | | |
| Other investments | $ | 213,602 | | Embedded value | | N/A | | N/A | | N/A | |
| 69,395 | | Discounted cash flow | | Discount rate | | 18.0% | | 18.0% | |
| 7,966 | | Third party pricing | | N/A | | N/A | | N/A | |
| Investments of consolidated VIEs: | | | | | | | | | |
| Bank Loans | 3,455,160 | | Discounted cash flow | | Discount rate | | 2.8% - 17.6% | | 4.8% | |
| | Guideline public company | | TEV / EBITDA | | 1.3x - 16.8x | | 10.4x | |
| | Guideline public company | | TEV / Revenue | | 1.4x | | 1.4x | |
| | Third party pricing | | N/A | | N/A | | N/A | |
| Profit Participating Notes | 2,546,845 | | Discounted cash flow | | Discount rate | | 7.5% - 15.0% | | 14.7% | |
| Equity Securities | 1,349,575 | | Discounted cash flow | | Discount rate | | 4.4% - 23.0% | | 7.0% | |
| | Dividend discount model | | Discount rate | | 9.0% - 13.5% | | 10.7% | |
| | Adjusted transaction value | | Purchase multiple | | 1.12x | | 1.12x | |
| | Guideline public company | | Discount rate | | 14.0% | | 14.0% | |
| | Market comparable companies | | NTAV multiple | | 0.34x -1.2x | | 0.9x | |
| | Market comparable companies | | P/E multiple | | 7.7x | | 7.7x | |
| | | | | | | | | |
| Real Estate | 382,895 | | Discounted cash flow | | Discount rate | | 6.3% - 13.5% | | 8.3% | |
| | Discounted cash flow | | Capitalization rate | | 5.8% - 8.3% | | 6.9% | |
| | Direct capitalization | | Capitalization rate | | 5.5% - 8.8% | | 6.6% | |
| Bonds | 50,800 | | Discounted cash flow | | Discount rate | | 5.0% - 12.6% | | 6.7% | |
| CLO Notes | 41,229 | | Third party pricing | | N/A | | N/A | | N/A | |
| Other Equity Investments | 3,289 | | Discounted cash flow | | Discount rate | | 4.4% - 8.2% | | 6.7% | |
| Warrants | 1,928 | | Option model | | Volatility | | 49.0% - 62.5% | | 52.8% | |
| Total Investments of Consolidated VIEs | 7,831,721 | | | | | | | | | |
| Total Financial Assets | $ | 8,122,684 | | | | | | | | | |
| Financial Liabilities | | | | | | | | | |
| Liabilities of Consolidated VIEs: | | | | | | | | | |
| Secured loans | $ | 3,587,956 | | Discounted cash flow | | Discount rate | | 2.0% - 11.2% | | 3.4% | |
| Subordinated notes | 340,999 | | Discounted cash flow | | Discount rate | | 9.0% - 16.0% | | 14.7% | |
| Preferred equity | 213,724 | | Discounted cash flow | | Discount rate | | 15.0% | | 15.0% | |
| Other liabilities | 23,025 | | Discounted cash flow | | Discount rate | | 3.5% - 7.5% | | 5.5% | |
| | Transactional value | | Cost | | N/A | | N/A | |
| | Third party pricing | | N/A | | N/A | | N/A | |
| | Guideline public company | | TEV / LTM EBITDA | | 5.3x | | 5.3x | |
| Total liabilities of Consolidated VIEs: | 4,165,704 | | | | | | | | | |
| Contingent Consideration Obligation | $ | 103,273 | | Discounted cash flow | | Discount rate | | 17.0% | | 17.0% | |
| Total Financial Liabilities | $ | 4,268,977 | | | | | | | | | |
APOLLO GLOBAL MANAGEMENT, INC.
NOTES TO CONDENSED CONSOLIDATED
FINANCIAL STATEMENTS
(dollars in thousands, except share data, except where noted)
| | | | | | | | | | | | | | | | | | | | | | | | | | | | | |
| | As of December 31, 2019 |
| Fair Value | | Valuation Techniques | | Unobservable Inputs | | Ranges | | Weighted Average (1) |
| Financial Assets | | | | | | | | | |
| Other investments | $ | 5,350 | | | Third Party Pricing | | N/A | | N/A | | N/A |
| 108,060 | | | Discounted cash flow | | Discount Rate | | 15.0% - 16.0% | | 15.6% |
| Investments of consolidated VIEs: | | | | | | | | | |
| | | | | | | | | |
| Equity securities | 321,069 | | | Book value multiple | | Book value multiple | | 0.61x | | 0.61x |
| Discounted cash flow | | Discount rate | | 13.1% | | 13.1% |
| | | | | | | | | |
| Total Financial Assets | $ | 434,479 | | | | | | | | | |
| Financial Liabilities | | | | | | | | | |
| Contingent consideration obligation | $ | 112,514 | | | Discounted cash flow | | Discount rate | | 17.3% | | 17.3% |
| Total Financial Liabilities | $ | 112,514 | | | | | | | | | |
N/A Not applicable
|
| | | | | | | | | | | |
| | As of December 31, 2018 |
| | Fair Value | | Valuation Techniques | | Unobservable Inputs | | Ranges | | Weighted Average |
| Financial Assets | | | | | | | | | |
| Other investments | $ | 6,901 |
| | Third Party Pricing | | N/A | | N/A | | N/A |
| 89,469 |
| | Discounted cash flow | | Discount Rate | | 15.0% - 16.0% | | 15.5% |
| Investments of consolidated VIEs: | | | | | | | | | |
| Corporate loans/bonds/CLO notes | 4,116 |
| | Third party pricing | | N/A | | N/A | | N/A |
| Equity securities | 291,871 |
| | Book value multiple | | Book value multiple | | 0.65x | | 0.65x |
| | Discounted cash flow | | Discount rate | | 15.2% | | 15.2% |
| Total investments of consolidated VIEs | 295,987 |
| | | | | | | | |
| Total Financial Assets | $ | 392,357 |
| | | | | | | | |
| Financial Liabilities | | | | | | | | | |
| Contingent consideration obligation | $ | 74,487 |
| | Discounted cash flow | | Discount rate | | 17.0% | | 17.0% |
| Total Financial Liabilities | $ | 74,487 |
| | | | | | | | |
LTM Last twelve months
NTAV Net tangible asset value
P/E Price-to-Earnings
TEV Total enterprise value
Fair Value Measurement of Investment in Athene Holding
As of September 30, 20192020, the fair value of Apollo’s Level II investment in Athene Holding was estimated using the closing market price of Athene Holding shares of $34.08 less a DLOM of 16.8%. The DLOM was derived based on the average remaining lock up restrictions on the shares of Athene Holding held by Apollo (36 months from the closing date of the transactions contemplated by the Transaction Agreement) and the estimated volatility in such shares of Athene Holding. The historical share price volatility of a representative set of Athene Holding’s publicly traded insurance peers was calculated over a three year period equivalent to the lock up on the shares of Athene Holding held by Apollo and used as a proxy to estimate the projected volatility in Athene Holding’s shares. As of December 31, 2018,2019, the fair value of Apollo’s Level I investment in Athene Holding was calculated using the closing market price of Athene Holding shares of $42.06 and $39.83, respectively.$47.03.
Discounted Cash Flow Model
When a discounted cash flow model is used to determine fair value, the significant input used in the valuation model is the discount rate applied to present value the projected cash flows. Increases in the discount rate can significantly lower the fair value of an investment and the contingent consideration obligations; conversely decreases in the discount rate can significantly increase the fair value of an investment and the contingent consideration obligations.
Consolidated VIEs
Investments
AsThe significant unobservable inputs used in the fair value measurement of September 30, 2019bank loans are discount rates. Significant increases (decreases) in any of discount rates would result in a significantly lower (higher) fair value measurement. Where guideline public company method is used to determine fair value, total enterprise value and December 31, 2018,earnings before interest, taxes, depreciation and amortization (“EBITDA”) are used. The guideline public company method values a business based on trading multiples derived from publicly traded companies that are similar to the subject company.
The significant unobservable inputs used in the fair value measurement of bonds, other equity investments and profit participating notes are discount rates. Significant increases (decreases) in discount rates would result in a significantly lower (higher) fair value measurements.
The significant unobservable inputs used in the fair value measurement of the equity securities include the discount rate applied, purchase multiple, price-to-earnings multiple and the booknet tangible asset value multiples applied in the valuation models. These
APOLLO GLOBAL MANAGEMENT, INC.
NOTES TO CONDENSED CONSOLIDATED
FINANCIAL STATEMENTS
(dollars in thousands, except share data, except where noted)
unobservable inputs in isolation can cause significant increases or decreases in fair value. The discount rate is determined based on the market rates an investor would expect for a similar investment with similar risks. When a comparable multiple model is
The significant unobservable inputs used to determinein the fair value measurement of real estate are discount rates and capitalization rates. Significant increases (decreases) in any of discount rates and capitalization rates in isolation would result in a significantly lower (higher) fair value measurement.
The significant unobservable inputs used in the comparable multiplesfair value measurement of warrants are generally multiplied by the underlying companies’ earnings before interest, taxes, depreciation and amortization (“EBITDA”) to establish the total enterprisevolatility rates. Significant increases (decreases) in volatility rates would result in a significantly higher (lower) fair value of the company. The comparable multiple is determined based on the implied trading multiple of public industry peers.measurement.
Liabilities
As of September 30, 2019 and December 31, 2018, theThe debt obligations of the certain consolidated VIEs, that are CLOs, were measured on the basis of the fair value of the financial assets of thethose CLOs as the financial assets were determined to be more observable and, as a result, categorized as Level II in the fair value hierarchy.
The significant unobservable inputs used in the fair value measurement of the Company’s liabilities of consolidated VIEs are discount rates. Significant increases (decreases) in discount rates would result in a significantly lower (higher) fair value measurement.
Contingent Consideration Obligations
The significant unobservable input used in the fair value measurement of the contingent consideration obligations is the discount rate applied in the valuation models. This input in isolation can cause significant increases or decreases in fair value. The discount rate was based on the hypothetical cost of equity in connection with the acquisition of Stone Tower. See note 1516 for further discussion of the contingent consideration obligations.
Valuation of Underlying Investments of Equity Method Investees
As discussed previously, the underlying entities that the Company manages and invests in are primarily investment companies which account for their investments at estimated fair value.
APOLLO GLOBAL MANAGEMENT, INC.
NOTES TO CONDENSED CONSOLIDATED
FINANCIAL STATEMENTS
(dollars in thousands, except share data, except where noted)
On a quarterly basis, Apollo utilizes valuation committees consisting of members from senior management, to review and approve the valuation results related to the investments of the funds it manages. For certain publicly traded vehicles managed by the Company, a review is performed by an independent board of directors. The Company also retains independentexternal valuation firms to provide third-party valuation consulting services to Apollo, which consist of certain limited procedures that management identifies and requests them to perform. The limited procedures provided by the independentexternal valuation firms assist management with validating their valuation results or determining fair value. The Company performs various back-testing procedures to validate their valuation approaches, including comparisons between expected and observed outcomes, forecast evaluations and variance analyses. However, because of the inherent uncertainty of valuation, those estimated values may differ significantly from the values that would have been used had a ready market for the investments existed, and the differences could be material.
Credit Investments
The majority of investments in Apollo’s credit funds are valued based on quoted market prices and valuation models. Quoted market prices are valued based on the average of the “bid” and the “ask” quotes provided by multiple brokers wherever possible without any adjustments. Apollo will designate certain brokers to use to value specific securities. In order to determine the designated brokers, Apollo considers the following: (i) brokers with which Apollo has previously transacted, (ii) the underwriter of the security and (iii) active brokers indicating executable quotes. In addition, when valuing a security based on broker quotes wherever possible Apollo tests the standard deviation amongst the quotes received and the variance between the concluded fair value and the value provided by a pricing service. When broker quotes are not available Apollo considers the use of pricing service quotes or other sources to mark a position. When relying on a pricing service as a primary source, Apollo (i) analyzes how the price has moved over the measurement period, (ii) reviews the number of brokers included in the pricing service’s population, if available, and (iii) validates the valuation levels with Apollo’s pricing team and traders.
Debt and equity securities that are not publicly traded or whose market prices are not readily available are valued at fair value utilizing a model based approach to determine fair value. Valuation approaches used to estimate the fair value of
APOLLO GLOBAL MANAGEMENT, INC.
NOTES TO CONDENSED CONSOLIDATED
FINANCIAL STATEMENTS
(dollars in thousands, except share data, except where noted)
illiquid credit investments also may include the market approach and the income approach, as previously described above. The valuation approaches used consider, as applicable, market risks, credit risks, counterparty risks and foreign currency risks.
Private Equity Investments
The majority of the illiquid investments within our private equity funds are valued using the market approach, which provides an indication of fair value based on a comparison of the subject company to comparable publicly traded companies and transactions in the industry.
Market Approach
The market approach is driven by current market conditions, including actual trading levels of similar companies and, to the extent available, actual transaction data of similar companies. Judgment is required by management when assessing which companies are similar to the subject company being valued. Consideration may also be given to any of the following factors: (1) the subject company’s historical and projected financial data; (2) valuations given to comparable companies; (3) the size and scope of the subject company’s operations; (4) the subject company’s individual strengths and weaknesses; (5) expectations relating to the market’s receptivity to an offering of the subject company’s securities; (6) applicable restrictions on transfer; (7) industry and market information; (8) general economic and market conditions; and (9) other factors deemed relevant. Market approach valuation models typically employ a multiple that is based on one or more of the factors described above. Enterprise value as a multiple of EBITDA is common and relevant for most companies and industries, however, other industry specific multiples are employed where available and appropriate. Sources for gaining additional knowledge related to comparable companies include public filings, annual reports, analyst research reports, and press releases. Once a comparable company set is determined, Apollo reviews certain aspects of the subject company’s performance and determines how its performance compares to the group and to certain individuals in the group. Apollo compares certain measurements such as EBITDA margins, revenue growth over certain time periods, leverage ratios and growth opportunities. In addition, Apollo compares ourthe entry multiple and its relation to the comparable set at the time of acquisition to understand its relation to the comparable set on each measurement date.
Income Approach
For investments where the market approach does not provide adequate fair value information, Apollo relies on the income approach. The income approach is also used to validate the market approach within our private equity funds. The income approach provides an indication of fair value based on the present value of cash flows that a business or security is expected to generate in the future. The most widely used methodology for the income approach is a discounted cash flow method. Inherent in
APOLLO GLOBAL MANAGEMENT, INC.
NOTES TO CONDENSED CONSOLIDATED
FINANCIAL STATEMENTS
(dollars in thousands, except share data, except where noted)
the discounted cash flow method are significant assumptions related to the subject company’s expected results, the determination of a terminal value and a calculated discount rate, which is normally based on the subject company’s weighted average cost of capital, or “WACC.” The WACC represents the required rate of return on total capitalization, which is comprised of a required rate of return on equity, plus the current tax-effected rate of return on debt, weighted by the relative percentages of equity and debt that are typical in the industry. The most critical step in determining the appropriate WACC for each subject company is to select companies that are comparable in nature to the subject company and the credit quality of the subject company. Sources for gaining additional knowledge about the comparable companies include public filings, annual reports, analyst research reports, and press releases. The general formula then used for calculating the WACC considers the after-tax rate of return on debt capital and the rate of return on common equity capital, which further considers the risk-free rate of return, market beta, market risk premium and small stock premium, if applicable. The variables used in the WACC formula are inferred from the comparable market data obtained. The Company evaluates the comparable companies selected and concludes on WACC inputs based on the most comparable company or analyzes the range of data for the investment.
Debt securities that are not publicly traded or whose market prices are not readily available are valued at fair value utilizing a model based approach to determine fair value. Valuation approaches used to estimate the fair value of hybrid capital investments also may include the market approach and the income approach, as previously described above. The valuation approaches used consider, as applicable, market risks, credit risks, counterparty risks and foreign currency risks.
The value of liquid investments, where the primary market is an exchange (whether foreign or domestic), is determined using period end market prices. Such prices are generally based on the close price on the date of determination.
APOLLO GLOBAL MANAGEMENT, INC.
NOTES TO CONDENSED CONSOLIDATED
FINANCIAL STATEMENTS
(dollars in thousands, except share data, except where noted)
Real Assets Investments
The estimated fair value of commercial mortgage-backed securities (“CMBS”) in Apollo’s real assets funds is determined by reference to market prices provided by certain dealers who make a market in these financial instruments. Broker quotes are only indicative of fair value and may not necessarily represent what the funds would receive in an actual trade for the applicable instrument. Additionally, the loans held-for-investment are stated at the principal amount outstanding, net of deferred loan fees and costs for certain investments. The loans in Apollo’s real assets funds are evaluated for possible impairment on a quarterly basis. For Apollo’s real assets funds, valuations of non-marketable underlying investments are determined using methods that include, but are not limited to (i) discounted cash flow estimates or comparable analysis prepared internally, (ii) third party appraisals or valuations by qualified real estate appraisers and (iii) contractual sales value of investments/properties subject to bona fide purchase contracts. Methods (i) and (ii) also incorporate consideration of the use of the income, cost, or sales comparison approaches of estimating property values.
Certain of the credit, private equity, and real assets funds may also enter into foreign currency exchange contracts, total return swap contracts, credit default swap contracts, and other derivative contracts, which may include options, caps, collars and floors. Foreign currency exchange contracts are marked-to-market by recognizing the difference between the contract exchange rate and the current market rate as unrealized appreciation or depreciation. If securities are held at the end of the period, the changes in value are recorded in income as unrealized. Realized gains or losses are recognized when contracts are settled. Total return swap and credit default swap contracts are recorded at fair value as an asset or liability with changes in fair value recorded as unrealized appreciation or depreciation. Realized gains or losses are recognized at the termination of the contract based on the difference between the close-out price of the total return or credit default swap contract and the original contract price. Forward contracts are valued based on market rates obtained from counterparties or prices obtained from recognized financial data service providers.
APOLLO GLOBAL MANAGEMENT, INC.
NOTES TO CONDENSED CONSOLIDATED
FINANCIAL STATEMENTS
(dollars in thousands, except share data, except where noted)
7.8. OTHER ASSETS
Other assets consisted of the following:
| | | | | | | | | | | |
| As of
September 30, 2020 | | As of
December 31, 2019 |
| Fixed assets | $ | 180,793 | | | $ | 138,359 | |
| Less: Accumulated depreciation and amortization | (108,044) | | | (96,347) | |
| Fixed assets, net | 72,749 | | | 42,012 | |
Deferred equity-based compensation(1) | 85,967 | | | 132,422 | |
| Prepaid expenses | 44,178 | | | 55,189 | |
| Intangible assets, net | 25,161 | | | 20,615 | |
| Tax receivables | 57,064 | | | 48,106 | |
| Other | 33,605 | | | 28,105 | |
| Total Other Assets | $ | 318,724 | | | $ | 326,449 | |
|
| | | | | | | |
| | As of
September 30, 2019 | | As of
December 31, 2018 |
| Fixed assets | $ | 119,952 |
| | $ | 109,039 |
|
| Less: Accumulated depreciation and amortization | (93,850 | ) | | (89,049 | ) |
| Fixed assets, net | 26,102 |
| | 19,990 |
|
Deferred equity-based compensation(1) | 117,622 |
| | 80,443 |
|
| Prepaid expenses | 47,823 |
| | 49,648 |
|
| Intangible assets, net | 19,945 |
| | 18,899 |
|
| Tax receivables | 44,374 |
| | 10,464 |
|
| Other | 22,798 |
| | 12,725 |
|
| Total Other Assets | $ | 278,664 |
| | $ | 192,169 |
|
| |
(1) | Deferred equity-based compensation relates to the value of equity-based awards that have been or are expected to be granted in connection with the settlement of certain profit sharing arrangements. A corresponding amount for awards expected to be granted of $98.4 million and $54.5 million, as of September 30, 2019 and December 31, 2018, respectively, is included in other liabilities on the condensed consolidated statements of financial condition. |
Depreciation expense was $2.5$1.8 million and $2.2$2.5 million for the three months ended September 30, 20192020 and 2018,2019, respectively, and $7.1$4.9 million and $6.4$7.1 million for the nine months ended September 30, 20192020 and 2018,2019, respectively, and is presented as a component of general, administrative and other expense in the condensed consolidated statements of operations.
8.9. LEASES
Apollo has operating leases for office space, data centers, and certain equipment under various lease agreements.
The table below presents operating lease expenses:
|
| | | | | | | | | | | | | | | |
| | For the Three Months Ended September 30, | | For the Nine Months Ended September 30, |
| | 2019 | | 2018 | | 2019 | | 2018 |
| Operating lease cost | $ | 11,249 |
| | $ | 9,465 |
| | $ | 30,537 |
| | $ | 27,957 |
|
The following table presents supplemental cash flow information related to operating leases:
|
| | | | | | | | | | | | | | | |
| | For the Three Months Ended September 30, | | For the Nine Months Ended September 30, |
| | 2019 | | 2018 | | 2019 | | 2018 |
| Operating cash flows for operating leases | $ | 582 |
| | $ | 9,592 |
| | $ | 20,212 |
| | $ | 26,195 |
|
APOLLO GLOBAL MANAGEMENT, INC.
NOTES TO CONDENSED CONSOLIDATED
FINANCIAL STATEMENTS
(dollars in thousands, except share data, except where noted)
| | | | | | | | | | | | | | | | | | | | | | | | | |
| | For the Three Months Ended September 30, | | For the Nine Months Ended September 30, | | |
| | 2020 | | 2019 | | 2020 | | 2019 | | |
| Operating lease cost | $ | 9,587 | | | $ | 11,249 | | | $ | 35,566 | | | $ | 30,537 | | | |
The following table presents supplemental cash flow information related to operating leases:
| | | | | | | | | | | | | | | | | | | | | | | | | |
| | For the Three Months Ended September 30, | | For the Nine Months Ended September 30, | | |
| | 2020 | | 2019 | | 2020 | | 2019 | | |
| Operating cash flows for operating leases | $ | 5,404 | | | $ | 582 | | | $ | 19,360 | | | $ | 20,212 | | | |
As of September 30, 2019,2020, the Company’s total lease payments by maturity are presented in the following table:
|
| | | |
| | Operating Leases |
| Remaining 2019 | $ | 8,607 |
|
| 2020 | 25,893 |
|
| 2021 | 24,807 |
|
| 2022 | 20,674 |
|
| 2023 | 19,181 |
|
| Thereafter | 156,460 |
|
| Total lease payments | $ | 255,622 |
|
| Less imputed interest | (47,949 | ) |
| Present value of lease payments | $ | 207,673 |
|
| | | | | |
| | Operating Lease Payments |
| Remaining 2020 | $ | 5,915 | |
| 2021 | 36,959 | |
| 2022 | 36,168 | |
| 2023 | 33,578 | |
| 2024 | 31,030 | |
| Thereafter | 270,469 | |
| Total lease payments | $ | 414,119 | |
| Less imputed interest | (77,350) | |
| Present value of lease payments | $ | 336,769 | |
The Company has undiscounted future operating lease payments of $278.5$250.6 million related to leases that have not commenced that were entered into as of and subsequent to September 30, 2019.2020. Such lease payments are not yet included in the table above or the Company’s condensed consolidated statements of financial condition as lease assets and lease liabilities. These operating leases are anticipated to commence between fiscal years 2019 and 2021by 2022 with lease terms of approximately 15 years.
Supplemental information related to leases is as follows:
|
| | |
| As of
September 30, 2019 |
Weighted average remaining lease term (in years) | 12.5 |
|
Weighted average discount rate | 1.6 | % |
| | | | | | | | | | | |
| As of
September 30, 2020 | | As of
September 30, 2019 |
| Weighted average remaining lease term (in years) | 13.7 | | 12.5 |
| Weighted average discount rate | 3.1 | % | | 1.6 | % |
As of December 31, 2018,2019, the approximate aggregate minimum future payments required for operating leases under U.S. GAAP applicable to that period were as follows:
|
| | | | | | | | | | | | | | | | | | | | | | | | | | | |
| | 2019 | | 2020 | | 2021 | | 2022 | | 2023 | | Thereafter | | Total |
| Aggregate minimum future payments | $ | 39,970 |
| | $ | 25,923 |
| | $ | 33,022 |
| | $ | 36,243 |
| | $ | 35,231 |
| | $ | 400,889 |
| | $ | 571,278 |
|
| | | | | | | | | | | | | | | | | | | | | | | | | | | | | | | | | | | | | | | | | |
| 2020 | | 2021 | | 2022 | | 2023 | | 2024 | | Thereafter | | Total |
| Aggregate minimum future payments | $ | 28,094 | | | $ | 40,516 | | | $ | 51,184 | | | $ | 49,383 | | | $ | 47,237 | | | $ | 467,698 | | | $ | 684,112 | |
9.10. INCOME TAXES
The Company’s income tax (provision) benefit totaled $231.9$(89.4) million and $(19.1)$231.9 million for the three months ended September 30, 20192020 and 2018,2019, respectively, and $195.3$66.2 million and $(46.6)$195.3 million for the nine months ended September 30, 20192020 and 2018,2019, respectively. The Company’s effective tax rate was approximately 11.7% and (80.2)% and 5.0% for the three months ended September 30, 20192020 and 2018,2019, respectively, and 9.8% and (19.9)% and 10.5% for the nine months ended September 30, 20192020 and 2018,2019, respectively.
Under U.S. GAAP, a tax benefit from an uncertain tax position may be recognized when it is more likely than not that the position will be sustained upon examination, including resolution of any related appeals or litigation processes, based on the technical merits of the position. Based upon the Company’s review of its federal, state, local and foreign income tax
APOLLO GLOBAL MANAGEMENT, INC.
NOTES TO CONDENSED CONSOLIDATED
FINANCIAL STATEMENTS
(dollars in thousands, except share data, except where noted)
returns and tax filing positions, the Company determined that 0 unrecognized tax benefits for uncertain tax positions were required to be recorded, including any additional items related to the Conversion. In addition, the Company does not believe that it has any tax positions for which it is reasonably possible that it will be required to record significant amounts of unrecognized tax benefits within the next twelve months.
The primary jurisdictions in which the Company operates are the United States, New York State, New York City, California and the United Kingdom. There are 0 unremitted earnings with respect to the United Kingdom and other foreign entities.
In the normal course of business, the Company is subject to examination by federal, and certain state, local and foreign tax authorities. With a few exceptions, as of September 30, 2019,2020, the Company’s U.S. federal, state, local and foreign income tax returns for the years 20152017 through 20172019 are open under the general statute of limitations provisions and therefore subject to
APOLLO GLOBAL MANAGEMENT, INC.
NOTES TO CONDENSED CONSOLIDATED
FINANCIAL STATEMENTS
(dollars in thousands, except share data, except where noted)
examination. Currently, the Internal Revenue Service is examining the tax return of a subsidiary for the 2011 tax year. The State and City of New York are examining certain subsidiaries’ tax returns for tax years 2011 to 2013.2018. No provisions with respect to these examinations have been recorded.
Prior to the Conversion, Apollo and certain of its subsidiaries operated in the U.S. as partnerships for income tax purposes. Effective September 5, 2019, Apollo Global Management, Inc. converted from a Delaware limited liability company named Apollo Global Management, LLC to a Delaware corporation named Apollo Global Management, Inc. Subsequent to the Conversion, we expect thatgenerally all of the income we earn will bethe Company earns is subject to U.S. corporate income taxes, which could result in an overall higher income tax expense (or benefit) in periods subsequent to the Conversion. As of September 30, 2019, the Company recorded a net deferred tax benefit of $207.5 million.
The Company’s income tax provision and related income tax assets and liabilities are based on, among other things, an estimate of the impact of the Conversion. This includes the impact of the step-up in tax basis of certain assets related to prior exchanges of the Managing Partners’ and Contributing Partners’ AOG units for Class A Common Stock. Additionally, the estimate includes an analysis, as of September 5, 2019, of the difference between tax and book basis of certain partnerships and related underlying assets and liabilities previously not subject to corporate income taxes.
The Company’s estimate of income tax assets and liabilities is based on the most recent information available; however, the impact of the Conversion cannot be fully determined until the analysis ofavailable including the tax and book basis of underlying assets of certain partnerships not previously subject to corporate income taxes has been finalized. The Company does not expect such information and analysis to be available until 2020.tax. The tax basis of the partnerships and their underlying assets and liabilities are based on estimates subject to finalization of the Company’s 2019 tax return information. As a result, the impact of the Conversion may differ possibly materially, from the current estimates described herein.herein, but any change is not anticipated to be material.
The Company recordedrecords additional deferred tax assets as a result of the step-up in the tax basis of assets and intangibles resulting from subsequent exchanges of AOG Units for Class A Common Stock.Stock by the Managing and Contributing Partners. A related tax receivable agreement liability is recorded in due“Due to related partiesRelated Parties” in the condensed consolidated statements of financial condition for the expected payments under the tax receivable agreement entered into by and among APO Corp., the Managing Partners, the Contributing Partners, and other parties thereto (as amended, the “tax receivable agreement”) (see note 14)15). The benefit the Company obtains from the difference in the tax asset recognized and the related liability results in an increase to additional paid in capital. The amortization period for athe portion of thesethe increase in tax basis related to intangibles is 15 years andyears. The realization of the remaining portion of the increase in tax basis relates to the disposition of the underlying assets to which the step-up was attributable.is attributed. The associated deferred tax assets will reverse over the same corresponding time periods.
The table below presents the impact to the deferred tax asset, tax receivable agreement liability and additional paid in capital related to the exchange of AOG Units for Class A Common Stock.
| | | | | | | | | | | | | | | | | | | | |
Exchange of AOG Units
for Class A Common Stock | | Increase in Deferred Tax Asset | | Increase in Tax Receivable Agreement Liability | | Increase to Additional Paid In Capital |
| For the Nine Months Ended September 30, 2020 | | $ | 76,580 | | | $ | 62,531 | | | $ | 14,049 | |
| For the Nine Months Ended September 30, 2019 | | $ | 168,058 | | | $ | 39,092 | | | $ | 16,658 | |
| | | | | | |
| | | | | | |
|
| | | | | | | | | | | | |
Exchange of AOG Units for Class A Common Stock | | Increase in Deferred Tax Asset | | Increase in Tax Receivable Agreement Liability | | Increase to Additional Paid In Capital |
| For the Nine Months Ended September 30, 2019 | | $ | 168,058 |
| (1) | $ | 39,092 |
| | $ | 16,658 |
|
| For the Nine Months Ended September 30, 2018 | | $ | 47,011 |
| | $ | 39,605 |
| | $ | 7,406 |
|
| |
(1) | For the nine months ended September 30, 2019, $150.9 million and $38.6 million of the increase in deferred tax asset and the increase in tax receivable agreement liability, respectively, shown above are related to the step-up in assets from AOG Unit exchanges in prior years triggered by the Conversion, and therefore do not increase additional paid in capital, but rather increase income tax benefit and decrease other income, respectively. |
APOLLO GLOBAL MANAGEMENT, INC.
NOTES TO CONDENSED CONSOLIDATED
FINANCIAL STATEMENTS
(dollars in thousands, except share data, except where noted)
10.11. DEBT
Debt consisted of the following:
| | | | | | | | | | | | | | | | | | | | | | | | | | | | | | | | | | | |
| | As of September 30, 2020 | | As of December 31, 2019 |
| | Outstanding
Balance | | Fair Value | | Annualized
Weighted
Average
Interest Rate | | Outstanding
Balance | | Fair Value | | Annualized
Weighted
Average
Interest Rate |
2024 Senior Notes(1) | $ | 497,654 | | | $ | 552,105 | | (4) | 4.00 | % | | $ | 497,164 | | | $ | 529,333 | | (4) | 4.00 | % |
2026 Senior Notes(1) | 497,089 | | | 575,491 | | (4) | 4.40 | | | 496,704 | | | 540,713 | | (4) | 4.40 | |
2029 Senior Notes(1) | 674,749 | | | 792,870 | | (4) | 4.87 | | | 674,727 | | | 761,780 | | (4) | 4.87 | |
2030 Senior Notes(1) | 494,273 | | | 501,906 | | (4) | 2.65 | | | 0 | | | 0 | | | 0 | |
2039 Senior Secured Guaranteed Notes(1) | 316,807 | | | 370,392 | | (5) | 4.77 | | | 316,100 | | | 354,093 | | (5) | 4.77 | |
2048 Senior Notes(1) | 296,602 | | | 369,164 | | (4) | 5.00 | | | 296,510 | | | 350,331 | | (4) | 5.00 | |
2050 Subordinated Notes(1) | 296,527 | | | 296,625 | | (4) | 4.95 | | | 297,008 | | | 304,125 | | (4) | 4.95 | |
Secured Borrowing I(2) | 18,734 | | | 18,624 | | (3) | 1.84 | | | 17,921 | | | 17,921 | | (3) | 1.99 | |
Secured Borrowing II(2) | 19,925 | | | 19,713 | | (3) | 1.71 | | | 0 | | | 0 | | | 0 | |
2014 AMI Term Facility II(2) | 0 | | | 0 | | | 0 | | | 17,266 | | | 17,266 | | (3) | 1.75 | |
2016 AMI Term Facility I(2) | 19,773 | | | 19,773 | | (3) | 1.30 | | | 18,915 | | | 18,915 | | (3) | 1.30 | |
2016 AMI Term Facility II(2) | 19,114 | | | 19,114 | | (3) | 1.40 | | | 18,285 | | | 18,285 | | (3) | 1.40 | |
| Total Debt | $ | 3,151,247 | | | $ | 3,535,777 | | | | | $ | 2,650,600 | | | $ | 2,912,762 | | | |
|
| | | | | | | | | | | | | | | | | | | | | |
| | As of September 30, 2019 | | As of December 31, 2018 |
| | Outstanding Balance | | Fair Value | | Annualized Weighted Average Interest Rate | | Outstanding Balance | | Fair Value | | Annualized Weighted Average Interest Rate |
2024 Senior Notes(1) | $ | 497,001 |
| | $ | 527,393 |
| (4) | 4.00 | % | | $ | 496,512 |
| | $ | 498,736 |
| (4) | 4.00 | % |
2026 Senior Notes(1) | 496,576 |
| | 533,904 |
| (4) | 4.40 |
| | 496,191 |
| | 502,107 |
| (4) | 4.40 |
|
2029 Senior Notes(1) | 674,719 |
| | 751,179 |
| (4) | 4.87 |
| | — |
| | — |
| | — |
|
2039 Senior Secured Guaranteed Notes(1) | 315,864 |
| | 348,547 |
| (5) | 4.77 |
| | — |
| | — |
| | — |
|
2048 Senior Notes(1) | 296,479 |
| | 343,374 |
| (4) | 5.00 |
| | 296,386 |
| | 290,714 |
| (4) | 5.00 |
|
2014 AMI Term Facility I(2) | 14,860 |
| | 14,860 |
| (3) | 2.00 |
| | 15,633 |
| | 15,633 |
| (3) | 2.00 |
|
2014 AMI Term Facility II(2) | 16,783 |
| | 16,783 |
| (3) | 1.75 |
| | 17,657 |
| | 17,657 |
| (3) | 1.75 |
|
2016 AMI Term Facility I(2) | 18,385 |
| | 18,385 |
| (3) | 1.30 |
| | 19,371 |
| | 19,371 |
| (3) | 1.32 |
|
2016 AMI Term Facility II(2) | 17,773 |
| | 17,772 |
| (3) | 1.40 |
| | 18,698 |
| | 18,698 |
| (3) | 1.70 |
|
| Total Debt | $ | 2,348,440 |
| | $ | 2,572,197 |
| | | | $ | 1,360,448 |
| | $ | 1,362,916 |
| | |
(1)Includes amortization of note discount, as applicable. Outstanding balance is presented net of unamortized debt issuance costs:
| | | | | | | | | | | |
| As of September 30, 2020 | | As of December 31, 2019 |
| 2024 Senior Notes | $ | 1,979 | | | $ | 2,394 | |
| 2026 Senior Notes | 2,662 | | | 3,014 | |
| 2029 Senior Notes | 5,443 | | | 5,928 | |
| 2030 Senior Notes | 4,296 | | | 0 | |
| 2039 Senior Secured Guaranteed Notes | 8,193 | | | 8,900 | |
| 2048 Senior Notes | 3,101 | | | 3,185 | |
| 2050 Subordinated Notes | 3,473 | | | 2,992 | |
| Total | $ | 29,147 | | | $ | 26,413 | |
(2)Apollo Management International LLP (“AMI”), a subsidiary of the Company, entered into several credit facilities (collectively referred to as the “AMI Facilities”) to fund the Company’s investment in certain European CLOs it manages:
| |
(1) | Includes amortization of note discount, as applicable. Outstanding balance is presented net of unamortized debt issuance costs: |
|
| | | | | | | |
| | As of September 30, 2019 | | As of December 31, 2018 |
| 2024 Senior Notes | $ | 2,532 |
| | $ | 2,946 |
|
| 2026 Senior Notes | 3,131 |
| | 3,483 |
|
| 2029 Senior Notes | 6,090 |
| | — |
|
| 2039 Senior Secured Guaranteed Notes | 9,136 |
| | — |
|
| 2048 Senior Notes | 3,214 |
| | 3,298 |
|
| |
(2) | Apollo Management International LLP (“AMI”), a subsidiary of the Company, entered into several five year credit facilities (collectively referred to as the “AMI Facilities”) to fund the Company’s investment in certain European CLOs it manages: |
|
| | | | | | | |
| Facility | | Date | | Loan Amount |
2014 AMI Term FacilitySecured Borrowing I | | July 3, 2014December 19, 2019 | | € | 13,63615,984 |
|
2014 AMI Term FacilitySecured Borrowing II | | December 9, 2014March 5, 2020 | | € | 15,40017,000 |
|
| 2016 AMI Term Facility I | | January 18, 2016 | | € | 16,870 |
|
| 2016 AMI Term Facility II | | June 22, 2016 | | € | 16,308 |
|
| |
(3) | The Secured Borrowings consists of obligations through repurchase agreements redeemable at maturity with third party lenders. The weighted average remaining maturity of Secured Borrowing I and II is 10.9 years. (3)Fair value is based on obtained broker quotes. These notes are classified as a Level III liability within the fair value hierarchy based on the number and quality of broker quotes obtained, the standard deviations of the observed broker quotes and the percentage deviation from independent pricing services. For instances where broker quotes are not available, a discounted cash flow method is used to obtain a fair value. |
| |
(4) | Fair value is based on obtained broker quotes. These notes are classified as a Level II liability within the fair value hierarchy based on the number and quality of broker quotes obtained, the standard deviations of the observed broker quotes and the percentage deviation from independent pricing services. |
| |
(5) | Fair value is based on a discounted cash flow method. These notes are classified as a Level III liability within the fair value hierarchy. |
2013 AMH Credit Facilities—On December 18, 2013, AMH and its subsidiaries and certain other subsidiaries of the Company entered into credit facilities (the “2013 AMH Credit Facilities”) with the lenders and issuing banks party thereto and JPMorgan Chase Bank, N.A., as administrative agent for the lenders. The 2013 AMH Credit Facilities provided for (i) a term loan facility to AMH (the “Term Facility”) that included $750 million of term loan from third-party lenders and $271.7 million of term loan held by a subsidiary of the Company and (ii) a $500 million revolving credit facility (the “Revolver Facility”), in each case, with an original maturity date of January 18, 2019. On March 11, 2016, the maturity date of both the Term Facilityobserved broker quotes and the Revolver Facility was extended by two yearspercentage deviation from external pricing services. For instances where broker quotes are not available, a discounted cash flow method is used to January 18, 2021. The extension was determined to beobtain a modification of the 2013 AMH Credit Facilities in accordance with U.S. GAAP.fair value.
APOLLO GLOBAL MANAGEMENT, INC.
NOTES TO CONDENSED CONSOLIDATED
FINANCIAL STATEMENTS
(dollars in thousands, except share data, except where noted)
In connection with(4)Fair value is based on obtained broker quotes. These notes are classified as a Level II liability within the issuancefair value hierarchy based on the number and quality of broker quotes obtained, the standard deviations of the 2024 Senior Notes, the 2026 Senior Notesobserved broker quotes and the 2048 Senior Notes (as described below), $250 million, $200 million and $300 million ofpercentage deviation from external pricing services.
(5)Fair value is based on a discounted cash flow method. These notes are classified as a Level III liability within the proceeds, respectively, were used to repay the entire remaining amount of both the term loan from third-party lenders and the term loan held by a subsidiary of the Company as of March 15, 2018. The Revolver Facility was replaced as of July 11, 2018 by the 2018 AMH Credit Facility, as described below. The 2013 AMH Credit Facilities and all related loan documents were terminated as of July 11, 2018.fair value hierarchy.
2018 AMH Credit Facility—On July 11, 2018, AMH as borrower (the “Borrower”) entered into a new credit agreement (the “2018 AMH Credit Facility”) with the lenders and issuing banks party thereto and Citibank, N.A., as administrative agent for the lenders. The 2018 AMH Credit Facility provides for a $750 million revolving credit facility to the Borrower with a final maturity date of July 11, 2023. The 2018 AMH Credit Facility is to remain available until its maturity, and any undrawn revolving commitments bear a commitment fee. The interest rate on the 2018 AMH Credit Facility is based on adjusted LIBORLondon Inter-bank Offered Rate (“LIBOR”) and the applicable margin as of September 30, 20192020 was 1.00%. The commitment fee on the $750 million undrawn 2018 AMH Credit Facility as of September 30, 20192020 was 0.09%.
Borrowings under the 2018 AMH Credit Facility may be used for working capital and general corporate purposes, including, without limitation, permitted acquisitions. The Borrower may incur incremental facilities in respect of the 2018 AMH Credit Facility in an aggregate amount not to exceed $250 million plus additional amounts so long as the Borrower is in compliance with a net leverage ratio not to exceed 4.00 to 1.00. As of September 30, 2019,2020, the 2018 AMH Credit Facility was undrawn.
2024 Senior Notes—On May 30, 2014, AMH issued $500 million in aggregate principal amount of its 4.000% Senior Notes due 2024 (the “2024 Senior Notes”), at an issue price of 99.722% of par. Interest on the 2024 Senior Notes is payable semi-annually in arrears on May 30 and November 30 of each year. The 2024 Senior Notes will mature on May 30, 2024. The discount is amortized into interest expense on the condensed consolidated statements of operations over the term of the 2024 Senior Notes. The Company is obligated to settle the 2024 Senior Notes for the face amount of $500 million.
2026 Senior Notes—On May 27, 2016, AMH issued $500 million in aggregate principal amount of its 4.400% Senior Notes due 2026 (the “2026 Senior Notes”), at an issue price of 99.912% of par. Interest on the 2026 Senior Notes is payable semi-annually in arrears on May 27 and November 27 of each year. The 2026 Senior Notes will mature on May 27, 2026. The discount is amortized into interest expense on the condensed consolidated statements of operations over the term of the 2026 Senior Notes. The Company is obligated to settle the 2026 Senior Notes for the face amount of $500 million.
2029 Senior Notes—On February 7, 2019, AMH issued $550 million in aggregate principal amount of its 4.872% Senior Notes due 2029, at an issue price of 99.999% of par. On June 11, 2019, AMH issued an additional $125 million in aggregate principal amount of its 4.872% Senior Notes due 2029 (the “Additional Notes”)., at an issue price of 104.812% of par. The Additional Notes constitute a single class of securities with the previously issued senior notes due 2029 (collectively, the “2029 Senior Notes”). Interest on the 2029 Senior Notes is payable semi-annually in arrears on February 15 and August 15 of each year. The 2029 Senior Notes will mature on February 15, 2029. The discount is amortized into interest expense on the condensed consolidated statements of operations over the term of the 2029 Senior Notes. The Company is obligated to settle the 2029 Senior Notes for the face amount of $675 million.
2030 Senior Notes—On June 5, 2020, AMH issued $500 million in aggregate principal amount of its 2.65% Senior Notes due 2030 (the “2030 Senior Notes”), at an issue price of 99.704% of par. Interest on the 2030 Senior Notes is payable semi-annually in arrears on June 5 and December 5 of each year. The 2030 Senior Notes will mature on June 5, 2030. The discount is amortized into interest expense on the condensed consolidated statements of operations over the term of the 2030 Senior Notes. The Company is obligated to settle the 2030 Senior Notes for the face amount of $500 million.
2039 Senior Secured Guaranteed Notes—On June 10, 2019, APH Finance 1, LLC (the “Issuer”), a subsidiary of the Company, issued $325 million in aggregate principal amount of its 4.77% Series A Senior Secured Guaranteed Notes due 2039 (the “2039 Senior Secured Guaranteed Notes”). The 2039 Senior Secured Guaranteed Notes are secured by a lien on the Issuer’s and the guarantors’ participation interests in the rights to distributions in relation to a portfolio of equity investments owned by affiliates of the Company in certain existing and future funds managed or advised by subsidiaries of the Company. Interest on the 2039 Senior Secured Guaranteed Notes is payable on a quarterly basis. The 2039 Senior Secured Guaranteed Notes will mature in JuneJuly 2039, but, unless prepaid to the extent permitted under the indenture governing the 2039 Senior Secured Guaranteed Notes, the anticipated repayment date will be in JuneJuly 2029. If the Issuer has not repaid or refinanced the 2039 Senior Secured Guaranteed Notes prior to the anticipated repayment date an additional 5.0% per annum will accrue on the 2039 Senior Secured Guaranteed Notes. The issuance costs are amortized into interest expense on the condensed consolidated statements of operations over the expected term of the 2039 Senior Secured Guaranteed Notes.
APOLLO GLOBAL MANAGEMENT, INC.
NOTES TO CONDENSED CONSOLIDATED
FINANCIAL STATEMENTS
(dollars in thousands, except share data, except where noted)
2048 Senior Notes—On March 15, 2018, AMH issued $300 million in aggregate principal amount of its 5.000% Senior Notes due 2048 (the “2048 Senior Notes”), at an issue price of 99.892% of par. Interest on the 2048 Senior Notes is payable semi-annually in arrears on March 15 and September 15 of each year. The 2048 Senior Notes will mature on March 15, 2048. The discount is amortized into interest expense on the condensed consolidated statements of operations over the term of the 2048 Senior Notes. The Company is obligated to settle the 2048 Senior Notes for the face amount of $300 million.
APOLLO GLOBAL MANAGEMENT, INC.
NOTES TO CONDENSED CONSOLIDATED
FINANCIAL STATEMENTS
(dollarsits 4.950% Fixed-Rate Resettable Subordinated Notes due 2050 (the “2050 Subordinated Notes”), at an issue price of 100.000% of par. Interest on the 2050 Subordinated Notes is payable semi-annually in thousands, except share data, except where noted)
As of September 30, 2019,2020, the indentures governing the 2024 Senior Notes, the 2026 Senior Notes, the 2029 Senior Notes, andthe 2030 Senior Notes, the 2048 Senior Notes and the 2050 Subordinated Notes (the “Indentures”) include covenants that restrict the ability of AMH and, as applicable, the guarantors of the notes under the Indentures to incur indebtedness secured by liens on voting stock or profit participating equity interests of their respective subsidiaries, or merge, consolidate or sell, transfer or lease assets. The Indentures also provide for customary events of default.
As of September 30, 2019,2020, the indenture governing the 2039 Senior Secured Guaranteed Notes includes a series of covenants and restrictions customary for transactions of this type, including covenants that (i) require the Issuer to maintain specified reserve accounts to be used to make required payments in respect of the 2039 Senior Secured Guaranteed Notes, (ii) relate to prepayments and related payments of specified amounts, including specified make-whole payments under certain circumstances and (iii) relate to recordkeeping, access to information and similar matters.
The following table presents the interest expense incurred related to the Company’s debt:
| | | | | | | | | | | | | | | | | | | | | | | | | |
| | For the Three Months Ended September 30, | | For the Nine Months Ended September 30, | | |
| | 2020 | | 2019 | | 2020 | | 2019 | | |
Interest Expense:(1) | | | | | | | | | |
| | | | | | | | | |
| 2018 AMH Credit Facility | $ | 316 | | | $ | 334 | | | $ | 945 | | | $ | 961 | | | |
| 2024 Senior Notes | 5,163 | | | 5,163 | | | 15,489 | | | 15,489 | | | |
| 2026 Senior Notes | 5,628 | | | 5,629 | | | 16,885 | | | 16,885 | | | |
| 2029 Senior Notes | 8,229 | | | 8,412 | | | 24,687 | | | 19,514 | | | |
| 2030 Senior Notes | 3,465 | | | 0 | | | 4,428 | | | 0 | | | |
| 2039 Senior Secured Guaranteed Notes | 4,111 | | | 4,112 | | | 12,334 | | | 5,071 | | | |
| 2048 Senior Notes | 3,781 | | | 3,781 | | | 11,343 | | | 11,343 | | | |
| 2050 Subordinated Notes | 3,742 | | | 0 | | | 11,228 | | | 0 | | | |
| AMI Term Facilities/Secured Borrowings | 454 | | | 402 | | | 1,083 | | | 980 | | | |
| Total Interest Expense | $ | 34,889 | | | 27,833 | | | $ | 98,422 | | | $ | 70,243 | | | |
(1)Debt issuance costs incurred are amortized into interest expense over the term of the debt arrangement, as applicable.
|
| | | | | | | | | | | | | | | |
| | For the Three Months Ended September 30, | | For the Nine Months Ended September 30, |
| | 2019 | | 2018 | | 2019 | | 2018 |
Interest Expense:(1) | | | | | | | |
| 2013 AMH Credit Facilities | $ | — |
| | $ | 80 |
| | $ | — |
| | $ | 2,324 |
|
| 2018 AMH Credit Facility | 334 |
| | 232 |
| | 961 |
| | 232 |
|
| 2024 Senior Notes | 5,163 |
| | 5,163 |
| | 15,489 |
| | 15,489 |
|
| 2026 Senior Notes | 5,629 |
| | 5,629 |
| | 16,885 |
| | 16,885 |
|
| 2029 Senior Notes | 8,412 |
| | — |
| | 19,514 |
| | — |
|
| 2039 Senior Secured Guaranteed Notes | 4,112 |
| | — |
| | 5,071 |
| | — |
|
| 2048 Senior Notes | 3,781 |
| | 3,783 |
| | 11,343 |
| | 8,228 |
|
| AMI Term Facilities | 402 |
| | 322 |
| | 980 |
| | 1,010 |
|
| Total Interest Expense | $ | 27,833 |
| | $ | 15,209 |
| | $ | 70,243 |
| | $ | 44,168 |
|
| |
(1) | Debt issuance costs incurred in connection with the 2013 AMH Credit Facilities, the 2018 AMH Credit Facility, the 2024 Senior Notes, the 2026 Senior Notes, the 2029 Senior Notes, the 2039 Senior Secured Guaranteed Notes and the 2048 Senior Notes are amortized into interest expense over the term of the debt arrangement. |
APOLLO GLOBAL MANAGEMENT, INC.
NOTES TO CONDENSED CONSOLIDATED
FINANCIAL STATEMENTS
(dollars in thousands, except share data, except where noted)
11.12. NET INCOME (LOSS) PER SHARE OF CLASS A COMMON STOCK
The table below presents basic and diluted net income per share of Class A Common Stock using the two-class method:
| | | | | | | | | | | | | | | | | | | | | | | |
| | Basic and Diluted |
| For the Three Months Ended
September 30, | | For the Nine Months Ended
September 30, |
| 2020 | | 2019 | | 2020 | | 2019 |
| Numerator: | | | | | | | |
| Net income (loss) attributable to Apollo Global Management, Inc. Class A Common Stockholders | $ | 263,236 | | | $ | 354,106 | | | $ | (304,982) | | | $ | 649,658 | |
Dividends declared on Class A Common Stock(1) | (112,075) | | | (100,355) | | | (413,858) | | | (305,901) | |
Dividends on participating securities(2) | (4,008) | | | (4,450) | | | (14,863) | | | (13,524) | |
| Earnings allocable to participating securities | (5,853) | | | (11,440) | | | 0 | | (3) | (16,003) | |
| Undistributed income (loss) attributable to Class A Common Stockholders: Basic | 141,300 | | | 237,861 | | | (733,703) | | | 314,230 | |
| Dilution effect on distributable income attributable to unvested RSUs | 0 | | | 1,200 | | | 0 | | | 2,355 | |
| Undistributed income (loss) attributable to Class A Common Stockholders: Diluted | $ | 141,300 | | | $ | 239,061 | | | $ | (733,703) | | | $ | 316,585 | |
| Denominator: | | | | | | | |
| Weighted average number of shares of Class A Common Stock outstanding: Basic | 227,771,678 | | | 205,797,643 | | | 227,395,847 | | | 202,087,827 | |
| Dilution effect of unvested RSUs | 0 | | | 1,843,680 | | | 0 | | | 1,657,627 | |
| Weighted average number of shares of Class A Common Stock outstanding: Diluted | 227,771,678 | | | 207,641,323 | | | 227,395,847 | | | 203,745,454 | |
Net Income per share of Class A Common Stock: Basic(4) | | | | | | | |
| Distributed Income | $ | 0.49 | | | $ | 0.50 | | | $ | 1.80 | | | $ | 1.52 | |
| Undistributed Income (Loss) | 0.62 | | | 1.14 | | | (3.21) | | | 1.55 | |
| Net Income (Loss) per share of Class A Common Stock: Basic | $ | 1.11 | | | $ | 1.64 | | | $ | (1.41) | | | $ | 3.07 | |
Net Income per share of Class A Common Stock: Diluted(4) | | | | | | | |
| Distributed Income | $ | 0.49 | | | $ | 0.49 | | | $ | 1.80 | | | $ | 1.51 | |
| Undistributed Income (Loss) | 0.62 | | | 1.14 | | | (3.21) | | | 1.55 | |
| Net Income per share of Class A Common Stock: Diluted | $ | 1.11 | | | $ | 1.63 | | | $ | (1.41) | | | $ | 3.06 | |
|
| | | | | | | | | | | | | | | | |
| | Basic and Diluted | |
| | For the Three Months Ended September 30, | | For the Nine Months Ended September 30, | |
| | 2019 | | 2018 | | 2019 | | 2018 | |
| Numerator: | | | | | | | | |
| Net income attributable to Apollo Global Management, Inc. Class A Common Stockholders | $ | 354,106 |
| | $ | 162,357 |
| | $ | 649,658 |
| | $ | 154,370 |
| |
Dividends declared on Class A Common Stock(1) | (100,355 | ) | | (86,468 | ) | | (305,901 | ) | | (296,093 | ) | |
Dividends on participating securities(2) | (4,450 | ) | | (4,150 | ) | | (13,524 | ) | | (13,687 | ) | |
| Earnings allocable to participating securities | (11,440 | ) | | (3,633 | ) | | (16,003 | ) | | — |
| (3) |
| Undistributed income (loss) attributable to Class A Common Stockholders: Basic | 237,861 |
| | 68,106 |
| | 314,230 |
| | (155,410 | ) | |
| Dilution effect on distributable income attributable to unvested RSUs | 1,200 |
| | — |
| | 2,355 |
| | — |
| |
| Undistributed income (loss) attributable to Class A Common Stockholders: Diluted | $ | 239,061 |
| | $ | 68,106 |
| | $ | 316,585 |
| | $ | (155,410 | ) | |
| Denominator: | | | | | | | | |
| Weighted average number of shares of Class A Common Stock outstanding: Basic | 205,797,643 |
| | 200,347,996 |
| | 202,087,827 |
| | 199,837,707 |
| |
| Dilution effect of unvested RSUs | 1,843,680 |
| | — |
| | 1,657,627 |
| | — |
| |
| Weighted average number of shares of Class A Common Stock outstanding: Diluted | 207,641,323 |
| | 200,347,996 |
| | 203,745,454 |
| | 199,837,707 |
| |
Net Income per share of Class A Common Stock: Basic(4) | | | | | | | | |
| Distributed Income | $ | 0.50 |
| | $ | 0.43 |
| | $ | 1.52 |
| | $ | 1.47 |
| |
| Undistributed Income (Loss) | 1.14 |
| | 0.34 |
| | 1.55 |
| | (0.77 | ) | |
| Net Income per share of Class A Common Stock: Basic | $ | 1.64 |
| | $ | 0.77 |
| | $ | 3.07 |
| | $ | 0.70 |
| |
Net Income per share of Class A Common Stock: Diluted(4) | | | | | | | | |
| Distributed Income | $ | 0.49 |
| | $ | 0.43 |
| | $ | 1.51 |
| | $ | 1.47 |
| |
| Undistributed Income (Loss) | 1.14 |
| | 0.34 |
| | 1.55 |
| | (0.77 | ) | |
| Net Income per share of Class A Common Stock: Diluted | $ | 1.63 |
| | $ | 0.77 |
| | $ | 3.06 |
| | $ | 0.70 |
| |
| |
(1) | (2)Participating securities consist of vested and unvested RSUs that have rights to dividends and unvested restricted shares. (3)No allocation of undistributed losses was made to the participating securities as the holders do not have a contractual obligation to share in the losses of the Company with Class A Common Stockholders. (4)For the three months and nine months ended September 30, 2020, all of the classes of securities were determined to be anti-dilutive. For the three and nine months ended September 30, 2019, unvested RSUs were determined to be dilutive, and were accordingly included in the diluted earnings per share calculation. For the three and nine months ended September 30, 2019, the share options, AOG Units and participating securities were determined to be anti-dilutive and were accordingly excluded from the diluted earnings per share calculation. See note 13 for information regarding the quarterly dividends declared and paid during 2019 and 2018.
|
| |
(2) | Participating securities consist of vested and unvested RSUs that have rights to dividends and unvested restricted shares. |
| |
(3) | No allocation of undistributed losses was made to the participating securities as the holders do not have a contractual obligation to share in the losses of the Company with Class A Common Stockholders. |
| |
(4) | For the three and nine months ended September 30, 2019, unvested RSUs were determined to be dilutive, and were accordingly included in the diluted earnings per share calculation. For the three and nine months ended September 30, 2019, the share options, AOG Units and participating securities were determined to be anti-dilutive and were accordingly excluded from the diluted earnings per share calculation. For the three and nine months ended September 30, 2018, all of the classes of securities were determined to be anti-dilutive. |
The Company has granted RSUs that provide the right to receive, subject to vesting during continued employment, shares of Class A Common Stock pursuant to the Equity Plan. The Company has 3 types of RSU grants, which we refer to as Plan Grants, Bonus Grants and Performance Grants. “Plan Grants” vest over time (generally one to six years) and may or may not provide the right to receive dividend equivalents on vested RSUs on an equal basis with the Class A Common Stockholders any time a dividend is declared. “Bonus Grants” vest over time (generally three years) and generally provide the right to receive dividend equivalents on both vested and unvested RSUs on an equal basis with the Class A Common Stockholders any time a dividend is declared. “Performance Grants” generally vest over time (three(three to five years), subject to the Company’s receipt of performance revenues, within prescribed periods, sufficient to cover the associated equity-based
APOLLO GLOBAL MANAGEMENT, INC.
NOTES TO CONDENSED CONSOLIDATED
FINANCIAL STATEMENTS
(dollars in thousands, except share data, except where noted)
compensation expense. Performance Grants provide the right to receive dividend equivalents on vested RSUs and may also provide the right to receive dividend equivalents on unvested RSUs.
APOLLO GLOBAL MANAGEMENT, INC.
NOTES TO CONDENSED CONSOLIDATED
FINANCIAL STATEMENTS
(dollars in thousands, except share data, except where noted)
Any dividend equivalent paid to an employee will not be returned to the Company upon forfeiture of the award by the employee. Vested and unvested RSUs that are entitled to non-forfeitable dividend equivalents qualify as participating securities and are included in the Company’s basic and diluted earnings per share computations using the two-class method. The holder of an RSU participating security would have a contractual obligation to share in the losses of the entity if the holder is obligated to fund the losses of the issuing entity or if the contractual principal or mandatory redemption amount of the participating security is reduced as a result of losses incurred by the issuing entity. The RSU participating securities do not have a mandatory redemption amount and the holders of the participating securities are not obligated to fund losses,losses; therefore, neither the vested RSUs nor the unvested RSUs are subject to any contractual obligation to share in losses of the Company.
HoldersCertain holders of AOG Units are subject to the transfer restrictions set forth in the agreements with the respective holders and may, a limited number of times each year, upon notice (subject to the terms of an exchange agreement), exchange their AOG Units for shares of Class A Common Stock on a 1-for-1 basis. An AOG Unit holder must exchange one unit in each of the Apollo Operating Group partnerships or limited liability companies to effectuate an exchange for 1 share of Class A Common Stock.
Apollo Global Management, Inc. has 1 share of Class B Common Stock outstanding, which is held by BRH Holdings GP, Ltd. (“BRH”). The voting power of the share of Class B Common Stock is reduced on a 1 vote per 1 AOG Unit basis in the event of an exchange of AOG Units for shares of Class A Common Stock, as discussed above.subject to the terms of the AGM Inc. Certificate of Incorporation. The Class B Common Stock has 0 net income (loss) per share as it does not participate in Apollo’s earnings (losses) or dividends. The Class B Common Stock has 0 dividend orrights and only a de minimis liquidation rights.right. The Class B Common Stock represented 44.8%47.2% and 52.5%44.8% of the total voting power of the Company’s Class A Common Stock and Class B Common Stock with respect to the limited matters upon which they arewere entitled to vote together as a single class pursuant to the Company’s governing documents as of September 30, 20192020 and 2018,2019, respectively.
The following table summarizes the anti-dilutive securities.
| | | | | | | | | | | | | | | | | | | | | | | | | |
| For the Three Months Ended September 30, | | For the Nine Months Ended September 30, | | |
| 2020 | | 2019 | | 2020 | | 2019 | | |
| Weighted average vested RSUs | 137,606 | | | 109,317 | | | 600,651 | | | 527,476 | | | |
| Weighted average unvested RSUs | 8,149,823 | | | N/A | | 7,831,201 | | | N/A | | |
| Weighted average unexercised options | 0 | | | 200,000 | | | 0 | | | 202,778 | | | |
Weighted average AOG Units outstanding(1) | 174,873,808 | | | 195,985,046 | | | 175,447,257 | | | 200,149,596 | | | |
| Weighted average unvested restricted shares | 1,148,241 | | | 954,304 | | | 1,212,620 | | | 989,684 | | | |
|
| | | | | | | | | | | |
| | For the Three Months Ended September 30, | | For the Nine Months Ended September 30, |
| | 2019 | | 2018 | | 2019 | | 2018 |
| Weighted average vested RSUs | 109,317 |
| | 155,287 |
| | 527,476 |
| | 477,503 |
|
| Weighted average unvested RSUs | N/A |
| | 9,592,835 |
| | N/A |
| | 8,593,350 |
|
| Weighted average unexercised options | 200,000 |
| | 204,167 |
| | 202,778 |
| | 204,167 |
|
| Weighted average AOG Units outstanding | 195,985,046 |
| | 202,552,808 |
| | 200,149,596 |
| | 203,222,170 |
|
| Weighted average unvested restricted shares | 954,304 |
| | 940,060 |
| | 989,684 |
| | 827,576 |
|
12.13. EQUITY-BASED COMPENSATION
Equity-based awards granted to employees and non-employees as compensation are measured based on the grant date fair value of the award. Equity-based awards that do not require future service (i.e., vested awards) are expensed immediately. Equity-based employee awards that require future service are expensed over the relevant service period. Equity-based awards that require performance metrics to be met are expensed only when the performance metric is met or deemed probable.
RSUs
The Company grants RSUs under the Equity Plan. The fair value of all grants is based on the grant date fair value, which considers the public share price of the Company’s Class A Common Stock subject to certain discounts, as applicable.
The estimated total grant date fair value for Plan Grants and Bonus Grants is charged to compensation expense on a straight-line basis over the vesting period, which for Plan Grants is generally one to six years, with the first installment vesting one year after grant and quarterly vesting thereafter, and for Bonus Grants is generally annual vesting over three years.
During the nine months ended September 30, 2019, the Company awarded Performance Grants of 1.3 million RSUs to certain employees with a grant date fair value of $27.6 million, which vest over time (generally 3 to 5 years) subject to the receipt of performance revenues, within prescribed periods, sufficient to cover the associated equity-based compensation expense. Additionally, the Company modified Plan Grants of 0.5 million RSUs with a grant date fair value of $10.5 million to Performance Grants of 0.5 million RSUs. The modification did not result in a change to the grant date fair value of the awards, as performance conditions that impact vesting are not considered in the determination of the fair value of an award. In accordance with U.S.
APOLLO GLOBAL MANAGEMENT, INC.
NOTES TO CONDENSED CONSOLIDATED
FINANCIAL STATEMENTS
(dollars in thousands, except share data, except where noted)
During the nine months ended September 30, 2020 and September 30, 2019, the Company awarded Performance Grants of 2.1 million and 1.3 million RSUs to certain employees with a grant date fair value of $81.5 million and $27.6 million, respectively, which vest subject to continued employment and the Company’s receipt of performance revenues, within prescribed periods, sufficient to cover the associated equity-based compensation expense. In accordance with U.S. GAAP, equity-based compensation expense for these and other Performance Grants will be recognized on an accelerated recognition method over the requisite service period to the extent the performance revenue metrics are met or deemed probable. The following table summarizes the equity based compensation expense recognized relating to Performance Grants.
|
| | | | | | | | | | | |
| | For the Three Months Ended September 30, | | For the Nine Months Ended September 30, |
| | 2019 | | 2018 | | 2019 | | 2018 |
| Equity-based compensation | 16,456 |
| | 19,259 |
| | 45,587 |
| | 46,207 |
|
Additionally, the Company entered into an agreement in 2018 with several employees under which it expects to grant them RSUs beginningwould be granted starting in 2020 if year-over-year growth in certain discretionary earnings metrics iswere attained prior to grant and they remainremained employed at the grant date. Once granted, these RSUs willthe awards vest based on bothsubject to continued serviceemployment and the Company’s receipt of performance revenues within prescribed periods, sufficient to cover the associated equity-based compensation expense. In accordanceconnection with U.S. GAAP, equity-based compensation expense for such awards, ifthese agreements, the Company granted 0.3 million RSUs with a grant date fair value of $11.7 million that were fully vested and when granted, will be recognized on an accelerated recognition method over the requisite service period to the extent the performance revenue metrics are met or deemed probable. NaN equity-based compensation expense was recognized related to these RSUs forexpensed during the three and ninemonths ended June 30, 2020. No additional awards were granted during the three months ended September 30, 2019.2020.
The following table summarizes the equity based compensation expense recognized relating to Performance Grants:
| | | | | | | | | | | | | | | | | | | | | | | | | |
| For the Three Months Ended September 30, | | For the Nine Months Ended September 30, | | |
| 2020 | | 2019 | | 2020 | | 2019 | | |
| Equity-based compensation | $ | 19,925 | | | $ | 16,456 | | | $ | 77,255 | | | $ | 45,587 | | | |
The fair value of all RSU grants made during the nine months ended September 30, 2020 and September 30, 2019 was $185.1 millionand 2018 was $102.2 million, and $227.1 million, respectively.
The following table presents the actual forfeiture rates and equity-based compensation expense recognized:
| | | | | | | | | | | | For the Three Months Ended September 30, | | For the Nine Months Ended September 30, | |
| | For the Three Months Ended September 30, | | For the Nine Months Ended September 30, | | 2020 | | 2019 | | 2020 | | 2019 | |
| | 2019 | | 2018 | | 2019 | | 2018 | |
| Actual forfeiture rate | 0.5 | % | | 0.7 | % | | 1.7 | % | | 8.0 | % | |
| Forfeiture rate | | Forfeiture rate | 0.5 | % | | 0.5 | % | | 6.8 | % | | 1.7 | % | |
| Equity-based compensation | $ | 33,771 |
| | $ | 37,166 |
| | $ | 101,709 |
| | $ | 99,544 |
| Equity-based compensation | $ | 40,473 | | | $ | 33,771 | | | $ | 133,273 | | | $ | 101,709 | | |
The following table summarizes RSU activity:
| | | | | | | | | | | | | | | | | | | | | | | | | | |
| Unvested | | Weighted Average Grant Date Fair Value | | Vested | | Total Number of RSUs Outstanding | |
| Balance at January 1, 2020 | 9,784,693 | | | $ | 26.38 | | | 2,349,618 | | | 12,134,311 | | (1) |
| Granted | 4,364,141 | | | 42.42 | | | — | | | 4,364,141 | | |
| Forfeited | (949,090) | | | $ | 22.83 | | | (17,185) | | | (966,275) | | |
| Vested | (2,486,605) | | | 30.46 | | | 2,486,605 | | | — | | |
| Issued | — | | | $ | 28.20 | | | (4,661,031) | | | (4,661,031) | | |
| Balance at September 30, 2020 | 10,713,139 | | (2) | $ | 32.28 | | | 158,007 | | | 10,871,146 | | (1) |
|
| | | | | | | | | | | | | |
| | Unvested | | Weighted Average Grant Date Fair Value | | Vested | | Total Number of RSUs Outstanding | |
| Balance at January 1, 2019 | 9,839,968 |
| | $ | 26.52 |
| | 2,380,783 |
| | 12,220,751 |
| (1) |
| Granted | 4,141,766 |
| | 24.66 |
| | — |
| | 4,141,766 |
| |
| Forfeited | (214,041 | ) | | 26.01 |
| | (18,524 | ) | | (232,565 | ) | |
| Vested | (2,001,237 | ) | | 27.71 |
| | 2,001,237 |
| | — |
| |
| Issued | — |
| | 23.84 |
| | (4,146,944 | ) | | (4,146,944 | ) | |
| Balance at September 30, 2019 | 11,766,456 |
| (2) | $ | 25.67 |
| | 216,552 |
| | 11,983,008 |
| (1) |
(1)
| |
(1) | Amount excludes RSUs which have vested and have been issued in the form of Class A Common Stock. |
| |
(2) | RSUs were expected to vest over the weighted average period of 3.0 years. |
Restricted Share Awards—Athene Holding
The Company has granted Athene Holding restricted share awards to certain employees of the Company. Separately, Athene Holding has also granted restricted share awards to certain employees of the Company. Both awards are collectively referred to as the “AHL Awards.” Certain of the AHL Awards function similarly to options as they are exchangeable for Class A shares of Athene Holding upon payment of a conversion price and the satisfaction of certain other conditions. The awards granted are either subjectCommon Stock.
(2)RSUs were expected to time-based vesting conditions that generally vest over three to five years or vest upon achieving certain metrics, such as attainmentthe weighted average period of certain rates of return and realized cash received by certain investors in Athene Holding upon sale of their shares.
The Company records the AHL Awards in other assets and other liabilities in the condensed consolidated statements of financial condition. The fair value of the asset is amortized through equity-based compensation over the vesting period. The fair value of the liability is remeasured each period, with any changes in fair value recorded in compensation expense in the
APOLLO GLOBAL MANAGEMENT, INC.
NOTES TO CONDENSED CONSOLIDATED
FINANCIAL STATEMENTS
(dollars in thousands, except share data, except where noted)
condensed consolidated statements of operations. For AHL Awards granted by Athene Holding, compensation expense related to amortization of the asset is offset, with certain exceptions, by related management fees earned by the Company from Athene.
The grant date fair value of the AHL Awards is based on the share price of Athene Holding, less discounts for transfer restrictions, and has been categorized as Level II within the fair value hierarchy as a result. The AHL Awards that function similarly to options were valued using a multiple-scenario model, which considers the price volatility of the underlying share price of Athene Holding, time to expiration and the risk-free rate, while the other awards were valued using the share price of Athene Holding less any discounts for transfer restrictions.
The following table summarizes the management fees, equity-based compensation expense and actual forfeiture rates for the AHL Awards:
|
| | | | | | | | | | | | | | | |
| | For the Three Months Ended September 30, | | For the Nine Months Ended September 30, |
| | 2019 | | 2018 | | 2019 | | 2018 |
| Management fees | $ | (167 | ) | | $ | 1,872 |
| | $ | 375 |
| | $ | (14 | ) |
| Equity-based compensation | 194 |
| | 3,349 |
| | 1,909 |
| | 1,075 |
|
| Actual forfeiture rate | — | % | | — | % | | — | % | | 3.6 | % |
Equity-Based Compensation Allocation
Equity-based compensation is allocated based on ownership interests. Therefore, the amortization of equity-based compensation is allocated to stockholders’ equity attributable to AGM Inc. and the Non-Controlling Interests, which results in a difference in the amounts charged to equity-based compensation expense and the amounts credited to stockholders’ equity attributable to AGM Inc. in the Company’s condensed consolidated financial statements.
Below is a reconciliation of the equity-based compensation allocated to AGM Inc.:
|
| | | | | | | | | | | | | | |
| | For the Nine Months Ended September 30, 2019 |
| | Total Amount | | Non-Controlling Interest % in Apollo Operating Group | | Allocated to Non-Controlling Interest in Apollo Operating Group(1) | | Allocated to Apollo Global Management, Inc. |
| RSUs, share options and restricted share awards | $ | 113,254 |
| | — | % | | $ | — |
| | $ | 113,254 |
|
| AHL Awards | 1,909 |
| | 44.8 |
| | 855 |
| | 1,054 |
|
| Other equity-based compensation awards | 17,241 |
| | 44.8 |
| | 7,721 |
| | 9,520 |
|
| Total equity-based compensation | $ | 132,404 |
| | | | 8,576 |
| | 123,828 |
|
Less other equity-based compensation awards(2) | | | | | (8,576 | ) | | (21,639 | ) |
| Capital increase related to equity-based compensation | | | | | $ | — |
| | $ | 102,189 |
|
|
| | | | | | | | | | | | | | |
| | For the Nine Months Ended September 30, 2018 |
| | Total Amount | | Non-Controlling Interest % in Apollo Operating Group | | Allocated to Non-Controlling Interest in Apollo Operating Group(1) | | Allocated to Apollo Global Management, Inc. |
| RSUs, share options and restricted share awards | $ | 108,719 |
| | — | % | | $ | — |
| | $ | 108,719 |
|
| AHL Awards | 1,075 |
| | 50.2 |
| | 539 |
| | 536 |
|
| Other equity-based compensation awards | 13,849 |
| | 50.2 |
| | 6,950 |
| | 6,899 |
|
| Total equity-based compensation | $ | 123,643 |
| | | | 7,489 |
| | 116,154 |
|
Less other equity-based compensation awards(2) | | | | | (7,489 | ) | | (21,916 | ) |
| Capital increase related to equity-based compensation | | | | | $ | — |
| | $ | 94,238 |
|
| |
(1) | Calculated based on average ownership percentage for the period considering issuances of Class A shares or Class A Common Stock, as applicable, during the period. |
APOLLO GLOBAL MANAGEMENT, INC.
NOTES TO CONDENSED CONSOLIDATED
FINANCIAL STATEMENTS
(dollars in thousands, except share data, except where noted)
| |
(2) | Includes equity-based compensation reimbursable by certain funds. |
Below is a reconciliation of the equity-based compensation allocated to AGM Inc.: 13. | | | | | | | | | | | | | | | | | | | | | | | |
| For the Nine Months Ended September 30, 2020 |
| Total Amount | | Non-Controlling Interest % in Apollo Operating Group | | Allocated to Non-Controlling Interest in Apollo Operating Group(1) | | Allocated to Apollo Global Management, Inc. |
| RSUs, share options and restricted share awards | $ | 152,998 | | | 0 | % | | $ | 0 | | | $ | 152,998 | |
| | | | | | | |
| Other equity-based compensation awards | 8,270 | | | 47.1 | | | 3,898 | | | 4,372 | |
| Total equity-based compensation | $ | 161,268 | | | | | 3,898 | | | 157,370 | |
Less other equity-based compensation awards(2) | | | | | (3,898) | | | (23,520) | |
| Capital increase related to equity-based compensation | | | | | $ | 0 | | | $ | 133,850 | |
| | | | | | | | | | | | | | | | | | | | | | | |
| For the Nine Months Ended September 30, 2019 |
| Total Amount | | Non-Controlling Interest % in Apollo Operating Group | | Allocated to Non-Controlling Interest in Apollo Operating Group(1) | | Allocated to Apollo Global Management, Inc. |
| RSUs, share options and restricted share awards | $ | 113,254 | | | 0 | % | | $ | 0 | | | $ | 113,254 | |
| | | | | | | |
| Other equity-based compensation awards | 19,150 | | | 44.8 | | | 8,576 | | | 10,574 | |
| Total equity-based compensation | $ | 132,404 | | | | | 8,576 | | | 123,828 | |
Less other equity-based compensation awards(2) | | | | | (8,576) | | | (21,639) | |
| Capital increase related to equity-based compensation | | | | | $ | 0 | | | $ | 102,189 | |
(1)Calculated based on average ownership percentage for the period considering issuances of Class A shares or Class A Common Stock, as applicable, during the period.
(2)Includes equity-based compensation reimbursable by certain funds.
14. EQUITY
Common Stock
As a result of the Conversion, (i) each Class A Shareshare converted into 1 share of Class A Common Stock (ii) the Class B Shareshare converted into 1 share of Class B Common Stock and (iii) the Former Manager was granted 1 issued and outstanding, fully paid and nonassessable share of Class C Common Stock, which bestows to its holder certain management rights over the Company.
Holders of Class A Common Stock are entitled to participate in dividends from the Company on a pro rata basis. HoldersAs of September 30, 2020, the holders of Class A Common Stock do not elect the members of the Company’s board of directors and havehad limited voting rights.
During the three and nine months ended September 30, 20192020 and 2018,2019, the Company issued shares of Class A Common Stock in settlement of vested RSUs. The Company has generally allowed holders of vested RSUs and exercised share options to settle their tax liabilities by reducing the number of shares of Class A Common Stock issued to them, which the Company refers to as “net share settlement.” Additionally, the Company has generally allowed holders of share options to settle their exercise price by reducing the number of shares of Class A Common Stock issued to them at the time of exercise by an amount sufficient to cover the exercise price. The net share settlement results in a liability for the Company and a corresponding accumulated deficit adjustment.
In February 2016, Apollo announced its adoption of a program to repurchase up to $250 million in the aggregate of its shares of Class A Common Stock, including up to $150 million in the aggregate of its outstanding shares of Class A Common Stock through a share repurchase program and up to $100 million through net share settlement of equity-based awards granted under the Equity Plan. In January 2019, Apollo increased its authorized share repurchase amount by $250 million, bringing the total authorized repurchase amount to $500 million. On March 12, 2020, Apollo announced that the executive committee of the Company’s board of directors approved a new share repurchase authorization that allows the Company to repurchase up to $500 million whichof its Class A common stock. This new authorization increased the Company’s capacity to repurchase shares from $80 million of unused capacity under the Company’s previously approved the share repurchase plan authorization. The share repurchase plan authorization may be used to repurchase outstanding shares of Class A Common Stock as well as to reduce the number of shares of Class A Common Stock to be issued to employees to satisfy associated tax obligations in connection with
APOLLO GLOBAL MANAGEMENT, INC.
NOTES TO CONDENSED CONSOLIDATED
FINANCIAL STATEMENTS
(dollars in thousands, except share data, except where noted)
the settlement of equity-based awards granted under the the Equity Plan (or any successor equity plan thereto). Shares of Class A Common Stock may be repurchased from time to time in open market transactions, in privately negotiated transactions, pursuant to a trading plan adopted in accordance with Rule 10b5-1 of the Exchange Act, or otherwise, with the size and timing of these repurchases depending on legal requirements, price, market and economic conditions and other factors. Apollo is not obligated under the terms of the program to repurchase any of its shares of Class A Common Stock. The repurchase program has no expiration date and may be suspended or terminated by the Company at any time without prior notice.
The table below summarizes the issuance of shares of Class A Common Stock for equity-based awards:
| | | | | | | | | | | | | | | |
| For the Nine Months Ended September 30, | | | | |
| 2020 | | 2019 | | | | |
Shares of Class A Common Stock issued in settlement of vested RSUs and share options exercised(1) | 4,661,031 | | | 4,146,944 | | | | | |
Reduction of shares of Class A Common Stock issued(2) | (1,972,369) | | | (1,585,734) | | | | | |
Shares of Class A Common Stock purchased related to share issuances and forfeitures(3) | 581,828 | | | (103,954) | | | | | |
| Issuance of shares of Class A Common Stock for equity-based awards | 3,270,490 | | | 2,457,256 | | | | | |
|
| | | | | |
| | For the Nine Months Ended September 30, |
| | 2019 | | 2018 |
Shares of Class A Common Stock issued in settlement of vested RSUs and share options exercised(1) | 4,146,944 |
| | 3,587,931 |
|
Reduction of shares of Class A Common Stock issued(2) | (1,585,734 | ) | | (1,201,328 | ) |
Shares of Class A Common Stock purchased related to share issuances and forfeitures(3) | (103,954 | ) | | (183,969 | ) |
| Issuance of shares of Class A Common Stock for equity-based awards | 2,457,256 |
| | 2,202,634 |
|
| |
(1) | The gross value of shares issued was $127.2 million and $120.6(2)Cash paid for tax liabilities associated with net share settlement was $91.9 million and $48.8 million for the nine months ended September 30, 2020 and 2019, respectively. (3)Certain Apollo employees receive a portion of the profit sharing proceeds of certain funds in the form of (a) restricted shares of Class A Common Stock of AGM Inc. that they are required to purchase with such proceeds or (b) RSUs, in each case which equity-based awards generally vest over three years. These equity-based awards are granted under the Company's Equity Plan. To prevent dilution on account of these awards, Apollo may, in its discretion, repurchase shares of Class A Common Stock on the open market and retire them. During the nine months ended September 30, 2020 and 2019, we issued 636,425 and 163,024 of such restricted shares and 168,591 and 102,089 of such RSUs under the Equity Plan, respectively, and repurchased 19,549 and 265,113 shares of Class A Common Stock in open-market transactions not pursuant to a publicly-announced repurchase plan or program, respectively. In addition, there were 54,597 and 1,865 restricted shares forfeited during the nine months ended September 30, 2020 and 2019, and 2018, respectively, based on the closing price of a share of Class A Common Stock at the time of issuance. |
| |
(2) | Cash paid for tax liabilities associated with net share settlement was $48.8 million and $40.3 million for the nine months ended September 30, 2019 and 2018, respectively. |
| |
(3) | Certain Apollo employees receive a portion of the profit sharing proceeds of certain funds in the form of (a) restricted shares of Class A Common Stock of AGM Inc. that they are required to purchase with such proceeds or (b) RSUs, in each case which equity-based awards generally vest over three years. These equity-based awards are granted under the Company's Equity Plan. To prevent dilution on account of these awards, Apollo may, in its discretion, repurchase of shares of Class A Common Stock on the open market and retire them. During the nine months ended September 30, 2019 and 2018, we issued 163,024 and 673,326 of such restricted shares and 102,089 and 75,636 of such RSUs under the Equity Plan, respectively, and repurchased 265,113 and 830,438 shares of Class A Common Stock in open-market transactions not pursuant to a publicly-announced repurchase plan or program, respectively. In addition, there were 1,865 and 26,857 restricted shares forfeited during the nine months ended September 30, 2019 and 2018, respectively.
|
APOLLO GLOBAL MANAGEMENT, INC.
NOTES TO CONDENSED CONSOLIDATED
FINANCIAL STATEMENTS
(dollars in thousands, except share data, except where noted)
Additionally, during the nine months ended September 30, 2020 and 2019, 2,735,546 and 2018, 3,453,901 and 1,571,438 shares of Class A Common Stock were repurchased in open market transactions as part of the publicly announced share repurchase program adopted in February 2016,discussed above, respectively, and such shares were subsequently canceled by the Company. The Company paid $102.4 million$90.7 and $54.3$102.4 million for these open market share repurchases during the nine months ended September 30, 2020 and 2019, and 2018, respectively.
Preferred Stock Issuance
On March 7, 2017, Apollo issued 11,000,000 6.375% Series A Preferred shares (the “Series A Preferred shares”) for gross proceeds of $275.0 million, or $264.4 million net of issuance costs and on March 19, 2018, Apollo issued 12,000,000 6.375% Series B Preferred shares (the “Series B Preferred shares” and collectively with the Series A Preferred shares, the “Preferred shares”) for gross proceeds of $300.0 million, or $289.8 million net of issuance costs.
As a result of the Conversion, (i) each Series A Preferred Shareshare representing limited liability company interests of AGM LLC outstanding immediately prior to the Effective Time converted into 1 issued and outstanding, fully paid and nonassessable share of Series A Preferred Stock, having a liquidation preference of $25.00 per share, of the Company and (ii) each Series B Preferred Shareshare representing limited liability company interests of AGM LLC outstanding immediately prior to the Effective Time converted into 1 issued and outstanding, fully paid and nonassessable share of Series B Preferred Stock, having a liquidation preference of $25.00 per share, of the Company (the Series A Preferred Stock and the Series B Preferred Stock collectively, the “Preferred Stock”).
When, as and if declared by the executive committee of the board of directors of AGM Inc., dividends on the Preferred Stock will be payable quarterly on March 15, June 15, September 15 and December 15 of each year, beginning on June 15, 2018 for the Series B Preferred Stock, at a rate per annum equal to 6.375%. Dividends on the Preferred Stock are discretionary and non-cumulative. During 2019, quarterly cash dividends were $0.398438 per share of Series A Preferred Stock and Series B Preferred Stock.
APOLLO GLOBAL MANAGEMENT, INC.
NOTES TO CONDENSED CONSOLIDATED
FINANCIAL STATEMENTS
(dollars in thousands, except share data, except where noted)
Subject to certain exceptions, unless dividends have been declared and paid or declared and set apart for payment on the Preferred Stock for a quarterly dividend period, during the remainder of that dividend period Apollo may not declare or pay or set apart payment for dividends on any shares of Class A Common Stock or any other equity securities that the Company may issue in the future ranking as to the payment of dividends, junior to the Preferred Stock (“Junior Stock”) and Apollo may not repurchase any Junior Stock. These restrictions were not applicable during the initial dividend period, which was the period from March 19, 2018 to but excluding June 15, 2018 for the Series B Preferred Stock.
The Series A Preferred Stock and the Series B Preferred Stock may be redeemed at Apollo’s option, in whole or in part, at any time on or after March 15, 2022 and March 15, 2023, respectively, at a price of $25.00 per share of Preferred Stock, plus declared and unpaid dividends to, but excluding, the redemption date, without payment of any undeclared dividends. Holders of the Preferred Stock will have no right to require the redemption of the Preferred Stock and there is no maturity date.
If a certain change of control event or a certain tax redemption event occurs prior to March 15, 2022 and March 15, 2023 for the Series A Preferred Stock and the Series B Preferred Stock, respectively, the Preferred Stock may be redeemed at Apollo’s option, in whole but not in part, upon at least 30 days’ notice, within 60 days of the occurrence of such change of control event or such tax redemption event, as applicable, at a price of $25.25 per share of Preferred Stock, plus declared and unpaid dividends to, but excluding, the redemption date, without payment of any undeclared dividends. If a certain rating agency event occurs prior to March 15, 2023, the Series B Preferred Stock may be redeemed at Apollo’s option, in whole but not in part, upon at least 30 days’ notice, within 60 days of the occurrence of such rating agency event, at a price of $25.50 per share of Series B Preferred Stock, plus declared and unpaid dividends to, but excluding, the redemption date, without payment of any undeclared dividends. If (i) a change of control event occurs (whether before, on or after March 15, 2022 and March 15, 2023 for the Series A Preferred Stock and the Series B Preferred Stock, respectively) and (ii) Apollo does not give notice prior to the 31st day following the change of control event to redeem all the outstanding Preferred Stock, the dividend rate per annum on the Preferred Stock will increase by 5.00%, beginning on the 31st day following such change of control event.
The Preferred Stock are not convertible into Class A Common Stock and have no voting rights, except in limited circumstances as provided in the Company’s certificate of incorporation. In connection with the issuance of the Preferred Stock, certain Apollo Operating Group entities issued for the benefit of Apollo a series of preferred units with economic terms that mirror those of the Preferred Stock.
APOLLO GLOBAL MANAGEMENT, INC.
NOTES TO CONDENSED CONSOLIDATED
FINANCIAL STATEMENTS
(dollars in thousands, except share data, except where noted)
Dividends and Distributions
The table below presents information regarding the quarterly dividends and distributions which were made at the sole discretion of the Former Manager of the Company prior to the Conversion and at the sole discretion of the executive committee of the board of directors subsequent to the Conversion (in millions, except per share data). Certain subsidiaries of AGM Inc. may be subject to U.S. federal, state, local and non-U.S. income taxes at the entity level and may pay taxes and/or make payments under the tax receivable agreement in a given fiscal year; therefore, the net amounts ultimately distributed by AGM Inc. to its Class A Common Stockholders in respect of each fiscal year are generally expected to be less than the net amounts distributed to AOG Unitholders. Subsequent to the Conversion, distributions from AGM Inc. are referred to as dividends.
|
| | | | | | | | | | | | | | | | | | | | | | |
| Dividend Declaration Date | | Dividend per share of Class A Common Stock | | Payment Date | | Dividend to Class A Common Stockholders | | Distribution to Non-Controlling Interest Holders in the Apollo Operating Group | | Total Distributions from Apollo Operating Group | | Distribution Equivalents on Participating Securities |
| February 1, 2018 | | $ | 0.66 |
| | February 28, 2018 | | $ | 133.0 |
| | $ | 133.7 |
| | $ | 266.7 |
| | $ | 5.4 |
|
| N/A | | — |
| | April 12, 2018 | | — |
| | 50.5 |
| (1) | 50.5 |
| | — |
|
| May 3, 2018 | | 0.38 |
| | May 31, 2018 | | 76.6 |
| | 77.0 |
| | 153.6 |
| | 4.1 |
|
| August 2, 2018 | | 0.43 |
| | August 31, 2018 | | 86.5 |
| | 87.1 |
| | 173.6 |
| | 4.2 |
|
| November 1, 2018 | | 0.46 |
| | November 30, 2018 | | 92.6 |
| | 93.0 |
| | 185.6 |
| | 4.4 |
|
| For the year ended December 31, 2018 | | $ | 1.93 |
| | | | $ | 388.7 |
| | $ | 441.3 |
| | $ | 830.0 |
| | $ | 18.1 |
|
| January 31, 2019 | | $ | 0.56 |
| | February 28, 2019 | | $ | 113.3 |
| | $ | 113.3 |
| | $ | 226.6 |
| | $ | 5.0 |
|
| N/A | | — |
| | April 12, 2019 | | — |
| | 45.4 |
| (1) | 45.4 |
| | — |
|
| May 2, 2019 | | 0.46 |
| | May 31, 2019 | | 92.2 |
| | 93.0 |
| | 185.2 |
| | 4.1 |
|
| July 31, 2019 | | 0.50 |
| | August 30, 2019 | | 100.4 |
| | 101.0 |
| | 201.4 |
| | 4.4 |
|
| N/A | | — |
| | August 15, 2019 | | — |
| | 4.1 |
| (1) | 4.1 |
| | — |
|
| N/A | | — |
| | September 26, 2019 | | — |
| | 17.8 |
| (1) | 17.8 |
| | — |
|
| For the nine months ended September 30, 2019 | | $ | 1.52 |
| | | | $ | 305.9 |
| | $ | 374.6 |
| | $ | 680.5 |
| | $ | 13.5 |
|
-52-
| |
(1) | On April 12, 2018 and April 12, 2019, the Company made a $0.25 and $0.18 per AOG Unit pro rata distribution, respectively, to the Non-Controlling Interest holders in the Apollo Operating Group, in connection with taxes and payments made under the tax receivable agreement. See note 14 for more information regarding the tax receivable agreement. On April 12, 2019, August 15, 2019 and September 26, 2019, the Company made a $0.04, $0.02 and $0.10 per AOG Unit pro rata distribution, respectively, to the Non-Controlling Interest holders in the Apollo Operating Group, in connection with federal corporate estimated tax payments. |
APOLLO GLOBAL MANAGEMENT, INC.
NOTES TO CONDENSED CONSOLIDATED
FINANCIAL STATEMENTS
(dollars in thousands, except share data, except where noted)
| | | | | | | | | | | | | | | | | | | | | | | | | | | | | | | | | | | | | | |
| Dividend Declaration Date | | Dividend per share of Class A Common Stock | | Payment Date | | Dividend to Class A Common Stockholders | | Distribution to Non-Controlling Interest Holders in the Apollo Operating Group | | Total Distributions from Apollo Operating Group | | Distribution Equivalents on Participating Securities |
| | | | | | | | | | | | |
| | | | | | | | | | | | |
| | | | | | | | | | | | |
| | | | | | | | | | | | |
| | | | | | | | | | | | |
| | | | | | | | | | | | |
| January 31, 2019 | | $ | 0.56 | | | February 28, 2019 | | $ | 113.3 | | | $ | 113.3 | | | $ | 226.6 | | | $ | 5.0 | |
| N/A | | 0 | | | April 12, 2019 | | 0 | | | 45.4 | | (1) | 45.4 | | | 0 | |
| May 2, 2019 | | 0.46 | | | May 31, 2019 | | 92.2 | | | 93.0 | | | 185.2 | | | 4.1 | |
| July 31, 2019 | | 0.50 | | | August 30, 2019 | | 100.4 | | | 101.0 | | | 201.4 | | | 4.4 | |
| N/A | | 0 | | | August 15, 2019 | | 0 | | | 4.1 | | (1) | 4.1 | | | 0 | |
| N/A | | 0 | | | September 26, 2019 | | 0 | | | 17.8 | | (1) | 17.8 | | | 0 | |
| October 31, 2019 | | 0.50 | | | November 29,2019 | | 111.5 | | | 90.1 | | | 201.6 | | | 4.4 | |
| For the Year Ended December 31, 2019 | | $ | 2.02 | | | | | $ | 417.4 | | | $ | 464.7 | | | $ | 882.1 | | | $ | 17.9 | |
| January 30, 2020 | | $ | 0.89 | | | February 28, 2020 | | $ | 205.6 | | | $ | 155.6 | | | $ | 361.2 | | | $ | 7.2 | |
| N/A | | 0 | | | April 15, 2020 | | 0 | | | 43.0 | | (1) | 43.0 | | | 0 | |
| May 1, 2020 | | 0.42 | | May 29, 2020 | | 96.2 | | | 85.7 | | | 181.9 | | | 3.6 | |
| July 30, 2020 | | 0.49 | | August 31, 2020 | | 112.1 | | | 100.0 | | | 212.1 | | | 4.0 | |
| | | | | | | | | | | | |
| For the Nine Months Ended September 30, 2020 | | $ | 1.80 | | | | | $ | 413.9 | | | $ | 384.3 | | | $ | 798.2 | | | $ | 14.8 | |
(1) On April 15, 2020 and April 12, 2019, the Company made $0.21 and $0.18 per AOG Unit pro rata distribution, respectively, to the Non-Controlling Interest holders in the Apollo Operating Group, in connection with taxes and payments made under the tax receivable agreement. See note 15 for more information regarding the tax receivable agreement. On April 12, 2019, August 15, 2019 and September 26, 2019, the Company made a $0.04, $0.02 and $0.10 per AOG Unit pro rata distribution, respectively, to the Non-Controlling Interest holders in the Apollo Operating Group, in connection with federal corporate estimated tax payments.
Non-Controlling Interests
As discussed in note 1, Athene Holding acquired 29,154,519 non-voting equity interests of the Apollo Operating Group, which as of September 30, 2020 represented a 6.7% economic interest in the Apollo Operating Group. The table below presents equity interests in Apollo’s consolidated, but not wholly-owned, subsidiaries and funds. Net income and comprehensive income attributable to Non-Controlling Interests consisted of the following:
APOLLO GLOBAL MANAGEMENT, INC.
NOTES TO CONDENSED CONSOLIDATED
FINANCIAL STATEMENTS
(dollars in thousands, except share data, except where noted)
|
| | | | | | | | | | | | | | | |
| | For the Three Months Ended September 30, | | For the Nine Months Ended September 30, |
| | 2019 | | 2018 | | 2019 | | 2018 |
| Net income attributable to Non-Controlling Interests in consolidated entities: | | | | | | | |
Interest in management companies and a co-investment vehicle(1) | $ | 827 |
| | $ | 1,067 |
| | $ | 2,853 |
| | $ | 4,176 |
|
| Other consolidated entities | 6,256 |
| | 10,273 |
| | 18,035 |
| | 21,859 |
|
| Net income attributable to Non-Controlling Interests in consolidated entities | $ | 7,083 |
| | $ | 11,340 |
| | $ | 20,888 |
| | $ | 26,035 |
|
| | | | | | | | |
| Net income attributable to Non-Controlling Interests in the Apollo Operating Group: | | | | | | | |
| Net income | $ | 521,094 |
| | $ | 362,692 |
| | $ | 1,178,822 |
| | $ | 397,154 |
|
| Net income attributable to Non-Controlling Interests in consolidated entities | (7,083 | ) | | (11,340 | ) | | (20,888 | ) | | (26,035 | ) |
| Net income after Non-Controlling Interests in consolidated entities | 514,011 |
| | 351,352 |
| | 1,157,934 |
| | 371,119 |
|
| Adjustments: | | | | | | | |
Income tax provision (benefit)(2) | (231,896 | ) | | 19,092 |
| | (195,345 | ) | | 46,596 |
|
NYC UBT and foreign tax benefit(3) | (1,913 | ) | | (2,776 | ) | | (6,286 | ) | | (6,963 | ) |
| Net loss in non-Apollo Operating Group entities | 38,724 |
| | 35 |
| | 39,270 |
| | 310 |
|
| Series A Preferred Stock Dividends | (4,382 | ) | | (4,383 | ) | | (13,148 | ) | | (13,149 | ) |
| Series B Preferred Stock Dividends | (4,782 | ) | | (4,781 | ) | | (14,344 | ) | | (9,350 | ) |
| Total adjustments | (204,249 | ) | | 7,187 |
| | (189,853 | ) | | 17,444 |
|
| Net income after adjustments | 309,762 |
| | 358,539 |
| | 968,081 |
| | 388,563 |
|
| Weighted average ownership percentage of Apollo Operating Group | 48.7 | % | | 50.2 | % | | 49.6 | % | | 50.3 | % |
| Net income attributable to Non-Controlling Interests in Apollo Operating Group | $ | 150,741 |
| | $ | 179,831 |
| | $ | 480,784 |
| | $ | 194,250 |
|
| | | | | | | | |
| Net Income attributable to Non-Controlling Interests | $ | 157,824 |
| | $ | 191,171 |
| | $ | 501,672 |
| | $ | 220,285 |
|
| Other comprehensive income (loss) attributable to Non-Controlling Interests | (12,999 | ) | | (2,130 | ) | | (16,053 | ) | | (13,859 | ) |
| Comprehensive Income Attributable to Non-Controlling Interests | $ | 144,825 |
| | $ | 189,041 |
| | $ | 485,619 |
| | $ | 206,426 |
|
| |
(1) | Reflects the remaining interest held by certain individuals who receive an allocation of income from certain of the credit funds managed by Apollo. |
| |
(2) | Reflects all taxes recorded in our condensed consolidated statements of operations. Of this amount, U.S. federal, state, and local corporate income taxes attributable to APO Corp. are added back to income of the Apollo Operating Group before calculating Non-Controlling Interests as the income allocable to the Apollo Operating Group is not subject to such taxes. |
| |
(3) | Reflects NYC UBT and foreign taxes that are attributable to the Apollo Operating Group and its subsidiaries related to its operations in the U.S. as partnerships and in non-U.S. jurisdictions as corporations. As such, these amounts are considered in the income attributable to the Apollo Operating Group. |
| | | | | | | | | | | | | | | | | | | | | | | | | |
| For the Three Months Ended September 30, | | For the Nine Months Ended September 30, | | |
| | 2020 | | 2019 | | 2020 | | 2019 | | |
| Net income (loss) attributable to Non-Controlling Interests in consolidated entities: | | | | | | | | | |
Interest in management companies and a co-investment vehicle(1) | $ | 1,037 | | | $ | 827 | | | $ | 2,316 | | | $ | 2,853 | | | |
| Other consolidated entities | 98,984 | | | 6,256 | | | (25,636) | | | 18,035 | | | |
| Net income (loss) attributable to Non-Controlling Interests in consolidated entities | $ | 100,021 | | | $ | 7,083 | | | $ | (23,320) | | | $ | 20,888 | | | |
| | | | | | | | | |
| Net income (loss) attributable to Non-Controlling Interests in the Apollo Operating Group: | | | | | | | | | |
| Net income (loss) | $ | 676,099 | | | $ | 521,094 | | | $ | (608,659) | | | $ | 1,178,822 | | | |
| Net income (loss) attributable to Non-Controlling Interests in consolidated entities | (100,021) | | | (7,083) | | | 23,320 | | | (20,888) | | | |
| Net income (loss) after Non-Controlling Interests in consolidated entities | 576,078 | | | 514,011 | | | (585,339) | | | 1,157,934 | | | |
| Adjustments: | | | | | | | | | |
Income tax provision (benefit)(2) | 89,357 | | | (231,896) | | | (66,173) | | | (195,345) | | | |
NYC UBT and foreign tax (provision) benefit(3) | (11,966) | | | (1,913) | | | (22,609) | | | (6,286) | | | |
| Net income (loss) in non-Apollo Operating Group entities | 46 | | | 38,724 | | | 64 | | | 39,270 | | | |
| Series A Preferred Stock Dividends | (4,382) | | | (4,382) | | | (13,148) | | | (13,148) | | | |
| Series B Preferred Stock Dividends | (4,781) | | | (4,782) | | | (14,344) | | | (14,344) | | | |
| Total adjustments | 68,274 | | | (204,249) | | | (116,210) | | | (189,853) | | | |
| Net income (loss) after adjustments | 644,352 | | | 309,762 | | | (701,549) | | | 968,081 | | | |
| Weighted average ownership percentage of Apollo Operating Group | 47.1 | % | | 48.7 | % | | 46.7 | % | | 49.6 | % | | |
| Net income (loss) attributable to Non-Controlling Interests in Apollo Operating Group | $ | 303,679 | | | $ | 150,741 | | | $ | (307,849) | | | $ | 480,784 | | | |
| | | | | | | | | |
| Net Income (loss) attributable to Non-Controlling Interests | $ | 403,700 | | | $ | 157,824 | | | $ | (331,169) | | | $ | 501,672 | | | |
| Other comprehensive income (loss) attributable to Non-Controlling Interests | 13,081 | | | (12,999) | | | 12,263 | | | (16,053) | | | |
| Comprehensive Income (Loss) attributable to Non-Controlling Interests | $ | 416,781 | | | $ | 144,825 | | | $ | (318,906) | | | $ | 485,619 | | | |
14.(1)Reflects the remaining interest held by certain individuals who receive an allocation of income from certain of the credit funds managed by Apollo.
(2)Reflects all taxes recorded in our condensed consolidated statements of operations. Of this amount, U.S. federal, state, and local corporate income taxes attributable to AGM Inc. and its subsidiaries are added back to income of the Apollo Operating Group before calculating Non-Controlling Interests as the income allocable to the Apollo Operating Group is not subject to such taxes.
(3)Reflects NYC UBT and foreign taxes that are attributable to the Apollo Operating Group and its subsidiaries related to its operations in the U.S. as partnerships and in non-U.S. jurisdictions as corporations. As such, these amounts are considered in the income attributable to the Apollo Operating Group.
15. RELATED PARTY TRANSACTIONS AND INTERESTS IN CONSOLIDATED ENTITIES
Management fees, transaction and advisory fees and reimbursable expenses from the funds the Company manages and their portfolio companies are included in due from related parties in the condensed consolidated statements of financial condition. The Company also typically facilitates the payment of certain operating costs incurred by the funds that it manages as well as their related parties. These costs are normally reimbursed by such funds and are included in due from related parties. Other related party transactions include loans to employees and periodic sales of ownership interests in Apollo funds to employees. Due from related parties and due to related parties are comprised of the following:
APOLLO GLOBAL MANAGEMENT, INC.
NOTES TO CONDENSED CONSOLIDATED
FINANCIAL STATEMENTS
(dollars in thousands, except share data, except where noted)
|
| | | | | | | |
| | As of
September 30, 2019 | | As of
December 31, 2018 |
| Due from Related Parties: | | | |
| Due from credit funds | $ | 190,919 |
| | $ | 153,687 |
|
| Due from private equity funds | 21,901 |
| | 19,993 |
|
| Due from real assets funds | 34,307 |
| | 42,471 |
|
| Due from portfolio companies | 57,783 |
| | 67,740 |
|
| Due from Contributing Partners, employees and former employees | 135,161 |
| | 94,217 |
|
| Total Due from Related Parties | $ | 440,071 |
| | $ | 378,108 |
|
| Due to Related Parties: | | | |
| Due to Managing Partners and Contributing Partners | $ | 287,456 |
| | $ | 285,598 |
|
| Due to credit funds | 4,212 |
| | 3,444 |
|
| Due to private equity funds | 215,110 |
| | 136,078 |
|
| Due to real assets funds | 335 |
| | 315 |
|
| Total Due to Related Parties | $ | 507,113 |
| | $ | 425,435 |
|
| | | | | | | | | | | |
| As of
September 30, 2020 | | As of
December 31, 2019 |
| Due from Related Parties: | | | |
| Due from credit funds | $ | 172,570 | | | $ | 186,495 | |
| Due from private equity funds | 34,926 | | | 27,724 | |
| Due from real assets funds | 29,749 | | | 26,626 | |
| Due from portfolio companies | 49,826 | | | 53,394 | |
| Due from Contributing Partners, employees and former employees | 200,382 | | | 120,830 | |
| | | |
| Total Due from Related Parties | $ | 487,453 | | | $ | 415,069 | |
| Due to Related Parties: | | | |
| Due to Managing Partners and Contributing Partners | $ | 316,387 | | | $ | 302,050 | |
| Due to credit funds | 8,375 | | | 7,213 | |
| Due to private equity funds | 349,483 | | | 191,620 | |
| Due to real assets funds | 37,941 | | | 504 | |
| | | |
| Total Due to Related Parties | $ | 712,186 | | | $ | 501,387 | |
Tax Receivable Agreement
Subject to certain restrictions, each of the Managing Partners and Contributing Partners has the right to exchange his vested AOG Units for the Company’s Class A Common Stock. All Operating Group entities have made, or will make, an election under Section 754 of the U.S. Internal Revenue Code of 1986, as amended (the “Internal Revenue Code”), which will result in an adjustment to the tax basis of the assets owned by the Apollo Operating Group at the time of the exchange. These exchanges will result in increases in the basis of underlying assets that will reduce the amount of tax that AGM Inc. and its subsidiaries will otherwise be required to pay in the future.
The tax receivable agreement provides for the payment to the Managing Partners and Contributing Partners of 85% of the amount of cash savings, if any, in U.S. federal, state, local and foreign income taxes that AGM Inc. and its subsidiaries would realizerealizes as a result of the increases in tax basis of assets that resulted from the 2007 Reorganization, the Conversion, and other exchanges of AOG Units for Class A Common Stock.Stock that have occurred in prior years. AGM Inc. and its subsidiaries retainsretain the benefit from the remaining 15% of actual cash tax savings. If the Company does not make the required annual payment on a timely basis as outlined in the tax receivable agreement, interest is accrued on the balance until the payment date.
As a result of the exchanges of AOG Units for Class A Common Stock during the nine months ended September 30, 2020 and 2019, and 2018, a $39.1$62.5 million and $39.6$39.1 million liability was recorded, respectively, to estimate the amount of the future expected payments to be made by AGM Inc. and its subsidiaries to the Managing Partners and Contributing Partners pursuant to the tax receivable agreement.
In April 2020, Apollo made a $48.2 million cash payment pursuant to the tax receivable agreement resulting from the realized tax benefit for the 2019 tax year. Additionally, in connection with this payment, the Company made a corresponding pro rata distribution of $43.0 million ($0.21 per AOG Unit) to the Non-Controlling Interest holders in the Apollo Operating Group. In April 2019, Apollo made a $37.2 million cash payment pursuant to the tax receivable agreement resulting from the realized tax benefit for the 2018 tax year. Additionally, in connection with this payment, the Company made a corresponding pro rata distribution of $37.4 million ($0.18 per AOG Unit) to the Non-Controlling Interest holders in the Apollo Operating Group. In April 2018, Apollo made a $50.3 million cash payment pursuant to the tax receivable agreement resulting from the realized tax benefit for the 2017 tax year. Additionally, in connection with this payment, the Company made a corresponding pro rata distribution of $50.5 million ($0.25 per AOG Unit) to the Non-Controlling Interest holders in the Apollo Operating Group.
Due from Contributing Partners, Employees and Former Employees
As of September 30, 20192020 and December 31, 2018,2019, due from Contributing Partners, Employees and Former Employees includes various amounts due to the Company including employee loans and return of profit sharing distributions. As of September 30, 20192020 and December 31, 2018,2019, the balance included interest-bearing employee loans receivable of $17.0$17.4 million and $16.8$17.1 million, respectively. The outstanding principal amount of the loans as well as all accrued and unpaid interest is required to be repaid at the earlier of the eighth anniversary of the date of the relevant loan or at the date of the relevant employee’s resignation from the Company.
APOLLO GLOBAL MANAGEMENT, INC.
NOTES TO CONDENSED CONSOLIDATED
FINANCIAL STATEMENTS
(dollars in thousands, except share data, except where noted)
The Company recorded a receivable from the Contributing Partners and certain employees and former employees for the potential return of profit sharing distributions that would be due if certain funds were liquidated as of September 30, 20192020 and December 31, 20182019 of $103.3$174.6 million and $66.3$88.5 million, respectively.
Indemnity
Performance revenues from certain funds can be distributed to the Company on a current basis, but are subject to repayment by the subsidiaries of the Apollo Operating Group that act as general partners of the funds in the event that certain specified return thresholds are not ultimately achieved. The Managing Partners, Contributing Partners and certain other investment professionals have personally guaranteed, subject to certain limitations, the obligations of these subsidiaries in respect of this general partner obligation. Such guarantees are several and not joint and are limited to a particular Managing Partner’s or Contributing Partner’s distributions. Pursuant to an existing shareholders agreement, the Company has agreed to indemnify each of the Company’s Managing Partners and certain Contributing Partners against all amounts that they pay pursuant to any of these personal guarantees in favor of certain funds that the Company manages (including costs and expenses related to investigating the basis for or objecting to any claims made in respect of the guarantees) for all interests that the Company’s Managing Partners and Contributing Partners have contributed or sold to the Apollo Operating Group.
Accordingly, in the event that the Company’s Managing Partners, Contributing Partners and certain investment professionals are required to pay amounts in connection with a general partner obligation for the return of previously made distributions with respect to Fund IV, Fund V and Fund VI, the Company will be obligated to reimburse the Company’s Managing Partners and certain Contributing Partners for the indemnifiable percentage of amounts that they are required to pay even though the Company did not receive the certain distribution to which that general partner obligation related. The Company recorded an indemnification liability of $12.7$12.8 million and $12.2$12.7 million as of September 30, 20192020 and December 31, 2018,2019, respectively.
Due to Credit, Private Equity and Real Assets Funds
Based upon an assumed liquidation of certain of the credit, private equity and real assets funds the Company manages, the Company has recorded a general partner obligation to return previously distributed performance allocations, which represents amounts due to these funds. The general partner obligation is recognized based upon an assumed liquidation of a fund’s net assets as of the reporting date. The actual determination and any required payment of any such general partner obligation would not take place until the final disposition of a fund’s investments based on the contractual termination of the fund or as otherwise set forth in the respective limited partnership agreement or other governing document of the fund.
The following table presents the general partner obligation to return previously distributed performance allocations related to certain funds by segment:
|
| | | | | | | |
| | As of
September 30, 2019 | | As of
December 31, 2018 |
| Credit | $ | 320 |
| | $ | 1,370 |
|
| Private Equity | 213,573 |
| | 135,723 |
|
| Total general partner obligation | $ | 213,893 |
| | $ | 137,093 |
|
| | | | | | | | | | | |
| As of
September 30, 2020 | | As of
December 31, 2019 |
| Credit | $ | 0 | | | $ | 0 | |
| Private Equity | 348,418 | | | 189,252 | |
| Real Assets | 36,695 | | | 0 | |
| Total general partner obligation | $ | 385,113 | | | $ | 189,252 | |
Athene
Athene Holding was founded in 2009 to capitalize on favorable market conditions in the dislocated life insurance sector. Athene Holding, through its subsidiaries, is a leading retirement services company that issues, reinsures and acquires retirement savings products designed for the increasing number of individuals and institutions seeking to fund retirement needs. The products and services offered by Athene include fixed and fixed indexed annuity products, reinsurance services offered to third-party annuity providers; and institutional products, such as funding agreements. Athene Holding became an effective registrant under the Exchange Act on December 9, 2016. Athene Holding is currently listed on the New York Stock Exchange under the symbol “ATH”.
The Company provides asset management and advisory services to Athene, including asset allocation services, direct asset management services, asset and liability matching management, mergers and acquisitions, asset diligence hedging and other asset management services. On September 20, 2018, Athene and Apollo agreed to revise the existing fee arrangements (the “amended fee agreement”) between Athene and Apollo. The amended fee agreement was subjectCompany began recording fees pursuant to approval by Athene’s shareholders of a bye-law amendment providing that Athene will not elect to terminate the investment management arrangement between Athene
APOLLO GLOBAL MANAGEMENT, INC.
NOTES TO CONDENSED CONSOLIDATED
FINANCIAL STATEMENTS
(dollars in thousands, except share data, except where noted)
and Apollo, except for cause, for a period of four years from the date of the bye-law amendment and thereafter only on each successive two-year anniversary of the expiration of the initial four-year period. On June 10, 2019, the Athene shareholders approved the bye-law amendment and the amended fee agreement took effect retroactive to the month beginning January 1, 2019. The Company began recording fees pursuant to the amended fee agreement on January 1, 2019. The amended fee agreement provides for sub-allocation fees which vary based on portfolio allocation differentiation, as described below.
The amended fee agreement provides for a monthly fee to be payable by Athene to the Company in arrears, with retroactive effect to the month beginning on January 1, 2019, in an amount equal to the following, to the extent not otherwise payable to the Company pursuant to any one or more investment management or sub-advisory agreements or arrangements:
(i) The Company, through its consolidated subsidiary Apollo Insurance Solutions Group LP, or ISG, earns a base management fee of 0.225% per year on the aggregate market value of substantially all of the assets in substantially all of the investment accounts of or relating to Athene (collectively, the “Athene Accounts”) up to $103.4 billion (the level of assets in the Athene Accounts as of January 1, 2019, excluding certain assets, the “Backbook Value”) and 0.150% per year on all assets in excess of $103.4 billion (the “Incremental Value”), respectively; plus
(ii) with respect to each asset in an Athene Account, subject to certain exceptions, that is managed by the Company and that belongs to a specified asset class tier (“core,” “core plus,” “yield,” and “high alpha”), a sub-allocation fee as follows, which will, in the case of assets acquired after January 1, 2019, be subject to a cap of 10% of the applicable asset’s gross book yield:
| |
(i) | The Company, through its consolidated subsidiary Apollo Insurance Solutions Group LLC, or ISG, earns a base management fee of 0.225% per year on the aggregate market value of substantially all of the assets in substantially all of the investment accounts of or relating to Athene (collectively, the “Athene Accounts”) up to $103.4 billion (the level of assets in the Athene Accounts as of January 1, 2019, excluding certain assets, the “Backbook Value”) and 0.150% per year on all assets in excess of $103.4 billion (the “Incremental Value”), respectively; plus |
| |
(ii) | with respect to each asset in an Account, subject to certain exceptions, that is managed by the Company and that belongs to a specified asset class tier (“core,” “core plus,” “yield,” and “high alpha”), a sub-allocation fee as follows, which will, in the case of assets acquired after January 1, 2019, be subject to a cap of 10% of the applicable asset’s gross book yield: |
|
| | |
| As of
September 30, 20192020 |
| Sub-Allocation Fees: | |
Core Assets(1) | 0.065 | % |
Core Plus Assets(2) | 0.130 | % |
Yield Assets(3) | 0.375 | % |
High Alpha Assets(4) | 0.700 | % |
Cash, Treasuries, Equities and Alternatives(5) | —0 | % |
| |
(1) | Core assets include public investment grade corporate bonds, municipal securities, agency residential or commercial mortgage backed securities and obligations of any governmental agency or government sponsored entity that is not expressly backed by the U.S. government. |
| |
(2) | Core plus assets include private investment grade corporate bonds, fixed rate first lien commercial mortgage loans (“CML”) and obligations issued or assumed by a financial institution (such an institution, a “financial issuer”) and determined by Apollo to be “Tier 2 Capital” under the Basel III recommendations developed by the Basel Committee on Banking Supervision (or any successor to such recommendations). |
| |
(3) | Yield assets include non-agency residential mortgage-backed securities, investment grade collateralized loan obligations, certain asset-backed securities, commercial mortgage-backed securities, emerging market investments, below investment grade corporate bonds, subordinated debt obligations, hybrid securities or surplus notes issued or assumed by a financial issuer, as rated preferred equity, residential mortgage loans, bank loans, investment grade infrastructure debt and certain floating rate commercial mortgage loans. |
| |
(4) | High alpha assets include subordinated commercial mortgage loans, below investment grade collateralized loan obligations, unrated preferred equity, debt obligations originated by MidCap, below investment grade infrastructure debt, certain loans originated directly by Apollo and agency mortgage derivatives. |
| |
(5) | With respect to Equities and Alternatives, Apollo earns performance revenues of 0% to 20%. |
(1)Core assets include public investment grade corporate bonds, municipal securities, agency residential or commercial mortgage backed securities and obligations of any governmental agency or government sponsored entity that is not expressly backed by the U.S. government.
(2)Core plus assets include private investment grade corporate bonds, fixed rate first lien commercial mortgage loans and obligations issued or assumed by a financial institution (such an institution, a “financial issuer”) and determined by Apollo to be “Tier 2 Capital” under the Basel III recommendations developed by the Basel Committee on Banking Supervision (or any successor to such recommendations).
(3)Yield assets include non-agency residential mortgage-backed securities, investment grade collateralized loan obligations, certain asset-backed securities, commercial mortgage-backed securities, emerging market investments, below investment grade corporate bonds, subordinated debt obligations, hybrid securities or surplus notes issued or assumed by a financial issuer, as rated preferred equity, residential mortgage loans, bank loans, investment grade infrastructure debt and certain floating rate commercial mortgage loans.
(4)High alpha assets include subordinated commercial mortgage loans, below investment grade collateralized loan obligations, unrated preferred equity, debt obligations originated by MidCap, below investment grade infrastructure debt, certain loans originated directly by Apollo and agency mortgage derivatives.
(5)With respect to Equities and Alternatives, Apollo earns performance revenues of 0% to 20%.
Athene and Apollo Strategic Transaction
On October 28, 2019 Athene Holding, AGM Inc. and the entities that form the Apollo Operating Group entered into the Transaction Agreement, pursuant to which, among other things:
•(i) Athene Holding issued, on February 28, 2020 (the “Closing Date”), 35,534,942 Class A common shares of Athene Holding (the “AHL Class A Common Shares”) to certain subsidiaries of the Apollo Operating Group in exchange for (i) issuance by the Apollo Operating Group of 29,154,519 non-voting equity interests of the Apollo Operating Group to AHL and (ii) $350 million in cash (“Share Issuance”);
•Athene Holding has granted to AGM Inc. the right to purchase additional AHL Class A Common Shares from the Closing Date until 180 days thereafter to the extent the issued and outstanding AHL Class A Common Shares beneficially owned by Apollo and certain of its related parties and employees (collectively, the “Apollo Parties”) (inclusive of AHL Class A Common Shares over which any such persons have a valid proxy) do not equal at least 35% of the issued and outstanding AHL Class A Common Shares, on a fully diluted basis;
APOLLO GLOBAL MANAGEMENT, INC.
NOTES TO CONDENSED CONSOLIDATED
FINANCIAL STATEMENTS
(dollars in thousands, except share data, except where noted)
•A representative of the Apollo Operating Group will have the right to purchase up to that number of AHL Class A Common Shares that would increase by up to 5% the percentage of the issued and outstanding AHL Class A Common Shares beneficially owned by the Apollo Parties (inclusive of AHL Class A Common Shares over which any such persons have a valid proxy), calculated on a fully diluted basis;
•Athene Holding has amended and restated its Twelfth Amended and Restated Bye-laws of Athene Holding to, among other items, eliminate Athene Holding’s multi-class share structure (“Multi-Class Share Elimination”). In connection with the Multi-Class Share Elimination, (i) all of the Class B common shares of Athene Holding would be converted into an equal number of AHL Class A Common Shares on a one-for-one basis and (ii) all of the Class M common shares of Athene Holding was converted into a combination of AHL Class A Common Shares and warrants to purchase AHL Class A Common Shares.
Liquidity Agreement
In connection with the consummation of the Share Issuance and the Multi-Class Share Elimination, AGM Inc. has also entered into a Liquidity Agreement, dated as of the Closing Date, with Athene Holding (the “Liquidity Agreement”), pursuant to which, once each quarter, Athene Holding is entitled to request to sell a number of AOG Units or request AGM Inc. to sell a number of AGM Inc. Class A Common Stock or AOG Units representing at least $50 million, in each case, in exchange for payment of the Cash Amount (as defined below). If Athene Holding intends to exercise such sale request, it will provide a notice of such intent to sell such AOG Units to AGM Inc. Upon receipt of such notice, subject to certain restrictions described below, AGM Inc. will consummate, or, in the case of an AOG Transaction (as defined below), permit the consummation of, one of the following transactions:
•a transaction whereby AGM Inc. purchases AOG Units from Athene Holding at a price agreed upon, in good faith, by AGM Inc. and Athene Holding (a “Purchase Transaction”);
•if Athene Holding and AGM Inc. do not agree to consummate a Purchase Transaction, AGM Inc. will use its best efforts to consummate a public offering of AGM Inc. Class A Common Stock, the proceeds (net of certain commissions, fees and expenses consistent with customary and prevailing market practices for similar offerings) of which will be used to fund the purchase of AOG Units from Athene Holding (a “Registered Sale”);
•if AGM Inc. notifies Athene Holding that it cannot consummate a Registered Sale, upon Athene Holding’s request, AGM Inc. will use its best efforts to consummate a sale of AGM Inc. Class A Common Stock pursuant to an exemption from the registration requirements of the Securities Act, the proceeds (net of certain commissions, fees and expenses consistent with customary and prevailing market practices for similar offerings) of which will be used to fund the purchase of AOG Units from Athene Holding (a “Private Placement,” and collectively with a Purchase Transaction and a Registered Sale, a “Sale Transaction”); or
•if AGM Inc. elects (in its sole discretion) not to consummate a Sale Transaction, Athene Holding will be permitted to sell AOG Units in one or more transactions that are exempt from the registration requirements of the Securities Act, subject to certain restrictions (an “AOG Transaction”).
For purposes of this description, “Cash Amount” means (i) in the case of a Registered Sale, the cash proceeds that AGM Inc. receives upon the consummation of a Registered Sale after deducting a capped amount of documented commissions, fees and expenses, (ii) in the case of a Purchase Transaction, the cash proceeds to which AGM Inc. and Athene Holding agree, (iii) in the case of a Private Placement, the cash proceeds that AGM Inc. receives upon the consummation of a Private Placement after deducting a capped amount of documented commissions, fees and expenses and (iv) in the case of an AOG Transaction, the cash proceeds to which the purchaser and Athene Holding agree. Each of the Purchase Transaction, Private Placement, Registered Sale and AOG Transaction are subject to the terms and conditions set forth in the Liquidity Agreement.
In the event that an AOG Transaction is consummated, the buyer of such AOG Units will be prohibited from exchanging such AOG Units into AGM Inc. Class A Common Stock for at least 30 days after such purchase. Athene Holding is prohibited from consummating an AOG Transaction with any purchaser (i) who would, after giving effect to such transfer, own more than 3.5% of the issued and outstanding AGM Inc. Class A Common Stock (on a fully-diluted basis) or (ii) who is a “bad actor” (as defined in Regulation D of the Act) or otherwise a prohibited transferee, as described in the Liquidity Agreement.
Athene Holding’s liquidity rights are subject to certain other limitations and obligations, including that in a Registered Sale or a Private Placement, AGM Inc. will not be required to sell any AGM Inc. Class A Common Stock at a price
APOLLO GLOBAL MANAGEMENT, INC.
NOTES TO CONDENSED CONSOLIDATED
FINANCIAL STATEMENTS
(dollars in thousands, except share data, except where noted)
that is less than 90% of the volume-weighted average price of the AGM Inc. Class A Common Stock for the 10 consecutive business days prior to the day Athene Holding submits a notice for sale of AOG Units.
The Liquidity Agreement also provides that Athene Holding is prohibited from transferring its AOG Units other than to an affiliate or pursuant to the options set forth above. AGM Inc. has the right not to consummate a Registered Sale or a Private Placement if the recipient of the Class A Common Stock would receive more than 2.0% of the outstanding and issued shares of AGM Inc. Class A Common Stock. Additionally, AGM Inc. has the right not to consummate an AOG Transaction if the recipient would, following such AOG Transaction, be the beneficial owner of greater than 3.5% of the AOG Units.
On February 28, 2020, Apollo and Athene closed on a strategic transaction as discussed above. In connection with the transaction, Apollo purchased a 17% incremental equity stake in Athene at a premium, bringing Apollo’s beneficial ownership in Athene to 28%, or 35% including shares and warrants owned by related parties and employees, on a fully diluted basis. Apollo has entered into a lock-up agreement restricting transfers of Apollo’s existing and newly acquired shares of Athene for three years from the Closing Date.
As of September 30, 2020 and December 31, 2019, the Company held a 28.5% and an 11.3% ownership interest in the Class A Common Shares of Athene Holding, respectively.
Athora
The Company, through its consolidated subsidiary, AAME,ISGI, provides investment advisory services to certain portfolio companies of Apollo funds and Athora, a strategic platform established to acquirethat acquires or reinsurereinsures blocks of insurance business in the German and broader European life insurance market (collectively, the “Athora Accounts”). The Company has commitments to make additional equity investments in Athora of $320.5 million as of September 30, 2020, $293.0 million of which is subject to certain conditions.
Athora Sub-Advised
The Company, through AAME,ISGI, provides sub-advisory services with respect to a portion of the assets in certain portfolio companies of Apollo funds and the Athora Accounts. The Company broadly refers to “Athora Sub-Advised” assets as those assets in the Athora Accounts which the Company explicitly sub-advises as well as those assets in the Athora Accounts which are invested directly in funds and investment vehicles Apollo manages. With limited exceptions,
The Company earns a base management fee on the aggregate market value of substantially all of the investment accounts of or relating to Athora and also a sub-advisory fee earned by the Company on the Athora Sub-Advised assets, is 0.35%.
APOLLO GLOBAL MANAGEMENT, INC.
NOTES TO CONDENSED CONSOLIDATED
FINANCIAL STATEMENTS
(dollars in thousands, except share data, except where noted)
AAA Investments
Apollo, as general partner of AAA Investments, is generally entitled to performance allocations equal to 20% ofwhich varies depending on the realized returns (net of related expenses, including borrowing costs) on AAA Investments’ investment in Athene Holding, except that Apollo is not entitled to receive any performance allocations with respect to the shares of Athene Holding that were acquired (and not in satisfaction of prior commitments to buy such shares) by AAA Investments in the contribution of certain assets by AAA to Athene in October 2012.specific asset class.
The following table presents the performance allocations earned from AAA Investments:
|
| | | | | | | | | | | | | | | |
| | For the Three Months Ended September 30, | | For the Nine Months Ended September 30, |
| | 2019 | | 2018 | | 2019 | | 2018 |
Performance allocations from AAA Investments, net(1) | $ | (40 | ) | | $ | 311 |
| | $ | 93 |
| | $ | (4,688 | ) |
| |
(1) | Net of related profit sharing expense. |
The following table presents the revenues earned in aggregate from Athene Athora and AAA Investments:Athora:
| | | | | | | | | | | | | | | | | | | | | | | | | |
| For the Three Months Ended September 30, | | For the Nine Months Ended September 30, |
| 2020 | | 2019 | | 2020 | | 2019 | | |
Revenues earned in aggregate from Athene and Athora, net(1)(2) | $ | 363,746 | | | $ | 141,273 | | | $ | (297,924) | | | $ | 505,780 | | | |
|
| | | | | | | | | | | | | | | |
| | For the Three Months Ended September 30, | | For the Nine Months Ended September 30, |
| | 2019 | | 2018 | | 2019 | | 2018 |
Revenues earned in aggregate from Athene, Athora and AAA Investments, net(1)(2) | $ | 141,273 |
| | $ | 290,450 |
| | $ | 505,780 |
| | $ | 379,275 |
|
| |
(1) | (1) Consisting of management fees, sub-advisory fees, performance revenues from Athene, Athora and AAA Investments, as applicable (net of related profit sharing expense) and changes in the market value of the Athene Holding shares owned directly by Apollo. These amounts exclude the deferred revenue recognized as management fees associated with the vesting of AHL Awards granted to employees of Apollo as further described in note 12. |
| |
(2) | Gains (losses) on the market value of the shares of Athene Holding owned directly by Apollo were $(19.2) million and $155.5 million for the three months ended September 30, 2019 and 2018, respectively, and $42.6 million and $20.6 million for the nine months ended September 30, 2019 and 2018, respectively. |
The following table presents performance allocations and profit sharing payable from AAA Investments:expense) and changes in the market value of the Athene Holding shares owned directly by Apollo. These amounts exclude the deferred revenue recognized as management fees associated with the vesting of Athene Holding restricted share awards (“AHL Awards”) granted to employees of Apollo.
|
| | | | | | | |
| | As of
September 30, 2019 | | As of
December 31, 2018 |
| Performance allocations | $ | 1,733 |
| | $ | 1,611 |
|
| Profit sharing payable | 476 |
| | 442 |
|
As(2) Gains (losses) on the market value of the shares of Athene Holding owned directly by Apollo were $145.0 million and $(19.2) million for the three months ended September 30, 2020 and 2019, respectively, and December 31, 2018,$(851.4) million and $42.6 million for the Company held a 10.9%nine months ended September 30, 2020 and 10.2% economic ownership interest in Athene Holding,2019, respectively.
AAA Investments Credit Agreement
On April 30, 2015, Apollo entered into a revolving credit agreement with AAA Investments (the “AAA Investments Credit Agreement”). Under the terms of the AAA Investments Credit Agreement, the Company shall make available to AAA Investments one or more advances at the discretion of AAA Investments in the aggregate amount not to exceed a balance of $10.0 million at an applicable rate of LIBOR plus 1.5%. The Company receives an annual commitment fee of 0.125% on the unused portion of the loan. As of September 30, 2019 and December 31, 2018, $8.52019, $8.7 million and $6.7 million, respectively, had been advanced by the Company and
APOLLO GLOBAL MANAGEMENT, INC.
NOTES TO CONDENSED CONSOLIDATED
FINANCIAL STATEMENTS
(dollars in thousands, except share data, except where noted)
remained outstanding on the AAA Investments Credit Agreement. As of September 30, 2020, there were no amounts advanced and outstanding on the AAA Investments Credit Agreement and all amounts previously advanced had been repaid. AAA Investments was obligated to pay the aggregate borrowings plus accrued interest at the earlier of (a) the third anniversary of the closing date, or (b) the date that was fifteen months following the initial public offering of shares of Athene Holding (the “Maturity Date”). On January 30, 2019, the Company and AAA agreed to extend the maturity date of the AAA Investments Credit Agreement to April 30,December 31, 2020.
AINV Amended and Restated Investment Advisory Management Agreement
On May 17, 2018, the board of directors of AINV approved an amended and restated investment advisory management agreement with Apollo Investment Management, L.P., the Company’s consolidated subsidiary, which reduced the base management
APOLLO GLOBAL MANAGEMENT, INC.
NOTES TO CONDENSED CONSOLIDATED
FINANCIAL STATEMENTS
(dollars in thousands, except share data, except where noted)
fee and revised the incentive fee on income to include a total return requirement. Effective April 1, 2018, the base management fee was reduced from 2.0% to 1.5% of the average value of AINV’s gross assets (excluding cash or cash equivalents but including other assets purchased with borrowed amounts) at the end of each of the two most recently completed calendar quarters; provided, however, the base management fee would be 1.0% of the average value of AINV’s gross assets (excluding cash or cash equivalents but including other assets purchased with borrowed amounts) that exceeds the product of (i) 200% and (ii) the value of AINV’s net asset value at the end of the most recently completed calendar quarter. In addition, beginning January 1, 2019, the incentive fee on income calculation included a total return requirement with a rolling twelve quarter look-back starting from April 1, 2018. The incentive fee rate remained 20% and the performance threshold remained 1.75% per quarter (7% annualized).
Regulated Entities
Apollo Global Securities, LLC (“AGS”) is a registered broker dealer with the SEC and is a member of the Financial Industry Regulatory Authority, subject to the minimum net capital requirements of the SEC. AGS was in compliance with these requirements at September 30, 2019.2020. From time to time, this entity is involved in transactions with related parties of Apollo, including portfolio companies of the funds Apollo manages, whereby AGS earns underwriting and transaction fees for its services.
15.16. COMMITMENTS AND CONTINGENCIES
Investment Commitments—As a limited partner, general partner and manager of the Apollo funds, Apollo had unfunded capital commitments as of September 30, 20192020 and December 31, 20182019 of $1.1$1.0 billion and $1.2$1.1 billion, respectively, of which $434$351.1 million and $469$394.0 million related to Fund IX as of September 30, 2019 and December 31, 2018, respectively.IX.
Debt Covenants—Apollo’s debt obligations contain various customary loan covenants. As of September 30, 2019,2020, the Company was not aware of any instances of non-compliance with the financial covenants contained in the documents governing the Company’s debt obligations.
Litigation and Contingencies—Contingencies—Apollo is, from time to time, party to various legal actions arising in the ordinary course of business including claims and lawsuits, reviews, investigations or proceedings by governmental and self-regulatory agencies regarding its business.
On June 20, 2016, Banca Carige S.p.A. (“Carige”) commenced a lawsuit in the Court of Genoa (Italy) (No. 8965/2016), against its former Chairman, its former Chief Executive Officer, AGM Inc., and certain entities (the “Apollo Entities”) organized and owned by investment funds managed by affiliates of AGM Inc. The complaint alleged that AGM Inc. and the Apollo Entities (i) aided and abetted breaches of fiduciary duty to Carige allegedly committed by Carige’s former Chairman and former CEO in connection with the sale to the Apollo Entities of Carige subsidiaries engaged in the insurance business; and (ii) took wrongful actions aimed at weakening Banca Carige’s financial condition supposedly to facilitate an eventual acquisition of Carige. The causes of action were based in tort under Italian law. Carige purportedly seekssought damages of €450 million in connection with the sale of the insurance businesses and €800 million for other losses. With judgment no. 3118/2018 published on December 6, 2018, the Court of Genoa fully rejected all the claims raised by Carige against AGM Inc. and the Apollo Entities, and also awardingawarded attorneys' fees in their favor for an amount of €428,996.10. Carige filed an appeal on January 3, 2019 before the Court of Appeal of Genoa. The Apollo Entities appeared in the proceedings requesting the Court to reject Banca Carige’s appeal. By decree dated August 12,On November 21, 2019, Carige and the Apollo Entities entered into a settlement agreement whereby, among other things, each party finally and irrevocably released and discharged the other parties from all their respective claims, actions and/or requests raised in the litigation. Accordingly, immediately after signing the settlement agreement, Carige and the Apollo Entities filed with the Court of Appeal rejected some preliminary requests made by the former directors, including their requesta joint declaration whereby they reported to join insurance companies and other members of the board of directors of Carige in the proceedings. By the same decree, the Court of Appeal scheduled the next hearing on September 22, 2021. Although the case appears to be in its final stages, no reasonable estimate of possible loss, if any, can be made at this time.that they had waived and withdrawn their respective claims.
On December 12, 2016, the CORE Litigation Trust (the “Trust”), which was created under the Chapter 11 reorganization plan for CORE Media and other affiliated entities, including CORE Entertainment, Inc. (“CORE”), commenced an action in California Superior Court for Los Angeles County, captioned Core Litigation Trust v. Apollo Global Management, LLC, et al., Case No. BC 643732, that was stayed on October 3, 2017, in favor of litigating in New York state court. On November 9, 2017, the Trust commenced an action in the Supreme Court of the State of New York, captioned Core Litigation Trust v. Apollo Global Management, LLC, et al., Index No. 656856/2017. The complaint names as defendants: (i) AGM Inc. and certain AGM Inc. affiliates including the Apollo-managed funds that were CORE’s beneficial owners (the “CORE Funds”), (ii) Twenty-First Century Fox, Inc. (“Fox”) and certain Fox affiliates, (iii) Endemol USA Holding, Inc. (“Endemol”) and certain Endemol-affiliated entities, and (iv) the joint venture through which the CORE Funds and Fox beneficially owned CORE Media and Endemol Shine (the “JV”). The Trust asserts claims against (i) all defendants for tortiously interfering with $360 million in loans under the 2011 loan agreements entered into between CORE and certain Lenders, and (ii) certain defendants for alter-ego and de-facto merger. The
APOLLO GLOBAL MANAGEMENT, INC.
NOTES TO CONDENSED CONSOLIDATED
FINANCIAL STATEMENTS
(dollars in thousands, except share data, except where noted)
Trust seeks $240 million in compensatory, unspecified punitive damages, pre-judgment interests, and costs and expenses. Under the parties’ agreement, dated as of August 19, 2019, to settle and release all of the Trust’s claims against Defendants, both the New York and California actions have been dismissed with prejudice.
On August 3, 2017, a complaint was filed in the United States District Court for the Middle District of Florida against AGM Inc., a senior partner of Apollo and a former principal of Apollo by Michael McEvoy on behalf of a purported class of employees of subsidiaries of CEVA Group, LLC (“CEVA Group”) who purchased shares in CEVA Investment Limited (“CIL”), the former parent company of CEVA Group. The complaint alleged that the defendants breached fiduciary duties to and defrauded the plaintiffs by inducing them to purchase shares in CIL and subsequently participating in a debt restructuring of CEVA Group in which shareholders of CIL did not receive a recovery. On February 9, 2018, the Bankruptcy Court for the Southern District of New York held that the claims asserted in the complaint were assets of CIL, which is a chapter 7 debtor, and that the complaint was null and void as a violation of the automatic stay. McEvoy subsequently revised his complaint to attempt to assert claims that do not belong to CIL. The amended complaint no longer namesnamed any individual defendants, but Apollo Management VI, L.P. and CEVA Group have beenwere added as defendants. The amended complaint purports to seeksought damages of approximately €30 million and asserts, among other things, claims for violations of the Investment Advisers Act of 1940,
APOLLO GLOBAL MANAGEMENT, INC.
NOTES TO CONDENSED CONSOLIDATED
FINANCIAL STATEMENTS
(dollars in thousands, except share data, except where noted)
breach of fiduciary duties, and breach of contract. On December 7, 2018, after receiving permission from the Bankruptcy Court, McEvoy filed his amended complaint in the District Court in Florida. On January 18, 2019, Apollo is currently seeking dismissal of this actionfiled a motion to dismiss the amended complaint. A hearing on that motion was held December 3, 2019. On January 6, 2020, the Florida court granted in part Apollo’s motion to dismiss, dismissing McEvoy’s Investment Advisers Act claim with prejudice, and believes that there is no meritdenying without prejudice Apollo’s motion with respect to the claims.remaining claims, and directing the parties to conduct limited discovery, and submit new briefing, solely with respect to the statute of limitations. On October 28, 2019, the District Court in Florida scheduled a hearing for December 3, 2019 onJuly 30, 2020, Apollo and CEVA Group’s motionsfiled a joint motion for summary judgment on statute of limitations grounds. Briefing has not yet concluded with respect to dismiss. AsApollo and CEVA’s motion. Apollo believes the caseclaims in this action are without merit. Because this action is in itsthe early stages, no reasonable estimate of possible loss, if any, can be made at this time.
On December 21, 2017, Harbinger Capital Partners II, LP, Harbinger Capital Partners Master Fund I, Ltd., Harbinger Capital Partners Special Situations Fund, L.P., Harbinger Capital Partners Special Situations GP, LLC, Harbinger Capital Partners Offshore Manager, L.L.C., Global Opportunities Breakaway Ltd. (in voluntary liquidation), and Credit Distressed Blue Line Master Fund, Ltd. (collectively, “Harbinger”) commenced an action in New York Supreme Court captioned Harbinger Capital Partners II LP et al. v. Apollo Global Management LLC, et al. (No. 657515/2017). The complaint namesnamed as defendants (i) AGM Inc., (ii) the funds managed by Apollo that invested in SkyTerra Communications, Inc. (“SkyTerra”) equity before selling their interests to Harbinger under an April 2008 agreement that closed in 2010, and (iii) 6 former SkyTerra directors, 5 of whom are current or former Apollo employees. The complaint allegesalleged that during the period of Harbinger’s various equity and debt investments in SkyTerra, from 2004 to 2010, the defendants concealed from Harbinger material defects in SkyTerra technology that was to be used to create a new mobile wi-fi network. The complaint allegesalleged that Harbinger would not have made investments in SkyTerra totaling approximately $1.9 billion had it known of the defects, and that the public disclosure of these defects ultimately led to SkyTerra filing for bankruptcy in 2012 (after it had been renamed LightSquared). The complaint assertsasserted claims against (i) all defendants for fraud, civil conspiracy, and negligent misrepresentation, (ii) AGM Inc. and the Apollo-managed funds only for breach of fiduciary duty, breach of contract, and unjust enrichment, and (iii) the SkyTerra director defendants only for aiding and abetting breach of fiduciary duty. The complaint seekssought $1.9 billion in damages, as well as punitive damages, interest, costs, and fees. This action was stayed from February 14, 2018, through June 12, 2019. On February 14, 2018, the defendants moved the United States Bankruptcy Court for the Southern District of New York to reopen the LightSquared bankruptcy proceeding for the limited purpose of enforcing Harbinger’s assignment and release in that bankruptcy of the claims that it assertsasserted in the New York state court action. Briefing and hearing on this motion were adjourned while the state court stay was pending. On June 12, 2019, Harbinger voluntarily discontinued the state action without prejudice subject to a tolling agreement. On June 12, 2019, Apollo voluntarily withdrew its bankruptcy court motion subject to a right to refile the motion if Harbinger were to refile the state court action. On June 8, 2020, Harbinger refiled its litigation in New York Supreme Court, captioned Harbinger Capital Partners II, LP et al. v. Apollo Global Management, LLC et al. (No. 652342/2020). The complaint adds 8 new defendants: 2 former SkyTerra executives, 1 former SkyTerra consultant, and 5 entities that were Harbinger’s counterparties in a transaction involving TVCC One Six Holdings LLC (“TVCC”). It also adds 3 new claims relating to Harbinger’s contention that the new defendants induced Harbinger to buy TVCC to support SkyTerra’s network even though they allegedly knew that the network had material defects. On August 11, 2020, state court Justice Peter Sherwood entered the parties’ agreed stipulation staying the litigation until the earlier of (i) November 15, 2020, or (ii) a party sending a termination notice (which can only be sent under certain limited circumstances). Apollo believes thesethe claims in this action are without merit. Because this action is in itsthe early stages, no reasonable estimate of possible loss, if any, can be made at this time.
NaN shareholders filed substantially similar putative class action lawsuits in the Circuit Court of the Fifteenth Judicial Circuit in and for Palm Beach County, Florida in March, April, and May 2018, alleging violations of the Securities Act in connection with the January 19, 2018 IPO of ADT Inc. common stock. The actions were consolidated on July 10, 2018, and the case was re-captioned, In re ADT Inc. Shareholder Litigation.Litigation. On August 24, 2018, the state-court plaintiffs filed a consolidated complaint naming as defendants ADT Inc., several ADT officers and directors, the IPO underwriters (including Apollo Global Securities, LLC), AGM Inc. and certain other Apollo affiliates. Plaintiffs generally allegealleged that the registration statement and prospectus for the IPO contained false and misleading statements and failed to disclose material information about certain litigation in which ADT was involved, ADT’s efforts to protect its intellectual property, and competitive pressures ADT faced. Defendants filed motions to dismiss the consolidated complaint on October 23, 2018, and those motions arewere fully briefed. On May 21, 2018, a similar shareholder class action lawsuit was filed in the United States District Court for the Southern District of Florida, naming
APOLLO GLOBAL MANAGEMENT, INC.
NOTES TO CONDENSED CONSOLIDATED
FINANCIAL STATEMENTS
(dollars in thousands, except share data, except where noted)
as defendants ADT, several officers and directors, and AGM Inc. The federal action, captioned Perdomo v. ADT Inc., generally allegesalleged that the registration statement was materially misleading because it failed to disclose ongoing deterioration in ADT’s financial results, along with certain customer and business metrics. On July 20, 2018, several alleged ADT shareholders filed competing motions to be named lead plaintiff in the federal action. On November 20, 2018, the court appointed a lead plaintiff, and on January 15, 2019, the lead plaintiff filed an amended complaint. The amended complaint namesnamed the same Apollo-affiliated defendants as the state-court action, along with three3 new Apollo entities.
APOLLO GLOBAL MANAGEMENT, INC.
NOTES TO CONDENSED CONSOLIDATED
FINANCIAL STATEMENTS
(dollars in thousands, except share data, except where noted)
Defendants filed motions to dismiss on March 25, 2019, and those motions arewere fully briefed. On July 26, 2019, the state court denied defendants’ motions to dismiss, except it reserved judgment on the question whether it has personal jurisdiction over certain defendants, including the Apollo defendants. On September 12, 2019, all parties to the state and federal actions reached a settlement in principle ofthat would resolve both actions, subjectactions. The plaintiffs in the federal action voluntarily dismissed their action on October 28, 2019, and the settlement was submitted to the state court for approval. On October 19, 2020, the state court entered an order preliminarily approving the settlement, directing notice to shareholders, and scheduling a final-approval hearing for January 12, 2021. The settlement requires no payment from any Apollo defendants.
On May 3, 2018, Caldera Holdings Ltd, Caldera Life Reinsurance Company, and Caldera Shareholder, L.P. (collectively, “Caldera”) filed a summons with notice in the Supreme Court of the State of New York, New York County, naming as defendants AGM Inc., Apollo Management, L.P., Apollo Advisors VIII, L.P., Apollo Capital Management VIII, LLC, Athene Asset Management, L.P., Athene Holding, Ltd., and Leon Black (collectively, “Defendants” and all but Athene Holding, Ltd., the “Apollo Defendants”). On July 12, 2018, Caldera filed a complaint, Index No. 652175/2018 (the “Complaint”), alleging three causes of action: (1) tortious interference with prospective business relations/prospective economic advantage; (2) defamation/trade disparagement/injurious falsehood; and (3) unfair competition. The Complaint seekssought damages of no less than $1.5 billion, as well as exemplary and punitive damages, attorneys’ fees, interest, and an injunction. Defendants moved to dismiss the Complaint on September 21, 2018 and Caldera filed an amended complaint on January 21, 2019 (the “Amended Complaint”). Defendants have moved to dismiss the Amended Complaint, and the Apollo Defendants have submitted to the Court a Final Arbitration Award issued on April 26, 2019 in a JAMS arbitration, finding Caldera, Imran Siddiqui, and Ming Dang liable for various causes of action, including breaches of fiduciary duty and/or aiding and abetting thereof. Oral argument on the motions to dismiss was held on May 31, 2019. TheOn December 20, 2019, the Court issued a Decision and Order dismissing Caldera’s complaint in its entirety as against all Defendants. On December 23, 2019, the Apollo Defendants believe thatfiled a Notice of Entry of the claims contained in the Complaint lack meritDecision and intend to defend the case vigorously. Because this action is in the early stages, no reasonable estimateOrder. On January 8, 2020, Caldera filed a Notice of possible loss, if any, can be made at this time.Appeal.
On March 7, 2019, plaintiff Elizabeth Morrison filed an amended complaint in an action captioned Morrison v. Ray Berry, et. al., Case No. 12808-VCG, pending in the ChanceryDelaware Court for the State of Delaware,Chancery, adding as defendants AGM Inc. and certain AGM Inc. affiliates. The original complaint had only named as defendants certain officers and directors (the “TFM defendants”) of The Fresh Market, Inc. (“TFM”), claiming that those defendants breached their fiduciary duties to the TFM shareholders in connection with their consideration and approval of a merger agreement between TFM and certain entities affiliated with Apollo, including by engaging in a sale process that improperly favored AGM Inc., and/or Apollo Management VIII, L.P., by agreeing to an inadequate price and by filing materially deficient disclosures regarding the transaction. In addition to AGM Inc., the amended complaint added as defendants Apollo Overseas Partners (Delaware 892) VIII, L.P., Apollo Overseas Partners (Delaware) VIII, L.P., Apollo Overseas Partners VIII, L.P., Apollo Management VIII, L.P., AIF VIII Management, LLC, Apollo Management, L.P., Apollo Management GP, LLC, Apollo Management Holdings, L.P., Apollo Management Holdings GP, LLC, APO Corp., AP Professional Holdings, L.P., Apollo Advisors VIII, L.P., Apollo Investment Fund VIII, L.P., and Pomegranate Holdings, Inc., and other defendants. The amended complaint allegesalleged that the Apollo defendants aided and abetted the breaches of fiduciary duties by the TFM defendants. After the defendants moved to dismiss the complaint on May 1, 2019, Plaintiff filed a second amended complaint on June 3, 2019, maintaining the same claim against the same Apollo defendants as the prior complaint. Defendants moved to dismiss the second amended complaint on July 12, 2019. On December 31, 2019, the court issued a decision dismissing certain of the TFM defendants while denying the motions of others. The court heard oral argumentdeferred ruling on the motions filed by several defendants, including the Apollo-affiliated defendants. On June 1, 2020, the Court granted the Apollo-affiliated defendants’ motion to dismiss.
On October 21, 2019, a putative class action complaint was filed in the Delaware Court of Chancery against Presidio, Inc. (“Presidio”), all of the members of Presidio’s board of directors (including 5 directors who are affiliated with Apollo), and BC Partners Advisors L.P. and Port Merger Sub, Inc. (together, “BCP”) challenging the then-pending acquisition of Presidio by BCP (the “Merger”). The action is captioned Firefighters Pension System of City of Kansas City, Missouri Trust v. Presidio, Inc. et al, C.A. No. 2019-0839-JTL. The original complaint alleged that the Presidio directors breached their fiduciary duties in connection with the negotiation of the Merger and that the disclosures Presidio made in its filings with the SEC in connection with the Merger omitted material information, and that BCP aided and abetted those alleged breaches. On November 5, 2019, the Court of Chancery held a hearing on September 23, 2019,a motion by plaintiffs to preliminarily enjoin the stockholder vote and denied that motion. On January 28, 2020, following the closing of the Merger, plaintiffs filed an amended class action complaint, adding as defendants AGM Inc. and AP VIII Aegis Holdings, L.P. (together, the “Apollo Defendants”) and LionTree Advisors, LLC (Presidio’s financial advisor in connection with the Merger). The amended complaint alleges, among other things, that the Presidio directors breached their fiduciary duties in connection with the Merger, that the filings with the SEC in connection with the Merger omitted material information, that the Apollo Defendants were controlling stockholders of
APOLLO GLOBAL MANAGEMENT, INC.
NOTES TO CONDENSED CONSOLIDATED
FINANCIAL STATEMENTS
(dollars in thousands, except share data, except where noted)
Presidio and breached their alleged fiduciary duties to Presidio’s public stockholders, and that BCP, LionTree and the Apollo Defendants aided and abetted breaches of fiduciary duties. The amended complaint seeks, among other relief, declaratory relief, class certification, and unspecified money damages. The defendants have filed motions to dismiss the amended complaint and filed supporting memoranda April 30, 2020. Oral argument on defendants’ motions to dismiss was held on October 29, 2020, and the court took themthe argument and submissions under advisement.advisement with a decision to follow. Apollo believes the claims in this action are without merit. Because this action is in the early stages, no reasonable estimate of possible loss, if any, can be made at this time.
On January 15, 2020, DISH Network L.L.C. (“DISH”) filed a lawsuit in the Circuit Court of Cook County, Illinois against Terrier Media Buyer, Inc. d/b/a Cox Media Group (“CMG”), AGM Inc., NBI Holdings, LLC, Camelot Media Buyer, Inc. and Camelot Media Holdings, LLC., among other defendants. DISH’s lawsuit alleges that the defendants engaged in a series of transactions designed to take control of certain local television broadcast stations in a way that deprived DISH of its contractual right to retransmit to its subscribers the signals of certain of the local broadcast television stations. DISH seeks a declaration that it may continue to retransmit under its prior retransmission agreement, among other relief. On the same day it filed its lawsuit, DISH obtained an ex parte temporary restraining order (“TRO”) that enjoined all defendants (i) from taking any action to interfere with performance of a retransmission agreement concerning certain local television stations, (ii) from prohibiting DISH from retransmitting the signals of those stations, and (iii) from otherwise interfering with DISH’s right to retransmit the signals of those stations. On January 24, 2020, the Circuit Court of Cook County extended the TRO. On the same day, the defendants removed the case to the U.S. District Court for the Northern District of Illinois. DISH subsequently moved to remand the case back to state court, which motion was denied, and for leave to name additional AGM Inc. subsidiaries as defendants, which motion was granted in part and denied in part. The court granted DISH leave to name AP IX Titan Holdings GP, LLC and AP IX (PMC) VoteCo, LLC as defendants in DISH’s amended complaint. On May 1, 2020, DISH filed its first amended complaint, which served as the basis for DISH’s request for a preliminary injunction. On July 20, 2020, the court denied DISH’s motion for a preliminary injunction and dissolved the TRO on July 22, 2020. On July 21, 2020, the court denied DISH’s request to stay dissolution of the TRO, and that order was affirmed by the United States Court of Appeals for the Seventh Circuit on July 22, 2020. DISH’s appeal of the district court’s decision denying its request for a preliminary injunction remains pending. DISH filed its opening brief on appeal on September 8, 2020. The defendants filed their response brief on October 22, 2020. While the appeal of the preliminary injunction decision remains pending, proceedings in the district court are continuing. On October 14, 2020, DISH filed a second amended complaint against CMG, AGM Inc., NBI Holdings, LLC, Camelot Media Buyer, Inc., Camelot Media Holdings, LLC and Northwest Broadcasting, Inc. The second amended complaint does not name any other defendant. Apollo believes the claims in this action are without merit. Because this action is in the early stages, no reasonable estimate of possible loss, if any, can be made at this time.
In March 2020, Frank Funds, which claims to be a former shareholder of MPM Holdings, Inc. (“MPM”), commenced an action in the Delaware Court of Chancery, captioned Frank Funds v. Apollo Global Management, Inc., et al., C.A. No. 2020-0130, against AGM Inc., certain former MPM directors (including 3 Apollo officers and employees), and members of the consortium that acquired MPM in a May 2019 merger. The complaint asserts, on behalf of a putative class of former MPM shareholders, a claim against Apollo for breach of its fiduciary duties as MPM’s alleged controlling shareholder in connection with the May 2019 merger in which a consortium acquired MPM. Frank Funds seeks unspecified compensatory damages. Apollo believes the claims in this action are without merit. On July 1, 2020, Apollo moved to dismiss the complaint; briefing on that motion has not yet begun. Because this action is in the early stages, no reasonable estimate of possible loss, if any, can be made at this time.
APOLLO GLOBAL MANAGEMENT, INC.
NOTES TO CONDENSED CONSOLIDATED
FINANCIAL STATEMENTS
(dollars in thousands, except share data, except where noted)
On March 12, 2020, AGM Inc. and several investment funds managed by subsidiaries of AGM Inc. (the “Apollo Funds”) were added as defendants in a class action filed by plaintiff Zachary Blair on December 7, 2017, in the Superior Court of California. Plaintiff alleges he is a former employee of Classic Party Rentals, a party equipment rental company previously owned by the Apollo Funds. Plaintiff alleges that Classic Party Rentals failed to comply with California wage and hour and related laws, and also has asserted claims based on various provisions of the California labor code and California’s unfair competition laws. On October 11, 2019, the court certified a class of current and former non-exempt drivers, assistant drivers, and organizer employees of Classic Party Rentals who were paid on an hourly basis and who worked at Classic Party Rentals in California at any time from December 7, 2013, through the date of the class certification order. After being served with the complaint in July 2020, AGM Inc. filed a motion to dismiss all claims against it. That motion remains pending. Apollo believes the claims in this action are without merit. Because this action is in the early stages, no reasonable estimate of possible loss, if any, can be made at this time.
On May 29, 2020, plaintiff Vrajeshkumar Patel filed a putative stockholder derivative and class action complaint in the Delaware Court of Chancery against Talos Energy, Inc. (“Talos”), all of the members of Talos’s board of directors (including 2 Apollo partners), Riverstone Holdings, LLC (“Riverstone”), AGM Inc., and Guggenheim Securities, LLC in connection with the acquisition of certain assets from Castex Energy 2014, LLC and ILX Holdings, LLC in February 2020. The complaint asserts, on behalf of a putative class of shareholders and Talos, direct and derivative claims against Apollo, Riverstone, and the individual defendants for breach of their fiduciary duties. The plaintiff alleges that Apollo and Riverstone comprise a controlling shareholder group. The complaint seeks, among other relief, class certification and unspecified money damages. On August 4, 2020, the defendants filed motions to dismiss the complaint in its entirety. Apollo believes the claims in this action are without merit. Because this action is in the early stages, no reasonable estimate of possible loss, if any, can be made at this time.
On June 3, 2020, a group of former MPM shareholders seeking appraisal of their MPM shares in a consolidated appraisal proceeding, In re Appraisal of MPM Holdings, Inc., C.A. No. 2019-0519 (Del. Ch.), moved for leave to file a verified amended appraisal petition and class-action complaint. In that motion, the petitioners stated that they seek leave to assert claims for breach of fiduciary duty and/or aiding and abetting breaches of fiduciary duty against AGM Inc., an affiliated Apollo fund, certain former MPM directors (including 3 Apollo officers and employees), and members of the consortium that acquired MPM, based on alleged actions related to the May 2019 merger. The petitioners also seek to consolidate their appraisal proceeding with the Frank Funds action, and notified the Delaware Chancery Court via letter on September 23, 2020, that they had reached an agreement in principle with Frank Funds to consolidate the two cases. The Delaware Court of Chancery has not yet ruled on the motion. Apollo believes the claims in this action are without merit. Because this action is in the early stages, no reasonable estimate of possible loss, if any, can be made at this time.
On August 4, 2020, a putative class action complaint was filed in the United States District Court for the District of Nevada against PlayAGS Inc. (“PlayAGS”), all of the members of PlayAGS’s board of directors (including three directors who are affiliated with Apollo), certain underwriters of AGS (including Apollo Global Securities, LLC), as well as AGM Inc., Apollo Investment Fund VIII, L.P., Apollo Gaming Holdings, L.P., and Apollo Gaming Voteco, LLC (these last four parties, together, the “Apollo Defendants”). The complaint asserts claims arising under the Securities Act of 1933 in connection with certain secondary offerings of PlayAGS stock conducted in August 2018 and March 2019, alleging that the registration statements issued in connection with those offerings did not fully disclose certain business challenges facing PlayAGS. Such claims are asserted against all defendants, including Apollo Global Securities, LLC and the Apollo Defendants, as well as all directors (including the directors affiliated with Apollo). The complaint further asserts a control person claim under Section 20(a) of the Securities Exchange Act of 1934 against the Apollo Defendants and the director defendants (including the directors affiliated with Apollo), alleging that the Apollo Defendants and the director defendants were responsible for certain misstatements and omissions by PlayAGS about its business during a putative class period from May 3, 2018 through August 7, 2019. Apollo believes the claims in this action are without merit. Because this action is in the early stages, no reasonable estimate of possible loss, if any, can be made at this time.
Commitments and Contingencies—Other long-term obligations relate to payments with respect to certain consulting agreements entered into by Apollo Investment Consulting LLC, a subsidiary of Apollo, as well as long-term service contracts. A significant portion of these costs are reimbursable by funds or portfolio companies. As of September 30, 2019,2020, fixed and determinable payments due in connection with these obligations were as follows:
|
| | | | | | | | | | | | | | | | | | | | | | | | | | | |
| | Remaining 2019 | | 2020 | | 2021 | | 2022 | | 2023 | | Thereafter | | Total |
| Other long-term obligations | $ | 8,884 |
| | $ | 8,435 |
| | $ | 1,836 |
| | $ | 881 |
| | $ | 654 |
| | $ | 654 |
| | $ | 21,344 |
|
-64-
APOLLO GLOBAL MANAGEMENT, INC.
NOTES TO CONDENSED CONSOLIDATED
FINANCIAL STATEMENTS
(dollars in thousands, except share data, except where noted)
| | | | | | | | | | | | | | | | | | | | | | | | | | | | | | | | | | | | | | | | | |
| Remaining 2020 | | 2021 | | 2022 | | 2023 | | 2024 | | Thereafter | | Total |
| Other long-term obligations | $ | 9,347 | | | $ | 9,908 | | | $ | 1,947 | | | $ | 703 | | | $ | 703 | | | $ | 0 | | | $ | 22,608 | |
Contingent Obligations—Performance allocations with respect to certain funds are subject to reversal in the event of future losses to the extent of the cumulative revenues recognized in income to date. If all of the existing investments became
APOLLO GLOBAL MANAGEMENT, INC.
NOTES TO CONDENSED CONSOLIDATED
FINANCIAL STATEMENTS
(dollars in thousands, except share data, except where noted)
worthless, the amount of cumulative revenues that have been recognized by Apollo through September 30, 20192020 and that would be reversed approximates $2.3$2.0 billion. Management views the possibility of all of the investments becoming worthless as remote. Performance allocations are affected by changes in the fair values of the underlying investments in the funds that Apollo manages. Valuations, on an unrealized basis, can be significantly affected by a variety of external factors including, but not limited to, bond yields and industry trading multiples. Movements in these items can affect valuations quarter to quarter even if the underlying business fundamentals remain stable.
Additionally, at the end of the life of certain funds that the Company manages, there could be a payment due to a fund by the Company if the Company, as general partner, has received more performance allocations than was ultimately earned. The general partner obligation amount, if any, will depend on final realized values of investments at the end of the life of each fund or as otherwise set forth in the respective limited partnership agreement of the fund. See note 1415 to our condensed consolidated financial statements for further details regarding the general partner obligation.
Certain funds may not generate performance allocations as a result of unrealized and realized losses that are recognized in the current and prior reporting period. In certain cases, performance allocations will not be generated until additional unrealized and realized gains occur. Any appreciation would first cover the deductions for invested capital, unreturned organizational expenses, operating expenses, management fees and priority returns based on the terms of the respective fund agreements.
NaN of the Company’s subsidiaries, AGS, provides underwriting commitments in connection with securities offerings to theof related parties of Apollo, including portfolio companies of the funds Apollo manages.manages, as well as third parties. As of September 30, 2020 and December 31, 2019, there were 0no open underwriting commitments.
Contingent Consideration—In connection with the acquisition of Stone Tower in April 2012, the Company agreed to pay the former owners of Stone Tower a specified percentage of any future performance revenues earned from certain of the Stone Tower funds, CLOs, and strategic investment accounts. This contingent consideration liability was determined based on the present value of estimated future performance revenue payments, and is recorded in profit sharing payable in the condensed consolidated statements of financial condition. The fair value of the remaining contingent obligation was $96.4$103.3 million and $74.5$112.5 million as of September 30, 20192020 and December 31, 2018,2019, respectively.
The contingent consideration obligations will be remeasured to fair value at each reporting period until the obligations are satisfied and are characterized as Level III liabilities. The changes in the fair value of the contingent consideration obligations is reflected in profit sharing expense in the condensed consolidated statements of operations. See note 67 for further information regarding fair value measurements.
16.17. SEGMENT REPORTING
Apollo conducts its business primarily in the United States and substantially all of its revenues are generated domestically. Apollo’s business is conducted through 3 reportable segments: credit, private equity and real assets. Segment information is utilized by our Managing Partners, who operate collectively as our chief operating decision maker, to assess performance and to allocate resources. These segments were established based on the nature of investment activities in each underlying fund, including the specific type of investment made and the level of control over the investment.
The performance is measured by the Company’s chief operating decision maker on an unconsolidated basis because management makes operating decisions and assesses the performance of each of Apollo’s business segments based on financial and operating metrics and data that exclude the effects of consolidation of any of the affiliated funds.
Segment Reporting Changes
During the first quarter of 2019, Apollo’s chief operating decision maker determined that Segment Distributable Earnings, together with its main components including Fee Related Earnings, is the key performance measure used by management in evaluating the performance of Apollo’s credit, private equity and real assets segments. Accordingly, Apollo will no longer report Economic Income. Apollo believes these changes better reflect the manner in which it makes key operating decisions pertaining to resource allocation, capital deployment, budgeting and forecasting, and are consistent with what stockholders consider to be most important in evaluating its performance.
Apollo determined to change the business segment in which it reports certain funds and accounts to align its segment reporting with the manner in which such funds and accounts were managed. Effective January 1, 2019, the European Principal Finance Fund series, which has been historically reported in the credit segment, moved to the real assets segment. Several funds and accounts that generally invest in illiquid opportunistic investments and the latest fund in the Credit Opportunity Fund series,
APOLLO GLOBAL MANAGEMENT, INC.
NOTES TO CONDENSED CONSOLIDATED
FINANCIAL STATEMENTS
(dollars in thousands, except share data, except where noted)
which have been historically reported in the credit segment, moved to the private equity segment. Certain commercial real estate mortgage loan assets, previously reported in the credit segment, moved to the real assets segment. These changes affected the composition, but not the determination, of Apollo’s reporting segments.
Apollo changed its definition of “Distributable Earnings” to include depreciation and amortization expenses and renamed it “Segment Distributable Earnings.” Historically, depreciation and amortization expenses were not reflected in Apollo’s calculation of Segment Distributable Earnings. Apollo also renamed “Distributable Earnings after Taxes and Related Payables” to “Distributable Earnings.”
In connection with these changes, all prior periods have been recast to conform to the new presentation. Consequently, this information will be different from the historical segment financial results previously reported by Apollo in its reports filed with the SEC.
Segment Distributable Earnings
Segment Distributable Earnings, or “Segment DE”, is the key performance measure used by management in evaluating the performance of Apollo’s credit, private equity and real assets segments. Management believes the components of
APOLLO GLOBAL MANAGEMENT, INC.
NOTES TO CONDENSED CONSOLIDATED
FINANCIAL STATEMENTS
(dollars in thousands, except share data, except where noted)
Segment DE, such as the amount of management fees, advisory and transaction fees and realized performance fees, are indicative of the Company’s performance. Management uses Segment DE in making key operating decisions such as the following:
| |
• | •Decisions relatedto the allocation of resources such as staffing decisions including hiring and locations for deployment of the new hires; •Decisionsrelated to capital deployment such as providing capital to facilitate growth for the business and/or to facilitate expansion into new businesses; •to the allocation of resources such as staffing decisions including hiring and locations for deployment of the new hires; |
| |
• | Decisionsrelated to capital deployment such as providing capital to facilitate growth for the business and/or to facilitate expansion into new businesses;
|
Decisions related to expenses, such as determining annual discretionary bonuses and equity-based compensation awards to its employees. With respect to compensation, management seeks to align the interests of certain professionals and selected other individuals with those of the investors in the funds and those of Apollo’s stockholders by providing such individuals a profit sharing interest in the performance fees earned in relation to the funds. To achieve that objective, a certain amount of compensation is based on Apollo’s performance and growth for the year; and
•Decisions related to the amount of earnings available for dividends to Class A Common Stockholders, holders of RSUs that participate in dividends and holders of AOG Units.Units that participate in dividends.
Segment DE is a measure of profitability and has certain limitations in that it does not take into account certain items included under U.S. GAAP. Segment DE represents the amount of Apollo’s net realized earnings, excluding the effects of the consolidation of any of the related funds, Taxestaxes and Related Payables,related payables, transaction-related charges and any acquisitions. Transaction-related charges includes equity-based compensation charges, the amortization of intangible assets, contingent consideration, and certain other charges associated with acquisitions.acquisitions, and restructuring charges. In addition, Segment DE excludes non-cash revenue and expense related to equity awards granted by unconsolidated related parties to employees of the Company, compensation and administrative related expense reimbursements, as well as the assets, liabilities and operating results of the funds and variable interest entities that are included in the condensed consolidated financial statements. We believe the exclusion of the non-cash charges related to the 2007 Reorganization for equity-based compensation provides investors with a meaningful indication of our performance because these charges relate to the equity portion of our capital structure and not our core operating performance. Segment DE also excludes impacts of the remeasurement of the tax receivable agreement liability recorded in other income, which arises from changes in the associated deferred tax balance.
Segment DE may not be comparable to similarly titled measures used by other companies and is not a measure of performance calculated in accordance with U.S. GAAP. We use Segment DE as a measure of operating performance, not as a measure of liquidity. Segment DE should not be considered in isolation or as a substitute for net income or other income data prepared in accordance with U.S. GAAP. The use of Segment DE without consideration of related U.S. GAAP measures is not adequate due to the adjustments described above. Management compensates for these limitations by using Segment DE as a supplemental measure to U.S. GAAP results, to provide a more complete understanding of our performance as management measures it. A reconciliation of Segment DE to its most directly comparable U.S. GAAP measure of income (loss) before income tax provision can be found in this footnote.
APOLLO GLOBAL MANAGEMENT, INC.
NOTES TO CONDENSED CONSOLIDATED
FINANCIAL STATEMENTS
(dollars in thousands, except share data, except where noted)
Fee Related Earnings
Fee Related Earnings (“FRE”) is derived from our segment reported results and refers to a component of Segment DE that is used as a supplemental performance measure to assess whether revenues that we believe are generally more stable and predictable in nature, primarily consisting of management fees, are sufficient to cover associated operating expenses and generate profits. FRE is the sum across all segments of (i) management fees, (ii) advisory and transaction fees, (iii) performance fees earned fromrelated to business development companies, and Redding Ridge Holdings (as defined below)LP (“Redding Ridge Holdings”), an affiliate of Redding Ridge, and MidCap and (iv) other income, net, less (x) salary, bonus and benefits, excluding equity-based compensation, (y) other associated operating expenses and (z) non-controlling interests in the management companies of certain funds the Company manages.
The following tables present financial data for Apollo’s reportable segments.
|
| | | | | | | | | | | | | | | |
| | As of and for the Three Months Ended September 30, 2019 |
| | Credit Segment | | Private Equity Segment | | Real Assets Segment | | Total Reportable Segments |
| Management fees | $ | 198,867 |
| | $ | 131,643 |
| | $ | 47,862 |
| | $ | 378,372 |
|
| Advisory and transaction fees, net | 5,530 |
| | 10,655 |
| | 377 |
| | 16,562 |
|
Performance fees(1) | 6,449 |
| | — |
| | — |
| | 6,449 |
|
| Fee Related Revenues | 210,846 |
| | 142,298 |
| | 48,239 |
| | 401,383 |
|
| Salary, bonus and benefits | (51,746 | ) | | (45,807 | ) | | (19,306 | ) | | (116,859 | ) |
| General, administrative and other | (33,403 | ) | | (26,603 | ) | | (10,734 | ) | | (70,740 | ) |
| Placement fees | (190 | ) | | (65 | ) | | (1 | ) | | (256 | ) |
| Fee Related Expenses | (85,339 | ) | | (72,475 | ) | | (30,041 | ) | | (187,855 | ) |
| Other income (loss), net of Non-Controlling Interest | (597 | ) | | (135 | ) | | (6 | ) | | (738 | ) |
| Fee Related Earnings | 124,910 |
| | 69,688 |
| | 18,192 |
| | 212,790 |
|
| Realized performance fees | 3,530 |
| | 63,742 |
| | 162 |
| | 67,434 |
|
| Realized profit sharing expense | (1,674 | ) | | (22,084 | ) | | (65 | ) | | (23,823 | ) |
| Net Realized Performance Fees | 1,856 |
| | 41,658 |
| | 97 |
| | 43,611 |
|
| Realized principal investment income | 5,845 |
| | 8,114 |
| | 415 |
| | 14,374 |
|
| Net interest loss and other | (6,106 | ) | | (8,911 | ) | | (3,234 | ) | | (18,251 | ) |
Segment Distributable Earnings(2) | $ | 126,505 |
| | $ | 110,549 |
| | $ | 15,470 |
| | $ | 252,524 |
|
Total Assets(2) | $ | 2,898,125 |
| | $ | 3,284,439 |
| | $ | 724,171 |
| | $ | 6,906,735 |
|
| |
(1) | Represents certain performance fees from business development companies and Redding Ridge Holdings LP (“Redding Ridge Holdings”), an affiliate of Redding Ridge. |
| |
(2) | Refer below for a reconciliation of total revenues, total expenses, other income (loss) and total assets for Apollo’s total reportable segments to total consolidated revenues, total consolidated expenses, total consolidated other income (loss) and total assets. |
APOLLO GLOBAL MANAGEMENT, INC.
NOTES TO CONDENSED CONSOLIDATED
FINANCIAL STATEMENTS
(dollars in thousands, except share data, except where noted)
| | | | | | | | | | | | | | | | | | | | | | | |
| | As of and for the Three Months Ended September 30, 2020 |
| | Credit
Segment | | Private Equity
Segment | | Real Assets
Segment | | Total Reportable
Segments |
| Management fees | $ | 246,159 | | | $ | 128,446 | | | $ | 51,847 | | | 426,452 | |
| Advisory and transaction fees, net | 51,376 | | | 20,108 | | | 878 | | | 72,362 | |
Performance fees(1) | 2,204 | | | 0 | | | 0 | | | 2,204 | |
| Fee Related Revenues | 299,739 | | | 148,554 | | | 52,725 | | | 501,018 | |
| Salary, bonus and benefits | (61,975) | | | (53,451) | | | (29,513) | | | (144,939) | |
| General, administrative and other | (40,367) | | | (25,099) | | | (11,869) | | | (77,335) | |
| Placement fees | (425) | | | (188) | | | 0 | | | (613) | |
| Fee Related Expenses | (102,767) | | | (78,738) | | | (41,382) | | | (222,887) | |
| Other income (loss), net of Non-Controlling Interest | (780) | | | 23 | | | 59 | | | (698) | |
| Fee Related Earnings | 196,192 | | | 69,839 | | | 11,402 | | | 277,433 | |
| Realized performance fees | 7,614 | | | 2,025 | | | 7,806 | | | 17,445 | |
| Realized profit sharing expense | (7,614) | | | (2,025) | | | (7,806) | | | (17,445) | |
| Net Realized Performance Fees | 0 | | | 0 | | | 0 | | | 0 | |
Realized principal investment income, net(2) | 928 | | | 1,598 | | | 356 | | | 2,882 | |
| Net interest loss and other | (14,010) | | | (14,580) | | | (6,216) | | | (34,806) | |
Segment Distributable Earnings(3) | $ | 183,110 | | | $ | 56,857 | | | $ | 5,542 | | | $ | 245,509 | |
Total Assets(3) | $ | 4,314,160 | | | $ | 2,873,066 | | | $ | 833,780 | | | $ | 8,021,006 | |
|
| | | | | | | | | | | | | | | |
| | For the Three Months Ended September 30, 2018 |
| | Credit Segment | | Private Equity Segment | | Real Assets Segment | | Total Reportable Segments |
| Management fees | $ | 167,178 |
| | $ | 131,578 |
| | $ | 41,149 |
| | $ | 339,905 |
|
| Advisory and transaction fees, net | 2,189 |
| | 6,018 |
| | 4,765 |
| | 12,972 |
|
Performance fees(1) | 7,064 |
| | — |
| | — |
| | 7,064 |
|
| Fee Related Revenues | 176,431 |
| | 137,596 |
| | 45,914 |
| | 359,941 |
|
| Salary, bonus and benefits | (44,642 | ) | | (38,700 | ) | | (18,191 | ) | | (101,533 | ) |
| General, administrative and other | (31,392 | ) | | (22,694 | ) | | (9,911 | ) | | (63,997 | ) |
| Placement fees | (295 | ) | | (51 | ) | | (400 | ) | | (746 | ) |
| Fee Related Expenses | (76,329 | ) | | (61,445 | ) | | (28,502 | ) | | (166,276 | ) |
| Other income, net of Non-Controlling Interest | 265 |
| | 1,448 |
| | 1,680 |
| | 3,393 |
|
| Fee Related Earnings | 100,367 |
| | 77,599 |
| | 19,092 |
| | 197,058 |
|
| Realized performance fees | 11,281 |
| | 77,740 |
| | 4,010 |
| | 93,031 |
|
| Realized profit sharing expense | (8,986 | ) | | (42,842 | ) | | (2,352 | ) | | (54,180 | ) |
| Net Realized Performance Fees | 2,295 |
| | 34,898 |
| | 1,658 |
| | 38,851 |
|
| Realized principal investment income | 6,676 |
| | 10,579 |
| | 532 |
| | 17,787 |
|
| Net interest loss and other | (3,612 | ) | | (5,004 | ) | | (2,835 | ) | | (11,451 | ) |
Segment Distributable Earnings(2) | $ | 105,726 |
| | $ | 118,072 |
| | $ | 18,447 |
| | $ | 242,245 |
|
| |
(1) | Represents certain performance fees from business development companies and Redding Ridge Holdings. |
| |
(2) | Refer below for a reconciliation of total revenues, total expenses and other(2)Realized principal investment income, net includes dividends from our permanent capital vehicles, net of such amounts used to compensate employees. (3)Refer below for a reconciliation of total revenues, total expenses, other loss and total assets for Apollo’s total reportable segments to total consolidated revenues, total consolidated expenses and total consolidated other income (loss). |
The following table reconciles total consolidated revenues, to total revenues for Apollo’s reportable segments:consolidated expenses, total consolidated other income (loss) and total assets.
|
| | | | | | | |
| | For the Three Months Ended September 30, |
| | 2019 | | 2018 |
| Total Consolidated Revenues | $ | 702,721 |
| | $ | 517,731 |
|
Equity awards granted by unconsolidated related parties, reimbursable expenses and other(1) | (19,990 | ) | | (23,019 | ) |
Adjustments related to consolidated funds and VIEs(1) | 4,079 |
| | 2,445 |
|
Performance fees(2) | (250,642 | ) | | (119,478 | ) |
| Principal investment income | (34,785 | ) | | (17,738 | ) |
| Total Fee Related Revenues | 401,383 |
| | 359,941 |
|
| Realized performance fees | 67,434 |
| | 93,031 |
|
| Realized principal investment income and other | 13,532 |
| | 16,945 |
|
| Total Segment Revenues | $ | 482,349 |
| | $ | 469,917 |
|
| |
(1) | Represents advisory fees, management fees and performance fees earned from consolidated VIEs which are eliminated in consolidation. Includes non-cash revenues related to equity awards granted by unconsolidated related parties to employees of the Company and certain compensation and administrative related expense reimbursements. |
| |
(2) | Excludes certain performance fees from business development companies and Redding Ridge Holdings. |
APOLLO GLOBAL MANAGEMENT, INC.
NOTES TO CONDENSED CONSOLIDATED
FINANCIAL STATEMENTS
(dollars in thousands, except share data, except where noted)
| | | | | | | | | | | | | | | | | | | | | | | |
| | For the Three Months Ended September 30, 2019 |
| | Credit
Segment | | Private Equity
Segment | | Real Assets
Segment | | Total Reportable
Segments |
| Management fees | $ | 198,867 | | | $ | 131,643 | | | $ | 47,862 | | | $ | 378,372 | |
| Advisory and transaction fees, net | 5,530 | | | 10,655 | | | 377 | | | 16,562 | |
Performance fees(1) | 6,449 | | | 0 | | | 0 | | | 6,449 | |
| Fee Related Revenues | 210,846 | | | 142,298 | | | 48,239 | | | 401,383 | |
| Salary, bonus and benefits | (51,746) | | | (45,807) | | | (19,306) | | | (116,859) | |
| General, administrative and other | (33,403) | | | (26,603) | | | (10,734) | | | (70,740) | |
| Placement fees | (190) | | | (65) | | | (1) | | | (256) | |
| Fee Related Expenses | (85,339) | | | (72,475) | | | (30,041) | | | (187,855) | |
| Other loss, net of Non-Controlling Interest | (597) | | | (135) | | | (6) | | | (738) | |
| Fee Related Earnings | 124,910 | | | 69,688 | | | 18,192 | | | 212,790 | |
| Realized performance fees | 3,530 | | | 63,742 | | | 162 | | | 67,434 | |
| Realized profit sharing expense | (1,674) | | | (22,084) | | | (65) | | | (23,823) | |
| Net Realized Performance Fees | 1,856 | | | 41,658 | | | 97 | | | 43,611 | |
Realized principal investment income, net(2)
| 5,845 | | | 8,114 | | | 415 | | | 14,374 | |
| Net interest loss and other | (6,106) | | | (8,911) | | | (3,234) | | | (18,251) | |
Segment Distributable Earnings (3) | $ | 126,505 | | | $ | 110,549 | | | $ | 15,470 | | | $ | 252,524 | |
| | | | | | | |
(1)Represents certain performance fees related to business development companies, Redding Ridge Holdings and MidCap.
(2)Realized principal investment income, net includes dividends from our permanent capital vehicles, net of such amounts used to compensate employees.
(3)Refer below for a reconciliation of total revenues, total expenses and other income (loss) for Apollo’s total reportable segments to total consolidated revenues, total consolidated expenses and total consolidated other income (loss) and total assets.
The following table reconciles total consolidated expensesrevenues to total expensesrevenues for Apollo’s reportable segments:
| | | | | | | | | | | | | | | |
| | For the Three Months Ended September 30, | | | | |
| 2020 | | 2019 | | | | |
| Total Consolidated Revenues | $ | 1,018,274 | | | $ | 702,721 | | | | | |
Equity awards granted by unconsolidated related parties, reimbursable expenses and other(1) | (27,479) | | | (19,990) | | | | | |
Adjustments related to consolidated funds and VIEs(1) | 22,084 | | | 4,079 | | | | | |
Performance fees(2) | (457,754) | | | (250,642) | | | | | |
| Principal investment income | (54,107) | | | (34,785) | | | | | |
| Total Fee Related Revenues | 501,018 | | | 401,383 | | | | | |
| Realized performance fees | 17,445 | | | 67,434 | | | | | |
| Realized principal investment income, net and other | 1,198 | | | 13,532 | | | | | |
| Total Segment Revenues | $ | 519,661 | | | $ | 482,349 | | | | | |
|
| | | | | | | |
| | For the Three Months Ended September 30, |
| | 2019 | | 2018 |
| Total Consolidated Expenses | $ | 371,372 |
| | $ | 312,727 |
|
Equity awards granted by unconsolidated related parties, reimbursable expenses and other(1) | (20,563 | ) | | (23,153 | ) |
| Reclassification of interest expenses | (27,833 | ) | | (15,209 | ) |
Transaction-related charges, net(1) | (5,201 | ) | | (1,253 | ) |
Charges associated with corporate conversion(2) | (6,994 | ) | | — |
|
| Equity-based compensation | (15,802 | ) | | (17,668 | ) |
Total profit sharing expense(3) | (107,124 | ) | | (89,168 | ) |
| Total Fee Related Expenses | 187,855 |
| | 166,276 |
|
| Realized profit sharing expense | 23,823 |
| | 54,180 |
|
| Total Segment Expenses | $ | 211,678 |
| | $ | 220,456 |
|
| |
(1) | Represents the addition of expenses of consolidated funds and VIEs, transaction-related charges, non-cash expenses related to equity awards granted by unconsolidated related parties to employees of the Company and certain compensation and administrative expenses. Transaction-related charges include equity-based compensation charges, the amortization of intangible assets, contingent consideration and certain other charges associated with acquisitions. |
| |
(2) | Represents expenses incurred in relation to the Conversion, as described in note 1. |
| |
(3) | Includes unrealized profit sharing expense, realized profit sharing expense and equity based profit sharing expense and other. |
The following table reconciles total(1)Represents advisory fees, management fees and performance fees earned from consolidated other income (loss)VIEs which are eliminated in consolidation. Includes non-cash revenues related to total other loss for Apollo’s reportable segments:equity awards granted by unconsolidated related parties to employees of the Company and certain compensation and administrative related expense reimbursements.
(2)Excludes certain performance fees related to business development companies, Redding Ridge Holdings and MidCap.
|
| | | | | | | |
| | For the Three Months Ended September 30, |
| | 2019 | | 2018 |
| Total Consolidated Other Income (Loss) | $ | (42,151 | ) | | $ | 176,780 |
|
Adjustments related to consolidated funds and VIEs(1) | (10,338 | ) | | (12,732 | ) |
| Loss from change in tax receivable agreement liability | 38,575 |
| | — |
|
| Net (gains) losses from investment activities | 19,783 |
| | (155,262 | ) |
| Interest income and other, net of Non-Controlling Interest | (6,607 | ) | | (5,393 | ) |
| Other Income (Loss), net of Non-Controlling Interest | (738 | ) | | 3,393 |
|
| Net interest loss and other | (17,409 | ) | | (10,609 | ) |
| Total Segment Other Loss | $ | (18,147 | ) | | $ | (7,216 | ) |
| |
(1) | Represents the addition of other income of consolidated funds and VIEs. |
APOLLO GLOBAL MANAGEMENT, INC.
NOTES TO CONDENSED CONSOLIDATED
FINANCIAL STATEMENTS
(dollars in thousands, except share data, except where noted)
| | | | | | | | | | | | | |
| | For the Three Months Ended September 30, | | |
| 2020 | | 2019 | | |
| Total Consolidated Expenses | $ | 531,055 | | | $ | 371,372 | | | |
Equity awards granted by unconsolidated related parties, reimbursable expenses and other(1) | (26,339) | | | (20,563) | | | |
| Reclassification of interest expenses | (34,889) | | | (27,833) | | | |
Transaction-related charges, net(1) | (10,835) | | | (5,201) | | | |
Charges associated with corporate conversion(2) | (2,829) | | | (6,994) | | | |
| Equity-based compensation | (17,962) | | | (15,802) | | | |
Total profit sharing expense(3) | (213,494) | | | (107,124) | | | |
| Dividend-related compensation expense | (1,820) | | | 0 | | | |
| Total Fee Related Expenses | 222,887 | | | 187,855 | | | |
| Realized profit sharing expense | 17,445 | | | 23,823 | | | |
| Total Segment Expenses | $ | 240,332 | | | $ | 211,678 | | | |
(1)Represents the addition of expenses of consolidated funds and VIEs, transaction-related charges, non-cash expenses related to equity awards granted by unconsolidated related parties to employees of the Company and certain compensation and administrative expenses. Transaction-related charges include equity-based compensation charges, the amortization of intangible assets, contingent consideration and certain other charges associated with acquisitions, and restructuring charges.
(2)Represents expenses incurred in relation to the Conversion, as described in note 1.
(3)Includes unrealized profit sharing expense, realized profit sharing expense and equity based profit sharing expense and other.
The following table presents the reconciliation ofreconciles total consolidated other income (loss) before income tax provision reported in the condensed consolidated statements of operations to Segment Distributable Earnings:
|
| | | | | | | |
| | For the Three Months Ended September 30, |
| | 2019 | | 2018 |
| Income before income tax provision | $ | 289,198 |
| | $ | 381,784 |
|
Transaction-related charges(1) | 5,201 |
| | 1,253 |
|
Charges associated with corporate conversion(2) | 6,994 |
| | — |
|
| Loss from change in tax receivable agreement liability | 38,575 |
| | — |
|
| Net income attributable to Non-Controlling Interests in consolidated entities | (7,083 | ) | | (11,340 | ) |
| Unrealized performance fees | (183,208 | ) | | (26,447 | ) |
| Unrealized profit sharing expense | 61,098 |
| | 8,903 |
|
Equity-based profit sharing expense and other(3) | 22,203 |
| | 26,085 |
|
| Equity-based compensation | 15,802 |
| | 17,668 |
|
| Unrealized principal investment (income) loss | (20,411 | ) | | 49 |
|
| Unrealized net (gains) losses from investment activities and other | 24,155 |
| | (155,710 | ) |
| Segment Distributable Earnings | $ | 252,524 |
| | $ | 242,245 |
|
| |
(1) | Transaction-related charges include equity-based compensation charges, the amortization of intangible assets, contingent consideration and certain other charges associated with acquisitions. |
| |
(2) | Represents expenses incurred in relation to the Conversion, as described in note 1. |
| |
(3) | Equity-based profit sharing expense and other includes certain profit sharing arrangements in which a portion of performance fees distributed to the general partner are allocated by issuance of equity-based awards, rather than cash, to employees of Apollo. Equity-based profit sharing expense and other also includes non-cash expenses related to equity awards granted by unconsolidated related parties to employees of Apollo. |
The following tables present financial datatotal other loss for Apollo’s reportable segments.segments:
| | | | | | | | | | | | | | | |
| | For the Three Months Ended September 30, | | | | |
| 2020 | | 2019 | | | | |
| Total Consolidated Other Income (Loss) | $ | 278,237 | | | $ | (42,151) | | | | | |
Adjustments related to consolidated funds and VIEs(1) | (121,425) | | | (10,338) | | | | | |
| Loss from change in tax receivable agreement liability | 0 | | | 38,575 | | | | | |
| Net (gains) losses from investment activities | (144,839) | | | 19,783 | | | | | |
| Interest income and other, net of Non-Controlling Interest | (12,671) | | | (6,607) | | | | | |
| Other Loss, net of Non-Controlling Interest | (698) | | | (738) | | | | | |
| Net interest loss and other | (33,122) | | | (17,409) | | | | | |
| Total Segment Other Loss | $ | (33,820) | | | $ | (18,147) | | | | | |
(1)Represents the addition of other income of consolidated funds and VIEs.
|
| | | | | | | | | | | | | | | |
| | As of and for the Nine Months Ended September 30, 2019 |
| | Credit Segment | | Private Equity Segment | | Real Assets Segment | | Total Reportable Segments |
| Management fees | $ | 571,884 |
| | $ | 391,777 |
| | $ | 139,645 |
| | $ | 1,103,306 |
|
| Advisory and transaction fees, net | 13,888 |
| | 47,048 |
| | 5,748 |
| | 66,684 |
|
Performance fees(1) | 16,371 |
| | — |
| | — |
| | 16,371 |
|
| Fee Related Revenues | 602,143 |
| | 438,825 |
| | 145,393 |
| | 1,186,361 |
|
| Salary, bonus and benefits | (146,515 | ) | | (129,307 | ) | | (57,031 | ) | | (332,853 | ) |
| General, administrative and other | (92,546 | ) | | (75,427 | ) | | (28,956 | ) | | (196,929 | ) |
| Placement fees | (42 | ) | | (548 | ) | | (1 | ) | | (591 | ) |
| Fee Related Expenses | (239,103 | ) | | (205,282 | ) | | (85,988 | ) | | (530,373 | ) |
| Other income, net of Non-Controlling Interest | 967 |
| | 4,024 |
| | 88 |
| | 5,079 |
|
| Fee Related Earnings | 364,007 |
| | 237,567 |
| | 59,493 |
| | 661,067 |
|
| Realized performance fees | 24,887 |
| | 136,429 |
| | 3,242 |
| | 164,558 |
|
| Realized profit sharing expense | (13,069 | ) | | (63,900 | ) | | (1,299 | ) | | (78,268 | ) |
| Net Realized Performance Fees | 11,818 |
| | 72,529 |
| | 1,943 |
| | 86,290 |
|
| Realized principal investment income | 16,803 |
| | 18,079 |
| | 2,209 |
| | 37,091 |
|
| Net interest loss and other | (15,148 | ) | | (22,694 | ) | | (8,115 | ) | | (45,957 | ) |
Segment Distributable Earnings(2) | $ | 377,480 |
| | $ | 305,481 |
| | $ | 55,530 |
| | $ | 738,491 |
|
Total Assets(2) | $ | 2,898,125 |
| | $ | 3,284,439 |
| | $ | 724,171 |
| | $ | 6,906,735 |
|
| |
(1) | Represents certain performance fees from business development companies and Redding Ridge Holdings. |
APOLLO GLOBAL MANAGEMENT, INC.
NOTES TO CONDENSED CONSOLIDATED
FINANCIAL STATEMENTS
(dollars in thousands, except share data, except where noted)
| |
(2) | Refer below for a reconciliation of total revenues, total expenses, other loss and total assets for Apollo’s total reportable segments to total consolidated revenues, total consolidated expenses, total consolidated other income (loss) and total assets. |
|
| | | | | | | | | | | | | | | |
| | For the Nine Months Ended September 30, 2018 |
| | Credit Segment | | Private Equity Segment | | Real Assets Segment | | Total Reportable Segments |
| Management fees | $ | 470,070 |
| | $ | 346,275 |
| | $ | 121,627 |
| | $ | 937,972 |
|
| Advisory and transaction fees, net | 6,484 |
| | 29,992 |
| | 5,070 |
| | 41,546 |
|
Performance fees(1) | 18,105 |
| | — |
| | — |
| | 18,105 |
|
| Fee Related Revenues | 494,659 |
| | 376,267 |
| | 126,697 |
| | 997,623 |
|
| Salary, bonus and benefits | (134,192 | ) | | (121,304 | ) | | (57,069 | ) | | (312,565 | ) |
| General, administrative and other | (85,603 | ) | | (59,010 | ) | | (29,435 | ) | | (174,048 | ) |
| Placement fees | (850 | ) | | (134 | ) | | (400 | ) | | (1,384 | ) |
| Fee Related Expenses | (220,645 | ) | | (180,448 | ) | | (86,904 | ) | | (487,997 | ) |
| Other income, net of Non-Controlling Interest | 2,260 |
| | 1,839 |
| | 1,903 |
| | 6,002 |
|
| Fee Related Earnings | 276,274 |
| | 197,658 |
| | 41,696 |
| | 515,628 |
|
Realized performance fees(2) | 29,030 |
| | 245,152 |
| | 55,625 |
| | 329,807 |
|
Realized profit sharing expense(2) | (23,313 | ) | | (132,102 | ) | | (32,222 | ) | | (187,637 | ) |
| Net Realized Performance Fees | 5,717 |
| | 113,050 |
| | 23,403 |
| | 142,170 |
|
| Realized principal investment income | 16,887 |
| | 37,988 |
| | 5,678 |
| | 60,553 |
|
| Net interest loss and other | (11,082 | ) | | (15,619 | ) | | (6,712 | ) | | (33,413 | ) |
Segment Distributable Earnings(3) | $ | 287,796 |
| | $ | 333,077 |
| | $ | 64,065 |
| | $ | 684,938 |
|
| |
(1) | Represents certain performance fees from business development companies and Redding Ridge Holdings. |
| |
(2) | Excludes realized performance fees and realized profit sharing expense settled in the form of shares of Athene Holding during the nine months ended September 30, 2018. |
| |
(3) | Refer below for a reconciliation of total revenues, total expenses and other income (loss) for Apollo’s total reportable segments to total consolidated revenues, total consolidated expenses and total consolidated other income (loss). |
The following table reconciles total consolidated revenues to total revenues for Apollo’s reportable segments:
|
| | | | | | | |
| | For the Nine Months Ended September 30, |
| | 2019 | | 2018 |
| Total Consolidated Revenues | $ | 2,017,077 |
| | $ | 1,207,950 |
|
Equity awards granted by unconsolidated related parties, reimbursable expenses and other(1) | (72,966 | ) | | (62,132 | ) |
Adjustments related to consolidated funds and VIEs(1) | 5,801 |
| | 6,063 |
|
Performance fees(2) | (661,828 | ) | | (126,332 | ) |
| Principal investment income | (101,723 | ) | | (27,926 | ) |
| Total Fee Related Revenues | 1,186,361 |
| | 997,623 |
|
Realized performance fees(3) | 164,558 |
| | 329,807 |
|
| Realized principal investment income and other | 34,564 |
| | 58,026 |
|
| Total Segment Revenues | $ | 1,385,483 |
| | $ | 1,385,456 |
|
| |
(1) | Represents advisory fees, management fees and performance fees earned from consolidated VIEs which are eliminated in consolidation. Includes non-cash revenues related to equity awards granted by unconsolidated related parties to employees of the Company and certain compensation and administrative related expense reimbursements. |
| |
(2) | Excludes certain performance fees from business development companies and Redding Ridge Holdings. |
| |
(3) | Excludes realized performance fees settled in the form of shares of Athene Holding during the nine months ended September 30, 2018. |
APOLLO GLOBAL MANAGEMENT, INC.
NOTES TO CONDENSED CONSOLIDATED
FINANCIAL STATEMENTS
(dollars in thousands, except share data, except where noted)
The following table reconciles total consolidated expenses to total expenses for Apollo’s reportable segments:
|
| | | | | | | |
| | For the Nine Months Ended September 30, |
| | 2019 | | 2018 |
| Total Consolidated Expenses | $ | 1,091,914 |
| | $ | 828,996 |
|
Equity awards granted by unconsolidated related parties, reimbursable expenses and other(1) | (73,270 | ) | | (61,724 | ) |
| Reclassification of interest expenses | (70,243 | ) | | (44,168 | ) |
Transaction-related charges, net(1) | (28,799 | ) | | 3,800 |
|
Charges associated with corporate conversion(2) | (17,000 | ) | | — |
|
| Equity-based compensation | (52,462 | ) | | (51,131 | ) |
Total profit sharing expense(3) | (319,767 | ) | | (187,776 | ) |
| Total Fee Related Expenses | 530,373 |
| | 487,997 |
|
Realized profit sharing expense(4) | 78,268 |
| | 187,637 |
|
| Total Segment Expenses | $ | 608,641 |
| | $ | 675,634 |
|
| |
(1) | Represents the addition of expenses of consolidated funds and VIEs, transaction-related charges, non-cash expenses related to equity awards granted by unconsolidated related parties to employees of the Company and certain compensation and administrative expenses. Transaction-related charges include equity-based compensation charges, the amortization of intangible assets, contingent consideration and certain other charges associated with acquisitions. |
| |
(2) | Represents expenses incurred in relation to the Conversion, as described in note 1. |
| |
(3) | Includes unrealized profit sharing expense, realized profit sharing expense and equity based profit sharing expense and other. |
| |
(4) | Excludes realized profit sharing expense settled in the form of shares of Athene Holding during the nine months ended September 30, 2018. |
The following table reconciles total consolidated other income (loss) to total other loss for Apollo’s reportable segments:
|
| | | | | | | |
| | For the Nine Months Ended September 30, |
| | 2019 | | 2018 |
| Total Consolidated Other Income (Loss) | $ | 58,314 |
| | $ | 64,796 |
|
Adjustments related to consolidated funds and VIEs(1) | (23,839 | ) | | (27,924 | ) |
| Loss from change in tax receivable agreement liability | 38,575 |
| | — |
|
| Net (gains) losses from investment activities | (44,095 | ) | | (20,560 | ) |
| Interest income and other, net of Non-Controlling Interest | (23,876 | ) | | (10,310 | ) |
| Other Income, net of Non-Controlling Interest | 5,079 |
| | 6,002 |
|
| Net interest loss and other | (43,430 | ) | | (30,886 | ) |
| Total Segment Other Loss | $ | (38,351 | ) | | $ | (24,884 | ) |
| |
(1) | Represents the addition of other income of consolidated funds and VIEs. |
APOLLO GLOBAL MANAGEMENT, INC.
NOTES TO CONDENSED CONSOLIDATED
FINANCIAL STATEMENTS
(dollars in thousands, except share data, except where noted)
The following table presents the reconciliation of income before income tax provision reported in the condensed consolidated statements of operations to Segment Distributable Earnings:
| | | | | | | | | | | | | | | |
| For the Three Months Ended September 30, | | | | |
| 2020 | | 2019 | | | | |
| Income before income tax provision | $ | 765,456 | | | $ | 289,198 | | | | | |
Transaction-related charges(1) | 10,835 | | | 5,201 | | | | | |
Charges associated with corporate conversion(2) | 2,829 | | | 6,994 | | | | | |
| Loss from change in tax receivable agreement liability | 0 | | | 38,575 | | | | | |
| Net income attributable to Non-Controlling Interests in consolidated entities | (100,021) | | | (7,083) | | | | | |
| Unrealized performance fees | (440,310) | | | (183,208) | | | | | |
| Unrealized profit sharing expense | 168,368 | | | 61,098 | | | | | |
Equity-based profit sharing expense and other(3) | 27,681 | | | 22,203 | | | | | |
| Equity-based compensation | 17,962 | | | 15,802 | | | | | |
| Unrealized principal investment income | (49,406) | | | (20,411) | | | | | |
| Unrealized net (gains) losses from investment activities and other | (157,885) | | | 24,155 | | | | | |
| Segment Distributable Earnings | $ | 245,509 | | | $ | 252,524 | | | | | |
|
| | | | | | | |
| | For the Nine Months Ended September 30, |
| | 2019 | | 2018 |
| Income before income tax provision | $ | 983,477 |
| | $ | 443,750 |
|
Transaction-related charges(1) | 28,799 |
| | (3,800 | ) |
Charges associated with corporate conversion(2) | 17,000 |
| | — |
|
| Loss from change in tax receivable agreement liability | 38,575 |
| | — |
|
| Net income attributable to Non-Controlling Interests in consolidated entities | (20,888 | ) | | (26,035 | ) |
Unrealized performance fees(3) | (497,270 | ) | | 203,475 |
|
Unrealized profit sharing expense(3) | 177,659 |
| | (58,360 | ) |
Equity-based profit sharing expense and other(4) | 63,840 |
| | 58,499 |
|
| Equity-based compensation | 52,462 |
| | 51,131 |
|
| Unrealized principal investment (income) loss | (64,632 | ) | | 32,627 |
|
| Unrealized net (gains) losses from investment activities and other | (40,531 | ) | | (16,349 | ) |
| Segment Distributable Earnings | $ | 738,491 |
| | $ | 684,938 |
|
| |
(1) | Transaction-related charges include equity-based compensation charges, the amortization of intangible assets, contingent consideration and certain other charges associated with acquisitions. |
| |
(2) | (2) Represents expenses incurred in relation to the Conversion, as described in note 1. |
| |
(3) | Includes realized performance fees and realized profit sharing expense settled in the form of shares of Athene Holding during the nine months ended September 30, 2018. |
| |
(4) | Equity-based profit sharing expense and other includes certain profit sharing arrangements in which a portion of performance fees distributed to the general partner are allocated by issuance of equity-based awards, rather than cash, to employees of Apollo. Equity-based profit sharing expense and other also includes non-cash expenses related to equity awards granted by unconsolidated related parties to employees of Apollo. |
The following table presents the reconciliation of Apollo’s total reportable segment assets to total assets:
|
| | | | | | | |
| | As of
September 30, 2019 | | As of
December 31, 2018 |
| Total reportable segment assets | $ | 6,906,735 |
| | $ | 4,791,646 |
|
Adjustments(1) | 1,157,569 |
| | 1,200,008 |
|
| Total assets | $ | 8,064,304 |
| | $ | 5,991,654 |
|
| |
(1) | Represents the addition of assets of consolidated funds and VIEs and consolidation elimination adjustments. |
17. SUBSEQUENT EVENTS
On October 27, 2019 Athene Holding Ltd., a Bermuda exempted company (“AHL”), AGM and the entities that form the Apollo Operating Group entered into a Transaction Agreement (the “Transaction Agreement”), pursuant to which, among other things:
(i) AHL will issue 27,959,184 Class A common shares of AHL (the “AHL Class A Common Shares”) to certain subsidiaries of the Apollo Operating Group in exchange for an issuance by the Apollo Operating Group of 29,154,519 non-voting equity interests of the Apollo Operating Group to AHL and (ii) AGM, through the Apollo Operating Group, will purchase an additional $350 million of AHL Class A Common Shares (the “Share Issuance”);
AHL has granted to AGM the right to purchase additional AHL Class A Common Shares from the closing date of the Share Issuance (the “Closing Date”) until 180 days thereafter to the extentConversion, as described in note 1.
(3) Equity-based profit sharing expense and other includes certain profit sharing arrangements in which a portion of performance fees distributed to the issuedgeneral partner are allocated by issuance of equity-based awards, rather than cash, to employees of Apollo. Equity-based profit sharing expense and outstanding AHL Class A Common Shares beneficially ownedother also includes non-cash expenses related to equity awards granted by Apollo and certain of itsunconsolidated related parties to employees of Apollo.
| | | | | | | | | | | | | | | | | | | | | | | |
| | As of and for the Nine Months Ended September 30, 2020 |
| | Credit
Segment | | Private Equity
Segment | | Real Assets
Segment | | Total Reportable
Segments |
| Management fees | $ | 679,109 | | | $ | 381,306 | | | $ | 150,227 | | | 1,210,642 | |
| Advisory and transaction fees, net | 80,399 | | | 85,253 | | | 5,191 | | | 170,843 | |
Performance fees(1) | 8,048 | | | 0 | | | 0 | | | 8,048 | |
| Fee Related Revenues | 767,556 | | | 466,559 | | | 155,418 | | | 1,389,533 | |
| Salary, bonus and benefits | (171,789) | | | (149,133) | | | (83,037) | | | (403,959) | |
| General, administrative and other | (112,991) | | | (68,863) | | | (35,637) | | | (217,491) | |
| Placement fees | (1,089) | | | (295) | | | 0 | | | (1,384) | |
| Fee Related Expenses | (285,869) | | | (218,291) | | | (118,674) | | | (622,834) | |
| Other income (loss), net of Non-Controlling Interest | (2,167) | | | 48 | | | 154 | | | (1,965) | |
| Fee Related Earnings | 479,520 | | | 248,316 | | | 36,898 | | | 764,734 | |
| Realized performance fees | 37,834 | | | 6,717 | | | 49,477 | | | 94,028 | |
| Realized profit sharing expense | (37,530) | | | (7,021) | | | (49,477) | | | (94,028) | |
| Net Realized Performance Fees | 304 | | | (304) | | | 0 | | | 0 | |
Realized principal investment income, net(2) | 4,112 | | | 5,544 | | | 4,028 | | | 13,684 | |
| Net interest loss and other | (42,981) | | | (41,940) | | | (16,069) | | | (100,990) | |
Segment Distributable Earnings(3) | $ | 440,955 | | | $ | 211,616 | | | $ | 24,857 | | | $ | 677,428 | |
Total Assets(3) | $ | 4,314,160 | | | $ | 2,873,066 | | | $ | 833,780 | | | $ | 8,021,006 | |
(1)Represents certain performance fees related to business development companies, Redding Ridge Holdings and employees (collectively, the “Apollo Parties”) (inclusive of AHL Class A Common Shares over which any such persons have a valid proxy) do not equal at least 35% of the
APOLLO GLOBAL MANAGEMENT, INC.
NOTES TO CONDENSED CONSOLIDATED
FINANCIAL STATEMENTS
(dollars in thousands, except share data, except where noted)
issued(3)Refer below for a reconciliation of total revenues, total expenses, other loss and outstanding AHL Class A Common Shares, ontotal assets for Apollo’s total reportable segments to total consolidated revenues, total consolidated expenses, total consolidated other income (loss) and total assets.
| | | | | | | | | | | | | | | | | | | | | | | |
| | For the Nine Months Ended September 30, 2019 |
| | Credit
Segment | | Private Equity
Segment | | Real Assets
Segment | | Total Reportable
Segments |
| Management fees | $ | 571,884 | | | $ | 391,777 | | | $ | 139,645 | | | $ | 1,103,306 | |
| Advisory and transaction fees, net | 13,888 | | | 47,048 | | | 5,748 | | | 66,684 | |
Performance fees(1) | 16,371 | | | 0 | | | 0 | | | 16,371 | |
| Fee Related Revenues | 602,143 | | | 438,825 | | | 145,393 | | | 1,186,361 | |
| Salary, bonus and benefits | (146,515) | | | (129,307) | | | (57,031) | | | (332,853) | |
| General, administrative and other | (92,546) | | | (75,427) | | | (28,956) | | | (196,929) | |
| Placement fees | (42) | | | (548) | | | (1) | | | (591) | |
| Fee Related Expenses | (239,103) | | | (205,282) | | | (85,988) | | | (530,373) | |
| Other income, net of Non-Controlling Interest | 967 | | | 4,024 | | | 88 | | | 5,079 | |
| Fee Related Earnings | 364,007 | | | 237,567 | | | 59,493 | | | 661,067 | |
| Realized performance fees | 24,887 | | | 136,429 | | | 3,242 | | | 164,558 | |
| Realized profit sharing expense | (13,069) | | | (63,900) | | | (1,299) | | | (78,268) | |
| Net Realized Performance Fees | 11,818 | | | 72,529 | | | 1,943 | | | 86,290 | |
Realized principal investment income, net(2)
| 16,803 | | | 18,079 | | | 2,209 | | | 37,091 | |
| Net interest loss and other | (15,148) | | | (22,694) | | | (8,115) | | | (45,957) | |
Segment Distributable Earnings(3) | $ | 377,480 | | | $ | 305,481 | | | $ | 55,530 | | | $ | 738,491 | |
| | | | | | | |
(1)Represents certain performance fees related to business development companies, Redding Ridge Holdings and MidCap.
(2)Realized principal investment income, net includes dividends from our permanent capital vehicles, net of such amounts used to compensate employees.
(3)Refer below for a fully diluted basis (the “Conditional Right”);reconciliation of total revenues, total expenses, other loss and total assets for Apollo’s total reportable segments to total consolidated revenues, total consolidated expenses, total consolidated other income (loss) and total assets.
A representative
The following table reconciles total consolidated revenues to total revenues for Apollo’s reportable segments:
| | | | | | | | | | | | | | | |
| | For the Nine Months Ended September 30, | | |
| 2020 | | 2019 | | | | |
| Total Consolidated Revenues | $ | 1,057,523 | | | $ | 2,017,077 | | | | | |
Equity awards granted by unconsolidated related parties, reimbursable expenses and other(1) | (88,167) | | | (72,966) | | | | | |
Adjustments related to consolidated funds and VIEs(1) | 36,798 | | | 5,801 | | | | | |
Performance fees(2) | 358,188 | | | (661,828) | | | | | |
| Principal investment (income) loss | 25,191 | | | (101,723) | | | | | |
| Total Fee Related Revenues | 1,389,533 | | | 1,186,361 | | | | | |
| Realized performance fees | 94,028 | | | 164,558 | | | | | |
| Realized principal investment income, net and other | 10,315 | | | 34,564 | | | | | |
| Total Segment Revenues | $ | 1,493,876 | | | $ | 1,385,483 | | | | | |
APOLLO GLOBAL MANAGEMENT, INC.
NOTES TO CONDENSED CONSOLIDATED
FINANCIAL STATEMENTS
(dollars in thousands, except share data, except where noted)
(1)Represents advisory fees, management fees and performance fees earned from consolidated VIEs which are eliminated in consolidation. Includes non-cash revenues related to equity awards granted by unconsolidated related parties to employees of the Apollo Operating Group will haveCompany and certain compensation and administrative related expense reimbursements.
(2)Excludes certain performance fees related to business development companies, Redding Ridge Holdings and MidCap.
The following table reconciles total consolidated expenses to total expenses for Apollo’s reportable segments:
| | | | | | | | | | | | | |
| | For the Nine Months Ended September 30, |
| 2020 | | 2019 | | |
| Total Consolidated Expenses | $ | 905,398 | | | $ | 1,091,914 | | | |
Equity awards granted by unconsolidated related parties, reimbursable expenses and other(1) | (80,212) | | | (73,270) | | | |
| Reclassification of interest expenses | (98,422) | | | (70,243) | | | |
Transaction-related charges, net(1) | (21,546) | | | (28,799) | | | |
Charges associated with corporate conversion(2) | (3,893) | | | (17,000) | | | |
| Equity-based compensation | (49,779) | | | (52,462) | | | |
Total profit sharing expense(3) | (22,532) | | | (319,767) | | | |
| Dividend-related compensation expense | (6,180) | | | 0 | | | |
| Total Fee Related Expenses | 622,834 | | | 530,373 | | | |
| Realized profit sharing expense | 94,028 | | | 78,268 | | | |
| Total Segment Expenses | $ | 716,862 | | | $ | 608,641 | | | |
(1)Represents the rightaddition of expenses of consolidated funds and VIEs, transaction-related charges, non-cash expenses related to purchase upequity awards granted by unconsolidated related parties to that number of AHL Class A Common Shares that would increase by up to 5% the percentageemployees of the issuedCompany and outstanding AHL Class A Common Shares beneficially owned bycertain compensation and administrative expenses. Transaction-related charges include equity-based compensation charges, the Apollo Parties (inclusiveamortization of AHL Class A Common Shares over which any such persons have a valid proxy), calculated on a fully diluted basis (the “Facility Right”,intangible assets, contingent consideration and togethercertain other charges associated with the Share Issuanceacquisitions, and the Conditional Right, the “Share Transactions”);restructuring charges.
AHL will make certain amendments(2)Represents expenses incurred in relation to the Twelfth AmendedConversion, as described in note 1.
(3)Includes unrealized profit sharing expense, realized profit sharing expense and Restated Bye-laws of AHL (the “Bye-laws”), by way of amendingequity based profit sharing expense and restating the Bye-laws (the “Thirteenth Amended and Restated Bye-laws”), which include, among other items, the elimination of AHL’s current multi-class share structure.other.
The consummationfollowing table reconciles total consolidated other income (loss) to total other loss for Apollo’s reportable segments:
| | | | | | | | | | | | | | | |
| | For the Nine Months Ended September 30, | | |
| 2020 | | 2019 | | | | |
| Total Consolidated Other Income (Loss) | $ | (826,957) | | | $ | 58,314 | | | | | |
Adjustments related to consolidated funds and VIEs(1) | (11,157) | | | (23,839) | | | | | |
| Loss from change in tax receivable agreement liability | 0 | | | 38,575 | | | | | |
| Net (gains) losses from investment activities | 849,293 | | | (44,095) | | | | | |
| Interest income and other, net of Non-Controlling Interest | (13,144) | | | (23,876) | | | | | |
| Other Income (Loss), net of Non-Controlling Interest | (1,965) | | | 5,079 | | | | | |
| Net interest loss and other | (97,621) | | | (43,430) | | | | | |
| Total Segment Other Loss | $ | (99,586) | | | $ | (38,351) | | | | | |
(1)Represents the addition of other income of consolidated funds and VIEs.
APOLLO GLOBAL MANAGEMENT, INC.
NOTES TO CONDENSED CONSOLIDATED
FINANCIAL STATEMENTS
(dollars in thousands, except share data, except where noted)
The following table presents the Share Issuancereconciliation of income before income tax provision reported in the condensed consolidated statements of operations to Segment Distributable Earnings:
| | | | | | | | | | | | | | | |
| For the Nine Months Ended September 30, | | |
| 2020 | | 2019 | | | | |
| Income (Loss) before income tax (provision) benefit | $ | (674,832) | | | $ | 983,477 | | | | | |
Transaction-related charges(1) | 21,546 | | | 28,799 | | | | | |
Charges associated with corporate conversion(2) | 3,893 | | | 17,000 | | | | | |
| Loss from change in tax receivable agreement liability | 0 | | | 38,575 | | | | | |
| Net (income) loss attributable to Non-Controlling Interests in consolidated entities | 23,320 | | | (20,888) | | | | | |
| Unrealized performance fees | 452,215 | | | (497,270) | | | | | |
| Unrealized profit sharing expense | (172,128) | | | 177,659 | | | | | |
Equity-based profit sharing expense and other(3) | 100,632 | | | 63,840 | | | | | |
| Equity-based compensation | 49,779 | | | 52,462 | | | | | |
| Unrealized principal investment (income) loss | 45,054 | | | (64,632) | | | | | |
| Unrealized net (gains) losses from investment activities and other | 827,949 | | | (40,531) | | | | | |
| Segment Distributable Earnings | $ | 677,428 | | | $ | 738,491 | | | | | |
(1) Transaction-related charges include equity-based compensation charges, the amortization of intangible assets, contingent consideration and thecertain other transactions contemplated by the Transaction Agreement are subjectcharges associated with acquisitions, and restructuring charges.
(2) Represents expenses incurred in relation to the satisfaction or waiverConversion, as described in note 1.
(3) Equity-based profit sharing expense and other includes certain profit sharing arrangements in which a portion of specified closing conditions, including (i)performance fees distributed to the approvalgeneral partner are allocated by issuance of the Thirteenth Amendedequity-based awards, rather than cash, to employees of Apollo. Equity-based profit sharing expense and Restated Bye-laws and the Share Transactions by AHL’s shareholders, (ii) the receipt of required governmental and regulatory approvals for the Share Transactions, and the approval of the NYSE for the listing of the AHL Class A Common Shares to be issued by AHL in connection with the Share Issuance, (iii) the absence of any applicable law or regulation or order that prohibits the transactions contemplated by the Transaction Agreement, and the absence of any pending or threatened proceeding by any governmental entity or any investigation by any governmental entity seeking any such order, and (iv) certain other customary closing conditions, including, among other things, delivery of certain transaction documents contemplated by the Transaction Agreement, accuracy of representations and warranties and compliance with covenants by the parties.
The Company expects the Transaction Agreement to have a material impact on its condensed consolidated financial statementsalso includes non-cash expenses related to its investment in Athene Holdingequity awards granted by unconsolidated related parties to employees of Apollo
The following table presents the reconciliation of Apollo’s total reportable segment assets to total assets:
| | | | | | | | | | | |
| As of
September 30, 2020 | | As of
December 31, 2019 |
| Total reportable segment assets | $ | 8,021,006 | | | $ | 7,337,517 | |
Adjustments(1) | 10,606,864 | | | 1,204,600 | |
| Total assets | $ | 18,627,870 | | | $ | 8,542,117 | |
(1) Represents the addition of assets of consolidated funds and corresponding Non-controlling Interests. Upon consummation of the Transaction Agreement, the fair value of the Company’s investment in Athene Holding will be calculated using the closing market price of AHL Class A Common Shares, less a discount due to a lack of marketability, as a result of a lock-up on existingVIEs and newly acquired AHL Class A Common Shares for three years from the initial closing date. In addition, the Company may have to consolidate certain entities in which it has an indirect ownership interest through its investment in Athene Holding, with a portion attributable to Non-controlling Interests.consolidation elimination adjustments.
18. SUBSEQUENT EVENTS
Dividends
On October 31, 2019,29, 2020, the Company declared a cash dividend of $0.50$0.51 per share of Class A Common Stock, which will be paid on November 29, 201930, 2020 to holders of record at the close of business on November 20, 2019.2020.
On October 31, 2019,29, 2020, the Company declared a cash dividend of $0.398438 per share of Series A Preferred Stock and Series B Preferred Stock, which will be paid on December 16, 201915, 2020 to holders of record at the close of business on November 29, 2019.30, 2020.
ITEM 1A. UNAUDITED SUPPLEMENTAL PRESENTATION OF STATEMENTS
OF FINANCIAL CONDITION
APOLLO GLOBAL MANAGEMENT, INC.
CONSOLIDATING STATEMENTS OF FINANCIAL CONDITION (Unaudited)
(dollars in thousands, except share data)
|
| | | | | | | | | | | | | | | |
| | As of September 30, 2019 |
| | Apollo Global Management, Inc. and Consolidated Subsidiaries | | Consolidated Funds and VIEs | | Eliminations | | Consolidated |
| Assets: | | | | | | | |
| Cash and cash equivalents | $ | 1,242,813 |
| | $ | 4 |
| | $ | — |
| | $ | 1,242,817 |
|
| Restricted cash | 19,777 |
| | — |
| | — |
| | 19,777 |
|
| U.S. Treasury securities, at fair value | 551,681 |
| | — |
| | — |
| | 551,681 |
|
| Investments | 3,558,632 |
| | 563 |
| | (86,286 | ) | | 3,472,909 |
|
| Assets of consolidated variable interest entities: | | | | | | | |
| Cash and cash equivalents | — |
| | 41,799 |
| | — |
| | 41,799 |
|
| Investments, at fair value | — |
| | 1,163,981 |
| | — |
| | 1,163,981 |
|
| Other assets | — |
| | 39,088 |
| | — |
| | 39,088 |
|
| Incentive fees receivable | 3,093 |
| | — |
| | — |
| | 3,093 |
|
| Due from related parties | 440,985 |
| | — |
| | (914 | ) | | 440,071 |
|
| Deferred tax assets, net | 530,954 |
| | — |
| | — |
| | 530,954 |
|
| Other assets | 279,330 |
| | — |
| | (666 | ) | | 278,664 |
|
| Lease assets | 190,618 |
| | — |
| | — |
| | 190,618 |
|
| Goodwill | 88,852 |
| | — |
| | — |
| | 88,852 |
|
| Total Assets | $ | 6,906,735 |
| | $ | 1,245,435 |
| | $ | (87,866 | ) | | $ | 8,064,304 |
|
| Liabilities and Stockholders’ Equity | | | | | | | |
| Liabilities: | | | | | | | |
| Accounts payable and accrued expenses | $ | 96,820 |
| | $ | — |
| | $ | — |
| | $ | 96,820 |
|
| Accrued compensation and benefits | 166,161 |
| | — |
| | — |
| | 166,161 |
|
| Deferred revenue | 172,157 |
| | — |
| | — |
| | 172,157 |
|
| Due to related parties | 507,113 |
| | — |
| | — |
| | 507,113 |
|
| Profit sharing payable | 693,618 |
| | — |
| | — |
| | 693,618 |
|
| Debt | 2,348,440 |
| | — |
| | — |
| | 2,348,440 |
|
| Liabilities of consolidated variable interest entities: | | | | | | | |
| Debt, at fair value | — |
| | 870,979 |
| | (42,155 | ) | | 828,824 |
|
| Other liabilities | — |
| | 69,338 |
| | (296 | ) | | 69,042 |
|
| Due to related parties | — |
| | 1,284 |
| | (1,284 | ) | | — |
|
| Other liabilities | 132,023 |
| | — |
| | — |
| | 132,023 |
|
| Lease liabilities | 207,673 |
| | — |
| | — |
| | 207,673 |
|
| Total Liabilities | 4,324,005 |
| | 941,601 |
| | (43,735 | ) | | 5,221,871 |
|
| | | | | | | | |
| Stockholders’ Equity: | | | | | | | |
| Apollo Global Management, Inc. stockholders’ equity: | | | | | | | |
| Series A Preferred Stock | 264,398 |
| | — |
| | — |
| | 264,398 |
|
| Series B Preferred Stock | 289,815 |
| | — |
| | — |
| | 289,815 |
|
| Additional paid in capital | 1,217,231 |
| | — |
| | — |
| | 1,217,231 |
|
| Retained earnings (accumulated deficit) | — |
| | 20,642 |
| | (20,642 | ) | | — |
|
| Accumulated other comprehensive loss | (6,546 | ) | | (4,684 | ) | | 4,403 |
| | (6,827 | ) |
| Total Apollo Global Management, Inc. stockholders’ equity | 1,764,898 |
| | 15,958 |
| | (16,239 | ) | | 1,764,617 |
|
| Non-Controlling Interests in consolidated entities | 6,032 |
| | 287,876 |
| | (27,892 | ) | | 266,016 |
|
| Non-Controlling Interests in Apollo Operating Group | 811,800 |
| | — |
| | — |
| | 811,800 |
|
| Total Stockholders’ Equity | 2,582,730 |
| | 303,834 |
| | (44,131 | ) | | 2,842,433 |
|
| Total Liabilities and Stockholders’ Equity | $ | 6,906,735 |
| | $ | 1,245,435 |
| | $ | (87,866 | ) | | $ | 8,064,304 |
|
APOLLO GLOBAL MANAGEMENT, INC.
CONSOLIDATING STATEMENTS OF FINANCIAL CONDITION (Unaudited)
(dollars in thousands, except share data)
| | | | | | | | | | | | | | | | | | | | | | | |
| As of September 30, 2020 |
| Apollo Global Management, Inc. and Consolidated Subsidiaries | | Consolidated Funds and VIEs | | Eliminations | | Consolidated |
| Assets: | | | | | | | |
| Cash and cash equivalents | $ | 1,838,640 | | | $ | 6 | | | $ | — | | | $ | 1,838,646 | |
| Restricted cash | 17,694 | | | — | | | — | | | 17,694 | |
| U.S. Treasury securities, at fair value | — | | | — | | | — | | | — | |
| Investments | 4,185,949 | | | 363 | | | (209,243) | | | 3,977,069 | |
| Assets of consolidated variable interest entities: | | | | | | | |
| Cash and cash equivalents | — | | | 805,529 | | | — | | | 805,529 | |
| Investments, at fair value | — | | | 10,156,109 | | | (255,516) | | | 9,900,593 | |
| Other assets | — | | | 189,795 | | | (6,197) | | | 183,598 | |
| Incentive fees receivable | 1,028 | | | — | | | — | | | 1,028 | |
| Due from related parties | 560,942 | | | — | | | (73,489) | | | 487,453 | |
| Deferred tax assets, net | 678,799 | | | — | | | — | | | 678,799 | |
| Other assets | 319,217 | | | — | | | (493) | | | 318,724 | |
| Lease assets | 301,779 | | | — | | | — | | | 301,779 | |
| Goodwill | 116,958 | | | — | | | — | | | 116,958 | |
| Total Assets | $ | 8,021,006 | | | $ | 11,151,802 | | | $ | (544,938) | | | $ | 18,627,870 | |
| Liabilities and Stockholders’ Equity | | | | | | | |
| Liabilities: | | | | | | | |
| Accounts payable and accrued expenses | $ | 143,664 | | | $ | — | | | $ | — | | | $ | 143,664 | |
| Accrued compensation and benefits | 221,185 | | | — | | | — | | | 221,185 | |
| Deferred revenue | 120,075 | | | — | | | — | | | 120,075 | |
| Due to related parties | 712,958 | | | — | | | (772) | | | 712,186 | |
| Profit sharing payable | 666,734 | | | — | | | — | | | 666,734 | |
| Debt | 3,151,247 | | | — | | | — | | | 3,151,247 | |
| Liabilities of consolidated variable interest entities: | | | | | | | |
| Debt, at fair value | — | | | 5,927,186 | | | (280,302) | | | 5,646,884 | |
| Notes payable | — | | | 2,567,353 | | | (103,086) | | | 2,464,267 | |
| Other liabilities | — | | | 870,202 | | | (63,869) | | | 806,333 | |
| Due to related parties | — | | | 23,435 | | | (23,435) | | | — | |
| Other liabilities | 169,522 | | | — | | | — | | | 169,522 | |
| Lease liabilities | 336,769 | | | — | | | — | | | 336,769 | |
| Total Liabilities | 5,522,154 | | | 9,388,176 | | | (471,464) | | | 14,438,866 | |
| | | | | | | |
| Stockholders’ Equity: | | | | | | | |
| Apollo Global Management, Inc. stockholders’ equity: | | | | | | | |
| Series A Preferred Stock | 264,398 | | | — | | | — | | | 264,398 | |
| Series B Preferred Stock | 289,815 | | | — | | | — | | | 289,815 | |
| Additional paid in capital | 929,524 | | | — | | | — | | | 929,524 | |
| Retained earnings (accumulated deficit) | (396,895) | | | 81,331 | | | (81,331) | | | (396,895) | |
| Accumulated other comprehensive loss | (4,218) | | | (917) | | | 7,857 | | | 2,722 | |
| Total Apollo Global Management, Inc. stockholders’ equity | 1,082,624 | | | 80,414 | | | (73,474) | | | 1,089,564 | |
| Non-Controlling Interests in consolidated entities | 5,694 | | | 1,683,212 | | | — | | | 1,688,906 | |
| Non-Controlling Interests in Apollo Operating Group | 1,410,534 | | | — | | | — | | | 1,410,534 | |
| Total Stockholders’ Equity | 2,498,852 | | | 1,763,626 | | | (73,474) | | | 4,189,004 | |
| Total Liabilities and Stockholders’ Equity | $ | 8,021,006 | | | $ | 11,151,802 | | | $ | (544,938) | | | $ | 18,627,870 | |
|
| | | | | | | | | | | | | | | |
| | As of December 31, 2018 |
| | Apollo Global Management, LLC and Consolidated Subsidiaries | | Consolidated Funds and VIEs | | Eliminations | | Consolidated |
| Assets: | | | | | | | |
| Cash and cash equivalents | $ | 609,743 |
| | $ | 4 |
| | $ | — |
| | $ | 609,747 |
|
| Restricted cash | 3,457 |
| | — |
| | — |
| | 3,457 |
|
| U.S. Treasury securities, at fair value | 392,932 |
| | — |
| | — |
| | 392,932 |
|
| Investments | 2,811,445 |
| | 558 |
| | (89,391 | ) | | 2,722,612 |
|
| Assets of consolidated variable interest entities: | | | | | | | |
| Cash and cash equivalents | — |
| | 49,671 |
| | — |
| | 49,671 |
|
| Investments, at fair value | — |
| | 1,175,985 |
| | (308 | ) | | 1,175,677 |
|
| Other assets | — |
| | 65,543 |
| | — |
| | 65,543 |
|
| Incentive fees receivable | 6,792 |
| | — |
| | — |
| | 6,792 |
|
| Due from related parties | 379,525 |
| | — |
| | (1,417 | ) | | 378,108 |
|
| Deferred tax assets | 306,094 |
| | — |
| | — |
| | 306,094 |
|
| Other assets | 192,806 |
| | — |
| | (637 | ) | | 192,169 |
|
| Goodwill | 88,852 |
| | — |
| | — |
| | 88,852 |
|
| Total Assets | $ | 4,791,646 |
| | $ | 1,291,761 |
| | $ | (91,753 | ) | | $ | 5,991,654 |
|
| Liabilities and Shareholders’ Equity | | | | | | | |
| Liabilities: | | | | | | | |
| Accounts payable and accrued expenses | $ | 70,878 |
| | $ | — |
| | $ | — |
| | $ | 70,878 |
|
| Accrued compensation and benefits | 73,583 |
| | — |
| | — |
| | 73,583 |
|
| Deferred revenue | 111,097 |
| | — |
| | — |
| | 111,097 |
|
| Due to related parties | 425,435 |
| | — |
| | — |
| | 425,435 |
|
| Profit sharing payable | 452,141 |
| | — |
| | — |
| | 452,141 |
|
| Debt | 1,360,448 |
| | — |
| | — |
| | 1,360,448 |
|
| Liabilities of consolidated variable interest entities: | | | | | | | |
| Debt, at fair value | — |
| | 899,651 |
| | (44,190 | ) | | 855,461 |
|
| Other liabilities | — |
| | 79,244 |
| | (267 | ) | | 78,977 |
|
| Due to related parties | — |
| | 1,787 |
| | (1,787 | ) | | — |
|
| Other liabilities | 111,794 |
| | — |
| | — |
| | 111,794 |
|
| Total Liabilities | 2,605,376 |
| | 980,682 |
| | (46,244 | ) | | 3,539,814 |
|
| | | | | | | | |
| Shareholders’ Equity: | | | | | | | |
| Apollo Global Management, LLC shareholders’ equity: | | | | | | | |
| Series A Preferred shares | 264,398 |
| | — |
| | — |
| | 264,398 |
|
| Series B Preferred shares | 289,815 |
| | — |
| | — |
| | 289,815 |
|
| Additional paid in capital | 1,299,418 |
| | — |
| | — |
| | 1,299,418 |
|
| Accumulated deficit | (473,275 | ) | | 17,673 |
| | (17,674 | ) | | (473,276 | ) |
| Accumulated other comprehensive loss | (3,925 | ) | | (2,479 | ) | | 2,245 |
| | (4,159 | ) |
| Total Apollo Global Management, LLC shareholders’ equity | 1,376,431 |
| | 15,194 |
| | (15,429 | ) | | 1,376,196 |
|
| Non-Controlling Interests in consolidated entities | 5,717 |
| | 295,885 |
| | (30,080 | ) | | 271,522 |
|
| Non-Controlling Interests in Apollo Operating Group | 804,122 |
| | — |
| | — |
| | 804,122 |
|
| Total Shareholders’ Equity | 2,186,270 |
| | 311,079 |
| | (45,509 | ) | | 2,451,840 |
|
| Total Liabilities and Shareholders’ Equity | $ | 4,791,646 |
| | $ | 1,291,761 |
| | $ | (91,753 | ) | | $ | 5,991,654 |
|
CONSOLIDATING STATEMENTS OF FINANCIAL CONDITION (Unaudited)
| |
ITEM 2. | MANAGEMENT’S DISCUSSION AND ANALYSIS OF FINANCIAL CONDITION AND RESULTS OF OPERATIONS |
(dollars in thousands, except share data)
| | | | | | | | | | | | | | | | | | | | | | | |
| As of December 31, 2019 |
| Apollo Global Management, LLC and Consolidated Subsidiaries | | Consolidated Funds and VIEs | | Eliminations | | Consolidated |
| Assets: | | | | | | | |
| Cash and cash equivalents | $ | 1,556,202 | | | $ | — | | | $ | — | | | $ | 1,556,202 | |
| Restricted cash | 19,779 | | | — | | | — | | | 19,779 | |
| U.S. Treasury securities, at fair value | 554,387 | | | — | | | — | | | 554,387 | |
| Investments | 3,704,332 | | | 595 | | | (95,068) | | | 3,609,859 | |
| Assets of consolidated variable interest entities: | | | | | | | |
| Cash and cash equivalents | — | | | 45,329 | | | — | | | 45,329 | |
| Investments, at fair value | — | | | 1,213,169 | | | — | | | 1,213,169 | |
| Other assets | — | | | 41,688 | | | — | | | 41,688 | |
| Incentive fees receivable | 2,414 | | | — | | | — | | | 2,414 | |
| Due from related parties | 415,622 | | | — | | | (553) | | | 415,069 | |
| Deferred tax assets | 473,165 | | | — | | | — | | | 473,165 | |
| Other assets | 327,009 | | | — | | | (560) | | | 326,449 | |
| Lease assets | 190,696 | | | — | | | — | | | 190,696 | |
| Goodwill | 93,911 | | | — | | | — | | | 93,911 | |
| Total Assets | $ | 7,337,517 | | | $ | 1,300,781 | | | $ | (96,181) | | | $ | 8,542,117 | |
| Liabilities and Stockholders’ Equity | | | | | | | |
| Liabilities: | | | | | | | |
| Accounts payable and accrued expenses | $ | 94,364 | | | $ | — | | | $ | — | | | $ | 94,364 | |
| Accrued compensation and benefits | 64,393 | | | — | | | — | | | 64,393 | |
| Deferred revenue | 84,639 | | | — | | | — | | | 84,639 | |
| Due to related parties | 501,387 | | | — | | | — | | | 501,387 | |
| Profit sharing payable | 758,669 | | | — | | | — | | | 758,669 | |
| Debt | 2,650,600 | | | — | | | — | | | 2,650,600 | |
| Liabilities of consolidated variable interest entities: | | | | | | | |
| Debt, at fair value | — | | | 893,711 | | | (43,564) | | | 850,147 | |
| Other liabilities | — | | | 79,762 | | | (190) | | | 79,572 | |
| Due to related parties | — | | | 923 | | | (923) | | | — | |
| Other liabilities | 210,740 | | | — | | | — | | | 210,740 | |
| Lease liabilities | 209,479 | | | — | | | — | | | 209,479 | |
| Total Liabilities | 4,574,271 | | | 974,396 | | | (44,677) | | | 5,503,990 | |
| | | | | | | |
| Stockholders’ Equity: | | | | | | | |
| Apollo Global Management, Inc. stockholders’ equity: | | | | | | | |
| Series A Preferred stock | 264,398 | | | — | | | — | | | 264,398 | |
| Series B Preferred stock | 289,815 | | | — | | | — | | | 289,815 | |
| Additional paid in capital | 1,302,587 | | | — | | | — | | | 1,302,587 | |
| Retained earnings (accumulated deficit) | — | | | 26,744 | | | (26,744) | | | — | |
| Accumulated other comprehensive loss | (4,331) | | | (3,379) | | | 3,132 | | | (4,578) | |
| Total Apollo Global Management, Inc. stockholders’ equity | 1,852,469 | | | 23,365 | | | (23,612) | | | 1,852,222 | |
| Non-Controlling Interests in consolidated entities | 6,776 | | | 303,020 | | | (27,892) | | | 281,904 | |
| Non-Controlling Interests in Apollo Operating Group | 904,001 | | | — | | | — | | | 904,001 | |
| Total Stockholders’ Equity | 2,763,246 | | | 326,385 | | | (51,504) | | | 3,038,127 | |
| Total Liabilities and Stockholders’ Equity | $ | 7,337,517 | | | $ | 1,300,781 | | | $ | (96,181) | | | $ | 8,542,117 | |
ITEM 2. MANAGEMENT’S DISCUSSION AND ANALYSIS OF FINANCIAL CONDITION AND RESULTS OF OPERATIONS
The following discussion should be read in conjunction with Apollo Global Management, Inc.’s condensed consolidated financial statements and the related notes included within this Quarterly Report on Form 10-Q. This discussion contains forward-looking statements that are subject to known and unknown risks and uncertainties. Actual results and the timing of events may differ significantly from those expressed or implied in such forward-looking statements due to a number of factors, including those included in the section entitled “Risk Factors” in the 20182019 Annual Report and quarterly report on Form 10-Q filed with the SEC on August 6, 2019.May 11, 2020. The highlights listed below have had significant effects on many items within our condensed consolidated financial statements and affect the comparison of the current period’s activity with those of prior periods.
General
Our Businesses
Founded in 1990, Apollo is a leading global alternative investment manager. We are a contrarian, value-oriented investment manager in credit, private equity and real assets with significant distressed expertise and a flexible mandate in the majority of our funds which enables our funds to invest opportunistically across a company’s capital structure. We raise, invest and manage funds on behalf of some of the world’s most prominent pension, endowment and sovereign wealth funds as well as other institutional and individual investors. Apollo is led by our Managing Partners, Leon Black, Joshua Harris and Marc Rowan, who have worked together for more than 3334 years and lead a team of 1,3521,657 employees, including 459547 investment professionals, as of September 30, 2019.2020.
Apollo conducts its business primarily in the United States and substantially all of its revenues are generated domestically. These businesses are conducted through the following three reportable segments:
| |
(i) | (i)Credit—primarily invests in non-control corporate and structured debt instruments including performing, stressed and distressed instruments across the capital structure; (ii)Private equity—primarily invests in control equity and related debt instruments, convertible securities and distressed debt instruments; and (iii)—primarily invests in non-control corporate and structured debt instruments including performing, stressed and distressed instruments across the capital structure; |
| |
(ii) | Private equity—primarily invests in control equity and related debt instruments, convertible securities and distressed debt instruments; and
|
| |
(iii) | Real assets—primarily invests in (i) real estate equity and infrastructure equity for the acquisition and recapitalization of real estate and infrastructure assets, portfolios, platforms and operating companies, (ii) real estate and infrastructure debt including first mortgage and mezzanine loans, preferred equity and commercial mortgage backed securities and (iii) European performing and non-performing loans, and unsecured consumer loans. |
These business segments are differentiated based on the varying investment strategies. The performance is measured by management on an unconsolidated basis because management makes operating decisions and assesses the performance of each of Apollo’s business segments based on financial and operating metrics and data that exclude the effects of consolidation of any of the managed funds.
Our financial results vary since performance fees, which generally constitute a large portion of the income we receive from the funds that we manage, as well as the transaction and advisory fees that we receive, can vary significantly from quarter to quarter and year to year. As a result, we emphasize long-term financial growth and profitability to manage our business.
In addition, the growth in our Fee-Generating AUM during the last year has primarily been in our credit segment.segment driven by continued growth in traditional funds and managed accounts as well as growth in asset management services to the insurance industry and in performing credit products. The average management fee rate for these new credit products is at market rates for such products and in certain cases is below our historical rates. Also, due to the complexity of these new product offerings, the Company has incurred and will continue to incur additional costs associated with managing these products. To date, these additional costs have been offset by realized economies of scale and ongoing cost management.
As of September 30, 2019,2020, we had total AUM of $322.7$433.1 billion across all of our businesses. More than 90% of our total AUM was in funds with a contractual life at inception of sevenfive years or more, and 50%60% of such AUM was in permanent capital vehicles.
The following table presents the gross and net returns for Apollo’s credit segment by category type:
| | | | | | | | | | | | | | | | | | | | | | | | |
| | | Gross Returns | | Net Returns |
| Category | | For the Three Months Ended September 30, 2020 | | For the Nine Months Ended September 30, 2020 | | For the Three Months Ended September 30, 2020 | | For the Nine Months Ended September 30, 2020 |
| Corporate Credit | | 3.5% | | 2.4% | | 3.2% | | 1.5% |
| Structured Credit | | 4.1% | | (3.4)% | | 4.1% | | (3.4)% |
| Direct Origination | | 3.7% | | 1.6% | | 2.8% | | (0.8)% |
As of December 31, 2017, Fund IX held its final closing, raising a total of $23.5 billion in third-party capital and approximately $1.2 billion of additional capital from Apollo and affiliated investors for total commitments of $24.7 billion. On December 31, 2013, Fund VIII held a final closing raising a total of $17.5 billion in third-party capital and approximately $880 million of additional capital from Apollo and affiliated investors, and as of September 30, 2019,2020, Fund VIII had $3.0$2.5 billion of
uncalled commitments remaining. Additionally, Fund VII held a final closing in December 2008, raising a total of $14.7 billion, and as of September 30, 2019,2020, Fund VII had $1.8 billion of uncalled commitments remaining. We have consistently produced attractive long-term investment returns in our traditional private equity funds, generating a 39% gross IRR and a 25%24% net IRR on a compound annual basis from inception through September 30, 2019.2020. Apollo’s private equity fund appreciationappreciation/(depreciation) was 3.6%8.0% and 11.1%(5.4%) for the three and nine months ended September 30, 2019,2020, respectively.
For our real assets segment, there was a total gross return was 4.6%of 3.4% and 9.3%(2.1)% for the three and nine months ended September 30, 2019,2020, respectively. TheIncluded in the gross return represents gross return forare U.S. Real Estate Fund I and U.S. Real Estate Fund II including co-investment capital, Asia Real Estate Fund including co-investment capital, the European Principal Finance funds, and infrastructure equity funds.
For further detail related to fund performance metrics across all of our businesses, see “—The Historical Investment Performance of Our Funds.”
Subsequent to December 31, 2018, the Company determined to change the business segment in which it reports certain funds and accounts to align its segment reporting with the manner in which such funds and accounts were managed. Effective January 1, 2019, the European Principal Finance Fund series, which has been historically reported in the credit segment, moved to the real assets segment. Several funds and accounts that generally invest in illiquid opportunistic investments and the latest fund in the Credit Opportunity Fund series, which have been historically reported in the credit segment, moved to the private equity segment. Certain commercial real estate mortgage loan assets, previously reported in the credit segment, moved to the real assets segment. These changes affected the composition, but not the determination,
Holding Company Structure
The diagram below depicts our current organizational structure: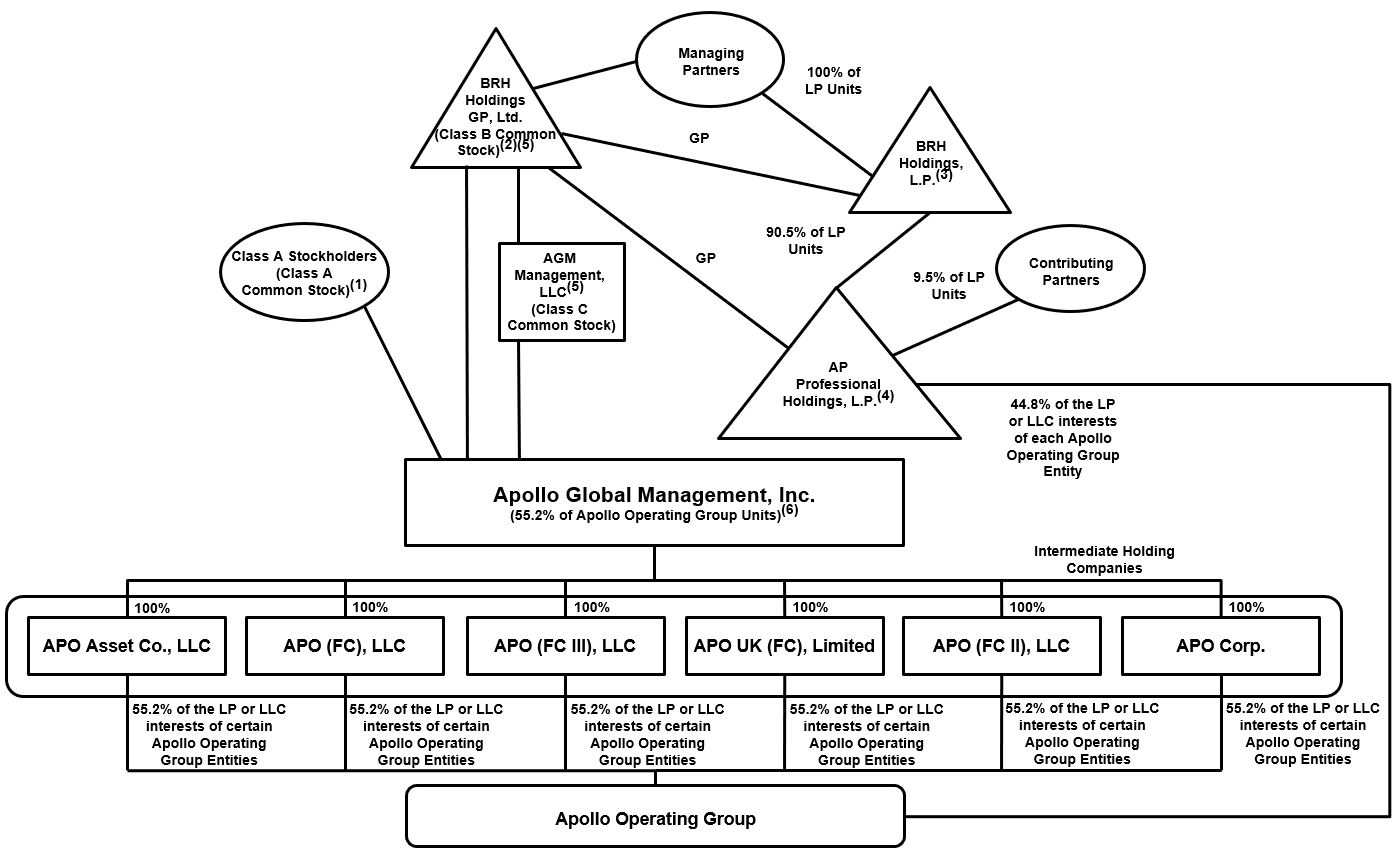
Note: The organizational structure chart above depicts a simplified version of the Apollo structure. It does not include all legal entities in the structure. Ownership percentages are as of November 4, 2020. As of November 4, 2020, there were 228,815,821 Class A shares, 1 2019.
| |
(1) | As of November 1, 2019, the Class A Common Stock represented 55.2% of the total voting power of the Class A Common Stock and the Class B Common Stock with respect to the limited matters upon which they are entitled to vote pursuant to the certificate of incorporation of AGM Inc. (“COI”). |
| |
(2) | Our Managing Partners own BRH Holdings GP, Ltd., which in turn holds our only outstanding share of Class B Common Stock. As of November 1, 2019, the Class B Common Stock represented 44.8% of the total voting power of the Class A Common Stock and the Class |
Class B share and 1 Class C share issued and outstanding, and 174,873,808 AOG Units held by Holdings that are exchangeable for Class A shares on a one-for-one basis. In addition, as of November 4, 2020, Athene held 29,154,519 AOG Units that are non-voting equity interests of the Apollo Operating Group and are not exchangeable for Class A shares.
(1)As of November 4, 2020, the Class A shares represented 9.2% of the total voting power of the Class A shares, the Class B Common Stockshare and the Class C share, voting together as a single class, with respect to General Stockholder Matters. As of November 4, 2020, the limitedClass A shares represented 52.8% of the total voting power of the Class A shares and the Class B share with respect to certain matters upon which they are entitled to vote pursuant to the certificate of incorporation of AGM Inc. (“COI”).
(2)Our Managing Partners own BRH Holdings GP, Ltd., which in turn holds our only outstanding Class B share. As of November 4, 2020, the Class B share represented 8.2% of the total voting power of the Class A shares, the Class B share and the Class C share, voting together as a single class, with respect to General Stockholder Matters, and a de minimisminimus economic interest in AGM Inc. As of November 4, 2020, the Class B share represented 47.2% of the total voting power of the Class A shares and the Class B share with respect to certain matters upon which they are entitled to vote as a single class.
| |
(3) | Through BRH Holdings, L.P., our Managing Partners indirectly beneficially own through estate planning vehicles, limited partner interests in Holdings. Our Managing Partners’ economic interests are represented by their indirect beneficial ownership, through Holdings, of 40.5% of the limited partner interests in the Apollo Operating Group. |
| |
(4) | Holdings owns 44.8% of the limited partner or limited liability company interests in each Apollo Operating Group entity. The AOG Units held by Holdings are exchangeable for Class A Common Stock. Our Managing Partners, through their interests in BRH and Holdings, beneficially own 40.5% of the AOG Units. Our Contributing Partners, through their interests in Holdings, beneficially own 4.2% of the AOG Units. |
| |
(5) | BRH Holdings GP, Ltd. is the sole member of AGM Management, LLC, our Former Manager. In connection with the Conversion, AGM Management, LLC was granted one issued and outstanding share of Class C Common Stock, which bestows to its holder certain management rights over AGM Inc. Except as required by the General Corporation Law of the State of Delaware (“DGCL”) or as expressly otherwise provided in the COI, for so long as certain conditions are satisfied (as set forth in the COI), the exclusive voting power for all purposes relating to holders of capital stock is vested in the holder of the Class C Common Stock. |
| |
(6) | Represents 55.2% of the limited partner or limited liability company interests in each Apollo Operating Group entity, held through the intermediate holding companies. AGM Inc. also indirectly owns 100% of the general partner interests in each Apollo Operating Group entity. |
(3)Through BRH Holdings, L.P., our Managing Partners indirectly beneficially own through estate planning vehicles, limited partner interests in Holdings. Our Managing Partners’ economic interests are represented by their indirect beneficial ownership, through Holdings, of 36.6% of the limited partner interests in the Apollo Operating Group.
(4)Holdings owns 40.4% of the limited partner or limited liability company interests in each Apollo Operating Group entity. The AOG Units held by Holdings are exchangeable for Class A shares. Our Managing Partners, through their interests in BRH and Holdings, beneficially own 36.6% of the AOG Units. Our Contributing Partners, through their interests in Holdings, beneficially own 3.8% of the AOG Units.
(5)BRH Holdings GP, Ltd. is the sole member of AGM Management, LLC, which in turns holds our only outstanding Class C share. The Class C share bestows to its holder certain management rights over AGM Inc. As of November 4, 2020, the Class C share represented 82.6% of the total voting power of the Class A shares, the Class B share and the Class C share, voting together as a single class, with respect to General Stockholder Matters, and a de minimus economic interest in AGM Inc.
(6)Represents 52.9% of the limited partner or limited liability company interests in each Apollo Operating Group entity, held through the intermediate holding companies. AGM Inc. also indirectly owns 100% of the general partner or managing member interests in each Apollo Operating Group entity.
(7)Represents 6.7% of the limited partner or limited liability company interests in each Apollo Operating Group entity held by Athene Holding Ltd. and/or its affiliates. AOG Units held by Athene are non-voting equity interests of the Apollo Operating Group and are not exchangeable for Class A shares.
Each of the Apollo Operating Group entities holds interests in different businesses or entities organized in different jurisdictions.
Our structure is designed to accomplish a number of objectives, the most important of which are as follows:
•Historically, we were a holding company that was qualified as a partnership for U.S. federal income tax purposes. Our intermediate holding companies enabled us to maintain our partnership status and to meet the qualifying income exception. Effective September 5, 2019, Apollo Global Management, LLC converted from a Delaware limited liability company to a Delaware corporation named Apollo Global Management, Inc.
•We have historically used multiple management companies to segregate operations for business, financial and other reasons. Going forward, we may increase or decrease the number of our management companies, partnerships or other entities within the Apollo Operating Group based on our views regarding the appropriate balance between (a) administrative convenience and (b) continued business, financial, tax and other optimization.
Conversion to a C Corporation
Effective September 5, 2019, Apollo Global Management, LLC converted from a Delaware limited liability company to a Delaware corporation named Apollo Global Management, Inc. Prior to the Conversion, a portion of the investment income, performance allocations and principal investment income we earned was not subject to corporate-level tax in the United States. Subsequent to the Conversion, we expect thatgenerally all of the income we earn will beis subject to U.S. corporate income taxes, which could result in an overall higher income tax expense (or benefit) in periods subsequent to the Conversion.
Business Environment
As a global investment manager, we are affected by numerous factors, including the condition of financial markets and the economy. Price fluctuations within equity, credit, commodity, foreign exchange markets, as well as interest rates, which may be volatile and mixed across geographies, can significantly impact the valuation of our funds’ portfolio companies and related income we may recognize.
In the U.S., the S&P 500 Index increased by 1.2%8% in the third quarter of 2019,2020, following an increase of 3.8%20% in the second quarter of 2019. Outside the U.S., global2020. Global equity markets declinedalso appreciated during the quarter, with the MSCI All Country World ex USA Index decreasing 0.9%increasing 5.01% following an increase of 4.1%15.6% in the second quarter of 2019.2020.
Conditions in the credit markets also have a significant impact on our business. Credit markets were positive in the third quarter of 2019,2020, with the BofAML HY Master II Index increasing 1.2%by 4.7%, while the S&P/LSTA Leveraged Loan Index increased 1.0%by 3.5%. The U.S. 10-year Treasury yield fellincreased during the quarter to 1.7%0.69%. On October 30, 2019,March 16, 2020, the Federal Reserve reduced the benchmark interest rate, lowering it for the thirdfirst time this year, to a target range of 0% to 0.25%, down from to a target range of 1.50% to 1.75%. at the end of 2019.
Foreign exchange rates can materially impact the valuations of our investments and those of our funds that are denominated in currencies other than the U.S. dollar. Relative to the U.S. dollar, the Euro depreciated 4.2% inappreciated 4.34% during the third quarter, of 2019, after appreciating by 1.4%1.81% in the second quarter of 2019,2020, while the British pound depreciated 3.2% in the third quarter of
2019, after depreciating 2.6%appreciated 4.21% in the second quarter of 2019.2020, after depreciating 0.10% in the second quarter of 2020. The price of crude oil depreciatedappreciated by 7.5%2.42% during the quarter ended September 30, 2019.2020.
In terms of economic conditions in the U.S., the Bureau of Economic Analysis reported real GDP increased at an annual rate of 1.9%33.1%, in the third quarter of 2019,2020, following an increasea decrease of 2.0%31.4% in the second quarter of 2019.2020. As of October 2019,2020, the International Monetary Fund estimated that the U.S. economy will contract by 4.3% in 2020 and expand by 2.4%3.1% in 2019 and 2.1% in 2020. Additionally,2021. The U.S. Bureau of Labor Statistics reported that the U.S. unemployment rate felldecreased to 3.5%7.9% as of September 30, 2019, a 50-year low.2020.
Regardless of the market or economic environment at any given time, Apollo relies on its contrarian, value-oriented approach to consistently invest capital on behalf of its fund investors by focusing on opportunities that management believes are often overlooked by other investors. As such, Apollo’s global integrated investment platform deployed $2.9$20.9 billion and $12.3$64.5 billion of capital through the funds it manages during the three and nine months ended September 30, 2019,2020, respectively.
Capital deployed by our commitment-based funds and SIAs that have a defined maturity date was $2.0 billion and $14.5 billion during the three and nine months ended September 30, 2020, respectively. We believe Apollo’s expertise in credit and its focus on nine core industry sectors, combined with more than 2930 years of investment experience, has allowed Apollo to respond quickly to changing environments. Apollo’s core industry sectors include chemicals, manufacturing and industrial, natural resources, consumer and retail, consumer services, business services, financial services, leisure, and media/telecom/technology. Apollo believes that these attributes have contributed to the success of its private equity funds investing in buyouts and credit opportunities during both expansionary and recessionary economic periods.
In general, institutional investors continue to allocate capital towards alternative investment managers for more attractive risk-adjusted returns in a low interest rate environment, and we believe the business environment remains generally accommodative to raise larger successor funds, launch new products, and pursue attractive strategic growth opportunities, such as continuing to grow the assets of our permanent capital vehicles. As such, Apollo had $15.9$13.0 billion and $53.1$109.5 billion of capital inflows during the three and nine months ended September 30, 2019,2020, respectively. While Apollo continues to attract capital inflows, it also continues to generate realizations for fund investors. Apollo returned $2.0$1.7 billion and $5.9$5.2 billion of capital and realized gains to the investors in the funds it manages during the three and nine months ended September 30, 2019,2020, respectively.
On October 20, 2020, at a regularly scheduled meeting of AGM Inc.’s board of directors, Apollo’s Chairman and Chief Executive Officer, Leon Black, requested that the conflicts committee of the board of directors (comprised of independent directors) retain outside counsel to conduct a thorough review of, and independently confirm, the information that Mr. Black has conveyed about his previous professional relationship with Mr. Jeffrey Epstein.The conflicts committee has retained Dechert LLP as outside counsel to conduct a thorough, independent review which will include interviewing individuals and examining relevant documents. Managing Business Performance
We believe that the presentation of Segment Distributable Earnings, or “Segment DE”,DE supplements a reader’s understanding of the economic operating performance of each of our segments.
Segment Distributable Earnings and Distributable Earnings
Segment Distributable EarningsDE is the key performance measure used by management in evaluating the performance of Apollo’s credit, private equity and real assets segments. See note 1617 to the condensed consolidated financial statements for more details regarding the components of Segment DE. Distributable Earnings (“DE”)DE represents Segment DE less estimated current corporate, local and non-U.S. taxes as well as the current payable under Apollo’s tax receivable agreement. DE is net of preferred dividends, if any, to the Series A and Series B Preferred Stockholders.preferred stockholders. DE excludes the impacts of the remeasurement of deferred tax assets and liabilities which arises from changes in estimated future tax rates. The economic assumptions and methodologies that impact the implied income tax provision are similar to those methodologies and certain assumptions used in calculating the income tax provision for Apollo’s condensed consolidated statements of operations under U.S. GAAP. Specifically, certain deductions considered in the income tax provision under U.S. GAAP, such as the deduction for transaction related charges and equity-based compensation, are taken into account for purposes of the implied tax provision. Management believes that excluding the remeasurement of the tax receivable agreement and deferred taxes from Segment DE and DE, respectively, is meaningful as it increases comparability between periods. Remeasurement of the tax receivable agreement and deferred taxes are estimates that may change due to changes in the interpretation of tax law.
We believe that Segment DE is helpful for an understanding of our business and that investors should review the same supplemental financial measure that management uses to analyze our segment performance. This measure supplements and should be considered in addition to and not in lieu of the results of operations discussed below in “—Overview of Results of Operations” that have been prepared in accordance with U.S. GAAP. See note 1617 to the condensed consolidated financial statements for more details regarding management’s consideration of Segment DE.
Fee Related Earnings and Fee Related EBITDA
Fee Related Earnings, or “FRE”, is derived from our segment reported results and refers to a component of Segment DE that is used as a supplemental performance measure. See note 1617 to the condensed consolidated financial statements for more details regarding the components of FRE.
Fee related EBITDA is a non-U.S. GAAP measure derived from our segment reported results and is used to assess the performance of our operations as well as our ability to service current and future borrowings. Fee related EBITDA represents FRE plus amounts for depreciation and amortization. “Fee related EBITDA +100% of net realized performance fees” represents Fee related EBITDA plus realized performance fees less realized profit sharing expense.
We use Segment DE, DE, FRE and Fee related EBITDA as measures of operating performance, not as measures of liquidity. These measures should not be considered in isolation or as a substitute for net income or other income data prepared in accordance with U.S. GAAP. The use of these measures without consideration of their related U.S. GAAP measures is not adequate due to the adjustments described above.
Segment Strategies
Apollo determined to change the business segment in which it reports certain funds and accounts to align its segment reporting with the manner in which such funds and accounts were managed. Effective January 1, 2019, the European Principal Finance Fund series, which has been historically reported in the credit segment, moved to the real assets segment. Several funds and accounts that generally invest in illiquid opportunistic investments and the latest fund in the Credit Opportunity Fund series, which have been historically reported in the credit segment, moved to the private equity segment. Certain commercial real estate mortgage loan assets, previously reported in the credit segment, moved to the real assets segment. These changes affected the composition, but not the determination, of Apollo’s reporting segments.
In order to better reflect the grouping of synergistic credit strategies across the funds, accounts and permanent capital vehicles managed within our credit segment, Apollo has re-aligned its credit segment around four main strategies: corporate credit, structured credit, direct origination and advisory and other. The underlying assets managed within, and strategies employed by, Apollo’s credit segment have not changed as a result of this re-alignment.
Apollo has re-aligned its private equity segment around three strategies: traditional private equity, hybrid capital and natural resources. Hybrid capital includes our recently launched hybrid value strategy, other funds and accounts that generally invest in illiquid opportunistic investments and the latest fund in the Credit Opportunity Fund series.
Apollo has re-aligned its real assets segment around three strategies: real estate, principal finance and infrastructure. Real estate includes the commercial real estate mortgage loan assets discussed above, among other types of real estate assets. Principal finance includes our European Principal Finance Fund series.
Operating Metrics
We monitor certain operating metrics that are common to the alternative investment management industry. These operating metrics include Assets Under Management, capital deployed and uncalled commitments.
Assets Under Management
The tables below present Fee-Generating and Non-Fee-Generating AUM by segment:
| | | | | | | | | | | | | | | | | | | | | | | |
| As of September 30, 2020 |
| Credit | | Private Equity | | Real Assets | | Total |
| | (in millions) |
| Fee-Generating | $ | 256,671 | | | $ | 43,921 | | | $ | 35,553 | | | $ | 336,145 | |
| Non-Fee-Generating | 55,434 | | | 32,880 | | | 8,686 | | | 97,000 | |
| Total Assets Under Management | $ | 312,105 | | | $ | 76,801 | | | $ | 44,239 | | | $ | 433,145 | |
| | | | | | | | | | | | | | | | | | | | | | | |
| As of September 30, 2019 |
| Credit | | Private Equity | | Real Assets | | Total |
| | (in millions) |
| Fee-Generating | $ | 168,096 | | | $ | 46,698 | | | $ | 28,235 | | | $ | 243,029 | |
| Non-Fee-Generating | 39,562 | | | 31,165 | | | 8,918 | | | 79,645 | |
| Total Assets Under Management | $ | 207,658 | | | $ | 77,863 | | | $ | 37,153 | | | $ | 322,674 | |
| | | | | | | | | | | | | | | | | | | | | | | |
| As of December 31, 2019 |
| Credit | | Private Equity | | Real Assets | | Total |
| | (in millions) |
| Fee-Generating | $ | 172,893 | | | $ | 43,826 | | | $ | 29,727 | | | $ | 246,446 | |
| Non-Fee-Generating | 42,637 | | | 32,962 | | | 9,060 | | | 84,659 | |
| Total Assets Under Management | $ | 215,530 | | | $ | 76,788 | | | $ | 38,787 | | | $ | 331,105 | |
|
| | | | | | | | | | | | | | | |
| | As of September 30, 2018 |
| | Credit | | Private Equity | | Real Assets | | Total |
| | (in millions) |
| Fee-Generating | $ | 134,003 |
| | $ | 47,065 |
| | $ | 22,541 |
| | $ | 203,609 |
|
| Non-Fee-Generating | 29,044 |
| | 31,960 |
| | 5,567 |
| | 66,571 |
|
| Total Assets Under Management | $ | 163,047 |
| | $ | 79,025 |
| | $ | 28,108 |
| | $ | 270,180 |
|
|
| | | | | | | | | | | | | | | |
| | As of December 31, 2018 |
| | Credit | | Private Equity | | Real Assets | | Total |
| | (in millions) |
| Fee-Generating | $ | 144,071 |
| | $ | 46,633 |
| | $ | 23,663 |
| | $ | 214,367 |
|
| Non-Fee-Generating | 30,307 |
| | 28,453 |
| | 7,132 |
| | 65,892 |
|
| Total Assets Under Management | $ | 174,378 |
| | $ | 75,086 |
| | $ | 30,795 |
| | $ | 280,259 |
|
The table below presents AUM with Future Management Fee Potential, which is a component of Non-Fee-Generating AUM, for each of Apollo’s three segments.
| | | | | | | | | | | | | | | | | |
| As of
September 30, 2020 | | As of
September 30, 2019 | | As of
December 31, 2019 |
| (in millions) |
| Credit | $ | 10,429 | | | $ | 8,581 | | | $ | 10,898 | |
| Private Equity | 9,450 | | | 9,259 | | | 9,441 | |
| Real Assets | 1,977 | | | 2,760 | | | 2,208 | |
| Total AUM with Future Management Fee Potential | $ | 21,856 | | | $ | 20,600 | | | $ | 22,547 | |
|
| | | | | | | | | | | |
| | As of
September 30, 2019 | | As of
September 30, 2018 | | As of
December 31, 2018 |
| | (in millions) |
| Credit | $ | 8,581 |
| | $ | 8,209 |
| | $ | 8,725 |
|
| Private Equity | 9,259 |
| | 10,646 |
| | 10,555 |
|
| Real Assets | 2,760 |
| | 1,392 |
| | 2,097 |
|
| Total AUM with Future Management Fee Potential | $ | 20,600 |
| | $ | 20,247 |
| | $ | 21,377 |
|
The following tables present the components of Performance Fee-Eligible AUM for each of Apollo’s three segments:
| | | | | | | | | | | | | | | | | | | | | | | |
| As of September 30, 2020 |
| Credit | | Private Equity | | Real Assets | | Total |
| | (in millions) |
Performance Fee-Generating AUM(1) | $ | 21,076 | | | $ | 20,690 | | | $ | 5,562 | | | $ | 47,328 | |
| AUM Not Currently Generating Performance Fees | 29,028 | | | 10,888 | | | 618 | | | 40,534 | |
| Uninvested Performance Fee-Eligible AUM | 9,551 | | | 27,647 | | | 4,621 | | | 41,819 | |
Total Performance Fee-Eligible AUM(2) | $ | 59,655 | | | $ | 59,225 | | | $ | 10,801 | | | $ | 129,681 | |
| | | | As of September 30, 2019 | | As of September 30, 2019 |
| | Credit | | Private Equity | | Real Assets | | Total | | Credit | | Private Equity | | Real Assets | | Total |
| | (in millions) | | (in millions) |
Performance Fee-Generating AUM(1) | $ | 36,397 |
| | $ | 24,263 |
| | $ | 4,339 |
| | $ | 64,999 |
| Performance Fee-Generating AUM(1) | $ | 36,397 | | | $ | 24,263 | | | $ | 4,339 | | | $ | 64,999 | |
| AUM Not Currently Generating Performance Fees | 13,997 |
| | 7,436 |
| | 1,136 |
| | 22,569 |
| AUM Not Currently Generating Performance Fees | 7,962 | | | 7,436 | | | 1,136 | | | 16,534 | |
| Uninvested Performance Fee-Eligible AUM | 8,179 |
| | 30,867 |
| | 4,540 |
| | 43,586 |
| Uninvested Performance Fee-Eligible AUM | 8,179 | | | 30,867 | | | 4,540 | | | 43,586 | |
| Total Performance Fee-Eligible AUM | $ | 58,573 |
| | $ | 62,566 |
| | $ | 10,015 |
| | $ | 131,154 |
| |
Total Performance Fee-Eligible AUM(2) | | Total Performance Fee-Eligible AUM(2) | $ | 52,538 | | | $ | 62,566 | | | $ | 10,015 | | | $ | 125,119 | |
| | | | | | | | | | | | | | | | | | | | | | | |
| As of December 31, 2019 |
| Credit | | Private Equity | | Real Assets | | Total |
| | (in millions) |
Performance Fee-Generating AUM(1) | $ | 38,560 | | | $ | 22,907 | | | $ | 5,179 | | | $ | 66,646 | |
| AUM Not Currently Generating Performance Fees | 6,889 | | | 8,112 | | | 589 | | | 15,590 | |
| Uninvested Performance Fee-Eligible AUM | 9,922 | | | 30,084 | | | 4,676 | | | 44,682 | |
Total Performance Fee-Eligible AUM(2) | $ | 55,371 | | | $ | 61,103 | | | $ | 10,444 | | | $ | 126,918 | |
(1)Performance Fee-Generating AUM of $0.5 billion, $2.6 billion and $3.2 billion as of September 30, 2020, September 30, 2019 and December 31, 2019, respectively, are above the hurdle rates or preferred returns and has been deferred to future periods when the fees are probable to not be significantly reversed.
(2)Effective as of June 30, 2020, performance fee-eligible AUM for Athora includes only capital commitments. Prior period performance fee-eligible AUM has been conformed to reflect this change in presentation.
|
| | | | | | | | | | | | | | | |
| | As of September 30, 2018 |
| | Credit | | Private Equity | | Real Assets | | Total |
| | (in millions) |
Performance Fee-Generating AUM(1) | $ | 33,308 |
| | $ | 26,153 |
| | $ | 2,065 |
| | $ | 61,526 |
|
| AUM Not Currently Generating Performance Fees | 6,707 |
| | 4,037 |
| | 1,426 |
| | 12,170 |
|
| Uninvested Performance Fee-Eligible AUM | 7,687 |
| | 35,004 |
| | 5,320 |
| | 48,011 |
|
| Total Performance Fee-Eligible AUM | $ | 47,702 |
| | $ | 65,194 |
| | $ | 8,811 |
| | $ | 121,707 |
|
|
| | | | | | | | | | | | | | | |
| | As of December 31, 2018 |
| | Credit | | Private Equity | | Real Assets | | Total |
| | (in millions) |
Performance Fee-Generating AUM(1) | $ | 23,574 |
| | $ | 22,974 |
| | $ | 2,019 |
| | $ | 48,567 |
|
| AUM Not Currently Generating Performance Fees | 17,857 |
| | 3,850 |
| | 2,662 |
| | 24,369 |
|
| Uninvested Performance Fee-Eligible AUM | 8,483 |
| | 35,749 |
| | 4,659 |
| | 48,891 |
|
| Total Performance Fee-Eligible AUM | $ | 49,914 |
| | $ | 62,573 |
| | $ | 9,340 |
| | $ | 121,827 |
|
| |
(1) | Performance Fee-Generating AUM of $2.6 billion, $4.7 billion and $0.2 billion as of September 30, 2019, September 30, 2018 and December 31, 2018, respectively, are above the applicable hurdle rates or preferred returns, but in accordance with the adoption of the revenue recognition standard effective January 1, 2018, recognition of performance fees associated with such Performance Fee-Generating AUM have been deferred to future periods when the fees are probable to not be significantly reversed. |
The following table presents AUM Not Currently Generating Performance Fees for funds that have invested capital for more than 24 months as of September 30, 20192020 and the corresponding appreciation required to reach the preferred return or high watermark in order to generate performance fees:
| | | | | | | | | | | | | | | | | | | | |
| Strategy / Fund | | Invested AUM Not Currently Generating Performance Fees | | Investment Period Active > 24 Months | | Appreciation Required to Achieve Performance Fees(1) |
| | (in millions) | | |
| Credit: | | | | | | |
| Corporate Credit | | $ | 21,717 | | | $ | 19,493 | | | 3% |
| Structured Credit | | 3,534 | | | 3,534 | | | 17% |
| Direct Origination | | 3,777 | | | 3,722 | | | 4% |
| | | | | | |
| Total Credit | | 29,028 | | | 26,749 | | | 5% |
| Private Equity: | | | | | | |
| Fund IX | | 5,615 | | | 5,615 | | | 8% |
| ANRP II | | 1,518 | | | 1,518 | | | 20% |
| Hybrid Capital | | 1,247 | | | 1,247 | | | 148% |
| Other PE | | 2,508 | | | 1,169 | | | 91% |
| Total Private Equity | | 10,888 | | | 9,549 | | | 38% |
| Real Assets: | | | | | | |
| Total Real Assets | | 618 | | | 289 | | | > 250bps |
| Total | | $ | 40,534 | | | $ | 36,587 | | | |
|
| | | | | | | | | | |
| Strategy / Fund | | Invested AUM Not Currently Generating Performance Fees | | Investment Period Active > 24 Months | | Appreciation Required to Achieve Performance Fees(1) |
| | | (in millions) | | |
| Credit: | | | | | | |
| Corporate Credit | | $ | 5,464 |
| | $ | 5,456 |
| | 3% |
| Structured Credit | | 1,772 |
| | 1,241 |
| | 9% |
| Direct Origination | | 171 |
| | — |
| | N/A |
| Advisory and Other | | 6,590 |
| | — |
| | N/A |
| Total Credit | | 13,997 |
| | 6,697 |
| | 4% |
| Private Equity: | | | | | | |
| ANRP I | | 314 |
| | 314 |
| | 107% |
| Hybrid Capital | | 2,290 |
| | 1,793 |
| | 89% |
| Other PE | | 4,832 |
| | 306 |
| | 66% |
| Total Private Equity | | 7,436 |
| | 2,413 |
| | 88% |
| Real Assets: | | | | | | |
| Total Real Assets | | 1,136 |
| | 403 |
| | > 250bps |
| Total | | $ | 22,569 |
| | $ | 9,513 |
| | |
| |
(1) | All investors in a given fund are considered in aggregate when calculating the appreciation required to achieve performance fees presented above. Appreciation required to achieve performance fees may vary by individual investor. Funds with an investment period less than 24 months are “N/A”. |
The components of Fee-Generating AUM by segment are presented below:
| | | | | | | | | | | | | | | | | | | | | | | |
| | As of September 30, 2020 |
| | Credit | | Private
Equity | | Real
Assets | | Total |
| | (in millions) |
| Fee-Generating AUM based on capital commitments | $ | 854 | | | $ | 27,113 | | | $ | 6,347 | | | $ | 34,314 | |
| Fee-Generating AUM based on invested capital | 2,816 | | | 15,220 | | | 2,278 | | | 20,314 | |
| Fee-Generating AUM based on gross/adjusted assets | 226,760 | | | 1,119 | | | 25,871 | | | 253,750 | |
| Fee-Generating AUM based on NAV | 26,241 | | | 469 | | | 1,057 | | | 27,767 | |
| Total Fee-Generating AUM | $ | 256,671 | | | $ | 43,921 | | (1) | $ | 35,553 | | | $ | 336,145 | |
| | | | | | | | | | | | | | | | | | | | | | | |
| | As of September 30, 2019 |
| | Credit | | Private
Equity | | Real
Assets | | Total |
| | (in millions) |
| Fee-Generating AUM based on capital commitments | $ | 3,888 | | | $ | 26,849 | | | $ | 4,886 | | | $ | 35,623 | |
| Fee-Generating AUM based on invested capital | 1,328 | | | 18,685 | | | 2,217 | | | 22,230 | |
| Fee-Generating AUM based on gross/adjusted assets | 140,251 | | | 743 | | | 20,253 | | | 161,247 | |
| Fee-Generating AUM based on NAV | 22,629 | | | 421 | | | 879 | | | 23,929 | |
| Total Fee-Generating AUM | $ | 168,096 | | | $ | 46,698 | | (1) | $ | 28,235 | | | $ | 243,029 | |
| |
(1) | (1) The weighted average remaining life of the traditional private equity funds as of the private equity funds as at September 30, 2019 was 80 months. |
|
| | | | | | | | | | | | | | | |
| | As of September 30, 2018 |
| | Credit | | Private Equity | | Real Assets | | Total |
| | (in millions) |
| Fee-Generating AUM based on capital commitments | $ | 3,403 |
| | $ | 26,982 |
| | $ | 5,440 |
| | $ | 35,825 |
|
| Fee-Generating AUM based on invested capital | 1,151 |
| | 18,610 |
| | 6,446 |
| | 26,207 |
|
| Fee-Generating AUM based on gross/adjusted assets | 109,276 |
| | 903 |
| | 10,604 |
| | 120,783 |
|
| Fee-Generating AUM based on NAV | 20,173 |
| | 570 |
| | 51 |
| | 20,794 |
|
| Total Fee-Generating AUM | $ | 134,003 |
| | $ | 47,065 |
| (1) | $ | 22,541 |
| | $ | 203,609 |
|
| |
(1) | The weighted average remaining life of the traditional private equity funds as of September 30, 2018 was 89 months. |
| | | | | | | | | | | | | | | | | | | | | | | |
| | As of December 31, 2019 |
| | Credit | | Private
Equity | | Real Assets | | Total |
| | (in millions) |
| Fee-Generating AUM based on capital commitments | $ | 3,921 | | | $ | 26,849 | | | $ | 4,932 | | | $ | 35,702 | |
| Fee-Generating AUM based on invested capital | 1,372 | | | 15,743 | | | 2,273 | | | 19,388 | |
| Fee-Generating AUM based on gross/adjusted assets | 144,028 | | | 814 | | | 21,403 | | | 166,245 | |
| Fee-Generating AUM based on NAV | 23,572 | | | 420 | | | 1,119 | | | 25,111 | |
| Total Fee-Generating AUM | $ | 172,893 | | | $ | 43,826 | | (1) | $ | 29,727 | | | $ | 246,446 | |
|
| | | | | | | | | | | | | | | |
| | As of December 31, 2018 |
| | Credit | | Private Equity | | Real Assets | | Total |
| | (in millions) |
| Fee-Generating AUM based on capital commitments | $ | 3,403 |
| | $ | 26,849 |
| | $ | 5,419 |
| | $ | 35,671 |
|
| Fee-Generating AUM based on invested capital | 1,020 |
| | 18,601 |
| | 6,659 |
| | 26,280 |
|
| Fee-Generating AUM based on gross/adjusted assets | 119,525 |
| | 776 |
| | 11,435 |
| | 131,736 |
|
| Fee-Generating AUM based on NAV | 20,123 |
| | 407 |
| | 150 |
| | 20,680 |
|
| Total Fee-Generating AUM | $ | 144,071 |
| | $ | 46,633 |
| (1) | $ | 23,663 |
| | $ | 214,367 |
|
| |
(1) | The weighted average remaining life of the traditional private equity funds as of December 31, 2018 was 89 months. |
The following table presents total AUM and Fee-Generating AUM amounts for our credit segment by category type:
|
| | | | | | | | | | | | | | | | | | | | | | | |
| | Total AUM | | Fee-Generating AUM |
| | As of
September 30, | | As of December 31, | | As of
September 30, | | As of December 31, |
| | 2019 | | 2018 | | 2018 | | 2019 | | 2018 | | 2018 |
| | (in millions) |
| Corporate Credit | $ | 111,184 |
| | $ | 90,908 |
| | $ | 98,188 |
| | $ | 93,132 |
| | $ | 77,848 |
| | $ | 82,812 |
|
| Structured Credit | 50,388 |
| | 40,996 |
| | 42,693 |
| | 44,053 |
| | 36,038 |
| | 37,932 |
|
| Direct Origination | 18,249 |
| | 14,296 |
| | 16,715 |
| | 16,696 |
| | 13,306 |
| | 14,395 |
|
| Advisory and Other | 27,837 |
| | 16,847 |
| | 16,782 |
| | 14,215 |
| | 6,811 |
| | 8,932 |
|
| Total | $ | 207,658 |
| | $ | 163,047 |
| | $ | 174,378 |
| | $ | 168,096 |
| | $ | 134,003 |
| | $ | 144,071 |
|
Investment Management Agreement - ISG | | | | | | | | | | | | | | | | | | | | | | | | | | | | | | | | | | | |
| | Total AUM | | Fee-Generating AUM |
| | As of
September 30, | | As of
December 31, | | As of
September 30, | | As of
December 31, |
| 2020 | | 2019 | | 2019 | | 2020 | | 2019 | | 2019 |
| | (in millions) |
| Corporate Credit | $ | 156,440 | | | $ | 111,184 | | | $ | 110,659 | | | $ | 122,895 | | | $ | 93,132 | | | $ | 92,601 | |
| Structured Credit | 56,451 | | | 50,388 | | | 52,735 | | | 48,445 | | | 44,053 | | | 45,453 | |
| Direct Origination | 24,568 | | | 18,249 | | | 24,234 | | | 21,824 | | | 16,696 | | | 22,031 | |
| Advisory and Other | 74,646 | | | 27,837 | | | 27,902 | | | 63,507 | | | 14,215 | | | 12,808 | |
| Total | $ | 312,105 | | | $ | 207,658 | | | $ | 215,530 | | | $ | 256,671 | | | $ | 168,096 | | | $ | 172,893 | |
Apollo, through its consolidated subsidiary, ISG, provides asset management services to Athene with respect to assets in the Athene Accounts, including asset allocation services, direct asset management services, asset and liability matching management, mergers and acquisitions, asset diligence, hedging and other asset management services and receives management fees for providing these services. The Company, through ISG, also provides sub-allocation services with respect to a portion of the assets in the Athene Accounts. See note 1415 to the condensed consolidated financial statements for more details regarding the fee rates of the investment management and sub-allocation fee arrangements with respect to the assets in the Athene Accounts.
The following table presents the aggregate Athene Sub-Allocated Total AUM by asset class:
| | | | | | | | | | | | | | | | | |
| As of
September 30, | | As of December 31, |
| | 2020 | | 2019 | | 2019 |
| | (in millions) |
| Core Assets | $ | 48,590 | | | $ | 33,524 | | | $ | 32,346 | |
| Core Plus Assets | 39,992 | | | 31,848 | | | 30,132 | |
| Yield Assets | 56,930 | | | 45,953 | | | 48,552 | |
| High Alpha | 6,776 | | | 4,286 | | | 5,051 | |
| Cash, Treasuries, Equity and Alternatives | 20,688 | | | 9,873 | | | 14,220 | |
Total (1) | $ | 172,976 | | | $ | 125,484 | | | $ | 130,301 | |
|
| | | |
| | As of September 30, 2019 |
| | (in millions) |
| Core Assets | $ | 33,524 |
|
| Core Plus Assets | 31,848 |
|
| Yield Assets | 45,953 |
|
| High Alpha | 4,286 |
|
| Cash, Treasuries, Equity and Alternatives | 9,873 |
|
| Total | $ | 125,484 |
|
(1)Includes $39.2 billion, $10.3 billion and $10.0 billion of gross assets related to Athene Co-Invest Reinsurance Affiliate 1A Ltd. and $2.5 billion, $1.5 billionand $2.6 billion of unfunded commitments related to Apollo/Athene Dedicated Investment AdvisoryProgram (“ADIP”) as of September 30, 2020, September 30, 2019 and Sub-Advisory Agreements - AAMEDecember 31, 2019, respectively.
Apollo, through AAME,ISGI, provides investment advisory services with respect to certain assets in certain portfolio companies of Apollo funds and sub-advises the Athora Accounts and broadly refers to “Athora Sub-Advised” assets as those assets in the Athora Accounts which the Company explicitly sub-advises as well as those assets in the Athora Accounts which are invested directly in funds and investment vehicles Apollo manages. The Company refers to the portion of the Athora AUM
that is not Athora Sub-Advised AUM as “Athora Non-Sub Advised” AUM. See note 1415 to the condensed consolidated financial statements for more details regarding the fee arrangements with respect to the assets in the Athora Accounts.
The following table presents Athora Sub-Advised and Athora Non-Sub-Advised AUM:
| | | | As of
September 30, | | As of December 31, | | As of
September 30, | | As of
December 31, |
| | 2019 | | 2018 | | 2018 | | 2020 | | 2019 | | 2019 |
| | (in millions) | | (in millions) |
| Sub-Advised AUM | $ | 3,667 |
| | $ | 1,962 |
| | $ | 3,032 |
| Sub-Advised AUM | $ | 5,563 | | | $ | 3,667 | | | $ | 3,877 | |
| Non-Sub-Advised AUM | 10,382 |
| | 6,040 |
| | 4,952 |
| Non-Sub-Advised AUM | 59,423 | | | 10,382 | | | 10,019 | |
| Total AUM | $ | 14,049 |
| | $ | 8,002 |
| | $ | 7,984 |
| Total AUM | $ | 64,986 | | | $ | 14,049 | | | $ | 13,896 | |
The following table presents total AUM and Fee-Generating AUM amounts for our private equity segment:
| | | | Total AUM | | Fee-Generating AUM | | Total AUM | | Fee-Generating AUM |
| | As of
September 30, | | As of December 31, | | As of
September 30, | | As of December 31, | | As of
September 30, | | As of
December 31, | | As of
September 30, | | As of
December 31, |
| | 2019 | | 2018 | | 2018 | | 2019 | | 2018 | | 2018 | | 2020 | | 2019 | | 2019 | | 2020 | | 2019 | | 2019 |
| | (in millions) | | (in millions) |
| Private Equity Funds | $ | 62,781 |
| | $ | 65,189 |
| | $ | 60,680 |
| | $ | 39,446 |
| | $ | 39,573 |
| | $ | 39,519 |
| Private Equity Funds | $ | 61,063 | | | $ | 62,781 | | | $ | 62,139 | | | $ | 35,932 | | | $ | 39,446 | | | $ | 36,947 | |
| Hybrid Capital | 9,108 |
| | 9,025 |
| | 8,886 |
| | 3,154 |
| | 3,396 |
| | 3,025 |
| Hybrid Capital | 10,842 | | | 9,108 | | | 9,113 | | | 3,829 | | | 3,154 | | | 2,961 | |
| Natural Resources | 5,974 |
| | 4,811 |
| | 5,520 |
| | 4,098 |
| | 4,096 |
| | 4,089 |
| Natural Resources | 4,896 | | | 5,974 | | | 5,536 | | | 4,160 | | | 4,098 | | | 3,918 | |
| Total | $ | 77,863 |
| | $ | 79,025 |
| | $ | 75,086 |
| | $ | 46,698 |
| | $ | 47,065 |
| | $ | 46,633 |
| Total | $ | 76,801 | | | $ | 77,863 | | | $ | 76,788 | | | $ | 43,921 | | | $ | 46,698 | | | $ | 43,826 | |
The following table presents total AUM and Fee-Generating AUM amounts for our real assets segment:
| | | | | | | | | | | | | | | | | | | | | | | | | | | | | | | | | | | |
| | Total AUM | | Fee-Generating AUM |
| | As of
September 30, | | As of
December 31, | | As of
September 30, | | As of
December 31, |
| 2020 | | 2019 | | 2019 | | 2020 | | 2019 | | 2019 |
| | (in millions) |
| Real Estate | $ | 32,554 | | | $ | 28,076 | | | $ | 29,401 | | | $ | 26,630 | | | $ | 21,384 | | | $ | 22,890 | |
| Principal Finance | 6,940 | | | 6,934 | | | 7,181 | | | 5,056 | | | 5,113 | | | 5,102 | |
| Infrastructure | 4,745 | | | 2,143 | | | 2,205 | | | 3,867 | | | 1,738 | | | 1,735 | |
| Total | $ | 44,239 | | | $ | 37,153 | | | $ | 38,787 | | | $ | 35,553 | | | $ | 28,235 | | | $ | 29,727 | |
|
| | | | | | | | | | | | | | | | | | | | | | | |
| | Total AUM | | Fee-Generating AUM |
| | As of
September 30, | | As of December 31, | | As of
September 30, | | As of December 31, |
| | 2019 | | 2018 | | 2018 | | 2019 | | 2018 | | 2018 |
| | (in millions) |
| Real Estate | $ | 28,076 |
| | $ | 20,359 |
| | $ | 21,971 |
| | $ | 21,384 |
| | $ | 16,252 |
| | $ | 16,873 |
|
| Principal Finance | 6,934 |
| | 7,119 |
| | 7,050 |
| | 5,113 |
| | 5,659 |
| | 5,468 |
|
| Infrastructure | 2,143 |
| | 630 |
| | 1,774 |
| | 1,738 |
| | 630 |
| | 1,322 |
|
| Total | $ | 37,153 |
| | $ | 28,108 |
| | $ | 30,795 |
| | $ | 28,235 |
| | $ | 22,541 |
| | $ | 23,663 |
|
The following tables summarize changes in total AUM for each of Apollo’s three segments:
| | | | | | | | | | | | | | | | | | | | | | | | | | | | | | | | | | | | | | | | | | | | | | | |
| For the Three Months Ended September 30, |
| | 2020 | | 2019 |
| Credit | | Private Equity | | Real Assets | | Total | | Credit | | Private Equity | | Real Assets | | Total |
| | |
Change in Total AUM(1): | | | | | | | | | | | | | | | |
| Beginning of Period | $ | 300,454 | | | $ | 73,301 | | | $ | 39,851 | | | $ | 413,606 | | | $ | 201,216 | | | $ | 77,148 | | | $ | 33,498 | | | $ | 311,862 | |
Inflows (2) | 7,110 | | | 1,701 | | | 4,147 | | | 12,958 | | | 8,595 | | | 516 | | | 3,906 | | | 13,017 | |
Outflows(3) | (4,959) | | | (108) | | | — | | | (5,067) | | | (3,647) | | | (13) | | | — | | | (3,660) | |
| Net Flows | 2,151 | | | 1,593 | | | 4,147 | | | 7,891 | | | 4,948 | | | 503 | | | 3,906 | | | 9,357 | |
| Realizations | (419) | | | (1,082) | | | (227) | | | (1,728) | | | (615) | | | (989) | | | (357) | | | (1,961) | |
Market Activity(2)(4) | 9,919 | | | 2,989 | | | 468 | | | 13,376 | | | 2,109 | | | 1,201 | | | 106 | | | 3,416 | |
| End of Period | $ | 312,105 | | | $ | 76,801 | | | $ | 44,239 | | | $ | 433,145 | | | $ | 207,658 | | | $ | 77,863 | | | $ | 37,153 | | | $ | 322,674 | |
(1)At the individual segment level, inflows include new subscriptions, commitments, capital raised, other increases in available capital, purchases, acquisitions, and portfolio company appreciation. Outflows represent redemptions, other decreases in available capital and portfolio company depreciation. Realizations represent fund distributions of realized proceeds. Market activity represents gains (losses), the impact of foreign exchange rate fluctuations and other income.
(2)For the three months ended September 30, 2020, market activity includes mark-to-market changes and investment income of Athene, which had previously been reported as inflows. Prior period numbers have been recast to conform to the current presentation.
(3)Outflows for Total AUM include redemptions of $0.7 billion and $0.3 billion during the three months ended September 30, 2020 and 2019, respectively.
(4)Includes foreign exchange impacts of $3.2 billion, $88.6 million and $172.3 million for credit, private equity and real assets, respectively, during the three months ended September 30, 2020, and foreign exchange impacts of $(1.6) billion, $(106.0) million and $(160.7) million for credit, private equity and real assets, respectively, during the three months ended September 30, 2019.
| | | | | | | | | | | | | | | | | | | | | | | | | | | | | | | | | | | | | | | | | | | | | | | |
| For the Nine Months Ended September 30, |
| | 2020 | | 2019 |
| Credit | | Private Equity | | Real Assets | | Total | | Credit | | Private Equity | | Real Assets | | Total |
| | (in millions) |
Change in Total AUM(1): | | | | | | | | | | | | | | | |
| Beginning of Period | $ | 215,530 | | | $ | 76,788 | | | $ | 38,787 | | | $ | 331,105 | | | $ | 174,378 | | | $ | 75,086 | | | $ | 30,795 | | | $ | 280,259 | |
Inflows(2) | 98,726 | | | 3,949 | | | 6,776 | | | 109,451 | | | 31,797 | | | 3,361 | | | 7,302 | | | 42,460 | |
Outflows(3) | (11,585) | | | (169) | | | (517) | | | (12,271) | | | (8,927) | | | (154) | | | (399) | | | (9,480) | |
| Net Flows | 87,141 | | | 3,780 | | | 6,259 | | | 97,180 | | | 22,870 | | | 3,207 | | | 6,903 | | | 32,980 | |
| Realizations | (1,584) | | | (2,785) | | | (817) | | | (5,186) | | | (1,335) | | | (3,541) | | | (1,025) | | | (5,901) | |
Market Activity(2)(4) | 11,018 | | | (982) | | | 10 | | | 10,046 | | | 11,745 | | | 3,111 | | | 480 | | | 15,336 | |
| End of Period | $ | 312,105 | | | $ | 76,801 | | | $ | 44,239 | | | $ | 433,145 | | | $ | 207,658 | | | $ | 77,863 | | | $ | 37,153 | | | $ | 322,674 | |
(1)At the individual segment level, inflows include new subscriptions, commitments, capital raised, other increases in available capital, purchases, acquisitions and portfolio company appreciation. Outflows represent redemptions, other decreases in available capital and portfolio company depreciation. Realizations represent fund distributions of realized proceeds. Market activity represents gains (losses), the impact of foreign exchange rate fluctuations and other income.
(2)For the nine months ended September 30, 2020, market activity includes mark-to-market changes and investment income of Athene, which had previously been reported as inflows. Prior period numbers have been recast to conform to the current presentation.
(3)Outflows for Total AUM include redemptions of $1.9 billion and $2.3 billion during the nine months ended September 30, 2020 and 2019, respectively.
(4)Includes foreign exchange impacts of $2.7 billion, $119.2 million and $133.1 million for credit, private equity and real assets, respectively, during the nine months ended September 30, 2020, and foreign exchange impacts of $(1.6) billion, $(133.8) million and $(138.2) million for credit, private equity and real assets, respectively, during the nine months ended September 30, 2019.
|
| | | | | | | | | | | | | | | | | | | | | | | | | | | | | | | |
| | For the Three Months Ended September 30, |
| | 2019 | | 2018 |
| | Credit | | Private Equity | | Real Assets | | Total | | Credit | | Private Equity | | Real Assets | | Total |
| | |
Change in Total AUM(1): | | | | | | | | | | | | | | | |
| Beginning of Period | $ | 201,216 |
| | $ | 77,148 |
| | $ | 33,498 |
| | $ | 311,862 |
| | $ | 163,222 |
| | $ | 78,867 |
| | $ | 27,363 |
| | $ | 269,452 |
|
| Inflows | 11,505 |
| | 516 |
| | 3,906 |
| | 15,927 |
| | 4,290 |
| | 509 |
| | 1,098 |
| | 5,897 |
|
Outflows(2) | (3,647 | ) | | (13 | ) | | — |
| | (3,660 | ) | | (4,651 | ) | | (16 | ) | | — |
| | (4,667 | ) |
| Net Flows | 7,858 |
| | 503 |
| | 3,906 |
| | 12,267 |
| | (361 | ) | | 493 |
| | 1,098 |
| | 1,230 |
|
| Realizations | (615 | ) | | (989 | ) | | (357 | ) | | (1,961 | ) | | (347 | ) | | (1,016 | ) | | (386 | ) | | (1,749 | ) |
Market Activity(3) | (801 | ) | | 1,201 |
| | 106 |
| | 506 |
| | 533 |
| | 681 |
| | 33 |
| | 1,247 |
|
| End of Period | $ | 207,658 |
| | $ | 77,863 |
| | $ | 37,153 |
| | $ | 322,674 |
| | $ | 163,047 |
| | $ | 79,025 |
| | $ | 28,108 |
| | $ | 270,180 |
|
| |
(1) | At the individual segment level, inflows include new subscriptions, commitments, capital raised, other increases in available capital, purchases, acquisitions, and portfolio company appreciation. Outflows represent redemptions, other decreases in available capital and portfolio company depreciation. Realizations represent fund distributions of realized proceeds. Market activity represents gains (losses), the impact of foreign exchange rate fluctuations and other income. |
| |
(2) | Outflows for Total AUM include redemptions of $0.3 billion and $1.3 billion during the three months ended September 30, 2019 and 2018, respectively. |
| |
(3) | Includes foreign exchange impacts of $(1.6) billion, $(106.0) million and $(160.7) million for credit, private equity and real assets, respectively, during the three months ended September 30, 2019, and foreign exchange impacts of $(330.2) million, $(19.2) million and $(14.2) million for credit, private equity and real assets, respectively, during the three months ended September 30, 2018. |
|
| | | | | | | | | | | | | | | | | | | | | | | | | | | | | | | |
| | For the Nine Months Ended September 30, |
| | 2019 | | 2018 |
| | Credit | | Private Equity | | Real Assets | | Total | | Credit | | Private Equity | | Real Assets | | Total |
| | (in millions) |
Change in Total AUM(1): | | | | | | | | | | | | | | | |
| Beginning of Period | $ | 174,378 |
| | $ | 75,086 |
| | $ | 30,795 |
| | $ | 280,259 |
| | $ | 144,807 |
| | $ | 80,694 |
| | $ | 23,427 |
| | $ | 248,928 |
|
| Inflows | 42,406 |
| | 3,361 |
| | 7,302 |
| | 53,069 |
| | 30,857 |
| | 3,778 |
| | 6,301 |
| | 40,936 |
|
Outflows(2) | (8,926 | ) | | (154 | ) | | (399 | ) | | (9,479 | ) | | (11,236 | ) | | (175 | ) | | — |
| | (11,411 | ) |
| Net Flows | 33,480 |
| | 3,207 |
| | 6,903 |
| | 43,590 |
| | 19,621 |
| | 3,603 |
| | 6,301 |
| | 29,525 |
|
| Realizations | (1,335 | ) | | (3,541 | ) | | (1,025 | ) | | (5,901 | ) | | (2,234 | ) | | (4,623 | ) | | (1,855 | ) | | (8,712 | ) |
Market Activity(3) | 1,135 |
| | 3,111 |
| | 480 |
| | 4,726 |
| | 853 |
| | (649 | ) | | 235 |
| | 439 |
|
| End of Period | $ | 207,658 |
| | $ | 77,863 |
| | $ | 37,153 |
| | $ | 322,674 |
| | $ | 163,047 |
| | $ | 79,025 |
| | $ | 28,108 |
| | $ | 270,180 |
|
| |
(1) | At the individual segment level, inflows include new subscriptions, commitments, capital raised, other increases in available capital, purchases, acquisitions and portfolio company appreciation. Outflows represent redemptions, other decreases in available capital and portfolio company depreciation. Realizations represent fund distributions of realized proceeds. Market activity represents gains (losses), the impact of foreign exchange rate fluctuations and other income. |
| |
(2) | Outflows for Total AUM include redemptions of $2.3 billion and $1.6 billion during the nine months ended September 30, 2019 and 2018, respectively. |
| |
(3) | Includes foreign exchange impacts of $(1.6) billion, $(133.8) million and $(138.2) million for credit, private equity and real assets, respectively, during the nine months ended September 30, 2019, and foreign exchange impacts of $(1.1) billion, $(66.2) million and $(56.2) million for credit, private equity and real assets, respectively, during the nine months ended September 30, 2018. |
Three Months Ended September 30, 2020
Total AUM was $322.7$433.1 billion at September 30, 2019,2020, an increase of $10.8$19.5 billion, or 3.5%4.7%, compared to $311.9$413.6 billion at June 30, 2019.2020. The net increase was primarily due to client transactions which increased insurance assets under management and market activity of $13.4 billion. More specifically, the net increase was due to:
•Net flows of $12.3$7.9 billion primarily related to:
•a $7.9 billion increase related to funds we manage in the credit segment primarily consisting of an increase in AUM relating to Athene of $7.2 billion driven by portfolio company activity, subscriptions of $1.9 billion across the corporate credit funds we manage and an increase in leverage of $0.7 billion throughout the segment; these increases were partially offset by net segment transfers of $2.7 billion;
a $3.9$4.1 billion increase related to funds we manage in the real assets segment primarily consisting of $3.0 billion of net segment transfers of $2.6 billion and an increase in leverage of $1.1 billion related to the real estate funds we manage; and
a $0.5 billion increase related to funds we manage in the private equity segment primarily consisting of an increase in leverage of $0.4 billion related to Fund IX.
Market activity of $0.5 billion primarily related to $1.2 billion of appreciation in the funds we manage in the private equity segment, partially offset by $0.8 billion of depreciation in the funds we manage in the credit segment.subscriptions; and
Offsetting these increases were:
Realizations of $2.0 billion primarily related to:
$1.0 billion related to funds we manage in the private equity segment primarily consisting of distributions from Fund VIII and other traditional private equity funds of $0.6 billion and $0.2 billion, respectively;
$0.6 billion related to funds we manage in the credit segment primarily consisting of distributions from the structured credit funds we manage; and
$0.4 billion related to funds we manage in the real assets segment related to the real estate funds we manage.
Total AUM was $322.7 billion at September 30, 2019, an increase of $42.4 billion, or 15.1%, compared to $280.3 billion at December 31, 2018. The net increase was primarily due to:
Net flows of $43.6 billion primarily related to:
•a $33.5$2.2 billion increase related to funds we manage in the credit segment primarily consisting of (i) an increase in AUM relating to Athene of $16.7$5.1 billion as a result of portfolio company activity, (ii) an increase in AUM in the advisory and other category as a result of the acquisition of Aspen Insurance Holdings Limited and Athora’s acquisition of Generali Belgium, which added approximately $7.5 billion and $6.5(ii) $1.9 billion of AUM, respectively, and (iii) subscriptions of $6.0 billion across the corporate credit funds we manage; these increases were offset by net segment transfers of $5.3 billion;
a $6.9$3.6 billion increase related to funds we manage in the real assets segment primarily consisting of net segment transfers of $5.3 billiontransfers; and an increase in leverage of $1.1 billion related to the real estate funds we manage; and
•a $3.2$1.6 billion increase related to funds we manage in the private equity segment primarily consisting of $1.1 billion of subscriptions related to the private equity funds we manage.
•Market activity of $2.7$13.4 billion related to (i) $9.9 billion of appreciation in the funds we manage in the credit segment, primarily related to certain traditional private equity fund co-investments and certain hybrid capital funds of $1.4 billion and $0.8 billion, respectively.
Marketthe market activity of $4.7 billion primarily related to $3.1Athene, (ii) $3.0 billion of appreciation in the funds we manage in the private equity segment, primarily related to Fund VIII, as well as $1.1 billion and(iii) $0.5 billion of appreciation in the funds we manage in the credit and real assets segments, respectively.segment.
Offsetting these increases were:
•Realizations of $5.9$1.7 billion primarily related to:
$3.5to $1.1 billion related to funds we manage in the private equity segment primarily consisting of distributions of $1.2 billion, $1.1 billion and $0.5 billion from Fund VIII, Fund VI and certain hybrid capital funds, respectively;VIII.
$1.3 billion related to funds we manage in the credit segment primarily consisting of distributions from the direct origination and structured credit funds we manage; and Nine Months Ended September 30, 2020
$1.0 billion related to funds we manage in the real assets segment primarily consisting of distributions from the principal finance and real estate funds we manage.
The following tables summarize changes in Fee-Generating AUM for each of Apollo’s three segments:
|
| | | | | | | | | | | | | | | | | | | | | | | | | | | | | | | |
| | For the Three Months Ended September 30, |
| | 2019 | | 2018 |
| | Credit | | Private Equity | | Real Assets | | Total | | Credit | | Private Equity | | Real Assets | | Total |
| | |
Change in Fee-Generating AUM(1): | | | | | | | | | | | | | | |
| Beginning of Period | $ | 163,089 |
| | $ | 47,082 |
| | $ | 25,965 |
| | $ | 236,136 |
| | $ | 132,602 |
| | $ | 47,835 |
| | $ | 21,798 |
| | $ | 202,235 |
|
| Inflows | 9,464 |
| | 94 |
| | 2,653 |
| | 12,211 |
| | 3,765 |
| | 277 |
| | 1,110 |
| | 5,152 |
|
Outflows(2) | (3,883 | ) | | (266 | ) | | (241 | ) | | (4,390 | ) | | (2,810 | ) | | (844 | ) | | (52 | ) | | (3,706 | ) |
| Net Flows | 5,581 |
| | (172 | ) | | 2,412 |
| | 7,821 |
| | 955 |
| | (567 | ) | | 1,058 |
| | 1,446 |
|
| Realizations | (265 | ) | | (251 | ) | | (78 | ) | | (594 | ) | | (119 | ) | | (243 | ) | | (367 | ) | | (729 | ) |
Market Activity(3) | (309 | ) | | 39 |
| | (64 | ) | | (334 | ) | | 565 |
| | 40 |
| | 52 |
| | 657 |
|
| End of Period | $ | 168,096 |
| | $ | 46,698 |
| | $ | 28,235 |
| | $ | 243,029 |
| | $ | 134,003 |
| | $ | 47,065 |
| | $ | 22,541 |
| | $ | 203,609 |
|
| |
(1) | At the individual segment level, inflows include new subscriptions, commitments, capital raised, other increases in available capital, purchases, acquisitions and portfolio company appreciation. Outflows represent redemptions, other decreases in available capital and portfolio company depreciation. Realizations represent fund distributions of realized proceeds. Market activity represents gains (losses), the impact of foreign exchange rate fluctuations and other income. |
| |
(2) | Outflows for Fee-Generating AUM include redemptions of $0.3 billion and $1.3 billion during the three months ended September 30, 2019 and 2018, respectively. |
| |
(3) | Includes foreign exchange impacts of $(828.8) million, $(13.0) million and $(100.8) million for credit, private equity and real assets, respectively, during the three months ended September 30, 2019, and foreign exchange impacts of $(228.2) million, $(4.0) million and $(35.3) million for credit, private equity and real assets, respectively, during the three months ended September 30, 2018. |
|
| | | | | | | | | | | | | | | | | | | | | | | | | | | | | | | |
| | For the Nine Months Ended September 30, |
| | 2019 | | 2018 |
| | Credit | | Private Equity | | Real Assets | | Total | | Credit | | Private Equity | | Real Assets | | Total |
| | (in millions) |
Change in Fee-Generating AUM(1): | | | | | | | | | | | | | | |
| Beginning of Period | $ | 144,071 |
| | $ | 46,633 |
| | $ | 23,663 |
| | $ | 214,367 |
| | $ | 116,352 |
| | $ | 34,063 |
| | $ | 18,550 |
| | $ | 168,965 |
|
| Inflows | 32,993 |
| | 1,418 |
| | 5,601 |
| | 40,012 |
| | 28,503 |
| | 24,924 |
| | 5,353 |
| | 58,780 |
|
Outflows(2) | (9,635 | ) | | (699 | ) | | (724 | ) | | (11,058 | ) | | (10,355 | ) | | (11,287 | ) | | (52 | ) | | (21,694 | ) |
| Net Flows | 23,358 |
| | 719 |
| | 4,877 |
| | 28,954 |
| | 18,148 |
| | 13,637 |
| | 5,301 |
| | 37,086 |
|
| Realizations | (544 | ) | | (762 | ) | | (363 | ) | | (1,669 | ) | | (1,249 | ) | | (698 | ) | | (1,398 | ) | | (3,345 | ) |
Market Activity(3) | 1,211 |
| | 108 |
| | 58 |
| | 1,377 |
| | 752 |
| | 63 |
| | 88 |
| | 903 |
|
| End of Period | $ | 168,096 |
| | $ | 46,698 |
| | $ | 28,235 |
| | $ | 243,029 |
| | $ | 134,003 |
| | $ | 47,065 |
| | $ | 22,541 |
| | $ | 203,609 |
|
| |
(1) | At the individual segment level, inflows include new subscriptions, commitments, capital raised, other increases in available capital, purchases, acquisitions and portfolio company appreciation. Outflows represent redemptions, other decreases in available capital and portfolio company depreciation. Realizations represent fund distributions of realized proceeds. Market activity represents gains (losses), the impact of foreign exchange rate fluctuations and other income. |
| |
(2) | Outflows for Fee-Generating AUM include redemptions of $2.3 billion and $1.6 billion during the nine months ended September 30, 2019 and 2018, respectively. |
| |
(3) | Includes foreign exchange impacts of $(874.8) million, $(15.4) million and $(106.0) million for credit, private equity and real assets, respectively, during the nine months ended September 30, 2019, and foreign exchange impacts of $(602.3) million, $(12.3) million and $(87.8) million for credit, private equity and real assets, respectively, during the nine months ended September 30, 2018. |
Total Fee-Generating AUM was $243.0$433.1 billion at September 30, 2019,2020, an increase of $6.9$102.0 billion, or 2.9%30.8%, compared to $236.1$331.1 billion at June 30,December 31, 2019. The net increase was primarily due to client transactions which increased insurance assets under management. More specifically, the net increase was due to:
•Net flows of $7.8$97.2 billion primarily related to:
a $5.6 billion increase related to funds we manage in the credit segment primarily consisting of •an increase in AUM relating to Athene of $7.2 billion driven by portfolio company activity and an increase relating to fee-generating capital deployment of $0.8 billion; these increases were partially offset by net segment transfers of $2.4 billion and fee-generating capital reduction of $0.5 billion; and
a $2.4 billion increase related to funds we manage in the real assets segment primarily consisting of $2.4 billion of net segment transfers.
Offsetting these increases were decreases related to realizations and market activity throughout the segments of $0.6 billion and $0.3 billion, respectively.
Total Fee-Generating AUM was $243.0 billion at September 30, 2019, an increase of $28.7 billion or 13.4%, compared to $214.4 billion at December 31, 2018. The net increase was primarily due to:
Net flows of $29.0 billion primarily related to:
a $23.4$87.1 billion increase related to funds we manage in the credit segment primarily consisting of (i) an increase in AUM relating to Athene of $16.7 billion as a result of portfolio company activity,in the advisory and other category, (ii) an increase in AUM in advisory and other as a result of Athora’s acquisition of Generali Belgium,Athene closed its reinsurance transaction with Jackson National Life Insurance Company, which added approximately $6.5$28 billion of AUM, and (iii) $12.3 billion of subscriptions across the corporate credit funds we manage, primarily due to an additional $6 billion of new commitments for Apollo Strategic Origination Partners, a new origination platform expected to provide approximately $12 billion in financings over the next three years;
•a $3.8 billion increase relatingrelated to fee-generating capital deploymentfunds we manage in the private equity segment primarily consisting of $3.4 billion; these increases were partially offset by fee-generating capital reduction$2.4 billion of $2.0 billion;subscriptions across the traditional private equity and hybrid value funds we manage; and
•a $4.9$6.3 billion increase related to funds we manage in the real assets segment primarily consisting of $4.8 billion of net segment transfers of $4.6 billion and $0.7$0.9 billion of fee-generating deployment,subscriptions.
•Market activity of $10.0 billion, primarily related to certain infrastructure funds; and$11.0 billion of appreciation in the funds we manage in the credit segment, primarily related to the market activity of Athene.
a $0.7•Realizations of $(5.2) billion increaseprimarily related to:
•$(2.8) billion related to funds we manage in the private equity segment primarily consisting of fee-generating capital deploymentdistributions of $1.4 billion offset by fee-generatingand $0.4 billion from Fund VIII and certain hybrid capital reductionfunds, respectively; and
•$(1.6) billion related to funds we manage in the credit segment primarily consisting of $0.5 billion.distributions from the corporate credit funds we manage.
The following tables summarize changes in Fee-Generating AUM for each of Apollo’s three segments:
| | | | | | | | | | | | | | | | | | | | | | | | | | | | | | | | | | | | | | | | | | | | | | | |
| For the Three Months Ended September 30, |
| | 2020 | | 2019 |
| Credit | | Private Equity | | Real Assets | | Total | | Credit | | Private Equity | | Real Assets | | Total |
| | |
Change in Fee-Generating AUM(1): | | | | | | | | | | | | | | |
| Beginning of Period | $ | 254,332 | | | $ | 43,840 | | | $ | 31,606 | | | $ | 329,778 | | | $ | 163,089 | | | $ | 47,082 | | | $ | 25,965 | | | $ | 236,136 | |
Inflows (2) | 5,552 | | | 277 | | | 4,059 | | | 9,888 | | | 6,554 | | | 94 | | | 2,653 | | | 9,301 | |
Outflows(3) | (7,069) | | | (229) | | | (185) | | | (7,483) | | | (3,882) | | | (266) | | | (241) | | | (4,389) | |
| Net Flows | (1,517) | | | 48 | | | 3,874 | | | 2,405 | | | 2,672 | | | (172) | | | 2,412 | | | 4,912 | |
| Realizations | (211) | | | (130) | | | (167) | | | (508) | | | (265) | | | (251) | | | (78) | | | (594) | |
Market Activity(4) | 4,067 | | | 163 | | | 240 | | | 4,470 | | | 2,600 | | | 39 | | | (64) | | | 2,575 | |
| End of Period | $ | 256,671 | | | $ | 43,921 | | | $ | 35,553 | | | $ | 336,145 | | | $ | 168,096 | | | $ | 46,698 | | | $ | 28,235 | | | $ | 243,029 | |
(1)At the individual segment level, inflows include new subscriptions, commitments, capital raised, other increases in available capital, purchases, acquisitions and portfolio company appreciation. Outflows represent redemptions, other decreases in available capital and portfolio company depreciation. Realizations represent fund distributions of realized proceeds. Market activity represents gains (losses), the impact of foreign exchange rate fluctuations and other income.
(2)For the three months ended September 30, 2020, market activity includes mark-to-market changes and investment income of Athene, which had previously been reported as inflows. Prior period numbers have been recast to conform to the current presentation.
(3)Outflows for Fee-Generating AUM include redemptions of $0.7 billion and $0.3 billion during the three months ended September 30, 2020 and 2019, respectively.
(4)Includes foreign exchange impacts of $3.0 billion, $14.9 million and $129.8 million for credit, private equity and real assets, respectively, during the three months ended September 30, 2020, and foreign exchange impacts of $(828.8) million, $(13.0) million and $(100.8) million for credit, private equity and real assets, respectively, during the three months ended September 30, 2019.
| | | | | | | | | | | | | | | | | | | | | | | | | | | | | | | | | | | | | | | | | | | | | | | |
| For the Nine Months Ended September 30, |
| | 2020 | | 2019 |
| Credit | | Private Equity | | Real Assets | | Total | | Credit | | Private Equity | | Real Assets | | Total |
| | (in millions) |
Change in Fee-Generating AUM(1): | | | | | | | | | | | | | | |
| Beginning of Period | $ | 172,893 | | | $ | 43,826 | | | $ | 29,727 | | | $ | 246,446 | | | $ | 144,071 | | | $ | 46,633 | | | $ | 23,663 | | | $ | 214,367 | |
Inflows(2) | 93,807 | | | 1,723 | | | 6,785 | | | 102,315 | | | 22,383 | | | 1,418 | | | 5,601 | | | 29,402 | |
Outflows(3) | (14,074) | | | (1,252) | | | (861) | | | (16,187) | | | (9,634) | | | (699) | | | (724) | | | (11,057) | |
| Net Flows | 79,733 | | | 471 | | | 5,924 | | | 86,128 | | | 12,749 | | | 719 | | | 4,877 | | | 18,345 | |
| Realizations | (681) | | | (676) | | | (368) | | | (1,725) | | | (544) | | | (762) | | | (363) | | | (1,669) | |
Market Activity(4) | 4,726 | | | 300 | | | 270 | | | 5,296 | | | 11,820 | | | 108 | | | 58 | | | 11,986 | |
| End of Period | $ | 256,671 | | | $ | 43,921 | | | $ | 35,553 | | | $ | 336,145 | | | $ | 168,096 | | | $ | 46,698 | | | $ | 28,235 | | | $ | 243,029 | |
(1)At the individual segment level, inflows include new subscriptions, commitments, capital raised, other increases in available capital, purchases, acquisitions and portfolio company appreciation. Outflows represent redemptions, other decreases in available capital and portfolio company depreciation. Realizations represent fund distributions of realized proceeds. Market activity represents gains (losses), the impact of foreign exchange rate fluctuations and other income.
(2)For the nine months ended September 30, 2020, market activity includes mark-to-market changes and investment income of Athene, which had previously been reported as inflows. Prior period numbers have been recast to conform to the current presentation.
(3)Outflows for Fee-Generating AUM include redemptions of $1.8 billion and $2.3 billion during the nine months ended September 30, 2020 and 2019, respectively.
(4)Includes foreign exchange impacts of $2.6 billion, $2.1 million and $100.2 million for credit, private equity and real assets, respectively, during the nine months ended September 30, 2020, and foreign exchange impacts of $(874.8) million, $(15.4) million and $(106.0) million for credit, private equity and real assets, respectively, during the nine months ended September 30, 2019.
Three Months Ended September 30, 2020
Total Fee-Generating AUM was $336.1 billion at September 30, 2020, an increase of $6.4 billion or 1.9%, compared to $329.8 billion at June 30, 2020. The net increase was primarily due to:
•Market activity of $1.4$4.5 billion primarily related to:
to a $1.2$4.1 billion increase related to funds we manage in the credit segment, primarily as a result of appreciationthe market activity of Athene; and
•Net flows of $2.4 billion primarily related to:
•a $3.9 billion increase related to funds we manage in the real assets segment primarily consisting of (i) $2.8 billion of net segment transfers and (ii) $0.5 billion of subscriptions across the real estate funds we manage; and
•a $(1.5) billion decrease related to funds we manage in the credit segment primarily consisting of (i) $2.9 billion of net segment transfers and (ii) $2.6 billion of fee-generating capital reductions; offset by an increase of $4.4 billion in AUM in the advisory and other category.
Nine Months Ended September 30, 2020
Total Fee-Generating AUM was $336.1 billion at September 30, 2020, an increase of $89.7 billion or 36.4%, compared to $246.4 billion at December 31, 2019. The net increase was primarily due to net flows of $86.1 billion primarily related to:
•a $79.7 billion increase related to funds we manage in the credit segment primarily consisting of (i) an increase in AUM in the advisory and other category, (ii) an increase in AUM as Athene closed its reinsurance transaction with Jackson National Life Insurance Company, which added $28 billion of AUM, and (iii) $3.1 billion of subscriptions across the corporate credit funds we manage.manage; and
Capital Deployed•a $5.9 billion increase related to funds we manage in the real assets segment primarily consisting of $4.6 billion of net segment transfers and $1.0 billion of fee-generating capital deployment, primarily related to the commencement of U.S. Real Estate Fund III’s investment period.
Deployment, Drawdown Deployment and Uncalled Commitments
Capital deployed isDuring the aggregate amountthree months ended September 30, 2020, the Company modified the definition of capital that hasdeployment to include net purchases, certain originations and net syndications to provide a more accurate representation of market activity across all the funds and accounts the Company manages. Prior period deployment figures have been invested during a given period byrecast to conform to this change in definition. The prior definition of deployment was limited to purchases in our commitment-basedcommitment based funds and SIAs that have a defined maturity date, and funds and SIAs in our real estate debt strategy. has been renamed “drawdown deployment”.
Uncalled commitments, by contrast, representsrepresent unfunded capital commitments that certain of Apollo’s funds and SIAs have received from fund investors to fund future or current fund investments and expenses.
Capital deployedDeployment, drawdown deployment and uncalled commitments are indicative of the pace and magnitude of fund capital that is deployed or will be deployed, and which therefore could result in future revenues that include management fees, transaction fees and performance fees to the extent they are fee-generating. Capital deployedDeployment, drawdown deployment and uncalled commitments can also give rise to future costs that are related to the hiring of additional resources to manage and account for the additional capital that is deployed or will be deployed. Management uses capital deployeddeployment, drawdown deployment and uncalled commitments as key operating metrics since we believe the results measureare measures of our fund’sfunds’ investment activities.
Capital DeployedDeployment
The following table summarizes the capital deployeddeployment across all funds by segment:
| | | | | | | | | | | | | | | | | | | | | | | | | |
| | For the Three Months Ended September 30, | | For the Nine Months Ended September 30, |
| | 2020 | | 2019 | | 2020 | | 2019 | | |
| | (in millions) | | (in millions) |
| Credit | $ | 16,173 | | | $ | 13,692 | | | $ | 46,864 | | | $ | 40,361 | | | |
| Private Equity | 758 | | | 1,571 | | | 10,514 | | | 7,940 | | | |
| Real Assets | 3,998 | | | 3,421 | | | 7,098 | | | 8,639 | | | |
| Total deployment | $ | 20,929 | | | $ | 18,684 | | | $ | 64,476 | | | $ | 56,940 | | | |
Drawdown Deployment
The following table summarizes drawdown deployment for funds and SIAs with a defined maturity date by segment:
| | | | | | | | | | | | | | | | | | | | | | | | | |
| | For the Three Months Ended September 30, | | For the Nine Months Ended September 30, |
| | 2020 | | 2019 | | 2020 | | 2019 | | |
| | (in millions) | | (in millions) |
Credit(1) | $ | 1,064 | | | $ | 1,367 | | | $ | 7,351 | | | $ | 4,710 | | | |
| Private Equity | 131 | | | $ | 986 | | | 5,739 | | | 6,641 | | | |
| Real Assets | 819 | | | 619 | | | 1,372 | | | 1,695 | | | |
| Total capital deployed | $ | 2,014 | | | $ | 2,972 | | | $ | 14,462 | | | $ | 13,046 | | | |
|
| | | | | | | | | | | | | | | |
| | For the Three Months Ended September 30, | | For the Nine Months Ended September 30, |
| | 2019 | | 2018 | | 2019 | | 2018 |
| | (in millions) | | (in millions) |
| Credit | $ | 1,264 |
| | $ | 485 |
| | $ | 4,010 |
| | $ | 1,986 |
|
| Private Equity | 986 |
| | 513 |
| | 6,641 |
| | 3,681 |
|
| Real Assets | 619 |
| | 253 |
| | 1,695 |
| | 1,227 |
|
| Total capital deployed | $ | 2,869 |
| | $ | 1,251 |
| | $ | 12,346 |
| | $ | 6,894 |
|
(1)Prior period numbers were recast to include Apollo Accord Master Fund, L.P. (“Accord”) and other defined maturity date funds.
Uncalled Commitments
The following table summarizes the uncalled commitments by segment:
| | | | | | | | | | | |
| As of
September 30, 2020 | | As of
December 31, 2019 |
| | (in millions) |
| Credit | $ | 24,035 | | | $ | 11,591 | |
| Private Equity | 33,921 | | | 36,346 | |
| Real Assets | 6,082 | | | 5,736 | |
Total uncalled commitments(1) | $ | 64,038 | | | $ | 53,673 | |
|
| | | | | | | |
| | As of
September 30, 2019 | | As of
December 31, 2018 |
| | (in millions) |
| Credit | $ | 8,971 |
| | $ | 8,066 |
|
| Private Equity | 38,459 |
| | 41,585 |
|
| Real Assets | 5,590 |
| | 5,980 |
|
Total uncalled commitments(1) | $ | 53,020 |
| | $ | 55,631 |
|
| |
(1) | As of September 30, 2019 and December 31, 2018, $44.3 billion and $48.5 billion, respectively, represented the amount of capital available for investment or reinvestment subject to the provisions of the applicable limited partnership agreements or other governing agreements of the funds, partnerships and accounts we manage. These amounts exclude uncalled commitments which can only be called for fund fees and expenses. |
The Historical Investment Performance of Our Funds
Below we present information relating to the historical performance of our funds, including certain legacy Apollo funds that do not have a meaningful amount of unrealized investments, and in respect of which the general partner interest has not been contributed to us.
When considering the data presented below, you should note that the historical results of our funds are not indicative of the future results that you should expect from such funds, from any future funds we may raise or from your investment in our Class A Common Stock.common stock.
An investment in our Class A Common Stockcommon stock is not an investment in any of the Apollo funds, and the assets and revenues of our funds are not directly available to us. The historical and potential future returns of the funds we manage are not directly linked to returns on our Class A Common Stock.shares. Therefore, you should not conclude that continued positive performance of the funds we manage will necessarily result in positive returns on an investment in our Class A Common Stock.shares. However, poor performance of the funds that we manage would cause a decline in our revenue from such funds, and would therefore have a negative effect on our performance and in all likelihood the value of our Class A Common Stock.shares.
Moreover, the historical returns of our funds should not be considered indicative of the future results you should expect from such funds or from any future funds we may raise. There can be no assurance that any Apollo fund will continue to achieve the same results in the future.
Finally, our private equity IRRs have historically varied greatly from fund to fund. For example, Fund IVVI generated a 12% gross IRR and a 9% net IRR since its inception through September 30, 2019,2020, while Fund V generated a 61% gross IRR and a 44% net IRR since its inception through September 30, 2019.2020. Accordingly, the IRR going forward for any current or future fund may vary considerably from the historical IRR generated by any particular fund, or for our private equity funds as a whole. Future returns will also be affected by the applicable risks, including risks of the industries and businesses in which a particular fund invests. See “Item 1A. Risk Factors—Risks Related to Our Businesses—The historical returns attributable to our funds should not be considered as indicative of the future results of our funds or of our future results or of any returns expected on an investment in our Class A shares and our Preferred shares” in the 20182019 Annual Report.Report and “Item 1A. Risk
Factors—The current, and uncertain future, impact of the COVID-19 outbreak is expected to continue to impact our business, financial condition and results of operations” in the quarterly report on Form 10-Q filed with the SEC on May 11, 2020.
Investment Record
The following table summarizes the investment record by segment of Apollo’s significant commitment-based funds that have a defined maturity date in which investors make a commitment to provide capital at the formation of such funds and deliver capital when called as investment opportunities become available. The funds included in the investment record table below have greater than $500 million of AUM and/or form part of a flagship series of funds.
All amounts are as of September 30, 2019,2020, unless otherwise noted:
| | | | | | | | | | | | | | | | | | | | | | | | | | | | | | | | | | | | | | | | | | | | | | | | | | | | | | | | | | | | | | |
| ($ in millions) | Vintage
Year | | Total AUM | | Committed
Capital | | Total Invested Capital | | Realized Value | | Remaining Cost | | Unrealized Value | | Total Value | | Gross
IRR | | Net
IRR | |
| Private Equity: | | | | | | | | | | | | | | | | | | | | |
| Fund IX | 2018 | | $ | 24,600 | | | $ | 24,729 | | | $ | 5,571 | | | $ | 691 | | | $ | 5,175 | | | $ | 5,829 | | | $ | 6,520 | | | 19 | % | | (2) | % | |
| Fund VIII | 2013 | | 18,221 | | | 18,377 | | | 16,048 | | | 10,166 | | | 10,098 | | | 14,387 | | | 24,553 | | | 15 | | | 10 | | |
| Fund VII | 2008 | | 2,953 | | | 14,677 | | | 16,461 | | | 31,838 | | | 2,459 | | | 679 | | | 32,517 | | | 33 | | | 24 | | |
| Fund VI | 2006 | | 647 | | | 10,136 | | | 12,457 | | | 21,132 | | | 405 | | | 3 | | | 21,135 | | | 12 | | | 9 | | |
| Fund V | 2001 | | 261 | | | 3,742 | | | 5,192 | | | 12,721 | | | 120 | | | 2 | | | 12,723 | | | 61 | | | 44 | | |
Fund I, II, III, IV & MIA(2) | Various | | 13 | | | 7,320 | | | 8,753 | | | 17,400 | | | — | | | — | | | 17,400 | | | 39 | | | 26 | | |
Traditional Private Equity Funds(3) | | | $ | 46,695 | | | $ | 78,981 | | | $ | 64,482 | | | $ | 93,948 | | | $ | 18,257 | | | $ | 20,900 | | | $ | 114,848 | | | 39 | % | | 24 | | |
| ANRP II | 2016 | | 2,446 | | | 3,454 | | | 2,667 | | | 1,393 | | | 2,005 | | | 1,657 | | | 3,050 | | | 9 | | | 1 | | |
| ANRP I | 2012 | | 319 | | | 1,323 | | | 1,149 | | | 1,014 | | | 615 | | | 110 | | | 1,124 | | | (1) | | | (5) | | |
| AION | 2013 | | 568 | | | 826 | | | 690 | | | 328 | | | 442 | | | 461 | | | 789 | | | 6 | | | — | | |
| Hybrid Value Fund | 2019 | | 3,441 | | | 3,238 | | | 1,911 | | | 241 | | | 1,779 | | | 2,004 | | | 2,245 | | | 27 | | | 21 | | |
| | | | | | | | | | | | | | | | | | | | |
| Total Private Equity | | | $ | 53,469 | | | $ | 87,822 | | | $ | 70,899 | | | $ | 96,924 | | | $ | 23,098 | | | $ | 25,132 | | | $ | 122,056 | | | | | | |
| Credit: | | | | | | | | | | | | | | | | | | | | |
| | | | | | | | | | | | | | | | | | | | |
| FCI III | 2017 | | $ | 2,718 | | | $ | 1,906 | | | $ | 2,607 | | | $ | 1,374 | | | $ | 1,908 | | | $ | 1,982 | | | $ | 3,356 | | | 22 | % | | 17 | % | |
| FCI II | 2013 | | 2,249 | | | 1,555 | | | 2,957 | | | 1,989 | | | 1,726 | | | 1,602 | | | 3,591 | | | 7 | | | 5 | | |
| FCI I | 2012 | | — | | | 559 | | | 1,516 | | | 1,975 | | | — | | | — | | | 1,975 | | | 11 | | | 8 | | |
SCRF IV (6) | 2017 | | 2,180 | | | 2,502 | | | 4,604 | | | 2,504 | | | 2,178 | | | 2,033 | | | 4,537 | | | (1) | | | (3) | | |
| SCRF III | 2015 | | — | | | 1,238 | | | 2,110 | | | 2,428 | | | — | | | — | | | 2,428 | | | 18 | | | 14 | | |
| SCRF II | 2012 | | — | | | 104 | | | 467 | | | 528 | | | — | | | — | | | 528 | | | 15 | | | 12 | | |
| SCRF I | 2008 | | — | | | 118 | | | 240 | | | 357 | | | — | | | — | | | 357 | | | 33 | | | 26 | | |
| Accord IV | 2020 | | 1,057 | | | 1,052 | | | 26 | | | — | | | 27 | | | 31 | | | 31 | | | NM1 | | NM1 | |
| Accord IIIB | 2020 | | 1,789 | | | 1,761 | | | 520 | | | 197 | | | 352 | | | 347 | | | 544 | | | NM1 | | NM1 | |
| Accord III | 2019 | | 800 | | | 886 | | | 2,331 | | | 2,229 | | | 316 | | | 351 | | | 2,580 | | | NM1 | | NM1 | |
Accord II(7) | 2018 | | — | | | 781 | | | 801 | | | 821 | | | — | | | — | | | 821 | | | 16 | | | 12 | | |
Accord I(7) | 2017 | | — | | | 308 | | | 111 | | | 113 | | | — | | | — | | | 113 | | | 10 | | | 5 | | |
| Total Credit | | | $ | 10,793 | | | $ | 12,770 | | | $ | 18,290 | | | $ | 14,515 | | | $ | 6,507 | | | $ | 6,346 | | | $ | 20,861 | | | | | | |
| Real Assets: | | | | | | | | | | | | | | | | | | | | |
| European Principal Finance Funds | | | | | | | | | | | | | | | | | | | | |
EPF III(4) | 2017 | | $ | 4,944 | | | $ | 4,576 | | | $ | 3,217 | | | $ | 1,220 | | | $ | 2,266 | | | $ | 2,873 | | | $ | 4,093 | | | 21 | % | | 10 | % | |
EPF II(4) | 2012 | | 1,315 | | | 3,485 | | | 3,552 | | | 4,434 | | | 676 | | | 609 | | | 5,043 | | | 14 | | | 8 | | |
EPF I(4) | 2007 | | 244 | | | 1,518 | | | 1,995 | | | 3,356 | | | — | | | 9 | | | 3,365 | | | 23 | | | 17 | | |
U.S. RE Fund III(8) | N/A | | 527 | | | 527 | | | 43 | | | — | | | 43 | | | 47 | | | 47 | | | NM1 | | NM1 | |
U.S. RE Fund II(5) | 2016 | | 1,086 | | | 1,243 | | | 893 | | | 515 | | | 642 | | | 676 | | | 1,191 | | | 13 | | | 10 | | |
U.S. RE Fund I(5) | 2012 | | 216 | | | 652 | | | 635 | | | 805 | | | 147 | | | 129 | | | 934 | | | 13 | | | 10 | | |
Asia RE Fund II(8) | N/A | | 279 | | | 278 | | | 71 | | | — | | | 71 | | | 74 | | | 74 | | | NM1 | | NM1 | |
Asia RE Fund(5) | 2017 | | 686 | | | 719 | | | 442 | | | 206 | | | 288 | | | 386 | | | 592 | | | 17 | | | 12 | | |
AIOF II(8) | N/A | | 864 | | | 865 | | | 92 | | | — | | | 92 | | | 93 | | | 93 | | | NM1 | | NM1 | |
| AIOF I | 2018 | | 1,125 | | | 897 | | | 801 | | | 334 | | | 561 | | | 732 | | | 1,066 | | | NM1 | | NM1 | |
| Total Real Assets | | | $ | 11,286 | | | $ | 14,760 | | | $ | 11,741 | | | $ | 10,870 | | | $ | 4,786 | | | $ | 5,628 | | | $ | 16,498 | | | | | | |
(1)Data has not been presented as the fund’s effective date is less than 24 months prior to the period indicated and such information was deemed not meaningful.
(2)The general partners and managers of Funds I, II and MIA, as well as the general partner of Fund III, were excluded assets in connection with the 2007 Reorganization. As a result, Apollo did not receive the economics associated with these entities. The investment performance of these funds, combined with Fund IV, is presented to illustrate fund performance associated with Apollo’s Managing Partners and other investment professionals.
|
| | | | | | | | | | | | | | | | | | | | | | | | | | | | | | | | | | | | |
| ($ in millions) | Vintage
Year | | Total AUM | | Committed
Capital | | Total Invested Capital | | Realized Value | | Remaining Cost | | Unrealized Value | | Total Value | | Gross
IRR | | Net
IRR | |
| Private Equity: | | | | | | | | | | | | | | | | | | | | |
| Fund IX | 2018 | | $ | 24,847 |
| | $ | 24,729 |
| | $ | 2,779 |
| | $ | — |
| | $ | 2,779 |
| | $ | 2,917 |
| | $ | 2,917 |
| | NM |
| (1) | NM |
| (1) |
| Fund VIII | 2013 | | 21,241 |
| | 18,377 |
| | 15,815 |
| | 6,447 |
| | 12,622 |
| | 17,771 |
| | 24,218 |
| | 18 | % | | 13 | % | |
| Fund VII | 2008 | | 3,709 |
| | 14,677 |
| | 16,461 |
| | 31,196 |
| | 2,803 |
| | 1,722 |
| | 32,918 |
| | 33 |
| | 25 |
| |
| Fund VI | 2006 | | 645 |
| | 10,136 |
| | 12,457 |
| | 21,114 |
| | 405 |
| | 19 |
| | 21,133 |
| | 12 |
| | 9 |
| |
| Fund V | 2001 | | 261 |
| | 3,742 |
| | 5,192 |
| | 12,720 |
| | 120 |
| | 2 |
| | 12,722 |
| | 61 |
| | 44 |
| |
Fund I, II, III, IV & MIA(2) | Various | | 13 |
| | 7,320 |
| | 8,753 |
| | 17,400 |
| | — |
| | — |
| | 17,400 |
| | 39 |
| | 26 |
| |
Traditional Private Equity Funds(3) | | | $ | 50,716 |
| | $ | 78,981 |
| | $ | 61,457 |
| | $ | 88,877 |
| | $ | 18,729 |
| | $ | 22,431 |
| | $ | 111,308 |
| | 39 | % | | 25 | % | |
| ANRP II | 2016 | | 3,357 |
| | 3,454 |
| | 2,193 |
| | 923 |
| | 1,778 |
| | 2,098 |
| | 3,021 |
| | 25 |
| | 14 |
| |
| ANRP I | 2012 | | 556 |
| | 1,323 |
| | 1,144 |
| | 978 |
| | 650 |
| | 322 |
| | 1,300 |
| | 4 |
| | — |
| |
| AION | 2013 | | 784 |
| | 826 |
| | 689 |
| | 291 |
| | 491 |
| | 661 |
| | 952 |
| | 18 |
| | 9 |
| |
| Hybrid Value Fund | 2019 | | 3,243 |
| | 3,238 |
| | 530 |
| | 12 |
| | 527 |
| | 536 |
| | 548 |
| | NM |
| (1) | NM |
| (1) |
| Total Private Equity | | | $ | 58,656 |
| | $ | 87,822 |
| | $ | 66,013 |
| | $ | 91,081 |
| | $ | 22,175 |
| | $ | 26,048 |
| | $ | 117,129 |
| | | | | |
| Credit: | | | | | | | | | | | | | | | | | | | | |
| Structured Credit Funds | | | | | | | | | | | | | | | | | | | | |
| FCI III | 2017 | | $ | 2,632 |
| | $ | 1,906 |
| | $ | 2,329 |
| | $ | 862 |
| | $ | 1,901 |
| | $ | 2,025 |
| | $ | 2,887 |
| | 28 | % | | 21 | % | |
| FCI II | 2013 | | 2,213 |
| | 1,555 |
| | 2,707 |
| | 1,734 |
| | 1,661 |
| | 1,568 |
| | 3,302 |
| | 8 |
| | 5 |
| |
| FCI I | 2012 | | 110 |
| | 559 |
| | 1,516 |
| | 1,975 |
| | — |
| | — |
| | 1,975 |
| | 11 |
| | 8 |
| |
SCRF IV (6) | 2017 | | 3,051 |
| | 2,502 |
| | 3,542 |
| | 1,615 |
| | 2,254 |
| | 2,287 |
| | 3,902 |
| | NM |
| (1) | NM |
| (1) |
| SCRF III | 2015 | | — |
| | 1,238 |
| | 2,110 |
| | 2,428 |
| | — |
| | — |
| | 2,428 |
| | 18 |
| | 14 |
| |
| SCRF II | 2012 | | — |
| | 104 |
| | 467 |
| | 528 |
| | — |
| | — |
| | 528 |
| | 15 |
| | 12 |
| |
| SCRF I | 2008 | | — |
| | 118 |
| | 240 |
| | 357 |
| | — |
| | — |
| | 357 |
| | 33 |
| | 26 |
| |
| Total Credit | | | $ | 8,006 |
| | $ | 7,982 |
|
| $ | 12,911 |
| | $ | 9,499 |
| | $ | 5,816 |
| | $ | 5,880 |
| | $ | 15,379 |
| | | | | |
| Real Assets: | | | | | | | | | | | | | | | | | | | | |
| European Principal Finance Funds | | | | | | | | | | | | | | | | | | | | |
EPF III(4) | 2017 | | $ | 4,683 |
| | $ | 4,469 |
| | $ | 2,034 |
| | $ | 50 |
| | $ | 1,984 |
| | $ | 2,242 |
| | $ | 2,292 |
| | 23 | % | | 9 | % | |
EPF II(4) | 2012 | | 1,675 |
| | 3,412 |
| | 3,352 |
| | 4,099 |
| | 822 |
| | 867 |
| | 4,966 |
| | 15 |
| | 9 |
| |
EPF I(4) | 2007 | | 229 |
| | 1,411 |
| | 1,855 |
| | 3,115 |
| | — |
| | 10 |
| | 3,125 |
| | 23 |
| | 17 |
| |
U.S. RE Fund II(5) | 2016 | | 1,217 |
| | 1,243 |
| | 823 |
| | 375 |
| | 603 |
| | 723 |
| | 1,098 |
| | 16 |
| | 12 |
| |
U.S. RE Fund I(5) | 2012 | | 332 |
| | 648 |
| | 631 |
| | 706 |
| | 220 |
| | 242 |
| | 948 |
| | 14 |
| | 11 |
| |
Asia RE Fund(5) | 2017 | | 648 |
| | 709 |
| | 395 |
| | 204 |
| | 241 |
| | 300 |
| | 504 |
| | 20 |
| | 14 |
| |
| Infrastructure Equity Fund | 2018 | | 997 |
| | 897 |
| | 782 |
| | 88 |
| | 725 |
| | 809 |
| | 897 |
| | NM |
| (1) | NM |
| (1) |
| Total Real Assets | | | $ | 9,781 |
| | $ | 12,789 |
| | $ | 9,872 |
| | $ | 8,637 |
| | $ | 4,595 |
| | $ | 5,193 |
| | $ | 13,830 |
| | | | | |
| |
(1) | Data has not been presented as the fund commenced investing capital less than 24 months prior to the period indicated and such information was deemed not meaningful. |
| |
(2) | The general partners and managers of Funds I, II and MIA, as well as the general partner of Fund III, were excluded assets in connection with the 2007 Reorganization. As a result, Apollo did not receive the economics associated with these entities. The investment performance of these funds, combined with Fund IV, is presented to illustrate fund performance associated with Apollo’s Managing Partners and other investment professionals. |
| |
(3) | Total IRR is calculated based on total cash flows for all funds presented. |
| |
(4) | Funds are denominated in Euros and historical figures are translated into U.S. dollars at an exchange rate of €1.00 to $1.09 as of September 30, 2019. |
| |
(5) | U.S. RE Fund I, U.S. RE Fund II and Asia RE Fund had $152 million, $771 million and $366 million of co-investment commitments as of September 30, 2019, respectively, which are included in the figures in the table. A co-invest entity within U.S. RE Fund I is denominated in pound sterling and translated into U.S. dollars at an exchange rate of £1.00 to $1.23 as of September 30, 2019.
|
| |
(6) | Remaining cost for certain of our credit funds may include physical cash called, invested or reserved for certain levered investments. |
(4)Funds are denominated in Euros and historical figures are translated into U.S. dollars at an exchange rate of €1.00 to $1.17 as of September 30, 2020.
(5)U.S. RE Fund I, U.S. RE Fund II and Asia RE Fund had $156 million, $771 million and $375 million of co-investment commitments as of September 30, 2020, respectively, which are included in the figures in the table. A co-invest entity within U.S. RE Fund I is denominated in pound sterling and translated into U.S. dollars at an exchange rate of £1.00 to $1.29 as of September 30, 2020.
(6)Remaining cost for certain of our credit funds may include physical cash called, invested or reserved for certain levered investments.
(7)Gross and Net IRR have been presented for these funds as they have a defined maturity date of less than 24 months and have substantially liquidated.
(8)Vintage Year is not yet applicable as these funds have not had their final closings.
Credit
The following table presents the gross and net returns for Apollo’s credit segment by category type:
| | | | | | | | | | | | | | | | | | | | | | | | |
| | | Gross Returns | | Net Returns |
| Category | | For the Three Months Ended September 30, 2020 | | For the Nine Months Ended September 30, 2020 | | For the Three Months Ended September 30, 2020 | | For the Nine Months Ended September 30, 2020 |
| Corporate Credit | | 3.5 | % | | 2.4 | % | | 3.2 | % | | 1.5 | % |
| Structured Credit | | 4.1 | | | (3.4) | | | 4.1 | | | (3.4) | |
| Direct Origination | | 3.7 | | | 1.6 | | | 2.8 | | | (0.8) | |
Private Equity
The following table summarizes the investment record for distressed investments made in our traditional private equity fund portfolios, since the Company’s inception. All amounts are as of September 30, 2019:2020:
| | | | | | | | | | | | | | | | | |
| Total Invested Capital | | Total Value | | Gross IRR |
| | (in millions) | | |
| Distressed for Control | $ | 7,795 | | | $ | 18,823 | | | 29 | % |
| Non-Control Distressed | 5,558 | | | 8,842 | | | 71 | |
| Total | 13,353 | | | 27,665 | | | 49 | |
Corporate Carve-outs, Opportunistic Buyouts and Other Credit(1) | 51,129 | | | 87,183 | | | 21 | |
| Total | $ | 64,482 | | | $ | 114,848 | | | 39 | % |
|
| | | | | | | | | | |
| | Total Invested Capital | | Total Value | | Gross IRR |
| | (in millions) | | |
| Distressed for Control | $ | 7,915 |
| | $ | 19,021 |
| | 29 | % |
| Non-Control Distressed | 5,416 |
| | 8,448 |
| | 71 |
|
| Total | 13,331 |
| | 27,469 |
| | 49 |
|
Corporate Carve-outs, Opportunistic Buyouts and Other Credit(1) | 48,126 |
| | 83,839 |
| | 21 |
|
| Total | $ | 61,457 |
| | $ | 111,308 |
| | 39 | % |
(1)Other Credit is defined as investments in debt securities of issuers other than portfolio companies that are not considered to be distressed.
| |
(1) | Other Credit is defined as investments in debt securities of issuers other than portfolio companies that are not considered to be distressed. |
The following tables provide additional detail on the composition of the Fund VIII and Fund VII private equity portfolios based on investment strategy. Amounts for Fund I, II, III, IV, V, VI and IX are included in the table above but not presented below as their remaining value is less than $100 million, the fund has been liquidated or the fund commenced investing capital less than 24 months prior to September 30, 20192020 and such information was deemed not meaningful. All amounts are as of September 30, 2019:2020:
Fund VIII(1)
| | | | | | | | | | | |
| Total Invested Capital | | Total Value |
| | (in millions) |
| Corporate Carve-outs | $ | 2,704 | | | $ | 5,760 | |
| Opportunistic Buyouts | 12,777 | | | 18,032 | |
Distressed(2) | 567 | | | 761 | |
| Total | $ | 16,048 | | | $ | 24,553 | |
|
| | | | | | | |
| | Total Invested Capital | | Total Value |
| | (in millions) |
| Corporate Carve-outs | $ | 2,673 |
|
| $ | 6,069 |
|
| Opportunistic Buyouts | 12,597 |
|
| 17,295 |
|
Distressed(2) | 545 |
|
| 854 |
|
| Total | $ | 15,815 |
| | $ | 24,218 |
|
Fund VII(1)
| | | | | | | | | | | |
| Total Invested Capital | | Total Value |
| | (in millions) |
| Corporate Carve-outs | $ | 2,539 | | | $ | 3,466 | |
| Opportunistic Buyouts | 4,339 | | | 10,498 | |
Distressed/Other Credit(2) | 9,583 | | | 18,553 | |
| Total | $ | 16,461 | | | $ | 32,517 | |
|
| | | | | | | |
| | Total Invested Capital | | Total Value |
| | (in millions) |
| Corporate Carve-outs | $ | 2,540 |
|
| $ | 3,736 |
|
| Opportunistic Buyouts | 4,338 |
|
| 10,580 |
|
Distressed/Other Credit(2) | 9,583 |
|
| 18,602 |
|
| Total | $ | 16,461 |
| | $ | 32,918 |
|
| |
(1) | Committed capital less unfunded capital commitments for Fund VIII and Fund VII were $15.7 billion and $14.4 billion, respectively, which represents capital commitments from limited partners to invest in such funds less capital that is available for investment or reinvestment subject to the provisions of the applicable limited partnership agreement or other governing agreements. |
| |
(2) | The distressed investment strategy includes distressed for control, non-control distressed and other credit. |
(2)The distressed investment strategy includes distressed for control, non-control distressed and other credit.
During the recovery and expansionary periods of 1994 through 2000 and late 2003 through the first half of 2007, our private equity funds invested or committed to invest approximately $13.7 billion primarily in traditional and corporate partner buyouts. During the recessionary periods of 1990 through 1993, 2001 through late 2003 and the recessionary and post recessionary periods (beginning the second half of 2007 through September 30, 2019)2020), our private equity funds have invested $54.2$59.1 billion, of which $19.7$20.8 billion was in distressed buyouts and debt investments when the debt securities of quality companies traded at deep discounts to par value. Our average entry multiple for Fund VIII, VII and VI was 5.7x, 6.1x and 7.7x, respectively, as of September 30, 2019.2020. Our average entry multiple for a private equity fund is the average of the total enterprise value over an applicable adjusted earnings before interest, taxes, depreciation and amortization, which may incorporate certain adjustments based on the investment team’s estimates and we believe captures the true economics of our funds’ investments in portfolio companies. The average entry multiple of actively investing funds may include committed investments not yet closed.
Credit
The following table presents the gross and net returns for Apollo’s credit segment by category type:
|
| | | | | | | | | | | |
| | Gross Returns | | Net Returns |
| Category | For the Three Months Ended September 30, 2019 | | For the Nine Months Ended September 30, 2019 | | For the Three Months Ended September 30, 2019 | | For the Nine Months Ended September 30, 2019 |
| Corporate Credit | 1.8 | % | | 8.2 | % | | 1.5 | % | | 7.4 | % |
| Structured Credit | 1.8 |
| | 10.3 |
| | 1.4 |
| | 8.5 |
|
| Direct Origination | 2.9 |
| | 9.4 |
| | 2.2 |
| | 7.0 |
|
Permanent Capital
The following table summarizes the investment record for our permanent capital vehicles by segment, excluding Athene-related and Athora-related assets managed or advised by ISG and AAME:ISGI:
| | | | | | | | | | | | | | | | | | | | | | | | | | | | | | | | | | | |
| | | | | Total Returns(1) |
| IPO Year(2) | | Total AUM | | For the Three Months Ended September 30, 2020 | | For the Nine Months Ended September 30, 2020 | | For the Three Months Ended September 30, 2019 | | For the Nine Months Ended September 30, 2019 |
| Credit: | | | (in millions) | | | | | | | | |
MidCap(3) | N/A | | $ | 8,124 | | | 4 | % | | 3 | % | | 4 | % | | 13 | % |
| AIF | 2013 | | 332 | | | 4 | | | (11) | | | 5 | % | | 17 | % |
| AFT | 2011 | | 362 | | | 5 | | | (11) | | | 1 | % | | 9 | % |
AINV/Other(4) | 2004 | | 4,475 | | | (10) | | | (45) | | | 5 | % | | 41 | % |
| Real Assets: | | | | | | | | | | | |
| ARI | 2009 | | 6,964 | | | (5) | % | | (44) | % | | 7 | % | | 24 | % |
| Total | | | $ | 20,257 | | | | | | | | | |
|
| | | | | | | | | | | | | | | | | |
| | | | | | Total Returns(1) |
| | IPO Year(2) | | Total AUM | | For the Three Months Ended September 30, 2019 | | For the Nine Months Ended September 30, 2019 | | For the Three Months Ended September 30, 2018 | | For the Nine Months Ended September 30, 2018 |
| Credit: | | | (in millions) | | | | | | | | |
MidCap(3) | N/A | | $ | 8,556 |
| | 4 | % | | 13 | % | | 6 | % | | 15 | % |
| AIF | 2013 | | 375 |
| | 5 | | | 17 |
| | 2 | | | 5 |
|
| AFT | 2011 | | 403 |
| | 1 | | | 9 |
| | — |
| | 4 |
|
AINV/Other(4) | 2004 | | 5,238 |
| | 5 | | | 41 |
| | — |
| | 4 |
|
| Real Assets: | | | | | | | | | | | |
| ARI | 2009 | | 6,715 |
| | 7 | % | | 24 | % | | 6 | % | | 10 | % |
| Total | | | $ | 21,287 |
| | | | | | | | |
| |
(1) | Total returns are based on the change in closing trading prices during the respective periods presented taking into account dividends and distributions, if any, as if they were reinvested without regard to commission. |
| |
(2) | An initial public offering (“IPO”) year represents the year in which the vehicle commenced trading on a national securities exchange. |
| |
(3) | MidCap is not a publicly traded vehicle and therefore IPO year is not applicable. The returns presented are a gross return based on NAV. The net returns based on NAV were 3% and 4% for the three months ended September 30, 2019 and 2018, respectively, and 9% and 11% for the nine months ended September 30, 2019 and September 30, 2018, respectively. |
| |
(4) | Included within Total AUM of AINV/Other is $1.9 billion of AUM related to a non-traded business development company from which Apollo earns investment-related service fees, but for which Apollo does not provide management or advisory services. Total returns exclude performance related to this AUM. |
(2)An initial public offering (“IPO”) year represents the year in which the vehicle commenced trading on a national securities exchange.
(3)MidCap is not a publicly traded vehicle and therefore IPO year is not applicable. The returns presented are a gross return based on NAV. The net returns based on NAV were 2% and 3% for the three months ended September 30, 2020 and September 30, 2019, respectively, and 0% and 9% for the nine months ended September 30, 2020 and September 30, 2019, respectively.
(4)Total AUM is as of June 30, 2020. Refer to www.apolloic.com for the most recent financial information on AINV. Included within Total AUM of AINV/Other is $1.7 billion of AUM related to a non-traded business development company from which Apollo earns investment-related service fees, but for which Apollo does not provide management or advisory services. Total returns exclude performance related to this AUM.
SIAs
As of September 30, 2019,2020, Apollo managed approximately $26$29 billion of total AUM in SIAs, which include capital deployed from certain SIAs across Apollo’s credit, private equity and real assets funds.
Overview of Results of Operations
Revenues
Advisory and Transaction Fees, Net. As a result of providing advisory services with respect to actual and potential credit, private equity, and real assets investments, we are entitled to receive fees for transactions related to the acquisition and, in certain instances, disposition of portfolio companies as well as fees for ongoing monitoring of portfolio company operations and directors’ fees. We also receive advisory fees for advisory services provided to certain credit funds. In addition, monitoring fees are generated on certain structured portfolio company investments. Under the terms of the limited partnership agreements for certain funds, the management fee payable by the funds may be subject to a reduction based on a certain percentage of such advisory and transaction fees, net of applicable broken deal costs (“Management Fee Offset”). Such amounts are presented as a reduction to advisory and transaction fees, net, in the condensed consolidated statements of operations (see note 2 to our condensed consolidated financial statements for more detail on advisory and transaction fees, net).
The Management Fee Offsets are calculated for each fund as follows:
•65%-100% for certain credit funds, gross advisory, transaction and other special fees;
•65%-100% for private equity funds, gross advisory, transaction and other special fees; and
•65%-100% for certain real assets funds, gross advisory, transaction and other special fees.
Management Fees. The significant growth of the assets we manage has had a positive effect on our revenues. Management fees are typically calculated based upon any of “net asset value,” “gross assets,” “adjusted par asset value,” “adjusted costs of all unrealized portfolio investments,” “capital commitments,” “invested capital,” “adjusted assets,” “capital contributions,” or “stockholders’ equity,” each as defined in the applicable limited partnership agreement and/or management agreement of the unconsolidated funds.
Performance Fees. The general partners of our funds are entitled to an incentive return of normally up to 20% of the total returns of a fund’s capital, depending upon performance of the underlying funds and subject to preferred returns and high water marks, as applicable. Performance fees, categorized as performance allocations, are accounted for as an equity method investment, and effectively, the performance fees for any period are based upon an assumed liquidation of the funds’ assets at the reporting date, and distribution of the net proceeds in accordance with the funds’ allocation provisions. Performance fees categorized as incentive fees, which are not accounted as an equity method investment, are deferred until fees are probable to not be significantly reversed. Prior to the adoption of the new revenue recognition guidance, incentive fees were recognized on an assumed liquidation basis. The majority of performance fees are comprised of performance allocations.
As of September 30, 2019,2020, approximately 51%55% of the value of our funds’ investments on a gross basis was determined using market-based valuation methods (i.e., reliance on broker or listed exchange quotes) and the remaining 49%45% was determined primarily by comparable company and industry multiples or discounted cash flow models. For our credit, private equity and real assets segments, the percentage determined using market-based valuation methods as of September 30, 20192020 was 73%, 18%19% and 16%19%, respectively. See “Item 1A. Risk Factors—Risks Related to Our Businesses—Our funds’ performance, and our performance, may be adversely affected by the financial performance of our funds’ portfolio companies and the industries in which our funds invest” in the 20182019 Annual Reportreport for a discussion regarding certain industry-specific risks that could affect the fair value of our private equity funds’ portfolio company investments.
In our private equity funds, the Company does not earn performance fees until the investors in the fund have achieved cumulative investment returns on invested capital (including management fees and expenses) in excess of an 8% hurdle rate. Additionally, certain of our credit and real assets funds have various performance fee rates and hurdle rates. Certain of our credit and real assets funds allocate performance fees to the general partner in a similar manner as the private equity funds. In our private equity, certain credit and real assets funds, so long as the investors achieve their priority returns, there is a catch-up formula whereby the Company earns a priority return for a portion of the return until the Company’s performance fees equate to its incentive fee rate for that fund; thereafter, the Company participates in returns from the fund at the performance fee rate. Performance fees, categorized as performance allocations, are subject to reversal to the extent that the performance fees distributed exceed the amount due to the general partner based on a fund’s cumulative investment returns. The Company recognizes potential repayment of previously received performance fees as a general partner obligation representing all amounts previously distributed to the general partner that would need to be repaid to the Apollo funds if these funds were to be liquidated based on the current fair value of the underlying funds’ investments as of the reporting date. The actual general partner obligation, however, would not become payable or realized until the end of a fund’s life or as otherwise set forth in the respective limited partnership agreement of the fund.
The table below presents an analysis of Apollo’s (i) performance fees receivable on an unconsolidated basis and (ii) realized and unrealized performance fees for Apollo’s combined segments:
| | | | | | | | | | | | | | | | | | | | | | | | | | | | | | | | | | | | | | | | | |
| | As of
September 30, 2020 | | For the Three Months Ended September 30, 2020 | | For the Nine Months Ended September 30, 2020 |
| | Performance Fees Receivable on an Unconsolidated Basis | | Unrealized Performance Fees | | Realized Performance Fees | | Total Performance Fees | | Unrealized Performance Fees | | Realized Performance Fees | | Total Performance Fees |
| | (in thousands) |
| Credit: | | | | | | | | | | | | | |
Corporate Credit (1) | $ | 152,204 | | | $ | 37,063 | | | $ | 6,436 | | | $ | 43,499 | | | $ | 133,590 | | | $ | 22,777 | | | $ | 156,367 | |
| Structured Credit | 125,366 | | | (5,061) | | | — | | | (5,061) | | | (65,276) | | | 13,846 | | | (51,430) | |
| Direct Origination | 54,772 | | | 7,002 | | | 3,381 | | | 10,383 | | | (9,967) | | | 9,258 | | | (709) | |
| Advisory and Other | 27,360 | | | 27,360 | | | — | | | 27,360 | | | 27,360 | | | — | | | 27,360 | |
| Total Credit | 359,702 | | | 66,364 | | | 9,817 | | | 76,181 | | | 85,707 | | | 45,881 | | | 131,588 | |
| Total Credit, net of profit sharing payable/expense | 51,558 | | | 33,553 | | | 2,204 | | | 35,757 | | | 43,150 | | | 8,352 | | | 51,502 | |
| Private Equity: | | | | | | | | | | | | | |
| Fund VIII | 532,239 | | | 328,709 | | | — | | | 328,709 | | | (183,292) | | | — | | | (183,292) | |
Fund VII(1)(2) | 46 | | | 2,702 | | | 28 | | | 2,730 | | | (111,531) | | | 499 | | | (111,032) | |
Fund VI(2) | 17,595 | | | (90) | | | 37 | | | (53) | | | (180) | | | 646 | | | 466 | |
Fund IV and V (1) | — | | | (43) | | | — | | | (43) | | | (204) | | | — | | | (204) | |
ANRP I and II(1)(2) | 166 | | | — | | | 15 | | | 15 | | | (21,418) | | | 275 | | | (21,143) | |
| Hybrid Value Fund | 49,535 | | | 20,346 | | | — | | | 20,346 | | | 49,535 | | | — | | | 49,535 | |
Other(1)(3) | 10,688 | | | 4,251 | | | 1,945 | | | 6,196 | | | (110,538) | | | 5,297 | | | (105,241) | |
| Total Private Equity | 610,269 | | | 355,875 | | | 2,025 | | | 357,900 | | | (377,628) | | | 6,717 | | | (370,911) | |
| Total Private Equity, net of profit sharing payable/expense | 366,908 | | | 227,837 | | | — | | | 227,837 | | | (230,714) | | | (304) | | | (231,018) | |
| Real Assets: | | | | | | | | | | | | | |
Principal Finance(1) | 112,942 | | | 27,413 | | | — | | | 27,413 | | | (98,820) | | | 35,025 | | | (63,795) | |
U.S. RE Fund I and II(1) | 8,783 | | | (8,067) | | | 3,514 | | | (4,553) | | | (29,592) | | | 8,138 | | | (21,454) | |
| AIOF I | 17,063 | | | (2,174) | | | 4,292 | | | 2,118 | | | (1,126) | | | 6,314 | | | 5,188 | |
Other(1)(3) | 6,961 | | | 486 | | | — | | | 486 | | | (27,829) | | | — | | | (27,829) | |
| Total Real Assets | 145,749 | | | 17,658 | | | 7,806 | | | 25,464 | | | (157,367) | | | 49,477 | | | (107,890) | |
| Total Real Assets, net of profit sharing payable/expense | 46,440 | | | 10,554 | | | — | | | 10,554 | | | (92,522) | | | — | | | (92,522) | |
| Total | $ | 1,115,720 | | | $ | 439,897 | | | $ | 19,648 | | | $ | 459,545 | | | $ | (449,288) | | | $ | 102,075 | | | $ | (347,213) | |
Total, net of profit sharing payable(4)/expense | $ | 464,906 | | | $ | 271,944 | | | $ | 2,204 | | | $ | 274,148 | | | $ | (280,086) | | | $ | 8,048 | | | $ | (272,038) | |
|
| | | | | | | | | | | | | | | | | | | | | | | | | | | |
| | As of
September 30, 2019 | | For the Three Months Ended September 30, 2019 | | For the Nine Months Ended September 30, 2019 |
| | Performance Fees Receivable on an Unconsolidated Basis | | Unrealized Performance Fees | | Realized Performance Fees | | Total Performance Fees | | Unrealized Performance Fees | | Realized Performance Fees | | Total Performance Fees |
| | (in thousands) |
| Credit: | | | | | | | | | | | | | |
Corporate Credit(1) | $ | 74,154 |
| | $ | 15,491 |
| | $ | 2,666 |
| | $ | 18,157 |
| | $ | 66,570 |
| | $ | 10,132 |
| | $ | 76,702 |
|
| Structured Credit | 187,441 |
| | 9,252 |
| | 2,677 |
| | 11,929 |
| | 45,768 |
| | 19,213 |
| | 64,981 |
|
| Direct Origination | 102,876 |
| | 9,094 |
| | 4,636 |
| | 13,730 |
| | 22,553 |
| | 11,913 |
| | 34,466 |
|
| Total Credit | $ | 364,471 |
| | $ | 33,837 |
| | $ | 9,979 |
| | $ | 43,816 |
| | $ | 134,891 |
| | $ | 41,258 |
| | $ | 176,149 |
|
| Total Credit, net of profit sharing expense | 117,867 |
| | 20,283 |
| | 8,305 |
| | 28,588 |
| | 76,762 |
| | 28,189 |
| | 104,951 |
|
| Private Equity: | | | | | | | | | | | | | |
Fund VIII(2) | $ | 796,534 |
| | $ | 173,585 |
| | $ | 57,270 |
| | $ | 230,855 |
| | $ | 355,339 |
| | $ | 124,803 |
| | $ | 480,142 |
|
Fund VII(1)(2) | 220 |
| | (66,978 | ) | | 700 |
| | (66,278 | ) | | (90,215 | ) | | 2,177 |
| | (88,038 | ) |
Fund VI(2) | 16,151 |
| | 567 |
| | 889 |
| | 1,456 |
| | 28,040 |
| | 2,808 |
| | 30,848 |
|
Fund IV and V(1) | — |
| | 109 |
| | — |
| | 109 |
| | (1,144 | ) | | — |
| | (1,144 | ) |
ANRP I and II(1)(2) | 48,372 |
| | (5,645 | ) | | 2,445 |
| | (3,200 | ) | | 14,058 |
| | 3,100 |
| | 17,158 |
|
Other(1)(3) | 82,493 |
| | 11,998 |
| | 2,438 |
| | 14,436 |
| | 29,624 |
| | 3,541 |
| | 33,165 |
|
| Total Private Equity | $ | 943,770 |
| | $ | 113,636 |
| | $ | 63,742 |
| | $ | 177,378 |
| | $ | 335,702 |
| | $ | 136,429 |
| | $ | 472,131 |
|
| Total Private Equity, net of profit sharing expense | 578,416 |
| | 83,016 |
| | 41,658 |
| | 124,674 |
| | 228,367 |
| | 72,529 |
| | 300,896 |
|
| Real Assets: | | | | | | | | | | | | | |
| Principal Finance | $ | 127,624 |
| | $ | 20,660 |
| | $ | — |
| | $ | 20,660 |
| | $ | 5,443 |
| | $ | 1,760 |
| | $ | 7,203 |
|
| U.S. RE Fund I & II | 13,287 |
| | 420 |
| | — |
| | 420 |
| | (2,871 | ) | | 1,645 |
| | (1,226 | ) |
| Infrastructure Equity Fund | 10,220 |
| | 5,143 |
| | — |
| | 5,143 |
| | 10,220 |
| | — |
| | 10,220 |
|
Other(3) | 18,906 |
| | 3,189 |
| | 162 |
| | 3,351 |
| | 7,562 |
| | (163 | ) | | 7,399 |
|
| Total Real Assets | $ | 170,037 |
| | $ | 29,412 |
| | $ | 162 |
| | $ | 29,574 |
| | $ | 20,354 |
| | $ | 3,242 |
| | $ | 23,596 |
|
| Total Real Assets, net of profit sharing expense | 98,712 |
| | 18,811 |
| | 97 |
| | 18,908 |
| | 14,482 |
| | 1,943 |
| | 16,425 |
|
| Total | $ | 1,478,278 |
| | $ | 176,885 |
| | $ | 73,883 |
| | $ | 250,768 |
| | $ | 490,947 |
| | $ | 180,929 |
| | $ | 671,876 |
|
Total, net of profit sharing expense(4) | $ | 794,995 |
| | $ | 122,110 |
| | $ | 50,060 |
| | $ | 172,170 |
| | $ | 319,611 |
| | $ | 102,661 |
| | $ | 422,272 |
|
| |
(1) | As of September 30, 2019, certain credit funds and certain private equity funds had $0.3 million and $213.6 million, respectively, in general partner obligations to return previously distributed performance fees. The fair value gain on investments and income at the fund level needed to reverse the general partner obligations for certain credit funds and certain private equity funds was $1.1 million and $1,622.6 million, respectively, as of September 30, 2019. |
| |
(2) | As of September 30, 2019, the remaining investments and escrow cash of Fund VIII were valued at 132% of the fund’s unreturned capital, which was above the required escrow ratio of 115%. As of September 30, 2019, the remaining investments and escrow cash of Fund VII, Fund VI, ANRP I and ANRP II were valued at 60%, 38%, 51% and 109% of the fund’s unreturned capital, respectively, which were below the required escrow ratio of 115%. As a result, these funds are required to place in escrow current and future performance fee distributions to the general partner until the specified return ratio of 115% is met (at the time of a future distribution) or upon liquidation. As of September 30, 2019, Fund VII had $128.5 million of gross performance fees, or $73.1 million net of profit sharing, in escrow. As of September 30, 2019, Fund VI had $167.6 million of gross performance fees, or $112.4 million net of profit sharing, in escrow. As of September 30, 2019, ANRP I had $40.2 million of gross performance fees, or $25.2 million net of profit sharing, in escrow. As of September 30, 2019, ANRP II had $21.0 million of gross performance fees, or $14.3 million net of profit sharing, in escrow. With respect to Fund VII, Fund VI, ANRP II and ANRP I, realized performance fees currently distributed to the general partner are limited to potential tax distributions and interest on escrow balances per the funds’ partnership agreements. Performance fees receivable as of September 30, 2019 and realized performance fees include interest earned on escrow balances that is not subject to contingent repayment. |
| |
(3) | Other includes certain SIAs. |
| |
(4) | There was a corresponding profit sharing payable of $693.6 million as of September 30, 2019, including profit sharing payable related to amounts in escrow and contingent consideration obligations of $96.4 million. |
(1)As of September 30, 2020, certain credit funds, certain private equity funds, and certain real asset funds had $0.8 million, $348.4 million, and $36.7 million, respectively, in general partner obligations to return previously distributed performance fees. The fair value gain on investments and income at the fund level needed to reverse the general partner obligations for certain credit funds, certain private equity funds and certain real assets funds was $0.8 million, $2,804.2 million and $70.1 million, respectively, as of September 30, 2020.
(2)As of September 30, 2020, the remaining investments and escrow cash of Fund VII, Fund VI, ANRP I and ANRP II were valued at 41%, 34%, 21% and 76% of the fund’s unreturned capital, respectively, which were below the required escrow ratio of 115%. As a result, these funds are required to place in escrow current and future performance fee distributions to the general partner until the specified return ratio of 115% is met (at the time of a future distribution) or upon liquidation. As of September 30, 2020, Fund VII had $128.5 million of gross performance fees, or $73.2 million net of profit sharing, in escrow. As of September 30, 2020, Fund VI had $167.6 million of gross performance fees, or $112.4 million net of profit sharing, in escrow. As of September 30, 2020, ANRP I had $40.2 million of gross performance fees, or $26.0 million net of profit sharing, in escrow. As of September 30, 2020, ANRP II had $31.2 million of gross performance fees, or $18.7 million net of profit sharing, in escrow. With respect to Fund VII, Fund VI, ANRP II and ANRP I, realized performance fees currently distributed to the general partner are limited to potential tax distributions and interest on escrow balances per these funds’ partnership agreements. Performance fees receivable as of September 30, 2020 and realized performance fees for the three and nine months ended September 30, 2020 include interest earned on escrow balances that is not subject to contingent repayment.
(3)Other includes certain SIAs.
(4)There was a corresponding profit sharing payable of $650.8 million as of September 30, 2020, including profit sharing payable related to amounts in escrow and contingent consideration obligations of $103.3 million.
The general partners of certain of our credit funds accrue performance fees, categorized as performance allocations, when the fair value of investments exceeds the cost basis of the individual investors’ investments in the fund, including any allocable share of expenses incurred in connection with such investments, which we refer to as “high water marks.” These high
water marks are applied on an individual investor basis. Certain of our credit funds have investors with various high water marks, the achievement of which is subject to market conditions and investment performance.
Performance fees from our private equity funds and certain credit and real assets funds are subject to contingent repayment by the general partner in the event of future losses to the extent that the cumulative performance fees distributed from
inception to date exceeds the amount computed as due to the general partner at the final distribution. These general partner obligations, if applicable, are included in due to related parties on the condensed consolidated statements of financial condition.
The following table summarizes our performance fees since inception for our combined segments through September 30, 2019:2020:
| | | | | | | | | | | | | | | | | | | | | | | | | | | | | |
| Performance Fees Since Inception(1) |
| | Undistributed by Fund and Recognized | | Distributed by Fund and Recognized(2) | | Total Undistributed and Distributed by Fund and Recognized(3) | | General Partner Obligation(3) | | Maximum Performance Fees Subject to Potential Reversal(4) |
| | (in millions) |
| Credit: | | | | | | | | | |
| Corporate Credit | $ | 152.2 | | | $ | 1,193.3 | | | $ | 1,345.5 | | | $ | 0.8 | | | $ | 175.0 | |
| Structured Credit | 125.3 | | | 170.5 | | | 295.8 | | | — | | | 124.5 | |
| Direct Origination | 54.8 | | | 46.6 | | | 101.4 | | | — | | | 54.3 | |
| Advisory and Other | 27.4 | | | — | | | 27.4 | | | — | | | 27.4 | |
| Total Credit | 359.7 | | | 1,410.4 | | | 1,770.1 | | | 0.8 | | | 381.2 | |
| Private Equity: | | | | | | | | | |
| Fund VIII | 532.2 | | | 818.6 | | | 1,350.8 | | | — | | | 1,061.4 | |
| Fund VII | — | | | 3,132.1 | | | 3,132.1 | | | 209.2 | | | 132.4 | |
| Fund VI | 17.6 | | | 1,663.9 | | | 1,681.5 | | | — | | | 0.7 | |
| Fund IV and V | — | | | 2,053.1 | | | 2,053.1 | | | 30.7 | | | 0.3 | |
| ANRP I and II | 0.2 | | | 104.7 | | | 104.9 | | | 32.0 | | | — | |
| Hybrid Value Fund | 49.5 | | | — | | | 49.5 | | | — | | | 49.5 | |
| | | | | | | | | |
| Other | 10.8 | | | 735.2 | | | 746.0 | | | 76.5 | | | 50.3 | |
| Total Private Equity | 610.3 | | | 8,507.6 | | | 9,117.9 | | | 348.4 | | | 1,294.6 | |
| Real Assets: | | | | | | | | | |
| Principal Finance | 112.9 | | | 420.4 | | | 533.3 | | | 13.4 | | | 279.7 | |
| U.S. RE Fund I and II | 8.8 | | | 36.0 | | | 44.8 | | | 15.7 | | | 24.0 | |
| AIOF I | 17.0 | | | 6.3 | | | 23.3 | | | — | | | 20.0 | |
Other(5) | 7.0 | | | 36.8 | | | 43.8 | | | 7.6 | | | 15.1 | |
| Total Real Assets | 145.7 | | | 499.5 | | | 645.2 | | | 36.7 | | | 338.8 | |
| Total | $ | 1,115.7 | | | $ | 10,417.5 | | | $ | 11,533.2 | | | $ | 385.9 | | | $ | 2,014.6 | |
(1)Certain funds are denominated in Euros and historical figures are translated into U.S. dollars at an exchange rate of €1.00 to $1.17 as of September 30, 2020. Certain funds are denominated in pound sterling and translated into U.S. dollars at an exchange rate of £1.00 to $1.29 as of September 30, 2020.
(2)Amounts in “Distributed by Fund and Recognized” for the Citi Property Investors (“CPI”), Gulf Stream Asset Management, LLC (“Gulf Stream”), Stone Tower Capital LLC and its related companies (“Stone Tower”) funds and SIAs are presented for activity subsequent to the respective acquisition dates. Amounts exclude certain performance fees from business development companies and Redding Ridge Holdings LP (“Redding Ridge Holdings”), an affiliate of Redding Ridge.
(3)Amounts were computed based on the fair value of fund investments on September 30, 2020. Performance fees have been allocated to and recognized by the general partner. Based on the amount allocated, a portion is subject to potential reversal or, to the extent applicable, has been reduced by the general partner obligation to return previously distributed performance fees at September 30, 2020. The actual determination and any required payment of any such general partner obligation would not take place until the final disposition of the fund’s investments based on contractual termination of the fund.
(4)Represents the amount of performance fees that would be reversed if remaining fund investments became worthless on September 30, 2020. Amounts subject to potential reversal of performance fees include amounts undistributed by a fund (i.e., the performance fees receivable), as well as a portion of the amounts that have been distributed by a fund, net of taxes and not subject to a general partner obligation to return previously distributed performance fees, except for those funds that are gross of taxes as defined in the respective funds’ governing documents.
(5)Other includes certain SIAs.
|
| | | | | | | | | | | | | | | | | | | |
| | Performance Fees Since Inception(1) |
| | Undistributed by Fund and Recognized | | Distributed by Fund and Recognized(2) | | Total Undistributed and Distributed by Fund and Recognized(3) | | General Partner Obligation(3) | | Maximum Performance Fees Subject to Potential Reversal(4) |
| | (in millions) |
| Credit: | | | | | | | | | |
| Corporate Credit | $ | 74.2 |
| | $ | 1,082.0 |
| | $ | 1,156.2 |
| | $ | 0.3 |
| | $ | 92.6 |
|
| Structured Credit | 187.4 |
| | 143.5 |
| | 330.9 |
| | — |
| | 166.9 |
|
| Direct Origination | 102.9 |
| | 12.0 |
| | 114.9 |
| | — |
| | 97.9 |
|
| Total Credit | 364.5 |
| | 1,237.5 |
| | 1,602.0 |
| | 0.3 |
| | 357.4 |
|
| Private Equity: | | | | | | | | | |
| Fund VIII | 796.5 |
| | 555.4 |
| | 1,351.9 |
| | — |
| | 1,147.0 |
|
| Fund VII | 0.2 |
| | 3,130.9 |
| | 3,131.1 |
| | 128.9 |
| | 335.8 |
|
| Fund VI | 16.2 |
| | 1,663.9 |
| | 1,680.1 |
| | — |
| | 3.8 |
|
| Fund IV and V | — |
| | 2,053.1 |
| | 2,053.1 |
| | 30.4 |
| | 0.5 |
|
| ANRP I and II | 48.4 |
| | 93.4 |
| | 141.8 |
| | 12.0 |
| | 66.5 |
|
| Other | 82.5 |
| | 707.1 |
| | 789.6 |
| | 42.3 |
| | 107.8 |
|
| Total Private Equity | 943.8 |
| | 8,203.8 |
| | 9,147.6 |
| | 213.6 |
| | 1,661.4 |
|
| Real Assets: | | | | | | | | | |
| Principal Finance | 127.6 |
| | 363.3 |
| | 490.9 |
| | — |
| | 255.5 |
|
| U.S. RE Fund I and II | 13.3 |
| | 27.8 |
| | 41.1 |
| | — |
| | 29.1 |
|
| Infrastructure Equity Fund | 10.2 |
| | — |
| | 10.2 |
| | — |
| | 10.2 |
|
Other(5) | 18.9 |
| | 36.9 |
| | 55.8 |
| | — |
| | 27.8 |
|
| Total Real Assets | 170.0 |
| | 428.0 |
| | 598.0 |
| | — |
| | 322.6 |
|
| Total | $ | 1,478.3 |
| | $ | 9,869.3 |
| | $ | 11,347.6 |
| | $ | 213.9 |
| | $ | 2,341.4 |
|
| |
(1) | Certain funds are denominated in Euros and historical figures are translated into U.S. dollars at an exchange rate of €1.00 to $1.09 as of September 30, 2019. Certain funds are denominated in pound sterling and translated into U.S. dollars at an exchange rate of £1.00 to $1.23 as of September 30, 2019. |
| |
(2) | Amounts in “Distributed by Fund and Recognized” for the CPI, Gulf Stream Asset Management, LLC (“Gulf Stream”), Stone Tower Capital LLC and its related companies (“Stone Tower”) funds and SIAs are presented for activity subsequent to the respective acquisition dates. |
| |
(3) | Amounts were computed based on the fair value of fund investments on September 30, 2019. Performance fees have been allocated to and recognized by the general partner. Based on the amount allocated, a portion is subject to potential reversal or, to the extent applicable, has been reduced by the general partner obligation to return previously distributed performance fees at September 30, 2019. The actual determination and any required payment of any such general partner obligation would not take place until the final disposition of the fund’s investments based on contractual termination of the fund. |
| |
(4) | Represents the amount of performance fees that would be reversed if remaining fund investments became worthless on September 30, 2019. Amounts subject to potential reversal of performance fees include amounts undistributed by a fund (i.e., the performance fees receivable), as well as a portion of the amounts that have been distributed by a fund, net of taxes and not subject to a general partner obligation to return previously distributed performance fees, except for those funds that are gross of taxes as defined in the respective funds’ governing documents. |
| |
(5) | Other includes certain SIAs. |
Expenses
Compensation and Benefits. Our most significant expense is compensation and benefits expense. This consists of fixed salary, discretionary and non-discretionary bonuses, profit sharing expense associated with the performance fees earned from credit, private equity, and real assets funds and compensation expense associated with the vesting of non-cash equity-based awards.
Our compensation arrangements with certain partners and employees contain a significant performance-based incentive component. Therefore, as our net revenues increase, our compensation costs rise. Our compensation costs also reflect the increased investment in people as we expand geographically and create new funds.
In addition, certain professionals and selected other individuals have a profit sharing interest in the performance fees earned in relation to our private equity, certain credit and real assets funds in order to better align their interests with our own and with those of the investors in these funds. Profit sharing expense is part of our compensation and benefits expense and is generally based upon a fixed percentage of credit, private equity and real assets performance fees. Profit sharing expense can reverse during periods when there is a decline in performance fees that were previously recognized. Profit sharing amounts are normally distributed to employees after the corresponding investment gains have been realized and generally before preferred returns are achieved for the investors. Therefore, changes in our unrealized performance fees have the same effect on our profit sharing expense. Profit sharing expense increases when unrealized performance fees increases. Realizations only impact profit sharing expense to the extent that the effects on investments have not been recognized previously. If losses on other investments within a fund are subsequently realized, the profit sharing amounts previously distributed are normally subject to a general partner obligation to return performance fees previously distributed back to the funds. This general partner obligation due to the funds would be realized only when the fund is liquidated, which generally occurs at the end of the fund’s term. However, indemnification obligations also exist for realized gains with respect to Fund IV, Fund V and Fund VI, which, although our Managing Partners and Contributing Partners would remain personally liable, may indemnify our Managing Partners and Contributing Partners for 17.5% to 100% of the previously distributed profits regardless of the fund’s future performance. See note 1415 to our condensed consolidated financial statements for further information regarding the Company’s indemnification liability.
Each Managing Partner receives $100,000 per year in base salary for services rendered to us. Additionally, our Managing Partners can receive other forms of compensation. In addition, AHL Awards (as defined in note 12 to our condensed consolidated financial statements) and other equity-based compensation awards have been granted to the Company and certain employees, which amortize over the respective vesting periods. The Company grants equity awards to certain employees, including RSUs, restricted Class A Common Stockshares and options, that generally vest and become exercisable in quarterly installments or annual installments depending on the contract terms over a period of three to six years. In some instances, vesting of an RSU is also subject to the Company’s receipt of performance fees, within prescribed periods, sufficient to cover the associated equity-based compensation expense. See note 1213 to our condensed consolidated financial statements for further discussion of equity-based compensation.
Other Expenses. The balance of our other expenses includes interest, placement fees, and general, administrative and other operating expenses. Interest expense consists primarily of interest related to the 2013 AMH Credit Facilities, the 2018 AMH Credit Facility, the 2024 Senior Notes, the 2026 Senior Notes, the 2029 Senior Notes, the 2030 Senior Notes, the 2039 Senior Secured Guaranteed Notes, and the 2048 Senior Notes and the 2050 Subordinated Notes as discussed in note 1011 to our condensed consolidated financial statements. Placement fees are incurred in connection with our capital raising activities. General, administrative and other expenses includes occupancy expense, depreciation and amortization, professional fees and costs related to travel, information technology and administration. Occupancy expense represents charges related to office leases and associated expenses, such as utilities and maintenance fees. Depreciation and amortization of fixed assets is normally calculated using the straight-line method over their estimated useful lives, ranging from two to sixteen years, taking into consideration any residual value. Leasehold improvements are amortized over the shorter of the useful life of the asset or the expected term of the lease. Intangible assets are amortized based on the future cash flows over the expected useful lives of the assets.
Other Income (Loss)
Net Gains (Losses) from Investment Activities. Net gains (losses) from investment activities include both realized gains and losses and the change in unrealized gains and losses in our investment portfolio between the opening reporting date and the closing reporting date. Net unrealized gains (losses) are a result of changes in the fair value of unrealized investments and reversal of unrealized gains (losses) due to dispositions of investments during the reporting period. Significant judgment and estimation goes into the assumptions that drive these models and the actual values realized with respect to investments could be materially different from values obtained based on the use of those models. The valuation methodologies applied impact the reported value of investment company holdings and their underlying portfolios in our condensed consolidated financial statements.
Net Gains (Losses) from Investment Activities of Consolidated Variable Interest Entities. Changes in the fair value of the consolidated VIEs’ assets and liabilities and related interest, dividend and other income and expenses subsequent to consolidation are presented within net gains (losses) from investment activities of consolidated variable interest entities and are attributable to Non-Controlling Interests in the condensed consolidated statements of operations.
Other Income (Losses), Net. Other income (losses), net includes gains (losses) arising from the remeasurement of foreign currency denominated assets and liabilities, remeasurement of the tax receivable agreement liability and other miscellaneous non-operating income and expenses.
Income Taxes. Prior to the Conversion, certain entities in the Apollo Operating Group operated as partnerships for U.S. federal income tax purposes. As a result, these members of the Apollo Operating Group were not subject to U.S. federal income taxes. However, certain of these entities were subject to New York City unincorporated business taxes (“NYC UBT”) and certain non-U.S. entities were subject to non-U.S. corporate income taxes. Effective September 5, 2019, Apollo Global Management, LLC converted from a Delaware limited liability company to a Delaware corporation named Apollo Global Management, Inc. Subsequent to the Conversion, we expect thatgenerally all of the income the Company earns will beis subject to U.S. corporate income taxes, which could result in an overall higher income tax expense (or benefit) in periods subsequent to the Conversion.
Significant judgment is required in determining the provision for income taxes and in evaluating income tax positions, including evaluating uncertainties. We recognize the income tax benefits of uncertain tax positions only where the position is “more likely than not” to be sustained upon examination, including resolutionsresolution of any related appeals or litigation, based on the technical merits of the positions. The tax benefit is measured as the largest amount of benefit that has a greater than 50% likelihood of being realized upon ultimate settlement. If a tax position is not considered more likely than not to be sustained, then no benefits of the position are recognized. The Company’s income tax positions are reviewed and evaluated quarterly to determine whether or not we have uncertain tax positions that require financial statement recognition or de-recognition.
Deferred tax assets and liabilities are recognized for the expected future tax consequences, using currently enacted tax rates, of differences between the carrying amount of assets and liabilities and their respective tax basis. The effect on deferred tax assets and liabilities of a change in tax rates is recognized in income in the period when the change is enacted. Deferred tax assets are reduced by a valuation allowance when it is more likely than not that some portion or all of the deferred tax assets will not be realized.
Non-Controlling Interests
For entities that are consolidated, but not 100% owned, a portion of the income or loss and corresponding equity is allocated to owners other than Apollo. The aggregate of the income or loss and corresponding equity that is not owned by the Company is included in Non-Controlling Interests in the condensed consolidated financial statements. The Non-Controlling Interests relating to Apollo Global Management, Inc. primarily include the 44.8%40.4% and 50.2%44.8% ownership interest in the Apollo Operating Group held by the Managing Partners and Contributing Partners through their limited partner interests in Holdings as of September 30, 2020 and 2019, and 2018, respectively. Additionally, as of September 30, 2020, Athene holds a 6.7% Non-Controlling Interest in the Apollo Operating Group as a result of the Transaction Agreement. Non-Controlling Interests also include limited partner interests in certain consolidated funds and VIEs.
The authoritative guidance for Non-Controlling Interests in the condensed consolidated financial statements requires reporting entities to present Non-Controlling Interest as equity and provides guidance on the accounting for transactions between an entity and Non-Controlling Interests. According to the guidance, (1) Non-Controlling Interests are presented as a separate component of stockholders’ equity on the Company’s condensed consolidated statements of financial condition, (2) net income (loss) includes the net income (loss) attributable to the Non-Controlling Interest holders on the Company’s condensed consolidated statements of operations, (3) the primary components of Non-Controlling Interest are separately presented in the Company’s condensed consolidated statements of changes in stockholders’ equity to clearly distinguish the interests in the Apollo Operating Group and other ownership interests in the consolidated entities and (4) profits and losses are allocated to Non-Controlling Interests in proportion to their ownership interests regardless of their basis.
Results of Operations
Below is a discussion of our condensed consolidated results of operations for the three and nine months ended September 30, 20192020 and 2018.2019. For additional analysis of the factors that affected our results at the segment level, see “—Segment Analysis” below:
| | | | | | | | | | | | | | | | | | | | | | | | | | | | | | | | | | | | | | | | | | | | | | | |
| | For the Three Months Ended
September 30, | | Amount
Change | | Percentage
Change | | For the Nine Months Ended September 30, | | Amount
Change | | Percentage
Change |
| | 2020 | | 2019 | | | 2020 | | 2019 | |
| Revenues: | (in thousands) | | | | (in thousands) | | |
| Management fees | $ | 433,570 | | | $ | 394,547 | | | $ | 39,023 | | | 9.9% | | $ | 1,240,127 | | | $ | 1,162,788 | | | $ | 77,339 | | | 6.7% |
| Advisory and transaction fees, net | 73,449 | | | 16,440 | | | 57,009 | | | 346.8 | | 172,369 | | | 67,133 | | | 105,236 | | | 156.8 |
| Investment income (loss): | | | | | | | | | | | | | | | |
| Performance allocations | 459,241 | | | 254,103 | | | 205,138 | | | 80.7 | | (350,483) | | | 682,462 | | | (1,032,945) | | | NM |
| Principal investment income (loss) | 50,722 | | | 33,393 | | | 17,329 | | | 51.9 | | (25,506) | | | 99,020 | | | (124,526) | | | NM |
| Total investment income (loss) | 509,963 | | | 287,496 | | | 222,467 | | | 77.4 | | (375,989) | | | 781,482 | | | (1,157,471) | | | NM |
| Incentive fees | 1,292 | | | 4,238 | | | (2,946) | | | (69.5) | | 21,016 | | | 5,674 | | | 15,342 | | | 270.4 |
| Total Revenues | 1,018,274 | | | 702,721 | | | 315,553 | | | 44.9 | | 1,057,523 | | | 2,017,077 | | | (959,554) | | | (47.6) |
| Expenses: | | | | | | | | | | | | | | | |
| Compensation and benefits: | | | | | | | | | | | | | | | |
| Salary, bonus and benefits | 163,197 | | | 126,695 | | | 36,502 | | | 28.8 | | 453,485 | | | 369,527 | | | 83,958 | | | 22.7 |
| Equity-based compensation | 49,726 | | | 42,665 | | | 7,061 | | | 16.5 | | 161,268 | | | 132,404 | | | 28,864 | | | 21.8 |
| Profit sharing expense | 191,809 | | | 88,610 | | | 103,199 | | | 116.5 | | (68,230) | | | 280,335 | | | (348,565) | | | NM |
| Total compensation and benefits | 404,732 | | | 257,970 | | | 146,762 | | | 56.9 | | 546,523 | | | 782,266 | | | (235,743) | | | (30.1) |
| Interest expense | 34,889 | | | 27,833 | | | 7,056 | | | 25.4 | | 98,422 | | | 70,243 | | | 28,179 | | | 40.1 |
| General, administrative and other | 90,822 | | | 85,313 | | | 5,509 | | | 6.5 | | 259,073 | | | 238,814 | | | 20,259 | | | 8.5 |
| Placement fees | 612 | | | 256 | | | 356 | | | 139.1 | | 1,380 | | | 591 | | | 789 | | | 133.5 |
| Total Expenses | 531,055 | | | 371,372 | | | 159,683 | | | 43.0 | | 905,398 | | | 1,091,914 | | | (186,516) | | | (17.1) |
| Other Income (Loss): | | | | | | | | | | | | | | | |
| Net gains (losses) from investment activities | 144,472 | | | (19,790) | | | 164,262 | | | NM | | (851,412) | | | 44,099 | | | (895,511) | | | NM |
| Net gains (losses) from investment activities of consolidated variable interest entities | 122,119 | | | 10,631 | | | 111,488 | | | NM | | 14,061 | | | 24,728 | | | (10,667) | | | (43.1) |
| Interest income | 1,485 | | | 10,152 | | | (8,667) | | | (85.4) | | 13,413 | | | 25,938 | | | (12,525) | | | (48.3) |
| Other income (loss), net | 10,161 | | | (43,144) | | | 53,305 | | | NM | | (3,019) | | | (36,451) | | | 33,432 | | | (91.7) |
| Total Other Income (Loss) | 278,237 | | | (42,151) | | | 320,388 | | | NM | | (826,957) | | | 58,314 | | | (885,271) | | | NM |
| Income (Loss) before income tax (provision) benefit | 765,456 | | | 289,198 | | | 476,258 | | | 164.7 | | (674,832) | | | 983,477 | | | (1,658,309) | | | NM |
| Income tax (provision) benefit | (89,357) | | | 231,896 | | | (321,253) | | | NM | | 66,173 | | | 195,345 | | | (129,172) | | | (66.1) |
| Net Income (Loss) | 676,099 | | | 521,094 | | | 155,005 | | | 29.7 | | (608,659) | | | 1,178,822 | | | (1,787,481) | | | NM |
| Net income (loss) attributable to Non-Controlling Interests | (403,700) | | | (157,824) | | | (245,876) | | | 155.8 | | 331,169 | | | (501,672) | | | 832,841 | | | NM |
| Net Income (Loss) Attributable to Apollo Global Management, Inc. | 272,399 | | | 363,270 | | | (90,871) | | | (25.0) | | (277,490) | | | 677,150 | | | (954,640) | | | NM |
| Series A Preferred Stock Dividends | (4,382) | | | (4,382) | | | — | | | — | | (13,148) | | | (13,148) | | | — | | | — |
| Series B Preferred Stock Dividends | (4,781) | | | (4,782) | | | 1 | | | — | | (14,344) | | | (14,344) | | | — | | | — |
| Net Income (Loss) Attributable to AGM Class A Shareholders | $ | 263,236 | | | $ | 354,106 | | | $ | (90,870) | | | (25.7)% | | $ | (304,982) | | | $ | 649,658 | | | $ | (954,640) | | | NM |
Note: “NM” denotes not meaningful. Changes from negative to positive amounts and positive to negative amounts are not considered meaningful. Increases or decreases from zero and changes greater than 500% are also not considered meaningful.
In March 2020, the World Health Organization declared the outbreak of a novel coronavirus (COVID-19) a pandemic, which has resulted in uncertainty and disruption in the global economy and financial markets. While we are unable to accurately predict the full impact that COVID-19 will have on our results from operations, financial condition, liquidity and cash flows due to numerous uncertainties, including the duration and severity of the pandemic and containment measures, our compliance with these measures has impacted our day-to-day operations and could disrupt our business and operations, as well as that of the Apollo Funds and their portfolio companies, for an indefinite period of time.
Three Months Ended September 30, 2020 Compared to Three Months Ended September 30, 2019
In this section, references to 2020 refer to the three months ended September 30, 2020 and references to 2019 refer to the three months ended September 30, 2019.
|
| | | | | | | | | | | | | | | | | | | | | | | | | | | | | |
| | For the Three Months Ended
September 30, | | Amount
Change | | Percentage
Change | | For the Nine Months Ended September 30, | | Amount
Change | | Percentage
Change |
| | 2019 | | 2018 | | | 2019 | | 2018 | |
| Revenues: | (in thousands) | | | | (in thousands) | | |
| Management fees | $ | 394,547 |
| | $ | 358,750 |
| | $ | 35,797 |
| | 10.0 | % | | $ | 1,162,788 |
| | $ | 987,102 |
| | $ | 175,686 |
| | 17.8 | % |
| Advisory and transaction fees, net | 16,440 |
| | 13,154 |
| | 3,286 |
| | 25.0 |
| | 67,133 |
| | 42,145 |
| | 24,988 |
| | 59.3 |
|
| Investment income: | | | | | | | | | | | | | | | |
| Performance allocations | 254,103 |
| | 124,856 |
| | 129,247 |
| | 103.5 |
| | 682,462 |
| | 129,776 |
| | 552,686 |
| | 425.9 |
|
| Principal investment income | 33,393 |
| | 16,153 |
| | 17,240 |
| | 106.7 |
| | 99,020 |
| | 25,334 |
| | 73,686 |
| | 290.9 |
|
| Total investment income | 287,496 |
| | 141,009 |
| | 146,487 |
| | 103.9 |
| | 781,482 |
| | 155,110 |
| | 626,372 |
| | 403.8 |
|
| Incentive fees | 4,238 |
| | 4,818 |
| | (580 | ) | | (12.0 | ) | | 5,674 |
| | 23,593 |
| | (17,919 | ) | | (76.0 | ) |
| Total Revenues | 702,721 |
| | 517,731 |
| | 184,990 |
| | 35.7 |
| | 2,017,077 |
| | 1,207,950 |
| | 809,127 |
| | 67.0 |
|
| Expenses: | | | | | | | | | | | | | | | |
| Compensation and benefits: | | | | | | | | | | | | | | | |
| Salary, bonus and benefits | 126,695 |
| | 112,722 |
| | 13,973 |
| | 12.4 |
| | 369,527 |
| | 343,623 |
| | 25,904 |
| | 7.5 |
|
| Equity-based compensation | 42,665 |
| | 50,334 |
| | (7,669 | ) | | (15.2 | ) | | 132,404 |
| | 123,643 |
| | 8,761 |
| | 7.1 |
|
| Profit sharing expense | 88,610 |
| | 63,059 |
| | 25,551 |
| | 40.5 |
| | 280,335 |
| | 121,327 |
| | 159,008 |
| | 131.1 |
|
| Total compensation and benefits | 257,970 |
| | 226,115 |
| | 31,855 |
| | 14.1 |
| | 782,266 |
| | 588,593 |
| | 193,673 |
| | 32.9 |
|
| Interest expense | 27,833 |
| | 15,209 |
| | 12,624 |
| | 83.0 |
| | 70,243 |
| | 44,168 |
| | 26,075 |
| | 59.0 |
|
| General, administrative and other | 85,313 |
| | 70,657 |
| | 14,656 |
| | 20.7 |
| | 238,814 |
| | 194,851 |
| | 43,963 |
| | 22.6 |
|
| Placement fees | 256 |
| | 746 |
| | (490 | ) | | (65.7 | ) | | 591 |
| | 1,384 |
| | (793 | ) | | (57.3 | ) |
| Total Expenses | 371,372 |
| | 312,727 |
| | 58,645 |
| | 18.8 |
| | 1,091,914 |
| | 828,996 |
| | 262,918 |
| | 31.7 |
|
| Other Income (Loss): | | | | | | | | | | | | | | | |
| Net gains (losses) from investment activities | (19,790 | ) | | 155,283 |
| | (175,073 | ) | | NM |
| | 44,099 |
| | 20,645 |
| | 23,454 |
| | 113.6 |
|
| Net gains from investment activities of consolidated variable interest entities | 10,631 |
| | 13,001 |
| | (2,370 | ) | | (18.2 | ) | | 24,728 |
| | 28,746 |
| | (4,018 | ) | | (14.0 | ) |
| Interest income | 10,152 |
| | 5,411 |
| | 4,741 |
| | 87.6 |
| | 25,938 |
| | 13,517 |
| | 12,421 |
| | 91.9 |
|
| Other income, net | (43,144 | ) | | 3,085 |
| | (46,229 | ) | | NM |
| | (36,451 | ) | | 1,888 |
| | (38,339 | ) | | NM |
|
| Total Other Income (Loss) | (42,151 | ) | | 176,780 |
| | (218,931 | ) | | NM |
| | 58,314 |
| | 64,796 |
| | (6,482 | ) | | (10.0 | ) |
| Income before income tax (provision) benefit | 289,198 |
| | 381,784 |
| | (92,586 | ) | | (24.3 | ) | | 983,477 |
| | 443,750 |
| | 539,727 |
| | 121.6 |
|
| Income tax (provision) benefit | 231,896 |
| | (19,092 | ) | | 250,988 |
| | NM |
| | 195,345 |
| | (46,596 | ) | | 241,941 |
| | NM |
|
| Net Income | 521,094 |
| | 362,692 |
| | 158,402 |
| | 43.7 |
| | 1,178,822 |
| | 397,154 |
| | 781,668 |
| | 196.8 |
|
| Net income attributable to Non-Controlling Interests | (157,824 | ) | | (191,171 | ) | | 33,347 |
| | (17.4 | ) | | (501,672 | ) | | (220,285 | ) | | (281,387 | ) | | 127.7 |
|
| Net Income Attributable to Apollo Global Management, Inc. | 363,270 |
| | 171,521 |
| | 191,749 |
| | 111.8 |
| | 677,150 |
| | 176,869 |
| | 500,281 |
| | 282.9 |
|
| Series A Preferred Stock Dividends | (4,382 | ) | | (4,383 | ) | | 1 |
| | — |
| | (13,148 | ) | | (13,149 | ) | | 1 |
| | — |
|
| Series B Preferred Stock Dividends | (4,782 | ) | | (4,781 | ) | | (1 | ) | | — |
| | (14,344 | ) | | (9,350 | ) | | (4,994 | ) | | 53.4 |
|
| Net Income Attributable to Apollo Global Management, Inc. Class A Common Stockholders | $ | 354,106 |
| | $ | 162,357 |
| | $ | 191,749 |
| | 118.1 | % | | $ | 649,658 |
| | $ | 154,370 |
| | $ | 495,288 |
| | 320.8 | % |
| |
Note: | “NM” denotes not meaningful. Changes from negative to positive amounts and positive to negative amounts are not considered meaningful. Increases or decreases from zero and changes greater than 500% are also not considered meaningful. |
Revenues
Our revenues and other income include fixed components that result from measures of capital and asset valuations and variable components that result from realized and unrealized investment performance, as well as the value of successfully completed transactions.
Three Months Ended September 30, 2019 Compared to Three Months Ended September 30, 2018
Management fees increased by $35.8$39.0 million for the three months ended September 30, 2019 as compared to the three months ended September 30, 2018.$433.6 million in 2020 from $394.5 million in 2019. This change was primarily attributable to an increase in management fees earned from Athene and Athora of $23.0$29.9 million as well as modest increases across our segments, during the three months ended September 30, 2019 as compared
to the same periodand $20.5 million, respectively. This increase was offset, in 2018.part by a decrease in management fees earned from Fund VIII and Fund VII of $4.5 million and $2.9 million, respectively, in 2020. For additional details regarding changes in management fees in each segment, see “—Segment Analysis” below.
Advisory and transaction fees, net, increased by $3.3$57.0 million for the three months ended September 30, 2019 as compared to the three months ended September 30, 2018.$73.4 million in 2020 from $16.4 million in 2019. This change was primarily attributable to an increase in netdriven by advisory and transaction fees earned with respectrelated to Fund VIII’s portfolio companies of $2.9 million during the three months ended September 30, 2019 as compared to the same period in 2018.a long-term strategic investment for an underlying real estate portfolio.
Performance allocations increased by $129.2$205.1 million for the three months ended September 30, 2019 as compared to the three months ended September 30, 2018. The increase$459.2 million in performance allocations2020 from $254.1 million in 2019. This change was primarily attributable to increased performance allocations earned from Fund VIII, and EPF III of $141.7 million and $29.5 million, respectively, partially offset by decreases in performance allocations earned from Fund VII and Fund VIAthora of $29.8$89.5 million, $69.0 million and $26.4$27.4 million, respectively, for the three months ended September 30, 2019 as compared to the same period in 2018.2020.
The increase in performance allocations from Fund VIII was primarily driven by greater appreciation in the value of the fund’s investments in private and public portfolio companies primarily in the manufacturing and industrial, consumer services, and financial services, media, telecom, technology, and consumer and retail sectors during the three months ended September 30, 2019 as compared to the same period during 2018.in 2020. The increase in performance allocations from EPF III was primarily driven by the fund achieving its annualized hurdle rate during the three months ended September 30, 2019, which did not occur in the same period during 2018. The decrease in performance allocations from Fund VII was primarily attributable to depreciation in the value of the fund’s investments in public portfolio companies primarily in the natural resources sector and private investments in the media, telecom and technology sectors during the three months ended September 30, 2019 as compared to the same period during 2018. The decrease in performance fees from Fund VI was primarily driven by decreased appreciation in the value of the fund’s investments in a public portfolio companies primarilycompany in the leisureconsumer and chemicals sectors, duringretail sector. The increase in performance allocations from Athora was driven by appreciation in the three months ended September 30, 2019 as compared tovaluation of the same period during 2018.underlying portfolio.
Principal investment income increased by $17.2$17.3 million for the three months ended September 30, 2019, as compared to the three months ended September 30, 2018.$50.7 million in 2020 from $33.4 million in 2019. This change was primarily driven by an increaseincreases in the value of investments held by certain Apollo funds and other entities in which the Company has a direct interest, mainly with respect to Athora, Fund VIII of $17.0 million during the three months ended September 30, 2019 as compared to the same period in 2018.
Nine Months Ended September 30, 2019 Compared to Nine Months Ended September 30, 2018
Management fees increased by $175.7 million for the nine months ended September 30, 2019 as compared to the nine months ended September 30, 2018. This change was primarily attributable to an increase in management fees earned from AtheneIX and Fund IXVII of $89.2$6.2 million, $6.2 million and $79.5$3.9 million, respectively, during nine months ended September 30, 2019, compared to the same period during 2018. For additional details regarding changes in management fees in each segment, see “—Segment Analysis” below.
Advisory and transaction fees, net, increased by $25.0 million for the nine months ended September 30, 2019 as compared to the nine months ended September 30, 2018. This change was primarily attributable to an increase in net advisory and transaction fees earned with respect to Fund IX’s investments in portfolio companies and Hybrid Value Fund’s investments in portfolio companies of $14.0 million and $10.1 million, respectively, during the nine months ended September 30, 2019, as compared to the same period during 2018.
Performance allocations increased by $552.7 million for the nine months ended September 30, 2019 as compared to the nine months ended September 30, 2018. The increase in performance allocations was primarily attributable to increased performance allocations earned from Fund VIII, SCRF IV and Fund VI of $498.0 million, $30.4 million and $29.9 million, respectively, partially offset by a decrease in performance allocations earned from Fund VII of $95.9 million during the nine months ended September 30, 2019, as compared to the same period during 2018.
The increase in performance allocations from Fund VIII was primarily driven by greater appreciation in the value of the fund’s investments in private portfolio companies primarily in the manufacturing and industrial and consumer services sectors, and appreciation in the value of the fund’s investments in public portfolio companies in the business services and financial services sectors, during the nine months ended September 30, 2019 as compared to the same period during 2018. The increase in performance fees from SCRF IV was primarily driven by income from the fund’s investments in CLO liabilities and synthetic structured CDOs during the nine months ended September 30, 2019 as compared to the same period during 2018. The increase in performance fees from Fund VI was primarily driven by appreciation in the value of the fund’s investments in public portfolio companies primarily in the leisure sector, during the nine months ended September 30, 2019 as compared to the same period during 2018. The decrease in performance allocations from Fund VII was primarily attributable to depreciation in the value of the fund’s investments in public portfolio companies primarily in the natural resources and business services sectors and depreciation of the fund’s private
investments primarily in the media, telecom and technology sector during the nine months ended September 30, 2019 as compared to the same period during 2018.
Principal investment income increased by $73.7 million for the nine months ended September 30, 2019, as compared to the nine months ended September 30, 2018. This change was primarily driven by an increase in the value of investments held by certain Apollo funds and other entities in which the Company has a direct interest, mainly with respect to Fund VIII of $59.4 million during the nine months ended September 30, 2019 as compared to the same period in 2018.
Incentive fees decreased by $17.9 million for the nine months ended September 30, 2019 as compared to the nine months ended September 30, 2018. This change was primarily attributable to a decrease in incentive fees earned from AINV and a strategic investment account of $11.9 million and $8.8 million, respectively, during the nine months ended September 30, 2019 as compared to the same period in 2018. The decrease in incentive fees earned from AINV was a result of the amended and restated investment management agreement with AINV which was revised to be on a total return measure, as described in note 14 to our condensed consolidated financial statements.2020.
Expenses
Three Months Ended September 30, 2019 Compared to Three Months Ended September 30, 2018
Compensation and benefits increased by $31.9$146.8 million for the three months ended September 30, 2019, as compared to the three months ended September 30, 2018.$404.7 million in 2020 from $258.0 million in 2019. This change was primarily attributable to an increase in profit sharing expense of $25.6$103.2 million due to a corresponding increase in performance allocations during the three months ended September 30, 2019, as compared to the same period in 2018.2020. In any period the blended profit sharing percentage is impacted by the respective profit sharing ratios of the funds generating performance allocations in the period. In addition,Additionally, salary, bonus and benefits increased by $14.0$36.5 million primarily due to an increase in headcount.headcount, and equity-based compensation increased $7.1 million due to higher amortization expenses associated with previously granted performance awards.
Included in profit sharing expense is $16.3$8.3 million for the three months ended September 30, 20182020 related to a performance based incentive arrangement for certain Apollo partners and employees designed to more closely align compensation with the overall realized performance of the Company on an annual basis (referred to herein as the “Incentive Pool”).Incentive Pool. There was no profit sharing expense related to the Incentive Pool for the three months ended September 30, 2019. Allocations to participants in the Incentive Pool contain both a fixed component and a discretionary component, each of which may vary year to year. The Incentive Pool is separate from the fund related profit sharing expense and may result in greater variability in compensation and have a variable impact on the blended profit sharing percentage during a particular period. See “—Profit Sharing Expense” in the Critical Accounting Policies section for an overview of the Incentive Pool.
Interest expense increased by $12.6$7.1 million for the three months ended September 30,to $34.9 million in 2020 from $27.8 million in 2019, as compared to the three months ended September 30, 2018, primarily due to additional interest expense incurred during the three months ended September 30, 2019 as a result of the issuances of the 20292030 Senior Notes and 2039 Senior Secured Guaranteed2050 Subordinated Notes, as described in note 1011 to our condensed consolidated financial statements.
General, administrative and other expenses increased by $14.7$5.5 million for the three months ended September 30,to $90.8 million in 2020 from $85.3 million in 2019 as compared to the three months ended September 30, 2018, primarily due to an increase in professional fees and fund organizational expenses during the three months ended September 30, 2019, as compared to the same period in 2018.technology expenses.
Nine Months Ended September 30, 2019 Compared to Nine Months Ended September 30, 2018Other Income (Loss)
Compensation and benefitsNet gains from investment activities increased by $193.7$164.3 million forto $144.5 million in 2020 from net losses of $19.8 million in 2019. As discussed in note 15, the nine months ended September 30, 2019, as compared to the nine months ended September 30, 2018. This change was primarily attributable toCompany acquired an increase in profit sharing expenseadditional 35.5 million shares of $159.0 million due to a corresponding increase in performance allocations during the nine months ended September 30, 2019, as compared to the same period in 2018. In any period the blended profit sharing percentage is impacted by the respective profit sharing ratios of the funds generating performance allocations in the period. In addition, salary, bonus and benefits increased by $25.9 million primarily due to an increase in headcount.
Included in profit sharing expense is $17.0 million and $50.7 million for the nine months ended September 30, 2019 and 2018, respectively, related to the Incentive Pool. See “—Profit Sharing Expense” in the Critical Accounting Policies section for an overview of the Incentive Pool.
Interest expense increased by $26.1 million for the nine months ended September 30, 2019, as compared to the nine months ended September 30, 2018, primarily due to additional interest expense incurred during the nine months ended September 30, 2019Athene Holding, as a result of the issuancesTransaction Agreement, increasing the Company’s total ownership of the 2029 Senior Notes and 2039 Senior Secured Guaranteed Notes, as described in note 10Athene Holding’s shares to our condensed consolidated financial statements.
General, administrative and other expenses increased by $44.054.6 million for the nine months endedat September 30, 2019,2020 as compared to the nine months ended19.1 million shares as of September 30, 2018. This change was primarily driven by an increase in professional fees and fund organizational expenses during the nine months ended September 30, 2019 as compared to the same period in 2018.
Other Income (Loss)
Three Months Ended September 30, 2019 Compared to Three Months Ended September 30, 2018
2019. Net losses from investment activities were $19.8 million for the three months ended September 30, 2019, as compared to net gains from investment activities of $155.3 million for the three months ended September 30, 2018. This change wasin 2020 were primarily attributable to a loss onappreciation in the share price of Athene Holding and the Company’s investment inacquisition of additional shares of Athene Holding duringpursuant to the three months ended September 30, 2019 as compared to a gain on the Company’s investment in Athene Holding during the three months ended September 30, 2018.Transaction Agreement. See note 67 and 15 to the condensed consolidated financial statements for further information regarding the Company’s investment in Athene Holding.
Net gains from investment activities of consolidated VIEs decreasedincreased by $2.4$111.5 million for the three months ended September 30, 2019, as compared to the three months ended September 30, 2018,$122.1 million in 2020 from $10.6 million in 2019. This change was primarily driven by a decrease in net gains from Champ, L.P.newly consolidated funds during the three months ended September 30, 2019,2020 as compared to the same perioddiscussed in 2018. See note 56 to the condensed consolidated financial statements for details regarding net gains from investment activities of consolidated VIEs.statements.
Interest income increaseddecreased by $4.7$8.7 million for the three months ended September 30,to $1.5 million in 2020 from $10.2 million in 2019 as compared to the three months ended September 30, 2018, primarily due to increaseddecreased interest income earned from U.S. Treasury securities heldas a result of lower interest rates during the three months ended September 30, 2019, as compared to the same period in 2018.2020.
Other income increased by $53.3 million to $10.2 million in 2020 from a loss net was $43.1of $(43.1) million during the three months ended September 30,in 2019. The loss in 2019 as compared to other income, net of $3.1 million during the three months ended September 30, 2018. This change was primarily attributable to losses from the change in tax receivable agreement liability, which did not occur during the three months ended September 30, 2019.
Nine Months Ended September 30, 2019 Compared to Nine Months Ended September 30, 2018
Net gains from investment activities increased by $23.5 million for the nine months ended September 30, 2019, as compared to the nine months ended September 30, 2018. This change was primarily attributable to increased appreciation on the Company’s investment in Athene Holding during the nine months ended September 30, 2019, as compared to the same period in 2018. See note 6 to the condensed consolidated financial statements for further information regarding the Company’s investment in Athene Holding.
Net gains from investment activities of consolidated VIEs decreased by $4.0 million for the nine months ended September 30, 2019, as compared to the nine months ended September 30, 2018, primarily driven by a decrease in net gains from Champ, L.P. during the nine months ended September 30, 2019, as compared to the same period in 2018. See note 5 to the condensed consolidated financial statements for details regarding net gains from investment activities of consolidated VIEs.
Interest income increased by $12.4 million for the nine months ended September 30, 2019, as compared to the nine months ended September 30, 2018, primarily due to increased interest income earned from U.S. Treasury securities held during the nine months ended September 30, 2018, as compared to the same period in 2018.
Other loss, net was $36.5 million during the nine months ended September 30, 2019, as compared to other income, net of $1.9 million during the nine months ended September 30, 2018. This change was primarily attributable to losses from the change in tax receivable agreement liability during the nine months ended September 30, 2019.2020.
Net Income Attributable to Non-Controlling Interests and Series A and Series B Preferred Stockholders
For information related to net income attributable to Non-Controlling Interests and net income attributable to Series A and Series B Preferred Stockholders, see note 1314 to the condensed consolidated financial statements.
Private Equity
The following table summarizes the investment record for distressed investments made in our traditional private equity fund portfolios, since the Company’s inception. All amounts are as of September 30, 2020:
| | | | | | | | | | | | | | | | | |
| Total Invested Capital | | Total Value | | Gross IRR |
| | (in millions) | | |
| Distressed for Control | $ | 7,795 | | | $ | 18,823 | | | 29 | % |
| Non-Control Distressed | 5,558 | | | 8,842 | | | 71 | |
| Total | 13,353 | | | 27,665 | | | 49 | |
Corporate Carve-outs, Opportunistic Buyouts and Other Credit(1) | 51,129 | | | 87,183 | | | 21 | |
| Total | $ | 64,482 | | | $ | 114,848 | | | 39 | % |
(1)Other Credit is defined as investments in debt securities of issuers other than portfolio companies that are not considered to be distressed.
The following tables provide additional detail on the composition of the Fund VIII and Fund VII private equity portfolios based on investment strategy. Amounts for Fund I, II, III, IV, V, VI and IX are included in the table above but not presented below as their remaining value is less than $100 million, the fund has been liquidated or the fund commenced investing capital less than 24 months prior to September 30, 2020 and such information was deemed not meaningful. All amounts are as of September 30, 2020:
Fund VIII(1)
| | | | | | | | | | | |
| Total Invested Capital | | Total Value |
| | (in millions) |
| Corporate Carve-outs | $ | 2,704 | | | $ | 5,760 | |
| Opportunistic Buyouts | 12,777 | | | 18,032 | |
Distressed(2) | 567 | | | 761 | |
| Total | $ | 16,048 | | | $ | 24,553 | |
Fund VII(1)
| | | | | | | | | | | |
| Total Invested Capital | | Total Value |
| | (in millions) |
| Corporate Carve-outs | $ | 2,539 | | | $ | 3,466 | |
| Opportunistic Buyouts | 4,339 | | | 10,498 | |
Distressed/Other Credit(2) | 9,583 | | | 18,553 | |
| Total | $ | 16,461 | | | $ | 32,517 | |
(1)Committed capital less unfunded capital commitments for Fund VIII and Fund VII were $16.1 billion and $14.4 billion, respectively, which represents capital commitments from limited partners to invest in such funds less capital that is available for investment or reinvestment subject to the provisions of the applicable limited partnership agreement or other governing agreements.
(2)The distressed investment strategy includes distressed for control, non-control distressed and other credit.
During the recovery and expansionary periods of 1994 through 2000 and late 2003 through the first half of 2007, our private equity funds invested or committed to invest approximately $13.7 billion primarily in traditional and corporate partner buyouts. During the recessionary periods of 1990 through 1993, 2001 through late 2003 and the recessionary and post recessionary periods (beginning the second half of 2007 through September 30, 2020), our private equity funds have invested $59.1 billion, of which $20.8 billion was in distressed buyouts and debt investments when the debt securities of quality companies traded at deep discounts to par value. Our average entry multiple for Fund VIII, VII and VI was 5.7x, 6.1x and 7.7x, respectively, as of September 30, 2020. Our average entry multiple for a private equity fund is the average of the total enterprise value over an applicable adjusted earnings before interest, taxes, depreciation and amortization, which may incorporate certain adjustments based on the investment team’s estimates and we believe captures the true economics of our funds’ investments in portfolio companies. The average entry multiple of actively investing funds may include committed investments not yet closed.
Permanent Capital
The following table summarizes the investment record for our permanent capital vehicles by segment, excluding Athene-related and Athora-related assets managed or advised by ISG and ISGI:
| | | | | | | | | | | | | | | | | | | | | | | | | | | | | | | | | | | |
| | | | | Total Returns(1) |
| IPO Year(2) | | Total AUM | | For the Three Months Ended September 30, 2020 | | For the Nine Months Ended September 30, 2020 | | For the Three Months Ended September 30, 2019 | | For the Nine Months Ended September 30, 2019 |
| Credit: | | | (in millions) | | | | | | | | |
MidCap(3) | N/A | | $ | 8,124 | | | 4 | % | | 3 | % | | 4 | % | | 13 | % |
| AIF | 2013 | | 332 | | | 4 | | | (11) | | | 5 | % | | 17 | % |
| AFT | 2011 | | 362 | | | 5 | | | (11) | | | 1 | % | | 9 | % |
AINV/Other(4) | 2004 | | 4,475 | | | (10) | | | (45) | | | 5 | % | | 41 | % |
| Real Assets: | | | | | | | | | | | |
| ARI | 2009 | | 6,964 | | | (5) | % | | (44) | % | | 7 | % | | 24 | % |
| Total | | | $ | 20,257 | | | | | | | | | |
(1)Total returns are based on the change in closing trading prices during the respective periods presented taking into account dividends and distributions, if any, as if they were reinvested without regard to commission.
(2)An initial public offering (“IPO”) year represents the year in which the vehicle commenced trading on a national securities exchange.
(3)MidCap is not a publicly traded vehicle and therefore IPO year is not applicable. The returns presented are a gross return based on NAV. The net returns based on NAV were 2% and 3% for the three months ended September 30, 2020 and September 30, 2019, respectively, and 0% and 9% for the nine months ended September 30, 2020 and September 30, 2019, respectively.
(4)Total AUM is as of June 30, 2020. Refer to www.apolloic.com for the most recent financial information on AINV. Included within Total AUM of AINV/Other is $1.7 billion of AUM related to a non-traded business development company from which Apollo earns investment-related service fees, but for which Apollo does not provide management or advisory services. Total returns exclude performance related to this AUM.
SIAs
As of September 30, 2020, Apollo managed approximately $29 billion of total AUM in SIAs, which include capital deployed from certain SIAs across Apollo’s credit, private equity and real assets funds.
Overview of Results of Operations
Revenues
Advisoryand Transaction Fees, Net. As a result of providing advisory services with respect to actual and potential credit, private equity, and real assets investments, we are entitled to receive fees for transactions related to the acquisition and, in certain instances, disposition of portfolio companies as well as fees for ongoing monitoring of portfolio company operations and directors’ fees. We also receive advisory fees for advisory services provided to certain credit funds. In addition, monitoring fees are generated on certain structured portfolio company investments. Under the terms of the limited partnership agreements for certain funds, the management fee payable by the funds may be subject to a reduction based on a certain percentage of such advisory and transaction fees, net of applicable broken deal costs (“Management Fee Offset”). Such amounts are presented as a reduction to advisory and transaction fees, net, in the condensed consolidated statements of operations (see note 2 to our condensed consolidated financial statements for more detail on advisory and transaction fees, net).
The Management Fee Offsets are calculated for each fund as follows:
•65%-100% for certain credit funds, gross advisory, transaction and other special fees;
•65%-100% for private equity funds, gross advisory, transaction and other special fees; and
•65%-100% for certain real assets funds, gross advisory, transaction and other special fees.
Management Fees. The significant growth of the assets we manage has had a positive effect on our revenues. Management fees are typically calculated based upon any of “net asset value,” “gross assets,” “adjusted par asset value,” “adjusted costs of all unrealized portfolio investments,” “capital commitments,” “invested capital,” “adjusted assets,” “capital contributions,” or “stockholders’ equity,” each as defined in the applicable limited partnership agreement and/or management agreement of the unconsolidated funds.
Performance Fees. The general partners of our funds are entitled to an incentive return of normally up to 20% of the total returns of a fund’s capital, depending upon performance of the underlying funds and subject to preferred returns and high water marks, as applicable. Performance fees, categorized as performance allocations, are accounted for as an equity method investment, and effectively, the performance fees for any period are based upon an assumed liquidation of the funds’ assets at the reporting date, and distribution of the net proceeds in accordance with the funds’ allocation provisions. Performance fees categorized as incentive fees, which are not accounted as an equity method investment, are deferred until fees are probable to not be significantly reversed. Prior to the adoption of the new revenue recognition guidance, incentive fees were recognized on an assumed liquidation basis. The majority of performance fees are comprised of performance allocations.
As of September 30, 2020, approximately 55% of the value of our funds’ investments on a gross basis was determined using market-based valuation methods (i.e., reliance on broker or listed exchange quotes) and the remaining 45% was determined primarily by comparable company and industry multiples or discounted cash flow models. For our credit, private equity and real assets segments, the percentage determined using market-based valuation methods as of September 30, 2020 was 73%, 19% and 19%, respectively. See “Item 1A. Risk Factors—Risks Related to Our Businesses—Our funds’ performance, and our performance, may be adversely affected by the financial performance of our funds’ portfolio companies and the industries in which our funds invest” in the 2019 Annual report for a discussion regarding certain industry-specific risks that could affect the fair value of our private equity funds’ portfolio company investments.
In our private equity funds, the Company does not earn performance fees until the investors in the fund have achieved cumulative investment returns on invested capital (including management fees and expenses) in excess of an 8% hurdle rate. Additionally, certain of our credit and real assets funds have various performance fee rates and hurdle rates. Certain of our credit and real assets funds allocate performance fees to the general partner in a similar manner as the private equity funds. In our private equity, certain credit and real assets funds, so long as the investors achieve their priority returns, there is a catch-up formula whereby the Company earns a priority return for a portion of the return until the Company’s performance fees equate to its incentive fee rate for that fund; thereafter, the Company participates in returns from the fund at the performance fee rate. Performance fees, categorized as performance allocations, are subject to reversal to the extent that the performance fees distributed exceed the amount due to the general partner based on a fund’s cumulative investment returns. The Company recognizes potential repayment of previously received performance fees as a general partner obligation representing all amounts previously distributed to the general partner that would need to be repaid to the Apollo funds if these funds were to be liquidated based on the current fair value of the underlying funds’ investments as of the reporting date. The actual general partner obligation, however, would not become payable or realized until the end of a fund’s life or as otherwise set forth in the respective limited partnership agreement of the fund.
The table below presents an analysis of Apollo’s (i) performance fees receivable on an unconsolidated basis and (ii) realized and unrealized performance fees for Apollo’s combined segments:
| | | | | | | | | | | | | | | | | | | | | | | | | | | | | | | | | | | | | | | | | |
| | As of
September 30, 2020 | | For the Three Months Ended September 30, 2020 | | For the Nine Months Ended September 30, 2020 |
| | Performance Fees Receivable on an Unconsolidated Basis | | Unrealized Performance Fees | | Realized Performance Fees | | Total Performance Fees | | Unrealized Performance Fees | | Realized Performance Fees | | Total Performance Fees |
| | (in thousands) |
| Credit: | | | | | | | | | | | | | |
Corporate Credit (1) | $ | 152,204 | | | $ | 37,063 | | | $ | 6,436 | | | $ | 43,499 | | | $ | 133,590 | | | $ | 22,777 | | | $ | 156,367 | |
| Structured Credit | 125,366 | | | (5,061) | | | — | | | (5,061) | | | (65,276) | | | 13,846 | | | (51,430) | |
| Direct Origination | 54,772 | | | 7,002 | | | 3,381 | | | 10,383 | | | (9,967) | | | 9,258 | | | (709) | |
| Advisory and Other | 27,360 | | | 27,360 | | | — | | | 27,360 | | | 27,360 | | | — | | | 27,360 | |
| Total Credit | 359,702 | | | 66,364 | | | 9,817 | | | 76,181 | | | 85,707 | | | 45,881 | | | 131,588 | |
| Total Credit, net of profit sharing payable/expense | 51,558 | | | 33,553 | | | 2,204 | | | 35,757 | | | 43,150 | | | 8,352 | | | 51,502 | |
| Private Equity: | | | | | | | | | | | | | |
| Fund VIII | 532,239 | | | 328,709 | | | — | | | 328,709 | | | (183,292) | | | — | | | (183,292) | |
Fund VII(1)(2) | 46 | | | 2,702 | | | 28 | | | 2,730 | | | (111,531) | | | 499 | | | (111,032) | |
Fund VI(2) | 17,595 | | | (90) | | | 37 | | | (53) | | | (180) | | | 646 | | | 466 | |
Fund IV and V (1) | — | | | (43) | | | — | | | (43) | | | (204) | | | — | | | (204) | |
ANRP I and II(1)(2) | 166 | | | — | | | 15 | | | 15 | | | (21,418) | | | 275 | | | (21,143) | |
| Hybrid Value Fund | 49,535 | | | 20,346 | | | — | | | 20,346 | | | 49,535 | | | — | | | 49,535 | |
Other(1)(3) | 10,688 | | | 4,251 | | | 1,945 | | | 6,196 | | | (110,538) | | | 5,297 | | | (105,241) | |
| Total Private Equity | 610,269 | | | 355,875 | | | 2,025 | | | 357,900 | | | (377,628) | | | 6,717 | | | (370,911) | |
| Total Private Equity, net of profit sharing payable/expense | 366,908 | | | 227,837 | | | — | | | 227,837 | | | (230,714) | | | (304) | | | (231,018) | |
| Real Assets: | | | | | | | | | | | | | |
Principal Finance(1) | 112,942 | | | 27,413 | | | — | | | 27,413 | | | (98,820) | | | 35,025 | | | (63,795) | |
U.S. RE Fund I and II(1) | 8,783 | | | (8,067) | | | 3,514 | | | (4,553) | | | (29,592) | | | 8,138 | | | (21,454) | |
| AIOF I | 17,063 | | | (2,174) | | | 4,292 | | | 2,118 | | | (1,126) | | | 6,314 | | | 5,188 | |
Other(1)(3) | 6,961 | | | 486 | | | — | | | 486 | | | (27,829) | | | — | | | (27,829) | |
| Total Real Assets | 145,749 | | | 17,658 | | | 7,806 | | | 25,464 | | | (157,367) | | | 49,477 | | | (107,890) | |
| Total Real Assets, net of profit sharing payable/expense | 46,440 | | | 10,554 | | | — | | | 10,554 | | | (92,522) | | | — | | | (92,522) | |
| Total | $ | 1,115,720 | | | $ | 439,897 | | | $ | 19,648 | | | $ | 459,545 | | | $ | (449,288) | | | $ | 102,075 | | | $ | (347,213) | |
Total, net of profit sharing payable(4)/expense | $ | 464,906 | | | $ | 271,944 | | | $ | 2,204 | | | $ | 274,148 | | | $ | (280,086) | | | $ | 8,048 | | | $ | (272,038) | |
(1)As of September 30, 2020, certain credit funds, certain private equity funds, and certain real asset funds had $0.8 million, $348.4 million, and $36.7 million, respectively, in general partner obligations to return previously distributed performance fees. The fair value gain on investments and income at the fund level needed to reverse the general partner obligations for certain credit funds, certain private equity funds and certain real assets funds was $0.8 million, $2,804.2 million and $70.1 million, respectively, as of September 30, 2020.
(2)As of September 30, 2020, the remaining investments and escrow cash of Fund VII, Fund VI, ANRP I and ANRP II were valued at 41%, 34%, 21% and 76% of the fund’s unreturned capital, respectively, which were below the required escrow ratio of 115%. As a result, these funds are required to place in escrow current and future performance fee distributions to the general partner until the specified return ratio of 115% is met (at the time of a future distribution) or upon liquidation. As of September 30, 2020, Fund VII had $128.5 million of gross performance fees, or $73.2 million net of profit sharing, in escrow. As of September 30, 2020, Fund VI had $167.6 million of gross performance fees, or $112.4 million net of profit sharing, in escrow. As of September 30, 2020, ANRP I had $40.2 million of gross performance fees, or $26.0 million net of profit sharing, in escrow. As of September 30, 2020, ANRP II had $31.2 million of gross performance fees, or $18.7 million net of profit sharing, in escrow. With respect to Fund VII, Fund VI, ANRP II and ANRP I, realized performance fees currently distributed to the general partner are limited to potential tax distributions and interest on escrow balances per these funds’ partnership agreements. Performance fees receivable as of September 30, 2020 and realized performance fees for the three and nine months ended September 30, 2020 include interest earned on escrow balances that is not subject to contingent repayment.
(3)Other includes certain SIAs.
(4)There was a corresponding profit sharing payable of $650.8 million as of September 30, 2020, including profit sharing payable related to amounts in escrow and contingent consideration obligations of $103.3 million.
The general partners of certain of our credit funds accrue performance fees, categorized as performance allocations, when the fair value of investments exceeds the cost basis of the individual investors’ investments in the fund, including any allocable share of expenses incurred in connection with such investments, which we refer to as “high water marks.” These high
water marks are applied on an individual investor basis. Certain of our credit funds have investors with various high water marks, the achievement of which is subject to market conditions and investment performance.
Performance fees from our private equity funds and certain credit and real assets funds are subject to contingent repayment by the general partner in the event of future losses to the extent that the cumulative performance fees distributed from inception to date exceeds the amount computed as due to the general partner at the final distribution. These general partner obligations, if applicable, are included in due to related parties on the condensed consolidated statements of financial condition.
The following table summarizes our performance fees since inception for our combined segments through September 30, 2020:
| | | | | | | | | | | | | | | | | | | | | | | | | | | | | |
| Performance Fees Since Inception(1) |
| | Undistributed by Fund and Recognized | | Distributed by Fund and Recognized(2) | | Total Undistributed and Distributed by Fund and Recognized(3) | | General Partner Obligation(3) | | Maximum Performance Fees Subject to Potential Reversal(4) |
| | (in millions) |
| Credit: | | | | | | | | | |
| Corporate Credit | $ | 152.2 | | | $ | 1,193.3 | | | $ | 1,345.5 | | | $ | 0.8 | | | $ | 175.0 | |
| Structured Credit | 125.3 | | | 170.5 | | | 295.8 | | | — | | | 124.5 | |
| Direct Origination | 54.8 | | | 46.6 | | | 101.4 | | | — | | | 54.3 | |
| Advisory and Other | 27.4 | | | — | | | 27.4 | | | — | | | 27.4 | |
| Total Credit | 359.7 | | | 1,410.4 | | | 1,770.1 | | | 0.8 | | | 381.2 | |
| Private Equity: | | | | | | | | | |
| Fund VIII | 532.2 | | | 818.6 | | | 1,350.8 | | | — | | | 1,061.4 | |
| Fund VII | — | | | 3,132.1 | | | 3,132.1 | | | 209.2 | | | 132.4 | |
| Fund VI | 17.6 | | | 1,663.9 | | | 1,681.5 | | | — | | | 0.7 | |
| Fund IV and V | — | | | 2,053.1 | | | 2,053.1 | | | 30.7 | | | 0.3 | |
| ANRP I and II | 0.2 | | | 104.7 | | | 104.9 | | | 32.0 | | | — | |
| Hybrid Value Fund | 49.5 | | | — | | | 49.5 | | | — | | | 49.5 | |
| | | | | | | | | |
| Other | 10.8 | | | 735.2 | | | 746.0 | | | 76.5 | | | 50.3 | |
| Total Private Equity | 610.3 | | | 8,507.6 | | | 9,117.9 | | | 348.4 | | | 1,294.6 | |
| Real Assets: | | | | | | | | | |
| Principal Finance | 112.9 | | | 420.4 | | | 533.3 | | | 13.4 | | | 279.7 | |
| U.S. RE Fund I and II | 8.8 | | | 36.0 | | | 44.8 | | | 15.7 | | | 24.0 | |
| AIOF I | 17.0 | | | 6.3 | | | 23.3 | | | — | | | 20.0 | |
Other(5) | 7.0 | | | 36.8 | | | 43.8 | | | 7.6 | | | 15.1 | |
| Total Real Assets | 145.7 | | | 499.5 | | | 645.2 | | | 36.7 | | | 338.8 | |
| Total | $ | 1,115.7 | | | $ | 10,417.5 | | | $ | 11,533.2 | | | $ | 385.9 | | | $ | 2,014.6 | |
(1)Certain funds are denominated in Euros and historical figures are translated into U.S. dollars at an exchange rate of €1.00 to $1.17 as of September 30, 2020. Certain funds are denominated in pound sterling and translated into U.S. dollars at an exchange rate of £1.00 to $1.29 as of September 30, 2020.
(2)Amounts in “Distributed by Fund and Recognized” for the Citi Property Investors (“CPI”), Gulf Stream Asset Management, LLC (“Gulf Stream”), Stone Tower Capital LLC and its related companies (“Stone Tower”) funds and SIAs are presented for activity subsequent to the respective acquisition dates. Amounts exclude certain performance fees from business development companies and Redding Ridge Holdings LP (“Redding Ridge Holdings”), an affiliate of Redding Ridge.
(3)Amounts were computed based on the fair value of fund investments on September 30, 2020. Performance fees have been allocated to and recognized by the general partner. Based on the amount allocated, a portion is subject to potential reversal or, to the extent applicable, has been reduced by the general partner obligation to return previously distributed performance fees at September 30, 2020. The actual determination and any required payment of any such general partner obligation would not take place until the final disposition of the fund’s investments based on contractual termination of the fund.
(4)Represents the amount of performance fees that would be reversed if remaining fund investments became worthless on September 30, 2020. Amounts subject to potential reversal of performance fees include amounts undistributed by a fund (i.e., the performance fees receivable), as well as a portion of the amounts that have been distributed by a fund, net of taxes and not subject to a general partner obligation to return previously distributed performance fees, except for those funds that are gross of taxes as defined in the respective funds’ governing documents.
(5)Other includes certain SIAs.
Expenses
Compensation and Benefits. Our most significant expense is compensation and benefits expense. This consists of fixed salary, discretionary and non-discretionary bonuses, profit sharing expense associated with the performance fees earned from credit, private equity, and real assets funds and compensation expense associated with the vesting of non-cash equity-based awards.
Our compensation arrangements with certain partners and employees contain a significant performance-based incentive component. Therefore, as our net revenues increase, our compensation costs rise. Our compensation costs also reflect the increased investment in people as we expand geographically and create new funds.
In addition, certain professionals and selected other individuals have a profit sharing interest in the performance fees earned in relation to our private equity, certain credit and real assets funds in order to better align their interests with our own and with those of the investors in these funds. Profit sharing expense is part of our compensation and benefits expense and is generally based upon a fixed percentage of credit, private equity and real assets performance fees. Profit sharing expense can reverse during periods when there is a decline in performance fees that were previously recognized. Profit sharing amounts are normally distributed to employees after the corresponding investment gains have been realized and generally before preferred returns are achieved for the investors. Therefore, changes in our unrealized performance fees have the same effect on our profit sharing expense. Profit sharing expense increases when unrealized performance fees increases. Realizations only impact profit sharing expense to the extent that the effects on investments have not been recognized previously. If losses on other investments within a fund are subsequently realized, the profit sharing amounts previously distributed are normally subject to a general partner obligation to return performance fees previously distributed back to the funds. This general partner obligation due to the funds would be realized only when the fund is liquidated, which generally occurs at the end of the fund’s term. However, indemnification obligations also exist for realized gains with respect to Fund IV, Fund V and Fund VI, which, although our Managing Partners and Contributing Partners would remain personally liable, may indemnify our Managing Partners and Contributing Partners for 17.5% to 100% of the previously distributed profits regardless of the fund’s future performance. See note 15 to our condensed consolidated financial statements for further information regarding the Company’s indemnification liability.
Each Managing Partner receives $100,000 per year in base salary for services rendered to us. Additionally, our Managing Partners can receive other forms of compensation. In addition, AHL Awards and other equity-based compensation awards have been granted to the Company and certain employees, which amortize over the respective vesting periods. The Company grants equity awards to certain employees, including RSUs, restricted Class A shares and options, that generally vest and become exercisable in quarterly installments or annual installments depending on the contract terms over a period of three to six years. In some instances, vesting of an RSU is also subject to the Company’s receipt of performance fees, within prescribed periods, sufficient to cover the associated equity-based compensation expense. See note 13 to our condensed consolidated financial statements for further discussion of equity-based compensation.
Other Expenses. The balance of our other expenses includes interest, placement fees, and general, administrative and other operating expenses. Interest expense consists primarily of interest related to the 2024 Senior Notes, the 2026 Senior Notes, the 2029 Senior Notes, the 2030 Senior Notes, the 2039 Senior Secured Guaranteed Notes, the 2048 Senior Notes and the 2050 Subordinated Notes as discussed in note 11 to our condensed consolidated financial statements. Placement fees are incurred in connection with our capital raising activities. General, administrative and other expenses includes occupancy expense, depreciation and amortization, professional fees and costs related to travel, information technology and administration. Occupancy expense represents charges related to office leases and associated expenses, such as utilities and maintenance fees. Depreciation and amortization of fixed assets is normally calculated using the straight-line method over their estimated useful lives, ranging from two to sixteen years, taking into consideration any residual value. Leasehold improvements are amortized over the shorter of the useful life of the asset or the expected term of the lease. Intangible assets are amortized based on the future cash flows over the expected useful lives of the assets.
Other Income Tax Provision(Loss)
Net Gains (Losses) from Investment Activities. Net gains (losses) from investment activities include both realized gains and losses and the change in unrealized gains and losses in our investment portfolio between the opening reporting date and the closing reporting date. Net unrealized gains (losses) are a result of changes in the fair value of unrealized investments and reversal of unrealized gains (losses) due to dispositions of investments during the reporting period. Significant judgment and estimation goes into the assumptions that drive these models and the actual values realized with respect to investments could be materially different from values obtained based on the use of those models. The valuation methodologies applied impact the reported value of investment company holdings and their underlying portfolios in our condensed consolidated financial statements.
Net Gains (Losses) from Investment Activities of Consolidated Variable Interest Entities. Changes in the fair value of the consolidated VIEs’ assets and liabilities and related interest, dividend and other income and expenses subsequent to consolidation are presented within net gains (losses) from investment activities of consolidated variable interest entities and are attributable to Non-Controlling Interests in the condensed consolidated statements of operations.
Other Income (Losses), Net. Other income (losses), net includes gains (losses) arising from the remeasurement of foreign currency denominated assets and liabilities, remeasurement of the tax receivable agreement liability and other miscellaneous non-operating income and expenses.
Income Taxes. Prior to the Conversion, certain entities in the Apollo Operating Group operated as partnerships for U.S. federal income tax purposes. As a result, these members of the Apollo Operating Group were not subject to U.S. federal income taxes. However, certain of these entities were subject to New York City unincorporated business taxes (“NYC UBT”) and certain non-U.S. entities were subject to non-U.S. corporate income taxes. Effective September 5, 2019, Apollo Global Management, LLC converted from a Delaware limited liability company converted to a Delaware corporation named Apollo Global Management, Inc. Prior to the Conversion, a portion of the investment income, performance allocations and principal investment income we earned was not subject to corporate-level tax in the United States. Subsequent to the Conversion, we expect thatgenerally all of the income we earn will beis subject to U.S. corporate income taxes, which could result in an overall higher income tax expense (or benefit) in periods subsequent to the Conversion. The
Significant judgment is required in determining the provision for income taxes includes federal, state and localin evaluating income taxestax positions, including evaluating uncertainties. We recognize the income tax benefits of uncertain tax positions only where the position is “more likely than not” to be sustained upon examination, including resolution of any related appeals or litigation, based on the technical merits of the positions. The tax benefit is measured as the largest amount of benefit that has a greater than 50% likelihood of being realized upon ultimate settlement. If a tax position is not considered more likely than not to be sustained, then no benefits of the position are recognized. The Company’s income tax positions are reviewed and evaluated quarterly to determine whether or not we have uncertain tax positions that require financial statement recognition or de-recognition.
Deferred tax assets and liabilities are recognized for the expected future tax consequences, using currently enacted tax rates, of differences between the carrying amount of assets and liabilities and their respective tax basis. The effect on deferred tax assets and liabilities of a change in tax rates is recognized in income in the United Statesperiod when the change is enacted. Deferred tax assets are reduced by a valuation allowance when it is more likely than not that some portion or all of the deferred tax assets will not be realized.
Non-Controlling Interests
For entities that are consolidated, but not 100% owned, a portion of the income or loss and foreigncorresponding equity is allocated to owners other than Apollo. The aggregate of the income taxes.or loss and corresponding equity that is not owned by the Company is included in Non-Controlling Interests in the condensed consolidated financial statements. The Non-Controlling Interests relating to Apollo Global Management, Inc. primarily include the 40.4% and 44.8% ownership interest in the Apollo Operating Group held by the Managing Partners and Contributing Partners through their limited partner interests in Holdings as of September 30, 2020 and 2019, respectively. Additionally, as of September 30, 2020, Athene holds a 6.7% Non-Controlling Interest in the Apollo Operating Group as a result of the Transaction Agreement. Non-Controlling Interests also include limited partner interests in certain consolidated funds and VIEs.
The authoritative guidance for Non-Controlling Interests in the condensed consolidated financial statements requires reporting entities to present Non-Controlling Interest as equity and provides guidance on the accounting for transactions between an entity and Non-Controlling Interests. According to the guidance, (1) Non-Controlling Interests are presented as a separate component of stockholders’ equity on the Company’s condensed consolidated statements of financial condition, (2) net income (loss) includes the net income (loss) attributable to the Non-Controlling Interest holders on the Company’s condensed consolidated statements of operations, (3) the primary components of Non-Controlling Interest are separately presented in the Company’s condensed consolidated statements of changes in stockholders’ equity to clearly distinguish the interests in the Apollo Operating Group and other ownership interests in the consolidated entities and (4) profits and losses are allocated to Non-Controlling Interests in proportion to their ownership interests regardless of their basis.
Results of Operations
Below is a discussion of our condensed consolidated results of operations for the three and nine months ended September 30, 2020 and 2019. For additional analysis of the factors that affected our results at the segment level, see “—Segment Analysis” below:
| | | | | | | | | | | | | | | | | | | | | | | | | | | | | | | | | | | | | | | | | | | | | | | |
| | For the Three Months Ended
September 30, | | Amount
Change | | Percentage
Change | | For the Nine Months Ended September 30, | | Amount
Change | | Percentage
Change |
| | 2020 | | 2019 | | | 2020 | | 2019 | |
| Revenues: | (in thousands) | | | | (in thousands) | | |
| Management fees | $ | 433,570 | | | $ | 394,547 | | | $ | 39,023 | | | 9.9% | | $ | 1,240,127 | | | $ | 1,162,788 | | | $ | 77,339 | | | 6.7% |
| Advisory and transaction fees, net | 73,449 | | | 16,440 | | | 57,009 | | | 346.8 | | 172,369 | | | 67,133 | | | 105,236 | | | 156.8 |
| Investment income (loss): | | | | | | | | | | | | | | | |
| Performance allocations | 459,241 | | | 254,103 | | | 205,138 | | | 80.7 | | (350,483) | | | 682,462 | | | (1,032,945) | | | NM |
| Principal investment income (loss) | 50,722 | | | 33,393 | | | 17,329 | | | 51.9 | | (25,506) | | | 99,020 | | | (124,526) | | | NM |
| Total investment income (loss) | 509,963 | | | 287,496 | | | 222,467 | | | 77.4 | | (375,989) | | | 781,482 | | | (1,157,471) | | | NM |
| Incentive fees | 1,292 | | | 4,238 | | | (2,946) | | | (69.5) | | 21,016 | | | 5,674 | | | 15,342 | | | 270.4 |
| Total Revenues | 1,018,274 | | | 702,721 | | | 315,553 | | | 44.9 | | 1,057,523 | | | 2,017,077 | | | (959,554) | | | (47.6) |
| Expenses: | | | | | | | | | | | | | | | |
| Compensation and benefits: | | | | | | | | | | | | | | | |
| Salary, bonus and benefits | 163,197 | | | 126,695 | | | 36,502 | | | 28.8 | | 453,485 | | | 369,527 | | | 83,958 | | | 22.7 |
| Equity-based compensation | 49,726 | | | 42,665 | | | 7,061 | | | 16.5 | | 161,268 | | | 132,404 | | | 28,864 | | | 21.8 |
| Profit sharing expense | 191,809 | | | 88,610 | | | 103,199 | | | 116.5 | | (68,230) | | | 280,335 | | | (348,565) | | | NM |
| Total compensation and benefits | 404,732 | | | 257,970 | | | 146,762 | | | 56.9 | | 546,523 | | | 782,266 | | | (235,743) | | | (30.1) |
| Interest expense | 34,889 | | | 27,833 | | | 7,056 | | | 25.4 | | 98,422 | | | 70,243 | | | 28,179 | | | 40.1 |
| General, administrative and other | 90,822 | | | 85,313 | | | 5,509 | | | 6.5 | | 259,073 | | | 238,814 | | | 20,259 | | | 8.5 |
| Placement fees | 612 | | | 256 | | | 356 | | | 139.1 | | 1,380 | | | 591 | | | 789 | | | 133.5 |
| Total Expenses | 531,055 | | | 371,372 | | | 159,683 | | | 43.0 | | 905,398 | | | 1,091,914 | | | (186,516) | | | (17.1) |
| Other Income (Loss): | | | | | | | | | | | | | | | |
| Net gains (losses) from investment activities | 144,472 | | | (19,790) | | | 164,262 | | | NM | | (851,412) | | | 44,099 | | | (895,511) | | | NM |
| Net gains (losses) from investment activities of consolidated variable interest entities | 122,119 | | | 10,631 | | | 111,488 | | | NM | | 14,061 | | | 24,728 | | | (10,667) | | | (43.1) |
| Interest income | 1,485 | | | 10,152 | | | (8,667) | | | (85.4) | | 13,413 | | | 25,938 | | | (12,525) | | | (48.3) |
| Other income (loss), net | 10,161 | | | (43,144) | | | 53,305 | | | NM | | (3,019) | | | (36,451) | | | 33,432 | | | (91.7) |
| Total Other Income (Loss) | 278,237 | | | (42,151) | | | 320,388 | | | NM | | (826,957) | | | 58,314 | | | (885,271) | | | NM |
| Income (Loss) before income tax (provision) benefit | 765,456 | | | 289,198 | | | 476,258 | | | 164.7 | | (674,832) | | | 983,477 | | | (1,658,309) | | | NM |
| Income tax (provision) benefit | (89,357) | | | 231,896 | | | (321,253) | | | NM | | 66,173 | | | 195,345 | | | (129,172) | | | (66.1) |
| Net Income (Loss) | 676,099 | | | 521,094 | | | 155,005 | | | 29.7 | | (608,659) | | | 1,178,822 | | | (1,787,481) | | | NM |
| Net income (loss) attributable to Non-Controlling Interests | (403,700) | | | (157,824) | | | (245,876) | | | 155.8 | | 331,169 | | | (501,672) | | | 832,841 | | | NM |
| Net Income (Loss) Attributable to Apollo Global Management, Inc. | 272,399 | | | 363,270 | | | (90,871) | | | (25.0) | | (277,490) | | | 677,150 | | | (954,640) | | | NM |
| Series A Preferred Stock Dividends | (4,382) | | | (4,382) | | | — | | | — | | (13,148) | | | (13,148) | | | — | | | — |
| Series B Preferred Stock Dividends | (4,781) | | | (4,782) | | | 1 | | | — | | (14,344) | | | (14,344) | | | — | | | — |
| Net Income (Loss) Attributable to AGM Class A Shareholders | $ | 263,236 | | | $ | 354,106 | | | $ | (90,870) | | | (25.7)% | | $ | (304,982) | | | $ | 649,658 | | | $ | (954,640) | | | NM |
Note: “NM” denotes not meaningful. Changes from negative to positive amounts and positive to negative amounts are not considered meaningful. Increases or decreases from zero and changes greater than 500% are also not considered meaningful.
In March 2020, the World Health Organization declared the outbreak of a novel coronavirus (COVID-19) a pandemic, which has resulted in uncertainty and disruption in the global economy and financial markets. While we are unable to accurately predict the full impact that COVID-19 will have on our results from operations, financial condition, liquidity and cash flows due to numerous uncertainties, including the duration and severity of the pandemic and containment measures, our compliance with these measures has impacted our day-to-day operations and could disrupt our business and operations, as well as that of the Apollo Funds and their portfolio companies, for an indefinite period of time.
Three Months Ended September 30, 20192020 Compared to Three Months Ended September 30, 20182019
The income tax provision decreased by $251.0 million for the three months ended September 30, 2019, as comparedIn this section, references to 2020 refer to the three months ended September 30, 2018. The decrease in the income tax provision was primarily related2020 and references to the benefit recorded as a result of the following Conversion related items: (i) the step-up in assets from prior exchanges of AOG Units for Class A shares and (ii) the inclusion of certain partnerships previously not subject to federal income taxes. The additional benefit is offset by the mix of earnings when comparing the amount of earnings that are subject to corporate-level tax to those earnings that are not subject to corporate-level tax as such earnings are passed through to Non-Controlling Interests. The provision for income taxes includes federal, state, local and foreign income taxes resulting in an effective income tax rate of (80.2)% and 5.0% for the three months ended September 30, 2019 and 2018, respectively. Excluding the impact of the Conversion, the Company’s estimated effective tax rate would have been approximately 8.5% for the three months ended September 30, 2019. The most significant reconciling items between our U.S. federal statutory income tax rate and our effective income tax rate were due to the following: (i) income passed through to Non-Controlling Interests and (ii) the impacts upon Conversion noted above (see note 9 to the condensed consolidated financial statements for further details regarding the Company’s income tax provision).
Nine Months Ended September 30, 2019 Compared to Nine Months Ended September 30, 2018
The income tax provision decreased by $241.9 million for the nine months ended September 30, 2019, as compared to the nine months ended September 30, 2018. The decrease in the income tax provision was primarily related to the benefit recorded as a result of the following Conversion related items: (i) the step-up in assets from prior exchanges of AOG Units for Class A shares and (ii) the inclusion of certain partnerships previously not subject to federal income taxes. The additional benefit is offset by the mix of earnings when comparing the amount of earnings that are subject to corporate-level tax to those earnings that are not subject to corporate-level tax as such earnings are passed through to Non-Controlling Interests. The provision for income taxes includes federal, state, local and foreign income taxes resulting in an effective income tax rate of (19.9)% and 10.5% for the nine months ended September 30, 2019 and 2018, respectively. Excluding the impact of the Conversion, the Company’s estimated effective tax rate would have been approximately 6.3% for the nine months ended September 30, 2019. The most significant reconciling items between our U.S. federal statutory income tax rate and our effective income tax rate were due to the following: (i) income passed through to Non-Controlling Interests and (ii) the impacts upon Conversion noted above (see note 9 to the condensed consolidated financial statements for further details regarding the Company’s income tax provision).
Segment Analysis
Discussed below are our results of operations for each of our reportable segments. They represent the segment information available and utilized by our executive management, which consists of our Managing Partners, who operate collectively as our chief operating decision maker, to assess performance and to allocate resources. See note 16 to our condensed consolidated financial statements for more information regarding our segment reporting.
Our financial results vary, since performance fees, which generally constitute a large portion of the income from the funds that we manage, as well as the transaction and advisory fees that we receive, can vary significantly from quarter to quarter and year to year. As a result, we emphasize long-term financial growth and profitability to manage our business.
Credit
The following table sets forth our segment statement of operations information and our supplemental performance measure, Segment Distributable Earnings, within our credit segment.
|
| | | | | | | | | | | | | | | | | | | | | | | | | | | | | |
| | For the Three Months Ended September 30, | | Total Change | | Percentage Change | | For the Nine Months Ended September 30, | | Total Change | | Percentage Change |
| | 2019 | | 2018 | | | | 2019 | | 2018 | | |
| | (in thousands) | | | | | | | | | | |
| Credit: | | | | | | | | | | | | | | | |
| Management fees | $ | 198,867 |
| | $ | 167,178 |
| | $ | 31,689 |
| | 19.0 | % | | $ | 571,884 |
| | $ | 470,070 |
| | $ | 101,814 |
| | 21.7 | % |
| Advisory and transaction fees, net | 5,530 |
| | 2,189 |
| | 3,341 |
| | 152.6 |
| | 13,888 |
| | 6,484 |
| | 7,404 |
| | 114.2 |
|
Performance fees(1) | 6,449 |
| | 7,064 |
| | (615 | ) | | (8.7 | ) | | 16,371 |
| | 18,105 |
| | (1,734 | ) | | (9.6 | ) |
| Fee Related Revenues | 210,846 |
| | 176,431 |
| | 34,415 |
| | 19.5 |
| | 602,143 |
| | 494,659 |
| | 107,484 |
| | 21.7 |
|
| Salary, bonus and benefits | (51,746 | ) | | (44,642 | ) | | (7,104 | ) | | 15.9 |
| | (146,515 | ) | | (134,192 | ) | | (12,323 | ) | | 9.2 |
|
| General, administrative and other | (33,403 | ) | | (31,392 | ) | | (2,011 | ) | | 6.4 |
| | (92,546 | ) | | (85,603 | ) | | (6,943 | ) | | 8.1 |
|
| Placement fees | (190 | ) | | (295 | ) | | 105 |
| | (35.6 | ) | | (42 | ) | | (850 | ) | | 808 |
| | (95.1 | ) |
| Fee Related Expenses | (85,339 | ) | | (76,329 | ) | | (9,010 | ) | | 11.8 |
| | (239,103 | ) | | (220,645 | ) | | (18,458 | ) | | 8.4 |
|
| Other income (loss), net of Non-Controlling Interest | (597 | ) | | 265 |
| | (862 | ) | | NM |
| | 967 |
| | 2,260 |
| | (1,293 | ) | | (57.2 | ) |
| Fee Related Earnings | 124,910 |
| | 100,367 |
| | 24,543 |
| | 24.5 |
| | 364,007 |
| | 276,274 |
| | 87,733 |
| | 31.8 |
|
| Realized performance fees | 3,530 |
| | 11,281 |
| | (7,751 | ) | | (68.7 | ) | | 24,887 |
| | 29,030 |
| | (4,143 | ) | | (14.3 | ) |
| Realized profit sharing expense | (1,674 | ) | | (8,986 | ) | | 7,312 |
| | (81.4 | ) | | (13,069 | ) | | (23,313 | ) | | 10,244 |
| | (43.9 | ) |
| Net Realized Performance Fees | 1,856 |
| | 2,295 |
| | (439 | ) | | (19.1 | ) | | 11,818 |
| | 5,717 |
| | 6,101 |
| | 106.7 |
|
| Realized principal investment income | 5,845 |
| | 6,676 |
| | (831 | ) | | (12.4 | ) | | 16,803 |
| | 16,887 |
| | (84 | ) | | (0.5 | ) |
| Net interest loss and other | (6,106 | ) | | (3,612 | ) | | (2,494 | ) | | 69.0 |
| | (15,148 | ) | | (11,082 | ) | | (4,066 | ) | | 36.7 |
|
| Segment Distributable Earnings | $ | 126,505 |
| | $ | 105,726 |
| | $ | 20,779 |
| | 19.7 | % | | $ | 377,480 |
| | $ | 287,796 |
| | $ | 89,684 |
| | 31.2 | % |
| |
(1) | Represents certain performance fees from business development companies and Redding Ridge Holdings. |
Three Months Ended September 30, 2019 Compared to Three Months Ended September 30, 2018
Management fees increased by $31.7 million for the three months ended September 30, 2019, as comparedrefer to the three months ended September 30, 2018.2019.
Revenues
Our revenues and other income include fixed components that result from measures of capital and asset valuations and variable components that result from realized and unrealized investment performance, as well as the value of successfully completed transactions.
Management fees increased by $39.0 million to $433.6 million in 2020 from $394.5 million in 2019. This change was primarily attributable to an increase in management fees earned from Athene and Athora of $20.6$29.9 million and $2.0$20.5 million, respectively. This increase was offset, in part by a decrease in management fees earned from Fund VIII and Fund VII of $4.5 million and $2.9 million, respectively, as well as modest increases across other credit funds and investment vehicles during the three months ended September 30, 2019, as compared to the same period during 2018.in 2020. For additional details regarding changes in management fees in each segment, see “—Segment Analysis” below.
Advisory and transaction fees, net, increased by $3.3$57.0 million to $73.4 million in 2020 from $16.4 million in 2019. This change was primarily driven by advisory and transaction fees earned related to a long-term strategic investment for an underlying real estate portfolio.
Performance allocations increased by $205.1 million to $459.2 million in 2020 from $254.1 million in 2019. This change was primarily attributable to increased performance allocations earned from Fund VIII, Fund VII and Athora of $89.5 million, $69.0 million and $27.4 million, respectively, in 2020.
The increase in performance allocations from Fund VIII was primarily driven by appreciation in the three months ended September 30, 2019, as comparedvalue of the fund’s investments in private and public portfolio companies primarily in the consumer services, financial services, media, telecom, technology, and consumer and retail sectors in 2020. The increase in performance allocations from Fund VII was primarily driven by appreciation in the value of the fund’s investments in a public portfolio company in the consumer and retail sector. The increase in performance allocations from Athora was driven by appreciation in the valuation of the underlying portfolio.
Principal investment income increased by $17.3 million to $50.7 million in 2020 from $33.4 million in 2019. This change was primarily driven by increases in the three months ended September 30, 2018.value of investments held by certain Apollo funds and other entities in which the Company has a direct interest, mainly with respect to Athora, Fund IX and Fund VII of $6.2 million, $6.2 million and $3.9 million, respectively, during 2020.
Expenses
Compensation and benefits increased by $146.8 million to $404.7 million in 2020 from $258.0 million in 2019. This change was primarily attributable to an increase in net transaction and advisory fees earned from Athene and advisory assets of $1.7 million and $1.2 million, respectively, during the three months ended September 30, 2019, as compared to the same period during 2018.
Salary, bonus and benefits expense increased by $7.1 million for the three months ended September 30, 2019, as compared to the three months ended September 30, 2018 primarily due to an increase in headcount.
General, administrative and other increased by $2.0 million during the three months ended September 30, 2019, as compared to the three months ended September 30, 2018. The change was primarily driven by an increase fund organizational expenses and technology expenses during the three months ended September 30, 2019, as compared to the same period in 2018.
Realized performance fees decreased by $7.8 million during the three months ended September 30, 2019, as compared to the same period in 2018. This change was primarily attributable to a decrease in realized performance fees generated from a strategic investment account of $11.0 million during the three months ended September 30, 2019 as compared to the three months ended September 30, 2018. The decrease in realized performance fees generated from the strategic investment account was primarily driven by decreased income and sales proceeds from the private lending and opportunistic strategies during the three months ended September 30, 2019, as compared to the three months ended September 30, 2018.
Realized profit sharing expense decreased by $7.3of $103.2 million during the three months ended September 30, 2019, as compareddue to the same period in 2018, as a result of a corresponding decreaseincrease in realized performance fees as described above.allocations during 2020. In any period the blended profit sharing percentage is impacted by the respective profit sharing ratios of the funds generating performance feesallocations in the period. Additionally, salary, bonus and benefits increased by $36.5 million primarily due to an increase in headcount, and equity-based compensation increased $7.1 million due to higher amortization expenses associated with previously granted performance awards.
Included in realized profit sharing expense is $1.0$8.3 million for 2020 related to the Incentive Pool for the three months ended September 30, 2018.Pool. There was no realized profit sharing expense related to the Incentive Pool for 2019. See “—Profit Sharing Expense” in the threeCritical Accounting Policies section for an overview of the Incentive Pool.
months ended September 30, 2019. The Incentive Pool is separate from the fund related profit sharingInterest expense and may result in greater variability in compensation and have a variable impact on the blended profit sharing percentage during a particular period.
Net interest loss and other increased by $2.5$7.1 million for the three months ended September 30,to $34.9 million in 2020 from $27.8 million in 2019, as compared to the three months ended September 30, 2018, primarily due to additional interest expense incurred during the three months ended September 30, 2019 as a result of the issuances of the 20292030 Senior Notes and 2039 Senior Secured Guaranteed2050 Subordinated Notes, as described in note 1011 to our condensed consolidated financial statements.
Nine Months Ended September 30, 2019 Compared to Nine Months Ended September 30, 2018
Management feesGeneral, administrative and other expenses increased by $101.8$5.5 million for the nine months ended September 30,to $90.8 million in 2020 from $85.3 million in 2019 as compared to the nine months ended September 30, 2018. This change was primarily attributable to an increase in management fees earned from Athene and Athora of $75.4 million and $4.7 million, respectively, during the nine months ended September 30, 2019, as compared to the same period during 2018.
Advisory and transaction fees, net increased by $7.4 million during the nine months ended September 30, 2019, as compared to the nine months ended September 30, 2018. This increase was primarily driven by increases in net advisory and transaction fees earned with respect to FCI III, Athene and advisory assets of $2.8 million, $2.1 million and $1.2 million, respectively, during the nine months ended September 30, 2019, as compared to the same period during 2018.
Performance fees decreased by $1.7 million for the nine months ended September 30, 2019, as compared to the nine months ended September 30, 2018. This change was primarily attributable to a decrease in performance fees earned from AINV of $11.9 million during the nine months ended September 30, 2019, as compared to the same period during 2018, as a result of the amended and restated investment management agreement with AINV which was revised to a total return measure, as described in note 14 to our condensed consolidated financial statements. This decrease in performance fees was partially offset by increased performance fees from Redding Ridge Holdings and a business development company of $6.3 million and $3.8 million during the nine months ended September 30, 2019, as compared to the same period during 2018. The performance fees from Redding Ridge Holdings and the business development company were primarily driven by the vehicles achieving their annualized hurdle rates during the nine months ended September 30, 2019, which did not occur during the same period during 2018.
Salary, bonus and benefits expense increased by $12.3 million for the nine months ended September 30, 2019, as compared to the nine months ended September 30, 2018 primarily due to an increase in headcount.professional fees and technology expenses.
General, administrative and otherOther Income (Loss)
Net gains from investment activities increased by $6.9$164.3 million duringto $144.5 million in 2020 from net losses of $19.8 million in 2019. As discussed in note 15, the nine months endedCompany acquired an additional 35.5 million shares of Athene Holding, as a result of the Transaction Agreement, increasing the Company’s total ownership of Athene Holding’s shares to 54.6 million at September 30, 2019,2020 as compared to the nine months ended19.1 million shares as of September 30, 2018. The2019. Net gains from investment activities in 2020 were primarily attributable to appreciation in the share price of Athene Holding and the Company’s acquisition of additional shares of Athene Holding pursuant to the Transaction Agreement. See note 7 and 15 to the condensed consolidated financial statements for further information regarding the Company’s investment in Athene Holding.
Net gains from investment activities of consolidated VIEs increased by $111.5 million to $122.1 million in 2020 from $10.6 million in 2019. This change was primarily driven by an increasegains from newly consolidated funds during 2020 as discussed in technology expenses and fund organizational expenses during the nine months ended September 30, 2019, as comparednote 6 to the same periodcondensed consolidated financial statements.
Interest income decreased by $8.7 million to $1.5 million in 2018.2020 from $10.2 million in 2019 primarily due to decreased interest income earned from U.S. Treasury securities as a result of lower interest rates during 2020.
Other income netincreased by $53.3 million to $10.2 million in 2020 from a loss of Non-Controlling Interest decreased by $1.3$(43.1) million for the nine months ended September 30,in 2019. The loss in 2019 as compared to the nine months ended September 30, 2018. This change was primarily attributable to incomelosses from the assignment of a CLO collateral managementchange in tax receivable agreement liability, which did not occur during the nine months ended September 30, 2018.2020.
Realized performance fees decreased by $4.1 million during the nine months ended September 30, 2019, as comparedNet Income Attributable to the nine months ended September 30, 2018. This change was primarilyNon-Controlling Interests and Series A and Series B Preferred Stockholders
For information related to net income attributable to a decrease in realized performance fees generated from two strategic investment accounts of $13.3 millionNon-Controlling Interests and $8.8 million, respectively, offset by an increase in realized performance fees generated from FCI Inet income attributable to Series A and Apollo Credit Master Fund Ltd. (“Credit Fund”) of $12.0 million and $3.2 million, respectively, during the nine months ended September 30, 2019 as comparedSeries B Preferred Stockholders, see note 14 to the nine months ended September 30, 2018. The decrease in realized performance fees generated from the first strategic investment account was primarily driven by decreased income and sales proceeds from the private lending and opportunistic strategies during the nine months ended September 30, 2019, as compared to the nine months ended September 30, 2018. The decrease in realized performance fees generated from the other strategic investment account was driven by lesser income generated from CLO investments during the nine months ended September 30, 2019 as compared to the same period during 2018. The increase in realized performance fees generated from FCI I was primarily driven by realizations of the fund’s investments in various life settlement policies during the nine months ended September 30, 2019, while the fund had no realized performance fees during the nine months ended September 30, 2018. The increase in realized performance fees generated from Credit Fund was primarily driven by the appreciation of its bank loan investments during the nine months ended September 30, 2019, as compared to the nine months ended September 30, 2018.
Realized profit sharing expense decreased by $10.2 million during the nine months ended September 30, 2019, as compared to the same period in 2018, as a result of a corresponding decrease in realized performance fees as described above. In any period the blended profit sharing percentage is impacted by the respective profit sharing ratios of the funds generating performance fees in the period. Included in realized profit sharing expense is $0.1 million and $2.4 million related to the Incentive Pool for the nine months ended September 30, 2019 and 2018, respectively. The Incentive Pool is separate from the fund related
profit sharing expense and may result in greater variability in compensation and have a variable impact on the blended profit sharing percentage during a particular period.
Net interest loss and other increased by $4.1 million for the nine months ended September 30, 2019, as compared to the nine months ended September 30, 2018, primarily due to additional interest expense incurred during the nine months ended September 30, 2019 as a result of the issuances of the 2029 Senior Notes and 2039 Senior Secured Guaranteed Notes, as described in note 10 to our condensed consolidated financial statements.
Private Equity
The following table summarizes the investment record for distressed investments made in our traditional private equity fund portfolios, since the Company’s inception. All amounts are as of September 30, 2020:
| | | | | | | | | | | | | | | | | |
| Total Invested Capital | | Total Value | | Gross IRR |
| | (in millions) | | |
| Distressed for Control | $ | 7,795 | | | $ | 18,823 | | | 29 | % |
| Non-Control Distressed | 5,558 | | | 8,842 | | | 71 | |
| Total | 13,353 | | | 27,665 | | | 49 | |
Corporate Carve-outs, Opportunistic Buyouts and Other Credit(1) | 51,129 | | | 87,183 | | | 21 | |
| Total | $ | 64,482 | | | $ | 114,848 | | | 39 | % |
(1)Other Credit is defined as investments in debt securities of issuers other than portfolio companies that are not considered to be distressed.
The following tables provide additional detail on the composition of the Fund VIII and Fund VII private equity portfolios based on investment strategy. Amounts for Fund I, II, III, IV, V, VI and IX are included in the table above but not presented below as their remaining value is less than $100 million, the fund has been liquidated or the fund commenced investing capital less than 24 months prior to September 30, 2020 and such information was deemed not meaningful. All amounts are as of September 30, 2020:
Fund VIII(1)
| | | | | | | | | | | |
| Total Invested Capital | | Total Value |
| | (in millions) |
| Corporate Carve-outs | $ | 2,704 | | | $ | 5,760 | |
| Opportunistic Buyouts | 12,777 | | | 18,032 | |
Distressed(2) | 567 | | | 761 | |
| Total | $ | 16,048 | | | $ | 24,553 | |
Fund VII(1)
| | | | | | | | | | | |
| Total Invested Capital | | Total Value |
| | (in millions) |
| Corporate Carve-outs | $ | 2,539 | | | $ | 3,466 | |
| Opportunistic Buyouts | 4,339 | | | 10,498 | |
Distressed/Other Credit(2) | 9,583 | | | 18,553 | |
| Total | $ | 16,461 | | | $ | 32,517 | |
(1)Committed capital less unfunded capital commitments for Fund VIII and Fund VII were $16.1 billion and $14.4 billion, respectively, which represents capital commitments from limited partners to invest in such funds less capital that is available for investment or reinvestment subject to the provisions of the applicable limited partnership agreement or other governing agreements.
(2)The distressed investment strategy includes distressed for control, non-control distressed and other credit.
During the recovery and expansionary periods of 1994 through 2000 and late 2003 through the first half of 2007, our private equity funds invested or committed to invest approximately $13.7 billion primarily in traditional and corporate partner buyouts. During the recessionary periods of 1990 through 1993, 2001 through late 2003 and the recessionary and post recessionary periods (beginning the second half of 2007 through September 30, 2020), our private equity funds have invested $59.1 billion, of which $20.8 billion was in distressed buyouts and debt investments when the debt securities of quality companies traded at deep discounts to par value. Our average entry multiple for Fund VIII, VII and VI was 5.7x, 6.1x and 7.7x, respectively, as of September 30, 2020. Our average entry multiple for a private equity fund is the average of the total enterprise value over an applicable adjusted earnings before interest, taxes, depreciation and amortization, which may incorporate certain adjustments based on the investment team’s estimates and we believe captures the true economics of our funds’ investments in portfolio companies. The average entry multiple of actively investing funds may include committed investments not yet closed.
Permanent Capital
The following table summarizes the investment record for our permanent capital vehicles by segment, excluding Athene-related and Athora-related assets managed or advised by ISG and ISGI:
| | | | | | | | | | | | | | | | | | | | | | | | | | | | | | | | | | | |
| | | | | Total Returns(1) |
| IPO Year(2) | | Total AUM | | For the Three Months Ended September 30, 2020 | | For the Nine Months Ended September 30, 2020 | | For the Three Months Ended September 30, 2019 | | For the Nine Months Ended September 30, 2019 |
| Credit: | | | (in millions) | | | | | | | | |
MidCap(3) | N/A | | $ | 8,124 | | | 4 | % | | 3 | % | | 4 | % | | 13 | % |
| AIF | 2013 | | 332 | | | 4 | | | (11) | | | 5 | % | | 17 | % |
| AFT | 2011 | | 362 | | | 5 | | | (11) | | | 1 | % | | 9 | % |
AINV/Other(4) | 2004 | | 4,475 | | | (10) | | | (45) | | | 5 | % | | 41 | % |
| Real Assets: | | | | | | | | | | | |
| ARI | 2009 | | 6,964 | | | (5) | % | | (44) | % | | 7 | % | | 24 | % |
| Total | | | $ | 20,257 | | | | | | | | | |
(1)Total returns are based on the change in closing trading prices during the respective periods presented taking into account dividends and distributions, if any, as if they were reinvested without regard to commission.
(2)An initial public offering (“IPO”) year represents the year in which the vehicle commenced trading on a national securities exchange.
(3)MidCap is not a publicly traded vehicle and therefore IPO year is not applicable. The returns presented are a gross return based on NAV. The net returns based on NAV were 2% and 3% for the three months ended September 30, 2020 and September 30, 2019, respectively, and 0% and 9% for the nine months ended September 30, 2020 and September 30, 2019, respectively.
(4)Total AUM is as of June 30, 2020. Refer to www.apolloic.com for the most recent financial information on AINV. Included within Total AUM of AINV/Other is $1.7 billion of AUM related to a non-traded business development company from which Apollo earns investment-related service fees, but for which Apollo does not provide management or advisory services. Total returns exclude performance related to this AUM.
SIAs
As of September 30, 2020, Apollo managed approximately $29 billion of total AUM in SIAs, which include capital deployed from certain SIAs across Apollo’s credit, private equity and real assets funds.
Overview of Results of Operations
Revenues
Advisoryand Transaction Fees, Net. As a result of providing advisory services with respect to actual and potential credit, private equity, and real assets investments, we are entitled to receive fees for transactions related to the acquisition and, in certain instances, disposition of portfolio companies as well as fees for ongoing monitoring of portfolio company operations and directors’ fees. We also receive advisory fees for advisory services provided to certain credit funds. In addition, monitoring fees are generated on certain structured portfolio company investments. Under the terms of the limited partnership agreements for certain funds, the management fee payable by the funds may be subject to a reduction based on a certain percentage of such advisory and transaction fees, net of applicable broken deal costs (“Management Fee Offset”). Such amounts are presented as a reduction to advisory and transaction fees, net, in the condensed consolidated statements of operations (see note 2 to our condensed consolidated financial statements for more detail on advisory and transaction fees, net).
The Management Fee Offsets are calculated for each fund as follows:
•65%-100% for certain credit funds, gross advisory, transaction and other special fees;
•65%-100% for private equity funds, gross advisory, transaction and other special fees; and
•65%-100% for certain real assets funds, gross advisory, transaction and other special fees.
Management Fees. The significant growth of the assets we manage has had a positive effect on our revenues. Management fees are typically calculated based upon any of “net asset value,” “gross assets,” “adjusted par asset value,” “adjusted costs of all unrealized portfolio investments,” “capital commitments,” “invested capital,” “adjusted assets,” “capital contributions,” or “stockholders’ equity,” each as defined in the applicable limited partnership agreement and/or management agreement of the unconsolidated funds.
Performance Fees. The general partners of our funds are entitled to an incentive return of normally up to 20% of the total returns of a fund’s capital, depending upon performance of the underlying funds and subject to preferred returns and high water marks, as applicable. Performance fees, categorized as performance allocations, are accounted for as an equity method investment, and effectively, the performance fees for any period are based upon an assumed liquidation of the funds’ assets at the reporting date, and distribution of the net proceeds in accordance with the funds’ allocation provisions. Performance fees categorized as incentive fees, which are not accounted as an equity method investment, are deferred until fees are probable to not be significantly reversed. Prior to the adoption of the new revenue recognition guidance, incentive fees were recognized on an assumed liquidation basis. The majority of performance fees are comprised of performance allocations.
As of September 30, 2020, approximately 55% of the value of our funds’ investments on a gross basis was determined using market-based valuation methods (i.e., reliance on broker or listed exchange quotes) and the remaining 45% was determined primarily by comparable company and industry multiples or discounted cash flow models. For our credit, private equity and real assets segments, the percentage determined using market-based valuation methods as of September 30, 2020 was 73%, 19% and 19%, respectively. See “Item 1A. Risk Factors—Risks Related to Our Businesses—Our funds’ performance, and our performance, may be adversely affected by the financial performance of our funds’ portfolio companies and the industries in which our funds invest” in the 2019 Annual report for a discussion regarding certain industry-specific risks that could affect the fair value of our private equity funds’ portfolio company investments.
In our private equity funds, the Company does not earn performance fees until the investors in the fund have achieved cumulative investment returns on invested capital (including management fees and expenses) in excess of an 8% hurdle rate. Additionally, certain of our credit and real assets funds have various performance fee rates and hurdle rates. Certain of our credit and real assets funds allocate performance fees to the general partner in a similar manner as the private equity funds. In our private equity, certain credit and real assets funds, so long as the investors achieve their priority returns, there is a catch-up formula whereby the Company earns a priority return for a portion of the return until the Company’s performance fees equate to its incentive fee rate for that fund; thereafter, the Company participates in returns from the fund at the performance fee rate. Performance fees, categorized as performance allocations, are subject to reversal to the extent that the performance fees distributed exceed the amount due to the general partner based on a fund’s cumulative investment returns. The Company recognizes potential repayment of previously received performance fees as a general partner obligation representing all amounts previously distributed to the general partner that would need to be repaid to the Apollo funds if these funds were to be liquidated based on the current fair value of the underlying funds’ investments as of the reporting date. The actual general partner obligation, however, would not become payable or realized until the end of a fund’s life or as otherwise set forth in the respective limited partnership agreement of the fund.
The table below presents an analysis of Apollo’s (i) performance fees receivable on an unconsolidated basis and (ii) realized and unrealized performance fees for Apollo’s combined segments:
| | | | | | | | | | | | | | | | | | | | | | | | | | | | | | | | | | | | | | | | | |
| | As of
September 30, 2020 | | For the Three Months Ended September 30, 2020 | | For the Nine Months Ended September 30, 2020 |
| | Performance Fees Receivable on an Unconsolidated Basis | | Unrealized Performance Fees | | Realized Performance Fees | | Total Performance Fees | | Unrealized Performance Fees | | Realized Performance Fees | | Total Performance Fees |
| | (in thousands) |
| Credit: | | | | | | | | | | | | | |
Corporate Credit (1) | $ | 152,204 | | | $ | 37,063 | | | $ | 6,436 | | | $ | 43,499 | | | $ | 133,590 | | | $ | 22,777 | | | $ | 156,367 | |
| Structured Credit | 125,366 | | | (5,061) | | | — | | | (5,061) | | | (65,276) | | | 13,846 | | | (51,430) | |
| Direct Origination | 54,772 | | | 7,002 | | | 3,381 | | | 10,383 | | | (9,967) | | | 9,258 | | | (709) | |
| Advisory and Other | 27,360 | | | 27,360 | | | — | | | 27,360 | | | 27,360 | | | — | | | 27,360 | |
| Total Credit | 359,702 | | | 66,364 | | | 9,817 | | | 76,181 | | | 85,707 | | | 45,881 | | | 131,588 | |
| Total Credit, net of profit sharing payable/expense | 51,558 | | | 33,553 | | | 2,204 | | | 35,757 | | | 43,150 | | | 8,352 | | | 51,502 | |
| Private Equity: | | | | | | | | | | | | | |
| Fund VIII | 532,239 | | | 328,709 | | | — | | | 328,709 | | | (183,292) | | | — | | | (183,292) | |
Fund VII(1)(2) | 46 | | | 2,702 | | | 28 | | | 2,730 | | | (111,531) | | | 499 | | | (111,032) | |
Fund VI(2) | 17,595 | | | (90) | | | 37 | | | (53) | | | (180) | | | 646 | | | 466 | |
Fund IV and V (1) | — | | | (43) | | | — | | | (43) | | | (204) | | | — | | | (204) | |
ANRP I and II(1)(2) | 166 | | | — | | | 15 | | | 15 | | | (21,418) | | | 275 | | | (21,143) | |
| Hybrid Value Fund | 49,535 | | | 20,346 | | | — | | | 20,346 | | | 49,535 | | | — | | | 49,535 | |
Other(1)(3) | 10,688 | | | 4,251 | | | 1,945 | | | 6,196 | | | (110,538) | | | 5,297 | | | (105,241) | |
| Total Private Equity | 610,269 | | | 355,875 | | | 2,025 | | | 357,900 | | | (377,628) | | | 6,717 | | | (370,911) | |
| Total Private Equity, net of profit sharing payable/expense | 366,908 | | | 227,837 | | | — | | | 227,837 | | | (230,714) | | | (304) | | | (231,018) | |
| Real Assets: | | | | | | | | | | | | | |
Principal Finance(1) | 112,942 | | | 27,413 | | | — | | | 27,413 | | | (98,820) | | | 35,025 | | | (63,795) | |
U.S. RE Fund I and II(1) | 8,783 | | | (8,067) | | | 3,514 | | | (4,553) | | | (29,592) | | | 8,138 | | | (21,454) | |
| AIOF I | 17,063 | | | (2,174) | | | 4,292 | | | 2,118 | | | (1,126) | | | 6,314 | | | 5,188 | |
Other(1)(3) | 6,961 | | | 486 | | | — | | | 486 | | | (27,829) | | | — | | | (27,829) | |
| Total Real Assets | 145,749 | | | 17,658 | | | 7,806 | | | 25,464 | | | (157,367) | | | 49,477 | | | (107,890) | |
| Total Real Assets, net of profit sharing payable/expense | 46,440 | | | 10,554 | | | — | | | 10,554 | | | (92,522) | | | — | | | (92,522) | |
| Total | $ | 1,115,720 | | | $ | 439,897 | | | $ | 19,648 | | | $ | 459,545 | | | $ | (449,288) | | | $ | 102,075 | | | $ | (347,213) | |
Total, net of profit sharing payable(4)/expense | $ | 464,906 | | | $ | 271,944 | | | $ | 2,204 | | | $ | 274,148 | | | $ | (280,086) | | | $ | 8,048 | | | $ | (272,038) | |
(1)As of September 30, 2020, certain credit funds, certain private equity funds, and certain real asset funds had $0.8 million, $348.4 million, and $36.7 million, respectively, in general partner obligations to return previously distributed performance fees. The fair value gain on investments and income at the fund level needed to reverse the general partner obligations for certain credit funds, certain private equity funds and certain real assets funds was $0.8 million, $2,804.2 million and $70.1 million, respectively, as of September 30, 2020.
(2)As of September 30, 2020, the remaining investments and escrow cash of Fund VII, Fund VI, ANRP I and ANRP II were valued at 41%, 34%, 21% and 76% of the fund’s unreturned capital, respectively, which were below the required escrow ratio of 115%. As a result, these funds are required to place in escrow current and future performance fee distributions to the general partner until the specified return ratio of 115% is met (at the time of a future distribution) or upon liquidation. As of September 30, 2020, Fund VII had $128.5 million of gross performance fees, or $73.2 million net of profit sharing, in escrow. As of September 30, 2020, Fund VI had $167.6 million of gross performance fees, or $112.4 million net of profit sharing, in escrow. As of September 30, 2020, ANRP I had $40.2 million of gross performance fees, or $26.0 million net of profit sharing, in escrow. As of September 30, 2020, ANRP II had $31.2 million of gross performance fees, or $18.7 million net of profit sharing, in escrow. With respect to Fund VII, Fund VI, ANRP II and ANRP I, realized performance fees currently distributed to the general partner are limited to potential tax distributions and interest on escrow balances per these funds’ partnership agreements. Performance fees receivable as of September 30, 2020 and realized performance fees for the three and nine months ended September 30, 2020 include interest earned on escrow balances that is not subject to contingent repayment.
(3)Other includes certain SIAs.
(4)There was a corresponding profit sharing payable of $650.8 million as of September 30, 2020, including profit sharing payable related to amounts in escrow and contingent consideration obligations of $103.3 million.
The general partners of certain of our credit funds accrue performance fees, categorized as performance allocations, when the fair value of investments exceeds the cost basis of the individual investors’ investments in the fund, including any allocable share of expenses incurred in connection with such investments, which we refer to as “high water marks.” These high
water marks are applied on an individual investor basis. Certain of our credit funds have investors with various high water marks, the achievement of which is subject to market conditions and investment performance.
Performance fees from our private equity funds and certain credit and real assets funds are subject to contingent repayment by the general partner in the event of future losses to the extent that the cumulative performance fees distributed from inception to date exceeds the amount computed as due to the general partner at the final distribution. These general partner obligations, if applicable, are included in due to related parties on the condensed consolidated statements of financial condition.
The following table summarizes our performance fees since inception for our combined segments through September 30, 2020:
| | | | | | | | | | | | | | | | | | | | | | | | | | | | | |
| Performance Fees Since Inception(1) |
| | Undistributed by Fund and Recognized | | Distributed by Fund and Recognized(2) | | Total Undistributed and Distributed by Fund and Recognized(3) | | General Partner Obligation(3) | | Maximum Performance Fees Subject to Potential Reversal(4) |
| | (in millions) |
| Credit: | | | | | | | | | |
| Corporate Credit | $ | 152.2 | | | $ | 1,193.3 | | | $ | 1,345.5 | | | $ | 0.8 | | | $ | 175.0 | |
| Structured Credit | 125.3 | | | 170.5 | | | 295.8 | | | — | | | 124.5 | |
| Direct Origination | 54.8 | | | 46.6 | | | 101.4 | | | — | | | 54.3 | |
| Advisory and Other | 27.4 | | | — | | | 27.4 | | | — | | | 27.4 | |
| Total Credit | 359.7 | | | 1,410.4 | | | 1,770.1 | | | 0.8 | | | 381.2 | |
| Private Equity: | | | | | | | | | |
| Fund VIII | 532.2 | | | 818.6 | | | 1,350.8 | | | — | | | 1,061.4 | |
| Fund VII | — | | | 3,132.1 | | | 3,132.1 | | | 209.2 | | | 132.4 | |
| Fund VI | 17.6 | | | 1,663.9 | | | 1,681.5 | | | — | | | 0.7 | |
| Fund IV and V | — | | | 2,053.1 | | | 2,053.1 | | | 30.7 | | | 0.3 | |
| ANRP I and II | 0.2 | | | 104.7 | | | 104.9 | | | 32.0 | | | — | |
| Hybrid Value Fund | 49.5 | | | — | | | 49.5 | | | — | | | 49.5 | |
| | | | | | | | | |
| Other | 10.8 | | | 735.2 | | | 746.0 | | | 76.5 | | | 50.3 | |
| Total Private Equity | 610.3 | | | 8,507.6 | | | 9,117.9 | | | 348.4 | | | 1,294.6 | |
| Real Assets: | | | | | | | | | |
| Principal Finance | 112.9 | | | 420.4 | | | 533.3 | | | 13.4 | | | 279.7 | |
| U.S. RE Fund I and II | 8.8 | | | 36.0 | | | 44.8 | | | 15.7 | | | 24.0 | |
| AIOF I | 17.0 | | | 6.3 | | | 23.3 | | | — | | | 20.0 | |
Other(5) | 7.0 | | | 36.8 | | | 43.8 | | | 7.6 | | | 15.1 | |
| Total Real Assets | 145.7 | | | 499.5 | | | 645.2 | | | 36.7 | | | 338.8 | |
| Total | $ | 1,115.7 | | | $ | 10,417.5 | | | $ | 11,533.2 | | | $ | 385.9 | | | $ | 2,014.6 | |
(1)Certain funds are denominated in Euros and historical figures are translated into U.S. dollars at an exchange rate of €1.00 to $1.17 as of September 30, 2020. Certain funds are denominated in pound sterling and translated into U.S. dollars at an exchange rate of £1.00 to $1.29 as of September 30, 2020.
(2)Amounts in “Distributed by Fund and Recognized” for the Citi Property Investors (“CPI”), Gulf Stream Asset Management, LLC (“Gulf Stream”), Stone Tower Capital LLC and its related companies (“Stone Tower”) funds and SIAs are presented for activity subsequent to the respective acquisition dates. Amounts exclude certain performance fees from business development companies and Redding Ridge Holdings LP (“Redding Ridge Holdings”), an affiliate of Redding Ridge.
(3)Amounts were computed based on the fair value of fund investments on September 30, 2020. Performance fees have been allocated to and recognized by the general partner. Based on the amount allocated, a portion is subject to potential reversal or, to the extent applicable, has been reduced by the general partner obligation to return previously distributed performance fees at September 30, 2020. The actual determination and any required payment of any such general partner obligation would not take place until the final disposition of the fund’s investments based on contractual termination of the fund.
(4)Represents the amount of performance fees that would be reversed if remaining fund investments became worthless on September 30, 2020. Amounts subject to potential reversal of performance fees include amounts undistributed by a fund (i.e., the performance fees receivable), as well as a portion of the amounts that have been distributed by a fund, net of taxes and not subject to a general partner obligation to return previously distributed performance fees, except for those funds that are gross of taxes as defined in the respective funds’ governing documents.
(5)Other includes certain SIAs.
Expenses
Compensation and Benefits. Our most significant expense is compensation and benefits expense. This consists of fixed salary, discretionary and non-discretionary bonuses, profit sharing expense associated with the performance fees earned from credit, private equity, and real assets funds and compensation expense associated with the vesting of non-cash equity-based awards.
Our compensation arrangements with certain partners and employees contain a significant performance-based incentive component. Therefore, as our net revenues increase, our compensation costs rise. Our compensation costs also reflect the increased investment in people as we expand geographically and create new funds.
In addition, certain professionals and selected other individuals have a profit sharing interest in the performance fees earned in relation to our private equity, certain credit and real assets funds in order to better align their interests with our own and with those of the investors in these funds. Profit sharing expense is part of our compensation and benefits expense and is generally based upon a fixed percentage of credit, private equity and real assets performance fees. Profit sharing expense can reverse during periods when there is a decline in performance fees that were previously recognized. Profit sharing amounts are normally distributed to employees after the corresponding investment gains have been realized and generally before preferred returns are achieved for the investors. Therefore, changes in our unrealized performance fees have the same effect on our profit sharing expense. Profit sharing expense increases when unrealized performance fees increases. Realizations only impact profit sharing expense to the extent that the effects on investments have not been recognized previously. If losses on other investments within a fund are subsequently realized, the profit sharing amounts previously distributed are normally subject to a general partner obligation to return performance fees previously distributed back to the funds. This general partner obligation due to the funds would be realized only when the fund is liquidated, which generally occurs at the end of the fund’s term. However, indemnification obligations also exist for realized gains with respect to Fund IV, Fund V and Fund VI, which, although our Managing Partners and Contributing Partners would remain personally liable, may indemnify our Managing Partners and Contributing Partners for 17.5% to 100% of the previously distributed profits regardless of the fund’s future performance. See note 15 to our condensed consolidated financial statements for further information regarding the Company’s indemnification liability.
Each Managing Partner receives $100,000 per year in base salary for services rendered to us. Additionally, our Managing Partners can receive other forms of compensation. In addition, AHL Awards and other equity-based compensation awards have been granted to the Company and certain employees, which amortize over the respective vesting periods. The Company grants equity awards to certain employees, including RSUs, restricted Class A shares and options, that generally vest and become exercisable in quarterly installments or annual installments depending on the contract terms over a period of three to six years. In some instances, vesting of an RSU is also subject to the Company’s receipt of performance fees, within prescribed periods, sufficient to cover the associated equity-based compensation expense. See note 13 to our condensed consolidated financial statements for further discussion of equity-based compensation.
Other Expenses. The balance of our other expenses includes interest, placement fees, and general, administrative and other operating expenses. Interest expense consists primarily of interest related to the 2024 Senior Notes, the 2026 Senior Notes, the 2029 Senior Notes, the 2030 Senior Notes, the 2039 Senior Secured Guaranteed Notes, the 2048 Senior Notes and the 2050 Subordinated Notes as discussed in note 11 to our condensed consolidated financial statements. Placement fees are incurred in connection with our capital raising activities. General, administrative and other expenses includes occupancy expense, depreciation and amortization, professional fees and costs related to travel, information technology and administration. Occupancy expense represents charges related to office leases and associated expenses, such as utilities and maintenance fees. Depreciation and amortization of fixed assets is normally calculated using the straight-line method over their estimated useful lives, ranging from two to sixteen years, taking into consideration any residual value. Leasehold improvements are amortized over the shorter of the useful life of the asset or the expected term of the lease. Intangible assets are amortized based on the future cash flows over the expected useful lives of the assets.
Other Income (Loss)
Net Gains (Losses) from Investment Activities. Net gains (losses) from investment activities include both realized gains and losses and the change in unrealized gains and losses in our investment portfolio between the opening reporting date and the closing reporting date. Net unrealized gains (losses) are a result of changes in the fair value of unrealized investments and reversal of unrealized gains (losses) due to dispositions of investments during the reporting period. Significant judgment and estimation goes into the assumptions that drive these models and the actual values realized with respect to investments could be materially different from values obtained based on the use of those models. The valuation methodologies applied impact the reported value of investment company holdings and their underlying portfolios in our condensed consolidated financial statements.
Net Gains (Losses) from Investment Activities of Consolidated Variable Interest Entities. Changes in the fair value of the consolidated VIEs’ assets and liabilities and related interest, dividend and other income and expenses subsequent to consolidation are presented within net gains (losses) from investment activities of consolidated variable interest entities and are attributable to Non-Controlling Interests in the condensed consolidated statements of operations.
Other Income (Losses), Net. Other income (losses), net includes gains (losses) arising from the remeasurement of foreign currency denominated assets and liabilities, remeasurement of the tax receivable agreement liability and other miscellaneous non-operating income and expenses.
Income Taxes. Prior to the Conversion, certain entities in the Apollo Operating Group operated as partnerships for U.S. federal income tax purposes. As a result, these members of the Apollo Operating Group were not subject to U.S. federal income taxes. However, certain of these entities were subject to New York City unincorporated business taxes (“NYC UBT”) and certain non-U.S. entities were subject to non-U.S. corporate income taxes. Effective September 5, 2019, Apollo Global Management, LLC converted from a Delaware limited liability company to a Delaware corporation named Apollo Global Management, Inc. Subsequent to the Conversion, generally all of the income is subject to U.S. corporate income taxes, which could result in an overall higher income tax expense (or benefit) in periods subsequent to the Conversion.
Significant judgment is required in determining the provision for income taxes and in evaluating income tax positions, including evaluating uncertainties. We recognize the income tax benefits of uncertain tax positions only where the position is “more likely than not” to be sustained upon examination, including resolution of any related appeals or litigation, based on the technical merits of the positions. The tax benefit is measured as the largest amount of benefit that has a greater than 50% likelihood of being realized upon ultimate settlement. If a tax position is not considered more likely than not to be sustained, then no benefits of the position are recognized. The Company’s income tax positions are reviewed and evaluated quarterly to determine whether or not we have uncertain tax positions that require financial statement recognition or de-recognition.
Deferred tax assets and liabilities are recognized for the expected future tax consequences, using currently enacted tax rates, of differences between the carrying amount of assets and liabilities and their respective tax basis. The effect on deferred tax assets and liabilities of a change in tax rates is recognized in income in the period when the change is enacted. Deferred tax assets are reduced by a valuation allowance when it is more likely than not that some portion or all of the deferred tax assets will not be realized.
Non-Controlling Interests
For entities that are consolidated, but not 100% owned, a portion of the income or loss and corresponding equity is allocated to owners other than Apollo. The aggregate of the income or loss and corresponding equity that is not owned by the Company is included in Non-Controlling Interests in the condensed consolidated financial statements. The Non-Controlling Interests relating to Apollo Global Management, Inc. primarily include the 40.4% and 44.8% ownership interest in the Apollo Operating Group held by the Managing Partners and Contributing Partners through their limited partner interests in Holdings as of September 30, 2020 and 2019, respectively. Additionally, as of September 30, 2020, Athene holds a 6.7% Non-Controlling Interest in the Apollo Operating Group as a result of the Transaction Agreement. Non-Controlling Interests also include limited partner interests in certain consolidated funds and VIEs.
The authoritative guidance for Non-Controlling Interests in the condensed consolidated financial statements requires reporting entities to present Non-Controlling Interest as equity and provides guidance on the accounting for transactions between an entity and Non-Controlling Interests. According to the guidance, (1) Non-Controlling Interests are presented as a separate component of stockholders’ equity on the Company’s condensed consolidated statements of financial condition, (2) net income (loss) includes the net income (loss) attributable to the Non-Controlling Interest holders on the Company’s condensed consolidated statements of operations, (3) the primary components of Non-Controlling Interest are separately presented in the Company’s condensed consolidated statements of changes in stockholders’ equity to clearly distinguish the interests in the Apollo Operating Group and other ownership interests in the consolidated entities and (4) profits and losses are allocated to Non-Controlling Interests in proportion to their ownership interests regardless of their basis.
Results of Operations
Below is a discussion of our condensed consolidated results of operations for the three and nine months ended September 30, 2020 and 2019. For additional analysis of the factors that affected our results at the segment level, see “—Segment Analysis” below:
| | | | | | | | | | | | | | | | | | | | | | | | | | | | | | | | | | | | | | | | | | | | | | | |
| | For the Three Months Ended
September 30, | | Amount
Change | | Percentage
Change | | For the Nine Months Ended September 30, | | Amount
Change | | Percentage
Change |
| | 2020 | | 2019 | | | 2020 | | 2019 | |
| Revenues: | (in thousands) | | | | (in thousands) | | |
| Management fees | $ | 433,570 | | | $ | 394,547 | | | $ | 39,023 | | | 9.9% | | $ | 1,240,127 | | | $ | 1,162,788 | | | $ | 77,339 | | | 6.7% |
| Advisory and transaction fees, net | 73,449 | | | 16,440 | | | 57,009 | | | 346.8 | | 172,369 | | | 67,133 | | | 105,236 | | | 156.8 |
| Investment income (loss): | | | | | | | | | | | | | | | |
| Performance allocations | 459,241 | | | 254,103 | | | 205,138 | | | 80.7 | | (350,483) | | | 682,462 | | | (1,032,945) | | | NM |
| Principal investment income (loss) | 50,722 | | | 33,393 | | | 17,329 | | | 51.9 | | (25,506) | | | 99,020 | | | (124,526) | | | NM |
| Total investment income (loss) | 509,963 | | | 287,496 | | | 222,467 | | | 77.4 | | (375,989) | | | 781,482 | | | (1,157,471) | | | NM |
| Incentive fees | 1,292 | | | 4,238 | | | (2,946) | | | (69.5) | | 21,016 | | | 5,674 | | | 15,342 | | | 270.4 |
| Total Revenues | 1,018,274 | | | 702,721 | | | 315,553 | | | 44.9 | | 1,057,523 | | | 2,017,077 | | | (959,554) | | | (47.6) |
| Expenses: | | | | | | | | | | | | | | | |
| Compensation and benefits: | | | | | | | | | | | | | | | |
| Salary, bonus and benefits | 163,197 | | | 126,695 | | | 36,502 | | | 28.8 | | 453,485 | | | 369,527 | | | 83,958 | | | 22.7 |
| Equity-based compensation | 49,726 | | | 42,665 | | | 7,061 | | | 16.5 | | 161,268 | | | 132,404 | | | 28,864 | | | 21.8 |
| Profit sharing expense | 191,809 | | | 88,610 | | | 103,199 | | | 116.5 | | (68,230) | | | 280,335 | | | (348,565) | | | NM |
| Total compensation and benefits | 404,732 | | | 257,970 | | | 146,762 | | | 56.9 | | 546,523 | | | 782,266 | | | (235,743) | | | (30.1) |
| Interest expense | 34,889 | | | 27,833 | | | 7,056 | | | 25.4 | | 98,422 | | | 70,243 | | | 28,179 | | | 40.1 |
| General, administrative and other | 90,822 | | | 85,313 | | | 5,509 | | | 6.5 | | 259,073 | | | 238,814 | | | 20,259 | | | 8.5 |
| Placement fees | 612 | | | 256 | | | 356 | | | 139.1 | | 1,380 | | | 591 | | | 789 | | | 133.5 |
| Total Expenses | 531,055 | | | 371,372 | | | 159,683 | | | 43.0 | | 905,398 | | | 1,091,914 | | | (186,516) | | | (17.1) |
| Other Income (Loss): | | | | | | | | | | | | | | | |
| Net gains (losses) from investment activities | 144,472 | | | (19,790) | | | 164,262 | | | NM | | (851,412) | | | 44,099 | | | (895,511) | | | NM |
| Net gains (losses) from investment activities of consolidated variable interest entities | 122,119 | | | 10,631 | | | 111,488 | | | NM | | 14,061 | | | 24,728 | | | (10,667) | | | (43.1) |
| Interest income | 1,485 | | | 10,152 | | | (8,667) | | | (85.4) | | 13,413 | | | 25,938 | | | (12,525) | | | (48.3) |
| Other income (loss), net | 10,161 | | | (43,144) | | | 53,305 | | | NM | | (3,019) | | | (36,451) | | | 33,432 | | | (91.7) |
| Total Other Income (Loss) | 278,237 | | | (42,151) | | | 320,388 | | | NM | | (826,957) | | | 58,314 | | | (885,271) | | | NM |
| Income (Loss) before income tax (provision) benefit | 765,456 | | | 289,198 | | | 476,258 | | | 164.7 | | (674,832) | | | 983,477 | | | (1,658,309) | | | NM |
| Income tax (provision) benefit | (89,357) | | | 231,896 | | | (321,253) | | | NM | | 66,173 | | | 195,345 | | | (129,172) | | | (66.1) |
| Net Income (Loss) | 676,099 | | | 521,094 | | | 155,005 | | | 29.7 | | (608,659) | | | 1,178,822 | | | (1,787,481) | | | NM |
| Net income (loss) attributable to Non-Controlling Interests | (403,700) | | | (157,824) | | | (245,876) | | | 155.8 | | 331,169 | | | (501,672) | | | 832,841 | | | NM |
| Net Income (Loss) Attributable to Apollo Global Management, Inc. | 272,399 | | | 363,270 | | | (90,871) | | | (25.0) | | (277,490) | | | 677,150 | | | (954,640) | | | NM |
| Series A Preferred Stock Dividends | (4,382) | | | (4,382) | | | — | | | — | | (13,148) | | | (13,148) | | | — | | | — |
| Series B Preferred Stock Dividends | (4,781) | | | (4,782) | | | 1 | | | — | | (14,344) | | | (14,344) | | | — | | | — |
| Net Income (Loss) Attributable to AGM Class A Shareholders | $ | 263,236 | | | $ | 354,106 | | | $ | (90,870) | | | (25.7)% | | $ | (304,982) | | | $ | 649,658 | | | $ | (954,640) | | | NM |
Note: “NM” denotes not meaningful. Changes from negative to positive amounts and positive to negative amounts are not considered meaningful. Increases or decreases from zero and changes greater than 500% are also not considered meaningful.
In March 2020, the World Health Organization declared the outbreak of a novel coronavirus (COVID-19) a pandemic, which has resulted in uncertainty and disruption in the global economy and financial markets. While we are unable to accurately predict the full impact that COVID-19 will have on our results from operations, financial condition, liquidity and cash flows due to numerous uncertainties, including the duration and severity of the pandemic and containment measures, our compliance with these measures has impacted our day-to-day operations and could disrupt our business and operations, as well as that of the Apollo Funds and their portfolio companies, for an indefinite period of time.
Three Months Ended September 30, 2020 Compared to Three Months Ended September 30, 2019
In this section, references to 2020 refer to the three months ended September 30, 2020 and references to 2019 refer to the three months ended September 30, 2019.
Revenues
Our revenues and other income include fixed components that result from measures of capital and asset valuations and variable components that result from realized and unrealized investment performance, as well as the value of successfully completed transactions.
Management fees increased by $39.0 million to $433.6 million in 2020 from $394.5 million in 2019. This change was primarily attributable to an increase in management fees earned from Athene and Athora of $29.9 million and $20.5 million, respectively. This increase was offset, in part by a decrease in management fees earned from Fund VIII and Fund VII of $4.5 million and $2.9 million, respectively, in 2020. For additional details regarding changes in management fees in each segment, see “—Segment Analysis” below.
Advisory and transaction fees, net, increased by $57.0 million to $73.4 million in 2020 from $16.4 million in 2019. This change was primarily driven by advisory and transaction fees earned related to a long-term strategic investment for an underlying real estate portfolio.
Performance allocations increased by $205.1 million to $459.2 million in 2020 from $254.1 million in 2019. This change was primarily attributable to increased performance allocations earned from Fund VIII, Fund VII and Athora of $89.5 million, $69.0 million and $27.4 million, respectively, in 2020.
The increase in performance allocations from Fund VIII was primarily driven by appreciation in the value of the fund’s investments in private and public portfolio companies primarily in the consumer services, financial services, media, telecom, technology, and consumer and retail sectors in 2020. The increase in performance allocations from Fund VII was primarily driven by appreciation in the value of the fund’s investments in a public portfolio company in the consumer and retail sector. The increase in performance allocations from Athora was driven by appreciation in the valuation of the underlying portfolio.
Principal investment income increased by $17.3 million to $50.7 million in 2020 from $33.4 million in 2019. This change was primarily driven by increases in the value of investments held by certain Apollo funds and other entities in which the Company has a direct interest, mainly with respect to Athora, Fund IX and Fund VII of $6.2 million, $6.2 million and $3.9 million, respectively, during 2020.
Expenses
Compensation and benefits increased by $146.8 million to $404.7 million in 2020 from $258.0 million in 2019. This change was primarily attributable to an increase in profit sharing expense of $103.2 million due to a corresponding increase in performance allocations during 2020. In any period the blended profit sharing percentage is impacted by the respective profit sharing ratios of the funds generating performance allocations in the period. Additionally, salary, bonus and benefits increased by $36.5 million primarily due to an increase in headcount, and equity-based compensation increased $7.1 million due to higher amortization expenses associated with previously granted performance awards.
Included in profit sharing expense is $8.3 million for 2020 related to the Incentive Pool. There was no profit sharing expense related to the Incentive Pool for 2019. See “—Profit Sharing Expense” in the Critical Accounting Policies section for an overview of the Incentive Pool.
Interest expense increased by $7.1 million to $34.9 million in 2020 from $27.8 million in 2019, primarily due to additional interest expense incurred as a result of the issuances of the 2030 Senior Notes and 2050 Subordinated Notes, as described in note 11 to our condensed consolidated financial statements.
General, administrative and other expenses increased by $5.5 million to $90.8 million in 2020 from $85.3 million in 2019 primarily due to an increase in professional fees and technology expenses.
Other Income (Loss)
Net gains from investment activities increased by $164.3 million to $144.5 million in 2020 from net losses of $19.8 million in 2019. As discussed in note 15, the Company acquired an additional 35.5 million shares of Athene Holding, as a result of the Transaction Agreement, increasing the Company’s total ownership of Athene Holding’s shares to 54.6 million at September 30, 2020 as compared to 19.1 million shares as of September 30, 2019. Net gains from investment activities in 2020 were primarily attributable to appreciation in the share price of Athene Holding and the Company’s acquisition of additional shares of Athene Holding pursuant to the Transaction Agreement. See note 7 and 15 to the condensed consolidated financial statements for further information regarding the Company’s investment in Athene Holding.
Net gains from investment activities of consolidated VIEs increased by $111.5 million to $122.1 million in 2020 from $10.6 million in 2019. This change was primarily driven by gains from newly consolidated funds during 2020 as discussed in note 6 to the condensed consolidated financial statements.
Interest income decreased by $8.7 million to $1.5 million in 2020 from $10.2 million in 2019 primarily due to decreased interest income earned from U.S. Treasury securities as a result of lower interest rates during 2020.
Other income increased by $53.3 million to $10.2 million in 2020 from a loss of $(43.1) million in 2019. The loss in 2019 was primarily attributable to losses from the change in tax receivable agreement liability, which did not occur during 2020.
Net Income Attributable to Non-Controlling Interests and Series A and Series B Preferred Stockholders
For information related to net income attributable to Non-Controlling Interests and net income attributable to Series A and Series B Preferred Stockholders, see note 14 to the condensed consolidated financial statements.
Income Tax Provision
Effective September 5, 2019, Apollo Global Management, LLC, a Delaware limited liability company, converted to a Delaware corporation named Apollo Global Management, Inc. Prior to the Conversion, a portion of the investment income, performance allocations and principal investment income earned by the Company was not subject to corporate-level tax in the United States. Subsequent to the Conversion, generally all of the Company’s income is subject to U.S. corporate income taxes, which may result in an overall higher income tax expense (or benefit) in periods after the Conversion. The provision for income taxes includes federal, state and local income taxes in the United States and foreign income taxes.
The income tax provision was $89.4 million in 2020, compared to the income tax benefit of $231.9 million in 2019. The change was primarily related to: (i) the significant deferred tax benefit retained by the Company upon Conversion in 2019 for the step-up in assets from prior year exchanges of AOG Units for Class A shares, (ii) all earnings becoming subject to corporate-level taxation subsequent to Conversion, and (iii) during the third quarter of 2020, the reduction of prior periods unrealized book losses generated from the market dislocation due to the impacts of COVID-19. The provision for income taxes includes, federal, state, local and foreign income taxes resulting in an effective income tax rate of 11.7% and (80.2)% for 2020 and 2019, respectively. The most significant reconciling items between the U.S. federal statutory income tax rate and the effective income tax are due to the following: (i) income passed through to Non-Controlling Interests, (ii) foreign, state and local income taxes including NYC UBT, and (iii) impacts upon Conversion in 2019 noted above (see note 10 to the condensed consolidated financial statements for further details regarding the Company’s income tax provision).
Nine Months Ended September 30, 2020 Compared to Nine Months Ended September 30, 2019
In this section, references to 2020 refer to the nine months ended September 30, 2020 and references to 2019 refer to the nine months ended September 30, 2019.
Revenues
Management fees increased by $77.3 million to $1.2 billion in 2020. This change was primarily attributable to an increase in management fees earned from Athene and Athora of $56.7 million and $37.0 million, respectively, partially offset by a decrease in management fees earned from Fund VIII and Fund VII of $9.7 million and $8.1 million, respectively. For additional details regarding changes in management fees in each segment, see “—Segment Analysis” below.
Advisory and transaction fees, net, increased by $105.2 million to $172.4 million in 2020 from $67.1 million in 2019. This increase was primarily driven by advisory and transaction fees earned in relation to a long-term strategic investment for an underlying real estate portfolio as well as net advisory and transaction fees earned with respect to certain portfolio companies in the media, telecom and technology industries and an increase in structuring fees earned from a company in the consumer and retail industry.
Performance allocations decreased by $1,032.9 million to $(350.5) million in 2020 from $682.5 million in 2019. The pandemic resulting from COVID-19 and the actions taken in response have caused severe disruption to the global economy and financial markets. In line with public equity and credit indices, we have experienced significant unrealized mark-to-market losses in our underlying funds. The decrease in performance allocations were primarily attributable to decreased performance allocations earned from Fund VIII and Structured Credit Recovery Fund IV (“SCRF IV”) of $723.0 million and $104.7 million, respectively, during 2020.
The decrease in performance allocations from Fund VIII was primarily driven by depreciation in the value of the fund’s investments in public portfolio companies primarily in the manufacturing and industrial and financial services sectors, and in private portfolio companies primarily in the consumer services, leisure and natural resources sectors during 2020. The decrease in performance allocations from SCRF IV was primarily driven by the fund’s mark-to-market losses on its investments in structured credit products due to widespread market sell-off and spread widening during 2020.
Principal investment income decreased by $124.5 million to $(25.5) million in 2020 from $99.0 million in 2019. This change was primarily driven by decreases in the value of investments held by certain Apollo funds and other entities in which the Company has a direct interest, mainly with respect to Fund VIII, AION and Redding Ridge of $80.7 million, $13.6 million and $13.4 million, respectively.
Incentive fees increased by $15.3 million to $21.0 million in 2020 from $5.7 million in 2019. This change was primarily attributable to an increase in incentive fees earned from Athene of $13.9 million in 2020.
Expenses
Compensation and benefits decreased by $235.7 million to $546.5 million in 2020 from $782.3 million in 2019. This change was primarily attributable to a decrease in profit sharing expense of $348.6 million due to a corresponding decrease in performance allocations during 2020, as compared to the same period in 2019. In any period the blended profit sharing percentage is impacted by the respective profit sharing ratios of the funds generating performance allocations in the period. The decrease in profit sharing expense was partially offset by an increase in salary, bonus and benefits of $84.0 million, primarily attributable to an increase in headcount. Additionally, there was an increase in equity-based compensation of $28.9 million due to higher amortization expenses associated with previously granted performance awards.
Included in profit sharing expense is $51.2 million and $17.0 million for 2020 and 2019, respectively, related to the Incentive Pool. See “—Profit Sharing Expense” in the Critical Accounting Policies section for an overview of the Incentive Pool.
Interest expense increased by $28.2 million to $98.4 million in 2020 from $70.2 million in 2019, primarily due to additional interest expense incurred as a result of the timing of issuances of debt arrangements, as described in note 11 to our condensed consolidated financial statements.
General, administrative and other expenses increased by $20.3 million to $259.1 million in 2020 from $238.8 million in 2019. This change was primarily driven by an increase in professional fees and occupancy expenses during 2020.
Other Income (Loss)
Net losses from investment activities were $851.4 million in 2020 as compared to net gains from investment activities of $44.1 million in 2019. As discussed in note 15, the Company acquired an additional 35.5 million shares of Athene Holding, as a result of the Transaction Agreement, increasing the Company’s total ownership of Athene Holding’s shares to 54.6 million at September 30, 2020 as compared to 19.1 million shares as of September 30, 2019. Net losses from investment activities in 2020 were primarily attributable to the depreciation in the share price of Athene Holding and the Company’s acquisition of additional shares of Athene Holding pursuant to the Transaction Agreement. See note 7 and 15 to the condensed consolidated financial statements for further information regarding the Company’s investment in Athene Holding.
Net losses from investment activities of consolidated VIEs were $14.1 million in 2020, as compared to net gains from investment activities of consolidated VIEs of $24.7 million in 2019. This change was primarily driven by losses from newly consolidated funds during 2020, as discussed in note 6 to the condensed consolidated financial statements.
Interest income decreased by $12.5 million to $13.4 million in 2020 from $25.9 million in 2019, primarily due to decreased interest income earned from U.S. Treasury securities as a result of lower interest rates in 2020.
Other loss, net was $3.0 million in 2020, as compared to $36.5 million in 2019. The loss in 2019 was primarily attributable to losses from the change in tax receivable agreement liability, which did not occur during 2020.
Income Tax Provision
The income tax benefit decreased to $66.2 million in 2020 from $195.3 million in 2019. The change was primarily related to: (i) the significant benefit retained by the Company upon Conversion in 2019 for the step-up in assets from prior year exchanges of AOG Units for Class A shares, (ii) all earnings becoming subject to corporate-level taxation subsequent to Conversion, and (iii) in 2020, the year-to-date unrealized mark-to-market losses generated from the recent market dislocation
due to the impacts of COVID-19. The provision for income taxes includes federal, state, local and foreign income taxes resulting in an effective income tax rate of 9.8% and (19.9)% for 2020 and 2019, respectively. The most significant reconciling items between our U.S. federal statutory income tax rate and our effective income tax rate were due to the following: (i) income passed through to Non-Controlling Interests, (ii) foreign, state and local income taxes, including NYC UBT, and (iii) impacts upon Conversion in 2019 noted above (see note 10 to the condensed consolidated financial statements for further details regarding the Company’s income tax provision).
Segment Analysis
Discussed below are our results of operations for each of our reportable segments. They represent the segment information available and utilized by our executive management, which consists of our Managing Partners, who operate collectively as our chief operating decision maker, to assess performance and to allocate resources. See note 17 to our condensed consolidated financial statements for more information regarding our segment reporting.
Our financial results vary, since performance fees, which generally constitute a large portion of the income from the funds that we manage, as well as the transaction and advisory fees that we receive, can vary significantly from quarter to quarter and year to year. As a result, we emphasize long-term financial growth and profitability to manage our business.
Credit
The following table sets forth our segment statement of operations information and our supplemental performance measure, Segment Distributable Earnings, within our private equitycredit segment.
| | | | | | | | | | | | | | | | | | | | | | | | | | | | | | | | | | | | | | | | | | | | | | | |
| | For the Three Months Ended September 30, | | Total Change | | Percentage Change | | For the Nine Months Ended September 30, | | Total Change | | Percentage Change |
| | 2020 | | 2019 | | | | 2020 | | 2019 | | |
| | (in thousands) | | | | (in thousands) | | |
| Credit: | | | | | | | | | | | | | | | |
| Management fees | $ | 246,159 | | | $ | 198,867 | | | $ | 47,292 | | | 23.8% | | $ | 679,109 | | | $ | 571,884 | | | $ | 107,225 | | | 18.7% |
| Advisory and transaction fees, net | 51,376 | | | 5,530 | | | 45,846 | | | NM | | 80,399 | | | 13,888 | | | 66,511 | | | 478.9 |
Performance fees(1) | 2,204 | | | 6,449 | | | (4,245) | | | (65.8) | | 8,048 | | | 16,371 | | | (8,323) | | | (50.8) |
| Fee Related Revenues | 299,739 | | | 210,846 | | | 88,893 | | | 42.2 | | 767,556 | | | 602,143 | | | 165,413 | | | 27.5 |
| Salary, bonus and benefits | (61,975) | | | (51,746) | | | (10,229) | | | 19.8 | | (171,789) | | | (146,515) | | | (25,274) | | | 17.3 |
| General, administrative and other | (40,367) | | | (33,403) | | | (6,964) | | | 20.8 | | (112,991) | | | (92,546) | | | (20,445) | | | 22.1 |
| Placement fees | (425) | | | (190) | | | (235) | | | 123.7 | | (1,089) | | | (42) | | | (1,047) | | | NM |
| Fee Related Expenses | (102,767) | | | (85,339) | | | (17,428) | | | 20.4 | | (285,869) | | | (239,103) | | | (46,766) | | | 19.6 |
| Other income (loss), net of Non-Controlling Interest | (780) | | | (597) | | | (183) | | | 30.7 | | (2,167) | | | 967 | | | (3,134) | | | NM |
| Fee Related Earnings | 196,192 | | | 124,910 | | | 71,282 | | | 57.1 | | 479,520 | | | 364,007 | | | 115,513 | | | 31.7 |
| Realized performance fees | 7,614 | | | 3,530 | | | 4,084 | | | 115.7 | | 37,834 | | | 24,887 | | | 12,947 | | | 52.0 |
| Realized profit sharing expense | (7,614) | | | (1,674) | | | (5,940) | | | 354.8 | | (37,530) | | | (13,069) | | | (24,461) | | | 187.2 |
| Net Realized Performance Fees | — | | | 1,856 | | | (1,856) | | | (100.0) | | 304 | | | 11,818 | | | (11,514) | | | (97.4) |
Realized principal investment income, net (2) | 928 | | | 5,845 | | | (4,917) | | | (84.1) | | 4,112 | | | 16,803 | | | (12,691) | | | (75.5) |
| Net interest loss and other | (14,010) | | | (6,106) | | | (7,904) | | | 129.4 | | (42,981) | | | (15,148) | | | (27,833) | | | 183.7 |
| Segment Distributable Earnings | $ | 183,110 | | | $ | 126,505 | | | $ | 56,605 | | | 44.7% | | $ | 440,955 | | | $ | 377,480 | | | $ | 63,475 | | | 16.8% |
|
| | | | | | | | | | | | | | | | | | | | | | | | | | | | | |
| | For the Three Months Ended September 30, | | Total Change | | Percentage Change | | For the Nine Months Ended September 30, | | Total Change | | Percentage Change |
| | 2019 | | 2018 | | | | 2019 | | 2018 | | |
| | (in thousands) | | | | | | | | | | |
| Private Equity: | | | | | | | | | | | | | | | |
| Management fees | $ | 131,643 |
| | $ | 131,578 |
| | $ | 65 |
| | — | % | | $ | 391,777 |
| | $ | 346,275 |
| | $ | 45,502 |
| | 13.1 | % |
| Advisory and transaction fees, net | 10,655 |
| | 6,018 |
| | 4,637 |
| | 77.1 |
| | 47,048 |
| | 29,992 |
| | 17,056 |
| | 56.9 |
|
| Fee Related Revenues | 142,298 |
| | 137,596 |
| | 4,702 |
| | 3.4 |
| | 438,825 |
| | 376,267 |
| | 62,558 |
| | 16.6 |
|
| Salary, bonus and benefits | (45,807 | ) | | (38,700 | ) | | (7,107 | ) | | 18.4 |
| | (129,307 | ) | | (121,304 | ) | | (8,003 | ) | | 6.6 |
|
| General, administrative and other | (26,603 | ) | | (22,694 | ) | | (3,909 | ) | | 17.2 |
| | (75,427 | ) | | (59,010 | ) | | (16,417 | ) | | 27.8 |
|
| Placement fees | (65 | ) | | (51 | ) | | (14 | ) | | 27.5 |
| | (548 | ) | | (134 | ) | | (414 | ) | | 309.0 |
|
| Fee Related Expenses | (72,475 | ) | | (61,445 | ) | | (11,030 | ) | | 18.0 |
| | (205,282 | ) | | (180,448 | ) | | (24,834 | ) | | 13.8 |
|
| Other income (loss), net | (135 | ) | | 1,448 |
| | (1,583 | ) | | NM |
| | 4,024 |
| | 1,839 |
| | 2,185 |
| | 118.8 |
|
| Fee Related Earnings | 69,688 |
| | 77,599 |
| | (7,911 | ) | | (10.2 | ) | | 237,567 |
| | 197,658 |
| | 39,909 |
| | 20.2 |
|
| Realized performance fees | 63,742 |
| | 77,740 |
| | (13,998 | ) | | (18.0 | ) | | 136,429 |
| | 245,152 |
| | (108,723 | ) | | (44.3 | ) |
| Realized profit sharing expense | (22,084 | ) | | (42,842 | ) | | 20,758 |
| | (48.5 | ) | | (63,900 | ) | | (132,102 | ) | | 68,202 |
| | (51.6 | ) |
| Net Realized Performance Fees | 41,658 |
| | 34,898 |
| | 6,760 |
| | 19.4 |
| | 72,529 |
| | 113,050 |
| | (40,521 | ) | | (35.8 | ) |
| Realized principal investment income | 8,114 |
| | 10,579 |
| | (2,465 | ) | | (23.3 | ) | | 18,079 |
| | 37,988 |
| | (19,909 | ) | | (52.4 | ) |
| Net interest loss and other | (8,911 | ) | | (5,004 | ) | | (3,907 | ) | | 78.1 |
| | (22,694 | ) | | (15,619 | ) | | (7,075 | ) | | 45.3 |
|
| Segment Distributable Earnings | $ | 110,549 |
| | $ | 118,072 |
| | $ | (7,523 | ) | | (6.4 | )% | | $ | 305,481 |
| | $ | 333,077 |
| | $ | (27,596 | ) | | (8.3 | )% |
(2)Realized principal investment income, net includes dividends from our permanent capital vehicles, net of such amounts used to compensate employees.
Three Months Ended September 30, 20192020 Compared to Three Months Ended September 30, 20182019
Advisory and transaction fees, net increased by $4.6 million for the three months ended September 30, 2019, as comparedIn this section, references to 2020 refer to the three months ended September 30, 2018.2020 and references to 2019 refer to the three months ended September 30, 2019.
Management fees increased by $47.3 million to $246.2 million in 2020 from $198.9 million in 2019. This change was primarily attributable to an increase in management fees earned from Athene and Athora of $28.3 million and $15.0 million, respectively.
Advisory and transaction fees, net increased by $45.8 million to $51.4 million in 2020 from $5.5 million in 2019. This increase was primarily driven by advisory and transaction fees earned with respectrelated to Fund VIII’s investmentsa long-term strategic investment for an underlying real estate portfolio during 2020.
Performance fees decreased by $4.2 million to $2.2 million in portfolio companies2020 from $6.4 million in 2019, primarily attributable to a decrease in performance fees generated from AINV and Fund IX’s investments in portfolio companiesa non-traded business development company of $2.9$2.2 million and $1.9$2.0 million, respectively, during the three months ended September 30, 2019, as compared to the same period during 2018.respectively.
Salary, bonus and benefits expense increased by $7.1$10.2 million for the three months ended September 30,to $62.0 million in 2020 from $51.7 million in 2019 as compared to the three months ended September 30, 2018 primarily due to an increase in headcount.
General, administrative and other expense increased by $3.9$7.0 million during the three months ended September 30,to $40.4 million in 2020 from $33.4 million in 2019 as compared to the three months ended September 30, 2018. The change was primarily driven by increased fund organizational expenses related to ANRP III,an increase in professional fees and other miscellaneous expenses during the three months ended September 30, 2019, as compared to the same period in 2018.2020.
Realized performance fees decreasedincreased by $14.0$4.1 million for the three months ended September 30, 2019, as compared to the three months ended September 30, 2018.$7.6 million in 2020 from $3.5 million in 2019. This change was primarily attributable to a decreasean increase in realized performance fees generated from Fund VIII of $14.1 million during the three months ended September 30, 2019 as compared to the three months ended September 30, 2018.an SIA. The decreaseincrease in realized performance fees generated from Fund VIIIthe SIA was primarily driven by a decrease in profits realized from investment sales and income from the fund’s investments. The realized performance fees from Fund VIII during the three months ended September 30, 2019 were the result of sales and incomeprofits generated from sales of opportunistic investments primarily in the financial services sector. The realized performance fees during the three months ended September 30, 2018 were the result of sales and income generated from investments primarily in the business services, leisure and consumer services sectors.
2020.
Realized profit sharing expense decreasedincreased by $20.8$5.9 million during the three months ended September 30,to $7.6 million in 2020 from $1.7 million in 2019 as compared to the same period in 2018, as a result of a corresponding decreaseincrease in realized performance fees as described above and a decreasean increase in profit sharing expense related to the Incentive Pool. In any period the blended profit sharing percentage is impacted by the respective profit sharing ratios of the funds generating performance fees in the period. Included in realized profit sharing expense is $14.6$2.7 million related to the Incentive Pool for the three months ended September 30, 2018.2020. There was no realized profit sharing expense related to the Incentive Pool for the three months ended September 30, 2019. The Incentive Pool is separate from the fund related profit sharing expense and may result in greater variability in compensation and have a variable impact on the blended profit sharing percentage during a particular period.
Realized principal investment income decreased by $2.5$4.9 million for the three months ended September 30, 2019, as compared to the same period$0.9 million in 2018.2020 from $5.8 million in 2019. This change was primarily attributable to a decrease in realizations from Apollo’s equity ownership interest in Fund VIII of $2.0 million, during the three months ended September 30, 2019, as compared to the same period in 2018.MidCap and Redding Ridge Holdings.
Net interest loss and other increased by $3.9$7.9 million for the three months ended September 30,to $14.0 million in 2020 from $6.1 million in 2019, as compared to the three months ended September 30, 2018, primarily due to additional interest expense incurred during the three months ended September 30, 2019 as a result of the timing of issuances of the 2029 Senior Notes and 2039 Senior Secured Guaranteed Notes,debt arrangements, as described in note 1011 to our condensed consolidated financial statements.statements, as well as a decrease in interest income earned from U.S. Treasury securities as a result of lower interest rates in 2020.
Nine Months Ended September 30, 20192020 Compared to Nine Months Ended September 30, 20182019
Management fees increased by $45.5 million for the nine months ended September 30, 2019, as comparedIn this section, references to 2020 refer to the nine months ended September 30, 2018. This change was primarily attributable2020 and references to the commencement of Fund IX’s investment period in April 2018, resulting in an increase of $79.5 million in management fees during the nine months ended September 30, 2019 as comparedrefer to the nine months ended September 30, 2018. The increase in management2019.
Management fees was partially offset by decreased management fees earned from Fund VIII and COF III of $22.1 million and $6.0 million, respectively, during the nine months ended September 30, 2019 as compared to the nine months ended September 30, 2018.
Advisory and transaction fees, net increased by $17.1$107.2 million for the nine months ended September 30, 2019, as compared to the nine months ended September 30, 2018.$679.1 million in 2020 from $571.9 million in 2019. This change was primarily attributable to an increase in management fees earned from Athene and Athora of $51.5 million and $32.5 million, respectively.
Advisory and transaction fees, net increased by $66.5 million to $80.4 million in 2020 from $13.9 million in 2019. This increase was primarily driven by advisory and transaction fees earned with respectin relation to Fund IX’s investments ina long-term strategic investment for an underlying real estate portfolio and structuring fees earned related to portfolio companies in the energy and Hybrid Value Fund’s investmentsconsumer and retail industries during 2020.
Performance fees decreased by $8.3 million to $8.0 million in portfolio companies of $14.02020 from $16.4 million and $10.1 million, respectively, during the nine months ended September 30,in 2019, as comparedprimarily attributable to the same period during 2018. The increasea decrease in net advisory and transaction fees was partially offset by decreased net advisory and transactionperformance fees earned from Fund VIII’s investmentsRedding Ridge Holdings of $6.4 million, as Redding Ridge Holdings achieved its annualized hurdle rate during 2019 but did not do so in portfolio companies2020, as well as decreases in performance fees generated from a non-traded business development company and AINV of $5.7$5.8 million during the nine months ended September 30, 2019, as compared to the nine months ended September 30, 2018.and $2.2 million, respectively.
Salary, bonus and benefits expense increased by $8.0$25.3 million for the nine months ended September 30,to $171.8 million in 2020 from $146.5 million in 2019 as compared to the nine months ended September 30, 2018 primarily due to an increase in headcount.
General, administrative and other expense increased by $16.4$20.4 million during the nine months ended September 30, 2019, as compared to the nine months ended September 30, 2018.$113.0 million in 2020 from $92.5 million in 2019. The change was primarily driven by increasedincreases in professional fees, technology expense and fund organizational expenses related to ANRP III during the nine months ended September 30, 2019, as compared to the same periodoccupancy costs in 2018.
Other income, net increased by $2.2 million for the nine months ended September 30, 2019, as compared to the nine months ended September 30, 2018. The change was primarily driven by the reversal of a liability relating to a favorable judgment in a legal proceeding during the nine months ended September 30, 2019.2020.
Realized performance fees decreasedincreased by $108.7$12.9 million for the nine months ended September 30, 2019, as compared to the nine months ended September 30, 2018.$37.8 million in 2020 from $24.9 million in 2019. This change was primarily attributable to decreasesan increase in realized performance fees generated from Fund VIII, ANRP II,an insurance-linked securities portfolio, an SIA and Fund VIIcertain CLOs of $80.4$13.9 million, $5.2$5.1 million and $4.5$5.0 million, respectively, during the nine months ended September 30, 2019 as compared to the nine months ended September 30, 2018.partially offset by a decrease in realized performance fees generated from FCI I of $12.0 million.
The increase in realized performance fees from Fund VIIIthe SIA was attributable to sales of opportunistic investments across a number of sectors. The increase in realized performance fees from certain CLOs was attributable to crystallization of performance fees as the CLOs liquidated during the nine months ended September 30, 2019 were the result of sales and income2020. The decrease in realized performance fees generated from FCI I was primarily driven by realizations of the fund’s investments primarily in various life settlement policies during 2019, while the business services, manufacturing and industrial, financial services and leisure sectors. Thefund had no realized performance fees during the nine months ended September 30, 2018 were the result of sales and income generated from investments primarily in the financial services, business services, manufacturing and industrial, and leisure sectors. The realized performance fees from ANRP II during the nine months ended September 30, 2019 were the result of a tax distribution and income earned on an escrow account balance and the realized performance fees during the same period in 2018 were the result of sales generated from investments in the natural resources sector. The realized performance fees from Fund VII
during the nine months ended September 30, 2019 were the result of income earned on an escrow account balance and the realized performance fees during the same period in 2018 were the result of a tax distribution.2020.
Realized profit sharing expense decreasedincreased by $68.2$24.5 million during the nine months ended September 30,to $37.5 million in 2020 from $13.1 million in 2019, as compared to the same period in 2018, as a result of a corresponding decreaseincrease in realized performance fees as described above, and a decreasean increase in profit sharing expense related to the Incentive Pool. In any period the blended profit sharing percentage is impacted by the respective profit sharing ratios of the funds generating performance fees in the period. Included in realized profit sharing expense is $16.9$19.4 million and $39.3$0.1 million related to the Incentive Pool for the nine months ended September 30,2020 and 2019, and 2018, respectively. The Incentive Pool is separate from the fund related profit sharing expense and may result in greater variability in compensation and have a variable impact on the blended profit sharing percentage during a particular period.
Realized principal investment income decreased by $19.9$12.7 million for the nine months ended September 30, 2019, as compared to the same period$4.1 million in 2018.2020 from $16.8 million in 2019. This change was primarily attributable to a decrease in realizations from Apollo’s equity ownership interest in Fund VIII, COF IIIMidCap and Fund VIIRedding Ridge Holdings of $10.4 million, $2.4$7.2 million and $2.1$1.0 million, respectively, during the nine months ended September 30, 2019, as compared to the same period in 2018.respectively.
Net interest loss and other increased by $7.1$27.8 million forto $43.0 million in 2020 from $15.1 million in 2019, primarily due to additional interest expense incurred as a result of the ninetiming of issuances of debt arrangements, as described in note 11 to our condensed consolidated financial statements. Additionally, the increase was partially due to one-time costs to wind down a managed account arrangement incurred during 2020.
Private Equity
The following table sets forth our segment statement of operations information and our supplemental performance measure, Segment Distributable Earnings, within our private equity segment.
| | | | | | | | | | | | | | | | | | | | | | | | | | | | | | | | | | | | | | | | | | | | | | | |
| For the Three Months Ended September 30, | | Total Change | | Percentage Change | | For the Nine Months Ended September 30, | | Total Change | | Percentage Change |
| | 2020 | | 2019 | | | | 2020 | | 2019 | | |
| | (in thousands) | | | | (in thousands) | | |
| Private Equity: | | | | | | | | | | | | | | | |
| Management fees | $ | 128,446 | | | $ | 131,643 | | | $ | (3,197) | | | (2.4)% | | $ | 381,306 | | | $ | 391,777 | | | $ | (10,471) | | | (2.7)% |
| Advisory and transaction fees, net | 20,108 | | | 10,655 | | | 9,453 | | | 88.7 | | 85,253 | | | 47,048 | | | 38,205 | | | 81.2 |
| Fee Related Revenues | 148,554 | | | 142,298 | | | 6,256 | | | 4.4 | | 466,559 | | | 438,825 | | | 27,734 | | | 6.3 |
| Salary, bonus and benefits | (53,451) | | | (45,807) | | | (7,644) | | | 16.7 | | (149,133) | | | (129,307) | | | (19,826) | | | 15.3 |
| General, administrative and other | (25,099) | | | (26,603) | | | 1,504 | | | (5.7) | | (68,863) | | | (75,427) | | | 6,564 | | | (8.7) |
| Placement fees | (188) | | | (65) | | | (123) | | | 189.2 | | (295) | | | (548) | | | 253 | | | (46.2) |
| Fee Related Expenses | (78,738) | | | (72,475) | | | (6,263) | | | 8.6 | | (218,291) | | | (205,282) | | | (13,009) | | | 6.3 |
| Other income, net | 23 | | | (135) | | | 158 | | | NM | | 48 | | | 4,024 | | | (3,976) | | | (98.8) |
| Fee Related Earnings | 69,839 | | | 69,688 | | | 151 | | | 0.2 | | 248,316 | | | 237,567 | | | 10,749 | | | 4.5 |
| Realized performance fees | 2,025 | | | 63,742 | | | (61,717) | | | (96.8) | | 6,717 | | | 136,429 | | | (129,712) | | | (95.1) |
| Realized profit sharing expense | (2,025) | | | (22,084) | | | 20,059 | | | (90.8) | | (7,021) | | | (63,900) | | | 56,879 | | | (89.0) |
| Net Realized Performance Fees | — | | | 41,658 | | | (41,658) | | | (100.0) | | (304) | | | 72,529 | | | (72,833) | | | NM |
| Realized principal investment income | 1,598 | | | 8,114 | | | (6,516) | | | (80.3) | | 5,544 | | | 18,079 | | | (12,535) | | | (69.3) |
| Net interest loss and other | (14,580) | | | (8,911) | | | (5,669) | | | 63.6 | | (41,940) | | | (22,694) | | | (19,246) | | | 84.8 |
| Segment Distributable Earnings | $ | 56,857 | | | $ | 110,549 | | | $ | (53,692) | | | (48.6)% | | $ | 211,616 | | | $ | 305,481 | | | $ | (93,865) | | | (30.7)% |
Three Months Ended September 30, 2020 Compared to Three Months Ended September 30, 2019
In this section, references to 2020 refer to the three months ended September 30, 2020 and references to 2019 refer to the three months ended September 30, 2019.
Management fees decreased by $3.2 million to $128.4 million in 2020 from $131.6 million in 2019. This change was primarily attributable to a decrease in management fees earned from Fund VIII and Fund VII of $4.5 million and $2.9 million, respectively, partially offset by an increase in management fees earned from Hybrid Value Fund of $4.0 million.
Advisory and transaction fees, net increased by $9.5 million to $20.1 million in 2020 from $10.7 million in 2019. This change was primarily attributable to a transaction fee earned with respect to a portfolio company in the media, telecom and technology industry.
Salary, bonus and benefits expense increased by $7.6 million to $53.5 million in 2020 from $45.8 million in 2019 primarily due to an increase in headcount.
Realized performance fees decreased by $61.7 million to $2.0 million in 2020 from $63.7 million in 2019. This change was primarily attributable to a decrease in realized performance fees generated from Fund VIII of $57.2 million. The realized performance fees generated from Fund VIII during 2019 were the result of sales and income generated from investments primarily in the financial services sector. Fund VIII had no realized performance fees during 2020.
Realized profit sharing expense decreased by $20.1 million to $2.0 million in 2020 from $22.1 million in 2019, as compareda result of the decrease in realized performance fees as described above, partially offset by an increase in profit sharing expense related to the Incentive Pool. In any period the blended profit sharing percentage is impacted by the respective profit sharing ratios of the funds generating performance fees in the period. Included in realized profit sharing expense is $1.2 million of expense related to the Incentive Pool for 2020. There was no profit sharing expense related to the Incentive Pool for 2019. The Incentive Pool is separate from the fund related profit sharing expense and may result in greater variability in compensation and have a variable impact on the blended profit sharing percentage during a particular period.
Realized principal investment income decreased by $6.5 million to $1.6 million in 2020 from $8.1 million in 2019. This change was primarily attributable to a decrease in realizations from Apollo’s equity ownership in Fund VIII of $7.2 million.
Net interest loss and other increased by $5.7 million to $14.6 million in 2020 from $8.9 million in 2019, primarily due to a decrease in interest income earned from U.S. Treasury securities as a result of lower interest rates in 2020, as well as additional interest expense incurred as a result of the timing of issuances of debt arrangements, as described in note 11 to our condensed consolidated financial statements.
Nine Months Ended September 30, 2020 Compared to Nine Months Ended September 30, 2019
In this section, references to 2020 refer to the nine months ended September 30, 2018,2020 and references to 2019 refer to the nine months ended September 30, 2019.
Management fees decreased by $10.5 million to $381.3 million in 2020 from $391.8 million in 2019. This change was primarily attributable to a decrease in management fees earned from Fund VIII and Fund VII of $9.7 million and $8.1 million, respectively, partially offset by an increase in management fees earned from Hybrid Value Fund of $8.8 million.
Advisory and transaction fees, net increased by $38.2 million to $85.3 million in 2020 from $47.0 million in 2019. This change was primarily attributable to transaction fees earned with respect to a portfolio company in the media, telecom and technology industry and a structuring fee earned from a portfolio company in the consumer and retail industry in 2020.
Salary, bonus and benefits expense increased by $19.8 million to $149.1 million in 2020 from $129.3 million in 2019 primarily due to an increase in headcount.
General, administrative and other expense decreased by $6.6 million to $68.9 million in 2020 from $75.4 million in 2019. The change was primarily driven by a decrease in professional fees and fund organizational expenses in 2020.
Realized performance fees decreased by $129.7 million to $6.7 million in 2020 from $136.4 million in 2019. This change was primarily attributable to a decrease in realized performance fees generated from Fund VIII of $126.8 million. The realized performance fees earned from Fund VIII in 2019 were the result of sales and income generated from investments primarily in the business services, manufacturing and industrial, financial services and leisure sectors. Fund VIII had no realized performance fees during 2020.
Realized profit sharing expense decreased by $56.9 million to $7.0 million in 2020 from $63.9 million in 2019, as a result of the corresponding decrease in realized performance fees as described above as well as a decrease in the profit sharing expense related to the Incentive Pool. In any period the blended profit sharing percentage is impacted by the respective profit sharing ratios of the funds generating performance fees in the period. Included in realized profit sharing expense is $3.0 million and $16.9 million of expenses related to the Incentive Pool for 2020 and 2019, respectively. The Incentive Pool is separate from the fund related profit sharing expense and may result in greater variability in compensation and have a variable impact on the blended profit sharing percentage during a particular period.
Realized principal investment income decreased by $12.5 million to $5.5 million in 2020 from $18.1 million in 2019. This change was primarily attributable to a decrease in realizations from Apollo’s equity ownership in Fund VIII of $15.6 million partially offset by an increase in realizations from Apollo’s equity ownership in Fund IX of $2.7 million.
Net interest loss and other increased by $19.2 million to $41.9 million in 2020 from $22.7 million in 2019 primarily due to additional interest expense incurred during the nine months ended September 30, 2019 as a result of the timing of issuances of the 2029 Senior Notes and 2039 Senior Secured Guaranteed Notes,debt arrangements, as described in note 1011 to our condensed consolidated financial statements.statements as well as a decrease in interest income earned from U.S. Treasury securities as a result of lower interest rates in 2020. Additionally, the increase was partially due to one-time costs to wind down a managed account arrangement incurred during 2020.
Real Assets
The following table sets forth our segment statement of operations information and our supplemental performance measure, Segment Distributable Earnings, within our real assets segment.
| | | | For the Three Months Ended September 30, | | Total Change | | Percentage Change | | For the Nine Months Ended September 30, | Total Change | | Percentage Change | | For the Three Months Ended September 30, | | Total Change | | Percentage Change | | For the Nine Months Ended September 30, | Total Change | | Percentage Change |
| | 2019 | | 2018 | | 2019 | | 2018 | | | 2020 | | 2019 | | 2020 | | 2019 | |
| | (in thousands) | | | | | | | | | | | | (in thousands) | | | | (in thousands) | | |
| Real Assets: | | | | | | | | | | | | | | | | Real Assets: | |
| Management fees | $ | 47,862 |
| | $ | 41,149 |
| | $ | 6,713 |
| | 16.3 | % | | $ | 139,645 |
| | $ | 121,627 |
| | $ | 18,018 |
| | 14.8 | % | Management fees | $ | 51,847 | | | $ | 47,862 | | | $ | 3,985 | | | 8.3% | | $ | 150,227 | | | $ | 139,645 | | | $ | 10,582 | | | 7.6% |
| Advisory and transaction fees, net | 377 |
| | 4,765 |
| | (4,388 | ) | | (92.1 | ) | | 5,748 |
| | 5,070 |
| | 678 |
| | 13.4 |
| Advisory and transaction fees, net | 878 | | | 377 | | | 501 | | | 132.9% | | 5,191 | | | 5,748 | | | (557) | | | (9.7) |
| Fee Related Revenues | 48,239 |
| | 45,914 |
| | 2,325 |
| | 5.1 |
| | 145,393 |
| | 126,697 |
| | 18,696 |
| | 14.8 |
| Fee Related Revenues | 52,725 | | | 48,239 | | | 4,486 | | | 9.3% | | 155,418 | | | 145,393 | | | 10,025 | | | 6.9 |
| Salary, bonus and benefits | (19,306 | ) | | (18,191 | ) | | (1,115 | ) | | 6.1 |
| | (57,031 | ) | | (57,069 | ) | | 38 |
| | (0.1 | ) | Salary, bonus and benefits | (29,513) | | | (19,306) | | | (10,207) | | | 52.9% | | (83,037) | | | (57,031) | | | (26,006) | | | 45.6 |
| General, administrative and other | (10,734 | ) | | (9,911 | ) | | (823 | ) | | 8.3 |
| | (28,956 | ) | | (29,435 | ) | | 479 |
| | (1.6 | ) | General, administrative and other | (11,869) | | | (10,734) | | | (1,135) | | | 10.6% | | (35,637) | | | (28,956) | | | (6,681) | | | 23.1 |
| Placement fees | (1 | ) | | (400 | ) | | 399 |
| | (99.8 | ) | | (1 | ) | | (400 | ) | | 399 |
| | (99.8 | ) | Placement fees | — | | | (1) | | | 1 | | | (100.0) | | — | | | (1) | | | 1 | | | (100.0) |
| Fee Related Expenses | (30,041 | ) | | (28,502 | ) | | (1,539 | ) | | 5.4 |
| | (85,988 | ) | | (86,904 | ) | | 916 |
| | (1.1 | ) | Fee Related Expenses | (41,382) | | | (30,041) | | | (11,341) | | | 37.8% | | (118,674) | | | (85,988) | | | (32,686) | | | 38.0 |
| Other income (loss), net of Non-Controlling Interest | (6 | ) | | 1,680 |
| | (1,686 | ) | | NM |
| | 88 |
| | 1,903 |
| | (1,815 | ) | | (95.4 | ) | Other income (loss), net of Non-Controlling Interest | 59 | | | (6) | | | 65 | | | NM | | 154 | | | 88 | | | 66 | | | 75.0 |
| Fee Related Earnings | 18,192 |
| | 19,092 |
| | (900 | ) | | (4.7 | ) | | 59,493 |
| | 41,696 |
| | 17,797 |
| | 42.7 |
| Fee Related Earnings | 11,402 | | | 18,192 | | | (6,790) | | | (37.3)% | | 36,898 | | | 59,493 | | | (22,595) | | | (38.0) |
| Realized performance fees | 162 |
| | 4,010 |
| | (3,848 | ) | | (96.0 | ) | | 3,242 |
| | 55,625 |
| | (52,383 | ) | | (94.2 | ) | Realized performance fees | 7,806 | | | 162 | | | 7,644 | | | NM | | 49,477 | | | 3,242 | | | 46,235 | | | NM |
| Realized profit sharing expense | (65 | ) | | (2,352 | ) | | 2,287 |
| | (97.2 | ) | | (1,299 | ) | | (32,222 | ) | | 30,923 |
| | (96.0 | ) | Realized profit sharing expense | (7,806) | | | (65) | | | (7,741) | | | NM | | (49,477) | | | (1,299) | | | (48,178) | | | NM |
| Net Realized Performance Fees | 97 |
| | 1,658 |
| | (1,561 | ) | | (94.1 | ) | | 1,943 |
| | 23,403 |
| | (21,460 | ) | | (91.7 | ) | Net Realized Performance Fees | — | | | 97 | | | (97) | | | (100.0)% | | — | | | 1,943 | | | (1,943) | | | (100.0) |
| Realized principal investment income | 415 |
| | 532 |
| | (117 | ) | | (22.0 | ) | | 2,209 |
| | 5,678 |
| | (3,469 | ) | | (61.1 | ) | Realized principal investment income | 356 | | | 415 | | | (59) | | | (14.2)% | | 4,028 | | | 2,209 | | | 1,819 | | | 82.3 |
| Net interest loss and other | (3,234 | ) | | (2,835 | ) | | (399 | ) | | 14.1 |
| | (8,115 | ) | | (6,712 | ) | | (1,403 | ) | | 20.9 |
| Net interest loss and other | (6,216) | | | (3,234) | | | (2,982) | | | 92.2% | | (16,069) | | | (8,115) | | | (7,954) | | | 98.0 |
| Segment Distributable Earnings | $ | 15,470 |
| | $ | 18,447 |
| | $ | (2,977 | ) | | (16.1 | )% | | $ | 55,530 |
| | $ | 64,065 |
| | $ | (8,535 | ) | | (13.3 | )% | Segment Distributable Earnings | $ | 5,542 | | | $ | 15,470 | | | $ | (9,928) | | | (64.2)% | | $ | 24,857 | | | $ | 55,530 | | | $ | (30,673) | | | (55.2)% |
Three Months Ended September 30, 20192020 Compared to Three Months Ended September 30, 20182019
Management fees increased by $6.7 million for the three months ended September 30, 2019, as comparedIn this section, references to 2020 refer to the three months ended September 30, 2018.2020 and references to 2019 refer to the three months ended September 30, 2019.
Management fees increased by $4.0 million to $51.8 million in 2020 from $47.9 million in 2019. This change was primarily attributable to an increase in management fees earned from Apollo U.S. Real Estate Fund III, Athene, and Athora of $4.4$1.6 million, along with modest increases in management fees earned across most of our real assets funds$1.4 million, and $1.4 million, respectively. Apollo U.S. Real Estate Fund III became effective during the three months ended SeptemberJune 30, 2019, as compared to the same period during 2018.
Advisory2020 and transactionearned a full quarter of management fees net decreased by $4.4 million for the three months ended September 30, 2019, as compared to the three months ended September 30, 2018. This change was primarily attributable to a decrease in net advisory and transaction fees earned with respect to an India-based fund of $3.5 million during the three months ended September 30, 2019, as compared to the same period during 2018.2020.
Salary, bonus and benefits increased by $1.1$10.2 million during the three months ended September 30,to $29.5 million in 2020 from $19.3 million in 2019 as compared to the three months ended September 30, 2018 primarily due to an increase in headcount.
Other income, net of Non-Controlling Interest decreased by $1.7 million for the three months ended September 30, 2019, as compared to the three months ended September 30, 2018 primarily due to a gain related to the acquisition of management contracts for India-based funds during the three months ended September 30, 2018.
Realized performance fees decreased by $3.8 million for the three months ended September 30, 2019, as compared to the three months ended September 30, 2018. The decrease in realized performance fees was primarily attributable to decreases in realized performance fees generated from EPF II and strategic investment accounts of $2.6 million and $1.1 million, respectively, during the three months ended September 30, 2019, as compared to the three months ended September 30, 2018. The decrease in realized performance fees from EPF II is primarily due to the realization of a UK commercial real estate investment held by the fund during the three months ended September 30, 2018, while the fund had no realizations during the three months ended September 30, 2019. The decrease in realized performance fees from strategic investment accounts was primarily driven by lower profits allocated from underlying fund investments for the three months ended September 30, 2019, as compared to the same period during 2018.
Realized profit sharing expense decreased by $2.3 million during the three months ended September 30, 2019, as compared to the same period in 2018, as a result of a corresponding decrease in realized performance fees as described above. In any period the blended profit sharing percentage is impacted by the respective profit sharing ratios of the funds generating performance fees in the period. Included in realized profit sharing expense is $0.7 million related to the Incentive Pool for the three months ended September 30, 2018. There was no realized profit sharing expense related to the Incentive Pool for the three months ended September 30, 2019. The Incentive Pool is separate from the fund related profit sharing expense and may result in greater variability in compensation and have a variable impact on the blended profit sharing percentage during a particular period.
Nine Months Ended September 30, 2019 Compared to Nine Months Ended September 30, 2018
Management fees increased by $18.0$7.6 million for the nine months ended September 30, 2019, as compared to the nine months ended September 30, 2018.$7.8 million in 2020 from $0.2 million in 2019. This change was primarily attributable to an increase in management fees earned from Athene of $13.5 million, along with modest increases in management fees earned across most of our real assets funds during the nine months ended September 30, 2019, as compared to the same period during 2018.
Other income, net of Non-Controlling Interest, decreased by $1.8 million for the nine months ended September 30, 2019, as compared to the nine months ended September 30, 2018 primarily due to a gain from the acquisition of management contracts related to India-based funds during the nine months ended September 30, 2018.
Realized performance fees decreased by $52.4 million for the nine months ended September 30, 2019, as compared to the nine months ended September 30, 2018. The decrease in realized performance fees was primarily attributable to decreases in realized performance fees generated from EPFApollo Infrastructure Opportunities Fund (“AIOF”) I and Apollo U.S. Real Estate Fund II and strategic investment accounts of $41.6$4.3 million and $8.3$3.0 million, respectively, during the nine months ended September 30, 2019, as compared to the nine months ended September 30, 2018. Realized performance fees from EPF II decreased primarily due to the realizations of UK hotel assets and UK commercial real estate investments held by the fund during the nine months ended September 30, 2018, while the fund had no realizations during the nine months ended September 30, 2019. respectively.
The decreaseincrease in realized performance fees from strategic investment accountsAIOF I was primarily driven by lowera result of full and partial realizations of infrastructure related assets and recurring yield from certain unrealized projects. The increase in realized profits allocatedperformance fees from underlying fund investments forApollo U.S. Real Estate Fund II was primarily the nine months ended September 30, 2019 as compared to the nine months ended September 30, 2018.result of industrial asset realizations in 2020.
Realized profit sharing expense decreasedincreased by $30.9$7.7 million during the nine months ended September 30,to $7.8 million in 2020 from $0.1 million in 2019, as compared to the same period in 2018, as a result of athe corresponding decreaseincrease in realized performance fees as described above and a decreasean increase in profit sharing expense related to the Incentive Pool. In any period the blended profit sharing percentage is impacted by the respective profit sharing ratios of the funds generating performance fees in the period. Included in realized profit sharing expense is $9.0$4.4 million of expense related to the Incentive Pool for 2020. The Incentive Pool is separate from the fund related profit sharing expense and may result in greater variability in compensation and have a variable impact on the blended profit sharing percentage during a particular period.
Net interest loss and other increased by $3.0 million to $6.2 million in 2020 from $3.2 million in 2019, primarily due to additional interest expense incurred as a result of the timing of issuances of debt arrangements, as described in note 11 to our condensed consolidated financial statements as well as a decrease in interest income earned from U.S. Treasury securities as a result of lower interest rates in 2020.
Nine Months Ended September 30, 2020 Compared to Nine Months Ended September 30, 2019
In this section, references to 2020 refer to the nine months ended September 30, 2020 and references to 2019 refer to the nine months ended September 30, 2019.
Management fees increased by $10.6 million to $150.2 million in 2020 from $139.6 million in 2019. This change was primarily attributable to an increase in management fees earned from Athene and Athora of $5.5 million and $4.5 million, respectively.
Salary, bonus and benefits expense increased by $26.0 million to $83.0 million in 2020 from $57.0 million in 2019 primarily due to an increase in headcount.
General, administrative and other expense increased by $6.7 million to $35.6 million in 2020 from $29.0 million in 2019. The change was primarily driven by an increase in professional fees, occupancy costs, and technology expenses in 2020.
Realized performance fees increased by $46.2 million to $49.5 million in 2020 from $3.2 million in 2019. The increase in realized performance fees in 2020 was primarily attributable to realized performance fees generated from EPF III and AIOF I of $34.1 million and $6.3 million, respectively.
The increase in realized performance fees from EPF III was a result of the sale of investments in logistics assets in 2020, while the fund had no realizations during 2019. The increase in realized performance fees from AIOF I was primarily a result of full and partial realizations of infrastructure related assets and recurring yield from certain unrealized projects.
Realized profit sharing expense increased by $48.2 million to $49.5 million in 2020 from $1.3 million in 2019 as a result of the corresponding increase in realized performance fees as described above, and an increase in profit sharing expense related to the Incentive Pool. In any period the blended profit sharing percentage is impacted by the respective profit sharing ratios of the funds generating performance fees in the period. Included in realized profit sharing expense is $28.8 million related to the Incentive Pool for the nine months ended September 30, 2018.2020. There was no realized profit sharing expense related to the Incentive Pool for the nine months ended September 30, 2019. The Incentive Pool is separate from the fund related profit sharing expense and may result in greater variability in compensation and have a variable impact on the blended profit sharing percentage during a particular period.
Realized principal investment income decreasedincreased by $3.5$1.8 million for the nine months ended September 30, 2019, as compared to the nine months ended September 30, 2018.$4.0 million in 2020 from $2.2 million in 2019. This change was primarily attributable to a decrease in realizations from Apollo’s equity ownership interest in EPF II of $4.3 million during the nine months ended September 30, 2019, as compared to the same period in 2018. The decrease in realized principal investment income was partially offset by an increase in realizations from Apollo’s equity ownership interest in ARI of $1.1 million during the nine months ended September 30, 2019, as compared to the same period in 2018.EPF III.
Net interest loss and other increased by $1.4$8.0 million for the nine months ended September 30,to $16.1 million in 2020 from $8.1 million in 2019 as compared to the nine months ended September 30, 2018, primarily due to additional interest expense incurred during the nine months ended
September 30, 2019 as a result of the timing of issuances of the 2029 Senior Notes and 2039 Senior Secured Guaranteed Notes,debt arrangements, as described in note 1011 to our condensed consolidated financial statements.statements as well as a decrease in interest income earned from U.S. Treasury securities as a result of lower interest rates in 2020.
Summary of Distributable Earnings
The following table is a reconciliation of Distributable Earnings per share of common and equivalent to net dividend per share of common and equivalent.
| | | | | | | | | | | | | | | | | | | | | | | |
| For the Three Months Ended September 30, | | For the Nine Months Ended September 30, |
| 2020 | | 2019 | | 2020 | | 2019 |
| (in thousands, except per share data) |
| Segment Distributable Earnings | $ | 245,509 | | | $ | 252,524 | | | $ | 677,428 | | | $ | 738,491 | |
| Taxes and related payables | (31,257) | | | (20,895) | | | (74,490) | | | (50,409) | |
| Preferred dividends | (9,163) | | | (9,164) | | | (27,492) | | | (27,492) | |
| Distributable Earnings | 205,089 | | | 222,465 | | | 575,446 | | | 660,590 | |
| Add back: Tax and related payables attributable to common and equivalents | 14,678 | | | 18,765 | | | 51,698 | | | 44,017 | |
Distributable Earnings before certain payables(1) | 219,767 | | | 241,230 | | | 627,144 | | | 704,607 | |
| Percent to common and equivalents | 54 | % | | 56 | % | | 54 | % | | 56 | % |
| Distributable Earnings before other payables attributable to common and equivalents | 118,674 | | | 135,089 | | | 338,658 | | | 394,580 | |
| Less: Taxes and related payables attributable to common and equivalents | (14,678) | | | (18,765) | | | (51,698) | | | (44,017) | |
Distributable Earnings attributable to common and equivalents(2) | $ | 103,996 | | | $ | 116,324 | | | $ | 286,960 | | | $ | 350,563 | |
Distributable Earnings per share(3) | $ | 0.47 | | | $ | 0.54 | | | $ | 1.30 | | | $ | 1.60 | |
(Retained) contributed capital per share(3) | 0.04 | | | (0.04) | | | 0.12 | | | (0.14) | |
Net dividend per share(3) | $ | 0.51 | | | $ | 0.50 | | | $ | 1.42 | | | $ | 1.46 | |
(1)Distributable Earnings before certain payables represents Distributable Earnings before the deduction for the estimated current corporate taxes and the amounts payable under Apollo’s tax receivable agreement.
(2)“Common and equivalents” consists of total shares of Class A Common Stock outstanding and RSUs that participate in dividends.
(3)Per share calculations are based on end of period Distributable Earnings Shares Outstanding, which consists of total shares of Class A Common Stock outstanding, AOG Units that participate in dividends and RSUs that participate in dividends.
|
| | | | | | | | | | | | | | | |
| | For the Three Months Ended September 30, | | For the Nine Months Ended September 30, |
| | 2019 | | 2018 | | 2019 | | 2018 |
| | (in thousands, except per share data) |
| Segment Distributable Earnings | $ | 252,524 |
| | $ | 242,245 |
| | $ | 738,491 |
| | $ | 684,938 |
|
| Taxes and related payables | (20,895 | ) | | (9,734 | ) | | (50,409 | ) | | (34,770 | ) |
| Preferred dividends | (9,164 | ) | | (9,164 | ) | | (27,492 | ) | | (22,499 | ) |
| Distributable Earnings | 222,465 |
| | 223,347 |
| | 660,590 |
| | 627,669 |
|
| Add back: Tax and related payables attributable to common and equivalents | 18,765 |
| | 7,702 |
| | 44,017 |
| | 28,677 |
|
Distributable Earnings before certain payables(1) | 241,230 |
| | 231,049 |
| | 704,607 |
| | 656,346 |
|
| Percent to common and equivalents | 56 | % | | 51 | % | | 56 | % | | 51 | % |
| Distributable Earnings before other payables attributable to common and equivalents | 135,089 |
| | 117,835 |
| | 394,580 |
| | 334,736 |
|
| Less: Taxes and related payables attributable to common and equivalents | (18,765 | ) | | (7,702 | ) | | (44,017 | ) | | (28,677 | ) |
Distributable Earnings attributable to common and equivalents(2) | $ | 116,324 |
| | $ | 110,133 |
| | $ | 350,563 |
| | $ | 306,059 |
|
Distributable Earnings per share(3) | $ | 0.54 |
| | $ | 0.54 |
| | $ | 1.60 |
| | $ | 1.52 |
|
Retained capital per share(3) | (0.04 | ) | | (0.08 | ) | | (0.14 | ) | | (0.25 | ) |
Net dividend per share(3) | $ | 0.50 |
| | $ | 0.46 |
| | $ | 1.46 |
| | $ | 1.27 |
|
| |
(1) | Distributable Earnings before certain payables represents Distributable Earnings before the deduction for the estimated current corporate taxes and the amounts payable under Apollo’s tax receivable agreement. |
| |
(2) | “Common and equivalents” consists of total shares of Class A Common Stock outstanding and RSUs that participate in dividends. |
| |
(3) | Per share calculations are based on end of period Distributable Earnings Shares Outstanding, which consists of total shares of Class A Common Stock outstanding, AOG Units and RSUs that participate in dividends. |
Summary of Non-U.S. GAAP Measures
The table below sets forth a reconciliation of net income attributable to Apollo Global Management, Inc. Class A Common Stockholders to our non-U.S. GAAP performance measures:
| | | | | | | | | | | | | | | | | | | | | | | |
| For the Three Months Ended September 30, | | For the Nine Months Ended September 30, |
| 2020 | | 2019 | | 2020 | | 2019 |
| (in thousands) |
| Net Income (Loss) Attributable to Apollo Global Management, Inc. Class A Common Stockholders | $ | 263,236 | | | $ | 354,106 | | | $ | (304,982) | | | $ | 649,658 | |
| Preferred dividends | 9,163 | | | 9,164 | | | 27,492 | | | 27,492 | |
| Net income (loss) attributable to Non-Controlling Interests in consolidated entities | 100,021 | | | 7,083 | | | (23,320) | | | 20,888 | |
| Net income (loss) attributable to Non-Controlling Interests in the Apollo Operating Group | 303,679 | | | 150,741 | | | (307,849) | | | 480,784 | |
| Net Income (Loss) | $ | 676,099 | | | $ | 521,094 | | | $ | (608,659) | | | $ | 1,178,822 | |
| Income tax provision (benefit) | 89,357 | | | (231,896) | | | (66,173) | | | (195,345) | |
| Income Before Income Tax Provision (Benefit) | $ | 765,456 | | | $ | 289,198 | | | $ | (674,832) | | | $ | 983,477 | |
Transaction-related charges(1) | 10,835 | | | 5,201 | | | 21,546 | | | 28,799 | |
Charges associated with corporate conversion(2) | 2,829 | | | 6,994 | | | 3,893 | | | 17,000 | |
| Loss from change in tax receivable agreement liability | — | | | 38,575 | | | — | | | 38,575 | |
| Net income (loss) attributable to Non-Controlling Interests in consolidated entities | (100,021) | | | (7,083) | | | 23,320 | | | (20,888) | |
| Unrealized performance fees | (440,310) | | | (183,208) | | | 452,215 | | | (497,270) | |
| Unrealized profit sharing expense | 168,368 | | | 61,098 | | | (172,128) | | | 177,659 | |
Equity-based profit sharing expense and other(3) | 27,681 | | | 22,203 | | | 100,632 | | | 63,840 | |
| Equity-based compensation | 17,962 | | | 15,802 | | | 49,779 | | | 52,462 | |
| Unrealized principal investment (income) loss | (49,406) | | | (20,411) | | | 45,054 | | | (64,632) | |
| Unrealized net (gains) losses from investment activities and other | (157,885) | | | 24,155 | | | 827,949 | | | (40,531) | |
Segment Distributable Earnings(4) | $ | 245,509 | | | $ | 252,524 | | | $ | 677,428 | | | $ | 738,491 | |
| Taxes and related payables | (31,257) | | | (20,895) | | | (74,490) | | | (50,409) | |
| Preferred dividends | (9,163) | | | (9,164) | | | (27,492) | | | (27,492) | |
| Distributable Earnings | $ | 205,089 | | | $ | 222,465 | | | $ | 575,446 | | | $ | 660,590 | |
| Preferred dividends | 9,163 | | | 9,164 | | | 27,492 | | | 27,492 | |
| Taxes and related payables | 31,257 | | | 20,895 | | | 74,490 | | | 50,409 | |
| Realized performance fees | (17,445) | | | (67,434) | | | (94,028) | | | (164,558) | |
| Realized profit sharing expense | 17,445 | | | 23,823 | | | 94,028 | | | 78,268 | |
| Realized principal investment income, net | (2,882) | | | (14,374) | | | (13,684) | | | (37,091) | |
| Net interest loss and other | 34,806 | | | 18,251 | | | 100,990 | | | 45,957 | |
| Fee Related Earnings | $ | 277,433 | | | $ | 212,790 | | | $ | 764,734 | | | $ | 661,067 | |
| Depreciation, amortization and other, net | 3,369 | | | 2,927 | | | 9,192 | | | 8,239 | |
| Fee Related EBITDA | $ | 280,802 | | | $ | 215,717 | | | $ | 773,926 | | | $ | 669,306 | |
| Realized performance fees | 17,445 | | | 67,434 | | | 94,028 | | | 164,558 | |
| Realized profit sharing expense | (17,445) | | | (23,823) | | | (94,028) | | | (78,268) | |
| Fee Related EBITDA + 100% of Net Realized Performance Fees | $ | 280,802 | | | $ | 259,328 | | | $ | 773,926 | | | $ | 755,596 | |
|
| | | | | | | | | | | | | | | |
| | For the Three Months Ended September 30, | | For the Nine Months Ended September 30, |
| | 2019 | | 2018 | | 2019 | | 2018 |
| | (in thousands) | | | | |
| Net Income Attributable to Apollo Global Management, Inc. Class A Common Stockholders | $ | 354,106 |
| | $ | 162,357 |
| | $ | 649,658 |
| | $ | 154,370 |
|
| Preferred dividends | 9,164 |
| | 9,164 |
| | 27,492 |
| | 22,499 |
|
| Net income attributable to Non-Controlling Interests in consolidated entities | 7,083 |
| | 11,340 |
| | 20,888 |
| | 26,035 |
|
| Net income attributable to Non-Controlling Interests in the Apollo Operating Group | 150,741 |
| | 179,831 |
| | 480,784 |
| | 194,250 |
|
| Net Income | $ | 521,094 |
| | $ | 362,692 |
| | $ | 1,178,822 |
| | $ | 397,154 |
|
| Income tax provision (benefit) | (231,896 | ) | | 19,092 |
| | (195,345 | ) | | 46,596 |
|
| Income Before Income Tax Provision (Benefit) | $ | 289,198 |
| | $ | 381,784 |
| | $ | 983,477 |
| | $ | 443,750 |
|
Transaction-related charges(1) | 5,201 |
| | 1,253 |
| | 28,799 |
| | (3,800 | ) |
Charges associated with corporate conversion(2) | 6,994 |
| | — |
| | 17,000 |
| | — |
|
| Loss from change in tax receivable agreement liability | 38,575 |
| | — |
| | 38,575 |
| | — |
|
| Net income attributable to Non-Controlling Interests in consolidated entities | (7,083 | ) | | (11,340 | ) | | (20,888 | ) | | (26,035 | ) |
Unrealized performance fees(3) | (183,208 | ) | | (26,447 | ) | | (497,270 | ) | | 203,475 |
|
Unrealized profit sharing expense(3) | 61,098 |
| | 8,903 |
| | 177,659 |
| | (58,360 | ) |
Equity-based profit sharing expense and other(4) | 22,203 |
| | 26,085 |
| | 63,840 |
| | 58,499 |
|
| Equity-based compensation | 15,802 |
| | 17,668 |
| | 52,462 |
| | 51,131 |
|
| Unrealized principal investment (income) loss | (20,411 | ) | | 49 |
| | (64,632 | ) | | 32,627 |
|
| Unrealized net (gains) losses from investment activities and other | 24,155 |
| | (155,710 | ) | | (40,531 | ) | | (16,349 | ) |
Segment Distributable Earnings(5) | $ | 252,524 |
| | $ | 242,245 |
| | $ | 738,491 |
| | $ | 684,938 |
|
| Taxes and related payables | (20,895 | ) | | (9,734 | ) | | (50,409 | ) | | (34,770 | ) |
| Preferred dividends | (9,164 | ) | | (9,164 | ) | | (27,492 | ) | | (22,499 | ) |
| Distributable Earnings | $ | 222,465 |
| | $ | 223,347 |
| | $ | 660,590 |
| | $ | 627,669 |
|
| Preferred dividends | 9,164 |
| | 9,164 |
| | 27,492 |
| | 22,499 |
|
| Taxes and related payables | 20,895 |
| | 9,734 |
| | 50,409 |
| | 34,770 |
|
| Realized performance fees | (67,434 | ) | | (93,031 | ) | | (164,558 | ) | | (329,807 | ) |
| Realized profit sharing expense | 23,823 |
| | 54,180 |
| | 78,268 |
| | 187,637 |
|
| Realized principal investment income | (14,374 | ) | | (17,787 | ) | | (37,091 | ) | | (60,553 | ) |
| Net interest loss and other | 18,251 |
| | 11,451 |
| | 45,957 |
| | 33,413 |
|
| Fee Related Earnings | $ | 212,790 |
| | $ | 197,058 |
| | $ | 661,067 |
| | $ | 515,628 |
|
| Depreciation, amortization and other, net | 2,927 |
| | 2,657 |
| | 8,239 |
| | 7,739 |
|
| Fee Related EBITDA | $ | 215,717 |
| | $ | 199,715 |
| | $ | 669,306 |
| | $ | 523,367 |
|
Realized performance fees(6) | 67,434 |
| | 93,031 |
| | 164,558 |
| | 329,807 |
|
Realized profit sharing expense(6) | (23,823 | ) | | (54,180 | ) | | (78,268 | ) | | (187,637 | ) |
| Fee Related EBITDA + 100% of Net Realized Performance Fees | $ | 259,328 |
| | $ | 238,566 |
| | $ | 755,596 |
| | $ | 665,537 |
|
| |
(1) | Transaction-related charges include contingent consideration, equity-based compensation charges and the amortization of intangible assets and certain other charges associated with acquisitions. |
| |
(2) | Represents expenses incurred in relation to the Conversion, as described in note 1 to the condensed consolidated financial statements. |
| |
(3) | Includes realized performance fees and realized profit sharing expense settled in the form of shares of Athene Holding during the nine months ended September 30, 2018. |
| |
(4) | (2)Represents expenses incurred in relation to the Conversion, as described in note 1 to the condensed consolidated financial statements. (3)Equity-based profit sharing expense and other includes certain profit sharing arrangements in which a portion of performance fees distributed to the general partner are allocated by issuance of equity-based awards, rather than cash, to employees of Apollo. Equity-based profit sharing expense and other includes certain profit sharing arrangements in which a portion of performance fees distributed to the general partner are allocated by issuance of equity-based awards, rather than cash, to employees of Apollo. Equity-based profit |
sharing expense and other also includes non-cash expenses related to equity awards in unconsolidated related parties granted to employees of Apollo.
| |
(5) | See note 16 to the condensed consolidated financial statements for more details regarding Segment Distributable Earnings for the combined segments. |
| |
(6) | Excludes realized performance fees and realized profit sharing expense settled in the form of shares of Athene Holding during the nine months ended September 30, 2018. |
(4)See note 17 to the condensed consolidated financial statements for more details regarding Segment Distributable Earnings for the combined segments.
The table below sets forth a reconciliation of Class A Common Stock Outstanding to our Distributable Earnings Shares Outstanding:
| | | | | | | | | | | | | | | | | |
| As of
September 30, 2020 | | As of
September 30, 2019 | | As of
December 31, 2019 |
| Total Class A Common Stock Outstanding | 228,747,302 | | | 222,403,296 | | | 222,994,407 | |
| Non-GAAP Adjustments: | | | | | |
| Participating Apollo Operating Group Units | 204,028,327 | | | 180,361,308 | | | 180,111,308 | |
| Vested RSUs | 158,007 | | | 216,552 | | | 2,349,618 | |
| Unvested RSUs Eligible for Dividend Equivalents | 8,086,467 | | | 8,770,229 | | | 6,610,369 | |
| Distributable Earnings Shares Outstanding | 441,020,103 | | | 411,751,385 | | | 412,065,702 | |
Liquidity and Capital Resources
Overview
Apollo’s business model primarily derives revenues and cash flows from the assets it manages. Apollo targets operating expense levels such that fee income exceeds total operating expenses each period. The company intends to distribute to its stockholders on a quarterly basis substantially all of its distributable earnings after taxes and related payables in excess of amounts determined to be necessary or appropriate to provide for the conduct of the business. As a result, the Company requires limited capital resources to support the working capital or operating needs of the business. While primarily met by cash flows generated through fee income received, liquidity needs are also met (to a limited extent) through proceeds from borrowings and equity issuances as described in notes 1011 and 1314 to the condensed consolidated financial statements, respectively. The Company had cash and cash equivalents of $1,242.8 million$1.8 billion at September 30, 2019.2020.
Due to the COVID-19 pandemic, there has been volatility in the financial markets. While the Company is not aware of any events that would result in an immediate impact to our liquidity needs, we continue to monitor developments on the global spread of COVID-19 as additional information is obtained.
Primary Sources and Uses of Cash
The Company has multiple sources of short-term liquidity to meet its capital needs, including cash on hand, annual cash flows from its activities, and available funds from the Company’s $750 million revolving credit facility as of September 30, 2019.2020. The Company believes these sources will be sufficient to fund our capital needs for at least the next twelve months. If the Company determines that market conditions are favorable after taking into account our liquidity requirements, we may seek to issue additional senior notes, preferred equity, or other financing instruments.
The section below discusses in more detail the Company’s primary sources and uses of cash and the primary drivers of cash flows within the Company’s condensed consolidated statements of cash flows:
| | | | For the Nine Months Ended September 30, | | For the Nine Months Ended September 30, |
| | 2019 | | 2018 | | 2020 | | 2019 | |
| | (in thousands) | | (in thousands) |
| Operating Activities | $ | 835,012 |
| | $ | 770,890 |
| Operating Activities | $ | 1,514,716 | | | $ | 835,012 | | |
| Investing Activities | (252,292 | ) | | (169,604 | ) | Investing Activities | (7,467) | | | (252,292) | | |
| Financing Activities | 58,798 |
| | (538,017 | ) | Financing Activities | (466,690) | | | 58,798 | | |
| Net Increase in Cash and Cash Equivalents, Restricted Cash and Cash Held at Consolidated Variable Interest Entities | $ | 641,518 |
| | $ | 63,269 |
| |
| Net Increase (Decrease) in Cash and Cash Equivalents, Restricted Cash and Cash Held at Consolidated Variable Interest Entities | | Net Increase (Decrease) in Cash and Cash Equivalents, Restricted Cash and Cash Held at Consolidated Variable Interest Entities | $ | 1,040,559 | | | $ | 641,518 | | |
Operating Activities
The Company’s operating activities support its investment management activities. The primary sources of cash within the operating activities section include: (a) management fees, (b) advisory and transaction fees, (c) realized performance revenues, and (d) realized principal investment income. The primary uses of cash within the operating activities section include: (a) compensation and non-compensation related expenses, (b) placement fees, and (c) interest and taxes.
•During the nine months ended September 30, 20192020 and 2018,2019, cash provided by operating activities primarily includes cash inflows from the receipt of management fees, advisory and transaction fees, realized performance revenues, and realized principal investment income, offset by cash outflows for compensation, general, administrative, and other expenses. Net cash provided by operating activities also reflects the operating activity of our consolidated funds and VIEs, which primarily include cash inflows from theconsolidated funds and from sale of investments offset by cash outflows for purchases of investments.
Investing Activities
The Company’s investing activities support growth of its business. The primary sources of cash within the investing activities section include distributions from investments. The primary uses of cash within the investing activities section include: (a) capital expenditures, (b) investment purchases, including purchases of U.S. Treasury securities, and (c) equity method investments in the funds we manage.
•During the nine months ended September 30, 20192020 and 2018,2019, cash used by investing activities primarily reflects purchases of U.S. Treasury securities and other investments and net contributions to equity method investments, offset partially by proceeds from maturities of U.S. Treasury securities.
Financing Activities
The Company’s financing activities reflect its capital market transactions and transactions with owners. The primary sources of cash within the financing activities section includes proceeds from debt and preferred equity issuances. The primary uses of cash within the financing activities section include: (a) distributions, (b) payments under the tax receivable agreement, (c) share repurchases, (d) cash paid to settle tax withholding obligations in connection with net share settlements of equity-based awards, and (e) repayments of debt.
•During the nine months ended September 30, 2020, cash used in financing activities primarily reflects dividends to Class A Common Stockholders, distributions to Non-Controlling interest holders, and repurchases of Class A Common Stock, partially offset by proceeds from the issuance of the 2030 Senior Notes. Net cash used in financing activities also reflects the financing activity of our consolidated funds and VIEs, which primarily reflects net cash inflows from issuance of debt and net contributions to Non-Controlling interest holders in consolidated VIEs.
•During the nine months ended September 30, 2019, cash provided by financing activities primarily reflects proceeds from the issuance of the 2029 Senior Notes and 2039 Senior Secured Guaranteed Notes, partially offset by dividends to Class A Common Stockholdersshareholders and distributions to Non-Controlling interest holders.
During the nine months ended September 30, 2018, cash used by financing activities primarily reflected repayments on the term loan facility to AMH and dividends to Class A Common Stockholders and Non-Controlling interest holders, partially offset by proceeds from the issuance of the Series B Preferred shares and the 2048 Senior Notes.
Future Debt Obligations
The Company had long-term debt of $2.3$3.2 billion at September 30, 2019,2020, which includes $2.3$3.1 billion of senior notes with maturities in 2024, 2026, 2029, 2030, 2039, 2048 and 2048.2050. See note 1011 to the condensed consolidated financial statements for further information regarding the Company’s debt arrangements.
Contractual Obligations, Commitments and Contingencies
The Company had unfunded general partner commitments of $1.1$1.0 billion at September 30, 2019,2020, of which $434$351.1 million related to Fund IX. For a summary and a description of the nature of the Company’s commitments, contingencies and contractual obligations, see note 1516 to the condensed consolidated financial statements and “—Contractual Obligations, Commitments and Contingencies”. The Company’s commitments are primarily fulfilled through cash flows from operations and (to a limited extent) through borrowings and equity issuances as described in notes 1011 and 1314 to the condensed consolidated financial statements, respectively.
Consolidated Funds and VIEs
The Company manages its liquidity needs by evaluating unconsolidated cash flows; however, the Company’s financial statements reflect the financial position of Apollo as well as Apollo’s consolidated funds and VIEs. The primary sources and uses of cash at Apollo’s consolidated funds and VIEs include: (a) raising capital from their investors, which have been reflected historically as Non-Controlling Interests of the consolidated subsidiaries in our financial statements, (b) using capital to make investments, (c) generating cash flows from operations through distributions, interest and the realization of investments, (d) distributing cash flow to investors, and (e) issuing debt to finance investments (CLOs).
Other Liquidity and Capital Resource Considerations
Future Cash Flows
Our ability to execute our business strategy, particularly our ability to increase our AUM, depends on our ability to establish new funds and to raise additional investor capital within such funds. Our liquidity will depend on a number of factors, such as our ability to project our financial performance, which is highly dependent on our funds and our ability to manage our projected costs, fund performance, access to credit facilities, compliance with existing credit agreements, as well as industry and market trends. Also during economic downturns the funds we manage might experience cash flow issues or liquidate entirely. In these situations we might be asked to reduce or eliminate the management fee and performance fees we charge, which could adversely impact our cash flow in the future.
An increase in the fair value of our funds’ investments, by contrast, could favorably impact our liquidity through higher management fees where the management fees are calculated based on the net asset value, gross assets or adjusted assets. Additionally, higher performance fees not yet realized would generally result when investments appreciate over their cost basis which would not have an impact on the Company’s cash flow until realized.
Income Taxes
Effective September 5, 2019, Apollo Global Management, LLC, a Delaware limited liability company, converted to a Delaware corporation named Apollo Global Management, Inc. Subsequent to the Conversion, we expect thatgenerally all of the income we earn will beis subject to U.S. corporate income taxes, which could result in an overall higher income tax expense (or benefit) in periods subsequent to the Conversion.
Consideration of Financing Arrangements
As noted above, in limited circumstances, the Company may issue debt or equity to supplement its liquidity. The decision to enter into a particular financing arrangement is made after careful consideration of various factors including the Company’s cash flows from operations, future cash needs, current sources of liquidity, demand for the Company’s debt or equity, and prevailing interest rates.
Revolver Facility
Under the Company’s 2018 AMH Credit Facility, the Company may borrow in an aggregate amount not to exceed $750 million and may incur incremental facilities in an aggregate amount not to exceed $250 million plus additional amounts so long as the Borrower is in compliance with a net leverage ratio not to exceed 4.00 to 1.00. Borrowings under the 2018 AMH Credit Facility may be used for working capital and general corporate purposes, including without limitation, permitted acquisitions. As of September 30, 2019, theThe 2018 AMH Credit Facility was undrawn.has a final maturity date of July 11, 2023.
Dividends and Distributions
For information regarding the quarterly dividends and distributions which were made at the sole discretion of the Company’s Former Manager prior to the Conversion to Class A Common Stockholders, Non-Controlling Interest holders in the Apollo Operating Group and participating securities, see note 1314 to the condensed consolidated financial statements.
Although the Company expects to pay dividends according to our dividend policy, we may not pay dividends according to our policy, or at all, if, among other things, we do not have the cash necessary to pay the intended dividends. To the extent we do not have cash on hand sufficient to pay dividends, we may have to borrow funds to pay dividends, or we may determine not to pay dividends. The declaration, payment and determination of the amount of our quarterly dividends are at the sole discretion of the executive committee of our Board.board of directors.
Our current intention is to distribute to our Class A Common Stockholders on a quarterly basis substantially all of our Distributable Earnings attributable to Class A Common Stockholders, in excess of amounts determined by the executive committee of our board of directors to be necessary or appropriate to provide for the conduct of our business and, at a minimum, a quarterly dividend of $0.40 per share.
On October 31, 2019,29, 2020, the Company declared a cash dividend of $0.50$0.51 per share of Class A Common Stock,share, which will be paid on November 29, 201930, 2020 to holders of record at the close of business on November 20, 2019.2020. Also, the Company declared a cash dividend of $0.398438 per share of Series A Preferred Stockshare and Series B Preferred Stockshare which will be paid on December 16, 201915, 2020 to holders of record at the close of business on November 29, 2019.30, 2020.
Tax Receivable Agreement
The tax receivable agreement provides for the payment to the Managing Partners and Contributing Partners of 85% of the amount of cash savings, if any, in U.S. federal, state, local and foreign income taxes that AGM Inc. and its subsidiaries realizes subject to the agreement. For more information regarding the tax receivable agreement, see note 1415 to the condensed consolidated financial statements.
AGM Share Repurchases
For information regarding the Company’s share repurchase program, see note 1314 to the condensed consolidated financial statements.
AINV Share Purchases
On March 11, 2016, it was announced that Apollo intended to embark on a program to purchase $50 million of AINV’s common stock, subject to certain regulatory approvals. Under the program, shares may be purchased from time to time in open market transactions and in accordance with applicable law. As of September 30, 2019, Apollo had purchased approximately 871 thousand shares, or approximately $4.9 million of AINV’s common stock.
Athora
On April 14, 2017, Apollo made an unfundeda commitment of €125 million to purchase new Class B-1 equity interests in Athora, a strategic platform established to acquirethat acquires and reinsures traditional closed life insurance policies and provideprovides capital and reinsurance
solutions to insurers in Europe.Europe which, as of April 2020 was fully drawn. In January 2018, Apollo purchased Class C-1 equity interests in Athora that represent a profits interest in Athora which, upon meeting certain vesting triggers, will be convertible by Apollo into additional Class B-1 equity interests in Athora.
As part of an ongoing capital raise in connection with Athora’s acquisition of VIVAT N.V., Apollo exercised its preemptive rights and made an additional incremental commitment of approximately €58 million to purchase new Class B-1 equity interests in Athora. In addition, in April 2020, Apollo purchased Class C-2 equity interests in Athora that represent a profits interest in Athora which, upon meeting certain vesting triggers, will be convertible by Apollo into additional Class B-1 equity interests in Athora.
Apollo and Athene are minority investors in Athora with a long term strategic relationship and aggregaterelationship. Through its share ownership, Apollo has approximately 19% of the total voting power in Athora, and Athene holds shares in Athora representing 10% of 35%the total voting power in Athora. In addition, Athora shares held by funds and 10%, respectively. other accounts managed by Apollo represent, in the aggregate, approximately 16% of the total voting power in Athora.
For more information regarding unfunded general partner commitments, see “—Contractual Obligations, Commitments and Contingencies”.
Fund VIII, Fund VII, Fund VI, ANRP I and ANRP II Escrow
As of September 30, 2019, the remaining investments and escrow cash of Fund VIII were valued at 132% of the fund’s unreturned capital, which was above the required escrow ratio of 115%. As of September 30, 2019,2020, the remaining investments and escrow cash of Fund VII, Fund VI, ANRP I and ANRP II were valued at 60%41%, 38%34%, 51%21% and 109%76% of the fund’s unreturned capital, respectively, which were below the required escrow ratio of 115%. As a result, these funds are required to place in escrow current and future performance fee distributions to the general partner until the specified return ratio of 115% is met (at the time of a future distribution) or upon liquidation. Realized performance fees currently distributed to the general partner are limited to potential tax distributions and interest on escrow balances per these funds’ partnership agreements.
Clawback
Performance fees from our private equity funds and certain credit and real assets funds are subject to contingent repayment by the general partner in the event of future losses to the extent that the cumulative performance fees distributed from inception to date exceeds the amount computed as due to the general partner at the final distribution. See “—Overview of Results of Operations—Performance Fees” for the maximum performance fees subject to potential reversal by each fund.
Indemnification Liability
The Company recorded an indemnification liability in the event that our Managing Partners, Contributing Partners and certain investment professionals are required to pay amounts in connection with a general partner obligation to return previously distributed performance fees. See note 1415 to the condensed consolidated financial statements for further information regarding the Company’s indemnification liability.
Investment Management Agreements - Athene Asset ManagementISG
The Company provides asset management and advisory services to Athene as described in note 1415 to the condensed consolidated financial statements. On September 20, 2018, Athene and Apollo agreed to revise the existing fee arrangements (the “amended fee agreement”) between Athene and Apollo. The amended fee agreement was subject to approval by Athene’s shareholders
The base management fee covers a range of investment services that Athene receives from the Company, including investment management, asset allocation, mergers and acquisition asset diligence and certain operational support services such as investment compliance, tax, legal and risk management support, among others. Additionally, the amended fee agreement provides for a possible payment by the Company to Athene, or a possible payment by Athene to the Company, equal to 0.025% of the Incremental Value as of the end of each year, beginning on December 31, 2019, depending upon the percentage of Athene’s investments that consist of core assets and core plus assets. In furtherance of yield support for Athene, if more than 60% of Athene’s invested assets which are subject to the sub-allocation fees are invested in core and core plus assets, Athene will receive a 0.025% fee reduction on the Incremental Value. As an incentive for differentiated asset management, if less than 50% of Athene’s invested assets which are subject to the sub-allocation fee are invested in core and core plus assets, thereby reflecting a higher allocation toward assets with the highest alpha-generating abilities, Athene will pay an additional fee of 0.025% on Incremental Value.
The amended fee agreement is intended to provide for further alignment of interests between Athene and the Company. On the Backbook Value, assuming constant portfolio allocations, the near-term impact of the amended fee agreement is anticipated to be immaterial. On the Incremental Value, assuming the same allocations as the Backbook Value, total fees paid by Athene to the Company are expected to be marginally lower than fees paid by Athene to the Company would have been under the prior fee arrangement. If invested asset allocations are more heavily weighted to assets with lower alpha-generating abilities than Athene’s current investment portfolio, the fees that Athene pays to the Company under the Fee Agreementamended fee agreement would be expected to decline relative to the prior fee arrangement. Conversely, if a greater proportion of Athene’s investment portfolio is allocated to differentiated assets with higher alpha-generating abilities, Athene’s net investment earned rates would be expected to increase, and so would the fees Athene pays to the Company relative to the prior fee arrangement.
Strategic Transaction with Athene Holding
On October 27, 2019 Athene Holding, AGM Inc. and the entities that form the Apollo Operating Group entered into athe Transaction Agreement. Pursuant to the Transaction Agreement, (the “Transaction Agreement”), pursuantAthene Holding issued, on February 28, 2020, 35,534,942 AHL Class A Common Shares to which, AGM, throughcertain subsidiaries of the Apollo Operating Group will purchasein exchange for (i) issuance by the Apollo Operating Group of 29,154,519 non-voting equity interests of the Apollo Operating Group to Athene Holding and (ii) $350 million of AHL Class A Common Shares. The consummation of the other transactions contemplated by the Transaction Agreement are subject to certain closing conditions and regulatory approvals.in cash. See note 1718 to the condensed consolidated financial statements for further information regarding the Transaction Agreement with Athene Holding.
Equity-Based Profit Sharing Expense
Profit sharing amounts are generally not paid until the related performance fees are distributed to the general partner upon realization of the fund’s investments. Under certain profit sharing arrangements, a portion of the performance fees distributed to the general partner is allocated by issuance of equity-based awards, rather than cash, to employees. See note 2 to the condensed consolidated financial statements for further information regarding the accounting for the Company’s profit sharing arrangements.
Strategic Relationship Agreement with CalPERS
On April 20, 2010, the Company announced that it entered into a strategic relationship agreement with CalPERS. The strategic relationship agreement provides that Apollo will reduce fees charged to CalPERS on funds it manages, or in the future will manage, solely for CalPERS by $125 million over a five-year period or as close a period as required to provide CalPERS with that benefit. The agreement further provides that Apollo will not use a placement agent in connection with securing any future capital commitments from CalPERS. As of September 30, 2019, the Company had reduced fees charged to CalPERS on the funds it manages by approximately $108.4 million.
Critical Accounting Policies
This Management’s Discussion and Analysis of Financial Condition and Results of Operations is based upon the condensed consolidated financial statements, which have been prepared in accordance with U.S. GAAP. The preparation of financial statements in accordance with U.S. GAAP requires the use of estimates and assumptions that could affect the reported amounts of assets and liabilities, the disclosure of contingent assets and liabilities and the reported amounts of revenues and expenses. Actual results could differ from these estimates. A summary of our significant accounting policies is presented in note 2 to our condensed consolidated financial statements. The following is a summary of our accounting policies that are affected most by judgments, estimates and assumptions.
The COVID-19 pandemic has created disruption and uncertainty in the global economy and financial markets. Although we cannot predict with certainty the full magnitude of the economic ramifications, we have accounted for pandemic-related circumstances when applying judgments and assumptions and updated our estimates accordingly when and as applicable.
Consolidation
The Company assesses all entities with which it is involved for consolidation on a case by case basis depending on the specific facts and circumstances surrounding each entity. Pursuant to the consolidation guidance, the Company first evaluates whether it holds a variable interest in an entity. Apollo factors in all economic interests including proportionate interests through related parties, to determine if such interests are to be considered a variable interest. As Apollo’s interest in
many of these entities is solely through market rate fees and/or insignificant indirect interests through related parties, Apollo is generally not considered to have a variable interest in many of these entities under the guidance and no further consolidation analysis is performed. For entities where the Company has determined that it does hold a variable interest, the Company performs an assessment to determine whether each of those entities qualify as a VIE.
The determination as to whether an entity qualifies as a VIE depends on the facts and circumstances surrounding each entity and therefore certain of Apollo’s funds may qualify as VIEs under the variable interest model whereas others may qualify as voting interest entities (“VOEs”) under the voting interest model. The granting of substantive kick-out rights is a key consideration in determining whether a limited partnership or similar entity is a VIE and whether or not that entity should be consolidated.
Under the voting interest model, Apollo consolidates those entities it controls through a majority voting interest. Apollo does not consolidate those VOEs in which substantive kick-out rights have been granted to the unaffiliated investors to either dissolve the fund or remove the general partner.
Under the variable interest model, Apollo consolidates those entities where it is determined that the Company is the primary beneficiary of the entity. The Company is determined to be the primary beneficiary if it holds a controlling financial interest in the VIE defined as possessing both (i) the power to direct the activities of the VIE that most significantly impact the VIE’s economic performance and (ii) the obligation to absorb losses of the VIE or the right to receive benefits from the VIE that could potentially be significant to the VIE. If Apollo alone is not considered to have a controlling financial interest in the VIE but Apollo and its related parties under common control in the aggregate have a controlling financial interest in the VIE, Apollo will still be deemed to be the primary beneficiary if it is the party within the related party group that is most closely associated with
the VIE. If Apollo and its related parties not under common control in the aggregate have a controlling financial interest in a VIE, then Apollo is deemed to be the primary beneficiary if substantially all the activities of the entity are performed on behalf of Apollo. Apollo determines whether it is the primary beneficiary of a VIE at the time it becomes initially involved with the VIE and reconsiders that conclusion continuously. Investments and redemptions (either by Apollo, related parties of Apollo or third parties) or amendments to the governing documents of the respective entity may affect an entity’s status as a VIE or the determination of the primary beneficiary.
The assessment of whether an entity is a VIE and the determination of whether Apollo should consolidate such VIE requires judgment by our management. Those judgments include, but are not limited to: (i) determining whether the total equity investment at risk is sufficient to permit the entity to finance its activities without additional subordinated financial support, (ii) evaluating whether the holders of equity investment at risk, as a group, can make decisions that have a significant effect on the success of the entity, (iii) determining whether the equity investors have proportionate voting rights to their obligations to absorb losses or rights to receive the expected residual returns from an entity and (iv) evaluating the nature of the relationship and activities of those related parties with shared power or under common control for purposes of determining which party within the related-party group is most closely associated with the VIE. Judgments are also made in determining whether a member in the equity group has a controlling financial interest including power to direct activities that most significantly impact the VIE’s economic performance and rights to receive benefits or obligations to absorb losses that could be potentially significant to the VIE. This analysis considers all relevant economic interests including proportionate interests held through related parties.
Revenue Recognition
Performance Fees. We earn performance fees from our funds as a result of such funds achieving specified performance criteria. Such performance fees generally are earned based upon a fixed percentage of realized and unrealized gains of various funds after meeting any applicable hurdle rate or threshold minimum.
Performance allocations are performance fees that are generally structured from a legal standpoint as an allocation of capital to the Company. Performance allocations from certain of the funds that we manage are subject to contingent repayment and are generally paid to us as particular investments made by the funds are realized. If, however, upon liquidation of a fund, the aggregate amount paid to us as performance fees exceeds the amount actually due to us based upon the aggregate performance of the fund, the excess (in certain cases net of taxes) is required to be returned by us to that fund. We account for performance allocations as an equity method investment, and accordingly, we accrue performance allocations quarterly based on fair value of the underlying investments and separately assess if contingent repayment is necessary. The determination of performance allocations and contingent repayment considers both the terms of the respective partnership agreements and the current fair value of the underlying investments within the funds. Estimates and assumptions are made when determining the fair value of the underlying investments within the funds and could vary depending on the valuation methodology that is used. See “Investments, at Fair Value” below for further discussion related to significant estimates and assumptions used for determining fair value of the underlying investments in our credit, private equity and real assets funds.
Incentive fees are performance fees structured as a contractual fee arrangement rather than a capital allocation. Incentive fees are generally received from the management of CLOs, managed accounts and AINV. For a majority of our incentive fees, once the quarterly or annual incentive fees have been determined, there is no look-back to prior periods for a potential contingent repayment, however, certain other incentive fees can be subject to contingent repayment at the end of the life of the entity. In accordance with the new revenue recognition standard, certain incentive fees are considered a form of variable consideration and therefore are deferred until fees are probable to not be significantly reversed. There is significant judgment involved in determining if the incentive fees are probable to not be significantly reversed, but generally the Company will defer the revenue until the fees are crystallized or are no longer subject to clawback or reversal. Prior to the adoption
Management Fees. Management fees related to our credit funds, can be based on net asset value, gross assets, adjusted cost of all unrealized portfolio investments, capital commitments, adjusted assets, capital contributions, or stockholders’ equity all as defined in the respective partnership agreements. The credit management fee calculations that consider net asset value, gross assets, adjusted cost of all unrealized portfolio investments and adjusted assets are normally based on the terms of the respective partnership agreements and the current fair value of the underlying investments within the funds. Estimates and assumptions are made when determining the fair value of the underlying investments within the funds and could vary depending on the valuation methodology that is used. The management fees related to our private equity funds, by contrast, are generally based on a fixed percentage of the committed capital or invested capital. The corresponding fee calculations that consider committed capital or invested capital are both objective in nature and therefore do not require the use of significant estimates or assumptions. The management fees related to our real assets funds are generally based on a specific percentage of the funds’ stockholders’ equity or committed or net invested capital or the capital accounts of the limited partners. See “Investments, at Fair Value” below for
further discussion related to significant estimates and assumptions used for determining fair value of the underlying investments in our credit, private equity and real assets funds.
Investments, at Fair Value
On a quarterly basis, Apollo utilizes valuation committees consisting of members from senior management, to review and approve the valuation results related to the investments of the funds it manages. For certain publicly traded vehicles managed by Apollo, a review is performed by an independent board of directors. The Company also retains independentexternal valuation firms to provide third-party valuation consulting services to Apollo, which consist of certain limited procedures that management identifies and requests them to perform. The limited procedures provided by the independentexternal valuation firms assist management with validating their valuation results or determining fair value. The Company performs various back-testing procedures to validate their valuation approaches, including comparisons between expected and observed outcomes, forecast evaluations and variance analyses. However, because of the inherent uncertainty of valuation, the estimated values may differ significantly from the values that would have been used had a ready market for the investments existed, and the differences could be material.
The fair values of the investments in our funds can be impacted by changes to the assumptions used in the underlying valuation models. For further discussion on the impact of changes to valuation assumptions see “Item 7A. Quantitative and Qualitative Disclosures About Market Risk—Sensitivity” in our 2018this Annual Report.Report on Form 10-K. There have been no material changes to the valuation approaches utilized during the periods that our financial results are presented in this report.
Fair Value of Financial Instruments
Except for the Company’s debt obligations (each as defined in note 1011 to our condensed consolidated financial statements), Apollo’s financial instruments are recorded at fair value or at amounts whose carrying values approximate fair value. See “—Investments, at Fair Value” above. While Apollo’s valuations of portfolio investments are based on assumptions that Apollo believes are reasonable under the circumstances, the actual realized gains or losses will depend on, among other factors, future operating results, the value of the assets and market conditions at the time of disposition, any related transaction costs and the timing and manner of sale, all of which may ultimately differ significantly from the assumptions on which the valuations were based. Financial instruments’ carrying values generally approximate fair value because of the short-term nature of those instruments or variable interest rates related to the borrowings.
Profit Sharing Expense. Profit sharing expense is primarily a result of agreements with our Contributing Partners and employees to compensate them based on the ownership interest they have in the general partners of the Apollo funds. Therefore, changes in the fair value of the underlying investments in the funds we manage and advise affect profit sharing expense. The Contributing Partners and employees are allocated approximately 30% to 50%, of the total performance fees which is driven primarily by changes in fair value of the underlying fund’s investments and is treated as compensation expense. Additionally, profit sharing expenses paid may be subject to clawback from employees, former employees and Contributing Partners to the extent not indemnified. When applicable, the accrual for potential clawback of previously distributed profit sharing amounts, which is a component of due from related parties on the condensed consolidated statements of financial condition, represents all amounts previously distributed to employees, former employees and Contributing Partners that would need to be returned to the general partner if the Apollo funds were to be liquidated based on the current fair value of the underlying funds’ investments as of the reporting date. The actual general partner receivable, however, would not become realized until the end of a fund’s life.
Several of the Company’s employee remuneration programs are dependent upon performance fee realizations, including the Incentive Pool, and dedicated performance fee rights.rights and certain RSU awards for which vesting is contingent, in part, on the realization of performance fees in a specified period. The Company established these programs to attract and retain,
and provide incentive to, partners and employees of the Company and to more closely align the overall compensation of partners and employees with the overall realized performance of the Company. Dedicated performance fee rights entitle their holders to payments arising from performance fee realizations. The Incentive Pool enables certain partners and employees to earn discretionary compensation based on realized performance fees in a given year, which amounts are reflected in profit sharing expense in the Company’s condensed consolidated financial statements. Amounts earned by participants as a result of their performance fee rights (whether dedicated or Incentive Pool) will vary year-to-year depending on the overall realized performance of the Company (and, in the case of the Incentive Pool, on their individual performance). There is no assurance that the Company will continue to compensate individuals through the same types of arrangements in the future and there may be periods when the executive committee of the Company’s managerCompany determines that allocations of realized performance fees are not sufficient to compensate individuals, which may result in an increase in salary, bonus and benefits, the modification of existing programs or the use of new remuneration programs. Reductions in performance fee revenues could also make it harder to retain employees and cause employees to seek other employment opportunities.
Fair Value Option. Apollo has elected the fair value option for the Company’s investment in Athene Holding, the assets and liabilities of certain of its consolidated VIEs (including CLOs), the Company’s U.S. Treasury securities with original
maturities greater than three months when purchased and certain of the Company’s other investments. Such election is irrevocable and is applied to financial instruments on an individual basis at initial recognition. See notes 3, 5,4, 6, and 67 to the condensed consolidated financial statements for further disclosure.
Equity-Based Compensation. Equity-based compensation is accounted for in accordance with U.S. GAAP, which requires that the cost of employee services received in exchange for an award is generally measured based on the grant date fair value of the award. Equity-based awards that do not require future service (i.e., vested awards) are expensed immediately. Equity-based employee awards that require future service are recognized over the relevant service period. In addition, certain RSUs granted by the Company vest subject to continued employment and the Company’s receipt of performance fees, within prescribed periods, sufficient to cover the associated equity-based compensation expense. In accordance with U.S. GAAP, equity-based compensation expense for such awards, if and when granted, will be recognized on an accelerated recognition method over the requisite service period to the extent the performance fee metrics are met or deemed probable. The addition of these performance measures helps to promote the interests of our Class A Common Stockholders and fund investors by making RSU vesting contingent on the realization and distribution of profits on our funds. Forfeitures of equity-based awards are accounted for when they occur. Apollo’s equity-based awards consist of, or provide rights with respect to, AOG Units, RSUs, share options, restricted shares, AHL Awards and other equity-based compensation awards. For more information regarding Apollo’s equity-based compensation awards, see note 1213 to our condensed consolidated financial statements. The Company’s assumptions made to determine the fair value on grant date are embodied in the calculations of compensation expense.
A significant part of our compensation expense is derived from amortization of RSUs. The fair value of all RSU grants after March 29, 2011 is based on the grant date fair value, which considers the public share price of the Company. The Company has three types of RSU grants, which we refer to as Plan Grants, Bonus Grants, and Performance Grants. Plan Grants may or may not provide the right to receive dividend equivalents until the RSUs vest and, for grants made after 2011, the underlying shares are generally issued by March 15th after the year in which they vest. For Plan Grants, the grant date fair value is based on the public share price of the Company, and is discounted for transfer restrictions and lack of dividends until vested if applicable. Bonus Grants provide the right to receive dividend equivalents on both vested and unvested RSUs and Performance Grants provide the right to receive dividend equivalents on vested RSUs and may also provide the right to receive dividend equivalents on unvested RSUs. Both Bonus Grants and Performance Grants are generally issued by March 15th of the year following the year in which they vest. For Bonus Grants and Performance Grants, the grant date fair value for the periods presented is based on the public share price of the Company, and is discounted for transfer restrictions.
We utilized the present value of a growing annuity formula to calculate a discount for the lack of pre-vesting dividends on certain Plan Grant and Performance Grant RSUs.
We utilize the Finnerty Model to calculate a marketability discount on the Plan Grant, Bonus Grant and Performance Grant RSUs to account for the lag between vesting and issuance. The Finnerty Model provides for a valuation discount reflecting the holding period restriction embedded in a restricted security preventing its sale over a certain period of time.
The Finnerty Model proposes to estimate a discount for lack of marketability such as transfer restrictions by using an option pricing theory. This model has gained recognition through its ability to address the magnitude of the discount by considering the volatility of a company’s stock price and the length of restriction. The concept underpinning the Finnerty Model is that a restricted security cannot be sold over a certain period of time. Further simplified, a restricted share of equity in a company can be viewed as having forfeited a put on the average price of the marketable equity over the restriction period (also known as an “Asian Put Option”). If we price an Asian Put Option and compare this value to that of the assumed fully
marketable underlying security, we can effectively estimate the marketability discount. The inputs utilized in the Finnerty Model are (i) length of holding period, (ii) volatility and (iii) dividend yield.
Bonus Grants constitute a component of the discretionary annual compensation awarded to certain of our professionals. During 2016, the Company increased the default portion of annual compensation to be awarded as a discretionary Bonus Grant relative to the portion awarded in previous years. The increase in the proportion of discretionary annual compensation awarded as a Bonus Grant has generally been offset by a decrease in discretionary annual cash bonuses. These changes are intended to further align the interests of Apollo’s employees and stakeholders and strengthen the long-term commitment of our partners and employees.
Income Taxes
Prior to the Conversion, certain entities in the Apollo Operating Group operated as partnerships for U.S. federal income tax purposes. As a result, these members of the Apollo Operating Group were not subject to U.S. federal income taxes. However, certain of these entities were subject to NYC UBT and certain non-U.S. entities were subject to non-U.S. corporate income taxes. Effective September 5, 2019, Apollo Global Management, LLC converted from a Delaware limited liability company to a Delaware
corporation named Apollo Global Management, Inc. Subsequent to the Conversion, we expect thatgenerally all of the income the Company earns will beis subject to U.S. corporate income taxes, which could result in an overall higher income tax expense (or benefit) in periods subsequent to the Conversion.
Significant judgment is required in determining tax expense and in evaluating tax positions, including evaluating uncertainties. The Company recognizes the tax benefits of uncertain tax positions only where the position is “more likely than not” to be sustained upon examination, including resolutionsresolution of any related appeals or litigation processes, based on the technical merits of the position. The tax benefit is measured as the largest amount of benefit that has a greater than 50% likelihood of being realized upon ultimate settlement. If a tax position is not considered more likely than not to be sustained, then no benefits of the position are recognized. The Company’s tax positions are reviewed and evaluated quarterly to determine whether or not the Company has uncertain tax positions that require financial statement recognition.
Deferred tax assets and liabilities are recognized for the expected future tax consequences of differences between the carrying amount of assets and liabilities and their respective tax basis using currently enacted tax rates. The effect on deferred tax assets and liabilities of a change in tax rates is recognized in income in the period during which the change is enacted. Deferred tax assets are reduced by a valuation allowance when it is more likely than not that some portion or all of the deferred tax assets will not be realized.
Fair Value Measurements
See note 67 to our condensed consolidated financial statements for a discussion of the Company’s fair value measurements.
We continue to monitor the impact of COVID-19 in our valuation considerations. Any updated information available from the portfolio companies and relevant market data as of the date of this report were incorporated in Apollo’s valuation considerations. Where an updated forecast was not available, Apollo’s valuation assumed change in the portfolio company’s performance guided by relevant market data and our understanding of the underlying business.
As discussed in Note 7 to the condensed consolidated financial statements, Apollo utilizes valuation committees consisting of members from senior management, to review and approve the valuation results related to the investments of the funds it manages. For certain publicly traded vehicles managed by the Company, a review is performed by an independent board of directors. The Company also retains external valuation firms to provide third-party valuation consulting services to Apollo, which consist of certain limited procedures that management identifies and requests them to perform. Please refer to Note 7 of this report for more details on valuation techniques employed by Apollo to determine fair value of its investments in credit, private equity and real assets investments. The following section outlines some of the additional considerations with respect to COVID-19 that are incorporated in our valuation approach.
Credit Investments
The majority of investments in Apollo’s credit funds are valued based on quoted market prices. Quoted market prices are considered to be indicative of fair value, incorporating all the risks and uncertainties associated with the underlying instrument in the prevailing market environment. Apollo’s valuation team further analyzes how prices have moved over the measurement period within each asset class and sector and compared it with the relevant benchmark indices.
Debt and equity securities that are not publicly traded or whose market prices are not readily available are valued at fair value utilizing a model-based approach to determine fair value. Apollo’s privately valued credit portfolio is concentrated in bank loans to middle-market companies, loans backed by commercial real estate, aviation and other asset backed loans, and life settlements. Valuation approaches used to estimate the fair value of illiquid credit investments may also include the market approach and the income approach. Most private debt instruments are valued utilizing discounted cash flow models where the key valuation drivers are market yield/credit spread, timing of cash flows and recovery of principal amount. Some of the considerations incorporated in determining the key valuation inputs in our model-based valuation approaches include but are not limited to:
•relative liquidity and change in liquidity profile of an asset class compared to underlying assets in an observable benchmark;
•specific contractual terms such as LIBOR floor, covenants or extension features; •portfolio company specific business strength or weakness as it relates to COVID-19;
•portfolio company’s liquidity profile;
•expected maturity of debt instruments, which could be different than the contractual maturity;
•requested or granted amendments or deferrals; and
•expected recovery and timing of recovery for distressed debt instruments.
Private Equity Investments
Over two thirds of Apollo’s private equity investments are valued using a market approach or an observable market price making overall portfolio returns in-line with relevant benchmark indices. Some of the additional considerations incorporated in valuation approaches includes but are not limited to:
•relative liquidity and change in liquidity profile of the portfolio company;
•portfolio company-specific business strength or weakness as it relates to COVID-19.
Real Assets Investments
The estimated fair value of commercial mortgage-backed securities (“CMBS”) in Apollo’s real assets funds is determined by reference to market prices provided by certain dealers who make a market in these financial instruments. Debt and equity securities that are not publicly traded or whose market prices are not readily available, such as private commercial real estate debt and equity investments in entities that own real estate, are valued at fair value utilizing a model-based approach to determine fair value. Some of the considerations incorporated in our model-based valuation approaches includes but are not limited to:
•property type specific considerations of potential disruption e.g., higher impact on hospitality or retail than residential;
•individual property specific considerations: region and sub-market, tenant profile and liquidity profile;
•requested or granted amendments or deferrals;
•expected maturity of debt instruments; for example, debt maturing in near term are priced utilizing extensions assuming borrowers may not re-finance in the current market environment; and
•loans evaluated for possible impairment.
Recent Accounting Pronouncements
A list of recent accounting pronouncements that are relevant to Apollo and its industry is included in note 2 to our condensed consolidated financial statements.
Off-Balance Sheet Arrangements
In the normal course of business, we engage in off-balance sheet arrangements, including transactions in derivatives, guarantees, commitments, indemnifications and potential contingent repayment obligations. See note 1516 to our condensed consolidated financial statements for a discussion of guarantees and contingent obligations.
Contractual Obligations, Commitments and Contingencies
The Company’s material contractual obligations consisted of lease obligations, contractual commitments as part of the ongoing operations of the funds and debt obligations. Fixed and determinable payments due in connection with these obligations are as follows as of September 30, 2019:2020:
| | | | | | | | | | | | | | | | | | | | | | | | | | | | | | | | | | | | | | | | | |
| Remaining 2020 | | 2021 | | 2022 | | 2023 | | 2024 | | Thereafter | | Total |
| | (in thousands) |
Operating lease obligations(1) | $ | 5,908 | | | $ | 41,043 | | | $ | 48,324 | | | $ | 50,027 | | | $ | 47,478 | | | $ | 471,899 | | | $ | 664,679 | |
Other long-term obligations(2) | 9,347 | | | 9,908 | | | 1,947 | | | 703 | | | 703 | | | — | | | 22,608 | |
2018 AMH Credit Facility(3) | 169 | | | 675 | | | 675 | | | 358 | | | — | | | — | | | 1,877 | |
2024 Senior Notes(3) | 5,000 | | | 20,000 | | | 20,000 | | | 20,000 | | | 508,333 | | | — | | | 573,333 | |
2026 Senior Notes(3) | 5,500 | | | 22,000 | | | 22,000 | | | 22,000 | | | 22,000 | | | 530,983 | | | 624,483 | |
2029 Senior Notes(3) | 8,222 | | | 32,886 | | | 32,886 | | | 32,886 | | | 32,886 | | | 810,818 | | | 950,584 | |
2030 Senior Notes(3) | 3,313 | | | 13,250 | | | 13,250 | | | 13,250 | | | 13,250 | | | 571,912 | | | 628,225 | |
2039 Senior Secured Guaranteed Notes(3)(4) | 3,876 | | | 15,503 | | | 15,503 | | | 15,503 | | | 15,503 | | | 395,063 | | | 460,951 | |
2048 Senior Notes(3) | 3,750 | | | 15,000 | | | 15,000 | | | 15,000 | | | 15,000 | | | 648,750 | | | 712,500 | |
2050 Subordinated Notes(3) | 3,713 | | | 14,850 | | | 14,850 | | | 14,850 | | | 14,850 | | | 671,844 | | | 734,957 | |
| Secured Borrowing I | 86 | | | 345 | | | 345 | | | 345 | | | 345 | | | 20,816 | | | 22,282 | |
| Secured Borrowing II | 85 | | | 339 | | | 339 | | | 339 | | | 339 | | | 22,394 | | | 23,835 | |
| 2016 AMI Term Facility I | 64 | | | 257 | | | 257 | | | 257 | | | 257 | | | 19,782 | | | 20,874 | |
| 2016 AMI Term Facility II | 67 | | | 268 | | | 268 | | | 19,264 | | | — | | | — | | | 19,867 | |
| Obligations | $ | 49,100 | | | $ | 186,324 | | | $ | 185,644 | | | $ | 204,782 | | | $ | 670,944 | | | $ | 4,164,261 | | | $ | 5,461,055 | |
|
| | | | | | | | | | | | | | | | | | | | | | | | | | | |
| | Remaining 2019 | | 2020 | | 2021 | | 2022 | | 2023 | | Thereafter | | Total |
| | (in thousands) |
Operating lease obligations(8) | $ | 8,607 |
| | $ | 27,452 |
| | $ | 38,151 |
| | $ | 39,664 |
| | $ | 37,803 |
| | $ | 382,423 |
| | $ | 534,100 |
|
Other long-term obligations(1) | 8,884 |
| | 8,435 |
| | 1,836 |
| | 881 |
| | 654 |
| | 654 |
| | 21,344 |
|
2018 AMH Credit Facility(2) | 169 |
| | 675 |
| | 675 |
| | 675 |
| | 358 |
| | — |
| | 2,552 |
|
2024 Senior Notes(3) | 5,000 |
| | 20,000 |
| | 20,000 |
| | 20,000 |
| | 20,000 |
| | 508,333 |
| | 593,333 |
|
2026 Senior Notes(4) | 5,500 |
| | 22,000 |
| | 22,000 |
| | 22,000 |
| | 22,000 |
| | 552,983 |
| | 646,483 |
|
2029 Senior Notes(5) | 8,222 |
| | 32,886 |
| | 32,886 |
| | 32,886 |
| | 32,886 |
| | 847,651 |
| | 987,417 |
|
2039 Senior Secured Guaranteed Notes(6) | 3,876 |
| | 15,503 |
| | 15,503 |
| | 15,503 |
| | 15,503 |
| | 565,289 |
| | 631,177 |
|
2048 Senior Notes(7) | 3,750 |
| | 15,000 |
| | 15,000 |
| | 15,000 |
| | 15,000 |
| | 663,750 |
| | 727,500 |
|
| 2014 AMI Term Facility I | 74 |
| | 297 |
| | 15,100 |
| | — |
| | — |
| | — |
| | 15,471 |
|
| 2014 AMI Term Facility II | 73 |
| | 294 |
| | 294 |
| | 16,859 |
| | — |
| | — |
| | 17,520 |
|
| 2016 AMI Term Facility I | 60 |
| | 239 |
| | 239 |
| | 239 |
| | 239 |
| | 18,633 |
| | 19,649 |
|
| 2016 AMI Term Facility II | 62 |
| | 249 |
| | 249 |
| | 249 |
| | 17,912 |
| | — |
| | 18,721 |
|
| Obligations | $ | 44,277 |
| | $ | 143,030 |
| | $ | 161,933 |
| | $ | 163,956 |
| | $ | 162,355 |
| | $ | 3,539,716 |
| | $ | 4,215,267 |
|
(2)Includes (i) payments on management service agreements related to certain assets and (ii) payments with respect to certain consulting agreements entered into by the Company. Note that a significant portion of these costs are reimbursable by funds.
| |
(1) | Includes (i) payments on management service agreements related to certain assets and (ii) payments with respect to certain consulting agreements entered into by the Company. Note that a significant portion of these costs are reimbursable by funds. |
| |
(2) | The commitment fee as of September 30, 2019 on the $750 million undrawn 2018 AMH Credit Facility was 0.09%. See note 10 of the condensed consolidated financial statements for further discussion of the 2018 AMH Credit Facility. |
| |
(3) | $500 million of the 2024 Senior Notes matures in May 2024. The interest rate on the 2024 Senior Notes as of September 30, 2019 was 4.00%. See note 10 of the condensed consolidated financial statements for further discussion of the 2024 Senior Notes. |
| |
(4) | $500 million of the 2026 Senior Notes matures in May 2026. The interest rate on the 2026 Senior Notes as of September 30, 2019 was 4.40%. See note 10 of the condensed consolidated financial statements for further discussion of the 2026 Senior Notes. |
| |
(5) | $675 million of the 2029 Senior Notes matures in February 2029. The interest rate on the 2029 Senior Notes as of September 30, 2019 was 4.87%. See note 10 of the condensed consolidated financial statements for further discussion of the 2029 Senior Notes. |
| |
(6) | $325 million of the 2039 Senior Secured Guaranteed Notes matures in June 2039. The interest rate on the 2039 Senior Secured Guaranteed Notes as of September 30, 2019 was 4.77%. See note 10 of the condensed consolidated financial statements for further discussion of the 2039 Senior Secured Guaranteed Notes. |
| |
(7) | $300 million of the 2048 Senior Notes matures in March 2048. The interest rate on the 2048 Senior Notes as of September 30, 2019 was 5.00%. See note 10 of the condensed consolidated financial statements for further discussion of the 2048 Senior Notes. |
| |
(8) | Operating lease obligations excludes $134.8 million of other operating expenses. |
| |
Note: | Due to the fact that the timing of certain amounts to be paid cannot be determined or for other reasons discussed below, the following contractual commitments have not been presented in the table above. |
| |
(i) | As noted previously, we have entered into a tax receivable agreement with our Managing Partners and Contributing Partners which requires us to pay to our Managing Partners and Contributing Partners 85% of any tax savings received by APO Corp. from our step-up in tax basis. The tax savings achieved may not ensure that we have sufficient cash available to pay this liability and we might be required to incur additional debt to satisfy this liability. |
| |
(ii) | Debt amounts related to the consolidated VIEs are not presented in the table above as the Company is not a guarantor of these non-recourse liabilities. |
| |
(iii) | In connection with the Stone Tower acquisition, the Company agreed to pay the former owners of Stone Tower a specified percentage of any future performance fees earned from certain of the Stone Tower funds, CLOs and strategic investment accounts. This contingent consideration liability is remeasured to fair value at each reporting period until the obligations are satisfied. See note 15 to the condensed consolidated financial statements for further information regarding the contingent consideration liability. |
| |
(iv) | Commitments from certain of our subsidiaries to contribute to the funds we manage and certain related parties. |
(3)See note 11 of the condensed consolidated financial statements for further discussion of these debt obligations.
(4)Payments based on anticipated repayment date of July 2029.
Note: Due to the fact that the timing of certain amounts to be paid cannot be determined or for other reasons discussed below, the following contractual commitments have not been presented in the table above.
(i)As noted previously, we have entered into a tax receivable agreement with our Managing Partners and Contributing Partners which requires us to pay to our Managing Partners and Contributing Partners 85% of any tax savings received by AGM Inc. and its subsidiaries from our step-up in tax basis. The tax savings achieved may not ensure that we have sufficient cash available to pay this liability and we might be required to incur additional debt to satisfy this liability.
(ii)Debt amounts related to the consolidated VIEs are not presented in the table above as the Company is not a guarantor of these non-recourse liabilities.
(iii)In connection with the Stone Tower acquisition, the Company agreed to pay the former owners of Stone Tower a specified percentage of any future performance fees earned from certain of the Stone Tower funds, CLOs and strategic investment accounts. This contingent consideration liability is remeasured to fair value at each reporting period until the obligations are satisfied. See note 16 to the condensed consolidated financial statements for further information regarding the contingent consideration liability.
(iv)Commitments from certain of our subsidiaries to contribute to the funds we manage and certain related parties.
Commitments
Certain of our management companies and general partners are committed to contribute to the funds we manage and certain related parties. While a small percentage of these amounts are funded by us, the majority of these amounts have historically been funded by our related parties, including certain of our employees and certain Apollo funds. The table below presents the commitment and remaining commitment amounts of Apollo and its related parties, the percentage of total fund commitments of Apollo and its related parties, the commitment and remaining commitment amounts of Apollo only (excluding related parties), and the percentage of total fund commitments of Apollo only (excluding related parties) for each credit, private equity and real assets fund as of September 30, 20192020 as follows ($ in millions):
| | | | | | | | | | | | | | | | | | | | | | | | | | | | | | | | | | | |
| Fund | Apollo and Related Party Commitments | | % of Total Fund Commitments | | Apollo Only (Excluding Related Party) Commitments | | Apollo Only (Excluding Related Party) % of Total Fund Commitments | | Apollo and Related Party Remaining Commitments | | Apollo Only (Excluding Related Party) Remaining Commitments |
| Credit: | | | | | | | | | | | |
| Apollo Credit Opportunity Fund II, L.P. (“COF II”) | $ | 30.5 | | | 1.93 | % | | $ | 23.4 | | | 1.48 | % | | $ | 0.8 | | | $ | 0.6 | |
| Apollo Credit Opportunity Fund I, L.P. (“COF I”) | 449.2 | | | 30.26 | | | 29.7 | | | 2.00 | | | — | | | — | |
| Financial Credit Investment IV, L.P. (“FCI IV”) | 177.3 | | | 23.07 | | | 14.3 | | | 1.86 | | | 177.3 | | | 14.3 | |
| Financial Credit Investment III, L.P. (“FCI III”) | 224.3 | | | 11.76 | | | 0.1 | | | 0.01 | | | 110.6 | | | 0.1 | |
| Financial Credit Investment II, L.P. (“FCI II”) | 244.6 | | | 15.72 | | | — | | | — | | | 114.9 | | | — | |
| Financial Credit Investment I, L.P. (“FCI I”) | 151.3 | | | 27.07 | | | — | | | — | | | — | | | — | |
| SCRF IV | 416.1 | | | 16.63 | | | 33.1 | | | 1.32 | | | 37.1 | | | 2.8 | |
| MidCap | 1,859.7 | | | 77.32 | | | 126.9 | | | 5.27 | | | 74.7 | | | 6.4 | |
| Apollo Moultrie Credit Fund, L.P. | 400.0 | | | 100.00 | | | — | | | — | | | 185.0 | | | — | |
| | | | | | | | | | | |
| Apollo Accord Fund IV, L.P. | 75.7 | | | 7.19 | | | 25.7 | | | 2.44 | | | 73.7 | | | 25.0 | |
| Apollo Accord Master Fund III, L.P. | 225.1 | | | 25.40 | | | 0.1 | | | 0.01 | | | 97.8 | | | — | |
| | | | | | | | | | | |
| Apollo Revolver Fund, L.P. | 322.1 | | | 61.31 | | | 10.2 | | | 1.94 | | | 322.1 | | | 10.2 | |
| Apollo Strategic Origination Partners | 6,121.2 | | | 50.50 | | | 121.2 | | | 1.00 | | | 6,121.2 | | | 121.2 | |
Athora(1)(4) | 1,319.4 | | | 32.53 | | | 214.1 | | | 5.28 | | | 108.6 | | | 27.5 | |
| Other Credit | 4,203.5 | | | Various | | 211.7 | | | Various | | 1,654.9 | | | 87.5 | |
| Private Equity: | | | | | | | | | | | |
| Fund IX | 1,917.5 | | | 7.75 | | | 455.9 | | | 1.84 | | | 1,464.3 | | | 351.1 | |
| Fund VIII | 1,543.5 | | | 8.40 | | | 396.8 | | | 2.16 | | | 219.5 | | | 58.1 | |
| Fund VII | 467.2 | | | 3.18 | | | 178.1 | | | 1.21 | | | 60.0 | | | 23.1 | |
| Fund VI | 246.3 | | | 2.43 | | | 6.1 | | | 0.06 | | | 9.7 | | | 0.2 | |
| Fund V | 100.0 | | | 2.67 | | | 0.5 | | | 0.01 | | | 6.2 | | | — | |
| Fund IV | 100.0 | | | 2.78 | | | 0.2 | | | 0.01 | | | 0.5 | | | — | |
| AION | 151.0 | | | 18.28 | | | 50.0 | | | 6.05 | | | 17.8 | | | 5.7 | |
| ANRP I | 376.1 | | | 28.43 | | | 10.1 | | | 0.76 | | | 47.8 | | | 1.0 | |
| ANRP II | 481.2 | | | 13.93 | | | 25.9 | | | 0.75 | | | 108.8 | | | 5.8 | |
| ANRP III | 650.1 | | | 46.44 | | | 27.0 | | | 1.93 | | | 640.8 | | | 26.6 | |
| A.A. Mortgage | 625.0 | | | 80.31 | | | — | | | — | | | 200.0 | | | — | |
| | | | | | | | | | | |
| Apollo Rose II, L.P. | 887.1 | | | 51.01 | | | 33.0 | | | 1.9 | | | 325.8 | | | 12.4 | |
| Champ, L.P. | 197.4 | | | 78.25 | | | 27.2 | | | 10.8 | | | 16.5 | | | 2.5 | |
| Apollo Royalties Management, LLC | 108.6 | | | 100.00 | | | — | | | — | | | — | | | — | |
| Hybrid Value Fund | 847.0 | | | 26.16 | | | 63.8 | | | 1.97 | | | 368.4 | | | 28.0 | |
| Hybrid Value Fund II | 776.2 | | | 55.44 | | | 26.2 | | | 1.87 | | | 776.2 | | | 26.2 | |
| COF III | 358.1 | | | 10.45 | | | 36.4 | | | 1.06 | | | 72.4 | | | 8.0 | |
| Asia Private Credit Fund | 126.5 | | | 55.12 | | | 0.1 | | | 0.04 | | | 31.9 | | | — | |
| AEOF | 125.5 | | | 12.01 | | | 25.5 | | | 2.44 | | | 92.5 | | | 18.8 | |
| Other Private Equity | 857.6 | | | Various | | 104.8 | | | Various | | 171.3 | | | 46.0 | |
| Real Assets: | | | | | | | | | | | |
| U.S. RE Fund III | 319.5 | | | 60.59 | | | 9.5 | | | 1.81 | | | 319.5 | | | 9.5 | |
U.S. RE Fund II(2) | 670.7 | | | 53.95 | | | 4.9 | | | 0.39 | | | 253.3 | | | 1.4 | |
U.S. RE Fund I(2) | 434.5 | | | 66.69 | | | 16.5 | | | 2.53 | | | 79.5 | | | 2.7 | |
| | | | | | | | | | | |
| | | | | | | | | | | |
Asia RE Fund(2) | 386.8 | | | 53.77 | | | 8.4 | | | 1.16 | | | 188.2 | | | 3.7 | |
| Asia RE Fund II | 278.1 | | | 100.00 | | | 3.1 | | | 1.12 | | | 278.1 | | | 3.1 | |
AIOF I(3) | 241.1 | | | 26.87 | | | 8.9 | | | 0.99 | | | 105.2 | | | 4.2 | |
EPF III(1) | 609.4 | | | 13.32 | | | 74.6 | | | 1.63 | | | 225.2 | | | 28.6 | |
EPF II(1) | 412.0 | | | 11.82 | | | 60.2 | | | 1.73 | | | 92.4 | | | 18.0 | |
EPF I(1) | 314.9 | | | 20.74 | | | 20.7 | | | 1.37 | | | 50.8 | | | 4.7 | |
| Other Real Assets | 749.7 | | | Various | | 16.5 | | | Various | | 367.8 | | | 13.5 | |
| Other: | | | | | | | | | | | |
| Apollo SPN Investments I, L.P. | 12.8 | | | 0.26 | | | 12.8 | | | 0.26 | | | 7.5 | | | 7.5 | |
| Total | $ | 31,591.4 | | | | | $ | 2,514.2 | | | | | $ | 15,676.6 | | | $ | 1,006.0 | |
(1)Apollo’s commitment in these funds is denominated in Euros and translated into U.S. dollars at an exchange rate of €1.00 to $1.17 as of September 30, 2020.
|
| | | | | | | | | | | | | | | | | | | | | |
| Fund | Apollo and Related Party Commitments | | % of Total Fund Commitments | | Apollo Only (Excluding Related Party) Commitments | | Apollo Only (Excluding Related Party) % of Total Fund Commitments | | Apollo and Related Party Remaining Commitments | | Apollo Only (Excluding Related Party) Remaining Commitments |
| Credit: | | | | | | | | | | | |
| Apollo Credit Opportunity Fund II, L.P. (“COF II”) | $ | 30.5 |
| | 1.93 | % | | $ | 23.4 |
| | 1.48 | % | | $ | 0.8 |
| | $ | 0.6 |
|
| Apollo Credit Opportunity Fund I, L.P. (“COF I”) | 449.2 |
| | 30.26 |
| | 29.7 |
| | 2.00 |
| | 237.1 |
| | 4.2 |
|
| Financial Credit Investment IV, L.P. (“FCI IV”) | 193.5 |
| | 31.50 |
| | 10.5 |
| | 1.71 |
| | 193.5 |
| | 10.5 |
|
| FCI III | 224.3 |
| | 11.76 |
| | 0.1 |
| | 0.01 |
| | 100.3 |
| | — |
|
| Financial Credit Investment II, L.P. (“FCI II”) | 245.3 |
| | 15.77 |
| | — |
| | — |
| | 115.9 |
| | — |
|
| FCI I | 151.3 |
| | 27.07 |
| | — |
| | — |
| | — |
| | — |
|
| SCRF IV | 416.1 |
| | 16.63 |
| | 33.1 |
| | 1.32 |
| | 109.0 |
| | 8.8 |
|
| MidCap | 1,672.9 |
| | 80.23 |
| | 110.9 |
| | 5.32 |
| | 31.0 |
| | 31.0 |
|
| Apollo Moultrie Credit Fund, L.P. | 400.0 |
| | 100.00 |
| | — |
| | — |
| | 135.0 |
| | — |
|
| Apollo Accord Master Fund II, L.P. | 116.6 |
| | 22.57 |
| | 11.6 |
| | 2.25 |
| | 20.4 |
| | 7.6 |
|
| Apollo Accord Master Fund III, L.P. | 225.1 |
| | 25.40 |
| | 0.1 |
| | 0.01 |
| | 225.1 |
| | 0.1 |
|
Athora(1) | 645.8 |
| | 27.37 |
| | 136.2 |
| | 5.77 |
| | 447.5 |
| | 94.5 |
|
| Other Credit | 3,634.2 |
| | Various |
| | 179.8 |
| | Various |
| | 1,505.0 |
| | 87.4 |
|
| Private Equity: | | | | | | | | | | | |
| Fund IX | 1,914.5 |
| | 7.74 |
| | 470.2 |
| | 1.90 |
| | 1,750.7 |
| | 434.0 |
|
| Fund VIII | 1,543.5 |
| | 8.40 |
| | 396.4 |
| | 2.16 |
| | 257.1 |
| | 67.1 |
|
| Fund VII | 467.2 |
| | 3.18 |
| | 178.1 |
| | 1.21 |
| | 60.9 |
| | 23.2 |
|
| Fund VI | 246.3 |
| | 2.43 |
| | 6.1 |
| | 0.06 |
| | 9.7 |
| | 0.2 |
|
| Fund V | 100.0 |
| | 2.67 |
| | 0.5 |
| | 0.01 |
| | 6.2 |
| | — |
|
| Fund IV | 100.0 |
| | 2.78 |
| | 0.2 |
| | 0.01 |
| | 0.5 |
| | — |
|
| AION | 151.5 |
| | 18.34 |
| | 50.0 |
| | 6.05 |
| | 20.2 |
| | 6.5 |
|
| ANRP I | 426.1 |
| | 32.21 |
| | 10.1 |
| | 0.76 |
| | 59.7 |
| | 1.1 |
|
| ANRP II | 561.2 |
| | 16.25 |
| | 26.0 |
| | 0.75 |
| | 200.5 |
| | 9.2 |
|
| ANRP III | 648.1 |
| | 49.71 |
| | 28.1 |
| | 2.16 |
| | 648.1 |
| | 28.1 |
|
| A.A. Mortgage Opportunities, L.P. | 625.0 |
| | 80.31 |
| | — |
| | — |
| | 261.6 |
| | — |
|
| Apollo Rose, L.P. | 299.1 |
| | 100.00 |
| | — |
| | — |
| | — |
| | — |
|
| Apollo Rose II, L.P. | 887.1 |
| | 51.01 |
| | 33.0 |
| | 1.9 |
| | 394.6 |
| | 14.9 |
|
| Champ, L.P. | 183.6 |
| | 78.25 |
| | 25.3 |
| | 10.8 |
| | 15.3 |
| | 2.4 |
|
| Apollo Royalties Management, LLC | 108.6 |
| | 100.00 |
| | — |
| | — |
| | — |
| | — |
|
| Apollo Hybrid Value Fund, L.P. | 834.2 |
| | 25.76 |
| | 89.2 |
| | 2.75 |
| | 693.9 |
| | 74.2 |
|
| COF III | 358.1 |
| | 10.45 |
| | 83.1 |
| | 2.43 |
| | 75.0 |
| | 18.7 |
|
| Apollo Asia Private Credit Fund, L.P. | 126.5 |
| | 55.12 |
| | 0.1 |
| | 0.04 |
| | 31.9 |
| | — |
|
| AEOF | 125.5 |
| | 12.01 |
| | 25.5 |
| | 2.44 |
| | 92.6 |
| | 18.8 |
|
| Other Private Equity | 708.7 |
| | Various |
| | 103.6 |
| | Various |
| | 160.4 |
| | 46.7 |
|
| Real Assets: | | | | | | | | | | | |
| U.S. RE Fund III | 317.1 |
| | 71.68 |
| | 7.1 |
| | 1.60 |
| | 317.1 |
| | 7.1 |
|
U.S. RE Fund II(2) | 697.2 |
| | 56.08 |
| | 4.7 |
| | 0.38 |
| | 290.1 |
| | 7.0 |
|
U.S. RE Fund I(2) | 434.0 |
| | 66.98 |
| | 16.4 |
| | 2.52 |
| | 81.3 |
| | 2.7 |
|
CPI Capital Partners Europe, L.P.(1) | 6.0 |
| | 0.47 |
| | — |
| | — |
| | — |
| | — |
|
| CPI Capital Partners Asia Pacific, L.P. | 6.9 |
| | 0.53 |
| | 0.5 |
| | 0.04 |
| | 0.1 |
| | — |
|
Asia RE Fund(2) | 376.9 |
| | 53.12 |
| | 8.4 |
| | 1.18 |
| | 240.5 |
| | 5.9 |
|
Infrastructure Equity Fund(3) | 246.1 |
| | 27.43 |
| | 13.1 |
| | 1.46 |
| | 59.7 |
| | 2.7 |
|
EPF III(1) | 609.4 |
| | 13.63 |
| | 72.6 |
| | 1.62 |
| | 332.3 |
| | 40.7 |
|
EPF II(1) | 410.1 |
| | 12.02 |
| | 60.2 |
| | 1.76 |
| | 92.8 |
| | 18.0 |
|
Apollo European Principal Finance Fund, L.P. (“EPF I”)(1) | 292.8 |
| | 20.74 |
| | 19.3 |
| | 1.37 |
| | 47.4 |
| | 4.4 |
|
| Other Real Assets | 682.9 |
| | Various |
| | 0.9 |
| | Various |
| | 24.7 |
| | 0.2 |
|
| Other: | | | | | | | | | | | |
| Apollo SPN Investments I, L.P. | 12.5 |
| | 0.27 |
| | 12.5 |
| | 0.27 |
| | 7.2 |
| | 7.2 |
|
| Total | $ | 22,911.5 |
| | | | $ | 2,276.6 |
| | | | $ | 9,352.7 |
| | $ | 1,085.7 |
|
| |
(1) | Apollo’s commitment in these funds is denominated in Euros and translated into U.S. dollars at an exchange rate of €1.00 to $1.09 as of September 30, 2019. |
(3)Figures for AIOF I include Apollo Infra Equity US Fund, L.P. and Apollo Infra Equity International Fund, L.P. commitments.
| |
(2) | Figures for U.S. RE Fund I include base, additional, and co-investment commitments. A co-investment vehicle within U.S. RE Fund I is denominated in pound sterling and translated into U.S. dollars at an exchange rate of £1.00 to $1.23 as of September 30, 2019. Figures for U.S. RE Fund II and Asia RE Fund include co-investment commitments. |
| |
(3) | Figures for Apollo Infrastructure Equity Fund include Apollo Infra Equity US Fund, L.P. and Apollo Infra Equity International Fund, L.P. commitments. |
(4)Apollo only (excluding related party) remaining commitments excludes a €250 million unfunded commitment that is subject to satisfaction of certain conditions.
On April 30, 2015, Apollo entered into the AAA Investments Credit Agreement (see note 1415 of our condensed consolidated financial statements for further disclosure regarding this facility). The 2018 AMH Credit Facility, 2024 Senior Notes, 2026 Senior Notes, 2029 Senior Notes, 2030 Senior Notes, 2039 Senior Secured Guaranteed Notes, andthe 2048 Senior Notes and the 2050 Subordinated Notes will have future impacts on our cash uses. See note 1011 of our condensed consolidated financial statements for information regarding the Company’s debt arrangements.
Contingent Obligation—Performance fees with respect to certain credit and private equity funds and real assets funds is subject to reversal in the event of future losses to the extent of the cumulative performance fees recognized in income to date. See note 1516 of our condensed consolidated financial statements for a description of our contingent obligation.
One of the Company’s subsidiaries, AGS, provides underwriting commitments in connection with securities offerings to theof related parties of Apollo, including portfolio companies of the funds Apollo manages.manages, as well as third parties. As of September 30, 2019,2020, there were no underwriting commitments.
| |
ITEM 3. | QUANTITATIVE AND QUALITATIVE DISCLOSURES ABOUT MARKET RISK |
ITEM 3. QUANTITATIVE AND QUALITATIVE DISCLOSURES ABOUT MARKET RISK
Our predominant exposure to market risk is related to our role as investment manager and general partner for our funds and the sensitivity to movements in the fair value of their investments and resulting impact on performance fees and management fee revenues. Our direct investments in the funds also expose us to market risk whereby movements in the fair values of the underlying investments will increase or decrease both net gains (losses) from investment activities and income (loss) from equity method investments. For a discussion of the impact of market risk factors on our financial instruments see “Item 2. Management’s Discussion and Analysis of Financial Condition and Results of Operations—Critical Accounting Policies—Investments, at Fair Value.”
The fair value of our financial assets and liabilities of our funds may fluctuate in response to changes in the value of investments, foreign exchange, commodities and interest rates. The net effect of these fair value changes impacts the gains and losses from investments in our condensed consolidated statements of operations. However, the majority of these fair value changes are absorbed by the Non-Controlling Interests.
The Company is subject to a concentration risk related to the investors in its funds. Although there are more than 1,000 investors in Apollo’s active credit, private equity and real assets funds, no individual investor accounts for more than 10% of the total committed capital to Apollo’s active funds.
Risks are analyzed across funds from the “bottom up” and from the “top down” with a particular focus on asymmetric risk. We gather and analyze data, monitor investments and markets in detail, and constantly strive to better quantify, qualify and circumscribe relevant risks.
Each risk management process is subject to our overall risk tolerance and philosophy and our enterprise-wide risk management framework. This framework includes identifying, measuring and managing market, credit and operational risks at each segment, as well as at the fund and Company level.
Each segment runs its own investment and risk management process subject to our overall risk tolerance and philosophy:
•Our credit and real assets funds continuously monitor a variety of markets for attractive trading opportunities, applying a number of traditional and customized risk management metrics to analyze risk related to specific assets or portfolios, as well as, fund-wide risks.
•The investment process of our private equity funds involves a detailed analysis of potential acquisitions, and investment management teams assigned to monitor the strategic development, financing and capital deployment decisions of each portfolio investment.
The Company has established a risk committeeGlobal Risk Committee comprised of various members of senior management including the Company’s Chief Financial Officer,Co-Presidents, Co-Chief Operating Officers, Chief Legal Officer, and the Company’sGlobal Head of Human Capital, Chief Risk Officer.Officer, Head of Enterprise Risk Management and Head of Internal Audit. The risk committee is tasked with
assisting the Company in monitoring and managing enterprise-wide risk. The risk committee generally meets on a quarterly basis and reports to senior management of the Company at such times as the committee deems appropriate and at least on an annual basis.
On at least a monthly basis, the Company’s risk department provides a summary analysis of fund level market and credit risk to the portfolio managers of the Company’s funds and the heads of the various business segments. On a periodic basis, the Company’s risk department presents a consolidated summary analysisprovides analyses of fund levelselect market and credit risk components to the Company’s risk committee.various members of senior management. In addition, the Company’s Chief Risk Officer reviews specific investments from the perspective of risk mitigation and discusses such analysis with the Company’s risk committee and/or the executive committee of the Company’s Board at such times as the Company’s Chief Risk Officer determines such discussions are warranted. On an annual basis, the Company’s Chief Risk Officer provides senior management of the Company with a comprehensive overview of risk management along with an update on current and future risk initiatives.
Impact on Management Fees—Our management fees are based on one of the following:
•capital commitments to an Apollo fund;
•capital invested in an Apollo fund;
•the gross, net or adjusted asset value of an Apollo fund, as defined; or
•as otherwise defined in the respective agreements.
Management fees could be impacted by changes in market risk factors and management could consider an investment permanently impaired as a result of (i) such market risk factors causing changes in invested capital or in market values to below cost, in the case of certain credit funds and our private equity funds or (ii) such market risk factors causing changes in gross or net asset value, for the credit funds. The proportion of our management fees that are based on NAV is dependent on the number and types of our funds in existence and the current stage of each fund’s life cycle.
Impact on Advisory and Transaction Fees—We earn transaction fees relating to the negotiation of credit, private equity and real assets transactions and may obtain reimbursement for certain out-of-pocket expenses incurred. Subsequently, on a quarterly or annual basis, ongoing advisory fees, and additional transaction fees in connection with additional purchases, dispositions, or follow-on transactions, may be earned. Management Fee Offsets and any broken deal costs, if applicable, are reflected as a reduction to advisory and transaction fees. Advisory and transaction fees will be impacted by changes in market risk factors to the extent that they limit our opportunities to engage in credit, private equity and real assets transactions or impair our ability to consummate such transactions. The impact of changes in market risk factors on advisory and transaction fees is not readily predicted or estimated.
Impact on Performance Fees—We earn performance fees from our funds as a result of such funds achieving specified performance criteria. Our performance fees will be impacted by changes in market risk factors. However, several major factors will influence the degree of impact:
•the performance criteria for each individual fund in relation to how that fund’s results of operations are impacted by changes in market risk factors;
•whether such performance criteria are annual or over the life of the fund;
•to the extent applicable, the previous performance of each fund in relation to its performance criteria; and
•whether each funds’ performance fee distributions are subject to contingent repayment.
As a result, the impact of changes in market risk factors on performance fees will vary widely from fund to fund. The impact is heavily dependent on the prior and future performance of each fund, and therefore is not readily predicted or estimated.
Market Risk—We are directly and indirectly affected by changes in market conditions. Market risk generally represents the risk that values of assets and liabilities or revenues and expenses will be adversely affected by changes in market conditions. Market risk is inherent in each of our investments and activities, including equity investments, loans, short-term borrowings, long-term debt, hedging instruments, credit default swaps and derivatives. Just a few of the market conditions that may shift from time to time, thereby exposing us to market risk, include fluctuations in interest and currency exchange rates, equity prices, changes in the implied volatility of interest rates and price deterioration. Volatility in debt and equity markets can impact our pace of capital deployment, the timing of receipt of transaction fee revenues and the timing of realizations. These market conditions could have an impact on the value of fund investments and rates of return. Accordingly, depending on the instruments or activities impacted, market risks can have wide ranging, complex adverse effects on our results from operations and our overall financial condition. We monitor market risk using certain strategies and methodologies which management
evaluates periodically for appropriateness. We intend to continue to monitor this risk going forward and continue to monitor our exposure to all market factors.
Interest Rate Risk—Interest rate risk represents exposure we and our funds have to instruments whose values vary with the change in interest rates. These instruments include, but are not limited to, loans, borrowings, investments in interest bearing securities and derivative instruments. We may seek to mitigate risks associated with the exposures by having our funds take offsetting positions in derivative contracts. Hedging instruments allow us to seek to mitigate risks by reducing the effect of movements in the level of interest rates, changes in the shape of the yield curve, as well as, changes in interest rate volatility. Hedging instruments used to mitigate these risks may include related derivatives such as options, futures and swaps.
Credit Risk—Certain of our funds are subject to certain inherent risks through their investments.
Certain of our entities invest substantially all of their excess cash in open-end money market funds and money market demand accounts, which are included in cash and cash equivalents. The money market funds invest primarily in government securities and other short-term, highly liquid instruments with a low risk of loss. We continually monitor the funds’ performance in order to manage any risk associated with these investments.
Certain of our funds hold derivative instruments that contain an element of risk in the event that the counterparties may be unable to meet the terms of such agreements. We seek to minimize our risk exposure by limiting the counterparties with which our funds enter into contracts to banks and investment banks who meet established credit and capital guidelines. As of September 30, 2019,2020, we do not expect any counterparty to default on its obligations and therefore do not expect to incur any loss due to counterparty default.
Certain of our funds’ investments include lower-rated and comparable quality unrated distressed investments and other instruments. Investments in such debt instruments are accompanied by a greater degree of risk of loss due to default by the issuer because such debt instruments are generally unsecured and subordinated to other creditors of the issuer. These issuers generally have high levels of indebtedness and can be more sensitive to adverse market conditions, such as a recession or increasing interest rates, as compared to higher rated issuers. We seek to minimize risk exposure by subjecting each prospective investment to rigorous credit analysis and by making investment decisions based upon objectives that include capital preservation and appreciation, and industry and issuer diversification.
Foreign Exchange Risk—Foreign exchange risk represents exposures our funds have to changes in the values of current fund holdings and future cash flows denominated in other currencies and investments in non-U.S. companies. The types of investments exposed to this risk include investments in foreign subsidiaries, foreign currency-denominated loans, foreign currency-denominated transactions, and various foreign exchange derivative instruments whose values fluctuate with changes in currency exchange rates or foreign interest rates. Instruments used to mitigate this risk are foreign exchange options, currency swaps, futures and forwards. These instruments may be used to help insulate our funds against losses that may arise due to volatile movements in foreign exchange rates and/or interest rates.
In our capacity as investment manager of the funds we manage, we continuously monitor a variety of markets for attractive opportunities for managing risk. For example, certain of the funds we manage may put in place foreign exchange hedges or borrowings with respect to certain foreign currency denominated investments to provide a hedge against foreign exchange exposure.
Non-U.S. Operations—We conduct business throughout the world and are continuing to expand into foreign markets. We currently have offices outside the U.S. in Toronto, London, Frankfurt, Madrid, Luxembourg, Mumbai, Delhi, Singapore, Hong Kong, Shanghai and Tokyo and have been strategically growing our international presence. Our fund investments and our revenues are primarily derived from our U.S. operations. With respect to our non-U.S. operations, we are subject to risk of loss from currency fluctuations, social instability, changes in governmental policies or policies of central banks, expropriation, nationalization, unfavorable political and diplomatic developments and changes in legislation relating to non-U.S. ownership. Our funds also invest in the securities of companies which are located in non-U.S. jurisdictions. As we continue to expand globally, we will continue to focus on monitoring and managing these risk factors as they relate to specific non-U.S. investments.
| |
ITEM 4. | CONTROLS AND PROCEDURES |
ITEM 4. CONTROLS AND PROCEDURES
We maintain “disclosure controls and procedures”, as such term is defined in Rules 13a-15(e) and 15d-15(e) under the Exchange Act, that are designed to ensure that information required to be disclosed by us in reports that we file or submit under the Exchange Act is recorded, processed, summarized and reported within the time periods specified in Securities and Exchange CommissionSEC rules and forms, and that such information is accumulated and communicated to our management, including our Chief Executive Officer and Chief Financial Officer, as appropriate, to allow timely decisions regarding required disclosure. In designing disclosure controls and procedures, our management necessarily was required to apply its judgment in evaluating the cost-benefit relationship of possible disclosure controls and procedures. The design of any disclosure controls and procedures also is based in part upon certain assumptions about the likelihood of future events, and there can be no assurance that any design will succeed in achieving its stated goals under all potential future conditions. Any controls and procedures, no matter how well designed and operated, can provide only reasonable assurance of achieving the desired objectives.
Our management, including our Chief Executive Officer and Chief Financial Officer, evaluated the effectiveness of our disclosure controls and procedures pursuant to Rule 13a-15 under the Exchange Act as of the end of the period covered by this report. Based on that evaluation, our Chief Executive Officer and Chief Financial Officer have concluded that, as of the end of the period covered by this report, our disclosure controls and procedures (as defined in Rule 13a-15(e) under the Exchange Act) are effective at the reasonable assurance level to accomplish their objectives of ensuring that information we are required to disclose
in reports that we file or submit under the Exchange Act is recorded, processed, summarized and reported within the time periods specified in Securities and Exchange CommissionSEC rules and forms, and that such information is accumulated and communicated to our management, including our Chief Executive Officer and Chief Financial Officer, as appropriate, to allow timely decisions regarding required disclosure.
No changes in our internal control over financial reporting (as such term is defined in Rules 13a–15(f) and 15d–15(f) under the Exchange Act) occurred during our most recent quarter, that have materially affected, or are reasonably likely to materially affect, our internal control over financial reporting. We have not experienced any material impact to our internal control over financial reporting despite the fact that most of our employees are working remotely due to the COVID-19 pandemic. We are continually monitoring and assessing the COVID-19 situation on our internal controls to minimize the impact on their design and operating effectiveness.
PART II—OTHER INFORMATION
ITEM 1. LEGAL PROCEEDINGS
See note 1516 to our condensed consolidated financial statements for a summary of the Company’s legal proceedings.
ITEM 1A. RISK FACTORS
For a discussion of our potential risks and uncertainties, see the information under the heading "Risk Factors" in our 20182019 Annual Report and our Quarterly Report for the quarter ended June 30, 2019,March 31, 2020 which are accessible on the Securities and Exchange Commission's website at www.sec.gov. There have been no material changes to the risk factors for the three months ended September 30, 2019.2020.
The risks described in our 20182019 Annual Report and our Quarterly Report for the quarter ended June 30, 2019March 31, 2020 are not the only risks facing us. Additional risks and uncertainties not currently known to us or that we currently deem to be immaterial also may materially adversely affect our business, financial condition and/ or operating results.
| |
ITEM 2. | UNREGISTERED SALE OF EQUITY SECURITIES |
ITEM 2. UNREGISTERED SALE OF EQUITY SECURITIES
On August 2, 2019,4, 2020, August 5, 2019, August 15, 2019, August 20, 2019, August 26, 201918, 2020, and August 27, 201931, 2020, we issued 182,698, 5,902, 26,338, 8,889, 1,185143,072, 9,998, and 1,44412,328 shares of Class A Common Stock,shares, respectively, net of taxes to Apollo Management Holdings, L.P., a subsidiary of Apollo Global Management, Inc., in connection with issuances of stock to participants in the Equity Plan for an aggregate purchase price of $5.8$7.1 million, $0.2$0.5 million, $0.9and $0.6 million, $0.3 million, $42.4 thousand and $51.6 thousand, respectively. The issuance was exempt from registration under the Securities Act in accordance with Section 4(a)(2) and Rule 506(b) thereof, as transactions by the issuer not involving a public offering. We determined that the purchaser of Class A Common Stockshares in the transactions, Apollo Management Holdings, L.P., was an accredited investor.
Issuer Purchases of Equity Securities
The following table sets forth purchases of our Class A Common Stock made by us or on our behalf during the fiscal quarter ended September 30, 2019.2020. From July 1, 2020 through September 30, 2020, the Company paid approximately $6.4 million in cash to satisfy tax withholding and cash settlement obligations in lieu of issuing shares of Class A Common Stock upon the vesting of equity awards representing 129,064 shares of Class A Common Stock.
| | | | | | | | | | | | | | | | | | | | | | | | | | |
| Period | | Total number of Class A Common Stock purchased(1) | | Average price paid per share | | Total number of Class A Common Stock purchased as part of publicly announced plans or programs(2) | | Approximate dollar value of Class A Common Stock that may yet be purchased under the plans or programs (3) |
| July 1, 2020 through July 31, 2020 | | — | | | $ | — | | | — | | | $ | 420,274,885 | |
| August 1, 2020 through August 31, 2020 | | 561,000 | | | $ | 48.86 | | | 541,451 | | | $ | 387,433,190 | |
| September 1, 2020 through September 30, 2020 | | — | | | $ | — | | | — | | | $ | 387,433,190 | |
| Total | | 561,000 | | | | | | | |
|
| | | | | | | | | | | | | | |
| Period | | Number of Shares of Class A Common Stock Purchased(1) | | Average Price
Paid per Share | | Class A Common Stock Purchased as Part of Publicly Announced Plans or Programs(2) | | Approximate Dollar Value of Class A Common Stock that May be Purchased Under the Plan or Programs |
| July 1, 2019 through July 31, 2019 | | — |
| | $ | — |
| | — |
| | $ | 227,407,649 |
|
| August 1, 2019 through August 31, 2019 | | 143,000 |
| | 32.23 |
| | 116,662 |
| | 223,647,633 |
|
| September 1, 2019 through September 30, 2019 | | — |
| | — |
| | — |
| | 223,647,633 |
|
| Total | | 143,000 |
| | | | 116,662 |
| | |
| |
(1) | (1) Certain Apollo employees receive a portion of the profit sharing proceeds of certain funds in the form of (a) restricted Class A Common Stock of AGM Inc. that they are required to purchase with such proceeds or (b) RSUs, in each case which equity-based awards generally vest over three years. These equity-based awards are granted under the Company's Equity Plan. To prevent dilution on account of these awards, Apollo may, in its discretion, repurchase Class A Common Stock on the open market and retire them. During the three months ended September 30, 2019, we repurchased 26,338 shares of Class A Common Stock at an average price paid per share of $32.23 in open-market transactions not pursuant to a publicly-announced repurchase plan or program on account of these awards. See note 13 to the condensed consolidated financial statements for further information on Class A Common Stock. |
| |
(2) | Pursuant to a publicly announced share repurchase program, the Company is authorized to repurchase up to $500 million in the aggregate of its Class A Common Stock, including through the repurchase of outstanding Class A Common Stock and through a reduction of Class A Common Stock to be issued to employees to satisfy associated tax obligations in connection with the settlement of equity-based awards |
granted under the Company's Equity Plan. To prevent dilution on account of these awards, Apollo may, in its discretion, repurchase Class A Common Stock on the open market and retire them. See note 14 to the condensed consolidated financial statements for further information on Class A Common Stock.
(2) Pursuant to a share repurchase program that was publicly announced on March 12, 2020, the Company is authorized to repurchase up to $500 million in the aggregate of its Class A Common Stock, including through the repurchase of outstanding Class A Common Stock and through a reduction of Class A Common Stock to be issued to employees to satisfy associated tax obligations in connection with the settlement of equity-based awards granted under the 2019 Equity Plan (or any successor equity plan thereto). This new authorization increased the Company’s capacity to repurchase shares from $80 million of unused capacity under the Company’s previously approved share repurchase plan. Class A Common Stock may be repurchased from time to time in open market transactions, in privately negotiated transactions, pursuant to a trading plan adopted in accordance with Rule 10b5-1 of the Exchange Act, or otherwise, with the size and timing of these repurchases depending on legal requirements, price, market and economic conditions and other factors. The Company is not obligated under the terms of the program to repurchase any of its Class A Common Stock. The repurchase program has no expiration date and may be suspended or terminated by the Company at any time without prior notice. Class A Common Stock repurchased as part of this program are canceled by the Company. Reductions
(3) Amounts have been adjusted to account for reductions of Class A Common Stock issued to employees to satisfy associated tax obligations in connection with the settlement of equity-based awards granted to employees under the Equity Plan are not included in the table.Plan.
ITEM 3. DEFAULTS UPON SENIOR SECURITIES
Not applicable.
ITEM 4. MINE SAFETY DISCLOSURES
Not applicable.
ITEM 5. OTHER INFORMATION
Not applicable.
ITEM 6. EXHIBITS
| |
ITEM 3. | DEFAULTS UPON SENIOR SECURITIES |
Not applicable.
| |
ITEM 4. | MINE SAFETY DISCLOSURES |
Not applicable.
Not applicable.
|
| | |
Exhibit
Number
| | Exhibit Description |
| |
| 3.1 | | |
| |
| 3.2 | | |
| |
| 3.3 | | |
| |
3.34.1 | | |
| |
4.1 | | |
| | |
| 4.2 | | |
| | |
| 4.3 | | |
| | |
| 4.4 | | |
| | |
| 4.5 | | |
| |
| 4.6 | | |
| | |
| 4.7 | | |
| | |
| 4.8 | | |
| | |
Exhibit
Number
| | Exhibit Description | | | | | | |
Exhibit
Number | | Exhibit Description |
4.9 | |
| 4.9 | | |
| | |
| 4.10 | | |
| | |
| 4.11 | | |
| | |
| 4.12 | | |
| | |
| 4.13 | | |
| | |
| 4.14 | | |
| | |
| 4.15 | | |
| | |
| 4.16 | | |
| | |
*4.17 | | Amendment No. 1, dated and effective as of September 30, 2019, to Indenture dated as of June 10, 2019, among APH Finance I, LLC, APH Finance 2, LLC, APH Finance 3, LLC and U.S. Bank National Association, as trustee. |
| | |
+10.1 | | |
| | |
*+10.2 | | |
| | |
+10.3 | | |
| | |
|
| | |
Exhibit
Number
4.18 | | Exhibit Description |
| |
+10.4 | | |
| | |
+10.5 | | |
| | |
+10.6 | | |
| | |
+10.7 | | |
| | |
+10.8 | | |
| | |
*+10.9 | | |
| | |
*+10.10 | | |
| | |
*+10.11 | | |
| | |
*+10.12 | | |
| | |
10.13 | | Amendment and Restated Shareholders Agreement, dated as of September 5, 2019, by and among Apollo Global Management, Inc., AP Professional Holdings, L.P., BRH Holdings, L.P., Black Family Partners, L.P., MJH Partners, L.P., MJR Foundation LLC, Leon D. Black, Marc J. Rowan and Joshua J. Harris (incorporated by reference to Exhibit 99.14.1 to the Registrant’s Form 8-K filed with the Securities and Exchange Commission on September 5,December 17, 2019 (File No. 001-35107)). |
| | |
10.144.19 | | Amendment to Amended and Restated Tax Receivable Agreement, dated asForm of September 5, 2019, by and among APO Corp., Apollo Principal Holdings II, L.P., Apollo Principal Holdings IV, L.P., Apollo Principal Holdings VI, L.P. Apollo Principal Holdings VIII, L.P., AMH Holdings (Cayman), L.P. and each Holder defined therein4.950% Fixed-Rate Resettable Subordinated Note due 2050 (incorporated by reference to Exhibit 99.24.2 to the Registrant’s Form 8-K filed with the Securities and Exchange Commission on September 5,December 17, 2019 (File No. 001-35107)).
|
| | |
|
| | |
Exhibit
Number
| | Exhibit Description |
| | |
10.15 | | |
| | |
| | |
| | |
| | |
| | |
| | |
| | |
| | |
| | |
| | |
| | |
| | |
| | |
| | |
| | |
| | |
| | |
| | |
| | |
| | |
| | |
| | |
| | |
| | |
| | |
| | |
| | |
| | |
| | |
| | |
| | |
| | |
| | |
| |
| | |
| |
| | |
| | |
| | |
| | |
| | |
| | |
| | |
| | |
| | |
| | |
| | |
| | |
| | |
| | |
| | |
| | |
| | |
| | |
| | |
| | |
| | |
| | |
| | |
| |
| | |
| | |
| | |
| | |
| | |
| | |
| | |
| | |
| | |
| | |
| | |
| | |
| | |
| | |
| | |
| | |
| | |
| | |
| | |
| | |
| | |
| |
| | |
| |
| | |
| |
| | |
| |
| | |
| | |
| | |
| | |
| | |
| | |
| | |
| | |
| | |
| | |
| | |
| | |
| | |
| | |
| | |
| | |
| | |
| | |
| | |
| | |
| | |
| | |
| | |
| | |
| | |
| | |
| | |
| | |
| | |
| | |
| | |
| | |
| | |
| | |
| | |
| | |
| | |
| | |
| | |
| | |
| | |
| | |
| | |
| | |
| | |
| | |
| | |
| | |
| | |
| | |
| | |
| | |
| | |
| | |
| | |
| | |
| | |
| | |
| | |
| | |
| | |
| | |
| | |
| | |
| | |
| | |
| | |
| | |
| | |
| | |
| | |
| | |
| | |
| | |
| | |
| | |
| | |
| | |
| | |
| | |
| | |
| | |
| | |
| | |
| | |
| | |
| | |
| | |
| | |
| | |
| | |
| | |
| | |
| | |
| | |
| | |
| | |
| | |
| | |
| | |
| | |
| | |
| | |
| | |
| | |
| | |
| | | | | | | | |
Exhibit
Number | | Exhibit Description |
| |
| 4.20 | | Sixth Amended and Restated Exchange Agreement,Ninth Supplemental Indenture, dated as of SeptemberJune 5, 2019, by and2020, among Apollo Global Management Inc., Apollo Principal Holdings, I, L.P., Apollo Principal Holdings II, L.P., Apollo Principal Holdings III, L.P., Apollo Principal Holdings IV, L.P., Apollo Principal Holdings V, L.P., Apollo Principal Holdings VI, L.P., Apollo Principal Holdings VII, L.P., Apollo Principal Holdings VIII, L.P., Apollo Principal Holdings IX, L.P., Apollo Principal Holdings X, L.P., Apollo Principal Holdings XI, LLC, Apollo Principal Holdings XII, L.P., AMH Holdings (Cayman), L.P.the Guarantors party thereto and the Apollo Principal Holders (as defined therein) from time to time party thereto(incorporatedWells Fargo Bank, National Association, as trustee (incorporated by reference to Exhibit 99.34.1 to the Registrant’s Form 8-K filed with the Securities and Exchange Commission on SeptemberJune 5, 20192020 (File No. 001-35107)). |
| | |
*31.14.21 | | |
| | |
| | |
| | |
| | |
| | |
| | |
| | |
| | |
| | |
| | |
| | |
| | |
| | |
| | |
| | |
| *31.1 | | |
| |
| *31.2 | | |
| |
| *32.1 | | |
| |
| *32.2 | | |
| | |
| 101.INS | | XBRL Instance Document - the instance document does not appear in the Interactive Data File because its XBRL tags are embedded within the Inline XBRL document |
| |
| *101.SCH | | XBRL Taxonomy Extension Schema Document |
| |
| *101.CAL | | XBRL Taxonomy Extension Calculation Linkbase Document |
| |
| *101.DEF | | XBRL Taxonomy Extension Definition Linkbase Document |
| |
| *101.LAB | | XBRL Taxonomy Extension Label Linkbase Document |
| |
| *101.PRE | | XBRL Taxonomy Extension Presentation Linkbase Document |
| | |
| 104 | | Cover Page Interactive Data File (embedded within the Inline XBRL document). |
|
| |
+ | Management contract or compensatory plan or arrangement. |
The agreements and other documents filed as exhibits to this report are not intended to provide factual information or other disclosure other than with respect to the terms of the agreements or other documents themselves, and you should not rely on them for that purpose. In particular, any representations and warranties made by us in these agreements or other documents were made solely within the specific context of the relevant agreement or document and may not describe the actual state of affairs as of the date they were made or at any other time.
SIGNATURES
Pursuant to the requirements of the Securities Exchange Act of 1934, the registrant has duly caused this report to be signed on its behalf by the undersigned, thereunto duly authorized.
| | | | | | | | | | | |
| | | |
| | | |
| | Apollo Global Management, Inc. |
| | (Registrant) |
| | |
Date: November 5, 20196, 2020 | By: | /s/ Martin Kelly |
| | Name: | Martin Kelly |
| | Title: | Chief Financial Officer and Co-Chief Operating Officer
(principal financial officer and authorized signatory)
|