000141149412/312021Q2FALSE2,736,4931,624,15611,000,00011,000,00011,000,00011,000,00012,000,00012,000,00012,000,00012,000,0000.000010.0000190,000,000,00090,000,000,000231,366,321228,873,449231,366,321228,873,4490.000010.00001999,999,999999,999,99911110.000010.000011111111647.53.123.0105210.717.610.410.40.610.611.251.251.251.255.58.07.61.815.68.712.54.56.07.012.55.58.56.312.04.57.210.010.00.610.6135.060.48.512.51.49.64.511.52.29.11647.54.415.6852149.69.713.81.21.29.89.80.560.561.11.11.827.014.075.07.515.05.86.06.312.55.58.55.8125.57.09.89.80.560.5650.064.41.89.37.714.01.87.9P1YP3YP1Y17.528.5two years0001411494apo:PrivateEquityFundMember2020-12-31
UNITED STATES
SECURITIES AND EXCHANGE COMMISSION
WASHINGTON, D.C. 20549
Form 10-Q
(Mark One)
| | | | | |
| ☒ | QUARTERLY REPORT PURSUANT TO SECTION 13 OR 15(d) OF THE SECURITIES EXCHANGE ACT OF 1934 |
FOR THE QUARTERLY PERIOD ENDED JUNE 30, 2021MARCH 31, 2022 OR
| | | | | |
| ☐ | TRANSITION REPORT PURSUANT TO SECTION 13 OR 15(d) OF THE SECURITIES EXCHANGE ACT OF 1934 |
FOR THE TRANSITION PERIOD FROM TO
Commission File Number: 001-35107
APOLLO GLOBALASSET MANAGEMENT, INC.
(Exact name of Registrant as specified in its charter)
| | | | | | | | |
| Delaware | | 20-8880053 |
| (State or other jurisdiction of incorporation or organization) | | (I.R.S. Employer Identification No.) |
9 West 57th Street, 43rd42nd Floor
New York, New York 10019
(Address of principal executive offices) (Zip Code)
(212) 515-3200
(Registrant’s telephone number, including area code)
Indicate by check mark whether the Registrant (1) has filed all reports required to be filed by Section 13 or 15(d) of the Securities Exchange Act of 1934 during the preceding 12 months (or for such shorter period that the Registrant was required to file such reports), and (2) has been subject to such filing requirements for the past 90 days. Yes ☒ No ☐
Indicate by check mark whether the registrant has submitted electronically every Interactive Data File required to be submitted pursuant to Rule 405 of Regulation S-T (§232.405 of this chapter) during the preceding 12 months (or for such shorter period that the registrant was required to submit such files). Yes ☒ No ☐
Indicate by check mark whether the Registrant is a large accelerated filer, an accelerated filer, a non-accelerated filer, a smaller reporting company or an emerging growth company. See the definitions of “large accelerated filer”, “accelerated filer”, “smaller reporting company” and “emerging growth company” in Rule 12b-2 of the Exchange Act.
| | | | | | | | | | | | | | | | | | | | |
| Large accelerated filer | | ☒ | | Accelerated filer | | ☐ |
| Non-accelerated filer | | ☐ | | Smaller reporting company | | ☐ |
| | | | Emerging growth company | | ☐ |
| If an emerging growth company, indicate by check mark if the registrant has elected not to use the extended transition period for complying with any new or revised financial accounting standards provided pursuant to Section 13(a) of the Exchange Act. | | |
| ☐ |
Indicate by check mark whether the Registrant is a shell company (as defined in Rule 12b-2 of the Exchange Act). Yes ☐ No ☒
Securities registered pursuant to Section 12(b) of the Act:
| | | | | | | | | | | | | | |
| Title of each class | | Trading Symbol(s) | | Name of each exchange on which registered |
Class A Common Stock | | APO | | New York Stock Exchange |
| 6.375% Series A Preferred Stock | | APO.PRAAM.PR A | | New York Stock Exchange |
| 6.375% Series B Preferred Stock | | APO. PRAAM.PR B | | New York Stock Exchange |
Securities registered pursuant to Section 12(g) of the Act: None
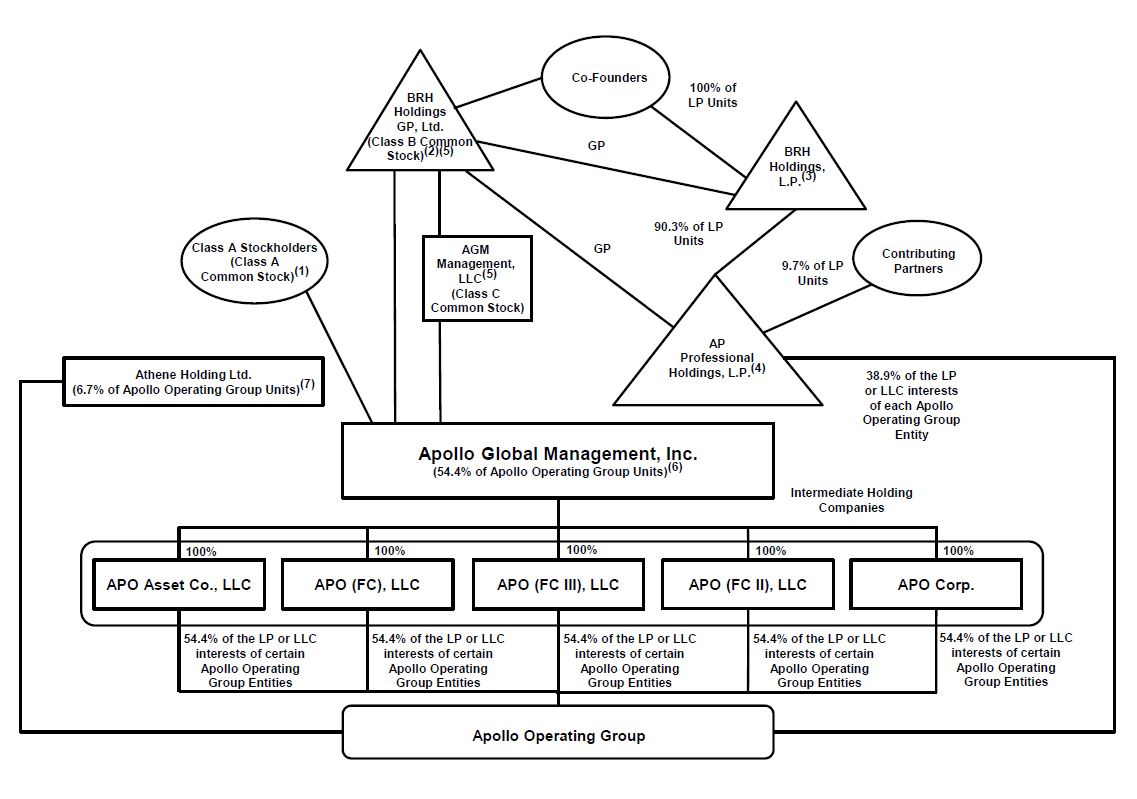
As of August 4, 2021,May 7, 2022, there were 235,527,3581,000 shares of Class A common stock, 1 share of Class B common stock and 1 share of Class C common stock of the Registrant outstanding.
As of August 4, 2021, on a fully exchanged and diluted basis, there were 432,935,490 shares of Class A common stock of the Registrant outstanding, which includes 168,253,613 Apollo Operating Group Units held by AP Professional Holdings, L.P. and 29,154,519 Apollo Operating Group Units held by Athene Holding Ltd.
| | | | | | | | |
| TABLE OF CONTENTS | |
| | | Page |
| PART I | | |
| | |
| ITEM 1. | | |
| | |
| | |
| | |
| | |
| | |
| | |
| | |
| | |
| | |
| | |
| | |
| | |
| | |
| | |
| | |
ITEM 1A. | | |
| | |
| ITEM 2. | | |
| | |
| ITEM 3. | | |
| | |
| ITEM 4. | | |
| | |
| PART II | OTHER INFORMATION | |
| | |
| ITEM 1. | | |
| | |
| ITEM 1A. | | |
| | |
| ITEM 2. | | |
| | |
| ITEM 3. | | |
| | |
| ITEM 4. | | |
| | |
| ITEM 5. | | |
| | |
| ITEM 6. | | |
| |
| |
Forward-Looking Statements
This quarterly report may contain forward-looking statements that are within the meaning of Section 27A of the Securities Act of 1933, as amended (the “Securities Act”), and Section 21E of the Securities Exchange Act of 1934, as amended (the “Exchange Act”). These statements include, but are not limited to, discussions related to Apollo’s expectations regarding the performance of its business, its liquidity and capital resources and the other non-historical statements in the discussion and analysis. These forward-looking statements are based on management’s beliefs, as well as assumptions made by, and information currently available to, management. When used in this quarterly report, the words “believe,” “anticipate,” “estimate,” “expect,” “intend” or future or conditional verbs, such as “will,“intend,” “should,” “could,” or “may,”“target” and variations of such words or similar expressions are intended to identify forward-looking statements. Although management believes that the expectations reflected in these forward-looking statements are reasonable, it can give no assurance that these expectations will prove to behave been correct. These statements are subject to certain risks, uncertainties and assumptions, including risks relating to our dependence on certain key personnel, our ability to raise new credit, private equity, or real assets funds, the impact of COVID-19, the novel coronavirus disease 2019 (“COVID-19”),impact of energy market dislocation, market conditions, and interest rate fluctuations, generally, our ability to manage our growth, fundour ability to operate in highly competitive environments, the performance changes inof the funds we manage, our regulatory environment and tax status,ability to raise new funds, the variability of our revenues, net incomeearnings and cash flow, our dependence on certain key personnel, the accuracy of management’s assumptions and estimates, our use of leverage to finance our businesses and investments by the funds we manage, changes in our funds,regulatory environment and tax status, litigation risks and consummation ofour ability to recognize the benefits expected to be derived from the merger of Apollo with Athene Holding potential corporate governance changes and related transactions which are subject to regulatory, corporate and stockholder approvals,Ltd. (“Athene”), among others. We believe these factors include but are not limited to those described under the section entitled “Risk Factors” in the Company’s Annual Report on Form 10-K filed with the United States Securities and Exchange Commission (“SEC”) on February 19, 202125, 2022 (the “2020“2021 Annual Report”) and Quarterly Report on Form 10-Q filed with the SEC on May 10, 2021,, as such factors may be updated from time to time in our periodic filings with the SEC, which are accessible on the SEC’s website at www.sec.gov. These factors should not be construed as exhaustive and should be read in conjunction with the other cautionary statements that are included in this report and in our other filings with the SEC. We undertake no obligation to publicly update or review any forward-looking statements, whether as a result of new information, future developments or otherwise, except as required by applicable law.
Terms Used in This Report
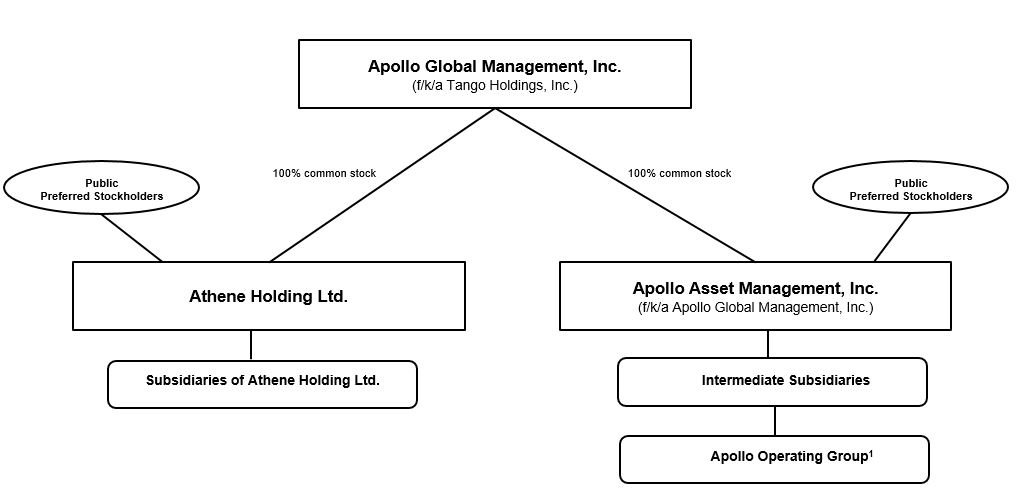
On January 1, 2022, Apollo Global Management, Inc. completed the previously announced merger transactions with Athene (the “Mergers”). Upon the closing of the Mergers, Apollo Global Management, Inc. was renamed Apollo Asset Management, Inc. (“AAM”) and became a subsidiary of Tango Holdings, Inc., and Tango Holdings, Inc. was renamed Apollo Global Management, Inc. (“AGM ”).
In this quarterly report, references to “Apollo,” “we,” “us,” “our”“our,” and the “Company” refer collectively to Apollo Global Management, Inc. (“AGM Inc.”)AAM and its subsidiaries, including the Apollo Operating Group and all of its subsidiaries, or as the context may otherwise require; "Classsubsidiaries. References to “Class A shares" refersshares” refer to the Class A common stock, $0.00001 par value per share, of AGM Inc.;AAM prior to the Mergers; “Class B share” refers to the Class B common stock, $0.00001 par value per share, of AGM Inc.; "ClassAAM prior to the Mergers; “Class C share"share” refers to the Class C common stock, $0.00001 par value per share, of AGM Inc.;AAM prior to the Mergers; “Series A Preferred shares” refers to the 6.375% Series A preferred stock of AGM Inc.;AAM; “Series B Preferred shares” refers to the 6.375% Series B preferred stock of AGM Inc.;AAM; and “Preferred shares” refers to the Series A Preferred shares and the Series B Preferred shares, collectively;collectively. In addition, references to “common stock” of the Company refer to the authorized shares of common stock, par value $0.00001 per share, of AAM following the Mergers.
The use of any defined term in this report to mean more than one entity, person, security or other item collectively is solely for convenience of reference and in no way implies that such entities, persons, securities or other items are one indistinguishable group. For example, notwithstanding the use of the defined terms "Apollo," "we", “us”, "our" and the “Company” in this report to refer to AAM and its subsidiaries, each subsidiary of AAM is a standalone legal entity that is separate and distinct from AAM and any of its other subsidiaries. Any AAM entity referenced herein is responsible for its own financial, contractual and legal obligations.
“AMH” refers to Apollo Management Holdings, L.P., a Delaware limited partnership, that is an indirect subsidiary of AGM Inc.;AAM;
“Apollo funds”, “our funds” and references to the “funds” we manage, refer to the funds (including the parallel funds and alternative investment vehicles of such funds), partnerships, accounts, including strategic investment accounts or “SIAs,” alternative asset companies and other entities for which subsidiaries of the Apollo Operating Group provide investment management or advisory services;
“Apollo Group” means (i) the Class C Stockholder and its affiliates, including their respective general partners, members and limited partners, (ii) Holdings and its affiliates, including their respective general partners, members and limited partners, (iii) with respect to each Co-Founder, such Co-Founder and such Co-Founder’s group (as defined in Section 13(d) of the Exchange Act), (iv) any former or current investment professional of or other employee of an Apollo employer (as defined below) or the Apollo Operating Group (or such other entity controlled by a member of the Apollo Operating Group) and any member of such person’s group, (v) any former or current executive officer of an Apollo employer or the Apollo Operating Group (or such other entity controlled by a member of the Apollo Operating Group) and any member of such person’s group; and (vi) any former or current director of an Apollo employer or the Apollo Operating Group (or such other entity controlled by a member of the Apollo Operating Group) and any member of such person’s group. With respect to any person, Apollo employer means AGM Inc. or such successor thereto or such other entity controlled by AGM Inc. or its successor as may be such person’s employer at such time, but does not include any portfolio companies;
“Apollo Operating Group” refers to (i) the limited partnerships and limited liability companiesentities through which we currently operate our businesses and (ii) one or more limited partnerships or limited liability companiesentities formed for the purpose of, among other activities, holding certain of our gains or losses on our principal investments in the funds, which we refer to as our “principal investments”;
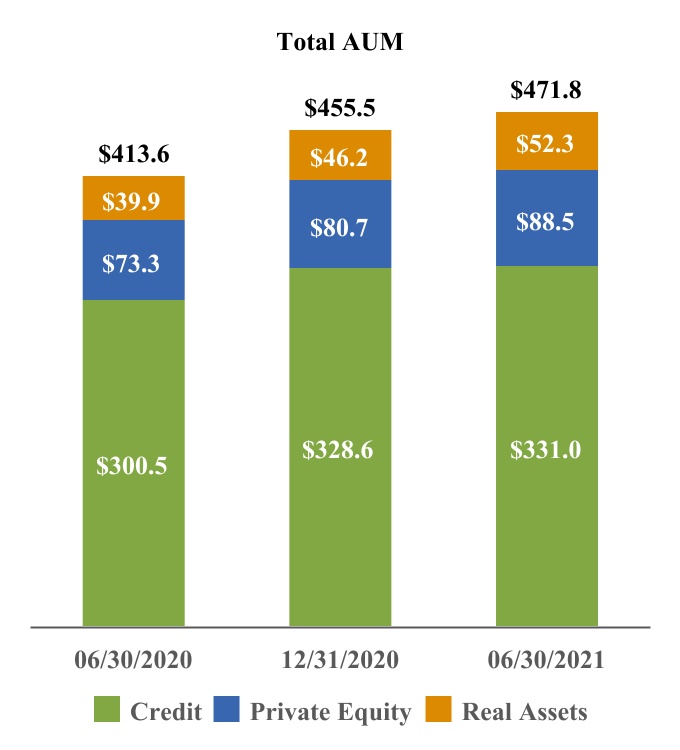
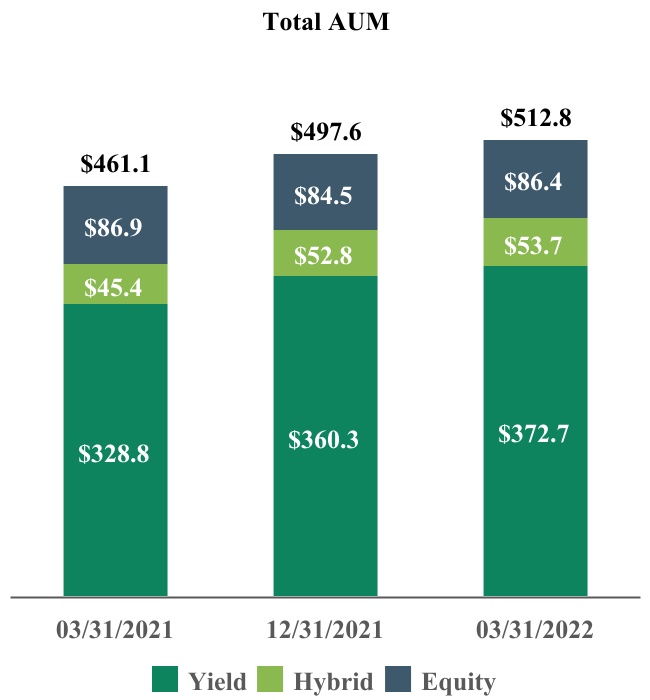
“Assets Under Management”, or “AUM”, refers to the assets of the funds, partnerships and accounts to which we provide investment management, advisory, or certain other investment-related services, including, without limitation, capital that such funds, partnerships and accounts have the right to call from investors pursuant to capital commitments. Our AUM equals the sum of:
(i)the net asset value, or “NAV,” plus used or available leverage and/or capital commitments, or gross assets plus capital commitments, of the credityield and certain hybrid funds, partnerships and accounts for which we provide investment management or advisory services, other than certain collateralized loan obligations (“CLOs”), collateralized debt obligations (“CDOs”), and certain permanentperpetual capital vehicles, which have a fee-generating basis other than the mark-to-market value of the underlying assets; for certain perpetual capital vehicles in yield, gross asset value plus available financing capacity;
(ii)the fair value of the investments of the private equity and real assetscertain hybrid funds, partnerships and accounts we manage or advise, plus the capital that such funds, partnerships and accounts are entitled to call from investors pursuant to capital commitments, plus portfolio level financings; for certain permanent capital vehicles in real assets, gross asset value plus available financing capacity;
(iii)the gross asset value associated with the reinsurance investments of the portfolio company assets we manage or advise; and
(iv)the fair value of any other assets that we manage or advise for the funds, partnerships and accounts to which we provide investment management, advisory, or certain other investment-related services, plus unused credit facilities, including capital commitments to such funds, partnerships and accounts for investments that may require pre-qualification or other conditions before investment plus any other capital commitments to such funds, partnerships and accounts available for investment that are not otherwise included in the clauses above.
Our AUM measure includes Assets Under Management for which we charge either nominal or zero fees. Our AUM measure also includes assets for which we do not have investment discretion, including certain assets for which we earn only investment-related service fees, rather than management or advisory fees. Our definition of AUM is not based on any definition of Assets Under Management contained in our governing documents or in any management agreements of our Apollo fund management agreements.the funds we manage. We consider multiple factors for determining what should be included in our definition of AUM. Such factors include but are not limited to (1) our ability to influence the investment decisions for existing and available assets; (2) our ability to generate income from the underlying assets in our funds;the funds we manage; and (3) the AUM measures that we use internally or believe are used by other investment managers. Given the differences in the investment strategies and structures among other alternative investment managers, our calculation of AUM may differ from the calculations employed by other investment managers and, as a result, this measure may not be directly comparable to similar measures presented by other investment managers. Our calculation also differs from the manner in which our affiliates registered with the SEC report “Regulatory Assets Under Management” on Form ADV and Form PF in various ways;ways.
We use AUM, Gross capital deployed and Dry powder as performance measurements of our investment activities, as well as to monitor fund size in relation to professional resource and infrastructure needs;
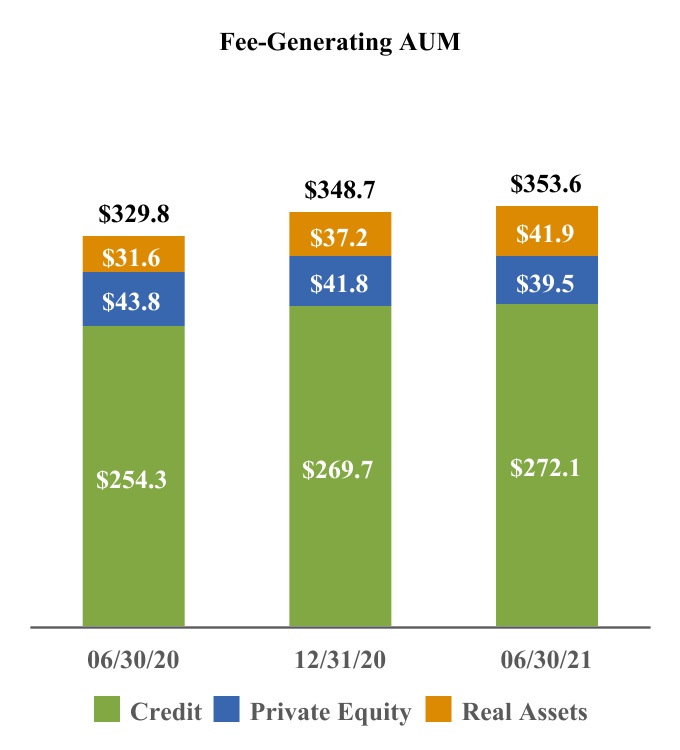
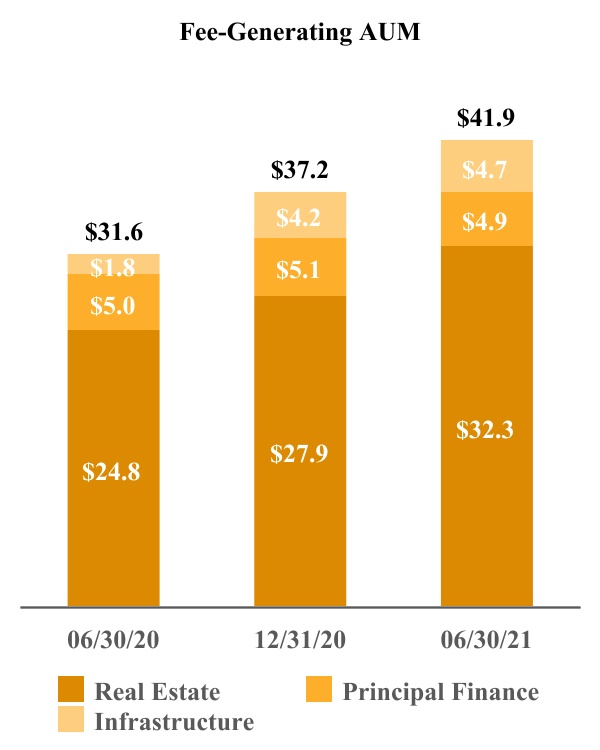
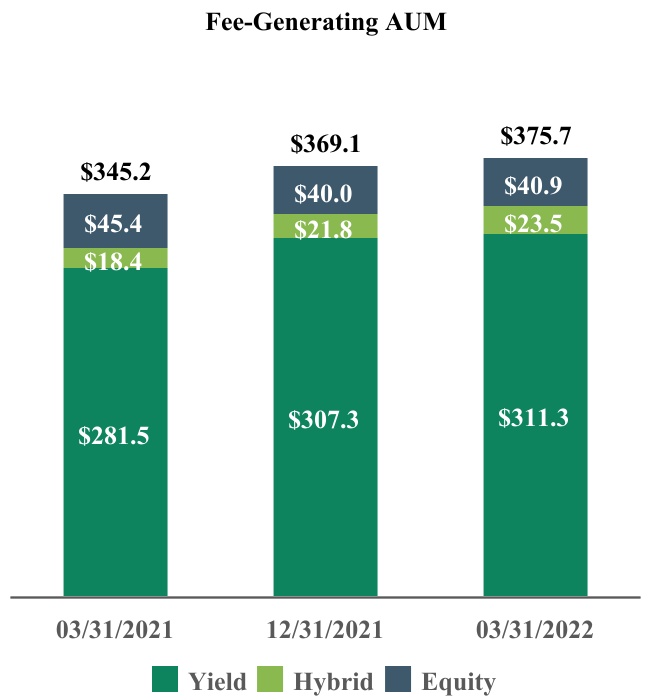
“Fee-Generating AUM” consists of assets of the funds, partnerships and accounts to which we provide investment management, advisory, or certain other investment-related services and on which we earn management fees, monitoring fees or other investment-related fees pursuant to management or other fee agreements on a basis that varies among the Apollo funds, partnerships and accounts. Management fees are normally based on “net asset value,” “gross assets,” “adjusted par asset value,” “adjusted cost of all unrealized portfolio investments,” “capital commitments,” “adjusted assets,” “stockholders’ equity,” “invested capital” or “capital contributions,” each as defined in the applicable management agreement. Monitoring fees, also referred to as advisory fees, with respect to the structured portfolio company investments of the funds, partnerships and accounts we manage or advise, are generally based on the total value of such structured portfolio company investments, which normally includes leverage, less any portion of such total value that is already considered in Fee-Generating AUM;
“Non-Fee-Generating AUM” refers to AUM that does not produce management fees or monitoring fees. This measure generally includes the following:
(i)fair value above invested capital for those funds that earn management fees based on invested capital;
(ii)net asset values related to general partner and co-investment interests;
(iii)unused credit facilities;
(iv)available commitments on those funds that generate management fees on invested capital;
(v)structured portfolio company investments that do not generate monitoring fees; and
(vi)the difference between gross asset and net asset value for those funds that earn management fees based on net asset value.
“Performance Fee-Eligible AUM” refers to the AUM that may eventually produce performance fees. All funds for which we are entitled to receive a performance fee allocation or incentive fee are included in Performance Fee-Eligible AUM, which consists of the following:
(i) “Performance Fee-Generating AUM”, which refers to invested capital of the funds, partnerships and accounts we manage, advise, or to which we provide certain other investment-related services, that is currently above its hurdle rate or preferred return, and profit of such funds, partnerships and accounts is being allocated to, or earned by, the general partner in accordance with the applicable limited partnership agreements or other governing agreements;
(ii) “AUM Not Currently Generating Performance Fees”, which refers to invested capital of the funds, partnerships and accounts we manage, advise, or to which we provide certain other investment-related services, that is currently below its hurdle rate or preferred return; and
(iii) “Uninvested Performance Fee-Eligible AUM”, which refers to capital of the funds, partnerships and accounts we manage, advise, or to which we provide certain other investment-related services, that is available for investment or reinvestment subject to the provisions of applicable limited partnership agreements or other governing agreements, which capital is not currently part of the NAV or fair value of investments that may eventually produce performance fees allocable to, or earned by, the general partner.
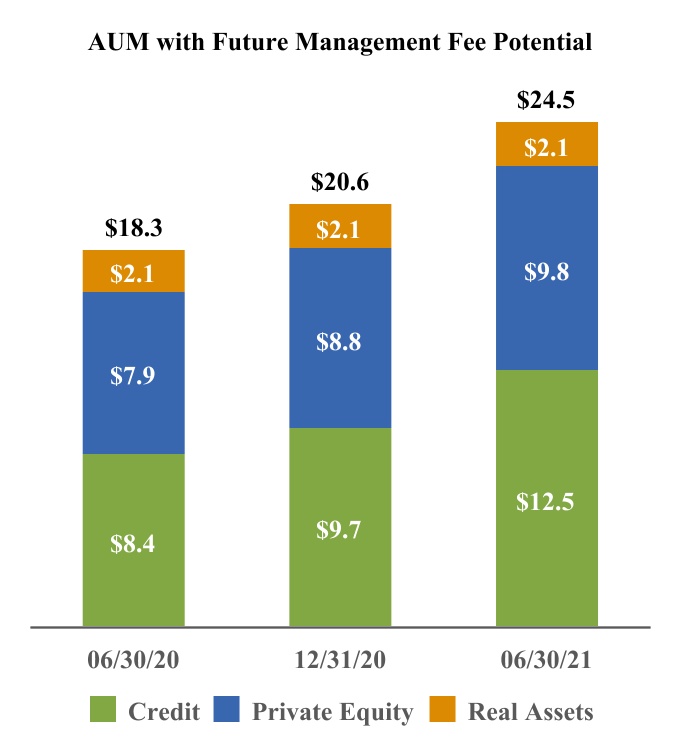
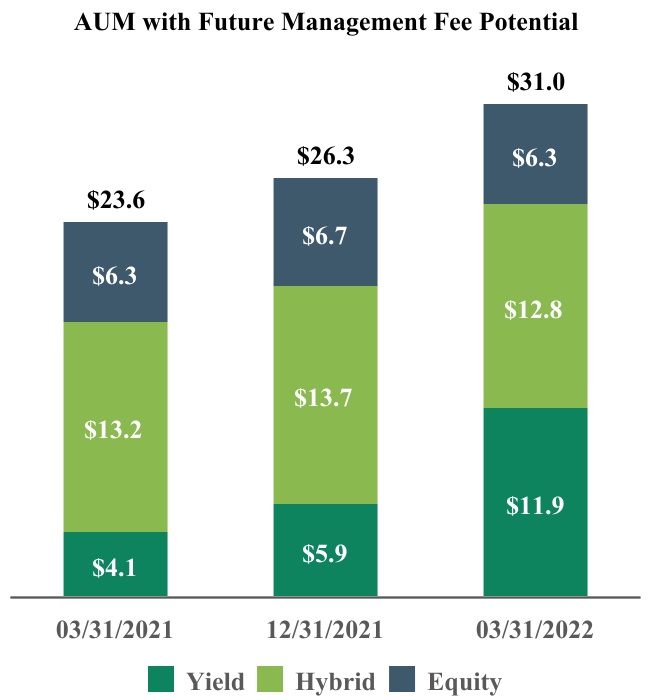
“AUM with Future Management Fee Potential” refers to the committed uninvested capital portion of total AUM not
currently earning management fees. The amount depends on the specific terms and conditions of each fund;
We use AUM as a performance measure of our funds’ investment activities of the funds we manage, as well as to monitor fund size in relation to professional resource and infrastructure needs. Non-Fee-Generating AUM includes assets on which we could earn performance fees;
“Advisory” refers to certain assets advised by Apollo Asset Management Europe PC LLP (“AAME PC”), a wholly-owned subsidiary of Apollo Asset Management Europe LLP (“AAME”). AAME PC and AAME are subsidiaries of Apollo and are collectively referred to herein as “ISGI”;
“Athene Holding” or “AHL” refers to Athene Holding Ltd. (together with its subsidiaries, “Athene”), a leading retirement services company that issues, reinsures and acquires retirement savings products designed for the increasing number of individuals and institutions seeking to fund retirement needs, and to which Apollo, through its consolidated subsidiary Apollo Insurance Solutions Group LP (formerly known as Athene Asset Management LLC) (“ISG”), provides asset management and advisory services;services. Athene Holding is a subsidiary of our parent company, Apollo Global Management, Inc.;
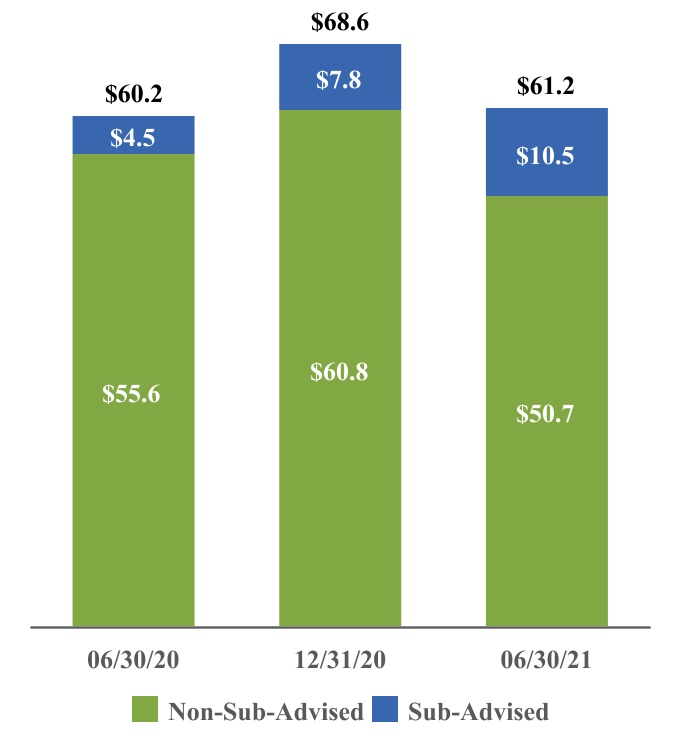
“Athora Holding” refers to Athora Holding, Ltd. (“Athora Holding” and together with its subsidiaries, “Athora”), a strategic platform that acquires or reinsures blocks of insurance business in the German and broader European life insurance market (collectively, the “Athora Accounts”). The Company, through ISGI, provides investment advisory services to Athora. Athora Non-Sub-Advised Assets includes the Athora assets which are managed by Apollo but not sub-advised by Apollo nor invested in Apollo funds or investment vehicles. Athora Sub-Advised includes assets which the Company explicitly sub-advises as well as those assets in the Athora Accounts which are invested directly in funds and investment vehicles Apollo manages;
“capital deployed” or “deployment”Contributing Partners” refer to those of our current and former partners and their related parties (other than Messrs. Leon Black, Joshua Harris and Marc Rowan, our co-founders) who indirectly beneficially owned (through Holdings) Apollo Operating Group units;
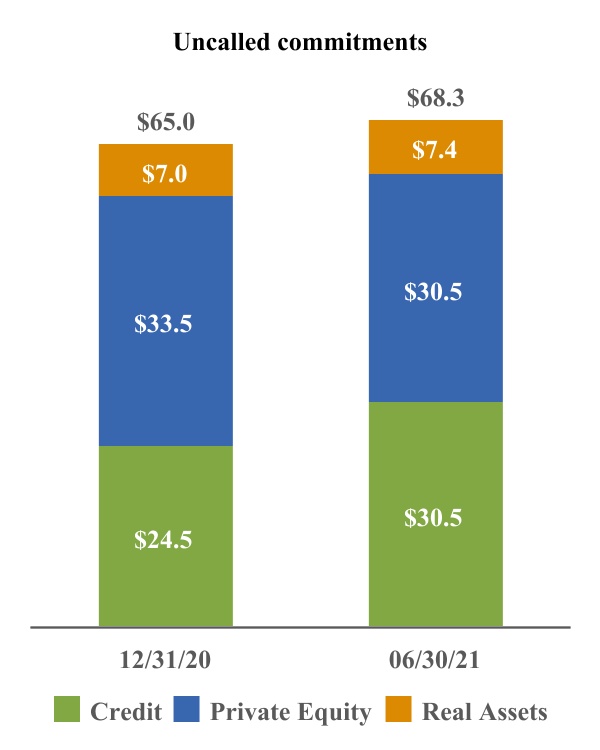
“Dry Powder” represents (i) the aggregate amount of capital that has been invested during a given period (including leverage) by our commitment basedavailable for investment or reinvestment subject to the provisions of the applicable limited partnership agreements or other governing agreements of the funds, and SIAs that have a defined maturity date, (ii) purchases of investments (net of sales) by our subscription and contribution based funds and mandates (including leverage), (iii) investments originated by certain of our platform companies, net of syndications to our other fundspartnerships and accounts but including syndicationswe manage. Dry powder excludes uncalled commitments which can only be called for fund fees and expenses and commitments from Perpetual Capital Vehicles;
“Equity Plan” refers to third parties,AGM’s 2007 Omnibus Equity Incentive Plan, which effective as of July 22, 2019, was amended, restated and (iv) third-party investment activity in opportunities sourced by our teams for which we earn a fee and in which we participate. Deployment excludes offsetting short positions, certain credit derivatives, certain short-dated government securities, and involuntary repayment of loans and bonds;
renamed the 2019 Omnibus Equity Incentive Plan; “Co-Founders”Former Managing Partners” refer to Messrs. Leon Black, Joshua Harris and Marc Rowan collectively and, when used in reference to holdings of interests in Apollo or Holdings, includes certain related parties of such individuals;
“Contributing Partners” refer to those
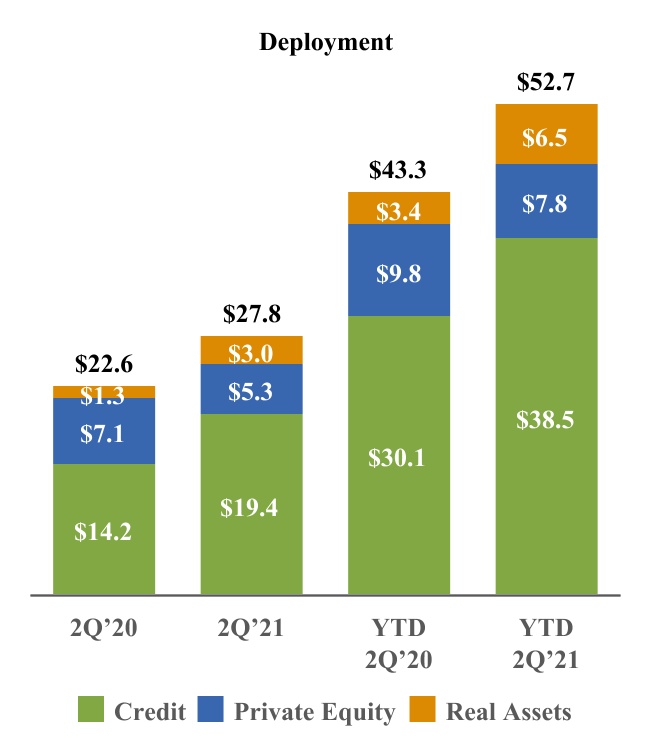
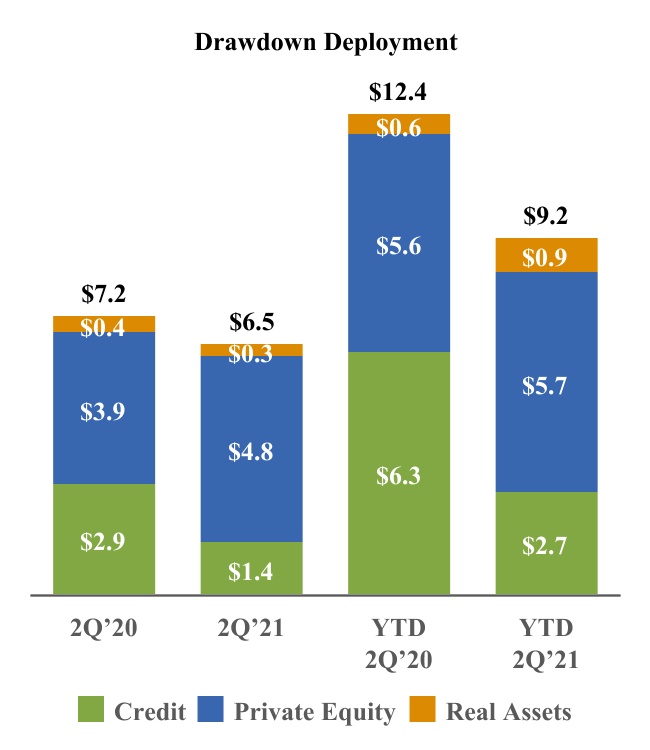
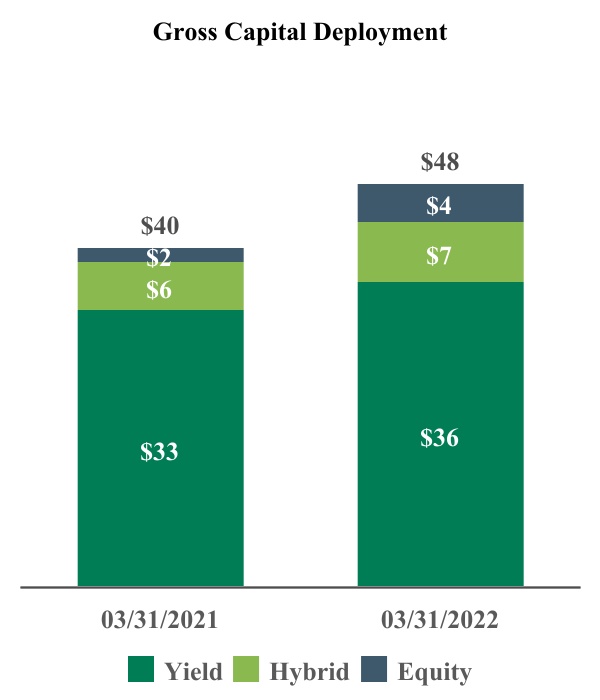
“drawdownGross capital deployed” or “drawdown deployment” isrepresents the aggregate amount ofgross capital that has been invested in investments by the funds and accounts we manage during a giventhe relevant period, (which may,but excludes certain investment activities primarily related to hedging and cash management functions at the firm. Gross capital deployment is not reduced or netted down by sales or refinancings, and takes into account leverage used by the funds and accounts we manage in certain cases, include leverage) by (i) our commitment-based funds, excluding certain funds in which permanent capital vehicles are the primary investor and (ii) SIAs that have a defined maturity date;
“Equity Plan” refersgaining exposure to the Company’s 2007 Omnibus Equity Incentive Plan, which effective as of July 22, 2019, was amended, restated and renamed the 2019 Omnibus Equity Incentive Plan;various investments that they have made;
“gross IRR” of a credit fund and the principal finance funds within the real assets segment represents the annualized return of a fund based on the actual timing of all cumulative fund cash flows before management fees, performance fees allocated to the general partner and certain other expenses. Calculations may include certain investors that do not pay fees. The terminal value is the net asset value as of the reporting date. Non-U.S. dollar denominated (“USD”) fund cash flows and residual values are converted to USD using the spot rate as of the reporting date. In addition, gross IRRs at the fund level will differ from those at the individual investor level as a result of, among other factors, timing of investor-level inflows and outflows. Gross IRR does not represent the return to any fund investor;
“gross IRR” of atraditional private equity or hybrid value fund represents the cumulative investment-related cash flows (i) for a given investment for the fund or funds which made such investment, and (ii) for a given fund, in the relevant fund itself (and not any one investor in the fund), in each case, on the basis of the actual timing of investment inflows and outflows (for unrealized investments assuming disposition on June 30, 2021March 31, 2022 or other date specified) aggregated on a gross basis quarterly, and the return is annualized and compounded before management fees, performance fees and certain other expenses (including interest incurred by the fund itself) and measures the returns on the fund’s investments as a whole without regard to whether all of the returns would, if distributed, be payable to the fund’s investors. In addition, gross IRRs at the fund level will differ from those at the individual investor level as a result of, among other factors, timing of investor-level inflows and outflows. Gross IRR does not represent the return to any fund investor;
“gross IRR”return” or “gross ROE” of a real assetstotal return yield fund excludingor the principal finance funds represents the cumulative investment-related cash flows in the fund itself (and not any one investor in the fund), on the basis of the actual timing of cash inflows and outflows (for unrealized investments assuming disposition on June 30, 2021 or other date specified) starting on the date that each investment closes, and the return is annualized and compounded before management fees, performance fees, and certain other expenses (including interest incurred by the fund itself) and measures the returns on the fund’s investments as a whole without regard to whether all of the returns would, if distributed, be payable to the fund’s investors. Non-USD fund cash flows and residual values are converted to USD using the spot rate as of the reporting date. In addition, gross IRRs at the fund level will differ from those at the individual investor level as a result of, among other factors, timing of investor-level inflows and outflows. Gross IRR does not represent the return to any fund investor;
“gross return” of ahybrid credit or real assetshedge fund is the monthly or quarterly time-weighted return that is equal to the percentage change in the value of a fund’s portfolio, adjusted for all contributions and withdrawals (cash flows) before the effects of management fees, incentive fees allocated to the general partner, or other fees and expenses. Returns for credit fundsthese categories are calculated for all funds and accounts in the respective strategies excluding assets for Athene, Athora and certain other entities where we manage or may manage a significant portion of the total company assets. Returns of CLOs represent the gross returns on assets.strategies. Returns over multiple periods are calculated by geometrically linking each period’s return over time;time. Gross return and gross ROE do not represent the return to any fund investor;
“HoldCo” refers to Tango Holdings, Inc., which was subsequently renamed Apollo Global Management, Inc. in connection with the Mergers;
“Holdings” means AP Professional Holdings, L.P., a Cayman Islands exempted limited partnership through which our Co-FoundersFormer Managing Partners and Contributing Partners indirectly beneficially ownowned their interests in the Apollo Operating Group units;
“inflows” represents (i) at the individual segment level, subscriptions, commitments, and other increases in available capital, such as acquisitions or leverage, net of inter-segment transfers, and (ii) on an aggregate basis, the sum of inflows across the credit, privateyield, hybrid and equity and real assets segments;strategies;
“net IRR” of a credit fund and the principal finance funds within the real assets segment represents the annualized return of a fund after management fees, performance fees allocated to the general partner and certain other expenses, calculated on investors that pay such fees. The terminal value is the net asset value as of the reporting date. Non-USD fund cash flows and residual values are converted to USD using the spot rate as of the reporting date. In addition, net IRR at the fund level will differ from that at the individual investor level as a result of, among other factors, timing of investor-level inflows and outflows. Net IRR does not represent the return to any fund investor;
“net IRR” of atraditional private equity or hybrid value fund means the gross IRR applicable to a fund, including returns for related parties which may not pay fees or performance fees, net of management fees, certain expenses (including interest incurred or earned by the fund itself) and realized performance fees all offset to the extent of interest income, and measures returns at the fund level on amounts that, if distributed, would be paid to investors of the fund. The timing of cash flows applicable to investments, management fees and certain expenses, may be adjusted for the usage of a fund’s subscription facility. To the extent that a fund exceeds all requirements detailed within the applicable fund agreement, the estimated unrealized value is adjusted such that a percentage of up to 20.0% of the unrealized gain is allocated to the general partner of such fund, thereby reducing the balance attributable to fund investors. In addition, net IRR at the fund level will differ from that at the individual investor level as a result of, among other factors, timing of investor-level inflows and outflows. Net IRR does not represent the return to any fund investor;
“net IRR”return” or “net ROE” of a real assetstotal return yield fund excludingor the principal finance funds represents the cumulative cash flows in the fund (and not any one investor in the fund), on the basis of the actual timing of cash inflows received from and outflows paid to investors of the fund (assuming the ending net asset value as of June 30, 2021 or other date specified is paid to investors), excluding certain non-fee and non-performance fee bearing parties, and the return is annualized and compounded after management fees, performance fees, and certain other expenses (including interest incurred by the fund itself) and measures the returns to investors of the fund as a whole. Non-USD fund cash flows and residual values are converted to USD using the spot rate as of the reporting date. In addition, net IRR at the fund level will differ from that at the individual investor level as a result of, among other factors, timing of investor-level inflows and outflows. Net IRR does not represent the return to any fund investor;
“net return” of ahybrid credit or real assetshedge fund represents the gross return after management fees, performance fees allocated to the general partner, or other fees and expenses. Returns over multiple periods are calculated by geometrically linking each period’s return over time;time. Net return and net ROE do not represent the return to any fund investor;
“other operating expenses” within the Principal Investing segment represents expenses incurred in the normal course of business and includes allocations of non-compensation expenses related to managing the business;
“performance allocations”, “performance fees”, “performance revenues”, “incentive fees” and “incentive income” refer to interests granted to Apollo by an Apollo fund that entitle Apollo to receive allocations, distributions or fees which are based on the performance of such fund or its underlying investments;
“permanentperpetual capital vehicles” refers to (a) assets that are owned by or related to Athene or Athora but only to the extent that origination or acquisitions of new liabilities exceed the run off driven by maturity or termination of existing liabilities, (b) assets that are owned by or related to MidCap FinCo Designated Activity Company (“MidCap”) and managed by Apollo, (c) assets of publicly traded vehicles managed by Apollo such as Apollo Investment Corporation (“AINV”), Apollo Commercial Real Estate Finance, Inc. (“ARI”), Apollo Tactical Income Fund Inc. (“AIF”), and Apollo Senior Floating Rate Fund Inc. (“AFT”), in each case that do not have redemption provisions or a requirement to return capital to investors upon exiting the investments made with such capital, except as required by applicable law, and (d) assets of Apollo Debt Solutions BDC ("ADS"), a non-traded business development company managed by Apollo, and (e) a publicly traded business development company from which
Apollo earns certain investment-related service fees. The investment management agreements of AINV, AIF and AFT have one year terms and the investment management agreement of ADS has an initial term of two years and then is subject to annual renewal. These investment management agreements are reviewed annually and remain in effect only if approved by the boards of directors of such companies or by the affirmative vote of the holders of a majority of the outstanding voting shares of such companies, including in either case, approval by a majority of the directors who are not “interested persons” as defined in the Investment Company Act of 1940, as amended (the “Investment Company Act”). In addition, the investment management agreements of AINV, AIF, AFT and AFTADS may be terminated in certain circumstances upon 60 days’ written notice. The investment management agreement of ARI has a one year term and is reviewed annually by ARI’s board of directors and may be terminated under certain circumstances by an affirmative vote of at least two-thirds of ARI’s independent directors. The investment management or advisory arrangements between each of MidCap and Apollo, Athene and Apollo and Athora and Apollo, may also be terminated under certain circumstances. The agreement pursuant to which Apollo earns certain investment-related service fees from a non-traded business development company may be terminated under certain limited circumstances;
“private equity fund appreciation (depreciation)” refersPrincipal investing compensation” within the Principal Investing segment represents realized performance compensation, distributions related to gain (loss)investment income and income fordividends, and includes allocations of certain compensation expenses related to managing the traditional private equity funds (as defined below), Apollo Natural Resources Partners, L.P. (together with its alternative investment vehicles, “ANRP I”), Apollo Natural Resources Partners II, L.P. (together with its alternative investment vehicles, “ANRP II”), Apollo Natural Resources Partners III, L.P. (together with its parallel vehicles and alternative investment vehicles, “ANRP III”), Apollo Special Situations Fund, L.P., AION Capital Partners Limited (“AION”) and Apollo Hybrid Value Fund, L.P. (together with its parallel funds and alternative investment vehicles, “HVF I”) for the periods presented on a total return basis before giving effect to fees and expenses. The performance percentage is determined by dividing (a) the change in the fair value of investments over the period presented, minus the change in invested capital over the period presented, plus the realized value for the period presented, by (b) the beginning unrealized value for the period presented plus the change in invested capital for the period presented. Returns over multiple periods are calculated by geometrically linking each period’s return over time;business;
“private equity investments” refer to (i) direct or indirect investments in existing and future private equity funds managed or sponsored by Apollo, (ii) direct or indirect co-investments with existing and future private equity funds managed or sponsored by Apollo, (iii) direct or indirect investments in securities which are not immediately capable of resale in a public market that
Apollo identifies but does not pursue through its private equity funds, and (iv) investments of the type described in (i) through (iii) above made by Apollo funds;
“Realized Value” refers to all cash investment proceeds received by the relevant Apollo fund, including interest and dividends, but does not give effect to management fees, expenses, incentive compensation or performance fees to be paid by such Apollo fund;
“Redding Ridge” refers to Redding Ridge Asset Management, LLC and its subsidiaries, which is a standalone, self-managed asset management business established in connection with risk retention rules that manages CLOs and retains the required risk retention interests;
“Remaining Cost” represents the initial investment of the fund in a portfolio investment, reduced for any return of capital distributed to date on such portfolio investment;
“Total Invested Capital” refers to the aggregate cash invested by the relevant Apollo fund and includes capitalized costs relating to investment activities, if any, but does not give effect to cash pending investment or available for reserves and excludes amounts, if any, invested on a financed basis with leverage facilities;
“Total Value” represents the sum of the total Realized Value and Unrealized Value of investments;
“traditional private equity funds” refers to Apollo Investment Fund I, L.P. (“Fund I”), AIF II, L.P. (“Fund II”), a mirrored investment account established to mirror Fund I and Fund II for investments in debt securities (“MIA”), Apollo Investment Fund III, L.P. (together with its parallel funds, “Fund III”), Apollo Investment Fund IV, L.P. (together with its parallel fund, “Fund IV”), Apollo Investment Fund V, L.P. (together with its parallel funds and alternative investment vehicles, “Fund V”), Apollo Investment Fund VI, L.P. (together with its parallel funds and alternative investment vehicles, “Fund VI”), Apollo Investment Fund VII, L.P. (together with its parallel funds and alternative investment vehicles, “Fund VII”), Apollo Investment Fund VIII, L.P. (together with its parallel funds and alternative investment vehicles, “Fund VIII”) and Apollo Investment Fund IX, L.P. (together with its parallel funds and alternative investment vehicles, “Fund IX”);
“Unrealized Value” refers to the fair value consistent with valuations determined in accordance with generally accepted accounting principles in the United States of America (“U.S. GAAP”), for investments not yet realized and may include payments in kind, accrued interest and dividends receivable, if any, and before the effect of certain taxes. In addition, amounts include committed and funded amounts for certain investments; and
“Vintage Year” refers to the year in which a fund’s final capital raise occurred, or, for certain funds, the year of a fund’s effective date or the year in which a fund’s investment period commences pursuant to its governing agreements..
PART I—I - FINANCIAL INFORMATION
ITEM 1. FINANCIAL STATEMENTS
APOLLO GLOBALASSET MANAGEMENT, INC.
CONDENSED CONSOLIDATED STATEMENTS OF FINANCIAL CONDITION (UNAUDITED)
AS OF JUNE 30, 2021MARCH 31, 2022 AND DECEMBER 31, 20202021
(dollars in thousands, except share data)
| | | As of
June 30, 2021 | | As of
December 31, 2020 | | As of
March 31, 2022 | | As of
December 31, 2021 |
| Assets: | Assets: | | | | Assets: | | | |
| Cash and cash equivalents | Cash and cash equivalents | $ | 1,824,712 | | | $ | 1,555,517 | | Cash and cash equivalents | $ | 1,245,606 | | | $ | 917,183 | |
| Restricted cash and cash equivalents | Restricted cash and cash equivalents | 1,524,902 | | | 17,708 | | Restricted cash and cash equivalents | 1,037,673 | | | 707,885 | |
| U.S. Treasury securities, at fair value | 0 | | | 816,985 | | |
| Investments (includes performance allocations of $2,736,493 and $1,624,156 as of June 30, 2021 and December 31, 2020, respectively) | 7,910,519 | | | 4,995,411 | | |
| Investments (includes performance allocations of $3,062,672 and $2,731,733 as of March 31, 2022 and December 31, 2021, respectively) | | Investments (includes performance allocations of $3,062,672 and $2,731,733 as of March 31, 2022 and December 31, 2021, respectively) | 6,970,485 | | | 11,353,580 | |
| Assets of consolidated variable interest entities: | Assets of consolidated variable interest entities: | | Assets of consolidated variable interest entities: | |
| Cash and cash equivalents | Cash and cash equivalents | 805,736 | | | 893,306 | | Cash and cash equivalents | 19,353 | | | 463,266 | |
| Investments, at fair value | Investments, at fair value | 13,659,631 | | | 13,316,016 | | Investments, at fair value | 455,621 | | | 14,737,051 | |
| Other assets | Other assets | 167,989 | | | 290,264 | | Other assets | 11 | | | 251,581 | |
| Incentive fees receivable | 13,802 | | | 5,231 | | |
| Due from related parties | Due from related parties | 425,927 | | | 462,383 | | Due from related parties | 370,434 | | | 493,826 | |
| Deferred tax assets, net | Deferred tax assets, net | 235,118 | | | 539,244 | | Deferred tax assets, net | 673,195 | | | 424,132 | |
| Other assets | Other assets | 494,455 | | | 364,963 | | Other assets | 802,051 | | | 585,901 | |
| Lease assets | Lease assets | 361,597 | | | 295,098 | | Lease assets | 606,961 | | | 450,531 | |
| Goodwill | Goodwill | 116,958 | | | 116,958 | | Goodwill | 130,112 | | | 116,958 | |
| Total Assets | Total Assets | $ | 27,541,346 | | | $ | 23,669,084 | | Total Assets | $ | 12,311,502 | | | $ | 30,501,894 | |
| Liabilities, Redeemable non-controlling interests and Stockholders’ Equity | Liabilities, Redeemable non-controlling interests and Stockholders’ Equity | | | | Liabilities, Redeemable non-controlling interests and Stockholders’ Equity | | | |
| Liabilities: | Liabilities: | | Liabilities: | |
| Accounts payable and accrued expenses | Accounts payable and accrued expenses | $ | 141,688 | | | $ | 119,982 | | Accounts payable and accrued expenses | $ | 138,082 | | | $ | 145,054 | |
| Accrued compensation and benefits | Accrued compensation and benefits | 169,554 | | | 82,343 | | Accrued compensation and benefits | 110,537 | | | 130,107 | |
| Deferred revenue | Deferred revenue | 74,946 | | | 30,369 | | Deferred revenue | 132,079 | | | 119,688 | |
| Due to related parties | Due to related parties | 439,662 | | | 608,469 | | Due to related parties | 1,724,971 | | | 1,222,402 | |
| Profit sharing payable | Profit sharing payable | 1,521,906 | | | 842,677 | | Profit sharing payable | 1,623,854 | | | 1,444,652 | |
| Debt | Debt | 3,154,289 | | | 3,155,221 | | Debt | 2,815,348 | | | 3,134,396 | |
| Liabilities of consolidated variable interest entities: | Liabilities of consolidated variable interest entities: | | Liabilities of consolidated variable interest entities: | |
| Debt, at fair value | Debt, at fair value | 8,077,288 | | | 8,660,515 | | Debt, at fair value | 162 | | | 7,942,508 | |
| Notes payable | Notes payable | 2,498,748 | | | 2,471,971 | | Notes payable | — | | | 2,611,019 | |
| Other liabilities | Other liabilities | 912,439 | | | 773,045 | | Other liabilities | 1,755 | | | 781,482 | |
| Other liabilities | Other liabilities | 511,750 | | | 295,612 | | Other liabilities | 511,807 | | | 500,980 | |
| Lease liabilities | Lease liabilities | 409,930 | | | 332,915 | | Lease liabilities | 671,613 | | | 505,206 | |
| Total Liabilities | Total Liabilities | 17,912,200 | | | 17,373,119 | | Total Liabilities | 7,730,208 | | | 18,537,494 | |
| Commitments and Contingencies (see note 15) | Commitments and Contingencies (see note 15) | 0 | | 0 | Commitments and Contingencies (see note 15) | 0 | | 0 |
| Redeemable non-controlling interests: | Redeemable non-controlling interests: | | Redeemable non-controlling interests: | |
| Redeemable non-controlling interests | Redeemable non-controlling interests | 1,416,711 | | | 782,702 | | Redeemable non-controlling interests | 1,790,014 | | | 1,770,034 | |
| Stockholders’ Equity: | Stockholders’ Equity: | | Stockholders’ Equity: | |
| Apollo Global Management, Inc. Stockholders’ Equity: | | |
| Apollo Asset Management, Inc. Stockholders’ Equity: | | Apollo Asset Management, Inc. Stockholders’ Equity: | |
| | Series A Preferred Stock, 11,000,000 shares issued and outstanding as of June 30, 2021 and December 31, 2020 | 264,398 | | | 264,398 | | |
| Series A Preferred Stock, 11,000,000 shares issued and outstanding as of March 31, 2022 and December 31, 2021 | | Series A Preferred Stock, 11,000,000 shares issued and outstanding as of March 31, 2022 and December 31, 2021 | 264,398 | | | 264,398 | |
| | Series B Preferred Stock, 12,000,000 shares issued and outstanding as of June 30, 2021 and December 31, 2020 | 289,815 | | | 289,815 | | |
| Series B Preferred Stock, 12,000,000 shares issued and outstanding as of March 31, 2022 and December 31, 2021 | | Series B Preferred Stock, 12,000,000 shares issued and outstanding as of March 31, 2022 and December 31, 2021 | 289,815 | | | 289,815 | |
|
| | Class A Common Stock, $0.00001 par value, 90,000,000,000 shares authorized, 231,366,321 and 228,873,449 shares issued and outstanding as of June 30, 2021 and December 31, 2020, respectively | 0 | | | 0 | | |
| Common Stock, $0.00001 par value, 40,000,000 and 0 shares authorized as of March 31, 2022 and December 31, 2021, respectively, 1,000 and 0 shares issued and outstanding as of March 31, 2022 and December 31, 2021, respectively | | Common Stock, $0.00001 par value, 40,000,000 and 0 shares authorized as of March 31, 2022 and December 31, 2021, respectively, 1,000 and 0 shares issued and outstanding as of March 31, 2022 and December 31, 2021, respectively | — | | | — | |
| | Class B Common Stock, $0.00001 par value, 999,999,999 shares authorized, 1 share issued and outstanding as of June 30, 2021 and December 31, 2020 | 0 | | | 0 | | |
| Class C Common Stock, $0.00001 par value, 1 share authorized, 1 share issued and outstanding as of June 30, 2021 and December 31, 2020 | 0 | | | 0 | | |
| Class A Common Stock, $0.00001 par value, 0 and 90,000,000,000 shares authorized as of March 31, 2022 and December 31, 2021, respectively, 0 and 248,896,649 shares issued and outstanding as of March 31, 2022 and December 31, 2021, respectively | | Class A Common Stock, $0.00001 par value, 0 and 90,000,000,000 shares authorized as of March 31, 2022 and December 31, 2021, respectively, 0 and 248,896,649 shares issued and outstanding as of March 31, 2022 and December 31, 2021, respectively | — | | | — | |
| Class B Common Stock, $0.00001 par value, 0 and 999,999,999 shares authorized as of March 31, 2022 and December 31, 2021, respectively, 0 shares issued and outstanding as of March 31, 2022 and December 31, 2021 | | Class B Common Stock, $0.00001 par value, 0 and 999,999,999 shares authorized as of March 31, 2022 and December 31, 2021, respectively, 0 shares issued and outstanding as of March 31, 2022 and December 31, 2021 | — | | | — | |
| Class C Common Stock, $0.00001 par value, 0 and 1 share authorized as of March 31, 2022 and December 31, 2021, respectively, 0 shares issued and outstanding as of March 31, 2022 and December 31, 2021 | | Class C Common Stock, $0.00001 par value, 0 and 1 share authorized as of March 31, 2022 and December 31, 2021, respectively, 0 shares issued and outstanding as of March 31, 2022 and December 31, 2021 | — | | | — | |
| Additional paid in capital | Additional paid in capital | 822,612 | | | 877,173 | | Additional paid in capital | 970,498 | | | 2,096,403 | |
| Retained earnings | Retained earnings | 990,798 | | | 0 | | Retained earnings | — | | | 1,143,899 | |
| Accumulated other comprehensive loss | Accumulated other comprehensive loss | (2,542) | | | (2,071) | | Accumulated other comprehensive loss | (2,527) | | | (5,374) | |
| Total Apollo Global Management, Inc. Stockholders’ Equity | 2,365,081 | | | 1,429,315 | | |
| Total Apollo Asset Management, Inc. Stockholders’ Equity | | Total Apollo Asset Management, Inc. Stockholders’ Equity | 1,522,184 | | | 3,789,141 | |
| Non-Controlling Interests in consolidated entities | Non-Controlling Interests in consolidated entities | 2,838,121 | | | 2,275,728 | | Non-Controlling Interests in consolidated entities | 374,620 | | | 3,813,885 | |
| Non-Controlling Interests in Apollo Operating Group | Non-Controlling Interests in Apollo Operating Group | 3,009,233 | | | 1,808,220 | | Non-Controlling Interests in Apollo Operating Group | 894,476 | | | 2,591,340 | |
| Total Stockholders’ Equity | Total Stockholders’ Equity | 8,212,435 | | | 5,513,263 | | Total Stockholders’ Equity | 2,791,280 | | | 10,194,366 | |
| Total Liabilities, Redeemable non-controlling interests and Stockholders’ Equity | Total Liabilities, Redeemable non-controlling interests and Stockholders’ Equity | $ | 27,541,346 | | | $ | 23,669,084 | | Total Liabilities, Redeemable non-controlling interests and Stockholders’ Equity | $ | 12,311,502 | | | $ | 30,501,894 | |
See accompanying notes to unaudited condensed consolidated financial statements.
APOLLO ASSET MANAGEMENT, INC.
CONDENSED CONSOLIDATED STATEMENTS OF OPERATIONS (UNAUDITED)
FOR THE THREE MONTHS ENDED MARCH 31, 2022 AND 2021
(dollars in thousands, except share data)
| | | | | | | | | | | | |
| For the Three Months Ended
March 31, |
| | 2022 | | 2021 | |
| Revenues: | | | | |
| Management fees | $ | 522,936 | | | $ | 457,185 | | |
| Advisory and transaction fees, net | 65,786 | | | 56,348 | | |
| Investment income | 702,315 | | | 1,777,313 | | |
| Incentive fees | 5,850 | | | 3,854 | | |
| Total Revenues | $ | 1,296,887 | | | $ | 2,294,700 | | |
| Expenses: | | | | |
| Compensation and benefits | 734,105 | | | 886,558 | | |
| Interest expense | 32,993 | | | 34,799 | | |
| General, administrative and other | 140,363 | | | 100,387 | | |
| Total Expenses | $ | 907,461 | | | $ | 1,021,744 | | |
| Other Income: | | | | |
| Net gains from investment activities | 771,262 | | | 353,151 | | |
| Net gains from investment activities of consolidated variable interest entities | 279,455 | | | 112,594 | | |
| Interest income | 2,836 | | | 798 | | |
| Other income (loss), net | (25,183) | | | (17,750) | | |
| Total Other Income | 1,028,370 | | | 448,793 | | |
| Income before income tax provision | 1,417,796 | | | 1,721,749 | | |
| Income tax provision | (134,174) | | | (203,246) | | |
| Net Income | 1,283,622 | | | 1,518,503 | | |
| Net income attributable to Non-Controlling Interests | (686,654) | | | (839,613) | | |
| Net Income Attributable to Apollo Asset Management, Inc. | 596,968 | | | 678,890 | | |
| Series A Preferred share dividends | (4,383) | | | (4,383) | | |
| Series B Preferred share dividends | (4,781) | | | (4,781) | | |
| Net Income Attributable to Apollo Asset Management, Inc. Common Stockholders | $ | 587,804 | | | $ | 669,726 | | |
| | | | |
| | | | |
| | | | |
| | | | |
| | | | |
See accompanying notes to unaudited condensed consolidated financial statements.
APOLLO GLOBALASSET MANAGEMENT, INC.
CONDENSED CONSOLIDATED STATEMENTS OF OPERATIONS (UNAUDITED)
FOR THE THREE AND SIX MONTHS ENDED JUNE 30, 2021 AND 2020
(dollars in thousands, except share data)
| | | | | | | | | | | | | | | | | | | | | | | |
| For the Three Months Ended
June 30, | | For the Six Months Ended
June 30, |
| | 2021 | | 2020 | | 2021 | | 2020 |
| Revenues: | | | | | | | |
| Management fees | $ | 470,092 | | | $ | 409,953 | | | $ | 927,277 | | | $ | 806,557 | |
| Advisory and transaction fees, net | 86,351 | | | 61,957 | | | 142,699 | | | 98,920 | |
| Investment income (loss): | | | | | | | |
| Performance allocations | 735,139 | | | 924,599 | | | 2,130,486 | | | (809,724) | |
| Principal investment income (loss) | 76,425 | | | 111,621 | | | 458,391 | | | (76,228) | |
| Total investment income (loss) | 811,564 | | | 1,036,220 | | | 2,588,877 | | | (885,952) | |
| Incentive fees | 14,318 | | | 205 | | | 18,172 | | | 19,724 | |
| Total Revenues | 1,382,325 | | | 1,508,335 | | | 3,677,025 | | | 39,249 | |
| Expenses: | | | | | | | |
| Compensation and benefits: | | | | | | | |
| Salary, bonus and benefits | 181,299 | | | 151,019 | | | 355,929 | | | 290,288 | |
| Equity-based compensation | 52,998 | | | 59,420 | | | 109,446 | | | 111,542 | |
| Profit sharing expense | 361,247 | | | 375,959 | | | 1,016,727 | | | (260,039) | |
| Total compensation and benefits | 595,544 | | | 586,398 | | | 1,482,102 | | | 141,791 | |
| Interest expense | 34,814 | | | 32,291 | | | 69,613 | | | 63,533 | |
| General, administrative and other | 115,838 | | | 83,729 | | | 215,688 | | | 168,251 | |
| Placement fees | 591 | | | 359 | | | 1,128 | | | 768 | |
| Total Expenses | 746,787 | | | 702,777 | | | 1,768,531 | | | 374,343 | |
| Other Income (Loss): | | | | | | | |
| Net gains (losses) from investment activities | 913,394 | | | 268,667 | | | 1,266,545 | | | (995,884) | |
| Net gains (losses) from investment activities of consolidated variable interest entities | 145,403 | | | 57,862 | | | 257,997 | | | (108,058) | |
| Interest income | 645 | | | 3,994 | | | 1,443 | | | 11,928 | |
| Other income (loss), net | 4,531 | | | 3,327 | | | (13,219) | | | (13,180) | |
| Total Other Income (Loss) | 1,063,973 | | | 333,850 | | | 1,512,766 | | | (1,105,194) | |
| Income (loss) before income tax (provision) benefit | 1,699,511 | | | 1,139,408 | | | 3,421,260 | | | (1,440,288) | |
| Income tax (provision) benefit | (194,051) | | | (140,323) | | | (397,297) | | | 155,530 | |
| Net Income (Loss) | 1,505,460 | | | 999,085 | | | 3,023,963 | | | (1,284,758) | |
| Net (income) loss attributable to Non-Controlling Interests | (847,733) | | | (552,756) | | | (1,687,346) | | | 734,869 | |
Net Income (Loss) Attributable to Apollo Global
Management, Inc. | 657,727 | | | 446,329 | | | 1,336,617 | | | (549,889) | |
| Series A Preferred Stock Dividends | (4,383) | | | (4,383) | | | (8,766) | | | (8,766) | |
| Series B Preferred Stock Dividends | (4,781) | | | (4,782) | | | (9,562) | | | (9,563) | |
Net Income (Loss) Attributable to Apollo Global
Management, Inc. Class A Common Stockholders | $ | 648,563 | | | $ | 437,164 | | | $ | 1,318,289 | | | $ | (568,218) | |
| Net Income (Loss) Per Share of Class A Common Stock: | | | | | | | |
| Net Income (Loss) Available to Class A Common Stock – Basic | $ | 2.70 | | | $ | 1.84 | | | $ | 5.51 | | | $ | (2.55) | |
| Net Income (Loss) Available to Class A Common Stock – Diluted | $ | 2.70 | | | $ | 1.84 | | | $ | 5.51 | | | $ | (2.55) | |
| Weighted Average Number of Shares of Class A Common Stock Outstanding – Basic | 231,058,813 | | | 227,653,988 | | | 230,534,073 | | | 227,205,866 | |
| Weighted Average Number of Shares of Class A Common Stock Outstanding – Diluted | 231,058,813 | | | 227,653,988 | | | 230,534,073 | | | 227,205,866 | |
See accompanying notes to condensed consolidated financial statements.
APOLLO GLOBAL MANAGEMENT, INC.
CONDENSED CONSOLIDATED STATEMENTS OF
COMPREHENSIVE INCOME (LOSS) (UNAUDITED)
FOR THE THREE AND SIX MONTHS ENDED JUNE 30,MARCH 31, 2022 AND 2021 AND 2020
(dollars in thousands, except share data)
| | | | | | | | | | | | | | | | | | | | | | | |
| For the Three Months Ended
June 30, | | For the Six Months Ended
June 30, |
| 2021 | | 2020 | | 2021 | | 2020 |
| Net Income (Loss) | $ | 1,505,460 | | | $ | 999,085 | | | $ | 3,023,963 | | | $ | (1,284,758) | |
| Other Comprehensive Income (Loss), net of tax: | | | | | | | |
| Currency translation adjustments, net of tax | 3,711 | | | 6,943 | | | (11,436) | | | 1,128 | |
| Net gain from change in fair value of cash flow hedge instruments | 52 | | | 50 | | | 102 | | | 101 | |
| Net gain (loss) on available-for-sale securities | (148) | | | 3,552 | | | 670 | | | (1,348) | |
| Total Other Comprehensive Income (Loss), net of tax | 3,615 | | | 10,545 | | | (10,664) | | | (119) | |
| Comprehensive Income (Loss) | 1,509,075 | | | 1,009,630 | | | 3,013,299 | | | (1,284,877) | |
| Comprehensive (Income) Loss attributable to Non-Controlling Interests | (851,304) | | | (558,979) | | | (1,677,153) | | | 735,687 | |
| Comprehensive Income (Loss) Attributable to Apollo Global Management, Inc. | $ | 657,771 | | | $ | 450,651 | | | $ | 1,336,146 | | | $ | (549,190) | |
| | | | | | | | | | | | |
| For the Three Months Ended
March 31, |
| 2022 | | 2021 | |
| Net Income | $ | 1,283,622 | | | $ | 1,518,503 | | |
| Other Comprehensive Income (Loss), net of tax: | | | | |
| Currency translation adjustments, net of tax | (5,810) | | | (15,147) | | |
| Net gain from change in fair value of cash flow hedge instruments | 1,976 | | | 50 | | |
| Net gain (loss) on available-for-sale securities | (681) | | | 818 | | |
| Total Other Comprehensive Loss, net of tax | (4,515) | | | (14,279) | | |
| Comprehensive Income | 1,279,107 | | | 1,504,224 | | |
| Comprehensive Income attributable to Non-Controlling Interests | (679,292) | | | (825,849) | | |
| Comprehensive Income Attributable to Apollo Asset Management, Inc. | $ | 599,815 | | | $ | 678,375 | | |
See accompanying notes to unaudited condensed consolidated financial statements.
APOLLO ASSET MANAGEMENT, INC.
CONDENSED CONSOLIDATED STATEMENTS OF CHANGES
IN STOCKHOLDERS’ EQUITY (UNAUDITED)
FOR THE THREE MONTHS ENDED MARCH 31, 2022 AND 2021
(dollars in thousands, except share data)
| | | | | | | | | | | | | | | | | | | | | | | | | | | | | | | | | | | | | | | | | | | | | | | | | | | | | | | | | | | | | | | | | | | | | | | | | |
| | Apollo Asset Management, Inc. Stockholders | | | | | | | | |
| | Class A Common Stock | | Class B Common Stock | | Class C Common Stock | | Series A Preferred Stock | | Series B Preferred Stock | | Additional
Paid in
Capital | | Retained Earnings | | | | Accumulated
Other
Comprehensive Loss | | Total Apollo
Asset
Management,
Inc.
Stockholders’
Equity | | Non-
Controlling
Interests in
Consolidated
Entities | | Non-
Controlling
Interests in
Apollo
Operating
Group | | Total Stockholders’ Equity |
| | | | | | | | | | | | | | | | | | | | | | | | | |
| Balance at January 1, 2021 | 228,873,449 | | | 1 | | | 1 | | | $ | 264,398 | | | $ | 289,815 | | | $ | 877,173 | | | $ | — | | | | | $ | (2,071) | | | $ | 1,429,315 | | | $ | 2,275,728 | | | $ | 1,808,220 | | | $ | 5,513,263 | |
| Accretion of redeemable non-controlling interests | — | | | — | | | — | | | — | | | — | | | (26,662) | | | — | | | | | — | | | (26,662) | | | — | | | — | | | (26,662) | |
| Dilution impact of issuance of Class A Common Stock | — | | | — | | | — | | | — | | | — | | | (1,257) | | | — | | | | | — | | | (1,257) | | | — | | | — | | | (1,257) | |
| Capital increase related to equity-based compensation | — | | | — | | | — | | | — | | | — | | | 45,283 | | | — | | | | | — | | | 45,283 | | | — | | | — | | | 45,283 | |
| Capital contributions | — | | | — | | | — | | | — | | | — | | | — | | | — | | | | | — | | | — | | | 820,983 | | | — | | | 820,983 | |
| Dividends/ Distributions | — | | | — | | | — | | | (4,383) | | | (4,781) | | | — | | | (144,282) | | | | | — | | | (153,446) | | | (39,483) | | | (121,400) | | | (314,329) | |
| Payments related to issuances of Class A Common Stock for equity-based awards | 1,419,608 | | | — | | | — | | | — | | | — | | | — | | | (48,101) | | | | | — | | | (48,101) | | | — | | | — | | | (48,101) | |
| | | | | | | | | | | | | | | | | | | | | | | | | |
| Exchange of AOG Units for Class A Common Stock | 1,929,515 | | | — | | | — | | | — | | | — | | | 13,658 | | | — | | | | | — | | | 13,658 | | | — | | | (8,921) | | | 4,737 | |
| Net income | — | | | — | | | — | | | 4,383 | | | 4,781 | | | — | | | 669,726 | | | | | — | | | 678,890 | | | 70,578 | | | 769,035 | | | 1,518,503 | |
| Currency translation adjustments, net of tax | — | | | — | | | — | | | — | | | — | | | — | | | — | | | | | (1,033) | | | (1,033) | | | (13,001) | | | (1,113) | | | (15,147) | |
| Net gain from change in fair value of cash flow hedge instruments | — | | | — | | | — | | | — | | | — | | | — | | | — | | | | | 27 | | | 27 | | | — | | | 23 | | | 50 | |
| Net income on available-for-sale securities | — | | | — | | | — | | | — | | | — | | | — | | | — | | | | | 491 | | | 491 | | | — | | | 327 | | | 818 | |
| Balance at March 31, 2021 | 232,222,572 | | | 1 | | | 1 | | | $ | 264,398 | | | $ | 289,815 | | | $ | 908,195 | | | $ | 477,343 | | | | | $ | (2,586) | | | $ | 1,937,165 | | | $ | 3,114,805 | | | $ | 2,446,171 | | | $ | 7,498,141 | |
| | | | | | | | | | | | | | | | | | | | | | | | | | | | | | | | | | | | | | | | | | | | | | | | | | | | | | | | | | | | | | | | | |
| | Apollo Asset Management, Inc. Stockholders | | | | | | | | |
| | Common Stock | | | | | | Series A Preferred Stock | | Series B Preferred Stock | | Additional
Paid in
Capital | | Retained Earnings | | | | Accumulated
Other
Comprehensive Loss | | Total Apollo
Asset
Management,
Inc.
Stockholders’
Equity | | Non-
Controlling
Interests in
Consolidated
Entities | | Non-
Controlling
Interests in
Apollo
Operating
Group | | Total
Stockholders’
Equity |
| Balance at January 1, 2022 | 248,896,649 | | | | | | | $ | 264,398 | | | $ | 289,815 | | | $ | 2,096,403 | | | $ | 1,143,899 | | | | | $ | (5,374) | | | $ | 3,789,141 | | | $ | 3,813,885 | | | $ | 2,591,340 | | | $ | 10,194,366 | |
| Reverse stock split | (248,895,649) | | | | | | | — | | | — | | | — | | | — | | | | | — | | | — | | | — | | | — | | | — | |
| | | | | | | | | | | | | | | | | | | | | | | | | |
| Deconsolidation of VIEs | — | | | | | | | — | | | — | | | — | | | | | | | — | | | — | | | (4,607,867) | | | — | | | (4,607,867) | |
| Accretion of redeemable non-controlling interests | — | | | | | | | — | | | — | | | (19,980) | | | — | | | | | — | | | (19,980) | | | — | | | — | | | (19,980) | |
| | | | | | | | | | | | | | | | | | | | | | | | | |
| | | | | | | | | | | | | | | | | | | | | | | | | |
| | | | | | | | | | | | | | | | | | | | | | | | | |
| | | | | | | | | | | | | | | | | | | | | | | | | |
| | | | | | | | | | | | | | | | | | | | | | | | | |
| | | | | | | | | | | | | | | | | | | | | | | | | |
| | | | | | | | | | | | | | | | | | | | | | | | | |
| Contributions | — | | | | | | | — | | | — | | | 328,628 | | | — | | | | | — | | | 328,628 | | | 1,427,248 | | | — | | | 1,755,876 | |
| Dividends/ Distributions | — | | | | | | | (4,383) | | | (4,781) | | | (1,434,553) | | | (1,731,703) | | | | | — | | | (3,175,420) | | | (460,731) | | | (2,174,071) | | | (5,810,222) | |
| | | | | | | | | | | | | | | | | | | | | | | | | |
| | | | | | | | | | | | | | | | | | | | | | | | | |
| | | | | | | | | | | | | | | | | | | | | | | | | |
| Net income | — | | | | | | | 4,383 | | | 4,781 | | | — | | | 587,804 | | | | | — | | | 596,968 | | | 210,109 | | | 476,545 | | | 1,283,622 | |
| Currency translation adjustments, net of tax | — | | | | | | | — | | | — | | | — | | | — | | | | | 2,646 | | | 2,646 | | | (8,024) | | | (432) | | | (5,810) | |
| Net gain from change in fair value of cash flow hedge instruments | — | | | | | | | — | | | — | | | — | | | — | | | | | 882 | | | 882 | | | — | | | 1,094 | | | 1,976 | |
| Net loss on available-for-sale securities | — | | | | | | | — | | | — | | | — | | | — | | | | | (681) | | | (681) | | | — | | | — | | | (681) | |
| Balance at March 31, 2022 | 1,000 | | | | | | | $ | 264,398 | | | $ | 289,815 | | | $ | 970,498 | | | $ | — | | | | | $ | (2,527) | | | $ | 1,522,184 | | | $ | 374,620 | | | $ | 894,476 | | | $ | 2,791,280 | |
See accompanying notes to unaudited condensed consolidated financial statements.
APOLLO GLOBALASSET MANAGEMENT, INC.
CONDENSED CONSOLIDATED STATEMENTS OF CHANGES
IN STOCKHOLDERS’ EQUITYCASH FLOWS (UNAUDITED)
FOR THE THREE AND SIX MONTHS ENDED JUNE 30,MARCH 31, 2022 AND 2021 AND 2020
(dollars in thousands, except share data)
| | | | | | | | | | | | | | | | | | | | | | | | | | | | | | | | | | | | | | | | | | | | | | | | | | | | | | | | | | | | | | | | | | | | | | | | | |
| | Apollo Global Management, Inc. Stockholders | | | | | | | | |
| | Class A Common Stock | | Class B Common Stock | | Class C Common Stock | | Series A Preferred Stock | | Series B Preferred Stock | | Additional
Paid in
Capital | | Accumulated Deficit | | | | Accumulated
Other
Comprehensive Loss | | Total Apollo
Global
Management,
Inc.
Shareholders’
Equity | | Non-
Controlling
Interests in
Consolidated
Entities | | Non-
Controlling
Interests in
Apollo
Operating
Group | | Total Stockholders’ Equity |
| Balance at April 1, 2020 | 228,834,099 | | | 1 | | | 1 | | | $ | 264,398 | | | $ | 289,815 | | | $ | 1,085,949 | | | $ | (1,075,323) | | | | | $ | (8,201) | | | $ | 556,638 | | | $ | 2,122,281 | | | $ | 820,115 | | | $ | 3,499,034 | |
| | | | | | | | | | | | | | | | | | | | | | | | | |
| | | | | | | | | | | | | | | | | | | | | | | | | |
| Dilution impact of issuance of Class A Common Stock | — | | | — | | | — | | | — | | | — | | | 126 | | | — | | | | | — | | | 126 | | | — | | | — | | | 126 | |
| Capital increase related to equity-based compensation | — | | | — | | | — | | | — | | | — | | | 47,539 | | | — | | | | | — | | | 47,539 | | | — | | | — | | | 47,539 | |
| Capital contributions | — | | | — | | | — | | | — | | | — | | | — | | | — | | | | | — | | | — | | | 38,826 | | | — | | | 38,826 | |
| Dividends/ Distributions | — | | | — | | | — | | | (4,383) | | | (4,782) | | | (99,789) | | | 0 | | | | | — | | | (108,954) | | | (98,633) | | | (128,662) | | | (336,249) | |
| Payments related to issuances of Class A Common Stock for equity-based awards | 355,616 | | | — | | | — | | | — | | | — | | | (1,383) | | | (15,586) | | | | | — | | | (16,969) | | | — | | | — | | | (16,969) | |
| | | | | | | | | | | | | | | | | | | | | | | | | |
| | | | | | | | | | | | | | | | | | | | | | | | | |
| Net income (loss) | — | | | — | | | — | | | 4,383 | | | 4,782 | | | — | | | 437,164 | | | | | — | | | 446,329 | | | 41,068 | | | 511,688 | | | 999,085 | |
| Currency translation adjustments, net of tax | — | | | — | | | — | | | — | | | — | | | — | | | — | | | | | 2,178 | | | 2,178 | | | 4,328 | | | 437 | | | 6,943 | |
| Net gain from change in fair value of cash flow hedge instruments | — | | | — | | | — | | | — | | | — | | | — | | | — | | | | | 26 | | | 26 | | | — | | | 24 | | | 50 | |
| Net income on available-for-sale securities | — | | | — | | | — | | | — | | | — | | | — | | | — | | | | | 2,118 | | | 2,118 | | | — | | | 1,434 | | | 3,552 | |
| Balance at June 30, 2020 | 229,189,715 | | | 1 | | | 1 | | | $ | 264,398 | | | $ | 289,815 | | | $ | 1,032,442 | | | $ | (653,745) | | | | | $ | (3,879) | | | $ | 929,031 | | | $ | 2,107,870 | | | $ | 1,205,036 | | | $ | 4,241,937 | |
| | | | | | | | | | | | | | | | | | | | | | | | | |
| Balance at January 1, 2020 | 222,994,407 | | | 1 | | | 1 | | | $ | 264,398 | | | $ | 289,815 | | | $ | 1,302,587 | | | $ | 0 | | | | | $ | (4,578) | | | $ | 1,852,222 | | | $ | 281,904 | | | $ | 904,001 | | | $ | 3,038,127 | |
| Equity transaction with Athene Holding | — | | | — | | | — | | | — | | | — | | | (54,868) | | | — | | | | | — | | | (54,868) | | | — | | | 1,214,577 | | | 1,159,709 | |
| Consolidation of VIEs | — | | | — | | | — | | | — | | | — | | | — | | | — | | | | | — | | | — | | | 1,895,095 | | | — | | | 1,895,095 | |
| Dilution impact of issuance of Class A Common Stock | — | | | — | | | — | | | — | | | — | | | 8,329 | | | — | | | | | — | | | 8,329 | | | — | | | — | | | 8,329 | |
| Capital increase related to equity-based compensation | — | | | — | | | — | | | — | | | — | | | 93,230 | | | — | | | | | — | | | 93,230 | | | — | | | — | | | 93,230 | |
| Capital contributions | — | | | — | | | — | | | — | | | — | | | — | | | — | | | | | — | | | — | | | 181,853 | | | — | | | 181,853 | |
| Dividends/ Distributions | — | | | — | | | — | | | (8,766) | | | (9,563) | | | (312,638) | | | — | | | | | — | | | (330,967) | | | (127,570) | | | (284,300) | | | (742,837) | |
| Payments related to issuances of Class A Common Stock for equity-based awards | 3,151,903 | | | — | | | — | | | — | | | — | | | 28,991 | | | (85,527) | | | | | — | | | (56,536) | | | — | | | — | | | (56,536) | |
| Repurchase of Class A Common Stock | (2,194,095) | | | — | | | — | | | — | | | — | | | (64,205) | | | — | | | | | — | | | (64,205) | | | — | | | — | | | (64,205) | |
| Exchange of AOG Units for Class A Common Stock | 5,237,500 | | | — | | | — | | | — | | | — | | | 31,016 | | | — | | | | | — | | | 31,016 | | | — | | | (16,967) | | | 14,049 | |
| Net income (loss) | — | | | — | | | — | | | 8,766 | | | 9,563 | | | — | | | (568,218) | | | | | — | | | (549,889) | | | (123,341) | | | (611,528) | | | (1,284,758) | |
| Currency translation adjustments, net of tax | — | | | — | | | — | | | — | | | — | | | — | | | — | | | | | 1,381 | | | 1,381 | | | (71) | | | (182) | | | 1,128 | |
| Net gain from change in fair value of cash flow hedge instruments | — | | | — | | | — | | | — | | | — | | | — | | | — | | | | | 54 | | | 54 | | | — | | | 47 | | | 101 | |
| Net loss on available-for-sale securities | — | | | — | | | — | | | — | | | — | | | — | | | — | | | | | (736) | | | (736) | | | — | | | (612) | | | (1,348) | |
| Balance at June 30, 2020 | 229,189,715 | | | 1 | | | 1 | | | $ | 264,398 | | | $ | 289,815 | | | $ | 1,032,442 | | | $ | (653,745) | | | | | $ | (3,879) | | | $ | 929,031 | | | $ | 2,107,870 | | | $ | 1,205,036 | | | $ | 4,241,937 | |
| | | | | | | | | | | | | | |
| For the Three Months Ended
March 31, |
| 2022 | | 2021 | | | |
| Cash Flows from Operating Activities: | | | | | | |
| Net income | $ | 1,283,622 | | | $ | 1,518,503 | | | | |
| Adjustments to reconcile net income to net cash provided by (used in) operating activities: | | | | | | |
| Equity-based compensation | 156,288 | | | 56,448 | | | | |
| Depreciation and amortization | 7,891 | | | 6,052 | | | | |
| Unrealized (gains) losses from investment activities | 13,236 | | | (342,379) | | | | |
| Principal investment income | (158,136) | | | (381,966) | | | | |
| Performance allocations | (544,179) | | | (1,395,347) | | | | |
| Change in fair value of contingent obligations | (2,742) | | | 5,756 | | | | |
| (Gain) loss from change in tax receivable agreement liability | 14,184 | | | (1,941) | | | | |
| Deferred taxes, net | (249,068) | | | 187,293 | | | | |
| | | | | | |
| Non-cash lease expense | 9,978 | | | 8,122 | | | | |
| | | | | | |
| Other non-cash amounts included in net income (loss), net | (4,541) | | | (7,191) | | | | |
| Cash flows due to changes in operating assets and liabilities: | | | | | | |
| | | | | | |
| Due from related parties | 670,506 | | | 30,468 | | | | |
| Accounts payable and accrued expenses | (6,972) | | | 10,709 | | | | |
| Accrued compensation and benefits | (21,903) | | | 13,908 | | | | |
| Deferred revenue | 12,123 | | | 95,663 | | | | |
| Due to related parties | 476,160 | | | (888) | | | | |
| Profit sharing payable | 194,646 | | | 502,539 | | | | |
| Lease liability | — | | | (5,194) | | | | |
| Other assets and other liabilities, net | (553,130) | | | (3,518) | | | | |
| Earnings from principal investments | 234,726 | | | 25,959 | | | | |
| Earnings from performance allocations | 252,369 | | | 247,554 | | | | |
| Satisfaction of contingent obligations | (12,701) | | | (12,322) | | | | |
| Apollo Funds and VIE related: | | | | | | |
| Net realized and unrealized gains from investing activities and debt | (101,449) | | | (292,917) | | | | |
| | | | | | |
| Deconsolidation of VIEs | (743,582) | | | — | | | | |
| Purchases of investments | (2,666,619) | | | (1,617,959) | | | | |
| Proceeds from sale of investments | 1,490,289 | | | 620,345 | | | | |
| Changes in other assets and other liabilities, net | (51,466) | | | 503,552 | | | | |
| Net Cash Provided by (Used in) Operating Activities | $ | (300,470) | | | $ | (228,751) | | | | |
| Cash Flows from Investing Activities: | | | | | | |
| Purchases of fixed assets | $ | (43,542) | | | $ | (5,504) | | | | |
| | | | | | |
| Proceeds from sale of investments | 2,694 | | | — | | | | |
| Purchase of investments | (119,169) | | | — | | | | |
| Purchase of U.S. Treasury securities | (699,184) | | | — | | | | |
| Proceeds from maturities of U.S. Treasury securities | 299,763 | | | — | | | | |
| Cash contributions to principal investments | (125,201) | | | (30,646) | | | | |
| Cash distributions from principal investments | 12,454 | | | 56,006 | | | | |
| Issuance of related party loans | (1,143,756) | | | — | | | | |
| Repayment of related party loans | 580,958 | | | — | | | | |
| Other investing activities | (1,338) | | | (725) | | | | |
| Apollo Funds and VIE related: | | | | | | |
| Purchase of U.S. Treasury securities | (817,371) | | | (817,077) | | | | |
| Proceeds from maturities of U.S. Treasury | 1,162,166 | | | 816,809 | | | | |
| Net Cash Provided by (Used in) Investing Activities | $ | (891,526) | | | $ | 18,863 | | | | |
| | | | | | |
| | | | | | | | | | | | | | | | | | | | | | | | | | | | | | | | | | | | | | | | | | | | | | | | | | | | | | | | | | | | | | | | | | | | | | | | | |
| | Apollo Global Management, Inc. Stockholders | | | | | | | | |
| | Class A Common Stock | | Class B Common Stock | | Class C Common Stock | | Series A Preferred Stock | | Series B Preferred Stock | | Additional
Paid in
Capital | | Retained Earnings | | | | Accumulated
Other
Comprehensive Loss | | Total Apollo
Global
Management,
Inc.
Shareholders’
Equity | | Non-
Controlling
Interests in
Consolidated
Entities | | Non-
Controlling
Interests in
Apollo
Operating
Group | | Total
Stockholders’
Equity |
| Balance at April 1, 2021 | 232,222,572 | | | 1 | | | 1 | | | $ | 264,398 | | | $ | 289,815 | | | $ | 908,195 | | | $ | 477,343 | | | | | $ | (2,586) | | | $ | 1,937,165 | | | $ | 3,114,805 | | | $ | 2,446,171 | | | $ | 7,498,141 | |
| | | | | | | | | | | | | | | | | | | | | | | | | |
| Deconsolidation of VIEs | — | | | — | | | — | | | — | | | — | | | — | | | — | | | | | — | | | — | | | (125,215) | | | — | | | (125,215) | |
| Accretion of redeemable non-controlling interests | — | | | — | | | — | | | — | | | — | | | (15,981) | | | — | | | | | — | | | (15,981) | | | — | | | — | | | (15,981) | |
| | | | | | | | | | | | | | | | | | | | | | | | | |
| Dilution impact of issuance of Class A Common Stock | — | | | — | | | — | | | — | | | — | | | (38) | | | — | | | | | — | | | (38) | | | — | | | — | | | (38) | |
| | | | | | | | | | | | | | | | | | | | | | | | | |
| Capital increase related to equity-based compensation | — | | | — | | | — | | | — | | | — | | | 40,975 | | | — | | | | | — | | | 40,975 | | | — | | | — | | | 40,975 | |
| Capital contributions | — | | | — | | | — | | | — | | | — | | | — | | | — | | | | | — | | | — | | | 191,435 | | | — | | | 191,435 | |
| Dividends/ Distributions | — | | | — | | | — | | | (4,383) | | | (4,781) | | | 0 | | | (119,536) | | | | | — | | | (128,700) | | | (462,485) | | | (162,224) | | | (753,409) | |
| Payments related to issuances of Class A Common Stock for equity-based awards | 397,782 | | | — | | | — | | | — | | | — | | | 3,214 | | | (15,572) | | | | | — | | | (12,358) | | | — | | | — | | | (12,358) | |
| Repurchase of Class A Common Stock | (2,144,713) | | | — | | | — | | | — | | | — | | | (122,703) | | | — | | | | | — | | | (122,703) | | | — | | | — | | | (122,703) | |
| Exchange of AOG Units for Class A Common Stock | 890,680 | | | — | | | — | | | — | | | — | | | 8,950 | | | 0 | | | | | — | | | 8,950 | | | — | | | (6,437) | | | 2,513 | |
| Net income | — | | | — | | | — | | | 4,383 | | | 4,781 | | | — | | | 648,563 | | | | | — | | | 657,727 | | | 116,276 | | | 731,457 | | | 1,505,460 | |
| Currency translation adjustments, net of tax | — | | | — | | | — | | | — | | | — | | | — | | | — | | | | | 105 | | | 105 | | | 3,305 | | | 301 | | | 3,711 | |
| Net gain from change in fair value of cash flow hedge instruments | — | | | — | | | — | | | — | | | — | | | — | | | — | | | | | 28 | | | 28 | | | — | | | 24 | | | 52 | |
| Net loss on available-for-sale securities | — | | | — | | | — | | | — | | | — | | | — | | | — | | | | | (89) | | | (89) | | | — | | | (59) | | | (148) | |
| Balance at June 30, 2021 | 231,366,321 | | | 1 | | | 1 | | | $ | 264,398 | | | $ | 289,815 | | | $ | 822,612 | | | $ | 990,798 | | | | | $ | (2,542) | | | $ | 2,365,081 | | | $ | 2,838,121 | | | $ | 3,009,233 | | | $ | 8,212,435 | |
| Balance at January 1, 2021 | 228,873,449 | | | 1 | | | 1 | | | $ | 264,398 | | | $ | 289,815 | | | $ | 877,173 | | | $ | 0 | | | | | $ | (2,071) | | | $ | 1,429,315 | | | $ | 2,275,728 | | | $ | 1,808,220 | | | $ | 5,513,263 | |
| | | | | | | | | | | | | | | | | | | | | | | | | |
| Deconsolidation of VIEs | — | | | — | | | — | | | — | | | — | | | — | | | — | | | | | — | | | — | | | (125,215) | | | — | | | (125,215) | |
| Accretion of redeemable non-controlling interests | — | | | — | | | — | | | — | | | — | | | (42,643) | | | — | | | | | — | | | (42,643) | | | — | | | — | | | (42,643) | |
| | | | | | | | | | | | | | | | | | | | | | | | | |
| Dilution impact of issuance of Class A Common Stock | — | | | — | | | — | | | — | | | — | | | (1,295) | | | — | | | | | — | | | (1,295) | | | — | | | — | | | (1,295) | |
| | | | | | | | | | | | | | | | | | | | | | | | | |
| Capital increase related to equity-based compensation | — | | | — | | | — | | | — | | | — | | | 86,258 | | | — | | | | | — | | | 86,258 | | | — | | | — | | | 86,258 | |
| Capital contributions | — | | | — | | | — | | | — | | | — | | | — | | | — | | | | | — | | | — | | | 1,012,418 | | | — | | | 1,012,418 | |
| Dividends/ Distributions | — | | | — | | | — | | | (8,766) | | | (9,562) | | | — | | | (263,818) | | | | | — | | | (282,146) | | | (501,968) | | | (283,624) | | | (1,067,738) | |
| Payments related to issuances of Class A Common Stock for equity-based awards | 1,817,390 | | | — | | | — | | | — | | | — | | | 3,214 | | | (63,673) | | | | | — | | | (60,459) | | | — | | | — | | | (60,459) | |
| Repurchase of Class A Common Stock | (2,144,713) | | | — | | | — | | | — | | | — | | | (122,703) | | | — | | | | | — | | | (122,703) | | | — | | | — | | | (122,703) | |
| Exchange of AOG Units for Class A Common Stock | 2,820,195 | | | — | | | — | | | — | | | — | | | 22,608 | | | — | | | | | — | | | 22,608 | | | — | | | (15,358) | | | 7,250 | |
| Net income | — | | | — | | | — | | | 8,766 | | | 9,562 | | | — | | | 1,318,289 | | | | | — | | | 1,336,617 | | | 186,854 | | | 1,500,492 | | | 3,023,963 | |
| Currency translation adjustments, net of tax | — | | | — | | | — | | | — | | | — | | | — | | | — | | | | | (928) | | | (928) | | | (9,696) | | | (812) | | | (11,436) | |
| Net gain from change in fair value of cash flow hedge instruments | — | | | — | | | — | | | — | | | — | | | — | | | — | | | | | 55 | | | 55 | | | — | | | 47 | | | 102 | |
| Net income on available-for-sale securities | — | | | — | | | — | | | — | | | — | | | — | | | — | | | | | 402 | | | 402 | | | — | | | 268 | | | 670 | |
| Balance at June 30, 2021 | 231,366,321 | | | 1 | | | 1 | | | $ | 264,398 | | | $ | 289,815 | | | $ | 822,612 | | | $ | 990,798 | | | | | $ | (2,542) | | | $ | 2,365,081 | | | $ | 2,838,121 | | | $ | 3,009,233 | | | $ | 8,212,435 | |
| | | | | | | | | | | | | | |
| Cash Flows from Financing Activities: | | | | | | |
| | | | | | |
| | | | | | |
| Dividends to Preferred Stockholders | (9,164) | | | (9,164) | | | | |
| | | | | | |
| | | | | | |
| Distributions related to AGM’s repurchase of Common Stock | (226,431) | | | — | | | | |
| Distributions related to deliveries of AGM’s Common Stock for RSUs | (138,043) | | | (48,101) | | | | |
| Dividends paid | (229,230) | | | (144,282) | | | | |
| Distributions paid to Non-Controlling Interests in Apollo Operating Group | — | | | (121,400) | | | | |
| | | | | | |
| | | | | | |
| | | | | | |
| Other financing activities, net | (1,956) | | | (1,186) | | | | |
| Apollo Funds and VIE related: | | | | | | |
| Issuance of debt | 1,689,011 | | | 256,586 | | | | |
| Principal repayment of debt | (646,366) | | | (200,456) | | | | |
| | | | | | |
| | | | | | |
| Distributions paid to Non-Controlling Interests in consolidated entities | (458,605) | | | (38,716) | | | | |
| Contributions from Non-Controlling Interests in consolidated entities | 1,427,078 | | | 821,402 | | | | |
| Proceeds from issuance of Class A Units of a SPAC | — | | | 690,000 | | | | |
| | | | | | |
| Payment of underwriting discounts | — | | | (27,730) | | | | |
| | | | | | |
| Net Cash Provided by (Used in) Financing Activities | $ | 1,406,294 | | | $ | 1,176,953 | | | | |
| Net Increase in Cash and Cash Equivalents, Restricted Cash and Cash Equivalents, and Cash and Cash Equivalents Held at Consolidated Funds and VIEs | 214,298 | | | 967,065 | | | | |
| Cash and Cash Equivalents, Restricted Cash and Cash Equivalents, and Cash and Cash Equivalents Held at Consolidated Funds and VIEs, Beginning of Period | 2,088,334 | | | 2,466,531 | | | | |
| Cash and Cash Equivalents, Restricted Cash and Cash Equivalents, and Cash and Cash Equivalents Held at Consolidated Funds and VIEs, End of Period | $ | 2,302,632 | | | $ | 3,433,596 | | | | |
| Supplemental Disclosure of Cash Flow Information: | | | | | | |
| Interest paid | $ | 24,246 | | | $ | 28,209 | | | | |
| Interest paid by consolidated variable interest entities | 170,479 | | | 66,551 | | | | |
| Income taxes paid | 16,071 | | | 7,125 | | | | |
| Supplemental Disclosure of Non-Cash Investing Activities: | | | | | | |
| | | | | | |
| Non-cash distributions from principal investments | $ | 93,420 | | | $ | (2,229) | | | | |
| | | | | | |
| Change in accrual for purchase of fixed assets | (44) | | | — | | | | |
| | | | | | |
| | | | | | |
| Non-cash strategic transactions | 21,086 | | | — | | | | |
| | | | | | |
| | | | | | |
| | | | | | |
| Supplemental Disclosure of Non-Cash Financing Activities: | | | | | | |
| Capital increases related to equity-based compensation | $ | 130,302 | | | $ | 45,283 | | | | |
| Issuance of restricted shares | 27,872 | | | — | | | | |
| | | | | | |
| | | | | | |
| | | | | | |
| | | | | | |
| Other non-cash financing activities | (681) | | | (1,257) | | | | |
| | | | | | |
| | | | | | |
| | | | | | |
| | | | | | |
| | | | | | |
| | | | | | |
| Net Assets Deconsolidated from Consolidated Variable Interest Entities and Funds: | | | | | | |
| | | | | | |
| Investments, at fair value | (16,170,171) | | | — | | | | |
| Other assets | (184,098) | | | — | | | | |
| Debt at Fair Value | 9,350,378 | | | — | | | | |
| Notes payable | 2,611,019 | | | — | | | | |
| Other liabilities | 528,587 | | | — | | | | |
| Non-Controlling interest in consolidated entities | 4,607,867 | | | — | | | | |
| Adjustments related to exchange of Apollo Operating Group units: | | | | | | |
| Deferred tax assets | $ | — | | | $ | 30,295 | | | | |
| Due to related parties | — | | | (25,558) | | | | |
| Additional paid in capital | — | | | (4,737) | | | | |
| Non-Controlling Interest in Apollo Operating Group | — | | | 8,921 | | | | |
| | | | | | |
| Reconciliation of Cash and Cash Equivalents, Restricted Cash and Cash Equivalents, and Cash and Cash Equivalents Held at Consolidated Variable Interest Entities to the Consolidated Statements of Financial Condition: | | | | | | |
| Cash and cash equivalents | $ | 1,245,606 | | | $ | 1,717,996 | | | | |
| Restricted cash and cash equivalents | 1,037,673 | | | 707,714 | | | | |
| Cash and cash equivalents held at consolidated variable interest entities | 19,353 | | | 1,007,886 | | | | |
| Total Cash and Cash Equivalents, Restricted Cash and Cash Equivalents, and Cash and Cash Equivalents Held at Consolidated Variable Interest Entities | $ | 2,302,632 | | | $ | 3,433,596 | | | | |
See accompanying notes to unaudited condensed consolidated financial statements.
APOLLO GLOBAL MANAGEMENT, INC.
CONDENSED CONSOLIDATED STATEMENTS OF CASH FLOWS (UNAUDITED)
FOR THE SIX MONTHS ENDED JUNE 30, 2021 AND 2020
(dollars in thousands, except share data)
| | | | | | | | | | | | | |
| For the Six Months Ended
June 30, |
| 2021 | | 2020 | | |
| Cash Flows from Operating Activities: | | | | | |
| Net income (loss) | $ | 3,023,963 | | | $ | (1,284,758) | | | |
| Adjustments to reconcile net income (loss) to net cash provided by operating activities: | | | | | |
| Equity-based compensation | 109,446 | | | 111,542 | | | |
| Depreciation and amortization | 13,030 | | | 8,549 | | | |
| Unrealized (gains) losses from investment activities | (1,257,530) | | | 994,434 | | | |
| Principal investment (income) loss | (458,391) | | | 76,228 | | | |
| Performance allocations | (2,130,486) | | | 809,724 | | | |
| Change in fair value of contingent obligations | 22,310 | | | (547) | | | |
| Gain from change in tax receivable agreement liability | (1,941) | | | 0 | | | |
| Deferred taxes, net | 348,318 | | | (180,016) | | | |
| | | | | |
| Non-cash lease expense | 22,841 | | | 26,288 | | | |
| Other non-cash amounts included in net income (loss), net | (9,888) | | | 7,180 | | | |
| Cash flows due to changes in operating assets and liabilities: | | | | | |
| Incentive fees receivable | (8,572) | | | 1,550 | | | |
| Due from related parties | (111,694) | | | (73,671) | | | |
| Accounts payable and accrued expenses | 21,706 | | | 25,570 | | | |
| Accrued compensation and benefits | 87,211 | | | 74,430 | | | |
| Deferred revenue | 44,577 | | | (19,798) | | | |
| Due to related parties | (10,557) | | | (911) | | | |
| Profit sharing payable | 670,033 | | | (258,316) | | | |
| Lease liability | (12,321) | | | (14,265) | | | |
| Other assets and other liabilities, net | 125,481 | | | (27,588) | | | |
| Cash distributions of earnings from principal investments | 94,784 | | | 12,276 | | | |
| Cash distributions of earnings from performance allocations | 741,660 | | | 200,846 | | | |
| Satisfaction of contingent obligations | (13,114) | | | (12,870) | | | |
| Apollo Funds and VIE related: | | | | | |
| Net realized and unrealized (gains) losses from investing activities and debt | (344,628) | | | 319,347 | | | |
| Cash transferred from consolidated VIEs | 0 | | | 502,153 | | | |
| Deconsolidation of VIEs | (2,998) | | | 0 | | | |
| Purchases of investments | (2,434,817) | | | (1,349,102) | | | |
| Proceeds from sale of investments | 2,195,453 | | | 1,158,433 | | | |
| Changes in other assets and other liabilities, net | 369,288 | | | (169,334) | | | |
| Net Cash Provided by Operating Activities | $ | 1,093,164 | | | $ | 937,374 | | | |
| Cash Flows from Investing Activities: | | | | | |
| Purchases of fixed assets | $ | (13,246) | | | $ | (37,619) | | | |
| Acquisitions | 0 | | | 48,518 | | | |
| Proceeds from sale of investments | 3,235 | | | 21,855 | | | |
| Purchase of investments | (37,168) | | | (522,432) | | | |
| Purchase of U.S. Treasury securities | 0 | | | (1,056,827) | | | |
| Proceeds from maturities of U.S. Treasury securities | 0 | | | 840,020 | | | |
| Cash contributions to equity method investments | (148,085) | | | (159,781) | | | |
| Cash distributions from equity method investments | 150,906 | | | 91,892 | | | |
| | | | | | | | | | | | | |
| Issuance of related party loans | 0 | | | (315) | | | |
| | | | | |
| Other investing activities | (615) | | | (241) | | | |
| Apollo Funds and VIE related: | | | | | |
| Purchase of U.S. Treasury securities | (817,077) | | | 0 | | | |
| Proceeds from maturities of U.S. Treasury Securities | 1,633,886 | | | 0 | | | |
| Net Cash Provided by (Used in) Investing Activities | $ | 771,836 | | | $ | (774,930) | | | |
| Cash Flows from Financing Activities: | | | | | |
| Principal repayments of debt | $ | 0 | | | $ | (16,990) | | | |
| | | | | |
| Dividends to Preferred Stockholders | (18,328) | | | (18,329) | | | |
| Issuance of debt | 0 | | | 518,756 | | | |
| Satisfaction of tax receivable agreement | (39,884) | | | (48,195) | | | |
| Repurchase of Class A Common Stock | (122,703) | | | (64,205) | | | |
| Payments related to deliveries of Class A Common Stock for RSUs | (63,673) | | | (85,527) | | | |
| Dividends paid | (263,818) | | | (312,638) | | | |
| Distributions paid to Non-Controlling Interests in Apollo Operating Group | (283,624) | | | (284,300) | | | |
| Issuance of related party loans | 0 | | | 28,280 | | | |
| Repayment of related party loans | 0 | | | (28,280) | | | |
| Other financing activities, net | (1,601) | | | (8,690) | | | |
| Apollo Funds and VIE related: | | | | | |
| Issuance of debt | 773,961 | | | 821,573 | | | |
| Principal repayment of debt | (1,330,790) | | | (716,184) | | | |
| Issuances of debt within other liabilities of consolidated VIEs | 0 | | | 67,459 | | | |
| Distributions paid to Non-Controlling Interests in consolidated entities | (500,483) | | | (125,208) | | | |
| Contributions from Non-Controlling Interests in consolidated entities | 1,012,492 | | | 181,687 | | | |
| Proceeds from issuance of Class A Units of SPAC | 690,000 | | | 0 | | | |
| | | | | |
| Payment of underwriting discounts | (27,730) | | | 0 | | | |
| | | | | |
| Net Cash Used in Financing Activities | $ | (176,181) | | | $ | (90,791) | | | |
| Net Increase in Cash and Cash Equivalents, Restricted Cash and Cash Equivalents, and Cash and Cash Equivalents Held at Consolidated Variable Interest Entities | 1,688,819 | | | 71,653 | | | |
| Cash and Cash Equivalents, Restricted Cash and Cash Equivalents, and Cash and Cash Equivalents Held at Consolidated Variable Interest Entities, Beginning of Period | 2,466,531 | | | 1,621,310 | | | |
| Cash and Cash Equivalents, Restricted Cash and Cash Equivalents, and Cash and Cash Equivalents Held at Consolidated Variable Interest Entities, End of Period | $ | 4,155,350 | | | $ | 1,692,963 | | | |
| Supplemental Disclosure of Cash Flow Information: | | | | | |
| Interest paid | $ | 67,615 | | | $ | 60,837 | | | |
| Interest paid by consolidated variable interest entities | 132,113 | | | 116,365 | | | |
| Income taxes paid | 38,478 | | | 16,399 | | | |
| Supplemental Disclosure of Non-Cash Investing Activities: | | | | | |
| | | | | |
| Non-cash distributions from principal investments | $ | 146,352 | | | $ | (4,642) | | | |
| Non-cash purchases of other investments, at fair value | 0 | | | 1,153,316 | | | |
| | | | | |
| | | | | |
| Non-cash loss on Athene equity swap | 0 | | | (61,261) | | | |
| | | | | |
| Acquisition of goodwill | 0 | | | 663 | | | |
| Contingent consideration | 0 | | | (6,208) | | | |
| Supplemental Disclosure of Non-Cash Financing Activities: | | | | | |
| Capital increases related to equity-based compensation | $ | 86,258 | | | $ | 93,230 | | | |
| Issuance of restricted shares | 3,214 | | | 28,991 | | | |
| Non-cash issuance of AOG units to Athene | 0 | | | 1,214,577 | | | |
| | | | | |
| Other non-cash financing activities | (1,295) | | | 8,329 | | | |
| Net Assets Transferred from Consolidated Variable Interest Entity: | | | | | |
| Investments, at fair value | $ | 0 | | | $ | 9,061,907 | | | |
| | | | | | | | | | | | | |
| Other assets | 0 | | | 130,907 | | | |
| Debt, at fair value | 0 | | | (6,829,326) | | | |
| Other liabilities | 0 | | | (967,575) | | | |
| Non-Controlling interest in consolidated entities related to acquisition | — | | | (1,898,067) | | | |
| Net Assets Deconsolidated from Consolidated Variable Interest Entities and Funds: | | | | | |
| Cash and cash equivalents | $ | 4,925 | | | $ | 0 | | | |
| Investments, at fair value | 229,717 | | | 0 | | | |
| Other assets | 755 | | | 0 | | | |
| Notes payable | (107,500) | | | 0 | | | |
| Other liabilities | (2,682) | | | 0 | | | |
| Non-Controlling interest in consolidated entities | (125,215) | | | 0 | | | |
| Adjustments related to exchange of Apollo Operating Group units: | | | | | |
| Deferred tax assets | $ | 45,479 | | | $ | 76,580 | | | |
| Due to related parties | (38,229) | | | (62,531) | | | |
| Additional paid in capital | (7,250) | | | (14,049) | | | |
| Non-Controlling Interest in Apollo Operating Group | 15,358 | | | 16,967 | | | |
| | | | | |
| Reconciliation of Cash and Cash Equivalents, Restricted Cash and Cash Equivalents, and Cash and Cash Equivalents Held at Consolidated Variable Interest Entities to the Condensed Consolidated Statements of Financial Condition: | | | | | |
| Cash and cash equivalents | $ | 1,824,712 | | | $ | 939,824 | | | |
| Restricted cash and cash equivalents | 1,524,902 | | | 81,378 | | | |
| Cash and cash equivalents held at consolidated variable interest entities | 805,736 | | | 671,761 | | | |
| Total Cash and Cash Equivalents, Restricted Cash and Cash Equivalents, and Cash and Cash Equivalents Held at Consolidated Variable Interest Entities | $ | 4,155,350 | | | $ | 1,692,963 | | | |
See accompanying notes to condensed consolidated financial statements.
APOLLO GLOBALASSET MANAGEMENT, INC.
NOTES TO CONDENSED CONSOLIDATED
FINANCIAL STATEMENTS (UNAUDITED)
(dollars in thousands, except share data, except where noted)
1. ORGANIZATION
Apollo GlobalAsset Management, Inc. (“AGM Inc.”AAM”, together with its consolidated subsidiaries, the “Company” or “Apollo”) is a high-growth, global alternative investmentasset manager whose predecessor was founded in 1990. Its primary business is to raise, invest and manage credit, private equity and real assets funds as well as strategic investment accounts, on behalf of pension, endowment and sovereign wealth funds, as well as other institutional and individual investors. For these investment management services, Apollo receives management fees generally related to the amount of assets managed, transaction and advisory fees, incentive fees and performance allocations related to the performance of the respective funds that it manages. As of March 31, 2022, Apollo has 3had 2 primary business segments:
•CreditAsset Management —primarily invests in non-control focuses on 3 investing strategies: yield, hybrid and equity; yield focuses on generating excess returns through high quality credit underwriting and origination of safe-yielding assets; hybrid focuses across debt and equity to offer a differentiated risk-adjusted return with an emphasis on structured downside protected opportunities across asset classes; and within equity, controlled transactions are principally buyouts, corporate and structured debt instruments including performing, stressedcarveouts and distressed investments, across the capital structure;while our real estate funds generally focus on single asset, portfolio and platform acquisitions;
•Private equityPrincipal Investing —primarily investsincludes our general partner investments in control equitythe funds we manage, where we earn realized performance fee income based on the investment performance of these funds. Principal investing also includes our growth capital and related debt instruments, convertible securitiesliquidity resources, and distressed debt investments; andseeks to deploy capital into strategic investments over time to help accelerate the growth of the asset management segment.
•Real assets—primarily invests in (i) real estate equity and infrastructure equity for the acquisition and recapitalization of real estate and infrastructure assets, portfolios, platforms and operating companies, (ii) real estate and infrastructure debt including first mortgage and mezzanine loans, preferred equity and commercial mortgage backed securities and (iii) European performing and non-performing loans, and unsecured consumer loans.
Organization of the Company
As of June 30, 2021,March 31, 2022, the Company owned through 5 intermediate holding companies that include APO Corp., a Delaware corporation that is a domestic corporation for U.S. federal income tax purposes, APO Asset Co., LLC, a Delaware limited liability company that is treated as a corporation for U.S. federal income tax purposes, APO (FC), LLC, an Anguilla limited liability company that is a disregarded entity for U.S. federal income tax purposes, APO (FC II), LLC, an Anguilla limited liability company that is a disregarded entity for U.S. federal income tax purposes, and APO (FC III), LLC, a Cayman Islands limited liability company that is a disregarded entity for U.S. federal income tax purposes (collectively, the “Intermediate Holding Companies”), 53.5%57.4% of the economic interests of, and operated and controlled all of the businesses and affairs of, the Apollo Operating Group.
AP Professional Holdings, L.P., a Cayman Islands exempted limited partnership (“Holdings”), is an entity through which the Co-Founders and certain The remaining 42.6% of the Company’s other current and former partners (the “Contributing Partners”) indirectly beneficially own interests in each of the entities that comprise the Apollo Operating Group. As of June 30, 2021, Holdings owned 39.8% of the economic interests in the Apollo Operating Group. The Company consolidates the financial results of the Apollo Operating Group and its consolidated subsidiaries. Holdings’ ownership interest in the Apollo Operating Group is reflected as a Non-Controlling Interest in the accompanying condensed consolidated financial statements.
Athene and Apollo Strategic Transaction
On February 28, 2020, pursuant to a transaction agreement (the “Transaction Agreement”) between Athene Holding, AGM Inc. and the entities that form the Apollo Operating Group, the Apollo Operating Group issued 29,154,519 non-voting equity interests of the Apollo Operating Group to Athene Holding. As a result, as of June 30, 2021, Athene Holdingare owned 6.7% of the economic interests in theby Apollo Operating Group. See note 14 for further disclosure regarding the Transaction Agreement.
As noted further in note 14, Apollo purchased a 17% incremental equity ownership stake in Athene, bringing Apollo’s beneficial ownership in Athene to 28%, at the close of the transaction. This has resulted in Apollo’s indirect ownership in certain VIEs, through Athene, being considered significant such that the Company has the power to direct the activities that most significantly impact the economic performance of these VIEs.Global Management, Inc. (“AGM”).
Apollo and Athene Merger and Corporate Conversion
On March 8, 2021, AGM Inc. entered into anJanuary 1, 2022, Apollo and Athene Holding Ltd. (“Athene”) completed the previously announced merger transactions pursuant to the Agreement and Plan of Merger (the “Merger Agreement”) with AHL,by and among AAM, Tango Holdings, Inc., a Delaware corporation and a direct wholly ownedthen wholly-owned subsidiary of AGM Inc.AAM (“HoldCo”), Blue Merger Sub, Ltd., a Bermuda exempted company and a direct wholly ownedwholly-owned subsidiary of HoldCo (“AHL Merger Sub”), and Green
APOLLO GLOBAL MANAGEMENT, INC.
NOTES TO CONDENSED CONSOLIDATED
FINANCIAL STATEMENTS (UNAUDITED)
(dollars in thousands, except share data, except where noted)
Merger Sub, Inc., a Delaware corporation and a direct wholly ownedwholly-owned subsidiary of HoldCo (“AGMAAM Merger Sub” and together with AHL Merger Sub, the “Merger Subs”).
At the closing of the transaction (the “Closing”),transactions, AHL Merger Sub will mergemerged with and into AHL (the “AHL Merger”), with AHL as the surviving entity in the AHL Merger and a direct wholly owned subsidiary of HoldCo, (the “AHL Surviving Entity”), and AGMAAM Merger Sub will mergemerged with and into ApolloAAM (the “AGM“AAM Merger” and, together with the AHL Merger, the “Mergers”) with AGMAAM as the surviving entity in the AGMAAM Merger and a direct wholly owned subsidiary of HoldCo (the “AGM Surviving Entity”). Upon consummationHoldCo.
In connection with the closing of the Mergers, AGM and AHL will be direct wholly owned subsidiaries of HoldCo which will bewas renamed “Apollo Global Management, Inc.” The transaction is expected to close in JanuaryFollowing the closing of 2022. The transaction requires the approvalMergers, all of stockholdersthe common shares of both Apollo and AHL and is subject to, among other things, regulatory approvals, and other customary closing conditions. See note 14 for further disclosure regarding the Merger Agreement.AAM are owned by AGM.
In addition, on March 9, 2021, AGM Inc. entered into a binding governance term sheetconnection with the Co-Founders pursuant to which it was agreed, among other things, thatclosing of the Mergers, the Company will convert itscompleted a corporate recapitalization (the “Corporate Recapitalization”) which resulted in the recapitalization of AGM from an umbrella partnership C corporation (“up-C”) structure to a corporation with a single class of common stock with one1 vote per share. The change will take effect at closing of the Mergers, subject to regulatory and stockholder approvals, and will result in the exchange of Apollo’s Apollo Operating Group units for a combination of Class A shares and cash, and the reorganization of Apollo Global Management, Inc. from an umbrella partnership C corporation (“Up-C”) structure to a C-corporation with a single class of common stock.
2. SUMMARY OF SIGNIFICANT ACCOUNTING POLICIES
Basis of Presentation
The accompanying unaudited condensed consolidated financial statements are prepared in accordance with generally accepted accounting principles in the United States of America (“U.S. GAAP”) for interim financial information and instructions to Form 10-Q. The. These condensed consolidated financial statements should be read in conjunction with the annual financial statements included in the 2021 Annual Report. Certain disclosures included in the annual financial statements have been condensed or omitted as they are not required for interim financial statements under U.S. GAAP and these notes are unaudited and exclude somethe rules of the disclosures required in annual financial statements. Management believes it has made all necessary adjustments (consisting only of normal recurring items) so that the condensed consolidated financial statements are presented fairly and that estimates made in preparing its condensed consolidated financial statements are reasonable and prudent.SEC. The operating results presented for interim periods are not necessarily indicative of the results that may be expected for any other interim period or for the entire year. These condensed consolidated financial statements should be read in conjunction with the annual financial statements included in the 2020 Annual Report.
The condensed consolidated financial statements include the accounts of the Company, its wholly-owned or majority-owned subsidiaries, the consolidated entities which are considered to be variable interest entities (“VIEs”) and for which the Company is considered the primary beneficiary, and certain entities which are not considered VIEs but which the Company controls through a majority voting interest. Intercompany accounts and transactions, if any, have been eliminated upon consolidation.
Certain reclassifications, when applicable, have been made to the prior periods’ condensed consolidated financial statements and notes to conform to the current period’s presentation and are disclosed accordingly.
Consolidation
The types of entities with which Apollo is involved generally include subsidiaries (e.g., general partners and management companies related to the funds the Company manages), entities that have all the attributes of an investment company (e.g., funds), special purpose acquisition companies (“SPACs”) and securitization vehicles (e.g., CLOs). Each of these entities is assessed for consolidation on a case by case basis depending on the specific facts and circumstances surrounding that entity.
Pursuant to the consolidation guidance, the Company first evaluates whether it holds a variable interest in an entity. Fees that are customary and commensurate with the level of services provided, and where the Company does not hold other economic interests in the entity that would absorb more than an insignificant amount of the expected losses or returns of the entity, would not be considered a variable interest. Apollo factors in all economic interests, including proportionate interests through related parties, to determine if such interests are considered a variable interest. As Apollo’s interests in many of these entities are solely through market rate fees and/or insignificant indirect interests through related parties, Apollo is not considered to have a variable interest in many of these entities and no further consolidation analysis is performed. For entities
APOLLO GLOBALASSET MANAGEMENT, INC.
NOTES TO CONDENSED CONSOLIDATED
FINANCIAL STATEMENTS (UNAUDITED)
(dollars in thousands, except share data, except where noted)
whereThe results of the Company and its subsidiaries are presented on a consolidated basis. Any ownership interest other than the Company’s interest in its subsidiaries is reflected as a noncontrolling interest. Intercompany accounts and transactions have been eliminated. Management believes it has determinedmade all necessary adjustments (consisting only of normal recurring items) so that the condensed consolidated financial statements are presented fairly and that any estimates made are reasonable and prudent. Certain reclassifications have been made to previously reported amounts to conform to the current period’s presentation.
Consolidation
When an entity is consolidated, the accounts of the consolidated entity, including its assets, liabilities, revenues, expenses and cash flows, are presented on a gross basis. Consolidation does not have an effect on the amounts of net income reported. The Company consolidates entities where it does holdhas a variablecontrolling financial interest unless there is a specific scope exception that prevents consolidation. The types of entities with which the Company performsis involved generally include, but are not limited to:
•Subsidiaries, including management companies and general partners of funds that the Company manages
•Entities that have attributes of an assessment to determine whether eachinvestment company (e.g., funds)
•Special purpose acquisition companies (“SPACs”)
•Securitization vehicles (e.g., collateralized loan obligations (“CLOs”))
Each of thosethese entities qualify as a VIE.
The determination as to whether an entity qualifies as a VIE dependsis assessed for consolidation depending on the specific facts and circumstances surrounding each entity and therefore certain of Apollo’s funds may qualify as VIEs under the variable interest model whereas others may qualify as voting interest entities (“VOEs”) under the voting interest model. The granting of substantive kick-out rights is a key consideration inthat entity. In determining whether a limited partnership or similarto consolidate an entity, the Company first evaluates whether the entity is a VIE and whether or not that entity should be consolidated.
Under the variable interest entity (“VIE”) or a voting interest entity (“VOE”) and applies the appropriate consolidation model Apollo consolidates those entities where itas discussed below. If an entity is determined thatnot consolidated, then the Company’s investment is generally accounted for under the equity method of accounting or as a financial instrument as discussed in the related policy discussions below.
Investment Companies
Funds managed by the Company are generally accounted for as investment companies and are not required to consolidate their investments in operating companies. Judgment is required to evaluate whether entities have the characteristics of an investment company and are thus eligible to be accounted for as an investment company. Funds that meet the investment company criteria reflect their investments at fair value as required by specialized accounting guidance. The Company has retained this specialized accounting for investment companies in consolidation.
Variable Interest Entities
All entities are first considered under the VIE model. VIEs are entities that i) do not have sufficient equity at risk to finance its activities without additional subordinated financial support or ii) have equity investors that do not have the ability to make significant decisions related to the entity’s operations, absorb expected losses, or receive expected residual returns.
The Company consolidates a VIE if it is the primary beneficiary of the entity. The Company is determined to bedeemed the primary beneficiary when it has a controlling financial interest in the VIE, which is defined as possessing both (i) the power to direct the activities of the VIE that most significantly impact the VIE’s economic performance and (ii) the obligation to absorb losses of the VIE or the right to receive benefits from the VIE that could potentially be significant. When Apollo alone is not consideredThe Company performs the VIE and primary beneficiary assessment at inception of its involvement with a VIE and on an ongoing basis as facts and circumstances change.
To assess whether the Company has the power to direct the activities that most significantly impact the VIE’s economic performance, it considers the design of the entity as well as ongoing rights and responsibilities. In general, the parties that can make the most significant decisions regarding asset management, servicing, liquidation rights or have the right to unilaterally remove those decision-makers are deemed to have a controlling financial interest in the VIE but Apollo and its related parties under common control in the aggregate have a controlling financial interest in the VIE, Apollo will be deemed the primary beneficiary if it is the party that is most closely associated with the VIE. When Apollo and its related parties not under common control in the aggregate have a controlling financial interest in the VIE, Apollo would be deemedpower to be the primary beneficiary if substantially alldirect the activities of the VIE. To assess whether the Company has the obligation to absorb losses or right to receive benefits that could potentially be significant, the Company considers all its economic interests that are considered variable interests in the entity including interests held through related parties. This assessment requires judgment in considering whether those interests are performed on behalf of Apollo.
Apollo determines whether it is the primary beneficiary of a VIE at the time it becomes initially involved with the VIE and reconsiders that conclusion continuously. Investments and redemptions (either by Apollo, related parties of Apollo or third parties) or amendments to the governing documents of the respective entity may affect an entity’s status as a VIE or the determination of the primary beneficiary.significant.
Assets and liabilities of the consolidated VIEs, other than SPACs, are primarily shown in separate sections within the condensed consolidated statements of financial condition. Changes in the fair value of the consolidated VIEs’ assets and liabilities and related interest, dividend and other income and expenses are primarily presented within net gains from investment activities of consolidated variable interest entities in the condensed consolidated statements of operations. The portion attributable to Non-Controlling Interests is reported within net income attributable to Non-Controlling Interests in the condensed consolidated statements of operations. For additional disclosures regarding VIEs, see note 5.notes 6 and 14.
APOLLO ASSET MANAGEMENT, INC.
NOTES TO CONDENSED CONSOLIDATED
FINANCIAL STATEMENTS (UNAUDITED)
(dollars in thousands, except share data, except where noted)
Voting Interest Entities
For entities that are not determined to be VIEs, the entities are generally considered VOEs. Under the voting interest model, Apollo consolidates those entities it controls through a majority voting interest. Apollo does not consolidate those VOEs in which substantive kick-out rights have been granted to the unrelated investors to either dissolve the fund or remove the general partner.
Use of Estimates
The preparation of the condensed consolidated financial statements requires management to make estimates and assumptions that affect the reported amounts in the financial statements and the related footnotes. Apollo’s most significant estimates include goodwill, intangible assets, income taxes, performance allocations, incentive fees, contingent consideration obligation related to an acquisition, non-cash compensation, and fair value of investments and debt. While such impact may change considerably over time, the estimates and assumptions affecting the Company’s condensed consolidated financial statements are based on the best available information as of March 31, 2022. Actual results could differ materially from those estimates.
Cash and Cash Equivalents
Apollo considers all highly liquid short-term investments with original maturities of three months or less when purchased to be cash equivalents. Cash and cash equivalents include money market funds and U.S. Treasury securities with original maturities of three months or less when purchased.securities. Interest income from cash and cash equivalents is recorded in interest income in the condensed consolidated statements of operations. The carrying values of the money market funds and U.S. Treasury securities were $1.2 billion and $1.2 billion as of June 30, 2021 and December 31, 2020, respectively, which represent their fair values due to their short-term nature and are categorized as Level I within the fair value hierarchy.nature. Substantially all of the Company’s cash on deposit is in interest bearing accounts with major financial institutions and exceed insured limits.
Restricted Cash and Cash Equivalents
Restricted cash and cash equivalents includes cash held in reserve accounts used to make required payments in respect of the 2039 Senior Secured Guaranteed Notes. Restricted cash and cash equivalents also includes cash deposited at a bank, which is pledged as collateral in connection with leased premises.
Restricted cash and cash equivalents of Apollo Strategic Growth Capital II (“APSG”APSG II”) and Acropolis Infrastructure Acquisition Corp. (“Acropolis”), a consolidated SPAC,SPACs, are held in a trust accountaccounts and consist of U.Sinclude money market funds and U.S. Treasury bills with original maturities of three months or less, when purchased, that were purchased with funds raised through the respective initial public offering of the consolidated entity. The $0.8 billion$690.3 million and $345.2 million in funds for APSG II and Acropolis, respectively, as of June 30, 2021 are restricted for use and may only be used for purposes of completing an initial business combination or redemption of public shares as set forth in APSG’s trust agreement. Restricted cash and cash equivalents of Apollo Strategic Growth Capital II (“APSG II”), a consolidated SPAC, are held in a trust account and include money market funds that were
APOLLO GLOBAL MANAGEMENT, INC.
NOTES TO CONDENSED CONSOLIDATED
FINANCIAL STATEMENTS (UNAUDITED)
(dollars in thousands, except share data, except where noted)
purchased with funds raised through the initial public offering of the consolidated entity. The $0.7 billion in funds as of June 30, 2021March 31, 2022 are restricted for use and may only be used for purposes of completing an initial business combination or redemption of public shares as set forth in APSG II’sII and Acropolis’s respective trust agreement. Please refer to note 14 for further detail.
U.S. Treasury securities, at fair value
U.S. Treasury securities, at fair value includes U.S. Treasury bills with original maturities greater than three months when purchased. These securities are recorded at fair value.value within investments on the condensed consolidated statements of financial condition. Interest income on such securities is separately presented from the overall change in fair value and is recognized in interest income in the condensed consolidated statements of operations. Any remaining change in fair value of such securities, that is not recognized as interest income, is recognized in net gains (losses) from investment activities in the condensed consolidated statements of operations. Securities are generally recognized on a trade date basis.
U.S. Treasury securities, at fair value of Apollo Strategic Growth Capital (“APSG I”), a consolidated SPAC, are held in a trust account and consist of U.S Treasury bills that were purchased with funds raised through the initial public offering of the consolidated entity. The $817.4 million in funds as of March 31, 2022 are restricted for use and may only be used for purposes of completing an initial business combination or redemption of public shares as set forth in the trust agreement.
Fair Value of Financial Instruments
Apollo has elected the fair value option for the Company’s investment in Athene Holding, the assets and liabilities of certain of its consolidated VIEs (including CLOs), the Company’s U.S. Treasury securities with original maturities greater than three months when purchased, and certain of the Company’s other investments. Such election is irrevocable and is applied to financial instruments on an individual basis at initial recognition.
The fair value of a financial instrument is the price that would be received to sell an asset or paid to transfer a liability in an orderly transaction between market participants at the measurement date under current market conditions.in an orderly transaction. Changes in the fair value of financial instruments are recorded and presented in net gains (losses) from investment activities except for certain investments for which the Company is entitled to receive performance allocations. For those investments, changes in fair value are presented in principal investment income.
Except for the Company’s debt obligations, financial
APOLLO ASSET MANAGEMENT, INC.
NOTES TO CONDENSED CONSOLIDATED
FINANCIAL STATEMENTS (UNAUDITED)
(dollars in thousands, except share data, except where noted)
Financial instruments are generally recorded at fair value or at amounts whose carrying values approximate fair value. The actual realized gains or losses will depend on, among other factors, future operating results, the value of the assets and market conditions at the time of disposition, any related transaction costs and the timing and manner of sale, all of which may ultimately differ significantly from the assumptions on which the valuations were based.
Fair Value Option
Entities are permitted to elect the fair value option (“FVO”) to carry at fair value certain financial assets and financial liabilities, including investments otherwise accounted for under the equity method of accounting. The Company has elected the FVO for financial instruments held by its consolidated CLOs, which includes investments in loans and corporate bonds, as well as debt obligations and contingent obligations. Certain consolidated VIEs have applied the fair value option for certain investments in private debt securities that otherwise would not have been carried at fair value with gains and losses in net income. The FVO election is irrevocable and is applied to financial instruments on an individual basis at initial recognition or at eligible remeasurement events. Please refer to note 4 for additional information and other instances of when the Company has elected the FVO.
Fair Value Hierarchy
U.S. GAAP establishes a hierarchical disclosure framework which prioritizes and ranks the level of market price observability used in measuring financial instruments at fair value. Market price observability is affected by a number of factors, including the type of financial instrument, the characteristics specific to the financial instrument and the state of the marketplace, including the existence and transparency of transactions between market participants. Financial instruments with readily available quoted prices in active markets generally will have a higher degree of market price observability and a lesser degree of judgment used in measuring fair value.
Financial instruments measured and reported at fair value are classified and disclosed based on the observability of inputs used in the determination of fair values, as follows:
Level I - Quoted prices are available in active markets for identical financial instruments as of the reporting date. The types of financial instruments included in Level I include listed equities and debt. The Company does not adjust the quoted price for these financial instruments, even in situations where the Company holds a large position and the sale of such position would likely deviate from the quoted price.
Level II - Pricing inputs are other than quoted prices in active markets, which are either directly or indirectly observable as of the reporting date, and fair value is determined through the use of models or other valuation methodologies. Financial instruments that are generally included in this category include corporate bonds and loans, less liquid and restricted equity securities and certain over-the-counter derivatives where the fair value is based on observable inputs. These financial instruments exhibit higher levels of liquid market observability as compared to Level III financial instruments.
Level III - Pricing inputs are unobservable for the financial instrument and includes situations where there is little observable market activity for the financial instrument. The inputs into the determination of fair value may require significant management judgment or estimation. Financial instruments that are included in this category generally include general and limited partner interests in corporate private equity and real assets funds, opportunistic credithybrid funds, distressed debt and non-investment grade residual interests in securitizations, and CDOs and CLOs where the fair value is based on observable inputs as well as unobservable inputs.
APOLLO GLOBAL MANAGEMENT, INC.
NOTES TO CONDENSED CONSOLIDATED
FINANCIAL STATEMENTS (UNAUDITED)
(dollars in thousands, except share data, except where noted)
When a security is valued based on broker quotes, the Company subjects those quotes to various criteria in making the determination as to whether a particular financial instrument would qualify for classification as Level II or Level III. These criteria include, but are not limited to, the number and quality of the broker quotes, the standard deviations of the observed broker quotes, and the percentage deviation from external pricing services.
Investments in securities that are traded on a securities exchange or comparable over-the-counter quotation systems are valued based on the last reported sale price at that date. If no sales of such investments are reported on such date, and in the case of over-the-counter securities or other investments for which the last sale date is not available, valuations are based on independent market quotations obtained from market participants, recognized pricing services or other sources deemed relevant, and the prices are based on the average of the “bid” and “ask” prices, or at ascertainable prices at the close of business on such day. Market quotations are generally based on valuation pricing models or market transactions of similar securities adjusted for
APOLLO ASSET MANAGEMENT, INC.
NOTES TO CONDENSED CONSOLIDATED
FINANCIAL STATEMENTS (UNAUDITED)
(dollars in thousands, except share data, except where noted)
security-specific factors such as relative capital structure priority and interest and yield risks, among other factors. When market quotations are not available, a model based approach is used to determine fair value.
In certain cases, the inputs used to measure fair value may fall into different levels of the fair value hierarchy. In such cases, a financial instrument’s level within the fair value hierarchy is based on the lowest level of input that is significant to the fair value measurement. The Company’s assessment of the significance of a particular input to the fair value measurement in its entirety requires judgment and considers factors specific to the financial instrument when the fair value is based on unobservable inputs.
Equity Method Investments
For investments in entities over whichwhere the Company exercises significant influence but which dodoes not meet the requirements for consolidation and for which the Company has not elected the fair value option, the Company uses the equity method of accounting. Under the equity method of accounting, whereby the Company records its share of the underlying income or loss of such entities.entities adjusted for distributions. The Company’s share of the underlying net income or loss of such entities is recorded in principal investment income (loss) in the condensed consolidated statements of operations.
The carrying amounts of equity method investments are recorded in investments in the condensed consolidated statements of financial condition. AsGenerally, the underlying entities that the Company manages and invests in are for U.S. GAAP purposes, primarily investment companies which reflect their investments at estimated fair value,and the carrying value of the Company’s equity method investments in such entities approximates fair value.
Financial Instruments held by Consolidated VIEs
TheUnder a measurement alternative permissible for consolidated collateralized financing entities, the Company measures both the financial assets and financial liabilities of the consolidated CLOs in its condensed consolidated financial statements using the fair value of the financial assets or financial liabilities, of the consolidated CLOs, whichever are more observable.
Where financial assets are more observable, the financial assets of the consolidated CLOs are measured at fair value and the financial liabilities are measured in consolidation as: (i) the sum of the fair value of the financial assets and the carrying value of any nonfinancial assets that are incidental to the operations of the CLOs less (ii) the sum of the fair value of any beneficial interests retained by the Company (other than those that represent compensation for services) and the Company’s carrying value of any beneficial interests that represent compensation for services. The resulting amount is allocated to the individual financial liabilities (other than the beneficial interest retained by the Company) using a reasonable and consistent methodology.
Where financial liabilities are more observable, the financial liabilities of the consolidated CLOs are measured at fair value and the financial assets are measured in consolidation as: (i) the sum of the fair value of the financial liabilities, and the carrying value of any nonfinancial liabilities that are incidental to the operations of the CLOs less (ii) the carrying value of any nonfinancial assets that are incidental to the operations of the CLOs. The resulting amount is allocated to the individual financial assets using a reasonable and consistent methodology.
Under the measurement alternative, netNet income attributable to Apollo GlobalAsset Management, Inc. reflects the Company’s own economic interests in the consolidated CLOs including (i) changes in the fair value of the beneficial interests retained by the Company and (ii) beneficial interests that represent compensation for collateral management services.
The consolidated VIEs hold investments that could be traded over-the-counter. Investments in securities that are traded on a securities exchange or comparable over-the-counter quotation systems are valued based on the last reported sale price at that date. If no sales of such investments are reported on such date, and in the case of over-the-counter securities or other investments for which the last sale date is not available, valuations are based on independent market quotations obtained from market participants, recognized pricing services or other sources deemed relevant, and the prices are based on the average of the “bid” and “ask” prices, or at ascertainable prices at the close of business on such day. Market quotations are generally based on valuation pricing models or market transactions of similar securities adjusted for security-specific factors such as relative capital structure priority and interest and yield risks, among other factors. When market quotations are not available, a model based approach is used to determine fair value.
APOLLO GLOBAL MANAGEMENT, INC.
NOTES TO CONDENSED CONSOLIDATED
FINANCIAL STATEMENTS (UNAUDITED)
(dollars in thousands, except share data, except where noted)
Certain consolidated VIEs have applied the fair value option for certain investments in private debt securities that otherwise would not have been carried at fair value with gains and losses in net income.
Deferred Revenue
Apollo records deferred revenue, which is a type of contract liability, when consideration is received in advance of management services provided.
Apollo also earns management fees subject to the Management Fee Offset (described below). When advisory and transaction fees are earned by the management company, the Management Fee Offset reduces the management fee obligation of the fund. When the Company receives cash for advisory and transaction fees, a certain percentage of such advisory and/or transaction fees, as applicable, is allocated as a credit to reduce future management fees, otherwise payable by such fund. Such credit is recorded as deferred revenue in the condensed consolidated statements of financial condition. A portion of any excess advisory and transaction fees may be required to be returned to the limited partners of certain funds upon such fund’s liquidation. As the management fees earned by the Company are presented on a gross basis, any Management Fee Offsets calculated are presented as a reduction to advisory and transaction fees in the condensed consolidated statements of operations.
APOLLO ASSET MANAGEMENT, INC.
NOTES TO CONDENSED CONSOLIDATED
FINANCIAL STATEMENTS (UNAUDITED)
(dollars in thousands, except share data, except where noted)
Additionally, Apollo earns advisory fees pursuant to the terms of the advisory agreements with certain of the portfolio companies that are owned by the funds Apollo manages. When Apollo receives a payment from a portfolio company that exceeds the advisory fees earned at that point in time, the excess payment is recorded as deferred revenue in the condensed consolidated statements of financial condition. The advisory agreements with the portfolio companies vary in duration and the associated fees are received monthly, quarterly or annually.
Deferred revenue is reversed and recognized as revenue over the period that the agreed upon services are performed. There was $23.5$107.4 million of revenue recognized during the sixthree months ended June 30, 2021March 31, 2022 that was previously deferred as of January 1, 2021.2022.
Under the terms of the funds’ partnership agreements, Apollo is normally required to bear organizational expenses over a set dollar amount and placement fees or costs in connection with the offering and sale of interests in the funds it manages to investors. The placement fees are payable to placement agents, who are independent third parties that assist in identifying potential investors, securing commitments to invest from such potential investors, preparing or revising offering and marketing materials, developing strategies for attempting to secure investments by potential investors and/or providing feedback and insight regarding issues and concerns of potential investors, when a limited partner either commits or funds a commitment to a fund. In cases where the limited partners of the funds are determined to be the customer in an arrangement, placement fees may be capitalized as a cost to acquire a customer contract, and amortized over the life of the customer contract. Capitalized placement fees are recorded within other assets in the condensed consolidated statements of financial condition, while amortization is recorded within placement fees in the condensed consolidated statements of operations. In certain instances, the placement fees are paid over a period of time. Based on the management agreements with the funds, Apollo considers placement fees and organizational costs paid in determining if cash has been received in excess of the management fees earned. Placement fees and organizational costs are normally the obligation of Apollo but can be paid for by the funds. When these costs are paid by the fund, the resulting obligations are included within deferred revenue. The deferred revenue balance will also be reduced during future periods when management fees are earned but not paid.
Redeemable non-controlling interests
Redeemable non-controlling interests represent the shares issued by APSG andI, APSG II and Acropolis, the consolidated SPACs, that are redeemable for cash by the respective public shareholders in connection with the SPACs’applicable SPAC’s failure to complete a business combination or its tender offer/stockholder approval provisions. The redeemable non-controlling interests are initially recorded at their original issue price, net of issuance costs and the initial fair value of separately traded warrants. The carrying amount is accreted to its redemption value over the period from the date of issuance to the earliest redemption date of the instrument. These increases are recordedThe accretion to redemption value is recorded against additional paid-in capital.Refer to note 14 for further detail.
Revenues
The Company’s revenues are reported in four separate categories that include (i) management fees; (ii) advisory and transaction fees, net; (iii) investment income, which is comprised of performance allocations and principal investment income; and (iv) incentive fees.
APOLLO GLOBAL MANAGEMENT, INC.
NOTES TO CONDENSED CONSOLIDATED
FINANCIAL STATEMENTS (UNAUDITED)
(dollars in thousands, except share data, except where noted)
The revenue guidance requires that an entity shouldCompany is required to recognize revenue to depict the transfer of promised goods or services to customers in an amount that reflects the consideration to which the entity expects to be entitled in exchange for those goods or services (i.e., the transaction price). When determining the transaction price, under the revenue guidance, an entityCompany may recognize variable consideration only to the extent that it is probable to not be significantly reversed. The revenue guidanceCompany is also requires disclosuresrequired to help users of financial statements better understanddisclose the nature, amount, timing, and uncertainty of revenue that is recognized.
Performance allocations are accounted for under guidance applicable toas equity method investments, and therefore not within the scope of the revenue guidance.investments. The Company recognizes performance allocations within investment income along with the related principal investment income (as further described below) in the condensed consolidated statements of operations and within the investments line in the condensed consolidated statements of financial condition.
Refer to disclosures below for additional information on each of the Company’s revenue streams.
Management Fees
Management fees are recognized over time during the periods in which the related services are performed in accordance with the contractual terms of the related agreement. Management fees are generally based on (1) a percentage of the capital
APOLLO ASSET MANAGEMENT, INC.
NOTES TO CONDENSED CONSOLIDATED
FINANCIAL STATEMENTS (UNAUDITED)
(dollars in thousands, except share data, except where noted)
committed during the commitment period, and thereafter based on the remaining invested capital of unrealized investments, or (2) net asset value, gross assets or as otherwise defined in the respective agreements. Included in management fees are certain expense reimbursements where the Company is considered the principal under the agreements and is required to record the expense and related reimbursement revenue on a gross basis.
Advisory and Transaction Fees, Net
Advisory fees, including management consulting fees and directors’ fees, are generally recognized over time as the underlying services are provided in accordance with the contractual terms of the related agreement. The Company receives such fees in exchange for ongoing management consulting services provided to portfolio companies of funds it manages. Transaction fees, including structuring fees and arranging fees related to the Company’s funds, portfolio companies of funds and third parties are generally recognized at a point in time when the underlying services rendered are complete.
The amounts due from fund portfolio companies are recorded in due from related parties on the condensed consolidated statements of financial condition, which is discussed further in note 14. Under the terms of the limited partnership agreements for certain funds, the management fee payable by the funds may be subject to a reduction based on a certain percentage of such advisory and transaction fees, net of applicable broken deal costs (“Management Fee Offset”). Advisory and transaction fees are presented net of the Management Fee Offset in the condensed consolidated statements of operations.
Underwriting fees, which are also included within advisory and transaction fees, net, include gains, losses and fees, arising from securities offerings in which one of the Company’s subsidiaries participates in the underwriter syndicate. Underwriting fees are recognized at a point in time when the underwriting is completed. Underwriting fees recognized but not received are recorded in other assets on the condensed consolidated statements of financial condition.
During the normal course of business, the Company incurs certain costs related to certain transactions that are not consummated (“broken deal costs”). These costs (e.g., research costs, due diligence costs, professional fees, legal fees and other related items) are determined to be broken deal costs upon management’s decision to no longer pursue the transaction. In accordance with the related fund agreement, in the event the deal is deemed broken, all of the costs are reimbursed by the funds and then included as a component of the calculation of the Management Fee Offset. If a deal is successfully completed, Apollo is reimbursed by the fund or fund’s portfolio company for all costs incurred and no offset is generated. As the Company acts as an agent for the funds it manages, any transaction costs incurred and paid by the Company on behalf of the respective funds relating to successful or broken deals are recorded net on the Company’s condensed consolidated statements of operations, and any receivable from the respective funds is recorded in due from related parties on the condensed consolidated statements of financial condition.
Investment Income
Investment income is comprised of performance allocations and principal investment income.
APOLLO GLOBAL MANAGEMENT, INC.
NOTES TO CONDENSED CONSOLIDATED
FINANCIAL STATEMENTS (UNAUDITED)
(dollars in thousands, except share data, except where noted)
Performance Allocations
Performance allocations are a type of performance revenue (i.e., income earned based on the extent to which an entity’s performance exceeds predetermined thresholds). Performance allocations are generally structured from a legal standpoint as an allocation of capital in which the Company’s capital account receives allocations of the returns of an entity when those returns exceed predetermined thresholds. The determination of which performance revenues are considered performance allocations is primarily based on the terms of an agreement with the entity.
The Company recognizes performance allocations within investment income along with the related principal investment income (as described further below) in the condensed consolidated statements of operations and within the investments line in the condensed consolidated statements of financial condition.
When applicable, the Company may record a general partner obligation to return previously distributed performance allocations. The general partner obligation is based upon an assumed liquidation of a fund’s net assets as of the reporting date and is reported within due to related parties on the condensed consolidated statements of financial condition. The actual determination and any required payment of any such general partner obligation would not take place until the final disposition of a fund’s investments based on the contractual termination of the fund or as otherwise set forth in the respective limited partnership agreement or other governing document of the fund.
APOLLO ASSET MANAGEMENT, INC.
NOTES TO CONDENSED CONSOLIDATED
FINANCIAL STATEMENTS (UNAUDITED)
(dollars in thousands, except share data, except where noted)
Principal Investment Income
Principal investment income includes the Company’s income or loss from equity method investments and certain other investments in entities in which the Company is generally eligible to receive performance allocations. Income from equity method investments includes the Company’s share of net income or loss generated from its investments, which are not consolidated, but in which the Company exerts significant influence.
Incentive Fees
Incentive fees are a type of performance revenue. Incentive fees differ from performance allocations in that incentive fees do not represent an allocation of capital but rather a contractual fee arrangement with the entity.
Incentive fees are considered a form of variable consideration as they are subject to clawback or reversal and therefore must be deferred until the fees are probable to not be significantly reversed. Accrued but unpaid incentive fees are reported within incentive fees receivable in the Company’s condensed consolidated statements of financial condition. The Company’s incentive fees primarily relate to the credit segmentyield investing strategy and are generally received from CLOs, managed accounts and AINV.
Compensation and Benefits
Salaries, Bonus and Benefits
Salaries, bonus and benefits include base salaries, discretionary and non-discretionary bonuses, severance and employee benefits. Bonuses are generally accrued over the related service period.
Equity-Based Compensation
Equity-based awards granted to employees and non-employees as compensation are measured based on the grant date fair value of the award. Equity-based awards that do not require future service (i.e., vested awards) are expensed immediately. Equity-based employee awards that require future service are expensed over the relevant service period. In addition, certain restricted share units (“RSUs”) granted by the CompanyAGM vest based on both continued service and the Company’s receipt of performance revenues, within prescribed periods, sufficient to cover the associated equity-based compensation expense. In accordance with U.S. GAAP, equity-based compensation expense for such awards, if and when granted, will be recognized on an accelerated recognition method over the requisite service period to the extent the performance revenue metrics are met or deemed probable. The Company accounts for forfeitures of equity-based awards when they occur.
Profit Sharing
Profit sharing expense and profit sharing payable primarily consist of a portion of performance revenues earned from certain funds that are allocated to employees and former employees. Profit sharing amounts are recognized as the related
APOLLO GLOBAL MANAGEMENT, INC.
NOTES TO CONDENSED CONSOLIDATED
FINANCIAL STATEMENTS (UNAUDITED)
(dollars in thousands, except share data, except where noted)
performance revenues are earned. Accordingly, profit sharing amounts can be reversed during periods when there is a decline in performance revenues that were previously recognized.
Profit sharing amounts are generally not paid until the related performance revenue is distributed to the general partner upon realization of the fund’s investments. Under certain profit sharing arrangements, the Company requires that a portion of certain of the performance revenues distributed to its employees be used to purchase restricted Class A Common Stockcommon stock issued under the Company’sAGM’s Equity Plan. Prior to distribution of the performance revenue, the Company records the value of the equity-based awards expected to be granted in other assets and other liabilities within the condensed consolidated statements of financial condition. Such equity-based awards are recorded as equity-based compensation expense over the relevant service period once granted.
Additionally, profit sharing amounts previously distributed may be subject to clawback from employees and former employees. When applicable, the accrual for potential clawback of previously distributed profit sharing amounts, which is a component of due from related parties on the condensed consolidated statements of financial condition, represents all amounts previously distributed to employees and former employees that would need to be returned to the general partner if the Apollo funds were to be liquidated based on the fair value of the underlying funds’ investments as of the reporting date. The actual general partner receivable, however, would not become realized until the final disposition of a fund’s investments based on the contractual termination of the fund or as otherwise set forth in the respective limited partnership agreement or other governing document of the fund.
APOLLO ASSET MANAGEMENT, INC.
NOTES TO CONDENSED CONSOLIDATED
FINANCIAL STATEMENTS (UNAUDITED)
(dollars in thousands, except share data, except where noted)
Profit sharing payable also includes contingent consideration obligations that were recognized in connection with certain Apollo acquisitions. Changes in the fair value of the contingent consideration obligations are reflected in the Company’s condensed consolidated statements of operations as profit sharing expense.
The Company has a performance-based incentive arrangement for certain Apollo partners and employees designed to more closely align compensation on an annual basis with the overall realized performance of the Company. This arrangement enables certain partners and employees to earn discretionary compensation based on performance revenue earned by the Company in a given year, which amounts are reflected in profit sharing expense in the accompanying condensed consolidated financial statements. The Company may also use dividends it receives from investments in MidCap, ARI and AINV to compensate employees. These amounts are recorded as profit sharing expense in the Company’s condensed consolidated statements of operations.
401(k) Savings Plan
The Company sponsors a 401(k) savings plan (the “401(k) Plan”) whereby U.S.-based employees are entitled to participate in the 401(k) Plan based upon satisfying certain eligibility requirements. The Company matches 50% of eligible annual employee contributions up to 3% of the eligible employees’ annual compensation. Matching contributions vest after three years of service.
General, Administrative and Other
General, administrative and other primarily includes professional fees, occupancy, depreciation and amortization, travel, information technology, administration expenses and administration expenses.placement fees.
Income TaxesPerformance Allocations
Effective September 5, 2019, Apollo Global Management, LLC convertedPerformance allocations are a type of performance revenue (i.e., income earned based on the extent to which an entity’s performance exceeds predetermined thresholds). Performance allocations are generally structured from a Delaware limited liability company to a Delaware corporation named Apollo Global Management, Inc. Subsequent tolegal standpoint as an allocation of capital in which the conversion, generally allCompany’s capital account receives allocations of the income it earns fromreturns of an entity when those returns exceed predetermined thresholds. The determination of which performance revenues are considered performance allocations is primarily based on the Apollo Operating Group (“AOG”) entities is subject to U.S. corporate income taxes. Certainterms of an agreement with the AOG entities operate as partnerships for U.S. income tax purposes and are subject to New York City unincorporated business taxes (“NYC UBT”). Certain non-U.S. entities are also subject to non-U.S. corporate income taxes.entity.
Significant judgment is required in determining tax expense and in evaluating tax positions, including evaluating uncertainties. The Company recognizes performance allocations within investment income along with the tax benefitrelated principal investment income (as described further below) in the condensed consolidated statements of uncertain tax positions only whereoperations and within the positioninvestments line in the condensed consolidated statements of financial condition.
When applicable, the Company may record a general partner obligation to return previously distributed performance allocations. The general partner obligation is “more likely than not”based upon an assumed liquidation of a fund’s net assets as of the reporting date and is reported within due to be sustained upon examination, including resolutionrelated parties on the condensed consolidated statements of financial condition. The actual determination and any required payment of any related appeals or litigation processes,such general partner obligation would not take place until the final disposition of a fund’s investments based on the technical meritscontractual termination of the position. The tax benefit is measuredfund or as otherwise set forth in the largest amountrespective limited partnership agreement or other governing document of benefit that has a greater than 50% likelihood of being realized upon ultimate settlement. If a tax position is not considered more likely than not to be sustained, then no benefitsthe fund.
APOLLO GLOBALASSET MANAGEMENT, INC.
NOTES TO CONDENSED CONSOLIDATED
FINANCIAL STATEMENTS (UNAUDITED)
(dollars in thousands, except share data, except where noted)
ofPrincipal Investment Income
Principal investment income includes the position are recognized. The Company’s tax positions are reviewed and evaluated quarterly to determine whether the Company has uncertain tax positions that require financial statement recognition.
Deferred tax assets and liabilities are recognized for the expected future tax consequences of differences between the carrying amount of assets and liabilities and their respective tax basis using currently enacted tax rates. The effect on deferred tax assets and liabilities of a change in tax rates is recognized in income in the period during which the change is enacted. Deferred tax assets are reduced by a valuation allowance when it is more likely than not that all or a portion of the deferred tax assets will not be realized.
Non-Controlling Interests
For entities that are consolidated, but not 100% owned, a portion of the income or loss from equity method investments and correspondingcertain other investments in entities in which the Company is generally eligible to receive performance allocations. Income from equity is allocated to owners other than Apollo. The aggregatemethod investments includes the Company’s share of thenet income or loss and corresponding equity that isgenerated from its investments, which are not owned byconsolidated, but in which the Company is includedexerts significant influence.
Incentive Fees
Incentive fees are a type of performance revenue. Incentive fees differ from performance allocations in Non-Controlling Intereststhat incentive fees do not represent an allocation of capital but rather a contractual fee arrangement with the entity.
Incentive fees are considered a form of variable consideration as they are subject to clawback or reversal and therefore must be deferred until the fees are probable to not be significantly reversed. Accrued but unpaid incentive fees are reported within incentive fees receivable in the condensed consolidated financial statements. The Non-Controlling Interests relating to Apollo Global Management, Inc. include the ownership interest in the Apollo Operating Group held by Co-Founders and Contributing Partners through their limited partner interests in Holdings. Additionally, Athene holds Non-Controlling Interests in the Apollo Operating Group as a result of the Transaction Agreement. Non-Controlling Interests also include ownership interests in certain consolidated funds and VIEs.
Non-Controlling Interests are presented as a separate component of stockholders’ equity on the Company’s condensed consolidated statements of financial condition. The primary componentsCompany’s incentive fees primarily relate to the yield investing strategy and are generally received from CLOs, managed accounts and AINV.
Compensation and Benefits
Salaries, Bonus and Benefits
Salaries, bonus and benefits include base salaries, discretionary and non-discretionary bonuses, severance and employee benefits. Bonuses are generally accrued over the related service period.
Equity-Based Compensation
Equity-based awards granted to employees and non-employees as compensation are measured based on the grant date fair value of Non-Controlling Intereststhe award. Equity-based awards that do not require future service (i.e., vested awards) are separately presentedexpensed immediately. Equity-based employee awards that require future service are expensed over the relevant service period. In addition, certain restricted share units (“RSUs”) granted by AGM vest based on both continued service and the Company’s receipt of performance revenues, within prescribed periods, sufficient to cover the associated equity-based compensation expense. In accordance with U.S. GAAP, equity-based compensation expense for such awards, if and when granted, will be recognized on an accelerated recognition method over the requisite service period to the extent the performance revenue metrics are met or deemed probable. The Company accounts for forfeitures of equity-based awards when they occur.
Profit Sharing
Profit sharing expense and profit sharing payable primarily consist of a portion of performance revenues earned from certain funds that are allocated to employees and former employees. Profit sharing amounts are recognized as the related performance revenues are earned. Accordingly, profit sharing amounts can be reversed during periods when there is a decline in performance revenues that were previously recognized.
Profit sharing amounts are generally not paid until the Company’srelated performance revenue is distributed to the general partner upon realization of the fund’s investments. Under certain profit sharing arrangements, the Company requires that a portion of certain of the performance revenues distributed to its employees be used to purchase restricted common stock issued under AGM’s Equity Plan. Prior to distribution of the performance revenue, the Company records the value of the equity-based awards expected to be granted in other assets and other liabilities within the condensed consolidated statements of changes in stockholders’ equityfinancial condition. Such equity-based awards are recorded as equity-based compensation expense over the relevant service period once granted.
Additionally, profit sharing amounts previously distributed may be subject to clearly distinguishclawback from employees and former employees. When applicable, the interest in the Apollo Operating Group and other ownership interests in the consolidated entities. Net income includes the net income attributable to the holdersaccrual for potential clawback of Non-Controlling Interestspreviously distributed profit sharing amounts, which is a component of due from related parties on the Company’s condensed consolidated statements of operations. Profitsfinancial condition, represents all amounts previously distributed to employees and losses are allocatedformer employees that would need to Non-Controlling Interests in proportion to their relative ownership interests regardless of their basis.
Guarantees
See note 15be returned to the condensed consolidated financial statements for information relatedgeneral partner if the Apollo funds were to our material guarantees.
Use of Estimates
The preparation ofbe liquidated based on the condensed consolidated financial statements requires management to make estimates and assumptions that affect the reported amounts of assets and liabilities at the date of the condensed consolidated financial statements, the disclosure of contingent assets and liabilities at the date of the condensed consolidated financial statements and the reported amounts of revenues and expenses during the reporting periods. Apollo’s most significant estimates include goodwill, intangible assets, income taxes, performance allocations, incentive fees, contingent consideration obligation related to an acquisition, non-cash compensation, and fair value of the underlying funds’ investments and debt. Due toas of the COVID-19 pandemic, there has been uncertainty and disruptionreporting date. The actual general partner receivable, however, would not become realized until the final disposition of a fund’s investments based on the contractual termination of the fund or as otherwise set forth in the global economy and financial markets. The Company is unable to predict the adverse impact the COVID-19 pandemic will ultimately have. While such impact may change considerably over time, the estimates and assumptions affecting the Company’s condensed consolidated financial statements are based on information available as of June 30, 2021. Actual results could differ materially from those estimates.
Recent Accounting Pronouncements
In December 2019, the Financial Accounting Standards Board (“FASB”) issued guidance intended to simplify the accounting for income taxes. The new guidance eliminates certain exceptions to the existing approach in ASC 740, and clarifiesrespective limited partnership agreement or other guidance within the standard; it is effective for the Company on January 1, 2021. Based on the Company’s current application of ASC 740, the guidance did not have a material impact on the condensed consolidated financial statementsgoverning document of the Company.fund.
APOLLO GLOBALASSET MANAGEMENT, INC.
NOTES TO CONDENSED CONSOLIDATED
FINANCIAL STATEMENTS (UNAUDITED)
(dollars in thousands, except share data, except where noted)
3. INVESTMENTS
The following table presents Apollo’s investments:
| | | | | | | | | | | |
| As of
June 30, 2021 | | As of
December 31, 2020 |
| Investments, at fair value | $ | 3,681,955 | | | $ | 2,360,434 | |
| Equity method investments | 1,492,071 | | | 1,010,821 | |
| Performance allocations | 2,736,493 | | | 1,624,156 | |
| Total Investments | $ | 7,910,519 | | | $ | 4,995,411 | |
Investments, at Fair Value
Investments, at fair value, consist of investments for which the fair value option has been elected and primarily include the Company’s investmentProfit sharing payable also includes contingent consideration obligations that were recognized in Athene Holding and investments in debt of unconsolidated CLOs.connection with certain Apollo acquisitions. Changes in the fair value related to these investmentsof the contingent consideration obligations are presented in net gains (losses) from investment activities except for certain investments for which the Company is entitled to receive performance allocations. For those investments, changes in fair value are presented in principal investment income.
The Company’s equity investment in Athene Holding, for which the fair value option was elected, met the significance criteria as defined by the SEC for the three and six months ended June 30, 2021 and 2020. As such, the following tables present summarized financial information of Athene Holding:
| | | | | | | | | | | | | | | | | | | | | | | |
| | For the Three Months Ended June 30, | | For the Six Months Ended June 30, |
| 2021 | | 2020 | | 2021 | | 2020 |
| (in millions) |
| Statements of Operations | | | | | | | |
| Revenues | $ | 6,423 | | | $ | 4,398 | | | $ | 10,814 | | | $ | 2,849 | |
| Benefits and expenses | 4,433 | | | 3,317 | | | 8,685 | | | 3,150 | |
| Income (loss) before income taxes | 1,990 | | | 1,081 | | | 2,129 | | | (301) | |
| Income tax expense (benefit) | 184 | | | 150 | | | 246 | | | (16) | |
| Net income (loss) | 1,806 | | | 931 | | | 1,883 | | | (285) | |
| Less: Net income (loss) attributable to non-controlling interests | 389 | | | 88 | | | (148) | | | (81) | |
| Net income (loss) available to Athene Holding Ltd. shareholders | $ | 1,417 | | | $ | 843 | | | $ | 2,031 | | | $ | (204) | |
| Less: Preferred stock dividends | 35 | | | 19 | | | 71 | | | 37 | |
| Net income (loss) available to Athene Holding Ltd. common shareholders | $ | 1,382 | | | $ | 824 | | | $ | 1,960 | | | $ | (241) | |
Net Gains (Losses) from Investment Activities
The following table presents the realized and net change in unrealized gains (losses) reported in net gains (losses) from investment activities:
| | | | | | | | | | | | | | | | | | | | | | | |
| | For the Three Months Ended June 30, | | For the Six Months Ended June 30, |
| | 2021 | | 2020 | | 2021 | | 2020 |
| Realized gains on sales of investments, net | $ | 1,192 | | | $ | 70 | | | $ | 1,193 | | | $ | 1,877 | |
| Net change in unrealized gains (losses) due to changes in fair value | 912,202 | | | 268,597 | | | 1,265,352 | | | (997,761) | |
| Net gains (losses) from investment activities | $ | 913,394 | | | $ | 268,667 | | | $ | 1,266,545 | | | $ | (995,884) | |
APOLLO GLOBAL MANAGEMENT, INC.
NOTES TO CONDENSED CONSOLIDATED
FINANCIAL STATEMENTS (UNAUDITED)
(dollars in thousands, except share data, except where noted)
Equity Method Investments
Apollo’s equity method investments include its investmentsreflected in the credit, private equity and real assets funds it manages, which are not consolidated, but in which the Company exerts significant influence. Apollo’s share of net income generated by these investments is recorded in principal investment income in theCompany’s condensed consolidated statements of operations.operations as profit sharing expense.
Equity method investments consistedThe Company has a performance-based incentive arrangement for certain Apollo partners and employees designed to more closely align compensation on an annual basis with the overall realized performance of the following:Company. This arrangement enables certain partners and employees to earn discretionary compensation based on performance revenue earned by the Company in a given year, which amounts are reflected in profit sharing expense in the accompanying condensed consolidated financial statements.
| | | | | | | | | | | | | | |
| | Equity Held as of |
| | June 30, 2021 | (5) | December 31, 2020 | (5) |
Credit(1)(2) | $ | 472,320 | | | $ | 258,952 | | |
Private Equity(3) | 938,439 | | | 672,430 | | |
| Real Assets | 81,312 | | | 79,439 | | |
Total equity method investments(4) | $ | 1,492,071 | | | $ | 1,010,821 | | |
(1) The equity method investmentCompany sponsors a 401(k) savings plan (the “401(k) Plan”) whereby U.S.-based employees are entitled to participate in AINV was $39.7 million and $40.4 million asthe 401(k) Plan based upon satisfying certain eligibility requirements. The Company matches 50% of June 30, 2021 and December 31, 2020, respectively. The valueeligible annual employee contributions up to 3% of the Company’s investment in AINV was $37.7 millioneligible employees’ annual compensation. Matching contributions vest after three years of service.
General, Administrative and $30.8 million based on the quoted market price of AINV as of June 30, 2021Other
General, administrative and December 31, 2020, respectively.
(2) The equity method investment in VA Capital Company, LLC was $323.5 millionother primarily includes professional fees, occupancy, depreciation and $113.5 million as of June 30, 2021amortization, travel, information technology, administration expenses and December 31, 2020, respectively.placement fees.
(3) The equity method investment in Fund VIII was $318.4 million and $343.3 million as of June 30, 2021 and December 31, 2020, respectively, representing an ownership percentage of 2.2% and 2.2% as of June 30, 2021 and December 31, 2020, respectively. The equity method investment in Fund IX was $268.0 million and $134.4 million as of June 30, 2021 and December 31, 2020, respectively, representing an ownership percentage of 1.9% and 1.9% as of June 30, 2021 and December 31, 2020, respectively.
(4) Certain funds invest across multiple segments. The presentation in the table above is based on the classification of the majority of such funds’ investments.
(5) Some amounts included are a quarter in arrears.
Performance Allocations
Performance allocations are a type of performance revenue (i.e., income earned based on the extent to which an entity’s performance exceeds predetermined thresholds). Performance allocations are generally structured from a legal standpoint as an allocation of capital in which the Company’s capital account receives allocations of the returns of an entity when those returns exceed predetermined thresholds. The determination of which performance revenues are considered performance allocations is primarily based on the terms of an agreement with the entity.
The Company recognizes performance allocations within investment income along with the related principal investment income (as described further below) in the condensed consolidated statements of operations and within the investments line in the condensed consolidated statements of financial condition.
When applicable, the Company may record a general partner obligation to return previously distributed performance allocations. The general partner obligation is based upon an assumed liquidation of a fund’s net assets as of the reporting date and is reported within due to related parties on the condensed consolidated statements of financial condition. The actual determination and any required payment of any such general partner obligation would not take place until the final disposition of a fund’s investments based on the contractual termination of the fund or as otherwise set forth in the respective limited partnership agreement or other governing document of the fund.
APOLLO ASSET MANAGEMENT, INC.
NOTES TO CONDENSED CONSOLIDATED
FINANCIAL STATEMENTS (UNAUDITED)
(dollars in thousands, except share data, except where noted)
Principal Investment Income
Principal investment income includes the Company’s income or loss from equity method investments and certain other investments in entities in which the Company is generally eligible to receive performance allocations. Income from equity method investments includes the Company’s share of net income or loss generated from its investments, which are not consolidated, but in which the Company exerts significant influence.
Incentive Fees
Incentive fees are a type of performance revenue. Incentive fees differ from performance allocations in that incentive fees do not represent an allocation of capital but rather a contractual fee arrangement with the entity.
Incentive fees are considered a form of variable consideration as they are subject to clawback or reversal and therefore must be deferred until the fees are probable to not be significantly reversed. Accrued but unpaid incentive fees are reported within incentive fees receivable in the Company’s condensed consolidated statements of financial condition. The Company’s incentive fees primarily relate to the yield investing strategy and are generally received from CLOs, managed accounts and AINV.
Compensation and Benefits
Salaries, Bonus and Benefits
Salaries, bonus and benefits include base salaries, discretionary and non-discretionary bonuses, severance and employee benefits. Bonuses are generally accrued over the related service period.
Equity-Based Compensation
Equity-based awards granted to employees and non-employees as compensation are measured based on the grant date fair value of the award. Equity-based awards that do not require future service (i.e., vested awards) are expensed immediately. Equity-based employee awards that require future service are expensed over the relevant service period. In addition, certain restricted share units (“RSUs”) granted by AGM vest based on both continued service and the Company’s receipt of performance revenues, within prescribed periods, sufficient to cover the associated equity-based compensation expense. In accordance with U.S. GAAP, equity-based compensation expense for such awards, if and when granted, will be recognized on an accelerated recognition method over the requisite service period to the extent the performance revenue metrics are met or deemed probable. The Company accounts for forfeitures of equity-based awards when they occur.
Profit Sharing
Profit sharing expense and profit sharing payable primarily consist of a portion of performance revenues earned from certain funds that are allocated to employees and former employees. Profit sharing amounts are recognized as the related performance revenues are earned. Accordingly, profit sharing amounts can be reversed during periods when there is a decline in performance revenues that were previously recognized.
Profit sharing amounts are generally not paid until the related performance revenue is distributed to the general partner upon realization of the fund’s investments. Under certain profit sharing arrangements, the Company requires that a portion of certain of the performance revenues distributed to its employees be used to purchase restricted common stock issued under AGM’s Equity Plan. Prior to distribution of the performance revenue, the Company records the value of the equity-based awards expected to be granted in other assets and other liabilities within the condensed consolidated statements of financial condition. Such equity-based awards are recorded as equity-based compensation expense over the relevant service period once granted.
Additionally, profit sharing amounts previously distributed may be subject to clawback from employees and former employees. When applicable, the accrual for potential clawback of previously distributed profit sharing amounts, which is a component of due from related parties on the condensed consolidated statements of financial condition, represents all amounts previously distributed to employees and former employees that would need to be returned to the general partner if the Apollo funds were to be liquidated based on the fair value of the underlying funds’ investments as of the reporting date. The actual general partner receivable, however, would not become realized until the final disposition of a fund’s investments based on the contractual termination of the fund or as otherwise set forth in the respective limited partnership agreement or other governing document of the fund.
APOLLO ASSET MANAGEMENT, INC.
NOTES TO CONDENSED CONSOLIDATED
FINANCIAL STATEMENTS (UNAUDITED)
(dollars in thousands, except share data, except where noted)
Profit sharing payable also includes contingent consideration obligations that were recognized in connection with certain Apollo acquisitions. Changes in the fair value of the contingent consideration obligations are reflected in the Company’s condensed consolidated statements of operations as profit sharing expense.
The Company has a performance-based incentive arrangement for certain Apollo partners and employees designed to more closely align compensation on an annual basis with the overall realized performance of the Company. This arrangement enables certain partners and employees to earn discretionary compensation based on performance revenue earned by the Company in a given year, which amounts are reflected in profit sharing expense in the accompanying condensed consolidated financial statements.
401(k) Savings Plan
The Company sponsors a 401(k) savings plan (the “401(k) Plan”) whereby U.S.-based employees are entitled to participate in the 401(k) Plan based upon satisfying certain eligibility requirements. The Company matches 50% of eligible annual employee contributions up to 3% of the eligible employees’ annual compensation. Matching contributions vest after three years of service.
General, Administrative and Other
General, administrative and other primarily includes professional fees, occupancy, depreciation and amortization, travel, information technology, administration expenses and placement fees.
Income Taxes
The Company is a Delaware corporation and generally all of its income is subject to U.S. corporate income taxes. Certain entities within the legal entity structure of the Company operate as partnerships for U.S. income tax purposes and are subject to NYC Unincorporated Business Tax (“UBT”). Certain non-U.S. entities are also subject to non-U.S. corporate income taxes. The Company is included in the U.S. federal consolidated and certain state combined income tax returns with AGM and its other subsidiaries. For purposes of these separate company consolidated financial statements, the Company’s taxes were determined using the separate return method as if the Company had filed tax returns separate from AGM. As a result, the tax effects of certain activity and the tax treatment of certain transactions included in the condensed consolidated financial statements of AGM may not be the same in the Company’s separate company consolidated financial statements.
Significant judgment is required in determining tax expense and in evaluating tax positions, including evaluating uncertainties. The Company’s tax positions are reviewed and evaluated quarterly to determine whether the Company has uncertain tax positions that require financial statement recognition. The Company recognizes the tax benefit of uncertain tax positions only where the position is “more likely than not” to be sustained upon examination, including resolution of any related appeals or litigation processes, based on the technical merits of the position. The tax benefit is measured as the largest amount of benefit that has a greater than 50% likelihood of being realized upon ultimate settlement. If a tax position were not considered more likely than not to be sustained, then no benefits of the position would be recognized.
Deferred tax assets and liabilities are recognized for the expected future tax consequences of differences between the financial statement carrying amount of assets and liabilities and their respective tax bases using currently enacted tax rates in the period the temporary difference is expected to reverse. The effect on deferred tax assets and liabilities of a change in tax rates is recognized in income in the period during which the change is enacted. Deferred tax assets are reduced by a valuation allowance when it is more likely than not that all or a portion of the deferred tax assets will not be realized. In determining the realizability of deferred tax assets, the Company evaluates all positive and negative evidence in addition to the ability to carry back losses, the timing of future reversals of taxable temporary differences, tax planning strategies and future expected earnings.
Non-Controlling Interests
For entities that are consolidated, but not 100% owned, a portion of the income or loss and corresponding equity is allocated to owners other than the Company. The aggregate of the income or loss and corresponding equity that is not owned by the Company is included in Non-Controlling Interests in the condensed consolidated financial statements. Prior to the Corporate Recapitalization, the Non-Controlling Interests relating to AGM included the ownership interest in the Apollo Operating Group held by Former Managing Partners and Contributing Partners through their limited partner interests in Holdings. Additionally,
APOLLO ASSET MANAGEMENT, INC.
NOTES TO CONDENSED CONSOLIDATED
FINANCIAL STATEMENTS (UNAUDITED)
(dollars in thousands, except share data, except where noted)
Athene held Non-Controlling Interests in the Apollo Operating Group as a result of the Transaction Agreement. Subsequent to the closing of the Mergers, Athene’s interest in the Apollo Operating Group was distributed to AGM. Non-Controlling Interests also include ownership interests in certain consolidated funds and VIEs.
Non-Controlling Interests are presented as a separate component of stockholders’ equity on the Company’s condensed consolidated statements of financial condition. The primary components of Non-Controlling Interests are separately presented in the Company’s condensed consolidated statements of changes in stockholders’ equity to clearly distinguish the interest in the Apollo Operating Group and other ownership interests in the consolidated entities. Net income includes the net income attributable to the holders of Non-Controlling Interests on the Company’s condensed consolidated statements of operations. Profits and losses are allocated to Non-Controlling Interests in proportion to their relative ownership interests regardless of their basis.
Guarantees
See note 15 to the condensed consolidated financial statements for information related to the Company’s material guarantees.
Recent Accounting Pronouncements
Business Combinations – Accounting for Contract Assets and Contract Liabilities from Contracts with Customers (ASU 2021-08)
In October 2021, the FASB issued guidance to add contract assets and contract liabilities from contracts with customers acquired in a business combination to the list of exceptions to the fair value recognition and measurement principles that apply to business combinations, and instead require them to be accounted for in accordance with revenue recognition guidance. The new guidance is mandatorily effective for the Company on January 1, 2023 and applied prospectively, with early adoption permitted. The Company is currently evaluating the new guidance and its impact on the consolidated financial statements.
3. GOODWILL
The carrying value of goodwill was $130.1 million and $117.0 million as of March 31, 2022 and December 31, 2021, respectively. Goodwill primarily relates to the 2007 reorganization of the Company’s predecessor business (the “2007 Reorganization”), the Company’s acquisition of Stone Tower Capital LLC and its related management companies (“Stone Tower”) in 2012 and the Company’s acquisition of PK AirFinance, an aircraft lending platform, in 2020.
In connection with the completion of the Mergers, the Company undertook a strategic review of its operating structure and business segments to assess the performance of its businesses and the allocation of resources. As a result, the Company reorganized into 2 reportable segments, asset management and principal investing. The Company conducted interim impairment testing immediately prior to and subsequent to the reorganization and determined there to be no impairment of historical goodwill.
On March 1, 2022, the Company completed the acquisition of Griffin Capital’s U.S. wealth distribution business. In connection with the acquisition, the Company recognized goodwill of $13.1 million as of the acquisition date.
APOLLO ASSET MANAGEMENT, INC.
NOTES TO CONDENSED CONSOLIDATED
FINANCIAL STATEMENTS (UNAUDITED)
(dollars in thousands, except share data, except where noted)
4. INVESTMENTS
The following table presents Apollo’s investments:
| | | | | | | | | | | |
| As of
March 31, 2022 | | As of
December 31, 2021 |
| Investments, at fair value | $ | 1,201,066 | | | $ | 5,588,992 | |
| Equity method investments | 964,689 | | | 1,345,750 | |
| Performance allocations | 3,062,672 | | | 2,731,733 | |
| U.S. Treasury Securities, at fair value | 1,742,058 | | | 1,687,105 | |
| Total Investments | $ | 6,970,485 | | | $ | 11,353,580 | |
Investments, at Fair Value
Investments, at fair value, consist of investments for which the fair value option has been elected and include the Company’s investment in Athora, investments in debt of unconsolidated CLOs and, as of December 31, 2021, included the Company’s investment in Athene Holding. Changes in the fair value related to these investments are presented in net gains (losses) from investment activities except for certain investments for which the Company is entitled to receive performance allocations. For those investments, changes in fair value are presented in principal investment income.
Prior to the Mergers, the Company’s equity investment in Athene Holding, for which the fair value option was elected, met the significance criteria as defined by the SEC as of March 31, 2021. During the first quarter of 2022, the Company’s investment in Athene Holding was distributed to AGM. As such, the following tables present summarized financial information of Athene Holding:
| | | | | | | | | | | | | |
| | For the Three Months Ended March 31, |
| 2022 | | 2021 | | |
| (in millions) |
| Statements of Operations | | | | | |
| Revenues | $ | (269) | | | $ | 4,391 | | | |
| Benefits and expenses | 2,504 | | | 4,252 | | | |
| Income (loss) before income taxes | (2,773) | | | 139 | | | |
| Income tax expense (benefit) | (407) | | | 62 | | | |
| Net income (loss) | $ | (2,366) | | | $ | 77 | | | |
| Less: Net loss attributable to non-controlling interests | (883) | | | (537) | | | |
| Net income (loss) available to Athene Holding Ltd. shareholders | (1,483) | | | 614 | | | |
| Less: Preferred stock dividends | 35 | | | 36 | | | |
| Net income (loss) available to Athene Holding Ltd. common shareholders | $ | (1,518) | | | $ | 578 | | | |
Net Gains (Losses) from Investment Activities
The following table presents the realized and net change in unrealized gains (losses) reported in net gains (losses) from investment activities:
| | | | | | | | | | | | | |
| | For the Three Months Ended March 31, |
| | 2022 | | 2021 | | |
| Realized gains (losses) on sales of investments, net | 4,843 | | | $ | 1 | | | |
| Net change in unrealized gains (losses) due to changes in fair value | 766,419 | | | 353,150 | | | |
| Net gains (losses) from investment activities | 771,262 | | | $ | 353,151 | | | |
APOLLO ASSET MANAGEMENT, INC.
NOTES TO CONDENSED CONSOLIDATED
FINANCIAL STATEMENTS (UNAUDITED)
(dollars in thousands, except share data, except where noted)
Performance Allocations
Performance allocations receivable is recorded within investments in the condensed consolidated statements of financial condition from credit, private equity and real assets funds consisted of the following:
| | | | | | | | | | | |
| As of June 30, 2021 | | As of December 31, 2020 |
| Credit | $ | 484,010 | | | $ | 465,153 | |
| Private Equity | 2,100,537 | | | 1,040,827 | |
| Real Assets | 151,946 | | | 118,176 | |
| Total performance allocations | $ | 2,736,493 | | | $ | 1,624,156 | |
condition. The table below provides a roll forward of the performance allocations balance:
| | | | | | | | | | | | | | | | | | | | | | | |
| Credit | | Private Equity | | Real Assets | | Total |
| | | | | | | |
| | | | | | | |
| | | | | | | |
| Performance allocations, January 1, 2021 | $ | 465,153 | | | $ | 1,040,827 | | | $ | 118,176 | | | $ | 1,624,156 | |
| Change in fair value of funds | 273,442 | | | 1,522,069 | | | 58,486 | | | 1,853,997 | |
| Fund distributions to the Company | (254,585) | | | (462,359) | | | (24,716) | | | (741,660) | |
| Performance allocations, June 30, 2021 | $ | 484,010 | | | $ | 2,100,537 | | | $ | 151,946 | | | $ | 2,736,493 | |
| | | | | | | | | | | | | |
| | | | | | | Total |
| Performance allocations, January 1, 2022 | | | | | | | 2,731,733 | |
| Change in fair value of funds | | | | | | | 583,308 | |
| Fund distributions to the Company | | | | | | | (252,369) | |
| Performance allocations, March 31, 2022 | | | | | | | 3,062,672 | |
| | | | | | | |
| | | | | | | |
| | | | | | | |
The change in fair value of funds excludes the general partner obligation to return previously distributed performance allocations, which is recorded in due to related parties in the condensed consolidated statements of financial condition. See note 14 for further disclosure regarding the general partner obligation.
The timing of the payment of performance allocations due to the general partner or investment manager varies depending on the terms of the applicable fund agreements. Generally, performancePerformance allocations with respect to the private equity funds and certain credit and real assets funds are payable and are distributed to the fund’s general partner upon realization of an investment if the fund’s cumulative returns are in excess of the preferred return.
APOLLO GLOBAL MANAGEMENT, INC.
NOTES TO CONDENSED CONSOLIDATED
FINANCIAL STATEMENTS (UNAUDITED)
(dollars in thousands, except share data, except where noted)
4.5. PROFIT SHARING PAYABLE
Profit sharing payable consistedwas $1.6 billion and $1.4 billion as of the following:
| | | | | | | | | | | |
| As of June 30, 2021 | | As of December 31, 2020 |
| Credit | $ | 435,211 | | | $ | 356,375 | |
| Private Equity | 1,009,378 | | | 422,079 | |
| Real Assets | 77,317 | | | 64,223 | |
| Total profit sharing payable | $ | 1,521,906 | | | $ | 842,677 | |
March 31, 2022 and December 31, 2021, respectively. The table below provides a roll-forwardroll forward of the profit sharing payable balance:
| | | | | | | | | | | | | | | | | | | | | | | |
| Credit | | Private Equity | | Real Assets | | Total |
| | | | | | | |
| | | | | | | |
| | | | | | | |
| Profit sharing payable, January 1, 2021 | $ | 356,375 | | | $ | 422,079 | | | $ | 64,223 | | | $ | 842,677 | |
| Profit sharing expense | 189,553 | | | 740,289 | | | 30,415 | | | 960,257 | |
| Payments/other | (110,717) | | | (152,990) | | | (17,321) | | | (281,028) | |
| Profit sharing payable, June 30, 2021 | $ | 435,211 | | | $ | 1,009,378 | | | $ | 77,317 | | | $ | 1,521,906 | |
| | | | | | | | |
| | Total |
| Profit sharing payable, January 1, 2022 | | $ | 1,444,652 | |
| Profit sharing expense | | 354,667 | |
| Payments/other | | (175,465) | |
| Profit sharing payable, March 31, 2022 | | $ | 1,623,854 | |
| | |
| | |
| | |
Profit sharing expense includes (i) changes in amounts payable to employees and former employees entitled to a share of performance revenues in Apollo’s funds and (ii) changes to the fair value of the contingent consideration obligations recognized in connection with certain Apollo acquisitions. Profit sharing expense excludes the potential return of profit sharing distributions that would be due if certain funds were liquidated, which is recorded in due from related parties in the condensed consolidated statements of financial condition. See note 14 for further disclosure regarding the potential return of profit sharing distributions.
As discussed in note 2, under certain profit sharing arrangements, the Company requires that a portion of certain of the performance revenues distributed to its employees of AAM be used to purchase restricted shares of Class A Common StockAGM’s common stock issued under itsAGM’s Equity Plan. Prior to distribution of the performance revenues, the Company records the value of the equity-based awards expected to be granted in other assets and other liabilities within the condensed consolidated statements of financial condition. See note 78 for further disclosure regarding deferred equity-based compensation.
5.6. VARIABLE INTEREST ENTITIES
As describedA variable interest in a VIE is an investment or other interest that will absorb portions of the VIE’s expected losses and/or receive expected residual returns. Please refer to note 2 for more detail about the Company consolidates entities thatCompany’s variable interest entity (VIE) assessment and consolidation policy. Variable interests in consolidated VIEs and unconsolidated VIEs are VIEs for which the Company has been designated as the primary beneficiary.discussed separately below.
Consolidated Variable Interest Entities
As noted further in note 14, Apollo purchased a 17% incremental equity ownership stake in Athene on February 28, 2020, bringing Apollo’s beneficial ownership in Athene to approximately 28.4% as of June 30, 2021. This has resulted in Apollo’s indirect ownership through Athene in several VIEs being considered significant and therefore Apollo has consolidated the financial positions and results of operations of such VIEs given that the Company also has the power to direct the activities that most significantly impact the economic performance of these VIEs.
Consolidated VIEs include certain CLOsconsolidated SPACs as well as certain CLOs and funds managed by the Company. Through its role as collateral manager, investment manager or general partnerThe financial information for these consolidated SPACs are disclosed in note 14.
The assets of theseconsolidated VIEs the Company has the power to direct the activities that most significantly impact the economic performance of these VIEs. In addition, the Company’s combined interests in these VIEs are significant. The assets are not available to creditors of the Company, and the investors in these consolidated VIEs have no recourse against the assets of the Company. ThereSimilarly, there is no recourse to the Company for the consolidated VIEs’ liabilities.
The Company measures the fair value of the financial assets and the financial liabilities of the CLOs using the fair value of either the financial assets or financial liabilities, whichever is more observable (see note 2 for further discussion). The Company has elected the fair value option for financial instruments held by its consolidated CLOs, which includes investments in loans and corporate bonds, as well as debt obligations and contingent obligations. Other assets include amounts due from
APOLLO GLOBALASSET MANAGEMENT, INC.
NOTES TO CONDENSED CONSOLIDATED
FINANCIAL STATEMENTS (UNAUDITED)
(dollars in thousands, except share data, except where noted)
brokersOther assets include interest receivables, receivables from affiliates and interest receivables.due from brokers. Other liabilities include payables for securities purchased, which represent open trades within the consolidated CLOs and primarily relate to corporate loans that are expected to settle within 60 days.
The consolidated funds managed by the Company are investment companies and their investments, which include equity securities as well as debt securities, are held at fair value. Other assets of the consolidated funds include interest receivables and receivables from affiliates. Other liabilities includedays, debt held at amortized cost as well asand short-term payables.
Included within liabilities of the consolidated VIEs are notes payable related to certain funds managed by the Company. Each series of notes in a respective consolidated VIE participates in distributions from the VIE, including principal and interest from underlying investments, in accordance with the terms of the note series.investments. Amounts allocated to the noteholders reflect amounts that would be distributed if the VIE’s affairsassets were wound up and its assets soldliquidated for cash equal to their respective carrying values, its liabilities satisfied in accordance with their terms, and all the remaining amounts distributed to the noteholders. The respective VIEs that issue the notes payable are marked at their prevailing net asset value, which approximates fair value.
Results from certain funds managed by the Company are reported on a three month lag based upon the availability of financial information.
Net Gains (Losses) from Investment Activities of Consolidated Variable Interest Entities
The following table presents net gains from investment activities of the consolidated VIEs:
| | | | | | | | | | | | | | | | | | | | | | | | | | |
| | For the Three Months Ended
June 30, | | For the Six Months Ended
June 30, | |
| | 2021 | (1) | 2020 | (1) | 2021 | (1) | 2020 | (1) |
| Net gains (losses) from investment activities | $ | 51,173 | | | $ | 478,480 | | | $ | 355,574 | | | $ | (500,744) | | |
| Net gains (losses) from debt | (2,519) | | | (353,182) | | | (11,527) | | | 181,269 | | |
| Interest and other income | 228,420 | | | 84,609 | | | 362,758 | | | 236,051 | | |
| Interest and other expenses | (131,671) | | | (152,045) | | | (448,808) | | | (24,634) | | |
| Net gains (losses) from investment activities of consolidated variable interest entities | $ | 145,403 | | | $ | 57,862 | | | $ | 257,997 | | | $ | (108,058) | | |
(1)Amounts reflect consolidation eliminations. | | | | | | | | | | | | | | | | |
| | For the Three Months Ended March 31, | |
| | 2022 | (1) | 2021 | (1) | | |
| Net gains (losses) from investment activities | $ | 90,831 | | | $ | 304,401 | | | | |
| Net gains (losses) from debt | 10,138 | | | (9,008) | | | | |
| Interest and other income | 167,051 | | | 134,338 | | | | |
| Interest and other expenses | 11,435 | | | (317,137) | | | | |
| Net gains from investment activities of consolidated variable interest entities | $ | 279,455 | | | $ | 112,594 | | | | |
| | | | | | |
(1) Amounts reflect consolidation eliminations. | | |
Senior Secured Notes, Subordinated Notes and Secured Borrowings
Included within debt, at fair value and other liabilities are amounts due to third-party institutions by the consolidated VIEs. The following table summarizes the principal provisions of those amounts:amounts as of December 31, 2021.
| | | | | | | | | | | | | | | | | | | | | | | | | | | | | | | | | | | |
| | As of June 30, 2021 | | As of December 31, 2020 |
| | Principal Outstanding | | Weighted Average Interest Rate | | Weighted Average Remaining Maturity in Years | | Principal Outstanding | | Weighted Average Interest Rate | | Weighted Average Remaining Maturity in Years |
Senior Secured Notes(2) | $ | 4,851,818 | | | 1.98 | % | | 12.9 | | $ | 5,350,198 | | | 2.10 | % | | 6.0 |
Subordinated Notes(2) | 3,453,339 | | | 5.03 | % | (1) | 32 | | 3,389,375 | | | 5.08 | % | (1) | 21.1 |
Secured Borrowings(2)(3) | 109,606 | | | 2.18 | % | | 0.4 | | 236,698 | | | 2.41 | % | | 0.3 |
| Total | $ | 8,414,763 | | | | | | | $ | 8,976,271 | | | | | |
(1)As of June 30, 2021 and DecemberMarch 31, 2020, $0.7 billion and $0.6 billion, respectively, of the principal outstanding balance of the subordinated notes do not have contractual interest rates but instead receive distributions from the excess cash flows of the VIEs.
(2)The notes and borrowings of the consolidated VIEs are collateralized by assets held by each respective vehicle and assets of one vehicle may not be used to satisfy the liabilities of another vehicle. As of June 30, 2021 and December 31, 2020, the fair value of these consolidated VIEs’ assets were $9.1 billion and $9.6 billion, respectively.
APOLLO GLOBAL MANAGEMENT, INC.
NOTES TO CONDENSED CONSOLIDATED
FINANCIAL STATEMENTS (UNAUDITED)
(dollars in thousands, except share data, except where noted)
(3)As of June 30, 2021 and December 31, 2020, secured borrowings consist of consolidated VIEs’ obligations through a repurchase agreement redeemable at maturity with third party lenders. The fair value of the secured borrowings as of June 30, 2021 and December 31, 2020 approximates2022, there was no principal outstanding due to the short term naturethird-party institutions for these borrowings as a result of the borrowings. These secured borrowings are classified as a Level III liability within the fair value hierarchy.deconsolidation of VIEs.
The consolidated VIEs’ debt obligations contain various customary loan covenants. As of June 30, 2021, the Company was not aware of any instances of non-compliance with any of these covenants. | | | | | | | | | | | | | | | | | | | | | | | | | |
| | | | As of December 31, 2021 |
| | | | | | | | Principal Outstanding | | Weighted Average Interest Rate | | Weighted Average Remaining Maturity in Years |
Senior Secured Notes(2) | | | | | | | $ | 7,431,467 | | | 3.16 | % | | 15.5 |
Subordinated Notes(2) | | | | | | | 613,192 | | | N/A | (1) | 14.5 |
Secured Borrowings(2)(3) | | | | | | | 18,149 | | | 2.33 | % | | 0.4 |
| Total | | | | | | | $ | 8,062,808 | | | | | |
| | | | | | | | | | | |
(1) The principal outstanding balance of the subordinated notes do not have contractual interest rates but instead receive distributions from the excess cash flows of the VIEs. |
(2) The notes and borrowings of the consolidated VIEs are collateralized by assets held by each respective vehicle and assets of one vehicle may not be used to satisfy the liabilities of another vehicle. |
(3) As of December 31, 2021, secured borrowings consist of consolidated VIEs’ obligations through a repurchase agreement redeemable at maturity with third party lenders. The fair value of the secured borrowings as of December 31, 2021 approximates principal outstanding due to the short term nature of the borrowings. These secured borrowings are classified as a Level III liability within the fair value hierarchy. |
As of June 30, 2021, except for the secured borrowings, the contractual maturities for debt of the consolidated VIEs are greater than 10 years.
Unconsolidated Variable Interest Entities Which are Not Consolidated
The Company holds variable interests in certain VIEs which are not consolidated, as it has been determined that Apollo is not the primary beneficiary.
The following table presents the carrying amounts of the assets and liabilities of themaximum exposure to losses relating to these VIEs for which Apollo has concluded that it holds a significant variable interest, but that it is not the primary beneficiary. In addition, the table presents the maximum exposure to losses relating to these VIEs.
| | | | | | | | | | | |
| As of
June 30, 2021 | (2) | As of
December 31, 2020 |
| Assets: | | | |
| Cash | $ | 299,882 | | | $ | 354,109 | |
| Investments | 4,153,458 | | | 4,154,057 | |
| Receivables | 68,564 | | | 34,800 | |
| Total Assets | $ | 4,521,904 | | | $ | 4,542,966 | |
| | | |
| Liabilities: | | | |
| Debt and other payables | $ | 1,315,315 | | | $ | 1,229,345 | |
| | | |
| | | |
| Total Liabilities | $ | 1,315,315 | | | $ | 1,229,345 | |
| | | |
Apollo Exposure(1) | $ | 157,106 | | | $ | 155,273 | |
(1)Represents Apollo’s direct investment in those entities in which Apollo holds a significant variable interest and certain other investments. Additionally, cumulative performance allocations are subject to reversal in the event of future losses, as discussed in note 15.
(2)Some amounts included are a quarter in arrears.
APOLLO GLOBALASSET MANAGEMENT, INC.
NOTES TO CONDENSED CONSOLIDATED
FINANCIAL STATEMENTS (UNAUDITED)
(dollars in thousands, except share data, except where noted)
6. | | | | | | | | | | | |
| As of
March 31, 2022 | (2) | As of
December 31, 2021 |
| | | |
| | | |
| | | |
| | | |
| | | |
| | | |
| | | |
| | | |
| | | |
| | | |
| | | |
| | | |
Apollo Exposure(1) | $ | 217,331 | | | $ | 240,871 | |
| | | |
(1) Represents Apollo’s direct investment in those entities in which Apollo holds a significant variable interest and certain other investments. Additionally, cumulative performance allocations are subject to reversal in the event of future losses, as discussed in note 15. |
(2) Some amounts included are a quarter in arrears. |
7. FAIR VALUE MEASUREMENTS OF FINANCIAL INSTRUMENTS
The following tables summarize the Company’s financial assets and financial liabilities recorded at fair value by fair value hierarchy level:
| | | | | | | | | | | | | | | | | | | | | | | | | | | | | |
| | As of June 30, 2021 |
| Level I | | Level II | | Level III | | Total | | Cost |
| Assets | | | | | | | | | |
| U.S. Treasury securities, at fair value | $ | 1,492,112 | | | $ | 0 | | | $ | 0 | | | $ | 1,492,112 | | | $ | 1,492,104 | |
| Investments, at fair value: | | | | | | | | | |
| Investment in Athene Holding | 0 | | | 3,208,968 | | | 0 | | | 3,208,968 | | | 2,092,247 | |
| | | | | | | | | |
| Other investments | 37,365 | | | 45,835 | | | 389,787 | | (1) | 472,987 | | | 391,178 | |
| Total investments, at fair value | 37,365 | | | 3,254,803 | | | 389,787 | | | 3,681,955 | | | 2,483,425 | |
| Investments of VIEs, at fair value | 5,321 | | | 1,534,816 | | | 11,877,952 | | | 13,418,089 | | | |
| Investments of VIEs, valued using NAV | 0 | | | 0 | | | 0 | | | 241,542 | | | |
| Total investments of VIEs, at fair value | 5,321 | | | 1,534,816 | | | 11,877,952 | | | 13,659,631 | | | |
| | | | | | | | | |
| Total Assets | $ | 1,534,798 | | | $ | 4,789,619 | | | $ | 12,267,739 | | | $ | 18,833,698 | | | |
| | | | | | | | | |
| Liabilities | | | | | | | | | |
| Debt of VIEs, at fair value | $ | 0 | | | $ | 893,650 | | | $ | 7,183,638 | | | $ | 8,077,288 | | | |
| Other liabilities of VIEs, at fair value | 0 | | | 4,060 | | | 22,536 | | | 26,596 | | | |
Contingent consideration obligations(3) | 0 | | | 0 | | | 128,984 | | | 128,984 | | | |
Other liabilities(4) | 51,389 | | | 0 | | | 0 | | | 51,389 | | | |
| | | | | | | | | |
| Total Liabilities | $ | 51,389 | | | $ | 897,710 | | | $ | 7,335,158 | | | $ | 8,284,257 | | | |
| | | | | | | | | | | | | | | | | | | | | | | | | | | | | |
| | As of March 31, 2022 |
| Level I | | Level II | | Level III | | NAV | | Total |
| Assets | | | | | | | | | |
Cash and cash equivalents(1) | $ | 1,245,606 | | | $ | — | | | $ | — | | | $ | — | | | $ | 1,245,606 | |
Restricted cash and cash equivalents(2) | 1,037,673 | | | — | | | — | | | — | | | 1,037,673 | |
U.S. Treasury securities(3) | 1,742,058 | | | — | | | — | | | — | | | 1,742,058 | |
| Investments, at fair value | 69,457 | | | 44,714 | | | 1,086,895 | | (4) | — | | | 1,201,066 | |
| Investments of VIEs | — | | | — | | | 454,787 | | | 834 | | | 455,621 | |
Due from related parties(5) | — | | | — | | | 39,074 | | | — | | | 39,074 | |
Derivative assets(6) | — | | | 3,741 | | | — | | | — | | | 3,741 | |
| Total Assets | $ | 4,094,794 | | | $ | 48,455 | | | $ | 1,580,756 | | | $ | 834 | | | $ | 5,724,839 | |
| | | | | | | | | |
| Liabilities | | | | | | | | | |
| Debt of VIEs | $ | — | | | $ | 162 | | | $ | — | | | $ | — | | | $ | 162 | |
| | | | | | | | | |
| | | | | | | | | |
Contingent consideration obligations(7) | — | | | — | | | 110,458 | | | — | | | 110,458 | |
Other liabilities(8) | 45,305 | | | — | | | — | | | — | | | 45,305 | |
Derivative liabilities(6) | — | | | 11,590 | | | — | | | — | | | 11,590 | |
| Total Liabilities | $ | 45,305 | | | $ | 11,752 | | | $ | 110,458 | | | $ | — | | | $ | 167,515 | |
| | | | | | | | | | | | | | | | | | | | | | | | | | | | | |
| | As of December 31, 2020 |
| Level I | | Level II | | Level III | | Total | | Cost |
| Assets | | | | | | | | | |
| U.S. Treasury securities, at fair value | $ | 1,816,958 | | | $ | 0 | | | $ | 0 | | | $ | 1,816,958 | | | $ | 1,816,635 | |
| Investments, at fair value: | | | | | | | | | |
| Investment in Athene Holding | 0 | | | 1,942,574 | | | 0 | | | 1,942,574 | | | 2,092,247 | |
| Other investments | 0 | | | 48,088 | | | 369,772 | | (1) | 417,860 | | | 354,010 | |
| Total investments, at fair value | 0 | | | 1,990,662 | | | 369,772 | | | 2,360,434 | | | 2,446,257 | |
| Investments of VIEs, at fair value | 2,558 | | | 2,140,135 | | | 10,962,980 | | | 13,105,673 | | | |
| Investments of VIEs, valued using NAV | 0 | | | 0 | | | 0 | | | 210,343 | | | |
| Total investments of VIEs, at fair value | 2,558 | | | 2,140,135 | | | 10,962,980 | | | 13,316,016 | | | |
Derivative assets(2) | 0 | | | 17 | | | 0 | | | 17 | | | |
| Total Assets | $ | 1,819,516 | | | $ | 4,130,814 | | | $ | 11,332,752 | | | $ | 17,493,425 | | | |
| | | | | | | | | |
| Liabilities | | | | | | | | | |
| Debt of VIEs, at fair value | $ | 0 | | | $ | 1,580,097 | | | $ | 7,080,418 | | | $ | 8,660,515 | | | |
| Other liabilities of VIEs, at fair value | 0 | | | 3,874 | | | 20,202 | | | 24,076 | | | |
Contingent consideration obligations(3) | 0 | | | 0 | | | 119,788 | | | 119,788 | | | |
Derivative liabilities(2) | 0 | | | 100 | | | 0 | | | 100 | | | |
| Total Liabilities | $ | 0 | | | $ | 1,584,071 | | | $ | 7,220,408 | | | $ | 8,804,479 | | | |
(1) Other investments as of June 30, 2021 and December 31, 2020 excludes $93.3 million and $44.4 million, respectively, of performance allocations classified as Level III related to certain investments for which the Company has elected the fair value option. The Company’s policy is to account for performance allocations as investments.
(2) Derivative assets and derivative liabilities are presented as a component of Other assets and Other liabilities, respectively, in the condensed consolidated statements of financial condition.
(3) Profit sharing payable includes contingent obligations classified as Level III.
(4) Other liabilities includes the publicly traded warrants of APSG and APSG II.
APOLLO GLOBALASSET MANAGEMENT, INC.
NOTES TO CONDENSED CONSOLIDATED
FINANCIAL STATEMENTS (UNAUDITED)
(dollars in thousands, except share data, except where noted)
| | | | | | | | | | | | | | | | | | | | | | | | | | | | | |
| | As of December 31, 2021 |
| Level I | | Level II | | Level III | | NAV | | Total |
| Assets | | | | | | | | | |
Cash and cash equivalents(1) | $ | 917,183 | | | $ | — | | | $ | — | | | $ | — | | | $ | 917,183 | |
Restricted cash and cash equivalents(2) | 707,885 | | | — | | | — | | | — | | | 707,885 | |
U.S. Treasury securities(3) | 1,687,105 | | | — | | | — | | | — | | | 1,687,105 | |
| Investments | | | | | | | | | |
| Investment in Athene Holding | 4,548,048 | | | — | | | — | | | — | | | 4,548,048 | |
| Other investments | 48,493 | | | 46,267 | | | 946,184 | | (4) | — | | | 1,040,944 | |
| Total investments | 4,596,541 | | | 46,267 | | | 946,184 | | | — | | | 5,588,992 | |
| Investments of VIEs | 6,232 | | | 1,055,421 | | | 13,187,803 | | | 487,595 | | | 14,737,051 | |
Due from related parties(5) | — | | | — | | | 47,835 | | | — | | | 47,835 | |
Derivative assets(6) | — | | | 7,436 | | | — | | | — | | | 7,436 | |
| Total Assets | $ | 7,914,946 | | | $ | 1,109,124 | | | $ | 14,181,822 | | | $ | 487,595 | | | $ | 23,693,487 | |
| | | | | | | | | |
| Liabilities | | | | | | | | | |
| Debt of VIEs, at fair value | $ | — | | | $ | 446,029 | | | $ | 7,496,479 | | | $ | — | | | $ | 7,942,508 | |
| Other liabilities of VIEs | — | | | 3,111 | | | 31,090 | | | 557 | | | 34,758 | |
Contingent consideration obligations(7) | — | | | — | | | 125,901 | | | — | | | 125,901 | |
Other liabilities(8) | 47,961 | | | — | | | — | | | — | | | 47,961 | |
Derivative liabilities(6) | — | | | 1,520 | | | — | | | — | | | 1,520 | |
| Total Liabilities | $ | 47,961 | | | $ | 450,660 | | | $ | 7,653,470 | | | $ | 557 | | | $ | 8,152,648 | |
| | | | | | | | | |
(1) Cash and cash equivalents as of March 31, 2022 and December 31, 2021 includes $0.9 million and $1.8 million, respectively, of cash and cash equivalents held by consolidated SPACs. Refer to note 14 for further information. |
(2) Restricted cash and cash equivalents as of March 31, 2022 and December 31, 2021 includes $1.0 billion and 0.7 billion, respectively, of restricted cash and cash equivalents held by consolidated SPACs. Refer to note 14 for further information. |
(3) U.S. Treasury securities as of March 31, 2022 and December 31, 2021 includes $0.8 billion and $1.2 billion, respectively, of U.S. Treasury securities held by consolidated SPACs. Refer to note 14 for further information. |
(4) Investments as of March 31, 2022 and December 31, 2021 excludes $165.9 million and $175.8 million, respectively, of performance allocations classified as Level III related to certain investments for which the Company has elected the fair value option. The Company’s policy is to account for performance allocations as investments. |
(5) Due from related parties represents a receivable from a fund. |
(6) Derivative assets and derivative liabilities are presented as a component of Other assets and Other liabilities, respectively, in the condensed consolidated statements of financial condition. |
(7) Profit sharing payable includes contingent obligations classified as Level III. |
(8) Other liabilities includes the publicly traded warrants of APSG I and APSG II. |
APOLLO ASSET MANAGEMENT, INC.
NOTES TO CONDENSED CONSOLIDATED
FINANCIAL STATEMENTS (UNAUDITED)
(dollars in thousands, except share data, except where noted)
The following tables summarize the changes in fair value in financial assets measured at fair value for which Level III inputs have been used to determine fair value:
| | | | | For the Three Months Ended June 30, 2021 | | | For the Three Months Ended March 31, 2022 |
| | | Other Investments | | Investments of Consolidated VIEs | | Total | | | Investments | | Investments of Consolidated VIEs | | Total |
| Balance, Beginning of Period | Balance, Beginning of Period | | $ | 381,277 | | | $ | 11,947,443 | | | $ | 12,328,720 | | Balance, Beginning of Period | | $ | 946,184 | | | $ | 13,187,803 | | | $ | 14,133,987 | |
| Transfer out due to deconsolidation | | 0 | | | (229,717) | | | (229,717) | | |
| Net transfer in (out) due to consolidation (deconsolidation) | | Net transfer in (out) due to consolidation (deconsolidation) | | 21,710 | | | (14,190,236) | | | (14,168,526) | |
| Purchases | Purchases | | 0 | | | 692,073 | | | 692,073 | | Purchases | | 103,224 | | | 2,418,129 | | | 2,521,353 | |
| Sales of investments/distributions | | (3,235) | | | (557,994) | | | (561,229) | | |
| Sale of investments/distributions | | Sale of investments/distributions | | (2,694) | | | (1,192,531) | | | (1,195,225) | |
| | Net realized gains | Net realized gains | | 3 | | | 7,087 | | | 7,090 | | Net realized gains | | 1,596 | | | 11,766 | | | 13,362 | |
| Changes in net unrealized gains | Changes in net unrealized gains | | 9,137 | | | 19,746 | | | 28,883 | | Changes in net unrealized gains | | 28,465 | | | 203,795 | | | 232,260 | |
| Cumulative translation adjustment | Cumulative translation adjustment | | 2,605 | | | 4,807 | | | 7,412 | | Cumulative translation adjustment | | (11,590) | | | (10,808) | | | (22,398) | |
Transfer into Level III(1) | Transfer into Level III(1) | | 0 | | | 7,219 | | | 7,219 | | Transfer into Level III(1) | | — | | | 29,803 | | | 29,803 | |
Transfer out of Level III(1) | Transfer out of Level III(1) | | 0 | | | (12,712) | | | (12,712) | | Transfer out of Level III(1) | | — | | | (2,934) | | | (2,934) | |
| Balance, End of Period | Balance, End of Period | | $ | 389,787 | | | $ | 11,877,952 | | | $ | 12,267,739 | | Balance, End of Period | | $ | 1,086,895 | | | $ | 454,787 | | | $ | 1,541,682 | |
| Change in net unrealized gains included in net gains from investment activities related to investments still held at reporting date | | $ | 9,137 | | | $ | 0 | | | $ | 9,137 | | |
| Change in net unrealized gains included in principal investment income related to investments still held at reporting date | | Change in net unrealized gains included in principal investment income related to investments still held at reporting date | | $ | 28,465 | | | $ | — | | | $ | 28,465 | |
| Change in net unrealized gains included in net gains (losses) from investment activities of consolidated VIEs related to investments still held at reporting date | Change in net unrealized gains included in net gains (losses) from investment activities of consolidated VIEs related to investments still held at reporting date | | 0 | | | 66,050 | | | 66,050 | | Change in net unrealized gains included in net gains (losses) from investment activities of consolidated VIEs related to investments still held at reporting date | | — | | | 81,204 | | | 81,204 | |
| | | | For the Three Months Ended June 30, 2020 | | For the Three Months Ended March 31, 2021 |
| | Other Investments | | Investments of Consolidated VIEs | | Total | | Investments | | Investments of Consolidated VIEs | | Total |
| Balance, Beginning of Period | Balance, Beginning of Period | $ | 118,112 | | | $ | 7,640,903 | | | $ | 7,759,015 | | Balance, Beginning of Period | $ | 369,772 | | | $ | 10,962,980 | | | $ | 11,332,752 | |
| | Purchases | Purchases | 128,551 | | | 530,348 | | | 658,899 | | Purchases | — | | | 990,350 | | | 990,350 | |
| Sale of investments/distributions | Sale of investments/distributions | (966) | | | (154,724) | | | (155,690) | | Sale of investments/distributions | — | | | (247,939) | | | (247,939) | |
| Settlements | 0 | | | (252,776) | | | (252,776) | | |
| | Net realized gains | Net realized gains | 966 | | | 1,355 | | | 2,321 | | Net realized gains | 1,065 | | | 5,888 | | | 6,953 | |
| Changes in net unrealized gains | 16,443 | | | 308,146 | | | 324,589 | | |
| Changes in net unrealized gains (losses) | | Changes in net unrealized gains (losses) | 19,979 | | | 312,401 | | | 332,380 | |
| Cumulative translation adjustment | Cumulative translation adjustment | 4,521 | | | 7,637 | | | 12,158 | | Cumulative translation adjustment | (10,245) | | | (19,055) | | | (29,300) | |
Transfer into Level III(1) | Transfer into Level III(1) | 0 | | | 1,706 | | | 1,706 | | Transfer into Level III(1) | 706 | | | 2,666 | | | 3,372 | |
Transfer out of Level III(1) | Transfer out of Level III(1) | (274) | | | (67,015) | | | (67,289) | | Transfer out of Level III(1) | — | | | (59,848) | | | (59,848) | |
| Balance, End of Period | Balance, End of Period | $ | 267,353 | | | $ | 8,015,580 | | | $ | 8,282,933 | | Balance, End of Period | $ | 381,277 | | | $ | 11,947,443 | | | $ | 12,328,720 | |
| Change in net unrealized gains included in net gains from investment activities related to investments still held at reporting date | $ | 16,442 | | | $ | 0 | | | $ | 16,442 | | |
| Change in net unrealized gains included in net gains (losses) from investment activities of consolidated VIEs related to investments still held at reporting date | 0 | | | 70,639 | | | 70,639 | | |
| Change in net unrealized gains included in principal investment income related to investments still held at reporting date | | Change in net unrealized gains included in principal investment income related to investments still held at reporting date | $ | 19,979 | | | $ | — | | | $ | 19,979 | |
| Change in net unrealized losses included in net gains (losses) from investment activities of consolidated VIEs related to investments still held at reporting date | | Change in net unrealized losses included in net gains (losses) from investment activities of consolidated VIEs related to investments still held at reporting date | — | | | 129,731 | | | 129,731 | |
| (1) Transfers between Level II and III were a result of subjecting the broker quotes on these financial assets to various criteria which include the number and quality of broker quotes, the standard deviation of obtained broker quotes and the percentage deviation from external pricing services. | | (1) Transfers between Level II and III were a result of subjecting the broker quotes on these financial assets to various criteria which include the number and quality of broker quotes, the standard deviation of obtained broker quotes and the percentage deviation from external pricing services. |
APOLLO GLOBAL MANAGEMENT, INC.
NOTES TO CONDENSED CONSOLIDATED
FINANCIAL STATEMENTS (UNAUDITED)
(dollars in thousands, except share data, except where noted)
| | | | | | | | | | | | | | | | | | | |
| | | | For the Six Months Ended June 30, 2021 |
| | | Other Investments | | Investments of Consolidated VIEs | | Total |
| Balance, Beginning of Period | | | $ | 369,772 | | | $ | 10,962,980 | | | $ | 11,332,752 | |
| Transfer out due to deconsolidation | | | 0 | | | (229,717) | | | (229,717) | |
| Purchases | | | 0 | | | 1,682,423 | | | 1,682,423 | |
| Sale of investments/distributions | | | (3,235) | | | (805,933) | | | (809,168) | |
| | | | | | | |
| Net realized gains | | | 1,068 | | | 12,975 | | | 14,043 | |
| Changes in net unrealized gains | | | 29,116 | | | 332,147 | | | 361,263 | |
| Cumulative translation adjustment | | | (7,640) | | | (14,248) | | | (21,888) | |
Transfer into Level III(1) | | | 706 | | | 9,885 | | | 10,591 | |
Transfer out of Level III(1) | | | 0 | | | (72,560) | | | (72,560) | |
| Balance, End of Period | | | $ | 389,787 | | | $ | 11,877,952 | | | $ | 12,267,739 | |
| Change in net unrealized gains included in principal investment income related to investments still held at reporting date | | | $ | 29,116 | | | $ | 0 | | | $ | 29,116 | |
| Change in net unrealized gains included in net gains (losses) from investment activities of consolidated VIEs related to investments still held at reporting date | | | 0 | | | 198,957 | | | 198,957 | |
| | | | | | | | | | | | | | | | | |
| | For the Six Months Ended June 30, 2020 |
| Other Investments | | Investments of Consolidated VIEs | | Total |
| Balance, Beginning of Period | $ | 113,410 | | | $ | 321,069 | | | $ | 434,479 | |
| Transfer in due to consolidation | 0 | | | 7,794,128 | | | 7,794,128 | |
| Purchases | 159,955 | | | 859,580 | | | 1,019,535 | |
| Sale of investments/distributions | (9,378) | | | (183,877) | | | (193,255) | |
| Settlements | 0 | | | (437,948) | | | (437,948) | |
| Net realized gains | 1,751 | | | 121 | | | 1,872 | |
| Changes in net unrealized losses | (1,181) | | | (334,556) | | | (335,737) | |
| Cumulative translation adjustment | 3,070 | | | (3,784) | | | (714) | |
Transfer into Level III(1) | 0 | | | 70,636 | | | 70,636 | |
Transfer out of Level III(1) | (274) | | | (69,789) | | | (70,063) | |
| Balance, End of Period | $ | 267,353 | | | $ | 8,015,580 | | | $ | 8,282,933 | |
| Change in net unrealized losses included in principal investment income related to investments still held at reporting date | $ | (1,181) | | | $ | 0 | | | $ | (1,181) | |
| Change in net unrealized losses included in net gains (losses) from investment activities of consolidated VIEs related to investments still held at reporting date | 0 | | | (47,303) | | | (47,303) | |
(1)Transfers between Level II and III were a result of subjecting the broker quotes on these financial assets to various criteria which include the number and quality of broker quotes, the standard deviation of obtained broker quotes and the percentage deviation from external pricing services.
APOLLO GLOBAL MANAGEMENT, INC.
NOTES TO CONDENSED CONSOLIDATED
FINANCIAL STATEMENTS (UNAUDITED)
(dollars in thousands, except share data, except where noted)
The following table summarizes the changes in fair value in financial liabilities measured at fair value for which Level III inputs have been used to determine fair value:
| | | | | | | | | | | | | | | | | |
| | For the Three Months Ended June 30, 2021 |
| |
| Contingent Consideration Obligations | | Debt and Other Liabilities of Consolidated VIEs | | Total |
| Balance, Beginning of Period | $ | 113,222 | | | $ | 7,317,250 | | | $ | 7,430,472 | |
| | | | | |
| Issuances | 0 | | | 101,871 | | | 101,871 | |
| Repayments | (792) | | | (227,251) | | | (228,043) | |
| Net realized losses | 0 | | | 10,239 | | | 10,239 | |
Changes in net unrealized (gains) losses(1) | 16,554 | | | (8,346) | | | 8,208 | |
| Cumulative translation adjustment | 0 | | | 12,214 | | | 12,214 | |
Transfer into Level III(2) | 0 | | | 197 | | | 197 | |
| Balance, End of Period | $ | 128,984 | | | $ | 7,206,174 | | | $ | 7,335,158 | |
| Change in net unrealized gains included in net gains (losses) from investment activities of consolidated VIEs related to debt and other liabilities still held at reporting date | $ | 0 | | | $ | (5,559) | | | $ | (5,559) | |
| | | | | | | | | | | | | | | | | |
| | For the Three Months Ended June 30, 2020 |
| |
| Contingent Consideration Obligations | | Debt and Other Liabilities of Consolidated VIEs | | Total |
| Balance, Beginning of Period | $ | 76,700 | | | $ | 3,795,866 | | | $ | 3,872,566 | |
| | | | | |
| Issuances | 0 | | | 213,828 | | | 213,828 | |
| Repayments | (219) | | | (18,750) | | | (18,969) | |
| Net realized losses | 0 | | | 3,459 | | | 3,459 | |
Changes in net unrealized losses(1) | 22,616 | | | 255,950 | | | 278,566 | |
| Cumulative translation adjustment | 0 | | | 8,394 | | | 8,394 | |
| Balance, End of Period | $ | 99,097 | | | $ | 4,258,747 | | | $ | 4,357,844 | |
| Change in net unrealized losses included in net gains (losses) from investment activities of consolidated VIEs related to debt and other liabilities still held at reporting date | $ | 0 | | | $ | 172,730 | | | $ | 172,730 | |
| | | | | | | | | | | | | | | | | |
| | For the Six Months Ended June 30, 2021 |
| |
| Contingent Consideration Obligations | | Debt and Other Liabilities of Consolidated VIEs | | Total |
| Balance, Beginning of Period | $ | 119,788 | | | $ | 7,100,620 | | | $ | 7,220,408 | |
| | | | | |
| Issuances | 0 | | | 311,408 | | | 311,408 | |
| Repayments | (13,114) | | | (271,904) | | | (285,018) | |
| Net realized losses | 0 | | | 10,730 | | | 10,730 | |
Changes in net unrealized losses(1) | 22,310 | | | 69,146 | | | 91,456 | |
| Cumulative translation adjustment | 0 | | | (14,023) | | | (14,023) | |
Transfer into Level III(2) | 0 | | | 197 | | | 197 | |
| Balance, End of Period | $ | 128,984 | | | $ | 7,206,174 | | | $ | 7,335,158 | |
| Change in net unrealized gains included in net gains (losses) from investment activities of consolidated VIEs related to debt and other liabilities still held at reporting date | $ | 0 | | | $ | (58,909) | | | $ | (58,909) | |
APOLLO GLOBAL MANAGEMENT, INC.
NOTES TO CONDENSED CONSOLIDATED
FINANCIAL STATEMENTS (UNAUDITED)
(dollars in thousands, except share data, except where noted)
| | | | | | | | | | | | | | | | | |
| | For the Six Months Ended June 30, 2020 |
| |
| Contingent Consideration Obligations | | Debt and Other Liabilities of Consolidated VIEs | | Total |
| Balance, Beginning of Period | $ | 112,514 | | | $ | 0 | | | $ | 112,514 | |
| Transfer in due to consolidation | 0 | | | 4,291,286 | | | 4,291,286 | |
| Issuances | 0 | | | 302,928 | | | 302,928 | |
| Repayments | (12,870) | | | (198,750) | | | (211,620) | |
| Net realized losses | 0 | | | 3,459 | | | 3,459 | |
Changes in net unrealized gains(1) | (547) | | | (142,043) | | | (142,590) | |
| Cumulative translation adjustment | 0 | | | 1,867 | | | 1,867 | |
| Balance, End of Period | $ | 99,097 | | | $ | 4,258,747 | | | $ | 4,357,844 | |
| Change in net unrealized gains included in net gains (losses) from investment activities of consolidated VIEs related to debt and other liabilities still held at reporting date | $ | 0 | | | $ | (225,263) | | | $ | (225,263) | |
(1)Changes in fair value of contingent consideration obligations are recorded in profit sharing expense in the condensed consolidated statements of operations.
(2)Transfers between Level II and III were a result of subjecting the broker quotes on these financial assets to various criteria which include the number and quality of broker quotes, the standard deviation of obtained broker quotes and the percentage deviation from independent pricing services.
APOLLO GLOBALASSET MANAGEMENT, INC.
NOTES TO CONDENSED CONSOLIDATED
FINANCIAL STATEMENTS (UNAUDITED)
(dollars in thousands, except share data, except where noted)
The following tables summarize the changes in fair value in financial liabilities measured at fair value for which Level III inputs have been used to determine fair value:
| | | | | | | | | | | | | | | | | | | |
| | For the Three Months Ended March 31, 2022 | | |
| | | |
| Contingent Consideration Obligations | | Debt and Other Liabilities of Consolidated VIEs | | Total | | |
| Balance, Beginning of Period | $ | 125,901 | | | $ | 7,527,569 | | | $ | 7,653,470 | | | |
| | | | | | | |
| Transfer out due to deconsolidation | — | | | (8,626,153) | | | (8,626,153) | | | |
| Issuances | — | | | 1,645,025 | | | 1,645,025 | | | |
| Payments | (12,701) | | | (518,773) | | | (531,474) | | | |
| Net realized losses | — | | | (480) | | | (480) | | | |
Changes in net unrealized losses(1) | (2,742) | | | (16,368) | | | (19,110) | | | |
| Cumulative translation adjustment | — | | | (10,820) | | | (10,820) | | | |
| | | | | | | |
| | | | | | | |
| Balance, End of Period | $ | 110,458 | | | $ | — | | | $ | 110,458 | | | |
| | | | | | | |
| | | | | | | | | | | | | | | | | |
| | For the Three Months Ended March 31, 2021 |
| |
| Contingent Consideration Obligations | | Debt and Other Liabilities of Consolidated VIEs | | Total |
| Balance, Beginning of Period | $ | 119,788 | | | $ | 7,100,620 | | | $ | 7,220,408 | |
| | | | | |
| Issuances | — | | | 209,537 | | | 209,537 | |
| Payments | (12,322) | | | (44,653) | | | (56,975) | |
| Net realized losses | — | | | 491 | | | 491 | |
Changes in net unrealized (gains) losses(1) | 5,756 | | | 77,492 | | | 83,248 | |
| Cumulative translation adjustment | — | | | (26,237) | | | (26,237) | |
| Balance, End of Period | $ | 113,222 | | | $ | 7,317,250 | | | $ | 7,430,472 | |
| Change in net unrealized gains included in net gains (losses) from investment activities of consolidated VIEs related to debt and other liabilities still held at reporting date | $ | — | | | $ | 72,471 | | | $ | 72,471 | |
| | | | | |
(1) Changes in fair value of contingent consideration obligations are recorded in profit sharing expense in the condensed consolidated statements of operations. |
(2) Transfers between Level II and III were a result of subjecting the broker quotes on these financial assets to various criteria which include the number and quality of broker quotes, the standard deviation of obtained broker quotes and the percentage deviation from independent pricing services. |
The following tables summarize the quantitative inputs and assumptions used for financial assets and liabilities categorized as Level III under the fair value hierarchy:
| | | | | | | | | | | | | | | | | | | | | | | | | | | |
| | As of June 30, 2021 | |
| Fair Value | Valuation Techniques | | Unobservable Inputs | | Ranges | | Weighted Average (1) | |
| Financial Assets | | | | | | | | | |
| Other investments | $ | 263,237 | | Embedded value | | N/A | | N/A | | N/A | |
| 118,178 | | Discounted cash flow | | Discount rate | | 16.0% - 47.5% | | 23.0% | |
| 8,372 | | Third party pricing | | N/A | | N/A | | N/A | |
| Investments of consolidated VIEs: | | | | | | | | | |
| Equity securities | 4,222,903 | | Discounted cash flow | | Discount rate | | 3.1% - 23.0% | | 10.1% | |
| | Discounted cash flow | | Disposition timeline | | 10 - 52 months | | 26.8 | |
| | Discounted cash flow | | 2 year home price index forecast | | (10.7%) - 17.6% | | 4.0% | |
| | Dividend discount model | | Discount rate | | 13.9% | | 13.9% | |
| | Market comparable companies | | P/E multiple | | 10.4x | | 10.4x | |
| | Market comparable companies | | TBV multiple | | 0.61x | | 0.61x | |
| | Adjusted transaction value | | Purchase multiple | | 1.25x | | 1.25x | |
| | Adjusted transaction value | | N/A | | N/A | | N/A | |
| | Guideline public company | | NTAV multiple | | 1.25x | | 1.25x | |
| | Guideline public company | | TEV/EBITDA | | 5.5x - 8.0x | | 7.6x | |
| | Third Party Pricing | | N/A | | N/A | | N/A | |
| Bank loans | 3,928,257 | | Discounted cash flow | | Discount rate | | 1.8% - 15.6% | | 4.1% | |
| | Adjusted transaction value | | N/A | | N/A | | N/A | |
| | Third party pricing | | N/A | | N/A | | N/A | |
| Profit participating notes | 2,638,732 | | Discounted cash flow | | Discount rate | | 8.7% - 12.5% | | 12.4% | |
| | Adjusted transaction value | | N/A | | N/A | | N/A | |
| Real estate | 454,220 | | Discounted cash flow | | Capitalization rate | | 4.5% - 6.0% | | 5.7% | |
| | Discounted cash flow | | Discount rate | | 7.0% - 12.5% | | 8.3% | |
| | Discounted cash flow | | Terminal capitalization rate | | 8.3% | | 8.3% | |
| | Direct capitalization | | Capitalization rate | | 5.5% - 8.5% | | 6.4% | |
| | Direct capitalization | | Terminal capitalization rate | | 6.3% - 12.0% | | 7.1% | |
| | Adjusted transaction value | | N/A | | N/A | | N/A | |
| Bonds | 118,160 | | Discounted cash flow | | Discount rate | | 4.5% - 7.2% | | 6.5% | |
| | Third party pricing | | N/A | | N/A | | N/A | |
| Convertible securities | 26,142 | | Dividend discount model | | Discount rate | | 13.9% | | 13.9% | |
| | Market comparable companies | | P/E multiple | | 10.0x | | 10.0x | |
| | Market comparable companies | | TBV multiple | | 0.61x | | 0.61x | |
| Warrants | 3,380 | | Option model | | Volatility | | 35.0% - 60.4% | | 47.9% | |
| Other equity investments | 486,158 | | Third party pricing | | N/A | | N/A | | N/A | |
| | Adjusted transaction value | | Discount rate | | 8.5% - 12.5% | | 10.5% | |
| | Adjusted transaction value | | N/A | | N/A | | N/A | |
| Total Investments of Consolidated VIEs | 11,877,952 | | | | | | | | | |
| Total Financial Assets | $ | 12,267,739 | | | | | | | | | |
| Financial Liabilities | | | | | | | | | |
| Liabilities of Consolidated VIEs: | | | | | | | | | |
| Secured loans | $ | 4,013,342 | | Discounted cash flow | | Discount rate | | 1.4% - 9.6% | | 2.6% | |
| Subordinated notes | 3,148,942 | | Discounted cash flow | | Discount rate | | 4.5% - 11.5% | | 5.7% | |
| Participating equity | 21,354 | | Discounted cash flow | | Discount rate | | 15.0% | | 15.0% | |
| | | | | | | | | |
| Other liabilities | 22,536 | | Discounted cash flow | | Discount rate | | 2.2% - 9.1% | | 5.9% | |
| | Third party pricing | | N/A | | N/A | | N/A | |
| Total liabilities of Consolidated VIEs: | 7,206,174 | | | | | | | | | |
| Contingent Consideration Obligation | 128,984 | | Discounted cash flow | | Discount rate | | 18.5% | | 18.5% | |
| Total Financial Liabilities | $ | 7,335,158 | | | | | | | | | |
| | | | | | | | | | | | | | | | | | | | | | | | | | | | | | |
| | As of March 31, 2022 | |
| Fair Value | | Valuation Techniques | | Unobservable Inputs | | Ranges | | Weighted Average (1) | |
| Financial Assets | | | | | | | | | | |
| Investments | $ | 530,825 | | | Embedded value | | N/A | | N/A | | N/A | |
| 171,118 | | | Discounted cash flow | | Discount rate | | 14.0% - 52.8% | | 26.4% | |
| 384,952 | | | Adjusted transaction value | | N/A | | N/A | | N/A | |
| Due from related parties | 39,074 | | | Discounted cash flow | | Discount rate | | 15.0% | | 15.0% | |
| Investments of consolidated VIEs: | | | | | | | | | | |
| Equity securities | 454,787 | | | Dividend discount model | | Discount rate | | 14.5% | | 14.5% | |
| Total Financial Assets | $ | 1,580,756 | | | | | | | | | | |
| Financial Liabilities | | | | | | | | | | |
| | | | | | | | | | |
| | | | | | | | | | |
| | | | | | | | | | |
| | | | | | | | | | |
| | | | | | | | | | |
| | | | | | | | | | |
| Contingent Consideration Obligation | 110,458 | | | Discounted cash flow | | Discount rate | | 18.5% | | 18.5% | |
| Total Financial Liabilities | $ | 110,458 | | | | | | | | | | |
APOLLO GLOBALASSET MANAGEMENT, INC.
NOTES TO CONDENSED CONSOLIDATED
FINANCIAL STATEMENTS (UNAUDITED)
(dollars in thousands, except share data, except where noted)
| | | | As of December 31, 2020 | | As of December 31, 2021 |
| | Fair Value | Valuation Techniques | | Unobservable Inputs | | Ranges | | Weighted Average (1) | | | Fair Value | | Valuation Techniques | | Unobservable Inputs | | Ranges | | Weighted Average (1) |
| Financial Assets | Financial Assets | | | | | | | | | Financial Assets | | | | | | | |
| Other investments | Other investments | $ | 254,655 | | Embedded value | | N/A | | N/A | | N/A | | Other investments | $ | 516,221 | | | Embedded value | | N/A | | N/A | | N/A |
| | 107,652 | | Discounted cash flow | | Discount rate | | 16% - 47.5% | | 23.4% | | | 169,625 | | | Discounted cash flow | | Discount rate | | 14.0% - 52.8% | | 26.4% |
| | 7,465 | | Third party pricing | | N/A | | N/A | | N/A | | | 260,338 | | | Adjusted transaction value | | N/A | | N/A | | N/A |
| Due from related parties | | Due from related parties | 47,835 | | | Discounted cash flow | | Discount rate | | 16.0% | | 16.0% |
| Investments of consolidated VIEs: | Investments of consolidated VIEs: | | | Investments of consolidated VIEs: | |
| Equity securities | Equity securities | 4,339,244 | | Discounted cash flow | | Discount rate | | 4.4% - 15.6% | | 7.2% | | Equity securities | 4,144,661 | | | Discounted cash flow | | Discount rate | | 3.0% - 19.0% | | 10.4% |
| | Discounted cash flow | | Disposition timeline | | 8 - 52 months | | 28.8 | | | Dividend discount model | | Discount rate | | 13.7% | | 13.7% |
| | Discounted cash flow | | 2 year home price index forecast | | (14%) - 9.6% | | (2.5%) | | | Market comparable companies | | NTAV multiple | | 1.25x | | 1.25x |
| | Dividend discount model | | Discount rate | | 9.7% - 13.8% | | 11.2% | | | Adjusted transaction value | | Purchase multiple | | 1.25x | | 1.25x |
| | Market comparable companies | | NTAV multiple | | 1.2x | | 1.2x | | | Adjusted transaction value | | N/A | | N/A | | N/A |
| Market comparable companies | | P/E multiple | | 9.8x | | 9.8x | | |
| Market comparable companies | | TBV multiple | | 0.56x | | 0.56x | | |
| Adjusted transaction value | | Purchase multiple | | 1.1x | | 1.1x | | |
| Adjusted transaction value | | N/A | | N/A | | N/A | | |
| Bank loans | Bank loans | 3,501,384 | | Discounted cash flow | | Discount rate | | 1.8% - 27.0% | | 3.4% | | Bank loans | 4,569,873 | | | Discounted cash flow | | Discount rate | | 1.8% - 15.6% | | 4.3% |
| | Recoverability | | Recoverability rate | | 14.0% - 75.0% | | 57.8% | | | Adjusted transaction value | | N/A | | N/A | | N/A |
| Profit participating notes | | Profit participating notes | 2,849,150 | | | Discounted cash flow | | Discount rate | | 8.7% - 12.5% | | 12.4% |
| | Third party pricing | | N/A | | N/A | | N/A | | | Adjusted transaction value | | N/A | | N/A | | N/A |
| Profit participating notes | 2,577,596 | | Discounted cash flow | | Discount rate | | 7.5% - 15.0% | | 14.6% | | |
| Real estate | Real estate | 422,123 | | Discounted cash flow | | Capitalization rate | | 5.8% - 6.0% | | 5.8% | | Real estate | 511,648 | | | Discounted cash flow | | Capitalization rate | | 4.0% - 5.8% | | 5.3% |
| | Discounted cash flow | | Discount rate | | 6.3% - 12.5% | | 8.4% | | | Discounted cash flow | | Discount rate | | 5.0% - 12.5% | | 7.3% |
| | Discounted cash flow | | Terminal capitalization rate | | 8.3% | | 8.3% | | | Discounted cash flow | | Terminal capitalization rate | | 8.3% | | 8.3% |
| | Direct capitalization | | Capitalization rate | | 5.5% - 8.5% | | 6.6% | | | Direct capitalization | | Capitalization rate | | 5.5% - 8.5% | | 6.2% |
| | Direct capitalization | | Terminal capitalization rate | | 5.8% - 12% | | 7.6% | | | Direct capitalization | | Terminal capitalization rate | | 6.0% - 12.0% | | 6.9% |
| Bonds | Bonds | 97,209 | | Discounted cash flow | | Discount rate | | 5.5% - 7.0% | | 6.5% | | Bonds | 50,885 | | | Discounted cash flow | | Discount rate | | 4.0% - 7.0% | | 6.1% |
| | Third party pricing | | N/A | | N/A | | N/A | | | Third party pricing | | N/A | | N/A | | N/A |
| Convertible securities | 16,581 | | Discounted cash flow | | Discount rate | | 12.4% | | 12.4% | | |
| Other equity investments | | Other equity investments | 1,061,586 | | | Discounted cash flow | | Discount rate | | 11.8% -12.5% | | 12.1% |
| | Dividend discount model | | Discount rate | | 13.8% | | 13.8% | | | Adjusted transaction value | | N/A | | N/A | | N/A |
| Market comparable companies | | P/E multiple | | 9.8x | | 9.8x | | |
| Market comparable companies | | TBV multiple | | 0.56x | | 0.56x | | |
| Warrants | 2,676 | | Option model | | Volatility | | 50.0% - 64.4% | | 53.1% | | |
| Other equity investments | 6,167 | | Third party pricing | | N/A | | N/A | | N/A | | |
| Total Investments of Consolidated VIEs | Total Investments of Consolidated VIEs | 10,962,980 | | | | Total Investments of Consolidated VIEs | 13,187,803 | | |
| Total Financial Assets | Total Financial Assets | $ | 11,332,752 | | | | Total Financial Assets | $ | 14,181,822 | | |
| Financial Liabilities | Financial Liabilities | | | | Financial Liabilities | | |
| Liabilities of Consolidated VIEs: | Liabilities of Consolidated VIEs: | | | Liabilities of Consolidated VIEs: | |
| Secured loans | Secured loans | $ | 3,822,475 | | Discounted cash flow | | Discount rate | | 1.8% - 9.3% | | 2.7% | | Secured loans | $ | 4,311,348 | | | Discounted cash flow | | Discount rate | | 1.4% - 10.0% | | 2.8% |
| Subordinated notes | Subordinated notes | 3,044,437 | | Discounted cash flow | | Discount rate | | 7.7% - 14.0% | | 9.9% | | Subordinated notes | 3,164,491 | | | Discounted cash flow | | Discount rate | | 4.5% - 11.9% | | 5.8% |
| Adjusted transaction value | | N/A | | N/A | | N/A | | |
| Preferred equity | 213,506 | | Discounted cash flow | | Discount rate | | 15% | | 15% | | |
| Participating equity | | Participating equity | 20,640 | | | Discounted cash flow | | Discount rate | | 15.0% | | 15.0% |
| Other liabilities | Other liabilities | 20,202 | | Discounted cash flow | | Discount rate | | 1.8% - 7.9% | | 5.7% | | Other liabilities | 31,090 | | | Discounted cash flow | | Discount rate | | 3.7% - 9.3% | | 6.3% |
| Adjusted transaction value | | N/A | | N/A | | N/A | | |
| Third party pricing | | N/A | | N/A | | N/A | | |
| Total liabilities of Consolidated VIEs: | 7,100,620 | | | | |
| Total Liabilities of Consolidated VIEs | | Total Liabilities of Consolidated VIEs | 7,527,569 | | |
| Contingent Consideration Obligation | Contingent Consideration Obligation | 119,788 | | Discounted cash flow | | Discount rate | | 17.5% | | 17.5% | | Contingent Consideration Obligation | 125,901 | | | Discounted cash flow | | Discount rate | | 18.5% | | 18.5% |
| Total Financial Liabilities | Total Financial Liabilities | $ | 7,220,408 | | | | Total Financial Liabilities | $ | 7,653,470 | | |
|
N/A Not applicable
EBITDA Earnings before interest, taxes, depreciation, and amortization
NTAV Net tangible asset value
P/E Price-to-Earnings
TBV Total book value
TEV Total enterprise value
APOLLO GLOBAL MANAGEMENT, INC.
NOTES TO CONDENSED CONSOLIDATED
FINANCIAL STATEMENTS (UNAUDITED)
(dollars in thousands, except share data, except where noted)
(1) Unobservable inputs were weighted based on the fair value of the investments included in the range.
Fair Value Measurement of Investment in Athene Holding
As of June 30,
At December 31, 2021, the fair value of Apollo’s Level III investment in Athene Holding was estimated using the closing market price of Athene Holding shares of $67.50 less a DLOM$83.33. Following the Mergers, as of 12.9%. The DLOM was derived based on the average remaining lock up restrictions on the shares of Athene Holding held by Apollo (36 months from the closing date of the transactions contemplated by the Transaction Agreement) and the estimated volatilityMarch 31, 2022, AAM no longer holds an interest in such shares of Athene Holding. The historical share price volatility of a representative set of Athene Holding’s publicly traded insurance peers was calculated over a three year period equivalent to the lock up on the shares of Athene Holding held by Apollo and usedAHL as a proxy to estimate the projected volatilityfurther described in Athene Holding’s shares. As of December 31, 2020, the fair value of Apollo’s Level II investment in Athene Holding was estimated using the closing market price of Athene Holding shares of $43.14 less a DLOM of 17.5%.note 14.
Discounted Cash Flow Model
When a discounted cash flow model is used to determine fair value, the significant input used in the valuation model is the discount rate applied to present value the projected cash flows. Increases in the discount rate can significantly lower the fair value of an investment and the contingent consideration obligations; conversely decreases in the discount rate can significantly increase the fair value of an investment and the contingent consideration obligations.
APOLLO ASSET MANAGEMENT, INC.
NOTES TO CONDENSED CONSOLIDATED
FINANCIAL STATEMENTS (UNAUDITED)
(dollars in thousands, except share data, except where noted)
Consolidated VIEs
VIEs’ Investments
The significant unobservable inputs used in the fair value measurement of the equity securities include the discount rate applied, purchase multiple, price-to-earnings multiple, total book value multiple and net tangible asset value in the valuation models. These unobservable inputs in isolation can cause significant increases or decreases in fair value. The discount rate is determined based on the market rates an investor would expect for a similar investment with similar risks.
The significant unobservable inputs used in the fair value measurement of bank loans, are discount rates and recoverability percentage. Significant increases (decreases) in any discount rates would result in a significantly lower (higher) fair value measurement.
The significant unobservable inputs used in the fair value measurement of bonds, and profit participating notes, and other equity investments are discount rates. Significant increases (decreases) in discount rates would result in a significantly lower (higher) fair value measurements.
The significant unobservable inputs used in the fair value measurement of real estate are discount rates and capitalization rates. Significant increases (decreases) in any discount rates or capitalization rates in isolation would result in a significantly lower (higher) fair value measurement.
The significant unobservable inputs used in the fair value measurement of convertible securities are discount rates, price-to-earnings multiple and total book value multiple. Significant increases (decreases) in any discount rates would result in a significantly lower (higher) fair value measurement.
The significant unobservable inputs used in the fair value measurement of warrants are volatility rates. Significant increases (decreases) in volatility rates would result in a significantly higher (lower) fair value measurement.measurements.
Certain investments of VIEs are valued using the NAV per share equivalent calculated by the investment manager as a practical expedient to determiningdetermine an independent fair value.
Consolidated VIEs’ Liabilities
The debt obligations of certain consolidated VIEs, that are CLOs, were measured on the basis of the fair value of the financial assets of those CLOs as the financial assets were determined to be more observable and, as a result, categorized as Level II in the fair value hierarchy.
APOLLO GLOBAL MANAGEMENT, INC.
NOTES TO CONDENSED CONSOLIDATED
FINANCIAL STATEMENTS (UNAUDITED)
(dollars in thousands, except share data, except where noted)
The significant unobservable inputs used in the fair value measurement of the Company’s liabilities of consolidated VIEs are discount rates. Significant increases (decreases) in discount rates would result in a significantly lower (higher) fair value measurement.
Certain liabilities of VIEs are valued using the NAV per share equivalent calculated by the investment manager as a practical expedient to determine an independent fair value.
Contingent Consideration Obligations
The significant unobservable input used in the fair value measurement of the contingent consideration obligations is the discount rate applied in the valuation models. This input in isolation can cause significant increases or decreases in fair value. The discount rate was based on the hypothetical cost of equity in connection with the acquisition of Stone Tower. See note 15 for further discussion of the contingent consideration obligations.
Valuation of Underlying Investments of Equity Method Investees
As discussed previously, the underlying entities that the Company manages and invests in are primarily investment companies which account for their investments at estimated fair value.
On a quarterly basis, Apollo utilizes valuation committees consisting of members from senior management, to review and approve the valuation results related to the investments of the funds it manages. For certain publicly traded vehicles managed by the Company, a review is performed by an independent board of directors. The Company also retains external valuation firms to provide third-party valuation consulting services to Apollo, which consist of certain limited procedures that management identifies and requests them to perform. The limited procedures provided by the external valuation firms assist management with validating their valuation results or determining fair value. The Company performs various back-testing procedures to validate their valuation approaches, including comparisons between expected and observed outcomes, forecast evaluations and variance analyses. However, because of the inherent uncertainty of valuation, those estimated values may differ significantly from the values that would have been used had a ready market for the investments existed, and the differences could be material.
CreditYield Investments
The majority ofYield investments in Apollo’s credit funds are generally valued based on third party vendor prices and/or quoted market prices and valuation models. QuotedValuations using quoted market prices are valued based on the average of the “bid” and the “ask” quotes provided by multiple brokers wherever possible without any adjustments. Apollo will designate certain brokers to use to value specific securities. In order to determine
APOLLO ASSET MANAGEMENT, INC.
NOTES TO CONDENSED CONSOLIDATED
FINANCIAL STATEMENTS (UNAUDITED)
(dollars in thousands, except share data, except where noted)
determining the designated brokers, Apollo considers the following: (i) brokers with which Apollo has previously transacted, (ii) the underwriter of the security and (iii) active brokers indicating executable quotes. In addition, when valuing a security based on broker quotes wherever possible Apollo tests the standard deviation amongst the quotes received and the variance between the concluded fair value and the value provided by a pricing service. When broker quotes are not available Apollo considers the use of pricing service quotes or other sources to mark a position. When relying on a pricing service as a primary source, Apollo (i) analyzes how the price has moved over the measurement period, (ii) reviews the number of brokers included in the pricing service’s population, if available, and (iii) validates the valuation levels with Apollo’s pricing team and traders.
Debt and equity securities that are not publicly traded or whose market prices are not readily available are valued at fair value utilizing a model based approach to determine fair value. Valuation approaches used to estimate the fair value of illiquid credit investments also may include the market approach and the income approach, as described below. The valuation approaches used consider, as applicable, market risks, credit risks, counterparty risks and foreign currency risks.
Private Equity and Hybrid Investments
The majority of the illiquid investments within our private equity fundsand hybrid investments are valued using the market approach which provides an indication of fair value based on a comparison ofand/or the subject company to comparable publicly traded companies and transactions in the industry.income approach, as described below.
Market Approach
The market approach is driven by current market conditions, including actual trading levels of similar companies and, to the extent available, actual transaction data of similar companies. Judgment is required by management when assessing which companies are similar to the subject company being valued. Consideration may also be given to any of the following factors: (1) the subject company’s historical and projected financial data; (2) valuations given to comparable companies; (3) the size and scope of the subject company’s operations; (4) the subject company’s individual strengths and weaknesses;
APOLLO GLOBAL MANAGEMENT, INC.
NOTES TO CONDENSED CONSOLIDATED
FINANCIAL STATEMENTS (UNAUDITED)
(dollars in thousands, except share data, except where noted)
(5) expectations relating to the market’s receptivity to an offering of the subject company’s securities; (6) applicable restrictions on transfer; (7) industry and market information; (8) general economic and market conditions; and (9) other factors deemed relevant. Market approach valuation models typically employ a multiple that is based on one or more of the factors described above.
Enterprise value as a multiple of EBITDA is common and relevant for most companies and industries, however, other industry specific multiples are employed where available and appropriate. Sources for gaining additional knowledge related to comparable companies include public filings, annual reports, analyst research reports, and press releases. Once a comparable company set is determined, Apollo reviews certain aspects of the subject company’s performance and determines how its performance compares to the group and to certain individuals in the group. Apollo compares certain measurements such as EBITDA margins, revenue growth over certain time periods, leverage ratios and growth opportunities. In addition, Apollo compares the entry multiple and its relation to the comparable set at the time of acquisition to understand its relation to the comparable set on each measurement date.
Income Approach
For investments where the market approach does not provide adequate fair value information, Apollo relies on the income approach. The income approach is also used to validate the market approach within our private equity funds. The income approach provides an indication of fair value based on the present value of cash flows that a business or security is expected to generate in the future. The most widely used methodology for the income approach is a discounted cash flow method. Inherent in the discounted cash flow method are significant assumptions related to the subject company’s expected results, the determination of a terminal value and a calculated discount rate, which is normally based on the subject company’s weighted average cost of capital, or “WACC.” The WACC represents the required rate of return on total capitalization, which is comprised of a required rate of return on equity, plus the current tax-effected rate of return on debt, weighted by the relative percentages of equity and debt that are typical in the industry. The most critical step in determining the appropriate WACC for each subject company is to select companies that are comparable in nature to the subject company and the credit quality of the subject company. Sources for gaining additional knowledge about the comparable companies include public filings, annual reports, analyst research reports, and press releases. The general formula then used for calculating the WACC considers the after-tax rate of return on debt capital and the rate of return on common equity capital, which further considers the risk-free rate of return, market beta, market risk premium and small stock premium, if applicable. The variables used in the WACC formula are inferred from the comparable market data obtained. The Company evaluates the comparable companies selected and concludes on WACC inputs based on the most comparable company or analyzes the range of data for the investment.
Debt securities that are not publicly traded or whose market prices are not readily available are valued at fair value utilizing a model based approach to determine fair value. Valuation approaches used to estimate the fair value of hybrid capital investments also may include the market approach and the income approach, as previously described above. The valuation approaches used consider, as applicable, market risks, credit risks, counterparty risks and foreign currency risks.
The value of liquid investments, where the primary market is an exchange (whether foreign or domestic), is determined using period end market prices. Such prices are generally based on the close price on the date of determination.
The estimated fair value of commercial mortgage-backed securities (“CMBS”)APOLLO ASSET MANAGEMENT, INC.
NOTES TO CONDENSED CONSOLIDATED
FINANCIAL STATEMENTS (UNAUDITED)
(dollars in Apollo’s real assets funds is determined by reference to market prices provided by certain dealers who make a market in these financial instruments. Broker quotes are only indicative of fair value and may not necessarily represent what the funds would receive in an actual trade for the applicable instrument. Additionally, the loans held-for-investment are stated at the principal amount outstanding, net of deferred loan fees and costs for certain investments. The loans in Apollo’s real assets funds are evaluated for possible impairment on a quarterly basis. For Apollo’s real assets funds, valuations of non-marketable underlying investments are determined using methods that include, but are not limited to (i) discounted cash flow estimates or comparable analysis prepared internally, (ii) third party appraisals or valuations by qualified real estate appraisers and (iii) contractual sales value of investments/properties subject to bona fide purchase contracts. Methods (i) and (ii) also incorporate consideration of the use of the income, cost, or sales comparison approaches of estimating property values.thousands, except share data, except where noted)
Certain of the credit, private equity, and real assets funds Apollo manages may also enter into foreign currency exchange contracts, total return swap contracts, credit default swap contracts, and other derivative contracts, which may include options, caps, collars and floors. Foreign currency exchange contracts are marked-to-market by recognizing the difference between the contract exchange rate and the current market rate as unrealized appreciation or depreciation. If securities are held at the end of the period, the changes in value are recorded in income as unrealized. Realized gains or losses are recognized when contracts
APOLLO GLOBAL MANAGEMENT, INC.
NOTES TO CONDENSED CONSOLIDATED
FINANCIAL STATEMENTS (UNAUDITED)
(dollars in thousands, except share data, except where noted)
are settled. Total return swap and credit default swap contracts are recorded at fair value as an asset or liability with changes in fair value recorded as unrealized appreciation or depreciation. Realized gains or losses are recognized at the termination of the contract based on the difference between the close-out price of the total return or credit default swap contract and the original contract price. Forward contracts are valued based on market rates obtained from counterparties or prices obtained from recognized financial data service providers.
7.8. OTHER ASSETS
Other assets consisted of the following:
| | | | | | | | | | | |
| As of
June 30, 2021 | | As of
December 31, 2020 |
| Fixed assets | $ | 203,154 | | | $ | 191,853 | |
| Less: Accumulated depreciation and amortization | (119,904) | | (111,821) | |
| Fixed assets, net | 83,250 | | 80,032 | |
Deferred equity-based compensation(1) | 239,946 | | 137,777 | |
| Prepaid expenses | 68,161 | | 46,639 | |
| Intangible assets, net | 20,584 | | 23,586 | |
| Tax receivables | 27,716 | | 42,979 | |
| Other | 54,798 | | 33,950 | |
| Total Other Assets | $ | 494,455 | | | $ | 364,963 | |
(1)Deferred equity-based compensation relates to the value of equity-based awards that have been or are expected to be granted in connection with the settlement of certain profit sharing arrangements. A corresponding amount for awards expected to be granted of $224.4 million and $114.6 million, as of June 30, 2021 and December 31, 2020, respectively, is included in other liabilities on the condensed consolidated statements of financial condition. | | | | | | | | | | | |
| As of
March 31, 2022 | | As of
December 31, 2021 |
| Fixed assets | $ | 295,653 | | | $ | 256,252 | |
| Less: Accumulated depreciation and amortization | (136,564) | | (130,072) | |
| Fixed assets, net | 159,089 | | 126,180 | |
Deferred equity-based compensation(1) | 291,305 | | 282,900 | |
Commitment asset(2) | 172,227 | | — | |
| Prepaid expenses | 76,332 | | 57,765 | |
| Intangible assets, net | 17,633 | | 14,846 | |
| Tax receivables | 19,466 | | 30,334 | |
| Other | 65,999 | | 73,876 | |
| Total Other Assets | $ | 802,051 | | | $ | 585,901 | |
| | | |
(1) Deferred equity-based compensation relates to the value of equity-based awards that have been or are expected to be granted in connection with the settlement of certain profit sharing arrangements. A corresponding amount for awards expected to be granted of $210.4 million and $210.6 million, as of March 31, 2022 and December 31, 2021, respectively, is included in other liabilities on the condensed consolidated statements of financial condition. |
(2) Represents a commitment from an institutional investor as part of a strategic transaction. |
Depreciation expense was $4.3$5.9 million and $2.3$3.9 million for the three months ended June 30,March 31, 2022 and 2021, and 2020, respectively, and $8.3 million and $4.9 million for the six months ended June 30, 2021 and 2020, respectively, and is presented as a component of general, administrative and other expense in the condensed consolidated statements of operations.
8.9. LEASES
Apollo has operating leases for office space, data centers, and certain equipment under various lease agreements.
The table below presents operating lease expenses:expenses recorded in general, administrative and other in the condensed consolidated statements of operations.
| | | | | | | | | | | | | | | | | | | | | | | |
| | For the Three Months Ended June 30, | | For the Six Months Ended June 30, |
| | 2021 | | 2020 | | 2021 | | 2020 |
| Operating lease cost | $ | 12,529 | | | $ | 13,617 | | | $ | 23,013 | | | $ | 25,979 | |
| | | | | | | | | | | |
| | For the Three Months Ended March 31, |
| | 2022 | | 2021 |
| Operating lease cost | $ | 16,104 | | | $ | 10,484 | |
The following table presents supplemental cash flow information related to operating leases:
| | | | | | | | | | | | | | | | | | | | | | | |
| | For the Three Months Ended June 30, | | For the Six Months Ended June 30, |
| | 2021 | | 2020 | | 2021 | | 2020 |
| Operating cash flows for operating leases | $ | 4,939 | | | $ | 3,307 | | | $ | 12,494 | | | $ | 13,956 | |
| | | | | | | | | | | |
| | For the Three Months Ended March 31, |
| | 2022 | | 2021 |
| Operating cash flows for operating leases | $ | 6,126 | | | $ | 7,555 | |
APOLLO GLOBALASSET MANAGEMENT, INC.
NOTES TO CONDENSED CONSOLIDATED
FINANCIAL STATEMENTS (UNAUDITED)
(dollars in thousands, except share data, except where noted)
As of June 30, 2021,March 31, 2022, the Company’s total lease payments by maturity are presented in the following table:
| | | | Operating Lease Payments | | Operating Lease Payments |
| Remaining 2021 | $ | 23,251 | | |
| 2022 | 45,662 | | |
| Remaining 2022 | | Remaining 2022 | $ | 46,452 | |
| 2023 | 2023 | 41,125 | | 2023 | 68,111 | |
| 2024 | 2024 | 37,453 | | 2024 | 65,548 | |
| 2025 | 2025 | 35,160 | | 2025 | 63,714 | |
| 2026 | | 2026 | 59,055 | |
| Thereafter | Thereafter | 313,404 | | Thereafter | 493,132 | |
| Total lease payments | Total lease payments | $ | 496,055 | | Total lease payments | $ | 796,012 | |
| Less imputed interest | Less imputed interest | (86,125) | | Less imputed interest | (124,399) | |
| Present value of lease payments | Present value of lease payments | $ | 409,930 | | Present value of lease payments | $ | 671,613 | |
The Company hasdoes not have any undiscounted future operating lease payments of $160.4 million related to leases that have not commenced that were entered into as of June 30, 2021. Such lease payments are not yet included in the table above or the Company’s condensed consolidated statements of financial condition as lease assets and lease liabilities. These operating leases are anticipated to commence by 2022 with lease terms of approximately 16 years.March 31, 2022.
Supplemental information related to leases is as follows:
| | | As of
June 30, 2021 | | As of
June 30, 2020 | | As of
March 31, 2022 | | As of
March 31, 2021 |
| Weighted average remaining lease term (in years) | Weighted average remaining lease term (in years) | 13.6 | | 13.9 | Weighted average remaining lease term (in years) | 12.8 | | 13.3 |
| Weighted average discount rate | Weighted average discount rate | 3.0 | % | | 3.1 | % | Weighted average discount rate | 2.6 | % | | 3.1 | % |
9.10. INCOME TAXES
The Company’s income tax (provision) benefitbenefit totaled $(194.1)$(134.2) million and $(140.3)$(203.2) million for the three months ended June 30,March 31, 2022 and 2021, and 2020, respectively, and $(397.3) million and $155.5 million for the six months ended June 30, 2021 and 2020, respectively. The Company’s effective income tax rate was approximately 11.4%9.5% and 12.3%11.8% for thethe three months ended June 30,March 31, 2022 and 2021, and 2020, respectively, and 11.6% and 10.8% for the six months ended June 30, 2021 and 2020, respectively.
Under U.S. GAAP, a tax benefit from an uncertain tax position may be recognized when it is more likely than not that the position will be sustained upon examination, including resolution of any related appeals or litigation processes, based on the technical merits of the position. Based upon the Company’s review of its federal, state, local and foreign income tax returns and tax filing positions, theThe Company determined that 0 material unrecognized tax benefits for uncertain tax positions were required to be recorded. In addition, the Company does not believe that it has any tax positions for which it is reasonably possible that it will be required to record significant amountsrecorded $15.7 million of unrecognized tax benefits withinas of March 31, 2022 for uncertain tax positions. Approximately all of the unrecognized tax benefits, if recognized, would affect the effective tax rate. The Company does not anticipate a material change to its unrecognized tax benefits over the next twelve months.
The primary jurisdictions in which the Company operates and incurs income taxes are the United States and the United Kingdom. There are 0no unremitted earnings with respect to the United Kingdom and other foreign entities.jurisdictions.
In the normal course of business, the Company is subject to examination by federal, state, local and foreign tax authorities. As of June 30, 2021,March 31, 2022, the Company’s U.S. federal, state, local and foreign income tax returns for the years 20172018 through 20192020 are open under the general statute of limitations provisions and therefore subject to examination. Currently, the Internal Revenue Service is examining the tax returnreturns of a subsidiarythe Company and certain subsidiaries for the 20112019 and 2020 tax year.years. The State and City of New York are examining certain subsidiaries’ tax returns for tax years 2011 to 2018. The United Kingdom and India tax authorities are currently examining certain subsidiaries’ tax returns for tax year 2017. There are other examinations ongoing in other foreign jurisdictions, which the Company operates. No provisions with respect to these examinations have been recorded.recorded, other than the unrecognized tax benefits discussed above.
The Company recordshas historically recorded deferred tax assets as a result of the step-up in the tax basis of assets, andincluding intangibles resulting from exchanges of AOG Units for Class A Common Stockshares by the Co-FoundersFormer Managing Partners and Contributing Partners. A related liability ishas historically been recorded in due“Due to related partiesRelated Parties” in the condensed consolidated statements of financial condition for the expected payments under the tax receivable agreement entered into by and among APO Corp., the Co-Founders,Company, the Former Managing Partners, the Contributing Partners, and other parties thereto (as amended, the “tax receivable agreement”) (see note 14). The benefit the Company obtainshas historically obtained from the difference in the tax asset recognized and the related liability resulted in an increase to additional paid in capital. The amortization period for the portion of the
APOLLO GLOBALASSET MANAGEMENT, INC.
NOTES TO CONDENSED CONSOLIDATED
FINANCIAL STATEMENTS (UNAUDITED)
(dollars in thousands, except share data, except where noted)
from the difference in the tax asset recognized and the related liability results in an increase to additional paid in capital. The amortization period for the portion of the increase in tax basis related to intangibles is 15 years. The realization of the remaining portion of the increase in tax basis relates to the disposition of the underlying assets to which the step-up is attributed. The associated deferred tax assets reverse at the time of the corresponding asset disposition.
Subsequent to the Mergers, the Managing Partners and Contributing Partners no longer own AOG Units. Therefore, there were no exchanges subject to the tax receivable agreement during the three months ended March 31, 2022. The table below presents the impact to the deferred tax asset, tax receivable agreement liability and additional paid in capital related to the exchange of AOG Units for Class A Common Stock.shares for the three months ended March 31, 2021.
| | | | | | | | | | | | | | | | | | | | |
Exchange of AOG Units
for Class A Common Stock | | Increase in Deferred Tax Asset | | Increase in Tax Receivable Agreement Liability | | Increase to Additional Paid In Capital |
| For the Six Months Ended June 30, 2021 | | $ | 45,479 | | | $ | 38,229 | | | $ | 7,250 | |
| For the Six Months Ended June 30, 2020 | | $ | 76,580 | | | $ | 62,531 | | | $ | 14,049 | |
| | | | | | |
| | | | | | |
On March 27, 2020, the U.S. federal government enacted the Coronavirus Aid, Relief, and Economic Security Act (the “CARES Act”). The CARES Act is an emergency economic stimulus package in response to the coronavirus outbreak which, among other things, contains numerous income tax provisions. The provisions of the CARES Act have not had a material impact on the Company’s condensed consolidated financial statements or related disclosures. | | | | | | | | | | | | | | | | | | | | |
Exchange of AOG Units
for Common Stock | | Increase in Deferred Tax Asset | | Increase in Tax Receivable Agreement Liability | | Increase to Additional Paid In Capital |
| | | | | | |
| For the Three Months Ended March 31, 2021 | | $ | 30,295 | | | $ | 25,558 | | | $ | 4,737 | |
| | | | | | |
| | | | | | |
10.11. DEBT
Debt consisted of the following:
| | | | | | | | | | | | | | | | | | | | | | | | | | | | | | | | | | | |
| | As of June 30, 2021 | | As of December 31, 2020 |
| | Outstanding
Balance | | Fair Value | | Annualized
Weighted
Average
Interest Rate | | Outstanding
Balance | | Fair Value | | Annualized
Weighted
Average
Interest Rate |
2024 Senior Notes(1) | $ | 498,143 | | | $ | 545,437 | | (4) | 4.00 | % | | $ | 497,817 | | | $ | 553,633 | | (4) | 4.00 | % |
2026 Senior Notes(1) | 497,473 | | | 568,433 | | (4) | 4.40 | | | 497,217 | | | 581,898 | | (4) | 4.40 | |
2029 Senior Notes(1) | 674,772 | | | 790,973 | | (4) | 4.87 | | | 674,757 | | | 804,768 | | (4) | 4.87 | |
2030 Senior Notes(1) | 494,630 | | | 508,997 | | (4) | 2.65 | | | 494,375 | | | 513,362 | | (4) | 2.65 | |
2039 Senior Secured Guaranteed Notes(1) | 317,514 | | | 371,705 | | (5) | 4.77 | | | 317,042 | | | 376,472 | | (5) | 4.77 | |
2048 Senior Notes(1) | 296,695 | | | 385,876 | | (4) | 5.00 | | | 296,633 | | | 379,953 | | (4) | 5.00 | |
2050 Subordinated Notes(1) | 296,616 | | | 312,000 | | (4) | 4.95 | | | 296,557 | | | 307,500 | | (4) | 4.95 | |
Secured Borrowing I(2) | 18,952 | | | 18,942 | | (3) | 1.84 | | | 19,526 | | | 19,527 | | (3) | 1.84 | |
Secured Borrowing II(2) | 20,157 | | | 20,148 | | (3) | 1.70 | | | 20,767 | | | 20,773 | | (3) | 1.71 | |
2016 AMI Term Facility I(2) | 20,002 | | | 20,002 | | (3) | 1.30 | | | 20,608 | | | 20,608 | | (3) | 1.30 | |
2016 AMI Term Facility II(2) | 19,335 | | | 19,335 | | (3) | 1.40 | | | 19,922 | | | 19,922 | | (3) | 1.40 | |
| Total Debt | $ | 3,154,289 | | | $ | 3,561,848 | | | | | $ | 3,155,221 | | | $ | 3,598,416 | | | |
(1)Includes amortization of note discount, as applicable. Outstanding balance is presented net of unamortized debt issuance costs:
| | | | | | | | | | | |
| As of June 30, 2021 | | As of December 31, 2020 |
| 2024 Senior Notes | $ | 1,565 | | | $ | 1,841 | |
| 2026 Senior Notes | 2,310 | | | 2,545 | |
| 2029 Senior Notes | 4,958 | | | 5,282 | |
| 2030 Senior Notes | 4,049 | | | 4,231 | |
| 2039 Senior Secured Guaranteed Notes | 7,486 | | | 7,958 | |
| 2048 Senior Notes | 3,016 | | | 3,073 | |
| 2050 Subordinated Notes | 3,384 | | | 3,443 | |
| Total | $ | 26,768 | | | $ | 28,373 | |
APOLLO GLOBAL MANAGEMENT, INC.
NOTES TO CONDENSED CONSOLIDATED
FINANCIAL STATEMENTS (UNAUDITED)
(dollars in thousands, except share data, except where noted)
(2)Apollo Management International LLP (“AMI”), a subsidiary of the Company, entered into several credit facilities (collectively referred to as the “AMI Facilities”) to fund the Company’s investment in certain European CLOs it manages:
| | | | | | | | | | | | | | |
Facility | | Date | | Loan Amount |
Secured Borrowing I | | December 19, 2019 | | € | 15,984 | |
Secured Borrowing II | | March 5, 2020 | | € | 17,000 | |
2016 AMI Term Facility I | | January 18, 2016 | | € | 16,870 | |
2016 AMI Term Facility II | | June 22, 2016 | | € | 16,308 | |
The Secured Borrowings consist of obligations through repurchase agreements redeemable at maturity with third party lenders. The weighted average remaining maturity of Secured Borrowing I and II is 10.2 years.
(3)Fair value is based on obtained broker quotes. These notes are classified as a Level III liability within the fair value hierarchy based on the number and quality of broker quotes obtained, the standard deviations of the observed broker quotes and the percentage deviation from external pricing services. For instances where broker quotes are not available, a discounted cash flow method is used to obtain a fair value.
(4)Fair value is based on obtained broker quotes. These notes are classified as a Level II liability within the fair value hierarchy based on the number and quality of broker quotes obtained, the standard deviations of the observed broker quotes and the percentage deviation from external pricing services.
(5)Fair value is based on a discounted cash flow method. These notes are classified as a Level III liability within the fair value hierarchy.
AMH Credit Facility—On November 23, 2020, AMH as borrower (the “Borrower”) entered into a new credit agreement (the “AMH Credit Facility”) with the lenders and issuing banks party thereto and Citibank, N.A., as administrative agent for the lenders. The AMH Credit Facility refinanced the 2018 AMH Credit Facility listed below. The AMH Credit Facility provides for a $750 million revolving credit facility to the Borrower with a final maturity date of November 23, 2025. The AMH Credit Facility is to remain available until its maturity, and any undrawn revolving commitments bear a commitment fee. The interest rate on the AMH Credit Facility is based on adjusted London Inter-Bank Offered Rate (“LIBOR”) and the applicable margin as of June 30, 2021 was 1.00%. The commitment fee on the $750 million undrawn AMH Credit Facility as of June 30, 2021 was 0.09%.
Borrowings under the AMH Credit Facility may be used for working capital and general corporate purposes, including, without limitation, permitted acquisitions. The Borrower may incur incremental facilities in respect of the AMH Credit Facility in an aggregate amount not to exceed $250 million plus additional amounts so long as the Borrower is in compliance with a net leverage ratio not to exceed 4.00 to 1.00. As of June 30, 2021, the AMH Credit Facility was undrawn.
2018 AMH Credit Facility—On July 11, 2018, AMH as borrower (the “Borrower”) entered into a credit agreement (the “2018 AMH Credit Facility”) with the lenders and issuing banks party thereto and Citibank, N.A., as administrative agent for the lenders. The AMH Credit Facility refinanced the 2018 AMH Credit Facility at substantially the same terms. The 2018 AMH Credit Facility and all related loan documents were terminated as of November 23, 2020.
2024 Senior Notes—On May 30, 2014, AMH issued $500 million in aggregate principal amount of its 4.000% Senior Notes due 2024 (the “2024 Senior Notes”), at an issue price of 99.722% of par. Interest on the 2024 Senior Notes is payable semi-annually in arrears on May 30 and November 30 of each year. The 2024 Senior Notes will mature on May 30, 2024. The discount is amortized into interest expense on the condensed consolidated statements of operations over the term of the 2024 Senior Notes. The Company is obligated to settle the 2024 Senior Notes for the face amount of $500 million.
2026 Senior Notes—On May 27, 2016, AMH issued $500 million in aggregate principal amount of its 4.400% Senior Notes due 2026 (the “2026 Senior Notes”), at an issue price of 99.912% of par. Interest on the 2026 Senior Notes is payable semi-annually in arrears on May 27 and November 27 of each year. The 2026 Senior Notes will mature on May 27, 2026. The discount is amortized into interest expense on the condensed consolidated statements of operations over the term of the 2026 Senior Notes. The Company is obligated to settle the 2026 Senior Notes for the face amount of $500 million.
2029 Senior Notes—On February 7, 2019, AMH issued $550 million in aggregate principal amount of its 4.872% Senior Notes due 2029, at an issue price of 99.999% of par. On June 11, 2019, AMH issued an additional $125 million in aggregate principal amount of its 4.872% Senior Notes due 2029 (the “Additional Notes”), at an issue price of 104.812% of par. The Additional Notes constitute a single class of securities with the previously issued senior notes due 2029 (collectively, the “2029 Senior Notes”). Interest on the 2029 Senior Notes is payable semi-annually in arrears on February 15 and August 15 of each year. The 2029 Senior Notes will mature on February 15, 2029. The discount is amortized into interest expense on the
APOLLO GLOBAL MANAGEMENT, INC.
NOTES TO CONDENSED CONSOLIDATED
FINANCIAL STATEMENTS (UNAUDITED)
(dollars in thousands, except share data, except where noted)
condensed consolidated statements of operations over the term of the 2029 Senior Notes. The Company is obligated to settle the 2029 Senior Notes for the face amount of $675 million.
2030 Senior Notes—On June 5, 2020, AMH issued $500 million in aggregate principal amount of its 2.65% Senior Notes due 2030 (the “2030 Senior Notes”), at an issue price of 99.704% of par. Interest on the 2030 Senior Notes is payable semi-annually in arrears on June 5 and December 5 of each year. The 2030 Senior Notes will mature on June 5, 2030. The discount is amortized into interest expense on the condensed consolidated statements of operations over the term of the 2030 Senior Notes. The Company is obligated to settle the 2030 Senior Notes for the face amount of $500 million.
2039 Senior Secured Guaranteed Notes—On June 10, 2019, APH Finance 1, LLC (the “Issuer”), a subsidiary of the Company, issued $325 million in aggregate principal amount of its 4.77% Series A Senior Secured Guaranteed Notes due 2039 (the “2039 Senior Secured Guaranteed Notes”). The 2039 Senior Secured Guaranteed Notes are secured by a lien on the Issuer’s and the guarantors’ participation interests in the rights to distributions in relation to a portfolio of equity investments owned by affiliates of the Company in certain existing and future funds managed or advised by subsidiaries of the Company. Interest on the 2039 Senior Secured Guaranteed Notes is payable on a quarterly basis. The 2039 Senior Secured Guaranteed Notes will mature in July 2039, but, unless prepaid to the extent permitted under the indenture governing the 2039 Senior Secured Guaranteed Notes, the anticipated repayment date will be in July 2029. If the Issuer has not repaid or refinanced the 2039 Senior Secured Guaranteed Notes prior to the anticipated repayment date an additional 5.0% per annum will accrue on the 2039 Senior Secured Guaranteed Notes. The issuance costs are amortized into interest expense on the condensed consolidated statements of operations over the expected term of the 2039 Senior Secured Guaranteed Notes.
2048 Senior Notes—On March 15, 2018, AMH issued $300 million in aggregate principal amount of its 5.000% Senior Notes due 2048 (the “2048 Senior Notes”), at an issue price of 99.892% of par. Interest on the 2048 Senior Notes is payable semi-annually in arrears on March 15 and September 15 of each year. The 2048 Senior Notes will mature on March 15, 2048. The discount is amortized into interest expense on the condensed consolidated statements of operations over the term of the 2048 Senior Notes. The Company is obligated to settle the 2048 Senior Notes for the face amount of $300 million.
2050 Subordinated Notes—On December 17, 2019, AMH issued $300 million in aggregate principal amount of its 4.950% Fixed-Rate Resettable Subordinated Notes due 2050 (the “2050 Subordinated Notes”), at an issue price of 100.000% of par. Interest on the 2050 Subordinated Notes is payable semi-annually in arrears on June 17 and December 17 of each year. The 2050 Subordinated Notes will mature on January 14, 2050. The discount is amortized into interest expense on the condensed consolidated statements of operations over the term of the 2050 Subordinated Notes. The Company is obligated to settle the 2050 Subordinated Notes for the face amount of $300 million. | | | | | | | | | | | | | | | | | | | | | | | | | | | | | | | | | | | | | | |
| | | As of March 31, 2022 | | As of December 31, 2021 |
| | Maturity Date | Outstanding
Balance | | Fair Value | | Interest Rate(1) | | Outstanding
Balance | | Fair Value | | Interest Rate(1) |
2024 Senior Notes(2) | May 30, 2024 | $ | 498,633 | | | $ | 506,068 | | (4) | 4.00 | % | | $ | 498,469 | | | $ | 530,052 | | (4) | 4.00 | % |
2026 Senior Notes(2) | May 27, 2026 | 497,858 | | | 519,730 | | (4) | 4.40 | | | 497,730 | | | 553,055 | | (4) | 4.40 | |
2029 Senior Notes(2) | February 15, 2029 | 674,794 | | | 720,958 | | (4) | 4.87 | | | 674,786 | | | 777,703 | | (4) | 4.87 | |
2030 Senior Notes(2) | June 5, 2030 | 495,040 | | | 465,610 | | (4) | 2.65 | | | 494,928 | | | 506,094 | | (4) | 2.65 | |
2039 Senior Secured Guaranteed Notes(2) | (6) | — | | | — | | | — | | | 317,985 | | | 369,041 | | (5) | 4.77 | |
2048 Senior Notes(2) | March 15, 2048 | 296,787 | | | 346,429 | | (4) | 5.00 | | | 296,757 | | | 397,191 | | (4) | 5.00 | |
2050 Subordinated Notes(2) | January 14, 2050 | 296,705 | | | 286,425 | | (4) | 4.95 | | | 296,675 | | | 308,687 | | (4) | 4.95 | |
| Secured Borrowing II | April 15, 2032 | 18,814 | | | 18,665 | | (3) | 1.70 | | | 19,334 | | | 19,239 | | (3) | 1.70 | |
| 2016 AMI Term Facility I | January 15, 2025 | 18,670 | | | 18,670 | | (3) | 1.30 | | | 19,186 | | | 19,186 | | (3) | 1.30 | |
| 2016 AMI Term Facility II | July 23, 2023 | 18,047 | | | 18,047 | | (3) | 1.40 | | | 18,546 | | | 18,546 | | (3) | 1.40 | |
| Total Debt | | $ | 2,815,348 | | | $ | 2,900,602 | | | | | $ | 3,134,396 | | | $ | 3,498,794 | | | |
| | | | | | | | | | | | |
(1) Interest rate is calculated as weighted average annualized. |
(2) Includes amortization of note discount, as applicable, totaling $17.5 million and $25.1 million as of March 31, 2022 and December 31, 2021, respectively. Outstanding balance is presented net of unamortized debt issuance costs. |
(3) Fair value is based on obtained broker quotes. These notes are classified as a Level III liability within the fair value hierarchy based on the number and quality of broker quotes obtained, the standard deviations of the observed broker quotes and the percentage deviation from external pricing services. For instances where broker quotes are not available, a discounted cash flow method is used to obtain a fair value. |
(4) Fair value is based on obtained broker quotes. These notes are classified as a Level II liability within the fair value hierarchy based on the number and quality of broker quotes obtained, the standard deviations of the observed broker quotes and the percentage deviation from external pricing services. |
(5) Fair value is based on a discounted cash flow method. These notes are classified as a Level III liability within the fair value hierarchy. |
(6) There is no outstanding balance as of March 31, 2022. These notes were transferred to a VIE consolidated by Athene during the three months ended March 31, 2022. |
As of June 30, 2021,March 31, 2022, the indentures governing the 2024 Senior Notes, the 2026 Senior Notes, the 2029 Senior Notes, the 2030 Senior Notes, the 2048 Senior Notes and the 2050 Subordinated Notes (the “Indentures”) include covenants that restrict the ability of AMH and, as applicable, the guarantors of the notes under the Indentures to incur indebtedness secured by liens on voting stock or profit participating equity interests of their respective subsidiaries, or merge, consolidate or sell, transfer or lease assets. The Indentures also provide for customary events of default.
Apollo’s debt obligations contain various customary loan covenants. As of June 30, 2021,March 31, 2022, the indentureCompany was not aware of any instances of non-compliance with the financial covenants contained in the documents governing the 2039 Senior Secured Guaranteed Notes includes a series of covenants and restrictions customary for transactions of this type, including covenants that (i) require the Issuer to maintain specified reserve accounts to be used to make required payments in respect of the 2039 Senior Secured Guaranteed Notes, (ii) relate to prepayments and related payments of specified amounts, including specified make-whole payments under certain circumstances and (iii) relate to recordkeeping, access to information and similar matters.Company’s debt obligations.
APOLLO GLOBALASSET MANAGEMENT, INC.
NOTES TO CONDENSED CONSOLIDATED
FINANCIAL STATEMENTS (UNAUDITED)
(dollars in thousands, except share data, except where noted)
Credit Facilities
The following table represents the Company’s credit facilities:
| | | | | | | | | | | | | | | | |
| Instrument/Facility | Borrowing Date | Maturity Date | | Lender | | Key terms |
| AMH Credit Facility | November 23, 2020 | November 23, 2025 | | Citibank, N.A. | | The commitment fee on the $750 million undrawn AMH Credit Facility as of March 31, 2022 was 0.09%. |
Borrowings under the AMH credit facility may be used for working capital and general corporate purposes, including, without limitation, permitted acquisitions. AMH may incur incremental facilities in respect of the credit facility in an aggregate amount not to exceed $250 million plus additional amounts so long as AMH is in compliance with a net leverage ratio not to exceed 4.00 to 1.00. As of March 31, 2022, there were 0 amounts outstanding under the AMH credit facility.
The following table presents the interest expense incurred related to the Company’s debt:
| | | | | | | | | | | | | | | | | | | | | | | |
| | For the Three Months Ended June 30, | | For the Six Months Ended June 30, |
| | 2021 | | 2020 | | 2021 | | 2020 |
Interest Expense:(1) | | | | | | | |
| 2018 AMH Credit Facility | $ | 0 | | | $ | 314 | | | $ | 0 | | | $ | 628 | |
| AMH Credit Facility | 322 | | | 0 | | | 643 | | | 0 | |
| 2024 Senior Notes | 5,163 | | | 5,163 | | | 10,326 | | | 10,326 | |
| 2026 Senior Notes | 5,628 | | | 5,628 | | | 11,256 | | | 11,256 | |
| 2029 Senior Notes | 8,229 | | | 8,229 | | | 16,458 | | | 16,458 | |
| 2030 Senior Notes | 3,462 | | | 964 | | | 6,922 | | | 964 | |
| 2039 Senior Secured Guaranteed Notes | 4,111 | | | 4,111 | | | 8,223 | | | 8,223 | |
| 2048 Senior Notes | 3,781 | | | 3,780 | | | 7,562 | | | 7,562 | |
| 2050 Subordinated Notes | 3,742 | | | 3,742 | | | 7,484 | | | 7,486 | |
| AMI Term Facilities/ Secured Borrowings | 376 | | | 360 | | | 739 | | | 630 | |
| Total Interest Expense | $ | 34,814 | | | $ | 32,291 | | | $ | 69,613 | | | $ | 63,533 | |
| | | | | | | | | | | |
| | For the Three Months Ended March 31, |
| | 2022 | | 2021 |
| | | |
| | | |
| | | |
| | | |
| | | |
| | | |
| | | |
| | | |
| | | |
| | | |
| | | |
| | | |
Total Interest Expense(1) | $ | 32,993 | | | $ | 34,799 | |
| | | |
(1) Debt issuance costs incurred are amortized into interest expense over the term of the debt arrangement, as applicable. |
(1)Debt issuance costs incurred are amortized into interest expense over the term of the debt arrangement, as applicable.
11. NET INCOME (LOSS) PER SHARE OF CLASS A COMMON STOCK
The table below presents basic and diluted net income (loss) per share of Class A Common Stock using the two-class method for the three and six months ended June 30, 2021 and 2020:
| | | | | | | | | | | | | | | | | | | | | | | | | | |
| | Basic and Diluted | |
| For the Three Months Ended June 30, | | For the Six Months Ended June 30, | |
| 2021 | | 2020 | | 2021 | | 2020 | |
| Numerator: | | | | | | | | |
| Net Income (Loss) Attributable to Apollo Global Management, Inc. Class A Common Stockholders | $ | 648,563 | | | $ | 437,164 | | | $ | 1,318,289 | | | $ | (568,218) | | |
Dividends declared on Class A Common Stock(1) | (115,494) | | | (96,181) | | | (254,674) | | | (301,783) | | |
Dividends on participating securities(2) | (4,042) | | | (3,608) | | | (9,144) | | | (10,855) | | |
| Earnings allocable to participating securities | (19,774) | | | (13,947) | | | (38,970) | | | 0 | | (3) |
| Undistributed income (loss) attributable to Class A Common Stockholders: Basic and Diluted | 509,253 | | | 323,428 | | | 1,015,501 | | | (880,856) | | |
| | | | | | | | |
| | | | | | | | |
| Denominator: | | | | | | | | |
| Weighted average number of shares of Class A Common Stock outstanding: Basic and Diluted | 231,058,813 | | | 227,653,988 | | | 230,534,073 | | | 227,205,866 | | |
| | | | | | | | |
| | | | | | | | |
Net Income per share of Class A Common Stock: Basic and Diluted(4) | | | | | | | | |
| Distributed Income | $ | 0.50 | | | $ | 0.42 | | | $ | 1.10 | | | $ | 1.31 | | |
| Undistributed Income (Loss) | 2.20 | | | 1.42 | | | 4.41 | | | (3.86) | | |
| Net Income (Loss) per share of Class A Common Stock: Basic and Diluted | $ | 2.70 | | | $ | 1.84 | | | $ | 5.51 | | | $ | (2.55) | | |
| | | | | | | | |
| | | | | | | | |
| | | | | | | | |
| | | | | | | | |
(1)See note 13 for information regarding the quarterly dividends declared and paid during 2021 and2020.
(2)Participating securities consist of vested and unvested RSUs that have rights to dividends and unvested restricted shares.
(3)No allocation of undistributed losses was made to the participating securities as the holders do not have a contractual obligation to share in the losses of the Company with Class A Common Stockholders.
(4)For the three and six months ended June 30, 2021 and June 30, 2020, all of the classes of securities were determined to be anti-dilutive.
The Company has granted RSUs that provide the right to receive, subject to vesting during continued employment, shares of Class A Common Stock pursuant to the Equity Plan. The Company has 3 types of RSU grants, which we refer to as Plan Grants, Bonus Grants and Performance Grants. “Plan Grants” vest over time (generally one to six years) and may or
APOLLO GLOBAL MANAGEMENT, INC.
NOTES TO CONDENSED CONSOLIDATED
FINANCIAL STATEMENTS (UNAUDITED)
(dollars in thousands, except share data, except where noted)
may not provide the right to receive dividend equivalents on vested RSUs on an equal basis with the Class A Common Stockholders any time a dividend is declared. “Bonus Grants” vest over time (generally three years) and generally provide the right to receive dividend equivalents on both vested and unvested RSUs on an equal basis with the Class A Common Stockholders any time a dividend is declared. “Performance Grants” generally vest over time (three to five years), subject to the Company’s receipt of performance revenues, within prescribed periods, sufficient to cover the associated equity-based compensation expense. Performance Grants provide the right to receive dividend equivalents on vested RSUs and may also provide the right to receive dividend equivalents on unvested RSUs.
Any dividend equivalent paid to an employee will not be returned to the Company upon forfeiture of the award by the employee. Vested and unvested RSUs that are entitled to non-forfeitable dividend equivalents qualify as participating securities and are included in the Company’s basic and diluted earnings per share computations using the two-class method. The holder of an RSU participating security would have a contractual obligation to share in the losses of the entity if the holder is obligated to fund the losses of the issuing entity or if the contractual principal or mandatory redemption amount of the participating security is reduced as a result of losses incurred by the issuing entity. The RSU participating securities do not have a mandatory redemption amount and the holders of the participating securities are not obligated to fund losses; therefore, neither the vested RSUs nor the unvested RSUs are subject to any contractual obligation to share in losses of the Company.
Certain holders of AOG Units are subject to the transfer restrictions set forth in the agreements with the respective holders and may, upon notice (subject to the terms of an exchange agreement), exchange their AOG Units for shares of Class A Common Stock on a 1-for-1 basis. An AOG Unit holder must exchange one unit in each of the Apollo Operating Group partnerships to effectuate an exchange for 1 share of Class A Common Stock.
Apollo Global Management, Inc. has 1 share of Class B common stock, $0.00001 par value per share, of the Company (“Class B Common Stock”) outstanding, which is held by BRH Holdings GP, Ltd. (“BRH”). The voting power of the share of Class B Common Stock is reduced on a 1 vote per 1 AOG Unit basis in the event of an exchange of AOG Units for shares of Class A Common Stock, subject to the terms of the AGM Inc. Certificate of Incorporation. The Class B Common Stock has 0 net income (loss) per share as it does not participate in Apollo’s earnings (losses) or dividends. The Class B Common Stock has 0 dividend rights and only a de minimis liquidation right. The Class B Common Stock represented 46.6% and 47.2% of the total voting power of the Company’s Class A Common Stock and Class B Common Stock with respect to the matters upon which they were entitled to vote together as a single class pursuant to the Company’s governing documents as of June 30, 2021 and 2020, respectively.
The following table summarizes the anti-dilutive securities for the three and six months ended June 30, 2021 and 2020, respectively.
| | | | | | | | | | | | | | | | | | | | | | | |
| For the Three Months Ended June 30, | | For the Six Months Ended June 30, |
| 2021 | | 2020 | | 2021 | | 2020 |
| Weighted average vested RSUs | 309,142 | | | 254,147 | | | 675,233 | | | 834,718 | |
| Weighted average unvested RSUs | 8,006,542 | | | 8,252,215 | | | 7,491,189 | | | 7,670,111 | |
| | | | | | | |
Weighted average AOG Units outstanding(1) | 172,599,261 | | | 174,873,808 | | | 173,207,079 | | | 175,737,132 | |
| Weighted average unvested restricted shares | 656,220 | | | 1,310,805 | | | 680,448 | | | 1,245,164 | |
(1)Excludes AOG Units owned by Athene. Athene can only redeem their AOG Units by selling to Apollo or to a different buyer with Apollo’s agreement as detailed in the Liquidity Agreement (see note 14). As these AOG Units are not convertible into shares of Class A Common Stock, they are excluded when calculating diluted net income per share.
12. EQUITY-BASED COMPENSATION
Under AGM’s Equity Plan, AGM is permitted to grant equity awards representing ownership interest in AGM common stock to employees of AAM. The fair value of all grants is based on the grant date fair value, which considers the public share price of AGM’s common stock subject to certain discounts, as applicable. Equity-based awards granted to employees and non-employees as compensation are measured based on the grant date fair value of the award. Equity-based awards that do not require future service (i.e., vested awards) are expensed immediately. Equity-based employee awards that require future
AGM grants both service are expensed over the relevant service period. Equity-based awards that require performance metrics to be met are expensed only when the performance metric is met or deemed probable.
APOLLO GLOBAL MANAGEMENT, INC.
NOTES TO CONDENSED CONSOLIDATED
FINANCIAL STATEMENTS (UNAUDITED)
(dollars in thousands, except share data, except where noted)
RSUs
The Company grants RSUs under the Equity Plan. The fair value of all grants is based on the grant date fair value, which considers the public share price of the Company’s Class A Common Stock subject to certain discounts, as applicable. The following table summarizes the weighted average discounts for Plan Grants, Bonus Grants and Performance Grants.
performance-based awards. The estimated total grant date fair value for Plan Grants and Bonus Grantsservice-based awards is charged to compensation expense on a straight-line basis over the vesting period, which for Plan Grants is generally one to six years withfrom the first installment vesting one year after grant and quarterly vesting thereafter, and for Bonus Grants is generally annual vesting over three years.
Duringdate of grant. Certain service-based awards are tied to profit sharing arrangements in which a portion of the six months ended June 30, 2021 and June 30, 2020,performance fees distributed to the Company awarded Performance Grantsgeneral partner are required to be used by employees to purchase restricted shares of 1.2 million and 2.0 million RSUs to certain employees with a grant date fair value of $51.5 million and $81.4 million, respectively,common stock or RSUs, which are granted under AGM’s Equity Plan. Performance-based awards vest subject to continued employment and the Company’s receiptAGM’s achievement of specified performance revenues, within prescribed periods, sufficient to cover the associated equity-based compensation.goals. In accordance with U.S. GAAP, equity-based compensation expense for these and other Performance Grants will beperformance grants are typically recognized on an accelerated recognition method over the requisite service period to the extent the performance revenue metrics are met or deemed probable.
Additionally,For the three months ended March 31, 2022 and March 31, 2021, AAM recorded equity-based compensation expense of $156.3 million and $56.4 million, respectively. The equity-based compensation expense of $156.3 million for the three months ended March 31, 2022 primarily included equity-based compensation expense of $73.8 million for performance-based RSU grants, $58.8 million for service-based RSU grants and $19.2 million for restricted stock from profit sharing arrangements. The equity-based compensation expense of $56.4 million for the three months ended March 31, 2021 primarily included equity-based compensation expense of $26.4 million for performance-based RSU grants, $18.7 million for service-based RSU grants and $4.0 million for restricted stock from profit sharing arrangements. As of March 31, 2022, there was $849.0 million of estimated unrecognized compensation expense related to unvested awards. This cost is expected to be recognized over a weighted-average period of 3.3 years.
Service-Based Awards
During the three months ended March 31, 2022 and March 31, 2021, AGM awarded service-based grants of 3.1 million RSUs and 2.0 million RSUs with a grant date fair value of $193.7 million and $101.6 million, respectively. During the same periods, the Company entered into an agreement in 2018recorded equity-based compensation expense on service-based awards of $58.8 million and $18.7 million, respectively.
Performance-Based Awards
During the three months ended March 31, 2022 and March 31, 2021, AGM awarded performance-based grants of 2.1 million and 1.1 million RSUs to certain employees with several employees undera grant date fair value of $126.4 million and $48.8 million, respectively, which RSUs would be granted starting in 2020 if year-over-year growth in certain discretionary earnings metrics were attained prior to grant and they remained employed at the grant date. Once granted, the awardsprimarily vest subject to continued employment and the Company’s receipt of performance revenues, sufficient to cover the associated equity-based compensation expense. In connection with these agreements, the Company granted 0.2 million RSUs with a grant date fair value of $7.5 million that fully vested and were expensed during the six months ended June 30, 2021, and granted 0.3 million RSUs with a grant date fair value of $11.7 million that were fully vested and were expensed during the six months ended June 30, 2020.
The following table summarizes the equity-based compensation expense recognized relating to Performance Grants: | | | | | | | | | | | | | | | | | | | | | | | | | |
| For the Three Months Ended June 30, | | For the Six Months Ended June 30, |
| 2021 | | 2020 | | 2021 | | 2020 | | |
| Equity-based compensation | $ | 17,488 | | | $ | 28,467 | | | $ | 43,865 | | | $ | 57,331 | | | |
| | | | | | | | | |
The fair value of all RSU grants made during the six months ended June 30, 2021 and 2020 was $160.1 million and $179.7 million, respectively.
The following table presents the actual forfeiture rates and equity-based compensation expense recognized:
| | | | | | | | | | | | | | | | | | | | | | | |
| For the Three Months Ended June 30, | | For the Six Months Ended June 30, |
| 2021 | | 2020 | | 2021 | | 2020 |
| Actual forfeiture rate | 0.4 | % | | 5.8 | % | | 0.8 | % | | 6.4 | % |
| Equity-based compensation | $ | 40,866 | | | $ | 47,282 | | | $ | 85,971 | | | $ | 92,800 | |
The following table summarizes RSU activity:
| | | | | | | | | | | | | | | | | | | | | | | | | | |
| Unvested | | Weighted Average Grant Date Fair Value | | Vested | | Total Number of RSUs Outstanding | |
| Balance at January 1, 2021 | 8,978,393 | | | $ | 31.89 | | | 1,833,332 | | | 10,811,725 | | (1) |
| Granted | 3,336,739 | | | 48.00 | | | — | | | 3,336,739 | | |
| Forfeited | (101,554) | | | $ | 42.27 | | | 0 | | | (101,554) | | |
| Vested | (1,506,292) | | | 33.65 | | | 1,506,292 | | | — | | |
| Issued | — | | | $ | 0 | | | (2,980,032) | | | (2,980,032) | | |
| Balance at June 30, 2021 | 10,707,286 | | (2) | $ | 36.56 | | | 359,592 | | | 11,066,878 | | (1) |
(1)Amount excludes RSUs which have vested and have been issued in the form of Class A Common Stock.
(2)Includes 6,413,319 Performance Grant RSUs, 3,295,347 Bonus Grant RSUs and 998,620 Plan Grant RSUs.within prescribed periods,
APOLLO GLOBALASSET MANAGEMENT, INC.
NOTES TO CONDENSED CONSOLIDATED
FINANCIAL STATEMENTS (UNAUDITED)
(dollars in thousands, except share data, except where noted)
As of June 30, 2021, there was $233.6 million of total unrecognizedsufficient to cover the associated equity-based compensation. During the same periods, the Company recorded equity-based compensation expense relatedon performance-based awards of $73.8 million and $26.4 million, respectively.
In December 2021, the Company awarded one-time grants to unvestedthe Co-Presidents of 6 million RSUs which is expectedvest on a cliff basis subject to be recognizedcontinued employment over a weighted-average termfive years, with 2 million of 2.2 years.
Equity-Based Compensation Allocation
Equity-based compensation is allocated based on ownership interests. Therefore,those RSUs also subject to the amortizationCompany’s achievement of equity-based compensation is allocated to stockholders’ equity attributable to AGM Inc.certain of fee related earnings and spread related earnings per share metrics. During the Non-Controlling Interests, which results in a difference inthree months ended March 31, 2022, the amounts charged toCompany recorded equity-based compensation expense of $13.9 million for service-based awards and the amounts credited$5.9 million for performance-based awards related to stockholders’ equity attributable to AGM Inc. in the Company’s condensed consolidated financial statements.
Below is a reconciliation of the equity-based compensation allocated to AGM Inc.:
| | | | | | | | | | | | | | | | | | | | | | | |
| For the Six Months Ended June 30, 2021 |
| Total Amount | | Non-Controlling Interest % in Apollo Operating Group | | Allocated to Non-Controlling Interest in Apollo Operating Group(1) | | Allocated to Apollo Global Management, Inc. |
| RSUs, share options and restricted share awards | $ | 96,010 | | | 0 | % | | $ | 0 | | | $ | 96,010 | |
| | | | | | | |
| Other equity-based compensation awards | 13,436 | | | 46.5 | | | 6,248 | | | 7,188 | |
| Total equity-based compensation | 109,446 | | | | | 6,248 | | | 103,198 | |
Less other equity-based compensation awards(2) | | | | | (6,248) | | | (16,940) | |
| Capital increase related to equity-based compensation | | | | | $ | 0 | | | $ | 86,258 | |
| | | | | | | | | | | | | | | | | | | | | | | |
| For the Six Months Ended June 30, 2020 |
| Total Amount | | Non-Controlling Interest % in Apollo Operating Group | | Allocated to Non-Controlling Interest in Apollo Operating Group(1) | | Allocated to Apollo Global Management, Inc. |
| RSUs, share options and restricted share awards | $ | 107,069 | | | 0 | % | | $ | 0 | | | $ | 107,069 | |
| | | | | | | |
| Other equity-based compensation awards | 4,473 | | | 47.1 | | | 2,109 | | | 2,364 | |
| Total equity-based compensation | $ | 111,542 | | | | | 2,109 | | | 109,433 | |
Less other equity-based compensation awards(2) | | | | | (2,109) | | | (16,203) | |
| Capital increase related to equity-based compensation | | | | | $ | 0 | | | $ | 93,230 | |
(1)Calculated based on average ownership percentage for the period considering issuances of Class A shares or Class A Common Stock, as applicable, during the period.
(2)Includes equity-based compensation reimbursable by certain funds.these one-time grants.
13. EQUITY
CommonPreferred Stock
Holders of Class A Common Stock are entitled to participate in dividends from the Company on a pro rata basis.
During the three and six months ended June 30, 2021 and 2020, the Company issued shares of Class A Common Stock in settlement of vested RSUs. The Company has generally allowed holders of vested RSUs and exercised share options to settle their tax liabilities by reducing the number of shares of Class A Common Stock issued to them, which the Company refers to as “net share settlement.” Additionally, the Company has generally allowed holders of share options to settle their exercise price by reducing the number of shares of Class A Common Stock issued to them at the time of exercise by an amount sufficient to cover the exercise price. The net share settlement results in a liability for the Company and a corresponding accumulated deficit adjustment.
In January 2019, Apollo increased its authorized share repurchase amount by $250 million, bringing the total authorized repurchase amount to $500 million. On March 12, 2020, Apollo announced that the executive committee of the Company’s board of directors approved a new share repurchase authorization that allows the Company to repurchase up to
APOLLO GLOBAL MANAGEMENT, INC.
NOTES TO CONDENSED CONSOLIDATED
FINANCIAL STATEMENTS (UNAUDITED)
(dollars in thousands, except share data, except where noted)
$500 million of its Class A common stock. This new authorization increased the Company’s capacity to repurchase shares from $80 million of unused capacity under the Company’s previously approved the share repurchase plan authorization. The share repurchase plan authorization may be used to repurchase outstanding shares of Class A Common Stock as well as to reduce the number of shares of Class A Common Stock to be issued to employees to satisfy associated tax obligations in connection with the settlement of equity-based awards granted under the Equity Plan (or any successor equity plan thereto). Shares of Class A Common Stock may be repurchased from time to time in open market transactions, in privately negotiated transactions, pursuant to a trading plan adopted in accordance with Rule 10b5-1 of the Exchange Act, or otherwise, with the size and timing of these repurchases depending on legal requirements, price, market and economic conditions and other factors. Apollo is not obligated under the terms of the program to repurchase any of its shares of Class A Common Stock. The repurchase program has no expiration date and may be suspended or terminated by the Company at any time without prior notice.
The table below summarizes the issuance of shares of Class A Common Stock for equity-based awards:
| | | | | | | | | | | | | |
| For the Six Months Ended June 30, |
| 2021 | | 2020 | | |
Shares of Class A Common Stock issued in settlement of vested RSUs and share options exercised(1) | 2,980,032 | | | 4,366,569 | | | |
Reduction of shares of Class A Common Stock issued(2) | (1,218,885) | | | (1,843,305) | | | |
Shares of Class A Common Stock purchased related to share issuances and forfeitures(3) | (270,362) | | | 628,639 | | | |
| Issuance of shares of Class A Common Stock for equity-based awards | 1,490,785 | | | 3,151,903 | | | |
(1)The gross value of shares issued was $155.2 million and $202.2 million for the six months ended June 30, 2021 and 2020, respectively, based on the closing price of a Class A Common Stock at the time of issuance.
(2)Cash paid for tax liabilities associated with net share settlement was $63.7 million and $85.5 million for the six months ended June 30, 2021 and 2020, respectively.
(3)Certain Apollo employees receive a portion of the profit sharing proceeds of certain funds in the form of (a) restricted Class A Common Stock that they are required to purchase with such proceeds or (b) RSUs, in each case which equity-based awards generally vest over three years. These equity-based awards are granted under the Company's 2007 Equity Plan. To prevent dilution on account of these awards, Apollo may, in its discretion, repurchase Class A Common Stock on the open market and retire them. During the six months ended June 30, 2021 and 2020, we issued 56,243 and 636,314 of such restricted shares and 270,362 and149,042 of such RSUs under the Equity Plan, respectively, and repurchased 326,605 and 0 shares of Class A Common Stock in open-market transactions not pursuant to a publicly-announced repurchase plan or program, respectively. In addition, there were 0 and 7,675 restricted shares forfeited during the six months ended June 30, 2021 and 2020, respectively.
During the six months ended June 30, 2021 and 2020, 1,818,108 and 2,194,095 shares of Class A Common Stock were repurchased in open market transactions as part of the publicly announced share repurchase program discussed above, respectively, and such shares were subsequently canceled by the Company. The Company paid $105.7 million and $64.2 million for these open market share repurchases during the six months ended June 30, 2021 and 2020, respectively.
Preferred Stock Issuance
On March 7, 2017, Apollo issued 11,000,0006.375% Series A Preferred shares (the “Series A Preferred shares”) for gross proceeds of $275.0 million, or $264.4 million net of issuance costs and on March 19, 2018, Apollo issued 12,000,000 6.375% Series B Preferred shares (the “Series B Preferred shares” and collectively with the Series A Preferred shares, the “Preferred shares”) for gross proceeds of $300.0 million, or $289.8 million net of issuance costs.
As a result of the conversion to a corporation, (i) each Series A Preferred share representing limited liability company interests of Apollo Global Management, LLC (“AGM LLC”) outstanding immediately prior to the effective time of the conversion converted into 1 issued and outstanding fully paid and nonassessable shareas of Series A Preferred Stock, having a liquidation preference of $25.00 per share, of the Company and (ii) each Series B Preferred share representing limited liability company interests of AGM LLC outstanding immediately prior to the effective time of the conversion converted into 1 issued and outstanding, fully paid and nonassessable share of Series B Preferred Stock, having a liquidation preference of $25.00 per share, of the Company (the Series A Preferred Stock and the Series B Preferred Stock collectively, the “Preferred Stock”).March 31, 2022.
When, as and if declared by the executive committee of the board of directors of AGM Inc., dividends on the Preferred Stock will be payable quarterly on March 15, June 15, September 15 and December 15 of each year, beginning on June 15, 2018 for the Series B Preferred Stock, at a rate per annum equal to 6.375%. Dividends on the Preferred Stockshares are
APOLLO GLOBAL MANAGEMENT, INC.
NOTES TO CONDENSED CONSOLIDATED
FINANCIAL STATEMENTS (UNAUDITED)
(dollars in thousands, except share data, except where noted)
discretionary and non-cumulative. During 2021,2022, quarterly cash dividends were $0.398438 per share of Series A Preferred Stockshare and Series B Preferred Stock.share.
Subject to certain exceptions, unless dividends have been declared and paid or declared and set apart for payment on the Preferred Stockshares for a quarterly dividend period, during the remainder of that dividend period Apollo may not declare or pay or set apart payment for dividends on any shares of Class A Common Stockcommon stock or any other equity securities that the Company may issue in the future ranking as to the payment of dividends, junior to the Preferred Stockshares (“Junior Stock”) and Apollo may not repurchase any Junior Stock.
The Series A Preferred Stockshares and the Series B Preferred Stockshares may be redeemed at Apollo’s option, in whole or in part, at any time on or after March 15, 2022 and March 15, 2023, respectively, at a price of $25.00 per share, of Preferred Stock, plus declared and unpaid dividends to, but excluding, the redemption date, without payment of any undeclared dividends. Holders of the Preferred Stock willshares have no right to require the redemption of the Preferred Stockshares and there is no maturity date.
If a certain change of control event or a certain tax redemption event occurs prior to March 15, 2022 and March 15, 2023 for the Series AB Preferred Stock andshares, the Series B Preferred Stock, respectively, the Preferred Stockshares may be redeemed at Apollo’s option, in whole but not in part, upon at least 30 days’ notice, within 60 days of the occurrence of such change of control event or such tax redemption event, as applicable, at a price of $25.25 per share, of Preferred Stock, plus declared and unpaid dividends to, but excluding, the redemption date, without payment of any undeclared dividends. If a certain rating agency event occurs prior to March 15, 2023, the Series B Preferred Stockshares may be redeemed at Apollo’s option, in whole but not in part, upon at least 30 days’ notice, within 60 days of the occurrence of such rating agency event, at a price of $25.50 per share, of Series B Preferred Stock, plus declared and unpaid dividends to, but excluding, the redemption date, without payment of any undeclared dividends. If (i) a change of control event occurs (whether before, on or after March 15, 2022 and March 15, 2023 for the Series A Preferred Stock and the Series B Preferred Stock, respectively) and (ii) Apollo does not give notice prior to the 31st day following the change of control event to redeem all the outstanding Preferred Stock,shares, the dividend rate per annum on the Preferred Stockshares will increase by 5.00%, beginning on the 31st day following such change of control event.
The Preferred Stockshares are not convertible into Class A Common Stockcommon stock and have no voting rights, except in limited circumstances as provided in the Company’s certificate of incorporation. In connection with the issuance of the Preferred Stock, certain Apollo Operating Group entities issued for the benefit of Apollo a series of preferred units with economic terms that mirror those of the Preferred Stock.
Dividends and Distributions
The table below presents information regarding the quarterly dividends and distributions which were made at the sole discretion of the executive committee of the board of directors (in millions, except per share data). Certain subsidiaries of AGM Inc. may be subject to U.S. federal, state, local and non-U.S. income taxes at the entity level and may pay taxes and/or make payments under the tax receivable agreement in a given fiscal year; therefore, the net amounts ultimately distributed by AGM Inc. to its Class A Common Stockholders in respect of each fiscal year are generally expected to be less than the net amounts distributed to AOG Unitholders.
APOLLO GLOBALASSET MANAGEMENT, INC.
NOTES TO CONDENSED CONSOLIDATED
FINANCIAL STATEMENTS (UNAUDITED)
(dollars in thousands, except share data, except where noted)
| | | | | | | | | | | | | | | | | | | | | | | | | | | | | | | | | | | | | | |
| Dividend Declaration Date | | Dividend per share of Class A Common Stock | | Payment Date | | Dividend to Class A Common Stockholders | | Distribution to Non-Controlling Interest Holders in the Apollo Operating Group | | Total Distributions from Apollo Operating Group | | Distribution Equivalents on Participating Securities |
| | | | | | | | | | | | |
| | | | | | | | | | | | |
| | | | | | | | | | | | |
| | | | | | | | | | | | |
| | | | | | | | | | | | |
| | | | | | | | | | | | |
| | | | | | | | | | | | |
| | | | | | | | | | | | |
| | | | | | | | | | | | |
| | | | | | | | | | | | |
| | | | | | | | | | | | |
| | | | | | | | | | | | |
| | | | | | | | | | | | |
| | | | | | | | | | | | |
| January 30, 2020 | | $ | 0.89 | | | February 28, 2020 | | $ | 205.6 | | | $ | 155.6 | | | $ | 361.2 | | | $ | 7.2 | |
| N/A | | 0 | | | April 15, 2020 | | 0 | | | 43.0 | | (1) | 43.0 | | | 0 | |
| May 1, 2020 | | 0.42 | | May 29, 2020 | | 96.2 | | | 85.7 | | | 181.9 | | | 3.6 | |
| July 30, 2020 | | 0.49 | | August 31, 2020 | | 112.1 | | | 100.0 | | | 212.1 | | | 4.0 | |
| October 29, 2020 | | 0.51 | | | November 30, 2020 | | 116.7 | | | 104.0 | | | 220.7 | | | 4.1 | |
| For the Year Ended December 31, 2020 | | $ | 2.31 | | | | | $ | 530.6 | | | $ | 488.3 | | | $ | 1,018.9 | | | $ | 18.9 | |
| February 03, 2021 | | $ | 0.60 | | | February 26, 2021 | | $ | 139.2 | | | $ | 121.4 | | | $ | 260.6 | | | $ | 5.1 | |
| N/A | | 0 | | | April 14, 2021 | | 0 | | | 41.8 | | (1) | 41.8 | | | 0 | |
| May 04, 2021 | | 0.50 | | | May 28, 2021 | | 115.5 | | | 100.9 | | | 216.4 | | | 4.0 | |
| N/A | | 0 | | | June 15, 2021 | | 0 | | | 19.5 | | (1) | 19.5 | | | 0 | |
| For the Six Months Ended June 30, 2021 | | $ | 1.10 | | | | | $ | 254.7 | | | $ | 283.6 | | | $ | 538.3 | | | $ | 9.1 | |
| | | | | | | | | | | | |
(1) On April 14, 2021 and April 15, 2020 the Company made a $0.15 and $0.21 per AOG Unit pro rata distribution, respectively, to the Non-Controlling Interest holders in the Apollo Operating Group, in connection with payments made under the tax receivable agreement. See note 14 for more information regarding the tax receivable agreement. On April 14, 2021 and June 15, 2021, the Company made a $0.03 and $0.08 per AOG Unit pro rata distribution, respectively, to the Non-Controlling Interest holders in the Apollo Operating Group, in connection with U.S. corporate tax payments.
Non-Controlling Interests
As discussed in note 1, Athene Holding acquired 29,154,519 non-voting equity interests of the Apollo Operating Group, which as of June 30, 2021 represented a 6.7% economic interest in the Apollo Operating Group. The table below presents equity interests in Apollo’s consolidated, but not wholly-owned, subsidiaries and funds. Net income and comprehensive income attributable to Non-Controlling Interests consisted of the following:
| | | | | | | | | | | | |
| For the Three Months Ended March 31, |
| | 2022 | | 2021 | |
| Net income attributable to Non-Controlling Interests in consolidated entities: | | | | |
Interest in management companies and a co-investment vehicle(1) | $ | 1,357 | | | $ | 1,280 | | |
| Other consolidated entities | 208,752 | | | 69,298 | | |
| Net income attributable to Non-Controlling Interests in consolidated entities | $ | 210,109 | | | $ | 70,578 | | |
| | | | |
| Net income attributable to Non-Controlling Interests in the Apollo Operating Group: | | | | |
| Net income | $ | 1,283,622 | | | $ | 1,518,503 | | |
| Net income attributable to Non-Controlling Interests in consolidated entities | (210,109) | | | (70,578) | | |
| Net income after Non-Controlling Interests in consolidated entities | 1,073,513 | | | 1,447,925 | | |
| Adjustments: | | | | |
Income tax provision(2) | 134,174 | | | 203,246 | | |
NYC UBT and foreign tax benefit(3) | (8,460) | | | (5,754) | | |
| Net income (loss) in non-Apollo Operating Group entities | 17,502 | | | (1,249) | | |
| Series A Preferred share dividends | (4,383) | | | (4,383) | | |
| Series B Preferred share dividends | (4,781) | | | (4,781) | | |
| Total adjustments | 134,052 | | | 187,079 | | |
| Net income after adjustments | 1,207,565 | | | 1,635,004 | | |
| Weighted average ownership percentage of Apollo Operating Group | 42.6 | % | | 46.7 | % | |
| Net income attributable to Non-Controlling Interests in Apollo Operating Group | $ | 476,545 | | | $ | 769,035 | | |
| | | | |
| Net income attributable to Non-Controlling Interests | $ | 686,654 | | | $ | 839,613 | | |
| Other comprehensive income attributable to Non-Controlling Interests | (7,362) | | | (13,764) | | |
| Comprehensive Income Attributable to Non-Controlling Interests | $ | 679,292 | | | $ | 825,849 | | |
| | | | |
(1) Reflects the remaining interest held by certain individuals who receive an allocation of income from certain of the credit funds managed by Apollo. | |
(2) Reflects all taxes recorded in our condensed consolidated statements of operations. Of this amount, U.S. federal, state, and local corporate income taxes attributable to AAM and its subsidiaries are added back to income of the Apollo Operating Group before calculating Non-Controlling Interests as the income allocable to the Apollo Operating Group is not subject to such taxes. | |
(3) Reflects New York City Unincorporated Business Tax (“NYC UBT”) and foreign taxes that are attributable to the Apollo Operating Group and its subsidiaries related to its operations in the U.S. as partnerships and in non-U.S. jurisdictions as corporations. As such, these amounts are considered in the income attributable to the Apollo Operating Group. | |
Redeemable Non-Controlling Interests
As discussed in note 2, redeemable non-controlling interests represent the shares issued by the Company’s consolidated SPACs. The table below presents the activities associated with the redeemable non-controlling interests.
| | | | | | | | | | | | | |
| For the Three Months Ended March 31, |
| | 2022 | | 2021 | | |
| Balance at beginning of period | $ | 1,770,034 | | | $ | 782,702 | | | |
| Net issuances of redeemable non-controlling interests | — | | | 636,966 | | | |
| Accretion of redeemable non-controlling interests | 19,980 | | | (18,938) | | | |
| Balance at end of period | $ | 1,790,014 | | | $ | 1,400,730 | | | |
| | | | | |
APOLLO GLOBALASSET MANAGEMENT, INC.
NOTES TO CONDENSED CONSOLIDATED
FINANCIAL STATEMENTS (UNAUDITED)
(dollars in thousands, except share data, except where noted)
| | | | | | | | | | | | | | | | | | | | | | | |
| For the Three Months Ended June 30, | | For the Six Months Ended June 30, |
| | 2021 | | 2020 | | 2021 | | 2020 |
| Net income (loss) attributable to Non-Controlling Interests in consolidated entities: | | | | | | | |
Interest in management companies and a co-investment vehicle(1) | $ | 1,317 | | | $ | 1,031 | | | $ | 2,597 | | | $ | 1,279 | |
| Other consolidated entities | 114,959 | | | 40,037 | | | 184,257 | | | (124,620) | |
| Net income (loss) attributable to Non-Controlling Interests in consolidated entities | $ | 116,276 | | | $ | 41,068 | | | $ | 186,854 | | | $ | (123,341) | |
| | | | | | | |
| Net income (loss) attributable to Non-Controlling Interests in the Apollo Operating Group: | | | | | | | |
| Net income (loss) | $ | 1,505,460 | | | $ | 999,085 | | | $ | 3,023,963 | | | $ | (1,284,758) | |
| Net income (loss) attributable to Non-Controlling Interests in consolidated entities | (116,276) | | | (41,068) | | | (186,854) | | | 123,341 | |
| Net income (loss) after Non-Controlling Interests in consolidated entities | 1,389,184 | | | 958,017 | | | 2,837,109 | | | (1,161,417) | |
| Adjustments: | | | | | | | |
Income tax provision (benefit)(2) | 194,051 | | | 140,323 | | | 397,297 | | | (155,530) | |
NYC UBT and foreign tax benefit(3) | (7,727) | | | (3,181) | | | (13,481) | | | (10,643) | |
| Net income (loss) in non-Apollo Operating Group entities | 1,253 | | | 10 | | | 4 | | | 18 | |
| Series A Preferred Stock Dividends | (4,383) | | | (4,383) | | | (8,766) | | | (8,766) | |
| Series B Preferred Stock Dividends | (4,781) | | | (4,782) | | | (9,562) | | | (9,563) | |
| Total adjustments | 178,413 | | | 127,987 | | | 365,492 | | | (184,484) | |
| Net income (loss) after adjustments | 1,567,597 | | | 1,086,004 | | | 3,202,601 | | | (1,345,901) | |
| Weighted average ownership percentage of Apollo Operating Group | 46.6 | % | | 47.1 | % | | 46.6 | % | | 46.7 | % |
| Net income (loss) attributable to Non-Controlling Interests in Apollo Operating Group | $ | 731,457 | | | $ | 511,688 | | | $ | 1,500,492 | | | $ | (611,528) | |
| | | | | | | |
| Net income (loss) attributable to Non-Controlling Interests | $ | 847,733 | | | $ | 552,756 | | | $ | 1,687,346 | | | $ | (734,869) | |
| Other comprehensive income (loss) attributable to Non-Controlling Interests | 3,571 | | | 6,223 | | | (10,193) | | | (818) | |
| Comprehensive Income (Loss) Attributable to Non-Controlling Interests | $ | 851,304 | | | $ | 558,979 | | | $ | 1,677,153 | | | $ | (735,687) | |
(1)Reflects the remaining interest held by certain individuals who receive an allocation of income from certain of the credit funds managed by Apollo.
(2)Reflects all taxes recorded in our condensed consolidated statements of operations. Of this amount, U.S. federal, state, and local corporate income taxes attributable to AGM Inc. and its subsidiaries are added back to income of the Apollo Operating Group before calculating Non-Controlling Interests as the income allocable to the Apollo Operating Group is not subject to such taxes.
(3)Reflects New York City Unincorporated Business Tax (“NYC UBT”) and foreign taxes that are attributable to the Apollo Operating Group and its subsidiaries related to its operations in the U.S. as partnerships and in non-U.S. jurisdictions as corporations. As such, these amounts are considered in the income attributable to the Apollo Operating Group.
14. RELATED PARTY TRANSACTIONS AND INTERESTS IN CONSOLIDATED ENTITIES
Management fees, transaction and advisory fees and reimbursable expenses from the funds the Company manages and their portfolio companies are included in due from related parties in the condensed consolidated statements of financial condition. The Company also typically facilitates the payment of certain operating costs incurred by the funds that it manages as well as their related parties. These costs are normally reimbursed by such funds and are included in due from related parties. Other related party transactions include loans to employees and periodic sales of ownership interests in Apollo funds to employees. Due from related parties and due to related parties are comprised of the following:
APOLLO GLOBAL MANAGEMENT, INC.
NOTES TO CONDENSED CONSOLIDATED
FINANCIAL STATEMENTS (UNAUDITED)
(dollars in thousands, except share data, except where noted)
| | | | | | | | | | | |
| As of
June 30, 2021 | | As of
December 31, 2020 |
| Due from Related Parties: | | | |
| Due from credit funds | $ | 206,904 | | | $ | 183,992 | |
| Due from private equity funds | 25,318 | | | 21,169 | |
| Due from real assets funds | 38,194 | | | 28,231 | |
| Due from portfolio companies | 63,119 | | | 80,122 | |
| Due from Contributing Partners, employees and former employees | 92,392 | | | 148,869 | |
| | | |
| Total Due from Related Parties | $ | 425,927 | | | $ | 462,383 | |
| Due to Related Parties: | | | |
| Due to Co-Founders and Contributing Partners | $ | 306,635 | | | $ | 310,230 | |
| Due to credit funds | 31,876 | | | 34,280 | |
| Due to private equity funds | 65,604 | | | 216,899 | |
| Due to real assets funds | 35,547 | | | 47,060 | |
| | | |
| Total Due to Related Parties | $ | 439,662 | | | $ | 608,469 | |
| | | | | | | | | | | |
| As of
March 31, 2022 | | As of
December 31, 2021 |
| Due from Related Parties: | | | |
Due from funds(1) | $ | 209,969 | | | $ | 315,875 | |
| Due from employees and former employees | 100,229 | | | 106,755 | |
| Due from portfolio companies | 59,026 | | | 66,960 | |
| | | |
| Incentive fees receivable | 1,210 | | | 4,236 | |
| Total Due from Related Parties | $ | 370,434 | | | $ | 493,826 | |
| Due to Related Parties: | | | |
Due to Former Managing Partners and Contributing Partners(2) | $ | 1,044,823 | | | $ | 1,118,272 | |
| Due to parent | 548,377 | | | — | |
| Due to funds | 131,771 | | | 104,130 | |
| | | |
| Total Due to Related Parties | $ | 1,724,971 | | | $ | 1,222,402 | |
| | | |
(1) Includes $47.8 million related to a receivable from a fund in connection with the Company’s sale of a platform investment to such fund. The amount is payable to the Company over five years and is held at fair value. |
(2) Includes $482.0 million and $569.6 million as of March 31, 2022 and December 31, 2021 related to the purchase of limited partnership interests, payable in equal installments through December 31, 2024. |
Tax Receivable Agreement
SubjectOn January 1, 2022, Apollo acquired Athene and merged operations into a newly established HoldCo, later renamed Apollo Global Management, Inc. Pursuant to the Merger Agreement executed by AGM and the Managing Partners and Contributing Partners, all AOG Units beneficially owned by each holder of AOG Units were converted to shares of AGM common stock following the consummation of the Merger.
Prior to the consummation of the Mergers, each of the Former Managing Partners and Contributing Partners, subject to certain restrictions, each of the Co-Founders and Contributing Partners hashad the right to exchange his vested AOG Units for the Company’s Class A Common Stock.shares. All Apollo Operating Group entities have made, or will make, an election under Section 754 of the U.S. Internal Revenue Code, of 1986, as amended (the “Internal Revenue Code”), which will result in an adjustment to the tax basis of the assets owned by the Apollo Operating Group entities at the time ofan exchange was made. The election results in an increase to the exchange. These exchanges will result in increases in thetax basis of underlying assets thatwhich will reduce the amount of gain and associated tax that AGM Inc. and its subsidiaries will otherwise be required to pay in the future.
The tax receivable agreement (“TRA”) provides for the payment to the Co-FoundersFormer Managing Partners and Contributing Partners of 85% of the amount of cash savings, if any, in U.S. federal, state, local and foreign income taxes that AGM Inc. and its subsidiariesApollo realizes as a result of the increases in tax basis of assets that resulted from the 2007 Reorganization, the Conversion,transactions and other exchanges of AOG Units for Class A Common Stockshares that have occurred in prior years. AGM Inc. and its subsidiaries retain the benefit from the remaining 15% of actual cash tax savings. In May 2022, Apollo waived its early termination right, which had provided it the right to early terminate the tax receivable agreement at any time by payment of an early termination payment to all holders. If the Company does not make the required annual payment on a timely basis as outlined in the tax receivable agreement,TRA, interest is accrued on the balance until the payment date.
Following the closing of the Mergers, the Former Managing Partners and Contributing Partners no longer own AOG Units. Therefore, there were no exchanges subject to the TRA during the three months ended March 31, 2022.
As a result of the exchanges of AOG Units for Class A Common StockShares during the sixthree months ended June 30,March 31, 2021 and 2020, a $38.2 million and $62.5$26 million liability was recorded respectively, to estimate the amount of the future expected payments to be made by AGM Inc. and its subsidiaries to the Co-FoundersFormer Managing Partners and Contributing Partners pursuant to the tax receivable agreement. In April 2021, Apollo made a $39.9 million cash payment pursuant to the tax receivable agreement resulting from the realized tax benefit for the 2020 tax year. In connection with this payment, the Company made a corresponding pro rata distribution of $34.7 million ($0.15 per AOG Unit) to the Non-Controlling Interest holders in the Apollo Operating Group. In April 2020, Apollo made a $48.2 million cash payment pursuant to the tax receivable agreement resulting from the realized tax benefit for the 2019 tax year. In connection with this payment, the Company made a corresponding pro rata distribution of $43.0 million ($0.21 per AOG Unit) to the Non-Controlling Interest holders in the Apollo Operating Group.
Pursuant to the binding governance term sheet the Company entered into with the Co-Founders, all AOG Units beneficially owned by each holder of AOG Units (other than Athene) will be transferred to a wholly-owned subsidiary of a newly formed holding company (“NewCo”) and one or more of its affiliates in a series of transactions in exchange for (i) such number of shares of Class A common stock of NewCo equal to the aggregate number of AOG Units beneficially owned by such AOG Unit owners as of immediately prior to the mandatory exchange (such AOG Units, the “Outstanding AOG Units”) and (ii) an aggregate amount in cash equal to the product of (a) number of Outstanding AOG Units multiplied by (b) $3.66, payable over a period of four years in equal quarterly installments (the “AOG Unit Payment”); provided, however, that in the event that the Company consummates the transactions contemplated by the Merger Agreement simultaneously with the mandatory exchange, the AOG Unit Payment will be payable over the period between the date on which the transactions contemplated by the Merger Agreement are consummated and the third anniversary of the Mandatory Exchange Date in equal quarterly installments (such transactions collectively, the “mandatory exchange”).TRA.
APOLLO GLOBALASSET MANAGEMENT, INC.
NOTES TO CONDENSED CONSOLIDATED
FINANCIAL STATEMENTS (UNAUDITED)
(dollars in thousands, except share data, except where noted)
The term sheet also states thatAOG Unit Payment
On December 31, 2021, holders of AOG Units (other than Athene and the tax receivable agreement will not be applicableCompany) sold and transferred a portion of such AOG Units to APO Corp., a wholly-owned consolidated subsidiary of the Company, in exchange for an amount equal to $3.66 multiplied by the mandatory exchange, but will remain in effect for any exchanges occurringtotal number of AOG Units held by such holders immediately prior to such transaction (such payment, the mandatory exchange date.“AOG Unit Payment”). The remainder of the AOG Units held by such holders were exchanged for shares of AGM common stock concurrently with the consummation of the Mergers on January 1, 2022.
As of March 31, 2022, the outstanding payable amount to Former Managing Partners and Contributing Partners was $482 million, which is payable in equal installments through December 31, 2024.
Due from Contributing Partners, Employees and Former Employees
As of June 30, 2021March 31, 2022 and December 31, 2020,2021, due from Contributing Partners, Employeesemployees and Former Employeesformer employees includes various amounts due to the Company including employee loans and return of profit sharing distributions. As of June 30, 2021March 31, 2022 and December 31, 2020,2021, the balance included interest-bearing employee loans receivable of $15.8$22.8 million and $17.5 million respectively. The outstanding principal amount of the loans as well as all accrued and unpaid interest is required to be repaid at the earlier of the eighth anniversary of the date of the relevant loan or at the date of the relevant employee’s resignation from the Company.
The Company recorded a receivable from the Contributing Partners and certain employees and former employees for the potential return of profit sharing distributions that would be due if certain funds were liquidated as of June 30, 2021March 31, 2022 and December 31, 20202021 of $67.7$63.8 million and $124.1$64.5 million, respectively.
Indemnity
Performance revenues from certain funds can be distributed to the Company on a current basis, but are subject to repayment by the subsidiaries of the Apollo Operating Group that act as general partners of the funds in the event that certain specified return thresholds are not ultimately achieved. The Co-Founders,Former Managing Partners, Contributing Partners and certain other investment professionals have personally guaranteed, subject to certain limitations, the obligations of these subsidiaries in respect of this general partner obligation. Such guarantees are several and not joint and are limited to a particular Co-Founders’Former Managing Partners’ or Contributing Partner’s distributions. Pursuant to an existing shareholders agreement, theThe Company has agreed to indemnify each of the Company’s Co-FoundersFormer Managing Partners and certain Contributing Partners against all amounts that they pay pursuant to any of these personal guarantees in favor of certain funds that the Company manages (including costs and expenses related to investigating the basis for or objecting to any claims made in respect of the guarantees) for all interests that the Company’s Co-FoundersFormer Managing Partners and Contributing Partners have contributed or sold to the Apollo Operating Group.
Accordingly, in the event that the Company’s Co-Founders, Contributing Partners and certain investment professionals are required to pay amounts in connection with a general partner obligation for the return of previously made distributions with respect to Fund IV, Fund V and Fund VI, the Company will be obligated to reimburse the Company’s Co-Founders and certain Contributing Partners for the indemnifiable percentage of amounts that they are required to pay even though the Company did not receive the certain distribution to which that general partner obligation related. The Company recorded an indemnification liability in respect of $13.2this indemnification obligation of $13.5 million and $12.8$13.2 million as of June 30, 2021March 31, 2022 and December 31, 2020,2021, respectively.
Due to Credit, Private Equity and Real Assets Funds
Based upon an assumed liquidation of certain of the credit, private equity and real assets funds the Company manages, the Company has recorded a general partner obligation to return previously distributed performance allocations, which represents amounts due to these funds. The general partner obligation is recognized based upon an assumed liquidation of a fund’s net assets as of the reporting date. The actual determination and any required payment of any such general partner obligation would not take place until the final disposition of a fund’s investments based on the contractual termination of the fund or as otherwise set forth in the respective limited partnership agreement or other governing document of the fund.
The following table presents theCompany recorded general partner obligationobligations to return previously distributed performance allocations related to certain funds by segment:
| | | | | | | | | | | |
| As of
June 30, 2021 | | As of
December 31, 2020 |
| Credit | $ | 0 | | | $ | 0 | |
| Private Equity | 65,289 | | | 215,011 | |
| Real Assets | 35,367 | | | 46,860 | |
| Total general partner obligation | $ | 100,656 | | | $ | 261,871 | |
APOLLO GLOBAL MANAGEMENT, INC.
NOTES TO CONDENSED CONSOLIDATED
FINANCIAL STATEMENTS (UNAUDITED)
(dollars in thousands, except share data, except where noted)
Athene$80.2 million and $81.2 million as of March 31, 2022 and December 31, 2021, respectively.
Athene Holding, through its subsidiaries, is a leading retirement services company that issues, reinsures and acquires retirement savings products designed for the increasing number of individuals and institutions seeking to fund retirement needs. The products and services offered by Athene include fixed and fixed indexed annuity products, reinsurance services offered to third-party annuity providers; and institutional products, such as funding agreements. Athene Holding is currently listed on the New York Stock Exchange under the symbol “ATH”.Fee Arrangement
The Company provides asset management and advisory services to Athene, including asset allocation services, direct asset management services, asset and liability matching management, mergers and acquisitions, asset diligence hedging and other asset management services. On September 20, 2018,March 31, 2022, Athene and Apollo agreed to revise the existing fee arrangements (the “amended fee agreement”) between Athene and Apollo. The Company began recording fees pursuant to the amended fee agreement on January 1, 2019.2022. The amended fee agreement provides for sub-allocation fees which vary based on portfolio allocation differentiation, as described below.
APOLLO ASSET MANAGEMENT, INC.
NOTES TO CONDENSED CONSOLIDATED
FINANCIAL STATEMENTS (UNAUDITED)
(dollars in thousands, except share data, except where noted)
The amended fee agreement provides for a monthly fee to be payable by Athene to the Company in arrears, with retroactive effect to the month beginning on January 1, 2019,2022, in an amount equal to the following, to the extent not otherwise payable to the Company pursuant to any one or more investment management or sub-advisory agreements or arrangements:
(i) The Company, through its consolidated subsidiary Apollo Insurance Solutions Group LP, or ISG, earns a base management fee of 0.225% per year on the aggregate marketbook value of substantially all of the assets in substantially all of the investment accounts of or relating to Athene (collectively, the “Athene Accounts”) up to $103.4 billion (the level of assets in the Athene Accounts as of January 1, 2019, excluding certain assets, the “Backbook Value”) and 0.150% per year on all assets in excess of $103.4 billion (the “Incremental Value”), respectively; plus
(ii) with respect to each asset in an Athene Account, subject to certain exceptions, that is managed by the Company and that belongs to a specified asset class tier (“core,” “core plus,” “yield,” and “high alpha”), a sub-allocation fee as follows, which will, in the case of assets acquired after January 1, 2019, be subject to a cap of 10% of the applicable asset’s gross book yield:follows:
| | | | | |
| As of
June 30, 2021March 31, 2022 |
| Sub-Allocation Fees: | |
Core Assets(1) | 0.065 | % |
Core Plus Assets(2) | 0.130 | % |
Yield Assets(3) | 0.375 | % |
High Alpha Assets(4) | 0.700 | % |
Other Assets (5) | 0— | % |
(1)Core assets include public investment grade corporate bonds, municipal securities, agency residential or commercial mortgage backed securities and obligations of any governmental agency or government sponsored entity that is not expressly backed by the U.S. government.
(2)Core plus assets include private investment grade corporate bonds, fixed rate first lien commercial mortgage loans and obligations issued or assumed by a financial institution (such an institution, a “financial issuer”) and determined by Apollo to be “Tier 2 Capital” under the Basel III recommendations developed by the Basel Committee on Banking Supervision (or any successor to such recommendations).
(3)Yield assets include non-agency residential mortgage-backed securities, investment grade collateralized loan obligations, certain asset-backed securities, commercial mortgage-backed securities, emerging market investments, below investment grade corporate bonds, subordinated debt obligations, hybrid securities or surplus notes issued or assumed by a financial issuer, as rated preferred equity, residential mortgage loans, bank loans, investment grade infrastructure debt and certain floating rate commercial mortgage loans.
(4)High alpha assets include subordinated commercial mortgage loans, below investment grade collateralized loan obligations, unrated preferred equity, debt obligations originated by MidCap, below investment grade infrastructure debt, certain loans originated directly by Apollo and agency mortgage derivatives.
(5)Other Assets include cash, treasuries, equities and alternatives. With respect to equities and alternatives, Apollo earns performance revenues of 0% to 20%.
APOLLO GLOBAL MANAGEMENT, INC.
NOTES TO CONDENSED CONSOLIDATED
FINANCIAL STATEMENTS (UNAUDITED)
(dollars in thousands, except share data, except where noted)
Athene and Apollo Strategic Transaction
On October 28, 2019 Athene Holding, AGM Inc. and the entities that form the Apollo Operating Group entered into a Transaction Agreement, pursuant to which, among other things:
•(i) Athene Holding issued, on February 28, 2020 (the “Closing Date”), 35,534,942 Class A common shares of Athene Holding (the “AHL Class A Common Shares”) to certain subsidiaries of the Apollo Operating Group in exchange for (i) issuance by the Apollo Operating Group of 29,154,519 non-voting equity interests of the Apollo Operating Group to AHL and (ii) $350 million in cash (“Share Issuance”);
•Athene Holding granted to AGM Inc. the right to purchase additional AHL Class A Common Shares from the Closing Date until 180 days thereafter to the extent the issued and outstanding AHL Class A Common Shares beneficially owned by Apollo and certain of its related parties and employees (collectively, the “Apollo Parties”) (inclusive of AHL Class A Common Shares over which any such persons have a valid proxy) do not equal at least 35% of the issued and outstanding AHL Class A Common Shares, on a fully diluted basis;
•A representative of the Apollo Operating Group has the right to purchase up to that number of AHL Class A Common Shares that would increase by up to 5% the percentage of the issued and outstanding AHL Class A Common Shares beneficially owned by the Apollo Parties (inclusive of AHL Class A Common Shares over which any such persons have a valid proxy), calculated on a fully diluted basis;
•Athene Holding amended and restated its Twelfth Amended and Restated Bye-laws of Athene Holding to, among other items, eliminate Athene Holding’s multi-class share structure (“Multi-Class Share Elimination”). In connection with the Multi-Class Share Elimination, (i) all of the Class B common shares of Athene Holding would be converted into an equal number of AHL Class A Common Shares on a one-for-one basis and (ii) all of the Class M common shares of Athene Holding were converted into a combination of AHL Class A Common Shares and warrants to purchase AHL Class A Common Shares.
On February 28, 2020, Apollo and Athene closed on the strategic transaction discussed above. In connection with the transaction, Apollo purchased a 17% incremental equity stake in Athene at a premium, bringing Apollo’s beneficial ownership in Athene to 28%, or 35% including shares and warrants owned by related parties and employees, on a fully diluted basis. Apollo entered into a lock-up agreement restricting transfers of Apollo’s existing and newly acquired shares of Athene for three years from the Closing Date.
As of June 30, 2021 and December 31, 2020, the Company held a 28.4% and an 28.5% ownership interest in the AHL Class A Common Shares, respectively.
Liquidity Agreement
In connection with the consummation of the Share Issuance and the Multi-Class Share Elimination, AGM Inc. also entered into a Liquidity Agreement, dated as of the Closing Date, with Athene Holding (the “Liquidity Agreement”), pursuant to which, once each quarter, Athene Holding is entitled to request to sell a number of AOG Units or request AGM Inc. to sell a number of shares of AGM Inc. Class A Common Stock or AOG Units representing at least $50 million, in each case, in exchange for payment of the Cash Amount (as defined below). If Athene Holding intends to exercise such sale request, it will provide a notice of such intent to sell such AOG Units to AGM Inc. Upon receipt of such notice, subject to certain restrictions described below, AGM Inc. will consummate, or, in the case of an AOG Transaction (as defined below), permit the consummation of, one of the following transactions:
•a transaction whereby AGM Inc. purchases AOG Units from Athene Holding at a price agreed upon, in good faith, by AGM Inc. and Athene Holding (a “Purchase Transaction”);
•if Athene Holding and AGM Inc. do not agree to consummate a Purchase Transaction, AGM Inc. will use its best efforts to consummate a public offering of AGM Inc. Class A Common Stock, the proceeds (net of certain commissions, fees and expenses consistent with customary and prevailing market practices for similar offerings) of which will be used to fund the purchase of AOG Units from Athene Holding (a “Registered Sale”);
•if AGM Inc. notifies Athene Holding that it cannot consummate a Registered Sale, upon Athene Holding’s request, AGM Inc. will use its best efforts to consummate a sale of AGM Inc. Class A Common Stock pursuant to an
APOLLO GLOBAL MANAGEMENT, INC.
NOTES TO CONDENSED CONSOLIDATED
FINANCIAL STATEMENTS (UNAUDITED)
(dollars in thousands, except share data, except where noted)
exemption from the registration requirements of the Securities Act, the proceeds (net of certain commissions, fees and expenses consistent with customary and prevailing market practices for similar offerings) of which will be used to fund the purchase of AOG Units from Athene Holding (a “Private Placement,” and collectively with a Purchase Transaction and a Registered Sale, a “Sale Transaction”); or
•if AGM Inc. elects (in its sole discretion) not to consummate a Sale Transaction, Athene Holding will be permitted to sell AOG Units in one or more transactions that are exempt from the registration requirements of the Securities Act, subject to certain restrictions (an “AOG Transaction”).
For purposes of this description, “Cash Amount” means (i) in the case of a Registered Sale, the cash proceeds that AGM Inc. receives upon the consummation of a Registered Sale after deducting a capped amount of documented commissions, fees and expenses, (ii) in the case of a Purchase Transaction, the cash proceeds to which AGM Inc. and Athene Holding agree, (iii) in the case of a Private Placement, the cash proceeds that AGM Inc. receives upon the consummation of a Private Placement after deducting a capped amount of documented commissions, fees and expenses and (iv) in the case of an AOG Transaction, the cash proceeds to which the purchaser and Athene Holding agree. Each of the Purchase Transaction, Private Placement, Registered Sale and AOG Transaction are subject to the terms and conditions set forth in the Liquidity Agreement.
In the event that an AOG Transaction is consummated, the buyer of such AOG Units will be prohibited from exchanging such AOG Units into AGM Inc. Class A Common Stock for at least 30 days after such purchase. Athene Holding is prohibited from consummating an AOG Transaction with any purchaser (i) who would, after giving effect to such transfer, own more than 3.5% of the issued and outstanding AGM Inc. Class A Common Stock (on a fully-diluted basis) or (ii) who is a “bad actor” (as defined in Regulation D of the Act) or otherwise a prohibited transferee, as described in the Liquidity Agreement.
Athene Holding’s liquidity rights are subject to certain other limitations and obligations, including that in a Registered Sale or a Private Placement, AGM Inc. will not be required to sell any AGM Inc. Class A Common Stock at a price that is less than 90% of the volume-weighted average price of the AGM Inc. Class A Common Stock for the 10 consecutive business days prior to the day Athene Holding submits a notice for sale of AOG Units.
The Liquidity Agreement also provides that Athene Holding is prohibited from transferring its AOG Units other than to an affiliate or pursuant to the options set forth above. AGM Inc. has the right not to consummate a Registered Sale or a Private Placement if the recipient of the Class A Common Stock would receive more than 2.0% of the outstanding and issued shares of AGM Inc. Class A Common Stock. Additionally, AGM Inc. has the right not to consummate an AOG Transaction if the recipient would, following such AOG Transaction, be the beneficial owner of greater than 3.5% of the AOG Units.
Merger Agreement
On March 8, 2021, AGM Inc.the Company entered into the Merger Agreement with AHL, HoldCo, AHL Merger Sub, and AGMAAM Merger Sub.
The Merger Agreement provides that, uponAs of December 31, 2021, the termsCompany held a 28.4% ownership interest in AHL’s Class A common shares.
On January 1, 2022, Apollo and subject toAthene completed the conditions set forth therein, AGM Inc. and AHL will effect an all-stock merger transaction to combine their respective businesses through: (a) the AHL Merger, with AHL as the surviving entity in the AHL Merger and a direct wholly owned subsidiary of HoldCo and (b) the AGM Merger with AGM as the surviving entity in the AGM Merger and a direct wholly owned subsidiary of HoldCo. The Mergers are intended to become effective concurrently and, upon the consummation of the Mergers, AGM Inc. and AHL will be direct wholly owned subsidiaries of HoldCo.previously announced Mergers. Following the Mergers and the closing of the transactions contemplated byMergers, all of the Merger Agreement, HoldCo will be renamed “Apollo Global Management, Inc.” The transaction is expected to close in Januarycommon stock of 2022. The transaction requires the approval of stockholders of both ApolloAAM and AHL are owned by AGM and is subject to, among other things, antitrustboth AAM and regulatory approvals, and other customary closing conditions.
Upon the terms and subjectAHL became consolidated subsidiaries of AGM. Subsequent to the conditionsclosing of the Merger Agreement, which has been approved byMergers, the boards of directors of both companies, as well as the conflicts committee of AGM’s board and a special committee of certain disinterested members of the board of directors of AHL, at the effective time of the AHL Merger, each issued and outstanding share of AHLCompany distributed its interest in AHL’s Class A common stock, par value $0.001 per share (“AHL shares”) (other than AHL shares heldto AGM.
Subsequent to the closing of the Mergers, the Company transferred the 2039 Senior Secured Guaranteed Notes to a VIE consolidated by AHL as treasury shares (including HoldCo, AHL Merger Sub, AGM Merger SubAthene. Similarly, certain of Apollo’s general partner fund co-investments were transferred to Athene and the respective controlled funds of AGM Inc. or any direct or indirect wholly owned subsidiary of AGM Inc.)), willare expected to be converted automatically into the righttransferred to receive 1.149 duly authorized, validly issued, fully paid and nonassessable shares of Class A common stock, par value $0.00001 per share, of HoldCo (such shares, “HoldCo Shares”) and any cash paid in lieu of fractional HoldCo Shares. The exchange ratio is fixed anda fund managed by Apollo including third-party capital.
APOLLO GLOBALASSET MANAGEMENT, INC.
NOTES TO CONDENSED CONSOLIDATED
FINANCIAL STATEMENTS (UNAUDITED)
(dollars in thousands, except share data, except where noted)
will not be adjusted for changes in the market value of the AGM Class A Shares or the AHL Shares. No fractional HoldCo Shares will be issued in connection with the AHL Merger, and AHL’s shareholders will receive cash in lieu of any fractional HoldCo Shares.
Subject to the terms and conditions of the Merger Agreement, at the effective time of the AGM Merger, each issued and outstanding share of AGM Inc. Class A shares (other than Class A shares (a) held by AGM Inc. as treasury shares or (b) by AGM Merger Sub or any direct or indirect wholly owned subsidiary of AGM Inc.) will be converted automatically into one (1) HoldCo Share.
At the effective time of the AGM Merger, each of the issued and outstanding series of preferred shares of AGM Inc. will remain issued and outstanding as preferred shares of the AGM Surviving Entity, and at the effective time of the AHL Merger, each of the issued and outstanding preferred shares of AHL will remain issued and outstanding as preferred shares of the AHL Surviving Entity, in each case as described further in the Merger Agreement.
At the effective time of the AHL Merger, each of the issued and outstanding warrants of AHL that is outstanding immediately prior to the effective time of the AHL Merger will, automatically and without any action on the part of the holder of an AHL warrant, remain outstanding in accordance with its terms, or, alternatively, be exchanged for such consideration from HoldCo in connection with the transactions contemplated by the Merger Agreement as may be agreed in writing by AGM Inc. and AHL prior to the effective time of the AHL Merger.
At the effective time of the AHL Merger, each outstanding option to purchase AHL Shares, award of restricted AHL Shares and award of AHL restricted share units will be converted into a similar award (with the same terms and conditions) with respect to HoldCo Shares based on the exchange ratio, in each case, as described further in the Merger Agreement; except that outstanding awards of restricted AHL Shares and AHL restricted share units, in each case, that are subject to performance-based vesting conditions, will convert into time-based awards with respect to HoldCo Shares based on the applicable target-level of performance and will vest at the end of the applicable performance period.
At the effective time of the AGM Merger, each outstanding option to purchase AGM Inc. Class A shares, award of restricted AGM Inc. Class A shares and award of AGM Inc. restricted share units will be converted into a similar award (with the same terms and conditions, including any performance conditions) with respect to HoldCo Shares, in each case, as described further in the Merger Agreement.
The Merger Agreement contains certain termination rights and provides that, upon termination of the Merger Agreement, AGM Inc. will be obligated to pay AHL a cash termination fee of $81.9 million if: (i) the board of directors of AGM Inc. withdraws, suspends, withholds or in any manner adverse to AHL amends its recommendation of approval of the AGM Merger and the Merger Agreement by AGM stockholders, and (ii) AGM Inc. stockholder approval of the AGM Merger and the Merger Agreement is not obtained at the AGM Inc. stockholder meeting at which the AGM Merger and the Merger Agreement is submitted for approval.
Athora
The Company, through ISGI, provides investment advisory services to certain portfolio companies of fund managed by Apollo funds and Athora, a strategic platform that acquires or reinsures blocks of insurance business in the German and broader European life insurance market (collectively, the “Athora Accounts”). The Company had equity commitments outstanding of up to make additional equity investments in Athora of $296.4$453.7 million as of June 30, 2021,March 31, 2022, subject to certain conditions.
Athora Sub-Advised
The Company, through ISGI, provides sub-advisory services with respect to a portion of the assets in certain portfolio companies of Apollo funds and the Athora Accounts. The Company broadly refers to “Athora Sub-Advised” assets as those assets in the Athora Accounts which the Company explicitly sub-advises as well as those assets in the Athora Accounts which are invested directly in funds and investment vehicles Apollo manages.
The Company earns a base management fee on the aggregate market value of substantially all of the investment accounts of or relating to Athora and also a sub-advisory fee on the Athora Sub-Advised assets, which varies depending on the specific asset class.
APOLLO GLOBAL MANAGEMENT, INC.
NOTES TO CONDENSED CONSOLIDATED
FINANCIAL STATEMENTS (UNAUDITED)
(dollars in thousands, except share data, except where noted)
Athora and removed Athora’s previous reimbursement of certain costs incurred by Apollo. These changes had retroactive effect to January 1, 2021.The following table presents the revenues earned in aggregate from Athene and Athora:
| | | | | | | | | | | | | | | | | | | | | | | |
| For the Three Months Ended June 30, | | For the Six Months Ended June 30, |
| 2021 | | 2020 | | 2021 | | 2020 |
Revenues earned in aggregate from Athene and Athora, net(1)(2) | $ | 1,179,485 | | | $ | 463,823 | | | $ | 1,796,116 | | | $ | (661,670) | |
| | | | | | | | | | | | | |
| For the Three Months Ended March 31, |
| 2022 | | 2021 | | |
Revenues earned in aggregate from Athene and Athora, net(1)(2) | $ | 877,878 | | | $ | 616,631 | | | |
(1) Consisting of management fees, sub-advisory fees, performance revenues from Athene and Athora, as applicable (net of related profit sharing expense) and changes in the market value of the Athene Holding shares owned directly by Apollo. These amounts exclude the deferred revenue recognized as management fees associated with the vesting of AHL Awards granted to employees of Apollo.
(2) Gains (losses) on the market value of the shares of Athene Holding owned directly by Apollo were $912.0 million and $267.0was $354.4 million for the three months ended June 30, 2021 and 2020, respectively, and $1.3 billion and $(996.4) million for the six months ended June 30, 2021 and 2020, respectively.
AINV Amended and Restated Investment Advisory Management Agreement
On May 17, 2018, the board of directors of AINV approved an amended and restated investment advisory management agreement with Apollo Investment Management, L.P., the Company’s consolidated subsidiary, which reduced the base management fee and revised the incentive fee on income to include a total return requirement. Effective April 1, 2018, the base management fee was reduced from 2.0% to 1.5% of the average value of AINV’s gross assets (excluding cash or cash equivalents but including other assets purchased with borrowed amounts) at the end of each of the two most recently completed calendar quarters; provided, however, the base management fee would be 1.0% of the average value of AINV’s gross assets (excluding cash or cash equivalents but including other assets purchased with borrowed amounts) that exceeds the product of (i) 200% and (ii) the value of AINV’s net asset value at the end of the most recently completed calendar quarter. In addition, beginning January 1, 2019, the incentive fee on income calculation included a total return requirement with a rolling twelve quarter look-back starting from April 1, 2018. The incentive fee rate remained 20% and the performance threshold remained 1.75% per quarter (7% annualized).March 31, 2021.
Regulated Entities and Affiliated Service Providers
Apollo Global Securities, LLC (“AGS”)is a registered broker dealer with the SEC and is a member of the Financial Industry Regulatory Authority, subject to the minimum net capital requirements of the SEC. AGS was in compliance with these requirements at June 30, 2021.March 31, 2022. From time to time, this entity is involved in transactions withAGS, as well as other Apollo affiliates provide services to related parties of Apollo, including Apollo funds and their portfolio companies, whereby the Company or its affiliates earn fees for providing such services.
Griffin Capital Securities, LLC (“GCS”) is a registered broker dealer with the SEC and is a member of the funds Apollo manages, as well as third parties, whereby AGS earns underwriting and transaction fees for its services.Financial Industry Regulatory Authority, subject to the minimum net capital requirements of the SEC. GCS was in compliance with these requirements at March 31, 2022.
Investment in SPACs
On October 6, 2020, APSG I, a SPAC, completed an initial public offering, ultimately raising total gross proceeds of $817$816.8 million, including the underwriters’ subsequent partial exercise of their over-allotment option. In a private placement concurrent with the initial public offering, APSG I sold warrants to APSG Sponsor, L.P., a subsidiary of Apollo, for total gross proceeds of $18.3 million. APSG Sponsor, L.P. also holds Class B ordinary shares of APSG.APSG I. Apollo currently consolidates APSG I as a voting interest entity,VIE, and thus all private placement warrants and Class B ordinary shares are eliminated in consolidation.
On February 12, 2021, APSG II, a SPAC, completed an initial public offering, raising total gross proceeds of $690$690.0 million, including the underwriters’ exercise in full of their over-allotment option. In a private placement concurrent with the initial public offering, APSG II sold warrants to APSG Sponsor II, L.P., a subsidiary of Apollo, for total gross proceeds of $15.6 million. APSG Sponsor II, L.P. also holds Class B ordinary shares of APSG II. Apollo currently consolidates APSG II as a voting interest entity,VIE, and thus all private placement warrants and Class B ordinary shares are eliminated in consolidation.
15. COMMITMENTS AND CONTINGENCIES
Investment Commitments—AsOn July 13, 2021, Acropolis, a limited partner, general partner and managerSPAC, completed an initial public offering, ultimately raising total gross proceeds of $345.0 million, including the Apollo funds, Apollo had unfunded capital commitments asunderwriters’ subsequent exercise in full of June 30, 2021 and December 31, 2020 of $1.0 billion and $1.0 billion, respectively, of which $253.7 million and $348.0 million, respectively, related to Fund IX.their over-allotment option. In a private placement
APOLLO GLOBALASSET MANAGEMENT, INC.
NOTES TO CONDENSED CONSOLIDATED
FINANCIAL STATEMENTS (UNAUDITED)
(dollars in thousands, except share data, except where noted)
Debt Covenants—Apollo’s debt obligations contain various customary loan covenants. concurrent with the initial public offering, Acropolis sold warrants to Acropolis Infrastructure Acquisition Sponsor, L.P., a subsidiary of Apollo, for total gross proceeds of $8.8 million. Acropolis Infrastructure Acquisition Sponsor, L.P. also holds Class B common stock of Acropolis. Apollo currently consolidates Acropolis as a VIE, and thus all private placement warrants and Class B common stock are eliminated in consolidation.
As of June 30, 2021,described in note 2, the Company was not awareconsolidates entities that are VIEs for which the Company has been designated as the primary beneficiary. Through its interests in the respective sponsors, the Company has the power to direct the activities that most significantly impact the economic performance of any instancesthese SPACs. In addition, the Company’s combined interests in these VIEs are significant. Assets and liabilities of non-compliance withthe consolidated SPACs are shown within the respective line items of the condensed consolidated financial statements, as outlined below.
The tables below present the financial covenants containedinformation of these SPACs in aggregate:
| | | | | | | | | | | | | | | |
| | | |
| As of
March 31, 2022 | | As of
December 31, 2021 | | | | |
| Assets: | | | | | | | |
| Cash and cash equivalents | $ | 938 | | | $ | 1,796 | | | | | |
| Restricted cash and cash equivalents | 1,035,506 | | | 690,205 | | | | | |
| U.S. Treasury securities, at fair value | 817,678 | | | 1,162,299 | | | | | |
| | | | | | | |
| | | | | | | |
| Other assets | 2,056 | | | 2,627 | | | | | |
| Total Assets | $ | 1,856,178 | | | $ | 1,856,927 | | | | | |
| Liabilities, Redeemable non-controlling interests and Stockholders’ Equity | | | | | | | |
| Liabilities: | | | | | | | |
| Accounts payable and accrued expenses | $ | 8,438 | | | $ | 2,361 | | | | | |
| Due to related parties | 19,415 | | | 20,146 | | | | | |
| Other liabilities | 138,970 | | | 143,778 | | | | | |
| Total Liabilities | 166,823 | | | 166,285 | | | | | |
| Redeemable non-controlling interests: | | | | | | | |
| Redeemable non-controlling interests | 1,782,262 | | | 1,762,282 | | | | | |
| Stockholders’ Equity: | | | | | | | |
| Additional paid in capital | (118,349) | | | (98,369) | | | | | |
| Retained earnings | 25,442 | | | 26,729 | | | | | |
| | | | | | | |
| Total Stockholders’ Equity | (92,907) | | | (71,640) | | | | | |
| Total Liabilities, Redeemable non-controlling interests and Stockholders’ Equity | $ | 1,856,178 | | | $ | 1,856,927 | | | | | |
| | | | | | | | | | | | | | | |
| | | |
| For the Three Months Ended March 31, | | |
| | 2022 | | 2021 | | | | |
| | | | | | | |
| | | | | | | |
| | | | | | | |
| Expenses: | | | | | | | |
| Interest expense | $ | 4 | | | $ | 1 | | | | | |
| General, administrative and other | 6,622 | | | 6,334 | | | | | |
| Total Expenses | 6,626 | | | 6,335 | | | | | |
| Other Income (Loss): | | | | | | | |
| Net gains (losses) from investment activities | 4,823 | | | (1,607) | | | | | |
| Interest income | 662 | | | 172 | | | | | |
| Other income (loss), net | (146) | | | (123) | | | | | |
| Total Other Income (Loss) | 5,339 | | | (1,558) | | | | | |
| | | | | | | |
| | | | | | | |
| Net Income Attributable to Apollo Asset Management, Inc. | (1,287) | | | (7,893) | | | | | |
15. COMMITMENTS AND CONTINGENCIES
Investment Commitments
As a limited partner, general partner and manager of the documents governing the Company’s debt obligations.Apollo funds, Apollo had unfunded capital commitments as of March 31, 2022 and December 31, 2021 of $0.7 billion and $1.0 billion, respectively.
APOLLO ASSET MANAGEMENT, INC.
NOTES TO CONDENSED CONSOLIDATED
FINANCIAL STATEMENTS (UNAUDITED)
(dollars in thousands, except share data, except where noted)
Litigation and Contingencies—
Apollo is, from time to time, party to various legal actions arising in the ordinary course of business including claims and lawsuits, reviews, investigations or proceedings by governmental and self-regulatory agencies regarding its business.
On August 3, 2017, a complaint was filed in the United States District Court for the Middle District of Florida against AGM Inc.,AAM, a senior partner of Apollo and a former principal of Apollo by Michael McEvoy on behalf of a purported class of employees of subsidiaries of CEVA Group, LLC (“CEVA Group”) who purchased shares in CEVA Investment Limited (“CIL”), the former parent company of CEVA Group. The complaint alleged that the defendants breached fiduciary duties to and defrauded the plaintiffs by inducing them to purchase shares in CIL and subsequently participating in a debt restructuring of CEVA Group in which shareholders of CIL did not receive a recovery. On February 9, 2018, the Bankruptcy Court for the Southern District of New York held that the claims asserted in the complaint were assets of CIL, which is a chapter 7 debtor, and that the complaint was null and void as a violation of the automatic stay. McEvoy subsequently revised his complaint to attempt to assert claims that do not belong to CIL. The amended complaint no longer named any individual defendants, but Apollo Management VI, L.P. and CEVA Group were added as defendants. The amended complaint sought damages of approximately €30 million and asserts, among other things, claims for violations of the Investment Advisers Act of 1940, breach of fiduciary duties, and breach of contract. On December 7, 2018, after receiving permission from the Bankruptcy Court, McEvoy filed his amended complaint in the District Court infor the Middle District of Florida. On January 18, 2019, Apollo filed a motion to dismiss the amended complaint. A hearing on that motion was held December 3, 2019. On January 6, 2020, the Florida court granted in part Apollo’s motion to dismiss, dismissing McEvoy’s Investment Advisers Act claim with prejudice, and denying without prejudice Apollo’s motion with respect to the remaining claims, and directing the parties to conduct limited discovery, and submit new briefing, solely with respect to the statute of limitations. On July 30, 2020, Apollo and CEVA filed a joint motion for summary judgment on statute of limitations grounds. On June 29, 2021, the District Courtdistrict court issued a decision denying the defendants’ joint motion for summary judgment on statute of limitations grounds, and set deadlines on July 23, 2021 for the plaintiff to file an amended complaint and August 20, 2021 for defendants to answer or move to dismiss the amended complaint. Plaintiff filed his second amended complaint on July 23, 2021 which added alleged grounds for tolling the statute of limitations. Also on July 23, 2021, the defendants filed a joint motion for reconsideration with respect to aspects of the District Court’sdistrict court’s June 29, 2021 decision. On March 10, 2022, the court granted defendants’ motion for reconsideration and granted Apollo’s motion for summary judgment. On April 7, 2022, Plaintiff filed a motion to alter or amend the court’s order of March 10. The defendants, including Apollo, opposed that motion on April 28, 2022. Apollo believes that Plaintiff’s motion to alter or amend the claims in this action arecourt’s order of March 10 is without merit. Because this action is in the early stages, noNo reasonable estimate of possible loss, if any, can be made at this time.
On December 21, 2017, Harbinger Capital Partners II, LP, Harbinger Capital Partners Master Fund I, Ltd., Harbinger Capital Partners Special Situations Fund, L.P., Harbinger Capital Partners Special Situations GP, LLC, Harbinger Capital Partners Offshore Manager, L.L.C., Global Opportunities Breakaway Ltd. (in voluntary liquidation), and Credit Distressed Blue Line Master Fund, Ltd. (collectively,several entities referred to collectively as “Harbinger”) commenced an action in New York Supreme Court captioned Harbinger Capital Partners II LP et al. v. Apollo Global Management LLC, et al. (No. 657515/2017). The complaint named as defendants (i) AGM Inc., (ii) theAAM, and funds managed by Apollo that invested in SkyTerra Communications, Inc. (“SkyTerra”) equity before selling their interests to Harbinger under an April 2008 agreement that closed in 2010, and (iii) 6 former SkyTerra directors, 5 of whom are current or former Apollo employees., among others. The complaint alleged that during the period of Harbinger’s various equity and debt investments in SkyTerra from 2004 to 2010, the defendants concealed from Harbinger material defects in SkyTerra technology that was to be used to create a new mobile wi-fi network.technology. The complaint further alleged that Harbinger would not have made investments in SkyTerra totaling approximately $1.9 billion had it known of the defects, and that the public disclosure of these defects ultimately led to SkyTerra filing for bankruptcy in 2012 (after it had been renamed LightSquared). The complaint asserted claims against (i) all defendants for fraud, civil conspiracy, and negligent misrepresentation, (ii) AGM Inc. and the Apollo-managed funds only for breach of fiduciary duty, breach of contract, and unjust enrichment, and (iii) the SkyTerra director defendants only for aiding and abetting breach of fiduciary duty. The complaint sought $1.9 billion in damages, as well as punitive damages, interest, costs, and fees. This action was stayed from February 14, 2018, through June 12, 2019. On February 14, 2018, the defendants moved the United States Bankruptcy Court for the Southern District of New York to reopen the LightSquared bankruptcy proceeding for the limited purpose of enforcing Harbinger’s assignment and release in that bankruptcy of the claims that it asserted in the New York state court action (the “Bankruptcy Motion”). Briefing and hearing on the Bankruptcy Motion were adjourned while the state court stay was pending. On June 12, 2019, Harbinger voluntarily discontinued the state action without prejudice subject to a tolling agreement, and Apollo voluntarily withdrew the Bankruptcy Motion subject to a right to refile the motion if Harbinger were to refile the state court action.prejudice. On June 8, 2020, Harbinger refiled its litigation in New York Supreme Court, captioned Harbinger Capital Partners II, LP et al. v. Apollo Global Management, LLC et al. (No. 652342/2020). The complaint adds 8 new defendants:
APOLLO GLOBAL MANAGEMENT, INC.
NOTES TO CONDENSED CONSOLIDATED
FINANCIAL STATEMENTS (UNAUDITED)
(dollars in thousands, except share data, except where noted)
2 former SkyTerra executives, 1 former SkyTerra consultant,defendants and 5 entities (four of whom have since been dismissed) that were Harbinger’s counterparties in a transaction involving TVCC One Six Holdings LLC (“TVCC”). It also adds 3 new claims relating to Harbinger’s contention that the new defendants induced Harbinger to buy TVCCCCTV One Four Holdings, LLC (“CCTV”) to support SkyTerra’s network even though they allegedly knew that the network had material defects. The parties agreed to stay this action until November 15, 2020. On November 23, 2020, Defendants refiled the Bankruptcy Motion,a bankruptcy motion, and on November 24, 2020, filed in the state court a motion to stay the state court proceedings pending a ruling by the Bankruptcy Courtbankruptcy court on the Bankruptcy Motion.bankruptcy motion. On February 1, 2021, the Bankruptcy Courtbankruptcy court denied the Bankruptcy Motion.bankruptcy motion. On March 31, 2021, Defendants filed their motions to dismiss the New York Supreme Court action. Harbinger opposed thoseHearings were held on the motions to dismiss on JuneFebruary 15, 2021. Defendants’ replies were due on July 29, 2021.2022 and February 18, 2022, and the motions remain pending. Apollo believes the claims in this action are without merit. Because this action is in the early stages, no reasonable estimate of possible loss, if any, can be made at this time.
NaN shareholders filed substantially similar putative class action lawsuits in the Circuit Court of the Fifteenth Judicial Circuit in and for Palm Beach County, Florida in March, April, and May 2018, alleging violations of the Securities Act in connection with the January 19, 2018 IPO of ADT Inc. common stock. The actions were consolidated on July 10, 2018, and the case was re-captioned, In re ADT Inc. Shareholder Litigation. On August 24, 2018, the state-court plaintiffs filed a consolidated complaint naming as defendants ADT Inc., several ADT officers and directors, the IPO underwriters (including Apollo Global Securities, LLC), AGM Inc. and certain other Apollo affiliates. Plaintiffs generally alleged that the registration statement and prospectus for the IPO contained false and misleading statements and failed to disclose material information about certain litigation in which ADT was involved, ADT’s efforts to protect its intellectual property, and competitive pressures ADT faced. Defendants filed motions to dismiss the consolidated complaint on October 23, 2018, and those motions were fully briefed. On May 21, 2018, a similar shareholder class action lawsuit was filed in the United States District Court for the Southern District of Florida, naming as defendants ADT, several officers and directors, and AGM Inc. The federal action, captioned Perdomo v. ADT Inc., generally alleged that the registration statement was materially misleading because it failed to disclose ongoing deterioration in ADT’s financial results, along with certain customer and business metrics. On July 20, 2018, several alleged ADT shareholders filed competing motions to be named lead plaintiff in the federal action. On November 20, 2018, the court appointed a lead plaintiff, and on January 15, 2019, the lead plaintiff filed an amended complaint. The amended complaint named the same Apollo-affiliated defendants as the state-court action, along with 3 new Apollo entities. Defendants filed motions to dismiss on March 25, 2019. On July 26, 2019, the state court denied defendants’ motions to dismiss, except it reserved judgment on the question whether it has personal jurisdiction over certain defendants, including the Apollo defendants. On September 12, 2019, all parties to the state and federal actions reached a settlement in principle that would resolve both actions. The plaintiffs in the federal action voluntarily dismissed their action on October 28, 2019, and the settlement was submitted to the state court for approval. On January 8, 2021, the state court entered a final order and judgment approving the settlement and dismissing the state action with prejudice. The settlement requires no payment from any Apollo defendants.
On May 3, 2018, Caldera Holdings Ltd, Caldera Life Reinsurance Company, and Caldera Shareholder, L.P. (collectively, “Caldera”) filed a summons with notice in the Supreme Court of the State of New York, New York County, naming as defendants AGM Inc., Apollo Management, L.P., Apollo Advisors VIII, L.P., Apollo Capital Management VIII, LLC, Athene Asset Management, L.P., Athene Holding, Ltd., and Leon Black (collectively, “Defendants” and all but Athene Holding, Ltd., the “Apollo Defendants”). On July 12, 2018, Caldera filed a complaint, Index No. 652175/2018 (the “Complaint”), alleging three causes of action: (1) tortious interference with prospective business relations/prospective economic advantage; (2) defamation/trade disparagement/injurious falsehood; and (3) unfair competition. The Complaint sought damages of no less than $1.5 billion, as well as exemplary and punitive damages, attorneys’ fees, interest, and an injunction. Defendants moved to dismiss the Complaint on September 21, 2018 and Caldera filed an amended complaint on January 21, 2019 (the “Amended Complaint”). Defendants moved to dismiss the Amended Complaint, and the Apollo Defendants submitted to the Court a Final Arbitration Award issued on April 26, 2019 in a JAMS arbitration, finding Caldera, Imran Siddiqui, and Ming Dang liable for various causes of action, including breaches of fiduciary duty and/or aiding and abetting thereof. Oral argument on the motions to dismiss was held on May 31, 2019. On December 20, 2019, the Court issued a Decision and Order dismissing Caldera’s complaint in its entirety as against all Defendants. On December 23, 2019, the Apollo Defendants filed a Notice of Entry of the Decision and Order. On January 8, 2020, Caldera filed a Notice of Appeal.
On March 7, 2019, plaintiff Elizabeth Morrison filed an amended complaint in an action captioned Morrison v. Ray Berry, et. al., Case No. 12808-VCG, pending in the Delaware Court of Chancery, adding as defendants AGM Inc. and certain AGM Inc. affiliates. The original complaint had only named as defendants certain officers and directors (the “TFM defendants”) of The Fresh Market, Inc. (“TFM”), claiming that those defendants breached their fiduciary duties to the TFM shareholders in connection with their consideration and approval of a merger agreement between TFM and certain entities affiliated with Apollo, including by engaging in a sale process that improperly favored AGM Inc., and/or Apollo Management
APOLLO GLOBAL MANAGEMENT, INC.
NOTES TO CONDENSED CONSOLIDATED
FINANCIAL STATEMENTS (UNAUDITED)
(dollars in thousands, except share data, except where noted)
VIII, L.P., by agreeing to an inadequate price and by filing materially deficient disclosures regarding the transaction. In addition to AGM Inc., the amended complaint added as defendants Apollo Overseas Partners (Delaware 892) VIII, L.P., Apollo Overseas Partners (Delaware) VIII, L.P., Apollo Overseas Partners VIII, L.P., Apollo Management VIII, L.P., AIF VIII Management, LLC, Apollo Management, L.P., Apollo Management GP, LLC, Apollo Management Holdings, L.P., Apollo Management Holdings GP, LLC, APO Corp., AP Professional Holdings, L.P., Apollo Advisors VIII, L.P., Apollo Investment Fund VIII, L.P., Pomegranate Holdings, Inc., and other defendants. The amended complaint alleged that the Apollo defendants aided and abetted the breaches of fiduciary duties by the TFM defendants. After the defendants moved to dismiss the complaint on May 1, 2019, Plaintiff filed a second amended complaint on June 3, 2019, maintaining the same claim against the same Apollo defendants as the prior complaint. Defendants moved to dismiss the second amended complaint on July 12, 2019. On December 31, 2019, the court issued a decision dismissing certain of the TFM defendants while denying the motions of others. The court deferred ruling on the motions filed by several defendants, including the Apollo-affiliated defendants. On June 1, 2020, the Court granted the Apollo-affiliated defendants’ motion to dismiss, but the case remained pending against the officer defendants and TFM’s financial advisor in the transaction. On July 7, 2021, the court approved a settlement among the Plaintiff and the remaining defendants. The settlement required no payment from any Apollo-affiliated defendants.
On October 21, 2019, a putative class action complaint was filed in the Delaware Court of Chancery against Presidio, Inc. (“Presidio”), all of the members of Presidio’s board of directors (including 5 directors who are affiliated with Apollo), and BC Partners Advisors L.P. and Port Merger Sub, Inc. (together, “BCP”) challenging the then-pending acquisition of Presidio by BCP (the “Presidio Merger”). The action is captioned Firefighters Pension System of City of Kansas City, Missouri Trust v. Presidio, Inc. et al, C.A. No. 2019-0839-JTL. The original complaint alleged that the Presidio directors breached their fiduciary duties in connection with the negotiation of the Presidio Merger and that the disclosures Presidio made in its filings with the SEC in connection with the Presidio Merger omitted material information, and that BCP aided and abetted those alleged breaches. On November 5, 2019, the Court of Chancery held a hearing on a motion by plaintiffs to preliminarily enjoin the stockholder vote and denied that motion. On January 28, 2020, following the closing of the Presidio Merger, plaintiffs filed an amended class action complaint, adding as defendants AGM Inc. and AP VIII Aegis Holdings, L.P. (together, the “Apollo Defendants”) and LionTree Advisors, LLC (Presidio’s financial advisor in connection with the Presidio Merger). The amended complaint alleges, among other things, that the Presidio directors breached their fiduciary duties in connection with the Presidio Merger, that the filings with the SEC in connection with the Presidio Merger omitted material information, that the Apollo Defendants were controlling stockholders of Presidio and breached their alleged fiduciary duties to Presidio’s public stockholders, and that BCP, LionTree and the Apollo Defendants aided and abetted breaches of fiduciary duties. The amended complaint seeks, among other relief, declaratory relief, class certification, and unspecified money damages. The defendants completed briefing on motions to dismiss the amended complaint on April 30, 2020. On January 29, 2021, the Court of Chancery issued an opinion and accompanying orders granting the Apollo Defendants’ motion to dismiss, granting the motions to dismiss filed by the directors other than Presidio’s CEO, and denying motions to dismiss as to BCP, Liontree, and Presidio’s CEO. Apollo believes the claims in this action are without merit.
On November 1, 2019, plaintiff Benjamin Fongers filed a putative class action in Illinois Circuit Court, Cook County, against CareerBuilder, LLC (“CareerBuilder”) and AGM Inc.AAM. Plaintiff alleges that in March 2019, CareerBuilder changed its compensation plan so that sales representatives such as Fongers would (i) receive reduced commissions; and (ii) only be able to receive commissions for accounts they originated that were not reassigned to anyone else, a departure from the earlier plan. Plaintiff also claims that the plan applied retroactively to deprive sales representatives of commissions to which they were earlier entitled. Plaintiff alleges that AGM Inc.AAM exercises complete control over CareerBuilder and thus, CareerBuilder acts as AGM Inc.’sAAM’s agent. Based on these allegations, Plaintiff alleges claims against both defendants for breach of written contract, breach of implied contract, unjust enrichment, violation of the Illinois Sales Representative Act, and violation of the Illinois Wage and Payment Collection Act. The defendants removed the action to the Northern District of Illinois on December 5, 2019, and Plaintiff moved to remand on January 6, 2020. On October 21, 2020, the District Courtdistrict court granted the motion to remand. On
APOLLO ASSET MANAGEMENT, INC.
NOTES TO CONDENSED CONSOLIDATED
FINANCIAL STATEMENTS (UNAUDITED)
(dollars in thousands, except share data, except where noted)
January 11, 2021, the District Courtdistrict court ordered the Clerkclerk of Courtcourt to take the necessary steps to transfer the case back to Illinois Circuit Court, Cook County. On March 8, 2021, Plaintiff filed a motion under 28 U.S.C. § 1447(c) to recover attorneys’ fees of approximately $35,000 for the remand briefing. Defendants filed their opposition on March 31, 2021, and Plaintiff replied on April 14, 2021. Defendants filed motions to dismiss the complaint in the Illinois Circuit Court, Cook County on June 11; plaintiff filed his opposition briefs11, which were fully briefed on July 23; defendants’ replies are due August 13; and a status conference is set for August 18,13, 2021. CareerBuilder has also filed a Motion for a Protective Order and to Stay Discovery pending the outcome of the motions to dismiss. ThatOn February 7, 2022, the court held a hearing on the motions to dismiss and the request to stay discovery. At the hearing, the court took the motions to dismiss under advisement and granted CareerBuilder’s motion will be fully briefed on July 26, 2021. Apollo believesto stay discovery. On March 11, 2022, the claimsparties filed a Notice of Settlement notifying the court that the parties have reached an agreement in this action are without merit. Because this action isprinciple to resolve the case in the early stages, no reasonable estimate of possible loss, if any, can be made at this time.full.
APOLLO GLOBAL MANAGEMENT, INC.
NOTES TO CONDENSED CONSOLIDATED
FINANCIAL STATEMENTS (UNAUDITED)
(dollars in thousands, except share data, except where noted)
In March 2020, Frank Funds, which claims to be a former shareholder of MPM Holdings, Inc. (“MPM”), commenced an action in the Delaware Court of Chancery, captioned Frank Funds v. Apollo Global Management, Inc., et al., C.A. No. 2020-0130, against AGM Inc.,AAM, certain former MPM directors (including 3 Apollo officers and employees), and members of the consortium that acquired MPM in a May 2019 merger. The complaint asserts, on behalf of a putative class of former MPM shareholders, a claim against Apollo for breach of its fiduciary duties as MPM’s alleged controlling shareholder in connection with the May 2019 merger in which a consortium acquired MPM.merger. Frank Funds seeks unspecified compensatory damages. Apollo believes the claims in this action are without merit. On July 1, 2020, Apollo moved to dismiss the complaint; briefing on that motion did not occur because the complaint was superseded, as described herein. On July 23, 2019, a group of former MPM shareholders filed an appraisal petition in Delaware Chancery Court seeking the fair value of their MPM shares that were purchased through MPM’s May 15, 2019 merger, with a consortium of buyers, in an action captioned In re Appraisal of MPM Holdings, Inc., C.A. No. 2019-0519 (Del. Ch.). While Apollo was not a party to the appraisal action, it was served a document subpoena on October 22, 2019, to which it responded. On June 3, 2020, petitioners moved for leave to file a verified amended appraisal petition and class-action complaint that included claims for breach of fiduciary duty and/or aiding and abetting breaches of fiduciary duty against AGM Inc.,AAM, the Apollo-affiliated fund that owned MPM’s shares before the merger, certain former MPM directors (including three Apollo employees), and members of the consortium that acquired MPM, based on alleged actions related to the May 2019 merger. The petitioners also sought to consolidate their appraisal proceeding with the Frank Funds action, and notified the Delaware Chancery Court via letter on September 23, 2020, that they had reached an agreement in principle with Frank Funds to consolidate the two cases.action. On November 13, 2020, the Chancery Court granted the parties’ stipulated order to consolidate the two matters, and on December 21, 2020, the Chancery Court granted petitioners’ motion for leave to file the proposed amended complaint. This new consolidated action is captioned In Re MPM Holdings Inc. Appraisal and Stockholder Litigation, C.A. No. 2019-0519 (Del Ch.). Defendants filed motionsOn January 13, 2022, the Chancery Court denied Apollo’s motion to dismiss the amended complaint on February 19, 2021, and the motions were fully briefed on July 26, 2021.dismiss. Apollo believes the claims in this action are without merit. Because this action is in the early stages, no reasonable estimate of possible loss, if any, can be made at this time.
On March 12, 2020, AGM Inc. and several investment funds managed by subsidiaries of AGM Inc. (the “Apollo Funds”) were added as defendants in a class action filed by plaintiff Zachary Blair on December 7, 2017, in the Superior Court of California. Plaintiff alleges he is a former employee of Classic Party Rentals, a party equipment rental company previously owned by the Apollo Funds. Plaintiff alleges that Classic Party Rentals failed to comply with California wage and hour and related laws, and also has asserted claims based on various provisions of the California labor code and California’s unfair competition laws. On October 11, 2019, the court certified a class of current and former non-exempt drivers, assistant drivers, and organizer employees of Classic Party Rentals who were paid on an hourly basis and who worked at Classic Party Rentals in California at any time from December 7, 2013, through the date of the class certification order. After being served with the Complaint in July 2020, a co-defendant removed the matter to the U.S. District Court for the Eastern District of California on August 24, 2020, and AGM Inc. and the Apollo Funds filed a motion to dismiss all claims against them on September 23, 2020. On March 24, 2021, the motion to dismiss was granted and the court dismissed the complaint without prejudice. On June 21, 2021, pursuant to a settlement reached by the parties, the court dismissed with prejudice the plaintiff’s individual claims and without prejudice the putative class claims against AGM Inc. and the Apollo Funds.
On May 29, 2020, plaintiff Vrajeshkumar Patel filed a putative stockholder derivative and class action complaint in the Delaware Court of Chancery against Talos Energy, Inc. (“Talos”), all of the members of Talos’s board of directors (including 2 Apollo partners), Riverstone Holdings, LLC (“Riverstone”), AGM Inc.,AAM, and Guggenheim Securities, LLC in connection with the acquisition of certain assets from Castex Energy 2014, LLC and ILX Holdings, LLC in February 2020. The complaint asserts on behalf of a putative class of shareholders and Talos, direct and derivative claims against Apollo, Riverstone, and the individual defendants for breach of their fiduciary duties. The plaintiff alleges that Apollo and Riverstone comprise a controlling shareholder group. The complaint seeks, among other relief, class certification and unspecified money damages. On August 4, 2020, the defendants filed motions to dismiss the complaint in its entirety. The motion is now fully briefed and oral argument was held on February 19, 2021.dismiss. On May 17, 2021, Vice Chancellor Zurn sent a letter to counsel orderingthe court ordered that the Riverstone funds and Apollo funds that hold the relevant Talos stock be joined as necessary parties. The parties filed a stipulation, which was entered by the court on June 7, 2021, adding Riverstone Talos Energy Equityco LLC, Riverstone Talos Energy Debtco LLC, Apollo Talos Holdings, L.P., and AP Talos Energy Debtco LLC as defendants in the action. These parties adoptedOn September 30, 2021, the arguments previously advanced bycourt dismissed the Riverstonecomplaint in its entirety against all defendants. Plaintiff has filed an appeal of this decision, and Apollo defendants, and did not engage in any separate briefing or argument.that appeal is pending. Apollo believes that the claims in this actionPlaintiff’s arguments on appeal are without merit. Because this action is in the early stages, noNo reasonable estimate of possible loss, if any, can be made at this time.
APOLLO GLOBAL MANAGEMENT, INC.
NOTES TO CONDENSED CONSOLIDATED
FINANCIAL STATEMENTS (UNAUDITED)
(dollars in thousands, except share data, except where noted)
On August 4, 2020, a putative class action complaint was filed in the United States District Court for the District of Nevada against PlayAGS Inc. (“PlayAGS”), all of the members of PlayAGS’s board of directors (including three directors who are affiliated with Apollo), certain underwriters of PlayAGS (including Apollo Global Securities, LLC), as well as AGM Inc.,AAM, Apollo Investment Fund VIII, L.P., Apollo Gaming Holdings, L.P., and Apollo Gaming Voteco, LLC (these last four parties, together, the “Apollo Defendants”). The complaint asserts claims against all defendants arising under the Securities Act of 1933 in connection with certain secondary offerings of PlayAGS stock conducted in August 2018 and March 2019, alleging that the registration statements issued in connection with those offerings did not fully disclose certain business challenges facing PlayAGS. Such claims are asserted against all defendants, including Apollo Global Securities, LLC and the Apollo Defendants, as well as all directors (including the directors affiliated with Apollo). The complaint further asserts a control person claim under Section 20(a) of the Securities Exchange Act of 1934 against the Apollo Defendants and the director defendants (including the directors affiliated with Apollo), alleging that the Apollo Defendants and the directorsuch defendants were responsible for certain misstatements and omissions by PlayAGS about its business during a putative class period from May 3, 2018 through August 7, 2019.. Plaintiffs filed a consolidated amended complaintcomplaints on January 21,11, 2021 and they filed a further amended complaintagain on March 25, 2021. On May 24, 2021, the Apollo Defendants filed a motion to dismiss on May 24, 2021. Plaintiffs filed an opposition to the complaint, which motion to dismiss on July 23, 2021. Apollo’s reply brief is due September 13, 2021.remains pending. Apollo believes the claims in this action are without merit. Because this action is in the early stages, no reasonable estimate of possible loss, if any, can be made at this time.
APOLLO ASSET MANAGEMENT, INC.
NOTES TO CONDENSED CONSOLIDATED
FINANCIAL STATEMENTS (UNAUDITED)
(dollars in thousands, except share data, except where noted)
On or around October 19, 2021, a purported stockholder of AAM filed a complaint against AAM in the Court of Chancery of the State of Delaware seeking the disclosure of certain additional documents pursuant to Section 220 of the Delaware General Corporation Law. The complaint alleges that the stockholder seeks to investigate (a) whether wrongdoing or mismanagement occurred in connection with the decision of the AAM board of directors to pay, in connection with the elimination of the AAM Up-C structure, the partners of AP Professional Holdings, L.P. (including the Former Managing Partners) a payment of cash equal to $3.66 per AOG Unit held, which the complaint characterizes as providing $640 million for “Tax Receivable Agreement” assets (which the stockholder alleges are worth nothing); (b) the independence and disinterestedness of AAM directors and/or officers; and (c) potential damages relating thereto.
Commitments and Contingencies—Contingencies
Other long-term obligations relate to payments with respect to certain consulting agreements entered into by Apollo Investment Consulting LLC, a subsidiary of Apollo, as well as long-term service contracts. A significant portion of these costs are reimbursable by funds or portfolio companies. As of June 30, 2021,March 31, 2022, fixed and determinable payments due in connection with these obligations were as follows:
| | | | | | | | | | | | | | | | | | | | | | | | | | | | | | | | | | | | | | | | | |
| Remaining 2021 | | 2022 | | 2023 | | 2024 | | 2025 | | Thereafter | | Total |
| Other long-term obligations | $ | 21,523 | | | $ | 7,555 | | | $ | 2,020 | | | $ | 820 | | | $ | 711 | | | $ | 711 | | | $ | 33,340 | |
| | | | | | | | | | | | | | | | | | | | | | | | | | | | | |
| Remaining 2022 | | 2023 - 2024 | | 2025 - 2026 | | 2027 and Thereafter | | Total |
| Other long-term obligations | $ | 40,756 | | | $ | 3,624 | | | $ | 1,328 | | | $ | 664 | | | $ | 46,372 | |
Contingent Obligations—Obligations
Performance allocations with respect to certain funds are subject to reversal in the event of future losses to the extent of the cumulative revenues recognized in income to date. If all of the existing investments became worthless, the amount of cumulative revenues that have been recognized by Apollo through June 30, 2021March 31, 2022 and that would be reversed approximates $4.1$4.8 billion. Management views the possibility of all of the investments becoming worthless as remote. Performance allocations are affected by changes in the fair values of the underlying investments in the funds that Apollo manages. Valuations, on an unrealized basis, can be significantly affected by a variety of external factors including, but not limited to, bond yields and industry trading multiples. Movements in these items can affect valuations quarter to quarter even if the underlying business fundamentals remain stable.
Additionally, at the end of the life of certain funds that the Company manages, there could be a payment due to a fund by the Company if the Company, as general partner, has received more performance allocations than was ultimately earned. The general partner obligation amount, if any, will depend on final realized values of investments at the end of the life of each fund or as otherwise set forth in the respective limited partnership agreement of the fund. See note 14 to our condensed consolidated financial statements for further details regarding the general partner obligation.
Certain funds may not generate performance allocations as a result of unrealized and realized losses that are recognized in the current and prior reporting period. In certain cases, performance allocations will not be generated until additional unrealized and realized gains occur. Any appreciation would first cover the deductions for invested capital, unreturned organizational expenses, operating expenses, management fees and priority returns based on the terms of the respective fund agreements.
NaN of the Company’s subsidiaries, AGS, provides underwriting commitments in connection with securities offerings of related parties of Apollo, including portfolio companies of the funds Apollo manages, as well as third parties. As of June 30, 2021March 31, 2022 and December 31, 2020,2021, there were no open underwriting commitments.
In connection with the launch of a non-traded business development company (“BDC”), the Company agreed to guarantee a commitment to purchase the underlying portfolio investment, in the event the BDC does not raise sufficient third party capital. The Company’s maximum commitment is $510 million, and is backstopped by an unconsolidated related party fund up to $500 million. The likelihood that performance under the guarantee arrangement will be required is determined to be remote.Contingent Consideration
APOLLO GLOBAL MANAGEMENT, INC.
NOTES TO CONDENSED CONSOLIDATED
FINANCIAL STATEMENTS (UNAUDITED)
(dollars in thousands, except share data, except where noted)
Merger Agreement Termination Fee—In connection with the merger with Athene Holding, the Merger Agreement contains certain termination rights and provides that, upon termination of the Merger Agreement, AGM Inc. will be obligated to pay AHL a cash termination fee of $81.9 million. See note 14 for further disclosure regarding the Merger Agreement and termination fee.
Contingent Consideration—In connection with the acquisition of Stone Tower in April 2012, the Company agreed to pay the former owners of Stone Tower a specified percentage of any future performance revenues earned from certain of the Stone Tower funds, CLOs, and strategic investment accounts. This contingent consideration liability was determined based on the present value of estimated future performance revenue payments, and is recorded in profit sharing payable in the condensed consolidated statements of financial condition. The fair value of the remaining contingent obligation was $129.0$110.5 million and $119.8$125.9 million as of June 30, 2021March 31, 2022 and December 31, 2020,2021, respectively.
The contingent consideration obligations will be remeasured to fair value at each reporting period until the obligations are satisfied and are characterized as Level III liabilities. The changes in the fair value of the contingent consideration obligations is reflected in profit sharing expense in the condensed consolidated statements of operations. See note 67 for further information regarding fair value measurements.
APOLLO ASSET MANAGEMENT, INC.
NOTES TO CONDENSED CONSOLIDATED
FINANCIAL STATEMENTS (UNAUDITED)
(dollars in thousands, except share data, except where noted)
16. SEGMENT REPORTING
Apollo conducts its business primarily in the United States through 32 reportable segments: credit, private equity(i) asset management and real assets.(ii) principal investing. Segment information is utilized by our chief operating decision makermakers to assess performance and to allocate resources. These segments were established based on the nature of investment activities in each underlying fund, including the specific type of investment made and the level of control over the investment.
The performance is measured by the Company’s chief operating decision makermakers on an unconsolidated basis because management makes operating decisions and assesses the performance of each of Apollo’s business segments based on financial and operating metrics and data that exclude the effects of consolidation of any of the affiliated funds.
Segment Distributable EarningsReporting Changes
In connection with the completion of the Mergers, Apollo undertook a strategic review of its operating structure and business segments to assess the performance of its businesses and the allocation of resources. As a result, for periods following the Mergers, Apollo reports results through 2 reportable segments called asset management and principal investing.
In connection with these changes, all prior periods have been recast to conform to the new presentation. Consequently, this information will be different from the historical segment financial results previously reported by Apollo in its reports filed with the SEC.
Adjusted Segment Distributable Earnings, or “Segment DE”,Income
Adjusted Segment Income is the key performance measure used by management in evaluating the performance of Apollo’s credit, private equitythe asset management and real assetsprincipal investing segments. Management believes the components ofuses Adjusted Segment DE, such as the amount of management fees, advisory and transaction fees and realized performance fees, are indicative of the Company’s performance. Management uses Segment DE in makingIncome to make key operating decisions such as the following:
•Decisionsdecisions related to the allocation of resources such as staffing decisions including hiring and locations for deployment of the new hires;
•Decisionsdecisions related to capital deployment such as providing capital to facilitate growth for the business and/or to facilitate expansion into new businesses;
•Decisionsdecisions related to expenses, such as determining annual discretionary bonuses and equity-based compensation awards to its employees. With respect to compensation, management seeks to align the interests of certain professionals and selected other individuals with those of the investors in the funds and those of Apollo’s stockholders by providing such individuals a profit sharing interest in the performance fees earned in relation to the funds. To achieve that objective, a certain amount of compensation is based on Apollo’s performance and growth for the year; andyear.
•Decisions related to the amount of earnings available for dividends to Class A Common Stockholders, holders of RSUs that participate in dividends and holders of AOG Units that participate in dividends.
Adjusted Segment DEIncome is a measure of profitability and has certain limitations in that it does not take into account certain items included under U.S. GAAP. Adjusted Segment DEIncome represents the amount of Apollo’s net realized earnings, excluding the effects of the consolidation of any of the related funds and SPACs, interest and preferred dividends paid to Preferred shareholders, taxes and related payables, transaction-related charges and any acquisitions. Transaction-related charges includes equity-based compensation charges, the amortization of intangible assets, contingent consideration, and certain other charges associated with acquisitions, and restructuring charges. In addition, Adjusted Segment
APOLLO GLOBAL MANAGEMENT, INC.
NOTES TO CONDENSED CONSOLIDATED
FINANCIAL STATEMENTS (UNAUDITED)
(dollars in thousands, except share data, except where noted)
DE Income excludes non-cash revenue and expense related to equity awards granted by unconsolidated related parties to employees of the Company, compensation and administrative related expense reimbursements, as well as the assets, liabilities and operating results of the funds and variable interest entities that are included in the condensed consolidated financial statements. Adjusted Segment DEIncome also excludes impacts of the remeasurement of the tax receivable agreement liability recorded in other income, which arises from changes in the associated deferred tax balance.
Adjusted Segment DEIncome may not be comparable to similarly titled measures used by other companies and is not a measure of performance calculated in accordance with U.S. GAAP. We use Adjusted Segment DEIncome as a measure of operating performance, not as a measure of liquidity. Adjusted Segment DEIncome should not be considered in isolation or as a substitute for net income or other income data prepared in accordance with U.S. GAAP. The use of Adjusted Segment DEIncome without consideration of related U.S. GAAP measures is not adequate due to the adjustments described above. Management compensates for these limitations by using Adjusted Segment DEIncome as a supplemental measure to U.S. GAAP results, to provide a more complete understanding of our performance as management measures it. A reconciliation of Adjusted Segment DEIncome to its most directly comparable U.S. GAAP measure of income (loss) before income tax provision can be found in this footnote.
APOLLO ASSET MANAGEMENT, INC.
NOTES TO CONDENSED CONSOLIDATED
FINANCIAL STATEMENTS (UNAUDITED)
(dollars in thousands, except share data, except where noted)
Fee Related Earnings
Fee Related Earnings (“FRE”) is derived from our segment reported results and refers to a component of Adjusted Segment DEIncome that is used as a supplemental performance measure to assess whether revenues that we believe are generally more stable and predictable in nature, primarily consistingthe performance of the asset management fees, are sufficient to cover associated operating expenses and generate profits.segment. FRE is the sum across all segments of (i) management fees, (ii) advisory and transaction fees, (iii) fee-related performance fees related to business development companies, Redding Ridge Holdings LP (“Redding Ridge Holdings”), an affiliatefrom indefinite term vehicles, that are measured and received on a recurring basis and not dependent on realization events of Redding Ridge, and MidCapthe underlying investments and (iv) other income, net, less (x) salary, bonus and benefits,(a) fee-related compensation, excluding equity-based compensation, (y) other associated operating(b) non-compensation expenses incurred in the normal course of business, (c) placement fees and (z)(d) non-controlling interests in the management companies of certain funds the Company manages.
Principal Investing Income
Principal Investing Income (“PII”)is a component of Adjusted Segment Income that is used to assess the performance of the principal investing segment. For the principal investing segment, PII is the sum of (i) realized performance fees, excluding realizations received in the form of shares, (ii) realized investment income, less (x) realized principal investing compensation expense, excluding expense related to equity-based compensation, and (y) certain corporate compensation and non-compensation expenses.
The following tables present financial data for Apollo’sthe Company’s reportable segments.
| | | | | | | | | | | | | | | | | | | | | | | |
| | As of and for the Three Months Ended June 30, 2021 |
| | Credit
Segment | | Private Equity
Segment | | Real Assets
Segment | | Total Reportable
Segments |
| Management fees | $ | 273,307 | | | $ | 123,106 | | | $ | 65,823 | | | $ | 462,236 | |
| Advisory and transaction fees, net | 54,757 | | | 27,047 | | | 1,431 | | | 83,235 | |
Performance fees(1) | 8,075 | | | 0 | | | 0 | | | 8,075 | |
| Fee Related Revenues | 336,139 | | | 150,153 | | | 67,254 | | | 553,546 | |
| Salary, bonus and benefits | (75,299) | | | (58,856) | | | (30,003) | | | (164,158) | |
| General, administrative and other | (43,590) | | | (27,546) | | | (15,455) | | | (86,591) | |
| Placement fees | (589) | | | 0 | | | 0 | | | (589) | |
| Fee Related Expenses | (119,478) | | | (86,402) | | | (45,458) | | | (251,338) | |
| Other income (loss), net of Non-Controlling Interest | (990) | | | 696 | | | (304) | | | (598) | |
| Fee Related Earnings | 215,671 | | | 64,447 | | | 21,492 | | | 301,610 | |
| Realized performance fees | 103,789 | | | 361,793 | | | 3,174 | | | 468,756 | |
| Realized profit sharing expense | (71,970) | | | (173,191) | | | (1,392) | | | (246,553) | |
| Net Realized Performance Fees | 31,819 | | | 188,602 | | | 1,782 | | | 222,203 | |
Realized principal investment income, net(2) | 2,588 | | | 67,102 | | | 451 | | | 70,141 | |
| Net interest loss and other | (11,869) | | | (13,738) | | | (11,453) | | | (37,060) | |
Segment Distributable Earnings(3) | $ | 238,209 | | | $ | 306,413 | | | $ | 12,272 | | | $ | 556,894 | |
Total Assets(3) | $ | 6,100,580 | | | $ | 4,868,181 | | | $ | 785,017 | | | $ | 11,753,778 | |
| | | | | | | | | | | | | | | |
| | As of and for the Three Months Ended |
| | 2022 | | 2021 | |
| Asset Management | | | | | |
| Management Fees | | $ | 505,401 | | | $ | 453,884 | | |
| Advisory and transaction fees, net | | 64,113 | | | 55,495 | | |
| Fee-related performance fees | | 14,226 | | | 8,771 | | |
| Fee related compensation | | (175,372) | | | (154,395) | | |
| Other operating expenses | | (98,384) | | | (62,064) | | |
| Fee Related Earnings (FRE) | | 309,984 | | | 301,691 | | |
| | | | | |
| Principal Investing | | | | | |
| Realized performance fees | | 127,189 | | | 106,754 | | |
| Realized investment income | | 439,408 | | | 30,015 | | |
| Principal investing compensation | | (155,988) | | | (68,225) | | |
| Other operating expenses | | (5,964) | | | (7,374) | | |
| Principal Investing Income (PII) | | 404,645 | | | 61,170 | | |
| | | | | |
| Adjusted Segment Income | | 714,629 | | | 362,861 | | |
| | | | | |
| Segment Assets: | | | | | |
| Asset Management | | $ | 1,494,453 | | | | |
| Principal Investing | | 8,655,165 | | | | |
Total Assets(1) | | $ | 10,149,618 | | | | |
| | | | | |
| (1) Refer below for a reconciliation of total assets for Apollo’s total reportable segments to total consolidated assets. | |
(1)Represents certain performance fees related to business development companies, Redding Ridge Holdings and MidCap.
(2)
Realized principal investment income, net includes dividends from our permanent capital vehicles, net of such amounts used to compensate employees.
APOLLO GLOBAL MANAGEMENT, INC.
NOTES TO CONDENSED CONSOLIDATED
FINANCIAL STATEMENTS (UNAUDITED)
(dollars in thousands, except share data, except where noted)
(3)Refer below for a reconciliation of total revenues, total expenses, other loss and total assets for Apollo’s total reportable segments to total consolidated revenues, total consolidated expenses, total consolidated other income (loss) and total assets.
| | | | | | | | | | | | | | | | | | | | | | | |
| | For the Three Months Ended June 30, 2020 |
| | Credit
Segment | | Private Equity
Segment | | Real Assets
Segment | | Total Reportable
Segments |
| Management fees | $ | 224,721 | | | $ | 127,592 | | | $ | 49,509 | | | $ | 401,822 | |
| Advisory and transaction fees, net | 13,756 | | | 44,802 | | | 3,191 | | | 61,749 | |
Performance fees(1) | 3,440 | | | 0 | | | 0 | | | 3,440 | |
| Fee Related Revenues | 241,917 | | | 172,394 | | | 52,700 | | | 467,011 | |
| Salary, bonus and benefits | (52,806) | | | (53,202) | | | (28,991) | | | (134,999) | |
| General, administrative and other | (37,251) | | | (21,770) | | | (12,782) | | | (71,803) | |
| Placement fees | (358) | | | 0 | | | 0 | | | (358) | |
| Fee Related Expenses | (90,415) | | | (74,972) | | | (41,773) | | | (207,160) | |
| Other income (loss), net of Non-Controlling Interest | (724) | | | 2 | | | 116 | | | (606) | |
| Fee Related Earnings | 150,778 | | | 97,424 | | | 11,043 | | | 259,245 | |
| Realized performance fees | 4,359 | | | 3,549 | | | 2,929 | | | 10,837 | |
| Realized profit sharing expense | (4,359) | | | (3,549) | | | (2,929) | | | (10,837) | |
| Net Realized Performance Fees | 0 | | | 0 | | | 0 | | | 0 | |
Realized principal investment income, net(2) | 1,810 | | | 3,404 | | | 5 | | | 5,219 | |
| Net interest loss and other | (11,857) | | | (11,686) | | | (5,507) | | | (29,050) | |
Segment Distributable Earnings (3) | $ | 140,731 | | | $ | 89,142 | | | $ | 5,541 | | | $ | 235,414 | |
| | | | | | | |
| | | | | | | |
(1)Represents certain performance fees related to business development companies and Redding Ridge Holdings and Midcap.
(2)Realized principal investment income, net includes dividends from our permanent capital vehicles, net of such amounts used to compensate employees.
(3)Refer below for a reconciliation of total revenues, total expenses and other income (loss) for Apollo’s total reportable segments to total consolidated revenues, total consolidated expenses and total consolidated other income (loss) and total assets.
The following table reconciles total consolidated revenues to total revenues for Apollo’s reportable segments:
| | | | | | | | | | | | | |
| | For the Three Months Ended June 30, |
| 2021 | | 2020 | | |
| Total Consolidated Revenues | $ | 1,382,325 | | | $ | 1,508,335 | | | |
Equity awards granted by unconsolidated related parties, reimbursable expenses and other(1) | (34,119) | | | (24,847) | | | |
Adjustments related to consolidated funds and VIEs(1) | 32,609 | | | 16,165 | | | |
Performance fees(2) | (748,508) | | | (918,493) | | | |
| Principal investment income | (78,761) | | | (114,149) | | | |
| Total Fee Related Revenues | 553,546 | | | 467,011 | | | |
| Realized performance fees | 468,756 | | | 10,837 | | | |
| Realized principal investment income, net and other | 70,141 | | | 4,376 | | | |
| Total Segment Revenues | $ | 1,092,443 | | | $ | 482,224 | | | |
(1)Represents advisory fees, management fees and performance fees earned from consolidated VIEs which are eliminated in consolidation. Includes non-cash revenues related to equity awards granted by unconsolidated related parties to employees of the Company and certain compensation and administrative related expense reimbursements.
(2)Excludes certain performance fees from business development companies, Redding Ridge Holdings and MidCap.
APOLLO GLOBAL MANAGEMENT, INC.
NOTES TO CONDENSED CONSOLIDATED
FINANCIAL STATEMENTS (UNAUDITED)
(dollars in thousands, except share data, except where noted)
The following table reconciles total consolidated expenses to total expenses for Apollo’s reportable segments:
| | | | | | | | | | | | | |
| | For the Three Months Ended June 30, |
| 2021 | | 2020 | | |
| Total Consolidated Expenses | $ | 746,787 | | | $ | 702,777 | | | |
Equity awards granted by unconsolidated related parties, reimbursable expenses and other(1) | (37,886) | | | (21,662) | | | |
| Reclassification of interest expenses | (34,814) | | | (32,291) | | | |
Transaction-related charges, net(1) | (31,572) | | | (32,110) | | | |
| | | | | |
| Equity-based compensation | (19,491) | | | (17,747) | | | |
Total profit sharing expense(2) | (371,686) | | | (389,987) | | | |
| Dividend-related compensation expense | 0 | | | (1,820) | | | |
| Total Fee Related Expenses | 251,338 | | | 207,160 | | | |
| Realized profit sharing expense | 246,553 | | | 10,837 | | | |
| Total Segment Expenses | $ | 497,891 | | | $ | 217,997 | | | |
(1)Represents the addition of expenses of consolidated funds and VIEs, transaction-related charges, non-cash expenses related to equity awards granted by unconsolidated related parties to employees of the Company and certain compensation and administrative expenses. Transaction-related charges include equity-based compensation charges, the amortization of intangible assets, contingent consideration and certain other charges associated with acquisitions, and restructuring charges.
(2)Includes unrealized profit sharing expense, realized profit sharing expense and equity-based profit sharing expense and other.
The following table reconciles total consolidated other income (loss) to total other loss for Apollo’s reportable segments:
| | | | | | | | | | | | | |
| | For the Three Months Ended June 30, |
| 2021 | | 2020 | | |
| Total Consolidated Other Income (Loss) | $ | 1,063,973 | | | $ | 333,850 | | | |
Adjustments related to consolidated funds and VIEs(1) | (147,661) | | | (56,197) | | | |
| | | | | |
| Net (gains) losses from investment activities | (913,751) | | | (270,112) | | | |
| Interest income and other, net of Non-Controlling Interest | (3,159) | | | (8,147) | | | |
| Other Income, net of Non-Controlling Interest | (598) | | | (606) | | | |
| Net interest loss and other | (37,060) | | | (28,207) | | | |
| Total Segment Other Loss | $ | (37,658) | | | $ | (28,813) | | | |
(1)Represents the addition of other income of consolidated funds and VIEs.
APOLLO GLOBALASSET MANAGEMENT, INC.
NOTES TO CONDENSED CONSOLIDATED
FINANCIAL STATEMENTS (UNAUDITED)
(dollars in thousands, except share data, except where noted)
The following table presents the reconciliation of income before income tax provision reported in the condensed consolidated statements of operations to Adjusted Segment Distributable Earnings:Income:
| | | | | | | | | | | | | |
| For the Three Months Ended June 30, |
| 2021 | | 2020 | | |
| Income before income tax (provision) benefit | $ | 1,699,511 | | | $ | 1,139,408 | | | |
Transaction-related charges(1) | 31,572 | | | 32,110 | | | |
| | | | | |
| | | | | |
| Net income attributable to Non-Controlling Interests in consolidated entities | (116,276) | | | (41,068) | | | |
| Unrealized performance fees | (279,750) | | | (907,656) | | | |
| Unrealized profit sharing expense | 98,141 | | | 340,687 | | | |
Equity-based profit sharing expense and other(2) | 26,992 | | | 38,463 | | | |
| Equity-based compensation | 19,491 | | | 17,747 | | | |
| Unrealized principal investment (income) loss | (8,620) | | | (107,110) | | | |
| Unrealized net (gains) losses from investment activities and other | (914,167) | | | (277,167) | | | |
| Segment Distributable Earnings | $ | 556,894 | | | $ | 235,414 | | | |
(1) Transaction-related charges include equity-based compensation charges, the amortization of intangible assets, contingent consideration and certain other charges associated with acquisitions, and restructuring charges.
(2) Equity-based profit sharing expense and other includes certain profit sharing arrangements in which a portion of performance fees distributed to the general partner are allocated by issuance of equity-based awards, rather than cash, to employees of Apollo. Equity-based profit sharing expense and other also includes non-cash expenses related to equity awards granted by unconsolidated related parties to employees of Apollo.
| | | | | | | | | | | | | | | | | | | | | | | |
| | As of and for the Six Months Ended June 30, 2021 |
| | Credit
Segment | | Private Equity
Segment | | Real Assets
Segment | | Total Reportable
Segments |
| Management fees | $ | 541,338 | | | $ | 245,374 | | | $ | 124,193 | | | $ | 910,905 | |
| Advisory and transaction fees, net | 87,887 | | | 48,378 | | | 2,465 | | | 138,730 | |
Performance fees(1) | 16,846 | | | 0 | | | 0 | | | 16,846 | |
| Fee Related Revenues | 646,071 | | | 293,752 | | | 126,658 | | | 1,066,481 | |
| Salary, bonus and benefits | (144,678) | | | (117,605) | | | (59,246) | | | (321,529) | |
| General, administrative and other | (80,219) | | | (48,675) | | | (26,345) | | | (155,239) | |
| Placement fees | (1,066) | | | 0 | | | 0 | | | (1,066) | |
| Fee Related Expenses | (225,963) | | | (166,280) | | | (85,591) | | | (477,834) | |
| Other income (loss), net of Non-Controlling Interest | (1,549) | | | 1,419 | | | (251) | | | (381) | |
| Fee Related Earnings | 418,559 | | | 128,891 | | | 40,816 | | | 588,266 | |
| Realized performance fees | 118,160 | | | 432,714 | | | 24,636 | | | 575,510 | |
| Realized profit sharing expense | (79,924) | | | (210,781) | | | (13,604) | | | (304,309) | |
| Net Realized Performance Fees | 38,236 | | | 221,933 | | | 11,032 | | | 271,201 | |
Realized principal investment income, net(2) | 4,435 | | | 88,805 | | | 3,535 | | | 96,775 | |
| Net interest loss and other | (25,654) | | | (27,236) | | | (17,676) | | | (70,566) | |
Segment Distributable Earnings(3) | $ | 435,576 | | | $ | 412,393 | | | $ | 37,707 | | | $ | 885,676 | |
Total Assets(3) | $ | 6,100,580 | | | $ | 4,868,181 | | | $ | 785,017 | | | $ | 11,753,778 | |
(1)Represents certain performance fees related to business development companies, Redding Ridge Holdings and MidCap.
(2)Realized principal investment income, net includes dividends from our permanent capital vehicles, net of such amounts used to compensate employees.
(3)Refer below for a reconciliation of total revenues, total expenses, other loss and total assets for Apollo’s total reportable segments to total consolidated revenues, total consolidated expenses, total consolidated other income (loss) and total assets.
APOLLO GLOBAL MANAGEMENT, INC.
NOTES TO CONDENSED CONSOLIDATED
FINANCIAL STATEMENTS (UNAUDITED)
(dollars in thousands, except share data, except where noted)
| | | | | | | | | | | | | | | | | | | | | | | |
| | For the Six Months Ended June 30, 2020 |
| | Credit
Segment | | Private Equity
Segment | | Real Assets
Segment | | Total Reportable
Segments |
| Management fees | $ | 432,950 | | | $ | 252,860 | | | $ | 98,380 | | | $ | 784,190 | |
| Advisory and transaction fees, net | 29,023 | | | 65,145 | | | 4,313 | | | 98,481 | |
Performance fees(1) | 5,844 | | | 0 | | | 0 | | | 5,844 | |
| Fee Related Revenues | 467,817 | | | 318,005 | | | 102,693 | | | 888,515 | |
| Salary, bonus and benefits | (109,814) | | | (95,682) | | | (53,524) | | | (259,020) | |
| General, administrative and other | (72,624) | | | (43,764) | | | (23,768) | | | (140,156) | |
| Placement fees | (664) | | | (107) | | | 0 | | | (771) | |
| Fee Related Expenses | (183,102) | | | (139,553) | | | (77,292) | | | (399,947) | |
| Other loss, net of Non-Controlling Interest | (1,387) | | | 25 | | | 95 | | | (1,267) | |
| Fee Related Earnings | 283,328 | | | 178,477 | | | 25,496 | | | 487,301 | |
| Realized performance fees | 30,220 | | | 4,692 | | | 41,671 | | | 76,583 | |
| Realized profit sharing expense | (29,916) | | | (4,996) | | | (41,671) | | | (76,583) | |
| Net Realized Performance Fees | 304 | | | (304) | | | 0 | | | 0 | |
Realized principal investment income, net(2) | 3,184 | | | 3,946 | | | 3,672 | | | 10,802 | |
| Net interest loss and other | (28,971) | | | (27,360) | | | (9,853) | | | (66,184) | |
Segment Distributable Earnings (3) | $ | 257,845 | | | $ | 154,759 | | | $ | 19,315 | | | $ | 431,919 | |
| | | | | | | |
| | | | | | | |
(1)Represents certain performance fees related to business development companies, Redding Ridge Holdings and Midcap.
(2)Realized principal investment income, net includes dividends from our permanent capital vehicles, net of such amounts used to compensate employees.
(3)Refer below for a reconciliation of total revenues, total expenses and other income (loss) for Apollo’s total reportable segments to total consolidated revenues, total consolidated expenses and total consolidated other income (loss) and total assets.
The following table reconciles total consolidated revenues to total revenues for Apollo’s reportable segments:
| | | | | | | | | | | | | |
| | For the Six Months Ended June 30, |
| 2021 | | 2020 | | |
| Total Consolidated Revenues | $ | 3,677,025 | | | $ | 39,249 | | | |
Equity awards granted by unconsolidated related parties, reimbursable expenses and other(1) | (67,674) | | | (60,688) | | | |
Adjustments related to consolidated funds and VIEs(1) | 75,033 | | | 14,714 | | | |
Performance fees(2) | (2,145,760) | | | 815,942 | | | |
| Principal investment (income) loss | (472,143) | | | 79,298 | | | |
| Total Fee Related Revenues | 1,066,481 | | | 888,515 | | | |
| Realized performance fees | 575,510 | | | 76,583 | | | |
| Realized principal investment income, net and other | 96,775 | | | 9,117 | | | |
| Total Segment Revenues | $ | 1,738,766 | | | $ | 974,215 | | | |
(1)Represents advisory fees, management fees and performance fees earned from consolidated VIEs which are eliminated in consolidation. Includes non-cash revenues related to equity awards granted by unconsolidated related parties to employees of the Company and certain compensation and administrative related expense reimbursements.
(2)Excludes certain performance fees from business development companies, Redding Ridge Holdings and MidCap.
APOLLO GLOBAL MANAGEMENT, INC.
NOTES TO CONDENSED CONSOLIDATED
FINANCIAL STATEMENTS (UNAUDITED)
(dollars in thousands, except share data, except where noted)
The following table reconciles total consolidated expenses to total expenses for Apollo’s reportable segments:
| | | | | | | | | | | | | |
| | For the Six Months Ended June 30, |
| 2021 | | 2020 | | |
| Total Consolidated Expenses | $ | 1,768,531 | | | $ | 374,343 | | | |
Equity awards granted by unconsolidated related parties, reimbursable expenses and other(1) | (77,488) | | | (53,873) | | | |
| Reclassification of interest expenses | (69,613) | | | (63,533) | | | |
Transaction-related charges, net(1) | (51,666) | | | (10,711) | | | |
Charges associated with corporate conversion (2) | 0 | | | (1,064) | | | |
| Equity-based compensation | (35,649) | | | (31,817) | | | |
Total profit sharing expense(3) | (1,053,306) | | | 190,962 | | | |
| Dividend-related compensation expense | (2,975) | | | (4,360) | | | |
| Total Fee Related Expenses | 477,834 | | | 399,947 | | | |
| Realized profit sharing expense | 304,309 | | | 76,583 | | | |
| Total Segment Expenses | $ | 782,143 | | | $ | 476,530 | | | |
(1)Represents the addition of expenses of consolidated funds and VIEs, transaction-related charges, non-cash expenses related to equity awards granted by unconsolidated related parties to employees of the Company and certain compensation and administrative expenses. Transaction-related charges include equity-based compensation charges, the amortization of intangible assets, contingent consideration and certain other charges associated with acquisitions, and restructuring charges.
(2)Represents expenses incurred in relation to the conversion to a corporation.
(3)Includes unrealized profit sharing expense, realized profit sharing expense and equity-based profit sharing expense and other.
The following table reconciles total consolidated other income (loss) to total other loss for Apollo’s reportable segments:
| | | | | | | | | | | | | |
| | For the Six Months Ended June 30, |
| 2021 | | 2020 | | |
| Total Consolidated Other Income (Loss) | $ | 1,512,766 | | | $ | (1,105,194) | | | |
Adjustments related to consolidated funds and VIEs(1) | (255,063) | | | 110,268 | | | |
| Loss from change in tax receivable agreement liability | (1,941) | | | 0 | | | |
| Net (gains) losses from investment activities | (1,268,900) | | | 994,132 | | | |
| Interest income and other, net of Non-Controlling Interest | 12,757 | | | (473) | | | |
| Other Income (Loss), net of Non-Controlling Interest | (381) | | | (1,267) | | | |
| Net interest loss and other | (70,566) | | | (64,499) | | | |
| Total Segment Other Loss | $ | (70,947) | | | $ | (65,766) | | | |
(1)Represents the addition of other income of consolidated funds and VIEs.
APOLLO GLOBAL MANAGEMENT, INC.
NOTES TO CONDENSED CONSOLIDATED
FINANCIAL STATEMENTS (UNAUDITED)
(dollars in thousands, except share data, except where noted)
| | | | | | | | | | | |
| For the Three Months Ended March 31, |
| 2022 | | 2021 |
| Income before income tax provision | $ | 1,417,796 | | | $ | 1,721,749 | |
Equity-based profit sharing expense and other(1) | 97,078 | | | 34,872 | |
| Equity-based compensation | 56,333 | | | 16,158 | |
Transaction-related charges(2) | (729) | | | 9,325 | |
Merger-related transaction and integration costs(3) | 17,746 | | | 10,769 | |
| (Gain) loss from change in tax receivable agreement liability | 14,184 | | | (1,941) | |
| Net income attributable to Non-Controlling Interests in consolidated entities | (210,109) | | | (70,578) | |
| Unrealized performance fees | (444,643) | | | (1,290,499) | |
| Unrealized profit sharing expense | 191,253 | | | 588,992 | |
| | | |
| Net interest expense | 30,300 | | | 33,852 | |
| Unrealized principal investment income (loss) | 82,128 | | | (363,773) | |
| Unrealized net (gains) losses from investment activities and other | (536,708) | | | (326,065) | |
| Adjusted Segment Income | $ | 714,629 | | | $ | 362,861 | |
| | | |
(1) Equity-based profit sharing expense and other includes certain profit sharing arrangements in which a portion of performance fees distributed to the general partner are required to be used by employees of Apollo to purchase restricted shares of common stock or RSUs, which are granted under AGM’s Equity Plan. Equity-based profit sharing expense and other also includes performance grants which are tied to the Company’s receipt of performance fees, within prescribed periods, sufficient to cover the associated equity-based compensation expense. |
(2) Transaction-related charges include equity-based compensation charges, the amortization of intangible assets, contingent consideration and certain other charges associated with acquisitions. |
(3) Merger-related transaction and integration costs includes advisory services, technology integration, equity-based compensation charges and other costs associated with the Mergers. |
|
The following table presents the reconciliation of income before income tax provision reported in the condensed consolidated statements of operations to Segment Distributable Earnings:
| | | | | | | | | | | | | |
| For the Six Months Ended June 30, |
| 2021 | | 2020 | | |
| Income (Loss) before income tax (provision) benefit | $ | 3,421,260 | | | $ | (1,440,288) | | | |
Transaction-related charges(1) | 51,666 | | | 10,711 | | | |
Charges associated with corporate conversion(2) | 0 | | | 1,064 | | | |
| Loss from change in tax receivable agreement liability | (1,941) | | | 0 | | | |
| Net (income) loss attributable to Non-Controlling Interests in consolidated entities | (186,854) | | | 123,341 | | | |
| Unrealized performance fees | (1,570,249) | | | 892,525 | | | |
| Unrealized profit sharing expense | 687,133 | | | (340,496) | | | |
Equity-based profit sharing expense and other(3) | 61,864 | | | 72,951 | | | |
| Equity-based compensation | 35,649 | | | 31,817 | | | |
| Unrealized principal investment (income) loss | (372,393) | | | 94,460 | | | |
| Unrealized net (gains) losses from investment activities and other | (1,240,459) | | | 985,834 | | | |
| Segment Distributable Earnings | $ | 885,676 | | | $ | 431,919 | | | |
(1) Transaction-related charges include equity-based compensation charges, the amortization of intangible assets, contingent consideration and certain other charges associated with acquisitions, and restructuring charges.
(2) Represents expenses incurred in relation to the conversion to a corporation.
(3) Equity-based profit sharing expense and other includes certain profit sharing arrangements in which a portion of performance fees distributed to the general partner are allocated by issuance of equity-based awards, rather than cash, to employees of Apollo. Equity-based profit sharing expense and other also includes non-cash expenses related to equity awards granted by unconsolidated related parties to employees of Apollo.
The following table presents the reconciliation of Apollo’sCompany’s total reportable segment assets to total assets:
| | | | | | | | | | | |
| As of
June 30, 2021 | | As of
December 31, 2020 |
| Total reportable segment assets | $ | 11,753,778 | | | $ | 8,681,467 | |
Adjustments(1) | 15,787,568 | | | 14,987,617 | |
| Total assets | $ | 27,541,346 | | | $ | 23,669,084 | |
(1) Represents the addition of assets of consolidated funds and VIEs and consolidation elimination adjustments. | | | | | | | | | | | |
| As of
March 31, 2022 | | As of
December 31, 2021 |
| Total reportable segment assets | $ | 10,149,618 | | | $ | 13,573,400 | |
Adjustments(1) | 2,161,884 | | | 16,928,494 | |
| Total assets | $ | 12,311,502 | | | $ | 30,501,894 | |
| | | |
(1) Represents the addition of assets of consolidated funds and VIEs and consolidation elimination adjustments. |
17. SUBSEQUENT EVENTS
Dividends
On August 4, 2021, the Company declared a cash dividend of $0.50 per share of Class A Common Stock, which will be paid on August 31, 2021 to holders of record at the close of business on August 19, 2021.
On August 4, 2021,May 5, 2022, the Company declared a cash dividend of $0.398438 per share of Series A Preferred Stockshares and Series B Preferred Stock,shares, which will be paid on SeptemberJune 15, 20212022 to holders of record at the close of business on SeptemberJune 1, 2021.2022.
On May 3, 2022, the Company completed the acquisition of the U.S. asset management business of Griffin Capital (“Griffin”) in exchange for closing consideration of approximately $300 million and contingent consideration of up to $150 million, substantially all of which will be settled in shares of AGM common stock, per the transaction agreement signed December 2, 2021. This follows, and is incremental to, the March 2022 close of Griffin’s wealth distribution business. As a result of the final close, the Griffin Institutional Access Real Estate Fund and the Griffin Institutional Access Credit Fund are now advised by Apollo and have been renamed the Apollo Diversified Real Estate Fund and Apollo Diversified Credit Fund, respectively.
ITEM 1A. UNAUDITED SUPPLEMENTAL PRESENTATION OF STATEMENTS OF FINANCIAL CONDITION
APOLLO GLOBAL MANAGEMENT, INC.
CONSOLIDATING STATEMENTS OF FINANCIAL CONDITION (Unaudited)
(dollars in thousands, except share data) | | | | | | | | | | | | | | | | | | | | | | | |
| As of June 30, 2021 |
| Apollo Global Management, Inc. and Consolidated Subsidiaries | | Consolidated Funds and VIEs | | Eliminations | | Consolidated |
| Assets: | | | | | | | |
| Cash and cash equivalents | $ | 1,823,421 | | | $ | 1,291 | | | $ | — | | | $ | 1,824,712 | |
| Restricted cash and cash equivalents | 17,695 | | | 1,507,207 | | | — | | | 1,524,902 | |
| | | | | | | |
| Investments | 8,186,436 | | | 413 | | | (276,330) | | | 7,910,519 | |
| Assets of consolidated variable interest entities: | | | | | | | |
| Cash and cash equivalents | — | | | 805,736 | | | — | | | 805,736 | |
| Investments, at fair value | — | | | 14,040,590 | | | (380,959) | | | 13,659,631 | |
| Other assets | — | | | 169,900 | | | (1,911) | | | 167,989 | |
| Incentive fees receivable | 13,802 | | | — | | | — | | | 13,802 | |
| Due from related parties | 505,940 | | | (3,321) | | | (76,692) | | | 425,927 | |
| Deferred tax assets, net | 235,118 | | | — | | | — | | | 235,118 | |
| Other assets | 492,811 | | | 2,137 | | | (493) | | | 494,455 | |
| Lease assets | 361,597 | | | — | | | — | | | 361,597 | |
| Goodwill | 116,958 | | | — | | | — | | | 116,958 | |
| Total Assets | $ | 11,753,778 | | | $ | 16,523,953 | | | $ | (736,385) | | | $ | 27,541,346 | |
| Liabilities, Redeemable non-controlling interests and Stockholders’ Equity | | | | | | | |
| Liabilities: | | | | | | | |
| Accounts payable and accrued expenses | $ | 138,541 | | | $ | 3,149 | | | $ | (2) | | | $ | 141,688 | |
| Accrued compensation and benefits | 169,554 | | | — | | | — | | | 169,554 | |
| Deferred revenue | 74,946 | | | — | | | — | | | 74,946 | |
| Due to related parties | 440,019 | | | 5,800 | | | (6,157) | | | 439,662 | |
| Profit sharing payable | 1,521,906 | | | — | | | — | | | 1,521,906 | |
| Debt | 3,154,289 | | | — | | | — | | | 3,154,289 | |
| Liabilities of consolidated variable interest entities: | | | | | | | |
| Debt, at fair value | — | | | 8,226,118 | | | (148,830) | | | 8,077,288 | |
| Notes payable | — | | | 2,601,543 | | | (102,795) | | | 2,498,748 | |
| Other liabilities | — | | | 966,791 | | | (54,352) | | | 912,439 | |
| Due to related parties | — | | | 32,393 | | | (32,393) | | | — | |
| Other liabilities | 407,623 | | | 122,493 | | | (18,366) | | | 511,750 | |
| Lease liabilities | 409,930 | | | — | | | — | | | 409,930 | |
| Total Liabilities | 6,316,808 | | | 11,958,287 | | | (362,895) | | | 17,912,200 | |
| | | | | | | |
| Redeemable non-controlling interests: | | | | | | | |
| Redeemable non-controlling interests | — | | | 1,410,683 | | | 6,028 | | | 1,416,711 | |
| Stockholders’ Equity: | | | | | | | |
| Apollo Global Management, Inc. Stockholders’ Equity: | | | | | | | |
| Series A Preferred Stock | 264,398 | | | — | | | — | | | 264,398 | |
| Series B Preferred Stock | 289,815 | | | — | | | — | | | 289,815 | |
| Additional paid in capital | 865,255 | | | (57,334) | | | 14,691 | | | 822,612 | |
| Retained earnings (accumulated deficit) | 1,004,571 | | | 374,275 | | | (388,048) | | | 990,798 | |
| Accumulated other comprehensive income (loss) | (2,456) | | | 6,075 | | | (6,161) | | | (2,542) | |
| Total Apollo Global Management, Inc. Stockholders’ Equity | 2,421,583 | | | 323,016 | | | (379,518) | | | 2,365,081 | |
| Non-Controlling Interests in consolidated entities | 6,154 | | | 2,831,967 | | | — | | | 2,838,121 | |
| Non-Controlling Interests in Apollo Operating Group | 3,009,233 | | | — | | | — | | | 3,009,233 | |
| Total Stockholders’ Equity | 5,436,970 | | | 3,154,983 | | | (379,518) | | | 8,212,435 | |
| Total Liabilities, Redeemable non-controlling interests and Stockholders’ Equity | $ | 11,753,778 | | | $ | 16,523,953 | | | $ | (736,385) | | | $ | 27,541,346 | |
APOLLO GLOBAL MANAGEMENT, INC.
CONSOLIDATING STATEMENTS OF FINANCIAL CONDITION (Unaudited)
(dollars in thousands, except share data) | | | | | | | | | | | | | | | | | | | | | | | |
| As of December 31, 2020 |
| Apollo Global Management, Inc. and Consolidated Subsidiaries | | Consolidated Funds and VIEs | | Eliminations | | Consolidated |
| Assets: | | | | | | | |
| Cash and cash equivalents | $ | 1,555,252 | | | $ | 265 | | | $ | — | | | $ | 1,555,517 | |
| Restricted cash | 17,708 | | | — | | | — | | | 17,708 | |
| U.S. Treasury securities, at fair value | — | | | 816,985 | | | — | | | 816,985 | |
| Investments | 5,244,465 | | | 334 | | | (249,388) | | | 4,995,411 | |
| Assets of consolidated variable interest entities: | | | | | | | |
| Cash and cash equivalents | — | | | 893,306 | | | — | | | 893,306 | |
| Investments, at fair value | — | | | 13,878,603 | | | (562,587) | | | 13,316,016 | |
| Other assets | — | | | 290,264 | | | — | | | 290,264 | |
| Incentive fees receivable | 5,231 | | | — | | | — | | | 5,231 | |
| Due from related parties | 543,169 | | | (4) | | | (80,782) | | | 462,383 | |
| Deferred tax assets, net | 539,244 | | | — | | | — | | | 539,244 | |
| Other assets | 364,342 | | | 1,118 | | | (497) | | | 364,963 | |
| Lease assets | 295,098 | | | — | | | — | | | 295,098 | |
| Goodwill | 116,958 | | | — | | | — | | | 116,958 | |
| Total Assets | $ | 8,681,467 | | | $ | 15,880,871 | | | $ | (893,254) | | | $ | 23,669,084 | |
| Liabilities, Redeemable non-controlling interests and Stockholders’ Equity | | | | | | | |
| Liabilities: | | | | | | | |
| Accounts payable and accrued expenses | $ | 119,784 | | | $ | 198 | | | $ | — | | | $ | 119,982 | |
| Accrued compensation and benefits | 82,343 | | | — | | | — | | | 82,343 | |
| Deferred revenue | 30,369 | | | — | | | — | | | 30,369 | |
| Due to related parties | 608,455 | | | 1,871 | | | (1,857) | | | 608,469 | |
| Profit sharing payable | 842,677 | | | — | | | — | | | 842,677 | |
| Debt | 3,155,221 | | | — | | | — | | | 3,155,221 | |
| Liabilities of consolidated variable interest entities: | | | | | | | |
| Debt, at fair value | — | | | 9,022,414 | | | (361,899) | | | 8,660,515 | |
| Notes payable | — | | | 2,574,879 | | | (102,908) | | | 2,471,971 | |
| Other liabilities | — | | | 836,181 | | | (63,136) | | | 773,045 | |
| Due to related parties | — | | | 23,898 | | | (23,898) | | | — | |
| Other liabilities | 267,023 | | | 28,589 | | | — | | | 295,612 | |
| Lease liabilities | 332,915 | | | — | | | — | | | 332,915 | |
| Total Liabilities | 5,438,787 | | | 12,488,030 | | | (553,698) | | | 17,373,119 | |
| | | | | | | |
| Redeemable non-controlling interests: | | | | | | | |
| Redeemable non-controlling interests | — | | | 782,702 | | | — | | | 782,702 | |
| Stockholders’ Equity: | | | | | | | |
| Apollo Global Management, Inc. Stockholders’ Equity: | | | | | | | |
| Series A Preferred stock | 264,398 | | | — | | | — | | | 264,398 | |
| Series B Preferred stock | 289,815 | | | — | | | — | | | 289,815 | |
| Additional paid in capital | 877,173 | | | (12,928) | | | 12,928 | | | 877,173 | |
| Retained earnings (accumulated deficit) | — | | | 334,998 | | | (334,998) | | | — | |
| Accumulated other comprehensive income (loss) | (2,044) | | | 17,459 | | | (17,486) | | | (2,071) | |
| Total Apollo Global Management, Inc. Stockholders’ Equity | 1,429,342 | | | 339,529 | | | (339,556) | | | 1,429,315 | |
| Non-Controlling Interests in consolidated entities | 5,118 | | | 2,270,610 | | | — | | | 2,275,728 | |
| Non-Controlling Interests in Apollo Operating Group | 1,808,220 | | | — | | | — | | | 1,808,220 | |
| Total Stockholders’ Equity | 3,242,680 | | | 2,610,139 | | | (339,556) | | | 5,513,263 | |
| Total Liabilities and Stockholders’ Equity | $ | 8,681,467 | | | $ | 15,880,871 | | | $ | (893,254) | | | $ | 23,669,084 | |
ITEM 2. MANAGEMENT’S DISCUSSION AND ANALYSIS OF FINANCIAL CONDITION AND RESULTS OF OPERATIONS
The following discussion should be read in conjunction with Apollo GlobalAsset Management, Inc.’s condensed consolidated financial statements and the related notes included within this Quarterly Report on Form 10-Q.quarterly report. This discussion contains forward-looking statements that are subject to known and unknown risks and uncertainties. Actual results and the timing of events may differ significantly from those expressed or implied in such forward-looking statements due to a number of factors, including those included in the section entitled “Risk Factors” in the 20202021 Annual Report and Quarterly Report on Form 10-Q filed with the SEC on May 10, 2021.Report. The highlights listed below have had significant effects on many items within our condensed consolidated financial statements and affect the comparison of the current period’s activity with those of prior periods. Target returns included in this report are presented gross and do not account for fees, expenses and taxes, which will reduce returns. Target returns are neither guarantees nor predictions or projections of future performance. There can be no assurance that target returns will be achieved or that Apollo will be successful in implementing the applicable strategy. Actual gross and net returns for funds managed by Apollo, and individual investors participating directly or indirectly in funds managed by Apollo, may vary significantly from the target returns set forth herein.
General
Our Businesses
Founded in 1990, Apollo is a high-growth, global alternative asset manager. Apollo conducts its business primarily in the United States through the following two reportable segments: asset management and principal investing. These business segments are differentiated based on the investment services they provide as well as varying investing strategies. Apollo had a team of 2,336 employees, including 660 investment professionals, as of March 31, 2022.
Asset Management
Our asset management segment focuses on three investing strategies: yield, hybrid and equity. We are a contrarian, value-oriented asset manager in credit, private equity and real assets with significant distressed expertise andhave a flexible mandate in many of the majority of our funds we manage which enables ourthe funds to invest opportunistically across a company’s capital structure. We raise, invest and manage funds on behalf of some of the world’s most prominent pension, endowment and sovereign wealth funds, as well as other institutional and individual investors. Apollo is led by Joshua Harris and Marc Rowan, who have worked together for more than 34 years and lead a team of 1,825 employees, including 569 investment professionals, as of June 30, 2021.
Apollo conducts its business primarily in the United States through the following three reportable segments:
(i)Credit—primarily invests in non-control corporate and structured debt instruments including performing, stressed and distressed instruments across the capital structure;
(ii)Private equity—primarily invests in control equity and related debt instruments, convertible securities and distressed debt instruments; and
(iii)Real assets—primarily invests in (i) real estate equity and infrastructure equity for the acquisition and recapitalization of real estate and infrastructure assets, portfolios, platforms and operating companies, (ii) real estate and infrastructure debt including first mortgage and mezzanine loans, preferred equity and commercial mortgage backed securities and (iii) European performing and non-performing loans, and unsecured consumer loans.
These business segments are differentiated based on the varying investment strategies. The performance is measured by management on an unconsolidated basis because management makes operating decisions and assesses the performance of each of Apollo’s business segments based on financial and operating metrics and data that exclude the effects of consolidation of any of the managed funds.
Our financial results vary since performance fees, which generally constitute a large portion of the income we receive from the funds that we manage, as well as the transaction and advisory fees that we receive, can vary significantly from quarter to quarter and year to year. As a result, we emphasize long-term financial growth and profitability to manage our business.
In addition, the growth in our Fee-Generating AUM during the last year has primarily been in our credit segment driven by continued growth in traditional funds and managed accounts as well as growth in asset management services to the insurance industry and in performing credit products. The average management fee rate for these new credit products is at market rates for such products and in certain cases is below our historical rates. Also, due to the complexity of these new product offerings, the Company has incurred and will continue to incur additional costs associated with managing these products. To date, these additional costs have been offset by realized economies of scale and ongoing cost management.
As of June 30, 2021,March 31, 2022, we had total AUM of $471.8$512.8 billion.
Yield
Yield is our largest asset management strategy with $372.7 billion across all of AUM as of March 31, 2022. Our yield strategy focuses on generating excess returns through high-quality credit underwriting and origination. Beyond participation in the traditional issuance and secondary credit markets, through our businesses. More than 89% oforigination platforms and corporate solutions capabilities we seek to originate attractive and safe-yielding assets for the funds we manage. Within our total AUM was in funds with a contractual life at inception of five years or more, and 59% of such AUM was in permanent capital vehicles.
The following table presents the gross and netyield strategy, we target 4% to 10% returns for Apollo’s credit segment by category type:for the funds we manage. Since inception, the total return yield fund has generated a 6% gross ROE and 5% net ROE annualized through March 31, 2022.
| | | | | | | | | | | | | | | | | | |
| | | Gross Returns | | Net Returns |
| Category | | For the Three Months Ended June 30, 2021 | For the Six Months Ended June 30, 2021 | | For the Three Months Ended June 30, 2021 | For the Six Months Ended June 30, 2021 |
| Corporate Credit | | 2.0% | 4.6% | | 1.7% | 3.9% |
| Structured Credit | | 4.5% | 10.1% | | 4.0% | 9.1% |
| Direct Origination | | 2.7% | 9.2% | | 2.0% | 7.2% |
On December 31, 2017, Fund IX held its final closing, raising a total of $23.5 billion in third-party capital and approximately $1.2Our hybrid strategy, with $53.7 billion of additional capital from Apollo and affiliated investors for total commitments of $24.7 billion. On December 31, 2013, Fund VIII held a final closing raising a total of $17.5 billion in third-party capital and approximately $880 million of additional capital from Apollo and affiliated investors, andAUM as of June 30, 2021, Fund VIII had $2.5March 31, 2022, brings together our capabilities across debt and equity to seek to offer a differentiated risk-adjusted return with an emphasis on structured downside protected opportunities across asset classes. We target 8% to 15% returns within our hybrid strategy by pursuing investments in all market environments, deploying capital during both periods of dislocation and market strength, and focusing on different investing strategies and asset classes. Our flagship hybrid credit hedge fund has generated a 12% gross ROE and 8% net ROE annualized and our hybrid value funds have generated a 28% gross IRR and a 23% net IRR from inception through March 31, 2022.
Equity
Our equity strategy, with $86.4 billion of uncalled commitments remaining. Additionally, Fund VII held a final closing in December 2008, raising a total of $14.7 billion, andAUM as of June 30, 2021, Fund VII had $1.8 billionMarch 31, 2022, emphasizes flexibility, complexity, and purchase price discipline to drive opportunistic-like returns for the funds we manage throughout market cycles. Apollo’s equity team has experience across sectors, industries, and geographies in both private equity and real estate equity. Our controlled equity transactions are principally buyouts, corporate carveouts and distressed investments, while our real estate funds generally transact in single asset, portfolio and platform acquisitions. Within our equity strategy, we target upwards of uncalled commitments remaining.15% returns in the funds we manage. We have consistently produced attractive long-term investment returns in our traditional private equity funds, generating a 39% gross IRR and a 25% net IRR on a compound annual basis from inception through June 30, 2021. Apollo’s private equity fund appreciation was 9.5%March 31, 2022.
Principal Investing
Our principal investing segment is comprised of our realized performance fee income, realized investment income from our balance sheet investments, and 33.6% for the three and six months ended June 30, 2021, respectively.
For our real assets segment, there was a total gross return of 4.0% and 7.7% for the three and six months ended June 30, 2021, respectively, which represents gross return for our real estate equity funds and their co-investment capital, the European principal finance funds, and infrastructure equity funds.
For further detailcertain allocable expenses related to fund performance metrics across allcorporate functions supporting the entire company. The principal investing segment also includes our growth capital and liquidity resources. We expect to deploy capital into strategic investments over time that will help accelerate the growth of our businesses, see “—The Historical Investment Performance of Our Funds.”asset management segment, by broadening our investment
Holding Company Structuremanagement and/or product distribution capabilities or increasing the efficiency of our operations. We believe these investments will translate into greater compounded annual growth of Fee Related Earnings.
Given the cyclical nature of performance fees, earnings from our principal investing segment, or Principal Investing Income (“PII”), is inherently more volatile in nature than earnings from the asset management segment. We earn fees based on the investment performance of the funds we manage and compensate our employees, primarily investment professionals, with a meaningful portion of these proceeds to align our team with the investors in the funds we manage and incentivize them to deliver strong investment performance over time. We expect to increase the proportion of performance fee income we pay to our employees over time, and as such proportion increases, we expect PII to represent a relatively smaller portion of our total company earnings.
The diagram below depicts our current organizational structure:
Note: The organizational structure chart above depicts a simplified version of the Apollo structure. It does not include all legal entities in the structure. Ownership percentages are as of August 4, 2021. As of August 4, 2021, there were 235,527,358 Class A shares, 1 Class B share and 1 Class C share issued and outstanding, and 168,253,613 AOG Units held by Holdings that are exchangeable for Class A shares on a one-for-one basis. In addition, as of August 4, 2021, Athene held 29,154,519 AOG Units that are non-voting equity interests of the Apollo Operating Group and are not exchangeable for Class A shares.
(1)As of August 4, 2021, the Class A shares represented 9.2% of the total voting power of the Class A shares, the Class B shareIncludes direct and the Class C share, voting together as a single class, with respect to General Stockholder Matters. As of August 4, 2021, the Class A shares represented 54.4% of the total voting power of the Class A shares and the Class B share with respect to certain matters upon which they are entitled to vote pursuant to the certificate of incorporation of AGM Inc. (“COI”).indirect ownership by AGM.
(2)Our Co-Founders own BRH Holdings GP, Ltd., which in turn holds our only outstanding Class B share. As of August 4, 2021, the Class B share represented 7.7% of the total voting power of the Class A shares, the Class B share and the Class C share, voting together as a single class, with respect to General Stockholder Matters, and a de minimus economic interest in AGM Inc. As of August 4, 2021, the Class B share represented 45.6% of the total voting power of the Class A shares and the Class B share with respect to certain matters upon which they are entitled to vote as a single class.
(3)Through BRH Holdings, L.P., our Co-Founders indirectly beneficially own through estate planning vehicles, limited partner interests in Holdings. Our Co-Founders’ economic interests are represented by their indirect beneficial ownership, through Holdings, of 35.1% of the limited partner interests in the Apollo Operating Group.
(4)Holdings owns 38.9% of the limited partner or limited liability company interests in each Apollo Operating Group entity. The AOG Units held by Holdings are exchangeable for Class A shares. Our Co-Founders, through their interests in BRH and Holdings, beneficially own 35.1% of the AOG Units. Our Contributing Partners, through their interests in Holdings, beneficially own 3.8% of the AOG Units.
(5)BRH Holdings GP, Ltd. is the sole member of AGM Management, LLC, which in turns holds our only outstanding Class C share. The Class C share bestows to its holder certain management rights over AGM Inc. As of August 4, 2021, the Class C share represented 83.1% of the total voting power of the Class A shares, the Class B share and the Class C share, voting together as a single class, with respect to General Stockholder Matters, and a de minimus economic interest in AGM Inc.
(6)Represents 54.4% of the limited partner or limited liability company interests in each Apollo Operating Group entity, held through the intermediate holding companies. AGM Inc. also indirectly owns 100% of the general partner or managing member interests in each Apollo Operating Group entity.
(7)Represents 6.7% of the limited partner or limited liability company interests in each Apollo Operating Group entity held by Athene Holding Ltd. and/or its affiliates. AOG Units held by Athene are non-voting equity interests of the Apollo Operating Group and are not exchangeable for Class A shares.
Each of the Apollo Operating Group entities holds interests in different businesses or entities organized in different jurisdictions.
Our structure is designed to accomplish a number of objectives, the most important of which are as follows:
•Historically, we were a holding company that was qualified as a partnership for U.S. federal income tax purposes. Our intermediate holding companies enabled us to maintain our partnership status and to meet the qualifying income exception. Effective September 5, 2019, Apollo Global Management, LLC converted from a Delaware limited liability company to a Delaware corporation named Apollo Global Management, Inc.
•We have historically used multiple management companies to segregate operations for business, financial and other reasons. Going forward, we may increase or decrease the number of our management companies, partnerships or other entities within the Apollo Operating Group based on our views regarding the appropriate balance between (a) administrative convenience and (b) continued business, financial, tax and other optimization.
On March 8, 2021, we announced that we entered into a binding governance term sheet with the Co-Founders. The term sheet sets forth a number of changes to our governance structure and a timeline for their implementation, including changes relating to:
• composition and size of our board of directors;
• Board committees, including to create a nominating and corporate governance committee, a compensation committee, and a new executive committee. The new executive committee will for the first year consist of at least three members, but no more than four members, including Jay Clayton, as the committee’s Chairman, Marc Rowan and Joshua Harris; and
• elimination of the Up-C structure – as promptly as practicable following the receipt of all required regulatory approvals:
• the single Class B share that is held by BRH Holdings GP, Ltd. will be converted into shares of Series I Preferred Stock of AGM Inc. equal in number to the outstanding AOG Units (other than those AOG Units held by the Company and Athene) and entitled to one vote per share on each matter properly presented to the stockholders of AGM Inc.;
• upon the issuance of the Series I Preferred Stock, the Co-Founders shall cause AGM Management, LLC to surrender to the Company the sole Class C share;
• on or prior to June 30, 2022, as designated by us, which date will coincide with the consummation of the transactions contemplated by the Merger Agreement, provided that if the transactions contemplated by the Merger Agreement have not been consummated by June 30, 2022, then the mandatory exchange date will be June 30, 2022 (such date, the “Mandatory Exchange Date”), a wholly-owned subsidiary of a newly formed holding company (“NewCo”) will merge with and into AGM Inc., with AGM Inc. to be the surviving company in the merger. Upon consummation of this merger, each holder of a share of Class A common stock will receive on a tax-free basis shares of Class A common stock of NewCo and will no longer hold any equity interests in the Company;
• on the Mandatory Exchange Date all AOG Units beneficially owned by each holder of AOG Units (other than those held by the Company and Athene) will be transferred to NewCo and one or more of its affiliates in a series of transactions in exchange for (i) such number of shares of Class A common stock of NewCo equal to the aggregate
number of AOG Units beneficially owned by such AOG Unit owners as of immediately prior to the mandatory exchange (such AOG Units, the “Outstanding AOG Units”) and (ii) an aggregate amount in cash equal to the product of (a) number of Outstanding AOG Units multiplied by (b) $3.66, payable over a period of four years in equal quarterly installments (the “AOG Unit Payment”); provided, however, that in the event that we consummate the transactions contemplated by the Merger Agreement simultaneously with the mandatory exchange, the AOG Unit Payment will be payable over the period between the date on which the transactions contemplated by the Merger Agreement are consummated and the third anniversary of the Mandatory Exchange Date in equal quarterly installments (such transactions collectively, the “mandatory exchange”).
The term sheet also states that the tax receivable agreement will not be applicable for the mandatory exchange, but will remain in effect for any exchanges occurring prior to the Mandatory Exchange Date.
The parties to the term sheet agreed that, upon the surrender of the Class C share, the Company will provide each Co-Founder with certain stockholder rights set forth in a stockholder agreement, as provided in the term sheet.
Implementation of the provisions of the term sheet remains subject to regulatory and stockholder approvals, and there can be no certainty on the consummation or the timing of these changes.
Business Environment
As a global investmentasset manager, we are affected by numerous factors, including the condition of financial markets and the economy. Price fluctuations within equity, credit, commodity, foreign exchange markets, as well as interest rates, which may be volatile and mixed across geographies, can significantly impact the valuation of our funds’investments and those of portfolio companies for the funds we manage and related income we may recognize.
In the U.S., the S&P 500 Index increaseddecreased by 8.2%4.9% during the secondfirst quarter of 2021,2022, following an increase of 5.8%10.6% during the firstfourth quarter of 2021. Global equity markets also appreciateddepreciated during the quarter, with the MSCI All Country World ex USA Index increasing 5.9%decreasing 4.7%, following an increase of 4.2%3.2% in the firstfourth quarter of 2021.
Conditions in the credit markets also have a significant impact on our business. Credit markets were positivenegative in the secondfirst quarter of 2021,2022, with the BofAML HY Master II Index increasingdecreasing by 2.8%4.5%, while the S&P/LSTA Leveraged Loan Index increaseddecreased by 1.1%0.2%. The U.S. 10-year Treasury yield decreased duringat the end of the quarter to 1.45%was 2.32%. TheOn March 17, 2022, the Federal Reserve keptraised the benchmark interest rate steady during the last twelve months atto a target range of 0.25% to 0.50% from a target range of 0% to 0.25%. in 2021.
Foreign exchange rates can materially impact the valuations of our investments and those of ourthe funds we manage that are denominated in currencies other than the U.S. dollar. Relative to the U.S. dollar, the Euro appreciated 1.1%depreciated 2.7% during the first quarter, after depreciating by 4.0%1.8% in the firstfourth quarter of 2021, while the British pound appreciated 0.4% duringdepreciated 2.9% in the first quarter, after appreciating 0.9%0.4% in the firstfourth quarter of 2021. The price of crude oil appreciated by 24.2%33.3% during the quarter, after appreciating by 21.9%0.2% during the firstfourth quarter of 2021.
In terms of economic conditions in the U.S., the Bureau of Economic Analysis reported real GDP increaseddecreased at an annual rate of 6.5% in the second quarter of 2021, following an increase of 6.4%1.4% in the first quarter of 2022, following an increase of 6.9% in the fourth quarter of 2021. As of July 2021,April 2022, the International Monetary Fund estimated that the U.S. economy will expand by 7.0%3.7% in 20212022 and 4.9%2.3% in 2022.2023. The U.S. Bureau of Labor Statistics reported that the U.S. unemployment rate decreased to 5.9%3.6% as of June 30, 2021.March 31, 2022. In addition, the U.S. Bureau of Labor Statistics reported that the annual U.S. inflation rate increased to 8.5% as of March 31, 2022 from 7.0% as of December 2021, and continues to be the highest rate since 2008.
Regardless of the market or economic environment at any given time, Apollo relies on its contrarian, value-oriented approach to consistently invest capital on behalf of its fund investors by focusing on opportunities that management believes are often overlooked by other investors. As such, Apollo’s global integrated investment platform deployed $27.8 billionacross yield, hybrid and $52.7 billionequity strategies had gross capital deployment of capital through the funds it manages during the three and six months ended June 30, 2021, respectively. Drawdown capital deployed was $6.5 billion and $9.2$48.0 billion during the three and six months ended June 30, 2021, respectively. We believeMarch 31, 2022 driven by asset origination platforms, traditional sources such as commercial real estate, CLO debt, high grade alpha transactions, and deployment from traditional private equity funds.
Apollo has one of the largest investing platforms in the world, deploying capital for investors across the risk/return spectrum from investment grade credit all the way up through private equity across its yield, hybrid, and equity investing strategies. Apollo’s expertise in credit and its focus on nine core industry sectors, combined with more than 3132 years of investment experience, has allowed Apollo to respond quickly to changing environments. Apollo’s core industry sectors include chemicals, manufacturing and industrial, natural resources, consumer and retail, consumer services, business services, financial services, leisure, and media/telecom/technology. Apollo believes that these attributes have contributed to the success of its private equity funds investing in buyouts andas well as credit opportunities investing in senior loans, high yield, and distressed credit during both expansionary and recessionary economic periods. Over the past decade, to support the significant growth of its yield investing capabilities, Apollo has developed a differentiated asset origination ecosystem which produces private credit and large-cap loan origination investment opportunities for its fund investors and retirement services clients.
In general, institutional investors continue to allocate capital towards alternative investment managers for more attractive risk-adjusted returns in a low interest rate environment, and we believe the business environment remains generally
accommodative to raise larger successor funds, launch new products, and pursue attractive strategic growth opportunities, such as continuing to grow the assets of our permanentperpetual capital vehicles. As such, Apollo had $12.4 billion and $25.8$30.7 billion of capital inflows during the three and six months ended June 30, 2021, respectively.March 31, 2022. Apollo returned $9.0 billion and $12.7$4.5 billion of capital and realized gains to the investors in the funds it manages during the three and six months ended June 30,March 31, 2022.
Overview of Results of Operations
Revenues
Management Fees
The significant growth of the assets we manage has had a positive effect on our revenues. Management fees are typically calculated based upon any of “net asset value,” “gross assets,” “adjusted par asset value,” “adjusted costs of all unrealized portfolio investments,” “capital commitments,” “invested capital,” “adjusted assets,” “capital contributions,” or “stockholders’ equity,” each as defined in the applicable limited partnership agreement and/or management agreement of the unconsolidated funds or accounts.
Advisoryand Transaction Fees, Net
As a result of providing advisory services with respect to actual and potential investments, we are entitled to receive fees for transactions related to the acquisition and, in certain instances, disposition and financing of companies, some of which are portfolio companies of the funds we manage, as well as fees for ongoing monitoring of portfolio company operations and directors’ fees. We also receive advisory fees for advisory services provided to certain funds. In addition, monitoring fees are generated on certain structured portfolio company investments. Under the terms of the limited partnership agreements for certain funds, the management fee payable by the funds may be subject to a reduction based on a certain percentage (up to 100%) of such advisory and transaction fees, net of applicable broken deal costs (“Management Fee Offset”). Such amounts are presented as a reduction to advisory and transaction fees, net, in the condensed consolidated statements of operations (see note 2 to our condensed consolidated financial statements for more detail on advisory and transaction fees, net).
Performance Fees
The general partners of the funds we manage are entitled to an incentive return of normally up to 20% of the total returns of a fund’s capital, depending upon performance of the underlying funds and subject to preferred returns and high water marks, as applicable. Performance fees, categorized as performance allocations, are accounted for as an equity method investment, and
effectively, the performance fees for any period are based upon an assumed liquidation of the funds’ assets at the reporting date, and distribution of the net proceeds in accordance with the funds’ allocation provisions. Performance fees categorized as incentive fees, which are not accounted as an equity method investment, are deferred until fees are probable to not be significantly reversed. Prior to the adoption of the new revenue recognition guidance, incentive fees were recognized on an assumed liquidation basis. The majority of performance fees are comprised of performance allocations.
As of March 31, 2022, approximately 52% of the value of the investments of the funds we manage on a gross basis was determined using market-based valuation methods (i.e., reliance on broker or listed exchange quotes) and the remaining 48% was determined primarily by comparable company and industry multiples or discounted cash flow models. See “Item 1A. Risk Factors—Risks Related to Our Businesses—Our funds’ performance, and our performance, may be adversely affected by the financial performance of our funds’ portfolio companies and the industries in which our funds invest” in the 2021 respectively.Annual Report for discussion regarding certain industry-specific risks that could affect the fair value of certain of the portfolio company investments of the funds we manage.
On October 20, 2020,In certain equity funds we manage, the Company does not earn performance fees until the investors in the fund have achieved cumulative investment returns on invested capital (including management fees and expenses) in excess of an 8% hurdle rate. Additionally, certain of our yield and hybrid funds have various performance fee rates and hurdle rates. Certain of our yield and hybrid funds allocate performance fees to the general partner in a similar manner as the equity funds. In certain of our equity, yield and hybrid funds, so long as the investors achieve their priority returns, there is a catch-up formula whereby the Company earns a priority return for a portion of the return until the Company’s performance fees equate to its incentive fee rate for that fund; thereafter, the Company participates in returns from the fund at a regularly scheduled meeting of AGM Inc.’s board of directors, Apollo’s former Chairman and Chief Executive Officer, Leon Black, requestedthe performance fee rate. Performance fees, categorized as performance allocations, are subject to reversal to the extent that the conflicts committeeperformance fees distributed exceed the amount due to the general partner based on a fund’s cumulative investment returns. The Company recognizes potential repayment of previously received performance fees as a general partner obligation representing all amounts previously distributed to the general partner that would need to be repaid to the Apollo funds if these funds were to be liquidated based on the current fair value of the boardunderlying funds’ investments as of directors (comprisedthe reporting date. The actual general partner obligation, however, would not become payable or realized until the end of independent directors) retain outside counsela fund’s life or as otherwise set forth in the respective limited partnership agreement of the fund.
The table below presents an analysis of Apollo’s (i) performance fees receivable on an unconsolidated basis and (ii) realized and unrealized performance fees:
| | | | | | | | | | | | | | | | | | | | | | | | | | | | | | | | | | | | | | | | | | |
| As of March 31, | | | | | | | | Performance Fees for the Three Months Ended
March 31, 2022 | | | | |
| | 2022 | | | | | | |
| | Performance Fees Receivable on an Unconsolidated Basis | | | | | | | | Unrealized | | Realized | | Total | | | | | | | | | | | | |
| | (in thousands) |
| AIOF I and II | $ | 15,232 | | | | | | | | | | $ | (795) | | | $ | 5,043 | | | $ | 4,248 | | | | | | | | | | | | | |
ANRP I, II and III(1)(2) | 90,883 | | | | | | | | | | 991 | | | 13 | | | 1,004 | | | | | | | | | | | | | |
| EPF Funds | 135,855 | | | | | | | | | | 494 | | | 8,618 | | | 9,112 | | | | | | | | | | | | | |
| FCI Funds | 132,201 | | | | | | | | | | (7,084) | | | — | | | (7,084) | | | | | | | | | | | | | |
| Fund IX | 1,176,017 | | | | | | | | | | 405,183 | | | 54,018 | | | 459,201 | | | | | | | | | | | | | |
| Fund VIII | 653,111 | | | | | | | | | | (73,110) | | | — | | | (73,110) | | | | | | | | | | | | | |
Fund VII(1)(2) | 82,457 | | | | | | | | | | (18,373) | | | 23,543 | | | 5,170 | | | | | | | | | | | | | |
| Fund VI | 16,145 | | | | | | | | | | (141) | | | 27 | | | (114) | | | | | | | | | | | | | |
Fund IV and V(1) | — | | | | | | | | | | (223) | | | — | | | (223) | | | | | | | | | | | | | |
| Hybrid Value Fund | 121,969 | | | | | | | | | | 15,887 | | | 14,588 | | | 30,475 | | | | | | | | | | | | | |
Real Estate Equity(1) | 68,137 | | | | | | | | | | 24,588 | | | 2,859 | | | 27,447 | | | | | | | | | | | | | |
| Corporate Credit | 7,911 | | | | | | | | | | 1,171 | | | 4,386 | | | 5,557 | | | | | | | | | | | | | |
| Structured Finance and ABS | 73,924 | | | | | | | | | | 3,196 | | | 5,147 | | | 8,343 | | | | | | | | | | | | | |
| Direct Origination | 116,781 | | | | | | | | | | 9,517 | | | 9,156 | | | 18,673 | | | | | | | | | | | | | |
Other(1)(3) | 408,357 | | | | | | | | | | 81,468 | | | 14,017 | | | 95,485 | | | | | | | | | | | | | |
| Total | $ | 3,098,980 | | | | | | | | | | $ | 442,769 | | | $ | 141,415 | | | $ | 584,184 | | | | | | | | | | | | | |
Total, net of profit sharing payable(4)/expense | 1,602,325 | | | | | | | | | | 252,923 | | | (3,518) | | | 249,405 | | | | | | | | | | | | | |
(1)As of March 31, 2022, certain funds had $80.2 million in general partner obligations to conductreturn previously distributed performance fees. The fair value gain on investments and income at the fund level needed to reverse the general partner obligations was $1.3 billion, as of March 31, 2022.
(2)As of March 31, 2022, the remaining investments and escrow cash of ANRP II was valued at 100% of the fund’s unreturned capital, which was below the required escrow ratio of 115%. As a thorough reviewresult, the fund is required to place in escrow current and future performance fee distributions to the general partner until the specified return ratio of 115% is met (at the time of a future distribution) or upon liquidation. As of March 31, 2022, ANRP II had $60.8 million of gross performance fees, or $38.7 million net of profit sharing, in escrow. With respect to ANRP II, realized performance fees currently distributed to the general partner are limited to potential tax distributions and independently confirm,interest on escrow balances per the fund’s partnership agreements. Performance fees receivable as of March 31, 2022 and realized performance fees for the three months ended March 31, 2022 include interest earned on escrow balances that is not subject to contingent repayment.
(3)Other includes certain SIAs.
(4)There was a corresponding profit sharing payable of $1.5 billion as of March 31, 2022, including profit sharing payable related to amounts in escrow and contingent consideration obligations of $110.5 million.
The general partners of certain of the funds we manage accrue performance fees, categorized as performance allocations, when the fair value of investments exceeds the cost basis of the individual investors’ investments in the fund, including any allocable share of expenses incurred in connection with such investments, which we refer to as “high water marks.” These high water marks are applied on an individual investor basis. Certain funds we manage have investors with various high water marks, the achievement of which is subject to market conditions and investment performance.
Performance fees from certain funds we manage are subject to contingent repayment by the general partner in the event of future losses to the extent that the cumulative performance fees distributed from inception to date exceeds the amount computed as due to the general partner at the final distribution. These general partner obligations, if applicable, are included in due to related parties on the condensed consolidated statements of financial condition.
The following table summarizes our performance fees since inception for our combined segments through March 31, 2022:
| | | | | | | | | | | | | | | | | | | | | | | | | | | | | |
| Performance Fees Since Inception(1) |
| | Undistributed by Fund and Recognized | | Distributed by Fund and Recognized(2) | | Total Undistributed and Distributed by Fund and Recognized(3) | | General Partner Obligation(3) | | Maximum Performance Fees Subject to Potential Reversal(4) |
| | (in millions) |
| AIOF I and II | $ | 15.2 | | | $ | 36.6 | | | $ | 51.8 | | | $ | — | | | $ | 36.9 | |
| ANRP I, II and III | 90.9 | | | 156.6 | | | 247.5 | | | 12.0 | | | 113.6 | |
| EPF Funds | 135.9 | | | 455.7 | | | 591.6 | | | 26.2 | | | 326.1 | |
| FCI Funds | 132.2 | | | 24.2 | | | 156.4 | | | — | | | 132.2 | |
| Fund IX | 1,176.0 | | | 440.6 | | | 1,616.6 | | | — | | | 1,440.2 | |
| Fund VIII | 653.1 | | | 1,638.8 | | | 2,291.9 | | | — | | | 1,693.2 | |
| Fund VII | 82.5 | | | 3,181.6 | | | 3,264.1 | | | — | | | 27.1 | |
| Fund VI | 16.1 | | | 1,663.9 | | | 1,680.0 | | | — | | | 0.3 | |
| Fund IV and V | — | | | 2,053.1 | | | 2,053.1 | | | 31.9 | | | 0.4 | |
| Hybrid Value Fund | 122.0 | | | 99.7 | | | 221.7 | | | — | | | 168.3 | |
| Real Estate Equity | 68.1 | | | 57.8 | | | 125.9 | | | — | | | 77.0 | |
| Corporate Credit | 7.9 | | | 925.7 | | | 933.6 | | | — | | | 7.8 | |
| Structured Finance and ABS | 73.9 | | | 52.1 | | | 126.0 | | | — | | | 68.6 | |
| Direct Origination | 116.8 | | | 62.4 | | | 179.2 | | | — | | | 107.6 | |
Other(5) | 408.4 | | | 1,610.8 | | | 2,019.2 | | | 10.1 | | | 558.7 | |
| Total | $ | 3,099.0 | | | $ | 12,459.6 | | | $ | 15,558.6 | | | $ | 80.2 | | | $ | 4,758.0 | |
(1)Certain funds are denominated in Euros and historical figures are translated into U.S. dollars at an exchange rate of €1.00 to $1.11 as of March 31, 2022. Certain funds are denominated in pound sterling and historical figures are translated into U.S. dollars at an exchange rate of £1.00 to $1.31 as of March 31, 2022.
(2)Amounts in “Distributed by Fund and Recognized” for the Citi Property Investors (“CPI”), Gulf Stream Asset Management, LLC (“Gulf Stream”), Stone Tower Capital LLC and its related companies (“Stone Tower”) funds and SIAs are presented for activity subsequent to the respective acquisition dates. Amounts exclude certain performance fees from business development companies and Redding Ridge Holdings LP (“Redding Ridge Holdings”), an affiliate of Redding Ridge.
(3)Amounts were computed based on the fair value of fund investments on March 31, 2022. Performance fees have been allocated to and recognized by the general partner. Based on the amount allocated, a portion is subject to potential reversal or, to the extent applicable, has been reduced by the general partner obligation to return previously distributed performance fees at March 31, 2022. The actual determination and any required payment of any such general partner obligation would not take place until the final disposition of the fund’s investments based on contractual termination of the fund.
(4)Represents the amount of performance fees that would be reversed if remaining fund investments became worthless on March 31, 2022. Amounts subject to potential reversal of performance fees include amounts undistributed by a fund (i.e., the performance fees receivable), as well as a portion of the amounts that have been distributed by a fund, net of taxes and not subject to a general partner obligation to return previously distributed performance fees, except for those funds that are gross of taxes as defined in the respective funds’ governing documents.
(5)Other includes certain SIAs.
Expenses
Compensation and Benefits
Our most significant expense is compensation and benefits expense. This consists of fixed salary, discretionary and non-discretionary bonuses, profit sharing expense associated with the performance fees earned and compensation expense associated with the vesting of non-cash equity-based awards.
Our compensation arrangements with certain partners and employees contain a significant performance-based incentive component. Therefore, as our net revenues increase, our compensation costs rise. Our compensation costs also reflect the increased investment in people as we expand geographically and create new funds.
In addition, certain professionals and selected other individuals have a profit sharing interest in the performance fees earned in order to better align their interests with our own and with those of the investors in these funds. Profit sharing expense is part of our compensation and benefits expense and is generally based upon a fixed percentage of performance fees. Profit sharing expense can reverse during periods when there is a decline in performance fees that were previously recognized. Profit sharing amounts are normally distributed to employees after the corresponding investment gains have been realized and generally before preferred returns are achieved for the investors. Therefore, changes in our unrealized performance fees have the same effect on our profit sharing expense. Profit sharing expense increases when unrealized performance fees increases. Realizations only impact profit sharing expense to the extent that the effects on investments have not been recognized previously. If losses on other investments within a fund are subsequently realized, the profit sharing amounts previously distributed are normally subject to a general partner obligation to return performance fees previously distributed back to the funds. This general partner obligation due to the funds would be realized only when the fund is liquidated, which generally occurs at the end of the fund’s term. However, indemnification obligations also exist for realized gains with respect to Fund IV, Fund V and Fund VI, which, although our Former Managing Partners and Contributing Partners would remain personally liable, may indemnify our Former Managing Partners and Contributing Partners for 17.5% to 100% of the previously distributed profits regardless of the fund’s future performance. See note 14 to our condensed consolidated financial statements for further information regarding the Company’s indemnification liability.
Other Expenses
The balance of our other expenses includes interest, placement fees, and general, administrative and other operating expenses. Interest expense consists primarily of interest related to the 2024 Senior Notes, the 2026 Senior Notes, the 2029 Senior Notes, the 2030 Senior Notes, the 2048 Senior Notes and the 2050 Subordinated Notes as discussed in note 11 to our condensed consolidated financial statements. Placement fees are incurred in connection with our capital raising activities. In cases where the limited partners of the funds are determined to be the customer in an arrangement, placement fees may be capitalized as a cost to acquire a customer contract, and amortized over the life of the customer contract. General, administrative and other expenses includes occupancy expense, depreciation and amortization, professional fees and costs related to travel, information technology and administration. Occupancy expense represents charges related to office leases and associated expenses, such as utilities and maintenance fees. Depreciation and amortization of fixed assets is normally calculated using the straight-line method over their estimated useful lives, ranging from two to sixteen years, taking into consideration any residual value. Leasehold improvements are amortized over the shorter of the useful life of the asset or the expected term of the lease. Intangible assets are amortized based on the future cash flows over the expected useful lives of the assets.
Other Income (Loss)
Net Gains (Losses) from Investment Activities
Net gains (losses) from investment activities include both realized gains and losses and the change in unrealized gains and losses in our investment portfolio between the opening reporting date and the closing reporting date. Net unrealized gains (losses) are a result of changes in the fair value of unrealized investments and reversal of unrealized gains (losses) due to dispositions of investments during the reporting period. Significant judgment and estimation goes into the assumptions that Mr. Blackdrive these models and the actual values realized with respect to investments could be materially different from values obtained based on the use of those models. The valuation methodologies applied impact the reported value of investment company holdings and their underlying portfolios in our condensed consolidated financial statements.
Net Gains (Losses) from Investment Activities of Consolidated Variable Interest Entities
Changes in the fair value of the consolidated VIEs’ assets and liabilities and related interest, dividend and other income and expenses subsequent to consolidation are presented within net gains (losses) from investment activities of consolidated variable interest entities and are attributable to Non-Controlling Interests in the condensed consolidated statements of operations.
Other Income (Losses), Net
Other income (losses), net includes gains (losses) arising from the remeasurement of foreign currency denominated assets and liabilities, remeasurement of the tax receivable agreement liability and other miscellaneous non-operating income and expenses.
Income Taxes
Significant judgment is required in determining the provision for income taxes and in evaluating income tax positions, including evaluating uncertainties. We recognize the income tax benefits of uncertain tax positions only where the position is “more likely than not” to be sustained upon examination, including resolution of any related appeals or litigation, based on the technical merits of the positions. The tax benefit is measured as the largest amount of benefit that has conveyed about his previous professional relationship with Mr. Jeffrey Epstein.a greater than 50% likelihood of being realized upon ultimate settlement. If a tax position is not considered more likely than not to be sustained, then no benefits of the position are recognized. The conflicts committee had retained Dechert LLP as outside counselCompany’s income tax positions are reviewed and evaluated quarterly to conductdetermine whether or not we have uncertain tax positions that require financial statement recognition or de-recognition.
Deferred tax assets and liabilities are recognized for the expected future tax consequences, using currently enacted tax rates, of differences between the carrying amount of assets and liabilities and their respective tax basis. The effect on deferred tax assets and liabilities of a thorough, independent review which included interviewing individualschange in tax rates is recognized in income in the period when the change is enacted. Deferred tax assets are reduced by a valuation allowance when it is more likely than not that some portion or all of the deferred tax assets will not be realized.
Non-Controlling Interests
For entities that are consolidated, but not 100% owned, a portion of the income or loss and examining relevant documents.
On January 25, 2021,corresponding equity is allocated to owners other than Apollo. The aggregate of the income or loss and corresponding equity that is not owned by the Company announced thatis included in Non-Controlling Interests in the conflicts committeecondensed consolidated financial statements. As of March 31, 2022, the Non-Controlling Interests relates to the 42.6% ownership interest in the Apollo Operating Group held directly by AGM. As of December 31, 2021, Non-Controlling Interests include the 39.8% ownership interest in the Apollo Operating Group held by the Former Managing Partners and Contributing Partners through their limited partner interests in Holdings. Additionally, as of December 31, 2021, Athene held a 6.7% Non-Controlling Interest in the Apollo Operating Group as a result of the boardTransaction Agreement. Non-Controlling Interests also include limited partner interests in certain consolidated funds and VIEs.
Results of Mr. Black’s previous professional relationship with Jeffrey EpsteinOperations
Below is a discussion of our condensed consolidated results of operations for the three months ended March 31, 2022 and publicly released the review’s findings. The findings2021. For additional analysis of the reportfactors that affected our results at the segment level, see “—Segment Analysis” below:
| | | | | | | | | | | | | | | | | | | | | | | |
| | For the Three Months Ended March 31, | | Total
Change | | Percentage
Change |
| | 2022 | | 2021 | |
| (in thousands) | | |
| Revenues: | | | | | | | |
| Management fees | $ | 522,936 | | | $ | 457,185 | | | $ | 65,751 | | | 14.4% |
| Advisory and transaction fees, net | 65,786 | | | 56,348 | | | 9,438 | | | 16.7 |
| Investment income | 702,315 | | | 1,777,313 | | | (1,074,998) | | | (60.5) |
| Incentive fees | 5,850 | | | 3,854 | | | 1,996 | | | 51.8 |
| Total Revenues | 1,296,887 | | | 2,294,700 | | | (997,813) | | | (43.5) |
| Expenses: | | | | | | | |
| Compensation and benefits: | | | | | | | |
| Salary, bonus and benefits | 218,254 | | | 174,630 | | | 43,624 | | | 25.0 |
| Equity-based compensation | 156,288 | | | 56,448 | | | 99,840 | | | 176.9 |
| Profit sharing expense | 359,562 | | | 655,480 | | | (295,918) | | | (45.1) |
| Total compensation and benefits | 734,105 | | | 886,558 | | | (152,453) | | | (17.2) |
| Interest expense | 32,993 | | | 34,799 | | | (1,806) | | | (5.2) |
| General, administrative and other | 140,363 | | | 100,387 | | | 39,976 | | | 39.8 |
| Total Expenses | 907,461 | | | 1,021,744 | | | (114,283) | | | (11.2) |
| Other Income: | | | | | | | |
| Net gains from investment activities | 771,262 | | | 353,151 | | | 418,111 | | | 118.4 |
| Net gains from investment activities of consolidated variable interest entities | 279,455 | | | 112,594 | | | 166,861 | | | 148.2 |
| Interest income | 2,836 | | | 798 | | | 2,038 | | | 255.4 |
| Other income (loss), net | (25,183) | | | (17,750) | | | (7,433) | | | 41.9 |
| Total Other Income | 1,028,370 | | | 448,793 | | | 579,577 | | | 129.1 |
| Income before income tax provision | 1,417,796 | | | 1,721,749 | | | (303,953) | | | (17.7) |
| Income tax provision | (134,174) | | | (203,246) | | | 69,072 | | | (34.0) |
| Net Income | 1,283,622 | | | 1,518,503 | | | (234,881) | | | (15.5) |
| Net income attributable to Non-Controlling Interests | (686,654) | | | (839,613) | | | 152,959 | | | (18.2) |
| Net Income Attributable to Apollo Asset Management, Inc. | 596,968 | | | 678,890 | | | (81,922) | | | (12.1) |
| Series A Preferred share dividends | (4,383) | | | (4,383) | | | — | | | — |
| Series B Preferred share dividends | (4,781) | | | (4,781) | | | — | | | — |
| Net Income Attributable to Apollo Asset Management, Inc. Common Stockholders | $ | 587,804 | | | $ | 669,726 | | | $ | (81,922) | | | (12.2) |
Note: “NM” denotes not meaningful. Changes from negative to positive amounts and positive to negative amounts are consistent withnot considered meaningful. Increases or decreases from zero and changes greater than 500% are also not considered meaningful.
Three Months Ended March 31, 2022 Compared to Three Months Ended March 31, 2021
In this section, references to 2022 refer to the three months ended March 31, 2022 and references to 2021 refer to the three months ended March 31, 2021
Revenues
Revenues were $1.3 billion in 2022, a decrease of $1.0 billion from $2.3 billion in 2021 due to lower investment income. This decrease was primarily due to a decrease in performance allocations as a result of equity market volatility in 2022. Performance allocations were higher in 2021 due to fund appreciation leading to unrealized performance allocation gains.
This decrease was in part offset by an increase in management fees of $65.8 million to $522.9 million in 2022 from $457.2 million in 2021. The increase in management fees was primarily driven by yield funds due to increased Fee-Generating AUM inflows primarily from our perpetual capital vehicles.
Expenses
Expenses were $0.9 billion in 2022, a decrease of $114.3 million from $1.0 billion in 2021 due to a decrease in profit sharing expense of $295.9 million resulting from lower performance allocations during 2022. In any period, the blended profit sharing percentage is impacted by the respective profit sharing ratios of the funds generating performance allocations in the period. This decrease was partially offset by increases in equity-based compensation of $99.8 million and an increase in salary, bonus and benefits of $43.6 million due to accelerated headcount growth in 2021, including for certain senior level roles, as the Company strategically invests in talent that will seek to capture its next leg of growth. In addition, equity-based compensation increased
as a result of: i) performance grants which are tied to the Company’s receipt of performance fees, within prescribed periods and are typically recognized on an accelerated recognition method over the requisite service period to the extent the performance revenue metrics are met or deemed probable, and ii) the impact of one-time grants awarded to the Co-Presidents which vest on a cliff basis subject to continued employment over five years and the Company’s achievement of FRE and SRE per share.
General, administrative and other expenses were $140.4 million in 2022, an increase of $40.0 million from $100.4 million in 2021. The increase in 2022 is driven by increases in professional fees, travel and entertainment expenses, and absorption of occupancy and technology expenses to support the Company’s increased headcount.
Other Income (Loss)
Other Income was $1.0 billion in 2022, an increase of $580 million from $448.8 million in 2021. This increase was primarily attributable to an increase in net gains from investment activities as a result of realized investment income from dividend income earned on one of our balance sheet investments.
Income Tax Provision
The income tax provision totaled $134.2 million and $203.2 million in 2022 and 2021, respectively. The change was primarily related to the decrease in pre-tax income. The provision for income taxes includes federal, state, local and foreign income taxes resulting in an effective income tax rate of 9.5% and 11.8% for 2022 and 2021, respectively. The most significant reconciling items between the U.S. federal statutory income tax rate and the effective income tax rate were due to the following: (i) income passed through to Non-Controlling Interests, (ii) foreign, state and local income taxes, including New York City unincorporated business taxes (“NYC UBT”), and (iii) equity-based compensation net of the limiting provisions for executive compensation under IRC Section 162(m) (see note 10 to the condensed consolidated financial statements made by Mr. Black and Apollofor further details regarding the prior relationship.
On January 25, 2021, the Company announced that, at a meeting of the executive committee of our board of directors on January 24, 2021, Mr. Black informed the executive committee members that he intends to retire from his position as Chief Executive Officer of the Company on or before July 31, 2021. Leon Black, Marc Rowan and Joshua Harris, on behalf of our Class C Stockholder, voted to appoint Mr. Rowan as our Chief Executive Officer to begin serving in such role effective upon Mr. Black’s retirement.
On March 21, 2021, Mr. Black stepped down from his position as Chief Executive Officer, Director and Chairman, and as a member of the executive committee of our board of directors. Mr. Rowan formally assumed the role of Chief Executive Officer of AGM Inc. The executive committee of our board of directors appointed Lead Independent Director Jay Clayton to serve as Non-Executive Chairman of the Board effective March 21, 2021.
On May 20, 2021, the Company announced that Co-Founder Joshua Harris will step down from his day-to-day role at Apollo effective upon the closing date of Apollo’s merger with Athene, while continuing to serve on our board of directors and the executive committee of our board of directors.Company’s income tax provision).
Managing Business Performance
We believe that the presentation of Adjusted Segment DEIncome supplements a reader’s understanding of the economic operating performance of each of our segments.
Adjusted Segment Distributable Earnings and Distributable EarningsIncome
Adjusted Segment DEIncome is the key performance measure used by management in evaluating the performance of Apollo’s credit, private equityasset management and real assetsprincipal investing segments. See note 16 to the condensed consolidated financial statements for more details regarding the components of Adjusted Segment DE. DE represents Segment DE less estimated current corporate, local and non-U.S. taxes as well as the current payable under Apollo’s tax receivable agreement. DE is net of preferred dividends, if any, to the Series A and Series B preferred stockholders. DE excludes the impacts of the remeasurement of deferred tax assets and liabilities which arises from changes in estimated future tax rates. The economic assumptions and methodologies that impact the implied income tax provision are similar to those methodologies and certain assumptions used in calculating the income tax provision for Apollo’s condensed consolidated statements of operations under U.S. GAAP. Specifically, certain deductions considered in the income tax provision under U.S. GAAP, such as the deduction for transaction related charges and equity-based compensation, are taken into account for purposes of the implied tax provision. Management believes that excluding the remeasurement of the tax receivable agreement and deferred taxes from Segment DE and DE, respectively, is meaningful as it increases comparability between periods. Remeasurement of the tax receivable agreement and deferred taxes are estimates that may change due to changes in the interpretation of tax law.Income.
We believe that Adjusted Segment DEIncome is helpful for an understanding of our business and that investors should review the same supplemental financial measure that management uses to analyze our segment performance. This measure supplements and should be considered in addition to and not in lieu of the results of operations discussed below in “—Overview of Results of Operations” that have been prepared in accordance with U.S. GAAP. See note 16 to the condensed consolidated financial statements for more details regarding management’s consideration of Segment DE.
Fee Related Earnings and Fee Related EBITDAPrincipal Investing Income
Fee Related Earnings, or “FRE”,FRE is derived from our segment reported results and refers to a component of Adjusted Segment DE thatIncome and represents the performance measure used to assess the performance of the asset management segment.
PII is a component of Adjusted Segment Income and represents the performance measure used as a supplementalto assess the performance measure. of the principal investing segment.
See note 16 to the condensed consolidated financial statements for more details regarding the components of FRE.
Fee related EBITDA is a non-U.S. GAAP measure derived from our segment reported resultsFRE and is used to assess the performance of our operations as well as our ability to service current and future borrowings. Fee related EBITDA represents FRE plus amounts for depreciation and amortization. “Fee related EBITDA +100% of net realized performance fees” represents Fee related EBITDA plus realized performance fees less realized profit sharing expense.PII.
We use Adjusted Segment DE, DE,Income, FRE, and Fee related EBITDAPII as measures of operating performance, not as measures of liquidity. These measures should not be considered in isolation or as a substitute for net income or other income data prepared in accordance with U.S. GAAP. The use of these measures without consideration of their related U.S. GAAP measures is not adequate due to the adjustments described above.
Segment Analysis
Discussed below are our results of operations for each of our reportable segments. They represent the segment information available and utilized by our management to assess performance and to allocate resources. See note 16 to our condensed consolidated financial statements for more information regarding our segment reporting.
Our financial results vary, since performance fees, which generally constitute a large portion of the income from the funds that we manage, as well as the transaction and advisory fees that we receive, can vary significantly from quarter to quarter and year to year. As a result, we emphasize long-term financial growth and profitability to manage our business.
Asset Management
The following table presents Fee Related Earnings, the performance measure of our asset management segment.
| | | | | | | | | | | | | | | | | | | | | | | |
| | Three Months ended March 31, | | Total Change | | Percentage Change |
| | 2022 | | 2021 | | |
| | (in thousands) | | |
| Asset Management: | | | | | | | |
| Management fees - Yield | $ | 333,305 | | | $ | 281,076 | | | $ | 52,229 | | | 18.6% |
| Management fees - Hybrid | 48,346 | | | 39,177 | | | 9,169 | | | 23.4 |
| Management fees - Equity | 123,750 | | | 133,631 | | | (9,881) | | | (7.4) |
| Management fees | 505,401 | | | 453,884 | | | 51,517 | | | 11.4 |
| Advisory and transaction fees, net | 64,113 | | | 55,495 | | | 8,618 | | | 15.5 |
| Fee-related performance fees | 14,226 | | | 8,771 | | | 5,455 | | | 62.2 |
| Fee-related compensation | (175,372) | | | (154,395) | | | (20,977) | | | 13.6 |
| Other operating expenses | (98,384) | | | (62,064) | | | (36,320) | | | 58.5 |
| Fee Related Earnings (FRE) | $ | 309,984 | | | $ | 301,691 | | | $ | 8,293 | | | 2.7 |
| | | | | | | | | | | | | | | | | | | | | | | |
| | Three Months ended March 31, | | Total Change | | Percentage Change |
| | 2021 | | 2020 | | |
| | (in thousands) | | |
| Asset Management: | | | | | | | |
| Management fees - Yield | $ | 281,076 | | | $ | 214,450 | | | $ | 66,626 | | | 31.1% |
| Management fees - Hybrid | 39,177 | | | 30,070 | | | 9,107 | | | 30.3 |
| Management fees - Equity | 133,631 | | | 137,848 | | | (4,217) | | | (3.1) |
| Management fees | 453,884 | | | 382,368 | | | 71,516 | | | 18.7 |
| Advisory and transaction fees, net | 55,495 | | | 36,732 | | | 18,763 | | | 51.1 |
| Fee-related performance fees | 8,771 | | | 2,404 | | | 6,367 | | | 264.9 |
| Fee-related compensation | (154,395) | | | (118,456) | | | (35,939) | | | 30.3 |
| Other operating expenses | (62,064) | | | (62,145) | | | 81 | | | (0.1) |
| Fee Related Earnings (FRE) | $ | 301,691 | | | $ | 240,903 | | | $ | 60,788 | | | 25.2 |
| | | | | | | |
Three Months Ended March 31, 2022 Compared to Three Months Ended March 31, 2021
In this section, references to 2022 refer to the three months ended March 31, 2022 and references to 2021 refer to the three months ended March 31, 2021.
FRE was $310.0 million in 2022, an increase of $8.3 million compared to $301.7 million in 2021. This increase was primarily attributable to continued growth in management fees and advisory and transaction fees. The increase in management fees was primarily driven by yield funds from increased Fee-Generating AUM inflows primarily from our perpetual capital vehicles. The growth in revenues was offset, in part, by higher fee-related compensation expenses and other operating expenses as we expand our global team and absorb occupancy and technology costs.
Three Months Ended March 31, 2021 Compared to Three Months Ended March 31, 2020
In this section, references to 2021 refer to the three months ended March 31, 2021 and references to 2020 refer to the three months ended March 31, 2020.
FRE was $301.7 million in 2021, an increase of $60.8 million compared to $240.9 million in 2020. This increase was primarily attributable to growth in management fees and advisory and transaction fees. The increase in management fees was primarily driven by yield funds from increased Fee-Generating AUM inflows primarily from our perpetual capital vehicles. The growth in revenues was offset, in part, by higher fee-related compensation expense due to an increase in headcount as we continued to
expand our global team in 2021.
Asset Management Operating Metrics
We monitor certain operating metrics that are common to the alternative investmentasset management industry.industry and directly impact the performance of our asset management segment. These operating metrics include Assets Under Management, Gross capital deployeddeployment and uncalled commitments.
Assets Under Overview of Results of Operations
Revenues
Management Fees
The following presents Apollo’s Total AUM and Fee-Generating AUM by segment (in billions):
| | |
Note: Totals may not add due to rounding |
significant growth of the assets we manage has had a positive effect on our revenues. Management fees are typically calculated based upon any of “net asset value,” “gross assets,” “adjusted par asset value,” “adjusted costs of all unrealized portfolio investments,” “capital commitments,” “invested capital,” “adjusted assets,” “capital contributions,” or “stockholders’ equity,” each as defined in the applicable limited partnership agreement and/or management agreement of the unconsolidated funds or accounts.
As a result of providing advisory services with respect to actual and potential investments, we are entitled to receive fees for transactions related to the acquisition and, in certain instances, disposition and financing of companies, some of which are portfolio companies of the funds we manage, as well as fees for ongoing monitoring of portfolio company operations and directors’ fees. We also receive advisory fees for advisory services provided to certain funds. In addition, monitoring fees are generated on certain structured portfolio company investments. Under the terms of the limited partnership agreements for certain funds, the management fee payable by the funds may be subject to a reduction based on a certain percentage (up to 100%) of such advisory and transaction fees, net of applicable broken deal costs (“Management Fee Offset”). Such amounts are presented as a reduction to advisory and transaction fees, net, in the condensed consolidated statements of operations (see note 2 to our condensed consolidated financial statements for more detail on advisory and transaction fees, net).
The following presents Apollo’s AUMeffectively, the performance fees for any period are based upon an assumed liquidation of the funds’ assets at the reporting date, and distribution of the net proceeds in accordance with Future Management Fee Potential by segment (in billions):
| | |
Note: Totals may not add due to rounding |
The following tables present the components offunds’ allocation provisions. Performance Fee-Eligible AUM for each of Apollo’s three segments:
| | | | | | | | | | | | | | | | | | | | | | | |
| As of June 30, 2021 |
| Credit(1) | | Private Equity | | Real Assets | | Total |
| | (in millions) |
Performance Fee-Generating AUM (1) | $ | 44,605 | | | $ | 37,298 | | | $ | 5,522 | | | $ | 87,425 | |
| AUM Not Currently Generating Performance Fees | 8,737 | | | 3,326 | | | 599 | | | 12,662 | |
| Uninvested Performance Fee-Eligible AUM | 12,249 | | | 23,908 | | | 6,082 | | | 42,239 | |
| Total Performance Fee-Eligible AUM | $ | 65,591 | | | $ | 64,532 | | | $ | 12,203 | | | $ | 142,326 | |
| | | | | | | | | | | | | | | | | | | | | | | |
| As of June 30, 2020 |
| Credit | | Private Equity | | Real Assets | | Total |
| | (in millions) |
Performance Fee-Generating AUM (1) | $ | 18,186 | | | $ | 18,015 | | | $ | 3,768 | | | $ | 39,969 | |
| AUM Not Currently Generating Performance Fees | 31,861 | | | 12,158 | | | 1,342 | | | 45,361 | |
| Uninvested Performance Fee-Eligible AUM | 8,571 | | | 26,160 | | | 4,734 | | | 39,465 | |
| Total Performance Fee-Eligible AUM | $ | 58,618 | | | $ | 56,333 | | | $ | 9,844 | | | $ | 124,795 | |
| | | | | | | | | | | | | | | | | | | | | | | |
| As of December 31, 2020 |
| Credit | | Private Equity | | Real Assets | | Total |
| | (in millions) |
Performance Fee-Generating AUM (1) | $ | 34,685 | | | $ | 29,296 | | | $ | 4,886 | | | $ | 68,867 | |
| AUM Not Currently Generating Performance Fees | 16,791 | | | 5,035 | | | 821 | | | 22,647 | |
| Uninvested Performance Fee-Eligible AUM | 9,847 | | | 27,214 | | | 5,709 | | | 42,770 | |
| Total Performance Fee-Eligible AUM | $ | 61,323 | | | $ | 61,545 | | | $ | 11,416 | | | $ | 134,284 | |
(1)Performance Fee-Generating AUM of $4.7 billion, $0.1 billion and $1.6 billionfees categorized as of June 30, 2021, June 30, 2020 and December 31, 2020, respectively,incentive fees, which are above the hurdle rates or preferred returns and have beennot accounted as an equity method investment, are deferred to future periods when theuntil fees are probable to not be significantly reversed.
Prior to the adoption of the new revenue recognition guidance, incentive fees were recognized on an assumed liquidation basis. The following table presents AUM Not Currently Generating Performance Fees for funds that have invested capital for more than 24 months asmajority of June 30, 2021 and the corresponding appreciation required to reach the preferred return or high watermark in order to generate performance fees:
| | | | | | | | | | | | | | | | | | | | |
| Strategy / Fund | | Invested AUM Not Currently Generating Performance Fees | | Investment Period Active > 24 Months | | Appreciation Required to Achieve Performance Fees(1) |
| | (in millions) | | |
| Credit: | | | | | | |
| Corporate Credit | | $ | 2,373 | | | $ | 2,289 | | | 2% |
| Structured Credit | | 3,724 | | | 3,658 | | | 6% |
| Direct Origination | | 2,641 | | | 2,641 | | | 1% |
| | | | | | |
| Total Credit | | 8,738 | | | 8,588 | | | 4% |
| Private Equity: | | | | | | |
| | | | | | |
| | | | | | |
| Hybrid Capital | | 766 | | | 747 | | | 246% |
| Other PE | | 2,559 | | | 2,207 | | | 42% |
| Total Private Equity | | 3,325 | | | 2,954 | | | 93% |
| Real Assets: | | | | | | |
| Total Real Assets | | 599 | | | 354 | | | >250bps |
| Total | | $ | 12,662 | | | $ | 11,896 | | | |
(1)All investors in a given fund are considered in aggregate when calculating the appreciation required to achieve performance fees presented above. Appreciation required to achieveare comprised of performance fees may vary by individual investor. Funds with an investment period less than 24 months are “N/A”.
The components of Fee-Generating AUM by segment are presented below:
| | | | | | | | | | | | | | | | | | | | | | | |
| | As of June 30, 2021 |
| | Credit | | Private
Equity | | Real
Assets | | Total |
| | (in millions) |
| Fee-Generating AUM based on capital commitments | $ | 1,201 | | | $ | 25,168 | | | $ | 7,083 | | | $ | 33,452 | |
| Fee-Generating AUM based on invested capital | 3,225 | | | 13,285 | | | 2,424 | | | 18,934 | |
| Fee-Generating AUM based on gross/adjusted assets | 233,245 | | | 343 | | | 30,216 | | | 263,804 | |
| Fee-Generating AUM based on NAV | 34,468 | | | 745 | | | 2,157 | | | 37,370 | |
| Total Fee-Generating AUM | $ | 272,139 | | | $ | 39,541 | | (1) | $ | 41,880 | | | $ | 353,560 | |
(1)The weighted average remaining lifeAs of March 31, 2022, approximately 52% of the traditional private equity funds as of June 30, 2021 was 69 months.
| | | | | | | | | | | | | | | | | | | | | | | |
| | As of June 30, 2020 |
| | Credit | | Private
Equity | | Real
Assets | | Total |
| | (in millions) |
| Fee-Generating AUM based on capital commitments | $ | 2,559 | | | $ | 26,849 | | | $ | 5,063 | | | $ | 34,471 | |
| Fee-Generating AUM based on invested capital | 2,135 | | | 15,528 | | | 2,299 | | | 19,962 | |
| Fee-Generating AUM based on gross/adjusted assets | 223,902 | | | 992 | | | 23,059 | | | 247,953 | |
| Fee-Generating AUM based on NAV | 25,736 | | | 471 | | | 1,185 | | | 27,392 | |
| Total Fee-Generating AUM | $ | 254,332 | | | $ | 43,840 | | (1) | $ | 31,606 | | | $ | 329,778 | |
(1) The weighted average remaining lifevalue of the traditional private equity funds at June 30, 2020 was 71 months.
| | | | | | | | | | | | | | | | | | | | | | | |
| | As of December 31, 2020 |
| | Credit | | Private
Equity | | Real Assets | | Total |
| | (in millions) |
| Fee-Generating AUM based on capital commitments | $ | 922 | | | $ | 25,168 | | | $ | 6,580 | | | $ | 32,670 | |
| Fee-Generating AUM based on invested capital | 3,000 | | | 15,393 | | | 2,434 | | | 20,827 | |
| Fee-Generating AUM based on gross/adjusted assets | 238,202 | | | 771 | | | 26,820 | | | 265,793 | |
| Fee-Generating AUM based on NAV | 27,534 | | | 494 | | | 1,356 | | | 29,384 | |
| Total Fee-Generating AUM | $ | 269,658 | | | $ | 41,826 | | (1) | $ | 37,190 | | | $ | 348,674 | |
(1) The weighted average remaining life of the traditional private equity funds as of December 31, 2020 was 73 months.
The following presents the total AUM and Fee-Generating AUM amounts for our credit segment by category type (in billions):
| | |
Note: Totals may not add due to rounding |
Apollo, through its consolidated subsidiary, ISG, provides asset management services to Athene with respect to assets in the Athene Accounts, including asset allocation services, direct asset management services, asset and liability matching management, mergers and acquisitions, asset diligence, hedging and other asset management services and receives management fees for providing these services. The Company, through ISG, also provides sub-allocation services with respect to a portion of
the assets in the Athene Accounts. See note 14 to the condensed consolidated financial statements for more details regarding the fee rates of the investment management and sub-allocation fee arrangements with respect to the assets in the Athene Accounts.
The following table presents the aggregate Athene Sub-Allocated Total AUM by asset class (in billions):
| | |
Note: Totals may not add due to rounding |
Other Assets include cash, treasuries, equities and alternatives. Total AUM includes $44.6 billion, $39.5 billion and $41.3 billion of gross assets related to Athene Co-Invest Reinsurance Affiliate 1A Ltd. and $2.1 billion, $2.4 billion and $2.5 billion of unfunded commitments related to Apollo/Athene Dedicated Investment Program (“ADIP”) as of June 30, 2021, June 30, 2020 and December 31, 2020 respectively.
Apollo, through ISGI, provides investment advisory services with respect to certain assets in certain portfolio companies of Apollo funds and sub-advises the Athora Accounts and broadly refers to “Athora Sub-Advised” assets as those assets in the Athora Accounts which the Company explicitly sub-advises as well as those assets in the Athora Accounts which are invested directly in funds and investment vehicles Apollo manages. The Company refers to the portion of the Athora AUM that is not Athora Sub-Advised AUM as “Athora Non-Sub Advised” AUM. See note 14 to the condensed consolidated financial statements for more details regarding the fee arrangements with respect to the assets in the Athora Accounts.
The following table presents Athora Sub-Advised and Athora Non-Sub-Advised AUM (in billions):
| | |
Note: Totals may not add due to rounding |
The following presents total AUM and Fee-Generating AUM amounts for our private equity segment by category type (in billions):
| | |
Note: Totals may not add due to rounding |
The following presents total AUM and Fee-Generating AUM amounts for our real assets segment by category type (in billions):
| | |
Note: Totals may not add due to rounding |
The following tables summarize changes in total AUM for each of Apollo’s three segments:
| | | | | | | | | | | | | | | | | | | | | | | | | | | | | | | | | | | | | | | | | | | | | | | |
| For the Three Months Ended June 30, |
| | 2021 | | 2020 |
| Credit | | Private Equity | | Real Assets | | Total | | Credit | | Private Equity | | Real Assets | | Total |
| | |
Change in Total AUM(1): | | | | | | | | | | | | | | | |
| Beginning of Period | $ | 323,261 | | | $ | 89,463 | | | $ | 48,414 | | | $ | 461,138 | | | $ | 209,745 | | | $ | 67,669 | | | $ | 38,097 | | | $ | 315,511 | |
| Inflows | 6,453 | | | 2,371 | | | 3,613 | | | 12,437 | | | 85,347 | | | 1,768 | | | 2,122 | | | 89,237 | |
Outflows(2) | (3,635) | | | (652) | | | — | | | (4,287) | | | (5,788) | | | (51) | | | (283) | | | (6,122) | |
| Net Flows | 2,818 | | | 1,719 | | | 3,613 | | | 8,150 | | | 79,559 | | | 1,717 | | | 1,839 | | | 83,115 | |
| Realizations | (1,466) | | | (7,334) | | | (232) | | | (9,032) | | | (653) | | | (536) | | | (224) | | | (1,413) | |
Market Activity(3) | 6,415 | | | 4,621 | | | 483 | | | 11,519 | | | 11,803 | | | 4,451 | | | 139 | | | 16,393 | |
| End of Period | $ | 331,028 | | | $ | 88,469 | | | $ | 52,278 | | | $ | 471,775 | | | $ | 300,454 | | | $ | 73,301 | | | $ | 39,851 | | | $ | 413,606 | |
(1)At the individual segment level, inflows include new subscriptions, commitments, capital raised, other increases in available capital, purchases, acquisitions, and portfolio company appreciation. Outflows represent redemptions, other decreases in available capital and portfolio company depreciation. Realizations represent fund distributions of realized proceeds. Market activity represents gains (losses), the impact of foreign exchange rate fluctuations and other income.
(2)Outflows for Total AUM include redemptions of $0.5 billion and $0.7 billion during the three months ended June 30, 2021 and 2020, respectively.
(3)Includes foreign exchange impacts of $751.9 million, $28.3 million and $44.2 million for credit, private equity and real assets, respectively, during the three months ended June 30, 2021 and foreign exchange impacts of $522.7 million, $42.8 million and $52.4 million for credit, private equity and real assets, respectively, during the three months ended June 30, 2020.
| | | | | | | | | | | | | | | | | | | | | | | | | | | | | | | | | | | | | | | | | | | | | | | |
| For the Six Months Ended June 30, |
| | 2021 | | 2020 |
| Credit | | Private Equity | | Real Assets | | Total | | Credit | | Private Equity | | Real Assets | | Total |
| | (in millions) |
Change in Total AUM(1): | | | | | | | | | | | | | | | |
| Beginning of Period | $ | 328,560 | | | $ | 80,716 | | | $ | 46,210 | | | $ | 455,486 | | | $ | 215,530 | | | $ | 76,788 | | | $ | 38,787 | | | $ | 331,105 | |
| Inflows | 14,812 | | | 4,825 | | | 6,178 | | | 25,815 | | | 91,616 | | | 2,249 | | | 2,629 | | | 96,494 | |
Outflows(2) | (9,526) | | | (714) | | | — | | | (10,240) | | | (6,626) | | | (61) | | | (517) | | | (7,204) | |
| Net Flows | 5,286 | | | 4,111 | | | 6,178 | | | 15,575 | | | 84,990 | | | 2,188 | | | 2,112 | | | 89,290 | |
| Realizations | (2,381) | | | (9,697) | | | (666) | | | (12,744) | | | (1,165) | | | (1,704) | | | (590) | | | (3,459) | |
Market Activity(3) | (437) | | | 13,339 | | | 556 | | | 13,458 | | | 1,099 | | | (3,971) | | | (458) | | | (3,330) | |
| End of Period | $ | 331,028 | | | $ | 88,469 | | | $ | 52,278 | | | $ | 471,775 | | | $ | 300,454 | | | $ | 73,301 | | | $ | 39,851 | | | $ | 413,606 | |
(1)At the individual segment level, inflows include new subscriptions, commitments, capital raised, other increases in available capital, purchases, acquisitions and portfolio company appreciation. Outflows represent redemptions, other decreases in available capital and portfolio company depreciation. Realizations represent fund distributions of realized proceeds. Market activity represents gains (losses), the impact of foreign exchange rate fluctuations and other income.
(2)Outflows for Total AUM include redemptions of $1.3 billion and $1.2 billion during the six months ended June 30, 2021 and 2020, respectively.
(3)Includes foreign exchange impacts of $(2.4) billion, $(1.0) million and $(92.1) million for credit, private equity and real assets, respectively, during the six months ended June 30, 2021, and foreign exchange impacts of $(457.0) million, $30.6 million and $(39.2) million for credit, private equity and real assets, respectively, during the six months ended June 30, 2020.
Three Months Ended June 30, 2021
Total AUM was $471.8 billion at June 30, 2021, an increase of $10.6 billion, or 2.3%, compared to $461.1 billion at March 31, 2021. The net increase was primarily due to appreciation in our credit and real assets segments. More specifically, the net increase was due to:
•Market activity of $11.5 billion, primarily related to $6.4 billion of appreciation in the funds we manage in the credit segment, including $5.2 billion for Athene, and $4.6 billion of appreciation in the private equity segment driven by $1.4 billion and $0.8 billion from Fund VIII and Fund IX, respectively;
•Net flows of $8.2 billion primarily related to:
•a $3.6 billion increase related to funds we manage in the real assets segment primarily consisting of $2.1 billion of net segment transfers, $1.0 billion of leverage and $0.5 billion of subscriptions across the real estate and infrastructure funds we manage;
•a $2.8 billion increase related to funds we manage in the credit segment primarily consisting of (i) $3.4 billion of subscriptions driven by the corporate credit and structured credit funds we manage and (ii) a $1.4 billion increase in AUM in the advisory and other category due to the growth of our insurance clients; offsetting these increases were $(1.5) billion of net segment transfers, primarily into real assets, and $(0.5) billion of redemptions; and
•a $1.7 billion increase related to funds we manage in the private equity segment primarily consisting of $1.5 billion of subscriptions across the hybrid capital and traditional private equity funds we manage.
•Realizations of $(9.0) billion primarily related to:
•$(7.3) billion related to funds we manage in the private equity segment primarily consisting of distributions of $5.8 billion and $0.9 billion from the traditional private equity and hybrid capital funds we manage, respectively; and
•$(1.5) billion related to funds we manage in the credit segment primarily consisting of distributions from the corporate credit and direct origination funds we manage.
Six Months Ended June 30, 2021
Total AUM was $471.8 billion at June 30, 2021, an increase of $16.3 billion, or 3.6%, compared to $455.5 billion at December 31, 2020. The net increase was primarily due to appreciation in the private equity segment and fundraising across the platform. More specifically, the net increase was due to:
•Net flows of $15.6 billion primarily related to:
•a $6.2 billion increase related to funds we manage in the real assets segment primarily consisting of $4.0 billion of net segment transfers, $1.5 billion of leverage and $0.6 billion of subscriptions across the real estate and infrastructure funds we manage;
•a $5.3 billion increase related to funds we manage in the credit segment primarily consisting of (i) $6.4 billion of subscriptions driven by the corporate credit and structured credit funds we manage and (ii) a $3.7 billion increase in AUM in the advisory and other category due to the growth of our insurance clients; offsetting these increases were $(4.2) billion of net segment transfers, primarily into real assets, and $1.2 billion of redemptions; and
•a $4.1 billion increase related to funds we manage in the private equity segment primarily consisting of $3.2 billion of subscriptions across the hybrid capital and traditional private equity funds we manage.
•Market activity of $13.5 billion, primarily related to $13.3 billion of appreciation in the private equity segment driven by $4.2 billion, $2.8 billion, $1.0 billion, $1.0 billion and $1.0 billion from Fund VIII, Fund IX, Tech Data co-invest, ADT co-invest and Fund VII, respectively.
•Realizations of $(12.7) billion primarily related to:
•$(9.7) billion related to funds we manage in the private equity segment primarily consisting of distributions of $7.8 billion and $1.0 billion from the traditional private equity and hybrid capital funds we manage, respectively; and
•$(2.4) billion related to funds we manage in the credit segment primarily consisting of distributions from the corporate credit and direct origination funds we manage.
The following tables summarize changes in Fee-Generating AUM for each of Apollo’s three segments:
| | | | | | | | | | | | | | | | | | | | | | | | | | | | | | | | | | | | | | | | | | | | | | | |
| For the Three Months Ended June 30, |
| | 2021 | | 2020 |
| Credit | | Private Equity | | Real Assets | | Total | | Credit | | Private Equity | | Real Assets | | Total |
| | |
Change in Fee-Generating AUM(1): | | | | | | | | | | | | | | |
| Beginning of Period | $ | 263,330 | | | $ | 42,614 | | | $ | 39,302 | | | $ | 345,246 | | | $ | 168,262 | | | $ | 43,976 | | | $ | 29,412 | | | $ | 241,650 | |
| Inflows | 7,561 | | | 167 | | | 2,618 | | | 10,346 | | | 80,745 | | | 829 | | | 2,535 | | | 84,109 | |
Outflows(2) | (3,889) | | | (1,194) | | | (47) | | | (5,130) | | | (5,664) | | | (977) | | | (278) | | | (6,919) | |
| Net Flows | 3,672 | | | (1,027) | | | 2,571 | | | 5,216 | | | 75,081 | | | (148) | | | 2,257 | | | 77,190 | |
| Realizations | (869) | | | (2,020) | | | (155) | | | (3,044) | | | (75) | | | (203) | | | (134) | | | (412) | |
Market Activity(3) | 6,006 | | | (26) | | | 162 | | | 6,142 | | | 11,064 | | | 215 | | | 71 | | | 11,350 | |
| End of Period | $ | 272,139 | | | $ | 39,541 | | | $ | 41,880 | | | $ | 353,560 | | | $ | 254,332 | | | $ | 43,840 | | | $ | 31,606 | | | $ | 329,778 | |
(1)At the individual segment level, inflows include new subscriptions, commitments, capital raised, other increases in available capital, purchases, acquisitions and portfolio company appreciation. Outflows represent redemptions, other decreases in available capital and portfolio company depreciation. Realizations represent fund distributions of realized proceeds. Market activity represents gains (losses), the impact of foreign exchange rate fluctuations and other income.
(2)Outflows for Fee-Generating AUM include redemptions of $0.5 billion and $0.7 billion during the three months ended June 30, 2021 and 2020, respectively.
(3)Includes foreign exchange impacts of $0.7 billion, $4.4 million and $37.6 million for credit, private equity and real assets, respectively, during the three months ended June 30, 2021, and foreign exchange impacts of $268.4 million, $2.4 million and $45.2 million for credit, private equity and real assets, respectively, during the three months ended June 30, 2020.
| | | | | | | | | | | | | | | | | | | | | | | | | | | | | | | | | | | | | | | | | | | | | | | |
| For the Six Months Ended June 30, |
| | 2021 | | 2020 |
| Credit | | Private Equity | | Real Assets | | Total | | Credit | | Private Equity | | Real Assets | | Total |
| | (in millions) |
Change in Fee-Generating AUM(1): | | | | | | | | | | | | | | |
| Beginning of Period | $ | 269,658 | | | $ | 41,826 | | | $ | 37,190 | | | $ | 348,674 | | | $ | 172,893 | | | $ | 43,826 | | | $ | 29,727 | | | $ | 246,446 | |
| Inflows | 13,536 | | | 1,203 | | | 4,973 | | | 19,712 | | | 88,256 | | | 1,445 | | | 2,726 | | | 92,427 | |
Outflows(2) | (8,887) | | | (1,383) | | | (146) | | | (10,416) | | | (7,006) | | | (1,022) | | | (677) | | | (8,705) | |
| Net Flows | 4,649 | | | (180) | | | 4,827 | | | 9,296 | | | 81,250 | | | 423 | | | 2,049 | | | 83,722 | |
| Realizations | (1,481) | | | (2,168) | | | (213) | | | (3,862) | | | (470) | | | (546) | | | (202) | | | (1,218) | |
Market Activity(3) | (687) | | | 63 | | | 76 | | | (548) | | | 659 | | | 137 | | | 32 | | | 828 | |
| End of Period | $ | 272,139 | | | $ | 39,541 | | | $ | 41,880 | | | $ | 353,560 | | | $ | 254,332 | | | $ | 43,840 | | | $ | 31,606 | | | $ | 329,778 | |
(1)At the individual segment level, inflows include new subscriptions, commitments, capital raised, other increases in available capital, purchases, acquisitions and portfolio company appreciation. Outflows represent redemptions, other decreases in available capital and portfolio company depreciation. Realizations represent fund distributions of realized proceeds. Market activity represents gains (losses), the impact of foreign exchange rate fluctuations and other income.
(2)Outflows for Fee-Generating AUM include redemptions of $1.2 billion and $1.1 billion during the six months ended June 30, 2021 and 2020, respectively.
(3)Includes foreign exchange impacts of $(2.0) billion, $2.5 million and $(100.2) million for credit, private equity and real assets, respectively, during the six months ended June 30, 2021, and foreign exchange impacts of $(378.5) million, $(12.9) million and $(29.6) million for credit, private equity and real assets, respectively, during the six months ended June 30, 2020.
Three Months Ended June 30, 2021
Total Fee-Generating AUM was $353.6 billion at June 30, 2021, an increase of $8.3 billion, or 2.4%, compared to $345.2 billion at March 31, 2021. The net increase was primarily due to market activity of $6.0 billion in the funds we manage in the credit segment, primarily related to the market activity of Athene. Additionally, net flows of $5.2 billion primarily related to:
•a $3.7 billion increase related to funds we manage in the credit segment primarily consisting of (i) $3.5 billion of fee-generating capital deployment, (ii) a $2.4 billion increase in AUM in the advisory and other category due to the growth of our insurance clients and (iii) $1.0 billion of subscriptions across the corporate credit funds we manage; offsetting these increases were (i) $(1.7) billion of net segment transfers, primarily into real assets, and (ii) $(1.2) billion of change in leverage; and
•a $2.6 billion increase related to funds we manage in the real assets segment primarily consisting of $1.5 billion of net segment transfers and $0.5 billion of fee-generating capital deployment.
Net flows were offset by realizations of $(3.0) billion primarily related to the traditional private equity funds we manage.
Six Months Ended June 30, 2021
Total Fee-Generating AUM was $353.6 billion at June 30, 2021, an increase of $4.9 billion, or 1.4%, compared to $348.7 billion at December 31, 2020. The net increase was primarily due to growth of our insurance clients. More specifically the net increase was due to:
•Net flows of $9.3 billion primarily related to:
•a $4.8 billion increase related to funds we manage in the real assets segment primarily consisting of $3.2 billion of net segment transfers and $1.0 billion of fee-generating capital deployment; and
•a $4.6 billion increase related to funds we manage in the credit segment primarily consisting of (i) a $6.8 billion increase in AUM in the advisory and other category due to the growth of our insurance clients, (ii) $3.9 billion of fee-generating capital deployment and (iii) $2.4 billion of subscriptions across the corporate credit and structured funds we manage; offsetting these increases were (i) $(3.9) billion of net segment transfers, primarily into real assets, (ii) $(2.1) billion of change in leverage and (iii) $(1.4) billion of fee-generating capital reduction.
•Net flows were offset by realizations of $(3.9) billion primarily related to the traditional private equity funds we manage.
Deployment, Drawdown Deployment and Uncalled Commitments
During the third quarter of 2020, the Company modified the definition of deployment to include net purchases, certain originations and net syndications to provide a more accurate representation of market activity across all the funds and accounts the Company manages. Prior period deployment figures have been recast to conform to this change in definition. The prior definition of deployment was limited to purchases in our commitment based funds, excluding certain funds in which permanent capital vehicles are the primary investor, and SIAs that have a defined maturity date, and has been renamed “drawdown deployment”.
Uncalled commitments, by contrast, represent unfunded capital commitments that certain of Apollo’s funds and SIAs have received from fund investors to fund future or current fund investments and expenses.
Deployment, drawdown deployment and uncalled commitments are indicative of the pace and magnitude of fund capital that is deployed or will be deployed, and which therefore could result in future revenues that include management fees, transaction fees and performance fees to the extent they are fee-generating. Deployment, drawdown deployment and uncalled commitments can also give rise to future costs that are related to the hiring of additional resources to manage and account for the additional capital that is deployed or will be deployed. Management uses deployment, drawdown deployment and uncalled commitments as key operating metrics since we believe the results are measures of our funds’ investment activities.
Deployment and Drawdown Deployment
The following presents deployment across all funds and drawdown deployment for funds and SIAs with a defined maturity date, by segment (in billions):
| | |
Note: Totals may not add due to rounding |
Uncalled Commitments
The following presents Apollo’s uncalled commitments by segment (in billions):
| | |
Note: Totals may not add due to rounding |
As of June 30, 2021 and December 31, 2020, Apollo had $47.6 billion and $46.8 billion of dry powder, respectively, which represents the amount of capital available for investment or reinvestment subject to the provisions of the applicable limited partnership agreements or other governing agreements of the funds, partnerships and accounts we manage. These amounts exclude uncalled commitments which can only be called for fund fees and expenses and commitments from permanent capital vehicles.
The Historical Investment Performance of Our Funds
Below we present information relating to the historical performance of our funds, including certain legacy Apollo funds that do not have a meaningful amount of unrealized investments, and in respect of which the general partner interest has not been contributed to us.
When considering the data presented below, you should note that the historical results of our funds are not indicative of the future results that you should expect from such funds, from any future funds we may raise or from your investment in our Class A shares.
An investment in our Class A shares is not an investment in any of the Apollo funds, and the assets and revenues of our funds are not directly available to us. The historical and potential future returns of the funds we manage are not directly linked to returns on our Class A shares. Therefore, you should not conclude that continued positive performance ofa gross basis was determined using market-based valuation methods (i.e., reliance on broker or listed exchange quotes) and the funds we manage will necessarily result in positive returns on an investment in our Class A shares. However, poor performance of the funds that we manage would cause a decline in our revenue from such funds,remaining 48% was determined primarily by comparable company and would therefore have a negative effect on our performance and in all likelihood the value of our Class A shares.
Moreover, the historical returns of our funds should not be considered indicative of the future results you should expect from such fundsindustry multiples or from any future funds we may raise. There can be no assurance that any Apollo fund will continue to achieve the same results in the future.
Finally, our private equity IRRs have historically varied greatly from fund to fund. For example, Fund VI generated a 12% gross IRR and a 9% net IRR since its inception through June 30, 2021, while Fund V generated a 61% gross IRR and a 44% net IRR since its inception through June 30, 2021. Accordingly, the IRR going forward for any current or future fund may vary considerably from the historical IRR generated by any particular fund, or for our private equity funds as a whole. Future returns will also be affected by the applicable risks, including risks of the industries and businesses in which a particular fund
invests.discounted cash flow models. See “Item 1A. Risk Factors—Risks Related to Our Businesses—The historical returns attributable toOur funds’ performance, and our performance, may be adversely affected by the financial performance of our funds’ portfolio companies and the industries in which our funds should not be considered as indicative of the future results of our funds or of our future results or of any returns expected on an investment in our Class A shares and our Preferred shares” and “Item 1A. Risk Factors—The COVID-19 pandemic has caused severe disruptions in the U.S. and global economy and is expected to continue to impact our business, financial condition and results of operations”invest” in the 20202021 Annual Report.Report for discussion regarding certain industry-specific risks that could affect the fair value of certain of the portfolio company investments of the funds we manage.
Investment RecordIn certain equity funds we manage, the Company does not earn performance fees until the investors in the fund have achieved cumulative investment returns on invested capital (including management fees and expenses) in excess of an 8% hurdle rate. Additionally, certain of our yield and hybrid funds have various performance fee rates and hurdle rates. Certain of our yield and hybrid funds allocate performance fees to the general partner in a similar manner as the equity funds. In certain of our equity, yield and hybrid funds, so long as the investors achieve their priority returns, there is a catch-up formula whereby the Company earns a priority return for a portion of the return until the Company’s performance fees equate to its incentive fee rate for that fund; thereafter, the Company participates in returns from the fund at the performance fee rate. Performance fees, categorized as performance allocations, are subject to reversal to the extent that the performance fees distributed exceed the amount due to the general partner based on a fund’s cumulative investment returns. The Company recognizes potential repayment of previously received performance fees as a general partner obligation representing all amounts previously distributed to the general partner that would need to be repaid to the Apollo funds if these funds were to be liquidated based on the current fair value of the underlying funds’ investments as of the reporting date. The actual general partner obligation, however, would not become payable or realized until the end of a fund’s life or as otherwise set forth in the respective limited partnership agreement of the fund.
The following table summarizes the investment record by segmentbelow presents an analysis of Apollo’s significant commitment-based funds that have a defined maturity date in which investors make a commitment to provide capital at the formation of such funds(i) performance fees receivable on an unconsolidated basis and deliver capital when called as investment opportunities become available. The funds included in the investment record table below have greater than $500 million of AUM and/or form part of a flagship series of funds.(ii) realized and unrealized performance fees:
All amounts are as of June 30, 2021, unless otherwise noted:
| | | | | | | | | | | | | | | | | | | | | | | | | | | | | | | | | | | | | | | | | | | | | | | | | | | | | | | | | | | | | | |
| ($ in millions) | Vintage
Year | | Total AUM | | Committed
Capital | | Total Invested Capital | | Realized Value | | Remaining Cost | | Unrealized Value | | Total Value | | Gross
IRR | | Net
IRR | |
| Private Equity: | | | | | | | | | | | | | | | | | | | | |
| Fund IX | 2018 | | $ | 28,053 | | | $ | 24,729 | | | $ | 9,362 | | | $ | 2,409 | | | $ | 8,271 | | | $ | 11,890 | | | $ | 14,299 | | | 49 | % | | 28 | % | |
| Fund VIII | 2013 | | 17,937 | | | 18,377 | | | 16,063 | | | 16,325 | | | 7,739 | | | 13,932 | | | 30,257 | | | 19 | | | 14 | | |
| Fund VII | 2008 | | 3,390 | | | 14,677 | | | 16,461 | | | 32,653 | | | 1,419 | | | 1,352 | | | 34,005 | | | 33 | | | 25 | | |
| Fund VI | 2006 | | 644 | | | 10,136 | | | 12,457 | | | 21,134 | | | 405 | | | 2 | | | 21,136 | | | 12 | | | 9 | | |
| Fund V | 2001 | | 260 | | | 3,742 | | | 5,192 | | | 12,721 | | | 120 | | | 2 | | | 12,723 | | | 61 | | | 44 | | |
Fund I, II, III, IV & MIA(2) | Various | | 11 | | | 7,320 | | | 8,753 | | | 17,400 | | | — | | | — | | | 17,400 | | | 39 | | | 26 | | |
Traditional Private Equity Funds(3) | | | $ | 50,295 | | | $ | 78,981 | | | $ | 68,288 | | | $ | 102,642 | | | $ | 17,954 | | | $ | 27,178 | | | $ | 129,820 | | | 39 | | | 25 | | |
| ANRP III | 2020 | | 1,469 | | | 1,400 | | | 258 | | | 37 | | | 258 | | | 357 | | | 394 | | | NM1 | | NM1 | |
| ANRP II | 2016 | | 2,387 | | | 3,454 | | | 2,719 | | | 2,361 | | | 1,534 | | | 1,646 | | | 4,007 | | | 20 | | | 12 | | |
| ANRP I | 2012 | | 366 | | | 1,323 | | | 1,149 | | | 1,074 | | | 586 | | | 131 | | | 1,205 | | | 2 | | | (2) | | |
| AION | 2013 | | 547 | | | 826 | | | 700 | | | 371 | | | 400 | | | 423 | | | 794 | | | 5 | | | (1) | | |
| HVF I | 2019 | | 3,596 | | | 3,238 | | | 2,929 | | | 1,169 | | | 2,179 | | | 2,589 | | | 3,758 | | | 29 | | | 23 | | |
| | | | | | | | | | | | | | | | | | | | |
| | | | | | | | | | | | | | | | | | | | |
| | | | | | | | | | | | | | | | | | | | |
| Total Private Equity | | | $ | 58,660 | | | $ | 89,222 | | | $ | 76,043 | | | $ | 107,654 | | | $ | 22,911 | | | $ | 32,324 | | | $ | 139,978 | | | | | | |
| Credit: | | | | | | | | | | | | | | | | | | | | |
| | | | | | | | | | | | | | | | | | | | |
| FCI III | 2017 | | $ | 2,411 | | | $ | 1,906 | | | $ | 2,797 | | | $ | 1,741 | | | $ | 1,893 | | | $ | 1,916 | | | $ | 3,657 | | | 19 | % | | 15 | % | |
| FCI II | 2013 | | 2,211 | | | 1,555 | | | 3,145 | | | 2,291 | | | 1,728 | | | 1,540 | | | 3,831 | | | 7 | | | 5 | | |
| FCI I | 2012 | | — | | | 559 | | | 1,516 | | | 1,975 | | | — | | | — | | | 1,975 | | | 12 | | | 8 | | |
SCRF IV (6) | 2017 | | 2,544 | | | 2,502 | | | 5,145 | | | 4,049 | | | 1,418 | | | 1,608 | | | 5,657 | | | 8 | | | 7 | | |
| SCRF III | 2015 | | — | | | 1,238 | | | 2,110 | | | 2,428 | | | — | | | — | | | 2,428 | | | 18 | | | 14 | | |
| SCRF II | 2012 | | — | | | 104 | | | 467 | | | 528 | | | — | | | — | | | 528 | | | 15 | | | 12 | | |
| SCRF I | 2008 | | — | | | 118 | | | 240 | | | 357 | | | — | | | — | | | 357 | | | 33 | | | 26 | | |
| Accord IV | 2020 | | 2,379 | | | 2,337 | | | 784 | | | 395 | | | 432 | | | 411 | | | 806 | | | NM1 | | NM1 | |
Accord IIIB(7) | 2020 | | 1,110 | | | 1,758 | | | 691 | | | 737 | | | — | | | — | | | 737 | | | 24 | | | 19 | | |
Accord III(7) | 2019 | | 461 | | | 886 | | | 2,358 | | | 2,454 | | | — | | | — | | | 2,454 | | | 23 | | | 18 | | |
Accord II(7) | 2018 | | — | | | 781 | | | 801 | | | 821 | | | — | | | — | | | 821 | | | 16 | | | 12 | | |
Accord I(7) | 2017 | | — | | | 308 | | | 111 | | | 113 | | | — | | | — | | | 113 | | | 10 | | | 5 | | |
| Total Credit | | | $ | 11,116 | | | $ | 14,052 | | | $ | 20,165 | | | $ | 17,889 | | | $ | 5,471 | | | $ | 5,475 | | | $ | 23,364 | | | | | | |
| Real Assets: | | | | | | | | | | | | | | | | | | | | |
| European Principal Finance Funds | | | | | | | | | | | | | | | | | | | | |
EPF III(4) | 2017 | | $ | 5,096 | | | $ | 4,594 | | | $ | 3,803 | | | $ | 2,009 | | | $ | 2,223 | | | $ | 3,089 | | | $ | 5,098 | | | 20 | % | | 10 | % | |
EPF II(4) | 2012 | | 1,015 | | | 3,497 | | | 3,635 | | | 4,632 | | | 579 | | | 339 | | | 4,971 | | | 13 | | | 8 | | |
EPF I(4) | 2007 | | 247 | | | 1,536 | | | 2,018 | | | 3,395 | | | — | | | 2 | | | 3,397 | | | 23 | | | 17 | | |
U.S. RE Fund III(5) | 2021 | | 832 | | | 835 | | | 231 | | | 3 | | | 229 | | | 242 | | | 245 | | | NM1 | | NM1 | |
U.S. RE Fund II(5) | 2016 | | 1,179 | | | 1,262 | | | 990 | | | 569 | | | 722 | | | 825 | | | 1,394 | | | 14 | | | 11 | | |
U.S. RE Fund I(5) | 2012 | | 184 | | | 657 | | | 641 | | | 829 | | | 134 | | | 100 | | | 929 | | | 12 | | | 9 | | |
Asia RE Fund II(5)(8) | N/A | | 939 | | | 936 | | | 335 | | | 20 | | | 315 | | | 324 | | | 344 | | | NM1 | | NM1 | |
Asia RE Fund I(5) | 2017 | | 724 | | | 719 | | | 449 | | | 213 | | | 292 | | | 434 | | | 647 | | | 17 | | | 13 | | |
Apollo Infrastructure Opportunity Fund II(8) | N/A | | 1,343 | | | 1,322 | | | 216 | | | — | | | 216 | | | 257 | | | 257 | | | NM1 | | NM1 | |
| Apollo Infrastructure Opportunity Fund I | 2018 | | 948 | | | 897 | | | 802 | | | 860 | | | 298 | | | 342 | | | 1,202 | | | 26 | | | 20 | | |
| Total Real Assets | | | $ | 12,507 | | | $ | 16,255 | | | $ | 13,120 | | | $ | 12,530 | | | $ | 5,008 | | | $ | 5,954 | | | $ | 18,484 | | | | | | |
| | | | | | | | | | | | | | | | | | | | | | | | | | | | | | | | | | | | | | | | | | |
| As of March 31, | | | | | | | | Performance Fees for the Three Months Ended
March 31, 2022 | | | | |
| | 2022 | | | | | | |
| | Performance Fees Receivable on an Unconsolidated Basis | | | | | | | | Unrealized | | Realized | | Total | | | | | | | | | | | | |
| | (in thousands) |
| AIOF I and II | $ | 15,232 | | | | | | | | | | $ | (795) | | | $ | 5,043 | | | $ | 4,248 | | | | | | | | | | | | | |
ANRP I, II and III(1)(2) | 90,883 | | | | | | | | | | 991 | | | 13 | | | 1,004 | | | | | | | | | | | | | |
| EPF Funds | 135,855 | | | | | | | | | | 494 | | | 8,618 | | | 9,112 | | | | | | | | | | | | | |
| FCI Funds | 132,201 | | | | | | | | | | (7,084) | | | — | | | (7,084) | | | | | | | | | | | | | |
| Fund IX | 1,176,017 | | | | | | | | | | 405,183 | | | 54,018 | | | 459,201 | | | | | | | | | | | | | |
| Fund VIII | 653,111 | | | | | | | | | | (73,110) | | | — | | | (73,110) | | | | | | | | | | | | | |
Fund VII(1)(2) | 82,457 | | | | | | | | | | (18,373) | | | 23,543 | | | 5,170 | | | | | | | | | | | | | |
| Fund VI | 16,145 | | | | | | | | | | (141) | | | 27 | | | (114) | | | | | | | | | | | | | |
Fund IV and V(1) | — | | | | | | | | | | (223) | | | — | | | (223) | | | | | | | | | | | | | |
| Hybrid Value Fund | 121,969 | | | | | | | | | | 15,887 | | | 14,588 | | | 30,475 | | | | | | | | | | | | | |
Real Estate Equity(1) | 68,137 | | | | | | | | | | 24,588 | | | 2,859 | | | 27,447 | | | | | | | | | | | | | |
| Corporate Credit | 7,911 | | | | | | | | | | 1,171 | | | 4,386 | | | 5,557 | | | | | | | | | | | | | |
| Structured Finance and ABS | 73,924 | | | | | | | | | | 3,196 | | | 5,147 | | | 8,343 | | | | | | | | | | | | | |
| Direct Origination | 116,781 | | | | | | | | | | 9,517 | | | 9,156 | | | 18,673 | | | | | | | | | | | | | |
Other(1)(3) | 408,357 | | | | | | | | | | 81,468 | | | 14,017 | | | 95,485 | | | | | | | | | | | | | |
| Total | $ | 3,098,980 | | | | | | | | | | $ | 442,769 | | | $ | 141,415 | | | $ | 584,184 | | | | | | | | | | | | | |
Total, net of profit sharing payable(4)/expense | 1,602,325 | | | | | | | | | | 252,923 | | | (3,518) | | | 249,405 | | | | | | | | | | | | | |
(1)Data has not been presentedAs of March 31, 2022, certain funds had $80.2 million in general partner obligations to return previously distributed performance fees. The fair value gain on investments and income at the fund level needed to reverse the general partner obligations was $1.3 billion, as the fund’s effective date is less than 24 months prior to the period indicated and such information was deemed not meaningful.of March 31, 2022.
(2)The general partnersAs of March 31, 2022, the remaining investments and managersescrow cash of Funds I,ANRP II was valued at 100% of the fund’s unreturned capital, which was below the required escrow ratio of 115%. As a result, the fund is required to place in escrow current and MIA, as well asfuture performance fee distributions to the general partner until the specified return ratio of Fund III, were excluded assets115% is met (at the time of a future distribution) or upon liquidation. As of March 31, 2022, ANRP II had $60.8 million of gross performance fees, or $38.7 million net of profit sharing, in connection withescrow. With respect to ANRP II, realized performance fees currently distributed to the 2007 Reorganization. As a result, Apollo didgeneral partner are limited to potential tax distributions and interest on escrow balances per the fund’s partnership agreements. Performance fees receivable as of March 31, 2022 and realized performance fees for the three months ended March 31, 2022 include interest earned on escrow balances that is not receive the economics associated with these entities. The investment performance of these funds, combined with Fund IV, is presentedsubject to illustrate fund performance associated with Apollo’s Co-Founders and other investment professionals.contingent repayment.
(3)Total IRR is calculated based on total cash flows for all funds presented.Other includes certain SIAs.
(4)FundsThere was a corresponding profit sharing payable of $1.5 billion as of March 31, 2022, including profit sharing payable related to amounts in escrow and contingent consideration obligations of $110.5 million.
The general partners of certain of the funds we manage accrue performance fees, categorized as performance allocations, when the fair value of investments exceeds the cost basis of the individual investors’ investments in the fund, including any allocable share of expenses incurred in connection with such investments, which we refer to as “high water marks.” These high water marks are applied on an individual investor basis. Certain funds we manage have investors with various high water marks, the achievement of which is subject to market conditions and investment performance.
Performance fees from certain funds we manage are subject to contingent repayment by the general partner in the event of future losses to the extent that the cumulative performance fees distributed from inception to date exceeds the amount computed as due to the general partner at the final distribution. These general partner obligations, if applicable, are included in due to related parties on the condensed consolidated statements of financial condition.
The following table summarizes our performance fees since inception for our combined segments through March 31, 2022:
| | | | | | | | | | | | | | | | | | | | | | | | | | | | | |
| Performance Fees Since Inception(1) |
| | Undistributed by Fund and Recognized | | Distributed by Fund and Recognized(2) | | Total Undistributed and Distributed by Fund and Recognized(3) | | General Partner Obligation(3) | | Maximum Performance Fees Subject to Potential Reversal(4) |
| | (in millions) |
| AIOF I and II | $ | 15.2 | | | $ | 36.6 | | | $ | 51.8 | | | $ | — | | | $ | 36.9 | |
| ANRP I, II and III | 90.9 | | | 156.6 | | | 247.5 | | | 12.0 | | | 113.6 | |
| EPF Funds | 135.9 | | | 455.7 | | | 591.6 | | | 26.2 | | | 326.1 | |
| FCI Funds | 132.2 | | | 24.2 | | | 156.4 | | | — | | | 132.2 | |
| Fund IX | 1,176.0 | | | 440.6 | | | 1,616.6 | | | — | | | 1,440.2 | |
| Fund VIII | 653.1 | | | 1,638.8 | | | 2,291.9 | | | — | | | 1,693.2 | |
| Fund VII | 82.5 | | | 3,181.6 | | | 3,264.1 | | | — | | | 27.1 | |
| Fund VI | 16.1 | | | 1,663.9 | | | 1,680.0 | | | — | | | 0.3 | |
| Fund IV and V | — | | | 2,053.1 | | | 2,053.1 | | | 31.9 | | | 0.4 | |
| Hybrid Value Fund | 122.0 | | | 99.7 | | | 221.7 | | | — | | | 168.3 | |
| Real Estate Equity | 68.1 | | | 57.8 | | | 125.9 | | | — | | | 77.0 | |
| Corporate Credit | 7.9 | | | 925.7 | | | 933.6 | | | — | | | 7.8 | |
| Structured Finance and ABS | 73.9 | | | 52.1 | | | 126.0 | | | — | | | 68.6 | |
| Direct Origination | 116.8 | | | 62.4 | | | 179.2 | | | — | | | 107.6 | |
Other(5) | 408.4 | | | 1,610.8 | | | 2,019.2 | | | 10.1 | | | 558.7 | |
| Total | $ | 3,099.0 | | | $ | 12,459.6 | | | $ | 15,558.6 | | | $ | 80.2 | | | $ | 4,758.0 | |
(1)Certain funds are denominated in Euros and historical figures are translated into U.S. dollars at an exchange rate of €1.00 to $1.19$1.11 as of June 30, 2021.
(5)U.S. RE Fund I, U.S. RE Fund II, U.S. RE Fund III, Asia RE Fund I and Asia RE Fund II had $161 million, $791 million, $160 million, $376 million and $515 million of co-investment commitments as of June 30, 2021, respectively, whichMarch 31, 2022. Certain funds are included in the figures in the table. A co-invest entity within U.S. RE Fund I is denominated in pound sterling and historical figures are translated into U.S. dollars at an exchange rate of £1.00 to $1.38$1.31 as of June 30, 2021.March 31, 2022.
(6)(2)Remaining costAmounts in “Distributed by Fund and Recognized” for certain of our creditthe Citi Property Investors (“CPI”), Gulf Stream Asset Management, LLC (“Gulf Stream”), Stone Tower Capital LLC and its related companies (“Stone Tower”) funds may include physical cash called, invested or reserved for certain levered investments.
(7)Gross and Net IRR have beenSIAs are presented for these funds as they have a defined maturity dateactivity subsequent to the respective acquisition dates. Amounts exclude certain performance fees from business development companies and Redding Ridge Holdings LP (“Redding Ridge Holdings”), an affiliate of less than 24 months and have been liquidated.Redding Ridge.
(8)Vintage Year is not yet applicable as these funds have not had their final closings.
Private Equity
The following table summarizes the investment record for distressed investments made in our traditional private equity fund portfolios, since the Company’s inception. All amounts are as of June 30, 2021:
| | | | | | | | | | | | | | | | | |
| Total Invested Capital | | Total Value | | Gross IRR |
| | (in millions) | | |
| Distressed for Control | $ | 7,795 | | | $ | 18,880 | | | 29 | % |
| Non-Control Distressed | 5,758 | | | 9,945 | | | 71 | |
| Total | 13,553 | | | 28,825 | | | 49 | |
Corporate Carve-outs, Opportunistic Buyouts and Other Credit(1) | 54,735 | | | 100,995 | | | 21 | |
| Total | $ | 68,288 | | | $ | 129,820 | | | 39 | % |
(1)Other Credit is defined as investments in debt securities of issuers other than portfolio companies that are not considered to be distressed.
The following tables provide additional detail on the composition of the Fund IX, Fund VIII and Fund VII private equity portfolios based on investment strategy. Amounts for Fund I, II, III, IV, V and VI are included in the table above but not presented below as their remaining value is less than $100 million or the fund has been liquidated and such information was deemed not meaningful. All amounts are as of June 30, 2021:
Fund IX(1)
| | | | | | | | | | | |
| Total Invested Capital | | Total Value |
| | (in millions) |
| Corporate Carve-outs | $ | 1,018 | | | $ | 1,262 | |
| Opportunistic Buyouts | 8,144 | | | 11,555 | |
Distressed(2) | 200 | | | 1,482 | |
| Total | $ | 9,362 | | | $ | 14,299 | |
Fund VIII(1)
| | | | | | | | | | | |
| Total Invested Capital | | Total Value |
| | (in millions) |
| Corporate Carve-outs | $ | 2,704 | | | $ | 6,598 | |
| Opportunistic Buyouts | 12,792 | | | 22,905 | |
Distressed(2) | 567 | | | 754 | |
| Total | $ | 16,063 | | | $ | 30,257 | |
Fund VII(3)(1)Amounts were computed based on the fair value of fund investments on March 31, 2022. Performance fees have been allocated to and recognized by the general partner. Based on the amount allocated, a portion is subject to potential reversal or, to the extent applicable, has been reduced by the general partner obligation to return previously distributed performance fees at March 31, 2022. The actual determination and any required payment of any such general partner obligation would not take place until the final disposition of the fund’s investments based on contractual termination of the fund.
| | | | | | | | | | | |
| Total Invested Capital | | Total Value |
| | (in millions) |
| Corporate Carve-outs | $ | 2,539 | | | $ | 4,528 | |
| Opportunistic Buyouts | 4,338 | | | 10,834 | |
Distressed/Other Credit(2) | 9,584 | | | 18,643 | |
| Total | $ | 16,461 | | | $ | 34,005 | |
(1)(5)Committed capital less unfunded capital commitmentsOther includes certain SIAs.
Expenses
Compensation and Benefits
Our most significant expense is compensation and benefits expense. This consists of fixed salary, discretionary and non-discretionary bonuses, profit sharing expense associated with the performance fees earned and compensation expense associated with the vesting of non-cash equity-based awards.
Our compensation arrangements with certain partners and employees contain a significant performance-based incentive component. Therefore, as our net revenues increase, our compensation costs rise. Our compensation costs also reflect the increased investment in people as we expand geographically and create new funds.
In addition, certain professionals and selected other individuals have a profit sharing interest in the performance fees earned in order to better align their interests with our own and with those of the investors in these funds. Profit sharing expense is part of our compensation and benefits expense and is generally based upon a fixed percentage of performance fees. Profit sharing expense can reverse during periods when there is a decline in performance fees that were previously recognized. Profit sharing amounts are normally distributed to employees after the corresponding investment gains have been realized and generally before preferred returns are achieved for the investors. Therefore, changes in our unrealized performance fees have the same effect on our profit sharing expense. Profit sharing expense increases when unrealized performance fees increases. Realizations only impact profit sharing expense to the extent that the effects on investments have not been recognized previously. If losses on other investments within a fund are subsequently realized, the profit sharing amounts previously distributed are normally subject to a general partner obligation to return performance fees previously distributed back to the funds. This general partner obligation due to the funds would be realized only when the fund is liquidated, which generally occurs at the end of the fund’s term. However, indemnification obligations also exist for realized gains with respect to Fund IX,IV, Fund VIIIV and Fund VII were $10.9 billion, $16.1 billionVI, which, although our Former Managing Partners and $14.4 billion, respectively, which representsContributing Partners would remain personally liable, may indemnify our Former Managing Partners and Contributing Partners for 17.5% to 100% of the previously distributed profits regardless of the fund’s future performance. See note 14 to our condensed consolidated financial statements for further information regarding the Company’s indemnification liability.
Other Expenses
The balance of our other expenses includes interest, placement fees, and general, administrative and other operating expenses. Interest expense consists primarily of interest related to the 2024 Senior Notes, the 2026 Senior Notes, the 2029 Senior Notes, the 2030 Senior Notes, the 2048 Senior Notes and the 2050 Subordinated Notes as discussed in note 11 to our condensed consolidated financial statements. Placement fees are incurred in connection with our capital commitments fromraising activities. In cases where the limited partners to invest in such funds less capital that is available for investment or reinvestment subject to the provisions of the applicable limited partnership agreement or other governing agreements.
(2)The distressed investment strategy includes distressed for control, non-control distressedfunds are determined to be the customer in an arrangement, placement fees may be capitalized as a cost to acquire a customer contract, and amortized over the life of the customer contract. General, administrative and other credit. Other Credit is defined as investments in debt securities of issuers other than portfolio companies that are not considered to be distressed.
During the recovery and expansionary periods of 1994 through 2000 and late 2003 through the first half of 2007, our private equity funds invested or committed to invest approximately $13.7 billion primarily in traditional and corporate partner buyouts. During the recessionary periods of 1990 through 1993, 2001 through late 2003 and the recessionary and post recessionary periods (beginning the second half of 2007 through June 30, 2021), our private equity funds have invested $64.1 billion, of which $21.2 billion was in distressed buyouts and debt investments when the debt securities of quality companies traded at deep discounts to par value. Our average entry multiple for Fund VIII, VII and VI was 5.7x, 6.1x and 7.7x, respectively, as of June 30, 2021. Our average entry multiple for a private equity fund is the average of the total enterprise value over an applicable adjusted earnings before interest, taxes,expenses includes occupancy expense, depreciation and amortization, which may incorporate certain adjustmentsprofessional fees and costs related to travel, information technology and administration. Occupancy expense represents charges related to office leases and associated expenses, such as utilities and maintenance fees. Depreciation and amortization of fixed assets is normally calculated using the straight-line method over their estimated useful lives, ranging from two to sixteen years, taking into consideration any residual value. Leasehold improvements are amortized over the shorter of the useful life of the asset or the expected term of the lease. Intangible assets are amortized based on the investment team’s estimates and we believe capturesfuture cash flows over the true economicsexpected useful lives of our funds’ investments in portfolio companies. The average entry multiplethe assets.
Permanent Capital
The following table summarizes the investment record for our permanent capital vehicles by segment, excluding Athene-related and Athora-related assets managed or advised by ISG and ISGI:
| | | | | | | | | | | | | | | | | | | | | | | | | | | | | | | | | | | |
| | | | | Total Returns(1) |
| IPO Year(2) | | Total AUM | | For the Three Months Ended June 30, 2021 | | For the Six Months Ended June 30, 2021 | | For the Three Months Ended June 30, 2020 | | For the Six Months Ended June 30, 2020 |
| Credit: | | | (in millions) | | | | | | | | |
MidCap(3) | N/A | | $ | 8,883 | | | 2 | % | | 12 | % | | 4 | % | | — | % |
| AIF | 2013 | | 367 | | | 7 | | | 11 | | | 12 | % | | (14) | % |
| AFT | 2011 | | 394 | | | 8 | | | 13 | | | 9 | % | | (15) | % |
AINV/Other(4) | 2004 | | 4,559 | | | 2 | | | 35 | | | 49 | % | | (39) | % |
| Real Assets: | | | | | | | | | | | |
| ARI | 2009 | | 7,954 | | | 17 | % | | 50 | % | | 37 | % | | (41) | % |
| Total | | | $ | 22,157 | | | | | | | | | |
(1)Net Gains (Losses) from Investment ActivitiesTotal returns
Net gains (losses) from investment activities include both realized gains and losses and the change in unrealized gains and losses in our investment portfolio between the opening reporting date and the closing reporting date. Net unrealized gains (losses) are a result of changes in the fair value of unrealized investments and reversal of unrealized gains (losses) due to dispositions of investments during the reporting period. Significant judgment and estimation goes into the assumptions that drive these models and the actual values realized with respect to investments could be materially different from values obtained based on the use of those models. The valuation methodologies applied impact the reported value of investment company holdings and their underlying portfolios in our condensed consolidated financial statements.
Net Gains (Losses) from Investment Activities of Consolidated Variable Interest Entities
Changes in the fair value of the consolidated VIEs’ assets and liabilities and related interest, dividend and other income and expenses subsequent to consolidation are presented within net gains (losses) from investment activities of consolidated variable interest entities and are attributable to Non-Controlling Interests in the condensed consolidated statements of operations.
Other Income (Losses), Net
Other income (losses), net includes gains (losses) arising from the remeasurement of foreign currency denominated assets and liabilities, remeasurement of the tax receivable agreement liability and other miscellaneous non-operating income and expenses.
Income Taxes
Significant judgment is required in determining the provision for income taxes and in evaluating income tax positions, including evaluating uncertainties. We recognize the income tax benefits of uncertain tax positions only where the position is “more likely than not” to be sustained upon examination, including resolution of any related appeals or litigation, based on the technical merits of the positions. The tax benefit is measured as the largest amount of benefit that has a greater than 50% likelihood of being realized upon ultimate settlement. If a tax position is not considered more likely than not to be sustained, then no benefits of the position are recognized. The Company’s income tax positions are reviewed and evaluated quarterly to determine whether or not we have uncertain tax positions that require financial statement recognition or de-recognition.
Deferred tax assets and liabilities are recognized for the expected future tax consequences, using currently enacted tax rates, of differences between the carrying amount of assets and liabilities and their respective tax basis. The effect on deferred tax assets and liabilities of a change in closing trading prices duringtax rates is recognized in income in the respective periods presented taking into account dividendsperiod when the change is enacted. Deferred tax assets are reduced by a valuation allowance when it is more likely than not that some portion or all of the deferred tax assets will not be realized.
Non-Controlling Interests
For entities that are consolidated, but not 100% owned, a portion of the income or loss and distributions, if any, as if they were reinvested without regardcorresponding equity is allocated to commission.
(2)An initial public offering (“IPO”) year representsowners other than Apollo. The aggregate of the year in which the vehicle commenced trading on a national securities exchange.
(3)MidCapincome or loss and corresponding equity that is not a publicly traded vehicle and therefore IPO yearowned by the Company is not applicable. The returns presented are a gross return based on NAV. The net returns based on NAV were 1% and 1% forincluded in Non-Controlling Interests in the three months ended June 30, 2021 and June 30, 2020, respectively, and 9% and (2)% for the six months ended June 30, 2021 and June 30, 2020, respectively.
(4)All amounts are ascondensed consolidated financial statements. As of March 31, 2021 except for total returns. Refer2022, the Non-Controlling Interests relates to www.apolloic.com for the most recent financial information on AINV. Included within total AUM of AINV/Other is $1.7 billion of AUM related to a non-traded business development company from which42.6% ownership interest in the Apollo earns investment-related service fees, but for which Apollo does not provide management or advisory services. Total returns exclude performance related to this AUM.
SIAs
Operating Group held directly by AGM. As of June 30,December 31, 2021, Non-Controlling Interests include the 39.8% ownership interest in the Apollo managed approximately $30.7 billionOperating Group held by the Former Managing Partners and Contributing Partners through their limited partner interests in Holdings. Additionally, as of total AUMDecember 31, 2021, Athene held a 6.7% Non-Controlling Interest in SIAs, whichthe Apollo Operating Group as a result of the Transaction Agreement. Non-Controlling Interests also include capital deployed fromlimited partner interests in certain SIAs across Apollo’s credit, private equityconsolidated funds and real assets funds.VIEs.
Results of Operations
Below is a discussion of our condensed consolidated results of operations for the three months ended March 31, 2022 and 2021. For additional analysis of the factors that affected our results at the segment level, see “—Segment Analysis” below:
| | | | | | | | | | | | | | | | | | | | | | | |
| | For the Three Months Ended March 31, | | Total
Change | | Percentage
Change |
| | 2022 | | 2021 | |
| (in thousands) | | |
| Revenues: | | | | | | | |
| Management fees | $ | 522,936 | | | $ | 457,185 | | | $ | 65,751 | | | 14.4% |
| Advisory and transaction fees, net | 65,786 | | | 56,348 | | | 9,438 | | | 16.7 |
| Investment income | 702,315 | | | 1,777,313 | | | (1,074,998) | | | (60.5) |
| Incentive fees | 5,850 | | | 3,854 | | | 1,996 | | | 51.8 |
| Total Revenues | 1,296,887 | | | 2,294,700 | | | (997,813) | | | (43.5) |
| Expenses: | | | | | | | |
| Compensation and benefits: | | | | | | | |
| Salary, bonus and benefits | 218,254 | | | 174,630 | | | 43,624 | | | 25.0 |
| Equity-based compensation | 156,288 | | | 56,448 | | | 99,840 | | | 176.9 |
| Profit sharing expense | 359,562 | | | 655,480 | | | (295,918) | | | (45.1) |
| Total compensation and benefits | 734,105 | | | 886,558 | | | (152,453) | | | (17.2) |
| Interest expense | 32,993 | | | 34,799 | | | (1,806) | | | (5.2) |
| General, administrative and other | 140,363 | | | 100,387 | | | 39,976 | | | 39.8 |
| Total Expenses | 907,461 | | | 1,021,744 | | | (114,283) | | | (11.2) |
| Other Income: | | | | | | | |
| Net gains from investment activities | 771,262 | | | 353,151 | | | 418,111 | | | 118.4 |
| Net gains from investment activities of consolidated variable interest entities | 279,455 | | | 112,594 | | | 166,861 | | | 148.2 |
| Interest income | 2,836 | | | 798 | | | 2,038 | | | 255.4 |
| Other income (loss), net | (25,183) | | | (17,750) | | | (7,433) | | | 41.9 |
| Total Other Income | 1,028,370 | | | 448,793 | | | 579,577 | | | 129.1 |
| Income before income tax provision | 1,417,796 | | | 1,721,749 | | | (303,953) | | | (17.7) |
| Income tax provision | (134,174) | | | (203,246) | | | 69,072 | | | (34.0) |
| Net Income | 1,283,622 | | | 1,518,503 | | | (234,881) | | | (15.5) |
| Net income attributable to Non-Controlling Interests | (686,654) | | | (839,613) | | | 152,959 | | | (18.2) |
| Net Income Attributable to Apollo Asset Management, Inc. | 596,968 | | | 678,890 | | | (81,922) | | | (12.1) |
| Series A Preferred share dividends | (4,383) | | | (4,383) | | | — | | | — |
| Series B Preferred share dividends | (4,781) | | | (4,781) | | | — | | | — |
| Net Income Attributable to Apollo Asset Management, Inc. Common Stockholders | $ | 587,804 | | | $ | 669,726 | | | $ | (81,922) | | | (12.2) |
Note: “NM” denotes not meaningful. Changes from negative to positive amounts and positive to negative amounts are not considered meaningful. Increases or decreases from zero and changes greater than 500% are also not considered meaningful.
Three Months Ended March 31, 2022 Compared to Three Months Ended March 31, 2021
In this section, references to 2022 refer to the three months ended March 31, 2022 and references to 2021 refer to the three months ended March 31, 2021
Revenues
Revenues were $1.3 billion in 2022, a decrease of $1.0 billion from $2.3 billion in 2021 due to lower investment income. This decrease was primarily due to a decrease in performance allocations as a result of equity market volatility in 2022. Performance allocations were higher in 2021 due to fund appreciation leading to unrealized performance allocation gains.
This decrease was in part offset by an increase in management fees of $65.8 million to $522.9 million in 2022 from $457.2 million in 2021. The increase in management fees was primarily driven by yield funds due to increased Fee-Generating AUM inflows primarily from our perpetual capital vehicles.
Expenses
Expenses were $0.9 billion in 2022, a decrease of $114.3 million from $1.0 billion in 2021 due to a decrease in profit sharing expense of $295.9 million resulting from lower performance allocations during 2022. In any period, the blended profit sharing percentage is impacted by the respective profit sharing ratios of the funds generating performance allocations in the period. This decrease was partially offset by increases in equity-based compensation of $99.8 million and an increase in salary, bonus and benefits of $43.6 million due to accelerated headcount growth in 2021, including for certain senior level roles, as the Company strategically invests in talent that will seek to capture its next leg of growth. In addition, equity-based compensation increased
as a result of: i) performance grants which are tied to the Company’s receipt of performance fees, within prescribed periods and are typically recognized on an accelerated recognition method over the requisite service period to the extent the performance revenue metrics are met or deemed probable, and ii) the impact of one-time grants awarded to the Co-Presidents which vest on a cliff basis subject to continued employment over five years and the Company’s achievement of FRE and SRE per share.
General, administrative and other expenses were $140.4 million in 2022, an increase of $40.0 million from $100.4 million in 2021. The increase in 2022 is driven by increases in professional fees, travel and entertainment expenses, and absorption of occupancy and technology expenses to support the Company’s increased headcount.
Other Income (Loss)
Other Income was $1.0 billion in 2022, an increase of $580 million from $448.8 million in 2021. This increase was primarily attributable to an increase in net gains from investment activities as a result of realized investment income from dividend income earned on one of our balance sheet investments.
Income Tax Provision
The income tax provision totaled $134.2 million and $203.2 million in 2022 and 2021, respectively. The change was primarily related to the decrease in pre-tax income. The provision for income taxes includes federal, state, local and foreign income taxes resulting in an effective income tax rate of 9.5% and 11.8% for 2022 and 2021, respectively. The most significant reconciling items between the U.S. federal statutory income tax rate and the effective income tax rate were due to the following: (i) income passed through to Non-Controlling Interests, (ii) foreign, state and local income taxes, including New York City unincorporated business taxes (“NYC UBT”), and (iii) equity-based compensation net of the limiting provisions for executive compensation under IRC Section 162(m) (see note 10 to the condensed consolidated financial statements for further details regarding the Company’s income tax provision).
Managing Business Performance
We believe that the presentation of Adjusted Segment Income supplements a reader’s understanding of the economic operating performance of our segments.
Adjusted Segment Income
Adjusted Segment Income is the key performance measure used by management in evaluating the performance of Apollo’s asset management and principal investing segments. See note 16 to the condensed consolidated financial statements for more details regarding the components of Adjusted Segment Income.
We believe that Adjusted Segment Income is helpful for an understanding of our business and that investors should review the same supplemental financial measure that management uses to analyze our segment performance. This measure supplements and should be considered in addition to and not in lieu of the results of operations discussed below in “—Overview of Results of Operations” that have been prepared in accordance with U.S. GAAP. See note 16 to the condensed consolidated financial statements for more details regarding management’s consideration of Segment Earnings.
Fee Related Earnings and Principal Investing Income
FRE is a component of Adjusted Segment Income and represents the performance measure used to assess the performance of the asset management segment.
PII is a component of Adjusted Segment Income and represents the performance measure used to assess the performance of the principal investing segment.
See note 16 to the condensed consolidated financial statements for more details regarding the components of FRE and PII.
We use Adjusted Segment Income, FRE, and PII as measures of operating performance, not as measures of liquidity. These measures should not be considered in isolation or as a substitute for net income or other income data prepared in accordance with U.S. GAAP. The use of these measures without consideration of their related U.S. GAAP measures is not adequate due to the adjustments described above.
Segment Analysis
Discussed below are our results of operations for each of our reportable segments. They represent the segment information available and utilized by our management to assess performance and to allocate resources. See note 16 to our condensed consolidated financial statements for more information regarding our segment reporting.
Our financial results vary, since performance fees, which generally constitute a large portion of the income from the funds that we manage, as well as the transaction and advisory fees that we receive, can vary significantly from quarter to quarter and year to year. As a result, we emphasize long-term financial growth and profitability to manage our business.
Asset Management
The following table presents Fee Related Earnings, the performance measure of our asset management segment.
| | | | | | | | | | | | | | | | | | | | | | | |
| | Three Months ended March 31, | | Total Change | | Percentage Change |
| | 2022 | | 2021 | | |
| | (in thousands) | | |
| Asset Management: | | | | | | | |
| Management fees - Yield | $ | 333,305 | | | $ | 281,076 | | | $ | 52,229 | | | 18.6% |
| Management fees - Hybrid | 48,346 | | | 39,177 | | | 9,169 | | | 23.4 |
| Management fees - Equity | 123,750 | | | 133,631 | | | (9,881) | | | (7.4) |
| Management fees | 505,401 | | | 453,884 | | | 51,517 | | | 11.4 |
| Advisory and transaction fees, net | 64,113 | | | 55,495 | | | 8,618 | | | 15.5 |
| Fee-related performance fees | 14,226 | | | 8,771 | | | 5,455 | | | 62.2 |
| Fee-related compensation | (175,372) | | | (154,395) | | | (20,977) | | | 13.6 |
| Other operating expenses | (98,384) | | | (62,064) | | | (36,320) | | | 58.5 |
| Fee Related Earnings (FRE) | $ | 309,984 | | | $ | 301,691 | | | $ | 8,293 | | | 2.7 |
| | | | | | | | | | | | | | | | | | | | | | | |
| | Three Months ended March 31, | | Total Change | | Percentage Change |
| | 2021 | | 2020 | | |
| | (in thousands) | | |
| Asset Management: | | | | | | | |
| Management fees - Yield | $ | 281,076 | | | $ | 214,450 | | | $ | 66,626 | | | 31.1% |
| Management fees - Hybrid | 39,177 | | | 30,070 | | | 9,107 | | | 30.3 |
| Management fees - Equity | 133,631 | | | 137,848 | | | (4,217) | | | (3.1) |
| Management fees | 453,884 | | | 382,368 | | | 71,516 | | | 18.7 |
| Advisory and transaction fees, net | 55,495 | | | 36,732 | | | 18,763 | | | 51.1 |
| Fee-related performance fees | 8,771 | | | 2,404 | | | 6,367 | | | 264.9 |
| Fee-related compensation | (154,395) | | | (118,456) | | | (35,939) | | | 30.3 |
| Other operating expenses | (62,064) | | | (62,145) | | | 81 | | | (0.1) |
| Fee Related Earnings (FRE) | $ | 301,691 | | | $ | 240,903 | | | $ | 60,788 | | | 25.2 |
| | | | | | | |
Three Months Ended March 31, 2022 Compared to Three Months Ended March 31, 2021
In this section, references to 2022 refer to the three months ended March 31, 2022 and references to 2021 refer to the three months ended March 31, 2021.
FRE was $310.0 million in 2022, an increase of $8.3 million compared to $301.7 million in 2021. This increase was primarily attributable to continued growth in management fees and advisory and transaction fees. The increase in management fees was primarily driven by yield funds from increased Fee-Generating AUM inflows primarily from our perpetual capital vehicles. The growth in revenues was offset, in part, by higher fee-related compensation expenses and other operating expenses as we expand our global team and absorb occupancy and technology costs.
Three Months Ended March 31, 2021 Compared to Three Months Ended March 31, 2020
In this section, references to 2021 refer to the three months ended March 31, 2021 and references to 2020 refer to the three months ended March 31, 2020.
FRE was $301.7 million in 2021, an increase of $60.8 million compared to $240.9 million in 2020. This increase was primarily attributable to growth in management fees and advisory and transaction fees. The increase in management fees was primarily driven by yield funds from increased Fee-Generating AUM inflows primarily from our perpetual capital vehicles. The growth in revenues was offset, in part, by higher fee-related compensation expense due to an increase in headcount as we continued to
expand our global team in 2021.
Asset Management Operating Metrics
We monitor certain operating metrics that are common to the alternative asset management industry and directly impact the performance of our asset management segment. These operating metrics include Assets Under Management, Gross capital deployment and uncalled commitments.
Overview of Results of Operations
Revenues
AdvisoryManagement Feesand Transaction Fees, Net. As a result of providing advisory services with respect to actual and potential credit, private equity, and real assets investments, we are entitled to receive fees for transactions related to the acquisition and, in certain instances, disposition of portfolio companies as well as fees for ongoing monitoring of portfolio company operations and directors’ fees. We also receive advisory fees for advisory services provided to certain credit funds. In addition, monitoring fees are generated on certain structured portfolio company investments. Under the terms of the limited partnership agreements for certain funds, the management fee payable by the funds may be subject to a reduction based on a certain percentage of such advisory and transaction fees, net of applicable broken deal costs (“Management Fee Offset”). Such amounts are presented as a reduction to advisory and transaction fees, net, in the condensed consolidated statements of operations (see note 2 to our condensed consolidated financial statements for more detail on advisory and transaction fees, net).
The Management Fee Offsets are calculated for each fund as follows:
•65%-100% for certain credit funds, gross advisory, transaction and other special fees;
•65%-100% for private equity funds, gross advisory, transaction and other special fees; and
•65%-100% for certain real assets funds, gross advisory, transaction and other special fees.
Management Fees.The significant growth of the assets we manage has had a positive effect on our revenues. Management fees are typically calculated based upon any of “net asset value,” “gross assets,” “adjusted par asset value,” “adjusted costs of all unrealized portfolio investments,” “capital commitments,” “invested capital,” “adjusted assets,” “capital contributions,” or “stockholders’ equity,” each as defined in the applicable limited partnership agreement and/or management agreement of the unconsolidated funds or accounts.
Advisoryand Transaction Fees, Net
As a result of providing advisory services with respect to actual and potential investments, we are entitled to receive fees for transactions related to the acquisition and, in certain instances, disposition and financing of companies, some of which are portfolio companies of the funds we manage, as well as fees for ongoing monitoring of portfolio company operations and directors’ fees. We also receive advisory fees for advisory services provided to certain funds. In addition, monitoring fees are generated on certain structured portfolio company investments. Under the terms of the limited partnership agreements for certain funds, the management fee payable by the funds may be subject to a reduction based on a certain percentage (up to 100%) of such advisory and transaction fees, net of applicable broken deal costs (“Management Fee Offset”). Such amounts are presented as a reduction to advisory and transaction fees, net, in the condensed consolidated statements of operations (see note 2 to our condensed consolidated financial statements for more detail on advisory and transaction fees, net).
Performance Fees.Fees
The general partners of ourthe funds we manage are entitled to an incentive return of normally up to 20% of the total returns of a fund’s capital, depending upon performance of the underlying funds and subject to preferred returns and high water marks, as applicable. Performance fees, categorized as performance allocations, are accounted for as an equity method investment, and
effectively, the performance fees for any period are based upon an assumed liquidation of the funds’ assets at the reporting date, and distribution of the net proceeds in accordance with the funds’ allocation provisions. Performance fees categorized as incentive fees, which are not accounted as an equity method investment, are deferred until fees are probable to not be significantly reversed. Prior to the adoption of the new revenue recognition guidance, incentive fees were recognized on an assumed liquidation basis. The majority of performance fees are comprised of performance allocations.
As of June 30, 2021,March 31, 2022, approximately 54%52% of the value of our funds’the investments of the funds we manage on a gross basis was determined using market-based valuation methods (i.e., reliance on broker or listed exchange quotes) and the remaining 46%48% was determined primarily by comparable company and industry multiples or discounted cash flow models. For our credit, private equity and real assets segments, the percentage determined using market-based valuation methods as of June 30, 2021 was 74%, 23% and 19%, respectively. See “Item 1A. Risk Factors—Risks Related to Our Businesses—Our funds’ performance, and our performance, may be adversely affected by the financial performance of our funds’ portfolio companies and the industries in which our funds invest” and “—The COVID-19 pandemic has caused severe disruptions in the U.S. and global economy and is expected to continue to impact our business, financial condition and results of operations” in the 20202021 Annual Report for discussion regarding certain industry-specific risks that could affect the fair value of our private equity funds’certain of the portfolio company investments.investments of the funds we manage.
In our privatecertain equity funds we manage, the Company does not earn performance fees until the investors in the fund have achieved cumulative investment returns on invested capital (including management fees and expenses) in excess of an 8% hurdle rate. Additionally, certain of our credityield and real assetshybrid funds have various performance fee rates and hurdle rates. Certain of our credityield and real assetshybrid funds allocate performance fees to the general partner in a similar manner as the private equity funds. In certain of our private equity, certain credityield and real assetshybrid funds, so long as the investors achieve their priority returns, there is a catch-up formula whereby the Company earns a priority return for a portion of the return until the Company’s performance fees equate to its incentive fee rate for that fund; thereafter, the Company participates in returns from the fund at the performance fee rate. Performance fees, categorized as performance allocations, are subject to reversal to the extent that the performance fees distributed exceed the amount due to the general partner based on a fund’s cumulative investment returns. The Company recognizes potential repayment of previously received performance fees as a general partner obligation representing all amounts previously distributed to the general partner that would need to be repaid to the Apollo funds if these funds were to be liquidated based on the current fair value of the underlying funds’ investments as of the reporting date. The actual general
partner obligation, however, would not become payable or realized until the end of a fund’s life or as otherwise set forth in the respective limited partnership agreement of the fund.
The table below presents an analysis of Apollo’s (i) performance fees receivable on an unconsolidated basis and (ii) realized and unrealized performance fees for Apollo’s combined segments:fees:
| | | | | | | | | | | | | | | | | | | | | | | | | | | | | | | | | | | | | | |
| As of
June 30, 2021 | | For the Three Months Ended June 30, 2021 | For the Six Months Ended June 30, 2021 |
| | |
| | Performance Fees Receivable on an Unconsolidated Basis | | Unrealized
Performance Fees | | Realized
Performance Fees | | Total
Performance Fees | Unrealized
Performance Fees | | Realized
Performance Fees | | Total
Performance Fees |
| | (in thousands) |
| Credit: | | | | | | | | | | | | |
| Corporate Credit | $ | 147,765 | | | $ | 20,274 | | | $ | 15,019 | | | $ | 35,293 | | $ | 80,218 | | | $ | 25,535 | | | $ | 105,753 | |
| Structured Credit | 204,379 | | | (38,303) | | | 98,792 | | | 60,489 | | 20,658 | | | 106,677 | | | 127,335 | |
| Direct Origination | 91,768 | | | 3,186 | | | (1,947) | | | 1,239 | | 38,941 | | | 2,794 | | | 41,735 | |
| Advisory and Other | 43,932 | | | 7,078 | | | — | | | 7,078 | | 18,590 | | | — | | | 18,590 | |
| Total Credit | 487,844 | | | (7,765) | | | 111,864 | | | 104,099 | | 158,407 | | | 135,006 | | | 293,413 | |
| Total Credit, net of profit sharing payable/expense | 68,550 | | | 10,152 | | | 39,895 | | | 50,047 | | 74,119 | | | 55,081 | | | 129,200 | |
| Private Equity: | | | | | | | | | | | | |
| Fund IX | 685,592 | | | 142,461 | | | — | | | 142,461 | | 531,794 | | | — | | | 531,794 | |
Fund VIII(5) | 1,040,298 | | | (209,343) | | | 470,849 | | | 261,506 | | 239,832 | | | 525,342 | | | 765,174 | |
Fund VII(1)(2) | 78,896 | | | 99,179 | | | 9 | | | 99,188 | | 183,957 | | | 16 | | | 183,973 | |
| Fund VI | 17,271 | | | (260) | | | 12 | | | (248) | | (556) | | | 21 | | | (535) | |
Fund IV and V(1) | — | | | (102) | | | — | | | (102) | | (322) | | | — | | | (322) | |
ANRP I, II and III(1) | 120,483 | | | 79,163 | | | 3 | | | 79,166 | | 140,470 | | | 5 | | | 140,475 | |
| HVF I | 60,231 | | | (22,995) | | | 33,296 | | | 10,301 | | 7,735 | | | 47,775 | | | 55,510 | |
Other(1)(3) | 118,478 | | | 19,672 | | | 6,238 | | | 25,910 | | 118,936 | | | 8,169 | | | 127,105 | |
| Total Private Equity | 2,121,249 | | | 107,775 | | | 510,407 | | | 618,182 | | 1,221,846 | | | 581,328 | | | 1,803,174 | |
| Total Private Equity, net of profit sharing payable/expense | 1,186,184 | | | 80,788 | | | 262,895 | | | 343,683 | | 713,426 | | | 296,226 | | | 1,009,652 | |
| Real Assets Funds: | | | | | | | | | | | | |
Principal Finance(1) | 91,859 | | | 24,477 | | | 951 | | | 25,428 | | 14,065 | | | 22,413 | | | 36,478 | |
Real Estate Equity Funds(1) | 23,329 | | | 2,443 | | | — | | | 2,443 | | 2,205 | | | — | | | 2,205 | |
| AIOF I and II | 22,619 | | | 3,235 | | | 443 | | | 3,678 | | 9,820 | | | 443 | | | 10,263 | |
Other(1)(3) | 19,701 | | | 737 | | | 1,781 | | | 2,518 | | 14,333 | | | 1,780 | | | 16,113 | |
| Total Real Assets | 157,508 | | | 30,892 | | | 3,175 | | | 34,067 | | 40,423 | | | 24,636 | | | 65,059 | |
| Total Real Assets, net of profit sharing payable/expense | 80,191 | | | 16,377 | | | 1,784 | | | 18,161 | | 21,279 | | | 11,033 | | | 32,312 | |
| Total | $ | 2,766,601 | | | $ | 130,902 | | | $ | 625,446 | | | $ | 756,348 | | $ | 1,420,676 | | | $ | 740,970 | | | $ | 2,161,646 | |
Total, net of profit sharing payable(4)/expense | $ | 1,334,925 | | | $ | 107,317 | | | $ | 304,574 | | | $ | 411,891 | | $ | 808,824 | | | $ | 362,340 | | | $ | 1,171,164 | |
| | | | | | | | | | | | | | | | | | | | | | | | | | | | | | | | | | | | | | | | | | |
| As of March 31, | | | | | | | | Performance Fees for the Three Months Ended
March 31, 2022 | | | | |
| | 2022 | | | | | | |
| | Performance Fees Receivable on an Unconsolidated Basis | | | | | | | | Unrealized | | Realized | | Total | | | | | | | | | | | | |
| | (in thousands) |
| AIOF I and II | $ | 15,232 | | | | | | | | | | $ | (795) | | | $ | 5,043 | | | $ | 4,248 | | | | | | | | | | | | | |
ANRP I, II and III(1)(2) | 90,883 | | | | | | | | | | 991 | | | 13 | | | 1,004 | | | | | | | | | | | | | |
| EPF Funds | 135,855 | | | | | | | | | | 494 | | | 8,618 | | | 9,112 | | | | | | | | | | | | | |
| FCI Funds | 132,201 | | | | | | | | | | (7,084) | | | — | | | (7,084) | | | | | | | | | | | | | |
| Fund IX | 1,176,017 | | | | | | | | | | 405,183 | | | 54,018 | | | 459,201 | | | | | | | | | | | | | |
| Fund VIII | 653,111 | | | | | | | | | | (73,110) | | | — | | | (73,110) | | | | | | | | | | | | | |
Fund VII(1)(2) | 82,457 | | | | | | | | | | (18,373) | | | 23,543 | | | 5,170 | | | | | | | | | | | | | |
| Fund VI | 16,145 | | | | | | | | | | (141) | | | 27 | | | (114) | | | | | | | | | | | | | |
Fund IV and V(1) | — | | | | | | | | | | (223) | | | — | | | (223) | | | | | | | | | | | | | |
| Hybrid Value Fund | 121,969 | | | | | | | | | | 15,887 | | | 14,588 | | | 30,475 | | | | | | | | | | | | | |
Real Estate Equity(1) | 68,137 | | | | | | | | | | 24,588 | | | 2,859 | | | 27,447 | | | | | | | | | | | | | |
| Corporate Credit | 7,911 | | | | | | | | | | 1,171 | | | 4,386 | | | 5,557 | | | | | | | | | | | | | |
| Structured Finance and ABS | 73,924 | | | | | | | | | | 3,196 | | | 5,147 | | | 8,343 | | | | | | | | | | | | | |
| Direct Origination | 116,781 | | | | | | | | | | 9,517 | | | 9,156 | | | 18,673 | | | | | | | | | | | | | |
Other(1)(3) | 408,357 | | | | | | | | | | 81,468 | | | 14,017 | | | 95,485 | | | | | | | | | | | | | |
| Total | $ | 3,098,980 | | | | | | | | | | $ | 442,769 | | | $ | 141,415 | | | $ | 584,184 | | | | | | | | | | | | | |
Total, net of profit sharing payable(4)/expense | 1,602,325 | | | | | | | | | | 252,923 | | | (3,518) | | | 249,405 | | | | | | | | | | | | | |
(1)As of June 30, 2021,March 31, 2022, certain private equity funds and certain real asset funds had $65.3$80.2 million and $35.4 million, respectively, in general partner obligations to return previously distributeddistributed performance fees. The fair value gain on investments and income at the fund level needed to reverse the general partner obligations for certain private equity funds and certain real assets funds was $1.2$1.3 billion, and $240.0 million, respectively, as of June 30, 2021.March 31, 2022.
(2)As of June 30, 2021,March 31, 2022, the remaining investments and escrow cash of Fund VII wereANRP II was valued at 91%100% of the fund’sfund’s unreturned capital, which was below the required escrow ratio of 115%. As a result, Fund VIIthe fund is required to place in escrow current and future performance fee distributions to the general partner until the specified return ratio of 115% is met (at the time of a future distribution) or upon liquidation. As of June 30, 2021, Fund VIIMarch 31, 2022, ANRP II had $128.5$60.8 million of gross performance fees, or $73.2$38.7 million net of profitprofit sharing, in escrow. With respect to Fund VII,ANRP II, realized performance fees currently distributed to the general partner are limited to potential tax distributions and interest on escrow balances per these funds’the fund’s partnership agreements. Performance fees receivable as of June 30, 2021March 31, 2022 and realized performance fees for the three and six months ended June 30, 2021March 31, 2022 include interest earned on escrow balances that is not subject to contingent repayment.
(3)Other includes certain SIAs.
(4)There was a corresponding profit sharing payable of $1.4of $1.5 billion as of June 30, 2021,March 31, 2022, including profit sharing payable related to amounts in escrow and contingent consideration obligations of $129.0$110.5 million.
(5)Fund VIII includes $148.6 million of realized performance fees received in the form of shares.
The general partners of certaincertain of our creditthe funds we manage accrue performance fees, categorized as performance allocations, when the fair value of investments exceeds the cost basis of the individual investors’ investments in the fund, including any allocable share of expenses incurred in connection with such investments, which we refer to as “high water marks.” These high water marks are applied on an individual investor basis. Certain of our credit funds we manage have investors with various high water marks, the achievement of which is subject to market conditions and investment performance.
Performance fees from our private equitycertain funds and certain credit and real assets fundswe manage are subject to contingent repayment by the general partner in the event of future losses to the extent that the cumulative performance fees distributed from inception to date exceeds the amount computed as due to the general partner at the final distribution. These general partner obligations, if applicable, are included in due to related parties on the condensed consolidated statements of financial condition.
The following table summarizes our performance fees since inception for our combined segments through June 30, 2021:March 31, 2022:
| | | Performance Fees Since Inception(1) | | Performance Fees Since Inception(1) |
| | | Undistributed by Fund and Recognized | | Distributed by Fund and Recognized(2) | | Total Undistributed and Distributed by Fund and Recognized(3) | | General Partner Obligation(3) | | Maximum Performance Fees Subject to Potential Reversal(4) | | Undistributed by Fund and Recognized | | Distributed by Fund and Recognized(2) | | Total Undistributed and Distributed by Fund and Recognized(3) | | General Partner Obligation(3) | | Maximum Performance Fees Subject to Potential Reversal(4) |
| | | (in millions) | | (in millions) |
| Credit: | | |
| Corporate Credit | $ | 147.8 | | | $ | 1,367.3 | | | $ | 1,515.1 | | | $ | — | | | $ | 188.3 | | |
| Structured Credit | 204.4 | | | 251.3 | | | 455.7 | | | — | | | 176.5 | | |
| Direct Origination | 91.8 | | | 53.2 | | | 145.0 | | | — | | | 91.8 | | |
| Advisory and Other | 43.9 | | | — | | | 43.9 | | | — | | | 43.9 | | |
| Total Credit | 487.9 | | | 1,671.8 | | | 2,159.7 | | | — | | | 500.5 | | |
| Private Equity: | | | | | | | | | | |
| AIOF I and II | | AIOF I and II | $ | 15.2 | | | $ | 36.6 | | | $ | 51.8 | | | $ | — | | | $ | 36.9 | |
| ANRP I, II and III | | ANRP I, II and III | 90.9 | | | 156.6 | | | 247.5 | | | 12.0 | | | 113.6 | |
| EPF Funds | | EPF Funds | 135.9 | | | 455.7 | | | 591.6 | | | 26.2 | | | 326.1 | |
| FCI Funds | | FCI Funds | 132.2 | | | 24.2 | | | 156.4 | | | — | | | 132.2 | |
| Fund IX | Fund IX | 685.6 | | | — | | | 685.6 | | | — | | | 685.6 | | Fund IX | 1,176.0 | | | 440.6 | | | 1,616.6 | | | — | | | 1,440.2 | |
| Fund VIII | Fund VIII | 1,040.3 | | | 1,343.9 | | | 2,384.2 | | | — | | | 1,931.8 | | Fund VIII | 653.1 | | | 1,638.8 | | | 2,291.9 | | | — | | | 1,693.2 | |
| Fund VII | Fund VII | 78.9 | | | 3,132.2 | | | 3,211.1 | | | — | | | 263.6 | | Fund VII | 82.5 | | | 3,181.6 | | | 3,264.1 | | | — | | | 27.1 | |
| Fund VI | Fund VI | 17.3 | | | 1,663.9 | | | 1,681.2 | | | — | | | 0.5 | | Fund VI | 16.1 | | | 1,663.9 | | | 1,680.0 | | | — | | | 0.3 | |
| Fund IV and V | Fund IV and V | — | | | 2,053.1 | | | 2,053.1 | | | 31.4 | | | 0.4 | | Fund IV and V | — | | | 2,053.1 | | | 2,053.1 | | | 31.9 | | | 0.4 | |
| ANRP I, II and III | 120.4 | | | 104.8 | | | 225.2 | | | 12.0 | | | 140.5 | | |
| HVF I | 60.2 | | | 67.6 | | | 127.8 | | | — | | | 92.5 | | |
| | Hybrid Value Fund | | Hybrid Value Fund | 122.0 | | | 99.7 | | | 221.7 | | | — | | | 168.3 | |
| Real Estate Equity | | Real Estate Equity | 68.1 | | | 57.8 | | | 125.9 | | | — | | | 77.0 | |
| Corporate Credit | | Corporate Credit | 7.9 | | | 925.7 | | | 933.6 | | | — | | | 7.8 | |
| Structured Finance and ABS | | Structured Finance and ABS | 73.9 | | | 52.1 | | | 126.0 | | | — | | | 68.6 | |
| Direct Origination | | Direct Origination | 116.8 | | | 62.4 | | | 179.2 | | | — | | | 107.6 | |
Other(5) | Other(5) | 118.5 | | | 747.1 | | | 865.6 | | | 21.9 | | | 156.8 | | Other(5) | 408.4 | | | 1,610.8 | | | 2,019.2 | | | 10.1 | | | 558.7 | |
| Total Private Equity | 2,121.2 | | | 9,112.6 | | | 11,233.8 | | | 65.3 | | | 3,271.7 | | |
| Real Assets: | | | | | | | | | | |
| Principal Finance | 91.9 | | | 446.5 | | | 538.4 | | | 27.7 | | | 248.7 | | |
| Real Estate Equity Funds | 23.3 | | | 34.9 | | | 58.2 | | | 7.7 | | | 24.4 | | |
| AIOF I and II | 22.6 | | | 15.8 | | | 38.4 | | | — | | | 27.1 | | |
Other(5) | 19.7 | | | 36.5 | | | 56.2 | | | — | | | 27.3 | | |
| Total Real Assets | 157.5 | | | 533.7 | | | 691.2 | | | 35.4 | | | 327.5 | | |
| Total | Total | $ | 2,766.6 | | | $ | 11,318.1 | | | $ | 14,084.7 | | | $ | 100.7 | | | $ | 4,099.7 | | Total | $ | 3,099.0 | | | $ | 12,459.6 | | | $ | 15,558.6 | | | $ | 80.2 | | | $ | 4,758.0 | |
(1)Certain funds are denominated in Euros and historical figures are translated into U.S. dollars at an exchange rate of €1.00 to $1.19$1.11 as of June 30, 2021.March 31, 2022. Certain funds are denominated in pound sterling and historical figures are translated into U.S. dollars at an exchange rate of £1.00 to $1.38$1.31 as of June 30, 2021.March 31, 2022.
(2)Amounts in “Distributed by Fund and Recognized” for the Citi Property Investors (“CPI”), Gulf Stream Asset Management, LLC (“Gulf Stream”), Stone Tower Capital LLC and its related companies (“Stone Tower”) funds and SIAs are presented for activity subsequent to the respective acquisition dates. Amounts exclude certain performance fees from business development companies and Redding Ridge Holdings LP (“Redding Ridge Holdings”), an affiliate of Redding Ridge.
(3)Amounts were computed based on the fair value of fund investments on June 30, 2021.March 31, 2022. Performance fees have been allocated to and recognized by the general partner. Based on the amount allocated, a portion is subject to potential reversal or, to the extent applicable, has been reduced by the general partner obligation to return previously distributed performance fees at June 30, 2021.March 31, 2022. The actual determination and any required payment of any such general partner obligation would not take place until the final disposition of the fund’s investments based on contractual termination of the fund.
(4)Represents the amount of performance fees that would be reversed if remaining fund investments became worthless on June 30, 2021.March 31, 2022. Amounts subject to potential reversal of performance fees include amounts undistributed by a fund (i.e., the performance fees receivable), as well as a portion of the amounts that have been distributed by a fund, net of taxes and not subject to a general partner obligation to return previously distributed performance fees, except for those funds that are gross of taxes as defined in the respective funds’ governing documents.
(5)Other includes certain SIAs.
Expenses
Compensation and Benefits.Benefits
Our most significant expense is compensation and benefits expense. This consists of fixed salary, discretionary and non-discretionary bonuses, profit sharing expense associated with the performance fees earned from credit, private equity, and real assets funds and compensation expense associated with the vesting of non-cash equity-based awards.
Our compensation arrangements with certain partners and employees contain a significant performance-based incentive component. Therefore, as our net revenues increase, our compensation costs rise. Our compensation costs also reflect the increased investment in people as we expand geographically and create new funds.
In addition, certain professionals and selected other individuals have a profit sharing interest in the performance fees earned in relation to our private equity, certain credit and real assets funds in order to better align their interests with our own and with those of the investors in these funds. Profit sharing expense is part of our compensation and benefits expense and is generally based upon a fixed percentage of credit, private equity and real assets performance fees. Profit sharing expense can reverse during periods when there is a decline in performance fees that were previously recognized. Profit sharing amounts are normally distributed to employees after the corresponding investment gains have been realized and generally before preferred returns are achieved for the investors. Therefore, changes in our unrealized performance fees have the same effect on our profit sharing expense. Profit sharing expense increases when unrealized performance fees increases. Realizations only impact profit sharing expense to the extent that the effects on investments have not been recognized previously. If losses on other investments within a fund are subsequently realized, the profit sharing amounts previously distributed are normally subject to a general partner obligation to return performance fees previously distributed back to the funds. This general partner obligation due to the funds would be realized only when the fund is liquidated, which generally occurs at the end of the fund’s term. However, indemnification obligations also exist for realized gains with respect to Fund IV, Fund V and Fund VI, which, although our Co-FoundersFormer Managing Partners and Contributing Partners would remain personally liable, may indemnify our Co-FoundersFormer Managing Partners and Contributing Partners for 17.5% to 100% of the previously distributed profits regardless of the fund’s future performance. See note 14 to our condensed consolidated financial statements for further information regarding the Company’s indemnification liability.
Each of Joshua Harris and Marc Rowan receives $100,000 per year in base salary for services rendered to us. Additionally, Messrs. Harris and Rowan can receive other forms of compensation. In addition, AHL Awards and other equity-based compensation awards have been granted to the Company and certain employees, which amortize over the respective vesting periods. The Company grants equity awards to certain employees, including RSUs, restricted Class A shares and options, that generally vest and become exercisable in quarterly installments or annual installments depending on the contract terms over a period of three to six years. In some instances, vesting of an RSU is also subject to the Company’s receipt of performance fees, within prescribed periods, sufficient to cover the associated equity-based compensation expense. See note 12 to our condensed consolidated financial statements for further discussion of equity-based compensation.
Other Expenses.Expenses
The balance of our other expenses includes interest, placement fees, and general, administrative and other operating expenses. Interest expense consists primarily of interest related to the 2024 Senior Notes, the 2026 Senior Notes, the 2029 Senior Notes, the 2030 Senior Notes, the 2039 Senior Secured Guaranteed Notes, the 2048 Senior Notes and the 2050 Subordinated Notes as discussed in note 1011 to our condensed consolidated financial statements. Placement fees are incurred in connection with our capital raising activities. In cases where the limited partners of the funds are determined to be the customer in an arrangement, placement fees may be capitalized as a cost to acquire a customer contract, and amortized over the life of the customer contract. General, administrative and other expenses includes occupancy expense, depreciation and amortization, professional fees and costs related to travel, information technology and administration. Occupancy expense represents charges related to office leases and associated expenses, such as utilities and maintenance fees. Depreciation and amortization of fixed assets is normally calculated using the straight-line method over their estimated useful lives, ranging from two to sixteen years, taking into consideration any residual value. Leasehold improvements are amortized over the shorter of the useful life of the asset or the expected term of the lease. Intangible assets are amortized based on the future cash flows over the expected useful lives of the assets.
Other Income (Loss)
Net Gains (Losses) from Investment Activities.Activities
Net gains (losses) from investment activities include both realized gains and losses and the change in unrealized gains and losses in our investment portfolio between the opening reporting date and the closing reporting date. Net unrealized gains (losses) are a result of changes in the fair value of unrealized investments and reversal of unrealized gains (losses) due to dispositions of investments during the reporting period. Significant judgment and estimation goes into the assumptions that drive these models and the actual values realized with respect to investments could be materially different from values obtained based on the use of those models. The valuation methodologies applied impact the reported value of investment company holdings and their underlying portfolios in our condensed consolidated financial statements.
Net Gains (Losses) from Investment Activities of Consolidated Variable Interest Entities.Entities
Changes in the fair value of the consolidated VIEs’ assets and liabilities and related interest, dividend and other income and expenses subsequent to consolidation are presented within net gains (losses) from investment activities of consolidated variable interest entities and are attributable to Non-Controlling Interests in the condensed consolidated statements of operations.
Other Income (Losses), Net.Net
Other income (losses), net includes gains (losses) arising from the remeasurement of foreign currency denominated assets and liabilities, remeasurement of the tax receivable agreement liability and other miscellaneous non-operating income and expenses.
Income Taxes.
Significant judgment is required in determining the provision for income taxes and in evaluating income tax positions, including evaluating uncertainties. We recognize the income tax benefits of uncertain tax positions only where the position is “more likely than not” to be sustained upon examination, including resolution of any related appeals or litigation, based on the technical merits of the positions. The tax benefit is measured as the largest amount of benefit that has a greater than 50% likelihood of being realized upon ultimate settlement. If a tax position is not considered more likely than not to be sustained, then no benefits of the position are recognized. The Company’s income tax positions are reviewed and evaluated quarterly to determine whether or not we have uncertain tax positions that require financial statement recognition or de-recognition.
Deferred tax assets and liabilities are recognized for the expected future tax consequences, using currently enacted tax rates, of differences between the carrying amount of assets and liabilities and their respective tax basis. The effect on deferred tax assets and liabilities of a change in tax rates is recognized in income in the period when the change is enacted. Deferred tax assets are reduced by a valuation allowance when it is more likely than not that some portion or all of the deferred tax assets will not be realized.
Non-Controlling Interests
For entities that are consolidated, but not 100% owned, a portion of the income or loss and corresponding equity is allocated to owners other than Apollo. The aggregate of the income or loss and corresponding equity that is not owned by the Company is included in Non-Controlling Interests in the condensed consolidated financial statements. TheAs of March 31, 2022, the Non-Controlling Interests relatingrelates to the 42.6% ownership interest in the Apollo Global Management, Inc. primarilyOperating Group held directly by AGM. As of December 31, 2021, Non-Controlling Interests include the 39.8% and 40.4% ownership interest in the Apollo Operating Group held by the Co-FoundersFormer Managing Partners and Contributing Partners through their limited partner interests in Holdings as of June 30, 2021 and 2020, respectively.Holdings. Additionally, as of June 30,December 31, 2021, Athene holdsheld a 6.7% Non-Controlling Interest in the Apollo Operating Group as a result of the Transaction Agreement. Non-Controlling Interests also include limited partner interests in certain consolidated funds and VIEs.
The authoritative guidance for Non-Controlling Interests in the condensed consolidated financial statements requires reporting entities to present Non-Controlling Interest as equity and provides guidance on the accounting for transactions between an entity and Non-Controlling Interests. According to the guidance, (1) Non-Controlling Interests are presented as a separate component of stockholders’ equity on the Company’s condensed consolidated statements of financial condition, (2) net income (loss) includes the net income (loss) attributable to the Non-Controlling Interest holders on the Company’s condensed consolidated statements of operations, (3) the primary components of Non-Controlling Interest are separately presented in the Company’s condensed consolidated statements of changes in stockholders’ equity to clearly distinguish the interests in the Apollo Operating Group and other ownership interests in the consolidated entities and (4) profits and losses are allocated to Non-Controlling Interests in proportion to their ownership interests regardless of their basis.
Results of Operations
Below is a discussion of our condensed consolidated results of operations for the three and six months ended June 30, 2021March 31, 2022 and 2020.2021. For additional analysis of the factors that affected our results at the segment level, see “—Segment Analysis” below:
| | | | | | | | | | | | | | | | | | | | | | | | | | | | | | | | | | | | | | | | | | | | | | | |
| | For the Three Months Ended
June 30, | | Amount
Change | | Percentage
Change | | For the Six Months Ended June 30, | | Amount
Change | | Percentage
Change |
| | 2021 | | 2020 | | | 2021 | | 2020 | |
| Revenues: | (in thousands) | | | | (in thousands) | | |
| Management fees | $ | 470,092 | | | $ | 409,953 | | | $ | 60,139 | | | 14.7% | | $ | 927,277 | | | $ | 806,557 | | | $ | 120,720 | | | 15.0% |
| Advisory and transaction fees, net | 86,351 | | | 61,957 | | | 24,394 | | | 39.4 | | 142,699 | | | 98,920 | | | 43,779 | | | 44.3 |
| Investment income (loss): | | | | | | | | | | | | | | | |
| Performance allocations | 735,139 | | | 924,599 | | | (189,460) | | | (20.5) | | 2,130,486 | | | (809,724) | | | 2,940,210 | | | NM |
| Principal investment income (loss) | 76,425 | | | 111,621 | | | (35,196) | | | (31.5) | | 458,391 | | | (76,228) | | | 534,619 | | | NM |
| Total investment income (loss) | 811,564 | | | 1,036,220 | | | (224,656) | | | (21.7) | | 2,588,877 | | | (885,952) | | | 3,474,829 | | | NM |
| Incentive fees | 14,318 | | | 205 | | | 14,113 | | | NM | | 18,172 | | | 19,724 | | | (1,552) | | | (7.9) |
| Total Revenues | 1,382,325 | | | 1,508,335 | | | (126,010) | | | (8.4) | | 3,677,025 | | | 39,249 | | | 3,637,776 | | | NM |
| Expenses: | | | | | | | | | | | | | | | |
| Compensation and benefits: | | | | | | | | | | | | | | | |
| Salary, bonus and benefits | 181,299 | | | 151,019 | | | 30,280 | | | 20.1 | | 355,929 | | | 290,288 | | | 65,641 | | | 22.6 |
| Equity-based compensation | 52,998 | | | 59,420 | | | (6,422) | | | (10.8) | | 109,446 | | | 111,542 | | | (2,096) | | | (1.9) |
| Profit sharing expense | 361,247 | | | 375,959 | | | (14,712) | | | (3.9) | | 1,016,727 | | | (260,039) | | | 1,276,766 | | | NM |
| Total compensation and benefits | 595,544 | | | 586,398 | | | 9,146 | | | 1.6 | | 1,482,102 | | | 141,791 | | | 1,340,311 | | | NM |
| Interest expense | 34,814 | | | 32,291 | | | 2,523 | | | 7.8 | | 69,613 | | | 63,533 | | | 6,080 | | | 9.6 |
| General, administrative and other | 115,838 | | | 83,729 | | | 32,109 | | | 38.3 | | 215,688 | | | 168,251 | | | 47,437 | | | 28.2 |
| Placement fees | 591 | | | 359 | | | 232 | | | 64.6 | | 1,128 | | | 768 | | | 360 | | | 46.9 |
| Total Expenses | 746,787 | | | 702,777 | | | 44,010 | | | 6.3 | | 1,768,531 | | | 374,343 | | | 1,394,188 | | | 372.4 |
| Other Income (Loss): | | | | | | | | | | | | | | | |
| Net gains (losses) from investment activities | 913,394 | | | 268,667 | | | 644,727 | | | 240.0 | | 1,266,545 | | | (995,884) | | | 2,262,429 | | | NM |
| Net gains (losses) from investment activities of consolidated variable interest entities | 145,403 | | | 57,862 | | | 87,541 | | | 151.3 | | 257,997 | | | (108,058) | | | 366,055 | | | NM |
| Interest income | 645 | | | 3,994 | | | (3,349) | | | (83.9) | | 1,443 | | | 11,928 | | | (10,485) | | | (87.9) |
| Other income (loss), net | 4,531 | | | 3,327 | | | 1,204 | | | 36.2 | | (13,219) | | | (13,180) | | | (39) | | | 0.3 |
| Total Other Income (Loss) | 1,063,973 | | | 333,850 | | | 730,123 | | | 218.7 | | 1,512,766 | | | (1,105,194) | | | 2,617,960 | | | NM |
| Income (Loss) before income tax provision | 1,699,511 | | | 1,139,408 | | | 560,103 | | | 49.2 | | 3,421,260 | | | (1,440,288) | | | 4,861,548 | | | NM |
| Income tax (provision) benefit | (194,051) | | | (140,323) | | | (53,728) | | | 38.3 | | (397,297) | | | 155,530 | | | (552,827) | | | NM |
| Net Income (Loss) | 1,505,460 | | | 999,085 | | | 506,375 | | | 50.7 | | 3,023,963 | | | (1,284,758) | | | 4,308,721 | | | NM |
| Net income (loss) attributable to Non-Controlling Interests | (847,733) | | | (552,756) | | | (294,977) | | | 53.4 | | (1,687,346) | | | 734,869 | | | (2,422,215) | | | NM |
| Net Income (Loss) Attributable to Apollo Global Management, Inc. | 657,727 | | | 446,329 | | | 211,398 | | | 47.4 | | 1,336,617 | | | (549,889) | | | 1,886,506 | | | NM |
| Net income attributable to Series A Preferred Shareholders | (4,383) | | | (4,383) | | | — | | | — | | (8,766) | | | (8,766) | | | — | | | — |
| Net income attributable to Series B Preferred Shareholders | (4,781) | | | (4,782) | | | 1 | | | — | | (9,562) | | | (9,563) | | | 1 | | | — |
| Net Income (Loss) Attributable to AGM Class A Shareholders | $ | 648,563 | | | $ | 437,164 | | | $ | 211,399 | | | 48.4% | | $ | 1,318,289 | | | $ | (568,218) | | | $ | 1,886,507 | | | NM |
| | | | | | | | | | | | | | | | | | | | | | | |
| | For the Three Months Ended March 31, | | Total
Change | | Percentage
Change |
| | 2022 | | 2021 | |
| (in thousands) | | |
| Revenues: | | | | | | | |
| Management fees | $ | 522,936 | | | $ | 457,185 | | | $ | 65,751 | | | 14.4% |
| Advisory and transaction fees, net | 65,786 | | | 56,348 | | | 9,438 | | | 16.7 |
| Investment income | 702,315 | | | 1,777,313 | | | (1,074,998) | | | (60.5) |
| Incentive fees | 5,850 | | | 3,854 | | | 1,996 | | | 51.8 |
| Total Revenues | 1,296,887 | | | 2,294,700 | | | (997,813) | | | (43.5) |
| Expenses: | | | | | | | |
| Compensation and benefits: | | | | | | | |
| Salary, bonus and benefits | 218,254 | | | 174,630 | | | 43,624 | | | 25.0 |
| Equity-based compensation | 156,288 | | | 56,448 | | | 99,840 | | | 176.9 |
| Profit sharing expense | 359,562 | | | 655,480 | | | (295,918) | | | (45.1) |
| Total compensation and benefits | 734,105 | | | 886,558 | | | (152,453) | | | (17.2) |
| Interest expense | 32,993 | | | 34,799 | | | (1,806) | | | (5.2) |
| General, administrative and other | 140,363 | | | 100,387 | | | 39,976 | | | 39.8 |
| Total Expenses | 907,461 | | | 1,021,744 | | | (114,283) | | | (11.2) |
| Other Income: | | | | | | | |
| Net gains from investment activities | 771,262 | | | 353,151 | | | 418,111 | | | 118.4 |
| Net gains from investment activities of consolidated variable interest entities | 279,455 | | | 112,594 | | | 166,861 | | | 148.2 |
| Interest income | 2,836 | | | 798 | | | 2,038 | | | 255.4 |
| Other income (loss), net | (25,183) | | | (17,750) | | | (7,433) | | | 41.9 |
| Total Other Income | 1,028,370 | | | 448,793 | | | 579,577 | | | 129.1 |
| Income before income tax provision | 1,417,796 | | | 1,721,749 | | | (303,953) | | | (17.7) |
| Income tax provision | (134,174) | | | (203,246) | | | 69,072 | | | (34.0) |
| Net Income | 1,283,622 | | | 1,518,503 | | | (234,881) | | | (15.5) |
| Net income attributable to Non-Controlling Interests | (686,654) | | | (839,613) | | | 152,959 | | | (18.2) |
| Net Income Attributable to Apollo Asset Management, Inc. | 596,968 | | | 678,890 | | | (81,922) | | | (12.1) |
| Series A Preferred share dividends | (4,383) | | | (4,383) | | | — | | | — |
| Series B Preferred share dividends | (4,781) | | | (4,781) | | | — | | | — |
| Net Income Attributable to Apollo Asset Management, Inc. Common Stockholders | $ | 587,804 | | | $ | 669,726 | | | $ | (81,922) | | | (12.2) |
Note: “NM” denotes not meaningful. Changes from negative to positive amounts and positive to negative amounts are not considered meaningful. Increases or decreases from zero and changes greater than 500% are also not considered meaningful.
In March 2020, the World Health Organization declared the outbreak of a novel coronavirus (COVID-19) pandemic, which has resulted in uncertainty and disruption in the global economy and financial markets. While we are unable to accurately predict the full impact that COVID-19 will have on our results from operations, financial condition, liquidity and cash flows due to numerous uncertainties, including the duration and severity of the pandemic and containment measures, our compliance with these measures has impacted our day-to-day operations and could disrupt our business and operations, as well as that of the Apollo Funds and their portfolio companies, for an indefinite period of time. See “Item 1A. Risk Factors — Risks Related to Our Businesses — The COVID-19 pandemic has caused severe disruptions in the U.S. and global economy and is expected to continue to impact our business, financial condition and results of operations” in the 2020 Annual Report.
Three Months Ended June 30, 2021March 31, 2022 Compared to Three Months Ended June 30, 2020March 31, 2021
In this section, references to 2022 refer to the three months ended March 31, 2022 and references to 2021 refer to the three months ended June 30,March 31, 2021 and references to 2020 refer to the three months ended June 30, 2020.
Revenues
Management fees increased by $60.1 million to $470.1 millionRevenues were $1.3 billion in 2022, a decrease of $1.0 billion from $2.3 billion in 2021 from $410.0 million in 2020.due to lower investment income. This changedecrease was primarily attributabledue to a decrease in performance allocations as a result of equity market volatility in 2022. Performance allocations were higher in 2021 due to fund appreciation leading to unrealized performance allocation gains.
This decrease was in part offset by an increase in management fees earnedof $65.8 million to $522.9 million in 2022 from Athene of $49.2 million. For additional details regarding changes$457.2 million in 2021. The increase in management fees in each segment, see “—Segment Analysis” below.
Advisory and transaction fees, net, increased by $24.4 million to $86.4 million in 2021 from $62.0 million in 2020. Advisory and transaction fees earned during 2021 were primarily related to transaction fees earned from a company in the consumer services industry and structuring fees earned from a company in the consumer and retail industry. Advisory and transaction fees earned during 2020 were primarily related to transaction fees earned with respect to certain portfolio companies in the media, telecom and technology industries and structuring fees earned from a company in the consumer and retail industry.
Performance allocations decreased by $189.5 million to $735.1 million in 2021 from $924.6 million in 2020. The decrease in performance allocations was primarily attributable to decreased performance allocations earned from Fund VIII of $472.9 million partially offset by an increase in performance allocations earned from Fund IX, ANRP II and Fund VII of $145.7 million, $78.4 million and $55.6 million, respectively, during 2021.
The decrease in performance allocations from Fund VIII was primarily driven by the fund beingyield funds due to increased Fee-Generating AUM inflows primarily from our perpetual capital vehicles.
Expenses
Expenses were $0.9 billion in the catchup phase2022, a decrease of carry during 2020 whereby the Company earned a larger share of carried interest (80%), whereas for 2021, the Company earned its typical 20% carried interest rate.
The increase in performance allocations$114.3 million from Fund IX was primarily driven by the fund achieving its annualized hurdle rate$1.0 billion in 2021 whereas it was below the annualized hurdle rate in 2020.
The increase in performance allocations from ANRP II was primarily driven by appreciation in the value of the fund’s public and private investments in the natural resources sector during 2021. Moreover, the fund achieved its annualized hurdle rate in 2021 whereas it was below the annualized hurdle rate in 2020.
The increase in performance allocations from Fund VII was primarily driven by appreciation in the value of a private investment in the consumer services sector during 2021.
Principal investment income decreased by $35.2 million to $76.4 million in 2021 from $111.6 million in 2020. Principal investment income was higher in 2020 primarily driven by larger increases in the value of investments held by certain Apollo funds and other entities in which the Company has a direct interest, mainly with respect to VA Capital Company, LLC of $34.4 million in 2020.
Incentive fees increased by $14.1 million to $14.3 million in 2021 from $0.2 million in 2020. This change was primarily attributable to incentive fees earned from an SIA of $13.8 million in 2021.
Expenses
Compensation and benefits increased by $9.1 million to $595.5 million in 2021 from $586.4 million in 2020. This change was primarily attributable to an increase in salary, bonus and benefits of $30.3 million, due to an increase in bonus accruals and headcount. This change was partially offset by a decrease in profit sharing expense of $14.7$295.9 million in 2021.resulting from lower performance allocations during 2022. In any period, the blended profit sharing percentage is impacted by the respective profit sharing ratios of the funds generating performance allocations in the period.
Included This decrease was partially offset by increases in profit sharing expense is $24.6equity-based compensation of $99.8 million and $5.0an increase in salary, bonus and benefits of $43.6 million for 2021 and 2020, respectively, relateddue to the Incentive Pool. See “—Profit Sharing Expense” in the Critical Accounting Policies section for an overview of the Incentive Pool.
Interest expense increased by $2.5 million to $34.8 millionaccelerated headcount growth in 2021, from $32.3 millionincluding for certain senior level roles, as the Company strategically invests in 2020, primarily duetalent that will seek to additional interest expense incurred as a resultcapture its next leg of the timing of issuances of debt arrangements, as described in note 10 to our condensed consolidated financial statements.growth. In addition, equity-based compensation increased
as a result of: i) performance grants which are tied to the Company’s receipt of performance fees, within prescribed periods and are typically recognized on an accelerated recognition method over the requisite service period to the extent the performance revenue metrics are met or deemed probable, and ii) the impact of one-time grants awarded to the Co-Presidents which vest on a cliff basis subject to continued employment over five years and the Company’s achievement of FRE and SRE per share.
General, administrative and other expenses increased by $32.1 million to $115.8were $140.4 million in 20212022, an increase of $40.0 million from $83.7$100.4 million in 2020. This change was primarily2021. The increase in 2022 is driven by an increaseincreases in legal, consulting, and other professional fees, as well as higher recruitment fees relatedtravel and entertainment expenses, and absorption of occupancy and technology expenses to support the increase inCompany’s increased headcount.
Other Income (Loss)
NetOther Income was $1.0 billion in 2022, an increase of $580 million from $448.8 million in 2021. This increase was primarily attributable to an increase in net gains from investment activities increased by $644.7 million to $913.4 million in 2021as a result of realized investment income from $268.7 million in 2020. This change was primarily attributable to a gain from the Company’s investment in Athene Holding during 2021 as compared to the same period in 2020 due to the combined impact of COVID-19 related market dislocation and a higher discount for lack of marketability (“DLOM”) during 2020. See note 6 and 14 to the condensed consolidated financial statements for further information regarding the Company’s investment in Athene Holding.
Net gains from investment activities of consolidated VIEs increased by $87.5 million to $145.4 million in 2021 from $57.9 million in 2020. This change was primarily driven by gains from existing consolidated VIEs during 2021 as compared to losses in our consolidated VIEs in 2020 due to unrealized mark-to-market losses from COVID-19 related market dislocation, as discussed in note 5 to the condensed consolidated financial statements.
Interest income decreased by $3.3 million to $0.6 million in 2021 from $4.0 million in 2020 primarily due to lower interestdividend income earned from money market funds and U.S. Treasury securities.on one of our balance sheet investments.
Income Tax Provision
IncomeThe income tax provision totaled $(194.1)$134.2 million and $(140.3)$203.2 million forin 2022 and 2021, and 2020, respectively. The change was primarily related to the increasedecrease in pre-tax income. Significant unrealized mark-to-market gains were recognized during 2021 as compared to 2020 due to the market dislocation impact of COVID-19. The provision for income taxes includes federal, state, local and foreign income taxes resulting in an effective income tax rate of 11.4%9.5% and 12.3%11.8% for 20212022 and 2020,2021, respectively. The most significant reconciling items between ourthe U.S. federal statutory income tax rate and ourthe effective income tax rate were due to the following: (i) income passed through to Non-Controlling Interests, and (ii) foreign, state and local income taxes, including New York City unincorporated business taxes (“NYC UBTUBT”), and (iii) equity-based compensation net of the limiting provisions for executive compensation under IRC Section 162(m) (see note 910 to the condensed consolidated financial statements for further details regarding the Company’s income tax provision).
Six Months Ended June 30, 2021 Compared to Six Months Ended June 30, 2020
In this section, references to 2021 refer toManaging Business Performance
We believe that the six months ended June 30, 2021 and references to 2020 refer to the six months ended June 30, 2020.
Revenues
Management fees increased by $120.7 million to $927.3 million in 2021 from $806.6 million in 2020. This change was primarily attributable to an increase in management fees earned from Athene and Athorapresentation of $93.2 million and $19.3 million, respectively. For additional details regarding changes in management fees in each segment, see “—Adjusted Segment Analysis” below.
Advisory and transaction fees, net, increased by $43.8 million to $142.7 million in 2021 from $98.9 million in 2020. Advisory and transaction fees earned during 2021 were primarily related to transaction fees earned fromIncome supplements a company in the consumer services industry and structuring fees earned from a company in the consumer and retail industry. Advisory and transaction fees earned during 2020 were primarily related to net advisory and transaction fees earned with respect to certain portfolio companies in the media, telecom, technology, and financial services industries, net advisory and transaction fees earned related to the structuring of a loan for a portfolio company and structuring fees from a company in the consumer and retail industry.
Performance allocations increased by $2.9 billion to $2.1 billion in 2021 from $(0.8) billion in 2020. The increase in performance allocations was primarily attributable to increased performance allocations earned from Fund VIII, Fund IX, Fund VII and ANRP II of $1.4 billion, $548.4 million, $297.7 million and $158.7 million, respectively, during 2021. In 2020, the pandemic resulting from COVID-19 and the actions taken in response caused severe disruption to the global economy and financial markets and, in line with public equity and credit indices, we experienced significant unrealized mark-to-market losses in our underlying funds.
The increase in performance allocations from Fund VIII was primarily driven by higher appreciation in the valuereader’s understanding of the fund’s investmentseconomic operating performance of our segments.
Adjusted Segment Income
Adjusted Segment Income is the key performance measure used by management in public portfolio companies primarily inevaluating the consumer services, media, telecomperformance of Apollo’s asset management and technology, and
financial services sectors, as well as appreciation in private portfolio companies primarily in the natural resources and media, telecom and technology sectors during 2021.
The increase in performance allocations from Fund IX was primarily driven by appreciation in the value of the fund’s investments in private portfolio companies in the media, telecom and technology, leisure and financial services sectors during 2021. Moreover, the fund achieved its annualized hurdle rate in 2021 whereas it was below the annualized hurdle rate in 2020.
The increase in performance allocations from Fund VII was primarily driven by appreciation in the value of the fund’s investments in private portfolio companies in the consumer services sector and in public portfolio companies in the consumer and retail and natural resources sectors during 2021.
The increase in performance allocations from ANRP II was primarily driven by appreciation in the value of the fund’s public and private investments in the natural resources sector during 2021. Moreover, the fund achieved its annualized hurdle rate in 2021 whereas it was below the annualized hurdle rate in 2020.
Principal investment income increased by $534.6 million to $458.4 million in 2021 from $(76.2) million in 2020. This change was primarily driven by increases in the value of investments held by certain Apollo funds and other entities in which the Company has a direct interest, mainly with respect to VA Capital Company, LLC, Fund VIII, Fund IX, Redding Ridge Holdings and Fund VII of $210.8 million, $144.0 million, $48.9 million, $23.5 million and $17.9 million, respectively. The impact of the COVID-19 pandemic led to unrealized principal investment losses during 2020.
Expenses
Compensation and benefits increased by $1.3 billion to $1.5 billion in 2021 from $141.8 million in 2020. This change was primarily attributable to an increase in profit sharing expense of $1.3 billion due to a corresponding increase in performance allocations during 2021, as compared to the same period in 2020. In any period, the blended profit sharing percentage is impacted by the respective profit sharing ratios of the funds generating performance allocations in the period. Additionally, there was an increase in salary, bonus and benefits of $65.6 million, primarily attributable to an increase in bonus accruals and headcount.
Included in profit sharing expense is $35.7 million and $42.9 million for 2021 and 2020, respectively, related to the Incentive Pool. See “—Profit Sharing Expense” in the Critical Accounting Policies section for an overview of the Incentive Pool.
Interest expense increased by $6.1 million to $69.6 million in 2021 from $63.5 million in 2020, primarily due to additional interest expense incurred as a result of the timing of issuances of debt arrangements, as described in note 10 to our condensed consolidated financial statements.
General, administrative and other expenses increased by $47.4 million to $215.7 million in 2021 from $168.3 million in 2020. This change was primarily driven by an increase in legal, consulting, and other professional fees as well as higher recruitment expenses during 2021.
Other Income (Loss)
Net gains (losses) from investment activities increased by $2.3 billion to $1.3 billion in 2021 from $(1.0) billion in 2020. This change was primarily attributable to a gain from the Company’s investment in Athene Holding during 2021 as compared to a loss on the Company’s investment in Athene Holding due to the combined impact of COVID-19 related market dislocation and a higher DLOM during 2020.investing segments. See note 6 and 1416 to the condensed consolidated financial statements for further informationmore details regarding the Company’s investmentcomponents of Adjusted Segment Income.
We believe that Adjusted Segment Income is helpful for an understanding of our business and that investors should review the same supplemental financial measure that management uses to analyze our segment performance. This measure supplements and should be considered in Athene Holding.
Net gains (losses) from investment activitiesaddition to and not in lieu of consolidated VIEs increased by $366.1 million to $258.0 millionthe results of operations discussed below in 2021 from $(108.1) million“—Overview of Results of Operations” that have been prepared in 2020. This change was primarily driven by gains from new and existing consolidated VIEs during 2021 as compared to net losses in our consolidated VIEs in 2020 due to unrealized mark-to-market losses from COVID-19 related market dislocation, as discussed in note 5 to the condensed consolidated financial statements.accordance with U.S. GAAP. See note 516 to the condensed consolidated financial statements for more details regarding net gains from investment activitiesmanagement’s consideration of consolidated VIEs.Segment Earnings.
Interest income decreased by $10.5 millionFee Related Earnings and Principal Investing Income
FRE is a component of Adjusted Segment Income and represents the performance measure used to $1.4 million in 2021 from $11.9 million in 2020, primarily dueassess the performance of the asset management segment.
PII is a component of Adjusted Segment Income and represents the performance measure used to lower interest income earned from money market funds and U.S. Treasury securities in 2021. Throughout 2021,assess the Company has invested a smaller portionperformance of its cash in U.S. Treasury securities compared to 2020.the principal investing segment.
Income Tax Provision
The income tax (provision) benefit totaled $(397.3) million and $155.5 million in 2021 and 2020, respectively. The change was primarily related to the increase in pre-tax income. Significant unrealized mark-to-market book gains were recognized in 2021 as compared to (and in larger part reversing) the unrealized mark-to-market book losses recognized in 2020. The provision for income taxes includes federal, state, local and foreign income taxes resulting in an effective income tax rate of 11.6% and 10.8% for 2021 and 2020, respectively. The most significant reconciling items between our U.S. federal statutory income tax rate and our effective income tax rate were due to the following: (i) income passed through to Non-Controlling Interests; and (ii) foreign, state and local income taxes including NYC UBT (seeSee note 916 to the condensed consolidated financial statements for furthermore details regarding the Company’scomponents of FRE and PII.
We use Adjusted Segment Income, FRE, and PII as measures of operating performance, not as measures of liquidity. These measures should not be considered in isolation or as a substitute for net income tax provision).or other income data prepared in accordance with U.S. GAAP. The use of these measures without consideration of their related U.S. GAAP measures is not adequate due to the adjustments described above.
Segment Analysis
Discussed below are our results of operations for each of our reportable segments. They represent the segment information available and utilized by our chief operating decision makermanagement to assess performance and to allocate resources. See note 16 to our condensed consolidated financial statements for more information regarding our segment reporting.
Our financial results vary, since performance fees, which generally constitute a large portion of the income from the funds that we manage, as well as the transaction and advisory fees that we receive, can vary significantly from quarter to quarter and year to year. As a result, we emphasize long-term financial growth and profitability to manage our business.
CreditAsset Management
The following table sets forth our segment statement of operations information and our supplementalpresents Fee Related Earnings, the performance measure Segment Distributable Earnings, withinof our creditasset management segment.
| | | | | | | | | | | | | | | | | | | | | | | | | | | | | | | | | | | | | | | | | | | | |
| | For the Three Months Ended June 30, | | Total Change | | Percentage Change | For the Six Months Ended June 30, | | Total Change | | Percentage Change |
| | 2021 | | 2020 | | | 2021 | | 2020 | | |
| | | | | | | | | (in thousands) | | |
| Credit: | | | | | | | | | | | | | | |
| Management fees | $ | 273,307 | | | $ | 224,721 | | | $ | 48,586 | | | 21.6% | $ | 541,338 | | | $ | 432,950 | | | $ | 108,388 | | | 25.0% |
| Advisory and transaction fees, net | 54,757 | | | 13,756 | | | 41,001 | | | 298.1 | 87,887 | | | 29,023 | | | 58,864 | | | 202.8 |
Performance fees(1) | 8,075 | | | 3,440 | | | 4,635 | | | 134.7 | 16,846 | | | 5,844 | | | 11,002 | | | 188.3 |
| Fee Related Revenues | 336,139 | | | 241,917 | | | 94,222 | | | 38.9 | 646,071 | | | 467,817 | | | 178,254 | | | 38.1 |
| Salary, bonus and benefits | (75,299) | | | (52,806) | | | (22,493) | | | 42.6 | (144,678) | | | (109,814) | | | (34,864) | | | 31.7 |
| General, administrative and other | (43,590) | | | (37,251) | | | (6,339) | | | 17.0 | (80,219) | | | (72,624) | | | (7,595) | | | 10.5 |
| Placement fees | (589) | | | (358) | | | (231) | | | 64.5 | (1,066) | | | (664) | | | (402) | | | 60.5 |
| Fee Related Expenses | (119,478) | | | (90,415) | | | (29,063) | | | 32.1 | (225,963) | | | (183,102) | | | (42,861) | | | 23.4 |
| Other income (loss), net of Non-Controlling Interest | (990) | | | (724) | | | (266) | | | 36.7 | (1,549) | | | (1,387) | | | (162) | | | 11.7 |
| Fee Related Earnings | 215,671 | | | 150,778 | | | 64,893 | | | 43.0 | 418,559 | | | 283,328 | | | 135,231 | | | 47.7 |
| Realized performance fees | 103,789 | | | 4,359 | | | 99,430 | | | NM | 118,160 | | | 30,220 | | | 87,940 | | | 291.0 |
| Realized profit sharing expense | (71,970) | | | (4,359) | | | (67,611) | | | NM | (79,924) | | | (29,916) | | | (50,008) | | | 167.2 |
| Net Realized Performance Fees | 31,819 | | | — | | | 31,819 | | | NM | 38,236 | | | 304 | | | 37,932 | | | NM |
Realized principal investment income, net(2) | 2,588 | | | 1,810 | | | 778 | | | 43.0 | 4,435 | | | 3,184 | | | 1,251 | | | 39.3 |
| Net interest loss and other | (11,869) | | | (11,857) | | | (12) | | | 0.1 | (25,654) | | | (28,971) | | | 3,317 | | | (11.4) |
| Segment Distributable Earnings | $ | 238,209 | | | $ | 140,731 | | | $ | 97,478 | | | 69.3% | $ | 435,576 | | | $ | 257,845 | | | $ | 177,731 | | | 68.9% |
| | | | | | | | | | | | | | |
| | | | | | | | | | | | | | | | | | | | | | | |
| | Three Months ended March 31, | | Total Change | | Percentage Change |
| | 2022 | | 2021 | | |
| | (in thousands) | | |
| Asset Management: | | | | | | | |
| Management fees - Yield | $ | 333,305 | | | $ | 281,076 | | | $ | 52,229 | | | 18.6% |
| Management fees - Hybrid | 48,346 | | | 39,177 | | | 9,169 | | | 23.4 |
| Management fees - Equity | 123,750 | | | 133,631 | | | (9,881) | | | (7.4) |
| Management fees | 505,401 | | | 453,884 | | | 51,517 | | | 11.4 |
| Advisory and transaction fees, net | 64,113 | | | 55,495 | | | 8,618 | | | 15.5 |
| Fee-related performance fees | 14,226 | | | 8,771 | | | 5,455 | | | 62.2 |
| Fee-related compensation | (175,372) | | | (154,395) | | | (20,977) | | | 13.6 |
| Other operating expenses | (98,384) | | | (62,064) | | | (36,320) | | | 58.5 |
| Fee Related Earnings (FRE) | $ | 309,984 | | | $ | 301,691 | | | $ | 8,293 | | | 2.7 |
| | | | | | | | | | | | | | | | | | | | | | | |
| | Three Months ended March 31, | | Total Change | | Percentage Change |
| | 2021 | | 2020 | | |
| | (in thousands) | | |
| Asset Management: | | | | | | | |
| Management fees - Yield | $ | 281,076 | | | $ | 214,450 | | | $ | 66,626 | | | 31.1% |
| Management fees - Hybrid | 39,177 | | | 30,070 | | | 9,107 | | | 30.3 |
| Management fees - Equity | 133,631 | | | 137,848 | | | (4,217) | | | (3.1) |
| Management fees | 453,884 | | | 382,368 | | | 71,516 | | | 18.7 |
| Advisory and transaction fees, net | 55,495 | | | 36,732 | | | 18,763 | | | 51.1 |
| Fee-related performance fees | 8,771 | | | 2,404 | | | 6,367 | | | 264.9 |
| Fee-related compensation | (154,395) | | | (118,456) | | | (35,939) | | | 30.3 |
| Other operating expenses | (62,064) | | | (62,145) | | | 81 | | | (0.1) |
| Fee Related Earnings (FRE) | $ | 301,691 | | | $ | 240,903 | | | $ | 60,788 | | | 25.2 |
| | | | | | | |
(1)Represents certain performance fees from business development companies, Redding Ridge Holdings, and MidCap.
(2)Realized principal investment income, net includes dividends from our permanent capital vehicles, net of such amounts used to compensate employees.
Three Months Ended June 30,March 31, 2022 Compared to Three Months Ended March 31, 2021
In this section, references to 2022 refer to the three months ended March 31, 2022 and references to 2021 refer to the three months ended March 31, 2021.
FRE was $310.0 million in 2022, an increase of $8.3 million compared to $301.7 million in 2021. This increase was primarily attributable to continued growth in management fees and advisory and transaction fees. The increase in management fees was primarily driven by yield funds from increased Fee-Generating AUM inflows primarily from our perpetual capital vehicles. The growth in revenues was offset, in part, by higher fee-related compensation expenses and other operating expenses as we expand our global team and absorb occupancy and technology costs.
Three Months Ended March 31, 2021 Compared to Three Months Ended June 30,March 31, 2020
In this section, references to 2021 refer to the three months ended June 30,March 31, 2021 and references to 2020 refer to the three months ended June 30,March 31, 2020.
Management fees increased by $48.6 million to $273.3
FRE was $301.7 million in 2021, from $224.7an increase of $60.8 million compared to $240.9 million in 2020. This changeincrease was primarily attributable to angrowth in management fees and advisory and transaction fees. The increase in management fees earnedwas primarily driven by yield funds from Athene of $44.5 million during 2021.increased Fee-Generating AUM inflows primarily from our perpetual capital vehicles. The growth in revenues was offset, in part, by higher fee-related compensation expense due to an increase in headcount as we continued to
Advisoryexpand our global team in 2021.
Asset Management Operating Metrics
We monitor certain operating metrics that are common to the alternative asset management industry and directly impact the performance of our asset management segment. These operating metrics include Assets Under Management, Gross capital deployment and uncalled commitments.
Assets Under Management
The following presents Apollo’s Total AUM and Fee-Generating AUM by investing strategy (in billions):
The following presents Apollo’s AUM with Future Management Fee Potential by investing strategy (in billions):
The following tables present the components of Performance Fee-Eligible AUM for each of Apollo’s three investing strategies within the asset management segment:
| | | | | | | | | | | | | | | | | | | | | | | |
| As of March 31, 2022 |
| Yield(1) | | Hybrid | | Equity | | Total |
| | (in millions) |
Performance Fee-Generating AUM (1) | $ | 37,000 | | | $ | 18,187 | | | $ | 41,482 | | | $ | 96,669 | |
| AUM Not Currently Generating Performance Fees | 7,637 | | | 6,250 | | | 4,231 | | | 18,118 | |
| Uninvested Performance Fee-Eligible AUM | 4,396 | | | 14,896 | | | 18,711 | | | 38,003 | |
| Total Performance Fee-Eligible AUM | $ | 49,033 | | | $ | 39,333 | | | $ | 64,424 | | | $ | 152,790 | |
| | | | | | | | | | | | | | | | | | | | | | | |
| As of March 31, 2021 |
| Yield | | Hybrid | | Equity | | Total |
| | (in millions) |
Performance Fee-Generating AUM (1) | $ | 31,302 | | | $ | 15,061 | | | $ | 35,898 | | | 82,261 | |
| AUM Not Currently Generating Performance Fees | 6,760 | | | 4,701 | | | 3,147 | | | 14,608 | |
| Uninvested Performance Fee-Eligible AUM | 2,526 | | | 15,113 | | | 28,323 | | | 45,962 | |
| Total Performance Fee-Eligible AUM | $ | 40,588 | | | $ | 34,875 | | | $ | 67,368 | | | 142,831 | |
| | | | | | | | | | | | | | | | | | | | | | | |
| As of December 31, 2021 |
| Yield | | Hybrid | | Equity | | Total |
| | (in millions) |
Performance Fee-Generating AUM (1) | $ | 37,756 | | | $ | 17,663 | | | $ | 37,447 | | | $ | 92,866 | |
| AUM Not Currently Generating Performance Fees | 2,355 | | | 4,971 | | | 3,614 | | | 10,940 | |
| Uninvested Performance Fee-Eligible AUM | 2,644 | | | 16,478 | | | 21,075 | | | 40,197 | |
| Total Performance Fee-Eligible AUM | $ | 42,755 | | | $ | 39,112 | | | $ | 62,136 | | | $ | 144,003 | |
| | | | | | | |
(1) Performance Fee-Generating AUM of $5.2 billion, $5.1 billion and $5.2 billion as of March 31, 2022, March 31, 2021 and December 31, 2021 respectively, are above the hurdle rates or preferred returns and have been deferred to future periods when the fees are probable to not be significantly reversed. |
The components of Fee-Generating AUM by investing strategy are presented below:
| | | | | | | | | | | | | | | | | | | | | | | |
| | As of March 31, 2022 |
| | Yield | | Hybrid | | Equity | | Total |
| | (in millions) |
| Fee-Generating AUM based on capital commitments | $ | — | | | $ | 3,580 | | | $ | 27,348 | | | $ | 30,928 | |
| Fee-Generating AUM based on invested capital | 2,448 | | | 7,533 | | | 12,790 | | | 22,771 | |
| Fee-Generating AUM based on gross/adjusted assets | 275,373 | | | 4,913 | | | 546 | | | 280,832 | |
| Fee-Generating AUM based on NAV | 33,497 | | | 7,475 | | | 216 | | | 41,188 | |
| Total Fee-Generating AUM | $ | 311,318 | | | $ | 23,501 | | | $ | 40,900 | | (1) | $ | 375,719 | |
| | | | | | | |
(1) The weighted average remaining life of the traditional private equity funds as of March 31, 2022 was 62 months. |
| | | | | | | | | | | | | | | | | | | | | | | |
| | As of March 31, 2021 |
| | Yield | | Hybrid | | Equity | | Total |
| | (in millions) |
| Fee-Generating AUM based on capital commitments | $ | 100 | | | $ | 2,150 | | | $ | 30,764 | | | $ | 33,014 | |
| Fee-Generating AUM based on invested capital | 1,622 | | | 6,073 | | | 13,376 | | | 21,071 | |
| Fee-Generating AUM based on gross/adjusted assets | 252,582 | | | 3,038 | | | 994 | | | 256,614 | |
| Fee-Generating AUM based on NAV | 27,161 | | | 7,115 | | | 271 | | | 34,547 | |
| Total Fee-Generating AUM | $ | 281,465 | | | $ | 18,376 | | | $ | 45,405 | | (1) | $ | 345,246 | |
| | | | | | | |
(1) The weighted average remaining life of the traditional private equity funds at March 31, 2021 was 70 months. |
| | | | | | | | | | | | | | | | | | | | | | | |
| | As of December 31, 2021 |
| | Yield | | Hybrid | | Equity | | Total |
| | (in millions) |
| Fee-Generating AUM based on capital commitments | $ | — | | | $ | 3,580 | | | $ | 27,277 | | | $ | 30,857 | |
| Fee-Generating AUM based on invested capital | 2,321 | | | 6,826 | | | 12,075 | | | 21,222 | |
| Fee-Generating AUM based on gross/adjusted assets | 273,695 | | | 4,293 | | | 406 | | | 278,394 | |
| Fee-Generating AUM based on NAV | 31,290 | | | 7,146 | | | 192 | | | 38,628 | |
| Total Fee-Generating AUM | $ | 307,306 | | | $ | 21,845 | | | $ | 39,950 | | (1) | $ | 369,101 | |
| | | | | | | |
(1) The weighted average remaining life of the traditional private equity funds as of December 31, 2021 was 64 months. |
Apollo, through its consolidated subsidiary, ISG, provides asset management services to Athene with respect to assets in the Athene Accounts, including asset allocation services, direct asset management services, asset and liability matching management, mergers and acquisitions, asset diligence, hedging and other asset management services and receives management fees for providing these services. Apollo, through ISG, also provides sub-allocation services with respect to a portion of the assets in the Athene Accounts. See note 14 to the condensed consolidated financial statements for more details regarding the fee rates of the investment management and sub-allocation fee arrangements with respect to the assets in the Athene Accounts. Apollo managed or advised $217.6 billion, $212.6 billion, and $185.8 billion of AUM on behalf of Athene as of March 31, 2022, December 31, 2021 and March 31, 2021, respectively.
Apollo, through ISGI, provides investment advisory services with respect to certain assets in certain portfolio companies of Apollo funds and sub-advises the Athora Accounts and broadly refers to “Athora Sub-Advised” assets as those assets in the Athora Accounts which the Company explicitly sub-advises as well as those assets in the Athora Accounts which are invested directly in funds and investment vehicles Apollo manages. The Company refers to the portion of the Athora AUM that is not Athora Sub-Advised AUM as “Athora Non-Sub Advised” AUM. See note 14 to the condensed consolidated financial statements for more details regarding the fee arrangements with respect to the assets in the Athora Accounts. Apollo managed or advised $54.8 billion, $59.0 billion, and $61.5 billion of AUM on behalf of Athora as of March 31, 2022, December 31, 2021 and March 31, 2021, respectively.
The following tables summarize changes in total AUM for each of Apollo’s three investing strategies:
| | | | | | | | | | | | | | | | | | | | | | | | | | | | | | | | | | | | | | | | | | | | | | | |
| For the Three Months Ended March 31, |
| | 2022 | | 2021 |
| Yield | | Hybrid | | Equity | | Total | | Yield | | Hybrid | | Equity | | Total |
| | (in millions) |
Change in Total AUM(1): | | | | | | | | | | | | | | | |
| Beginning of Period | $ | 360,289 | | | $ | 52,772 | | | $ | 84,491 | | | $ | 497,552 | | | $ | 332,880 | | | $ | 42,317 | | | $ | 80,289 | | | $ | 455,486 | |
| Inflows | 26,859 | | | 2,439 | | | 1,359 | | | 30,657 | | | 11,628 | | | 2,806 | | | 889 | | | 15,323 | |
Outflows(2) | (9,547) | | | (453) | | | — | | | (10,000) | | | (7,645) | | | (196) | | | (58) | | | (7,899) | |
| Net Flows | 17,312 | | | 1,986 | | | 1,359 | | | 20,657 | | | 3,983 | | | 2,610 | | | 831 | | | 7,424 | |
| Realizations | (626) | | | (1,640) | | | (2,246) | | | (4,512) | | | (477) | | | (936) | | | (2,298) | | | (3,711) | |
Market Activity(3) | (4,279) | | | 622 | | | 2,803 | | | (854) | | | (7,603) | | | 1,451 | | | 8,091 | | | 1,939 | |
| End of Period | $ | 372,696 | | | $ | 53,740 | | | $ | 86,407 | | | $ | 512,843 | | | $ | 328,783 | | | $ | 45,442 | | | $ | 86,913 | | | $ | 461,138 | |
| | | | | | | | | | | | | | | |
(1) At the individual strategy level, inflows include new subscriptions, commitments, capital raised, other increases in available capital, purchases, acquisitions and portfolio company appreciation. Outflows represent redemptions, other decreases in available capital and portfolio company depreciation. Realizations represent fund distributions of realized proceeds. Market activity represents gains (losses), the impact of foreign exchange rate fluctuations and other income. |
(2) Outflows for Total AUM include redemptions of $0.6 billion and $0.7 billion during the three months ended March 31, 2022 and 2021, respectively. |
(3) Includes foreign exchange impacts of $(2.5) billion and $(3.3) billion during the three months ended March 31, 2022 and 2021, respectively. |
The following tables summarize changes in Fee-Generating AUM for each of Apollo’s three investing strategies:
| | | | | | | | | | | | | | | | | | | | | | | | | | | | | | | | | | | | | | | | | | | | | | | |
| For the Three Months Ended March 31, |
| | 2022 | | 2021 |
| Yield | | Hybrid | | Equity | | Total | | Yield | | Hybrid | | Equity | | Total |
| | (in millions) |
Change in Fee-Generating AUM(1): | | | | | | | | | | | | | | |
| Beginning of Period | $ | 307,306 | | | $ | 21,845 | | | $ | 39,950 | | | $ | 369,101 | | | $ | 285,830 | | | $ | 17,622 | | | $ | 45,222 | | | $ | 348,674 | |
| Inflows | 16,453 | | | 2,510 | | | 1,309 | | | 20,272 | | | 9,335 | | | 1,701 | | | 438 | | | 11,474 | |
Outflows(2) | (8,773) | | | (299) | | | (70) | | | (9,142) | | | (6,334) | | | (978) | | | (83) | | | (7,395) | |
| Net Flows | 7,680 | | | 2,211 | | | 1,239 | | | 11,130 | | | 3,001 | | | 723 | | | 355 | | | 4,079 | |
| Realizations | (309) | | | (582) | | | (263) | | | (1,154) | | | (309) | | | (359) | | | (149) | | | (817) | |
Market Activity(3) | (3,359) | | | 27 | | | (26) | | | (3,358) | | | (7,057) | | | 390 | | | (23) | | | (6,690) | |
| End of Period | $ | 311,318 | | | $ | 23,501 | | | $ | 40,900 | | | $ | 375,719 | | | $ | 281,465 | | | $ | 18,376 | | | $ | 45,405 | | | $ | 345,246 | |
| | | | | | | | | | | | | | | |
(1) At the individual strategy level, inflows include new subscriptions, commitments, capital raised, other increases in available capital, purchases, acquisitions and portfolio company appreciation. Outflows represent redemptions, other decreases in available capital and portfolio company depreciation. Realizations represent fund distributions of realized proceeds. Market activity represents gains (losses), the impact of foreign exchange rate fluctuations and other income. |
(2) Outflows for Fee-Generating AUM include redemptions of $0.4 billion and $0.7 billion during the three months ended March 31, 2022 and 2021, respectively. |
(3) )Includes foreign exchange impacts of $(1.9) billion and $(2.8) billion, during the three months ended March 31, 2022 and 2021, respectively. |
Gross Capital Deployment and Uncalled Commitments
Gross capital deployment represents the gross capital that has been invested in investments by the funds and accounts we manage during the relevant period, but excludes certain investment activities primarily related to hedging and cash management functions at the firm. Gross capital deployment is not reduced or netted down by sales or refinancings, and takes into account leverage used by the funds and accounts we manage in gaining exposure to the various investments that they have made.
Uncalled commitments, by contrast, represent unfunded capital commitments that certain of Apollo’s funds have received from fund investors to fund future or current fund investments and expenses.
Gross capital deployment and uncalled commitments are indicative of the pace and magnitude of fund capital that is deployed or will be deployed, and which therefore could result in future revenues that include management fees, transaction fees net increased by $41.0 millionand performance fees to $54.8the extent they are fee-generating. Gross capital deployment and uncalled commitments can also give rise to future costs that are related to the hiring of additional resources to manage and account for the additional capital that is deployed or will be deployed. Management uses gross capital deployment and uncalled commitments as key operating metrics since we believe the results are measures of investment activities of the funds we manage.
The following presents gross capital deployment and uncalled commitments (in billions):
As of March 31, 2022 and December 31, 2021, Apollo had $47.9 billion and $47.2 billion of dry powder, respectively, which represents the amount of capital available for investment or reinvestment subject to the provisions of the applicable governing agreements of the funds, partnerships and accounts we manage. These amounts exclude uncalled commitments which can only be called for fund fees and expenses, and commitments from perpetual capital vehicles.
Principal Investing
The following table presents Principal Investing Income, the performance measure of our principal investing segment.
| | | | | | | | | | | | | | | | | | | | | | | |
| Three Months ended March 31, | | Total Change | | Percentage Change |
| | 2022 | | 2021 | | |
| | (in thousands) | | |
| Principal Investing: | | | | | | | |
| Realized performance fees | $ | 127,189 | | | $ | 106,754 | | | $ | 20,435 | | | 19.1% |
| Realized investment income | 439,408 | | | 30,015 | | | 409,393 | | | NM |
| Principal investing compensation | (155,988) | | | (68,225) | | | (87,763) | | | 128.6 |
| Other operating expenses | (5,964) | | | (7,374) | | | 1,410 | | | (19.1) |
| Principal Investing Income (PII) | $ | 404,645 | | | $ | 61,170 | | | $ | 343,475 | | | NM |
| | | | | | | | | | | | | | | | | | | | | | | |
| Three Months ended March 31, | | Total Change | | Percentage Change |
| | 2021 | | 2020 | | |
| | (in thousands) | | |
| Principal Investing: | | | | | | | |
| Realized performance fees | $ | 106,754 | | | $ | 65,746 | | | $ | 41,008 | | | 62.4% |
| Realized investment income | 30,015 | | | 9,930 | | | 20,085 | | | 202.3 |
| Principal investing compensation | (68,225) | | | (73,851) | | | 5,626 | | | (7.6) |
| Other operating expenses | (7,374) | | | (23,121) | | | 15,747 | | | (68.1) |
| Principal Investing Income (PII) | $ | 61,170 | | | $ | (21,296) | | | $ | 82,466 | | | NM |
Three Months Ended March 31, 2022 Compared to Three Months Ended March 31, 2021
In this section, references to 2022 refer to the three months ended March 31, 2022 and references to 2021 refer to the three months ended March 31, 2021.
As described in “Item 2. Management’s Discussion and Analysis of Financial Condition and Results of Operations — General”, earnings from our principal investing segment are inherently more volatile in nature than earnings from our asset management segment due to the intrinsic cyclical nature of performance fees, one of the key drivers of PII performance.
PII was $404.6 million in 2021 from $13.82022, an increase of $343.5 million, as compared to $61.2 million in 2020.2021. This increase was primarily driven by structuring fees earned from a company in the consumer and retail industry.
Performance fees increased by $4.6 million to $8.1 million in 2021 from $3.4 million in 2020, primarily attributable to an increase in performance fees earned from Redding Ridge Holdings of $10.0 million, partially offset by a decrease in performance fees earned from Midcap and a business development company of $3.6 million and $1.8 million, respectively. Redding Ridge Holdings achieved its annualized hurdle rate during 2021 but did not do so in 2020.
Salary, bonus and benefits expense increased by $22.5 million to $75.3 million in 2021 from $52.8 million in 2020 primarily due to an increase in headcount as the Company continues to invest in its businesses.
General, administrative and other expenses increased by $6.3 million to $43.6 million in 2021 from $37.3 million in 2020. This increase was primarily driven by an increase in professional fees and other miscellaneous expenses.
Realized performance fees increased by $99.4 million to $103.8 million in 2021 from $4.4 million in 2020. This change was primarily attributable to an increase in realized investment income from dividends earned from one of our balance sheet investments and also includes realized gains on certain of Apollo’s general partner fund co-investments transferred to Athene that are expected to be transferred to a fund managed by Apollo including third-party capital. Realized performance fees generated from the sale of a mortgage business and an SIA of $75.0 million and $13.8 million, respectively.
The realized performance fees from the SIA were primarily driven by mark-to-market gains on its investments in structured credit products due to widespread market appreciation and spread tightening during 2021 as compared to the same period in 2020.
Realized profit sharing expense increased by $67.619.1% to $127.2 million to $72.0in 2022 from $106.8 million in 2021 as equity market volatility delayed monetization activity from $4.4 million in 2020,Fund VIII and Fund IX.
Principal investing compensation expense increased as a result of a corresponding increase in realized performance fees as described above, and an increase in the profit sharing expense related to the Incentive Pool.fees. In any period the blended profit sharing percentage is impacted by the respective profit sharing ratios of the funds generating performance fees in the period. IncludedAdditionally, included in realized profit sharing expense is $3.5 million and $1.3 millionprincipal investing compensation are expenses related to the Incentive Pool for 2021 and 2020, respectively.Pool. The Incentive Pool is separate from the fund related profit sharing expense and may result in greater variability in compensation and have a variable impact on the blended profit sharing percentage during a particular period.
Realized principal investment income increased by $0.8 million to $2.6 million in 2021 from $1.8 million in 2020. This change was primarily attributable to an increase in realizations from Apollo’s equity ownership in Midcap in 2021.
Six Months Ended June 30, 2021 Compared to Six Months Ended June 30, 2020
In this section, references to 2021 refer to the six months ended June 30, 2021 and references to 2020 refer to the six months ended June 30, 2020.
Management fees increased by $108.4 million to $541.3 million in 2021 from $433.0 million in 2020. This change was primarily attributable to an increase in management fees earned from Athene and Athora of $83.9 million and $17.3 million, respectively.
Advisory and transaction fees, net increased by $58.9 million to $87.9 million in 2021 from $29.0 million in 2020. This increase was primarily driven by advisory and transaction fees earned related to portfolio companies in the consumer and retail industries during 2021.
Performance fees increased by $11.0 million to $16.8 million in 2021 from $5.8 million in 2020, primarily attributable to an increase in performance fees earned from Redding Ridge Holdings of $14.1 million partially offset by a decrease in performance fees earned from Midcap of $3.5 million during 2021. Redding Ridge Holdings achieved its annualized hurdle rate during 2021 but did not do so in 2020.
Salary, bonus and benefits expense increased by $34.9 million to $144.7 million in 2021 from $109.8 million in 2020 primarily due to an increase in headcount and bonus accruals.
General, administrative and other expenses increased by $7.6 million to $80.2 million in 2021 from $72.6 million in 2020. This increase was primarily driven by an increase in consulting and legal fees and other miscellaneous expenses.
Realized performance fees increased by $87.9 million to $118.2 million in 2021 from $30.2 million in 2020. This change was primarily attributable to an increase in realized performance fees generated from the sale of a mortgage business of $75.0 million.
Realized profit sharing expense increased by $50.0 million to $79.9 million in 2021 from $29.9 million in 2020, as a result of a corresponding increase in realized performance fees as described above, and decrease in profit sharing expense related to the Incentive Pool. In any period the blended profit sharing percentage is impacted by the respective profit sharing ratios of the funds generating performance fees in the period. Included in realized profit sharing expense is $5.4 million and $16.6 million related to the Incentive Pool for 2021 and 2020, respectively. The Incentive Pool is separate from the fund related profit sharing expense and may result in greater variability in compensation and have a variable impact on the blended profit sharing percentage during a particular period.
Realized principal investment income increased by $1.3 million to $4.4 million in 2021 from $3.2 million in 2020. This change was primarily attributable to an increase in realization from Apollo’s equity ownership in Midcap, partially offset by a decrease in realizations from AINV.
Net interest loss and other decreased by $3.3 million to $25.7 million in 2021 from $29.0 million in 2020. The higher expenses incurred in 2020 were primarily due to one-time costs to wind down a managed account arrangement.
Private Equity
The following table sets forth our segment statement of operations information and our supplemental performance measure, Segment Distributable Earnings, within our private equity segment.
| | | | | | | | | | | | | | | | | | | | | | | | | | | | | | | | | | | | | | | | | | | | | | | |
| For the Three Months Ended June 30, | | Total Change | | Percentage Change | | For the Six Months Ended June 30, | | Total Change | | Percentage Change |
| 2021 | | 2020 | | | | 2021 | | 2020 | | |
| (in thousands) | | | | | | | | | | |
| Private Equity: | | | | | | | | | | | | | | | |
| Management fees | $ | 123,106 | | | $ | 127,592 | | | $ | (4,486) | | | (3.5)% | | $ | 245,374 | | | $ | 252,860 | | | $ | (7,486) | | | (3.0)% |
| Advisory and transaction fees, net | 27,047 | | | 44,802 | | | (17,755) | | | (39.6) | | 48,378 | | | 65,145 | | | (16,767) | | | (25.7) |
| Fee Related Revenues | 150,153 | | | 172,394 | | | (22,241) | | | (12.9) | | 293,752 | | | 318,005 | | | (24,253) | | | (7.6) |
| Salary, bonus and benefits | (58,856) | | | (53,202) | | | (5,654) | | | 10.6 | | (117,605) | | | (95,682) | | | (21,923) | | | 22.9 |
| General, administrative and other | (27,546) | | | (21,770) | | | (5,776) | | | 26.5 | | (48,675) | | | (43,764) | | | (4,911) | | | 11.2 |
| Placement fees | — | | | — | | | — | | | NM | | — | | | (107) | | | 107 | | | (100.0) |
| Fee Related Expenses | (86,402) | | | (74,972) | | | (11,430) | | | 15.2 | | (166,280) | | | (139,553) | | | (26,727) | | | 19.2 |
| Other income, net | 696 | | | 2 | | | 694 | | | NM | | 1,419 | | | 25 | | | 1,394 | | | NM |
| Fee Related Earnings | 64,447 | | | 97,424 | | | (32,977) | | | (33.8) | | 128,891 | | | 178,477 | | | (49,586) | | | (27.8) |
| Realized performance fees | 361,793 | | | 3,549 | | | 358,244 | | | NM | | 432,714 | | | 4,692 | | | 428,022 | | | NM |
| Realized profit sharing expense | (173,191) | | | (3,549) | | | (169,642) | | | NM | | (210,781) | | | (4,996) | | | (205,785) | | | NM |
| Net Realized Performance Fees | 188,602 | | | — | | | 188,602 | | | NM | | 221,933 | | | (304) | | | 222,237 | | | NM |
| Realized principal investment income | 67,102 | | | 3,404 | | | 63,698 | | | NM | | 88,805 | | | 3,946 | | | 84,859 | | | NM |
| Net interest loss and other | (13,738) | | | (11,686) | | | (2,052) | | | 17.6 | | (27,236) | | | (27,360) | | | 124 | | | (0.5) |
| Segment Distributable Earnings | $ | 306,413 | | | $ | 89,142 | | | $ | 217,271 | | | 243.7% | | $ | 412,393 | | | $ | 154,759 | | | $ | 257,634 | | | 166.5% |
Three Months Ended June 30,March 31, 2021 Compared to Three Months Ended June 30,March 31, 2020
In this section, references to 2021 refer to the three months ended June 30,March 31, 2021 and references to 2020 refer to the three months ended June 30,March 31, 2020.
Management fees decreased by $4.5 million to $123.1PII was $61.2 million in 2021, from $127.6an increase of $82.5 million, as compared to $(21.3) million in 2020. This changeincrease was primarily attributable to a decreaseincreases in management fees earned from ANRP II and Fund VIII of $6.7 million and $2.8 million, respectively, partially offset by an increase in management fees earned from ANRP III and HVF I of $4.3 million and $3.8 million, respectively.
Advisory and transaction fees, net decreased by $17.8 million to $27.0 million in 2021 from $44.8 million in 2020. Advisory and transaction fees in 2021 were primarily attributable to a transaction fee in the consumer services industry. Advisory and transaction fees in 2020 were primarily attributable to a transaction fee earned with respect to a portfolio company in the media, telecom and technology industry and a structuring fee earned from a portfolio company in the consumer and retail industry.
Salary, bonus and benefits expense increased by $5.7 million to $58.9 million in 2021 from $53.2 million in 2020 primarily due to an increase in headcount.
General, administrative and other expenses increased by $5.8 million to $27.5 million in 2021 from $21.8 million in 2020. This change was primarily driven by an increase in professionalrealized performance fees and other miscellaneous expensesdecreases in 2021.
operating expenses. Realized performance fees increased by $358.2 million62.4% to $361.8$106.8 million in 2021 from $3.5 million in 2020. This change was primarily attributable to an increase in realized performance fees generated from Fund VIII of $340.5 million during 2021.
The increase in realized performance fees earned from Fund VIII in 2021 were the result of sales and income generated from investments primarily in the consumer services, natural resources, manufacturing and industrial, and financial services sectors, which reduced the previous netting hole to zero and resulted in recognition of the realized performance fees.
Realized profit sharing expense increased by $169.6 million to $173.2 million in 2021 from $3.5$65.7 million in 2020 as a resultdriven by private equity fund appreciation of 22% in 2021. In 2020, the corresponding increasepandemic resulting from COVID-19 and the actions taken in realized performance fees as described above as well as an increase in the profit sharing expense relatedresponse caused severe disruption to the Incentive Pool. In any period the blended profit sharing percentage is impacted by the respective profit sharing ratios of the funds generating performance fees in the period. Included in realized profit sharing expense is $21.1 million and $1.8 million of expenses related to the Incentive Pool for 2021 and 2020, respectively. The Incentive Pool is separate from the fund related profit sharing expense and may result in greater variability in compensation and have a variable impact on the blended profit sharing percentage during a particular period.
Realized principal investment income increased by $63.7 million to $67.1 million in 2021 from $3.4 million in 2020. This change was primarily attributable to an increase in realizations from Apollo’s equity ownership in Fund VIII of $59.6 million in 2021.
Net interest loss and other increased by $2.1 million to $13.7 million in 2021 from $11.7 million in 2020 primarily due to additional interest expense as a result of the timing of issuances of debt arrangements, as described in note 11 to our consolidated financial statements and a decrease in interest income earned from U.S. Treasury securities in 2021.
Six Months Ended June 30, 2021 Compared to Six Months Ended June 30, 2020
In this section, references to 2021 refer to the six months ended June 30, 2021 and references to 2020 refer to the six months ended June 30, 2020.
Management fees decreased by $7.5 million to $245.4 million in 2021 from $252.9 million in 2020. This change was primarily attributable to a decrease in management fees earned from ANRP II, Fund VIII and Fund VII of $13.3 million, $5.6 million and $5.2 million, respectively, partially offset by an increase in management fees earned from ANRP III and HVF I of $8.6 million and $7.9 million, respectively.
Advisory and transaction fees, net decreased by $16.8 million to $48.4 million in 2021 from $65.1 million in 2020. Advisory and transaction fees in 2021 were primarily attributable to transaction fees in the consumer services industry. Advisory and transaction fees in 2020 were primarily attributable to transaction fees earned with respect to a portfolio company in the media, telecom and technology industry and a structuring fee earned from a portfolio company in the consumer and retail industry in 2020.
Salary, bonus and benefits expense increased by $21.9 million to $117.6 million in 2021 from $95.7 million in 2020 primarily due to an increase in headcount and bonus accruals.
General, administrative and other expenses increased by $4.9 million to $48.7 million in 2021 from $43.8 million in 2020. This change was primarily driven by increases in technology and other miscellaneous expenses in 2021.
Realized performance fees increased by $428.0 million to $432.7 million in 2021 from $4.7 million in 2020. This change was primarily attributable to an increase in realized performance fees generated from Fund VIII of $395 million in 2021.
The increase in realized performance fees earned from Fund VIII in 2021 were the result of sales and income generated from investments primarily in the consumer services, natural resources, manufacturing and industrial,global economy and financial services sectors, which reducedmarkets. In line with public equity and credit indices, the previous netting hole to zero and resultedCompany experienced significant unrealized mark-to-market losses in recognition of the realized performance fees. Fund VIII had no realized performance fees during 2020.
Realized profit sharing expense increased by $205.8 million to $210.8 million in 2021 from $5.0 million in 2020, as a result of the corresponding increase in realized performance fees as described above as well as an increase in the profit sharing expense related to the Incentive Pool. In any period, the blended profit sharing percentage is impacted by the respective profit sharing ratios of the funds generating performance fees in the period. Included in realized profit sharing expense is $28.3
million and $1.8 million of expenses related to the Incentive Pool for 2021 and 2020, respectively. The Incentive Pool is separate from the fund related profit sharing expense and may result in greater variability in compensation and have a variable impact on the blended profit sharing percentage during a particular period.
Realized principal investment income increased by $84.9 million to $88.8 million in 2021 from $3.9 million in 2020. This change was primarily attributable to an increase in realizations from Apollo’s equity ownership in Fund VIII and Fund IX of $68.9 million and $5.7 million, respectively.
Real Assets
The following table sets forth our segment statement of operations information and our supplemental performance measure, Segment Distributable Earnings, within our real assets segment.
| | | | | | | | | | | | | | | | | | | | | | | | | | | | | | | | | | | | | | | | | | | | | | | |
| For the Three Months Ended June 30, | Total Change | | Percentage Change | | For the Six Months Ended June 30, | Total Change | | Percentage Change |
| 2021 | | 2020 | | | | 2021 | | 2020 | | |
| (in thousands) | | | | (in thousands) | | |
| Real Assets: | | | | | | | | | | | | | | | |
| Management fees | $ | 65,823 | | | $ | 49,509 | | | $ | 16,314 | | | 33.0% | | $ | 124,193 | | | $ | 98,380 | | | $ | 25,813 | | | 26.2% |
| Advisory and transaction fees, net | 1,431 | | | 3,191 | | | (1,760) | | | (55.2) | | 2,465 | | | 4,313 | | | (1,848) | | | (42.8) |
| Fee Related Revenues | 67,254 | | | 52,700 | | | 14,554 | | | 27.6 | | 126,658 | | | 102,693 | | | 23,965 | | | 23.3 |
| Salary, bonus and benefits | (30,003) | | | (28,991) | | | (1,012) | | | 3.5 | | (59,246) | | | (53,524) | | | (5,722) | | | 10.7 |
| General, administrative and other | (15,455) | | | (12,782) | | | (2,673) | | | 20.9 | | (26,345) | | | (23,768) | | | (2,577) | | | 10.8 |
| | | | | | | | | | | | | | | |
| Fee Related Expenses | (45,458) | | | (41,773) | | | (3,685) | | | 8.8 | | (85,591) | | | (77,292) | | | (8,299) | | | 10.7 |
| Other income (loss), net of Non-Controlling Interest | (304) | | | 116 | | | (420) | | | NM | | (251) | | | 95 | | | (346) | | | NM |
| Fee Related Earnings | 21,492 | | | 11,043 | | | 10,449 | | | 94.6 | | 40,816 | | | 25,496 | | | 15,320 | | | 60.1 |
| Realized performance fees | 3,174 | | | 2,929 | | | 245 | | | 8.4 | | 24,636 | | | 41,671 | | | (17,035) | | | (40.9) |
| Realized profit sharing expense | (1,392) | | | (2,929) | | | 1,537 | | | (52.5) | | (13,604) | | | (41,671) | | | 28,067 | | | (67.4) |
| Net Realized Performance Fees | 1,782 | | | — | | | 1,782 | | | NM | | 11,032 | | | — | | | 11,032 | | | NM |
| Realized principal investment income | 451 | | | 5 | | | 446 | | | NM | | 3,535 | | | 3,672 | | | (137) | | | (3.7) |
| Net interest loss and other | (11,453) | | | (5,507) | | | (5,946) | | | 108.0 | | (17,676) | | | (9,853) | | | (7,823) | | | 79.4 |
| Segment Distributable Earnings | $ | 12,272 | | | $ | 5,541 | | | $ | 6,731 | | | 121.5% | | $ | 37,707 | | | $ | 19,315 | | | $ | 18,392 | | | 95.2% |
Three Months Ended June 30, 2021 Compared to Three Months Ended June 30, 2020
In this section, references to 2021 refer to the three months ended June 30, 2021 and references to 2020 refer to the three months ended June 30, 2020.
Management fees increased by $16.3 million to $65.8 million in 2021 from $49.5 million in 2020. This change was primarily attributable to an increase in management fees earned from Apollo Infrastructure Equity Fund II (“AIOF II”), Athene, Apollo U.S. Real Estate Fund III, L.P. (“U.S. RE Fund III”) and Athora of $5.4 million, $4.4 million, $2.5 million and $1.6 million, respectively.
Advisory and transaction fees, net decreased by $1.8 million to $1.4 million in 2021 from $3.2 million in 2020. Advisory and transaction fees in 2020 were primarily attributable to structuring fees earned from a company in the consumer and retail industry.
Salary, bonus and benefits expense increased by $1.0 million to $30.0 million in 2021 from $29.0 million in 2020 primarily due to an increase in headcount.
General, administrative and other expenses increased by $2.7 million to $15.5 million in 2021 from $12.8 million in 2020. This change was primarily driven by technology and other miscellaneous expenses in 2021.
Realized profit sharing expense decreased by $1.5 million to $1.4 million in 2021 from $2.9 million in 2020 as a result of the decrease in profit sharing expense related to the Incentive Pool. In any period, the blended profit sharing percentage is impacted by the respective profit sharing ratios of the funds generating performance fees in the period. Included in realized profit sharing expense is $1.8 million related to the Incentive Pool for 2020. There was no profit sharing expense related to the incentive pool for 2021. The Incentive Pool is separate from the fund related profit sharing expense and may result in greater variability in compensation and have a variable impact on the blended profit sharing percentage during a particular period.
Net interest loss and other increased by $5.9 million to $11.5 million in 2021 from $5.5 million in 2020 primarily due to additional interest expense incurred as a result of the timing of issuances of debt arrangements, as described in note 10 to our condensed consolidated financial statements as well as a payment related to general partner obligations.
Six Months Ended June 30, 2021 Compared to Six Months Ended June 30, 2020
In this section, references to 2021 refer to the six months ended June 30, 2021 and references to 2020 refer to the six months ended June 30, 2020.
Management fees increased by $25.8 million to $124.2 million in 2021 from $98.4 million in 2020. This change was primarily attributable to an increase in management fees earned from AIOF II, Athene, U.S. RE Fund III and Athora of $8.6 million, $8.6 million, $4.2 million and $2.0 million, respectively.
Advisory and transaction fees, net decreased by $1.8 million to $2.5 million in 2021 from $4.3 million in 2020. Advisory and transaction fees in 2020 were primarily attributable to structuring fees earned from a company in the consumer and retail industry.
Salary, bonus and benefits expense increased by $5.7 million to $59.2 million in 2021 from $53.5 million in 2020 primarily due to an increase in headcount and bonus accruals.
Realized performance fees decreased by $17.0 million to $24.6 million in 2021 from $41.7 million in 2020. The lower realized performance fees generated in 2021 were primarily attributable to decreases in realized performance fees generated from EPF III and Apollo U.S. Real Estate Fund II, L.P. (“U.S. RE Fund II”) of $11.7 million and $3.6 million, respectively.
The realized performance fees from EPF III in 2021 were primarily a result of realizations from residential mortgage backed securities, commercial real estate and investments in a real estate investment trust. The realized performance fees from EPF III in 2020 were primarily attributable to the sale of investments in logistics assets.
The decrease in realized performance fees from U.S. RE Fund II were primarily attributable to realizations from investments in the leisure sector in 2020 while the fund had no realized performance fees in 2021.
Realized profit sharing expense decreased by $28.1 million to $13.6 million in 2021 from $41.7 million in 2020 as a result of the corresponding decrease in realized performance fees as described above, and a decrease in profit sharing expense related to the Incentive Pool. In any period, the blended profit sharing percentage is impacted by the respective profit sharing ratios of the funds generating performance fees in the period. Included in realized profit sharing expense is $2.0 million and $24.3 million related to the Incentive Pool for 2021 and 2020, respectively. The Incentive Pool is separate from the fund related profit sharing expense and may result in greater variability in compensation and have a variable impact on the blended profit sharing percentage during a particular period.
Net interest loss and other increased by $7.8 million to $17.7 million in 2021 from $9.9 million in 2020 primarily due to additional interest expense incurred as a result of the timing of issuances of debt arrangements, as described in note 10 to our condensed consolidated financial statements as well as a payment related to general partner obligations.
Summary of Distributable Earnings
The following table is a reconciliation of Distributable Earnings per share of common and equivalent to net dividend per share of common and equivalent.
| | | | | | | | | | | | | | | | | | | | | | | |
| For the Three Months Ended June 30, | | For the Six Months Ended June 30, |
| 2021 | | 2020 | | 2021 | | 2020 |
| (in thousands, except per share data) |
| Segment Distributable Earnings | $ | 556,894 | | | $ | 235,414 | | | $ | 885,676 | | | $ | 431,919 | |
| Taxes and related payables | (46,175) | | | (21,040) | | | (71,961) | | | (43,233) | |
| Preferred dividends | (9,164) | | | (9,165) | | | (18,328) | | | (18,329) | |
| Distributable Earnings | 501,555 | | | 205,209 | | | 795,387 | | | 370,357 | |
| Add back: Tax and related payables attributable to common and equivalents | 40,255 | | | 17,776 | | | 60,574 | | | 37,020 | |
Distributable Earnings before certain payables(1) | 541,810 | | | 222,985 | | | 855,961 | | | 407,377 | |
| Percent to common and equivalents | 54 | % | | 54 | % | | 54 | % | | 54 | % |
| Distributable Earnings before other payables attributable to common and equivalents | 292,577 | | | 120,412 | | | 462,219 | | | 219,984 | |
| Less: Taxes and related payables attributable to common and equivalents | (40,255) | | | (17,776) | | | (60,574) | | | (37,020) | |
Distributable Earnings attributable to common and equivalents(2) | $ | 252,322 | | | $ | 102,636 | | | $ | 401,645 | | | $ | 182,964 | |
Distributable Earnings per share(3) | $ | 1.14 | | | $ | 0.46 | | | $ | 1.80 | | | $ | 0.83 | |
(Retained) contributed capital per share(3) | (0.64) | | | 0.03 | | | (0.80) | | | 0.08 | |
Net dividend per share(3) | $ | 0.50 | | | $ | 0.49 | | | $ | 1.00 | | | $ | 0.91 | |
(1)Distributable Earnings before certain payables represents Distributable Earnings before the deduction for the estimated current corporate taxes and the amounts payable under Apollo’s tax receivable agreement.
(2)“Common and equivalents” consists of total Class A shares outstanding and RSUs that participate in dividends.
(3)Per share calculations are based on end of period Distributable Earnings Shares Outstanding, which consists of total Class A shares outstanding, AOG Units that participate in dividends and RSUs that participate in dividends.
Summary of Non-U.S. GAAP Measures
The table below sets forth a reconciliation of net income attributable to Apollo Global Management, Inc. Class A Common Stockholders to our non-U.S. GAAP performance measures:
| | | | | | | | | | | | | | | | | | | | | | | |
| For the Three Months Ended June 30, | | For the Six Months Ended June 30, |
| 2021 | | 2020 | | 2021 | | 2020 |
| (in thousands) | | | | |
| Net Income (Loss) Attributable to Apollo Global Management, Inc. Class A Common Stockholders | $ | 648,563 | | | $ | 437,164 | | | $ | 1,318,289 | | | $ | (568,218) | |
| Preferred dividends | 9,164 | | | 9,165 | | | 18,328 | | | 18,329 | |
| Net income (loss) attributable to Non-Controlling Interests in consolidated entities | 116,276 | | | 41,068 | | | 186,854 | | | (123,341) | |
| Net income (loss) attributable to Non-Controlling Interests in the Apollo Operating Group | 731,457 | | | 511,688 | | | 1,500,492 | | | (611,528) | |
| Net Income (Loss) | $ | 1,505,460 | | | $ | 999,085 | | | $ | 3,023,963 | | | $ | (1,284,758) | |
| Income tax provision (benefit) | 194,051 | | | 140,323 | | | 397,297 | | | (155,530) | |
| Income (Loss) Before Income Tax Provision (Benefit) | $ | 1,699,511 | | | $ | 1,139,408 | | | $ | 3,421,260 | | | $ | (1,440,288) | |
Transaction-related charges(1) | 31,572 | | | 32,110 | | | 51,666 | | | 10,711 | |
Charges associated with corporate conversion(2) | — | | | — | | | — | | | 1,064 | |
| (Gains) losses from change in tax receivable agreement liability | — | | | — | | | (1,941) | | | — | |
| Net (income) loss attributable to Non-Controlling Interests in consolidated entities | (116,276) | | | (41,068) | | | (186,854) | | | 123,341 | |
| Unrealized performance fees | (279,750) | | | (907,656) | | | (1,570,249) | | | 892,525 | |
| Unrealized profit sharing expense | 98,141 | | | 340,687 | | | 687,133 | | | (340,496) | |
Equity-based profit sharing expense and other(3) | 26,992 | | | 38,463 | | | 61,864 | | | 72,951 | |
| Equity-based compensation | 19,491 | | | 17,747 | | | 35,649 | | | 31,817 | |
| Unrealized principal investment (income) loss | (8,620) | | | (107,110) | | | (372,393) | | | 94,460 | |
| Unrealized net (gains) losses from investment activities and other | (914,167) | | | (277,167) | | | (1,240,459) | | | 985,834 | |
Segment Distributable Earnings(4) | $ | 556,894 | | | $ | 235,414 | | | $ | 885,676 | | | $ | 431,919 | |
| Taxes and related payables | (46,175) | | | (21,040) | | | (71,961) | | | (43,233) | |
| Preferred dividends | (9,164) | | | (9,165) | | | (18,328) | | | (18,329) | |
| Distributable Earnings | $ | 501,555 | | | $ | 205,209 | | | $ | 795,387 | | | $ | 370,357 | |
| Preferred dividends | 9,164 | | | 9,165 | | | 18,328 | | | 18,329 | |
| Taxes and related payables | 46,175 | | | 21,040 | | | 71,961 | | | 43,233 | |
| Realized performance fees | (468,756) | | | (10,837) | | | (575,510) | | | (76,583) | |
| Realized profit sharing expense | 246,553 | | | 10,837 | | | 304,309 | | | 76,583 | |
| Realized principal investment income, net | (70,141) | | | (5,219) | | | (96,775) | | | (10,802) | |
| Net interest loss and other | 37,060 | | | 29,050 | | | 70,566 | | | 66,184 | |
| Fee Related Earnings | $ | 301,610 | | | $ | 259,245 | | | $ | 588,266 | | | $ | 487,301 | |
| Depreciation, amortization and other, net | 5,714 | | | 2,712 | | | 10,769 | | | 5,823 | |
| Fee Related EBITDA | $ | 307,324 | | | $ | 261,957 | | | $ | 599,035 | | | $ | 493,124 | |
| Realized performance fees | 468,756 | | | 10,837 | | | 575,510 | | | 76,583 | |
| Realized profit sharing expense | (246,553) | | | (10,837) | | | (304,309) | | | (76,583) | |
| Fee Related EBITDA + 100% of Net Realized Performance Fees | $ | 529,527 | | | $ | 261,957 | | | $ | 870,236 | | | $ | 493,124 | |
(1)Transaction-related charges include contingent consideration, equity-based compensation charges and the amortization of intangible assets and certain other charges associated with acquisitions, and restructuring charges.
(2)Represents expenses incurred in relation to the conversion to a corporation.
(3)Equity-based profit sharing expense and other includes certain profit sharing arrangements in which a portion of performance fees distributed to the general partner are allocated by issuance of equity-based awards, rather than cash, to employees of Apollo. Equity-
based profit sharing expense and other also includes non-cash expenses related to equity awards in unconsolidated related parties granted to employees of Apollo.
(4)See note 16 to the condensed consolidated financial statements for more details regarding Segment Distributable Earnings for the combined segments.
The table below sets forth a reconciliation of Class A shares outstanding to our Distributable Earnings Shares Outstanding:
| | | | | | | | | | | | | | | | | |
| As of
June 30, 2021 | | As of
June 30, 2020 | | As of
December 31, 2020 |
| Total Class A shares outstanding | 231,366,321 | | | 229,189,715 | | | 228,873,449 | |
| Non-GAAP Adjustments: | | | | | |
| Participating Apollo Operating Group Units | 201,208,132 | | | 204,028,327 | | | 204,028,327 | |
| Vested RSUs | 359,592 | | | 195,499 | | | 1,833,332 | |
| Unvested RSUs Eligible for Dividend Equivalents | 7,858,538 | | | 8,128,861 | | | 6,275,957 | |
| Distributable Earnings Shares Outstanding | 440,792,583 | | | 441,542,402 | | | 441,011,065 | |
Liquidity and Capital Resources
Overview
Apollo’s business model primarily derives revenues and cash flows from the assets it manages. Based on management’s experience, we believe that the Company’s current liquidity position, together with the cash generated from revenues will be sufficient to meet the Company’s anticipated expenses and other working capital needs for at least the next 12 months. Apollo targets operating expense levels such that fee income exceeds total operating expenses each period. The Company requires limited capital resources to support the working capital or operating needs of the business. For Apollo’s longer-term liquidity needs, we expect to continue to fund the Company’s operations through management fees and performance fees received. Liquidity needs are also met (to a limited extent) through proceeds from borrowings and equity issuances as described in notes 1011 and 13 to the condensed consolidated financial statements, respectively. From time to time, if the Company determines that market conditions are favorable after taking into account our liquidity requirements, we may seek to raise proceeds through the issuance of additional debt or equity instruments.
At June 30, 2021,As of March 31, 2022, the Company had $1.8$1.2 billion of unrestricted cash and cash equivalents and $0.9 billion of U.S. Treasury Securities as well as $750 million of available funds from the AMH Credit Facility.
Due to the COVID-19 pandemic, there has been volatility in the financial markets. While the Company is not aware of any events that would result in an immediate impact to our liquidity needs, we continue to monitor developments on the global spread of COVID-19 as additional information is obtained.
Primary Sources and Uses of Cash
Over the next 12 months, we expect the Company’s primary liquidity needs will be to:
•pay the Company’s operating expenses, including, compensation, general, administrative, and other expense;
•pay interest and principal on the Company’s financing arrangements;
•pay cash dividends in accordance with the Company’s dividend policy;to Preferred shareholders;
•make payments under the tax receivable agreement;
•repurchase Class A shares;
•pay taxes and tax related payments;
•make payments related to the mandatory exchange; and
•support the future growth of Apollo’s businesses through strategic corporate investments.
Over the long term, we believe we will be able to grow Apollo’s Assets Under Management and generate positive investment performance in ourthe funds we manage, which we expect will allow us to grow the Company’s management fees and performance fees in amounts sufficient to cover our long-term liquidity requirements, which may include:
•supporting the future growth of Apollo’s businesses;
•creating new or enhancing existing products and investment platforms;
•pursuing new strategic corporate investment opportunities;
•paying interest on and repaying outstanding short-term and long-term borrowings;
•repurchasing Class A shares;pay cash dividends to Preferred shareholders;
•making payments under the tax receivable agreement; and
•making payments related to the mandatory exchange; and
•paying dividends (in accordance with the Company’s dividend policy).exchange.
Cash Flow Analysis
The section below discusses in more detail the Company’s primary sources and uses of cash and the primary drivers of cash flows within the Company’s condensed consolidated statements of cash flows:
| | | | For the Six Months Ended June 30, | | For the Three Months Ended March 31, |
| | | 2021 | | 2020 | | | 2022 | | 2021 | |
| | | (in thousands) | | (in thousands) |
| Operating Activities | Operating Activities | $ | 1,093,164 | | | $ | 937,374 | | | Operating Activities | $ | (300,470) | | | $ | (228,751) | | |
| Investing Activities | Investing Activities | 771,836 | | | (774,930) | | | Investing Activities | (891,526) | | | 18,863 | | |
| Financing Activities | Financing Activities | (176,181) | | | (90,791) | | | Financing Activities | 1,406,294 | | | 1,176,953 | | |
| Net Increase (Decrease) in Cash and Cash Equivalents, Restricted Cash and Cash Held at Consolidated Variable Interest Entities | Net Increase (Decrease) in Cash and Cash Equivalents, Restricted Cash and Cash Held at Consolidated Variable Interest Entities | $ | 1,688,819 | | | $ | 71,653 | | | Net Increase (Decrease) in Cash and Cash Equivalents, Restricted Cash and Cash Held at Consolidated Variable Interest Entities | $ | 214,298 | | | $ | 967,065 | | |
The assets of our consolidated funds and VIEs (including SPACs), on a gross basis, can be substantially larger than the assets of our core business and, accordingly, could have a substantial effect on the accompanying statement of cash flows. Because our consolidated funds and VIEs are treated as investment companies for accounting purposes, their investing cash flow amounts are included in our cash flows from operations. The table below summarizes our condensed consolidated statements of cash flow by activity attributable to the Company and to our consolidated funds and VIEs.
| | | | For the Six Months Ended
June 30, | | For the Three Months Ended March 31, |
| | | 2021 | | 2020 | | | 2022 | | 2021 | |
| | | (in thousands) | | (in thousands) |
| Net cash provided by the Company’s operating activities | Net cash provided by the Company’s operating activities | $ | 1,121,970 | | | $ | 573,264 | | | Net cash provided by the Company’s operating activities | $ | 1,703,804 | | | $ | 412,212 | | |
| Net cash provided by (used in) the Consolidated Funds and VIEs operating activities | (28,806) | | | 364,110 | | | |
| Net cash provided by operating activities | 1,093,164 | | | 937,374 | | | |
| Net cash used in the Company’s investing activities | (60,183) | | | (807,924) | | | |
| Net cash used in the Consolidated Funds and VIEs operating activities | | Net cash used in the Consolidated Funds and VIEs operating activities | (2,004,274) | | | (640,963) | | |
| Net cash provided by (used in) operating activities | | Net cash provided by (used in) operating activities | (300,470) | | | (228,751) | | |
| Net cash provided by (used in) the Company’s investing activities | | Net cash provided by (used in) the Company’s investing activities | (1,205,595) | | | 2,614 | | |
| Net cash provided by the Consolidated Funds & VIEs investing activities | Net cash provided by the Consolidated Funds & VIEs investing activities | 832,019 | | | 32,994 | | | Net cash provided by the Consolidated Funds & VIEs investing activities | 314,069 | | | 16,249 | | |
| Net cash provided by (used in) investing activities | Net cash provided by (used in) investing activities | 771,836 | | | (774,930) | | | Net cash provided by (used in) investing activities | (891,526) | | | 18,863 | | |
| Net cash used in the Company’s financing activities | Net cash used in the Company’s financing activities | (793,631) | | | (320,118) | | | Net cash used in the Company’s financing activities | (184,439) | | | (324,133) | | |
| Net cash provided by the Consolidated Funds and VIEs financing activities | Net cash provided by the Consolidated Funds and VIEs financing activities | 617,450 | | | 229,327 | | | Net cash provided by the Consolidated Funds and VIEs financing activities | 1,590,733 | | | 1,501,086 | | |
| Net cash used in financing activities | $ | (176,181) | | | $ | (90,791) | | | |
| Net cash provided by (used in) financing activities | | Net cash provided by (used in) financing activities | $ | 1,406,294 | | | $ | 1,176,953 | | |
Operating Activities
The Company’s operating activities support its asset management activities and underlying investment management activities.strategies. The primary sources of cash within the operating activities section include: (a) management fees, (b) advisory and transaction fees, (c) realized performance revenues, (d) due from related parties and (e) realized principal investment income, and (e) investment sales from our consolidated funds and VIEs.income. The primary uses of cash within the operating activities section include: (a) compensation and non-compensation related expenses, (b) placement fees, (c) interest and taxes, and (d) investment purchases from our consolidated funds and VIEs.(c) due to related parties.
•During the sixthree months ended June 30, 2021 and 2020,March 31, 2022, cash provided by operating activities primarily includes cash inflows from the receipt of management fees, advisory and transaction fees, realized performance revenues, and realized principal investment income, offset by cash outflows for compensation, general, administrative, and other expenses.
Net cash providedused in operating activities also reflects operating activities of our consolidated funds and VIEs, which includes cash outflows for purchases of investments, offset by cash inflows from sales of investments.
•During the three months ended March 31, 2021 cash used by operating activities alsoprimarily reflects the operating activity of our consolidated funds and VIEs, which primarily include cash inflows from consolidated funds and from saleoutflows for purchases of investments, offset by cash inflows from consolidated funds. Net cash used by operating activities also reflects cash outflows for purchasescompensation, general, administrative, and other expenses, offset by cash inflows from the receipt of investments.management fees, advisory and transaction fees, realized performance revenues, and realized principal investment income.
Investing Activities
The Company’s investing activities support the growth of its business. The primary sources of cash within the investing activities section include distributionsproceeds from investments.maturities in U.S. Treasury securities. The primary uses of cash within the investing activities section include: (a) capital expenditures, (b) investment purchases, including purchases of U.S. Treasury securities, and (c) equity method investments in the funds we manage.issuances of related party loans.
•During the sixthree months ended June 30,March 31, 2022, cash used in investing activities primarily reflects issuances of related party loans, net purchases of U.S. Treasury securities and purchases of investments. Net cash provided by investing activities reflects the investing activities of our consolidated funds and VIEs, which includes net proceeds from maturities of U.S. Treasury securities.
•During the three months ended March 31, 2021, cash provided by investing activities primarily reflects the investing activity of our consolidated funds and VIEs, which primarily reflects net proceeds from maturities of U.S. Treasury securities.
•During the six months ended June 30, 2020, cash used by investing activities primarily reflects purchases of U.S. Treasury securities and other investments and net contributions to equity method investments, offset partially by proceeds from maturities of U.S. Treasury securities.investments.
Financing Activities
The Company’s financing activities reflect its capital market transactions and transactions with owners. The primary sources of cash within the financing activities section includes proceeds from debt and preferred equity issuances. The primary uses of cash within the financing activities section include: (a) dividends, (b) payments under the tax receivable agreement,issuances of warrants, (c) share repurchases, (d) cash paid to settle tax withholding obligations in connection with net share settlements of equity-based awards and (e) repayments of debt.
•During the sixthree months ended June 30,March 31, 2022, net cash provided by financing activities reflects the financing activity of our consolidated funds and VIEs, which primarily includes cash inflows from the issuance of debt. Cash used by financing activities includes cash dividends and share repurchases.
•During the three months ended March 31, 2021, cash usedprovided in financing activities primarily reflects dividends to Class A shareholders, distributions to Non-Controlling interest holders, and repurchases of Class A shares. Net cash used in financing activities also reflects the financing activity of our consolidated funds and VIEs, which primarily include cash inflows from the issuance of debt, net contributions from Non-Controlling interest in consolidated entities, proceeds from issuance of securities of a SPAC, partially offset by payment of underwriting discounts and cash outflows for the principal repayment of debt.
•During the six months ended June 30, 2020, cash used in financing activities primarily reflects dividends to Class A shareholders, distributions to Non-Controlling interest holders, and repurchases of Class A shares, partially offset by proceeds from the issuance of the 2030 Senior Notes. Net cash used in financing activities also reflects the financing activity of our consolidated funds and VIEs, which primarily include cash inflows from the issuance of debt offset by cash outflows for the principal repayment of debt.discounts.
Future Debt Obligations
The Company had long-term debt of $3.2$2.8 billion at June 30, 2021,March 31, 2022, which includes $3.1 billion of notes with maturities in 2024, 2026, 2029, 2030, 2039, 2048 and 2050. See note 1011 to the condensed consolidated financial statements for further information regarding the Company’s debt arrangements.
Contractual Obligations, Commitments and Contingencies
The Company had unfunded general partner commitments of $1.0 billion at June 30, 2021, of which $253.7 million related to Fund IX. For a summary and a description of the nature of the Company’s commitments, contingencies and contractual obligations, see note 15 to the condensed consolidated financial statements and “—Contractual Obligations, Commitments and Contingencies”.Contingencies.” The Company’s commitments are primarily fulfilled through cash flows from operations and (to a limited extent) through borrowings and equity issuances as described in notes 1011 and 13 to the condensed consolidated financial statements, respectively.
Consolidated Funds and VIEs
The Company manages its liquidity needs by evaluating unconsolidated cash flows; however, the Company’s condensed consolidated financial statements reflect the financial position of Apollo as well as Apollo’s consolidated funds and VIEs (including SPACs) and VIEs.. The primary sources and uses of cash at Apollo’s consolidated funds and VIEs include: (a) raising capital from their investors, which have been reflected historically as Non-Controlling Interests of the consolidated subsidiaries in our condensed consolidated financial statements, (b) using capital to make investments, (c) generating cash flows from operations through distributions, interest and the realization of investments, (d) distributing cash flow to investors, (e) issuing debt to finance investments (CLOs) and (f) raising capital through SPAC vehicles for future acquisition of targeted entities.
Other Liquidity and Capital Resource Considerations
Future Cash Flows
Our ability to execute our business strategy, particularly our ability to increase our AUM, depends on our ability to establish new funds and to raise additional investor capital within such funds. Our liquidity will depend on a number of factors, such as our ability to project our financial performance, which is highly dependent on ourthe funds we manage and our ability to manage our projected costs, fund performance, access to credit facilities, compliance with existing credit agreements, as well as industry and market trends. AlsoAdditionally, during economic downturns, the funds we manage mightmay experience cash flow issues or liquidate entirely. In these situations, we mightthe Company may be asked to reduce or eliminate the management feefees and performance fees we charge,charged, which could adversely impact our cash flow in the future.
An increase in the fair value of our funds’ investments,underlying portfolio companies of the funds we manage, by contrast, could favorably impact our liquidity through higher management fees where the management fees are calculated based on the net asset value, gross assets or adjusted assets. Additionally, higher performance fees not yet realized would generally result when investments appreciate over their cost basis which would not have an impact on the Company’s cash flow until realized.
Income Taxes
Effective September 5, 2019, Apollo Global Management, LLC, a Delaware limited liability company, converted to a Delaware corporation named Apollo Global Management, Inc. Subsequent to the conversion, generally all of the income it earns is subject to U.S. corporate income taxes.
Consideration of Financing Arrangements
As noted above, in limited circumstances, the Company may issue debt or equity to supplement its liquidity. The decision to enter into a particular financing arrangement is made after careful consideration of various factors including the Company’s cash flows from operations, future cash needs, current sources of liquidity, demand for the Company’s debt or equity, and prevailing interest rates.
Revolver Facility
Under the Company’s AMH Credit Facility, the Company may borrow in an aggregate amount not to exceed $750 million and may incur incremental facilities in an aggregate amount not to exceed $250 million plus additional amounts so long as the Borrower is in compliance with a net leverage ratio not to exceed 4.00 to 1.00. Borrowings under the AMH Credit Facility may be used for working capital and general corporate purposes, including without limitation, permitted acquisitions. The AMH Credit Facility has a final maturity date of November 23, 2025. The AMH Credit Facility refinanced the 2018 AMH Credit Facility at substantially the same terms. The 2018 AMH Credit Facility and all related loan documents were terminated as of November 23, 2020.
Dividends and Distributions
For information regarding the quarterly dividends and distributions to Class A shareholders, Non-Controlling Interest holders in the Apollo Operating Group and participating securities, see note 13 to the condensed consolidated financial statements.
Although the Company currently expects to pay dividends according toon our dividend policy,Preferred shares and may pay dividends on our common stock in the future, we may not pay dividends according to our policy, or at all, if, among other things, we do not have the cash necessary to pay the intended dividends. To the extent we do not have cash on hand sufficient to pay dividends, we may have to borrow funds to pay dividends, or we may determine not to pay dividends. The declaration, payment and determination of the amount of our quarterly dividends are at the sole discretion of the executive committee of our board of directors.
Our current intention is to distribute to our Class A shareholders on a quarterly basis substantially all of our Distributable Earnings after taxes and related payables, in excess of amounts determined by the executive committee of our board of directors to be necessary or appropriate to provide for the conduct of our business and, at a minimum, a quarterly dividend of $0.40 per share. Following the completion of the Company’s proposed merger with AHL, we intend to distribute an annual dividend of $1.60 per share, with increases based on growth of the business, as determined by the board of directors.
On August 4, 2021,May 5, 2022, the Company declared a cash dividend of $0.50 per Class A share, which will be paid on August 31, 2021 to holders of record at the close of business on August 19, 2021. Also, the Company declared a cash dividend
of $0.398438 per share of Series A Preferred share and Series B Preferred share which will be paid on SeptemberJune 15, 20212022 to holders of record at the close of business on SeptemberJune 1, 2021.2022.
Tax Receivable Agreement
The tax receivable agreement provides for the payment to the Co-FoundersFormer Managing Partners and Contributing Partners of 85% of the amount of cash savings, if any, in U.S. federal, state, local and foreign income taxes that AGM Inc. and its subsidiaries realizes subject to the agreement. For more information regarding the tax receivable agreement, see note 14 to the condensed consolidated financial statements.
AOG Unit Payment
Pursuant to the binding governance term sheet the Company entered into with the Co-Founders, all AOG Units beneficially owned by each holderOn December 31, 2021, holders of AOG Units (other than those held byAthene and the CompanyCompany) sold and Athene) will be transferred a portion of such AOG Units to NewCo and one or moreAPO Corp., a wholly-owned consolidated subsidiary of its affiliates in a series of transactionsthe Company, in exchange for (i) suchan amount equal to $3.66 multiplied by the total number of AOG Units held by such holders immediately prior to such transaction (such payment, the “AOG Unit Payment”). The remainder of the AOG Units held by such holders were exchanged for shares of Class AHoldCo common stock concurrently with the closing of NewCo equal to the aggregate numberMergers on January 1, 2022.
As of Outstanding AOG Units and (ii) an aggregateMarch 31, 2022, the outstanding payable amount in cash equal to the product of (a) number of Outstanding AOG Units multiplied by (b) $3.66, payable over a period of four years in equal quarterly installments; provided, however, that in the event that the Company consummates the transactions contemplated by the Merger Agreement simultaneouslyconnection with the mandatory exchange, the AOG Unit Payment will bewas $482 million, payable over the period between the date on which the transactions contemplated by the Merger Agreement are consummated and the third anniversary of the Mandatory Exchange Date in equal quarterly installments. Forinstallments through December 31, 2024. See note 14 for more information, see “—General”.information.
For information regarding the Company’s share repurchase program, see note 13 to the condensed consolidated financial statements.Athora
On April 14, 2017, Apollo made a commitment of €125 million to purchase new Class B-1 equity interests in Athora, a strategic platform that acquires and reinsures traditional closed life insurance policies and provides capital and reinsurance solutions to insurers in Europe which, as of April 2020 was fully drawn. In January 2018, Apollo purchased Class C-1 equity interests in Athora that represent a profits interest in Athora which, upon meeting certain vesting triggers, will be convertible by Apollo into additional Class B-1 equity interests in Athora.
As part of an ongoing capital raise inIn connection with Athora’s acquisition of VIVAT N.V., Apollo exercised its preemptive rights and made an additional incremental commitment of approximately €58 million to purchase new Class B-1 equity interests in Athora. In addition, in April 2020, Apollo purchased Class C-2 equity interests in Athora that represent a profits interest in Athora which, upon meeting certain vesting triggers, will be convertible by Apollo into additional Class B-1 equity interests in Athora.
In November 2021, Apollo made an additional commitment to purchase up to €120 million of new Class B-1 equity interests in Athora, to be drawn in connection with three separate offerings over a period of three years, with a commitment of up to €30 million in 2021, up to €40 million in 2022 and up to €50 million in 2023. Athora’s other common shareholders may exercise preemptive rights to acquire common shares in connection with each offering and any such exercise will reduce the total amount of new Class B-1 equity interests ultimately purchased by Apollo. In connection with the 2021 offering, Apollo acquired approximately €21.9 million of new Class B-1 equity interests. In addition, Apollo purchased Class C-3 equity interests in Athora in connection with the 2021 offering that represent a profits interest in Athora which, upon meeting certain vesting triggers, will be convertible by Apollo into additional Class B-1 equity interests in Athora. The remaining commitments are drawable in four installments between 2022 and 2024.
In December 2021, Apollo committed an additional €250 million to purchase new Class B-1 equity interests to support Athora’s ongoing growth initiatives, of which €180 million was drawn as of December 31, 2021. Apollo expects the remaining €70 million will be drawn in 2022, pending regulatory approvals.
Apollo and Athene are minority investors in Athora with a long term strategic relationship. Through its share ownership, Apollo has approximately 19%19.9% of the total voting power in Athora, and Athene holds shares in Athora representing 10% of the total voting power in Athora. In addition, Athora shares held by funds and other accounts managed by Apollo represent, in the aggregate, approximately 16%15.1% of the total voting power in Athora.
For more information regarding unfunded general partner commitments, see “—Contractual Obligations, Commitments and Contingencies”.Contingencies.”
Fund VIII, Fund VII, Fund VI, ANRP I and ANRP II Escrow
As of June 30, 2021,March 31, 2022, the remaining investments and escrow cash of Fund VIIANRP II was valued at 91%100% of the fund’s unreturned capital respectively, which was below the required escrow ratio of 115%. As a result, Fund VIIthe fund is required to place in escrow current and future performance fee distributions to the general partner until the specified return ratio of 115% is met (at the time of a future distribution) or upon liquidation. Realized performance fees currently distributed to the general partner are limited to potential tax distributions and interest on escrow balances per these funds’the fund’s partnership agreements.agreement.
Clawback
Performance fees from our private equitycertain of the funds and certain credit and real assets fundswe manage are subject to contingent repayment by the general partner in the event of future losses to the extent that the cumulative performance fees distributed
from inception to date exceeds the amount computed as due to the general partner at the final distribution. See “—Overview of Results of Operations—Performance Fees” for the maximum performance fees subject to potential reversal by each fund.
Indemnification Liability
The Company recorded an indemnification liability in the event that the Co-Founders,Former Managing Partners, Contributing Partners and certain investment professionals are required to pay amounts in connection with a general partner obligation to return previously distributed performance fees. See note 14 to the condensed consolidated financial statements for further information regarding the Company’s indemnification liability.
Investment Management Agreements - ISG
The Company provides asset management and advisory services to Athene as described in note 14 to the condensed consolidated financial statements.
The base management fee covers a range of investment services that Athene receives from the Company, including investment management, asset allocation, mergers and acquisition asset diligence and certain operational support services such as investment compliance, tax, legal and risk management support, among others. Additionally,Commensurate to the prior fee agreement, the amended fee agreement provides for a possible payment by the Company to Athene, or a possible payment by Athene to the Company, equal to 0.025%0.00625% of the Incremental Value as of the end of each year, beginning on December 31, 2019,quarter, depending upon the percentage of Athene’s investments that consist of core assets and core plus assets. In furtherance of yield support for Athene, if more than 60% of Athene’s invested assets which are subject to the sub-allocation fees are invested in core and core plus assets, Athene will receive a 0.025%0.00625% fee reduction on the Incremental Value. As an incentive for differentiated asset management, if less than 50% of Athene’s invested assets which are subject to the sub-allocation fee are invested in core and core plus assets, thereby reflecting a higher allocation toward assets with the highest alpha-generating abilities, Athene will pay an additional fee of 0.025%0.00625% on Incremental Value.
The amended fee agreement is intended to provide for further alignment of interests between Athene and the Company. On the Backbook Value, assuming constant portfolio allocations, the near-term impact of the amended fee agreement is anticipated to be immaterial. On the Incremental Value, assuming the same allocations as the Backbook Value, total fees paid by Athene to the Company are expected to be marginally lower than fees paid by Athene to the Company would have been under the prior fee arrangement. If invested asset allocations are more heavily weighted to assets with lower alpha-generating abilities than Athene’s current investment portfolio, the fees that Athene pays to the Company under the amended fee agreement would be expected to decline relative to the prior fee arrangement. Conversely, if a greater proportion of Athene’s investment portfolio is allocated to differentiated assets with higher alpha-generating abilities, Athene’s net investment earned rates would be expected to increase, and so would the fees Athene pays to the Company relative to the prior fee arrangement.
Strategic Transaction with Athene Holding
On October 27, 2019 Athene Holding, AGM Inc. and the entities that form the Apollo Operating Group entered into the Transaction Agreement. Pursuant to the Transaction Agreement, Athene Holding issued on February 28, 2020, 35,534,942 AHL Class A Common Shares to certain subsidiaries of the Apollo Operating Group in exchange for (i) issuance by the Apollo Operating Group of 29,154,519 non-voting equity interests of the Apollo Operating Group to Athene Holding and (ii) $350 million in cash. See note 14 to the condensed consolidated financial statements for further information regarding the Transaction Agreement with Athene Holding.
Termination Fee with Athene Holding
See note 14 to the condensed consolidated financial statements for further information regarding the termination fee that could be payable by AGM Inc. upon termination of the Merger Agreement with Athene Holding.
Equity-Based Profit Sharing Expense
Profit sharing amounts are generally not paid until the related performance fees are distributed to the general partner upon realization of the fund’s investments. Under certain profit sharing arrangements, a portion of the performance fees distributed to the general partner is allocated by issuance of equity-based awards, rather than cash, to employees. See note 2 to the condensed consolidated financial statements for further information regarding the accounting for the Company’s profit sharing arrangements.
Off-Balance Sheet Arrangements
In the normal course of business, we engage in off-balance sheet arrangements, including transactions in derivatives, guarantees, commitments, indemnifications and potential contingent repayment obligations. See note 15 to our condensed consolidated financial statements for a discussion of guarantees and contingent obligations.
Critical Accounting Estimates and Policies
This Management’s Discussion and Analysis of Financial Condition and Results of Operations is based upon the condensed consolidated financial statements, which have been prepared in accordance with U.S. GAAP. The preparation of financial statements in accordance with U.S. GAAP requires the use of estimates and assumptions that could affect the reported amounts of assets and liabilities, the disclosure of contingent assets and liabilities and the reported amounts of revenues and expenses. Actual results could differ from these estimates. A summary of our significant accounting policies is presented in note 2 to our condensed consolidated financial statements. statements and should be read in conjunction with our significant accounting policies described in note 2 of our consolidated financial statements in our 2021 Annual Report.
The following is a summary of our accounting policies that are affected most by judgments, estimates and assumptions.
The COVID-19 pandemic has created disruption and uncertainty in the global economy and financial markets. Although we cannot predict with certainty the full magnitude of the economic ramifications, we have accounted for pandemic-related circumstances when applying judgments and assumptions and updated our estimates accordingly when and as applicable.
Consolidation
The Company assesses all entities with which it is involved for consolidation on a case by case basis depending on the specific facts and circumstances surrounding each entity. Pursuant to the consolidation guidance, the Company first evaluates whether it holds a variable interest in an entity. Apollo factors in all economic interests including proportionate interests through related parties, to determine if such interests are to be considered a variable interest. As Apollo’s interest in many of these entities is solely through market rate fees and/or insignificant indirect interests through related parties, Apollo is generally not considered to have a variable interest in many of these entities under the guidance and no further consolidation analysis is performed. For entities where the Company has determined that it does hold a variable interest, the Company performs an assessment to determine whether each of those entities qualify as a VIE.
The determination as to whether an entity qualifies as a VIE depends on the facts and circumstances surrounding each entity and therefore certain of Apollo’s funds may qualify as VIEs under the variable interest model whereas others may qualify as voting interest entities (“VOEs”) under the voting interest model. The granting of substantive kick-out rights is a key consideration in determining whether a limited partnership or similar entity is a VIE and whether or not that entity should be consolidated.
Under the voting interest model, Apollo consolidates those entities it controls through a majority voting interest. Apollo does not consolidate those VOEs in which substantive kick-out rights have been granted to the unaffiliated investors to either dissolve the fund or remove the general partner.
Under the variable interest model, Apollo consolidates those entities where it is determined that the Company is the primary beneficiary of the entity.
The assessment of whether an entity is a VIE and the determination of whether Apollo should consolidate such VIE requires judgment by our management. Those judgments include, but are not limited to: (i) determining whether the total equity investment at risk is sufficient to permit the entity to finance its activities without additional subordinated financial support, (ii) evaluating whether the holders of equity investment at risk, as a group, can make decisions that have a significant effect on the success of the entity, (iii) determining whether the equity investors have proportionate voting rights to their obligations to absorb losses or rights to receive the expected residual returns from an entity and (iv) evaluating the nature of the relationship and activities of those related parties with shared power or under common control for purposes of determining which party within the related-party group is most closely associated with the VIE. Judgments are also made in determining whether a member in the equity group has a controlling financial interest including power to direct activities that most significantly impact the VIE’s economic performance and rights to receive benefits or obligations to absorb losses that could be potentially significant to the VIE. This analysis considers all relevant economic interests including proportionate interests held through related parties.
Revenue Recognition
Performance Fees. We earn performance fees from our funds as a result of such funds achieving specified performance criteria. Such performance fees generally are earned based upon a fixed percentage of realized and unrealized gains of various funds after meeting any applicable hurdle rate or threshold minimum.
Performance allocations are performance fees that are generally structured from a legal standpoint as an allocation of capital to the Company. Performance allocations from certain of the funds that we manage are subject to contingent repayment and are generally paid to us as particular investments made by the funds are realized. If, however, upon liquidation of a fund, the aggregate amount paid to us as performance fees exceeds the amount actually due to us based upon the aggregate performance of the fund, the excess (in certain cases net of taxes) is required to be returned by us to that fund. We account for performance allocations as an equity method investment, and accordingly, we accrue performance allocations quarterly based on fair value of the underlying investments and separately assess if contingent repayment is necessary. The determination of performance allocations and contingent repayment considers both the terms of the respective partnership agreements and the current fair value of the underlying investments within the funds. Estimates and assumptions are made when determining the fair value of the underlying investments within the funds and could vary depending on the valuation methodology that is used. See “Investments, at Fair Value” below for further discussion related to significant estimates and assumptions used for determining fair value of the underlying investments in our credit, private equity and real assets funds.
Incentive fees are performance fees structured as a contractual fee arrangement rather than a capital allocation. Incentive fees are generally received from the management of CLOs, managed accounts and AINV. For a majority of our incentive fees, once the quarterly or annual incentive fees have been determined, there is no look-back to prior periods for a potential contingent repayment, however, certain other incentive fees can be subject to contingent repayment at the end of the life of the entity. In accordance with the revenue recognition standard, certain incentive fees are considered a form of variable consideration and therefore are deferred until fees are probable to not be significantly reversed. There is significant judgment involved in determining if the incentive fees are probable to not be significantly reversed, but generally the Company will defer the revenue until the fees are crystallized or are no longer subject to clawback or reversal.
Management Fees. Management fees related to our credit funds, can be based on net asset value, gross assets, adjusted cost of all unrealized portfolio investments, capital commitments, adjusted assets, capital contributions, or stockholders’ equity all as defined in the respective partnership agreements. The credit management fee calculations that consider net asset value, gross assets, adjusted cost of all unrealized portfolio investments and adjusted assets are normally based on the terms of the respective partnership agreements and the current fair value of the underlying investments within the funds. Estimates and assumptions are made when determining the fair value of the underlying investments within the funds and could vary depending on the valuation methodology that is used. The management fees related to our private equity funds, by contrast, are generally based on a fixed percentage of the committed capital or invested capital. The corresponding fee calculations that consider committed capital or invested capital are both objective in nature and therefore do not require the use of significant estimates or assumptions. The management fees related to our real assets funds are generally based on a specific percentage of the funds’ stockholders’ equity or committed or net invested capital or the capital accounts of the limited partners. See “Investments, at Fair Value” below for further discussion related to significant estimates and assumptions used for determining fair value of the underlying investments in our credit, private equity and real assets funds.
Investments, at Fair Value
On a quarterly basis, Apollo utilizes valuation committees consisting of members from senior management, to review and approve the valuation results related to the investments of the funds it manages. For certain publicly traded vehicles managed by Apollo, a review is performed by an independent board of directors. The Company also retains external valuation firms to provide third-party valuation consulting services to Apollo, which consist of certain limited procedures that management identifies and requests them to perform. The limited procedures provided by the external valuation firms assist management with validating their valuation results or determining fair value. The Company performs various back-testing procedures to validate their valuation approaches, including comparisons between expected and observed outcomes, forecast evaluations and variance analyses. However, because of the inherent uncertainty of valuation, the estimated values may differ significantly from the values that would have been used had a ready market for the investments existed, and the differences could be material.
The fair values of the investments in our funds can be impacted by changes to the assumptions used in the underlying valuation models. For further discussion on the impact of changes to valuation assumptions see “Item 7A. Quantitative and Qualitative Disclosures About Market Risk—Sensitivity” in the 2020 Annual Report. There have been no material changes to the valuation approaches utilized during the periods that our financial results are presented in this report.
Fair Value of Financial Instruments
Except for the Company’s debt obligations (each as defined in note 10 to our condensed consolidated financial statements), Apollo’s financial instruments are recorded at fair value or at amounts whose carrying values approximate fair value. See “—Investments, at Fair Value” above. While Apollo’s valuations of portfolio investments are based on assumptions that Apollo believes are reasonable under the circumstances, the actual realized gains or losses will depend on, among other factors, future operating results, the value of the assets and market conditions at the time of disposition, any related transaction costs and the timing and manner of sale, all of which may ultimately differ significantly from the assumptions on which the valuations were based. Financial instruments’ carrying values generally approximate fair value because of the short-term nature of those instruments or variable interest rates related to the borrowings.
Profit Sharing Expense. Profit sharing expense is primarily a result of agreements with our Contributing Partners and employees to compensate them based on the ownership interest they have in the general partners of the Apollo funds. Therefore, changes in the fair value of the underlying investments in the funds we manage and advise affect profit sharing expense. The Contributing Partners and employees are allocated approximately 30% to 56%, of the total performance fees which is driven primarily by changes in fair value of the underlying fund’s investments and is treated as compensation expense. Additionally, profit sharing expenses paid may be subject to clawback from employees, former employees and Contributing Partners to the extent not indemnified. When applicable, the accrual for potential clawback of previously distributed profit sharing amounts, which is a component of due from related parties on the condensed consolidated statements of financial condition, represents all amounts previously distributed to employees, former employees and Contributing Partners that would need to be returned to the general partner if the Apollo funds were to be liquidated based on the current fair value of the underlying funds’ investments as of the reporting date. The actual general partner receivable, however, would not become realized until the end of a fund’s life.
Several of the Company’s employee remuneration programs are dependent upon performance fee realizations, including the Incentive Pool, and dedicated performance fee rights and certain RSU awards for which vesting is contingent, in part, on the realization of performance fees in a specified period. The Company established these programs to attract and retain, and provide incentive to, partners and employees of the Company and to more closely align the overall compensation of partners and employees with the overall realized performance of the Company. Dedicated performance fee rights entitle their holders to payments arising from performance fee realizations. The Incentive Pool enables certain partners and employees to earn discretionary compensation based on realized performance fees in a given year, which amounts are reflected in profit sharing expense in the Company’s condensed consolidated financial statements. Amounts earned by participants as a result of their performance fee rights (whether dedicated or Incentive Pool) will vary year-to-year depending on the overall realized performance of the Company (and, in the case of the Incentive Pool, on their individual performance). There is no assurance that the Company will continue to compensate individuals through the same types of arrangements in the future and there may be periods when the Company determines that allocations of realized performance fees are not sufficient to compensate individuals, which may result in an increase in salary, bonus and benefits, the modification of existing programs or the use of new remuneration programs. Reductions in performance fee revenues could also make it harder to retain employees and cause employees to seek other employment opportunities.
Fair Value Option. Apollo has elected the fair value option for the Company’s investment in Athene Holding, the assets and liabilities of certain of its consolidated VIEs (including CLOs), the Company’s U.S. Treasury securities with original maturities greater than three months when purchased and certain of the Company’s other investments. Such election is irrevocable and is applied to financial instruments on an individual basis at initial recognition. See notes 3, 5, and 6 to the condensed consolidated financial statements for further disclosure.
Equity-Based Compensation. Equity-based compensation is accounted for in accordance with U.S. GAAP, which requires that the cost of employee services received in exchange for an award is generally measured based on the grant date fair value of the award. Equity-based awards that do not require future service (i.e., vested awards) are expensed immediately. Equity-based employee awards that require future service are recognized over the relevant service period. In addition, certain RSUs granted by the Company vest subject to continued employment and the Company’s receipt of performance fees, within prescribed periods, sufficient to cover the associated equity-based compensation expense. In accordance with U.S. GAAP, equity-based compensation expense for such awards, if and when granted, will be recognized on an accelerated recognition method over the requisite service period to the extent the performance fee metrics are met or deemed probable. The addition of these performance measures helps to promote the interests of our Class A shareholders and fund investors by making RSU vesting contingent on the realization and distribution of profits on our funds. Forfeitures of equity-based awards are accounted for when they occur. Apollo’s equity-based awards consist of, or provide rights with respect to, AOG Units, RSUs, share options, restricted shares, AHL Awards and other equity-based compensation awards. For more information regarding Apollo’s
equity-based compensation awards, see note 12 to our condensed consolidated financial statements. The Company’s assumptions made to determine the fair value on grant date are embodied in the calculations of compensation expense.
A significant part of our compensation expense is derived from amortization of RSUs. The fair value of all RSU grants after March 29, 2011 is based on the grant date fair value, which considers the public share price of the Company. The Company has three types of RSU grants, which we refer to as Plan Grants, Bonus Grants, and Performance Grants. Plan Grants may or may not provide the right to receive dividend equivalents until the RSUs vest and, for grants made after 2011, the underlying shares are generally issued by March 15th after the year in which they vest. For Plan Grants, the grant date fair value is based on the public share price of the Company, and is discounted for transfer restrictions and lack of dividends until vested if applicable. Bonus Grants provide the right to receive dividend equivalents on both vested and unvested RSUs and Performance Grants provide the right to receive dividend equivalents on vested RSUs and may also provide the right to receive dividend equivalents on unvested RSUs. Both Bonus Grants and Performance Grants are generally issued by March 15th of the year following the year in which they vest. For Bonus Grants and Performance Grants, the grant date fair value for the periods presented is based on the public share price of the Company, and is discounted for transfer restrictions.
We utilized the present value of a growing annuity formula to calculate a discount for the lack of pre-vesting dividends on certain Plan Grant and Performance Grant RSUs.
We utilize the Finnerty Model to calculate a marketability discount on the Plan Grant, Bonus Grant and Performance Grant RSUs to account for the lag between vesting and issuance. The Finnerty Model provides for a valuation discount reflecting the holding period restriction embedded in a restricted security preventing its sale over a certain period of time.
The Finnerty Model proposes to estimate a discount for lack of marketability such as transfer restrictions by using an option pricing theory. This model has gained recognition through its ability to address the magnitude of the discount by considering the volatility of a company’s stock price and the length of restriction. The concept underpinning the Finnerty Model is that a restricted security cannot be sold over a certain period of time. Further simplified, a restricted share of equity in a company can be viewed as having forfeited a put on the average price of the marketable equity over the restriction period (also known as an “Asian Put Option”). If we price an Asian Put Option and compare this value to that of the assumed fully marketable underlying security, we can effectively estimate the marketability discount. The inputs utilized in the Finnerty Model are (i) length of holding period, (ii) volatility and (iii) dividend yield.
Income Taxes
Effective September 5, 2019, Apollo Global Management, LLC converted from a Delaware limited liability company to a Delaware corporation named Apollo Global Management, Inc. Subsequent to the conversion, generally all of the income it earns from the Apollo Operating Group (“AOG”) entities is subject to U.S. corporate income taxes. Certain of the AOG entities operate as partnerships for U.S. income tax purposes and are subject to New York City unincorporated business taxes (“NYC UBT”). Certain non-U.S. entities are also subject to non-U.S. corporate income taxes.
Significant judgment is required in determining tax expense and in evaluating tax positions, including evaluating uncertainties. The Company recognizes the tax benefit of uncertain tax positions only where the position is “more likely than not” to be sustained upon examination, including resolution of any related appeals or litigation processes, based on the technical merits of the position. The tax benefit is measured as the largest amount of benefit that has a greater than 50% likelihood of being realized upon ultimate settlement. If a tax position is not considered more likely than not to be sustained, then no benefits of the position are recognized. The Company’s tax positions are reviewed and evaluated quarterly to determine whether the Company has uncertain tax positions that require financial statement recognition.
Deferred tax assets and liabilities are recognized for the expected future tax consequences of differences between the carrying amount of assets and liabilities and their respective tax basis using currently enacted tax rates. The effect on deferred tax assets and liabilities of a change in tax rates is recognized in income in the period during which the change is enacted. Deferred tax assets are reduced by a valuation allowance when it is more likely than not that all or a portion of the deferred tax assets will not be realized.
Fair Value Measurements
See note 6 to our condensed consolidated financial statements for a discussion of the Company’s fair value measurements.
As discussed in Note 6 to the condensed consolidated financial statements, Apollo utilizes valuation committees consisting of members from senior management, to review and approve the valuation results related to the investments of the
funds it manages. For certain publicly traded vehicles managed by the Company, a review is performed by an independent board of directors. The Company also retains external valuation firms to provide third-party valuation consulting services to Apollo, which consist of certain limited procedures that management identifies and requests them to perform. Please refer to Note 6 of this report for more details on valuation techniques employed by Apollo to determine fair value of its investments in credit, private equity and real assets investments.
Credit Investments
The majority of investments in Apollo’s credit funds are valued based on quoted market prices. Quoted market prices are considered to be indicative of fair value, incorporating all the risks and uncertainties associated with the underlying instrument in the prevailing market environment. Apollo’s valuation team further analyzes how prices have moved over the measurement period within each asset class and sector and compared it with the relevant benchmark indices.
Debt and equity securities that are not publicly traded or whose market prices are not readily available are valued at fair value utilizing a model-based approach to determine fair value. Apollo’s privately valued credit portfolio is concentrated in bank loans to middle-market companies, loans backed by commercial real estate, aviation and other asset backed loans, and life settlements. Valuation approaches used to estimate the fair value of illiquid credit investments may also include the market approach and the income approach. Most private debt instruments are valued utilizing discounted cash flow models where the key valuation drivers are market yield/credit spread, timing of cash flows and recovery of principal amount. Some of the considerations incorporated in determining the key valuation inputs in our model-based valuation approaches include but are not limited to:
•relative liquidity and change in liquidity profileConsolidation of an asset class compared to underlying assets in an observable benchmark;VIEs
•specific contractual terms such as LIBOR floor, covenants or extension features;Revenue Recognition
◦Performance Fees within Investment Income
◦Management Fees
•portfolio company specific business strength or weakness as it relates to COVID-19;Investments, at fair value
•portfolio company’s liquidity profile;Fair value of financial instruments
•expected maturity of debt instruments, which could be different than the contractual maturity;Income taxes
•
requested or granted amendments or deferrals; and
•expected recovery and timing of recovery for distressed debt instruments.
Private Equity Investments
Over two thirds of Apollo’s private equity investments are valued using a market approach or an observable market price making overall portfolio returns in-line with relevant benchmark indices. Some of the additional considerations incorporated in valuation approaches include but are not limited to:
•relative liquidity and change in liquidity profile of the portfolio company; and
•portfolio company-specific business strength or weakness as it relates to COVID-19.
Real Assets Investments
The estimated fair valueabove critical accounting estimates and judgments are discussed in detail in ”Item 7. Management’s Discussion and Analysis of commercial mortgage-backed securities (“CMBS”) in Apollo’s real assets funds is determined by reference to market prices provided by certain dealers who make a market in these financial instruments. DebtFinancial Condition and equity securities that are not publicly traded or whose market prices are not readily available, such as private commercial real estate debtResults of Operations—Critical Accounting Estimates and equity investments in entities that own real estate, are valued at fair value utilizing a model-based approach to determine fair value. SomePolicies” of the considerations incorporated in our model-based valuation approaches include but are not limited to:
•property type specific considerations of potential disruption from COVID-19;
•individual property specific considerations: region and sub-market, tenant profile and liquidity profile;
•requested or granted amendments or deferrals;
•expected maturity of debt instruments; and
•loans evaluated for possible impairment.2021 Annual Report.
Recent Accounting Pronouncements
A list of recent accounting pronouncements that are relevant to Apollo and its industry is included in note 2 to our condensed consolidated financial statements.
Contractual Obligations, Commitments and Contingencies
The Company’s material contractual obligations consisted of lease obligations, contractual commitments as part of the ongoing operations of the funds, debt obligations, and debt obligations.AOG Unit Payments. Fixed and determinable payments due in connection with these obligations are as follows as of June 30, 2021:March 31, 2022:
| | | | | | | | | | | | | | | | | | | | | | | | | | | | | | | | | | | | | | | | | |
| Remaining 2021 | | 2022 | | 2023 | | 2024 | | 2025 | | Thereafter | | Total |
| | (in thousands) |
Operating lease obligations(1) | $ | 23,251 | | | $ | 52,081 | | | $ | 52,127 | | | $ | 48,454 | | | $ | 46,162 | | | $ | 434,422 | | | $ | 656,497 | |
Other long-term obligations(2) | 21,523 | | | 7,555 | | | 2,020 | | | 820 | | | 711 | | | 711 | | | 33,340 | |
2018 AMH Credit Facility(3) | 338 | | | 675 | | | 675 | | | 675 | | | 611 | | | — | | | 2,974 | |
2024 Senior Notes(3) | 10,000 | | | 20,000 | | | 20,000 | | | 508,333 | | | — | | | — | | | 558,333 | |
2026 Senior Notes(3) | 11,000 | | | 22,000 | | | 22,000 | | | 22,000 | | | 22,000 | | | 508,983 | | | 607,983 | |
2029 Senior Notes(3) | 16,443 | | | 32,886 | | | 32,886 | | | 32,886 | | | 32,886 | | | 777,933 | | | 925,920 | |
2030 Senior Notes(3) | 6,625 | | | 13,250 | | | 13,250 | | | 13,250 | | | 13,250 | | | 558,663 | | | 618,288 | |
2039 Senior Secured Guaranteed Notes(3)(4) | 7,751 | | | 15,503 | | | 15,503 | | | 15,503 | | | 15,503 | | | 379,558 | | | 449,321 | |
2048 Senior Notes(3) | 7,500 | | | 15,000 | | | 15,000 | | | 15,000 | | | 15,000 | | | 633,750 | | | 701,250 | |
2050 Subordinated Notes(3) | 7,425 | | | 14,850 | | | 14,850 | | | 14,850 | | | 14,850 | | | 656,994 | | | 723,819 | |
| Secured Borrowing I | 174 | | | 349 | | | 349 | | | 349 | | | 349 | | | 20,709 | | | 22,279 | |
| Secured Borrowing II | 171 | | | 343 | | | 343 | | | 343 | | | 343 | | | 22,311 | | | 23,854 | |
| 2016 AMI Term Facility I | 130 | | | 260 | | | 260 | | | 260 | | | 20,013 | | | — | | | 20,923 | |
| 2016 AMI Term Facility II | 135 | | | 271 | | | 19,489 | | | — | | | — | | | — | | | 19,895 | |
| Obligations | $ | 112,466 | | | $ | 195,023 | | | $ | 208,752 | | | $ | 672,723 | | | $ | 181,678 | | | $ | 3,994,034 | | | $ | 5,364,676 | |
(1)Operating lease obligations excludes $131.3 million of other operating expenses associated with operating leases. Operating lease obligations includes $160.4 million related to leases that have not yet commenced.
(2)Includes (i) payments on management service agreements related to certain assets and (ii) payments with respect to certain consulting agreements entered into by the Company. Note that a significant portion of these costs are reimbursable by funds.
(3)See note 10 of the condensed consolidated financial statements for further discussion of these debt obligations.
(4)Payments based on anticipated repayment date of July 2029.
| | | | | | | | | | | | | | | | | | | | | | | | | | | | | |
| Remaining 2022 | | 2023 - 2024 | | 2025 - 2026 | | 2027 and Thereafter | | Total |
| | (in thousands) |
Operating lease obligations(1) | $ | 46,451 | | | $ | 133,659 | | | $ | 122,729 | | | $ | 493,132 | | | $ | 795,971 | |
Other long-term obligations(2) | 40,756 | | | 3,624 | | | 1,328 | | | 664 | | | 46,372 | |
AMH Credit Facility(3) | 506 | | | 1,350 | | | 611 | | | — | | | 2,467 | |
Debt obligations(3) | 89,103 | | | 743,621 | | | 702,275 | | | 2,571,859 | | | 4,106,858 | |
AOG Unit Payment (4) | 131,450 | | | 350,534 | | | — | | | — | | | 481,984 | |
| Obligations | $ | 308,266 | | | $ | 1,232,788 | | | $ | 826,943 | | | $ | 3,065,655 | | | $ | 5,433,652 | |
| | | | | | | | | |
(1) Operating lease obligations excludes $168.8 million of other operating expenses associated with operating leases. |
(2) Includes (i) payments on management service agreements related to certain assets and (ii) payments with respect to certain consulting agreements entered into by the Company. Note that a significant portion of these costs are reimbursable by funds. |
(3) See note 11 of the condensed consolidated financial statements for further discussion of these debt obligations. |
(4) See note 14 to the condensed consolidated financial statements for more information regarding the AOG Unit Payment. |
Note: Due to the fact that the timing of certain amounts to be paid cannot be determined or for other reasons discussed below, the following contractual commitments have not been presented in the table above.
(i)As noted previously, we have entered into a tax receivable agreement with our Co-FoundersFormer Managing Partners and Contributing Partners which requires us to pay to our Co-FoundersFormer Managing Partners and Contributing Partners 85% of any tax savings received by AGM Inc. and its subsidiaries from our step-up in tax basis. The tax savings achieved may not ensure that we have sufficient cash available to pay this liability and we might be required to incur additional debt to satisfy this liability.
(ii)Debt amounts related to the consolidated VIEs are not presented in the table above as the Company is not a guarantor of these non-recourse liabilities.
(iii)In connection with the Stone Tower acquisition, the Company agreed to pay the former owners of Stone Tower a specified percentage of any future performance fees earned from certain of the Stone Tower funds, CLOs and strategic investment accounts. This contingent consideration liability is remeasured to fair value at each reporting period until the obligations are satisfied. See note 15 to the condensed consolidated financial statements for further information regarding the contingent consideration liability.
(iv)Commitments from certain of our subsidiaries to contribute to the funds we manage and certain related parties.
Commitments
Certain of our management companies and general partners are committed to contribute to the funds we manage and certain related parties. While a small percentage of these amounts are funded by us, the majority of these amounts have historically been funded by our related parties, including certain of our employees and certain Apollo funds. The table below presents the commitment and remaining commitment amounts of Apollo and its related parties and the commitment and remaining commitment amounts of Apollo only (excluding related parties) for each credit, private equity and real assets fund as of June 30, 2021 ($ inMarch 31, 2022 (in millions):
| | | | | | | | | | | | | | | | | | | | | | | |
| Fund | Apollo and Related Party Commitments | | Apollo Only (Excluding Related Party) Commitments | | Apollo and Related Party Remaining Commitments | | Apollo Only (Excluding Related Party) Remaining Commitments |
| Credit: | | | | | | | |
| FCI III | $ | 244.3 | | | $ | 0.1 | | | $ | 120.0 | | | $ | 0.1 | |
| SCRF IV | 416.1 | | | 33.1 | | | 145.1 | | | 11.4 | |
| Accord IV | 246.2 | | | 20.0 | | | 200.7 | | | 16.3 | |
| Accord IIIB | 140.5 | | | 14.1 | | | 97.8 | | | 11.3 | |
| Accord III | 225.1 | | | 0.1 | | | 97.8 | | | — | |
| Apollo Strategic Origination Partners | 6,121.2 | | | 121.2 | | | 5,981.9 | | | 118.5 | |
| Apollo Origination Partners | 1,352.7 | | | 7.7 | | | 1,207.8 | | | 6.9 | |
| Other Credit | 9,250.3 | | | 608.0 | | | 2,975.6 | | | 128.1 | |
| Total Credit | 17,996.4 | | | 804.3 | | | 10,826.7 | | | 292.6 | |
| Private Equity: | | | | | | | |
| Fund IX | 1,914.5 | | | 448.3 | | | 1,079.1 | | | 253.7 | |
| Fund VIII | 1,543.5 | | | 396.8 | | | 217.6 | | | 57.8 | |
| Fund VII | 467.2 | | | 178.1 | | | 59.7 | | | 22.9 | |
| ANRP III | 650.1 | | | 20.4 | | | 568.5 | | | 17.9 | |
| ANRP II | 481.2 | | | 26.1 | | | 103.4 | | | 5.8 | |
| ANRP I | 376.1 | | | 10.1 | | | 47.3 | | | 1.0 | |
| AION Capital Partners | 151.0 | | | 50.0 | | | 15.6 | | | 4.9 | |
| HVF II | 1,334.1 | | | 62.7 | | | 1,334.1 | | | 62.7 | |
| HVF | 839.6 | | | 63.4 | | | 196.8 | | | 14.9 | |
| Other Private Equity | 4,359.0 | | | 277.6 | | | 1,064.1 | | | 114.6 | |
| Total Private Equity | 12,116.3 | | | 1,533.5 | | | 4,686.2 | | | 556.2 | |
| Real Assets: | | | | | | | |
| European Principal Finance Funds | | | | | | | |
EPF III(1) | 609.4 | | | 74.2 | | | 290.2 | | | 36.4 | |
EPF II(1) | 412.3 | | | 60.2 | | | 90.7 | | | 17.8 | |
EPF I(1) | 318.5 | | | 21.0 | | | 51.4 | | | 4.8 | |
U.S. RE Fund III(2) | 356.3 | | | 8.5 | | | 266.6 | | | 6.8 | |
U.S. RE Fund II(2) | 676.3 | | | 4.9 | | | 188.3 | | | 1.2 | |
U.S. RE Fund I(2) | 435.3 | | | 16.8 | | | 77.2 | | | 2.6 | |
Asia RE Fund II(2) | 893.7 | | | 4.2 | | | 661.0 | | | 3.4 | |
Asia RE Fund I(2) | 364.3 | | | 8.4 | | | 176.9 | | | 3.2 | |
| Apollo Infrastructure Opportunities Fund II | 412.1 | | | 16.0 | | | 381.2 | | | 5.8 | |
Apollo Infrastructure Opportunities Fund I(3) | 241.2 | | | 8.9 | | | 64.2 | | | 2.4 | |
| Other Real Assets | 588.4 | | | 81.0 | | | 73.3 | | | 42.6 | |
| Total Real Assets | 5,307.8 | | | 304.1 | | | 2,321.0 | | | 127.0 | |
| Total | $ | 35,420.5 | | | $ | 2,641.9 | | | $ | 17,833.9 | | | $ | 975.8 | |
(1)Apollo’s commitment in these funds is denominated in Euros and translated into U.S. dollars at an exchange rate of €1.00 to $1.19 as of June 30, 2021.
(2)Figures for U.S. RE Fund I include base, additional, and co-investment commitments. A co-investment vehicle within U.S. RE Fund I is denominated in pound sterling and translated into U.S. dollars at an exchange rate of £1.00 to $1.38 as of June 30, 2021. Figures for U.S. RE Fund II, U.S. RE Fund III, Asia RE Fund I and Asia RE Fund II include co-investment commitments.
(3)Figures for AIOF I include Apollo Infra Equity US Fund, L.P. and Apollo Infra Equity International Fund, L.P. commitments. | | | | | | | | | | | | | | | | | | | | | | | |
| Fund | Apollo and Related Party Commitments | | Apollo Only (Excluding Related Party) Commitments | | Apollo and Related Party Remaining Commitments | | Apollo Only (Excluding Related Party) Remaining Commitments |
| Yield: | | | | | | | |
| Apollo Origination Partners | $ | 1,487.6 | | | $ | 17.6 | | | $ | 634.4 | | | $ | 13.1 | |
Athora(1) | 1,556.0 | | | 503.1 | | | 77.5 | | | 77.5 | |
| Apollo Strategic Origination Partners | 6,121.2 | | | 121.2 | | | 5,834.0 | | | 115.5 | |
| Other Yield | 6,583.5 | | | 251.2 | | | 2,869.4 | | | 28.5 | |
| Total Yield | 15,748.3 | | | 893.1 | | | 9,415.3 | | | 234.6 | |
| Hybrid: | | | | | | | |
| HVF II | 1,504.1 | | | 37.4 | | | 1,311.1 | | | 32.9 | |
| HVF | 843.4 | | | 8.7 | | | 172.1 | | | 1.2 | |
| FCI IV | 164.6 | | | 21.0 | | | 150.6 | | | 19.2 | |
| SCRF IV | 426.1 | | | 0.1 | | | 280.2 | | | 0.1 | |
| Accord V | 125.5 | | | 16.4 | | | 94.3 | | | 12.4 | |
| Accord IV | 246.2 | | | 20.0 | | | 193.2 | | | 19.4 | |
| Accord+ | 481.2 | | | 31.2 | | | 260.0 | | | 18.1 | |
| Apollo Infrastructure Opportunities Fund II | 607.6 | | | 47.6 | | | 541.0 | | | 43.2 | |
Apollo Infrastructure Opportunities Fund I(3) | 241.2 | | | 8.9 | | | 64.1 | | | 2.4 | |
| Other Hybrid | 8,481.2 | | | 433.5 | | | 2,342.5 | | | 121.2 | |
| Total Hybrid | 13,121.1 | | | 624.8 | | | 5,409.1 | | | 270.1 | |
| Equity: | | | | | | | |
| Fund IX | 1,914.5 | | | 34.8 | | | 896.3 | | | 11.0 | |
| Fund VII | 467.2 | | | 178.1 | | | 59.7 | | | 22.9 | |
| ANRP III | 650.1 | | | 10.1 | | | 409.1 | | | 6.4 | |
EPF IV(1) | 434.7 | | | 34.7 | | | 434.7 | | | 34.7 | |
EPF III(1) | 582.9 | | | 1.5 | | | 201.0 | | | 0.1 | |
EPF II(1) | 413.4 | | | 63.1 | | | 90.3 | | | 18.3 | |
EPF I(1) | 297.3 | | | 19.6 | | | 47.8 | | | 4.5 | |
U.S. RE Fund III(2) | 393.3 | | | 6.8 | | | 229.7 | | | 4.1 | |
U.S. RE Fund II(2) | 676.3 | | | 4.9 | | | 150.9 | | | 0.9 | |
U.S. RE Fund I(2) | 434.7 | | | 16.6 | | | 25.3 | | | 2.5 | |
Asia RE Fund II(2) | 916.5 | | | 2.0 | | | 681.0 | | | 1.5 | |
Asia RE Fund I(2) | 365.6 | | | 8.4 | | | 161.1 | | | 3.0 | |
| Other Equity | 7,125.0 | | | 142.9 | | | 1,126.5 | | | 38.6 | |
| Total Equity | 14,671.5 | | | 523.5 | | | 4,513.4 | | | 148.5 | |
| Total | $ | 43,540.9 | | | $ | 2,041.4 | | | $ | 19,337.8 | | | $ | 653.2 | |
| | | | | | | |
(1) Apollo’s commitment in these funds is denominated in Euros and translated into U.S. dollars at an exchange rate of €1.00 to $1.11 as of March 31, 2022. |
(2) Figures for U.S. RE Fund I include base, additional, and co-investment commitments. A co-investment vehicle within U.S. RE Fund I is denominated in pound sterling and translated into U.S. dollars at an exchange rate of £1.00 to $1.31 as of March 31, 2022. Figures for U.S. RE Fund II, U.S. RE Fund III, Asia RE Fund I and Asia RE Fund II include co-investment commitments. |
(3) Figures for AIOF I include Apollo Infra Equity U.S. Fund, L.P. and Apollo Infra Equity International Fund, L.P. commitments. |
The AMH Credit Facility, 2024 Senior Notes, 2026 Senior Notes, 2029 Senior Notes, 2030 Senior Notes, 2039 Senior Secured Guaranteed Notes, the 2048 Senior Notes and the 2050 Subordinated Notes will have future impacts on our cash uses. See note 1011 of our condensed consolidated financial statements for information regarding the Company’s debt arrangements.
Contingent Obligation—Performance fees with respect to certain credit and private equity funds and real assets funds isare subject to reversal in the event of future losses to the extent of the cumulative performance fees recognized in income to date. See note 15 of our condensed consolidated financial statements for a description of our contingent obligation.
One of the Company’s subsidiaries, AGS, provides underwriting commitments in connection with securities offerings of related parties of Apollo, including portfolio companies of the funds Apollo manages, as well as third parties. As of June 30, 2021March 31, 2022 and December 31, 2020,2021, there were no open underwriting commitments.
ITEM 3. QUANTITATIVE AND QUALITATIVE DISCLOSURES ABOUT MARKET RISK
Our predominant exposure to market risk is related to our role as investment manager and general partner for ourthe funds we manage and the sensitivity to movements in the fair value of their investments and resulting impact on performance fees and management fee revenues. Our direct investments in the funds also expose us to market risk whereby movements in the fair values of the underlying investments will increase or decrease both net gains (losses) from investment activities and income (loss) from equity method investments. For a discussionA description of the impact ofour market risk factors on our financial instruments see “Item 2. Management’s Discussionexposures may be found under Part II—Item 7A. Quantitative and Analysis of Financial Condition and Results of Operations—Critical Accounting Policies—Investments, at Fair Value.”
The fair valueQualitative Disclosures About Market Risk of our financial assets and liabilities of2021 Annual Report.
There have been no material changes to our funds may fluctuate in response to changes in the value of investments, foreign exchange, commodities and interest rates. The net effect of these fair value changes impacts the gains and lossesmarket risk exposures from investmentsthose previously disclosed in our condensed consolidated statements of operations. However, the majority of these fair value changes are absorbed by the Non-Controlling Interests.
The Company is subject to a concentration risk related to the investors in its funds. Although there are more than 1,000 investors in Apollo’s active credit, private equity and real assets funds, no individual investor accounts for more than 10% of the total committed capital to Apollo’s active funds.
Risks are analyzed across funds from the “bottom up” and from the “top down” with a particular focus on asymmetric risk. We gather and analyze data, monitor investments and markets in detail, and constantly strive to better quantify, qualify and circumscribe relevant risks.
Each risk management process is subject to our overall risk tolerance and philosophy and our enterprise-wide risk management framework. This framework includes identifying, measuring and managing market, credit and operational risks at each segment, as well as at the fund and Company level.
Each segment runs its own investment and risk management process subject to our overall risk tolerance and philosophy:
•Our credit and real assets funds continuously monitor a variety of markets for attractive trading opportunities, applying a number of traditional and customized risk management metrics to analyze risk related to specific assets or portfolios, as well as, fund-wide risks.
•The investment process of our private equity funds involves a detailed analysis of potential acquisitions, and investment management teams assigned to monitor the strategic development, financing and capital deployment decisions of each portfolio investment.
The Company has established a Global Risk Committee comprised of various members of senior management including the Company’s Co-Presidents, Co-Chief Operating Officers, General Counsel, Global Head of Human Capital, Chief Risk Officer, Head of Enterprise Risk Management and Head of Internal Audit. The risk committee is tasked with assisting the Company in monitoring and managing enterprise-wide risk. The risk committee generally meets on a quarterly basis and reports to senior management of the Company at such times as the committee deems appropriate and at least on an annual basis.
On at least a monthly basis, the Company’s risk department provides a summary analysis of fund level market and credit risk to the portfolio managers of the Company’s funds and the heads of the various business segments. On a periodic basis, the Company’s risk department provides analyses of select market and credit risk components to various members of senior management. In addition, the Company’s Chief Risk Officer reviews specific investments from the perspective of risk mitigation and discusses such analysis with the Company’s risk committee and/or the executive committee of the Company’s Board at such times as the Company’s Chief Risk Officer determines such discussions are warranted.
Impact onManagement Fees—Our management fees are based on one of the following:
•capital commitments to an Apollo fund;
•capital invested in an Apollo fund;
•the gross, net or adjusted asset value of an Apollo fund, as defined; or
•as otherwise defined in the respective agreements.
Management fees could be impacted by changes in market risk factors and management could consider an investment permanently impaired as a result of (i) such market risk factors causing changes in invested capital or in market values to below cost, in the case of certain credit funds and our private equity funds or (ii) such market risk factors causing changes in gross or net asset value, for the credit funds. The proportion of our management fees that are based on NAV is dependent on the number and types of our funds in existence and the current stage of each fund’s life cycle.
Impact on Advisory and Transaction Fees—We earn transaction fees relating to the negotiation of credit, private equity and real assets transactions and may obtain reimbursement for certain out-of-pocket expenses incurred. Subsequently, on a quarterly or annual basis, ongoing advisory fees, and additional transaction fees in connection with additional purchases, dispositions, or follow-on transactions, may be earned. Management Fee Offsets and any broken deal costs, if applicable, are reflected as a reduction to advisory and transaction fees. Advisory and transaction fees will be impacted by changes in market risk factors to the extent that they limit our opportunities to engage in credit, private equity and real assets transactions or impair our ability to consummate such transactions. The impact of changes in market risk factors on advisory and transaction fees is not readily predicted or estimated.
Impact on Performance Fees—We earn performance fees from our funds as a result of such funds achieving specified performance criteria. Our performance fees will be impacted by changes in market risk factors. However, several major factors will influence the degree of impact:
•the performance criteria for each individual fund in relation to how that fund’s results of operations are impacted by changes in market risk factors;
•whether such performance criteria are annual or over the life of the fund;
•to the extent applicable, the previous performance of each fund in relation to its performance criteria; and
•whether each funds’ performance fee distributions are subject to contingent repayment.
As a result, the impact of changes in market risk factors on performance fees will vary widely from fund to fund. The impact is heavily dependent on the prior and future performance of each fund, and therefore is not readily predicted or estimated.
Market Risk—We are directly and indirectly affected by changes in market conditions. Market risk generally represents the risk that values of assets and liabilities or revenues and expenses will be adversely affected by changes in market conditions. Market risk is inherent in each of our investments and activities, including equity investments, loans, short-term borrowings, long-term debt, hedging instruments, credit default swaps and derivatives. Just a few of the market conditions that may shift from time to time, thereby exposing us to market risk, include fluctuations in interest and currency exchange rates, equity prices, changes in the implied volatility of interest rates and price deterioration. Volatility in debt and equity markets can impact our pace of capital deployment, the timing of receipt of transaction fee revenues and the timing of realizations. These market conditions could have an impact on the value of fund investments and rates of return. Accordingly, depending on the instruments or activities impacted, market risks can have wide ranging, complex adverse effects on our results from operations and our overall financial condition. We monitor market risk using certain strategies and methodologies which management evaluates periodically for appropriateness. We intend to continue to monitor this risk going forward and continue to monitor our exposure to all market factors.
Interest Rate Risk—Interest rate risk represents exposure we and our funds have to instruments whose values vary with the change in interest rates. These instruments include, but are not limited to, loans, borrowings, investments in interest bearing securities and derivative instruments. We may seek to mitigate risks associated with the exposures by having our funds take offsetting positions in derivative contracts. Hedging instruments allow us to seek to mitigate risks by reducing the effect of movements in the level of interest rates, changes in the shape of the yield curve, as well as, changes in interest rate volatility. Hedging instruments used to mitigate these risks may include related derivatives such as options, futures and swaps.
Credit Risk—Certain of our funds are subject to certain inherent risks through their investments.
Certain of our entities invest substantially all of their excess cash in open-end money market funds and money market demand accounts, which are included in cash and cash equivalents. The money market funds invest primarily in
government securities and other short-term, highly liquid instruments with a low risk of loss. We continually monitor the funds’ performance in order to manage any risk associated with these investments.
Certain of our funds hold derivative instruments that contain an element of risk in the event that the counterparties may be unable to meet the terms of such agreements. We seek to minimize our risk exposure by limiting the counterparties with which our funds enter into contracts to banks and investment banks who meet established credit and capital guidelines. As of June 30, 2021 we do not expect any counterparty to default on its obligations and therefore do not expect to incur any loss due to counterparty default.
Certain of our funds’ investments include lower-rated and comparable quality unrated distressed investments and other instruments. Investments in such debt instruments are accompanied by a greater degree of risk of loss due to default by the issuer because such debt instruments are generally unsecured and subordinated to other creditors of the issuer. These issuers generally have high levels of indebtedness and can be more sensitive to adverse market conditions, such as a recession or increasing interest rates, as compared to higher rated issuers. We seek to minimize risk exposure by subjecting each prospective investment to rigorous credit analysis and by making investment decisions based upon objectives that include capital preservation and appreciation, and industry and issuer diversification.
Foreign Exchange Risk—Foreign exchange risk represents exposures our funds have to changes in the values of current fund holdings and future cash flows denominated in other currencies and investments in non-U.S. companies. The types of investments exposed to this risk include investments in foreign subsidiaries, foreign currency-denominated loans, foreign currency-denominated transactions, and various foreign exchange derivative instruments whose values fluctuate with changes in currency exchange rates or foreign interest rates. Instruments used to mitigate this risk are foreign exchange options, currency swaps, futures and forwards. These instruments may be used to help insulate our funds against losses that may arise due to volatile movements in foreign exchange rates and/or interest rates.
In our capacity as investment manager of the funds we manage, we continuously monitor a variety of markets for attractive opportunities for managing risk. For example, certain of the funds we manage may put in place foreign exchange hedges or borrowings with respect to certain foreign currency denominated investments to provide a hedge against foreign exchange exposure.
Non-U.S. Operations—We conduct business throughout the world and are continuing to expand into foreign markets. We currently have offices outside the U.S. in London, Frankfurt, Madrid, Luxembourg, Mumbai, Delhi, Singapore, Hong Kong, Shanghai and Tokyo, among other locations throughout the world, and have been strategically growing our international presence. Our fund investments and our revenues are primarily derived from our U.S. operations. With respect to our non-U.S. operations, we are subject to risk of loss from currency fluctuations, social instability, changes in governmental policies or policies of central banks, expropriation, nationalization, unfavorable political and diplomatic developments and changes in legislation relating to non-U.S. ownership. Our funds also invest in the securities of companies which are located in non-U.S. jurisdictions. As we continue to expand globally, we will continue to focus on monitoring and managing these risk factors as they relate to specific non-U.S. investments.Annual Report.
ITEM 4. CONTROLS AND PROCEDURES
We maintain “disclosure controls and procedures”, as such term is defined in Rules 13a-15(e) and 15d-15(e) under the Exchange Act, that are designed to ensure that information required to be disclosed by us in reports that we file or submit under the Exchange Act is recorded, processed, summarized and reported within the time periods specified in SEC rules and forms, and that such information is accumulated and communicated to our management, including our Chief Executive OfficerCo-Presidents and Chief Financial Officer, as appropriate, to allow timely decisions regarding required disclosure. In designing disclosure controls and procedures, our management necessarily was required to apply its judgment in evaluating the cost-benefit relationship of possible disclosure controls and procedures. The design of any disclosure controls and procedures also is based in part upon certain assumptions about the likelihood of future events, and there can be no assurance that any design will succeed in achieving its stated goals under all potential future conditions. Any controls and procedures, no matter how well designed and operated, can provide only reasonable assurance of achieving the desired objectives.
Our management, including our Chief Executive OfficerCo-Presidents and Chief Financial Officer, evaluated the effectiveness of our disclosure controls and procedures pursuant to Rule 13a-15 under the Exchange Act as of the end of the period covered by this report. Based on that evaluation, our Chief Executive OfficerCo-Presidents and Chief Financial Officer have concluded that, as of the end of the period covered by this report, our disclosure controls and procedures (as defined in Rule 13a-15(e) under the Exchange Act) are effective at the reasonable assurance level to accomplish their objectives of ensuring that information we are required to disclose in reports that we file or submit under the Exchange Act is recorded, processed, summarized and reported within the time periods specified in SEC rules and forms, and that such information is accumulated and communicated to our
management, including our Chief Executive OfficerCo-Presidents and Chief Financial Officer, as appropriate, to allow timely decisions regarding required disclosure.
No changes in our internal control over financial reporting (as such term is defined in Rules 13a–15(f) and 15d–15(f) under the Exchange Act) occurred during our most recent quarter, that have materially affected, or are reasonably likely to materially affect, our internal control over financial reporting. We have not experienced any material impact to our internal control over financial reporting despite the fact that most of our employees are working remotely due to the COVID-19 pandemic. We are continually monitoring and assessing the COVID-19 situation on our internal controls to minimize the impact on their design and operating effectiveness.
PART II - OTHER INFORMATION
ITEM 1. LEGAL PROCEEDINGS
See note 15 to our condensed consolidated financial statements for a summary of the Company’s legal proceedings.
ITEM 1A. RISK FACTORS
For a discussion of our potential risks and uncertainties, see the information under the heading "Risk Factors" in our 20202021 Annual Report, and our Quarterly Report for the quarter ended March 31, 2021, which areis accessible on the Securities and Exchange Commission's website at www.sec.gov. There have been no material changes to the risk factors for the three months ended June 30, 2020.March 31, 2022.
The risks described in our 20202021 Annual Report and our Quarterly Report for the quarter ended March 31, 2021 are not the only risks facing us. Additional risks and uncertainties not currently known to us or that we currently deem to be immaterial also may materially adversely affect our business, financial condition and/or operating results.
ITEM 2. UNREGISTERED SALESALES OF EQUITY SECURITIES AND USE OF PROCEEDS
On May 7, 2021, May 10, 2021, May 17, 2021, May 18, 2021, and June 2, 2021, we issued 332,010, 1,614, 3,260, 56,243, and 4,655 shares of Class A shares, respectively, net of taxes to Apollo Management Holdings, L.P., a subsidiary of Apollo Global Management, Inc., in connection with issuances of stock to participants in the Equity Plan for an aggregate purchase price of $18.8 million, $0.1 million, $0.2 million, $3.2 million, and $0.3 million respectively. The issuance was exempt from registration under the Securities Act in accordance with Section 4(a)(2) and Rule 506(b) thereof, as transactions by the issuer not involving a public offering. We determined that the purchaser of Class A shares in the transactions, Apollo Management Holdings, L.P., was an accredited investor.
Issuer Purchases of Equity Securities
The following table sets forth purchases of our Class A shares made by us or on our behalf during the fiscal quarter ended June 30, 2021. From April 1, 2021 through June 30, 2021, the Company paid approximately $15.6 million in cash to satisfy tax withholding and cash settlement obligations in lieu of issuing Class A shares upon the vesting of equity awards representing 274,888 Class A shares.
| | | | | | | | | | | | | | | | | | | | | | | | | | |
| Period | | Total number of Class A shares purchased(1) | | Average price paid per share | | Total number of Class A shares purchased as part of publicly announced plans or programs(2) | | Approximate dollar value of Class A shares that may yet be purchased under the plans or programs (3) |
| April 1, 2021 through April 30, 2021 | | — | | | $ | — | | | — | | | $ | 334,607,173 | |
| May 1, 2021 through May 31, 2021 | | 2,071,381 | | | $ | 57.20 | | | 1,744,776 | | | $ | 217,683,321 | |
| June 1, 2021 through June 30, 2021 | | 73,332 | | | $ | 57.50 | | | 73,332 | | | $ | 213,300,503 | |
| Total | | 2,144,713 | | | | | | | |
(1) Certain Apollo employees receive a portion of the profit sharing proceeds of certain funds in the form of (a) restricted Class A shares that they are required to purchase with such proceeds or (b) RSUs, in each case which equity-based awards generally vest over three years. These equity-based awards are granted under the Company's Equity Plan. To prevent dilution on account of these awards, Apollo may, in its discretion, repurchase Class A shares on the open market and retire them. During the three months ended June 30, 2021, we repurchased 326,605 Class A shares at an average price paid per share of $51.93 in open-market transactions not pursuant to a publicly-announced repurchase plan or program on account of these awards. See note 13 to the condensed consolidated financial statements for further information on Class A shares.
(2) Pursuant to a share repurchase program that was publicly announced on March 12, 2020, the Company is authorized to repurchase up to $500 million in the aggregate of its Class A shares, including through the repurchase of outstanding Class A shares and through a reduction of Class A shares to be issued to employees to satisfy associated tax obligations in connection with the settlement of equity-based awards granted under the 2019 Equity Plan (or any successor equity plan thereto). This authorization increased the Company’s capacity to repurchase shares from $80 million of unused capacity under the Company’s previously approved share repurchase plan. Class A shares may be repurchased from time to time in open market transactions, in privately negotiated transactions, pursuant to a trading plan adopted in accordance with Rule 10b5-1 of the Exchange Act, or otherwise, with the size and timing of these repurchases depending on legal requirements, price, market and economic conditions and other factors. The Company is not obligated under the terms of the program to repurchase any of its Class A shares. The repurchase program has no expiration date and may be suspended or
terminated by the Company at any time without prior notice. Class A shares repurchased as part of this program are canceled by the Company.
(3) Amounts have been adjusted to account for reductions of Class A shares to satisfy associated tax obligations in connection with the settlement of equity-based awards granted to employees under the Equity Plan.Not applicable.
ITEM 3. DEFAULTS UPON SENIOR SECURITIES
Not applicable.
ITEM 4. MINE SAFETY DISCLOSURES
Not applicable.
ITEM 5. OTHER INFORMATION
Not applicable.
ITEM 6. EXHIBITS
| | | | | | | | | |
Exhibit
Number | | Exhibit Description | |
| | |
| 2.1 | | Agreement and Plan of Merger, dated as of March 8, 2021, by and among Apollo Global Management, Inc., Athene Holding Ltd., Tango Holdings, Inc., Blue Merger Sub, Ltd., and Green Merger Sub, Inc. (incorporated by reference to Exhibit 2.1 to the Registrant’s Form 8-K filed with the Securities and Exchange Commission on March 8, 2021 (File No. 001-35107)). | |
| | | |
| 3.1 | | |
| |
3.2 | | | |
| | | |
| 3.2 | | | |
| | | |
| 3.3 | | | |
| | |
| 4.1 | | | |
| | | | | | | | |
Exhibit
Number | | Exhibit Description |
| |
| 4.5 | | | |
| | |
| 4.6 | | | |
| | | |
| 4.7 | | | |
| | | |
| 4.8 | | | |
| | | |
| 4.9 | | | |
| | | |
| 4.10 | | | |
| | | |
| 4.11 | | | |
| | | |
| 4.12 | | | |
| | | |
| 4.13 | | | |
| | | |
| | | | | | | | |
Exhibit
Number | | Exhibit Description |
| |
| 4.16 | | | |
| | | |
| 4.17 | | Amendment No. 1, dated and effective as of September 30, 2019, to Indenture dated as of June 10, 2019, among APH Finance I, LLC, APH Finance 2, LLC, APH Finance 3, LLC and U.S. Bank National Association, as trustee (incorporated by reference to Exhibit 4.17 to the Registrant’s Form 10-Q for the period ended September 30, 2019 (File No. 001-35107)). | |
| | | |
| 4.18 | | | |
| | | |
| 4.19 | | | |
| | | |
| 4.20 | | | |
| | | |
| 4.21 | | |
| | |
| | |
| | |
| | |
| | |
| | |
| | |
| | |
| | |
| | |
| | |
| | |
| | |
| *+10.1 | | First Amendment to Credit Agreement, datedApollo Global Management, Inc. 2019 Omnibus Equity Incentive Plan, as amended and restated as of May 10, 2021, by and among Apollo Management Holdings, L.P., the guarantors party thereto, the lenders party thereto and Citibank, N.A., as administrative agent.January 26, 2022. | |
| | | |
| *+10.2 | | | |
| | | |
| *+10.3 | | |
| | |
*+10.4 | | | |
| | | |
*+10.510.4 | | | |
| | | |
| *†+10.5 | | | |
| | | |
| *†+10.6 | | | |
| | | |
| *†+10.7 | | | |
| | | |
| *†+10.8 | | | |
| | | | | | | | | |
| | | |
| *+10.9 | | | |
| | | |
| *10.10 | | | |
| | | |
| | | |
| | | |
| | | |
| | | |
| | | |
| | | |
| | | |
| | | |
| | | |
| | | |
| | | |
| | | |
| | | |
| | | |
| | | |
| | | |
| | | |
| | | |
| | | |
| | | |
| | | |
| | | |
| | | |
| | | |
| | | |
| | | |
| | | |
| | | |
| | | |
| | | |
| | | |
| | | |
| | |
| | | |
| | |
| | | |
| | | |
| | | |
| | | |
| | | |
| | | |
| | | |
| | | |
| | | |
| | | |
| | | |
| | | |
| | | |
| | | |
| | | |
| | |
| | | |
| | | |
| | | |
| | | |
| | | |
| | | |
| | | |
| | | |
| | | |
| | | |
| | | |
| | | |
| | | |
| | | |
| | | |
| | | |
| | | |
| | | |
| | | |
| | |
| | | |
| | |
| | | |
| | |
| | | |
| | | |
| | | |
| | | |
| | | |
| | | |
| | | |
| | | |
| | | |
| | | |
| | | |
| | | |
| | | |
| | | |
| | | |
| | | |
| | | |
| | | |
| | | |
| | | |
| | | |
| | | |
| | | |
| | | |
| | | |
| | | |
| | | |
| | | |
| | | |
| | | |
| | | |
| | | |
| | | |
| | | |
| | | |
| | | |
| | | |
| | | |
| | | |
| | | |
| | | |
| | | |
| | | |
| | | |
| | | |
| | | |
| | | |
| | | |
| | | |
| | | |
| | | |
| | | |
| | | |
| | | |
| | | |
| | | |
| | | |
| | | |
| | | |
| | | |
| | | |
| | | |
| | | |
| | | |
| | | |
| | | |
| | | |
| | | |
| | | |
| | | |
| | | |
| | | |
| | | |
| | | |
| | | |
| | | |
| | | |
| | | |
| | | |
| | | |
| | | |
| | | |
| | | |
| | | |
| | | |
| | | |
| | | |
| | | |
| | | |
| | | |
| | | |
| | | |
| | | |
| | | |
| | | |
| | | |
| | | |
| | | |
| | | |
| | | |
| | | |
| | | |
| | | |
| | | |
| | | |
| | | |
| | | |
| | | |
| | | |
| | | |
| | | |
| | | |
| | | |
| | | |
| | | |
| | | |
| | | |
| | | |
| | | |
| | | |
| | | |
| | | |
| | | |
| | | |
| | | |
| | | |
| | | |
| | | |
| | | |
| | | |
| | | |
| | | |
| | | |
| | | |
| | | |
| | | |
| | | |
| | | |
| | | |
| | | |
| | | |
| | | |
| *31.1 | | | |
| | | |
| *31.2 | | | |
| | | |
| *31.3 | | | |
| | |
| *32.1 | | | |
| | | |
| *32.2 | | | |
| | |
| *32.3 | | |
| | | | |
| | | |
Exhibit
Number | | Exhibit Description |
| |
| | | |
| 101.INS | | XBRL Instance Document - the instance document does not appear in the Interactive Data File because its XBRL tags are embedded within the Inline XBRL document | |
| | |
| *101.SCH | | XBRL Taxonomy Extension Schema Document | |
| | |
| *101.CAL | | XBRL Taxonomy Extension Calculation Linkbase Document | |
| | |
| *101.DEF | | XBRL Taxonomy Extension Definition Linkbase Document | |
| | |
| *101.LAB | | XBRL Taxonomy Extension Label Linkbase Document | |
| | |
| *101.PRE | | XBRL Taxonomy Extension Presentation Linkbase Document | |
| | | |
| 104 | | Cover Page Interactive Data File (embedded within the Inline XBRL document). | |
| | | | | |
| * | Filed herewith. |
| + | Management contract or compensatory plan or arrangement. |
| † | Certain information contained in this exhibit has been omitted because it is not material and is the type that the registrant treats as private or confidential. |
The agreements and other documents filed as exhibits to this report are not intended to provide factual information or other disclosure other than with respect to the terms of the agreements or other documents themselves, and you should not rely on them for that purpose. In particular, any representations and warranties made by us in these agreements or other documents were made solely within the specific context of the relevant agreement or document and may not describe the actual state of affairs as of the date they were made or at any other time.
SIGNATURES
Pursuant to the requirements of the Securities Exchange Act of 1934, the registrant has duly caused this report to be signed on its behalf by the undersigned, thereunto duly authorized.
| | | | | | | | | | | |
| | | |
| | Apollo GlobalAsset Management, Inc. |
| | (Registrant) |
| | |
Date: August 6, 2021May 10, 2022 | By: | /s/ Martin KellyJohannes Worsoe |
| | Name: | Martin KellyJohannes Worsoe |
| | Title: | Chief Financial Officer and Co-Chief Operating Officer
(principal financial officer and authorized signatory) |