UNITED STATES
SECURITIES AND EXCHANGE COMMISSION
WASHINGTON, D.C. 20549
FORM 10-Q
(Mark One)
| |
| (X) | QUARTERLY REPORT PURSUANT TO SECTION 13 OR 15(d) OF THE SECURITIES EXCHANGE ACT OF 1934 |
For the quarterly period ended March 31,June 30, 2018
OR
| |
| ( ) | TRANSITION REPORT PURSUANT TO SECTION 13 OR 15(d) OF THE SECURITIES EXCHANGE ACT OF 1934 |
For the transition period from to
Commission File Number 001-33708
|
| | | | |
| Philip Morris International Inc. |
| | | | | |
(Exact name of registrant as specified in its charter)
|
| |
| Virginia | 13-3435103 |
(State or other jurisdiction of incorporation or organization) | (I.R.S. Employer Identification No.) |
|
| |
120 Park Avenue New York, New York | 10017 |
| (Address of principal executive offices) | (Zip Code) |
|
| |
| Registrant’s telephone number, including area code | (917) 663-2000 |
Former name, former address and former fiscal year, if changed since last report
Indicate by check mark whether the registrant (1) has filed all reports required to be filed by Section 13 or 15(d) of the Securities Exchange Act of 1934 during the preceding 12 months (or for such shorter period that the registrant was required to file such reports), and (2) has been subject to such filing requirements for the past 90 days. Yes þ No ¨
Indicate by check mark whether the registrant has submitted electronically and posted on its corporate Web site, if any, every Interactive Data File required to be submitted and posted pursuant to Rule 405 of Regulation S-T (§232.405 of this chapter) during the preceding 12 months (or for such shorter period that the registrant was required to submit and post such files). Yes þ No ¨
Indicate by check mark whether the registrant is a large accelerated filer, an accelerated filer, a non-accelerated filer, smaller reporting company, or an emerging growth company. See the definitions of “large accelerated filer,” “accelerated filer,” “smaller reporting company,” and "emerging growth company" in Rule 12b-2 of the Exchange Act.
Large accelerated filer þ Accelerated filer ¨
Non-accelerated filer ¨ (Do not check if a smaller reporting company) Smaller reporting company ¨
Emerging growth company ¨
If an emerging growth company, indicate by check mark if the registrant has elected not to use the extended transition period for complying with any new or revised financial accounting standards provided pursuant to Section 13(a) of the Exchange Act. ¨
Indicate by check mark whether the registrant is a shell company (as defined in Rule 12b-2 of the Exchange Act). Yes ¨ No þ
At AprilJuly 23, 2018, there were 1,554,473,7251,554,506,845 shares outstanding of the registrant’s common stock, no par value per share.
PHILIP MORRIS INTERNATIONAL INC.
TABLE OF CONTENTS
|
| | |
| | | Page No. |
| | | |
| PART I - | | |
| | | |
| Item 1. | | |
| | | |
| | Condensed Consolidated Balance Sheets at | |
| | March 31,June 30, 2018 and December 31, 2017 | |
| | | |
| | Condensed Consolidated Statements of Earnings for the | |
| | ThreeSix Months Ended March 31,June 30, 2018 and 2017 | |
| Three Months Ended June 30, 2018 and 2017 | |
| | | |
| | Condensed Consolidated Statements of Comprehensive Earnings for the | |
| | Six Months Ended June 30, 2018 and 2017 | |
| Three Months Ended March 31,June 30, 2018 and 2017
| |
| | | |
| | Condensed Consolidated Statements of Stockholders’ (Deficit) Equity for the | |
| | ThreeSix Months Ended March 31,June 30, 2018 and 2017 | |
| | | |
| | Condensed Consolidated Statements of Cash Flows for the | |
| | ThreeSix Months Ended March 31,June 30, 2018 and 2017 | |
| | |
| | | |
| | | |
| Item 2. | | |
| | | |
| Item 4. | | |
| | | |
| PART II - | | |
| | | |
| Item 1. | | |
| | | |
| Item 1A. | | |
| | | |
| Item 2. | | |
| | | |
| Item 6. | | |
| | | |
| | |
In this report, “PMI,” “we,” “us” and “our” refer to Philip Morris International Inc. and its subsidiaries.
PART I – FINANCIAL INFORMATION
Item 1. Financial Statements.
Philip Morris International Inc. and Subsidiaries
Condensed Consolidated Balance Sheets
(in millions of dollars)
(Unaudited)
| | | | March 31,
2018 | | December 31,
2017 | June 30,
2018 | | December 31,
2017 |
| ASSETS | | | | | | |
| Cash and cash equivalents | $ | 7,200 |
| | $ | 8,447 |
| $ | 6,587 |
| | $ | 8,447 |
|
| Trade receivables (less allowances of $25 in 2018 and $25 in 2017) | 3,373 |
| | 3,194 |
| |
| Trade receivables (less allowances of $23 in 2018 and $25 in 2017) | | 2,936 |
| | 3,194 |
|
| Other receivables | 521 |
| | 544 |
| 836 |
| | 544 |
|
Inventories: | | | | | | |
| Leaf tobacco | 2,737 |
| | 2,606 |
| 2,459 |
| | 2,606 |
|
| Other raw materials | 1,481 |
| | 1,563 |
| 1,463 |
| | 1,563 |
|
| Finished product | 4,374 |
| | 4,637 |
| 5,003 |
| | 4,637 |
|
| | 8,592 |
| | 8,806 |
| 8,925 |
| | 8,806 |
|
| Other current assets | 907 |
| | 603 |
| 744 |
| | 603 |
|
Total current assets | 20,593 |
| | 21,594 |
| 20,028 |
| | 21,594 |
|
Property, plant and equipment, at cost | 15,056 |
| | 14,566 |
| 14,382 |
| | 14,566 |
|
| Less: accumulated depreciation | 7,597 |
| | 7,295 |
| 7,269 |
| | 7,295 |
|
| | 7,459 |
| | 7,271 |
| 7,113 |
| | 7,271 |
|
| Goodwill (Note 4) | 7,667 |
| | 7,666 |
| 7,312 |
| | 7,666 |
|
| Other intangible assets, net (Note 4) | 2,455 |
| | 2,432 |
| 2,336 |
| | 2,432 |
|
| Investments in unconsolidated subsidiaries and equity securities (Notes 11&14) | 1,395 |
| | 1,074 |
| 1,352 |
| | 1,074 |
|
| Deferred income taxes | 1,150 |
| | 1,007 |
| 909 |
| | 1,007 |
|
| Other assets | 2,351 |
| | 1,924 |
| 1,671 |
| | 1,924 |
|
| TOTAL ASSETS | $ | 43,070 |
| | $ | 42,968 |
| $ | 40,721 |
| | $ | 42,968 |
|
See notes to condensed consolidated financial statements.
Continued
Philip Morris International Inc. and Subsidiaries
Condensed Consolidated Balance Sheets (Continued)
(in millions of dollars, except share data)
(Unaudited)
| | | | March 31,
2018 | | December 31,
2017 | June 30,
2018 | | December 31,
2017 |
| LIABILITIES | | | | | | |
| Short-term borrowings (Note 10) | $ | 608 |
| | $ | 499 |
| $ | 592 |
| | $ | 499 |
|
| Current portion of long-term debt (Note 10) | 4,662 |
| | 2,506 |
| 3,025 |
| | 2,506 |
|
| Accounts payable | 2,156 |
| | 2,242 |
| 1,953 |
| | 2,242 |
|
| Accrued liabilities: | | | | | | |
| Marketing and selling | 668 |
| | 708 |
| 634 |
| | 708 |
|
| Taxes, except income taxes | 5,085 |
| | 5,324 |
| 6,854 |
| | 5,324 |
|
| Employment costs | 770 |
| | 856 |
| 736 |
| | 856 |
|
| Dividends payable | 1,675 |
| | 1,669 |
| 1,785 |
| | 1,669 |
|
| Other | 1,556 |
| | 1,346 |
| 1,319 |
| | 1,346 |
|
| Income taxes (Note 9) | 508 |
| | 812 |
| 543 |
| | 812 |
|
| Total current liabilities | 17,688 |
| | 15,962 |
| 17,441 |
| | 15,962 |
|
Long-term debt (Note 10) | 29,578 |
| | 31,334 |
| 28,048 |
| | 31,334 |
|
| Deferred income taxes | 822 |
| | 799 |
| 793 |
| | 799 |
|
| Employment costs | 2,272 |
| | 2,271 |
| 2,136 |
| | 2,271 |
|
| Income taxes and other liabilities (Note 9) | 3,192 |
| | 2,832 |
| 2,471 |
| | 2,832 |
|
| Total liabilities | 53,552 |
| | 53,198 |
| 50,889 |
| | 53,198 |
|
Contingencies (Note 8) |
| |
|
| |
|
STOCKHOLDERS’ (DEFICIT) EQUITY | | | | | | |
Common stock, no par value
(2,109,316,331 shares issued in 2018 and 2017) | — |
| | — |
| — |
| | — |
|
| Additional paid-in capital | 1,856 |
| | 1,972 |
| 1,893 |
| | 1,972 |
|
| Earnings reinvested in the business | 29,985 |
| | 29,859 |
| 30,406 |
| | 29,859 |
|
| Accumulated other comprehensive losses | (8,883 | ) | | (8,535 | ) | (8,908 | ) | | (8,535 | ) |
| | 22,958 |
| | 23,296 |
| 23,391 |
| | 23,296 |
|
Less: cost of repurchased stock (554,850,007 and 556,098,569 shares in 2018 and 2017, respectively) | 35,308 |
| | 35,382 |
| |
Less: cost of repurchased stock (554,822,236 and 556,098,569 shares in 2018 and 2017, respectively) | | 35,306 |
| | 35,382 |
|
| Total PMI stockholders’ deficit | (12,350 | ) | | (12,086 | ) | (11,915 | ) | | (12,086 | ) |
| Noncontrolling interests | 1,868 |
| | 1,856 |
| 1,747 |
| | 1,856 |
|
| Total stockholders’ deficit | (10,482 | ) | | (10,230 | ) | (10,168 | ) | | (10,230 | ) |
| TOTAL LIABILITIES AND STOCKHOLDERS’ (DEFICIT) EQUITY | $ | 43,070 |
| | $ | 42,968 |
| $ | 40,721 |
| | $ | 42,968 |
|
See notes to condensed consolidated financial statements.
Philip Morris International Inc. and Subsidiaries
Condensed Consolidated Statements of Earnings
(in millions of dollars, except per share data)
(Unaudited)
| | | | For the Three Months Ended March 31, | For the Six Months Ended June 30, |
| | 2018 | | 2017 | 2018 | | 2017 |
| Revenues including excise taxes | $ | 18,426 |
| | $ | 16,556 |
| $ | 39,526 |
| | $ | 35,875 |
|
| Excise taxes on products | 11,530 |
| | 10,492 |
| 24,904 |
| | 22,894 |
|
| Net revenues (Note 18) | 6,896 |
| | 6,064 |
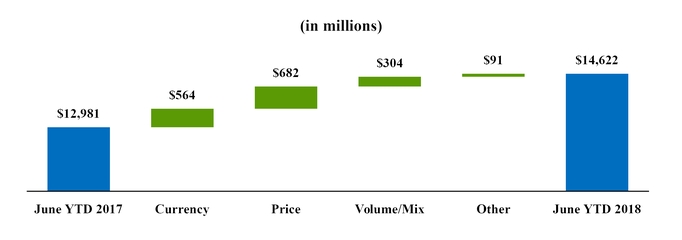
| 14,622 |
| | 12,981 |
|
| Cost of sales | 2,615 |
| | 2,177 |
| 5,359 |
| | 4,696 |
|
| Gross profit | 4,281 |
| | 3,887 |
| 9,263 |
| | 8,285 |
|
| Marketing, administration and research costs | 1,833 |
| | 1,449 |
| 3,701 |
| | 3,088 |
|
| Amortization of intangibles | 22 |
| | 22 |
| 43 |
| | 44 |
|
| Operating income | 2,426 |
| | 2,416 |
| 5,519 |
| | 5,153 |
|
| Interest expense, net | 227 |
| | 219 |
| 395 |
| | 432 |
|
| Pension and other employee benefit costs (Note 3) | 6 |
| | 20 |
| 12 |
| | 36 |
|
| Earnings before income taxes | 2,193 |
| | 2,177 |
| 5,112 |
| | 4,685 |
|
| Provision for income taxes | 559 |
| | 541 |
| 1,203 |
| | 1,230 |
|
| Equity investments and securities (income)/loss, net | (13 | ) | | (22 | ) | (33 | ) | | (45 | ) |
| Net earnings | 1,647 |
| | 1,658 |
| $ | 3,942 |
| | $ | 3,500 |
|
| Net earnings attributable to noncontrolling interests | 91 |
| | 68 |
| 188 |
| | 129 |
|
| Net earnings attributable to PMI | $ | 1,556 |
| | $ | 1,590 |
| $ | 3,754 |
| | $ | 3,371 |
|
Per share data (Note 6): | | | | | | |
| Basic earnings per share | $ | 1.00 |
| | $ | 1.02 |
| $ | 2.41 |
| | $ | 2.17 |
|
| Diluted earnings per share | $ | 1.00 |
| | $ | 1.02 |
| $ | 2.41 |
| | $ | 2.17 |
|
| Dividends declared | $ | 1.07 |
| | $ | 1.04 |
| $ | 2.21 |
| | $ | 2.08 |
|
See notes to condensed consolidated financial statements.
Philip Morris International Inc. and Subsidiaries
Condensed Consolidated Statements of Earnings
(in millions of dollars, except per share data)
(Unaudited)
|
| | | | | | | |
| | For the Three Months Ended June 30, |
| | 2018 | | 2017 |
| Revenues including excise taxes | $ | 21,100 |
| | $ | 19,319 |
|
| Excise taxes on products | 13,374 |
| | 12,402 |
|
| Net revenues (Note 18) | 7,726 |
| | 6,917 |
|
| Cost of sales | 2,744 |
| | 2,519 |
|
| Gross profit | 4,982 |
| | 4,398 |
|
| Marketing, administration and research costs | 1,868 |
| | 1,639 |
|
| Amortization of intangibles | 21 |
| | 22 |
|
| Operating income | 3,093 |
| | 2,737 |
|
| Interest expense, net | 168 |
| | 213 |
|
| Pension and other employee benefit costs (Note 3) | 6 |
| | 16 |
|
| Earnings before income taxes | 2,919 |
| | 2,508 |
|
| Provision for income taxes | 644 |
| | 689 |
|
| Equity investments and securities (income)/loss, net | (20 | ) | | (23 | ) |
| Net earnings | 2,295 |
| | 1,842 |
|
| Net earnings attributable to noncontrolling interests | 97 |
| | 61 |
|
| Net earnings attributable to PMI | $ | 2,198 |
| | $ | 1,781 |
|
Per share data (Note 6): | | | |
| Basic earnings per share | $ | 1.41 |
| | $ | 1.14 |
|
| Diluted earnings per share | $ | 1.41 |
| | $ | 1.14 |
|
| Dividends declared | $ | 1.14 |
| | $ | 1.04 |
|
See notes to condensed consolidated financial statements.
Philip Morris International Inc. and Subsidiaries
Condensed Consolidated Statements of Comprehensive Earnings
(in millions of dollars)
(Unaudited)
|
| | | | | | | | |
| | | For the Six Months Ended June 30, |
| | | 2018 | | 2017 |
| Net earnings | | $ | 3,942 |
| | $ | 3,500 |
|
| Other comprehensive earnings (losses), net of income taxes: | | | | |
| Change in currency translation adjustments: | | | | |
| Unrealized gains (losses), net of income taxes of ($27) in 2018 and $546 in 2017 | | (545 | ) | | 430 |
|
Change in net loss and prior service cost: | | | | |
| Amortization of net losses, prior service costs and net transition costs, net of income taxes of ($21) in 2018 and ($19) in 2017 | | 100 |
| | 111 |
|
Change in fair value of derivatives accounted for as hedges: | | | | |
| Gains (losses) recognized, net of income taxes of $1 in 2018 and $8 in 2017 | | (11 | ) | | (53 | ) |
| (Gains) losses transferred to earnings, net of income taxes of $- in 2018 and $1 in 2017 | | 6 |
| | (2 | ) |
| Total other comprehensive earnings (losses) | | (450 | ) | | 486 |
|
| Total comprehensive earnings | | 3,492 |
| | 3,986 |
|
| Less comprehensive earnings attributable to: | | | | |
| Noncontrolling interests | | 111 |
| | 126 |
|
| Comprehensive earnings attributable to PMI | | $ | 3,381 |
| | $ | 3,860 |
|
See notes to condensed consolidated financial statements.
Philip Morris International Inc. and Subsidiaries
Condensed Consolidated Statements of Comprehensive Earnings
(in millions of dollars)
(Unaudited)
| | | | | For the Three Months Ended March 31, | | For the Three Months Ended June 30, |
| | | 2018 | | 2017 | | 2018 | | 2017 |
| Net earnings | | $ | 1,647 |
| | $ | 1,658 |
| | $ | 2,295 |
| | $ | 1,842 |
|
| Other comprehensive earnings (losses), net of income taxes: | | | | | | | | |
| Change in currency translation adjustments: | | | | | | | | |
| Unrealized gains (losses), net of income taxes of $192 in 2018 and $156 in 2017 | | (371 | ) | | 303 |
| |
| Unrealized gains (losses), net of income taxes of ($219) in 2018 and $390 in 2017 | | | (174 | ) | | 127 |
|
Change in net loss and prior service cost: | | | | | | | | |
| Amortization of net losses, prior service costs and net transition costs, net of income taxes of ($11) in 2018 and ($9) in 2017 | | 50 |
| | 56 |
| |
| Amortization of net losses, prior service costs and net transition costs, net of income taxes of ($10) in 2018 and ($10) in 2017 | | | 50 |
| | 55 |
|
Change in fair value of derivatives accounted for as hedges: | | | | | | | | |
| Gains (losses) recognized, net of income taxes of $10 in 2018 and $11 in 2017 | | (64 | ) | | (75 | ) | |
| (Gains) losses transferred to earnings, net of income taxes of ($1) in 2018 and $2 in 2017 | | 2 |
| | 5 |
| |
| Gains (losses) recognized, net of income taxes of ($9) in 2018 and ($3) in 2017 | | | 53 |
| | 22 |
|
| (Gains) losses transferred to earnings, net of income taxes of $1 in 2018 and ($1) in 2017 | | | 4 |
| | (7 | ) |
| Total other comprehensive earnings (losses) | | (383 | ) | | 289 |
| | (67 | ) | | 197 |
|
| Total comprehensive earnings | | 1,264 |
| | 1,947 |
| | 2,228 |
| | 2,039 |
|
| Less comprehensive earnings attributable to: | | | | | | | | |
| Noncontrolling interests | | 56 |
| | 63 |
| | 55 |
| | 63 |
|
| Comprehensive earnings attributable to PMI | | $ | 1,208 |
| | $ | 1,884 |
| | $ | 2,173 |
| | $ | 1,976 |
|
See notes to condensed consolidated financial statementsstatements.
Philip Morris International Inc. and Subsidiaries
Condensed Consolidated Statements of Stockholders’ (Deficit) Equity
For the ThreeSix Months Ended March 31,June 30, 2018 and 2017
(in millions of dollars, except per share amounts)
(Unaudited)
| | | | PMI Stockholders’ (Deficit) Equity | | | | | PMI Stockholders’ (Deficit) Equity | | | | |
| | Common
Stock | | Additional
Paid-in
Capital | | Earnings
Reinvested in
the
Business | | Accumulated
Other
Comprehensive Losses | | Cost of
Repurchased
Stock | | Noncontrolling
Interests | | Total | Common
Stock | | Additional
Paid-in
Capital | | Earnings
Reinvested in
the
Business | | Accumulated
Other
Comprehensive Losses | | Cost of
Repurchased
Stock | | Noncontrolling
Interests | | Total |
| Balances, January 1, 2017 | $ | — |
| | $ | 1,964 |
| | $ | 30,397 |
| | $ | (9,559 | ) | | $ | (35,490 | ) | | $ | 1,788 |
| | $ | (10,900 | ) | $ | — |
| | $ | 1,964 |
| | $ | 30,397 |
| | $ | (9,559 | ) | | $ | (35,490 | ) | | $ | 1,788 |
| | $ | (10,900 | ) |
| Net earnings | | | | | 1,590 |
| | | | | | 68 |
| | 1,658 |
| | | | | 3,371 |
| | | | | | 129 |
| | 3,500 |
|
| Other comprehensive earnings (losses), net of income taxes | | | | | | | 294 |
| | | | (5 | ) | | 289 |
| | | | | | | 489 |
| | | | (3 | ) | | 486 |
|
| Issuance of stock awards | | | (71 | ) | | | | | | 104 |
| | | | 33 |
| | | (41 | ) | | | | | | 107 |
| | | | 66 |
|
| Dividends declared ($1.04 per share) | | | | | (1,620 | ) | | | | | | | | (1,620 | ) | |
| Dividends declared ($2.08 per share) | | | | | | (3,240 | ) | | | | | | | | (3,240 | ) |
| Payments to noncontrolling interests | | | | | | | | | | | (17 | ) | | (17 | ) | | | | | | | | | | | (192 | ) | | (192 | ) |
| Other | | | (1 | ) | | | | | | | | 1 |
| | — |
| | | (6 | ) | | | | | | | | 9 |
| | 3 |
|
| Balances, March 31, 2017 | $ | — |
| | $ | 1,892 |
| | $ | 30,367 |
| | $ | (9,265 | ) | | $ | (35,386 | ) | | $ | 1,835 |
| | $ | (10,557 | ) | |
| Balances, June 30, 2017 | | $ | — |
| | $ | 1,917 |
| | $ | 30,528 |
| | $ | (9,070 | ) | | $ | (35,383 | ) | | $ | 1,731 |
| | $ | (10,277 | ) |
| Balances, January 1, 2018 | $ | — |
| | $ | 1,972 |
| | $ | 29,859 |
| | $ | (8,535 | ) | | $ | (35,382 | ) | | $ | 1,856 |
| | $ | (10,230 | ) | $ | — |
| | $ | 1,972 |
| | $ | 29,859 |
| | $ | (8,535 | ) | | $ | (35,382 | ) | | $ | 1,856 |
| | $ | (10,230 | ) |
| Net earnings | | | | | 1,556 |
| | | | | | 91 |
| | 1,647 |
| | | | | 3,754 |
| | | | | | 188 |
| | 3,942 |
|
| Other comprehensive earnings (losses), net of income taxes | | | | | | | (344 | ) | | | | (39 | ) | | (383 | ) | | | | | | | (369 | ) | | | | (81 | ) | | (450 | ) |
| Issuance of stock awards | | | (29 | ) | | | | | | 74 |
| | | | 45 |
| | | 4 |
| | | | | | 76 |
| | | | 80 |
|
| Dividends declared ($1.07 per share) | | | | | (1,668 | ) | | | | | | | | (1,668 | ) | |
| Dividends declared ($2.21 per share) | | | | | | (3,445 | ) | | | | | | | | (3,445 | ) |
| Payments to noncontrolling interests | | | | | | | | | | | (36 | ) | | (36 | ) | | | | | | | | | | | (214 | ) | | (214 | ) |
| Adoption of new accounting standards (Note18) | | | | | 238 |
| | | | | | | | 238 |
| |
| Adoption of new accounting standards (Note 18) | | | | | | 238 |
| | | | | | | | 238 |
|
| Other (Note 17) | | | (87 | ) | | | | (4 | ) | | | | (4 | ) | | (95 | ) | | | (83 | ) | | | | (4 | ) | | | | (2 | ) | | (89 | ) |
| Balances, March 31, 2018 | $ | — |
| | $ | 1,856 |
| | $ | 29,985 |
| | $ | (8,883 | ) | | $ | (35,308 | ) | | $ | 1,868 |
| | $ | (10,482 | ) | |
| Balances, June 30, 2018 | | $ | — |
| | $ | 1,893 |
| | $ | 30,406 |
| | $ | (8,908 | ) | | $ | (35,306 | ) | | $ | 1,747 |
| | $ | (10,168 | ) |
See notes to condensed consolidated financial statements.
Philip Morris International Inc. and Subsidiaries
Condensed Consolidated Statements of Cash Flows
(in millions of dollars)
(Unaudited)
| | | | For the Three Months Ended March 31, | For the Six Months Ended June 30, |
| | 2018 | | 2017 | 2018 | | 2017 |
| CASH PROVIDED BY (USED IN) OPERATING ACTIVITIES | | | | | | |
| | | | | | | |
| Net earnings | $ | 1,647 |
| | $ | 1,658 |
| $ | 3,942 |
| | $ | 3,500 |
|
| | | | | | | |
| Adjustments to reconcile net earnings to operating cash flows: | | | | | | |
| Depreciation and amortization | 242 |
| | 197 |
| 488 |
| | 407 |
|
| Deferred income tax provision | 26 |
| | 27 |
| |
| Deferred income tax (benefit) provision | | (45 | ) | | 70 |
|
| Cash effects of changes in: | | | | | | |
| Receivables, net | (113 | ) | | 504 |
| (65 | ) | | (14 | ) |
| Inventories | 338 |
| | 1,243 |
| (526 | ) | | 1,664 |
|
| Accounts payable | (62 | ) | | 84 |
| (128 | ) | | 136 |
|
| Accrued liabilities and other current assets | (509 | ) | | (2,207 | ) | 2,023 |
| | (1,120 | ) |
| Income taxes | (315 | ) | | (510 | ) | (360 | ) | | (460 | ) |
| Pension plan contributions | (25 | ) | | (18 | ) | (41 | ) | | (29 | ) |
| Other | 151 |
| | (135 | ) | 85 |
| | (83 | ) |
| Net cash provided by operating activities | 1,380 |
| | 843 |
| 5,373 |
| | 4,071 |
|
| | | | | | | |
| CASH PROVIDED BY (USED IN) INVESTING ACTIVITIES | | | | | | |
| | | | | | | |
| Capital expenditures | (365 | ) | | (292 | ) | (774 | ) | | (560 | ) |
| Investments in unconsolidated subsidiaries and equity securities | (18 | ) | | (5 | ) | (30 | ) | | (19 | ) |
| Net investment hedges | (665 | ) | | (254 | ) | 77 |
| | (677 | ) |
| Other | 30 |
| | 8 |
| 44 |
| | 12 |
|
| Net cash used in investing activities | (1,018 | ) | | (543 | ) | (683 | ) | | (1,244 | ) |
See notes to condensed consolidated financial statements.
Continued
Philip Morris International Inc. and Subsidiaries
Condensed Consolidated Statements of Cash Flows (Continued)
(in millions of dollars)
(Unaudited)
| | | | For the Three Months Ended March 31, | For the Six Months Ended June 30, |
| | 2018 | | 2017 | 2018 | | 2017 |
| CASH PROVIDED BY (USED IN) FINANCING ACTIVITIES | | | | | | |
| | | | | | | |
| Short-term borrowing activity by original maturity: | | | | | | |
| Net issuances - maturities of 90 days or less | $ | 103 |
| | $ | 374 |
| $ | 119 |
| | $ | 266 |
|
| Long-term debt proceeds | — |
| | 2,482 |
| — |
| | 2,482 |
|
| Long-term debt repaid | — |
| | (814 | ) | (2,483 | ) | | (815 | ) |
| Dividends paid | (1,659 | ) | | (1,618 | ) | (3,332 | ) | | (3,236 | ) |
| Sale (purchase) of subsidiary shares to/(from) noncontrolling interests (Note 17) | (91 | ) | | — |
| (85 | ) | | 3 |
|
| Other | (91 | ) | | (83 | ) | (234 | ) | | (291 | ) |
| Net cash provided by (used in) financing activities | (1,738 | ) | | 341 |
| |
| Net cash used in financing activities | | (6,015 | ) | | (1,591 | ) |
| Effect of exchange rate changes on cash, cash equivalents and restricted cash | 131 |
| | 234 |
| (529 | ) | | 720 |
|
| | | | | | | |
Cash, cash equivalents and restricted cash(1): | | | | | | |
| Increase (Decrease) | (1,245 | ) | | 875 |
| (1,854 | ) | | 1,956 |
|
| Balance at beginning of period | 8,476 |
| | 4,331 |
| 8,476 |
| | 4,331 |
|
| Balance at end of period | $ | 7,231 |
| | $ | 5,206 |
| $ | 6,622 |
| | $ | 6,287 |
|
| | | | | | | |
(1) Following the adoption of Financial Accounting Standards Update ASU 2016-18, "Statement of Cash Flows: Restricted Cash," the amounts for cash and cash equivalents shown above include restricted cash of $31$35 million and $130$90 million as of March 31,June 30, 2018 and 2017, respectively, and $29 million and $92 million as of December 31, 2017, and 2016, respectively, which were included in other current assets in the condensed consolidated balance sheets.
See notes to condensed consolidated financial statements.
Philip Morris International Inc. and Subsidiaries
Notes to Condensed Consolidated Financial Statements
(Unaudited)
Note 1. Background and Basis of Presentation:
Background
Philip Morris International Inc. is a holding company incorporated in Virginia, U.S.A., whose subsidiaries and affiliates and their licensees are engaged in the manufacture and sale of cigarettes and other nicotine-containing products, including reduced-risk products, in markets outside of the United States of America. Throughout these financial statements, the term "PMI" refers to Philip Morris International Inc. and its subsidiaries.
Reduced-risk products ("RRPs") is the term PMI uses to refer to products that present, are likely to present, or have the potential to present less risk of harm to smokers who switch to these products versus continued smoking. PMI has a range of RRPs in various stages of development, scientific assessment and commercialization.
Basis of Presentation
The interim condensed consolidated financial statements of PMI are unaudited. These interim condensed consolidated financial statements have been prepared in conformity with accounting principles generally accepted in the United States of America and such principles are applied on a consistent basis. It is the opinion of PMI’s management that all adjustments necessary for a fair statement of the interim results presented have been reflected therein. All such adjustments were of a normal recurring nature. Net revenues and net earnings attributable to PMI for any interim period are not necessarily indicative of results that may be expected for the entire year.
To provide a greater focus on both parts of PMI's business -- combustible and reduced-risk products -- and to support PMI's transformation towards a smoke-free future, effective January 1, 2018, PMI began managing its business in six reportable segments as follows: European Union; Eastern Europe; Middle East & Africa; South & Southeast Asia; East Asia & Australia; and Latin America & Canada. For further details, see Note 7. Segment Reporting.
Certain prior years' amounts have been reclassified to conform with the current year's presentation, due primarily to new accounting guidance related to revenue recognition, pension costs and restricted cash and PMI’s decision to reorganize its reportable segments. For further details, see the condensed consolidated statements of cash flows, Note 3. Benefit Plans, Note 7. Segment Reporting and Note 18. New Accounting Standards. The changes did not have a material impact on PMI's consolidated financial position, results of operations or cash flows in any of the periods presented.
These statements should be read in conjunction with the audited consolidated financial statements and related notes, which appear in PMI’s Annual Report on Form 10-K for the year ended December 31, 2017.
Note 2. Stock Plans:
In May 2017, PMI’s shareholders approved the Philip Morris International Inc. 2017 Performance Incentive Plan (the “2017 Plan”). The 2017 Plan replaced the 2012 Performance Incentive Plan, and there will be no additional grants under the replaced plan. Under the 2017 Plan, PMI may grant to eligible employees restricted shares and restricted share units, performance-based cash incentive awards and performance-based equity awards. Up to 25 million shares of PMI’s common stock may be issued under the 2017 Plan. At March 31,June 30, 2018, shares available for grant under the 2017 Plan were 22,939,200.22,931,470.
In May 2017, PMI’s shareholders also approved the Philip Morris International Inc. 2017 Stock Compensation Plan for Non-Employee Directors (the “2017 Non-Employee Directors Plan”). The 2017 Non-Employee Directors Plan replaced the 2008 Stock Compensation Plan for Non-Employee Directors, and there will be no additional grants under the replaced plan. A non-employee director is defined as a member of the PMI Board of Directors who is not a full-time employee of PMI or of any corporation in which PMI owns, directly or indirectly, stock possessing at least 50% of the total combined voting power of all classes of stock entitled to vote in the election of directors in such corporation. Up to 1 million shares of PMI common stock may be awarded under the 2017 Non-Employee Directors Plan. At March 31,June 30, 2018, shares available for grant under the plan were 1,000,000.974,344.
Philip Morris International Inc. and Subsidiaries
Notes to Condensed Consolidated Financial Statements
(Unaudited)
Restricted share unit (RSU) awards
During the threesix months ended March 31,June 30, 2018 and 2017, shares granted to eligible employees and the weighted-average grant date
fair value per share and the recorded compensation expense related to RSU awards were as follows:
| | | | Number of Shares Granted | Weighted-Average Grant Date Fair Value Per RSU Award Granted | Compensation Expense Related to RSU Awards (in millions) | Number of Shares Granted | Weighted-Average Grant Date Fair Value Per RSU Award Granted |
| 2018 | 1,249,650 |
| $ | 100.70 |
| $ | 38 |
| 1,257,380 |
| $ | 100.70 |
|
| 2017 | 1,202,060 |
| $ | 98.47 |
| $ | 35 |
| 1,202,970 |
| $ | 98.48 |
|
Compensation expense related to RSU awards was as follows:
|
| | | | | | |
| | Compensation Expense Related to RSU Awards |
| (in millions) | For the Six Months Ended June 30, | For the Three Months Ended June 30, |
| 2018 | $ | 63 |
| $ | 25 |
|
| 2017 | $ | 60 |
| $ | 25 |
|
As of March 31,June 30, 2018, PMI had $196$170 million of total unrecognized compensation cost related to non-vested RSU awards. The cost is recognized over the original restriction period of the awards, which is typically three years after the date of the award, or upon death, disability or reaching the age of 58.
During the threesix months ended March 31,June 30, 2018, 1,378,5501,395,177 RSU awards vested. The grant date fair value of all the vested awards was approximately $114$116 million. The total fair value of RSU awards that vested during the threesix months ended March 31,June 30, 2018 was approximately $143$145 million.
Performance share unit (PSU) awards
During the threesix months ended March 31,June 30, 2018 and 2017, PMI granted PSU awards to certain executives. The PSU awards require the achievement of certain performance factors, which are predetermined at the time of grant, over a three-year performance cycle. PMI’s performance metrics consist of PMI’s Total Shareholder Return (TSR) relative to a predetermined peer group and on an absolute basis (50% weight), PMI’s currency-neutral compound annual adjusted operating income growth rate, excluding acquisitions (30% weight), and PMI’s performance against specific measures of PMI’s transformation (20% weight). The aggregate of the weighted performance factors for the three metrics determines the percentage of PSUs that will vest at the end of the three-year performance cycle. The minimum percentage of PSUs that can vest is zero, with a target percentage of 100 and a maximum percentage of 200. Each vested PSU entitles the participant to one share of common stock. An aggregate weighted PSU performance factor of 100 will result in the targeted number of PSUs being vested. At the end of the performance cycle, participants are entitled to an amount equivalent to the accumulated dividends paid on common stock during the performance cycle for the number of shares earned.
During the threesix months ended March 31,June 30, 2018 and 2017, shares granted to eligible employees and the grant date fair value per share
and the recorded compensation expense related to PSU awards were as follows:
| | | | Number of Shares Granted | PSU Grant Date Fair Value Subject to TSR Performance Factor Per Share (a) | PSU Grant Date Fair Value Subject to Other Performance Factors Per Share (b) | Compensation Expense Related to PSU Awards (in millions) | Number of Shares Granted | PSU Grant Date Fair Value Subject to TSR Performance Factor Per Share (a) | PSU Grant Date Fair Value Subject to Other Performance Factors Per Share (b) |
| 2018 | 401,500 |
| $ | 118.98 |
| $ | 100.69 |
| $ | 21 |
| 401,500 |
| $ | 118.98 |
| $ | 100.69 |
|
| 2017 | 393,460 |
| $ | 128.72 |
| $ | 98.29 |
| $ | 17 |
| 393,460 |
| $ | 128.72 |
| $ | 98.29 |
|
(a) The grant date fair value of the PSU market based awards subject to the TSR performance factor was determined by using the Monte Carlo simulation model.
(b) The grant date fair value of the PSU awards subject to the other performance factors was determined by using the average of the high and low market price of PMI’s stock at the date of grant.
Philip Morris International Inc. and Subsidiaries
Notes to Condensed Consolidated Financial Statements
(Unaudited)
Compensation expense related to PSU awards was as follows:
|
| | | | | | |
| | Compensation Expense Related to PSU Awards |
| (in millions) | For the Six Months Ended June 30, | For the Three Months Ended June 30, |
| 2018 | $ | 30 |
| $ | 9 |
|
| 2017 | $ | 25 |
| $ | 8 |
|
As of March 31,June 30, 2018, PMI had $57$48 million of total unrecognized compensation cost related to non-vested PSU awards. The cost is recognized over the performance cycle of the awards, or upon death, disability or reaching the age of 58.
During the threesix months ended March 31,June 30, 2018, there were no PSU awards that vested.
Philip Morris International Inc. and Subsidiaries
Notes to Condensed Consolidated Financial Statements
(Unaudited)
Note 3. Benefit Plans:
Pension coverage for employees of PMI’s subsidiaries is provided, to the extent deemed appropriate, through separate plans, many of which are governed by local statutory requirements. In addition, PMI provides health care and other benefits to substantially all U.S. retired employees and certain non-U.S. retired employees. In general, health care benefits for non-U.S. retired employees are covered through local government plans. PMI adopted ASU 2017-07 "Compensation - Retirement Benefits" on January 1, 2018, retrospectively for all periods. Following adoption, the service cost component of net periodic benefit cost continues to be included within operating income, while all other cost components are included below operating income, within pension and other employee benefit costs. Pension and other employee benefit costs including $19 million and $22 million related to net postemployment costs forper the three months ended March 31,2018 and 2017, respectively, and $3 million and $4 million related to net postretirement costs forcondensed consolidated statements of earnings consisted of the three months ended March 31,2018 and 2017, respectively.following:
|
| | | | | | | | | | | | | | | |
| | For the Six Months Ended June 30, | | For the Three Months Ended June 30, |
| (in millions) | 2018 | | 2017 | | 2018 | | 2017 |
| Net pension costs | $ | (33 | ) | | $ | (12 | ) | | $ | (17 | ) | | $ | (6 | ) |
| Net postemployment costs | 39 |
| | 41 |
| | 20 |
| | 19 |
|
| Net postretirement costs | 6 |
| | 7 |
| | 3 |
| | 3 |
|
| Total pension and other employee benefit costs | $ | 12 |
| | $ | 36 |
| | $ | 6 |
| | $ | 16 |
|
Pension Plans
Components of Net Periodic Benefit Cost
Net periodic pension cost consisted of the following:
| | | | | Pension (1) | Pension (1) |
| | | For the Three Months Ended March 31, | For the Six Months Ended June 30, | | For the Three Months Ended June 30, |
| (in millions) | | 2018 | | 2017 | 2018 | | 2017 | | 2018 | | 2017 |
| Service cost | | $ | 53 |
| | $ | 51 |
| $ | 107 |
| | $ | 102 |
| | $ | 54 |
| | $ | 51 |
|
| Interest cost | | 28 |
| | 26 |
| 58 |
| | 53 |
| | 30 |
| | 27 |
|
| Expected return on plan assets | | (87 | ) | | (79 | ) | (182 | ) | | (160 | ) | | (95 | ) | | (81 | ) |
| Amortization: | |
| |
| | | | | | | |
| Net loss | | 43 |
| | 44 |
| 90 |
| | 88 |
| | 47 |
| | 44 |
|
| Prior service cost | | — |
| | 3 |
| 1 |
| | 7 |
| | 1 |
| | 4 |
|
| Net periodic pension cost | | $ | 37 |
| | $ | 45 |
| $ | 74 |
| | $ | 90 |
| | $ | 37 |
| | $ | 45 |
|
(1) Primarily non-U.S. based defined benefit retirement plans.
Philip Morris International Inc. and Subsidiaries
Notes to Condensed Consolidated Financial Statements
(Unaudited)
Employer Contributions
PMI makes, and plans to make, contributions, to the extent that they are tax deductible and to meet specific funding requirements of its funded pension plans. Employer contributions of $25$41 million were made to the pension plans during the threesix months ended March 31,June 30, 2018. Currently, PMI anticipates making additional contributions during the remainder of 2018 of approximately $4637 million to its pension plans, based on current tax and benefit laws. However, this estimate is subject to change as a result of changes in tax and other benefit laws, as well as asset performance significantly above or below the assumed long-term rate of return on pension assets, or changes in interest and currency rates.
Philip Morris International Inc. and Subsidiaries
Notes to Condensed Consolidated Financial Statements
(Unaudited)
Note 4. Goodwill and Other Intangible Assets, net:
Goodwill and other intangible assets, net, by segment were as follows:
| | | | Goodwill | | Other Intangible Assets, net | Goodwill | | Other Intangible Assets, net |
| (in millions) | March 31,
2018 | December 31,
2017 | | March 31,
2018 | December 31,
2017 | June 30,
2018 | December 31,
2017 | | June 30,
2018 | December 31,
2017 |
| European Union | $ | 1,474 |
| $ | 1,419 |
| | $ | 439 |
| $ | 458 |
| $ | 1,371 |
| $ | 1,419 |
| | $ | 422 |
| $ | 458 |
|
| Eastern Europe | 334 |
| 321 |
| | 22 |
| 16 |
| 312 |
| 321 |
| | 21 |
| 16 |
|
| Middle East & Africa | 107 |
| 102 |
| | 185 |
| 178 |
| 91 |
| 102 |
| | 180 |
| 178 |
|
| South & Southeast Asia | 2,938 |
| 3,010 |
| | 987 |
| 1,004 |
| 2,836 |
| 3,010 |
| | 947 |
| 1,004 |
|
| East Asia & Australia | 561 |
| 567 |
| | 59 |
| 44 |
| 543 |
| 567 |
| | 58 |
| 44 |
|
| Latin America & Canada | 2,253 |
| 2,247 |
| | 763 |
| 732 |
| 2,159 |
| 2,247 |
| | 708 |
| 732 |
|
| Total | $ | 7,667 |
| $ | 7,666 |
| | $ | 2,455 |
| $ | 2,432 |
| $ | 7,312 |
| $ | 7,666 |
| | $ | 2,336 |
| $ | 2,432 |
|
Goodwill primarily reflects PMI’s acquisitions in Canada, Colombia, Greece, Indonesia, Mexico, Pakistan and Serbia, as well as the business combination in the Philippines. The movements in goodwill from December 31, 2017, were as follows:
| | | (in millions) | European Union | Eastern Europe | Middle East & Africa | South & Southeast Asia | East Asia & Australia | Latin America & Canada | Total | European Union | Eastern Europe | Middle East & Africa | South & Southeast Asia | East Asia & Australia | Latin America & Canada | Total |
| Balances, December 31, 2017 | $ | 1,419 |
| $ | 321 |
| $ | 102 |
| $ | 3,010 |
| $ | 567 |
| $ | 2,247 |
| $ | 7,666 |
| $ | 1,419 |
| $ | 321 |
| $ | 102 |
| $ | 3,010 |
| $ | 567 |
| $ | 2,247 |
| $ | 7,666 |
|
| Changes due to: | | |
| Currency | 55 |
| 13 |
| 5 |
| (72 | ) | (6 | ) | 6 |
| 1 |
| (48 | ) | (9 | ) | (11 | ) | (174 | ) | (24 | ) | (88 | ) | (354 | ) |
| Balances, March 31, 2018 | $ | 1,474 |
| $ | 334 |
| $ | 107 |
| $ | 2,938 |
| $ | 561 |
| $ | 2,253 |
| $ | 7,667 |
| |
| Balances, June 30, 2018 | | $ | 1,371 |
| $ | 312 |
| $ | 91 |
| $ | 2,836 |
| $ | 543 |
| $ | 2,159 |
| $ | 7,312 |
|
Additional details of other intangible assets were as follows: | | | | | March 31, 2018 | | December 31, 2017 | | June 30, 2018 | | December 31, 2017 |
| (in millions) | | Gross
Carrying
Amount | | Accumulated
Amortization | | Gross
Carrying
Amount | | Accumulated
Amortization | | Gross
Carrying
Amount | | Accumulated
Amortization | | Gross
Carrying
Amount | | Accumulated
Amortization |
| Non-amortizable intangible assets | | $ | 1,341 |
| | | | $ | 1,323 |
| | | | $ | 1,274 |
| | | | $ | 1,323 |
| | |
| Amortizable intangible assets | | 1,818 |
| | $ | 704 |
| | 1,798 |
| | $ | 689 |
| | 1,764 |
| | $ | 702 |
| | 1,798 |
| | $ | 689 |
|
| Total other intangible assets | | $ | 3,159 |
| | $ | 704 |
| | $ | 3,121 |
| | $ | 689 |
| | $ | 3,038 |
| | $ | 702 |
| | $ | 3,121 |
| | $ | 689 |
|
Philip Morris International Inc. and Subsidiaries
Notes to Condensed Consolidated Financial Statements
(Unaudited)
Non-amortizable intangible assets substantially consist of trademarks from PMI’s acquisitions in Indonesia in 2005 and Mexico in 2007. Amortizable intangible assets primarily consist of certain trademarks and distribution networks associated with business combinations. The gross carrying amount, the range of useful lives as well as the weighted-average remaining useful life of amortizable intangible assets at March 31,June 30, 2018, were as follows:
|
| | | | | | |
(dollars in millions) | Gross Carrying Amount | Initial Estimated
Useful Lives | | Weighted-Average
Remaining Useful Life |
| Trademarks | $ | 1,555 |
| 2 - 40 years | | 19 years |
| Distribution networks | 151 |
| 5 - 30 years | | 9 years |
Other (including farmer contracts
and intellectual property rights) | 112 |
| 4 - 17 years | | 11 years |
| | $ | 1,818 |
| | | |
Philip Morris International Inc. and Subsidiaries
Notes to Condensed Consolidated Financial Statements
(Unaudited)
|
| | | | | | |
(dollars in millions) | Gross Carrying Amount | Initial Estimated
Useful Lives | | Weighted-Average
Remaining Useful Life |
| Trademarks | $ | 1,514 |
| 2 - 40 years | | 19 years |
| Distribution networks | 143 |
| 5 - 30 years | | 8 years |
Other (including farmer contracts
and intellectual property rights) | 107 |
| 4 - 17 years | | 10 years |
| | $ | 1,764 |
| | | |
Pre-tax amortization expense for intangible assets during the threesix months ended March 31,June 30, 2018 and 2017 was $22$43 million and $44 million, respectively, and $21 million and $22 million respectively.for the three months ended June 30, 2018 and 2017. Amortization expense for each of the next five years is estimated to be $8483 million or less, assuming no additional transactions occur that require the amortization of intangible assets.
The increasedecrease in the gross carrying amount of other intangible assets from December 31, 2017, was due primarily to currency movements, partially offset by the purchase of additional intellectual property rights related to PMI's reduced-risk products,products.
During the second quarter of 2018, PMI completed its annual review of goodwill and non-amortizable intangible assets for potential
impairment, and no impairment charges were required as well as currency movements.a result of this review.
Note 5. Financial Instruments:
Overview
PMI operates in markets outside of the United States of America, with manufacturing and sales facilities in various locations around the world. PMI utilizes certain financial instruments to manage foreign currency and interest rate exposure. Derivative financial instruments are used by PMI principally to reduce exposures to market risks resulting from fluctuations in foreign currency exchange and interest rates by creating offsetting exposures. PMI is not a party to leveraged derivatives and, by policy, does not use derivative financial instruments for speculative purposes. Financial instruments qualifying for hedge accounting must maintain a specified level of effectiveness between the hedging instrument and the item being hedged, both at inception and throughout the hedged period. PMI formally documents the nature and relationships between the hedging instruments and hedged items, as well as its risk-management objectives, strategies for undertaking the various hedge transactions and method of assessing hedge effectiveness. Additionally, for hedges of forecasted transactions, the significant characteristics and expected terms of the forecasted transaction must be specifically identified, and it must be probable that each forecasted transaction will occur. If it were deemed probable that the forecasted transaction would not occur, the gain or loss would be recognized in earnings.
PMI uses deliverable and non-deliverable forward foreign exchange contracts, foreign currency swaps and foreign currency options, collectively referred to as foreign exchange contracts ("foreign exchange contracts"), and interest rate contracts to mitigate its exposure to changes in exchange and interest rates from third-party and intercompany actual and forecasted transactions. The primary currencies to which PMI is exposed include the Australian dollar, Canadian dollar, Euro, Indonesian rupiah, Japanese yen, Mexican peso, Philippine peso, Russian ruble, Swiss franc and Turkish lira. At March 31,June 30, 2018, PMI had contracts with aggregate notional amounts of $33.431.3 billion of which $7.14.2 billion related to cash flow hedges, $11.39.9 billion related to hedges of net investments in foreign operations and $15.017.2 billion related to other derivatives that primarily offset currency exposures on intercompany financing.
Effective January 1, 2018, PMI elected to early adopt Accounting Standard Update 2017-12 “Derivatives and Hedging (Topic 815) Targeted Improvements to Accounting for Hedging Activities,” which did not have a material impact on PMI’s consolidated financial position or results of operations.
Philip Morris International Inc. and Subsidiaries
Notes to Condensed Consolidated Financial Statements
(Unaudited)
The fair value of PMI’s foreign exchange contracts included in the condensed consolidated balance sheets as of March 31,June 30, 2018 and December 31, 2017, were as follows:
| | | | | Derivative Assets | | Derivative Liabilities | | Derivative Assets | | Derivative Liabilities |
| | |
| | Fair Value | |
| | Fair Value | |
| | Fair Value | |
| | Fair Value |
| (in millions) | | Balance Sheet Classification | | At March 31, 2018 | | At December 31, 2017 | | Balance Sheet Classification | | At March 31, 2018 | | At December 31, 2017 | | Balance Sheet Classification | | At June 30, 2018 | | At December 31, 2017 | | Balance Sheet Classification | | At June 30, 2018 | | At December 31, 2017 |
| Foreign exchange contracts designated as hedging instruments | | Other current assets | | $ | 48 |
| | $ | 84 |
| | Other accrued liabilities | | $ | 433 |
| | $ | 197 |
| | Other current assets | | $ | 76 |
| | $ | 84 |
| | Other accrued liabilities | | $ | 66 |
| | $ | 197 |
|
| | | Other assets | | 6 |
| | 34 |
| | Other liabilities | | 1,237 |
| | 880 |
| | Other assets | | 69 |
| | 34 |
| | Other liabilities | | 689 |
| | 880 |
|
| Foreign exchange contracts not designated as hedging instruments | | Other current assets | | 60 |
| | 22 |
| | Other accrued liabilities | | 20 |
| | 37 |
| | Other current assets | | 199 |
| | 22 |
| | Other accrued liabilities | | 95 |
| | 37 |
|
| | | Other assets | | — |
| | — |
| | Other liabilities | | 67 |
| | 14 |
| | Other assets | | — |
| | — |
| | Other liabilities | | 10 |
| | 14 |
|
| Total derivatives | | | | $ | 114 |
| | $ | 140 |
| | | | $ | 1,757 |
| | $ | 1,128 |
| | | | $ | 344 |
| | $ | 140 |
| | | | $ | 860 |
| | $ | 1,128 |
|
For the six months and three months ended March 31,June 30, 2018 and 2017, PMI's cash flow and net investment hedging instruments impacted the condensed consolidated statements of earnings and comprehensive earnings as follows:
|
| | | | | | | | | | | | | | | | | |
| (pre-tax, in millions) | For the Six Months Ended June 30, |
| | Amount of Gain/(Loss) Recognized in Other Comprehensive Earnings/(Losses) on Derivatives | | Statement of Earnings Classification of Gain/(Loss) Reclassified from Other Comprehensive Earnings/(Losses) into Earnings | | Amount of Gain/(Loss) Reclassified from Other Comprehensive Earnings/(Losses) into Earnings |
| | 2018 | | 2017 | | | | 2018 | | 2017 |
| Derivatives in Cash Flow Hedging Relationship | | | | | | | | | |
| Foreign exchange contracts | $ | (12 | ) | | $ | (61 | ) | | | | | | |
| | | | | | Net revenues | | $ | (7 | ) | | $ | 15 |
|
| | | | | | Cost of sales | | — |
| | — |
|
| | | | | | Marketing, administration and research costs | | (3 | ) | | — |
|
| | | | | | Interest expense, net | | (3 | ) | | (12 | ) |
| Derivatives in Net Investment Hedging Relationship | | | | | | | | | |
| Foreign exchange contracts | 138 |
| | (940 | ) | | | | | | |
| Total | $ | 126 |
| | $ | (1,001 | ) | | | | $ | (13 | ) | | $ | 3 |
|
Philip Morris International Inc. and Subsidiaries
Notes to Condensed Consolidated Financial Statements
(Unaudited)
| | | (pre-tax, in millions) | For the Three Months Ended March 31, | For the Three Months Ended June 30, |
| | Amount of Gain/(Loss) Recognized in Other Comprehensive Earnings/(Losses) on Derivatives | | Statement of Earnings Classification of Gain/(Loss) Reclassified from Other Comprehensive Earnings/(Losses) into Earnings | | Amount of Gain/(Loss) Reclassified from Other Comprehensive Earnings/(Losses) into Earnings | Amount of Gain/(Loss) Recognized in Other Comprehensive Earnings/(Losses) on Derivatives | | Statement of Earnings Classification of Gain/(Loss) Reclassified from Other Comprehensive Earnings/(Losses) into Earnings | | Amount of Gain/(Loss) Reclassified from Other Comprehensive Earnings/(Losses) into Earnings |
| | 2018 | | 2017 | | 2018 | | 2017 | 2018 | | 2017 | | 2018 | | 2017 |
| Derivatives in Cash Flow Hedging Relationship | | | | | | | | | | | | | | |
| Foreign exchange contracts | $ | (74 | ) | | $ | (86 | ) | | | | | $ | 62 |
| | $ | 25 |
| | | | |
| | | | | | Net revenues | | $ | (9 | ) | | $ | 9 |
| | | | | Net revenues | | $ | 2 |
| | $ | 6 |
|
| | | | | | Cost of sales | | — |
| | — |
| | | | | Cost of sales | | — |
| | — |
|
| | | | | | Marketing, administration and research costs | | 8 |
| | (9 | ) | | | | | Marketing, administration and research costs | | (11 | ) | | 9 |
|
| | | | | | Interest expense, net | | (2 | ) | | (3 | ) | | | | | Interest expense, net | | (1 | ) | | (9 | ) |
| Derivatives in Net Investment Hedging Relationship | | | | | | | | | | | | | | |
| Foreign exchange contracts | (608 | ) | | (249 | ) | | | | | 746 |
| | (691 | ) | | | | |
| Total | $ | (682 | ) | | $ | (335 | ) | | $ | (3 | ) | | $ | (3 | ) | $ | 808 |
| | $ | (666 | ) | | $ | (10 | ) | | $ | 6 |
|
Cash Flow Hedges
PMI has entered into foreign exchange contracts to hedge the foreign currency exchange and interest rate risks related to certain forecasted transactions. Gains and losses associated with qualifying cash flow hedge contracts is deferred as a component of accumulated other comprehensive losses until the underlying hedged transactions are reported in PMI’s condensed consolidated statements of earnings. Amounts reclassified from other comprehensive losses into earnings as a result of the discontinuance of cash flow hedges when the originally forecasted transaction is no longer probable of occurring were not material during the periods presented. As of March 31,June 30, 2018, PMI has hedged forecasted transactions for periods not exceeding the next fifteentwelve months with the exception of one foreign exchange contract that expires in May 2024. The impact of these hedges is primarily included in operating cash flows on PMI’s condensed consolidated statements of cash flows.
Philip Morris International Inc. and Subsidiaries
Notes to Condensed Consolidated Financial Statements
(Unaudited)
Hedges of Net Investments in Foreign Operations
PMI designates certain foreign currency denominated debt and foreign exchange contracts as net investment hedges, primarily of its Euro net assets. For the threesix months ended March 31,June 30, 2018 and 2017, these hedges of net investments resulted in losses,gains (losses), net of income taxes, of $757$303 million and $294$(1,025) million, respectively, principally related to changes in the exchange rates between the Euro and U.S. dollar. For the three months ended June 30, 2018 and 2017, these hedges of net investments resulted in gains (losses), net of income taxes, of $1,060 million and $(731) million, respectively, principally related to changes in the exchange rates between the Euro and U.S. dollar. These lossesgains (losses) were reported as a component of accumulated other comprehensive losses within currency translation adjustments, and were substantially offset by the losses and gains generated on the underlying assets. For the six months and three months ended March 31,June 30, 2018, the gains for amounts excluded from the effectiveness testing recognized in earnings based on the changes in fair value were $67$135 million and $68 million, respectively, and were accounted for in interest expense, net, on the condensed consolidated statement of earnings. The premiums paid for, and settlements of, net investment hedges are included in investing cash flows on PMI’s condensed consolidated statements of cash flows.
Philip Morris International Inc. and Subsidiaries
Notes to Condensed Consolidated Financial Statements
(Unaudited)
Other Derivatives
PMI has entered into foreign exchange contracts to hedge the foreign currency exchange and interest rate risks related to intercompany loans between certain subsidiaries, and third-party loans. While effective as economic hedges, no hedge accounting is applied for these contracts; therefore, the unrealized gains (losses) relating to these contracts are reported in marketing, administration and research costs in PMI’s condensed consolidated statements of earnings. For the threesix months ended March 31,June 30, 2018 and 2017, the gains (losses) from contracts for which PMI did not apply hedge accounting were $95$334 million and $(39)$149 million, respectively. For the three months ended June 30, 2018 and 2017, the gains from contracts for which PMI did not apply hedge accounting were $239 million and $188 million, respectively. The gains (losses) from these contracts substantially offset the losses and gains generated by the underlying intercompany and third-party loans being hedged.
For the six months and three months ended March 31,June 30, 2018 and 2017, the net impact of these contracts on the condensed consolidated statements of earnings was not material.
Qualifying Hedging Activities Reported in Accumulated Other Comprehensive Losses
Derivative gains or losses reported in accumulated other comprehensive losses are a result of qualifying hedging activity. Transfers of these gains or losses to earnings are offset by the corresponding gains or losses on the underlying hedged item. Hedging activity affected accumulated other comprehensive losses, net of income taxes, as follows:
| | | (in millions) | For the Three Months Ended March 31, | For the Six Months Ended June 30, | | For the Three Months Ended June 30, |
| | 2018 | 2017 | 2018 | 2017 | | 2018 | 2017 |
| Gain as of January 1, | $ | 42 |
| $ | 97 |
| |
| Gain/(loss) at beginning of period | | $ | 42 |
| $ | 97 |
| | $ | (20 | ) | $ | 27 |
|
| Derivative (gains)/losses transferred to earnings | 2 |
| 5 |
| 6 |
| (2 | ) | | 4 |
| (7 | ) |
| Change in fair value | (64 | ) | (75 | ) | (11 | ) | (53 | ) | | 53 |
| 22 |
|
| Gain/(loss) as of March 31, | $ | (20 | ) | $ | 27 |
| |
| Gain/(loss) as of June 30, | | $ | 37 |
| $ | 42 |
| | $ | 37 |
| $ | 42 |
|
At March 31,June 30, 2018, PMI expects $3022 million of derivative lossesgains that are included in accumulated other comprehensive losses to be reclassified to the condensed consolidated statement of earnings within the next 12 months. These lossesgains are expected to be substantially offset by the statement of earnings impact of the respective hedged transactions.
Contingent Features
PMI’s derivative instruments do not contain contingent features.
Credit Exposure and Credit Risk
PMI is exposed to credit loss in the event of non-performance by counterparties. While PMI does not anticipate non-performance, its risk is limited to the fair value of the financial instruments less any cash collateral received or pledged. PMI actively monitors its exposure to credit risk through the use of credit approvals and credit limit and by selecting and continuously monitoring a diverse group of major international banks and financial institutions as counterparties.
Philip Morris International Inc. and Subsidiaries
Notes to Condensed Consolidated Financial Statements
(Unaudited)
Fair Value
See Note 11. Fair Value Measurements and Note 13. Balance Sheet Offsetting for additional discussion of derivative financial instruments.
Philip Morris International Inc. and Subsidiaries
Notes to Condensed Consolidated Financial Statements
(Unaudited)
Note 6. Earnings Per Share:
Basic and diluted earnings per share (“EPS”) were calculated using the following:
| | | (in millions) | For the Three Months Ended March 31, | For the Six Months Ended June 30, | | For the Three Months Ended June 30, |
| | 2018 | 2017 | 2018 | 2017 | | 2018 | 2017 |
| Net earnings attributable to PMI | $ | 1,556 |
| $ | 1,590 |
| $ | 3,754 |
| $ | 3,371 |
| | $ | 2,198 |
| $ | 1,781 |
|
| Less distributed and undistributed earnings attributable to share-based payment awards | 3 |
| 3 |
| 8 |
| 8 |
| | 5 |
| 5 |
|
| Net earnings for basic and diluted EPS | $ | 1,553 |
| $ | 1,587 |
| $ | 3,746 |
| $ | 3,363 |
| | $ | 2,193 |
| $ | 1,776 |
|
| Weighted-average shares for basic EPS | 1,553 |
| 1,552 |
| 1,554 |
| 1,552 |
| | 1,555 |
| 1,553 |
|
Plus contingently issuable performance stock units (PSUs)
| 1 |
| 1 |
| — |
| 1 |
| | — |
| 1 |
|
| Weighted-average shares for diluted EPS | 1,554 |
| 1,553 |
| 1,554 |
| 1,553 |
| | 1,555 |
| 1,554 |
|
Unvested share-based payment awards that contain non-forfeitable rights to dividends or dividend equivalents are participating securities and therefore are included in PMI’s earnings per share calculation pursuant to the two-class method.
For the 2018 and 2017 computations, there were no antidilutive stock awards.
Note 7. Segment Reporting:
PMI’s subsidiaries and affiliates are engaged in the manufacture and sale of cigarettes and other nicotine-containing products, including RRPs, in markets outside of the United States of America. Reportable segments for PMI are organized by geographic region and managed by segment managers who are responsible for the operating and financial results of the regions inclusive of all product categories sold in the region. Effective January 1, 2018, PMI began managing its business in six reportable segments. PMI’s reportable segments are the European Union; Eastern Europe; Middle East & Africa; South & Southeast Asia; East Asia & Australia; and Latin America & Canada. PMI records net revenues and operating income to its segments based upon the geographic area in which the customer resides.
PMI’s chief operating decision maker evaluates segment performance and allocates resources based on regional operating income, which includes results from all product categories sold in each region. Effective January 1, 2018, PMI began using operating income to evaluate business segment performance and allocate resources, replacing operating companies income used previously.
On January 1, 2018, PMI adopted Financial Accounting Standards Update ASU 2014-09, "Revenue from Contracts with Customers." PMI adopted this standard retrospectively to each prior period presented. For further details on this standard and its impact on PMI, see Note 18. New Accounting Standards. The amounts presented for the reportable segments reflect this adoption.
PMI disaggregates its net revenue from contracts with customers by both geographic location and product category for each of PMI's six reportable segments, as PMI believes this best depicts how the nature, amount, timing and uncertainty of its revenue and cash flows are affected by economic factors.
Philip Morris International Inc. and Subsidiaries
Notes to Condensed Consolidated Financial Statements
(Unaudited)
Segment data were as follows:
| | | (in millions) | For the Three Months Ended March 31, | For the Six Months Ended June 30, | | For the Three Months Ended June 30, |
| | 2018 | 2017 | 2018 | 2017 | | 2018 | 2017 |
| Net revenues: | | | | |
| European Union | $ | 1,988 |
| $ | 1,740 |
| $ | 4,491 |
| $ | 3,850 |
| | $ | 2,503 |
| $ | 2,110 |
|
| Eastern Europe | 567 |
| 516 |
| 1,327 |
| 1,213 |
| | 760 |
| 697 |
|
| Middle East & Africa | 961 |
| 961 |
| 1,983 |
| 1,939 |
| | 1,022 |
| 978 |
|
| South & Southeast Asia | 1,081 |
| 1,031 |
| 2,237 |
| 2,077 |
| | 1,156 |
| 1,046 |
|
| East Asia & Australia | 1,591 |
| 1,210 |
| 3,069 |
| 2,548 |
| | 1,478 |
| 1,338 |
|
| Latin America & Canada | 708 |
| 606 |
| 1,515 |
| 1,354 |
| | 807 |
| 748 |
|
| Net revenues | $ | 6,896 |
| $ | 6,064 |
| $ | 14,622 |
| $ | 12,981 |
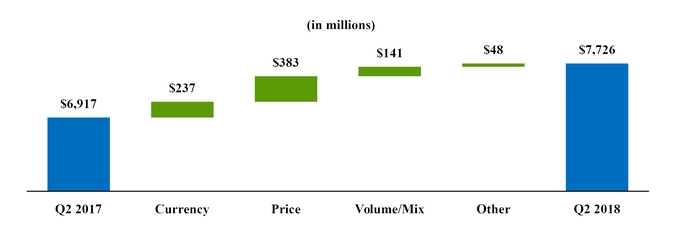
| | $ | 7,726 |
| $ | 6,917 |
|
| Operating income: | | | | |
| European Union | $ | 740 |
| $ | 748 |
| $ | 1,917 |
| $ | 1,692 |
| | $ | 1,177 |
| $ | 944 |
|
| Eastern Europe | 151 |
| 159 |
| 412 |
| 383 |
| | 261 |
| 224 |
|
| Middle East & Africa | 374 |
| 491 |
| 777 |
| 968 |
| | 403 |
| 477 |
|
| South & Southeast Asia | 429 |
| 370 |
| 869 |
| 689 |
| | 440 |
| 319 |
|
| East Asia & Australia | 515 |
| 472 |
| 1,013 |
| 982 |
| | 498 |
| 510 |
|
| Latin America & Canada | 217 |
| 176 |
| 531 |
| 439 |
| | 314 |
| 263 |
|
| Operating income | $ | 2,426 |
| $ | 2,416 |
| $ | 5,519 |
| $ | 5,153 |
| | $ | 3,093 |
| $ | 2,737 |
|
PMI's net revenues by product category were as follows:
| | | (in millions) | For the Three Months Ended March 31, | For the Six Months Ended June 30, | | For the Three Months Ended June 30, |
| | 2018 | 2017 | 2018 | 2017 | | 2018 | 2017 |
| Net revenues: | | | | |
| Combustible products: | | | | |
| European Union | $ | 1,836 |
| $ | 1,709 |
| $ | 4,157 |
| $ | 3,770 |
| | $ | 2,321 |
| $ | 2,060 |
|
| Eastern Europe | 527 |
| 513 |
| 1,222 |
| 1,204 |
| | 695 |
| 691 |
|
| Middle East & Africa | 884 |
| 957 |
| 1,794 |
| 1,925 |
| | 910 |
| 968 |
|
| South & Southeast Asia | 1,081 |
| 1,031 |
| 2,237 |
| 2,077 |
| | 1,156 |
| 1,046 |
|
| East Asia & Australia | 737 |
| 813 |
| 1,559 |
| 1,603 |
| | 822 |
| 790 |
|
| Latin America & Canada | 704 |
| 605 |
| 1,506 |
| 1,353 |
| | 802 |
| 748 |
|
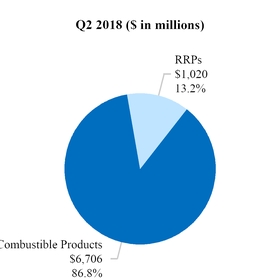
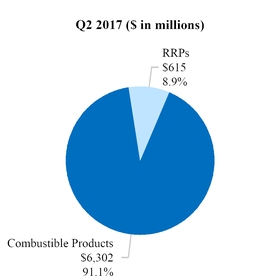
| Total combustible products | $ | 5,769 |
| $ | 5,629 |
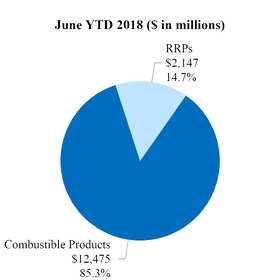
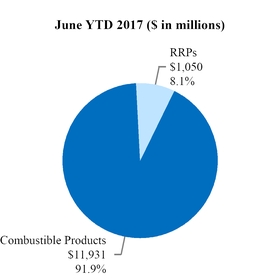
| $ | 12,475 |
| $ | 11,931 |
| | $ | 6,706 |
| $ | 6,302 |
|
| Reduced-risk products: | | | | |
| European Union | $ | 152 |
| $ | 31 |
| $ | 334 |
| $ | 81 |
| | $ | 182 |
| 50 |
|
| Eastern Europe | 40 |
| 3 |
| 105 |
| 9 |
| | 65 |
| 6 |
|
| Middle East & Africa | 77 |
| 4 |
| 189 |
| 14 |
| | 112 |
| 10 |
|
| South & Southeast Asia | — |
| — |
| — |
| — |
| | — |
| — |
|
| East Asia & Australia | 854 |
| 396 |
| 1,510 |
| 945 |
| | 656 |
| 549 |
|
| Latin America & Canada | 4 |
| — |
| 9 |
| 1 |
| | 5 |
| 1 |
|
| Total reduced-risk products | $ | 1,127 |
| $ | 435 |
| $ | 2,147 |
| $ | 1,050 |
| | $ | 1,020 |
| 615 |
|
| | | | | |
| Total PMI net revenues | $ | 6,896 |
| $ | 6,064 |
| $ | 14,622 |
| $ | 12,981 |
| | $ | 7,726 |
| 6,917 |
|
Note: Sum of product categories or Regions might not foot to total PMI due to roundings.
Philip Morris International Inc. and Subsidiaries
Notes to Condensed Consolidated Financial Statements
(Unaudited)
Net revenues related to combustible products refer to the operating revenues generated from the sale of these products, including shipping and handling charges billed to customers, net of sales and promotion incentives, and excise taxes. These net revenue amounts consist of the sale of PMI's cigarettes and other tobacco products combined. Other tobacco products primarily include roll-your-own and make-your-own cigarettes, pipe tobacco, cigars and cigarillos and do not include reduced-risk products.
Net revenues related to reduced-risk products refer to the operating revenues generated from the sale of these products, including shipping and handling charges billed to customers, net of sales and promotion incentives, and excise taxes. These net revenue amounts consist of the sale of PMI's heated tobacco units, IQOS devices and related accessories, and other nicotine-containing products, which primarily include our e-vapor products.
PMI recognizes revenue, when control is transferred to the customer, typically either upon shipment or delivery of goods.
Note 8. Contingencies:
Tobacco-Related Litigation
Legal proceedings covering a wide range of matters are pending or threatened against us, and/or our subsidiaries, and/or our indemnitees in various jurisdictions. Our indemnitees include distributors, licensees, and others that have been named as parties in certain cases and that we have agreed to defend, as well as to pay costs and some or all of judgments, if any, that may be entered against them. Pursuant to the terms of the Distribution Agreement between Altria Group, Inc. ("Altria") and PMI, PMI will indemnify Altria and Philip Morris USA Inc. ("PM USA"), a U.S. tobacco subsidiary of Altria, for tobacco product claims based in substantial part on products manufactured by PMI or contract manufactured for PMI by PM USA, and PM USA will indemnify PMI for tobacco product claims based in substantial part on products manufactured by PM USA, excluding tobacco products contract manufactured for PMI.
It is possible that there could be adverse developments in pending cases against us and our subsidiaries. An unfavorable outcome or settlement of pending tobacco-related litigation could encourage the commencement of additional litigation.
Damages claimed in some of the tobacco-related litigation are significant and, in certain cases in Brazil, Canada and Nigeria, range into the billions of U.S. dollars. The variability in pleadings in multiple jurisdictions, together with the actual experience of management in litigating claims, demonstrate that the monetary relief that may be specified in a lawsuit bears little relevance to the ultimate outcome. Much of the tobacco-related litigation is in its early stages, and litigation is subject to uncertainty. However, as discussed below, we have to date been largely successful in defending tobacco-related litigation.
We and our subsidiaries record provisions in the consolidated financial statements for pending litigation when we determine that an unfavorable outcome is probable and the amount of the loss can be reasonably estimated. At the present time, while it is reasonably possible that an unfavorable outcome in a case may occur, after assessing the information available to it (i) management has not concluded that it is probable that a loss has been incurred in any of the pending tobacco-related cases; (ii) management is unable to estimate the possible loss or range of loss for any of the pending tobacco-related cases; and (iii) accordingly, no estimated loss has been accrued in the consolidated financial statements for unfavorable outcomes in these cases, if any. Legal defense costs are expensed as incurred.
It is possible that our consolidated results of operations, cash flows or financial position could be materially affected in a particular fiscal quarter or fiscal year by an unfavorable outcome or settlement of certain pending litigation. Nevertheless, although litigation is subject to uncertainty, we and each of our subsidiaries named as a defendant believe, and each has been so advised by counsel handling the respective cases, that we have valid defenses to the litigation pending against us, as well as valid bases for appeal of adverse verdicts. All such cases are, and will continue to be, vigorously defended. However, we and our subsidiaries may enter into settlement discussions in particular cases if we believe it is in our best interests to do so.
To date, no tobacco-related case has been finally resolved in favor of a plaintiff against us, our subsidiaries or indemnitees.
The table below lists the number of tobacco-related cases pending against us and/or our subsidiaries or indemnitees as of AprilJuly 24, 2018, AprilJuly 25, 2017 and AprilJuly 22, 2016:
Philip Morris International Inc. and Subsidiaries
Notes to Condensed Consolidated Financial Statements
(Unaudited)
| | | Type of Case | | Number of Cases Pending as of April 24, 2018 | | Number of Cases Pending as of April 25, 2017 | | Number of Cases Pending as of April 22, 2016 | | Number of Cases Pending as of July 24, 2018 | | Number of Cases Pending as of July 25, 2017 | | Number of Cases Pending as of July 22, 2016 |
| Individual Smoking and Health Cases | | 62 | | 63 | | 66 | | 65 | | 68 | | 65 |
| Smoking and Health Class Actions | | 11 | | 11 | | 11 | | 11 | | 11 | | 11 |
| Health Care Cost Recovery Actions | | 16 | | 16 | | 16 | | 16 | | 16 | | 16 |
| Label-Related Class Actions | | 1 | | — | | — | | 1 | | — | | — |
| Individual Label-Related Cases | | 1 | | 1 | | 3 | | 1 | | 1 | | 3 |
| Public Civil Actions | | 2 | | 2 | | 3 | | 2 | | 2 | | 2 |
Since 1995, when the first tobacco-related litigation was filed against a PMI entity, 476477 Smoking and Health, Label-Related, Health Care Cost Recovery, and Public Civil Actions in which we and/or one of our subsidiaries and/or indemnitees were a defendant have been terminated in our favor. Thirteen cases have had decisions in favor of plaintiffs. Nine of these cases have subsequently reached final resolution in our favor and four remain on appeal.
The table below lists the verdict and significant post-trial developments in the four pending cases where a verdict was returned in favor of the plaintiff:
|
| | | | | | | | |
| Date | | Location of
Court/Name of
Plaintiff | | Type of
Case | | Verdict | | Post-Trial
Developments |
| February 2004 | | Brazil/The Smoker Health Defense Association | | Class Action | | The Civil Court of São Paulo found defendants liable without hearing evidence. In April 2004, the court awarded “moral damages” of R$1,000 (approximately $293)$265) per smoker per full year of smoking plus interest at the rate of 1% per month, as of the date of the ruling. The court did not assess actual damages, which were to be assessed in a second phase of the case. The size of the class was not defined in the ruling. | | Defendants appealed to the São Paulo Court of Appeals, which annulled the ruling in November 2008, finding that the trial court had inappropriately ruled without hearing evidence and returned the case to the trial court for further proceedings. In May 2011, the trial court dismissed the claim. Plaintiff appealed the decision. In February 2015, the appellate court unanimously dismissed plaintiff's appeal. In September 2015,March 2017, plaintiff appealedfiled an en banc appeal to the SuperiorSupreme Court of Justice. In addition, the defendants filed a constitutional appeal to the Federal Supreme Tribunal on the basis that plaintiff did not have standing to bring the lawsuit. This appeal isBoth appeals are still pending. |
Philip Morris International Inc. and Subsidiaries
Notes to Condensed Consolidated Financial Statements
(Unaudited)
|
| | | | | | | | |
| Date | | Location of
Court/Name of
Plaintiff | | Type of
Case | | Verdict | | Post-Trial
Developments |
| May 27, 2015 | | Canada/Cecilia Létourneau
| | Class Action | | On May 27, 2015, the Superior Court of the District of Montreal, Province of Quebec ruled in favor of the Létourneau class on liability and awarded a total of CAD 131 million (approximately $103$100 million) in punitive damages, allocating CAD 46 million (approximately $36$35 million) to our subsidiary. The trial court ordered defendants to pay the full punitive damage award into a trust within 60 days. The court did not order the payment of compensatory damages.
| | In June 2015, our subsidiary commenced the appellate process with the Court of Appeal of Quebec. Our subsidiary also filed a motion to cancel the trial court’s order for payment into a trust notwithstanding appeal. In July 2015, the Court of Appeal granted the motion to cancel and overturned the trial court’s ruling that our subsidiary make the payment into a trust. In August 2015, plaintiffs filed a motion for security with the Court of Appeal covering both the Létourneau case and the Blais case described below. In October 2015, the Court of Appeal granted the motion and ordered our subsidiary to furnish security totaling CAD 226 million (approximately $177$172 million) to cover both the Létourneau and Blais cases. The hearing for the merits appeal took place in November 2016. (See below for further detail.) |
Philip Morris International Inc. and Subsidiaries
Notes to Condensed Consolidated Financial Statements
(Unaudited)
|
| | | | | | | | |
| Date | | Location of
Court/Name of
Plaintiff | | Type of
Case | | Verdict | | Post-Trial
Developments |
| May 27, 2015 | | Canada/Conseil Québécois Sur Le Tabac Et La Santé and Jean-Yves Blais
| | Class Action | | On May 27, 2015, the Superior Court of the District of Montreal, Province of Quebec ruled in favor of the Blais class on liability and found the class members’ compensatory damages totaled approximately CAD 15.5 billion (approximately $12.1$11.8 billion), including pre-judgment interest. The trial court awarded compensatory damages on a joint and several liability basis, allocating 20% to our subsidiary (approximately CAD 3.1 billion including pre-judgment interest (approximately $2.4$2.36 billion)). The trial court awarded CAD 90,000 (approximately $70,500)$68,400) in punitive damages, allocating CAD 30,000 (approximately $23,500)$22,400) to our subsidiary. The trial court ordered defendants to pay CAD 1 billion (approximately $783$760 million) of the compensatory damage award, CAD 200 million (approximately $157$152 million) of which is our subsidiary’s portion, into a trust within 60 days. | | In June 2015, our subsidiary commenced the appellate process with the Court of Appeal of Quebec. Our subsidiary also filed a motion to cancel the trial court’s order for payment into a trust notwithstanding appeal. In July 2015, the Court of Appeal granted the motion to cancel and overturned the trial court’s ruling that our subsidiary make the payment into a trust. In August 2015, plaintiffs filed a motion for security with the Court of Appeal. In October 2015, the Court of Appeal granted the motion and ordered our subsidiary to furnish security totaling, together with the Létourneau case, CAD 226 million (approximately $177$172 million). The hearing for the merits appeal took place in November 2016. (See below for further detail.) |
Philip Morris International Inc. and Subsidiaries
Notes to Condensed Consolidated Financial Statements
(Unaudited)
|
| | | | | | | | |
| Date | | Location of
Court/Name of
Plaintiff | | Type of
Case | | Verdict | | Post-Trial
Developments |
| August 5, 2016 | | Argentina/Hugo Lespada | | Individual Action | | On August 5, 2016, the Civil Court No. 14 - Mar del Plata, issued a verdict in favor of plaintiff, an individual smoker, and awarded him ARS 110,000 (approximately $5,446)$3,985), plus interest, in compensatory and moral damages. The trial court found that our subsidiary failed to warn plaintiff of the risk of becoming addicted to cigarettes. | | On August 23, 2016, our subsidiary filed its notice of appeal. On October 31, 2017, the Civil and Commercial Court of Appeals of Mar del Plata ruled that plaintiff's claim was barred by the statute of limitations and it reversed the trial court's decision. On November 28, 2017, plaintiff filed an extraordinary appeal of the reversal of the trial court's decision to the Supreme Court of the Province of Buenos Aires. |
Pending claims related to tobacco products generally fall within the following categories:
Smoking and Health Litigation: These cases primarily allege personal injury and are brought by individual plaintiffs or on behalf of a class or purported class of individual plaintiffs. Plaintiffs' allegations of liability in these cases are based on various theories of recovery, including negligence, gross negligence, strict liability, fraud, misrepresentation, design defect, failure to warn, breach of express and implied warranties, violations of deceptive trade practice laws and consumer protection statutes. Plaintiffs in these cases seek various forms of relief, including compensatory and other damages, and injunctive and equitable relief. Defenses raised in these cases include licit activity, failure to state a claim, lack of defect, lack of proximate cause, assumption of the risk, contributory negligence, and statute of limitations.
As of AprilJuly 24, 2018, there were a number of smoking and health cases pending against us, our subsidiaries or indemnitees, as follows:
6265 cases brought by individual plaintiffs in Argentina (3435), Brazil (10), Canada (4), Chile (67), Costa Rica (1), Italy (3), the Philippines (1), Russia (1)Poland (2), Turkey (1) and Scotland (1), compared with 6368 such cases on AprilJuly 25, 2017, and 6665 cases on AprilJuly 22, 2016; and
11 cases brought on behalf of classes of individual plaintiffs in Brazil (2) and Canada (9), compared with 11 such cases on AprilJuly 25, 2017 and 11 such cases on AprilJuly 22, 2016.
In the first class action pending in Brazil, The Smoker Health Defense Association (ADESF) v. Souza Cruz, S.A. and Philip Morris Marketing, S.A., Nineteenth Lower Civil Court of the Central Courts of the Judiciary District of São Paulo, Brazil, filed July 25, 1995, our subsidiary and another member of the industry are defendants. The plaintiff, a consumer organization, is seeking damages for all addicted smokers and former smokers, and injunctive relief. In 2004, the trial court found defendants liable without hearing evidence and awarded “moral damages” of R$1,000 (approximately $293)$265) per smoker per full year of smoking plus interest at the rate of 1% per month, as of the date of the ruling. The court did not award actual damages, which were to be assessed in the second phase of the case. The size of the class was not estimated. Defendants appealed to the São Paulo Court of Appeals, which annulled the ruling in November 2008, finding that the trial court had inappropriately ruled without hearing evidence and returned the case to the trial court for further proceedings. In May 2011, the trial court dismissed the claim. In February 2015, the appellate court unanimously dismissed plaintiff's appeal. In September 2015, plaintiff appealed to the Superior Court of Justice. In February 2017, the Chief Justice of the Supreme Court of Justice denied plaintiff's appeal. In March 2017, plaintiff filed an en banc appeal to the Supreme Court of Justice. In addition, the defendants filed a constitutional appeal to the Federal Supreme Tribunal on the basis that plaintiff did not have standing to bring the lawsuit. Both appeals are still pending.
In the second class action pending in Brazil, Public Prosecutor of São Paulo v. Philip Morris Brasil Industria e Comercio Ltda., Civil Court of the City of São Paulo, Brazil, filed August 6, 2007, our subsidiary is a defendant. The plaintiff, the Public Prosecutor of the State of São Paulo, is seeking (i) damages on behalf of all smokers nationwide, former smokers, and their relatives; (ii) damages on behalf of people exposed to environmental tobacco smoke nationwide, and their relatives; and (iii) reimbursement of the health care costs allegedly incurred for the treatment of tobacco-related diseases by all Brazilian States and Municipalities,
Philip Morris International Inc. and Subsidiaries
Notes to Condensed Consolidated Financial Statements
(Unaudited)
and the Federal District. In an interim ruling issued in December 2007, the trial court limited the scope of this claim to the State of São Paulo only. In December 2008, the Seventh Civil Court of São Paulo issued a decision declaring that it lacked jurisdiction because the case involved issues similar to the ADESF case discussed above and should be transferred to the Nineteenth Lower Civil Court in São Paulo where the ADESF case is pending. The court further stated that these cases should be consolidated for the purposes of judgment. In April 2010, the São Paulo Court of Appeals reversed the Seventh Civil Court's decision that consolidated the cases, finding that they are based on different legal claims and are progressing at different stages of proceedings. This case was returned to the Seventh Civil Court of São Paulo, and our subsidiary filed its closing arguments in December 2010. In March 2012, the trial court dismissed the case on the merits. In January 2014, the São Paulo Court of Appeals rejected plaintiff’s appeal and affirmed the trial court decision. In July 2014, plaintiff appealed to the Superior Court of Justice.
In the first class action pending in Canada, Cecilia Létourneau v. Imperial Tobacco Ltd., Rothmans, Benson & Hedges Inc. and JTI Macdonald Corp., Quebec Superior Court, Canada, filed in September 1998, our subsidiary and other Canadian manufacturers (Imperial Tobacco Canada Ltd. and JTI-MacDonald Corp.) are defendants. The plaintiff, an individual smoker, sought compensatory and punitive damages for each member of the class who is deemed addicted to smoking. The class was certified in 2005. Trial began in March 2012 and concluded in December 2014. The trial court issued its judgment on May 27, 2015. The trial court found our subsidiary and two other Canadian manufacturers liable and awarded a total of CAD 131 million (approximately $103$100 million) in punitive damages, allocating CAD 46 million (approximately $36$35 million) to our subsidiary. The trial court found that defendants violated the Civil Code of Quebec, the Quebec Charter of Human Rights and Freedoms, and the Quebec Consumer Protection Act by failing to warn adequately of the dangers of smoking. The trial court also found that defendants conspired to prevent consumers from learning the dangers of smoking. The trial court further held that these civil faults were a cause of the class members’ addiction. The trial court rejected other grounds of fault advanced by the class, holding that: (i) the evidence was insufficient to show that defendants marketed to youth, (ii) defendants’ advertising did not convey false information about the characteristics of cigarettes, and (iii) defendants did not commit a fault by using the descriptors light or mild for cigarettes with a lower tar delivery. The trial court estimated the size of the addiction class at 918,000 members but declined to award compensatory damages to the addiction class because the evidence did not establish the claims with sufficient accuracy. The trial court ordered defendants to pay the full punitive damage award into a trust within 60 days and found that a claims process to allocate the awarded damages to individual class members would be too expensive and difficult to administer. The trial court ordered a briefing on the proposed process for the distribution of sums remaining from the punitive damage award after payment of attorneys’ fees and legal costs. In June 2015, our subsidiary commenced the appellate process by filing its inscription of appeal of the trial court’s judgment with the Court of Appeal of Quebec. Our subsidiary also filed a motion to cancel the trial court’s order for payment into a trust within 60 days notwithstanding appeal. In July 2015, the Court of Appeal granted the motion to cancel and overturned the trial court’s ruling that our subsidiary make the payment into a trust within 60 days. In August 2015, plaintiffs filed a motion with the Court of Appeal seeking security in both the Létourneau case and the Blais case described below. In October 2015, the Court of Appeal granted the motion and ordered our subsidiary to furnish security totaling CAD 226 million (approximately $177$172 million), in the form of cash into a court trust or letters of credit, in six equal consecutive quarterly installments of approximately CAD 37.6 million (approximately $29.4$28.6 million) beginning in December 2015 through March 2017. See the Blais description for further detail concerning the security order. The Court of Appeal heard oral arguments on the merits appeal in November 2016. Our subsidiary and PMI believe that the findings of liability and damages were incorrect and should ultimately be set aside on any one of many grounds, including the following: (i) holding that defendants violated Quebec law by failing to warn class members of the risks of smoking even after the court found that class members knew, or should have known, of the risks, (ii) finding that plaintiffs were not required to prove that defendants’ alleged misconduct caused injury to each class member in direct contravention of binding precedent, (iii) creating a factual presumption, without any evidence from class members or otherwise, that defendants’ alleged misconduct caused all smoking by all class members, (iv) holding that the addiction class members’ claims for punitive damages were not time-barred even though the case was filed more than three years after a prominent addiction warning appeared on all packages, and (v) awarding punitive damages to punish defendants without proper consideration as to whether punitive damages were necessary to deter future misconduct.
In the second class action pending in Canada, Conseil Québécois Sur Le Tabac Et La Santé and Jean-Yves Blais v. Imperial Tobacco Ltd., Rothmans, Benson & Hedges Inc. and JTI Macdonald Corp., Quebec Superior Court, Canada, filed in November 1998, our subsidiary and other Canadian manufacturers (Imperial Tobacco Canada Ltd. and JTI-MacDonald Corp.) are defendants. The plaintiffs, an anti-smoking organization and an individual smoker, sought compensatory and punitive damages for each member of the class who allegedly suffers from certain smoking-related diseases. The class was certified in 2005. Trial began in March 2012 and concluded in December 2014. The trial court issued its judgment on May 27, 2015. The trial court found our subsidiary and two other Canadian manufacturers liable and found that the class members’ compensatory damages totaled approximately CAD 15.5 billion, including pre-judgment interest (approximately $12.1$11.8 billion). The trial court awarded compensatory damages on a joint and several liability basis, allocating 20% to our subsidiary (approximately CAD 3.1 billion, including pre-judgment
Philip Morris International Inc. and Subsidiaries
Notes to Condensed Consolidated Financial Statements
(Unaudited)
interest (approximately $2.4$2.36 billion)). In addition, the trial court awarded CAD 90,000 (approximately $70,500)$68,400) in punitive damages, allocating CAD 30,000 (approximately $23,500)$22,400) to our subsidiary and found that defendants violated the Civil Code of Quebec, the Quebec Charter of Human Rights and Freedoms, and the Quebec Consumer Protection Act by failing to warn adequately of the dangers of smoking. The trial court also found that defendants conspired to prevent consumers from learning the dangers of smoking. The trial court further held that these civil faults were a cause of the class members’ diseases. The trial court rejected other grounds of fault advanced by the class, holding that: (i) the evidence was insufficient to show that defendants marketed to youth, (ii) defendants’ advertising did not convey false information about the characteristics of cigarettes, and (iii) defendants did not commit a fault by using the descriptors light or mild for cigarettes with a lower tar delivery. The trial court estimated the disease class at 99,957 members. The trial court ordered defendants to pay CAD 1 billion (approximately $783$760 million) of the compensatory damage award into a trust within 60 days, CAD 200 million (approximately $157$152 million) of which is our subsidiary’s portion and ordered briefing on a proposed claims process for the distribution of damages to individual class members and for payment of attorneys’ fees and legal costs. In June 2015, our subsidiary commenced the appellate process by filing its inscription of appeal of the trial court’s judgment with the Court of Appeal of Quebec. Our subsidiary also filed a motion to cancel the trial court’s order for payment into a trust within 60 days notwithstanding appeal. In July 2015, the Court of Appeal granted the motion to cancel and overturned the trial court’s ruling that our subsidiary make an initial payment within 60 days. In August 2015, plaintiffs filed a motion with the Court of Appeal seeking an order that defendants place irrevocable letters of credit totaling CAD 5 billion (approximately $3.91$3.8 billion) into trust, to secure the judgments in both the Létourneau and Blais cases. Plaintiffs subsequently withdrew their motion for security against JTI-MacDonald Corp. and proceeded only against our subsidiary and Imperial Tobacco Canada Ltd. In October 2015, the Court of Appeal granted the motion and ordered our subsidiary to furnish security totaling CAD 226 million (approximately $177$172 million) to cover both the Létourneau and Blais cases. Such security may take the form of cash into a court trust or letters of credit, in six equal consecutive quarterly installments of approximately CAD 37.6 million (approximately $29.4$28.6 million) beginning in December 2015 through March 2017. The Court of Appeal ordered Imperial Tobacco Canada Ltd. to furnish security totaling CAD 758 million (approximately $593$576 million) in seven equal consecutive quarterly installments of approximately CAD 108 million (approximately $84.6$82.1 million) beginning in December 2015 through June 2017. In March 2017, our subsidiary made its sixth and final quarterly installment of security for approximately CAD 37.6 million (approximately $29.4$28.6 million) into a court trust. This payment is included in other assets on the condensed consolidated balance sheets and in cash used in operating activities in the condensed consolidated statements of cash flows. The Court of Appeal ordered that the security is payable upon a final judgment of the Court of Appeal affirming the trial court’s judgment or upon further order of the Court of Appeal. The Court of Appeal heard oral arguments on the merits appeal in November 2016. Our subsidiary and PMI believe that the findings of liability and damages were incorrect and should ultimately be set aside on any one of many grounds, including the following: (i) holding that defendants violated Quebec law by failing to warn class members of the risks of smoking even after the court found that class members knew, or should have known, of the risks, (ii) finding that plaintiffs were not required to prove that defendants’ alleged misconduct caused injury to each class member in direct contravention of binding precedent, (iii) creating a factual presumption, without any evidence from class members or otherwise, that defendants’ alleged misconduct caused all smoking by all class members, (iv) relying on epidemiological evidence that did not meet recognized scientific standards, and (v) awarding punitive damages to punish defendants without proper consideration as to whether punitive damages were necessary to deter future misconduct.
In the third class action pending in Canada, Kunta v. Canadian Tobacco Manufacturers' Council, et al., The Queen's Bench, Winnipeg, Canada, filed June 12, 2009, we, our subsidiaries, and our indemnitees (PM USA and Altria), and other members of the industry are defendants. The plaintiff, an individual smoker, alleges her own addiction to tobacco products and chronic obstructive pulmonary disease (“COPD”), severe asthma, and mild reversible lung disease resulting from the use of tobacco products. She is seeking compensatory and punitive damages on behalf of a proposed class comprised of all smokers, their estates, dependents and family members, as well as restitution of profits, and reimbursement of government health care costs allegedly caused by tobacco products. In September 2009, plaintiff's counsel informed defendants that he did not anticipate taking any action in this case while he pursues the class action filed in Saskatchewan (see description of Adams, below).
In the fourth class action pending in Canada, Adams v. Canadian Tobacco Manufacturers' Council, et al., The Queen's Bench, Saskatchewan, Canada, filed July 10, 2009, we, our subsidiaries, and our indemnitees (PM USA and Altria), and other members of the industry are defendants. The plaintiff, an individual smoker, alleges her own addiction to tobacco products and COPD resulting from the use of tobacco products. She is seeking compensatory and punitive damages on behalf of a proposed class comprised of all smokers who have smoked a minimum of 25,000 cigarettes and have allegedly suffered, or suffer, from COPD, emphysema, heart disease, or cancer, as well as restitution of profits. Preliminary motions are pending.
In the fifth class action pending in Canada, Semple v. Canadian Tobacco Manufacturers' Council, et al., The Supreme Court (trial court), Nova Scotia, Canada, filed June 18, 2009, we, our subsidiaries, and our indemnitees (PM USA and Altria), and other members of the industry are defendants. The plaintiff, an individual smoker, alleges his own addiction to tobacco products and
Philip Morris International Inc. and Subsidiaries
Notes to Condensed Consolidated Financial Statements
(Unaudited)
COPD resulting from the use of tobacco products. He is seeking compensatory and punitive damages on behalf of a proposed class comprised of all smokers, their estates, dependents and family members, as well as restitution of profits, and reimbursement of government health care costs allegedly caused by tobacco products. No activity in this case is anticipated while plaintiff's counsel pursues the class action filed in Saskatchewan (see description of Adams, above).
In the sixth class action pending in Canada, Dorion v. Canadian Tobacco Manufacturers' Council, et al., The Queen's Bench, Alberta, Canada, filed June 15, 2009, we, our subsidiaries, and our indemnitees (PM USA and Altria), and other members of the industry are defendants. The plaintiff, an individual smoker, alleges her own addiction to tobacco products and chronic bronchitis and severe sinus infections resulting from the use of tobacco products. She is seeking compensatory and punitive damages on behalf of a proposed class comprised of all smokers, their estates, dependents and family members, restitution of profits, and reimbursement of government health care costs allegedly caused by tobacco products. To date, we, our subsidiaries, and our indemnitees have not been properly served with the complaint. No activity in this case is anticipated while plaintiff's counsel pursues the class action filed in Saskatchewan (see description of Adams, above).
In the seventh class action pending in Canada, McDermid v. Imperial Tobacco Canada Limited, et al., Supreme Court, British Columbia, Canada, filed June 25, 2010, we, our subsidiaries, and our indemnitees (PM USA and Altria), and other members of the industry are defendants. The plaintiff, an individual smoker, alleges his own addiction to tobacco products and heart disease resulting from the use of tobacco products. He is seeking compensatory and punitive damages on behalf of a proposed class comprised of all smokers who were alive on June 12, 2007, and who suffered from heart disease allegedly caused by smoking, their estates, dependents and family members, plus disgorgement of revenues earned by the defendants from January 1, 1954, to the date the claim was filed.
In the eighth class action pending in Canada, Bourassa v. Imperial Tobacco Canada Limited, et al., Supreme Court, British Columbia, Canada, filed June 25, 2010, we, our subsidiaries, and our indemnitees (PM USA and Altria), and other members of the industry are defendants. The plaintiff, the heir to a deceased smoker, alleges that the decedent was addicted to tobacco products and suffered from emphysema resulting from the use of tobacco products. She is seeking compensatory and punitive damages on behalf of a proposed class comprised of all smokers who were alive on June 12, 2007, and who suffered from chronic respiratory diseases allegedly caused by smoking, their estates, dependents and family members, plus disgorgement of revenues earned by the defendants from January 1, 1954, to the date the claim was filed. In December 2014, plaintiff filed an amended statement of claim.
In the ninth class action pending in Canada, Suzanne Jacklin v. Canadian Tobacco Manufacturers' Council, et al., Ontario Superior Court of Justice, filed June 20, 2012, we, our subsidiaries, and our indemnitees (PM USA and Altria), and other members of the industry are defendants. The plaintiff, an individual smoker, alleges her own addiction to tobacco products and COPD resulting from the use of tobacco products. She is seeking compensatory and punitive damages on behalf of a proposed class comprised of all smokers who have smoked a minimum of 25,000 cigarettes and have allegedly suffered, or suffer, from COPD, heart disease, or cancer, as well as restitution of profits. Plaintiff's counsel has indicated that he does not intend to take any action in this case in the near future.
Health Care Cost Recovery Litigation: These cases, brought by governmental and non-governmental plaintiffs, seek reimbursement of health care cost expenditures allegedly caused by tobacco products. Plaintiffs' allegations of liability in these cases are based on various theories of recovery including unjust enrichment, negligence, negligent design, strict liability, breach of express and implied warranties, violation of a voluntary undertaking or special duty, fraud, negligent misrepresentation, conspiracy, public nuisance, defective product, failure to warn, sale of cigarettes to minors, and claims under statutes governing competition and deceptive trade practices. Plaintiffs in these cases seek various forms of relief including compensatory and other damages, and injunctive and equitable relief. Defenses raised in these cases include lack of proximate cause, remoteness of injury, failure to state a claim, adequate remedy at law, “unclean hands” (namely, that plaintiffs cannot obtain equitable relief because they participated in, and benefited from, the sale of cigarettes), and statute of limitations.
As of AprilJuly 24, 2018, there were 16 health care cost recovery cases pending against us, our subsidiaries or indemnitees in Canada (10), Korea (1) and Nigeria (5), compared with 16 such cases on AprilJuly 25, 2017 and 16 such cases on AprilJuly 22, 2016.
In the first health care cost recovery case pending in Canada, Her Majesty the Queen in Right of British Columbia v. Imperial Tobacco Limited, et al., Supreme Court, British Columbia, Vancouver Registry, Canada, filed January 24, 2001, we, our subsidiaries, our indemnitee (PM USA), and other members of the industry are defendants. The plaintiff, the government of the province of British Columbia, brought a claim based upon legislation enacted by the province authorizing the government to file a direct action against cigarette manufacturers to recover the health care costs it has incurred, and will incur, resulting from a “tobacco related
Philip Morris International Inc. and Subsidiaries
Notes to Condensed Consolidated Financial Statements
(Unaudited)
wrong.” The Supreme Court of Canada has held that the statute is constitutional. We and certain other non-Canadian defendants challenged the jurisdiction of the court. The court rejected the jurisdictional challenge. Pre-trial discovery is ongoing.
In the second health care cost recovery case filed in Canada, Her Majesty the Queen in Right of New Brunswick v. Rothmans Inc., et al., Court of Queen's Bench of New Brunswick, Trial Court, New Brunswick, Fredericton, Canada, filed March 13, 2008, we, our subsidiaries, our indemnitees (PM USA and Altria), and other members of the industry are defendants. The claim was filed by the government of the province of New Brunswick based on legislation enacted in the province. This legislation is similar to the law introduced in British Columbia that authorizes the government to file a direct action against cigarette manufacturers to recover the health care costs it has incurred, and will incur, as a result of a “tobacco related wrong.” Pre-trial discovery is ongoing. In June 2017, the trial court set a trial date for November 4, 2019.
In the third health care cost recovery case filed in Canada, Her Majesty the Queen in Right of Ontario v. Rothmans Inc., et al., Ontario Superior Court of Justice, Toronto, Canada, filed September 29, 2009, we, our subsidiaries, our indemnitees (PM USA and Altria), and other members of the industry are defendants. The claim was filed by the government of the province of Ontario based on legislation enacted in the province. This legislation is similar to the laws introduced in British Columbia and New Brunswick that authorize the government to file a direct action against cigarette manufacturers to recover the health care costs it has incurred, and will incur, as a result of a “tobacco related wrong.” Pre-trial discovery is ongoing.
In the fourth health care cost recovery case filed in Canada, Attorney General of Newfoundland and Labrador v. Rothmans Inc., et al., Supreme Court of Newfoundland and Labrador, St. Johns, Canada, filed February 8, 2011, we, our subsidiaries, our indemnitees (PM USA and Altria), and other members of the industry are defendants. The claim was filed by the government of the province of Newfoundland and Labrador based on legislation enacted in the province that is similar to the laws introduced in British Columbia, New Brunswick and Ontario. The legislation authorizes the government to file a direct action against cigarette manufacturers to recover the health care costs it has incurred, and will incur, as a result of a “tobacco related wrong.” Pre-trial discovery is ongoing.
In the fifth health care cost recovery case filed in Canada, Attorney General of Quebec v. Imperial Tobacco Limited, et al., Superior Court of Quebec, Canada, filed June 8, 2012, we, our subsidiary, our indemnitee (PM USA), and other members of the industry are defendants. The claim was filed by the government of the province of Quebec based on legislation enacted in the province that is similar to the laws enacted in several other Canadian provinces. The legislation authorizes the government to file a direct action against cigarette manufacturers to recover the health care costs it has incurred, and will incur, as a result of a “tobacco related wrong.” Pre-trial discovery is ongoing.
In the sixth health care cost recovery case filed in Canada, Her Majesty in Right of Alberta v. Altria Group, Inc., et al., Supreme Court of Queen's Bench Alberta, Canada, filed June 8, 2012, we, our subsidiaries, our indemnitees (PM USA and Altria), and other members of the industry are defendants. The claim was filed by the government of the province of Alberta based on legislation enacted in the province that is similar to the laws enacted in several other Canadian provinces. The legislation authorizes the government to file a direct action against cigarette manufacturers to recover the health care costs it has incurred, and will incur, as a result of a “tobacco related wrong.” Pre-trial discovery is ongoing.
In the seventh health care cost recovery case filed in Canada, Her Majesty the Queen in Right of the Province of Manitoba v. Rothmans, Benson & Hedges, Inc., et al., The Queen's Bench, Winnipeg Judicial Centre, Canada, filed May 31, 2012, we, our subsidiaries, our indemnitees (PM USA and Altria), and other members of the industry are defendants. The claim was filed by the government of the province of Manitoba based on legislation enacted in the province that is similar to the laws enacted in several other Canadian provinces. The legislation authorizes the government to file a direct action against cigarette manufacturers to recover the health care costs it has incurred, and will incur, as a result of a “tobacco related wrong.” Defendants filed their defenses in September 2014. Pre-trial discovery is ongoing.
In the eighth health care cost recovery case filed in Canada, The Government of Saskatchewan v. Rothmans, Benson & Hedges Inc., et al., Queen's Bench, Judicial Centre of Saskatchewan, Canada, filed June 8, 2012, we, our subsidiaries, our indemnitees (PM USA and Altria), and other members of the industry are defendants. The claim was filed by the government of the province of Saskatchewan based on legislation enacted in the province that is similar to the laws enacted in several other Canadian provinces. The legislation authorizes the government to file a direct action against cigarette manufacturers to recover the health care costs it has incurred, and will incur, as a result of a “tobacco related wrong.” Defendants filed their defenses in February 2015. While discovery initially was scheduled to begin in 2017 by agreement of the parties, to date, the discovery process has not started.
In the ninth health care cost recovery case filed in Canada, Her Majesty the Queen in Right of the Province of Prince Edward Island v. Rothmans, Benson & Hedges Inc., et al., Supreme Court of Prince Edward Island (General Section), Canada, filed
Philip Morris International Inc. and Subsidiaries
Notes to Condensed Consolidated Financial Statements
(Unaudited)
September 10, 2012, we, our subsidiaries, our indemnitees (PM USA and Altria), and other members of the industry are defendants. The claim was filed by the government of the province of Prince Edward Island based on legislation enacted in the province that is similar to the laws enacted in several other Canadian provinces. The legislation authorizes the government to file a direct action against cigarette manufacturers to recover the health care costs it has incurred, and will incur, as a result of a “tobacco related wrong.” Defendants filed their defenses in February 2015. While discovery initially was scheduled to begin in 2017 by agreement of the parties, to date, the discovery process has not started.
In the tenth health care cost recovery case filed in Canada, Her Majesty the Queen in Right of the Province of Nova Scotia v. Rothmans, Benson & Hedges Inc., et al., Supreme Court of Nova Scotia, Canada, filed January 2, 2015, we, our subsidiaries, our indemnitees (PM USA and Altria), and other members of the industry are defendants. The claim was filed by the government of the province of Nova Scotia based on legislation enacted in the province that is similar to the laws enacted in several other Canadian provinces. The legislation authorizes the government to file a direct action against cigarette manufacturers to recover the health care costs it has incurred, and will incur, as a result of a “tobacco related wrong.” Defendants filed their defenses in July 2015. Pre-trial discovery is ongoing.
In the first health care cost recovery case in Nigeria, The Attorney General of Lagos State v. British American Tobacco (Nigeria) Limited, et al., High Court of Lagos State, Lagos, Nigeria, filed March 13, 2008, we and other members of the industry are defendants. Plaintiff seeks reimbursement for the cost of treating alleged smoking-related diseases for the past 20 years, payment of anticipated costs of treating alleged smoking-related diseases for the next 20 years, various forms of injunctive relief, plus punitive damages. We are in the process of making challenges to service and the court's jurisdiction. Currently, the case is stayed in the trial court pending the appeals of certain co-defendants relating to service objections.
In the second health care cost recovery case in Nigeria, The Attorney General of Kano State v. British American Tobacco (Nigeria) Limited, et al., High Court of Kano State, Kano, Nigeria, filed May 9, 2007, we and other members of the industry are defendants. Plaintiff seeks reimbursement for the cost of treating alleged smoking-related diseases for the past 20 years, payment of anticipated costs of treating alleged smoking-related diseases for the next 20 years, various forms of injunctive relief, plus punitive damages. We are in the process of making challenges to service and the court's jurisdiction. Currently, the case is stayed in the trial court pending the appeals of certain co-defendants relating to service objections.
In the third health care cost recovery case in Nigeria, The Attorney General of Gombe State v. British American Tobacco (Nigeria) Limited, et al., High Court of Gombe State, Gombe, Nigeria, filed October 17, 2008, we and other members of the industry are defendants. Plaintiff seeks reimbursement for the cost of treating alleged smoking-related diseases for the past 20 years, payment of anticipated costs of treating alleged smoking-related diseases for the next 20 years, various forms of injunctive relief, plus punitive damages. In February 2011, the court ruled that the plaintiff had not complied with the procedural steps necessary to serve us. As a result of this ruling, plaintiff must re-serve its claim. We have not yet been re-served.
In the fourth health care cost recovery case in Nigeria, The Attorney General of Oyo State, et al., v. British American Tobacco (Nigeria) Limited, et al., High Court of Oyo State, Ibadan, Nigeria, filed May 25, 2007, we and other members of the industry are defendants. Plaintiffs seek reimbursement for the cost of treating alleged smoking-related diseases for the past 20 years, payment of anticipated costs of treating alleged smoking-related diseases for the next 20 years, various forms of injunctive relief, plus punitive damages. We challenged service as improper. In June 2010, the court ruled that plaintiffs did not have leave to serve the writ of summons on the defendants and that they must re-serve the writ. We have not yet been re-served.
In the fifth health care cost recovery case in Nigeria, The Attorney General of Ogun State v. British American Tobacco (Nigeria) Limited, et al., High Court of Ogun State, Abeokuta, Nigeria, filed February 26, 2008, we and other members of the industry are defendants. Plaintiff seeks reimbursement for the cost of treating alleged smoking-related diseases for the past 20 years, payment of anticipated costs of treating alleged smoking-related diseases for the next 20 years, various forms of injunctive relief, plus punitive damages. In May 2010, the trial court rejected our service objections. We have appealed.
In the health care cost recovery case in Korea, the National Health Insurance Service v. KT&G, et. al., filed April 14, 2014, our subsidiary and other Korean manufacturers are defendants. Plaintiff alleges that defendants concealed the health hazards of smoking, marketed to youth, added ingredients to make their products more harmful and addictive, and misled consumers into believing that Lights cigarettes are safer than regular cigarettes. The National Health Insurance Service seeks to recover approximately $53.7 million allegedly incurred in treating 3,484 patients with small cell lung cancer, squamous cell lung cancer, and squamous cell laryngeal cancer from 2003 to 2012. The case is now in the evidentiary phase.
Label-Related Cases: These cases, brought by individual plaintiffs, or on behalf of a class or purported class of individual plaintiffs, allege that the use of the descriptor “Lights” or other alleged misrepresentations or omissions of labeling information constitute
Philip Morris International Inc. and Subsidiaries
Notes to Condensed Consolidated Financial Statements
(Unaudited)
fraudulent and misleading conduct. Plaintiffs' allegations of liability in these cases are based on various theories of recovery including misrepresentation, deception, and breach of consumer protection laws. Plaintiffs seek various forms of relief including restitution, injunctive relief, and compensatory and other damages. Defenses raised include lack of causation, lack of reliance, assumption of the risk, and statute of limitations.
As of AprilJuly 24, 2018, there was 1 case brought by an individual plaintiff in Italy (1) pending against our subsidiaries, compared with 1 such casescase on AprilJuly 25, 2017, and 3 such cases on AprilJuly 22, 2016, and one purported class action in Israel (1).
An individual plaintiff filed the purported class action, Aharon Ringer v. Philip Morris Ltd. and Globrands Ltd., on July 18, 2017, in the Central District Court of Israel. Our Israeli affiliate and an Israeli importer and distributor for other multinational tobacco companies are defendants. Plaintiff seeks to represent a class of smokers in Israel who have purchased cigarettes imported by defendants since July 18, 2010. Plaintiff estimates the class size to be 7,000,000 smokers. Plaintiff alleges that defendants misled consumers by not disclosing sufficient information about carbon monoxide, tar, and nicotine yields of, and tobacco contained in, the imported cigarettes. Plaintiff seeks various forms of relief, including an order for defendants to label cigarette packs in accordance with plaintiff’s demands, and damages for misleading consumers, breach of autonomy and unjust enrichment.
Public Civil Actions: Claims have been filed either by an individual, or a public or private entity, seeking to protect collective or individual rights, such as the right to health, the right to information or the right to safety. Plaintiffs' allegations of liability in these cases are based on various theories of recovery including product defect, concealment, and misrepresentation. Plaintiffs in these cases seek various forms of relief including injunctive relief such as banning cigarettes, descriptors, smoking in certain places and advertising, as well as implementing communication campaigns and reimbursement of medical expenses incurred by public or private institutions.
As of AprilJuly 24, 2018, there were 2 public civil actions pending against our subsidiaries in Argentina (1) and Venezuela (1), compared with 2 such cases on AprilJuly 25, 2017, and 32 such cases on AprilJuly 22, 2016.
In the public civil action in Argentina, Asociación Argentina de Derecho de Danos v. Massalin Particulares S.A., et al., Civil Court of Buenos Aires, Argentina, filed February 26, 2007, our subsidiary and another member of the industry are defendants. The plaintiff, a consumer association, seeks the establishment of a relief fund for reimbursement of medical costs associated with diseases allegedly caused by smoking. Our subsidiary filed its answer in September 2007. In March 2010, the case file was transferred to the Federal Court on Administrative Matters after the Civil Court granted plaintiff's request to add the national government as a co-plaintiff in the case. The case is currently in the evidentiary stage.
In the public civil action in Venezuela, Federation of Consumers and Users Associations (“FEVACU”), et al. v. National Assembly of Venezuela and the Venezuelan Ministry of Health, Constitutional Chamber of the Venezuelan Supreme Court, filed April 29, 2008, we were not named as a defendant, but the plaintiffs published a notice pursuant to court order, notifying all interested parties to appear in the case. In January 2009, our subsidiary appeared in the case in response to this notice. The plaintiffs purport to represent the right to health of the citizens of Venezuela and claim that the government failed to protect adequately its citizens' right to health. The claim asks the court to order the government to enact stricter regulations on the manufacture and sale of tobacco products. In addition, the plaintiffs ask the court to order companies involved in the tobacco industry to allocate a percentage of their “sales or benefits” to establish a fund to pay for the health care costs of treating smoking-related diseases. In October 2008, the court ruled that plaintiffs have standing to file the claim and that the claim meets the threshold admissibility requirements. In December 2012, the court admitted our subsidiary and BAT's subsidiary as interested third parties. In February 2013, our subsidiary answered the complaint.
Other Litigation
The Department of Special Investigations of the government of Thailand ("DSI") conducted an investigation into alleged underpayment by our subsidiary, Philip Morris (Thailand) Limited ("PM Thailand"), of customs duties and excise taxes relating to imports from the Philippines covering the period 2003-2007. On January 18, 2016, the Public Prosecutor filed charges against our subsidiary and seven former and current employees in the Bangkok Criminal Court alleging that PM Thailand and the individual defendants jointly and with the intention to defraud the Thai government, under-declared import prices of cigarettes to avoid full payment of taxes and duties in connection with import entries of cigarettes from the Philippines during the period of July 2003 to June 2006. The government is seeking a fine of approximately THB 80.8 billion (approximately $2.57$2.41 billion). In May 2017, the King of Thailand signed a new customs act. The new act, which took effect in November 2017, substantially limits the amount of fines that Thailand could seek in these proceedings. PM Thailand believes that its declared import prices are in compliance with
Philip Morris International Inc. and Subsidiaries
Notes to Condensed Consolidated Financial Statements
(Unaudited)
the Customs Valuation Agreement of the World Trade Organization and Thai law and that the allegations of the Public Prosecutor are inconsistent with several decisions already taken by Thai Customs and other Thai governmental agencies. Trial in the case began in November 2017. In March 2018, acting on a request from the Public Prosecutor, the court suspended the trial proceedings indefinitely and struck the case from the court list. The case may be reactivated byIn June 2018, the court or upon application of a party.reinstated the case and scheduled the remaining trial proceedings for May 2019.
The DSI also conducted an investigation into alleged underpayment by PM Thailand of customs duties and excise taxes relating to imports from Indonesia covering the period 2000-2003. On January 26, 2017, the Public Prosecutor filed charges against PM Thailand and its former Thai employee in the Bangkok Criminal Court alleging that PM Thailand and its former employee jointly and with the intention to defraud the Thai government under-declared import prices of cigarettes to avoid full payment of taxes and duties in connection with import entries during the period from January 2002 to July 2003. The government is seeking a fine of approximately THB 19.8 billion (approximately $629$591 million). The case is in pre-trial proceedings. The trial is scheduled to begin in the last quarter of 2018. PM Thailand believes that its declared import prices are in compliance with the Customs Valuation Agreement of the World Trade Organization and Thai law, and that the allegations of the Public Prosecutor are inconsistent with several decisions already taken by Thai Customs and a Thai court. In May 2017, the King of Thailand signed a new customs act. The new act, which took effect in November 2017, substantially limits the amount of fines that Thailand could seek in these proceedings. On November 29, 2017, PM Thailand received notices of assessment in the aggregate amount of approximately THB 25.6 billion (approximately $813$765 million) from the Thai Customs Department alleging that PM Thailand under-declared customs values for the imports from Indonesia covering the period 2001-2003. The notices include the Indonesian import entries subject to the proceedings discussed above and are in addition to the fine sought by the government in the criminal proceedings. PM Thailand filed its appeal against the notices in December 2017. We believe that all of the notices of assessment are barred by the applicable statutes of limitations and are otherwise without merit. In March 2018, the Thai Customs Post Clearance Audit Bureau informed PM Thailand that the Thai Customs Department will cancel or otherwise not pursue the notices.notices, and in May 2018 the Director-General of the Thai Customs Department issued a letter confirming this position. PM Thailand is considering whether further procedural steps are required to confirm the finality of this development.
The South Korean Board of Audit and Inspection (“BAI”) conducted an audit of certain Korean government agencies and the tobacco industry into whether inventory movements ahead of the January 1, 2015 increase of cigarette-related taxes by tobacco companies, including Philip Morris Korea Inc. ("PM Korea"), our South Korean affiliate, were in compliance with South Korean tax laws. In November 2016, the tax authorities completed their audit and assessed allegedly underpaid taxes and penalties. In order to avoid nonpayment financial costs, PM Korea paid approximately KRW 272 billion (approximately $254$241 million), of which KRW 100 billion (approximately $93$89 million) was paid in 2016 and KRW 172 billion (approximately $160$152 million) was paid in the first quarter of 2017. These amounts are included in other assets in the condensed consolidated balance sheets and in cash used in operating activities in the condensed consolidated statements of cash flows. PM Korea is appealing the assessments. The tax authorities have also referred the matter to the Public Prosecutor. On June 19, 2018, the Public Prosecutor who will further investigate and decide whetherdecided not to file criminal charges against PM Korea and/or other alleged co-offenders. IfThis decision is being appealed by the tax authorities and, if reversed, the Public Prosecutor decides to prosecute, it may seek up to three times the underpaid tax for company criminal penalties and up to five times the underpaid tax for individual criminal penalties. The Public Prosecutor also decided not to prosecute PM Korea believesand its managing director in connection with a criminal complaint against them that it has paid cigarette-related taxes in compliance with the South Korean tax laws. In addition,had been filed by the South Korean Ministry of Strategy and Finance (“MOSF”) filed a criminal complaint with the Public Prosecutor against PM Korea and its managing director.. In itsthis criminal complaint, the MOSF alleged that PM Korea exceeded the monthly product withdrawal limits that the MOSF had set in its notice. The Public Prosecutor will investigateThis decision is being appealed by the MOSF’s criminal complaint and decide whether to prosecute.MOSF. PM Korea believes that it has paid cigarette-related taxes in compliance with the South Korean tax laws and disagrees with the MOSF’s allegations.
We are also involved in additional litigation arising in the ordinary course of our business. While the outcomes of these proceedings are uncertain, management does not expect that the ultimate outcomes of other litigation, including any reasonably possible losses in excess of current accruals, will have a material adverse effect on our consolidated results of operations, cash flows or financial position.
Note 9. Income Taxes:
Income tax provisions for jurisdictions outside the United States of America, as well as state and local income tax provisions, were determined on a separate company basis, and the related assets and liabilities were recorded in PMI’s condensed consolidated balance sheets.
In December 2017, the Tax Cuts and Jobs Act was signed into law. Accordingly, PMI recorded a provisional charge of $1.6 billion in its 2017 income tax provision, including a charge for the transition tax on accumulated foreign earnings of $1.4 billion and $0.2
Philip Morris International Inc. and Subsidiaries
Notes to Condensed Consolidated Financial Statements
(Unaudited)
billion due to the re-measurement of U.S. deferred tax assets and liabilities using a rate of 21%. PMI is evaluating the assumptions used in the analysis, as well as guidance issued by the U.S. Treasury Department and the Internal Revenue Service and has not
Philip Morris International Inc. and Subsidiaries
Notes to Condensed Consolidated Financial Statements
(Unaudited)
made any measurement period adjustments related to these items during the quarter. PMI will complete its analysis during 2018, and any adjustments to the provisional charges will be included in income tax expense or benefit in the appropriate period, in accordance with Staff Accounting Bulletin No. 118 (SAB 118).
PMI’s effective tax rates for the six months and three months ended March 31,June 30, 2018 were 23.5% and 22.1%, respectively. PMI’s effective tax rates for the six months and three months ended June 30, 2017 were 25.5%26.3% and 24.9%27.5%, respectively. The effective tax rate for the threesix months ended March 31,June 30, 2017 was favorably impacted by the tax benefit of a legal entity restructuring ($61 million). In 2018, PMI's effective tax rate is expected to exceed the new U.S. federal statutory rate of 21%. PMI’s higher effective tax raterates for the six months and three months ended March 31,June 30, 2018 wasexceeded the U.S. federal statutory rate primarily due to earnings mix by taxing jurisdiction, as well as the expected impact of Global Intangible Low Taxed Income ("GILTI") provisions of the Tax Cuts and Jobs Act, partially offset by the favorable tax treatment of Foreign Derived Intangible Income ("FDII"). and a reduction in the liability for unrecognized tax benefits.
Based upon PMI's current interpretation of the Tax Cuts and Jobs Act, PMI estimates that its full-year 2018 effective tax rate will be approximately 26%, subject to future regulatory developments.24%. PMI is continuing to assess the impacts of the Tax Cuts and Jobs Act on the effective tax rate and income tax accounting, in particular the foreign tax credit limitations related to the new GILTI provisions. PMI will complete this assessment during 2018 and will make an accounting policy election on whether to treat GILTI taxes as a current period expense or include these amounts in the measurement of deferred taxes. Based on PMI’s assessment to date, no impact is expected from the Base Erosion and Anti-Abuse Tax ("BEAT") rules. Changes in currency exchange rates, or earnings mix by taxing jurisdiction alsoor future regulatory developments have an impact on the effective tax rates, which PMI monitors each quarter. Significant judgment is required in determining income tax provisions and in evaluating tax positions.
PMI is regularly examined by tax authorities around the world and is currently under examination in a number of jurisdictions. During the second quarter of 2018, the IRS concluded its examination of PMI's consolidated U.S. federal tax returns for the years 2013 and 2014. The U.S. federal statute of limitations remains open for the years 20132015 and onward. Foreign and U.S. state jurisdictions have statutes of limitations generally ranging from three to five years.
It is reasonably possible that within the next 12 months certain tax examinations will close, which could result in a change in unrecognized tax benefits along with related interest and penalties. An estimate of any possible change cannot be made at this time.
Note 10. Indebtedness:
Short-term Borrowings:
PMI's short-term borrowings, consisting of bank loans to certain PMI subsidiaries at March 31,June 30, 2018 and December 31, 2017, had a carrying value of $608592 million and $499 million, respectively. The fair value of PMI’s short-term borrowings, based on current market interest rates, approximates carrying value.
Long-term Debt:
At March 31, 2018 and December 31, 2017, PMI’s long-term debt consisted of the following:
|
| | | | | | | | |
| (in millions) | | March 31, 2018 | | December 31, 2017 |
| U.S. dollar notes, 1.375% to 6.375% (average interest rate 3.566%), due through 2044 | | $ | 23,294 |
| | $ | 23,291 |
|
| Foreign currency obligations: | | | | |
| Euro notes, 0.625% to 3.125% (average interest rate 2.250%), due through 2037 | | 9,348 |
| | 8,997 |
|
| Swiss franc notes, 0.750% to 2.000% (average interest rate 1.269%), due through 2024 | | 1,418 |
| | 1,376 |
|
| Other (average interest rate 3.378%), due through 2024 | | 180 |
| | 176 |
|
| | | 34,240 |
| | 33,840 |
|
| Less current portion of long-term debt | | 4,662 |
| | 2,506 |
|
| | | $ | 29,578 |
| | $ | 31,334 |
|
Philip Morris International Inc. and Subsidiaries
Notes to Condensed Consolidated Financial Statements
(Unaudited)
Long-term Debt:
At June 30, 2018 and December 31, 2017, PMI’s long-term debt consisted of the following:
|
| | | | | | | | |
| (in millions) | | June 30, 2018 | | December 31, 2017 |
| U.S. dollar notes, 1.375% to 6.375% (average interest rate 3.324%), due through 2044 | | $ | 20,801 |
| | $ | 23,291 |
|
| Foreign currency obligations: | | | | |
| Euro notes, 0.625% to 3.125% (average interest rate 2.250%), due through 2037 | | 8,748 |
| | 8,997 |
|
| Swiss franc notes, 0.750% to 2.000% (average interest rate 1.269%), due through 2024 | | 1,353 |
| | 1,376 |
|
| Other (average interest rate 3.442%), due through 2024 | | 171 |
| | 176 |
|
| | | 31,073 |
| | 33,840 |
|
| Less current portion of long-term debt | | 3,025 |
| | 2,506 |
|
| | | $ | 28,048 |
| | $ | 31,334 |
|
Other foreign currency debt above includes mortgage debt in Switzerland and capital lease obligations at March 31,June 30, 2018 and December 31, 2017.
Credit Facilities:
On January 29, 2018, PMI entered into an agreement to extend the term of its $2.0 billion 364-day revolving credit facility from February 6, 2018, to February 5, 2019.
At March 31,June 30, 2018, PMI's total committed credit facilities were as follows:
(in billions)
|
| | | | |
Type | | Committed Credit Facilities |
| 364-day revolving credit, expiring February 5, 2019 | | $ | 2.0 |
|
| Multi-year revolving credit, expiring February 28, 2021 | | 2.5 |
|
| Multi-year revolving credit, expiring October 1, 2022 | | 3.5 |
|
| Total facilities | | $ | 8.0 |
|
At March 31,June 30, 2018, there were no borrowings under these committed credit facilities, and the entire committed amounts were available for borrowing.
Note 11. Fair Value Measurements:
The authoritative guidance defines fair value as the exchange price that would be received for an asset or paid to transfer a liability (an exit price) in the principal or most advantageous market for the asset or liability in an orderly transaction between market participants on the measurement date. The guidance also establishes a fair value hierarchy, which requires an entity to maximize the use of observable inputs and minimize the use of unobservable inputs when measuring fair value. The guidance describes three levels of input that may be used to measure fair value, which are as follows:
| |
| Level 1 - | Quoted prices in active markets for identical assets or liabilities; |
Philip Morris International Inc. and Subsidiaries
Notes to Condensed Consolidated Financial Statements
(Unaudited)
| |
| Level 2 - | Observable inputs other than Level 1 prices, such as quoted prices for similar assets or liabilities; quoted prices in markets that are not active; or other inputs that are observable or can be corroborated by observable market data for substantially the full term of the assets or liabilities; and |
| |
| Level 3 - | Unobservable inputs that are supported by little or no market activity and that are significant to the fair value of the assets or liabilities. |
PMI's policy is to reflect transfers between hierarchy levels at the end of the reporting period.
Equity Securities
The fair value of PMI’s equity securities, which are determined by using quoted prices in active markets, have been classified within Level 1.
Derivative Financial Instruments
PMI assesses the fair value of its foreign exchange contracts and interest rate contracts using standard valuation models that use, as their basis, readily observable market inputs. The fair value of PMI’s foreign exchange forward contracts is determined by using the prevailing foreign exchange spot rates and interest rate differentials, and the respective maturity dates of the instruments. The fair value of PMI’s currency options is determined by using a Black-Scholes methodology based on foreign exchange spot rates
Philip Morris International Inc. and Subsidiaries
Notes to Condensed Consolidated Financial Statements
(Unaudited)
and interest rate differentials, currency volatilities and maturity dates. PMI’s derivative financial instruments have been classified within Level 2 in the table shown below. See Note 5. Financial Instruments for additional discussion of derivative financial instruments.
Debt
The fair value of PMI’s outstanding debt, which is utilized solely for disclosure purposes, is determined using quotes and market interest rates currently available to PMI for issuances of debt with similar terms and remaining maturities. The aggregate carrying value of PMI’s debt, excluding short-term borrowings and $27 million of capital lease obligations, was $34,213 million at March 31, 2018. The fair value of PMI’s outstanding debt, excluding the aforementioned short-term borrowings and capital lease obligations, was classified within Level 1 and Level 2 in the table shown below.
The aggregate fair values of PMI’s equity securities, derivative financial instruments and debt as of March 31, 2018, were as follows:
|
| | | | | | | | | | | | | | | | |
| (in millions) | | Fair Value at March 31, 2018 | | Quoted Prices
in Active
Markets for
Identical
Assets/Liabilities
(Level 1) | | Significant
Other
Observable
Inputs
(Level 2) | | Significant
Unobservable
Inputs
(Level 3) |
| Assets: | | | | | | | | |
| Equity securities | | $ | 272 |
| | $ | 272 |
| | $ | — |
| | $ | — |
|
| Foreign exchange contracts | | 114 |
| | — |
| | 114 |
| | — |
|
| Total assets | | $ | 386 |
| | $ | 272 |
| | $ | 114 |
| | $ | — |
|
| Liabilities: | | | | | | | | |
| Debt | | $ | 35,464 |
| | $ | 35,293 |
| | $ | 171 |
| | $ | — |
|
| Foreign exchange contracts | | 1,757 |
| | — |
| | 1,757 |
| | — |
|
| Total liabilities | | $ | 37,221 |
| | $ | 35,293 |
| | $ | 1,928 |
| | $ | — |
|
Note 12. Accumulated Other Comprehensive Losses:
PMI’s accumulated other comprehensive losses, net of taxes, consisted of the following:
|
| | | | | | | | | | | | |
| (in millions) | | At March 31, 2018 | | At December 31, 2017 | | At March 31, 2017 |
| Currency translation adjustments | | $ | (6,097 | ) | | $ | (5,761 | ) | | $ | (5,783 | ) |
| Pension and other benefits | | (2,766 | ) | | (2,816 | ) | | (3,509 | ) |
| Derivatives accounted for as hedges | | (20 | ) | | 42 |
| | 27 |
|
| Total accumulated other comprehensive losses | | $ | (8,883 | ) | | $ | (8,535 | ) | | $ | (9,265 | ) |
Reclassifications from Other Comprehensive Earnings
The movements in accumulated other comprehensive losses and the related tax impact, for each of the components above, that are due to current period activity and reclassifications to the income statement are shown on the condensed consolidated statements of comprehensive earnings for the three months ended March 31,2018 and 2017. For additional information, see Note 3. Benefit Plans and Note 5. Financial Instruments for disclosures related to PMI's pension and other benefits, and derivative financial instruments, respectively.
Philip Morris International Inc. and Subsidiaries
Notes to Condensed Consolidated Financial Statements
(Unaudited)
Note 13. Balance Sheet Offsetting:
Derivative Financial Instruments
PMI assesses the fair value of its foreign exchange contracts and interest rate contracts using standard valuation models that use, as their basis, readily observable market inputs. The fair value of PMI’s foreign exchange forward contracts is determined by using the prevailing foreign exchange spot rates and interest rate differentials, and the respective maturity dates of the instruments. The fair value of PMI’s currency options is determined by using a Black-Scholes methodology based on foreign exchange spot rates and interest rate differentials, currency volatilities and maturity dates. PMI’s derivative financial instruments have been classified within Level 2 in the table shown below. See Note 5. Financial Instruments for additional discussion of derivative financial instruments.
Debt
The fair value of PMI’s outstanding debt, which is utilized solely for disclosure purposes, is determined using quotes and market interest rates currently available to PMI for issuances of debt with similar terms and remaining maturities. The aggregate carrying value of PMI’s debt, excluding short-term borrowings and $26 million of capital lease obligations, was $31,047 million at June 30, 2018. The fair value of PMI’s outstanding debt, excluding the aforementioned short-term borrowings and capital lease obligations, was classified within Level 1 and Level 2 in the table shown below.
The aggregate fair values of PMI’s equity securities, derivative financial instruments and debt as of June 30, 2018, were as follows:
|
| | | | | | | | | | | | | | | | |
| (in millions) | | Fair Value at June 30, 2018 | | Quoted Prices
in Active
Markets for
Identical
Assets/Liabilities
(Level 1) | | Significant
Other
Observable
Inputs
(Level 2) | | Significant
Unobservable
Inputs
(Level 3) |
| Assets: | | | | | | | | |
| Equity securities | | $ | 248 |
| | $ | 248 |
| | $ | — |
| | $ | — |
|
| Foreign exchange contracts | | 344 |
| | — |
| | 344 |
| | — |
|
| Total assets | | $ | 592 |
| | $ | 248 |
| | $ | 344 |
| | $ | — |
|
| Liabilities: | | | | | | | | |
| Debt | | $ | 31,653 |
| | $ | 31,491 |
| | $ | 162 |
| | $ | — |
|
| Foreign exchange contracts | | 860 |
| | — |
| | 860 |
| | — |
|
| Total liabilities | | $ | 32,513 |
| | $ | 31,491 |
| | $ | 1,022 |
| | $ | — |
|
Philip Morris International Inc. and Subsidiaries
Notes to Condensed Consolidated Financial Statements
(Unaudited)
Note 12. Accumulated Other Comprehensive Losses:
PMI’s accumulated other comprehensive losses, net of taxes, consisted of the following:
|
| | | | | | | | | | | | |
| (in millions) | | At June 30, 2018 | | At December 31, 2017 | | At June 30, 2017 |
| Currency translation adjustments | | $ | (6,229 | ) | | $ | (5,761 | ) | | $ | (5,658 | ) |
| Pension and other benefits | | (2,716 | ) | | (2,816 | ) | | (3,454 | ) |
| Derivatives accounted for as hedges | | 37 |
| | 42 |
| | 42 |
|
| Total accumulated other comprehensive losses | | $ | (8,908 | ) | | $ | (8,535 | ) | | $ | (9,070 | ) |
Reclassifications from Other Comprehensive Earnings
The movements in accumulated other comprehensive losses and the related tax impact, for each of the components above, that are due to current period activity and reclassifications to the income statement are shown on the condensed consolidated statements of comprehensive earnings for the six months and three months ended June 30,2018 and 2017. For additional information, see Note 3. Benefit Plans and Note 5. Financial Instruments for disclosures related to PMI's pension and other benefits, and derivative financial instruments, respectively.
Note 13. Balance Sheet Offsetting:
Derivative Financial Instruments
PMI uses foreign exchange contracts and interest rate contracts to mitigate its exposure to changes in exchange and interest rates from third-party and intercompany actual and forecasted transactions. Substantially all of PMI's derivative financial instruments are subject to master netting arrangements, whereby the right to offset occurs in the event of default by a participating party. While these contracts contain the enforceable right to offset through close-out netting rights, PMI elects to present them on a gross basis in the condensed consolidated balance sheets. Collateral associated with these arrangements is in the form of cash and is unrestricted. See Note 5. Financial Instruments for disclosures related to PMI's derivative financial instruments.
The effects of these derivative financial instrument assets and liabilities on PMI's condensed consolidated balance sheets were as follows:
|
| | | | | | | | | | | | | | | | | | | |
| | (in millions) | Gross Amounts Recognized | Gross Amount Offset in the Condensed Consolidated Balance Sheet | Net Amounts Presented in the Condensed Consolidated Balance Sheet | Gross Amounts Not Offset in the Condensed Consolidated Balance Sheet | |
| | Financial Instruments | Cash Collateral Received/Pledged | Net Amount |
| |
| | | | | | | | |
| | At March 31, 2018 | | | | | | |
| | Assets | | | | | | |
| | Foreign exchange contracts | $ | 114 |
| $ | — |
| $ | 114 |
| $ | (25 | ) | $ | (68 | ) | $ | 21 |
|
| | Liabilities | | | | | | |
| | Foreign exchange contracts | $ | 1,757 |
| $ | — |
| $ | 1,757 |
| $ | (25 | ) | $ | (1,719 | ) | $ | 13 |
|
| | At December 31, 2017 | | | | | | |
| | Assets | | | | | | |
| | Foreign exchange contracts | $ | 140 |
| $ | — |
| $ | 140 |
| $ | (50 | ) | $ | (78 | ) | $ | 12 |
|
| | Liabilities | | | | | | |
| | Foreign exchange contracts | $ | 1,128 |
| $ | — |
| $ | 1,128 |
| $ | (50 | ) | $ | (1,004 | ) | $ | 74 |
|
|
| | | | | | | | | | | | | | | | | | | |
| | (in millions) | Gross Amounts Recognized | Gross Amount Offset in the Condensed Consolidated Balance Sheet | Net Amounts Presented in the Condensed Consolidated Balance Sheet | Gross Amounts Not Offset in the Condensed Consolidated Balance Sheet | |
| | Financial Instruments | Cash Collateral Received/Pledged | Net Amount |
| |
| | | | | | | | |
| | At June 30, 2018 | | | | | | |
| | Assets | | | | | | |
| | Foreign exchange contracts | $ | 344 |
| $ | — |
| $ | 344 |
| $ | (149 | ) | $ | (162 | ) | $ | 33 |
|
| | Liabilities | | | | | | |
| | Foreign exchange contracts | $ | 860 |
| $ | — |
| $ | 860 |
| $ | (149 | ) | $ | (698 | ) | $ | 13 |
|
| | At December 31, 2017 | | | | | | |
| | Assets | | | | | | |
| | Foreign exchange contracts | $ | 140 |
| $ | — |
| $ | 140 |
| $ | (50 | ) | $ | (78 | ) | $ | 12 |
|
| | Liabilities | | | | | | |
| | Foreign exchange contracts | $ | 1,128 |
| $ | — |
| $ | 1,128 |
| $ | (50 | ) | $ | (1,004 | ) | $ | 74 |
|
Philip Morris International Inc. and Subsidiaries
Notes to Condensed Consolidated Financial Statements
(Unaudited)
Note 14. Investments in Unconsolidated Subsidiaries:
At March 31,June 30, 2018 and December 31, 2017, PMI had total investments in unconsolidated subsidiaries of $1,098$1,051 million and $1,074 million, respectively, which were accounted for under the equity method of accounting. Equity method investments are initially recorded at cost. Under the equity method of accounting, the investment is adjusted for PMI's proportionate share of earnings or losses, dividends, capital contributions and movements in currency translation adjustments. The carrying value of our equity method investments at March 31,June 30, 2018 and December 31, 2017 exceeded our share of the unconsolidated subsidiaries' book value by $932$874 million and $927 million, respectively. The difference between the investment carrying value and the amount of underlying equity in net assets, excluding $879$826 million and $873 million attributable to goodwill as of March 31,June 30, 2018 and December 31, 2017, respectively, is being amortized on a straight-line basis over the underlying assets' estimated useful lives of 10 to 20 years. At March 31,June 30, 2018 and December 31, 2017, PMI received year-to-date dividends from unconsolidated subsidiaries of $10$23 million and $120 million, respectively.
PMI holds a 49% equity interest in United Arab Emirates-based Emirati Investors-TA (FZC) (“EITA”). PMI holds an approximate 25% economic interest in Société des Tabacs Algéro-Emiratie (“STAEM”), an Algerian joint venture that is 51% owned by EITA and 49% by the Algerian state-owned enterprise Management et Développement des Actifs et des Ressources Holding (MADAR Holding)("MADAR Holding"), formerly known as Société Nationale des Tabacs et Allumettes SpA. STAEM manufactures and distributes under license some of PMI’s brands.
Philip Morris International Inc. and Subsidiaries
Notes to Condensed Consolidated Financial Statements
(Unaudited)
PMI holds a 23% equity interest in Megapolis Distribution BV, the holding company of CJSC TK Megapolis, PMI's distributor in Russia.
The initial investments in EITA and Megapolis Distribution BV were recorded at cost and are included in investments in unconsolidated subsidiaries and equity securities on the condensed consolidated balance sheets.
PMI’s earnings activity from unconsolidated subsidiaries was as follows:
| | | | For the Three Months Ended March 31, | For the Six Months Ended June 30, | | For the Three Months Ended June 30, |
| (in millions) | 2018 | 2017 | 2018 | 2017 | | 2018 | 2017 |
| Net revenues | $ | 923 |
| $ | 840 |
| $ | 2,162 |
| $ | 2,093 |
| | $ | 1,239 |
| $ | 1,253 |
|
PMI’s balance sheet activity related to unconsolidated subsidiaries was as follows:
| | | (in millions) | | At March 31, 2018 | At December 31, 2017 | | At June 30, 2018 | At December 31, 2017 |
| | | | | |
| Receivables | | $ | 471 |
| $ | 293 |
| | $ | 491 |
| $ | 293 |
|
The activity primarily related to agreements with PMI’s unconsolidated subsidiaries within the Eastern Europe segment and the Middle East & Africa segment. These agreements, which are in the ordinary course of business, are primarily for distribution, contract manufacturing and licenses. PMI eliminated its respective share of all significant intercompany transactions with the equity method investees.
Note 15. Sale of Accounts Receivable:
To mitigate risk and enhance cash and liquidity management PMI sells trade receivables to unaffiliated financial institutions. These arrangements allow PMI to sell, on an ongoing basis, certain trade receivables without recourse. The trade receivables sold are generally short-term in nature and are removed from the condensed consolidated balance sheets. PMI sells trade receivables under two types of arrangements, servicing and non-servicing. For servicing arrangements, PMI continues to service the sold trade receivables on an administrative basis and does not act on behalf of the unaffiliated financial institutions. When applicable, a servicing liability is recorded for the estimated fair value of the servicing. The amounts associated with the servicing liability were not material as of March 31,June 30, 2018 and March 31,June 30, 2017. Under the non-servicing arrangements, PMI does not provide any administrative support or servicing after the trade receivables have been sold to the unaffiliated financial institutions.
Philip Morris International Inc. and Subsidiaries
Notes to Condensed Consolidated Financial Statements
(Unaudited)
Cumulative trade receivables sold, including excise taxes, for the threesix months ended March 31,June 30, 2018 and 2017, were $2,509 million$5.3 billion and $2,092 million,$4.5 billion, respectively. PMI’s operating cash flows were positively impacted by the amount of the trade receivables sold and derecognized from the condensed consolidated balance sheets, which remained outstanding with the unaffiliated financial institutions. The trade receivables sold that remained outstanding under these arrangements as of March 31,June 30, 2018 and March 31,June 30, 2017, were $878 million,$0.6 billion, and $561 million,$0.6 billion, respectively. The net proceeds received are included in cash provided by operating activities in the condensed consolidated statements of cash flows. The difference between the carrying amount of the trade receivables sold and the sum of the cash received is recorded as a loss on sale of trade receivables within marketing, administration and research costs in the condensed consolidated statements of earnings. For the six months and three months ended March 31,June 30, 2018 and 2017, the loss on sale of trade receivables was immaterial.
Philip Morris International Inc. and Subsidiaries
Notes to Condensed Consolidated Financial Statements
(Unaudited)
Note 16. Product Warranty:
PMI's IQOS devices are subject to standard product warranties generally for a period of 12 months from the date of purchase or such other periods as required by law. PMI generally provides in cost of sales for the estimated cost of warranty in the period the related revenue is recognized. PMI assesses the adequacy of its accrued product warranties and adjusts the amounts as necessary based on actual experience and changes in future estimates. Factors that affect product warranties may vary across markets but typically include product failure rates, logistics and service delivery costs, and warranty policies. PMI accounts for its product warranties within other accrued liabilities. At March 31,June 30, 2018 and December 31, 2017, these amounts were as follows:
| | | | For the Three Months Ended | For the Year Ended | For the Six Months Ended | For the Year Ended |
| (in millions) | March 31, 2018 | December 31, 2017 | June 30, 2018 | December 31, 2017 |
| Balance at beginning of period | $ | 71 |
| $ | 51 |
| $ | 71 |
| $ | 51 |
|
| Changes due to: | | |
| Warranties issued | 76 |
| 168 |
| 121 |
| 168 |
|
| Settlements | (54 | ) | (148 | ) | (87 | ) | (148 | ) |
| Currency | 1 |
| — |
| |
| Balance at end of period | $ | 94 |
| $ | 71 |
| $ | 105 |
| $ | 71 |
|
Note 17. Acquisitions:
On March 21, 2018, PMI acquired the remaining 49% interest in Tabacalera Costarricense, S.A. and Mendiola y Compañía, S.A. for a net purchase price of $95 million, which includes $2 million of contingent consideration. As a result, PMI now owns 100% of these Costa Rican affiliates. The purchase of the remaining 49% interest resulted in a decrease to PMI’s additional paid-in capital of $86 million.
Note 18. New Accounting Standards:
Recently adopted
On January 1, 2018, PMI adopted Financial Accounting Standards Update ASU 2014-09, “Revenue from Contracts with Customers” (“ASU 2014-09”). ASU 2014-09 contains principles that an entity will need to apply to determine the measurement of revenue and timing of when it is recognized. The underlying principle is that an entity will recognize revenue to depict the transfer of promised goods or services to customers in an amount that reflects the consideration to which the entity expects to be entitled to in exchange for these goods or services. PMI adopted ASU 2014-09 retrospectively to each prior period presented. PMI elected this transition method solely to reflect the change in excise tax presentation in all prior periods presented resulting from PMI’s accounting policy election to exclude excise taxes collected from customers from the measurement of the transaction price, thereby presenting revenues, net of excise taxes. Based on PMI’s assessment, the underlying principles of the new standard, relating to the measurement of revenue and the timing of recognition, are closely aligned with PMI’s current business model and practices. As a result, the adoption of ASU 2014-09 did not have a material impact on the consolidated financial position or results of operations.
The adoption of ASU 2014-09 resulted in the following change for net revenues to reflect the net presentation for revenues, excluding excise taxes, for the three months ended March 31, 2017:
|
| | | | | | | | | | |
| (in millions) | For the Three Months Ended March 31, 2017
|
| Net Revenues: | | | | |
| | As reported | | Retrospective Adoption |
| | Net revenues | Excises taxes | | Net revenues |
| | $ | 16,556 |
| $ | 10,492 |
| | $ | 6,064 |
|
Philip Morris International Inc. and Subsidiaries
Notes to Condensed Consolidated Financial Statements
(Unaudited)
The adoption of ASU 2014-09 resulted in the following changes for net revenues to reflect the net presentation for revenues, excluding excise taxes, for the six months and three months ended June 30, 2017:
|
| | | | | | | | | | | | | | | | | | | | | |
| (in millions) | For the Six Months Ended June 30, 2017 | | For the Three Months Ended June 30, 2017 |
| Net Revenues: | | | | | | | | | |
| | As reported | | Retrospective Adoption | | As reported | | Retrospective Adoption |
| | Net revenues | Excises taxes | | Net
revenues | | Net revenues | Excises taxes | | Net revenues |
| | $ | 35,875 |
| $ | 22,894 |
| | $ | 12,981 |
| | $ | 19,319 |
| $ | 12,402 |
| | $ | 6,917 |
|
The change in presentation of net revenues also impacts segment disclosure requirements, primarily information for significant customers and geographic areas. While there is no change in the underlying business or customers, the amounts used to calculate what is disclosed are different following the change in presentation of revenues net of excise taxes and the associated segment revenues. Prior to this change, revenues including excise taxes were the basis for determining if sales to a customer or in a foreign country met the thresholds for disclosure. On the basis of revenues including excise taxes and due to the fact that PMI is not responsible for collecting excise taxes in certain markets, no customers met the requirements for disclosure. On this basis, net revenues attributable to customers located in PMI’s largest markets in terms of net revenues, namely Indonesia ($8.0 billion and $7.7 billion in 2017 and 2016, respectively) and Germany ($7.2 billion and $7.1 billion in 2017 and 2016, respectively) were included as part of segment disclosures.
Following the change in presentation and using net revenues excluding excise taxes as the basis for determining the disclosures, PMI had one customer in the East Asia & Australia segment (16% and 11% of PMI’s consolidated net revenues in 2017 and 2016, respectively) and one customer in the European Union segment (10% and 11% of PMI’s consolidated net revenues in 2017 and 2016, respectively) that meet the requirements for disclosure. Additionally, on this basis, the only foreign countries meeting the disclosure requirements are PMI’s markets in Japan ($4.7 billion and $2.8 billion in 2017 and 2016, respectively) and Indonesia ($3.2 billion and $3.2 billion in 2017 and 2016, respectively).
PMI disaggregates its net revenue from contracts with customers by both geographic location and product category for each of PMI's six reportable segments, as PMI believes this best depicts how the nature, amount, timing and uncertainty of its revenue and cash flows are affected by economic factors. For further details, see Note 7. Segment Reporting.
PMI recognizes revenue primarily through the manufacture and sale of cigarettes and other nicotine-containing products, including reduced-risk products. The majority of PMI revenues are generated by sales through direct and indirect distribution networks with short-term payment conditions and where control is typically transferred to the customer either upon shipment or delivery of goods. PMI evaluates the transfer of control through evidence of the customer’s receipt and acceptance, transfer of title, PMI’s right to payment for those products and the customer’s ability to direct the use of those products upon receipt. Typically, PMI’s performance obligations are satisfied and revenue is recognized either upon shipment or delivery of goods. In certain instances, PMI facilitates shipping and handling activities after control has transferred to the customer. PMI has elected to record all shipping and handling activities as costs to fulfill a contract and such costs, which have not been incurred at the time revenue is recognized, are accrued. For the threesix months ended March 31,June 30, 2018 and 2017, PMI did not have any material contract assets or contract liabilities. For further details on PMI’s performance obligations see Note 16. Product Warranty.
On January 1, 2018, PMI adopted Financial Accounting Standard Update ASU 2016-01, “Financial Instruments - Overall (Subtopic 825-10): Recognition and Measurement of Financial Assets and Financial Liabilities” (“ASU 2016-01”), on a prospective basis. ASU 2016-01 requires equity investments (except those accounted for under the equity method of accounting, or those that result in consolidation of the investee) to be measured at fair value with changes in fair value recognized in net income. Additionally, ASU 2016-01 also changed certain disclosure requirements and other aspects of current U.S. GAAP. PMI identified certain cost investments, which are applicable to ASU 2016-01 requiring them to be measured at fair value with the changes in fair value recognized in net income. At January 1, 2018, the cumulative effect of this change resulted in an increase to investments in unconsolidated subsidiaries and equity securities, deferred income tax liability and earnings reinvested in the business of $301 million, $63 million and $238 million, respectively.
Philip Morris International Inc. and Subsidiaries
Notes to Condensed Consolidated Financial Statements
(Unaudited)
Recently issued
On February 25, 2016, the Financial Accounting Standards Board (“FASB”) issued Accounting Standards Update ASU 2016-02, “Leases” (“ASU 2016-02”). ASU 2016-02 requires organizations that lease assets to recognize on the balance sheet the assets and liabilities for the rights and obligations created by those leases. Additionally, ASU 2016-02 modifies current guidance for lessors' accounting. ASU 2016-02 is effective for interim and annual reporting periods beginning on or after January 1, 2019, with early adoption permitted. PMI has identified its lease management system to be used upon adoption and is in the process of identifying and evaluating the applicable leases. PMI expects, upon adoption, to recognize lease liabilities and the corresponding right-of-use assets (at the present value of future payments) for predominately all of its future minimum commitments under operating leases in place at that time. Such future minimum commitments at December 31, 2017 amounted to $849 million on an undiscounted basis. PMI is currently assessing the impact that the adoption of ASU 2016-02 will have on its financial position andstatements but does not expect it to have a material impact on its results of operations.operations or cash flows.
Item 2.
MANAGEMENT’S DISCUSSION AND ANALYSIS OF
FINANCIAL CONDITION AND RESULTS OF OPERATIONS
Description of Our Company
We are a leading international tobacco company engaged in the manufacture and sale of cigarettes and other nicotine-containing products in markets outside the United States of America. We are building our future on smoke-free products that are a much better consumer choice than continuing to smoke cigarettes. Through multidisciplinary capabilities in product development, state-of-the-art facilities and scientific substantiation, we aim to ensure that our smoke-free products meet adult consumer preferences and rigorous regulatory requirements. Our vision is that these products ultimately replace cigarettes to the benefit of adult smokers, society, our company and our shareholders.
Our cigarettes are sold in more than 180 markets, and in many of these markets they hold the number one or number two market share position. We have a wide range of premium, mid-price and low-price brands. Our portfolio comprises both international and local brands. In addition to the manufacture and sale of cigarettes, we are engaged in the development and commercialization of reduced-risk products ("RRPs"). RRPs is the term we use to refer to products that present, are likely to present, or have the potential to present less risk of harm to smokers who switch to these products versus continued smoking. We have a range of RRPs in various stages of development, scientific assessment and commercialization. Because our RRPs do not burn tobacco, they produce an aerosol that contains far lower quantities of harmful and potentially harmful constituents than found in cigarette smoke.
To provide a greater focus on both parts of our business -- combustible and reduced-risk products -- and to support our transformation toward a smoke-free future, effective January 1, 2018, we began managing our business in six reportable segments as follows:
European Union ("EU");
Eastern Europe ("EE");
Middle East & Africa ("ME&A"), which includes our international duty free business;
South & Southeast Asia ("S&SA");
East Asia & Australia ("EA&A"); and
Latin America & Canada ("LA&C").
We use the term net revenues to refer to our operating revenues from the sale of our products, including shipping and handling charges billed to customers, net of sales and promotion incentives, and excise taxes. As discussed in Note 18. New Accounting Standards, on January 1, 2018, we adopted Financial Accounting Standards Update ASU 2014-09, "Revenue from Contracts with Customers." We adopted this standard retrospectively to each prior period presented. We made an accounting policy election to exclude excise taxes collected from customers from the measurement of the transaction price, thereby presenting revenues, net of excise taxes in all prior periods. Our net revenues and operating income are affected by various factors, including the volume of products we sell, the price of our products, changes in currency exchange rates and the mix of products we sell. Mix is a term used to refer to the proportionate value of premium-price brands to mid-price or low-price brands in any given market (product mix). Mix can also refer to the proportion of shipment volume in more profitable markets versus shipment volume in less profitable markets (geographic mix).
Our cost of sales consists principally of: tobacco leaf, non-tobacco raw materials, labor and manufacturing costs; shipping and handling costs; and the cost of the IQOS devices produced by third-party electronics manufacturing service providers. Estimated costs associated with IQOS warranty programs are generally provided for in cost of sales in the period the related revenues are recognized.
Our marketing, administration and research costs include the costs of marketing and selling our products, other costs generally not related to the manufacture of our products (including general corporate expenses), and costs incurred to develop new products. The most significant components of our marketing, administration and research costs are marketing and sales expenses and general and administrative expenses.
Philip Morris International Inc. is a legal entity separate and distinct from its direct and indirect subsidiaries. Accordingly, our right, and thus the right of our creditors and stockholders, to participate in any distribution of the assets or earnings of any subsidiary is subject to the prior rights of creditors of such subsidiary, except to the extent that claims of our company itself as a creditor may
be recognized. As a holding company, our principal sources of funds, including funds to make payment on our debt securities, are from the receipt of dividends and repayment of debt from our subsidiaries. Our principal wholly-owned and majority-owned subsidiaries currently are not limited by long-term debt or other agreements in their ability to pay cash dividends or to make other distributions with respect to their common stock.
Executive Summary
The following executive summary provides significant highlights from the "Discussion and Analysis" that follows.
Consolidated Operating Results for the ThreeSix Months Ended March 31,June 30, 2018
Net Revenues - Net revenues of $14.6 billion for the six months ended June 30, 2018 increased by $1.6 billion, or 12.6%, from the comparable 2017 amount. The change in our net revenues for the three months ended March 31,2018, from the comparable 2017 amounts, were as follows:amount was driven by the following:
|
| | | | | | | | | | | | | | | | | | | | | | | | |
| | For the Three Months Ended March 31, | | Change
Fav./(Unfav.) | | Variance
Fav./(Unfav.) |
| (in millions) | 2018 | 2017 | | Total | Excluding Currency | | Total | Currency | Price | Volume/Mix |
| Net revenues | $ | 6,896 |
| $ | 6,064 |
| | 13.7 | % | 8.3 | % | | $ | 832 |
| $ | 327 |
| $ | 342 |
| $ | 163 |
|
DuringFor the quarter,six months ended June 30, 2018, net revenues, excluding favorable currency, increased by 8.3%, driven byprimarily reflecting a favorable pricing variance, from all Regions, notablydriven by EU, EE, S&SA and LA&C, including higher IQOS device sales, mainly in EA&A, as well as favorable volume/mix, driven primarily by EA&A, despite the unfavorable impact of the tax-driven cigarette industrynotably lower volume decline and related down-trading in the Gulf Cooperation Council ("GCC"), principally Saudi Arabia. and lower mix in Indonesia and lower volume/mix in Russia.
Net revenues include $1,127 million inby product category for the six months ended June 30, 2018 and $435 million in 2017 related to the sale of RRPs.are shown below:
Diluted Earnings Per Share - The changes in our reported diluted earnings per share ("(“diluted EPS"EPS”) for the threesix months ended March 31,June 30, 2018, from the comparable 2017 amounts, were as follows:
| | | | | Diluted EPS | | % Growth (Decline) | | Diluted EPS | | % Growth (Decline) |
| For the three months ended March 31, 2017 | | $ | 1.02 |
| | | |
| For the six months ended June 30, 2017 | | | $ | 2.17 |
| | |
| 2017 Asset impairment and exit costs | | — |
| | | | — |
| | |
| 2017 Tax items | | (0.04 | ) | | | | (0.04 | ) | | |
| Subtotal of 2017 items | | (0.04 | ) | | | | (0.04 | ) | | |
| 2018 Asset impairment and exit costs | | — |
| | | | — |
| | |
| 2018 Tax items | | — |
| | | | — |
| | |
| Subtotal of 2018 items | | — |
| | | | — |
| | |
| Currency | | 0.03 |
| | | | 0.07 |
| | |
| Interest | | — |
| | | | 0.03 |
| | |
| Change in tax rate | | 0.03 |
| | | | 0.13 |
| | |
| Operations | | (0.04 | ) | | | | 0.05 |
| | |
| For the three months ended March 31, 2018 | | $ | 1.00 |
| | (2.0 | )% | |
| For the six months ended June 30, 2018 | | | $ | 2.41 |
| | 11.1 | % |
Income Taxes – Our effective income tax rate for the threesix months ended March 31, June 30,2018 increaseddecreased by 0.62.8 percentage points to 25.5%23.5%. The 2017 tax item that increased our diluted EPS in 2017 by $0.04 per share in the table above was due to a legal entity restructuring ($61 million). The change in the effective tax rate that increased our diluted EPS by $0.03$0.13 per share in the table above was primarily due to the Tax Cuts and Jobs Act. For further details, see Note 9. Income Taxes.
Currency – The favorable currency impact during the reporting period results from the fluctuations of the U.S. dollar, especially against the Euro and Japanese yen, Russian ruble and South Korean won, partially offset by the Argentine peso and Swiss franc.peso. This favorable currency movement has impacted our profitability across our primary revenue markets and local currency cost bases.
Interest – The favorable impact of interest was due primarily to our ongoing efforts to optimize our capital structure following the passage of the Tax Cuts and Jobs Act. This included the decision to use existing cash to repay the principal for our recently matured May 2018 ten-year U.S. bond, which had a coupon of 5.65%.
Operations – The decreaseincrease in diluted EPS of $0.04$0.05 from our operations in the table above was due primarily to the following segments:
European Union: Higher marketing, administration and research costs and unfavorable volume/mix, partially offset by favorable pricing;
Middle East & Africa: Higher marketing, administration and research costs and unfavorable volume/mix, partially offset by favorable pricing; and
Eastern Europe: Unfavorable volume/mix and higher marketing, administration and research costs, partially offset by favorable pricing;
partially offset by
South & Southeast Asia: Favorable pricing and lower manufacturing costs, partially offset by unfavorable volume/mix;
Latin America & Canada: Favorable pricing, partially offset by unfavorable volume/mix, higher manufacturing costs and higher marketing, administration and research costs;
Eastern Europe: Favorable pricing, partially offset by unfavorable volume/mix and higher marketing, administration and research costs; and
East Asia & Australia: Favorable volume/mix and lower manufacturing costs, partially offset by higher marketing, administration and research costs and unfavorable pricing;
partially offset by
Middle East & Africa: Unfavorable pricing, unfavorable volume/mix, higher marketing, administration and research costs, and higher manufacturing costs; and
European Union: Higher marketing, administration and research costs, unfavorable volume/mix, higher manufacturing costs, partially offset by favorable pricing.
Consolidated Operating Results for the Three Months Ended June 30,2018
Net Revenues - Net revenues of $7.7 billion for the three months ended June 30,2018 increased by $809 million, or 11.7%, from the comparable 2017 amount. The change in our net revenues from the comparable 2017 amount was driven by the following:
During the quarter, net revenues, excluding favorable currency, increased by 8.3%, primarily reflecting a favorable pricing variance, driven by EU, EE, S&SA and LA&C, as well as favorable volume/mix, primarily in EA&A, despite the unfavorable impact of notably lower volume in the GCC and lower mix in Indonesia and Russia.
Net revenues by product category for the three months ended June 30, 2018 and 2017 are shown below:
Diluted Earnings Per Share - The changes in our reported diluted EPS for the three months ended June 30,2018, from the comparable 2017 amounts, were as follows:
|
| | | | | | | |
| | | Diluted EPS | | % Growth (Decline) |
| For the three months ended June 30, 2017 | | $ | 1.14 |
| | |
| 2017 Asset impairment and exit costs | | — |
| | |
| 2017 Tax items | | — |
| | |
| Subtotal of 2017 items | | — |
| | |
| 2018 Asset impairment and exit costs | | — |
| | |
| 2018 Tax items | | — |
| | |
| Subtotal of 2018 items | | — |
| | |
| Currency | | 0.04 |
| | |
| Interest | | 0.03 |
| | |
| Change in tax rate | | 0.10 |
| | |
| Operations | | 0.10 |
| | |
| For the three months ended June 30, 2018 | | $ | 1.41 |
| | 23.7 | % |
Income Taxes – Our effective income tax rate for the three months ended June 30, 2018 decreased by 5.4 percentage points to 22.1%. The change in the effective tax rate that increased our diluted EPS by $0.10 per share in the table above was primarily due to the Tax Cuts and Jobs Act. Our effective tax rate in the quarter reflected the impact of a revised full-year effective tax rate estimate of approximately 24%. The reduction compared to our prior full-year estimate of approximately 26% was mainly attributed to further analysis, interpretation and clarification of the scope and impact of the 2017 Tax Cuts and Jobs Act in the U.S. For further details, see Note 9. Income Taxes.
Currency – The favorable currency impact during the reporting period results from the fluctuations of the U.S. dollar, especially against the Euro and Japanese yen, partially offset by the Argentine peso. This favorable currency movement has impacted our profitability across our primary revenue markets and local currency cost bases.
Interest – The favorable impact of interest was due primarily to our ongoing efforts to optimize our capital structure following the passage of the Tax Cuts and Jobs Act. This included the decision to use existing cash to repay the principal for our recently matured May 2018 ten-year U.S. bond, which had a coupon of 5.65%.
Operations – The increase in diluted EPS of $0.10 from our operations in the table above was due primarily to the following segments:
South & Southeast Asia: Favorable pricing and lower manufacturing costs, partially offset by unfavorable volume/mix;
Latin America & Canada: Favorable pricing, partially offset by unfavorable volume/mix, higher manufacturing costs and higher marketing, administration and research costs;
European Union: Favorable pricing and favorable volume/mix, partially offset by higher manufacturing costs and higher marketing, administration and research costs; and
Eastern Europe: Favorable pricing and lower manufacturing costs, partially offset by unfavorable volume/mix;
partially offset by
Middle East & Africa: Unfavorable pricing, higher manufacturing costs and higher marketing, administration and research costs; and
East Asia & Australia: FavorableHigher marketing, administration and research costs and unfavorable pricing, partially offset by favorable volume/mix and lower manufacturing costs and favorable pricing, partially offset by higher marketing, administration and research costs.
For further details, see the “Consolidated Operating Results” and “Operating Results by Business Segment” sections of the following “Discussion and Analysis.”
2018 Forecasted Results - On AprilJuly 19, 2018, we increased, to reflect a lower effective tax rate,revised our 2018 full-year reported diluted EPS forecast to be in a range of $5.25$5.02 to $5.40,$5.12, at prevailing exchange rates at that time, representing a projected increase of approximately 35%29% to 39%32% versus diluted EPS per share of $3.88 in 2017. Excluding a favorablean unfavorable currency impact, at then-prevailing exchange rates, of approximately $0.16,$0.07, the forecast range represents a projected increase of approximately 8% to 11%10% versus adjusted diluted earnings per share of $4.72 in 2017.
2018 Full-Year Forecast Overview & Assumptions
This revised full-year forecast primarily reflects the effect of certain product and marketing initiatives, elements of which were first announced at the Annual Meeting of Shareholders in May 2018, notably:
The worldwide introduction of the next generation of IQOS devices towards the end of 2018, which requires the reduction of current generation device inventories, while the ramp-up of new devices is expected to occur in 2019;
A comprehensive set of new marketing programs in Japan, including the launch in October of a new heated tobacco mainstream-price product line for more price-sensitive consumers.
The forecast is based on the conservative view of a very limited favorable impact from these initiatives in Japan in 2018 (the full favorable effect therefore coming as of the beginning of 2019). Consequently, the forecast assumes that the sequential quarterly growth rate in new Japanese IQOS users for the second half of 2018 will be in line with that of the first half.
As a result, this forecast assumes:
Significant growth in PMI's in-market heated tobacco sales volume, reaching approximately 44 to 45 billion units in 2018;
Heated tobacco unit shipments of approximately 41 to 42 billion units in 2018, including an anticipated full-year inventory reduction -- concentrated in the third quarter of 2018 -- of approximately three billion units due to Japan;
A total cigarette and heated tobacco unit shipment volume decline for PMI of approximately 2% versus an estimated total international volume decline of 2% to 3%;
Currency-neutral net revenue growth of approximately 8.0%3% to 4%, compared to the previously disclosed assumption of approximately 8%, primarily reflecting:
| |
| ◦ | the reduction of inventories and lower-than-anticipated consumer off-take, primarily in Japan, of IQOS devices (representing approximately (2.5) points) and heated tobacco units (representing approximately (2.0) points); |
| |
| ◦ | the impact of moving to highly inflationary accounting in Argentina (representing approximately (0.5) points), as explained in Operating Results by Business Segment - Business Environment - U.S. GAAP Treatment of Argentina as a Highly Inflationary Economy; |
| |
| ◦ | partially offset by higher-than-expected cigarette shipments (representing approximately 0.5 points). |
This forecast further assumes:
A combustible product pricing variance of approximately 7%;
Net incremental investment behind RRPs of approximately $600 million for the full year;
Operating cash flow of over $9.0 billion;approximately $9 billion, subject to currency movements and year-end working capital requirements;
Capital expenditures of approximately $1.5 billion compared to the previously disclosed assumption of $1.7 billion;billion, primarily reflecting lower planned spending on heated tobacco unit manufacturing equipment, driven by increased production efficiency and dual-production flexibility at existing factories, coupled with an adjustment for revised production forecasts;
A full-yearAn effective tax rate of approximately 26%;24%, as described below; and
No share repurchases.
Our 2018 full-year diluted earnings per share forecast assumes a full-year effective tax rate of approximately 26%24%. The reduction in this rate compared to the full-year effective tax rate of 28%26% communicated in FebruaryApril 2018 mainly reflects two factors:
further analysis, interpretation and interpretationclarifications of the scope and impact of the Tax Cuts and Jobs Act, primarily related to foreign tax credit limitations due to the Global Intangible Low Taxed Income provisions of the Tax Cuts and Jobs Act; and
revised foreign income tax estimates due to a change in the mix of our foreign earnings.Act.
The Tax Cuts and Jobs Act has significant complexity, and our final full-year effective tax rate may differ from this assumption, due to, among other things, additional guidance that may be issued by the U.S. Treasury Department and the Internal Revenue Service, related interpretations and clarifications of tax law, and earnings mix by taxing jurisdiction.
We calculated our 2017 adjusted diluted EPS of $4.72 as reported diluted EPS of $3.88 plus the $0.84 per share charge related to tax items (primarily due to the impact of the Tax Cuts and Jobs Act). During 2017, we did not have an EPS impact related to asset impairment and exit costs.
Adjusted diluted EPS is not a measure under generally accepted accounting principles in the United States of America ("U.S. GAAP"). We define adjusted diluted EPS as reported diluted EPS adjusted for asset impairment and exit costs, tax items and unusual items. We believe it is appropriate to disclose this measure as it represents core earnings, improves comparability and helps investors analyze business performance and trends. Adjusted diluted EPS should be considered neither in isolation nor as a substitute for reported diluted EPS prepared in accordance with U.S. GAAP.
This 2018 forecast excludes the impact of any future acquisitions, unanticipated asset impairment and exit cost charges, future changes in currency exchange rates, further developments related to the Tax Cuts and Jobs Act, and any unusual events. The factors described in the "Cautionary"Cautionary Factors That May Affect Future Results"Results" section of the following "Discussion and Analysis" represent continuing risks to these projections.
Discussion and Analysis
Consolidated Operating Results
See pages 63-6879-83 for a discussion of our "Cautionary Factors That May Affect Future Results." Our net revenues and operating income by segment are shown in the table below:
| | | (in millions) | For the Three Months Ended March 31, | For the Six Months Ended June 30, | For the Three Months Ended June 30, |
| | 2018 | 2017 | Change | 2018 | 2017 | 2018 | 2017 |
| Net revenues: | | | |
| European Union | $ | 1,988 |
| $ | 1,740 |
| 14.3 | % | $ | 4,491 |
| $ | 3,850 |
| $ | 2,503 |
| $ | 2,110 |
|
| Eastern Europe | 567 |
| 516 |
| 9.9 | % | 1,327 |
| 1,213 |
| 760 |
| 697 |
|
| Middle East & Africa | 961 |
| 961 |
| — | % | 1,983 |
| 1,939 |
| 1,022 |
| 978 |
|
| South & Southeast Asia | 1,081 |
| 1,031 |
| 4.8 | % | 2,237 |
| 2,077 |
| 1,156 |
| 1,046 |
|
| East Asia & Australia | 1,591 |
| 1,210 |
| 31.5 | % | 3,069 |
| 2,548 |
| 1,478 |
| 1,338 |
|
| Latin America & Canada | 708 |
| 606 |
| 16.8 | % | 1,515 |
| 1,354 |
| 807 |
| 748 |
|
| Net revenues | $ | 6,896 |
| $ | 6,064 |
| 13.7 | % | $ | 14,622 |
| $ | 12,981 |
| $ | 7,726 |
| $ | 6,917 |
|
| Operating income: | | | |
| European Union | $ | 740 |
| $ | 748 |
| (1.1 | )% | $ | 1,917 |
| $ | 1,692 |
| $ | 1,177 |
| $ | 944 |
|
| Eastern Europe | 151 |
| 159 |
| (5.0 | )% | 412 |
| 383 |
| 261 |
| 224 |
|
| Middle East & Africa | 374 |
| 491 |
| (23.8 | )% | 777 |
| 968 |
| 403 |
| 477 |
|
| South & Southeast Asia | 429 |
| 370 |
| 15.9 | % | 869 |
| 689 |
| 440 |
| 319 |
|
| East Asia & Australia | 515 |
| 472 |
| 9.1 | % | 1,013 |
| 982 |
| 498 |
| 510 |
|
| Latin America & Canada | 217 |
| 176 |
| 23.3 | % | 531 |
| 439 |
| 314 |
| 263 |
|
| Operating income | $ | 2,426 |
| $ | 2,416 |
| 0.4 | % | $ | 5,519 |
| $ | 5,153 |
| $ | 3,093 |
| $ | 2,737 |
|
As discussed in Note 7. Segment Reporting, effective January 1, 2018, we began using operating income to evaluate segment performance and allocate resources, replacing operating companies income used previously.
Our net revenues by product category are shown in the table below:
| | PMI Net Revenues by Product Category
| PMI Net Revenues by Product Category
| PMI Net Revenues by Product Category
|
| (in millions) | For the Three Months Ended March 31, | For the Six Months Ended June 30, | For the Three Months Ended June 30, |
| | 2018 | 2017 | Change | 2018 | 2017 | Change | 2018 | 2017 | Change |
| Combustible Products | | | | | | |
| European Union | $ | 1,836 |
| $ | 1,709 |
| 7.4 | % | $ | 4,157 |
| $ | 3,770 |
| 10.3 | % | $ | 2,321 |
| $ | 2,060 |
| 12.6 | % |
| Eastern Europe | 527 |
| 513 |
| 2.8 | % | 1,222 |
| 1,204 |
| 1.5 | % | 695 |
| 691 |
| 0.5 | % |
| Middle East & Africa | 884 |
| 957 |
| (7.7 | )% | 1,794 |
| 1,925 |
| (6.8 | )% | 910 |
| 968 |
| (6.0 | )% |
| South & Southeast Asia | 1,081 |
| 1,031 |
| 4.8 | % | 2,237 |
| 2,077 |
| 7.7 | % | 1,156 |
| 1,046 |
| 10.5 | % |
| East Asia & Australia | 737 |
| 813 |
| (9.4 | )% | 1,559 |
| 1,603 |
| (2.7 | )% | 822 |
| 790 |
| 4.1 | % |
| Latin America & Canada | 704 |
| 605 |
| 16.3 | % | 1,506 |
| 1,353 |
| 11.3 | % | 802 |
| 748 |
| 7.3 | % |
| Total Combustible Products | $ | 5,769 |
| $ | 5,629 |
| 2.5 | % | $ | 12,475 |
| $ | 11,931 |
| 4.6 | % | $ | 6,706 |
| $ | 6,302 |
| 6.4 | % |
| Reduced-Risk Products | | | | | | |
| European Union | $ | 152 |
| $ | 31 |
| +100% |
| $ | 334 |
| $ | 81 |
| +100% |
| $ | 182 |
| $ | 50 |
| +100% |
|
| Eastern Europe | 40 |
| 3 |
| +100% |
| 105 |
| 9 |
| +100% |
| 65 |
| 6 |
| +100% |
|
| Middle East & Africa | 77 |
| 4 |
| +100% |
| 189 |
| 14 |
| +100% |
| 112 |
| 10 |
| +100% |
|
| South & Southeast Asia | — |
| — |
| — | % | — |
| — |
| — | % | — |
| — |
| — | % |
| East Asia & Australia | 854 |
| 396 |
| +100% |
| 1,510 |
| 945 |
| 59.8 | % | 656 |
| 549 |
| 19.6 | % |
| Latin America & Canada | 4 |
| — |
| — | % | 9 |
| 1 |
| +100% |
| 5 |
| 1 |
| +100% |
|
| Total Reduced-Risk Products | $ | 1,127 |
| $ | 435 |
| +100% |
| $ | 2,147 |
| $ | 1,050 |
| +100% |
| $ | 1,020 |
| $ | 615 |
| 65.9 | % |
| | | | | | | |
| Total PMI Net Revenues | $ | 6,896 |
| $ | 6,064 |
| 13.7 | % | $ | 14,622 |
| $ | 12,981 |
| 12.6 | % | $ | 7,726 |
| $ | 6,917 |
| 11.7 | % |
Note: Sum of product categories or Regions might not foot to total PMI due to roundings.
Net revenues related to combustible products refer to the operating revenues generated from the sale of these products, including shipping and handling charges billed to customers, net of sales and promotion incentives, and excise taxes. These net revenue amounts consist of the sale of our cigarettes and other tobacco products combined. Other tobacco products primarily include roll-your-own and make-your-own cigarettes, pipe tobacco, cigars and cigarillos and do not include reduced-risk products.
Net revenues related to reduced-risk products refer to the operating revenues generated from the sale of these products, including shipping and handling charges billed to customers, net of sales and promotion incentives, and excise taxes. These net revenue amounts consist of the sale of our heated tobacco units, IQOS devices and related accessories, and other nicotine-containing products, which primarily include our e-vapor products.
We recognize revenue when control is transferred to the customer, typically either upon shipment or delivery of goods.
Our shipment volume by segment for cigarettes and heated tobacco units is shown in the table below:
| | PMI Shipment Volume (Million Units)
| | | For the Three Months Ended March 31, | For the Six Months Ended June 30, | For the Three Months Ended June 30, |
| | 2018 | 2017 | Change | 2018 | 2017 | Change | 2018 | 2017 | Change |
| Cigarettes | | |
| European Union | 39,671 |
| 42,540 |
| (6.7 | )% | 87,655 |
| 92,298 |
| (5.0 | )% | 47,984 |
| 49,758 |
| (3.6 | )% |
| Eastern Europe | 22,039 |
| 24,596 |
| (10.4 | )% | 50,493 |
| 56,677 |
| (10.9 | )% | 28,454 |
| 32,081 |
| (11.3 | )% |
| Middle East & Africa | 29,248 |
| 31,978 |
| (8.5 | )% | 63,425 |
| 64,311 |
| (1.4 | )% | 34,177 |
| 32,333 |
| 5.7 | % |
| South & Southeast Asia | 40,218 |
| 37,899 |
| 6.1 | % | 85,006 |
| 79,924 |
| 6.4 | % | 44,788 |
| 42,025 |
| 6.6 | % |
| East Asia & Australia | 14,091 |
| 17,243 |
| (18.3 | )% | 29,205 |
| 33,033 |
| (11.6 | )% | 15,114 |
| 15,790 |
| (4.3 | )% |
| Latin America & Canada | 19,013 |
| 19,296 |
| (1.5 | )% | 39,217 |
| 40,849 |
| (4.0 | )% | 20,204 |
| 21,553 |
| (6.3 | )% |
| Total Cigarettes | 164,280 |
| 173,552 |
| (5.3 | )% | 355,001 |
| 367,092 |
| (3.3 | )% | 190,721 |
| 193,540 |
| (1.5 | )% |
| Heated Tobacco Units | | |
| European Union | 928 |
| 184 |
| +100% |
| 2,123 |
| 576 |
| +100% |
| 1,195 |
| 392 |
| +100% |
|
| Eastern Europe | 564 |
| 54 |
| +100% |
| 1,515 |
| 171 |
| +100% |
| 951 |
| 117 |
| +100% |
|
| Middle East & Africa | 709 |
| 51 |
| +100% |
| 1,680 |
| 163 |
| +100% |
| 971 |
| 112 |
| +100% |
|
| South & Southeast Asia | — |
| — |
| — | % | — |
| — |
| — | % | — |
| — |
| — | % |
| East Asia & Australia | 7,342 |
| 4,145 |
| 77.1 | % | 15,180 |
| 9,871 |
| 53.8 | % | 7,838 |
| 5,726 |
| 36.9 | % |
| Latin America & Canada | 23 |
| 1 |
| +100% |
| 55 |
| 4 |
| +100% |
| 32 |
| 3 |
| +100% |
|
| Total Heated Tobacco Units | 9,566 |
| 4,435 |
| +100% |
| 20,553 |
| 10,785 |
| 90.6 | % | 10,987 |
| 6,350 |
| 73.0 | % |
| Cigarettes and Heated Tobacco Units | | |
| European Union | 40,599 |
| 42,724 |
| (5.0 | )% | 89,778 |
| 92,874 |
| (3.3 | )% | 49,179 |
| 50,150 |
| (1.9 | )% |
| Eastern Europe | 22,603 |
| 24,650 |
| (8.3 | )% | 52,008 |
| 56,848 |
| (8.5 | )% | 29,405 |
| 32,198 |
| (8.7 | )% |
| Middle East & Africa | 29,957 |
| 32,029 |
| (6.5 | )% | 65,105 |
| 64,474 |
| 1.0 | % | 35,148 |
| 32,445 |
| 8.3 | % |
| South & Southeast Asia | 40,218 |
| 37,899 |
| 6.1 | % | 85,006 |
| 79,924 |
| 6.4 | % | 44,788 |
| 42,025 |
| 6.6 | % |
| East Asia & Australia | 21,433 |
| 21,388 |
| 0.2 | % | 44,385 |
| 42,904 |
| 3.5 | % | 22,952 |
| 21,516 |
| 6.7 | % |
| Latin America & Canada | 19,036 |
| 19,297 |
| (1.4 | )% | 39,272 |
| 40,853 |
| (3.9 | )% | 20,236 |
| 21,556 |
| (6.1 | )% |
| Total Cigarettes and Heated Tobacco Units | 173,846 |
| 177,987 |
| (2.3 | )% | 375,554 |
| 377,877 |
| (0.6 | )% | 201,708 |
| 199,890 |
| 0.9 | % |
Heated tobacco units ("HTU") is the term we use to refer to our heated tobacco consumables, which include HEETS, HEETS Marlboro and HEETS FROM MARLBORO, defined collectively as HEETS, as well as Marlboro HeatSticks and Parliament HeatSticks.
References to total international market, defined as worldwide cigarette and heated tobacco unit volume excluding the United States, total industry, total market and market shares throughout this "Discussion and Analysis" are our estimates for tax-paid products based on the latest available data from a number of internal and external sources and may, in defined instances, exclude the People's Republic of China and/or our duty free business.
In-market sales ("IMS") is defined as sales to the retail channel, depending on the market and distribution model.
Unless otherwise stated, references to total industry, total market, our shipment volume and our market share performance reflect cigarettes and heated tobacco units.
Key market data regarding total market size, our shipments and market share are shown in the tabletables below:
| | | | | For the Three Months Ended March 31, | | For the Six Months Ended June 30, |
| | | | | PMI Shipments (billion units) | | PMI Market Share (%) | | | | PMI Shipments (billion units) | | PMI Market Share (%)(1) |
| Market | | Total Market (billion units) | | Total | | Cigarette | | Heated Tobacco Unit | | Total | | Heated Tobacco Unit | | Total Market (billion units) | | Total | | Cigarette | | Heated Tobacco Unit | | Total | | Heated Tobacco Unit |
| | | 2018 | 2017 | | 2018 | 2017 | | 2018 | 2017 | | 2018 | 2017 | | 2018 | 2017 | | 2018 | 2017 | | 2018 | 2017 | | 2018 | 2017 | | 2018 | 2017 | | 2018 | 2017 | | 2018 | 2017 | | 2018 | 2017 |
| European Union | European Union | | European Union | |
| France | | 9.8 | 10.8 | | 4.3 | 4.7 | | 4.3 | 4.7 | | — | | 44.4 | 42.8 | | 0.1 | — | | 20.1 | 22.6 | | 9.4 | 10.1 | | 9.4 | 10.1 | | — | | 44.7 | 42.9 | | 0.1 | — |
| Germany | | 16.1 | 17.5 | | 5.8 | 6.7 | | 5.8 | 6.7 | | 0.1 | — | | 36.3 | 38.2 | | 0.4 | — | | 35.6 | 37.3 | | 13.3 | 13.9 | | 13.1 | 13.9 | | 0.1 | — | | 37.2 | 37.4 | | 0.4 | 0.1 |
| Italy | | 16.1 | 16.2 | | 8.0 | 7.8 | | 7.7 | | 0.3 | 0.1 | | 52.1 | 51.7 | | 1.5 | 0.5 | | 33.8 | 34.4 | | 17.3 | 18.0 | | 16.7 | 17.8 | | 0.6 | 0.3 | | 51.7 | 51.9 | | 1.7 | 0.6 |
| Poland | | 9.8 | 10.2 | | 3.9 | 4.3 | | 3.9 | 4.3 | | — | | 39.7 | 42.1 | | 0.5 | — | | 21.2 | 21.1 | | 8.6 | 8.9 | | 8.5 | 8.9 | | 0.1 | — | | 40.6 | 42.1 | | 0.5 | 0.1 |
| Spain | | 9.9 | | 3.2 | | 3.2 | | — | | 32.3 | 32.1 | | 0.3 | 0.1 | | 21.6 | 21.8 | | 7.1 | 7.3 | | 7.1 | 7.3 | | 0.1 | — | | 32.0 | | 0.3 | 0.1 |
| | | |
| Eastern Europe | Eastern Europe | | Eastern Europe | |
Russia (1)(2) | | 51.2 | 55.8 | | 12.8 | 14.8 | | 12.5 | 14.8 | | 0.3 | — | | 26.3 | 27.4 | | — | | 112.4 | 123.5 | | 30.3 | 34.4 | | 29.4 | 34.3 | | 0.9 | 0.1 | | 26.4 | 27.2 | | — |
| | | |
| Middle East & Africa | Middle East & Africa | | Middle East & Africa | |
| Saudi Arabia | | 4.9 | 8.2 | | 1.1 | 4.2 | | 1.1 | 4.2 | | — | | 41.6 | 54.1 | | — | | 9.9 | 14.8 | | 2.8 | 7.1 | | 2.8 | 7.1 | | — | | 40.8 | 52.8 | | — |
Turkey (1)(2) | | 24.7 | 22.0 | | 11.5 | 9.8 | | 11.5 | 9.8 | | — | | 43.1 | 42.9 | | — | | 54.4 | 47.7 | | 25.0 | 22.0 | | 25.0 | 22.0 | | — | | 43.1 | 43.2 | | — |
| | | |
| South & Southeast Asia | South & Southeast Asia | | South & Southeast Asia | |
| Indonesia | | 69.3 | 71.0 | | 23.0 | 23.4 | | 23.0 | 23.4 | | — | | 33.2 | 33.0 | | — | | 144.5 | 146.6 | | 48.0 | 48.2 | | 48.0 | 48.2 | | — | | 33.2 | 32.9 | | — |
| Philippines | | 15.3 | 16.6 | | 10.8 | 11.0 | | 10.8 | 11.0 | | — | | 70.5 | 65.9 | | — | | 34.3 | 35.7 | | 24.0 | 23.6 | | 24.0 | 23.6 | | — | | 69.9 | 66.2 | | — |
| | | |
| East Asia & Australia | East Asia & Australia | | East Asia & Australia | |
| Australia | | 2.9 | 3.2 | | 0.8 | 0.9 | | 0.8 | 0.9 | | — | | 28.7 | 27.8 | | — | | 6.2 | 6.9 | | 1.8 | 2.0 | | 1.8 | 2.0 | | — | | 29.3 | 29.1 | | — |
| Japan | | 39.7 | 40.6 | | 14.1 | 14.8 | | 7.9 | 10.7 | | 6.2 | 4.1 | | 34.7 | 30.0 | | 15.8 | 7.1 | | 82.2 | 84.0 | | 29.3 | 28.8 | | 16.7 | 19.0 | | 12.6 | 9.8 | | 34.5 | 31.0 | | 15.6 | 8.6 |
| Korea | | 15.8 | 16.1 | | 4.0 | 3.0 | | 2.9 | 3.0 | | 1.2 | — | | 25.5 | 19.1 | | 7.3 | — | | 33.7 | 34.4 | | 8.6 | 6.7 | | 6.0 | 6.7 | | 2.6 | — | | 25.4 | 19.7 | | 7.6 | 0.1 |
| | | |
| Latin America & Canada | Latin America & Canada | | Latin America & Canada | |
| Argentina | | 9.2 | 9.3 | | 6.8 | 6.9 | | 6.8 | 6.9 | | — | | 74.2 | 74.8 | | — | | 17.6 | 18.1 | | 13.1 | 13.5 | | 13.1 | 13.5 | | — | | 74.1 | 74.5 | | — |
| Canada | | 4.7 | 4.8 | | 1.8 | | 1.8 | | — | | 39.0 | 35.2 | | 0.1 | — | | 11.1 | 11.5 | | 4.2 | | 4.2 | | — | | 37.9 | 36.1 | | 0.1 | — |
| Mexico | | 7.6 | 7.9 | | 4.9 | 5.1 | | 4.9 | 5.1 | | — | | 63.5 | 64.4 | | — | | 16.9 | 17.6 | | 11.0 | 12.0 | | 11.0 | 12.0 | | — | | 65.1 | 67.8 | | — |
| | | |
(1) PMI Cigarette Market Share February quarter-to-date as measured by Nielsen Note: % change for Total Market and PMI shipments in the discussion below is computed based on millions of units
| |
(1) Market share estimates are calculated using IMS data unless otherwise stated (2) PMI Cigarette Market Share May year-to-date as measured by Nielsen Note: % change for Total Market and PMI shipments in the discussion below is computed based on millions of units
| | (1) Market share estimates are calculated using IMS data unless otherwise stated (2) PMI Cigarette Market Share May year-to-date as measured by Nielsen Note: % change for Total Market and PMI shipments in the discussion below is computed based on millions of units
|
|
| | | | | | | | | | | | | | | | | | |
| | | For the Three Months Ended June 30, |
| | | | | PMI Shipments (billion units) | | PMI Market Share (%)(1) |
| Market | | Total Market (billion units) | | Total | | Cigarette | | Heated Tobacco Unit | | Total | | Heated Tobacco Unit |
| | | 2018 | 2017 | | 2018 | 2017 | | 2018 | 2017 | | 2018 | 2017 | | 2018 | 2017 | | 2018 | 2017 |
| European Union | | | | | | | | | | | | | | | | |
| France | | 10.3 | 11.8 | | 5.0 | 5.3 | | 5.0 | 5.3 | | — | — | | 45.0 | 43.0 | | 0.1 | — |
| Germany | | 19.6 | 19.8 | | 7.4 | 7.3 | | 7.3 | 7.2 | | 0.1 | — | | 38.0 | 36.7 | | 0.4 | 0.2 |
| Italy | | 17.7 | 18.2 | | 9.3 | 10.2 | | 9.0 | 10.1 | | 0.3 | 0.2 | | 51.3 | 52.0 | | 1.9 | 0.6 |
| Poland | | 11.4 | 10.9 | | 4.7 | 4.6 | | 4.6 | 4.6 | | 0.1 | — | | 41.3 | 42.1 | | 0.6 | 0.1 |
| Spain | | 11.6 | 11.9 | | 3.9 | 4.1 | | 3.8 | 4.1 | | 0.1 | — | | 31.8 | 32.0 | | 0.4 | 0.1 |
| | | | | | | | | | | | | | | | | | | |
| Eastern Europe | | | | | | | | | | | | | | | | |
Russia (2) | | 62.5 | 67.7 | | 17.5 | 19.6 | | 16.9 | 19.5 | | 0.6 | 0.1 | | 26.4 | 27.1 | | — | — |
| | | | | | | | | | | | | | | | | | | |
| Middle East & Africa | | | | | | | | | | | | | | | | |
| Saudi Arabia | | 5.0 | 6.6 | | 1.7 | 2.9 | | 1.7 | 2.9 | | — | — | | 40.1 | 51.1 | | — | — |
Turkey (2) | | 28.5 | 25.7 | | 13.5 | 12.1 | | 13.5 | 12.1 | | — | — | | 43.0 | 43.4 | | — | — |
| | | | | | | | | | | | | | | | | | | |
| South & Southeast Asia | | | | | | | | | | | | | | | | |
| Indonesia | | 75.2 | 75.7 | | 25.0 | 24.8 | | 25.0 | 24.8 | | — | — | | 33.2 | 32.8 | | — | — |
| Philippines | | 18.9 | 19.1 | | 13.2 | 12.7 | | 13.2 | 12.7 | | — | — | | 69.6 | 66.5 | | — | — |
| | | | | | | | | | | | | | | | | | | |
| East Asia & Australia | | | | | | | | | | | | | | | | |
| Australia | | 3.3 | 3.7 | | 1.0 | 1.1 | | 1.0 | 1.1 | | — | — | | 29.9 | 30.3 | | — | — |
| Japan | | 42.6 | 43.4 | | 15.1 | 14.0 | | 8.7 | 8.3 | | 6.4 | 5.7 | | 34.2 | 32.0 | | 15.5 | 10.0 |
| Korea | | 17.9 | 18.2 | | 4.5 | 3.7 | | 3.1 | 3.7 | | 1.4 | — | | 25.3 | 20.3 | | 8.0 | 0.2 |
| | | | | | | | | | | | | | | | | | | |
| Latin America & Canada | | | | | | | | | | | | | | | |
| Argentina | | 8.5 | 8.8 | | 6.2 | 6.5 | | 6.2 | 6.5 | | — | — | | 73.4 | 74.3 | | — | — |
| Canada | | 6.4 | 6.7 | | 2.4 | 2.5 | | 2.4 | 2.4 | | — | — | | 37.3 | 36.8 | | 0.1 | — |
| Mexico | | 9.2 | 9.8 | | 6.1 | 6.9 | | 6.1 | 6.9 | | — | — | | 66.4 | 70.5 | | — | — |
| | | | | | | | | | | | | | | | | | | |
(1) Market share estimates are calculated using IMS data unless otherwise stated (2) PMI Cigarette Market Share May quarter-to-date as measured by Nielsen Note: % change for Total Market and PMI shipments in the discussion below is computed based on millions of units
|
Consolidated Operating Results for the ThreeSix Months Ended March 31,June 30, 2018
The following discussion compares our consolidated operating results for the threesix months ended March 31,June 30, 2018, with the threesix months ended March 31,2017.June 30, 2017.
Our total shipment volume decreased by 2.3%0.6%, principally due to:
the EU, primarily reflecting lower cigarette shipment volume mainly in France, Germany, Italy and Poland;Poland, partly offset by higher heated tobacco unit shipment volume;
Eastern Europe, reflecting lower cigarette shipment volume, mainlyprincipally in Russia and Ukraine;Ukraine, partly offset by higher heated tobacco unit shipment volume; and
Latin America & Canada, reflecting lower cigarette shipment volume, principally in Argentina and Mexico;
partly offset by
Middle East & Africa, reflecting higher cigarette shipment volume in North Africa, notably Egypt, and Turkey, as well as higher heated tobacco unit shipment volume, partly offset by lower cigarette shipment volume mainly in the GCC, notably in Saudi Arabia and North Africa, notably Algeria, partly offset by higher cigarette shipment volume mainly in Turkey and PMI Duty Free;the UAE;
South & Southeast Asia, reflecting higher cigarette shipment volume, driven mainly byprincipally in Pakistan, the Philippines and Thailand, partly offset by Indonesia; and
East Asia & Australia, reflecting higher heated tobacco unit shipment volume, driven by Japan and Korea.
Korea, partly offset by lower cigarette shipment volume, principally in Japan, Korea and Taiwan.
Excluding the net unfavorable impact of total estimated distributor inventory movements of approximately 2.11.6 billion units, reflecting unfavorable heated tobacco unit inventory movements of approximately 2.6 billion units, partly offset by favorable cigarette inventory movements of approximately 1.0 billion units, both driven mainly by Japan, and Saudi Arabia, ourPMI's total shipment volume decreased by 1.1%0.2%.
Our shipment volume by brand is shown in the table below:
| | | PMI Shipment Volume by Brand (Million Units) | PMI Shipment Volume by Brand (Million Units) | PMI Shipment Volume by Brand (Million Units)
|
| | First-Quarter | Six Months Year-to-Date |
| | 2018 | 2017 | Change | 2018 | 2017 | Change |
Cigarettes
| | |
| Marlboro | 57,973 |
| 62,399 |
| (7.1 | )% | 126,866 |
| 131,230 |
| (3.3 | )% |
| L&M | 19,225 |
| 21,913 |
| (12.3 | )% | 42,422 |
| 45,282 |
| (6.3 | )% |
| Chesterfield | 13,875 |
| 11,544 |
| 20.2 | % | 28,801 |
| 25,195 |
| 14.3 | % |
| Philip Morris | 10,659 |
| 10,608 |
| 0.5 | % | 23,182 |
| 23,296 |
| (0.5 | )% |
| Sampoerna A | 8,624 |
| 9,913 |
| (13.0 | )% | 18,798 |
| 20,530 |
| (8.4 | )% |
| Parliament | 8,460 |
| 9,199 |
| (8.0 | )% | 19,453 |
| 20,368 |
| (4.5 | )% |
| Bond Street | 6,975 |
| 8,485 |
| (17.8 | )% | 15,365 |
| 18,763 |
| (18.1 | )% |
| Dji Sam Soe | 6,696 |
| 4,459 |
| 50.2 | % | 13,573 |
| 9,267 |
| 46.5 | % |
| Lark | 5,517 |
| 6,526 |
| (15.5 | )% | 11,421 |
| 12,214 |
| (6.5 | )% |
| Fortune | 3,583 |
| 2,882 |
| 24.3 | % | 7,739 |
| 6,309 |
| 22.7 | % |
| Others | 22,693 |
| 25,624 |
| (11.4 | )% | 47,381 |
| 54,638 |
| (13.3 | )% |
| Total Cigarettes | 164,280 |
| 173,552 |
| (5.3 | )% | 355,001 |
| 367,092 |
| (3.3 | )% |
| Heated Tobacco Units | 9,566 |
| 4,435 |
| +100.0% |
| 20,553 |
| 10,785 |
| 90.6 | % |
| Total Cigarettes and Heated Tobacco Units | 173,846 |
| 177,987 |
| (2.3 | )% | 375,554 |
| 377,877 |
| (0.6 | )% |
Note: Sampoerna A includes Sampoerna.
Our cigarette shipment volume of the following brands decreased:
Marlboro,mainly due to Germany,the EU, the GCC, Japan and Saudi Arabia,Mexico, partly offset by Indonesia, North Africa and Turkey;
L&M, mainly due to the GCC, Germany, North Africa, Russia, Taiwan and Saudi Arabia,Ukraine, partly offset by Kazakhstan and Thailand;
Philip Morris, mainly due to Argentina, Italy and the Philippines, partly offset by Russia;
Sampoerna A in Indonesia, partly reflecting the impact of its retail price increasing past its round pack price point in the fourth quarter of 2017;
Parliament, mainly due to the GCC, Japan, RussiaKorea and Saudi Arabia,Russia, partly offset by Turkey;
Bond Street, mainly due to Russia and Ukraine;
Lark, mainly due to Japan, partly offset by Turkey; and
"Others," mainly due to: mid-price brands, notablySampoerna U in Indonesia, partly reflecting the impact of above-inflation retail price increases; and the successful portfolio consolidation of local, low-price brands into international trademarks, notably in Colombia, Mexico and Russia; partly offset by low-price brands in Pakistan.
Our cigarette shipment volume of the following brands increased:
Chesterfield, mainly driven by Argentina, Brazil, Colombia, Italy, Saudi Arabiathe GCC, Mexico and Turkey;
Philip Morris, mainly driven by Russia,Turkey, partly offset by Argentina and Italy;Russia;
Dji Sam Soe in Indonesia, notably reflecting the continued strong performance of its Magnum Mild 16s variant launched in the second quarter of 2017; and
Fortune in the Philippines, reflecting the favorable impact of its narrowed retail price gap to competitors' products.
The increase in ourPMI's heated tobacco unit shipment volume was driven by East Asia & Australia,EA&A, primarily Japan and Korea.
| | Financial Summary | Financial Summary -
Quarters Ended March 31, | | | | Change
Fav./(Unfav.) | | Variance
Fav./(Unfav.) | |
| | 2018 | 2017 | | Total | Excl.
Curr. | | Total | Cur-
rency | Price | Vol/
Mix | Cost/
Other | |
Financial Summary -
Six Months Ended June 30, | | | | | Change
Fav./(Unfav.) | | Variance
Fav./(Unfav.) |
| | 2018 | 2017 | | Total | Excl.
Curr. | | Total | Cur-
rency | Price | Vol/
Mix | Cost/
Other |
| (in millions) | | 2018 | 2017 | | Total | Excl.
Curr. | | Total | Cur-
rency | Price | Vol/
Mix | Cost/
Other | |
| Net Revenues | | | $ | 14,622 |
| $ | 12,981 |
| | 12.6 | % | 8.3 | % | | $ | 1,641 |
| $ | 564 |
| $ | 682 |
| $ | 304 |
| $ | 91 |
|
| Cost of Sales | | (2,615 | ) | (2,177 | ) | | (20.1 | )% | (13.9 | )% | | (438 | ) | (136 | ) | — |
| (335 | ) | 33 |
| | (5,359 | ) | (4,696 | ) | | (14.1 | )% | (9.1 | )% | | (663 | ) | (237 | ) | — |
| (458 | ) | 32 |
|
| Marketing, Administration and Research Costs | | (1,833 | ) | (1,449 | ) | | (26.5 | )% | (18.6 | )% | | (384 | ) | (115 | ) | — |
| — |
| (269 | ) | | (3,701 | ) | (3,088 | ) | | (19.9 | )% | (14.5 | )% | | (613 | ) | (164 | ) | — |
| — |
| (449 | ) |
| Amortization of Intangibles | | (22 | ) | (22 | ) | | — | % | — | % | | — |
| — |
| — |
| — |
| — |
| | (43 | ) | (44 | ) | | 2.3 | % | 2.3 | % | | 1 |
| — |
| — |
| — |
| 1 |
|
| Operating Income | | $ | 2,426 |
| $ | 2,416 |
| | 0.4 | % | (2.7 | )% | | $ | 10 |
| $ | 76 |
| $ | 342 |
| $ | (172 | ) | $ | (236 | ) | | $ | 5,519 |
| $ | 5,153 |
| | 7.1 | % | 3.9 | % | | $ | 366 |
| $ | 163 |
| $ | 682 |
| $ | (154 | ) | $ | (325 | ) |
“Cost/Other” in the above table reflects the currency-neutral variances of: cost of sales (excluding the volume/mix cost component); marketing, administration and research costs; asset impairment and exit costs; and amortization of intangibles. “Cost/Other” also includes the currency-neutral net revenue variance, unrelated to volume/mix and price components, attributable to fees for certain distribution rights billed to customers in certain markets in the ME&A Region. This immaterial presentational change, made in conjunction with the new revenue recognition standard, is prospective only.
DuringFor the quarter,six months ended June 30, 2018, net revenues, excluding favorable currency, increased by 8.3%, driven byprimarily reflecting a favorable pricing variance, from across all Regions, notablydriven by EU, EE, S&SA and LA&C, including higher IQOS device sales, mainly in EA&A, as well as favorable volume/mix, driven primarily by EA&A, despite the unfavorable impact of the tax-driven cigarette industrynotably lower volume decline and related down-trading in the GCC, principally Saudi Arabia. and lower mix in Indonesia and lower volume/mix in Russia.
The favorable currency in net revenues was due primarily to the Euro, Japanese yen and Polish zloty, partially offset by the Argentine peso.peso, Indonesian rupiah and Turkish lira.
Net revenues include $1,127$2,147 million in 2018 and $435$1,050 million in 2017 related to the sale of RRPs, mainly driven by Japan and Korea.RRPs.
Operating income, excluding favorable currency, decreasedincreased by 2.7%3.9%, mainly due to:reflecting: a favorable pricing variance and favorable manufacturing costs, notably in S&SA and EA&A; partly offset by unfavorable volume/mix, largely due to the GCC, principally Saudi Arabia;Indonesia and Russia, higher marketing, administration and research costs, primarily reflectingdue to increased investment behind RRPs,reduced-risk products, predominantly in the EU;EU and EA&A, and the full-year contribution of $80 million to the Foundation for a Smoke-Free World; partly offsetWorld recorded in the first quarter of 2018.
Interest expense, net, of $395 million decreased by $37 million (8.6%), due primarily to our ongoing efforts to optimize our capital structure following the passage of the Tax Cuts and Jobs Act. This included the decision to use existing cash to repay the principal for our recently matured May 2018 ten-year U.S. bond, which had a favorable pricing variance across all Regions and favorable manufacturing costs, notably in S&SA and EA&A.coupon of 5.65%.
Our effective tax rate increaseddecreased by 0.62.8 percentage pointspoint to 25.5%23.5%. The effective tax rate for the threesix months ended March 31,June 30, 2017, was favorably impacted by a legal entity restructuring ($61 million). We are continuing to evaluate the impact that the Tax Cuts and Jobs Act will have on our tax liability. Based upon our current interpretation of the Tax Cuts and Jobs Act, we estimate that our 2018 effective tax rate will be approximately 26%24%, subject to future regulatory developments and earnings mix by taxing jurisdiction. For further details, see Note 9. Income Taxes.
We are regularly examined by tax authorities around the world, and we are currently under examination in a number of jurisdictions. It is reasonably possible that within the next 12 months certain tax examinations will close, which could result in a change in unrecognized tax benefits along with related interest and penalties. An estimate of any possible change cannot be made at this time.
Net earnings attributable to PMI of $1.6$3.8 billion decreasedincreased by $34$383 million (2.1%(11.4%). This decreaseincrease was due primarily due to a higher effective tax rate, partially offset by higher operating income as discussed above.above, lower interest expense, net and a lower effective tax rate. Diluted and basic EPS of $1.00decreased$2.41 increased by 2.0%11.1%. Excluding a favorable currency impact of $0.03,$0.07, diluted EPS decreasedincreased by 4.9%7.8%.
Consolidated Operating Results for the Three Months Ended June 30,2018
The following discussion compares our consolidated operating results for the three months ended June 30,2018, with the three months ended June 30,2017.
Our total shipment volume increased by 0.9%, principally driven by:
Middle East & Africa, reflecting higher cigarette shipment volume, principally in North Africa, notably Algeria and Egypt, and Turkey, as well as higher heated tobacco unit shipment volume, partly offset by lower cigarette shipment volume in the GCC, notably in Saudi Arabia and the UAE;
South & South East Asia, reflecting higher cigarette shipment volume, principally in Pakistan, the Philippines and Thailand; and
East Asia & Australia, primarily reflecting higher heated tobacco unit shipment volume in Japan and Korea, and higher cigarette shipment volume in Japan, partly offset by lower cigarette shipment volume, notably in Korea and Taiwan;
partly offset by
the EU, reflecting lower cigarette shipment volume, principally in France, Italy and Spain, partly offset by higher cigarette shipment volume in Germany, as well as higher heated tobacco unit shipment volume;
Eastern Europe, reflecting lower cigarette shipment volume, principally in Russia and Ukraine, partly offset by higher heated tobacco unit shipment volume; and
Latin America & Canada, reflecting lower cigarette shipment volume, principally in Argentina and Mexico.
Excluding the net favorable impact of total estimated distributor inventory movements of approximately 0.5 billion units, reflecting favorable cigarette inventory movements of approximately 1.9 billion units, partly offset by unfavorable heated tobacco unit inventory movements of approximately 1.4 billion units, both driven mainly by Japan, our total shipment volume increased by 0.6%.
Our shipment volume by brand is shown in the table below:
|
| | | | | | |
| PMI Shipment Volume by Brand (Million Units) |
| | Second-Quarter |
| | 2018 | 2017 | Change |
Cigarettes
| | | |
| Marlboro | 68,893 |
| 68,830 |
| 0.1 | % |
| L&M | 23,196 |
| 23,369 |
| (0.7 | )% |
| Chesterfield | 14,926 |
| 13,652 |
| 9.3 | % |
| Philip Morris | 12,523 |
| 12,688 |
| (1.3 | )% |
| Sampoerna A | 10,174 |
| 10,617 |
| (4.2 | )% |
| Parliament | 10,993 |
| 11,169 |
| (1.6 | )% |
| Bond Street | 8,390 |
| 10,278 |
| (18.4 | )% |
| Dji Sam Soe | 6,877 |
| 4,808 |
| 43.0 | % |
| Lark | 5,904 |
| 5,688 |
| 3.8 | % |
| Fortune | 4,155 |
| 3,427 |
| 21.2 | % |
| Others | 24,690 |
| 29,014 |
| (14.9 | )% |
| Total Cigarettes | 190,721 |
| 193,540 |
| (1.5 | )% |
| Heated Tobacco Units | 10,987 |
| 6,350 |
| 73.0 | % |
| Total Cigarettes and Heated Tobacco Units | 201,708 |
| 199,890 |
| 0.9 | % |
Note: Sampoerna A includes Sampoerna.
Our cigarette shipment volume of the following brands increased:
Marlboro, mainly driven by Indonesia, Japan, North Africa, the Philippines and Turkey, partly offset by the GCC, Italy, Korea and Mexico;
Chesterfield, mainly driven by Brazil, Colombia, Mexico and Turkey, partly offset by Italy and Russia;
Dji Sam Soe in Indonesia, notably reflecting the continued strong performance of its Magnum Mild 16s variant launched in the second quarter of 2017;
Lark, mainly driven by Japan and Turkey; and
Fortune in the Philippines, reflecting the favorable impact of its narrowed retail price gap to competitors' products.
Our cigarette shipment volume of the following brands decreased:
L&M, mainly due to Russia, Saudi Arabia, Taiwan and Turkey, partly offset by Egypt and Thailand;
Philip Morris, mainly due to Argentina, Italy and the Philippines, partly offset by Russia;
Sampoerna A in Indonesia, partly reflecting the impact of its retail price increasing past its round pack price point in the fourth quarter of 2017;
Parliament, mainly due to Korea, Russia and Saudi Arabia, partly offset by Turkey;
Bond Street, mainly due to Russia and Ukraine; and
"Others," mainly due to: mid-price brands, notably Sampoerna U in Indonesia, partly reflecting the impact of above-inflation retail price increases; and the successful portfolio consolidation of local, low-price brands into international trademarks, notably in Mexico and Russia; partly offset by low-price brands in Pakistan.
The increase in our heated tobacco unit shipment volume was driven by EA&A, primarily Japan and Korea.
|
| | | | | | | | | | | | | | | | | | | | | | | | | | | | |
| Financial Summary |
Financial Summary -
Quarters Ended June 30, | | | | | Change
Fav./(Unfav.) | | Variance
Fav./(Unfav.) |
| | 2018 | 2017 | | Total | Excl.
Curr. | | Total | Cur-
rency | Price | Vol/
Mix | Cost/
Other |
| (in millions) | | | |
| Net Revenues | | $ | 7,726 |
| $ | 6,917 |
| | 11.7 | % | 8.3 | % | | $ | 809 |
| $ | 237 |
| $ | 383 |
| $ | 141 |
| $ | 48 |
|
| Cost of Sales | | (2,744 | ) | (2,519 | ) | | (8.9 | )% | (4.9 | )% | | (225 | ) | (101 | ) | — |
| (123 | ) | (1 | ) |
| Marketing, Administration and Research Costs | | (1,868 | ) | (1,639 | ) | | (14.0 | )% | (11.0 | )% | | (229 | ) | (49 | ) | — |
| — |
| (180 | ) |
| Amortization of Intangibles | | (21 | ) | (22 | ) | | 4.5 | % | 4.5 | % | | 1 |
| — |
| — |
| — |
| 1 |
|
| Operating Income | | $ | 3,093 |
| $ | 2,737 |
| | 13.0 | % | 9.8 | % | | $ | 356 |
| $ | 87 |
| $ | 383 |
| $ | 18 |
| $ | (132 | ) |
“Cost/Other” in the above table reflects the currency-neutral variances of: cost of sales (excluding the volume/mix cost component); marketing, administration and research costs; asset impairment and exit costs; and amortization of intangibles. “Cost/Other” also includes the currency-neutral net revenue variance, unrelated to volume/mix and price components, attributable to fees for certain distribution rights billed to customers in certain markets in the ME&A Region. This immaterial presentational change, made in conjunction with the new revenue recognition standard, is prospective only.
For the three months ended June 30, 2018, net revenues, excluding favorable currency, increased by 8.3%, primarily reflecting a favorable pricing variance, driven by EU, EE, S&SA and LA&C, as well as favorable volume/mix, primarily in EA&A, despite the unfavorable impact of notably lower volume in the GCC and lower mix in Indonesia and Russia.
The favorable currency in net revenues was due primarily to the Euro and the Japanese yen, partially offset by the Argentine peso, Indonesian rupiah and Turkish lira.
Net revenues include $1,020 million in 2018 and $615 million in 2017 related to the sale of RRPs.
Operating income, excluding favorable currency, increased by 9.8%, reflecting: a favorable pricing variance and favorable volume/mix, partly offset by higher marketing, administration and research costs, primarily due to increased investment behind reduced-risk products, predominantly in the EU and EA&A.
Interest expense, net, of $168 million decreased by $45 million (21.1%), due primarily to our ongoing efforts to optimize our capital structure following the passage of the Tax Cuts and Jobs Act. This included the decision to use existing cash to repay the principal for our recently matured May 2018 ten-year U.S. bond, which had a coupon of 5.65%.
Our effective tax rate decreased by 5.4 percentage points to 22.1%. We are continuing to evaluate the impact that the Tax Cuts and Jobs Act will have on our tax liability. Based upon our current interpretation of the Tax Cuts and Jobs Act, we estimate that our 2018 effective tax rate will be approximately 24%, subject to future regulatory developments and earnings mix by taxing jurisdiction. Our effective tax rate in the quarter reflected the impact of a revised full-year effective tax rate estimate of approximately 24%. The reduction compared to our prior full-year estimate of approximately 26% was mainly attributed to further analysis, interpretation and clarification of the scope and impact of the 2017 Tax Cuts and Jobs Act in the U.S. For further details, see Note 9. Income Taxes.
Net earnings attributable to PMI of $2.2 billion increased by $417 million (23.4%). This increase was due primarily to higher operating income as discussed above, lower interest expense, net and a lower effective tax rate. Diluted and basic EPS of $1.41 increased by 23.7%. Excluding a favorable currency impact of $0.04, diluted EPS increased by 20.2%.
Operating Results by Business Segment
-BusinessBusiness Environment
Taxes, Legislation, Regulation and Other Matters Regarding the Manufacture, Marketing, Sale and Use of Tobacco Products
The tobacco industry and our business face a number of challenges that may adversely affect our business, volume, results of operations, cash flows and financial position. These challenges, which are discussed below and in “Cautionary Factors That May Affect Future Results,” include:
regulatory restrictions on our products, including restrictions on the packaging, marketing, and sale of tobacco or other nicotine-containing products that could reduce our competitiveness, eliminate our ability to communicate with adult consumers, or even ban certain of our products;
fiscal challenges, such as excessive excise tax increases and discriminatory tax structures;
illicit trade in cigarettes and other tobacco products, including counterfeit, contraband and so-called “illicit whites”;
intense competition, including from non-tax paid volume by certain local manufacturers;
pending and threatened litigation as discussed in Note 8. Contingencies; and
governmental investigations.
Regulatory Restrictions: The tobacco industry operates in a highly regulated environment. The well-known risks of smoking have led regulators to impose significant restrictions and high excise taxes on cigarettes.
We support a comprehensive regulatory framework for tobacco products based on the principle of harm reduction, including mandated health warnings, minimum age laws, restrictions on advertising, and public place smoking restrictions. We also support regulatory measures that help reduce illicit trade.
Much of the regulation that shapes the business environment in which we operate is driven by the World Health Organization's (“WHO”) Framework Convention on Tobacco Control (“FCTC”), which entered into force in 2005. The FCTC is the first international public health treaty and has as its main objective to establish a global agenda for tobacco regulation, with the purpose of reducing tobacco use. To date, 180 countries and the European Union are Parties to the FCTC. The treaty requires Parties to have in place various tobacco control measures and recommends others. The FCTC governing body, the Conference of the Parties
(“CoP”), has also adopted non-binding guidelines and policy recommendations related to certain articles of the FCTC that go beyond the text of the treaty. It is not possible to predict whether or to what extent measures recommended in the FCTC guidelines will be implemented.
We continue to engage in a dialogue with regulators with respect to those measures that we do not believe would protect public health and, if implemented, could disrupt competition, severely limit our ability to market and sell our products (including our RRPs) to adult smokers, or increase illicit trade. We advocate for measures that would accelerate switching to better alternatives to continued smoking and embrace a regulatory framework that recognizes a risk continuum of tobacco and other nicotine-containing products.
Certain measures are discussed in more detail below.below and in the “Reduced-Risk Products (RRPs)” section.
Fiscal Challenges: Excessive and disruptive excise, sales and other tax increases and discriminatory tax structures are expected to continue to have an adverse impact on our profitability, due to lower consumption and consumer down-trading to non-premium, discount, other low-price or low-taxed combustible tobacco products such as fine cut tobacco and illicit cigarettes. In addition, in certain jurisdictions, some of our combustible products are subject to tax structures that discriminate against premium-price products and manufactured cigarettes. We believe that such tax policies undermine public health by encouraging consumers to turn to illicit trade, and ultimately undercut government revenue objectives, disrupt the competitive environment, and encourage criminal activity. Other jurisdictions have imposed, or are seeking to impose, levies or other taxes specifically on tobacco companies, such as taxes on revenues and/or profits.
EU Tobacco Products Directive: In April 2014, the EU adopted a significantly revised EU Tobacco Products Directive (TPD), which entered into force in May 2016. All 28 Member States and Norway have adopted laws transposing the TPD. The TPD sets forth a comprehensive set of regulatory requirements for tobacco products, including:
health warnings covering 65% of the front and back panels of cigarette packs, with an option for Member States to further standardize tobacco packaging, including the introduction of plain packaging;
a ban on characterizing flavors in some tobacco products, with a transition period for menthol expiring in May 2020;
security features and tracking and tracing measures that will become effective on May 20, 2019, and will increase operational expenses; and
a framework for the regulation of novel tobacco products and e-cigarettes, including requirements for health warnings and information leaflets, a prohibition on product packaging text related to reduced risk, and the introduction of notification requirements or authorization procedures in advance of commercialization.
Plain Packaging and Other Packaging Restrictions: Plain packaging legislation bans the use of branding, logos and colors on packaging other than the brand name and variant that may be printed only in specified locations and in a uniform font. To date, Australia, France, Georgia, Hungary, Ireland, New Zealand, Norway, Slovenia and the U.K. have adopted plain packaging laws, which are in various degrees of implementation. In New Zealand, pursuant to an announcement of the Ministry of Health, plain packaging will also apply to heated tobacco products. At the same time, the government is considering how to best apply risk-proportionate regulations across all tobacco products, including smoked tobacco, heated tobacco products and vaping products.
Several countries have initiated World Trade Organization (“WTO”) dispute settlement proceedings against Australia related to Australia's plain packaging legislation. The matter is still pending beforeOn June 28, 2018, the WTO panel.dispute settlement panel found that Australia's plain packaging regulations are compliant with WTO rules.
Other countries are also considering adopting plain packaging legislation, including, but not limited to, Canada, Singapore, South Africa and Turkey.
Some countries have adopted, or are considering adopting, packaging restrictions that could have an impact similar to plain packaging. Examples of such restrictions include standardizing the shape and size of packages, prohibiting certain colors or the use of certain descriptive phrases on packaging, and requiring very large graphic health warnings that leave little space for branding.
Restrictions and Bans on the Use of Ingredients: The WHO and others in the public health community have recommended restrictions or total bans on the use of some or all ingredients in tobacco products, including menthol. Broad restrictions and ingredient bans would require us to reformulate our American blend tobacco products and could reduce our ability to differentiate these products in the market in the long term. Menthol bans would eliminate the entire category of mentholated tobacco products. The European Union has banned flavored tobacco products, subject to an exemption until May 2020 for menthol. Other countries
may follow the EU’s approach. For instance, Turkey has banned menthol as of May 2020. Broader ingredient bans have been adopted by Canada and Brazil. Canada banned menthol in cigarettes as of October 2017. In addition, the Canadian parliament is considering a ban of menthol2017 and in all tobacco products. The majorityproducts as of Canadian provinces have also adopted or are in the process of adopting menthol bans.November 2018. The Brazil ingredients ban, which would prohibit the use of virtually all ingredients with flavoring or aromatic properties, is not in force due to legal challenges by tobacco industry unions, of which our Brazilian subsidiary is a member. It is not possible to predict the outcome of these legal proceedings.
Bans on Display of Tobacco Products at Retail: In a number of our markets, including, but not limited to, Australia, Canada, Norway, Russia, and Singapore, governments have banned the display of tobacco products at the point of sale. Other countries are also considering similar bans.
Bans and Restrictions on Advertising, Marketing, Promotions and Sponsorships: For many years, the FCTC has called for, and countries have imposed, partial or total bans on tobacco advertising, marketing, promotions and sponsorships, including bans and restrictions on advertising on radio and television, in print and on the Internet. The FCTC's non-binding guidelines recommend that governments prohibit all forms of communication with adult smokers.
Restrictions on Product Design: Some members of the public health community are calling for the further standardization of tobacco products by requiring, for example, that cigarettes have a certain minimum diameter, which would amount to a ban on slim cigarettes, or requiring the use of standardized filter and cigarette paper designs. In addition, at its meeting in November 2016, the CoP adopted non-binding guidelines recommending that countries regulate product design features that increase the attractiveness of tobacco products, such as the diameter of cigarettes and the use of flavor capsules.
Restrictions on Public Smoking: The pace and scope of public smoking restrictions have increased significantly in most of our markets. Many countries around the world have adopted, or are likely to adopt, regulations that restrict or ban smoking in public and/or work places, restaurants, bars and nightclubs. Some public health groups have called for, and some countries, regional governments and municipalities have adopted or proposed, bans on smoking in outdoor places, as well as bans on smoking in cars (typically, when minors are present) and private homes.
Other Regulatory Issues: Some regulators are considering, or in some cases have adopted, regulatory measures designed to reduce the supply of tobacco products. These include regulations intended to reduce the number of retailers selling tobacco products by, for example, reducing the overall number of tobacco retail licenses available or banning the sale of tobacco products within arbitrary distances of certain public facilities.
In a limited number of markets, most notably Japan, we are dependent on governmental approvals that may limit our pricing flexibility.
Illicit Trade: The illicit tobacco trade creates a cheap and unregulated supply of tobacco products, undermines efforts to reduce smoking prevalence, especially among youth, damages legitimate businesses, stimulates organized crime, increases corruption
and reduces government tax revenue. Illicit trade may account for as much as 10% of global cigarette consumption; this includes counterfeit, contraband and the growing problem of “illicit whites,” which are cigarettes legally produced in one jurisdiction for the sole purpose of being exported and illegally sold in another jurisdiction where they have no legitimate market. We estimate that illicit trade in the European Union accounted for slightly less than 10% of total cigarette consumption in 2017.
A number of jurisdictions are considering actions to prevent illicit trade. In November 2012, the FCTC adopted the Protocol to Eliminate Illicit Trade in Tobacco Products (the “Protocol”), which includes supply chain control measures, such as licensing of manufacturers and distributors, enforcement in free trade zones, controls on duty free and Internet sales and the implementation of tracking and tracing technologies. To date, 54 Parties have signed the Protocol, and 3546 Parties, including the European Union, have ratified it. The Protocol will come into force once the fortieth Party ratifies it,on September 25, 2018, after which date countries must implement its measures via national legislation. We expect, and welcome, that other Parties will ratify the Protocol.
As discussed in the EU Tobacco Products Directive section above, the EU regulations that mandate tracking and tracing of cigarettes and roll-your-own products manufactured or destined for the EU will become effective on May 20, 2019. The effective date for other tobacco-containing products, including some of our RRPs such as the heated tobacco units used with IQOS, is May 20, 2024.
In 2009, our Colombian subsidiaries entered into an Investment and Cooperation Agreement with the national and regional governments of Colombia to promote investment in, and cooperation on, anti-contraband and anti-counterfeit efforts. The agreement provides $200 million in funding over a 20-year period to address issues such as combating the illegal cigarette trade and increasing the quality and quantity of locally-grown tobacco.
In May 2016, PMI launched PMI IMPACT, a global initiative that supports third-party projects dedicated to fighting illegal trade and related crimes such as corruption, organized criminal networks and money laundering. The centerpiece of PMI IMPACT is a council of external independent experts with impeccable credentials in the fields of law, anti-corruption and law enforcement. The experts are responsible for evaluating and approving funding proposals for PMI IMPACT grants. PMI has pledged $100 million to fund projects within PMI IMPACT over three funding rounds. Substantially all grants under the first funding round were awarded in 2017. The second funding round began in September 2017 and is ongoing.
Reduced-Risk Products (RRPs)
Our Approach to RRPs: We recognize that smoking cigarettes causes serious diseases and that the best way to avoid the harms of smoking is never to start or to quit. Nevertheless, it is predicted that over the next decade the number of smokers will remain largely unchanged from the current estimate of 1.1 billion, despite the considerable efforts to discourage smoking.
Cigarettes burn tobacco, which produces smoke. As a result of the combustion process, the smoker inhales various toxic substances. In contrast, RRPs do not burn tobacco and produce an aerosol that contains significantly lower levels of harmful and potentially harmful constituents ("HPHCs") than found in cigarette smoke.
For smokers who would otherwise continue to smoke, we believe that RRPs offer a much better consumer choice. Accordingly, our key strategic priorities are: to develop and commercialize products that present less risk of harm to adult smokers who switch to those products versus continued smoking; and to convince current adult smokers who would otherwise continue to smoke to switch to those products.
We recognize that this transformation from cigarettes to RRPs will take time and that the speed of transformation will depend in part upon factors beyond our control, such as the willingness of governments, regulators and other policy groups to embrace RRPs as a desired alternative to continued cigarette smoking. We also recognize that our part in this transformation must be funded from our existing cigarette business. For as long as a significant number of adult smokers continues to smoke, it is critical that the industry be led by responsible and ethical manufacturers. Therefore, during the transformation, we intend to remain a leading international cigarette manufacturer.
We have a range of RRPs in various stages of development, scientific assessment and commercialization. We conduct rigorous scientific assessments of our RRP platforms to substantiate that they reduce exposure to HPHCs and, ultimately, that these products present, are likely to present, or have the potential to present less risk of harm to adult smokers who switch to them versus continued smoking. We draw upon a team of expert scientists and engineers from a broad spectrum of scientific disciplines and our extensive learnings of adult consumer preferences to develop and assess our RRPs. Our efforts are guided by the following key objectives:
to develop RRPs that adult smokers who would otherwise continue to smoke find to be satisfying alternatives to smoking;
for those adult smokers, our goal is to offer RRPs with a scientifically substantiated risk-reduction profile that approaches as closely as possible that associated with smoking cessation;
to substantiate the reduction of risk for the individual adult smoker and the reduction of harm to the population as a whole, based on scientific evidence of the highest standard that is made available for scrutiny and review by external independent scientists and relevant regulatory bodies; and
to advocate for the development of science-based regulatory frameworks for the development and commercialization of RRPs, including the communication of scientifically substantiated information to enable adult smokers to make better consumer choices.
Our RRP Platforms: Our product development is based on the elimination of combustion via tobacco heating and other innovative systems for aerosol generation, which we believe is the most promising path to providing a better consumer choice for those who would otherwise continue to smoke. We recognize that no single product will appeal to all adult smokers. Therefore, we are developing a portfolio of products intended to appeal to a variety of distinct adult consumer preferences.
Four RRP platforms are in various stages of development and commercialization readiness:
Platform 1 uses a precisely controlled heating device that we are commercializing under the IQOS brand name, into which a specially designed and proprietary tobacco unit is inserted and heated to generate an aerosol. We have conducted a series of clinical studies for this platform, the results of which were included in our submission to the U.S. Food and Drug Administration (“FDA”) described below. As anticipated, theThe results of the first six-month term of the 6+6 month exposure response study were received at the end of 2017, and the related report is under preparation. We expect to submit the final report for these resultswas completed and submitted to the FDA in the second quarter of 2018. We expectThe study showed
that all eight of the co-primary clinical risk endpoints moved in the same direction in the group that switched to receiveIQOS as observed for smoking cessation, with statistically significant changes in five of the eight endpoints compared with on-going smoking. The results of the second six-month term of the 6+6 month exposure response study were received for analysis in the second quarter of 2018; the related report is under preparation and is expected to be finalized later in 2018.
Platform 2 uses a pressed carbon heat source which, when ignited, generates a nicotine-containing aerosol by heating tobacco. The results of our pharmacokinetic study (that measured the nicotine pharmacokinetic profile as well as subjective effects) and of our five-day reduced exposure study indicate that this platform could be an acceptable substitute for adult smokers who seek an alternative to cigarettes. The reduced exposure study results showed a substantial reduction in relevant biomarkers of exposure to the measured HPHCs in those who switched to Platform 2 compared to those who continued to smoke cigarettes over a five-day period. The sustainability of this reduction as well as changes in clinical risk markers were assessed in a 3-month reduced exposure study. As anticipated, theThe results of this study were received at the end of 2017, and the related report is under preparation. We expect the report to bewas finalized in the second quarter of 2018. Subsequently, inIn accordance with standard scientific practices, we intend to share the conclusions in scientific forums and to submit them for inclusion in peer-reviewed publications.
Platform 3 provides an aerosol of nicotine salt formed by the chemical reaction of nicotine with a weak organic acid. We have explored two routes for this platform, one with electronics and one without, and conducted nicotine pharmacokinetic studies with both versions. We expect to receive the results related to the version without electronics for analysis later in the second quarter of 2018.
Platform 4 covers e-vapor products, which are battery-powered devices that produce an aerosol by vaporizing a nicotine-containing liquid solution. Our e-vapor products comprise devices using current generation technology and we are well advanced in the development and commercialization of our new e-vapor mesh technology that addresses certain challenges presented by some e-vapor products currently on the market. Our MESH products are designed to ensure the consistency and quality of the generated aerosol. We have conducted a nicotine pharmacokinetic study for which we expect to receive thein 2017. The results for analysisof this study were received in the second quarter of 2018;2018 for analysis, and we expect the resultsrelated report to be finalized later in 2018. We will also initiate a clinical reduced exposure study to measure selected biomarkers of exposure to HPHCs and assess changes in clinical risk markers. Results of this study are expected to contribute to further developments of Platform 4 products.in late 2019.
Commercialization of RRPs: We are building a new product category and tailor our commercialization strategy to the characteristics of each specific market. We focus our commercialization efforts on retail experience, guided consumer trials and customer care, as well as digital communication programs. In order to accelerate switching to IQOS, our initial market introductions typically entail one-on-one consumer engagement and introductory device discounts. These initial commercialization efforts require substantial investment.investment, which we believe will moderate over time.
In 2014, we introduced the IQOS system in pilot city launches in Nagoya, Japan, and in Milan, Italy. Since then, we have continuously expanded our commercialization activities, and IQOS is currently available for sale in 4042 markets in key cities or nationwide.
In Japan, we have recently observed a slower-than-initially-projected RRP category growth in the first quarter,half of the year, as we are now reaching different socio-economic strata with more conservative consumers who may show a slower pace of adoption than early adopters.
We are adjusting our commercial plans in termsimplementing a number of the timing, intensity and content of communicationinitiatives intended to specifically address the needs of these adult smokers. In addition, weWe expect a limited favorable impact of these initiatives in 2018, with the full favorable effect coming in 2019.
We estimate that while some IQOS users are experimenting with competitive products, only a very small percentage of convertedIQOS IQOS users in Japan switch to those products. We have also observed in Japan that while competitive products have the greatest impact following the initial launch, such impact dissipates over time as adult consumers recognize the benefits of IQOS.
We estimate that only a very small percentage of adult smokers who convert to IQOS switch back to cigarettes.
In the first quarter of 2016, we started the large scale commercial production of heated tobacco units. During 2017, we experienced supply shortages resulting from stronger-than-anticipated demand, primarily in Japan. Currently, weWe are no longer experiencing capacity limitations. We are integrating the production of our heated tobacco units into a number of our existing manufacturing facilities and progressing with our plans to build manufacturing capacity for our other RRP platforms.
In 2017, we secured a second supplier of IQOS devices. We are no longer experiencing supply constraints on the IQOS devices and, based on demand forecasts, we expect to be able to fully supply our current and planned launch markets.
TheAn adequate supply chain for our RRP portfolio, including the supply of electronic devices, is important to our business. We work with two electronics manufacturing service providers for the supply of our IQOS devices and a small number of other providers for other products in our RRP portfolio and related accessories. Although we work closely with these service providers on monitoring
their production capability and financial health, the commercialization of our RRPs could be adversely affected if they are unable to meet their commitments. The production of our RRP portfolio requires various metals, and we believe that there is an adequate supply of such metals in the world markets to satisfy our current and anticipated production requirements. However, some components and materials necessary for the production of our RRPs, including those for the electronic devices, are obtained from single or limited sources, and can be subject to industry-wide shortages and price fluctuations. Our inability to secure an adequate supply of such components and materials could negatively impact the commercialization of our RRPs.
Our IQOS devices are subject to standard product warranties generally for a period of 12 months from the date of purchase or such other periods as required by law. We discuss product warranties in more detail in Note 16. Product Warranty. The significance of warranty claims is dependent on a number of factors including warranty policies and product failure rates and may increase with the number of devices sold.
To further improve the consumer experience, we introduced a new version of the IQOS device in the first quarter of 2017 and continue to develop product improvements.
We are also progressing with ourOur commercialization efforts for the other RRP platforms:platforms are as follows:
We currently market our e-vapor products in several markets, including Ireland, Israel, Spain and the U.K. A city test of MESH, one of our Platform 4 products, is ongoing in Birmingham, U.K., and we expect to initiate a pilot launch of a next-generation version of this product later in 2018.
In December 2017, we initiated a small-scale city test of TEEPS, our Platform 2 product, in Santo Domingo, the Dominican Republic.
In 2018, we plan to conduct a consumer test of our Platform 3 product.
RRP Regulation and Taxation: RRPs contain nicotine and are not risk-free. We therefore support science-based regulation and taxation of RRPs. Regulation and taxation should differentiate between cigarettes and products that present, are likely to present, or have the potential to present less risk of harm to adult smokers who switch to these products versus continued smoking.smoking and recognize a continuum of risk for tobacco and other nicotine-containing products. Regulation should provide minimum standards for RRPs and specific rules for product assessment methodologies, ingredients, labelling and consumer communication, and should ensure that the public is informed about the health risks of all combustible and non-combustible tobacco and nicotine-containing products. Regulation,Tobacco regulation, as well as tobacco industry activities, should reflect the fact that youth should not consume nicotine in any form.
Some governments have banned or are seeking to ban or severely restrict emerging tobacco and nicotine-containing products such as our RRPs.RRPs and communication of truthful and non-misleading information about such products. These regulations might foreclose or unreasonably restrict adult consumer access even to products that might be shown to be a better consumer choice than continuing to smoke. We oppose such blanket bans and unreasonable restrictions of products that have the potential to present less risk of harm compared to continued smoking. By contrast, we support regulation that sets clear standards and propels innovation to benefit adult smokers who would otherwise continue to smoke.
In the United States, an established regulatory framework for assessing “Modified Risk Tobacco Products” and “New Tobacco Products” exists under the jurisdiction of the FDA. We submitted to the FDA a Modified Risk Tobacco Product Application (“MRTPA”) for IQOS in December 2016, and a Premarket Tobacco Product Application (“PMTA”) for IQOS in March 2017. In May 2017, the FDA formally accepted and filed our MRTPA for substantive scientific review and, in June 2017, the FDA opened the period for the public to provide comments on our application. In August 2017, the FDA completed a preliminary review of our PMTA and accepted our application for substantive review. The FDA referred our MRTPA to the Tobacco Product Scientific Advisory Committee (“TPSAC”). TPSAC held a meeting on January 24 and January 25, 2018 to discuss our MRTPA. The recommendations and votes of TPSAC are not binding on the FDA. By regulation, the FDA’s decision on our MRTPA will take into account, in addition to the views of TPSAC, scientific evidence as well as comments, data and information submitted by interested persons.
Separately, onin July 28, 2017, the FDA issued a policy announcement aiming to explore the potential of nicotine reduction in cigarettes in conjunction with the availability of less harmful products that deliver nicotine for adults who choose to use such products. In July 2018, as part of a public consultation procedure, we submitted our views on this topic to the FDA.
Future FDA actions may influence the regulatory approach of other governments.
In the EU, all EU Member States and Norway have transposed the EU Tobacco Products Directive, including the provisions on novel tobacco products, such as heated tobacco units, and e-cigarettes. Most of the EU Member States require a notification
submitted six months before the intended placing on the market of a novel tobacco product, while some require pre-market authorizations for the introduction of such products. To date, we have filed a comprehensive dossier summarizing our scientific assessment of IQOS in 22 Member States. In addition, in Italy, in April 2018, we submitted under recent legislation an application for HEETS, used with the IQOS device, requesting regulatory recognition of the reduction of toxic substances and potential risk reduction resulting from switching to this product compared to continued cigarette smoking. Also, pursuant to local regulations, in May 2018, we submitted a scientific dossier to regulatory authorities in Bulgaria with the notification of our intent to communicate to adult smokers the reduction of measured HPHCs and potential risk reduction resulting from switching to IQOS compared to continued cigarette smoking.
To date, several governmental agencies published their scientific findings that pertain to our RRPs.
On December 12, 2017, at the request of the U.K. Department of Health and Public Health England, the U.K. Committee on Toxicity published its assessment of the risk of heated tobacco products relative to cigarette smoking. This assessment included analysis of scientific data for two heated tobacco products, one of which was IQOS. The assessment concluded that, while still harmful to health, compared with the known risks from cigarettes, heated tobacco products are probably less harmful. Subsequently, on February 6, 2018, Public Health England published a report stating that the available evidence suggests that heated tobacco products may be considerably less harmful than cigarettes and more harmful than e-cigarettes.
On May 5, 2018, the German Federal Institute for Risk Assessment (“BfR”) published a study on the IQOS aerosol relative to cigarette smoke using the Health Canada Intense Smoking Regimen. BfR found reductions in selected HPHCs in a range of 80-99%. This publication indicates that significant reductions in the levels of selected toxicants are likely to reduce toxicant exposure, which BfR stated might be regarded as a discrete benefit compared to combustible cigarettes.
On May 15, 2018, the Dutch National Institute for Public Health and Environment (“RIVM”) published a factsheet on novel tobacco products that heat rather than burn tobacco, focusing on IQOS. RIVM analyzed the IQOS aerosol and concluded that the use of heated tobacco units with IQOS, while still harmful to health, is probably less harmful than continued smoking.
On June 7, 2018, the Korean Food and Drug Administration (“KFDA”) issued a statement on products that heat rather than burn tobacco. The KFDA tested three heat-not-burn products, one of which was IQOS. The KFDA confirmed that the levels of the nine HPHCs tested in the aerosol of these products were on average approximately 90% lower compared to those measured in the cigarette smoke of the top five cigarette brands in South Korea. However, the KFDA stated that it could not establish that the tested heat-not-burn products are less harmful than cigarettes.
We make our scientific findings publicly available for scrutiny and peer review through several channels, including our websites. From time to time, adult consumers, competitors, members of the scientific community, and others inquire into our scientific methodologies, challenge our scientific conclusions or request further study of certain aspects of our RRPs and their health effects. We are committed to a robust and open scientific debate but believe that such debate should be based on accurate and reliable scientific information. We seek to provide accurate and reliable scientific information about our RRPs; nonetheless, we may not be able to prevent third-party dissemination of false, misleading or unsubstantiated information about these products. The dissemination of scientifically unsubstantiated information or studies with a strong confirmation bias by third parties may cause confusion among adult smokers and affect their decision to switch to better alternatives to continued smoking, such as our RRPs.
To date, we have been largely successful in demonstrating to regulators that our RRPs are not cigarettes, and as such they are generally taxed either as a separate category or as other tobacco products, which typically yields more favorable tax rates than cigarettes. Although we believe that this is sensible from the public health perspective, we cannot guarantee that regulators will continue this approach.
There can be no assurance that we will succeed in our efforts to replace cigarettes with RRPs or that regulation will allow us to commercialize RRPs in all markets, to communicate scientifically substantiated risk-reduction claims, or to treat RRPs differently from cigarettes.
Our RRP Business Development Initiatives: In December 2013, we established a strategic framework with Altria Group, Inc. (“Altria”) under which Altria will make available its e-vapor products exclusively to us for commercialization outside the United States, and we will make available two of our RRPs exclusively to Altria for commercialization in the United States. In March 2015, we launched Solaris, a Platform 4 e-vapor product licensed from Altria, in Spain. In December 2015, we introduced Solaris in Israel.
In July 2015, we extended the strategic framework with Altria to include a Joint Research, Development and Technology Sharing Agreement. The additional agreement provides the framework under which PMI and Altria will collaborate to develop the next generation of e-vapor products for commercialization in the United States by Altria and in markets outside the United States by PMI. The collaboration between PMI and Altria in this endeavor is enabled by exclusive technology cross licenses and technical
information sharing. The agreements also provide for cooperation on the scientific assessment of, and for the sharing of improvements to, the existing generation of licensed products.
Other Developments: On September 12, 2017, we announced our support of the Foundation for a Smoke-Free World. We agreed to contribute $80 million per year over the next 12 years, as specified in the agreement. We made an initial contribution of $4.5 million in 2017 and the first annual contribution of $80 million in the first quarter of 2018. The Foundation is an independent body and is governed by its independent Board of Directors. The Foundation’s role, as set out in its corporate charter, includes funding research in the field of tobacco harm reduction, encouraging measures that reduce the harm caused by smoking, and assessing the effect of reduced cigarette consumption on the industry value chain.
Governmental Investigations
From time to time, we are subject to governmental investigations on a range of matters. We describe certain matters pending in Thailand and South Korea in Note 8. Contingencies.
In November 2010, a WTO panel issued its decision in a dispute relating to facts that arose from August 2006 between the Philippines and Thailand concerning a series of Thai customs and tax measures affecting cigarettes imported by PM Thailand into Thailand (see Note 8. Contingencies for additional information). The WTO panel decision, which was upheld by the WTO Appellate Body, concluded that Thailand had no basis to find that PM Thailand's declared customs values and taxes paid were too low, as alleged by the DSI in 2009. The decision also created obligations for Thailand to revise its laws, regulations, or practices affecting the customs valuation and tax treatment of future cigarette imports. Thailand agreed in September 2011 to fully comply with the decision by October 2012. The Philippines asserts that to date Thailand has not fully complied with the WTO panel decision. The Philippines has repeatedly expressed concerns with ongoing investigations by Thailand of PM Thailand, including those that led to the criminal charges described in Note 8. Contingencies, and has commenced two formal proceedings at the WTO to challenge criminal charges against PM Thailand arguing that the criminal charges appear to be based on grounds not supported by WTO customs valuation rules and inconsistent with several decisions already taken by Thai Customs and other Thai governmental agencies. The Philippines has also asserted that the demand notices received by PM Thailand from the Thai Customs Department in November 2017, described in Note 8. Contingencies, are inconsistent with Thailand's WTO obligations.
U.S. GAAP Treatment of Argentina as a Highly Inflationary Economy
Following the categorization of Argentina by the International Practices Task Force of the Center for Audit Quality as a country with a three-year cumulative inflation rate greater than 100%, the country is considered highly inflationary in accordance with U.S. GAAP. Consequently, we will begin to account for the operations of our Argentinian affiliates as highly inflationary, and treat the U.S. dollar as the functional currency of the affiliates, effective July 1, 2018. We estimate that this change will reduce our full-year 2018 currency-neutral net revenue growth by approximately 0.5%.
Acquisitions
We discuss our acquisitions in Note 17. Acquisitions to our condensed consolidated financial statements.
Investments in Unconsolidated Subsidiaries and Equity Securities
We discuss our investments in unconsolidated subsidiaries and equity securities in Note 11. Fair Value Measurements and Note 14. Investments in Unconsolidated Subsidiaries to our condensed consolidated financial statements.
Trade Policy
We are subject to various trade restrictions imposed by the United States of America and countries in which we do business (“Trade Sanctions”), including the trade and economic sanctions administered by the U.S. Department of the Treasury's Office of Foreign Assets Control and the U.S. Department of State. It is our policy to comply fully with these Trade Sanctions.
Tobacco products are agricultural products under U.S. law and are not technological or strategic in nature. From time to time we make sales in countries subject to Trade Sanctions, either where such sanctions do not apply to our business or pursuant to exemptions or licenses.
To our knowledge, none of our commercial arrangements results in the governments of any country identified by the U.S. government as a state sponsor of terrorism, nor entities controlled by those governments, receiving cash or acting as intermediaries in violation of U.S. laws.
We do not sell products in Iran, Sudan, North Korea and Syria. From time to time, we explore opportunities to sell our products in one or more of these countries, as permitted by law.
In January 2018, we commenced sales of cigarettes in Cuba, as permitted by U.S. law.
Certain states within the U.S. have enacted legislation permitting state pension funds to divest or abstain from future investment
in stocks of companies that do business with certain countries that are sanctioned by the U.S. We do not believe such legislation has had a material effect on the price of our shares.
Operating Results – For the Three Months and Six Months Ended March 31,June 30, 2018
The following discussion compares operating results within each of our reportable segments for the three months and six months ended March 31,June 30, 2018, with the three months and six months ended March 31,June 30, 2017.
Unless otherwise stated, references to total industry, total market, our shipment volume and our market share performance reflect cigarettes and heated tobacco units.
European Union:
| | Financial Summary -
Quarters Ended March 31, | | | | Change
Fav./(Unfav.) | | Variance
Fav./(Unfav.) | |
| | 2018 | 2017 | | Total | Excl.
Curr. | | Total | Cur-
rency | Price | Vol/
Mix | Cost/
Other | |
Financial Summary -
Quarters Ended June 30, | | | | | Change
Fav./(Unfav.) | | Variance
Fav./(Unfav.) |
| | 2018 | 2017 | | Total | Excl.
Curr. | | Total | Cur-
rency | Price | Vol/
Mix | Cost/
Other |
| (in millions) | | 2018 | 2017 | | Total | Excl.
Curr. | | Total | Cur-
rency | Price | Vol/
Mix | Cost/
Other | |
| Net Revenues | | | $ | 2,503 |
| $ | 2,110 |
| | 18.6 | % | 5.5 | % | | $ | 393 |
| $ | 278 |
| $ | 71 |
| $ | 44 |
| $ | — |
|
| Operating Income | | $ | 740 |
| $ | 748 |
| | (1.1 | )% | (15.8 | )% | | $ | (8 | ) | $ | 110 |
| $ | 46 |
| $ | (67 | ) | $ | (97 | ) | | $ | 1,177 |
| $ | 944 |
| | 24.7 | % | 6.8 | % | | $ | 233 |
| $ | 169 |
| $ | 71 |
| $ | 19 |
| $ | (26 | ) |
“Cost/Other” in the above table reflects the currency-neutral variances of: cost of sales (excluding the volume/mix cost component); marketing, administration and research costs; asset impairment and exit costs; and amortization of intangibles.
DuringFor the quarter,three months ended June 30, 2018, net revenues, excluding favorable currency, increased by 0.2%5.5%, mainly reflecting: a favorable pricing variance, driven principally by Germany, PolandItaly and the United Kingdom,Poland, partly offset by France; and unfavorablefavorable volume/mix, notablymainly driven by favorable volume in FranceBulgaria, the Czech Republic, Germany and Germany,Poland, partly offset by Italy.France.
The net revenues of the European Union segment include $152$182 million in 2018 and $31$50 million in 2017 related to the sale of RRPs.
Operating income, excluding favorable currency, increased by 6.8%, mainly reflecting: a favorable pricing variance; and favorable volume/mix, driven principally by Bulgaria, the Czech Republic and Romania, partly offset by France and Italy; partially offset by higher manufacturing costs and higher marketing, administration and research costs, primarily reflecting increased investment behind reduced-risk products.
|
| | | | | | | | | | | | | | | | | | | | | | | | | | | | |
Financial Summary -
Six Months Ended June 30, | | | | | Change
Fav./(Unfav.) | | Variance
Fav./(Unfav.) |
| | 2018 | 2017 | | Total | Excl.
Curr. | | Total | Cur-
rency | Price | Vol/
Mix | Cost/
Other |
| (in millions) | | | |
| Net Revenues | | $ | 4,491 |
| $ | 3,850 |
| | 16.6 | % | 3.1 | % | | $ | 641 |
| $ | 523 |
| $ | 117 |
| $ | 1 |
| $ | — |
|
| Operating Income | | $ | 1,917 |
| $ | 1,692 |
| | 13.3 | % | (3.2 | )% | | $ | 225 |
| $ | 279 |
| $ | 117 |
| $ | (48 | ) | $ | (123 | ) |
“Cost/Other” in the above table reflects the currency-neutral variances of: cost of sales (excluding the volume/mix cost component); marketing,
administration and research costs; asset impairment and exit costs; and amortization of intangibles.
For the six months ended June 30, 2018, net revenues, excluding favorable currency, increased by 3.1%, reflecting a favorable pricing variance, driven principally by Germany and Poland, partly offset by France.
The net revenues of the European Union segment include $334 million in 2018 and $81 million in 2017 related to the sale of RRPs.
Operating income, excluding favorable currency, decreased by 15.8%3.2%, mainly due to: unfavorable volume/mix, notably in France, and Germany and the United Kingdom; higher marketing, administration and research costs, primarily reflecting increased investment behind RRPsreduced-risk products across the Region,Region; and higher manufacturing costs; partly offset by a favorable pricing variance.
European Union - Total Market, PMI Shipment Volume and Market Share Commentaries
Total market, PMI shipment volume and market share performance are shown in the tables below:
| | | European Union Key Data | | First-Quarter | | Second-Quarter | | Six Months Year-to-Date |
| | | | Change |
| | | Change |
| | | Change |
|
| | | 2018 |
| 2017 |
| % / pp |
| | 2018 |
| 2017 |
| % / pp |
| | 2018 |
| 2017 |
| % / pp |
|
| Total Market (billion units) | | 107.7 |
| 112.3 |
| (4.1 | )% | | 125.9 |
| 128.5 |
| (2.0 | )% | | 233.6 |
| 240.8 |
| (3.0 | )% |
| | | | | | | |
| PMI Shipment Volume (million units) | | | | | | |
| Cigarettes | | 39,671 |
| 42,540 |
| (6.7 | )% | | 47,984 |
| 49,758 |
| (3.6 | )% | | 87,655 |
| 92,298 |
| (5.0 | )% |
| Heated Tobacco Units | | 928 |
| 184 |
| +100.0% |
| | 1,195 |
| 392 |
| +100.0% |
| | 2,123 |
| 576 |
| +100.0% |
|
| Total European Union | | 40,599 |
| 42,724 |
| (5.0 | )% | | 49,179 |
| 50,150 |
| (1.9 | )% | | 89,778 |
| 92,874 |
| (3.3 | )% |
| | | | | | | |
| PMI Market Share | | | | | | |
| Marlboro | | 18.3 | % | 18.8 | % | (0.5 | ) | | 18.5 | % | 18.7 | % | (0.2 | ) | | 18.5 | % | 18.7 | % | (0.2 | ) |
| L&M | | 6.7 | % | 7.0 | % | (0.3 | ) | | 7.0 | % | 7.0 | % | — |
| | 6.9 | % | 7.0 | % | (0.1 | ) |
| Chesterfield | | 5.9 | % | 6.1 | % | (0.2 | ) | | 5.9 | % | 5.9 | % | — |
| | 5.9 | % | 6.0 | % | (0.1 | ) |
| Philip Morris | | 3.1 | % | 3.2 | % | (0.1 | ) | | 2.9 | % | 3.1 | % | (0.2 | ) | | 3.0 | % | 3.1 | % | (0.1 | ) |
| HEETS | | 0.8 | % | 0.1 | % | 0.7 |
| | 1.0 | % | 0.2 | % | 0.8 |
| | 0.9 | % | 0.2 | % | 0.7 |
|
| Others | | 3.4 | % | 3.2 | % | 0.2 |
| | 3.2 | % | 3.1 | % | 0.1 |
| | 3.2 | % | 3.2 | % | — |
|
| Total European Union | | 38.2 | % | 38.4 | % | (0.2 | ) | | 38.5 | % | 38.0 | % | 0.5 |
| | 38.4 | % | 38.2 | % | 0.2 |
|
In the second quarter, the estimated total market in the EU decreased by 4.1%2.0% to 107.7125.9 billion units, mainly due to:
France, down by 12.4%, primarily reflecting the impact of significant excise-tax driven price increases in November 2017 and March 2018, and an increase in the prevalence of illicit trade; and
Italy, down by 2.9%, primarily reflecting the impact of retail price increases in March 2018;
partly offset by
Poland, up by 4.7%, primarily reflecting a reduction in the prevalence of illicit trade.
In the second quarter, our total shipment volume decreased by 1.9% to 49.2 billion units, or by 3.4%0.8% excluding the net impact of unfavorable estimated distributor inventory movements, notably due to:
France, down by 5.0%, primarily due to a lower total market, partly offset by higher market share primarily driven by Marlboro, benefiting from its round price of €8.00/pack as of March 2018, and Philip Morris;
Italy, down by 9.2%, or by 3.9% excluding unfavorable distributor inventory movements reflecting the normalization of distributor inventory levels, partly offset by higher heated tobacco unit shipment volume; and
Spain, down by 4.8%, primarily due to the lower total market and unfavorable distributor inventory movements;
partly offset by
Germany, up by 2.2%, primarily driven by higher market share, notably of Marlboro, and higher heated tobacco unit shipment volume; and
Poland, up by 2.7%, primarily reflecting the higher total market.
In the second quarter, our total market share increased by 0.5 points to 38.5%, with gains notably in Austria, Belgium, Bulgaria, France, Germany, Greece, Hungary, the Netherlands, Portugal, Romania and the United Kingdom, partly offset by declines, notably in the Czech Republic, Italy, Poland, Spain and Switzerland.
For the six months year-to-date, the estimated total market in the EU decreased by 3.0% to 233.6 billion units, or by 2.5% excluding the net impact of unfavorable estimated trade inventory movements, notably due to:
France, down by 9.4%10.9%, reflecting the same factors as in the quarter;
Germany, down by 4.3%, primarily reflecting the impact of significant excise-tax driven price increases in November 2017 and in March 2018;
Germany,Italy, down by 7.9%1.9%, reflecting the same factor as in the quarter; and
the United Kingdom, down by 7.0%, primarily reflecting the impact of price increases.
For the six months year-to-date, our total shipment volume decreased by 3.3% to 89.8 billion units, or by 3.0%2.6% excluding the net impact of unfavorable estimated tradedistributor inventory movements, largely related to the fourth quarter of 2017, primarily reflecting the impact of pricing in 2017 and in March 2018; and
Poland, down by 3.7%, or by 1.8% excluding the net impact of estimated trade inventory movements largely related to the fourth quarter of 2017.
Our total shipment volume decreased by 5.0% to 40.6 billion units, notably due to:
France, down by 8.9%6.8%, primarily due to a lower total market, partly offset by higher market share primarily driven by: Marlboro, partly resulting from the narrowing of its retail price gap with low price brands to €0.30/packsame factors as of March 2018; and Philip Morris, reflecting its momentum duringin the first two months of 2018 driven by its price repositioning to €7.00/pack in November 2017;
quarter;Germany, down by 12.4%4.8%, primarily due to athe lower total market and market share, reflecting the unfavorable impact of the estimated trade inventory movements;market; and
Poland,Italy, down by 9.2%4.3%, primarily due to: a lower total market, as well as lower market share, mainly due to: Marlboro, reflecting the impact of a widened retail price gap with the low price end of the market, as well as switching to RRPs; and L&M, reflecting anor by 2.2% excluding unfavorable comparison with the first quarter of 2017 related to brand support;
partly offset by
Italy, up by 2.1%, driven by favorable comparisons to the first quarter of 2017 related to distributor inventory movements as well asassociated with the timing of price increases in March 2018, partly offset by higher heated tobacco unit shipment volume; and
Spain, up by 1.9%, driven by favorable comparisons to the first quarter of 2017 related to distributor inventory movements.volume.
OurFor the six months year-to-date, our total market share decreasedincreased by 0.2 points to 38.2%38.4%, with declinesgains notably in Germany, mainly reflecting the unfavorable impact of the estimated trade inventory movements,Belgium, Bulgaria, France, Greece, Hungary, Portugal and Poland,Romania, partly offset by gainsdeclines, notably in France,Austria, the Czech Republic, Germany, Italy, RomaniaPoland, Switzerland and Spain.the United Kingdom.
Eastern Europe:
| | Financial Summary -
Quarters Ended March 31, | | | | Change
Fav./(Unfav.) | | Variance
Fav./(Unfav.) | |
| | 2018 | 2017 | | Total | Excl.
Curr. | | Total | Cur-
rency | Price | Vol/
Mix | Cost/
Other | |
Financial Summary -
Quarters Ended June 30, | | | | | Change
Fav./(Unfav.) | | Variance
Fav./(Unfav.) |
| | 2018 | 2017 | | Total | Excl.
Curr. | | Total | Cur-
rency | Price | Vol/
Mix | Cost/
Other |
| (in millions) | | 2018 | 2017 | | Total | Excl.
Curr. | | Total | Cur-
rency | Price | Vol/
Mix | Cost/
Other | |
| Net Revenues | | | $ | 760 |
| $ | 697 |
| | 9.0 | % | 10.3 | % | | $ | 63 |
| $ | (9 | ) | $ | 92 |
| $ | (20 | ) | $ | — |
|
| Operating Income | | $ | 151 |
| $ | 159 |
| | (5.0 | )% | (10.1 | )% | | $ | (8 | ) | $ | 8 |
| $ | 60 |
| $ | (47 | ) | $ | (29 | ) | | $ | 261 |
| $ | 224 |
| | 16.5 | % | 25.9 | % | | $ | 37 |
| $ | (21 | ) | $ | 92 |
| $ | (41 | ) | $ | 7 |
|
“Cost/Other” in the above table reflects the currency-neutral variances of: cost of sales (excluding the volume/mix cost component); marketing, administration and research costs; asset impairment and exit costs; and amortization of intangibles.
DuringFor the quarter,three months ended June 30, 2018, net revenues, excluding favorableunfavorable currency, increased by 4.3%10.3%, principally driven byreflecting a favorable pricing variance, notably indriven by Russia and Ukraine, partly offset by unfavorable volume/mix, primarily due to lower mix in Russia.
The net revenues of the Eastern Europe segment include $40$65 million in 2018 and $3$6 million in 2017 related to the sale of RRPs.
Operating income, excluding unfavorable currency, increased by 25.9%, mainly reflecting: a favorable currency, decreased by 10.1%, principally due to: unfavorable volume/mix; higherpricing variance, as well as lower manufacturing costs; and higher marketing, administration and research costs, primarily reflecting increased investments behind IQOS in Russia; partly offset by a favorable pricing variance.
Eastern Europe - Total Market, PMI Shipment Volume and Market Share Commentaries
In the quarter, the estimated total marketunfavorable volume/mix, predominantly in Eastern Europe decreased, notably due to:
Russia, down by 8.3%, or by 7.3% excluding the unfavorable impact of estimated trade inventory movements, primarily reflecting the timing and impact of retail price increases in 2017 and the quarter, as well as an increase in the prevalence of illicit trade; and
Ukraine, down by 11.4%, or by 9.4% excluding the net impact of estimated trade inventory movements related to the fourth quarter of 2017, primarily reflecting the impact of excise tax-driven retail price increases in 2017 and the quarter.
|
| | | | | | | |
| PMI Shipment Volume (million units) | | First-Quarter |
| | | 2018 |
| 2017 |
| Change |
|
| Cigarettes | | 22,039 |
| 24,596 |
| (10.4 | )% |
| Heated Tobacco Units | | 564 |
| 54 |
| +100.0% |
|
| Total Eastern Europe | | 22,603 |
| 24,650 |
| (8.3 | )% |
Our total shipment volume decreased by 8.3% to 22.6 billion units, notably in:
Russia, down by 13.9%, or by 12.7% excluding the unfavorable impact of estimated inventory movements, mainly due to the lower total market; lower market share, largely due to Bond Street, partly reflecting the impact of down-trading to competitive products in the low price segment, partly offset by higher share of premium-priced brands; and
Ukraine, down by 9.5%, mainly due to the lower total market;
partly offset by
higher heated tobacco unit shipment volume, notably in Russia and Ukraine.
Russia.
Middle East & Africa:
| | Financial Summary -
Quarters Ended March 31, | | | | Change
Fav./(Unfav.) | | Variance
Fav./(Unfav.) | |
| | 2018 | 2017 | | Total | Excl.
Curr. | | Total | Cur-
rency | Price | Vol/
Mix | Cost/
Other | |
Financial Summary -
Six Months Ended June 30, | | | | | Change
Fav./(Unfav.) | | Variance
Fav./(Unfav.) |
| | 2018 | 2017 | | Total | Excl.
Curr. | | Total | Cur-
rency | Price | Vol/
Mix | Cost/
Other |
| (in millions) | | 2018 | 2017 | | Total | Excl.
Curr. | | Total | Cur-
rency | Price | Vol/
Mix | Cost/
Other | |
| Net Revenues | | | $ | 1,327 |
| $ | 1,213 |
| | 9.4 | % | 7.7 | % | | $ | 114 |
| $ | 20 |
| $ | 152 |
| $ | (58 | ) | $ | — |
|
| Operating Income | | $ | 374 |
| $ | 491 |
| | (23.8 | )% | (17.3 | )% | | $ | (117 | ) | $ | (32 | ) | $ | 19 |
| $ | (50 | ) | $ | (54 | ) | | $ | 412 |
| $ | 383 |
| | 7.6 | % | 11.0 | % | | $ | 29 |
| $ | (13 | ) | $ | 152 |
| $ | (88 | ) | $ | (22 | ) |
“Cost/Other” in the above table reflects the currency-neutral variances of: cost of sales (excluding the volume/mix cost component); marketing, administration and research costs; asset impairment and exit costs; and amortization of intangibles.
DuringFor the quarter,six months ended June 30, 2018, net revenues, excluding favorable currency, decreasedincreased by 1.5%7.7%, reflecting a favorable pricing variance, driven by Russia and Ukraine, largely driven by annualization of prior-year pricing and first-quarter 2018 price increases, partly offset by unfavorable volume/mix, primarily due to Russia.
The net revenues of the Eastern Europe segment include $105 million in 2018 and $9 million in 2017 related to the sale of RRPs.
Operating income, excluding unfavorable currency, increased by 11.0%, mainly reflecting: a favorable pricing variance; partly offset by unfavorable volume/mix, predominantly due to unfavorableRussia, and higher marketing, administration and research costs notably reflecting increased investments behind reduced-risk products in Russia.
Eastern Europe - Total Market, PMI Shipment Volume and Market Share Commentaries
In the second quarter, the estimated total market in Eastern Europe decreased, notably due to:
Russia, down by 7.7%, primarily reflecting an increase in the prevalence of illicit trade, as well as the timing and impact of retail price increases; and
Ukraine, down by 8.6%, primarily reflecting the timing and impact of excise-tax driven retail price increases and an increase in the prevalence of illicit trade.
For the six months year-to-date, the estimated total market in Eastern Europe decreased, notably due to:
Russia, down by 8.9%, mainly reflecting the same factors as in the quarter; and
Ukraine, down by 9.9%, mainly reflecting the same factors as in the quarter.
|
| | | | | | | | | | | | | |
| PMI Shipment Volume (million units) | Second-Quarter | | Six Months Year-to-Date |
| | 2018 |
| 2017 |
| Change |
| | 2018 |
| 2017 |
| Change |
|
| Cigarettes | 28,454 |
| 32,081 |
| (11.3 | )% | | 50,493 |
| 56,677 |
| (10.9 | )% |
| Heated Tobacco Units | 951 |
| 117 |
| +100.0% |
| | 1,515 |
| 171 |
| +100.0% |
|
| Total Eastern Europe | 29,405 |
| 32,198 |
| (8.7 | )% | | 52,008 |
| 56,848 |
| (8.5 | )% |
In the second quarter, our total shipment volume decreased by 8.7% to 29.4 billion units, notably in:
Russia, down by 10.4%, mainly due to the lower total market; lower market share, largely due to Bond Street, reflecting the impact of down-trading to competitive products in the low price segment, partly offset by Philip Morris; partially offset by higher heated tobacco unit shipment volume; and
Ukraine, down by 11.8%, mainly due to the lower total market.
For the six months year-to-date, our total shipment volume decreased by 8.5% to 52.0 billion units, notably in:
Russia, down by 11.9%, mainly due to the lower total market; lower market share, largely due to Bond Street, reflecting the impact of down-trading to competitive products in the low price segment, partly offset by Philip Morris; partially offset by higher heated tobacco unit shipment volume; and
Ukraine, down by 10.8%, mainly due to the lower total market.
Middle East & Africa:
|
| | | | | | | | | | | | | | | | | | | | | | | | | | | | |
Financial Summary -
Quarters Ended June 30, | | | | | Change
Fav./(Unfav.) | | Variance
Fav./(Unfav.) |
| | 2018 | 2017 | | Total | Excl.
Curr. | | Total | Cur-
rency | Price | Vol/
Mix | Cost/
Other |
| (in millions) | | | |
| Net Revenues | | $ | 1,022 |
| $ | 978 |
| | 4.5 | % | 4.5 | % | | $ | 44 |
| $ | — |
| $ | (27 | ) | $ | 23 |
| $ | 48 |
|
| Operating Income | | $ | 403 |
| $ | 477 |
| | (15.5 | )% | (12.6 | )% | | $ | (74 | ) | $ | (14 | ) | $ | (27 | ) | $ | — |
| $ | (33 | ) |
“Cost/Other” in the above table reflects the currency-neutral variances of: cost of sales (excluding the volume/mix primarily relatedcost component); marketing, administration and research costs; asset impairment and exit costs; and amortization of intangibles. “Cost/Other” also includes the currency-neutral net revenue variance, unrelated to volume/mix and price components, attributable to fees for certain distribution rights billed to customers in certain markets in the ME&A Region. This immaterial presentational change, made in conjunction with the new revenue recognition standard, is prospective only.
For the three months ended June 30, 2018, net revenues, excluding currency, increased by 4.5%, reflecting: favorable volume/mix, principally driven by higher volume in Egypt, PMI Duty Free and Turkey, partly offset by Saudi Arabia and the UAE; and a favorable "cost/other" variance, as described above; partly offset by an unfavorable pricing variance, mainly due to Saudi Arabia, partly offset by Turkey.Egypt.
The net revenues of the Middle East & Africa segment include $77$112 million in 2018 and $4$10 million in 2017 related to the sale of RRPs.
Operating income, excluding unfavorable currency, decreased by 17.3%12.6%, predominantly duemainly reflecting an unfavorable pricing variance; higher manufacturing costs, principally in Egypt and Turkey; and higher marketing, administration and research costs, mainly reflecting increased investments behind reduced-risk products in PMI Duty Free.
|
| | | | | | | | | | | | | | | | | | | | | | | | | | | | |
Financial Summary -
Six Months Ended June 30, | | | | | Change
Fav./(Unfav.) | | Variance
Fav./(Unfav.) |
| | 2018 | 2017 | | Total | Excl.
Curr. | | Total | Cur-
rency | Price | Vol/
Mix | Cost/
Other |
| (in millions) | | | |
| Net Revenues | | $ | 1,983 |
| $ | 1,939 |
| | 2.3 | % | 1.5 | % | | $ | 44 |
| $ | 14 |
| $ | (51 | ) | $ | (10 | ) | $ | 91 |
|
| Operating Income | | $ | 777 |
| $ | 968 |
| | (19.7 | )% | (15.0 | )% | | $ | (191 | ) | $ | (46 | ) | $ | (51 | ) | $ | (50 | ) | $ | (44 | ) |
“Cost/Other” in the above table reflects the currency-neutral variances of: cost of sales (excluding the volume/mix cost component); marketing, administration and research costs; asset impairment and exit costs; and amortization of intangibles. “Cost/Other” also includes the currency-neutral net revenue variance, unrelated to volume/mix and price components, attributable to fees for certain distribution rights billed to customers in certain markets in the ME&A Region. This immaterial presentational change, made in conjunction with the new revenue recognition standard, is prospective only.
For the six months ended June 30, 2018, net revenues, excluding favorable currency, increased by 1.5%, reflecting: a favorable "cost/other" variance, as described above; partly offset by an unfavorable pricing variance, driven mainly by Saudi Arabia and Turkey, partly offset by Egypt, as well as unfavorable volume/mix, primarily due to lower volume in Saudi Arabia and the UAE, partly offset by higher volume in PMI Duty Free and Turkey.
The net revenues of the Middle East & Africa segment include $189 million in 2018 and $14 million in 2017 related to the sale of RRPs.
Operating income, excluding unfavorable currency, decreased by 15.0%, mainly reflecting: an unfavorable pricing variance, unfavorable volume/mix, principally due to Saudi Arabia.Arabia and the UAE, partly offset by PMI Duty Free and Turkey, as well as higher manufacturing costs, principally in Egypt, and higher marketing, administration and research costs, mainly reflecting increased investments behind reduced-risk products in PMI Duty Free.
Middle East & Africa - Total Market, PMI Shipment Volume and Market Share Commentaries
In the second quarter, the estimated total market in the Middle East & Africa decreased,increased, notably due to:driven by:
North Africa, up by 7.5%, driven by Algeria downand Egypt; and
Turkey, up by 26.7%11.0%, or by 4.4% excluding the net unfavorable impact of estimated trade inventory movements, primarily reflecting an increasea reduction in the prevalence of illicit trade;
partly offset by
Saudi Arabia and the UAE, down by 40.8%23.8%, primarilyand 28.3%, respectively, reflecting the impact of retail price increases in 2017 and the quarter following the introduction of the new excise tax in June and October 2017, respectively, and VAT in January 2018.
For the six months year-to-date, the estimated total market in the Middle East & Africa decreased, notably due to:
Algeria, down by 8.9%, or up by 1.8% excluding the unfavorable impact of trade inventory movements associated with the first quarter of 2018; and
Saudi Arabia and the UAE, down by 33.2% and 30.1%, respectively, primarily reflecting the same factors as in the quarter;
partly offset by
Turkey, up by 12.4%14.0%, primarily reflecting a lower prevalence of illicit trade.the same factor as in the quarter.
| | | PMI Shipment Volume (million units) | | First-Quarter | Second-Quarter | | Six Months Year-to-Date |
| | | 2018 |
| 2017 |
| Change |
| 2018 |
| 2017 |
| Change |
| | 2018 |
| 2017 |
| Change |
|
| Cigarettes | | 29,248 |
| 31,978 |
| (8.5 | )% | 34,177 |
| 32,333 |
| 5.7 | % | | 63,425 |
| 64,311 |
| (1.4 | )% |
| Heated Tobacco Units | | 709 |
| 51 |
| +100.0% |
| 971 |
| 112 |
| +100.0% |
| | 1,680 |
| 163 |
| +100.0% |
|
| Total Middle East & Africa | | 29,957 |
| 32,029 |
| (6.5 | )% | 35,148 |
| 32,445 |
| 8.3 | % | | 65,105 |
| 64,474 |
| 1.0 | % |
OurIn the second quarter, our total shipment volume decreasedincreased by 6.5%8.3% to 30.035.1 billion units, notably in:
Algeria, downEgypt, up by 29.1%17.7%, mainlyor by 13.9% excluding estimated trade inventory movements, reflecting the lowera higher total market and higher market share;
Turkey, up by 11.3%, reflecting a higher total market; and
PMI Duty Free, reflecting higher heated tobacco unit shipment volume;
partly offset by
Saudi Arabia, down by 74.5%42.0%, or by 57.9% excluding the unfavorable impact of adjustments to distributor inventory levels in the quarter, reflecting the lower total market and market share due to the impact of excise and VAT-driven price increases; and
the aforementionedUAE, down by 69.6%, reflecting the impact of excise tax and VAT increases on retail prices;VAT-driven price increases.
partly offset
For the six months year-to-date, our total shipment volume increased by 1.0% to 65.1 billion units, notably in:
Egypt, up by 5.3%, reflecting the same factor as in the quarter;
Turkey, up by 16.8%13.8%, reflecting a higher total market and market share;market; and
PMI Duty Free, mainly reflecting higher heated tobacco shipment volume, notably in PMI Duty Free.
volume;
partly offset by
Saudi Arabia, down by 61.1%, reflecting the same factors as in the quarter; and
the UAE, down by 67.2%, reflecting the same factors as in the quarter.
South & Southeast Asia:
| | Financial Summary -
Quarters Ended March 31, | | Change
Fav./(Unfav.) | | Variance
Fav./(Unfav.) | |
| | 2018 | 2017 | | Total | Excl.
Curr. | | Total | Cur-
rency | Price | Vol/
Mix | Cost/
Other | |
Financial Summary -
Quarters Ended June 30, | | | | | Change
Fav./(Unfav.) | | Variance
Fav./(Unfav.) |
| | 2018 | 2017 | | Total | Excl.
Curr. | | Total | Cur-
rency | Price | Vol/
Mix | Cost/
Other |
| (in millions) | | 2018 | 2017 | | Total | Excl.
Curr. | | Total | Cur-
rency | Price | Vol/
Mix | Cost/
Other | |
| Net Revenues | | | $ | 1,156 |
| $ | 1,046 |
| | 10.5 | % | 14.4 | % | | $ | 110 |
| $ | (41 | ) | $ | 149 |
| $ | 2 |
| $ | — |
|
| Operating Income | | $ 429 | $ 370 | | 15.9 | % | 19.2 | % | | $ | 59 |
| $ | (12 | ) | $ | 102 |
| $ | (54 | ) | $ | 23 |
| | $ | 440 |
| $ | 319 |
| | 37.9 | % | 43.9 | % | | $ | 121 |
| $ | (19 | ) | $ | 149 |
| $ | (18 | ) | $ | 9 |
|
“Cost/Other” in the above table reflects the currency-neutral variances of: cost of sales (excluding the volume/mix cost component); marketing, administration and research costs; asset impairment and exit costs; and amortization of intangibles.
DuringFor the quarter,three months ended June 30, 2018, net revenues, excluding unfavorable currency, increased by 5.6%14.4%, reflecting: a favorable pricing variance, driven principally by Indonesia and the Philippines, partly offset by Thailand. TheUnfavorable mix in Indonesia was offset by favorable volume in Pakistan, the Philippines and Thailand.
Operating income, excluding unfavorable currency, increased by 43.9%, mainly reflecting: a favorable pricing variance wasvariance; a favorable manufacturing cost comparison, driven by the Philippines; partly offset by unfavorable volume/mix, largelymainly due to Indonesia, partly offset by Pakistan, the Philippines and Thailand.
|
| | | | | | | | | | | | | | | | | | | | | | | | | | | | |
Financial Summary -
Six Months Ended June 30, | | | | | Change
Fav./(Unfav.) | | Variance
Fav./(Unfav.) |
| | 2018 | 2017 | | Total | Excl.
Curr. | | Total | Cur-
rency | Price | Vol/
Mix | Cost/
Other |
| (in millions) | | | |
| Net Revenues | | $ | 2,237 |
| $ | 2,077 |
| | 7.7 | % | 10.1 | % | | $ | 160 |
| $ | (49 | ) | $ | 251 |
| $ | (42 | ) | $ | — |
|
| Operating Income | | $ | 869 |
| $ | 689 |
| | 26.1 | % | 30.6 | % | | $ | 180 |
| $ | (31 | ) | $ | 251 |
| $ | (72 | ) | $ | 32 |
|
“Cost/Other” in the above table reflects the currency-neutral variances of: cost of sales (excluding the volume/mix cost component); marketing, administration and research costs; asset impairment and exit costs; and amortization of intangibles.
For the six months ended June 30, 2018, net revenues, excluding unfavorable currency, increased by 10.1%, reflecting: a favorable pricing variance, driven principally by Indonesia and the Philippines, partly offset by Thailand; partly offset by unfavorable volume/mix, mainly due to unfavorable mix in Indonesia, partly offset by favorable volume in Pakistan and Thailand.
Operating income, excluding unfavorable currency, increased by 19.2%30.6%, mainly driven by a favorable pricing variance, as well as a favorable manufacturing and marketing, administration and research cost comparison, notably indriven by Indonesia and the Philippines. The favorable pricing variance and cost comparison were partly offset by unfavorable volume/mix, mainly indue to Indonesia, partly offset by Pakistan and Thailand.
South & Southeast Asia - Total Market, PMI Shipment Volume and Market Share Commentaries
In the second quarter, the estimated total market in South & Southeast Asia increased, notably driven by:
Pakistan, up over 100%by 39.5% or approximately 8.44.2 billion units, or by 31.4% excluding the favorable impact of estimated trade inventory movements, notably reflecting an increase in the duty-paid market driven by a reduction in the prevalence of illicit trade resulting from excise tax reform in May 2017;2017. Excluding the net impact of favorable estimated trade inventory movements, the total market was up by 29.1%;
partly offset by
Indonesia, down by 2.3%0.6%, reflecting soft consumer spending and above inflation excise tax-driven retail price increases in the quarter;increases;
the Philippines, down by 7.8%0.7%, reflecting the impact of excise tax-driven retail price increases in 2017 and an approximately 25%29% excise-tax driven increase to the industry weighted average retail pack price in the quarter;on a year-to-date basis; and
Thailand, down by 8.9%8.5%, primarily reflecting the impact of excise tax-driven price increasesincreases.
For the six months year-to-date, the estimated total market in South & Southeast Asia increased, notably driven by:
Pakistan, up by 75.4% or approximately 12.6 billion units, notably reflecting an increase in the duty-paid market driven by a reduction in the prevalence of illicit trade resulting from excise tax reform in May 2017. Excluding the net impact of favorable estimated trade inventory movements, the total market was up by 30.5%;
partly offset by
Indonesia, down by 1.5%, primarily reflecting the same factors as in the quarter;
the Philippines, down by 3.9%, primarily reflecting the same factors as in the quarter; and
Thailand, down by 9.7%, primarily reflecting the same factors as in the quarter.
| | | PMI Shipment Volume (million units) | | First-Quarter | Second-Quarter | | Six Months Year-to-Date |
| | | 2018 |
| 2017 |
| Change |
| 2018 |
| 2017 |
| Change |
| | 2018 |
| 2017 |
| Change |
|
| Cigarettes | | 40,218 |
| 37,899 |
| 6.1 | % | 44,788 |
| 42,025 |
| 6.6 | % | | 85,006 |
| 79,924 |
| 6.4 | % |
| Heated Tobacco Units | | — |
| — |
| — | % | — |
| — |
| — | % | | — |
| — |
| — | % |
| Total South & Southeast Asia | | 40,218 |
| 37,899 |
| 6.1 | % | 44,788 |
| 42,025 |
| 6.6 | % | | 85,006 |
| 79,924 |
| 6.4 | % |
OurIn the second quarter, our total shipment volume increased by 6.1%6.6% to 40.244.8 billion units, mainly driven by:
Indonesia, up by 0.7%, mainly driven by higher market share, driven by Marlboro Filter Black 20s and Dji Sam Soe Magnum Mild 16s, partly offset by a lower total market;
Pakistan, up over 100%by 57.8%, notably reflecting the higher total market, primarily driven by the reduction in the prevalence of illicit tradetrade;
the Philippines, up by 3.9%, mainly reflecting higher market share driven by Marlboro; and the favorable impact of estimated trade inventory movements;Fortune, reflecting a narrower retail price gap to competitors' products; and
Thailand, up by 45.9%65.0%, mainly reflecting higher market share driven by the price repositioning of the L&M;&M 7.1 variant.
For the six months year-to-date, our total shipment volume increased by 6.4% to 85.0 billion units, mainly driven by:
Pakistan, up by over 100%, notably reflecting the same dynamics as in the quarter;
the Philippines, up by 1.5%, mainly reflecting the same factors as in the quarter; and
Thailand, up by 54.8%, mainly reflecting the same factors as in the quarter;
partly offset by
Indonesia, down by 1.8%0.5%, mainly due to the lower total market, partially offset by higher market share, driven by Marlboro Filter Black 20s and Dji Sam Soe Magnum Mild 16s; and16s.
the Philippines, down by 1.4%, mainly due to the lower total market, largely offset by higher market share.
East Asia & Australia:
| | Financial Summary -
Quarters Ended March 31, | | Change
Fav./(Unfav.) | | Variance
Fav./(Unfav.) | |
| | 2018 | 2017 | | Total | Excl.
Curr. | | Total | Cur-
rency | Price | Vol/
Mix | Cost/
Other | |
Financial Summary -
Quarters Ended June 30, | | | Change
Fav./(Unfav.) | | Variance
Fav./(Unfav.) |
| | 2018 | 2017 | | Total | Excl.
Curr. | | Total | Cur-
rency | Price | Vol/
Mix | Cost/
Other |
| (in millions) | | 2018 | 2017 | | Total | Excl.
Curr. | | Total | Cur-
rency | Price | Vol/
Mix | Cost/
Other | |
| Net Revenues | | | $ 1,478 | $ 1,338 | | 10.5 | % | 7.1 | % | | $ | 140 |
| $ | 45 |
| $ | (36 | ) | $ | 131 |
| $ | — |
|
| Operating Income | | $ 515 | $ 472 | | 9.1 | % | 5.7 | % | | $ | 43 |
| $ | 16 |
| $ | 15 |
| $ | 46 |
| $ | (34 | ) | | $ 498 | $ 510 | | (2.4 | )% | (1.4 | )% | | $ | (12 | ) | $ | (5 | ) | $ | (36 | ) | $ | 99 |
| $ | (70 | ) |
“Cost/Other” in the above table reflects the currency-neutral variances of: cost of sales (excluding the volume/mix cost component); marketing,
administration and research costs; asset impairment and exit costs; and amortization of intangibles.
For the three months ended June 30, 2018, net revenues, excluding favorable currency, increased by 7.1%, reflecting: a favorable volume/mix, driven by heated tobacco unitvolume in Japan and Korea, partly offset by unfavorable volume in Australia. The favorable volume/mix was partly offset by an unfavorable pricing variance, mainly due to Korea, reflecting the impact of the excise tax increase on the heated tobacco category in December 2017, partly offset by Australia. The pricing variance was also unfavorably impacted by the retail price adjustment of June 1, 2018, in Japan of IQOS device inventories in the distribution and retail trade channels.
The net revenues of the East Asia & Australia segment include $656 million in 2018 and $549 million in 2017 related to the sale of RRPs.
Operating income, excluding unfavorable currency, decreased by 1.4%, mainly reflecting: an unfavorable pricing variance; higher marketing, administration and research costs, principally related to increased investment behind reduced-risk products in Japan and Korea; partly offset by favorable volume/mix and lower manufacturing costs, primarily related to Japan.
|
| | | | | | | | | | | | | | | | | | | | | | | | | | | | |
Financial Summary -
Six Months Ended June 30, | | | | | Change
Fav./(Unfav.) | | Variance
Fav./(Unfav.) |
| | 2018 | 2017 | | Total | Excl.
Curr. | | Total | Cur-
rency | Price | Vol/
Mix | Cost/
Other |
| (in millions) | | | |
| Net Revenues | | $ | 3,069 |
| $ | 2,548 |
| | 20.4 | % | 16.8 | % | | $ | 521 |
| $ | 93 |
| $ | (21 | ) | $ | 449 |
| $ | — |
|
| Operating Income | | $ | 1,013 |
| $ | 982 |
| | 3.2 | % | 2.0 | % | | $ | 31 |
| $ | 11 |
| $ | (21 | ) | $ | 145 |
| $ | (104 | ) |
“Cost/Other” in the above table reflects the currency-neutral variances of: cost of sales (excluding the volume/mix cost component); marketing, administration and research costs; asset impairment and exit costs; and amortization of intangibles.
DuringFor the quarter,six months ended June 30, 2018, net revenues, excluding favorable currency, increased by 27.5%16.8%, reflecting a favorable pricing variance, driven principally by Australia and Japan, as well as a favorable volume/mix, driven by heated tobacco unit volume and IQOS device sales in Japan and Korea. The favorable volume/mix was partly offset by unfavorable volume in Australia and an unfavorable pricing variance, mainly due to Korea, reflecting the same dynamic as in the quarter, partly offset by Australia. The pricing variance was also unfavorably impacted by the retail price adjustment of June 1, 2018, in Japan of IQOS device inventories in the distribution and retail trade channels.
The net revenues of the East Asia & Australia segment include $854$1,510 million in 2018 and $396$945 million in 2017 related to the sale of RRPs.
Operating income, excluding favorable currency, increased by 5.7%2.0%, mainly driven by a favorable pricing variance,reflecting: favorable volume/mix, mainly in Korea,Japan and a favorable manufacturing cost comparison driven by Japan,Korea, partly offset by Australia, and lower manufacturing costs, primarily related to Japan. The favorable volume/mix was partly offset by an unfavorable pricing variance and higher marketing, administration and research costs, principally related to increased investment behind RRPsreduced-risk products in Japan and Korea, and affiliate reorganization costs in Australia.Korea.
East Asia & Australia - Total Market, PMI Shipment Volume and Market Share Commentaries
In the second quarter, the estimated total market in East Asia & Australia decreased, notably due to:
Australia, down by 8.4%11.7%, primarily reflecting the impact of excise tax-driven retail price increases in 2017 and in the quarter;first quarter of 2018;
Japan, down by 2.3%1.9%, primarily reflecting the decline of the total estimated cigarette market; and
Taiwan, down by 20.2%57.7%, primarily reflecting the impact of excise tax-driven retail price increases in June 2017.
For the six months year-to-date, the estimated total market in East Asia & Australia decreased, notably due to: |
| | | | | | | |
| PMI Shipment Volume (million units) | | First-Quarter |
| | | 2018 |
| 2017 |
| Change |
|
| Cigarettes | | 14,091 |
| 17,243 |
| (18.3 | )% |
| Heated Tobacco Units | | 7,342 |
| 4,145 |
| 77.1 | % |
| Total East Asia & Australia | | 21,433 |
| 21,388 |
| 0.2 | % |
Japan, down by 2.1%, primarily reflecting the same factors as in the quarter; and
Taiwan, down by 45.9%primarily reflecting the same factors as in the quarter.
|
| | | | | | | | | | | | | |
| PMI Shipment Volume (million units) | Second-Quarter | | Six Months Year-to-Date |
| | 2018 |
| 2017 |
| Change |
| | 2018 |
| 2017 |
| Change |
|
| Cigarettes | 15,114 |
| 15,790 |
| (4.3 | )% | | 29,205 |
| 33,033 |
| (11.6 | )% |
| Heated Tobacco Units | 7,838 |
| 5,726 |
| 36.9 | % | | 15,180 |
| 9,871 |
| 53.8 | % |
| Total East Asia & Australia | 22,952 |
| 21,516 |
| 6.7 | % | | 44,385 |
| 42,904 |
| 3.5 | % |
In the second quarter, our total shipment volume increased by 0.2%6.7% to 21.423.0 billion units, or by 11.2%4.3% excluding the unfavorablenet favorable impact of an estimated 1.00.5 billion cigarette units and 1.4 billion heated tobacco units of distributor inventory movements primarily in Japan compared to the first quarter of 2017,Japan. The increase was mainly driven by:
by higher heated tobacco unit shipment volume in Japan and Korea, reflecting higher market share;share, partly offset by lower cigarette shipment volume, mainly in Korea, down by 14.8%, primarily reflecting the lower total cigarette market and out-switching to heated tobacco units, and Taiwan, down by 40.1%, primarily reflecting the lower total market, partly offset by higher share.
largely
The net favorable distributor inventory movements in Japan of an estimated 0.5 billion units reflected:
Net favorable cigarette inventory movements of approximately 2.0 billion, reflecting a cigarette inventory reduction in the second quarter of 2017 of approximately 1.3 billion units, driven by out-switching to HeatSticks, and favorable cigarette inventory movements in the second quarter of 2018 of approximately 0.7 billion units, reflecting category consumption trends;
partly offset by
Net unfavorable heated tobacco unit inventory movements of approximately 1.5 billion units, driven by the build-up of HeatStick inventory in the second quarter of 2017 in response to increasing market demand.
Excluding the impact of estimated distributor inventory movements, our total shipment volume in Japan was up by 5.0%, reflecting an increase of heated tobacco unit shipment volume of 39.8% partly offset by a decline of cigarette shipment volume of 19.0%.
For the six months year-to-date, our total shipment volume increased by 3.5% to 44.4 billion units, or by 7.7% excluding the net unfavorable impact of an estimated 1.8 billion units of distributor inventory movements primarily in Japan. The increase was mainly driven by higher heated tobacco unit shipment volume in Japan and Korea, reflecting higher market share, partly offset by lower cigarette shipment in Japan and Korea, down by 25.8%12.2% and 6.1%10.9%, respectively, primarily reflecting the lower total cigarette market and out-switching to heated tobacco units, and Taiwan, down by 34.8%, primarily reflecting the lower cigarettetotal market, partly offset by higher share.
The net unfavorable distributor inventory movements in Japan of an estimated 1.9 billion units reflected:
Net unfavorable heated tobacco unit inventory movements of approximately 2.9 billion units, reflecting inventory build-up during the first six months of 2017 to meet increasing market demand; partly offset by
Net favorable cigarette inventory movements of approximately 1.0 billion units, mainly driven by inventory build-up during the first six months of 2018, reflecting category consumption trends.
Excluding the impact of estimated distributor inventory movements, our total shipment volume in Japan was up by 8.1%, reflecting an increase of heated tobacco unit shipment volume of 57.8%, partly offset by a decline of cigarette shipment volume of 17.7%.
Latin America & Canada:
| | Financial Summary -
Quarters Ended March 31, | | Change
Fav./(Unfav.) | | Variance
Fav./(Unfav.) | |
| | 2018 | 2017 | | Total | Excl.
Curr. | | Total | Cur-
rency | Price | Vol/
Mix | Cost/
Other | |
Financial Summary -
Quarters Ended June 30, | | | | | Change
Fav./(Unfav.) | | Variance
Fav./(Unfav.) |
| | 2018 | 2017 | | Total | Excl.
Curr. | | Total | Cur-
rency | Price | Vol/
Mix | Cost/
Other |
| (in millions) | | 2018 | 2017 | | Total | Excl.
Curr. | | Total | Cur-
rency | Price | Vol/
Mix | Cost/
Other | |
| Net Revenues | | | $ | 807 |
| $ | 748 |
| | 7.9 | % | 12.7 | % | | $ | 59 |
| $ | (36 | ) | $ | 134 |
| $ | (39 | ) | $ | — |
|
| Operating Income | | $ 217 | $ 176 | | 23.3 | % | 31.3 | % | | $ | 41 |
| $ | (14 | ) | $ | 100 |
| $ | — |
| $ | (45 | ) | | $ | 314 |
| $ | 263 |
| | 19.4 | % | 28.1 | % | | $ | 51 |
| $ | (23 | ) | $ | 134 |
| $ | (41 | ) | $ | (19 | ) |
“Cost/Other” in the above table reflects the currency-neutral variances of: cost of sales (excluding the volume/mix cost component); marketing, administration and research costs; asset impairment and exit costs; and amortization of intangibles.
For the quarter,three months ended June 30, 2018, net revenues, excluding unfavorable currency, increased by 17.0%12.7%, reflecting a favorable pricing variance, across the Region, notably in Argentina, Canada and Mexico, partly offset by unfavorable volume/mix, mainly due to unfavorable volume in Canada and Mexico.
The net revenues of the Latin America & Canada segment include $5 million in 2018 and $1 million in 2017 related to the sale of RRPs.
Operating income, excluding unfavorable currency, increased by 31.3%28.1%, largely reflecting a favorable pricing variance, partly offset by unfavorable volume/mix, mainly in Canada and Mexico, higher manufacturing costs, mainlynotably in Argentina and Canada, and higher marketing, administration and research costs, partly related to increased investment behind RRPsreduced-risk products in the Region.
|
| | | | | | | | | | | | | | | | | | | | | | | | | | | | |
Financial Summary -
Six Months Ended June 30, | | | | | Change
Fav./(Unfav.) | | Variance
Fav./(Unfav.) |
| | 2018 | 2017 | | Total | Excl.
Curr. | | Total | Cur-
rency | Price | Vol/
Mix | Cost/
Other |
| (in millions) | | | |
| Net Revenues | | $ | 1,515 |
| $ | 1,354 |
| | 11.9 | % | 14.6 | % | | $ | 161 |
| $ | (37 | ) | $ | 234 |
| $ | (36 | ) | $ | — |
|
| Operating Income | | $ | 531 |
| $ | 439 |
| | 21.0 | % | 29.4 | % | | $ | 92 |
| $ | (37 | ) | $ | 234 |
| $ | (41 | ) | $ | (64 | ) |
“Cost/Other” in the above table reflects the currency-neutral variances of: cost of sales (excluding the volume/mix cost component); marketing, administration and research costs; asset impairment and exit costs; and amortization of intangibles.
For the six months ended June 30, 2018, net revenues, excluding unfavorable currency, increased by 14.6%, reflecting a favorable pricing variance across the Region, notably in Argentina, Canada and Mexico, partly offset by unfavorable volume/mix, mainly due to unfavorable volume in Argentina and Mexico.
The net revenues of the Latin America & Canada segment include $9 million in 2018 and $1 million in 2017 related to the sale of RRPs.
Operating income, excluding unfavorable currency, increased by 29.4%, largely reflecting a favorable pricing variance, partly offset by: unfavorable volume/mix, mainly in Argentina and Mexico; higher manufacturing costs, mainly in Argentina; higher marketing, administration and research costs, partly related to increased investment behind reduced-risk products in the Region, coupled with an unfavorable comparison to 2017 related to the sale of assets, primarily in the Dominican Republic.
Latin America & Canada - Total Market, PMI Shipment Volume and Market Share Commentaries
In the second quarter, the estimated total market in Latin America & Canada decreased, notably due to:
Brazil, down by 8.0%8.5%, primarily reflecting the impact of retail price increases in 2017; and
Mexico, down by 5.6%, or up by 0.9% excluding estimated trade inventory movements related to the timing of price increases in June 2018 compared to the prior year.
For the six months year-to-date, the estimated total market in Latin America & Canada decreased, notably due to:
Brazil, down by 8.3%, primarily reflecting the same factor as in the quarter;
Colombia, down by 15.7%10.4%, primarily reflecting the impact of excise tax-driven retail price increases of approximately 25%; in the first quarter of 2018; and
Mexico, down by 2.7%4.3%, primarily reflectingor by 0.7% excluding the impact of the retail price increases in January 2018.estimated trade inventory movements.
| | | PMI Shipment Volume (million units) | | First-Quarter | Second-Quarter | | Six Months Year-to-Date |
| | | 2018 |
| 2017 |
| Change |
| 2018 |
| 2017 |
| Change |
| | 2018 |
| 2017 |
| Change |
|
| Cigarettes | | 19,013 |
| 19,296 |
| (1.5 | )% | 20,204 |
| 21,553 |
| (6.3 | )% | | 39,217 |
| 40,849 |
| (4.0 | )% |
| Heated Tobacco Units | | 23 |
| 1 |
| +100.0% |
| 32 |
| 3 |
| +100.0% |
| | 55 |
| 4 |
| +100.0% |
|
| Total Latin America & Canada | | 19,036 |
| 19,297 |
| (1.4 | )% | 20,236 |
| 21,556 |
| (6.1 | )% | | 39,272 |
| 40,853 |
| (3.9 | )% |
OurIn the second quarter, our total shipment volume decreased by 1.4%6.1% to 19.020.2 billion units, notably in:
Argentina, down by 1.7%4.4%, reflecting the lower total market and lower market share;
Canada, down by 2.9%, reflecting the lower total market; and
Mexico, down by 4.0%11.2%, reflecting the lower total market and lower market share.share impacted by the trade inventory movements described above.
For the six months year-to-date, our total shipment volume decreased by 3.9% to 39.3 billion units, notably in:
Argentina, down by 3.0%, reflecting the same factors as in the quarter; and
Mexico, down by 8.2%, reflecting the same factors as in the quarter.
Financial Review
Net Cash Provided by Operating Activities
During the first quartersix months of 2018, net cash provided by operating activities of $1.4$5.4 billion increased by $0.5$1.3 billion compared with the first quartersix months of 2017. Excluding favorable currency movements of $0.1$0.4 billion, the change was primarily due to lower working capital requirements of $0.2$0.5 billion, primarily driven by the timing of inventory movements and related excise tax payments, the 2017 payment in the South Korean tax matter (see Note 8. Contingencies for additional information). and higher net earnings.
Net Cash Used in Investing Activities
During the first quartersix months of 2018, net cash used in investing activities was $1.0$0.7 billion, compared with net cash used in investing activities of $0.5$1.2 billion during the first quartersix months of 2017. This increasedecrease in net cash used of $0.5$0.6 billion was due principally to lower cash collateral posted to secure derivatives designated as net investment hedges of Euro assets followingprincipally related to changes in exchange rates between the strengthening of the Euro
versus and the U.S. dollar, andpartially offset by higher capital expenditures. For further details on our derivatives designated as net investment hedges, see Note 5. Financial Instruments.
Our capital expenditures were $0.4$0.8 billion and $0.3$0.6 billion during the threesix months ended March 31,June 30, 2018 and 2017, respectively. The 2018 expenditures were primarily related to our ongoing investments in RRPs to support capacity expansion (notably for heated tobacco units). We expectnow anticipate total capital expenditures of approximately $1.5 billion in 2018, compared to be approximatelythe previously disclosed assumption of $1.7 billion.billion, primarily reflecting lower planned spending on heated tobacco unit manufacturing equipment driven by increased production efficiency and dual-production flexibility at existing factories, coupled with an adjustment for revised production forecasts.
Net Cash Provided by (Used in)Used in Financing Activities
During the first quartersix months of 2018, net cash used in financing activities was $1.7$6.0 billion, compared with net cash provided byused in financing activities of $0.3$1.6 billion during the first quartersix months of 2017. The change was due primarily to no debt issuancethe 2018 repayment of our $2.5 billion U.S. bond that matured in the first quarter ofMay 2018 compared with long-term debt proceeds, net of repayments, of $1.7 billion in the first quartersix months of 2017, and the purchase of the remaining 49% interest in our Costa Rican affiliates. For further details on the purchase of the remaining 49% interest in our Costa Rican affiliates, see Note 17. Acquisitions.
Dividends paid in the first quartersix months of 2018 and 2017 were $1.7$3.3 billion and $1.6$3.2 billion, respectively.
Debt and Liquidity
We define cash and cash equivalents as short-term, highly liquid investments, readily convertible to known amounts of cash that mature within a maximum of three months and have an insignificant risk of change in value due to interest rate or credit risk changes. As a policy, we do not hold any investments in structured or equity-linked products. Our cash and cash equivalents are predominantly held in demand deposits with institutions that have investment-grade long-term credit rating. As part of our cash management strategy and in order to manage counterparty exposure, we also enter into reverse repurchase agreements. Such agreements are collateralized with government or corporate securities held by a custodial bank and, at maturity, cash is paid back to PMI and the collateral is returned to the bank. While we entered into these agreements during the periods and had an average balance during threethe six months ended March 31,June 30, 2018 of $0.8$0.6 billion and an average balance during the full-year 2017 of $0.9 billion, we had a zero balance both at March 31,June 30, 2018 and December 31, 2017.
We utilize long-term and short-term debt financing, including a commercial paper program that is regularly used to finance ongoing liquidity requirements, as part of our overall cash management strategy. Our ability to access the capital and credit markets as well as overall dynamics of these markets may impact borrowing costs. We expect that the combination of our long-term and short-term debt financing, the commercial paper program and the committed credit facilities, coupled with our operating cash flows, will enable us to meet our liquidity requirements.
Credit Ratings – The cost and terms of our financing arrangements as well as our access to commercial paper markets may be affected by applicable credit ratings. On March 1, 2018, Standard & Poor's affirmed our long-term credit rating at "A" and short-term at "A-1", and revised our outlook to "Stable" from "Negative." At March 31,June 30, 2018, our credit ratings and outlook by major credit rating agencies were as follows:
|
| | | | | | |
| | | Short-term | | Long-term | | Outlook |
| Moody’s | | P-1 | | A2 | | Stable |
| Standard & Poor’s | | A-1 | | A | | Stable |
| Fitch | | F1 | | A | | Negative |
Credit Facilities – On January 29, 2018, we entered into an agreement to extend the term of our $2.0 billion 364-day revolving credit facility from February 6, 2018, to February 5, 2019.
At March 31,June 30, 2018, our committed credit facilities and commercial paper outstanding were as follows:
|
| | | | | | | | |
| (in billions) | | | | |
| Type | | Committed Credit Facilities | | Commercial Paper |
| 364-day revolving credit, expiring February 5, 2019 | | $ | 2.0 |
| | |
| Multi-year revolving credit, expiring February 28, 2021 | | 2.5 |
| | |
| Multi-year revolving credit, expiring October 1, 2022 | | 3.5 |
| | |
|
Total facilities | | $ | 8.0 |
| | |
|
Commercial paper outstanding | | |
| | $ | — |
|
At March 31,June 30, 2018, there were no borrowings under the committed credit facilities, and the entire committed amounts were available for borrowing.
All banks participating in our committed credit facilities have an investment-grade long-term credit rating from the credit rating agencies. We continuously monitor the credit quality of our banking group, and at this time we are not aware of any potential non-performing credit provider.
Each of these facilities requires us to maintain a ratio of consolidated earnings before interest, taxes, depreciation and amortization (“consolidated EBITDA”) to consolidated interest expense of not less than 3.5 to 1.0 on a rolling four-quarter basis. At March 31, June 30,
2018, our ratio calculated in accordance with the agreements was 10.310.5 to 1.0. These facilities do not include any credit rating triggers, material adverse change clauses or any provisions that could require us to post collateral. We expect to continue to meet our covenants. The terms “consolidated EBITDA” and “consolidated interest expense,” both of which include certain adjustments, are defined in the facility agreements previously filed with the U.S. Securities and Exchange Commission.
In addition to the committed credit facilities discussed above, certain of our subsidiaries maintain short-term credit arrangements to meet their respective working capital needs. These credit arrangements, which amounted to approximately $2.93.1 billion at March 31,June 30, 2018 and $2.8 billion at December 31, 2017, are for the sole use of our subsidiaries. Borrowings under these arrangements amounted to $608592 million at March 31,June 30, 2018, and $499 million at December 31, 2017.
Commercial Paper Program – We continue to have access to liquidity in the commercial paper market through programs in place in the U.S. and in Europe having an aggregate issuance capacity of $8.0 billion. At March 31,June 30, 2018 and December 31, 2017, we had no commercial paper outstanding. The average commercial paper balance outstanding during the first quartersix months of 2018 was $3.6$3.5 billion. The average commercial paper balance outstanding during 2017 was $5.2 billion.
Sale of Accounts Receivable – To mitigate credit risk and enhance cash and liquidity management we sell trade receivables to unaffiliated financial institutions. These arrangements allow us to sell, on an ongoing basis, certain trade receivables without recourse. The trade receivables sold are generally short-term in nature and are removed from the condensed consolidated balance sheets. We sell trade receivables under two types of arrangements, servicing and nonservicing.
Our operating cash flows were positively impacted by the amount of the trade receivables sold and derecognized from the condensed consolidated balance sheets, which remained outstanding with the unaffiliated financial institutions. The trade receivables sold that remained outstanding under these arrangements as of March 31,June 30, 2018, and March 31,June 30, 2017 were $878 million$0.6 billion and $561 million,$0.6 billion, respectively. The net proceeds received are included in cash provided by operating activities in the condensed consolidated statements of cash flows.
For further details, see Note 15. Sale of Accounts Receivable to our condensed consolidated financial statements.
Debt – Our total debt was $34.8$31.7 billion at March 31,June 30, 2018 and $34.3 billion at December 31, 2017.
On February 14, 2017, we filed a shelf registration statement with the U.S. Securities and Exchange Commission, under which we may from time to time sell debt securities and/or warrants to purchase debt securities over a three-year period.
Guarantees – At March 31,June 30, 2018, we were contingently liable for $0.8$0.4 billion of guarantees of our own performance, which were primarily related to excise taxes on the shipment of our products. There is no liability in the condensed consolidated financial statements associated with these guarantees. At March 31,June 30, 2018, our third-party guarantees were insignificant.
Equity and Dividends
We discuss our stock awards as of March 31,June 30, 2018 in Note 2. Stock Plans to our condensed consolidated financial statements.
During 2017, we did not repurchase any shares under a share repurchase program and we do not presently intend to repurchase shares of our common stock in 2018.
Dividends paid in the first quartersix months of 2018 were $1.7$3.3 billion. During the thirdsecond quarter of 2017,2018, our Board of Directors approved a 2.9%6.5% increase in the quarterly dividend to $1.07$1.14 per common share. As a result, the present annualized dividend rate is $4.28$4.56 per common share.
Market Risk
Counterparty Risk - We predominantly work with financial institutions with strong short- and long-term credit ratings as assigned by Standard & Poor’s and Moody’s. These banks are also part of a defined group of relationship banks. Non-investment grade institutions are only used in certain emerging markets to the extent required by local business needs. We have a conservative approach when it comes to choosing financial counterparties and financial instruments. As such, we do not invest or hold investments in any structured or equity-linked products. The majority of our cash and cash equivalents is currently invested in demand deposits maturing within less than 30 days.
We continuously monitor and assess the credit worthiness of all our counterparties.
Derivative Financial Instruments - We operate in markets outside of the United States of America, with manufacturing and sales facilities in various locations throughout the world. Consequently, we use certain financial instruments to manage our foreign currency and interest rate exposure. We use derivative financial instruments principally to reduce our exposure to market risks resulting from fluctuations in foreign exchange rates by creating offsetting exposures. We are not a party to leveraged derivatives and, by policy, do not use derivative financial instruments for speculative purposes.
See Note 5. Financial Instruments, Note 11. Fair Value Measurements, and Note 13. Balance Sheet Offsetting to our condensed consolidated financial statements for further details on our derivative financial instruments and the related collateral arrangements.
Contingencies
See Note 8. Contingencies to our condensed consolidated financial statements for a discussion of contingencies.
Cautionary Factors That May Affect Future Results
Forward-Looking and Cautionary Statements
We may from time to time make written or oral forward-looking statements, including statements contained in filings with the SEC, in reports to stockholders and in press releases and investor webcasts. You can identify these forward-looking statements by use of words such as "strategy," "expects," "continues," "plans," "anticipates," "believes," "will," "estimates," "intends," "projects," "goals," "targets" and other words of similar meaning. You can also identify them by the fact that they do not relate strictly to historical or current facts.
We cannot guarantee that any forward-looking statement will be realized, although we believe we have been prudent in our plans and assumptions. Achievement of future results is subject to risks, uncertainties and inaccurate assumptions. Should known or unknown risks or uncertainties materialize, or should underlying assumptions prove inaccurate, actual results could vary materially from those anticipated, estimated or projected. Investors should bear this in mind as they consider forward-looking statements and whether to invest in or remain invested in our securities. In connection with the “safe harbor” provisions of the Private Securities
Litigation Reform Act of 1995, we are identifying important factors that, individually or in the aggregate, could cause actual results and outcomes to differ materially from those contained in any forward-looking statements made by us; any such statement is qualified by reference to the following cautionary statements. We elaborate on these and other risks we face throughout this document, particularly in the “Business Environment” section. You should understand that it is not possible to predict or identify all risk factors. Consequently, you should not consider the following to be a complete discussion of all potential risks or uncertainties. We do not undertake to update any forward-looking statement that we may make from time to time, except in the normal course of our public disclosure obligations.
Risks Related to Our Business and Industry
Consumption of tax-paid cigarettes continues to decline in many of our markets.
This decline is due to multiple factors, including increased taxes and pricing, governmental actions, the diminishing social acceptance of smoking, continuing economic and geopolitical uncertainty, and the continuing prevalence of illicit products. These factors and their potential consequences are discussed more fully below and in the "Business Environment" section.
Cigarettes are subject to substantial taxes. Significant increases in cigarette-related taxes have been proposed or enacted and are likely to continue to be proposed or enacted in numerous jurisdictions. These tax increases may disproportionately affect our profitability and make us less competitive versus certain of our competitors.
Tax regimes, including excise taxes, sales taxes and import duties, can disproportionately affect the retail price of cigarettes versus other combustible tobacco products, or disproportionately affect the relative retail price of our cigarette brands versus cigarette brands manufactured by certain of our competitors. Because our portfolio is weighted toward the premium-price cigarette category, tax regimes based on sales price can place us at a competitive disadvantage in certain markets. As a result, our volume and profitability may be adversely affected in these markets.
Increases in cigarette taxes are expected to continue to have an adverse impact on our sales of cigarettes, due to resulting lower consumption levels, a shift in sales from manufactured cigarettes to other combustible tobacco products and from the premium-price to the mid-price or low-price cigarette categories, where we may be under-represented, from local sales to legal cross-border purchases of lower price products, or to illicit products such as contraband, counterfeit and "illicit whites."
Our business faces significant governmental action aimed at increasing regulatory requirements with the goal of reducing or preventing the use of tobacco products.
Governmental actions, combined with the diminishing social acceptance of smoking and private actions to restrict smoking, have resulted in reduced industry volume in many of our markets, and we expect that such factors will continue to reduce consumption levels and will increase down-trading and the risk of counterfeiting, contraband, "illicit whites" and legal cross-border purchases. Significant regulatory developments will take place over the next few years in most of our markets, driven principally by the World Health Organization's Framework Convention on Tobacco Control ("FCTC"). The FCTC is the first international public health treaty on tobacco, and its objective is to establish a global agenda for tobacco regulation. The FCTC has led to increased efforts by tobacco control advocates and public health organizations to promote increasingly restrictive regulatory measures on the marketing and sale of tobacco products to adult smokers. Regulatory initiatives that have been proposed, introduced or enacted include:
restrictions on or licensing of outlets permitted to sell cigarettes;
the levying of substantial and increasing tax and duty charges;
restrictions or bans on advertising, marketing and sponsorship;
the display of larger health warnings, graphic health warnings and other labeling requirements;
restrictions on packaging design, including the use of colors, and plain packaging;
restrictions on packaging and cigarette formats and dimensions;
restrictions or bans on the display of tobacco product packaging at the point of sale and restrictions or bans on cigarette vending machines;
requirements regarding testing, disclosure and performance standards for tar, nicotine, carbon monoxide and other smoke constituents;
disclosure, restrictions, or bans of tobacco product ingredients;
increased restrictions on smoking in public and work places and, in some instances, in private places and outdoors;
restrictions on the sale of novel tobacco or nicotine-containing products;
elimination of duty free sales and duty free allowances for travelers; and
encouraging litigation against tobacco companies.
Our operating income could be significantly affected by regulatory initiatives resulting in a significant decrease in demand for our brands, in particular requirements that lead to a commoditization of tobacco products, as well as any significant increase in the cost of complying with new regulatory requirements.
Litigation related to tobacco use and exposure to environmental tobacco smoke could substantially reduce our profitability and could severely impair our liquidity.
There is litigation related to tobacco products pending in certain jurisdictions. Damages claimed in some tobacco-related litigation are significant and, in certain cases in Brazil, Canada and Nigeria, range into the billions of U.S. dollars. We anticipate that new cases will continue to be filed. The FCTC encourages litigation against tobacco product manufacturers. It is possible that our consolidated results of operations, cash flows or financial position could be materially affected in a particular fiscal quarter or fiscal year by an unfavorable outcome or settlement of certain pending litigation. Please see Note 8. Contingencies to our condensed consolidated financial statements for a discussion of pending litigation.
We face intense competition, and our failure to compete effectively could have a material adverse effect on our profitability and results of operations.
We compete primarily on the basis of product quality, brand recognition, brand loyalty, taste, R&D, innovation, packaging, customer service, marketing, advertising and retail price and, increasingly, adult smoker willingness to convert to our RRPs. We are subject to highly competitive conditions in all aspects of our business. The competitive environment and our competitive position can be significantly influenced by weak economic conditions, erosion of consumer confidence, competitors' introduction of lower-price products or innovative products, higher tobacco product taxes, higher absolute prices and larger gaps between retail price categories, and product regulation that diminishes the ability to differentiate tobacco products.products and restricts adult consumer access to truthful and non-misleading information about our RRPs. Competitors include three large international tobacco companies and several
regional and local tobacco companies and, in some instances, state-owned tobacco enterprises, principally in Algeria, Egypt, the PRC, Taiwan, Thailand and Vietnam. Industry consolidation and privatizations of state-owned enterprises have led to an overall increase in competitive pressures. Some competitors have different profit and volume objectives, and some international competitors are susceptible to changes in different currency exchange rates.
Because we have operations in numerous countries, our results may be influenced by economic, regulatory and political developments, natural disasters or conflicts.
Some of the countries in which we operate face the threat of civil unrest and can be subject to regime changes. In others, nationalization, terrorism, conflict and the threat of war may have a significant impact on the business environment. Economic, political, regulatory or other developments or natural disasters could disrupt our supply chain, manufacturing capabilities or distribution capabilities. In addition, such developments could lead to loss of property or equipment that are critical to our business in certain markets and difficulty in staffing and managing our operations, which could reduce our volumes, revenues and net earnings.
In certain markets, we are dependent on governmental approvals of various actions such as price changes, and failure to obtain such approvals could impair growth of our profitability.
In addition, despite our high ethical standards and rigorous control and compliance procedures aimed at preventing and detecting unlawful conduct, given the breadth and scope of our international operations, we may not be able to detect all potential improper or unlawful conduct by our employees and partners.
We may be unable to anticipate changes in consumer preferences or to respond to consumer behavior influenced by economic downturns.
Our business is subject to changes in adult consumer preferences, which may be influenced by local economic conditions. To be successful, we must:
promote brand equity successfully;
anticipate and respond to new adult consumer trends;
develop new products and markets and broaden brand portfolios;
improve productivity;
convince adult smokers to convert to our RRPs;
ensure adequate production capacity to meet demand for our products; and
be able to protect or enhance margins through price increases.
In periods of economic uncertainty, adult consumers may tend to purchase lower-price brands, and the volume of our premium-price and mid-price brands and our profitability could suffer accordingly. Such down-trading trends may be reinforced by regulation that limits branding, communication and product differentiation.
We lose revenues as a result of counterfeiting, contraband, cross-border purchases, "illicit whites" and non-tax-paid volume produced by local manufacturers.
Large quantities of counterfeit cigarettes are sold in the international market. We believe that Marlboro is the most heavily counterfeited international cigarette brand, although we cannot quantify the revenues we lose as a result of this activity. In addition, our revenues are reduced by contraband, legal cross-border purchases, "illicit whites" and non-tax-paid volume produced by local manufacturers.
From time to time, we are subject to governmental investigations on a range of matters.
Investigations include allegations of contraband shipments of cigarettes, allegations of unlawful pricing activities within certain markets, allegations of underpayment of customs duties and/or excise taxes, allegations of false and misleading usage of descriptors and allegations of unlawful advertising. We cannot predict the outcome of those investigations or whether additional investigations may be commenced, and it is possible that our business could be materially affected by an unfavorable outcome of pending or future investigations. See “Management's Discussion and Analysis of Financial Condition and Results of Operations-Operating Results by Business Segment-Business Environment-Governmental Investigations” for a description of certain governmental investigations to which we are subject.
We may be unsuccessful in our attempts to introduce reduced-risk products, and regulators may not permit the commercialization of these products or the communication of scientifically substantiated risk-reduction claims.
Our key strategic priorities are: to develop and commercialize products that present less risk of harm to adult smokers who switch to those products versus continued smoking; and to convince current adult smokers who would otherwise continue to smoke to switch to those RRPs. For our efforts to be successful, we must: develop RRPs that such adult smokers find acceptable alternatives to smoking; conduct rigorous scientific studies to substantiate that they reduce exposure to harmful and potentially harmful constituents in smoke and, ultimately, that these products present, are likely to present, or have the potential to present less risk of harm to adult smokers who switch to them versus continued smoking; and effectively advocate for the development of science-based regulatory frameworks for the development and commercialization of RRPs, including communication of scientifically substantiated information to enable adult smokers to make better consumer choices. We might not succeed in our efforts. If we do not succeed, but others do, we may be at a competitive disadvantage. Furthermore, we cannot predict whether regulators will permit the sale and/or marketing of RRPs with scientifically substantiated risk-reduction claims. Such restrictions could limit the success of our RRPs.
We may be unsuccessful in our efforts to differentiate reduced-risk products and cigarettes with respect to taxation.
To date, we have been largely successful in demonstrating to regulators that our RRPs are not cigarettes, and as such they are generally taxed either as a separate category or as other tobacco products, which typically yields more favorable tax rates than cigarettes. If we cease to be successful in these efforts, RRP unit margins may be adversely affected.
Our reported results could be adversely affected by unfavorable currency exchange rates, and currency devaluations could impair our competitiveness.
We conduct our business primarily in local currency and, for purposes of financial reporting, the local currency results are translated into U.S. dollars based on average exchange rates prevailing during a reporting period. During times of a strengthening U.S. dollar, our reported net revenues and operating income will be reduced because the local currency translates into fewer U.S. dollars. During periods of local economic crises, foreign currencies may be devalued significantly against the U.S. dollar, reducing our margins. Actions to recover margins may result in lower volume and a weaker competitive position.
Changes in the earnings mix and changes in tax laws may result in significant variability in our effective tax rates. Our ability to receive payments from foreign subsidiaries or to repatriate royalties and dividends could be restricted by local country currency exchange controls.
The Tax Cuts and Jobs Act that was signed into law in December 2017 constitutes a major change to the U.S. tax system. Our estimated impact of the Tax Cuts and Jobs Act is based on management’s current interpretations, and our analysis is ongoing. Our final tax liability may be materially different from current estimates due to developments such as implementing regulations and clarifications. In future periods, our effective tax rate and our ability to recover deferred tax assets could be subject to additional uncertainty as a result of such developments. Furthermore, changes in the earnings mix or applicable foreign tax laws may result in significant variability in our effective tax rates. Because we are a U.S. holding company, our most significant source of funds is distributions from our non-U.S. subsidiaries. Certain countries in which we operate have adopted or could institute currency exchange controls that limit or prohibit our local subsidiaries' ability to convert local currency into U.S. dollars or to make payments outside the country. This could subject us to the risks of local currency devaluation and business disruption.
Our ability to grow profitability may be limited by our inability to introduce new products, enter new markets or improve our margins through higher pricing and improvements in our brand and geographic mix.
Our profit growth may suffer if we are unable to introduce new products or enter new markets successfully, to raise prices or to improve the proportion of our sales of higher margin products and in higher margin geographies.
We may be unable to expand our brand portfolio through successful acquisitions or the development of strategic business relationships.
One element of our growth strategy is to strengthen our brand portfolio and market positions through selective acquisitions and the development of strategic business relationships. Acquisition and strategic business development opportunities are limited and present risks of failing to achieve efficient and effective integration, strategic objectives and anticipated revenue improvements and cost savings. There is no assurance that we will be able to acquire attractive businesses on favorable terms, or that future acquisitions or strategic business developments will be accretive to earnings.
Government mandated prices, production control programs, shifts in crops driven by economic conditions and the impact of climate change may increase the cost or reduce the quality of the tobacco and other agricultural products used to manufacture our products.
As with other agricultural commodities, the price of tobacco leaf and cloves can be influenced by imbalances in supply and demand, and crop quality can be influenced by variations in weather patterns, including those caused by climate change. Tobacco production in certain countries is subject to a variety of controls, including government mandated prices and production control programs. Changes in the patterns of demand for agricultural products could cause farmers to produce less tobacco or cloves. Any significant change in tobacco leaf and clove prices, quality and quantity could affect our profitability and our business.
Our ability to implement our strategy of attracting and retaining the best global talent may be impaired by the decreasing social acceptance of cigarette smoking.
The tobacco industry competes for talent with consumer products and other companies that enjoy greater societal acceptance. As a result, we may be unable to attract and retain the best global talent.
The failure of our information systems to function as intended or their penetration by outside parties with the intent to corrupt them or our failure to comply with privacy laws and regulations could result in business disruption, litigation and regulatory action, and loss of revenue, assets or personal or other confidential data.
We use information systems to help manage business processes, collect and interpret business data and communicate internally and externally with employees, suppliers, customers and others. Some of these information systems are managed by third-party service providers. We have backup systems and business continuity plans in place, and we take care to protect our systems and data from unauthorized access. Nevertheless, failure of our systems to function as intended, or penetration of our systems by outside parties intent on extracting or corrupting information or otherwise disrupting business processes, could place us at a competitive disadvantage, result in a loss of revenue, assets or personal or other sensitive data, litigation and regulatory action, cause damage to our reputation and that of our brands and result in significant remediation and other costs. Failure to protect personal data and respect the rights of data subjects could subject us to substantial fines under regulations such as the EU General Data Protection Regulation.
We may be required to replace third-party contract manufacturers or service providers with our own resources.
In certain instances, we contract with third parties to manufacture some of our products or product parts or to provide other services. We may be unable to renew these agreements on satisfactory terms for numerous reasons, including government regulations. Accordingly, our costs may increase significantly if we must replace such third parties with our own resources.
Item 4. Controls and Procedures.
PMI carried out an evaluation, with the participation of PMI’s management, including PMI’s Chief Executive Officer and Chief Financial Officer, of the effectiveness of PMI’s disclosure controls and procedures (as defined in Rule 13a-15(e) under the Securities Exchange Act of 1934, as amended) as of the end of the period covered by this report. Based upon that evaluation, PMI’s Chief Executive Officer and Chief Financial Officer concluded that PMI’s disclosure controls and procedures are effective. There have been no changes in PMI’s internal control over financial reporting during the most recent fiscal quarter that have materially affected, or are reasonably likely to materially affect, PMI’s internal control over financial reporting.
Part II - OTHER INFORMATION
| |
| Item 1. | Legal Proceedings. |
See Note 8. Contingencies of the Notes to the Condensed Consolidated Financial Statements included in Part I – Item 1 of this report for a discussion of legal proceedings pending against Philip Morris International Inc. and its subsidiaries.
Information regarding Risk Factors appears in “MD&A – Cautionary Factors That May Affect Future Results,” in Part I – Item 2 of this Form 10-Q and in Part I – Item 1A. Risk Factors of our Annual Report on Form 10-K for the year ended December 31, 2017.
| |
| Item 2. | Unregistered Sales of Equity Securities and Use of Proceeds. |
Our share repurchase activity for each of the three months in the quarter ended March 31,June 30, 2018 was as follows:
|
| | | | | | | | | | | | | | |
| Period | | Total Number of Shares Repurchased | | Average Price Paid Per Share | | Total Number of Shares Purchased as Part of Publicly Announced Plans or Programs | | Approximate Dollar Value of Shares that May Yet be Purchased Under the Plans or Programs |
January 1, 2018 – January 31, 2018 (1) | | — |
| | $ | — |
| | — |
| | $ | — |
|
February 1, 2018 – February 28, 2018 (1) | | — |
| | $ | — |
| | — |
| | $ | — |
|
March 1, 2018 – March 31, 2018 (1) | | — |
| | $ | — |
| | — |
| | $ | — |
|
Pursuant to Publicly Announced Plans or Programs | | — |
| | $ | — |
| | | | |
January 1, 2018 –
January 31, 2018 (2) | | 5,582 |
| | $ | 105.76 |
| | | | |
February 1, 2018 –
February 28, 2018 (2) | | 122,425 |
| | $ | 104.06 |
| | | | |
March 1, 2018 –
March 31, 2018 (2) | | 1,981 |
| | $ | 103.30 |
| | | | |
| For the Quarter Ended March 31, 2018 | | 129,988 |
| | $ | 104.12 |
| | | | |
|
| | | | | | | | | | | | | | |
| Period | | Total Number of Shares Repurchased | | Average Price Paid Per Share | | Total Number of Shares Purchased as Part of Publicly Announced Plans or Programs | | Approximate Dollar Value of Shares that May Yet be Purchased Under the Plans or Programs |
April 1, 2018 – April 30, 2018 (1) | | — |
| | $ | — |
| | — |
| | $ | — |
|
May 1, 2018 – May 31, 2018 (1) | | — |
| | $ | — |
| | — |
| | $ | — |
|
June 1, 2018 – June 30, 2018 (1) | | — |
| | $ | — |
| | — |
| | $ | — |
|
Pursuant to Publicly Announced Plans or Programs | | — |
| | $ | — |
| | | | |
April 1, 2018 –
April 30, 2018 (2) | | 1,097 |
| | $ | 99.48 |
| | | | |
May 1, 2018 –
May 31, 2018 (2) | | 220 |
| | $ | 81.16 |
| | | | |
June 1, 2018 –
June 30, 2018 (2) | | 367 |
| | $ | 79.47 |
| | | | |
| For the Quarter Ended June 30, 2018 | | 1,684 |
| | $ | 92.72 |
| | | | |
| |
| (1) | During this reporting period, we did not have an authorized share repurchase program. |
| |
| (2) | Shares repurchased represent shares tendered to us by employees who vested in restricted share unit awards and used shares to pay all, or a portion of, the related taxes. |
|
| | |
| | |
| | | |
| 3.1 | | |
| | | |
10.1 | | Extension Agreement, effective as of February 6, 2018, to the Credit Agreement, dated as of February 12, 2013, among Philip Morris International Inc., the lenders named therein, Citibank Europe PLC, UK Branch (formerly, Citibank International Limited), as administrative agent (incorporated by reference to Exhibit 10.1 to the Current Report on Form 8-K filed January 29, 2018). |
| | |
10.2 | | |
| | |
10.3 | | |
| | |
10.4 | | |
| | |
10.5 | | |
| | |
10.6 | | |
| | |
| 12 | | |
| | |
| 31.1 | | |
| | |
| 31.2 | | |
| | |
| 32.1 | | |
| | |
| 32.2 | | |
| | |
| 101.INS | | XBRL Instance Document. |
| | |
| 101.SCH | | XBRL Taxonomy Extension Schema. |
| | |
| 101.CAL | | XBRL Taxonomy Extension Calculation Linkbase. |
| | |
| 101.DEF | | XBRL Taxonomy Extension Definition Linkbase. |
| | |
| 101.LAB | | XBRL Taxonomy Extension Label Linkbase. |
| | |
| 101.PRE | | XBRL Taxonomy Extension Presentation Linkbase. |
Signature
Pursuant to the requirements of the Securities Exchange Act of 1934, the Registrant has duly caused this report to be signed on its behalf by the undersigned thereunto duly authorized.
|
|
| PHILIP MORRIS INTERNATIONAL INC. |
| |
| /s/ MARTIN G. KING |
| |
| Martin G. King |
| Chief Financial Officer |
| |
AprilJuly 26, 2018 |