UNITED STATES
SECURITIES AND EXCHANGE COMMISSION
Washington, D.C. 20549
FORM 10-Q
(Mark One)
☒ QUARTERLY REPORT PURSUANT TO SECTION 13 OR 15(d) OF THE SECURITIES EXCHANGE ACT OF 1934
For the quarterly period ended July 4, 2021April 3, 2022
or
☐ TRANSITION REPORT PURSUANT TO SECTION 13 OR 15(d) OF THE SECURITIES EXCHANGE ACT OF 1934
For the transition period from to .
Commission File Number: 001-34841
NXP Semiconductors N.V.
(Exact name of registrant as specified in its charter)
| | | | | | | | |
| Netherlands | | 98-1144352 |
(State or other jurisdiction of incorporation or organization) | | (I.R.S. employer identification number) |
| | |
| 60 High Tech Campus | | 5656 AG |
| Eindhoven | |
| Netherlands | |
| (Address of principal executive offices) | | (Zip code) |
| | | | | | | | | | | |
| +31 | 40 | 2729999 |
| (Registrant’s telephone number, including area code) |
Securities registered pursuant to Section 12(b) of the Act:
| | | | | | | | |
| Title of each class | Trading symbol(s) | Name of each exchange on which registered |
| Common shares, EUR 0.20 par value | NXPI | The Nasdaq Global Select Market |
Indicate by check mark whether the Registrant (1) has filed all reports required to be filed by Section 13 or 15(d) of the Securities Exchange Act of 1934 during the preceding 12 months (or for such shorter period that the Registrant was required to file such reports), and (2) has been subject to such filing requirements for the past 90 days.
Yes ☒ No ☐
Indicate by check mark whether the Registrant has submitted electronically every Interactive Data File required to be submitted pursuant to Rule 405 of Regulation S-T (§232.405 of this chapter) during the preceding 12 months (or for such shorter period that the Registrant was required to submit such files).
Yes ☒ No ☐
Indicate by check mark whether the Registrant is a large accelerated filer, an accelerated filer, a non-accelerated filer, a smaller reporting company, or an emerging growth company. See the definitions of “large accelerated filer,” “accelerated filer,” “smaller reporting company,” and “emerging growth company” in Rule 12b-2 of the Exchange Act.
| | | | | | | | | | | |
| Large accelerated filer | ☒ | Accelerated filer | ☐ |
| Non-accelerated filer | ☐ | Smaller reporting company | ☐ |
| | Emerging growth company | ☐ |
If an emerging growth company, indicate by check mark if the Registrant has elected not to use the extended transition period for complying with any new or revised financial accounting standards provided pursuant to Section 13(a) of the Exchange Act. ☐
Indicate by check mark whether the Registrant is a shell company (as defined in Rule 12b-2 of the Exchange Act).
Yes ☐ No ☒
As of July 30, 2021,April 29, 2022, there were 265,134,880262,564,790 shares of our common stock, €0.20 par value per share, issued and outstanding.
NXP Semiconductors N.V.
Form 10-Q
For the Fiscal Quarter Ended July 4, 2021April 3, 2022
TABLE OF CONTENTS
PART I — FINANCIAL INFORMATION
Item 1. Financial Statements
CONDENSED CONSOLIDATED STATEMENTS OF OPERATIONS (Unaudited)
($ in millions, unless otherwise stated)
| | | For the three months ended | | For the six months ended | | | For the three months ended |
| | July 4, 2021 | | June 28, 2020 | | July 4, 2021 | | June 28, 2020 | | | April 3, 2022 | | April 4, 2021 |
| Revenue | Revenue | 2,596 | | | 1,817 | | | 5,163 | | | 3,838 | | Revenue | | 3,136 | | | 2,567 | |
| Cost of revenue | Cost of revenue | (1,174) | | | (957) | | | (2,386) | | | (1,981) | | Cost of revenue | | (1,359) | | | (1,212) | |
| Gross profit | Gross profit | 1,422 | | | 860 | | | 2,777 | | | 1,857 | | Gross profit | | 1,777 | | | 1,355 | |
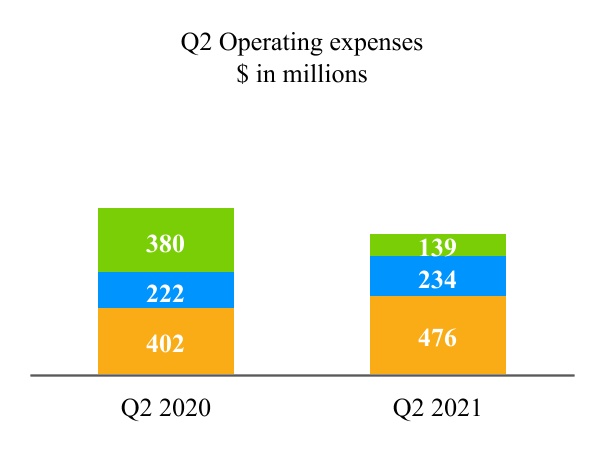
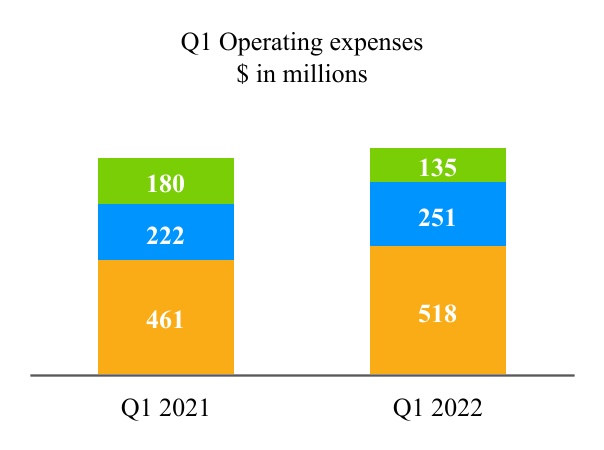
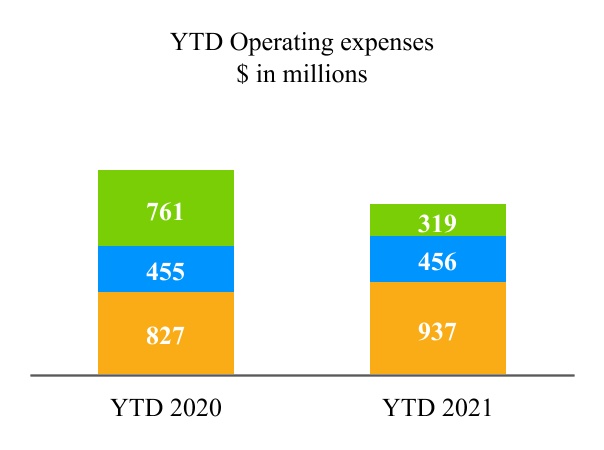
| Research and development | Research and development | (476) | | | (402) | | | (937) | | | (827) | | Research and development | | (518) | | | (461) | |
| Selling, general and administrative | Selling, general and administrative | (234) | | | (222) | | | (456) | | | (455) | | Selling, general and administrative | | (251) | | | (222) | |
| Amortization of acquisition-related intangible assets | Amortization of acquisition-related intangible assets | (139) | | | (380) | | | (319) | | | (761) | | Amortization of acquisition-related intangible assets | | (135) | | | (180) | |
| Total operating expenses | Total operating expenses | (849) | | | (1,004) | | | (1,712) | | | (2,043) | | Total operating expenses | | (904) | | | (863) | |
| Other income (expense) | Other income (expense) | 0 | | | (1) | | | 0 | | | 109 | | Other income (expense) | | — | | | — | |
| Operating income (loss) | Operating income (loss) | 573 | | | (145) | | | 1,065 | | | (77) | | Operating income (loss) | | 873 | | | 492 | |
| Financial income (expense): | Financial income (expense): | | Financial income (expense): | | |
| | Other financial income (expense) | Other financial income (expense) | (100) | | | (96) | | | (187) | | | (174) | | Other financial income (expense) | | (105) | | | (87) | |
| Income (loss) before income taxes | Income (loss) before income taxes | 473 | | | (241) | | | 878 | | | (251) | | Income (loss) before income taxes | | 768 | | | 405 | |
| Benefit (provision) for income taxes | Benefit (provision) for income taxes | (65) | | | 33 | | | (105) | | | 31 | | Benefit (provision) for income taxes | | (114) | | | (40) | |
| Results relating to equity-accounted investees | Results relating to equity-accounted investees | (2) | | | (1) | | | (3) | | | (2) | | Results relating to equity-accounted investees | | 12 | | | (1) | |
| Net income (loss) | Net income (loss) | 406 | | | (209) | | | 770 | | | (222) | | Net income (loss) | | 666 | | | 364 | |
| Less: Net income (loss) attributable to non-controlling interests | Less: Net income (loss) attributable to non-controlling interests | 9 | | | 5 | | | 20 | | | 13 | | Less: Net income (loss) attributable to non-controlling interests | | 9 | | | 11 | |
| Net income (loss) attributable to stockholders | Net income (loss) attributable to stockholders | 397 | | | (214) | | | 750 | | | (235) | | Net income (loss) attributable to stockholders | | 657 | | | 353 | |
| | Earnings per share data: | Earnings per share data: | | Earnings per share data: | | |
| Net income (loss) per common share attributable to stockholders in $ | Net income (loss) per common share attributable to stockholders in $ | | Net income (loss) per common share attributable to stockholders in $ | | |
| Basic | Basic | 1.46 | | | (0.77) | | | 2.73 | | | (0.84) | | Basic | | 2.50 | | | 1.27 | |
| Diluted | Diluted | 1.42 | | | (0.77) | | | 2.67 | | | (0.84) | | Diluted | | 2.48 | | | 1.25 | |
| | Weighted average number of shares of common stock outstanding during the period (in thousands): | Weighted average number of shares of common stock outstanding during the period (in thousands): | | Weighted average number of shares of common stock outstanding during the period (in thousands): | | |
| Basic | Basic | 272,686 | | | 279,142 | | | 275,145 | | | 279,533 | | Basic | | 263,089 | | | 277,526 | |
| Diluted | Diluted | 278,735 | | | 279,142 | | | 281,063 | | | 279,533 | | Diluted | | 265,109 | | | 283,263 | |
See accompanying notes to the Condensed Consolidated Financial Statements
CONDENSED CONSOLIDATED STATEMENTS OF COMPREHENSIVE INCOME
(Unaudited)
($ in millions, unless otherwise stated)
| | | For the three months ended | | For the six months ended | | | For the three months ended |
| | July 4, 2021 | | June 28, 2020 | | July 4, 2021 | | June 28, 2020 | | | April 3, 2022 | | April 4, 2021 |
| Net income (loss) | Net income (loss) | 406 | | | (209) | | | 770 | | | (222) | | Net income (loss) | | 666 | | | 364 | |
| Other comprehensive income (loss), net of tax: | Other comprehensive income (loss), net of tax: | | Other comprehensive income (loss), net of tax: | | |
| Change in fair value cash flow hedges | Change in fair value cash flow hedges | 0 | | | 11 | | | (14) | | | 1 | | Change in fair value cash flow hedges | | (4) | | | (14) | |
| Change in foreign currency translation adjustment | Change in foreign currency translation adjustment | 9 | | | 26 | | | (33) | | | (23) | | Change in foreign currency translation adjustment | | (18) | | | (42) | |
| Change in net actuarial gain (loss) | Change in net actuarial gain (loss) | 0 | | | (1) | | | 0 | | | (3) | | Change in net actuarial gain (loss) | | — | | | — | |
| | Total other comprehensive income (loss) | Total other comprehensive income (loss) | 9 | | | 36 | | | (47) | | | (25) | | Total other comprehensive income (loss) | | (22) | | | (56) | |
| Total comprehensive income (loss) | Total comprehensive income (loss) | 415 | | | (173) | | | 723 | | | (247) | | Total comprehensive income (loss) | | 644 | | | 308 | |
| Less: Comprehensive income (loss) attributable to non-controlling interests | Less: Comprehensive income (loss) attributable to non-controlling interests | 9 | | | 5 | | | 20 | | | 13 | | Less: Comprehensive income (loss) attributable to non-controlling interests | | 9 | | | 11 | |
| Total comprehensive income (loss) attributable to stockholders | Total comprehensive income (loss) attributable to stockholders | 406 | | | (178) | | | 703 | | | (260) | | Total comprehensive income (loss) attributable to stockholders | | 635 | | | 297 | |
See accompanying notes to the Condensed Consolidated Financial Statements
CONDENSED CONSOLIDATED BALANCE SHEETS (Unaudited)
($ in millions, unless otherwise stated)
| | | July 4, 2021 | | December 31, 2020 | | April 3, 2022 | | December 31, 2021 |
| ASSETS | ASSETS | | | | ASSETS | | | |
| Current assets: | Current assets: | | Current assets: | |
| | Cash and cash equivalents | 2,910 | | | 2,275 | | | Cash and cash equivalents | 2,683 | | | 2,830 | |
| | Accounts receivable, net | 991 | | | 765 | | | Accounts receivable, net | 925 | | | 923 | |
| | | Inventories, net | 1,116 | | | 1,030 | | | Inventories, net | 1,311 | | | 1,189 | |
| | Other current assets | 274 | | | 254 | | | Other current assets | 356 | | | 286 | |
| Total current assets | Total current assets | 5,291 | | | 4,324 | | Total current assets | 5,275 | | | 5,228 | |
| Non-current assets: | Non-current assets: | | Non-current assets: | |
| | Other non-current assets | 1,094 | | | 1,013 | | | Other non-current assets | 1,701 | | | 1,346 | |
| | Property, plant and equipment, net of accumulated depreciation of $4,461 and $4,237 | 2,375 | | | 2,284 | | | Property, plant and equipment, net of accumulated depreciation of $4,805 and $4,676 | 2,814 | | | 2,635 | |
| | Identified intangible assets, net of accumulated amortization of $7,277 and $7,007 | 1,891 | | | 2,242 | | | Identified intangible assets, net of accumulated amortization of $3,059 and $3,021 | 1,577 | | | 1,694 | |
| | Goodwill | 9,971 | | | 9,984 | | | Goodwill | 9,954 | | | 9,961 | |
| | Total non-current assets | 15,331 | | | 15,523 | | | Total non-current assets | 16,046 | | | 15,636 | |
| Total assets | Total assets | 20,622 | | | 19,847 | | Total assets | 21,321 | | | 20,864 | |
| | LIABILITIES AND EQUITY | LIABILITIES AND EQUITY | | LIABILITIES AND EQUITY | |
| Current liabilities: | Current liabilities: | | Current liabilities: | |
| | Accounts payable | 1,167 | | | 991 | | | Accounts payable | 1,369 | | | 1,252 | |
| | | Restructuring liabilities-current | 36 | | | 60 | | | Restructuring liabilities-current | 16 | | | 25 | |
| | Other current liabilities | 1,133 | | | 966 | | | Other current liabilities | 1,460 | | | 1,175 | |
| | Total current liabilities | Total current liabilities | 2,336 | | | 2,017 | | Total current liabilities | 2,845 | | | 2,452 | |
| Non-current liabilities: | Non-current liabilities: | | Non-current liabilities: | |
| | Long-term debt | 9,591 | | | 7,609 | | | Long-term debt | 10,573 | | | 10,572 | |
| | Restructuring liabilities | 12 | | | 14 | | | Restructuring liabilities | 14 | | | 12 | |
| | Deferred tax liabilities | 90 | | | 85 | | | Deferred tax liabilities | 53 | | | 57 | |
| | Other non-current liabilities | 924 | | | 971 | | | Other non-current liabilities | 1,076 | | | 1,001 | |
| Total non-current liabilities | Total non-current liabilities | 10,617 | | | 8,679 | | Total non-current liabilities | 11,716 | | | 11,642 | |
| Total liabilities | Total liabilities | 12,953 | | | 10,696 | | Total liabilities | 14,561 | | | 14,094 | |
| Equity: | Equity: | | Equity: | |
| | Non-controlling interests | 227 | | | 207 | | | Non-controlling interests | 251 | | | 242 | |
| | | Stockholders’ equity: | | | Stockholders’ equity: | |
| | Common stock, par value €0.20 per share: | 59 | | | 59 | | | Common stock, par value €0.20 per share: | 56 | | | 56 | |
| | Capital in excess of par value | 14,312 | | | 14,133 | | | Capital in excess of par value | 13,819 | | | 13,727 | |
| | Treasury shares, at cost: | | | Treasury shares, at cost: | |
| | 19,809,463 shares (2020: 9,044,952 shares) | (3,102) | | | (1,037) | | | 11,966,850 shares (2021: 9,569,359 shares) | (2,433) | | | (1,932) | |
| | Accumulated other comprehensive income (loss) | 70 | | | 117 | | | Accumulated other comprehensive income (loss) | 26 | | | 48 | |
| | Accumulated deficit | (3,897) | | | (4,328) | | | Accumulated deficit | (4,959) | | | (5,371) | |
| | Total stockholders’ equity | 7,442 | | | 8,944 | | | Total stockholders’ equity | 6,509 | | | 6,528 | |
| Total equity | Total equity | 7,669 | | | 9,151 | | Total equity | 6,760 | | | 6,770 | |
| Total liabilities and equity | Total liabilities and equity | 20,622 | | | 19,847 | | Total liabilities and equity | 21,321 | | | 20,864 | |
See accompanying notes to the Condensed Consolidated Financial Statements
CONDENSED CONSOLIDATED STATEMENTS OF CASH FLOWS (Unaudited)
($ in millions, unless otherwise stated)
| | | For the six months ended | | For the three months ended |
| | July 4, 2021 | | June 28, 2020 | | April 3, 2022 | | April 4, 2021 |
| Cash flows from operating activities: | Cash flows from operating activities: | | | | Cash flows from operating activities: | | | |
| Net income (loss) | Net income (loss) | 770 | | | (222) | | Net income (loss) | 666 | | | 364 | |
| Adjustments to reconcile net income (loss) to net cash provided by (used for) operating activities: | Adjustments to reconcile net income (loss) to net cash provided by (used for) operating activities: | | Adjustments to reconcile net income (loss) to net cash provided by (used for) operating activities: | |
| Depreciation and amortization | Depreciation and amortization | 646 | | | 1,083 | | Depreciation and amortization | 310 | | | 341 | |
| Share-based compensation | Share-based compensation | 184 | | | 212 | | Share-based compensation | 89 | | | 91 | |
| Amortization of discount (premium) on debt, net | Amortization of discount (premium) on debt, net | 1 | | | (1) | | Amortization of discount (premium) on debt, net | 1 | | | — | |
| Amortization of debt issuance costs | Amortization of debt issuance costs | 3 | | | 4 | | Amortization of debt issuance costs | 2 | | | 2 | |
| Net (gain) loss on sale of assets | Net (gain) loss on sale of assets | 0 | | | (110) | | Net (gain) loss on sale of assets | (1) | | | — | |
| (Gain) loss on equity security, net | (Gain) loss on equity security, net | 2 | | | 0 | | (Gain) loss on equity security, net | (4) | | | (3) | |
| | Results relating to equity-accounted investees | Results relating to equity-accounted investees | 3 | | | 2 | | Results relating to equity-accounted investees | (12) | | | 1 | |
| Deferred tax expense (benefit) | Deferred tax expense (benefit) | 12 | | | (156) | | Deferred tax expense (benefit) | (33) | | | 12 | |
| Changes in operating assets and liabilities: | Changes in operating assets and liabilities: | | Changes in operating assets and liabilities: | |
| (Increase) decrease in receivables and other current assets | (Increase) decrease in receivables and other current assets | (230) | | | 251 | | (Increase) decrease in receivables and other current assets | (61) | | | (95) | |
| (Increase) decrease in inventories | (Increase) decrease in inventories | (86) | | | (35) | | (Increase) decrease in inventories | (122) | | | (26) | |
| Increase (decrease) in accounts payable and other liabilities | Increase (decrease) in accounts payable and other liabilities | 124 | | | (96) | | Increase (decrease) in accounts payable and other liabilities | 266 | | | 51 | |
| Decrease (increase) in other non-current assets | Decrease (increase) in other non-current assets | (60) | | | (7) | | Decrease (increase) in other non-current assets | (247) | | | (8) | |
| Exchange differences | Exchange differences | 0 | | | 1 | | Exchange differences | — | | | (1) | |
| Other items | Other items | (1) | | | 0 | | Other items | 2 | | | 3 | |
| Net cash provided by (used for) operating activities | Net cash provided by (used for) operating activities | 1,368 | | | 926 | | Net cash provided by (used for) operating activities | 856 | | | 732 | |
| Cash flows from investing activities: | Cash flows from investing activities: | | Cash flows from investing activities: | |
| Purchase of identified intangible assets | Purchase of identified intangible assets | (72) | | | (73) | | Purchase of identified intangible assets | (43) | | | (37) | |
| Capital expenditures on property, plant and equipment | Capital expenditures on property, plant and equipment | (300) | | | (218) | | Capital expenditures on property, plant and equipment | (280) | | | (150) | |
| Purchase of equipment leased to others | | Purchase of equipment leased to others | (5) | | | — | |
| | Proceeds from disposals of property, plant and equipment | Proceeds from disposals of property, plant and equipment | 0 | | | 1 | | Proceeds from disposals of property, plant and equipment | 1 | | | — | |
| Purchase of interests in businesses, net of cash acquired | Purchase of interests in businesses, net of cash acquired | (1) | | | (21) | | Purchase of interests in businesses, net of cash acquired | (4) | | | — | |
| Proceeds from sale of interests in businesses, net of cash divested | 0 | | | 161 | | |
| | Purchase of investments | Purchase of investments | (6) | | | 0 | | Purchase of investments | — | | | (2) | |
| Proceeds from sale of investments | Proceeds from sale of investments | 8 | | | 0 | | Proceeds from sale of investments | — | | | 8 | |
| Proceeds from return of equity investment | Proceeds from return of equity investment | 1 | | | 0 | | Proceeds from return of equity investment | 2 | | | — | |
| Net cash provided by (used for) investing activities | Net cash provided by (used for) investing activities | (370) | | | (150) | | Net cash provided by (used for) investing activities | (329) | | | (181) | |
| Cash flows from financing activities: | Cash flows from financing activities: | | Cash flows from financing activities: | |
| | Proceeds from the issuance of long-term debt | 2,000 | | | 2,000 | | |
| | Cash paid for debt issuance costs | Cash paid for debt issuance costs | (22) | | | (15) | | Cash paid for debt issuance costs | (1) | | | — | |
| | Dividends paid to common stockholders | Dividends paid to common stockholders | (260) | | | (210) | | Dividends paid to common stockholders | (149) | | | (105) | |
| Proceeds from issuance of common stock through stock plans | Proceeds from issuance of common stock through stock plans | 31 | | | 37 | | Proceeds from issuance of common stock through stock plans | 28 | | | 31 | |
| Purchase of treasury shares and restricted stock unit withholdings | Purchase of treasury shares and restricted stock unit withholdings | (2,108) | | | (358) | | Purchase of treasury shares and restricted stock unit withholdings | (552) | | | (905) | |
| Other, net | (1) | | | 0 | | |
| | Net cash provided by (used for) financing activities | Net cash provided by (used for) financing activities | (360) | | | 1,454 | | Net cash provided by (used for) financing activities | (674) | | | (979) | |
| Effect of changes in exchange rates on cash positions | Effect of changes in exchange rates on cash positions | (3) | | | (9) | | Effect of changes in exchange rates on cash positions | — | | | (5) | |
| Increase (decrease) in cash and cash equivalents | Increase (decrease) in cash and cash equivalents | 635 | | | 2,221 | | Increase (decrease) in cash and cash equivalents | (147) | | | (433) | |
| Cash and cash equivalents at beginning of period | Cash and cash equivalents at beginning of period | 2,275 | | | 1,045 | | Cash and cash equivalents at beginning of period | 2,830 | | | 2,275 | |
| Cash and cash equivalents at end of period | Cash and cash equivalents at end of period | 2,910 | | | 3,266 | | Cash and cash equivalents at end of period | 2,683 | | | 1,842 | |
| | Supplemental disclosures to the condensed consolidated cash flows | Supplemental disclosures to the condensed consolidated cash flows | Supplemental disclosures to the condensed consolidated cash flows |
| Net cash paid during the period for: | Net cash paid during the period for: | | Net cash paid during the period for: | |
| Interest | Interest | 160 | | | 157 | | Interest | 45 | | | 56 | |
| Income taxes, net of refunds | Income taxes, net of refunds | 161 | | | 64 | | Income taxes, net of refunds | 122 | | | 40 | |
| Net gain (loss) on sale of assets: | Net gain (loss) on sale of assets: | | Net gain (loss) on sale of assets: | |
| Cash proceeds from the sale of assets | Cash proceeds from the sale of assets | 0 | | | 161 | | Cash proceeds from the sale of assets | 1 | | | — | |
| Book value of these assets | Book value of these assets | 0 | | | (51) | | Book value of these assets | — | | | — | |
| Non-cash investing activities: | Non-cash investing activities: | | Non-cash investing activities: | |
| Non-cash capital expenditures | Non-cash capital expenditures | 167 | | | 54 | | Non-cash capital expenditures | 246 | | | 121 | |
See accompanying notes to the Condensed Consolidated Financial Statements
CONDENSED CONSOLIDATED STATEMENTS OF CHANGES IN EQUITY (Unaudited)
($ in millions, unless otherwise stated)
| | | Outstanding
number of
shares (in
thousands) | | Common
stock | | Capital in
excess of
par value | | Treasury
shares at
cost | | Accumulated
other
comprehensive
income (loss) | | Accumulated
deficit | | Total
stock-
holders’
equity | | Non-
controlling
interests | | Total
equity | | Outstanding
number of
shares (in
thousands) | | Common
stock | | Capital in
excess of
par value | | Treasury
shares at
cost | | Accumulated
other
comprehensive
income (loss) | | Accumulated
deficit | | Total
stock-
holders’
equity | | Non-
controlling
interests | | Total
equity |
| Balance as of December 31, 2020 | | 280,475 | | | 59 | | | 14,133 | | | (1,037) | | | 117 | | | (4,328) | | | 8,944 | | | 207 | | | 9,151 | | |
| Balance as of December 31, 2021 | | Balance as of December 31, 2021 | | 264,950 | | | 56 | | | 13,727 | | | (1,932) | | | 48 | | | (5,371) | | | 6,528 | | | 242 | | | 6,770 | |
| Net income (loss) | Net income (loss) | | 353 | | | 353 | | | 11 | | | 364 | | Net income (loss) | | 657 | | | 657 | | | 9 | | | 666 | |
| Other comprehensive income | Other comprehensive income | | (56) | | | (56) | | | (56) | | Other comprehensive income | | (22) | | | (22) | | | (22) | |
| Share-based compensation plans | Share-based compensation plans | | 91 | | | 91 | | | 91 | | Share-based compensation plans | | 92 | | | 92 | | | 92 | |
| Shares issued pursuant to stock awards | Shares issued pursuant to stock awards | | 361 | | | 37 | | | (6) | | | 31 | | | 31 | | Shares issued pursuant to stock awards | | 256 | | | 51 | | | (23) | | | 28 | | | 28 | |
| Treasury shares repurchased and retired | Treasury shares repurchased and retired | | (5,087) | | | (905) | | | (905) | | | (905) | | Treasury shares repurchased and retired | | (2,653) | | | (552) | | | (552) | | | (552) | |
| | Dividends common stock ($0.5625 per share) | | (155) | | | (155) | | | (155) | | |
| Balance as of April 4, 2021 | | 275,749 | | | 59 | | | 14,224 | | | (1,905) | | | 61 | | | (4,136) | | | 8,303 | | | 218 | | | 8,521 | | |
| Net income (loss) | | 397 | | | 397 | | | 9 | | | 406 | | |
| Other comprehensive income | | 9 | | | 9 | | | 9 | | |
| Share-based compensation plans | | 88 | | | 88 | | | 88 | | |
| Shares issued pursuant to stock awards | | 64 | | | 6 | | | (6) | | | 0 | | | 0 | | |
| Treasury shares and restricted stock unit withholdings | | (6,103) | | | (1,203) | | | (1,203) | | | (1,203) | | |
| | Dividends common stock ($0.5625 per share) | | (152) | | | (152) | | | (152) | | |
| Balance as of July 4, 2021 | | 269,710 | | | 59 | | | 14,312 | | | (3,102) | | | 70 | | | (3,897) | | | 7,442 | | | 227 | | | 7,669 | | |
| Dividends common stock ($0.845 per share) | | Dividends common stock ($0.845 per share) | | (222) | | | (222) | | | (222) | |
| Balance as of April 3, 2022 | | Balance as of April 3, 2022 | | 262,553 | | | 56 | | | 13,819 | | | (2,433) | | | 26 | | | (4,959) | | | 6,509 | | | 251 | | | 6,760 | |
| |
| | | | | | | | | | | | | | | | | | | | | | | | | | | | | | | | | | | | | | | | | | | | | | | | | | | | | | | | |
| | Outstanding number of shares (in thousands) | | Common stock | | Capital in excess of par value | | Treasury shares at cost | | Accumulated other comprehensive income (loss) | | Accumulated deficit | | Total stock- holders’ equity | | Non- controlling interests | | Total equity |
| Balance as of December 31, 2019 | | 281,437 | | | 64 | | | 15,184 | | | (3,037) | | | 75 | | | (2,845) | | | 9,441 | | | 214 | | | 9,655 | |
| Net income (loss) | | | | | | | | | | | | (21) | | | (21) | | | 8 | | | (13) | |
| Other comprehensive income | | | | | | | | | | (61) | | | | | (61) | | | | | (61) | |
| Share-based compensation plans | | | | | | 108 | | | | | | | | | 108 | | | | | 108 | |
| Shares issued pursuant to stock awards | | 497 | | | | | | | 47 | | | | | (18) | | | 29 | | | | | 29 | |
| Treasury shares repurchased and retired | | (2,933) | | | | | | | (355) | | | | | | | (355) | | | | | (355) | |
| Expiration of stock purchase warrants | | | | | | (56) | | | | | | | 56 | | | 0 | | | | | 0 | |
| Dividends common stock ($0.375 per share) | | | | | | | | | | | | (105) | | | (105) | | | | | (105) | |
| Balance as of March 29, 2020 | | 279,001 | | | 64 | | | 15,236 | | | (3,345) | | | 14 | | | (2,933) | | | 9,036 | | | 222 | | | 9,258 | |
| Net income (loss) | | | | | | | | | | | | (214) | | | (214) | | | 5 | | | (209) | |
| Other comprehensive income | | | | | | | | | | 36 | | | | | 36 | | | | | 36 | |
| Share-based compensation plans | | | | | | 104 | | | | | | | | | 104 | | | | | 104 | |
| Shares issued pursuant to stock awards | | 252 | | | | | | | 23 | | | | | (15) | | | 8 | | | | | 8 | |
| Treasury shares and restricted stock unit withholdings | | (40) | | | | | | | (3) | | | | | | | (3) | | | | | (3) | |
| Expiration of stock purchase warrants | | | | | | (112) | | | | | | | 112 | | | 0 | | | | | 0 | |
| Dividends non-controlling interests | | | | | | | | | | | | | | | | (34) | | | (34) | |
| Dividends common stock ($0.375 per share) | | | | | | | | | | | | (105) | | | (105) | | | | | (105) | |
| Balance as of June 28, 2020 | | 279,213 | | | 64 | | | 15,228 | | | (3,325) | | | 50 | | | (3,155) | | | 8,862 | | | 193 | | | 9,055 | |
| | | | | | | | | | | | | | | | | | |
| | | | | | | | | | | | | | | | | | |
| | | | | | | | | | | | | | | | | | |
| | | | | | | | | | | | | | | | | | |
| | | | | | | | | | | | | | | | | | |
| | | | | | | | | | | | | | | | | | |
| | | | | | | | | | | | | | | | | | |
| | | | | | | | | | | | | | | | | | |
| | | | | | | | | | | | | | | | | | | | | | | | | | | | | | | | | | | | | | | | | | | | | | | | | | | | | | | | |
| | Outstanding number of shares (in thousands) | | Common stock | | Capital in excess of par value | | Treasury shares at cost | | Accumulated other comprehensive income (loss) | | Accumulated deficit | | Total stock- holders’ equity | | Non- controlling interests | | Total equity |
| Balance as of December 31, 2020 | | 280,475 | | | 59 | | | 14,133 | | | (1,037) | | | 117 | | | (4,328) | | | 8,944 | | | 207 | | | 9,151 | |
| Net income (loss) | | | | | | | | | | | | 353 | | | 353 | | | 11 | | | 364 | |
| Other comprehensive income | | | | | | | | | | (56) | | | | | (56) | | | | | (56) | |
| Share-based compensation plans | | | | | | 91 | | | | | | | | | 91 | | | | | 91 | |
| Shares issued pursuant to stock awards | | 361 | | | | | | | 37 | | | | | (6) | | | 31 | | | | | 31 | |
| Treasury shares repurchased and retired | | (5,087) | | | | | | | (905) | | | | | | | (905) | | | | | (905) | |
| Dividends common stock ($0.5625 per share) | | | | | | | | | | | | (155) | | | (155) | | | | | (155) | |
| Balance as of April 4, 2021 | | 275,749 | | | 59 | | | 14,224 | | | (1,905) | | | 61 | | | (4,136) | | | 8,303 | | | 218 | | | 8,521 | |
| | | | | | | | | | | | | | | | | | |
| | | | | | | | | | | | | | | | | | |
| | | | | | | | | | | | | | | | | | |
| | | | | | | | | | | | | | | | | | |
| | | | | | | | | | | | | | | | | | |
| | | | | | | | | | | | | | | | | | |
| | | | | | | | | | | | | | | | | | |
| | | | | | | | | | | | | | | | | | |
| | | | | | | | | | | | | | | | | | |
| | | | | | | | | | | | | | | | | | |
| | | | | | | | | | | | | | | | | | |
| | | | | | | | | | | | | | | | | | |
| | | | | | | | | | | | | | | | | | |
| | | | | | | | | | | | | | | | | | |
| | | | | | | | | | | | | | | | | | |
| | | | | | | | | | | | | | | | | | |
See accompanying notes to the Condensed Consolidated Financial Statements
NXP SEMICONDUCTORS N.V.
NOTES TO THE UNAUDITED CONDENSED CONSOLIDATED FINANCIAL STATEMENTS
All amounts in millions of $ unless otherwise stated
1 Basis of Presentation and Overview
We prepared our interim condensed consolidated financial statements that accompany these notes in conformity with U.S. generally accepted accounting principles, consistent in all material respects with those applied in our Annual Report on Form 10-K for the year ended December 31, 2020.2021.
We have made estimates and judgments affecting the amounts reported in our condensed consolidated financial statements and the accompanying notes. The actual results that we experience may differ materially from our estimates. The interim financial information is unaudited, but reflects all normal adjustments that are, in our opinion, necessary to provide a fair statement of results for the interim periods presented. This interim information should be read in conjunction with the consolidated financial statements in our Annual Report on Form 10-K for the year ended December 31, 2020.2021.
2 Significant Accounting Policies and Recent Accounting Pronouncements
Significant Accounting Policies
Except for the changes below, no material changes have been made to the Company'sFor a discussion of our significant accounting policies disclosed in Note 2 Significantsee, “Part II – Item 8. Financial Statements and Supplementary Data – Notes to Consolidated Financial Statements – “Significant Accounting Policies inPolicies” of our Annual Report on Form 10-K for the year ended December 31, 2020. The2021. There have been no changes to our significant accounting policy information below is to aid inpolicies since our Annual Report on Form 10-K for the understanding of the financial information disclosed.year ended December 31, 2021.
Accounting standards recently adopted
In December 2019, the FASB issued ASU 2019-12, Income Taxes (Topic 740): Simplifying the Accounting for Income Taxes. ASU 2019-12 modifies ASC 740 to simplify the accounting for income taxes, removing certain exceptions to the general principles in ASC 740 and amending existing guidance to improve consistent application. ASU 2019-12 became effective for us on January 1, 2021. We have assessed our current positions and the interrelation to the amendments and the adoption of this update did not have a material impact on the Company's consolidated financial statements and related disclosures.
No other new accounting pronouncements were issued or became effective in the period that had, or are expected to have, a material impact on our Consolidated Financial Statements.
3 Acquisitions and Divestments
20212022
There were 0no material acquisitions or divestments during the first sixthree months of 2021.2022.
20202021
There were 0 material acquisitions during the first six months of 2020. On February 3, 2020,July 6, 2021, we completed the sale of the Company's Voice and Audio Solutions (VAS) assets, pursuant to the definitive agreement dated August 16, 2019 and which was previously classified as held for sale, with Shenzhen Goodix Technology Co., Ltd. ("Goodix") from China,acquired Retune DSP for a total consideration of $15.7 million, net cash amount of $161 million inclusive of final working capitalclosing adjustments. This resulted in a gain of $110 million recorded in Other income (expense) on the Consolidated Statements of Operations.
4 Supplemental Financial Information
Statement of Operations Information:
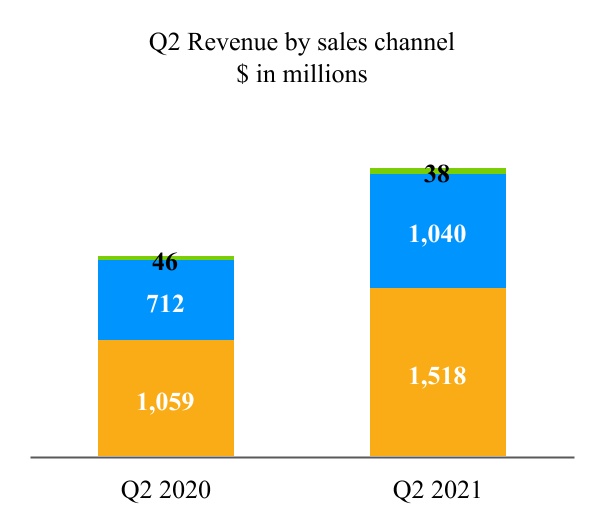
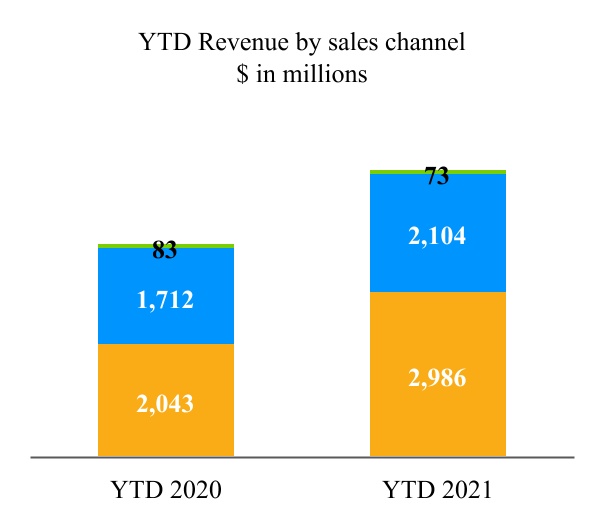
Disaggregation of revenue
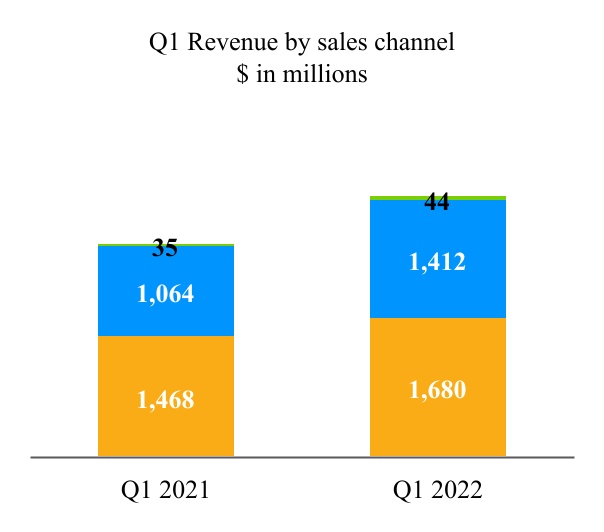
The following table presents revenue disaggregated by sales channel:
| | | For the three months ended | | For the six months ended | | | | For the three months ended | |
| | July 4, 2021 | | June 28, 2020 | | July 4, 2021 | | June 28, 2020 | | | | April 3, 2022 | | April 4, 2021 | |
| Distributors | Distributors | 1,518 | | | 1,059 | | | 2,986 | | | 2,043 | | | Distributors | | 1,680 | | | 1,468 | | |
| Original Equipment Manufacturers and Electronic Manufacturing Services | Original Equipment Manufacturers and Electronic Manufacturing Services | 1,040 | | | 712 | | | 2,104 | | | 1,712 | | | Original Equipment Manufacturers and Electronic Manufacturing Services | | 1,412 | | | 1,064 | | |
| Other | Other | 38 | | | 46 | | | 73 | | | 83 | | | Other | | 44 | | | 35 | | |
| Total | Total | 2,596 | | | 1,817 | | | 5,163 | | | 3,838 | | | Total | | 3,136 | | | 2,567 | | |
Depreciation, amortization and impairment
| | | For the three months ended | | For the six months ended | | | | For the three months ended | |
| | July 4, 2021 | | June 28, 2020 | | July 4, 2021 | | June 28, 2020 | | | | April 3, 2022 | | April 4, 2021 | |
| Depreciation of property, plant and equipment | Depreciation of property, plant and equipment | 135 | | | 136 | | | 267 | | | 269 | | | Depreciation of property, plant and equipment | | 142 | | | 132 | | |
| Amortization of internal use software | Amortization of internal use software | 2 | | | 1 | | | 4 | | | 3 | | | Amortization of internal use software | | 2 | | | 2 | | |
Amortization of other identified intangible assets 1) | Amortization of other identified intangible assets 1) | 168 | | | 406 | | | 375 | | | 811 | | | Amortization of other identified intangible assets 1) | | 166 | | | 207 | | |
| Total - Depreciation, amortization and impairment | Total - Depreciation, amortization and impairment | 305 | | | 543 | | | 646 | | | 1,083 | | | Total - Depreciation, amortization and impairment | | 310 | | | 341 | | |
1) For the sixthree month period ending JulyApril 4, 2021, the amount includes an impairment charge as a result of the discontinuation of an IPR&D project for an amount of $36 million.
Other income (expense)
Income derived from manufacturing service arrangements (“MSA”) and transitional service arrangements (“TSA”) that are put in place when we divest a business or activity, is included in other income (expense). These arrangements are short-term in nature and are expected to decrease as the divested business or activity becomes more established.
The following table presents the split of other income (expense):
| | | | | | | | | | | | | | | | | | | | | | | | | | | |
| For the three months ended | | For the six months ended | | |
| July 4, 2021 | | June 28, 2020 | | July 4, 2021 | | June 28, 2020 | | | | |
| | | | | | | | | | | |
| | | | | | | | | | | |
| Result from MSA and TSA arrangements | (1) | | | (1) | | | (2) | | | (1) | | | | | |
| Other, net | 1 | | 0 | | | 2 | | 110 | | | | | |
| Total - Other income (expense) | 0 | | (1) | | | 0 | | 109 | | | | | |
Financial income and expense
| | | For the three months ended | | For the six months ended | | | | For the three months ended | |
| | July 4, 2021 | | June 28, 2020 | | July 4, 2021 | | June 28, 2020 | | | | April 3, 2022 | | April 4, 2021 | |
| Interest income | Interest income | 1 | | | 4 | | | 2 | | | 8 | | | Interest income | | 2 | | | 1 | | |
| Interest expense | Interest expense | (90) | | | (94) | | | (177) | | | (176) | | | Interest expense | | (104) | | | (87) | | |
| Total interest expense, net | Total interest expense, net | (89) | | | (90) | | | (175) | | | (168) | | | Total interest expense, net | | (102) | | | (86) | | |
| | Foreign exchange rate results | Foreign exchange rate results | (1) | | | (5) | | | 0 | | | (1) | | | Foreign exchange rate results | | — | | | 1 | | |
| | Miscellaneous financing costs/income and other, net | Miscellaneous financing costs/income and other, net | (10) | | | (1) | | | (12) | | | (5) | | | Miscellaneous financing costs/income and other, net | | (3) | | | (2) | | |
| Total other financial income/ (expense) | Total other financial income/ (expense) | (11) | | | (6) | | | (12) | | | (6) | | | Total other financial income/ (expense) | | (3) | | | (1) | | |
| Total - Financial income and expenses | Total - Financial income and expenses | (100) | | | (96) | | | (187) | | | (174) | | | Total - Financial income and expenses | | (105) | | | (87) | | |
Earnings per share
The computation of earnings per share (EPS) is presented in the following table:
| | | For the three months ended | | For the six months ended | | | | For the three months ended | |
| | July 4, 2021 | | June 28, 2020 | | July 4, 2021 | | June 28, 2020 | | | | April 3, 2022 | | April 4, 2021 | |
| Net income (loss) | Net income (loss) | 406 | | | (209) | | | 770 | | | (222) | | | Net income (loss) | | 666 | | | 364 | | |
| Less: net income (loss) attributable to non-controlling interests | Less: net income (loss) attributable to non-controlling interests | 9 | | | 5 | | | 20 | | | 13 | | | Less: net income (loss) attributable to non-controlling interests | | 9 | | | 11 | | |
| Net income (loss) attributable to stockholders | Net income (loss) attributable to stockholders | 397 | | | (214) | | | 750 | | | (235) | | | Net income (loss) attributable to stockholders | | 657 | | | 353 | | |
| | Weighted average number of shares outstanding (after deduction of treasury shares) during the year (in thousands) | Weighted average number of shares outstanding (after deduction of treasury shares) during the year (in thousands) | 272,686 | | | 279,142 | | | 275,145 | | | 279,533 | | | Weighted average number of shares outstanding (after deduction of treasury shares) during the year (in thousands) | | 263,089 | | | 277,526 | | |
| Plus incremental shares from assumed conversion of: | Plus incremental shares from assumed conversion of: | | | Plus incremental shares from assumed conversion of: | | | |
Options 1) | Options 1) | 394 | | | 0 | | | 406 | | | 0 | | | Options 1) | | 321 | | | 416 | | |
Restricted Share Units, Performance Share Units and Equity Rights 2) | Restricted Share Units, Performance Share Units and Equity Rights 2) | 5,655 | | | 0 | | | 5,512 | | | 0 | | | Restricted Share Units, Performance Share Units and Equity Rights 2) | | 1,699 | | | 5,321 | | |
| Dilutive potential common shares | Dilutive potential common shares | 6,049 | | | 0 | | | 5,918 | | | 0 | | | Dilutive potential common shares | | 2,020 | | | 5,737 | | |
| | Adjusted weighted average number of shares outstanding (after deduction of treasury shares) during the year (in thousands) | Adjusted weighted average number of shares outstanding (after deduction of treasury shares) during the year (in thousands) | 278,735 | | | 279,142 | | | 281,063 | | | 279,533 | | | Adjusted weighted average number of shares outstanding (after deduction of treasury shares) during the year (in thousands) | | 265,109 | | | 283,263 | | |
| | EPS attributable to stockholders in $: | EPS attributable to stockholders in $: | | | EPS attributable to stockholders in $: | | | |
| Basic net income (loss) | Basic net income (loss) | 1.46 | | | (0.77) | | | 2.73 | | | (0.84) | | | Basic net income (loss) | | 2.50 | | | 1.27 | | |
| Diluted net income (loss) | Diluted net income (loss) | 1.42 | | | (0.77) | | | 2.67 | | | (0.84) | | | Diluted net income (loss) | | 2.48 | | | 1.25 | | |
1) There were 0no stock options to purchase shares of NXP’s common stock that were outstanding in Q2 2021 and YTD 2021 (Q2 2020: 0.9 million shares; YTD 2020: 0.9 millionQ1 2022 (Q1 2021: no shares) that were anti-dilutive and were not included in the computation of diluted EPS because the exercise price was greater than the average fair market value of the common stock or the number of shares assumed to be repurchased using the proceeds of unrecognized compensation expense and exercise prices waswere greater than the weighted average number of shares underlying outstanding stock options.
2) There were 00.2 million unvested RSUs, PSUs and equity rights that were outstanding in Q2 2021 and YTD 2021 (Q2 2020: 7.7 million shares; YTD 2020: 7.7 millionQ1 2022 (Q1 2021: no shares) that were anti-dilutive and were not included in the computation of diluted EPS because the number of shares assumed to be repurchased using the proceeds of unrecognized compensation expense waswere greater than the weighted average number of outstanding unvested RSUs, PSUs and equity rights or the performance goal has not been met yet.
Balance Sheet Information
Cash and cash equivalents
At July 4, 2021April 3, 2022 and December 31, 2020,2021, our cash balance was $2,910$2,683 million and $2,275$2,830 million, respectively, of which $206$185 million and $185$208 million was held by SSMC, our consolidated joint venture company with TSMC. Under the terms of our joint venture agreement with TSMC, a portion of this cash can be distributed by way of a dividend to us, but 38.8% of the dividend will be paid to our joint venture partner. During the first six months of 2021, 0 dividend was declared by SSMC. In 2020, $90 million has been declared by SSMC, distributed subsequent to the end of the second quarter of 2020, with 38.8% being paid to our joint venture partner.
Inventories
The portion of finished goods stored at customer locations under consignment amounted to $19$9 million as of July 4, 2021April 3, 2022 (December 31, 2020: $312021: $12 million).
Inventories are summarized as follows:
| | | July 4, 2021 | | December 31, 2020 | | April 3, 2022 | | December 31, 2021 |
| Raw materials | Raw materials | 91 | | | 66 | | Raw materials | 118 | | | 107 | |
| Work in process | Work in process | 882 | | | 786 | | Work in process | 974 | | | 846 | |
| Finished goods | Finished goods | 143 | | | 178 | | Finished goods | 219 | | | 236 | |
| | 1,116 | | | 1,030 | | | 1,311 | | | 1,189 | |
The amounts recorded above are net of allowance for obsolescence of $117$121 million as of July 4, 2021April 3, 2022 (December 31, 2020: $1222021: $120 million).
Equity Investments
At July 4, 2021April 3, 2022 and December 31, 2020,2021, the total carrying value of investments in equity securities is summarized as follows:
| | | July 4, 2021 | | December 31, 2020 | | April 3, 2022 | | December 31, 2021 |
| Marketable equity securities | Marketable equity securities | 20 | | | 19 | | Marketable equity securities | 17 | | | 18 | |
| Non-marketable equity securities | Non-marketable equity securities | 22 | | | 40 | | Non-marketable equity securities | 11 | | | 19 | |
| Equity-accounted investments | Equity-accounted investments | 69 | | | 61 | | Equity-accounted investments | 89 | | | 75 | |
| | 111 | | | 120 | | | 117 | | | 112 | |
The total carrying value of investments in equity-accounted investees is summarized as follows:
| | | July 4, 2021 | | December 31, 2020 | | April 3, 2022 | | December 31, 2021 |
| | Shareholding % | | Amount | | Shareholding % | | Amount | | Shareholding % | | Amount | | Shareholding % | | Amount |
| Wise Road Industry Investment Fund I, L.P. | Wise Road Industry Investment Fund I, L.P. | | 9.66 | % | | 32 | | | 10.17 | % | | 29 | | Wise Road Industry Investment Fund I, L.P. | | 8.41 | % | | 43 | | | 8.41 | % | | 31 | |
| Others | Others | | 0 | | | 37 | | | 0 | | | 32 | | Others | | — | | | 46 | | | — | | | 44 | |
| | 69 | | | 61 | | | 89 | | | 75 | |
Results related to equity-accounted investees at the end of each period were as follows:
| | | For the three months ended | | For the six months ended | | | For the three months ended |
| | July 4, 2021 | | June 28, 2020 | | July 4, 2021 | | June 28, 2020 | | | April 3, 2022 | | April 4, 2021 |
| Company’s share in income (loss) | Company’s share in income (loss) | (2) | | | (1) | | | (3) | | | (2) | | Company’s share in income (loss) | | 11 | | | (1) | |
| Other results | Other results | 0 | | | 0 | | | 0 | | | 0 | | Other results | | 1 | | | — | |
| | (2) | | | (1) | | | (3) | | | (2) | | | | 12 | | | (1) | |
Other current liabilities
Other current liabilities at July 4, 2021April 3, 2022 and December 31, 20202021 consisted of the following:
| | | July 4, 2021 | | December 31, 2020 | | April 3, 2022 | | December 31, 2021 |
| Accrued compensation and benefits | Accrued compensation and benefits | 411 | | | 286 | | Accrued compensation and benefits | 537 | | | 476 | |
| Income taxes payable | Income taxes payable | 70 | | | 140 | | Income taxes payable | 100 | | | 82 | |
| Dividend payable | Dividend payable | 152 | | | 105 | | Dividend payable | 222 | | | 149 | |
| Other | Other | 500 | | | 435 | | Other | 601 | | | 468 | |
| | 1,133 | | | 966 | | | 1,460 | | | 1,175 | |
Accumulated other comprehensive income (loss)
Total comprehensive income (loss) represents net income (loss) plus the results of certain equity changes not reflected in the condensed consolidated statements of operations. The after-tax components of accumulated other comprehensive income (loss) and their corresponding changes are shown below:
| | | Currency
translation
differences | | Change in fair
value
cash flow hedges | | Net actuarial
gain/(losses) | | Accumulated
Other
Comprehensive
Income (loss) | | Currency
translation
differences | | Change in fair
value
cash flow hedges | | Net actuarial
gain/(losses) | | Accumulated
Other
Comprehensive
Income (loss) |
| As of December 31, 2020 | 281 | | | 11 | | | (175) | | | 117 | | |
| As of December 31, 2021 | | As of December 31, 2021 | 207 | | | — | | | (159) | | | 48 | |
Other comprehensive income (loss) before
reclassifications | Other comprehensive income (loss) before
reclassifications | (33) | | | (9) | | | 0 | | | (42) | | Other comprehensive income (loss) before
reclassifications | (18) | | | (6) | | | — | | | (24) | |
Amounts reclassified out of accumulated other
comprehensive income (loss) | Amounts reclassified out of accumulated other
comprehensive income (loss) | 0 | | | (10) | | | 0 | | | (10) | | Amounts reclassified out of accumulated other
comprehensive income (loss) | — | | | 1 | | | — | | | 1 | |
| Tax effects | Tax effects | 0 | | | 5 | | | 0 | | | 5 | | Tax effects | — | | | 1 | | | — | | | 1 | |
| Other comprehensive income (loss) | Other comprehensive income (loss) | (33) | | | (14) | | | 0 | | | (47) | | Other comprehensive income (loss) | (18) | | | (4) | | | — | | | (22) | |
| As of July 4, 2021 | 248 | | | (3) | | | (175) | | | 70 | | |
| As of April 3, 2022 | | As of April 3, 2022 | 189 | | | (4) | | | (159) | | | 26 | |
Cash dividends
The following dividends were declared during the first quarters of 20212022 and 20202021 under NXP’s quarterly dividend program:
| | | | | | | | | | | | | | | | | | | | | | | |
| Fiscal year 2021 | | Fiscal year 2020 |
| Dividend per share | | Amount | | Dividend per share | | Amount |
| First quarter | 0.5625 | | | 155 | | | 0.375 | | | 105 | |
| Second quarter | 0.5625 | | | 152 | | | 0.375 | | | 105 | |
| | | | | | | |
| | | | | | | |
| | | | | | | |
| | | | | | | |
| | | | | | | | | | | | | | | | | | | | | | | |
| Fiscal year 2022 | | Fiscal year 2021 |
| Dividend per share | | Amount | | Dividend per share | | Amount |
| First quarter | 0.845 | | | 222 | | | 0.5625 | | | 155 | |
| | | | | | | |
| | | | | | | |
| | | | | | | |
| | | | | | | |
The dividend declared in the secondfirst quarter (not yet paid) is classified in the condensed consolidated balance sheet in other current liabilities as of July 4, 2021April 3, 2022 and was subsequently paid on JulyApril 6, 2021.2022.
5 Restructuring
At each reporting date, we evaluate our restructuring liabilities, which consist primarily of termination benefits, to ensure that our accruals are still appropriate.
The following table presents the changes in restructuring liabilities in 2021:2022:
| | | | | | | | | | | | | | | | | | | | | | | | | | | | | | | | | | | |
| As of January 1, 2021 | | Additions | | Utilized | | Released | | Other
changes | | As of July 4, 2021 |
| Restructuring liabilities | 74 | | | 0 | | | (25) | | | 0 | | | (1) | | | 48 | |
| | | | | | | | | | | | | | | | | | | | | | | | | | | | | | | | | | | |
| As of January 1, 2022 | | Additions | | Utilized | | Released | | Other
changes | | As of April 3, 2022 |
| Restructuring liabilities | 37 | | | — | | | (5) | | | (1) | | | (1) | | | 30 | |
The restructuring charges consist of personnel lay-off costs of $1 millionThere were no restructuring costs incurred for the sixthree month period ended JulyApril 3, 2022 and the utilization of the restructuring liabilities mainly reflects the execution of ongoing restructuring programs the Company initiated in earlier years (April 4, 2021 (June 28, 2020: $19 million)2021: no restructuring costs incurred).
These restructuring charges recorded in operating income, for the periods indicated, are included in the following line items in the statement of operations:
| | | | | | | | | | | | | | | | | | | | | | | |
| For the three months ended | | For the six months ended |
| July 4, 2021 | | June 28, 2020 | | July 4, 2021 | | June 28, 2020 |
| Cost of revenue | 0 | | | 0 | | | 0 | | | 3 | |
| Research and development | 1 | | | 6 | | | 1 | | | 10 | |
| Selling, general and administrative | 0 | | | 2 | | | 0 | | | 6 | |
| | | | | | | |
| Net restructuring charges | 1 | | | 8 | | | 1 | | | 19 | |
| | | | | | | | | | | | | | | |
| | | For the three months ended |
| | | | | April 3, 2022 | | April 4, 2021 |
| Cost of revenue | | | | | — | | | — | |
| Research and development | | | | | (1) | | | — | |
| Selling, general and administrative | | | | | — | | | — | |
| | | | | | | |
| Net restructuring charges | | | | | (1) | | | — | |
6 Income Taxes
Benefit/provision for income taxes:
| | | For the three months ended | | For the six months ended | | | | For the three months ended | |
| | July 4, 2021 | | June 28, 2020 | | July 4, 2021 | | June 28, 2020 | | | | April 3, 2022 | | April 4, 2021 | |
| Tax expense (benefit) | Tax expense (benefit) | 65 | | | (33) | | | 105 | | | (31) | | | Tax expense (benefit) | | 114 | | | 40 | | |
| Effective tax rate | Effective tax rate | 13.7 | % | | 13.7 | % | | 12.0 | % | | 12.4 | % | | Effective tax rate | | 14.8 | % | | 9.9 | % | |
Our provision for income taxes for the first sixthree months of 20212022 was $105of $114 million (12.0%(14.8% effective tax rate) compared to a benefitprovision from income taxes of ($31 million) ((12.4%)$40 million (9.9% effective tax rate) for the first sixthree months of 2020.2021. The increase in the income tax expense was due to higher income before income taxes offset by the net change in the valuation allowance between the two periods and by an increase in tax incentives (both as a result of the improved operational performance of the company).company which was partly offset by an increase in tax incentives also taking into account the effect of specific US tax law that became effective as from 2022. In addition to this, in the first three months of 2021 there was an income tax benefit due to changes in estimates of prior positions and due to a net change in the valuation allowance.
The Company benefits from income tax incentives in certain jurisdictions which provide that we pay reduced income taxes in those jurisdictions for a fixed period of time that varies depending on the jurisdiction. The predominant income tax holiday is expected to expire at the end of 2026. The impact of this tax holiday decreased foreign income taxes for the secondfirst quarter of 20212022 by $3 million and decreased by $2$4 million for the secondfirst quarter 2020 (YTD 2021: a decrease of $7 million and YTD 2020: a decrease of $5 million).2021. The benefit of this tax holiday on net income per share (diluted) was $0.02$0.01 for the secondfirst quarter of 2021 (YTD 2021: $0.03)2022 and $0.01 for the secondfirst quarter of 2020 (YTD 2020: $0.02).2021.
7 Identified Intangible Assets
Identified intangible assets as of July 4, 2021April 3, 2022 and December 31, 2020,2021, respectively, were composed of the following:
| | | July 4, 2021 | | December 31, 2020 | | April 3, 2022 | | December 31, 2021 |
| | Gross carrying
amount | | Accumulated
amortization | | Gross carrying
amount | | Accumulated
amortization | | Gross carrying
amount | | Accumulated
amortization | | Gross carrying
amount | | Accumulated
amortization |
In-process R&D (IPR&D) 1) | In-process R&D (IPR&D) 1) | 111 | | | — | | | 147 | | | — | | In-process R&D (IPR&D) 1) | 53 | | | — | | | 96 | | | — | |
| Marketing-related | Marketing-related | 81 | | | (81) | | | 81 | | | (81) | | Marketing-related | — | | | — | | | 81 | | | (81) | |
| Customer-related | Customer-related | 911 | | | (360) | | | 957 | | | (381) | | Customer-related | 851 | | | (336) | | | 852 | | | (325) | |
| Technology-based | Technology-based | 8,065 | | | (6,836) | | | 8,064 | | | (6,545) | | Technology-based | 3,732 | | | (2,723) | | | 3,686 | | | (2,615) | |
| Identified intangible assets | Identified intangible assets | 9,168 | | | (7,277) | | | 9,249 | | | (7,007) | | Identified intangible assets | 4,636 | | | (3,059) | | | 4,715 | | | (3,021) | |
| | (1) IPR&D is not subject to amortization until completion or abandonment of the associated research and development effort. | (1) IPR&D is not subject to amortization until completion or abandonment of the associated research and development effort. | (1) IPR&D is not subject to amortization until completion or abandonment of the associated research and development effort. |
The estimated amortization expense for these identified intangible assets for each of the five succeeding years is:
| | 2021 (remaining) | 332 | | |
| 2022 | 576 | | |
| 2022 (remaining) | | 2022 (remaining) | 457 | |
| 2023 | 2023 | 341 | | 2023 | 397 | |
| 2024 | 2024 | 152 | | 2024 | 212 | |
| 2025 | 2025 | 100 | | 2025 | 113 | |
| 2026 | | 2026 | 68 | |
| Thereafter | Thereafter | 390 | | Thereafter | 330 | |
All intangible assets, excluding IPR&D and goodwill, are subject to amortization and have no assumed residual value.
The expected weighted average remaining life of identified intangibles is 4 years as of July 4, 2021April 3, 2022 (December 31, 2020:2021: 4 years).
8 Debt
On May 11, 2021, NXP B.V., together with NXP Funding LLC and NXP USA, Inc., issued $1 billion of 2.5% senior unsecured notes due May 11, 2031 and $1 billion of 3.25% senior unsecured notes due May 11, 2041.
The following table summarizes the outstanding debt as of July 4, 2021April 3, 2022 and December 31, 2020:2021:
| | | July 4, 2021 | | December 31, 2020 | | April 3, 2022 | | December 31, 2021 |
| | Maturities | | Amount | | Effective
rate | | Amount | | Effective
rate | | Maturities | | Amount | | Interest
rate | | Amount | | Interest
rate |
| Fixed-rate 3.875% senior unsecured notes | Sep, 2022 | | 1,000 | | | 3.875 | | | 1,000 | | | 3.875 | | |
| Fixed-rate 4.625% senior unsecured notes | Fixed-rate 4.625% senior unsecured notes | Jun, 2023 | | 900 | | | 4.625 | | | 900 | | | 4.625 | | Fixed-rate 4.625% senior unsecured notes | Jun, 2023 | | 900 | | | 4.625 | | | 900 | | | 4.625 | |
| Fixed-rate 4.875% senior unsecured notes | Fixed-rate 4.875% senior unsecured notes | Mar, 2024 | | 1,000 | | | 4.875 | | | 1,000 | | | 4.875 | | Fixed-rate 4.875% senior unsecured notes | Mar, 2024 | | 1,000 | | | 4.875 | | | 1,000 | | | 4.875 | |
| Fixed-rate 2.7% senior unsecured notes | Fixed-rate 2.7% senior unsecured notes | May, 2025 | | 500 | | | 2.700 | | | 500 | | | 2.700 | | Fixed-rate 2.7% senior unsecured notes | May, 2025 | | 500 | | | 2.700 | | | 500 | | | 2.700 | |
| Fixed-rate 5.35% senior unsecured notes | Fixed-rate 5.35% senior unsecured notes | Mar, 2026 | | 500 | | | 5.350 | | | 500 | | | 5.350 | | Fixed-rate 5.35% senior unsecured notes | Mar, 2026 | | 500 | | | 5.350 | | | 500 | | | 5.350 | |
| Fixed-rate 3.875% senior unsecured notes | Fixed-rate 3.875% senior unsecured notes | Jun, 2026 | | 750 | | | 3.875 | | | 750 | | | 3.875 | | Fixed-rate 3.875% senior unsecured notes | Jun, 2026 | | 750 | | | 3.875 | | | 750 | | | 3.875 | |
| Fixed-rate 3.15% senior unsecured notes | Fixed-rate 3.15% senior unsecured notes | May, 2027 | | 500 | | | 3.150 | | | 500 | | | 3.150 | | Fixed-rate 3.15% senior unsecured notes | May, 2027 | | 500 | | | 3.150 | | | 500 | | | 3.150 | |
| Fixed-rate 5.55% senior unsecured notes | Fixed-rate 5.55% senior unsecured notes | Dec, 2028 | | 500 | | | 5.550 | | | 500 | | | 5.550 | | Fixed-rate 5.55% senior unsecured notes | Dec, 2028 | | 500 | | | 5.550 | | | 500 | | | 5.550 | |
| Fixed-rate 4.3% senior unsecured notes | Fixed-rate 4.3% senior unsecured notes | Jun, 2029 | | 1,000 | | | 4.300 | | | 1,000 | | | 4.300 | | Fixed-rate 4.3% senior unsecured notes | Jun, 2029 | | 1,000 | | | 4.300 | | | 1,000 | | | 4.300 | |
| Fixed-rate 3.4% senior unsecured notes | Fixed-rate 3.4% senior unsecured notes | May, 2030 | | 1,000 | | | 3.400 | | | 1,000 | | | 3.400 | | Fixed-rate 3.4% senior unsecured notes | May, 2030 | | 1,000 | | | 3.400 | | | 1,000 | | | 3.400 | |
| Fixed-rate 2.5% senior unsecured notes | Fixed-rate 2.5% senior unsecured notes | May, 2031 | | 1,000 | | | 2.500 | | | — | | | — | | Fixed-rate 2.5% senior unsecured notes | May, 2031 | | 1,000 | | | 2.500 | | | 1,000 | | | 2.500 | |
| Fixed-rate 2.65% senior unsecured notes | | Fixed-rate 2.65% senior unsecured notes | Feb, 2032 | | 1,000 | | | 2.650 | | | 1,000 | | | 2.650 | |
| Fixed-rate 3.25% senior unsecured notes | | Fixed-rate 3.25% senior unsecured notes | May, 2041 | | 1,000 | | | 3.250 | | | 1,000 | | | 3.250 | |
| Fixed-rate 3.125% senior unsecured notes | | Fixed-rate 3.125% senior unsecured notes | Feb, 2042 | | 500 | | | 3.125 | | | 500 | | | 3.125 | |
| Fixed-rate 3.25% senior unsecured notes | Fixed-rate 3.25% senior unsecured notes | May, 2041 | | 1,000 | | | 3.250 | | | — | | | — | | Fixed-rate 3.25% senior unsecured notes | Nov, 2051 | | 500 | | | 3.250 | | | 500 | | | 3.250 | |
| Floating-rate revolving credit facility (RCF) | Floating-rate revolving credit facility (RCF) | Jun, 2024 | | 0 | | | 0 | | | 0 | | | 0 | | Floating-rate revolving credit facility (RCF) | Jun, 2024 | | — | | | — | | | — | | | — | |
| Total principal | Total principal | | 9,650 | | | 7,650 | | | Total principal | | 10,650 | | | 10,650 | | |
| Unamortized discounts, premiums and debt
issuance costs | Unamortized discounts, premiums and debt
issuance costs | | (59) | | | (41) | | | Unamortized discounts, premiums and debt
issuance costs | | (77) | | | (78) | | |
Total debt, including unamortized discounts,
premiums, debt issuance costs and fair value
adjustments | Total debt, including unamortized discounts,
premiums, debt issuance costs and fair value
adjustments | | 9,591 | | | 7,609 | | | Total debt, including unamortized discounts,
premiums, debt issuance costs and fair value
adjustments | | 10,573 | | | 10,572 | | |
| Current portion of long-term debt | Current portion of long-term debt | | 0 | | | 0 | | | Current portion of long-term debt | | — | | | — | | |
| Long-term debt | Long-term debt | | 9,591 | | | 7,609 | | | Long-term debt | | 10,573 | | | 10,572 | | |
9 Related-Party Transactions
The Company's related parties are the members of the board of directors of NXP Semiconductors N.V., the members of the management teamexecutive officers of NXP Semiconductors N.V. and equity-accounted investees.
The following table presents the amounts related to revenue and other income and purchase of goods and services incurred in transactions with these related parties:
| | | For the three months ended | | For the six months ended | | | For the three months ended |
| | July 4, 2021 | | June 28, 2020 | | July 4, 2021 | | June 28, 2020 | | | April 3, 2022 | | April 4, 2021 |
| Revenue and other income | Revenue and other income | 2 | | | 18 | | | 4 | | | 36 | | Revenue and other income | | 3 | | | 2 | |
| Purchase of goods and services | Purchase of goods and services | 1 | | | 14 | | | 2 | | | 26 | | Purchase of goods and services | | 1 | | | 1 | |
The following table presents the amounts related to receivable and payable balances with these related parties:
| | | July 4, 2021 | | December 31, 2020 | | April 3, 2022 | | December 31, 2021 |
| Receivables | Receivables | 2 | | | 3 | | Receivables | 1 | | | 1 | |
| Payables | Payables | 7 | | | 7 | | Payables | 3 | | | 3 | |
10 Fair Value Measurements
The following table summarizes the estimated fair value of our financial instruments which are measured at fair value on a recurring basis:
| | | Estimated fair value | | Estimated fair value |
| | Fair value
hierarchy | | July 4, 2021 | | December 31, 2020 | | Fair value
hierarchy | | April 3, 2022 | | December 31, 2021 |
| Assets: | Assets: | | | | | | Assets: | | | | | |
| Money market funds | Money market funds | 1 | | 2,008 | | | 1,469 | | Money market funds | 1 | | 1,763 | | | 2,111 | |
| Marketable equity securities | Marketable equity securities | 1 | | 20 | | | 19 | | Marketable equity securities | 1 | | 17 | | | 18 | |
| Derivative instruments-assets | Derivative instruments-assets | 2 | | 2 | | | 18 | | Derivative instruments-assets | 2 | | 9 | | | 5 | |
| | Liabilities: | Liabilities: | | Liabilities: | |
| | Derivative instruments-liabilities | Derivative instruments-liabilities | 2 | | (10) | | | 0 | | Derivative instruments-liabilities | 2 | | (8) | | | (3) | |
The following methods and assumptions were used to estimate the fair value of financial instruments:
Assets and liabilities measured at fair value on a recurring basis
Investments in money market funds (as part of our cash and cash equivalents) and marketable equity securities (as part of other non-current assets) have fair value measurements which are all based on quoted prices in active markets for identical assets or liabilities. For derivatives (as part of other current assets or accrued liabilities) the fair value is based upon significant other observable inputs depending on the nature of the derivative.
Assets and liabilities recorded at fair value on a non-recurring basis
We measure and record our non-marketable equity securities, equity method investments and non-financial assets, such as intangible assets and property, plant and equipment, at fair value when an impairment charge is required.
Assets and liabilities not recorded at fair value on a recurring basis
Financial instruments not recorded at fair value on a recurring basis include non-marketable equity securities and equity method investments that have not been remeasured or impaired in the current period and debt.
As of July 4, 2021,April 3, 2022, the estimated fair value of current and non-current debt including the current portion, was $10.5$10.3 billion ($8.611.3 billion as of December 31, 2020)2021). The fair value is estimated on the basis of broker-dealer quotes, which are Level 2 inputs. Accrued interest is included under accrued liabilities and not within the carrying amount or estimated fair value of debt.
11 Commitments and Contingencies
Purchase Commitments
The Company maintains purchase commitments with certain suppliers, primarily for raw materials, semi-finished goods and manufacturing services and for some non-production items. Purchase commitments for inventory materials are generally restricted to a forecasted time-horizon as mutually agreed upon between the parties. This forecasted time-horizon can vary for different suppliers. As of July 4, 2021,April 3, 2022, the Company had purchase commitments of $3,769$3,925 million, which are due through 2044. Our long-term obligations increased substantially in 2021 as we locked in long-term supply with our key manufacturing partners.
Litigation
We are regularly involved as plaintiffs or defendants in claims and litigation relating to a variety of matters such as contractual disputes, personal injury claims, employee grievances and intellectual property litigation. In addition, our acquisitions, divestments and financial transactions sometimes result in, or are followed by, claims or litigation. Some of these claims may possibly be recovered from insurance reimbursements. Although the ultimate disposition of asserted claims cannot be predicted with certainty, it is our belief that the outcome of any such claims, either individually or on a combined basis, will not have a material adverse effect on our consolidated financial position. However, such outcomes may be material to our condensed consolidated statement of operations for a particular period. The Company records an accrual for any claim that arises whenever it considers that it is probable that it is exposed to a loss contingency and the amount of the loss contingency can be reasonably estimated. The Company does not record a gain contingency until the period in which all contingencies are resolved and the gain is realized or realizable. Legal fees are expensed when incurred.
Based on the most current information available to it and based on its best estimate, the Company also reevaluates at least on a quarterly basis the claims that have arisen to determine whether any new accruals need to be made or whether any accruals made need to be adjusted. Based on the procedures described above, the Company has an aggregate amount of $17$61 million accrued for potential and current legal proceedings pending as of July 4, 2021,April 3, 2022, compared to $17$65 million accrued at December 31, 2020.2021 (without reduction for any related insurance reimbursements). The accruals are included in “Other current liabilities” and “Other non-current liabilities”. As of July 4, 2021,April 3, 2022, the Company’s related balance of insurance reimbursements was $8$45 million (December 31, 2020: $82021: $46 million) and is included in “Other current assets” and “Other non-current assets”.
The Company also estimates the aggregate range of reasonably possible losses in excess of the amount accrued based on currently available information for those cases for which such estimate can be made. The estimated aggregate range requires significant judgment, given the varying stages of the proceedings, (including the fact that many of them are currently in preliminary stages), the existence of multiple defendants (including the Company) in such claims whose share of liability has yet to be determined, the numerous yet-unresolved issues in many of the claims, and the attendant uncertainty of the various potential outcomes of such claims. Accordingly, the Company’s estimate will change from time to time, and actual losses may be more than the current estimate. As at July 4, 2021,April 3, 2022, the Company believes that for all litigation pending its potential aggregate exposure to loss in excess of the amount accrued (without reduction for any amounts that may possibly be recovered under insurance programs) could range between $0 and $13$63 million. Based upon our past experience with these matters, the Company would expect to receive additional insurance reimbursement of up to $49 million on certain of these claims that would partially offset the potential maximumaggregate exposure to loss in excess of up to $15 million.the amount accrued.
In addition, the Company is currently assisting Motorola in the defense of personal injury lawsuits due to indemnity obligations included in the agreement that separated Freescale from Motorola in 2004. The multi-plaintiff Motorola lawsuits are pending in the Circuit Court of Cook County, Illinois. These claims allege a link between working in semiconductor manufacturing clean room facilities and birth defects in 1817 individuals. The Motorola suits allege exposures between 1981 and 2005.2006. Each claim seeks an unspecified amount of damages for the alleged injuries; however, legal counsel representing the plaintiffs has indicated they will seek substantial compensatory and punitive damages from Motorola for the entire inventory of claims which, if proven and recovered, the Company considers to be material. In the Motorola suits, aA portion of any indemnity due to Motorola will be reimbursed to NXP if Motorola receives an indemnification payment from its insurance coverage. Motorola has potential insurance coverage for many of the years indicated above, but with differing types and levels of coverage, self-insurance retention amounts and deductibles. We are in discussions with Motorola and their insurers regarding the availability of applicable insurance coverage for each of the individual cases. Motorola and NXP have denied liability for these alleged injuries based on numerous defenses.
Loss recovery
In February 2021, NXP’s two wafer manufacturing facilities in Austin, Texas were negatively impacted by unusually severe winter weather conditions that corresponded with a widespread disruption of gas, electricity, and water. The Company has insurance coverage for the repair or replacement of assets that suffered damage or loss and business interruption coverage, including lost profits, and the reimbursement of other expenses and costs that have been incurred relating to the damages and losses suffered.
For the three months ended July 4, 2021, the company recognized $109 million in insurance proceeds directly offsetting the loss from operations that were incurred in the period. The Company continues to work closely with its insurance carriers and claims adjusters to ascertain the full amount of insurance recoveries due as a result of the damage and loss
12 Subsequent Events
Share Repurchases
During the period subsequent to July 4, 2021 and through August 2, 2021, we repurchased via a 10b5-1 program $1.0 billion, or 5.0 million shares of our common stock pursuant to our share buyback programs.
Item 2. Management’s Discussion and Analysis of Financial Condition and Results of Operations
This interim Management’s Discussion and Analysis ("MD&A") should be read in conjunction with our consolidated financial statements and notes and the MD&A in our Annual Report on Form 10-K for the year ended December 31, 2020.2021. This discussion contains forward-looking statements that involve a number of risks and uncertainties, including any statements that refer to projections of our future financial performance, our anticipated growth and trends in our businesses, uncertain events or assumptions, and other characterizations of future events or circumstances, including the expected timeline to remediate the identified material weakness in our internal control over financial reporting, the uncertain nature, magnitude, and duration of hostilities stemming from Russia's recent military invasion of the Ukraine, and our response to the current global pandemic and the potential impact the pandemic will have on our operations, liquidity, customers, facilities and supply chain. Such statements are based on our current expectations and could be affected by the uncertainties and risk factors described throughout this filing, and in “Risk Factors” in Part I, Item 1A of our Annual Report on Form 10-K. Our actual results may differ materially from those contained in any forward-looking statements. We undertake no obligation to update any forward-looking statement to reflect subsequent events or circumstances.
Our MD&A is provided in addition to the accompanying consolidated financial statements and notes to assist readers in understanding our results of operations, financial condition and cash flows. MD&A is organized as follows:
•Overview - Overall analysis of financial and other highlights to provide context for the MD&A
•Results of Operations - An analysis of our financial results
•Liquidity and Capital Resources - An analysis of changes in our balance sheets and cash flows
•Contractual ObligationsInformation Regarding Guarantors of NXP - An updateFinancial information of the Obligor Group on contractual obligations as of December 31, 2020
•Off-balance Sheet Arrangements - An update on off-balance sheet arrangements as of December 31, 2020a combined basis
Overview
| | ($ in millions, unless otherwise stated) | ($ in millions, unless otherwise stated) | Q2 2021 | | Q2 2020 | | YTD 2021 | | YTD 2020 | | ($ in millions, unless otherwise stated) | Q1 2022 | | Q1 2021 | |
| | Revenue | Revenue | 2,596 | | 1,817 | | | 5,163 | | 3,838 | | | Revenue | 3,136 | | 2,567 | | |
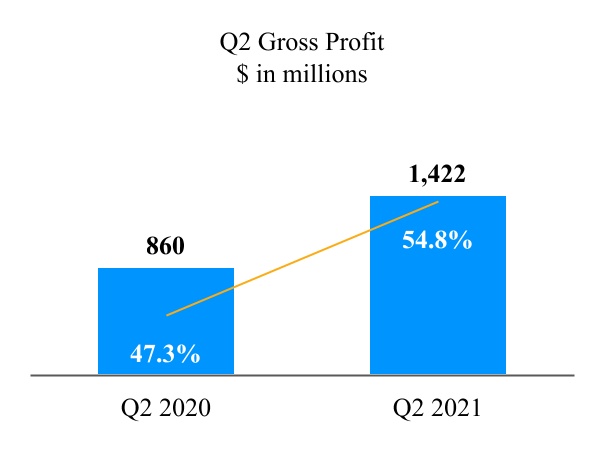
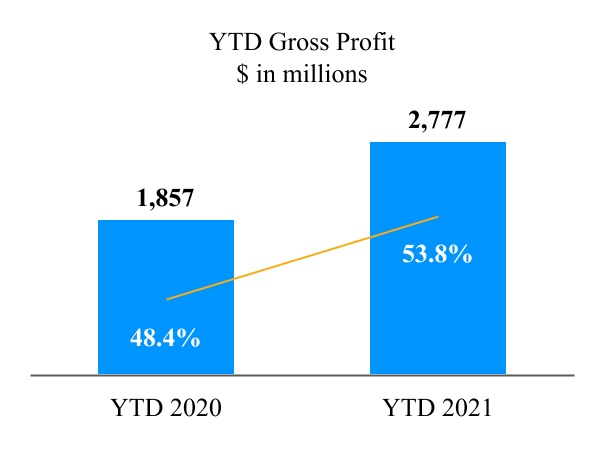
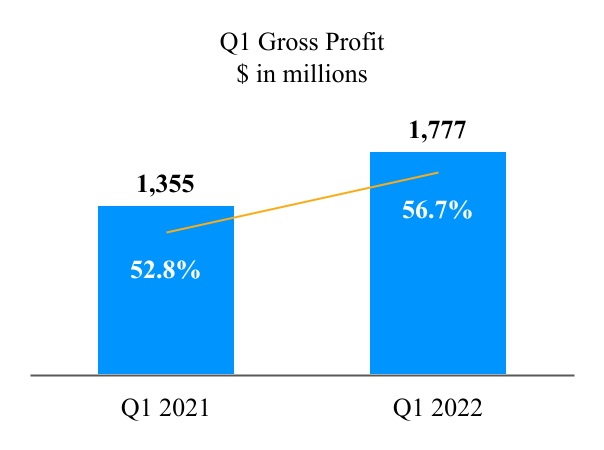
| Gross profit | Gross profit | 1,422 | | 860 | | | 2,777 | | 1,857 | | | Gross profit | 1,777 | | 1,355 | | |
| Operating income (loss) | Operating income (loss) | 573 | | | (145) | | | 1,065 | | | (77) | | | Operating income (loss) | 873 | | | 492 | | |
| Cash flow from operating activities | Cash flow from operating activities | 636 | | 414 | | 1,368 | | 926 | | Cash flow from operating activities | 856 | | 732 | |
| Total debt | Total debt | 9,591 | | 9,353 | | 9,591 | | 9,353 | | Total debt | 10,573 | | 7,611 | |
| Net debt | Net debt | 6,681 | | 6,087 | | | 6,681 | | 6,087 | | | Net debt | 7,890 | | 5,769 | | |
| Diluted weighted average number of shares outstanding | Diluted weighted average number of shares outstanding | 278,735 | | | 279,142 | | | 281,063 | | | 279,533 | | | Diluted weighted average number of shares outstanding | 265,109 | | | 283,263 | | |
| Diluted net income per share | Diluted net income per share | 1.42 | | (0.77) | | | 2.67 | | (0.84) | | | Diluted net income per share | 2.48 | | 1.25 | | |
| Dividends per common share | Dividends per common share | 0.5625 | | 0.375 | | | 1.1250 | | 0.750 | | | Dividends per common share | 0.8450 | | 0.5625 | | |
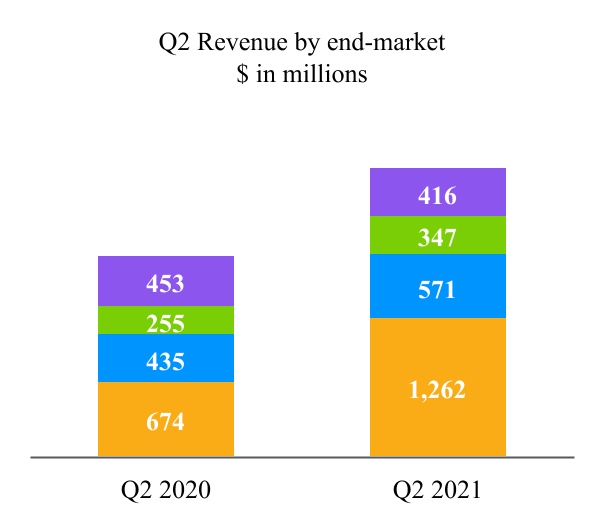
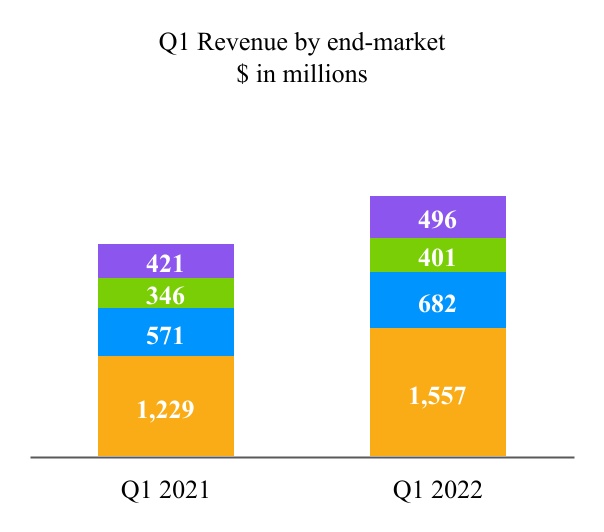
Q2 2021Q1 2022 compared to Q2 2020Q1 2021
Revenue for the three months ended July 4, 2021April 3, 2022 was $2,596$3,136 million compared to $1,817$2,567 million for the three months ended June 28, 2020,April 4, 2021, an increase of $779$569 million or an increase of 42.9%22% year-on-year. Revenue in the second quarter of 2021 represented a historical record for NXP. The strong revenue growth during the quarter was a result ofprimarily due to ongoing industry-wide growth after the initial shock and widespread market disruption caused by the emergence of the COVID-19 pandemicdemand for semiconductors in the year ago period, combined with company specific content growth in the automotivecompany’s focused end market as the automotive OEMs focus on secular shift due to electrification, advanced driver safety and assistance,markets, as well as driver connectivity.positive mix effects within the company’s focused end markets, and increased volumes of products shipped. Additionally, strong performancethe company continued to experience the effects of increased input costs from its suppliers which were passed along to end customers in the Industrial & IoT and Mobile markets helped to underpin the year-on-year performance.form of higher average selling prices.
Our gross profit percentage for the secondfirst quarter of 2022 increased from 52.8% in the first quarter of 2021 increased from 47.3% in the second quarter of 2020 to 54.8%56.7%, primarily from the continued significant acceleration of revenue in the secondfirst quarter of 20212022 when compared to the same period in 2020,2021, which led to improved loading and cost reductions, combined with sales price increases due to shortage and efficiencies,high demand, partly offset by a less favorable product mix and higher personnel-relatedinput costs.
We continue to generate strong operating cash flows, with $636$856 million in cash flows from operations for the secondfirst quarter of 2021.2022. We returned $1,358$701 million to our shareholders during the secondfirst quarter of 2021.2022. Our cash position at the end of the secondfirst quarter of 20212022 was $2,910$2,683 million. This includes the net proceeds of the $2 billion of senior unsecured debt issued by NXP on May 11, 2021. On May 27, 2021,January 31, 2022, the NXP Board of Directors approved a 50% increase in the quarterly cash dividend of $0.5625to $0.845 per common share for the secondfirst quarter of 2021.2022.
In summary, demand has come back more rapidly than we expected and our focus remains on looking after our customers to ensure that we meet their demand as best as possible.
YTD 2021 compared to YTD 2020
Revenue for the six months ended July 4, 2021 was $5,163 million compared to $3,838 million for the six months ended June 28, 2020, an increase of $1,325 million or an increase of 34.5%. The revenue level in the first six months of 2021 represented a historical record for NXP. The YTD 2021 growth compared to YTD 2020 was a result of industry-wide growth after the initial shock and widespread market disruption caused by the emergence of the COVID-19 pandemic, combined with company specific content growth in the automotive end market as the automotive OEMs focus on secular shift due electrification, advanced driver safety and assistance, as well as driver connectivity. Additionally, strong performance in the Industrial & IoT and Mobile markets helped to underpin the year-on-year performance. The rebound in NXP’s
revenue growth began to clearly emerge at the end of the calendar third quarter of 2020, and has continued to accelerate through the second quarter of 2021.
Our gross profit percentage for the six months ended July 4, 2021 increased from 48.4% for the six months ended June 28, 2020 to 53.8%, primarily from the significant acceleration of revenue in 2021 after the Covid crisis, and as such, improved loading and manufacturing efficiencies offset by higher personnel-related cost and a less favorable product mix.
Cash flow from operations for the first six months of 2021 was $1,368 million. Total shareholder return for the first six months of 2021 was $2,368 million. Our cash position remains solid, with the net proceeds of the $2 billion in newly issued debt adding to our cash and cash equivalents.
Results of operations
The following table presents operating income for each of the three month periods ended JulyApril 3, 2022 and April 4, 2021, and June 28, 2020, respectively:
| | ($ in millions, unless otherwise stated) | ($ in millions, unless otherwise stated) | Q2 2021 | | Q2 2020 | | YTD 2021 | | YTD 2020 | | ($ in millions, unless otherwise stated) | Q1 2022 | | Q1 2021 | |
| | Revenue | Revenue | 2,596 | | 1,817 | | | 5,163 | | 3,838 | | | Revenue | 3,136 | | 2,567 | | |
| % nominal growth | % nominal growth | 42.9 | | | (18.0) | | | 34.5 | | | (11.0) | | | % nominal growth | 22.2 | | | 27.0 | | |
| Gross profit | Gross profit | 1,422 | | 860 | | | 2,777 | | 1,857 | | | Gross profit | 1,777 | | 1,355 | | |
| Research and development | Research and development | (476) | | (402) | | | (937) | | (827) | | | Research and development | (518) | | (461) | | |
| Selling, general and administrative | Selling, general and administrative | (234) | | (222) | | | (456) | | (455) | | | Selling, general and administrative | (251) | | (222) | | |
| Amortization of acquisition-related intangible assets | Amortization of acquisition-related intangible assets | (139) | | (380) | | | (319) | | (761) | | | Amortization of acquisition-related intangible assets | (135) | | (180) | | |
| Other income (expense) | Other income (expense) | — | | (1) | | | — | | 109 | | | Other income (expense) | — | | — | | |
| Operating income (loss) | Operating income (loss) | 573 | | | (145) | | | 1,065 | | | (77) | | | Operating income (loss) | 873 | | | 492 | | |
Revenue
Q2 2021Q1 2022 compared to Q2 2020Q1 2021
Revenue for the three months ended July 4, 2021April 3, 2022 was $2,596$3,136 million compared to $1,817$2,567 million for the three months ended June 28, 2020,April 4, 2021, an increase of $779$569 million or an increase of 42.9% year-on-year. The revenue level22% year-on-year, with growth in the second quarter of 2021 represented a historical record for NXP. The strong revenue growth was a result of industry-wide growth after the initial shock and widespread market disruption caused by the emergenceall of the COVID-19 pandemic in the year ago period, combined with company specific content growth in the automotive end-market as the automotive OEMsCompany’s four focus on secular shift due electrification, advanced driver safety and assistance, as well as driver connectivity. Additionally, strong performance in the Industrial & IoT and Mobile end-market helped to underpin the year-on-year performance.end markets.
By end-market; revenue within Automotive was $1,262 million, an increase of 87.2% versus the year ago period. Within Industrial & IoT , revenue was $571 million, an increase of 31.3% versus the second quarter of 2020. In Mobile, revenue was $347 million, an increase of 36.1% versus the year ago period, and within Communications Infrastructure & Other, revenue was $416 million, a decrease of 8.2% versus the year ago period. When aggregating all end-markets together, and reviewing sales channel performance, business transacted through NXP's third party distribution partners, which primarily services the long-tail, mass market, was $1,518 million, an increase of 43.3%, and represented over half of the year-on-year revenue increase. Sales to NXPs direct OEM and EMS partners was $1,040 million an increase of 46.1% versus the second quarter of 2020. Revenue increased across all regions.
YTD 2021 compared to YTD 2020
Revenue for the six months ended July 4, 2021 was $5,163 million compared to $3,838 million for the six months ended June 28, 2020, an increase of $1,325 million or 34.5%. Revenue in the first six months of 2021 represented a historical record for NXP. The YTD 2021 growth compared to YTD 2020 was a result of industry-wide growth after the initial shock and widespread market disruption caused by the emergence of the COVID-19 pandemic, combined with company specific content growth in the automotive end-market as the automotive OEMs focus on secular shift due electrification, advanced driver safety and assistance, as well as driver connectivity. Additionally, strong performance in the Industrial & IoT and Mobile end-market helped to underpin the year-on-year performance. The rebound in NXP’s revenue growth began to clearly emerge at the end of the calendar third quarter of 2020, and has continued to accelerate through the second quarter of 2021. Revenue increased in all regions.
Revenue by end-market was as follows:
| | ($ in millions, unless otherwise stated) | ($ in millions, unless otherwise stated) | Q2 2021 | | Q2 2020 | | Change | | YTD 2021 | | YTD 2020 | | Change | | ($ in millions, unless otherwise stated) | Q1 2022 | | Q1 2021 | | Change | |
| Automotive | Automotive | 1,262 | | | 674 | | | 87.2 | % | | 2,491 | | | 1,668 | | | 49.3 | % | | Automotive | 1,557 | | | 1,229 | | | 26.7 | % | |
| Industrial & IoT | Industrial & IoT | 571 | | | 435 | | | 31.3 | % | | 1,142 | | | 811 | | | 40.8 | % | | Industrial & IoT | 682 | | | 571 | | | 19.4 | % | |
| Mobile | Mobile | 347 | | | 255 | | | 36.1 | % | | 693 | | | 502 | | | 38.0 | % | | Mobile | 401 | | | 346 | | | 15.9 | % | |
| Communication Infrastructure & Other | Communication Infrastructure & Other | 416 | | | 453 | | | (8.2) | % | | 837 | | | 857 | | | (2.3) | % | | Communication Infrastructure & Other | 496 | | | 421 | | | 17.8 | % | |
| Revenue | Revenue | 2,596 | | | 1,817 | | | 42.9 | % | | 5,163 | | | 3,838 | | | 34.5 | % | | Revenue | 3,136 | | | 2,567 | | | 22.2 | % | |
Revenue by sales channel was as follows:
| | ($ in millions, unless otherwise stated) | ($ in millions, unless otherwise stated) | Q2 2021 | | Q2 2020 | | Change | | YTD 2021 | | YTD 2020 | | Change | | ($ in millions, unless otherwise stated) | Q1 2022 | | Q1 2021 | | Change | |
| Distributors | Distributors | 1,518 | | | 1,059 | | | 43.3 | % | | 2,986 | | | 2,043 | | | 46.2 | % | | Distributors | 1,680 | | | 1,468 | | | 14.4 | % | |
| OEM/EMS | OEM/EMS | 1,040 | | | 712 | | | 46.1 | % | | 2,104 | | | 1,712 | | | 22.9 | % | | OEM/EMS | 1,412 | | | 1,064 | | | 32.7 | % | |
| Other | Other | 38 | | | 46 | | | (17.4) | % | | 73 | | | 83 | | | (12.0) | % | | Other | 44 | | | 35 | | | 25.7 | % | |
| Revenue | Revenue | 2,596 | | | 1,817 | | | 42.9 | % | | 5,163 | | | 3,838 | | | 34.5 | % | | Revenue | 3,136 | | | 2,567 | | | 22.2 | % | |
Revenue by geographic region, which is based on the customer’s shipped-to location was as follows:
| | ($ in millions, unless otherwise stated) | ($ in millions, unless otherwise stated) | Q2 2021 | | Q2 2020 | | Change | | YTD 2021 | | YTD 2020 | | Change | | ($ in millions, unless otherwise stated) | Q1 2022 | | Q1 2021 | | Change | |
| Greater China and Asia Pacific | Greater China and Asia Pacific | 1,503 | | | 1,165 | | | 29.0 | % | | 2,985 | | | 2,233 | | | 33.7 | % | | Greater China and Asia Pacific | 1,700 | | | 1,482 | | | 14.7 | % | |
| EMEA (Europe, the Middle East and Africa) | EMEA (Europe, the Middle East and Africa) | 461 | | | 265 | | | 74.0 | % | | 928 | | | 706 | | | 31.4 | % | | EMEA (Europe, the Middle East and Africa) | 638 | | | 467 | | | 36.6 | % | |
| Americas | Americas | 336 | | | 167 | | | 101.2 | % | | 657 | | | 421 | | | 56.1 | % | | Americas | 432 | | | 321 | | | 34.6 | % | |
| Japan | Japan | 188 | | | 146 | | | 28.8 | % | | 377 | | | 316 | | | 19.3 | % | | Japan | 218 | | | 189 | | | 15.3 | % | |
| South Korea | South Korea | 108 | | | 74 | | | 45.9 | % | | 216 | | | 162 | | | 33.3 | % | | South Korea | 148 | | | 108 | | | 37.0 | % | |
| Revenue | Revenue | 2,596 | | | 1,817 | | | 42.9 | % | | 5,163 | | | 3,838 | | | 34.5 | % | | Revenue | 3,136 | | | 2,567 | | | 22.2 | % | |
| | | | | | | | | | | | | | |
| n | Automotive | | n | Mobile |
| n | Industrial IoT | | n | Comm Infra & Other |
| | | | | | | | | | | | | | | | | |
| n | Distributors | | n | Other |
| n | OEM/EMS | | | |
Q2 2021 compared to Q2 2020
Revenue for the three months ended July 4, 2021 was $2,596 million compared to $1,817 million for the three months ended June 28, 2020, an increase of $779 million or an increase of 42.9% year-on-year. The increase within the second quarterin revenue is attributed to the continued strengtheningcombination of ongoing demand, across NXP’s Automotive, Industrial IoT, and Mobile, end-markets, with slight decreases inand the Communications Infrastructure & Other end-market.end-markets, as well as the effects of increased input costs from NXP suppliers which were passed along to our end customers in the form of higher average selling prices.
NXP’s revenueFrom an end market perspective, within the automotive end-market the year-on-year growth was driven by strong demand across the entire automotive product portfolio - both our distribution partners and OEM customers - in support of the secular shift of electrification, advanced driver safety and assistance, and driver connectivity systems. Growth within the Industrial & IoT market reflects the successful continuation of adoption of our complete secure, connected edge processing solutions which leverage our broad processor portfolio, complimented by connectivity, analog attach and security products. Growth within the Mobile end market was due to distributorsongoing adoption of our secure embed transaction solutions across all regions primarily in the Greater China including Asia Pacific regions, as well as early adoption of the company’s new secure ultra-wide-band (“UWB”) solutions.
When aggregating all end-markets together, and reviewing sales channel performance, business transacted through NXP's third party distribution partnerswas $1,680 million, an increase of 14.4%. Sales to NXP's direct OEM and EMS partnerscustomers was $1,518$1,412 million, and $1,040 million, respectively, representing increasesan increase of 43.3% and 46.1%32.7% versus the secondfirst quarter of 2020. Revenue2021.
From a geographic perspective, revenue increased across all regions.
Revenue from the Automotive end-market was $1,262$1,557 million, an increase of $588$328 million or 87.2%26.7% year-on-year. Within Automotive, OEMscustomers are focused on the key functional pillars of safety, electrification and improved driver comfort to accelerate competitive differentiation. These broad functional areas are fundamentally enabled by the secular adoption of new and increased levels of semiconductor content, which is layered on top of a strong base of existing electronic content in modern automobiles. As the market leader in multiple areas of the automotive electronics architecture, NXP is positioned to benefit from the long-term secular trends. Furthermore, the increase in Automotive revenue during the secondfirst quarter of 20212022 can be partially attributed to the ongoing rebound from the impacts of the COVID-19 pandemic, which began to significantly impact NXP in the second quarter of 2020.demand for our automotive products.
Revenue from the Industrial & IoT end-market was $571$682 million, an increase of $136$111 million or 31.3%19.4% year-on-year. The Industrial & IoT market is driven by the secular trend of multi-market OEMs seeking to enable secure, connected, high performance processing solutions at the edge of the network, whether it is in factory automation, smart building/smart home or the exploding plethora of connected IoT devices. The innovation in this market is being driven by thousands of relatively smaller customers, which NXP effectively services through its extended global distribution channel. Our portfolio of products consists of one of the broadest array of ARM-based processing solutions, including high performance industrial application processors, hybrid multi-core crossover processors, and low-power embedded microcontrollers. We complement our processor offerings with a variety of wide-band and narrow-band wireless connectivity products, as well as complimentary analog products including power management, analog high-speed interface devices and system security solutions. We further enable our customers with comprehensive development tools to enable embedded software and system design. Our solutions enable our customers to achieve fast time to market, flexibility to scale with processing and feature variations, allowing customers to design once, and reuse designs in multiple end-product instantiations. During the secondfirst quarter of 2021,2022, the year-on-year increase was driven by the continued growth in demand of NXP’s cross-overhigh performance industrial application processors, hybrid multi-core crossover processors, and industrial edge processors,low-power embedded microcontrollers, in addition to strong demand for the company’s industrial & IoT wireless connectivity, analog high-speed interface devices and system security solutions.
Revenue from the Mobile end-market was $347$401 million with an increase of $92$55 million or 36.1%15.9% year-on-year. The Mobile market opportunity for NXP is a result of consumer demand to securely virtualize physical payment, access and localization capabilities into a mobile wallet within modern smartphones. NXP is the market leader of embedded secure payment solutions – also known as mobile wallets – which are offered by leading smartphone OEMS. Complimenting this core mobile wallet position, NXP has introduced innovative secure auto and building access solutions leveraging ultra-wide-band (UWB) technology, embedded network provisioning and identification solutions, as well as offering a variety of embedded power and wireless charging solutions. The year-on-year increase was driven by the continued strong adoption of secure mobile wallet solutions and the increased demand for embeddedUWB Mobile, which was offset by declines in advanced power solutions. systems driven by load switch demand decline.Our mobile customers are primarily serviced through our global distribution channels.
Revenue in the Communication Infrastructure and Other end-market was $416$496 million, a declinean increase of $37$75 million or 8.2%17.8% year-on-year. The Communication Infrastructure and Other end-market is an amalgamation of three separate product portfolios, which service multiple markets, including cellular base stations; the network edge equipment, and the secure access, transit and government sponsored identification market. The year-on-year decline was due to a combination of reduced demand for multi-core processors within the mass market for network edge solutions, as well as lower shipments for smart RF antenna solutions which were impacted by the U.S. ban on sales to Huawei. These declines were partially offset by a positive rebound in RF Power products for the cellular basestation market, and improved demand for inventory tracking and secure access products.
YTD 2021 compared to YTD 2020
Revenue for the six months ended July 4, 2021 was $5,163 million compared to $3,838 million for the six months ended June 28, 2020, an increase of $1,325 million or 34.5%. The increase within the first half 2021 is attributed to the continued strengthening of demand, across the entire NXP product portfolio.
NXP’s revenue to distributors and direct OEM and EMS partners was $2,986 million and $2,104 million, respectively, representing increases of 46.2% and 22.9% versus six months ended of 2020. Revenue increased across all regions.
Revenue from the Automotive end-market was $2,491 million, an increase of $823 million or 49.3% from $1,668 million for the six months ended June 28, 2020. During the first quarter of 2020, automotive production and end consumer demand for new vehicles began to dramatically decline, reaching a cyclical trough in the second quarter of 2020. Beginning late in the third quarter of 2020, as the global automotive OEMS and Tier-one suppliers began to reopen factories, NXP continued to benefit from a faster than expected increase in demand for its automotive products. From a channel perspective, the year-on-year increase was primarily driven by demand from the Company’s automotive customers which are serviced via its OEM customers and its global distribution partners.
Revenue from the Industrial & IoT end-market was $1,142 million for the six months ended July 4, 2021, an increase of $331 million or 40.8%. During the first half of 2021, the year-to-date- increase comparable to the first half a year ago was driven by the continued strong adoption of NXP's newest cross-over and industrial edge processors, as well as adoption of complimentary analog and security solutions. The first half 2021 growth was driven by growth and demand of NXP’s products in our connectivity solutions driven by new product introductions in our direct channel. Additionally, in the beginning half of 2020, the greater China end-market experienced the societal lock-down impacts from the COVID-19 pandemic, resulting in a stronger YTD 2021 when compared to YTD 2020.
Revenue from the Mobile end-market, revenue was $693 million for the six months ended July 4, 2021, an increase of $191 million or 38.0%. The first half 2021 increase compared to the first half 2020 was driven primarily by the continued adoption of secure mobile wallet solutions, and to a lesser degree increased demand for embedded mobile power solutions. The year to date increase comparison was modestly offset by the divestment of the Voice and Audio Solutions, which closed early in the first quarter of 2020. Our mobile customers are primarily serviced through our global distribution channels.
Revenue in the Communication Infrastructure and Other end-market2022 was $837 million for the six months ended July 4, 2021, declined 20 million or 2.3% year-on-year. The first half 2021 decline compared to the first half 2020 was due todriven by a combination of lower shipments of smarthigh performance RF antenna solutions which were impacted by the U.S. ban on sales to Huawei, as well as reducedPower amplifier products for cellular base-station applications, broad based demand for secure identification, paymentaccess and accessidentification solutions, and lowermulti-core processors. Offsetting these positive growth trends were declines in demand for multi-core processors within the masscompany’s smart antennae products used in the Android mobile handset market for network edge solutions. These declines were partially offset by a positive rebound in RF Power products for the cellular basestation market, and improved demand for wireless access products.
Gross profit
Q2 2021Q1 2022 compared to Q2 2020Q1 2021
Gross profit for the three months ended July 4, 2021April 3, 2022 was $1,422$1,777 million, or 54.8%56.7% of revenue, compared to $860$1,355 million, or 47.3%52.8% of revenue for the three months ended June 28, 2020.April 4, 2021. The increase of $562$422 million in gross profit was driven by higher revenue as a result of accelerating demand and as such, improved factory loading, andincreased manufacturing efficiencies offset by a less favorable product mixvolumes, and higher personnel-related costs, including variable compensation cost.
YTD 2021 compared to YTD 2020
Gross profit for the six months ended July 4, 2021 was $2,777 million, or 53.8% of revenue, compared to $1,857 million, or 48.4% of revenue for the six months ended June 28, 2020. The increase of $920 million was primarily driven by the significant higher revenue in the first half of 2021 compared to the first half of 2020sales prices which is the result of accelerating demand and as such, improved loading and manufacturing efficiencieswere offset by higher personnel-related cost, including variable compensation cost, and a less favorable product mix.input costs.
Operating expenses
Q2 2021Q1 2022 compared to Q2 2020Q1 2021
Operating expenses for the three months ended July 4, 2021April 3, 2022 totaled $849$904 million, or 32.7%28.8% of revenue, compared to $1,004$863 million, or 55.3%33.6% of revenue, for the three months ended June 28, 2020.
YTD 2021 compared to YTD 2020
Operating expenses for the six months ended JulyApril 4, 2021 totaled $1,712 million, or 33.2% of revenue, compared to $2,043 million, or 53.2% of revenue, for the six months ended June 28, 2020.2021.
The following table below presents the composition of operating expenses by line item in the statement of operations:
| | ($ in millions, unless otherwise stated) | ($ in millions, unless otherwise stated) | Q2 2021 | | Q2 2020 | | YTD 2021 | | YTD 2020 | | ($ in millions, unless otherwise stated) | Q1 2022 | | Q1 2021 | |
| Research and development | Research and development | 476 | | | 402 | | | 937 | | | 827 | | | Research and development | 518 | | | 461 | | |
| Selling, general and administrative | Selling, general and administrative | 234 | | | 222 | | | 456 | | | 455 | | | Selling, general and administrative | 251 | | | 222 | | |
| Amortization of acquisition-related intangible assets | Amortization of acquisition-related intangible assets | 139 | | | 380 | | | 319 | | | 761 | | | Amortization of acquisition-related intangible assets | 135 | | | 180 | | |
| Total operating expenses | Total operating expenses | 849 | | | 1,004 | | | 1,712 | | | 2,043 | | | Total operating expenses | 904 | | | 863 | | |
| | | | | | | | | | | | | | | | | |
| n | R&D | n | SG&A | n | Amortization acquisition-related |
Q2 2021
Q1 2022 compared to Q2 2020Q1 2021
The decreaseincrease in operating expenses was a result of the following items:
Research and development (R&D) costs primarily consist of engineer salaries and wages (including share based compensation and other variable compensation), engineering related costs (including outside services, fixed-asset, IP and other licenses related costs), shared service center costs and other pre-production related expenses. R&D costs for the three months ended July 4, 2021April 3, 2022 increased by $74$57 million, or 18.4%12.4%, when compared to the three months ended June 28, 2020April 4, 2021 driven by:
+ higher personnel-related costs, including variable compensation costs; and
-+ lower restructuring costs.higher pre-production related expenses.
Selling, general and administrative (SG&A) costs primarily consist of personnel salaries and wages (including share based compensation and other variable compensation), communication and IT related costs, fixed-asset related costs and sales and marketing costs (including travel expenses). SG&A costs for the three months ended July 4, 2021April 3, 2022 increased by 12$29 million, or 5.4%13.1%, when compared to the three months ended June 28, 2020April 4, 2021 mainly due to:
+ higher personnel-related costs, including variable compensation costs;
+ higher legal expense; and
-+ lower share-based compensation expenses as a result of the CEO transition in 2020.higher professional services.
Amortization of acquisition-related intangible assets decreased by $241$45 million, or 63.4%25.0%, when compared to the three months ended June 28, 2020April 4, 2021 driven by:
- certain intangibles became fully amortized during 2020.
YTD 2021 compared to YTD 2020
The decrease in operating expenses was a result of the following items:
Research and development (R&D) costs primarily consist of engineer salaries and wages (including share based compensation and other variable compensation), engineering related costs (including outside services, fixed-asset, IP and other licenses related costs), shared service center costs and other pre-production related expenses. R&D costs for the six months ended July 4, 2021 increased by $110 million, or 13.3%, when compared to the six months ended June 28, 2020 driven by:
+ higher personnel-related costs, including variable compensation costs;
-higher subsidies, offsetting research and development costs; and
-lower restructuring costs.
Selling, general and administrative (SG&A) costs primarily consist of personnel salaries and wages (including share based compensation and other variable compensation), communication and IT related costs, fixed-asset related costs and sales and marketing costs (including travel expenses). SG&A costs for the six months ended July 4, 2021 remained flat with an increase of $1 million, or 0.2%, when compared to the six months ended June 28, 2020 mainly due to:
+ higher personnel-related costs, including variable compensation costs; and
-lower share-based compensation expenses as a result of the CEO transition in 2020.
Amortization of acquisition-related intangible assets decreased by $442 million, or 58.1%, when compared to the six months ended June 28, 2020 driven by:
- certain intangibles became fully amortized during 2020; and
+an impairment charge in Q1 2021 as a result of the discontinuation of an IPR&D project.
Other income (expense)
Income and expenses derived from manufacturing service arrangements (“MSA”) and transitional service arrangements (“TSA”) that are put into place when we divest a business or activity, are included in other income (expense). These arrangements are short-term in nature and are expected to decrease as the divested business or activity becomes more established.
The following table presents the split of other income (expense) for each of the three and six month periods ended July 4, 2021 and June 28, 2020:
| | | | | | | | | | | | | | | | | | | | | | | | | | | |
| ($ in millions) | Q2 2021 | | Q2 2020 | | YTD 2021 | | YTD 2020 | | | | |
| | | | | | | | | | | |
| | | | | | | | | | | |
| Result from MSA and TSA arrangements | (1) | | | (1) | | | (2) | | | (1) | | | | | |
| Other, net | 1 | | | — | | | 2 | | | 110 | | | | | |
| Total | — | | | (1) | | | — | | | 109 | | | | | |
Q2 2021 compared to Q2 2020
Other income (expense) reflects nil for the three month period ended July 4, 2021 and an expense of $1 million for the three month period ended June 28, 2020.
YTD 2021 compared to YTD 2020
Other income (expense) reflects nil for the six month period ended July 4, 2021, compared to an income of $109 million for the six month period ended June 28, 2020. Included in 2020 is $110 million relating to the net gain on the sale of the Voice and Audio Solutions (VAS) assets.
Financial income (expense)
The following table presents the details of financial income and expenses:
| | ($ in millions, unless otherwise stated) | ($ in millions, unless otherwise stated) | Q2 2021 | | Q2 2020 | | YTD 2021 | | YTD 2020 | | ($ in millions, unless otherwise stated) | Q1 2022 | | Q1 2021 | |
| | Interest income | Interest income | 1 | | | 4 | | | 2 | | | 8 | | | Interest income | 2 | | | 1 | | |
| Interest expense | Interest expense | (90) | | | (94) | | | (177) | | | (176) | | | Interest expense | (104) | | | (87) | | |
| Total interest expense, net | Total interest expense, net | (89) | | | (90) | | | (175) | | | (168) | | | Total interest expense, net | (102) | | | (86) | | |
| Foreign exchange rate results | Foreign exchange rate results | (1) | | | (5) | | | — | | | (1) | | | Foreign exchange rate results | — | | | 1 | | |
| | Miscellaneous financing costs/income and other, net | Miscellaneous financing costs/income and other, net | (10) | | | (1) | | | (12) | | | (5) | | | Miscellaneous financing costs/income and other, net | (3) | | | (2) | | |
| Total other financial income (expense) | Total other financial income (expense) | (11) | | | (6) | | | (12) | | | (6) | | | Total other financial income (expense) | (3) | | | (1) | | |
| Total | Total | (100) | | | (96) | | | (187) | | | (174) | | | Total | (105) | | | (87) | | |
Q2 2021Q1 2022 compared to Q2 2020Q1 2021
Financial income (expense) was an expense of $100$105 million in the secondfirst quarter of 20212022 compared to an expense of $96$87 million in the secondfirst quarter of 2020.2021. The change in financial income (expense) is primarily attributable to fair value adjustments in equity-accounted investees, resulting in a loss of $4 million when compared to a profit of $2 million in the second quarter of 2020, a decreasean increase in interest expense ($4 million) as a result of refinancing activities, a decrease in interest income ($3 million) as a result of declining interest rates and less unfavorable foreign exchange results ($4 million).
YTD 2021 compared to YTD 2020
Financial income (expense) was an expense of $187 million in the first six months of 2021 compared to an expense of $174 million in the first six months of 2020. The change in financial income (expense) is primarily attributable to a decrease in interest income ($6 million) as a result of declining interest rate, fair value adjustments in equity-accounted investees, resulting in a loss of $2 million when compared to a profit of $2 million in the second quarter of 2020 and non-service pension cost increased by $3 million.(re)financing activities.
Benefit (provision) for income taxes
Q2 2021Q1 2022 compared to Q2 2020Q1 2021
Our provision for income taxes was $65$114 million (13.7%(14.8% effective tax rate) for the secondfirst quarter of 20212022 compared to a benefit fromprovision for income taxes of ($33 million) ((13.7%)$40 million (9.9% effective tax rate) for the secondfirst quarter of 2020.2021. The increase in the income tax expense was due to higher income before income taxes offset by the net change in the valuation allowance between the two periods (as a result of the improved operational performance of the company) and changes in certain estimates.
YTD 2021 compared to YTD 2020
Our provision for income taxes for the first six months of 2021 was $105 million (12.0% effective tax rate) compared to a benefit from income taxes of ($31 million) ((12.4%) effective tax rate) for the first six months of 2020. The increase in the income tax expense was due to higher income before income taxes, offset by the net change in the valuation allowance between the two periods and by an increase in tax incentives (both as a result of the improved operational performance of the company).company which was partly offset by an increase in tax incentives also taking into account the effect of specific US tax law that became effective as from 2022. In addition to this, in the first three months of 2021 there was an income tax benefit due to changes in estimates of prior positions and due to a net change in the valuation allowance.
Net income (loss)
The following table presents the composition of net income for the periods reported:
| | ($ in millions, unless otherwise stated) | ($ in millions, unless otherwise stated) | Q2 2021 | | Q2 2020 | | YTD 2021 | | YTD 2020 | | ($ in millions, unless otherwise stated) | Q1 2022 | | Q1 2021 | |
| | Operating income (loss) | Operating income (loss) | 573 | | | (145) | | | 1,065 | | | (77) | | | Operating income (loss) | 873 | | | 492 | | |
| Financial income (expense) | Financial income (expense) | (100) | | | (96) | | | (187) | | | (174) | | | Financial income (expense) | (105) | | | (87) | | |
| Benefit (provision) for income taxes | Benefit (provision) for income taxes | (65) | | | 33 | | | (105) | | | 31 | | | Benefit (provision) for income taxes | (114) | | | (40) | | |
| Results relating to equity-accounted investees | Results relating to equity-accounted investees | (2) | | | (1) | | | (3) | | | (2) | | | Results relating to equity-accounted investees | 12 | | | (1) | | |
| Net income (loss) | Net income (loss) | 406 | | | (209) | | | 770 | | | (222) | | | Net income (loss) | 666 | | | 364 | | |
Liquidity and Capital Resources
We derive our liquidity and capital resources primarily from our cash flows from operations. We continue to generate strong positive operating cash flows. At the end of the secondfirst quarter of 2021,2022, our cash balance was $2,910$2,683 million, an increasea decrease of $635$147 million compared to December 31, 2020.2021. Taking into account the available amount of the Unsecured Revolving Credit Facility of $1,500 million, we had access to $4,410$4,183 million of liquidity as of July 4, 2021.April 3, 2022.
We currently use cash to fund operations, meet working capital requirements, for capital expenditures and for potential common stock repurchases, dividends and strategic investments. Based on past performance and current expectations, we believe that our current available sources of funds (including cash and cash equivalents, RCF Agreement, plus anticipated cash generated from operations) will be adequate to
finance our operations, working capital requirements, capital expenditures and potential dividends for at least the next twelve months. Our capital expenditures were $300$280 million in the first sixthree months of 2021,2022, compared to $218$150 million in the first sixthree months of 2020.2021. During the sixthree month period ended July 4, 2021,April 3, 2022, we repurchased $2,108$552 million, or 11.22.7 million shares of our common stock pursuant to our share buyback programs at a weighted average price of $188.43$207.94 per share.
Our total debt amounted to $9,591$10,573 million as of Q2 2021,Q1 2022, an increase of $1,982$1 million compared to December 31, 20202021 ($7,60910,572 million). On May 11, 2021, NXP issued 2.5% senior notes due in 2031 ($1 billion) and 3.25% senior notes due in 2041 ($1 billion). The net proceeds of the 2.5% Senior Notes due 2031 ("2031 Notes") will be used to finance certain eligible green projects. Pending the allocation of an amount equal to the net proceeds of the 2031 Notes to finance these eligible green projects, the net proceeds of the 2031 Notes, together with the net proceeds of the 3.25% Senior Notes due 2041, will temporarily be held as cash and other short-term securities or used for general corporate purposes, which may include capital expenditures, short-term debt repayment or equity buyback transactions.
At July 4, 2021,April 3, 2022, our cash balance was $2,910$2,683 million of which $206$185 million was held by SSMC, our consolidated joint venture company with TSMC. Under the terms of our joint venture agreement with TSMC, a portion of this cash can be distributed by way of a dividend to us, but 38.8% of the dividend will be paid to our joint venture partner. During the first six months of 2021, no dividend was declared by SSMC. In 2020, $90 million has been declared by SSMC, distributed subsequent to the end of the second quarter of 2020, with 38.8% being paid to our joint venture partner.
Cash flows
Our cash and cash equivalents during the first sixthree months of 20212022 decreased by $638$147 million (excluding the effect of changes in exchange rates on our cash position of $(3) million) as follows:
| | ($ in millions, unless otherwise stated) | ($ in millions, unless otherwise stated) | YTD 2021 | | YTD 2020 | ($ in millions, unless otherwise stated) | YTD 2022 | | YTD 2021 |
| | Net cash provided by (used for) operating activities | Net cash provided by (used for) operating activities | 1,368 | | | 926 | | Net cash provided by (used for) operating activities | 856 | | | 732 | |
| Net cash (used for) provided by investing activities | Net cash (used for) provided by investing activities | (370) | | | (150) | | Net cash (used for) provided by investing activities | (329) | | | (181) | |
| Net cash provided by (used for) financing activities | Net cash provided by (used for) financing activities | (360) | | | 1,454 | | Net cash provided by (used for) financing activities | (674) | | | (979) | |
| Increase (decrease) in cash and cash equivalents | Increase (decrease) in cash and cash equivalents | 638 | | | 2,230 | | Increase (decrease) in cash and cash equivalents | (147) | | | (428) | |
Cash Flow from Operating Activities
For the first sixthree months of 20212022 our operating activities provided $1,368$856 million in cash. This was primarily the result of net income of $770$666 million, adjustments to reconcile the net income of $851$352 million and changes in operating assets and liabilities of ($252)164) million. Adjustments to net income (loss) includes offsetting non-cash items, such as depreciation and amortization of $646$310 million, share-based compensation of $184$89 million and changes in deferred taxes of $12($33) million.
The change in operating assets and liabilities (working capital accounts) was attributable to the following:
The $230$61 million increase in receivables and other current assets for the three months ended April 3, 2022 was primarilymainly driven by the $2 million increaseincreases in income tax receivable and $227 million increase in accounts receivable due to the linearity of revenue between the two periods, customer mix, and the related timing of cash collections in the first six months of 2021 comparedvarious other assets with the same periodmost significant activities relating to a $20 million other receivables and $10 million in 2020.IT prepayments.
The $86$122 million increase in inventories for the three months ended April 3, 2022 was primarily related to increased production levels in order to attemptas we work to align inventory on hand with the current revenue forecasts.
The $124$266 million increase in accounts payable and other liabilities for the sixthree months ended July 4, 2021April 3, 2022 was primarily related to the increase in the accrual for variable compensation of $131$100 million as a result of improved operating results, $176$117 million in trade accounts payable as a result of increased demand,distributor rebates outstanding, and $10$55 million in interest payable; partially offset by the decreasepayable due to timing of $15 million in lease liabilities, $70 million related to incomeinterest payments, and social tax payables, a $26 million reduction in restructuring liabilities, and $82$1 million of other net movements including the non-cash adjustment for capital expenditures and purchased IP.IP; partially offset by the $7 million reduction in restructuring liabilities.
The $247 million increase in other non-current assets for the three months ended April 3, 2022 was primarily related to prepayments to secure long-term production supply with multiple vendors.
For the first sixthree months of 20202021 our operating activities provided $926$732 million in cash. This was primarily the result of net lossincome of ($222)$364 million, adjustments to reconcile the net lossincome of $1,034$444 million and changes in operating assets and liabilities of $113($78) million. Adjustments to net lossincome (loss) includes offsetting non-cash items, such as depreciation and amortization of $1,083$341 million, share-based compensation of $212$91 million, amortization of the discount (premium) on debt and debt issuance costs of $3$2 million, a gain on saleequity securities of assets of ($110)$(3) million, results relating to equity-accounted investees of $2$1 million and changes in deferred taxes of ($156)$12 million.
Cash Flow from Investing Activities
Net cash used for investing activities amounted to $370$329 million for the first sixthree months of 2022 and principally consisted of the cash outflows for capital expenditures of $280 million, $43 million for the purchase of identified intangible assets, $5 million for the purchase of equipment leased to others, $4 million for the net purchase of interests of businesses, partly offset by $2 million from the proceeds from return of equity investments and $1 million from the proceeds from disposals of property, plant and equipment.
Net cash used for investing activities amounted to $181 million for the first three months of 2021 and principally consisted of the cash outflows for capital expenditures of $300$150 million and $72$37 million for the purchase of identified intangible assets, partly offset by net proceeds of $2$6 million related to sales and purchases of investments.
Net cash used for investing activities amounted to $150 million for the first six months of 2020 and principally consisted of the cash outflows for purchases of interests in businesses (net of cash) of $21 million, capital expenditures of $218 million and $73 million for the purchase of identified intangible assets, partly offset by proceeds of $161 million from the sale of businesses (net of cash), related to the the sale of our Voice and Audio Solutions assets.
Cash Flow from Financing Activities
Net cash used for financing activities was $360$674 million for the first sixthree months of 20212022 compared to net cash provided by financing activities of $1,454$979 million for the first sixthree months of 2020,2021, detailed in the table below:
| | ($ in millions) | ($ in millions) | YTD 2021 | | YTD 2020 | ($ in millions) | YTD 2022 | | YTD 2021 |
| | Proceeds from the issuance of long-term debt | 2,000 | | | 2,000 | | |
| | Cash paid for debt issuance costs | Cash paid for debt issuance costs | (22) | | | (15) | | Cash paid for debt issuance costs | (1) | | | — | |
| | Dividends paid to common stockholders | Dividends paid to common stockholders | (260) | | | (210) | | Dividends paid to common stockholders | (149) | | | (105) | |
| Cash proceeds from exercise of stock options and savings from ESPP | Cash proceeds from exercise of stock options and savings from ESPP | 31 | | | 37 | | Cash proceeds from exercise of stock options and savings from ESPP | 28 | | | 31 | |
| Purchase of treasury shares | Purchase of treasury shares | (2,108) | | | (358) | | Purchase of treasury shares | (552) | | | (905) | |
| Other, net | (1) | | | — | | |
| |
Contractual ObligationsAdditional Capital Requirements
Expected working and other capital requirements are described in our Annual Report on Form 10-K for the fiscal year ended December 31, 2021 in Part II, Item 7, “Management’s Discussion and Analysis of Financial Condition and Results of Operations”. At April 3, 2022, other than for changes disclosed in the “Notes to Condensed Consolidated Financial Statements” and “Liquidity and Capital Resources” in this Quarterly Report, there have been no other material changes to our expected working and other capital requirements described in our Annual Report on Form 10-K for the fiscal year ended December 31, 2021.
Information Regarding Guarantors of NXP (unaudited)
Summarized Combined Financial Information for Guarantee of Securities of Subsidiaries
The following debt instruments are guaranteed, fully and unconditionally, jointly and severally, by NXP Semiconductors N.V. and issued or guaranteed by NXP USA, Inc., NXP B.V. and NXP LLC, (together, the “Subsidiary Obligors” and together with NXP Semiconductors N.V., the “Obligor Group”): 4.625% Senior Notes due 2023, 4.875% Senior Notes due 2024, 2.700% Senior Notes due 2025, 5.350% Senior Notes due 2026, 3.875% Senior Notes due 2026, 3.150% Senior Notes due 2027, 5.550% Senior Notes due 2028, 4.300% Senior Notes due 2029, 3.400% Senior Notes due 2030, 2.500% Senior Notes due 2031, 2.650% Senior Notes due 2032, 3.250% Senior Notes due 2041, 3.125% Senior Notes due 2042, and the 3.250% Senior Notes due 2051 (together the “ Notes”). Other than the Subsidiary Obligors, none of the Company’s subsidiaries (together the “Non-Guarantor Subsidiaries”) guarantee the Notes. The Company consolidates the Subsidiary Obligors in its consolidated financial statements and each of the Subsidiary Obligors are wholly owned subsidiaries of the Company.
All of the existing guarantees by the Company rank equally in right of payment with all of the existing and future senior indebtedness of the Obligor Group. There are no significant restrictions on the ability of the Obligor Group to obtain funds from respective subsidiaries by dividend or loan.
The following tables present summarized financial information of the Obligor Group on a combined basis, with intercompany balances and transactions between entities of the Obligor Group eliminated and investments and equity in the earnings of the Non-Guarantor Subsidiaries excluded. The Obligor Group’s amounts due from, amounts due to, and intercompany transactions with Non-Guarantor Subsidiaries have been disclosed below the table, when material.
Summarized Statements of Income
| | | | | |
| For the three months ended |
| ($ in millions) | April 3, 2022 |
| |
| Revenue | 1,813 | |
| Gross Profit | 921 | |
| Operating income | 366 | |
| Net income | 178 | |
Summarized Balance Sheets
| | | | | | | | | | | |
| As of |
| ($ in millions) | April 3, 2022 | | December 31, 2021 |
| | | |
| Current assets | 2,570 | | | 2,535 | |
| Non-current assets | 11,545 | | | 11,576 | |
| Total assets | 14,115 | | | 14,111 | |
| | | |
| Current liabilities | 812 | | | 637 | |
| Non-current liabilities | 10,856 | | | 10,792 | |
| Total liabilities | 11,668 | | | 11,429 | |
| | | |
| Obligor's Group equity | 2,447 | | | 2,682 | |
| Total liabilities and Obligor's Group equity | 14,115 | | | 14,111 | |
NXP Semiconductors N.V. is the head of a fiscal unity for the corporate income tax and VAT that contains the most significant Dutch wholly-owned group companies. The Company is therefore jointly and severally liable for the tax liabilities of the tax entity as a whole, and as such the income tax expense of the Dutch fiscal unity has been included in the Net income of the Obligor Group.
The Company maintains purchase commitments with certain suppliers, primarily for raw materials, semi-finished goods and manufacturing services and for some non-production items. As of July 4, 2021, the Company had purchase commitments of $3,769 million, which are due through 2044.
| | | | | | | | | | | | | | | | | | | | | | | | | | |
| ($ in millions) | | Total | 2021 | 2022 | 2023 | 2024 | 2025 | 2026 and thereafter |
| | | | | | | | |
| Long-term purchase obligations | | 3,769 | 519 | 918 | 609 | 481 | 480 | 762 |
Our long-term obligations increased substantially as we locked in long-term supply with our key manufacturing partners.
Off-balance Sheet Arrangements
At the endfinancial information of the second quarterObligor Group includes sales executed through a Non-Guarantor Subsidiary single-billing entity as a sales agent on behalf of 2021, we had no off-balance sheet arrangements other than commitments resultingan entity in the Obligor Group. The Obligor Group has sales to non-guarantors (for the three months ended April 3, 2022: $158 million). The Obligor Group has amounts due from normal business operations. None of these arrangements has or is likelyequity financing (April 3, 2022: $6,626 million; December 31, 2021: $5,167 million) and due to have a material effect on our financial condition, results of operations or cash flows.debt financing (April 3, 2022: $3,162 million; December 31, 2021: $3,053 million) with non-guarantor subsidiaries.
Item 3. Quantitative and Qualitative Disclosures About Market Risk
There have been no material changes to the Company’s market risk during the first sixthree months of 2021.2022. For a discussion of the Company’s exposure to market risk, refer to the Company’s market risk disclosures set forth in Part II, Item 7A, “Quantitative and Qualitative Disclosures About Market Risk” in our Annual Report on Form 10-K for the year ended December 31, 2020.2021.
Item 4. Controls and Procedures
Evaluation of Disclosure Controls and Procedures
Our management, with the participation of the Chief Executive Officer and Chief Financial Officer (Certifying Officers), evaluated the effectiveness of the Company's disclosure controls and procedures (as defined in Rules 13a-15(e) or 15d-15(e) promulgated under the Securities Exchange Act of 1934, as amended) on July 4, 2021.April 3, 2022. Based on that evaluation, the Certifying Officers concluded the Company's disclosure controls and procedures were not effective as of July 4,such date due to a material weakness in internal control over financial reporting that was disclosed in our Annual Report on Form 10-K for the fiscal year ended December 31, 2021.
Ongoing Remediation of Previously Identified Material Weakness
As previously described in Part II, Item 9A of our Annual Report on Form 10-K for the fiscal year ended December 31, 2021, we are implementing measures designed to ensure that control deficiencies contributing to the previously disclosed material weakness are remediated, such that these controls are designed, implemented, and operating effectively. In addition to those actions which are ongoing, we have been designing and continue to implement certain compensating controls, which allow for an additional layer of mitigation as we design, implement, and ensure effective operation of the measures addressing the material weakness.We expect these changes to materially improve our internal controls.
The weakness will not be considered remediated until the applicable controls operate for a sufficient period of time and management has concluded, through testing, that these controls are operating effectively. Management believes the remediation of this material weakness will be completed prior to the end of fiscal 2022. However, there is no assurance as to when such remediation will be completed.
Changes in Internal Control Over Financial Reporting
As noted above, the Company has been implementing measures to remediate the material weakness in our internal control over financial reporting. Other than the remediation efforts underway, there were no changes in the Company's internal control over financial reporting during the three month period ended July 4, 2021,April 3, 2022, which were identified in connection with management's evaluation required by paragraph (d) of Rules 13a-15 and 15d-15 under the Exchange Act that have materially affected, or are reasonably likely to materially affect, our internal control over financial reporting.
PART II — OTHER INFORMATION
Item 1. Legal Proceedings
Not applicable.
Item 1A. Risk Factors
ThereOur global business operations expose us to international business risks that could adversely affect our business
If any of the following international business risks were to materialize or become worse, they could have been noa material changesadverse effect on our business, financial condition and results of operations:
•negative economic developments in economies around the world and the instability of governments and international trade arrangements, such as the increase of barriers to international trade including the imposition of tariffs on imports by the United States and China, the withdrawal of the United Kingdom from the European Union, enhanced export controls on certain products and sanctions on certain industry sectors and parties in Russia and the sovereign debt crisis in certain European countries;
•social and political instability in a number of countries around the world, including continued hostilities and civil unrest in the Middle East and the Ukraine. The instability may have a negative effect on our business, financial condition and operations via our customers and global supply chain and volatility in energy prices and the financial markets;
•potential terrorist attacks;
•epidemics and pandemics, such as the coronavirus outbreak, which may adversely affect our workforce, as well as our suppliers and customers;
•adverse changes in government policies, especially those affecting trade and investment;
•volatility in foreign currency exchange rates, in particular with respect to the U.S. dollar, and transfer restrictions, in particular in China; and
•threats that our operations or property could be subject to nationalization and expropriation.
In addition, Russia’s recent invasion of Ukraine has led to sanctions, export controls and other penalties being levied by the United States, European Union and other countries against Russia, Belarus, the Crimea Region of Ukraine, the so-called Donetsk People’s Republic, and the so-called Luhansk People’s Republic. Additional potential sanctions and penalties have also been proposed and/or threatened. Russian military actions and the resulting sanctions could adversely affect the global economy and financial markets. Any Russian response could also disrupt commercial and financial transactions. Further, conflict between Ukraine and Russia could adversely impact the global supply chain, disrupt our operations, or negatively impact the demand for our products in our primary end markets. Any such disruption could result in an adverse impact to our financial results.
For a description of other applicable risk factors, previously disclosed inplease refer to Part I, Item 1A: “Risk Factors” of our Annual Report on Form 10-K for the year ended December 31, 2020.2021.
Item 2. Unregistered Sales of Equity Securities and Use of Proceeds
Purchases of Equity Securities by the Issuer and Affiliated Purchasers
In March 2021,January 2022, the board of directors of NXP (the “Board”) approved a new $2 billion 20212022 share repurchase program. The new $2 billion share repurchase authorization is in addition to the remaining amount for repurchase under the 2019$4 billion 2021 share repurchase program previously authorized by the Board in November 2019.Board. In addition, the Company purchases shares from participants in the Company’s equity programs who trade shares as trade for taxes. Under Dutch tax law, the repurchase of a company’s shares by an entity domiciled in the Netherlands results in a taxable event, unless a tax exemption applies. The tax on the repurchased shares is attributed to the shareholders, with NXP making the payment on the shareholders’ behalf. As such, the tax on the repurchased shares is accounted for within stockholders’ equity.
The following share repurchase activity occurred under these programs during the three months ended July 4, 2021:April 3, 2022:
| | | | | | | | | | | | | | | | | | | | | | | | | | | | | |
| Period |
Total Number
of Shares
Purchased | | Average Price
Paid per Share | | Number of Shares Purchased as Part of Publicly Announced Buy Back Programs | | Maximum Number of
Shares That May
Yet Be Purchased
Under the Buy Back Program | | Number of Shares Purchased as Trade for Tax (1) |
| April 5, 2021 – May 9, 2021 | 1,421,800 | | $190.84 | | 1,409,592 | | 11,688,793 | | 12,208 |
| May 10, 2021 – June 6, 2021 | 3,991,886 | | $199.03 | | 3,984,664 | | 7,526,721 | | 7,222 |
| May 7, 2021 – July 4, 2021 | 688,800 | | $200.23 | | 688,800 | | 6,819,312 | | — |
| Total | 6,102,486 | | | | 6,083,056 | | | | 19,430 |
| | | | | | | | | | | | | | | | | | | | | | | | | | | | | |
| Period |
Total Number
of Shares
Purchased | | Average Price
Paid per Share | | Number of Shares Purchased as Part of Publicly Announced Buy Back Programs | | Maximum Number of
Shares That May
Yet Be Purchased
Under the Buy Back Program | | Number of Shares Purchased as Trade for Tax (1) |
| January 1, 2022 – February 6, 2022 | 1,992,525 | | $212.48 | | 1,975,744 | | 16,833,194 | | 16,781 |
| February 7, 2022 – March 6, 2022 | 660,791 | | $194.24 | | 650,462 | | 18,184,668 | | 10,329 |
| March 7, 2022 – April 3, 2022 | (320) | | $199.90 | | — | | 17,628,198 | | (320) |
| Total | 2,652,996 | | | | 2,626,206 | | | | 26,790 |
(1) Reflects shares surrendered by participants to satisfy tax withholding obligations in connection with the Company's equity programs.
Item 5. Other Information
Not applicable.
Item 6. Exhibits
| | | | | | | | | | | | | | |
Exhibit Number | | Exhibit Description | | |
| 3.1 | | | | |
4.110.1*+ | | | |
4.2 | | | |
4.3 | | | |
4.4 | | | |
| 31.1* | | Rule 13a-14(a) / 15d-14(a) Certification of Chief Executive Officer | | |
| 31.2* | | Rule 13a-14(a) / 15d-14(a) Certification of Chief Financial Officer | | |
| 32.1* | | Section 1350 Certifications of Chief Executive Officer and Chief Financial Officer | | |
| 101 | | The following materials from the Company’s Quarterly Report on Form 10-Q for the quarter ended July 4, 2021,April 3, 2022, formatted in iXBRL (Inline eXtensible Business Reporting Language): (i) Condensed Consolidated Statements of Operations for the three and six months ended JulyApril 3, 2022 and April 4, 2021 and June 28, 2020;2021; (ii) Condensed Consolidated Statements of Comprehensive Income for the three and six months ended JulyApril 3, 2022 and April 4, 2021 and June 28, 2020;2021; (iii) Condensed Consolidated Balance Sheets as of July 4, 2021April 3, 2022 and December 31, 2020;2021; (iv) Condensed Consolidated Statements of Cash Flows for the sixthree months ended JulyApril 3, 2022 and April 4, 2021 and June 28, 2020;2021; (v) Condensed Consolidated Statements of Changes in Equity for the three and six months ended JulyApril 3, 2022 and April 4, 2021 and June 28, 2020;2021; and (vi) Notes to the Unaudited Condensed Consolidated Financial Statements. | | |
| 104 | | Cover Page Interactive Data File (formatted as Inline XBRL and contained in Exhibit 101). | | |
| | | | | |
| * | Filed or furnished herewith. |
| + | Indicates management contract or compensatory plan or arrangement. |
| |
SIGNATURE
Pursuant to the requirements of the Securities Exchange Act of 1934, the registrant has duly caused this report to be signed on its behalf by the undersigned, thereunto duly authorized.
Date: AugustMay 3, 20212022
| | | | | |
| NXP Semiconductors N.V. |
|
| /s/ P. KellyWilliam J. Betz |
Name: P. Kelly,William J. Betz, CFO |
|
Exhibit 31.1
CERTIFICATION
I, Kurt Sievers, certify that:
1.I have reviewed this quarterly report on Form 10-Q of NXP Semiconductors N.V.;
2.Based on my knowledge, this report does not contain any untrue statement of a material fact or omit to state a material fact necessary to make the statements made, in light of the circumstances under which such statements were made, not misleading with respect to the period covered by this report;
3.Based on my knowledge, the financial statements, and other financial information included in this report, fairly present in all material respects the financial condition, results of operations and cash flows of the Registrant as of, and for, the periods presented in this report;
4.The Registrant’s other certifying officer and I are responsible for establishing and maintaining disclosure controls and procedures (as defined in Exchange Act Rules 13a-15(e) and 15d-15(e)) and internal control over financial reporting (as defined in Exchange Act Rules 13a-15(f) and 15d-15(f)) for the Registrant and have:
a)Designed such disclosure controls and procedures, or caused such disclosure controls and procedures to be designed under our supervision, to ensure that material information relating to the Registrant, including its consolidated subsidiaries, is made known to us by others within those entities, particularly during the period in which this report is being prepared;
b)Designed such internal control over financial reporting, or caused such internal control over financial reporting to be designed under our supervision, to provide reasonable assurance regarding the reliability of financial reporting and the preparation of financial statements for external purposes in accordance with generally accepted accounting principles;
c)Evaluated the effectiveness of the Registrant’s disclosure controls and procedures and presented in this report our conclusions about the effectiveness of the disclosure controls and procedures, as of the end of the period covered by this report based on such evaluation; and
d)Disclosed in this report any change in the Registrant’s internal control over financial reporting that occurred during the Registrant’s most recent fiscal quarter (the Registrant’s fourth fiscal quarter in the case of an annual report) that has materially affected, or is reasonably likely to materially affect, the Registrant’s internal control over financial reporting; and
5.The Registrant’s other certifying officer and I have disclosed, based on our most recent evaluation of internal control over financial reporting, to the Registrant’s auditors and the audit committee of the Registrant’s board of directors (or persons performing the equivalent functions):
a)All significant deficiencies and material weaknesses in the design or operation of internal control over financial reporting which are reasonably likely to adversely affect the Registrant’s ability to record, process, summarize, and report financial information; and
b)Any fraud, whether or not material, that involves management or other employees who have a significant role in the Registrant’s internal control over financial reporting.
Date:August May 3, 20212022
| | | | | | | | |
| By: | | /s/ Kurt Sievers |
| | Kurt Sievers |
| | President & Chief Executive Officer |
Exhibit 31.2
CERTIFICATION
I, Peter Kelly,William J. Betz, certify that:
1.I have reviewed this quarterly report on Form 10-Q of NXP Semiconductors N.V.;
2.Based on my knowledge, this report does not contain any untrue statement of a material fact or omit to state a material fact necessary to make the statements made, in light of the circumstances under which such statements were made, not misleading with respect to the period covered by this report;
3.Based on my knowledge, the financial statements, and other financial information included in this report, fairly present in all material respects the financial condition, results of operations and cash flows of the Registrant as of, and for, the periods presented in this report;
4.The Registrant’s other certifying officer and I are responsible for establishing and maintaining disclosure controls and procedures (as defined in Exchange Act Rules 13a-15(e) and 15d-15(e)) and internal control over financial reporting (as defined in Exchange Act Rules 13a-15(f) and 15d-15(f)) for the Registrant and have:
a)Designed such disclosure controls and procedures, or caused such disclosure controls and procedures to be designed under our supervision, to ensure that material information relating to the Registrant, including its consolidated subsidiaries, is made known to us by others within those entities, particularly during the period in which this report is being prepared;
b)Designed such internal control over financial reporting, or caused such internal control over financial reporting to be designed under our supervision, to provide reasonable assurance regarding the reliability of financial reporting and the preparation of financial statements for external purposes in accordance with generally accepted accounting principles;
c)Evaluated the effectiveness of the Registrant’s disclosure controls and procedures and presented in this report our conclusions about the effectiveness of the disclosure controls and procedures, as of the end of the period covered by this report based on such evaluation; and
d)Disclosed in this report any change in the Registrant’s internal control over financial reporting that occurred during the Registrant’s most recent fiscal quarter (the Registrant’s fourth fiscal quarter in the case of an annual report) that has materially affected, or is reasonably likely to materially affect, the Registrant’s internal control over financial reporting; and
5.The Registrant’s other certifying officer and I have disclosed, based on our most recent evaluation of internal control over financial reporting, to the Registrant’s auditors and the audit committee of the Registrant’s board of directors (or persons performing the equivalent functions):
a)All significant deficiencies and material weaknesses in the design or operation of internal control over financial reporting which are reasonably likely to adversely affect the Registrant’s ability to record, process, summarize, and report financial information; and
b)Any fraud, whether or not material, that involves management or other employees who have a significant role in the Registrant’s internal control over financial reporting.
Date: AugustMay 3, 20212022
| | | | | | | | |
| By: | | /s/ Peter KellyWilliam J. Betz |
| | Peter KellyWilliam J. Betz |
| | Chief Financial Officer |
Exhibit 32.1
CERTIFICATIONS OF CHIEF EXECUTIVE OFFICER AND CHIEF FINANCIAL OFFICER
PURSUANT TO
18 U.S.C. SECTION 1350,
AS ADOPTED PURSUANT TO
SECTION 906 OF THE SARBANES-OXLEY ACT OF 2002
I, Kurt Sievers, certify, as of the date hereof, pursuant to 18 U.S.C. Section 1350, as adopted pursuant to Section 906 of the Sarbanes-Oxley Act of 2002, that the Quarterly Report of NXP Semiconductors N.V. on Form 10-Q for the period ended July 4, 2021April 3, 2022 fully complies with the requirements of Section 13(a) or 15(d) of the Securities Exchange Act of 1934 and that information contained in such Form 10-Q fairly presents in all material respects the financial condition and results of operations of NXP Semiconductors N.V. at the dates and for the periods indicated.
Date: AugustMay 3, 20212022
| | | | | | | | |
| By: | | /s/ Kurt Sievers |
| | Kurt Sievers |
| | President & Chief Executive Officer |
I, Peter Kelly,William J. Betz, certify, as of the date hereof, pursuant to 18 U.S.C. Section 1350, as adopted pursuant to Section 906 of the Sarbanes-Oxley Act of 2002, that the Quarterly Report of NXP Semiconductors N.V. on Form 10-Q for the period ended July 4, 2021April 3, 2022 fully complies with the requirements of Section 13(a) or 15(d) of the Securities Exchange Act of 1934 and that information contained in such Form 10-Q fairly presents in all material respects the financial condition and results of operations of NXP Semiconductors N.V. at the dates and for the periods indicated.
Date: AugustMay 3, 20212022
| | | | | | | | |
| By: | | /s/ Peter KellyWilliam J. Betz |
| | Peter KellyWilliam J. Betz |
| | Chief Financial Officer |