SECURITIES AND EXCHANGE COMMISSION
WASHINGTON, D.C. 20549
FORM 10-Q
☒ QUARTERLY REPORT PURSUANT TO SECTION 13 OR 15(d) OF THE SECURITIES EXCHANGE ACT OF 1934
FOR THE QUARTERLY PERIOD ENDED MarchMARCH 31, 20232024
OR
☐ TRANSITION REPORT PURSUANT TO SECTION 13 OR 15(d) OF THE SECURITIES EXCHANGE ACT OF 1934
FOR THE TRANSITION PERIOD FROM TO
Commission file number 001-33829
Keurig Dr Pepper Inc.
(Exact name of registrant as specified in its charter)
| | | | | | | | | | | |
| Delaware | 98-0517725 |
| (State or other jurisdiction of incorporation or organization) | (I.R.S. employer identification number) |
53 South Avenue
Burlington, Massachusetts
01803
(Address of principal executive offices)
(781) 418-7000
(Registrant's telephone number, including area code)
Securities registered pursuant to Section 12(b) of the Act:
| | | | | | | | | | | | | | |
| Title of each class | | Trading Symbol | | Name of each exchange on which registered |
| Common stock | | KDP | | The Nasdaq Stock Market LLC |
Indicate by check mark whether the registrant (1) has filed all reports required to be filed by Section 13 or 15(d) of the Securities Exchange Act of 1934 during the preceding 12 months (or for such shorter period that the registrant was required to file such reports), and (2) has been subject to such filing requirements for the past 90 days. Yes ☒ No ☐
Indicate by check mark whether the registrant has submitted electronically every Interactive Data File required to be submitted pursuant to Rule 405 of Regulation S-T (§232.405 of this chapter) during the preceding 12 months (or for such shorter period that the registrant was required to submit such files). Yes ☒ No ☐
Indicate by check mark whether the registrant is a large accelerated filer, an accelerated filer, a non-accelerated filer, a smaller reporting company, or an emerging growth company. See the definitions of "large accelerated filer", "accelerated filer", "smaller reporting company", and "emerging growth company" in Rule 12b-2 of the Securities Exchange Act of 1934.
Large Accelerated Filer ☒ Accelerated Filer ☐ Non-Accelerated Filer ☐ Smaller Reporting Company ☐ Emerging Growth Company ☐
If an emerging growth company, indicate by check mark if the registrant has elected not to use the extended transition period for complying with any new or revised financial accounting standards provided pursuant to Section 13(a) of the Exchange Act. ☐
Indicate by check mark whether the registrant is a shell company (as defined in Rule 12b-2 of the Securities Exchange Act of 1934). Yes ☐ No ☒
As of April 25, 2023,23, 2024, there were 1,403,776,4081,355,574,275 shares of the registrant's common stock, par value $0.01 per share, outstanding.
KEURIG DR PEPPER INC.
FORM 10-Q
TABLE OF CONTENTS
| | | | | | | | | | | | | | |
| | | | | Page |
| | |
| | | | |
| | | | |
| | | |
| | | | |
| | | | |
| | | |
| | | | |
| | | | |
| | | | |
| | | | |
| | | | |
| | | | |
| | | | |
| | | | |
| | | | |
| | | | |
| | | | |
| | | | |
| | | | |
| | | | |
| | | | |
| | | | |
| | | | |
| | | | |
| | | | |
| | | | |
| | Item 3. | Quantitative and Qualitative Disclosures About Market Risk | |
| | | | |
| | | | |
| | |
| | | | |
| | | |
| | | |
| | | | |
KEURIG DR PEPPER INC.
FORM 10-Q
MASTER GLOSSARY
| | | | | | | | |
| Term | | Definition |
| | |
| | |
| | |
2021 364-Day Credit Agreement | | The Company's $1,500 million credit agreement, which was entered into on March 26, 2021 and was terminated on February 23, 2022 |
2022 Revolving Credit Agreement | | KDP’s $4 billion revolving credit agreement, which was executed in February 2022 and replaced the 2021 364-Day Credit Agreement and the KDP Revolver |
| | |
| | |
| | |
| Annual Report | | Annual Report on Form 10-K for the year ended December 31, 20222023 |
| AOCI | | Accumulated other comprehensive income or loss |
| | |
| Athletic Brewing | | Athletic Brewing Holding Company, LLC, an equity method investment of KDP |
| Bedford | | Bedford Systems, LLC, an equity method investment of KDP and the maker of Drinkworks
| Board | | The Board of Directors of KDP |
| | |
BodyArmorbps | | Basis points |
| | |
| CEO | | BA Sports Nutrition,Chief Executive Officer |
| Chobani | | FHU US Holdings LLC, a formeran equity method investment of KDP |
bpsCircana | | basis points |
CSD | | Carbonated soft drinkCircana, Inc., a market information provider |
| DIO | | Days inventory outstanding |
| DPO | | Days of payables outstanding |
| DPS | | Dr Pepper Snapple Group, Inc. |
| DPS Merger | | The combination of the business operations of Keurig and DPS that was consummated onas of July 9, 2018 through a reverse merger transaction, whereby a wholly-owned special purpose merger subsidiary of DPS merged with and into the direct parent of Keurig |
| DSD | | Direct Store Delivery, KDP’s route-to-market whereby finished beverages are delivered directly to retailers |
| DSO | | Days sales outstanding |
| EPS | | Earnings per share |
| Exchange Act | | Securities Exchange Act of 1934, as amended |
| | |
| | |
| FX | | Foreign exchange |
| | |
| | |
IRiJAB | | Information Resources, Inc.JAB Holding Company S.a.r.l. and affiliates |
| | |
| KDP | | Keurig Dr Pepper Inc. |
| | |
KDP Revolver | | The Company's $2,400 million revolving credit facility, which was entered into on February 28, 2018 and terminated on February 23, 2022. |
| Keurig | | Keurig Green Mountain, Inc., a wholly-owned subsidiary of KDP, and the brand of our brewers |
| LIBOR | | London Interbank Offered Rate
| LRB | | Liquid refreshment beverages |
NCB | | Non-carbonated beverage |
| Notes | | Collectively, the Company's senior unsecured notes |
| Nutrabolt | | Woodbolt Holdings LLC, d/b/a Nutrabolt, an equity method investment of KDP |
| | |
| | |
| Revolving Credit Agreement | | KDP’s $4 billion revolving credit agreement, which was executed in February 2022 |
| RSU | | Restricted share unit |
| RTD | | Ready to drink |
| RVG | | Residual value guarantee
| Tractor | | Tractor Beverages, Inc., an equity method investment of KDP |
| SEC | | Securities and Exchange Commission |
| SG&A | | Selling, general and administrative |
| SOFR | | Secured Overnight Financing Rate |
| U.S. GAAP | | Accounting principles generally accepted in the U.S. |
| Veyron SPEs | | Special purpose entities with the same sponsor, Veyron Global
| VIE | | Variable interest entity
| Vita Coco | | The Vita Coco Company, Inc. |
| WD | | Warehouse Direct, KDP’s route-to-market whereby finished beverages are shipped to retailer warehouses, and then delivered by the retailer through its own delivery system to its stores |
PART I - FINANCIAL INFORMATION
ITEM 1.Financial Statements (Unaudited)
KEURIG DR PEPPER INC.
CONDENSED CONSOLIDATED STATEMENTS OF INCOME
(UNAUDITED)
| | | |
| | | | | First Quarter | | | First Quarter |
| (in millions, except per share data) | (in millions, except per share data) | | 2023 | | 2022 | (in millions, except per share data) | | | | | 2024 | | 2023 |
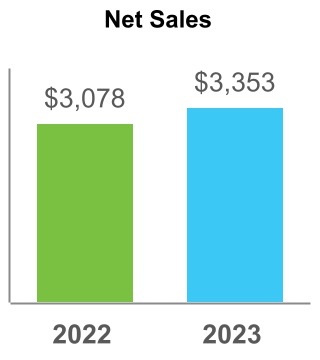
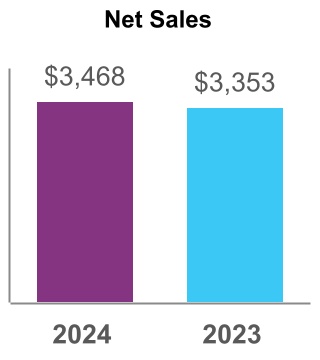
| Net sales | Net sales | | $ | 3,353 | | | $ | 3,078 | |
| Cost of sales | Cost of sales | | 1,609 | | | 1,428 | |
| Gross profit | Gross profit | | 1,744 | | | 1,650 | |
| Selling, general and administrative expenses | Selling, general and administrative expenses | | 1,165 | | | 1,018 | |
| | Gain on litigation settlement | | — | | | (299) | |
| | Other operating income, net | |
| | Other operating income, net | |
| | Other operating income, net | Other operating income, net | | (5) | | | (35) | |
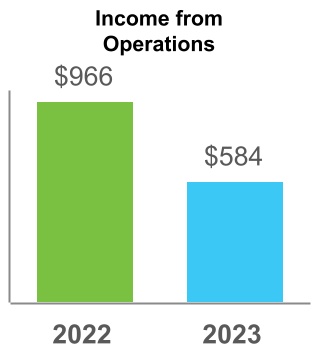
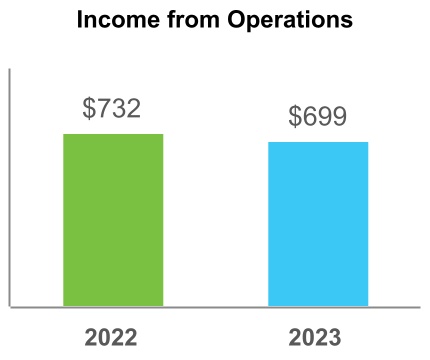
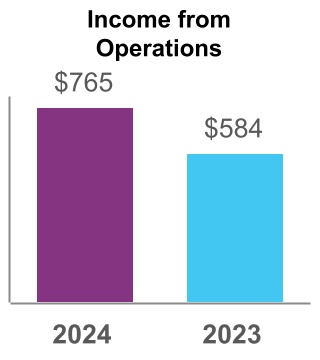
| Income from operations | Income from operations | | 584 | | | 966 | |
| Interest expense | | 23 | | | 188 | |
| Loss on early extinguishment of debt | | — | | | 48 | |
| Gain on sale of equity method investment | | — | | | (50) | |
| Impairment of investments and note receivable | | — | | | 6 | |
| Other (income) expense, net | | (20) | | | 9 | |
| Interest expense, net | |
| | Other income, net | |
| | Other income, net | |
| | Other income, net | |
| Income before provision for income taxes | Income before provision for income taxes | | 581 | | | 765 | |
| Provision for income taxes | Provision for income taxes | | 114 | | | 180 | |
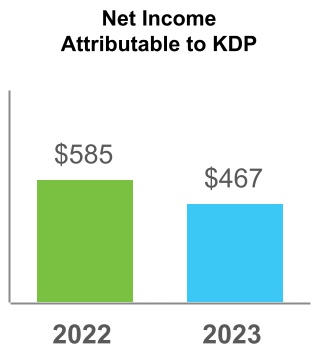
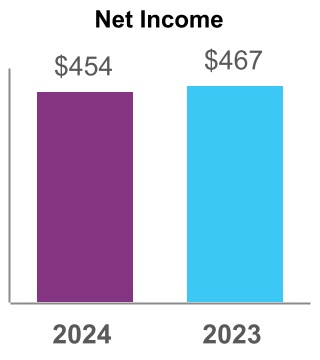
| Net income including non-controlling interest | | 467 | | | 585 | |
| Less: Net loss attributable to non-controlling interest | | — | | | — | |
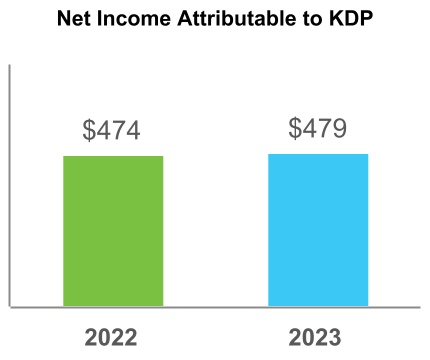
| Net income attributable to KDP | | $ | 467 | | | $ | 585 | |
| Net income | |
| | Earnings per common share: | |
| Earnings per common share: | |
| Earnings per common share: | Earnings per common share: | | | | | | | | | | | |
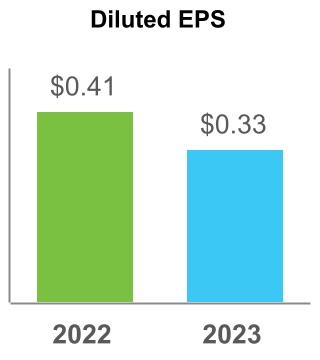
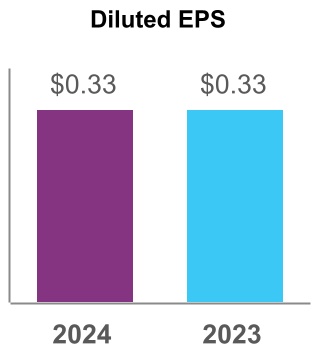
| Basic | Basic | | $ | 0.33 | | | $ | 0.41 | |
| Diluted | Diluted | | 0.33 | | | 0.41 | |
| Weighted average common shares outstanding: | Weighted average common shares outstanding: | | | | | Weighted average common shares outstanding: | | | | | | | |
| Basic | Basic | | 1,406.2 | | | 1,418.2 | |
| Diluted | Diluted | | 1,417.0 | | | 1,429.7 | |
The accompanying notes are an integral part of these unaudited condensed consolidated financial statements.
KEURIG DR PEPPER INC.
CONDENSED CONSOLIDATED STATEMENTS OF COMPREHENSIVE INCOME
(UNAUDITED)
| | | | | | | | | | | | | | | |
| | | | First Quarter |
| (in millions) | | | | | 2023 | | 2022 |
| Net income including non-controlling interest | | | | | $ | 467 | | | $ | 585 | |
| Other comprehensive (loss) income | | | | | | | |
| Foreign currency translation adjustments | | | | | 108 | | | 99 | |
| Net change in pension and post-retirement liability, net of tax of $0 and $0, respectively | | | | | — | | | — | |
| Net change in cash flow hedges, net of tax of $21 and $(48), respectively | | | | | (82) | | | 142 | |
| Total other comprehensive income | | | | | 26 | | | 241 | |
| Comprehensive income including non-controlling interest | | | | | 493 | | | 826 | |
| Less: Comprehensive income attributable to non-controlling interest | | | | | — | | | — | |
| Comprehensive income attributable to KDP | | | | | $ | 493 | | | $ | 826 | |
| | | | | | | | | | | | | | | |
| | | | First Quarter |
| (in millions) | | | | | 2024 | | 2023 |
| Net income | | | | | $ | 454 | | | $ | 467 | |
| Other comprehensive (loss) income: | | | | | | | |
| Foreign currency translation adjustments | | | | | (56) | | | 108 | |
| | | | | | | |
| Net change in cash flow hedges, net of tax of $0 and $21, respectively | | | | | (2) | | | (82) | |
| Total other comprehensive (loss) income | | | | | (58) | | | 26 | |
| Comprehensive income | | | | | $ | 396 | | | $ | 493 | |
The accompanying notes are an integral part of these unaudited condensed consolidated financial statements.
KEURIG DR PEPPER INC.
CONDENSED CONSOLIDATED BALANCE SHEETS
(UNAUDITED) | | | | | March 31, | | December 31, | | | March 31, | | December 31, |
| (in millions, except share and per share data) | (in millions, except share and per share data) | | 2023 | | 2022 | (in millions, except share and per share data) | | 2024 | | 2023 |
| Assets | Assets | Assets |
| Current assets: | Current assets: | | | | | Current assets: | | |
| Cash and cash equivalents | Cash and cash equivalents | | $ | 204 | | | $ | 535 | |
| | Trade accounts receivable, net | Trade accounts receivable, net | | 1,451 | | | 1,484 | |
| Inventories | Inventories | | 1,391 | | | 1,314 | |
| Prepaid expenses and other current assets | Prepaid expenses and other current assets | | 540 | | | 471 | |
| Total current assets | Total current assets | | 3,586 | | | 3,804 | |
| Property, plant and equipment, net | Property, plant and equipment, net | | 2,480 | | | 2,491 | |
| Investments in unconsolidated affiliates | Investments in unconsolidated affiliates | | 1,009 | | | 1,000 | |
| Goodwill | Goodwill | | 20,117 | | | 20,072 | |
| Other intangible assets, net | Other intangible assets, net | | 23,273 | | | 23,183 | |
| Other non-current assets | Other non-current assets | | 1,160 | | | 1,252 | |
| Deferred tax assets | Deferred tax assets | | 35 | | | 35 | |
| Total assets | Total assets | | $ | 51,660 | | | $ | 51,837 | |
| Liabilities and Stockholders' Equity | Liabilities and Stockholders' Equity | Liabilities and Stockholders' Equity |
| Current liabilities: | Current liabilities: | | | | | Current liabilities: | | |
| Accounts payable | Accounts payable | | $ | 4,947 | | | $ | 5,206 | |
| Accrued expenses | Accrued expenses | | 1,046 | | | 1,153 | |
| Structured payables | Structured payables | | 137 | | | 137 | |
| Short-term borrowings and current portion of long-term obligations | Short-term borrowings and current portion of long-term obligations | | 2,310 | | | 895 | |
| Other current liabilities | Other current liabilities | | 687 | | | 685 | |
| Total current liabilities | Total current liabilities | | 9,127 | | | 8,076 | |
| Long-term obligations | Long-term obligations | | 9,929 | | | 11,072 | |
| Deferred tax liabilities | Deferred tax liabilities | | 5,739 | | | 5,739 | |
| Other non-current liabilities | Other non-current liabilities | | 1,763 | | | 1,825 | |
| Total liabilities | Total liabilities | | 26,558 | | | 26,712 | |
| Commitments and contingencies | Commitments and contingencies | | Commitments and contingencies | | |
| Stockholders' equity: | Stockholders' equity: | | | | | Stockholders' equity: | | | | |
| Preferred stock, $0.01 par value, 15,000,000 shares authorized, no shares issued | Preferred stock, $0.01 par value, 15,000,000 shares authorized, no shares issued | | — | | | — | |
| Common stock, $0.01 par value, 2,000,000,000 shares authorized, 1,403,720,858 and 1,408,394,293 shares issued and outstanding as of March 31, 2023 and December 31, 2022, respectively | | 14 | | | 14 | |
| Common stock, $0.01 par value, 2,000,000,000 shares authorized, 1,355,571,438 and 1,390,446,043 shares issued and outstanding as of March 31, 2024 and December 31, 2023, respectively | |
| Additional paid-in capital | Additional paid-in capital | | 21,210 | | | 21,444 | |
| Retained earnings | Retained earnings | | 3,724 | | | 3,539 | |
| Accumulated other comprehensive income | Accumulated other comprehensive income | | 155 | | | 129 | |
| Total stockholders' equity | Total stockholders' equity | | 25,103 | | | 25,126 | |
| Non-controlling interest | | (1) | | | (1) | |
| Total equity | | 25,102 | | | 25,125 | |
| Total liabilities and equity | | $ | 51,660 | | | $ | 51,837 | |
| | Total liabilities and stockholders’ equity | |
| | Total liabilities and stockholders’ equity | |
| | Total liabilities and stockholders’ equity | |
The accompanying notes are an integral part of these unaudited condensed consolidated financial statements.
KEURIG DR PEPPER INC.
CONDENSED CONSOLIDATED STATEMENTS OF CASH FLOWS
(UNAUDITED) | | | | First Quarter | | First Quarter |
| (in millions) | (in millions) | 2023 | | 2022 | (in millions) | 2024 | | 2023 |
| Operating activities: | Operating activities: | | | | Operating activities: | | | |
| Net income attributable to KDP | $ | 467 | | | $ | 585 | |
| Net income | |
| Adjustments to reconcile net income to net cash provided by operating activities: | Adjustments to reconcile net income to net cash provided by operating activities: | | | | Adjustments to reconcile net income to net cash provided by operating activities: | | | |
| Depreciation expense | Depreciation expense | 107 | | | 106 | |
| Amortization of intangibles | Amortization of intangibles | 34 | | | 34 | |
| Other amortization expense | Other amortization expense | 45 | | | 42 | |
| Provision for sales returns | Provision for sales returns | 10 | | | 12 | |
| Deferred income taxes | Deferred income taxes | — | | | 8 | |
| Employee stock-based compensation expense | Employee stock-based compensation expense | 29 | | | (15) | |
| Loss on early extinguishment of debt | — | | | 48 | |
| | Gain on sale of equity method investment | — | | | (50) | |
| Gain on disposal of property, plant and equipment | (5) | | | (38) | |
| Unrealized gain on foreign currency | (2) | | | (11) | |
| Unrealized gain on derivatives | (95) | | | — | |
| | Equity in (earnings) loss of unconsolidated affiliates | (9) | | | 3 | |
| | Impairment on investments and note receivable of unconsolidated affiliate | — | | | 6 | |
| Loss (gain) on disposal of property, plant and equipment | |
| | Loss (gain) on disposal of property, plant and equipment | |
| | Loss (gain) on disposal of property, plant and equipment | |
| Unrealized loss (gain) on foreign currency | |
| Unrealized loss (gain) on derivatives | |
| | Equity in earnings of unconsolidated affiliates | |
| Equity in earnings of unconsolidated affiliates | |
| Equity in earnings of unconsolidated affiliates | |
| Earned equity | |
| | Other, net | |
| | Other, net | |
| | Other, net | Other, net | (4) | | | 13 | |
| Changes in assets and liabilities: | Changes in assets and liabilities: | | | | Changes in assets and liabilities: | | | |
| Trade accounts receivable | Trade accounts receivable | 28 | | | (73) | |
| Inventories | Inventories | (74) | | | (147) | |
| Income taxes receivable and payables, net | Income taxes receivable and payables, net | 60 | | | 135 | |
| Other current and non-current assets | Other current and non-current assets | (151) | | | (284) | |
| Accounts payable and accrued expenses | Accounts payable and accrued expenses | (391) | | | 151 | |
| Other current and non-current liabilities | Other current and non-current liabilities | 22 | | | 138 | |
| Net change in operating assets and liabilities | Net change in operating assets and liabilities | (506) | | | (80) | |
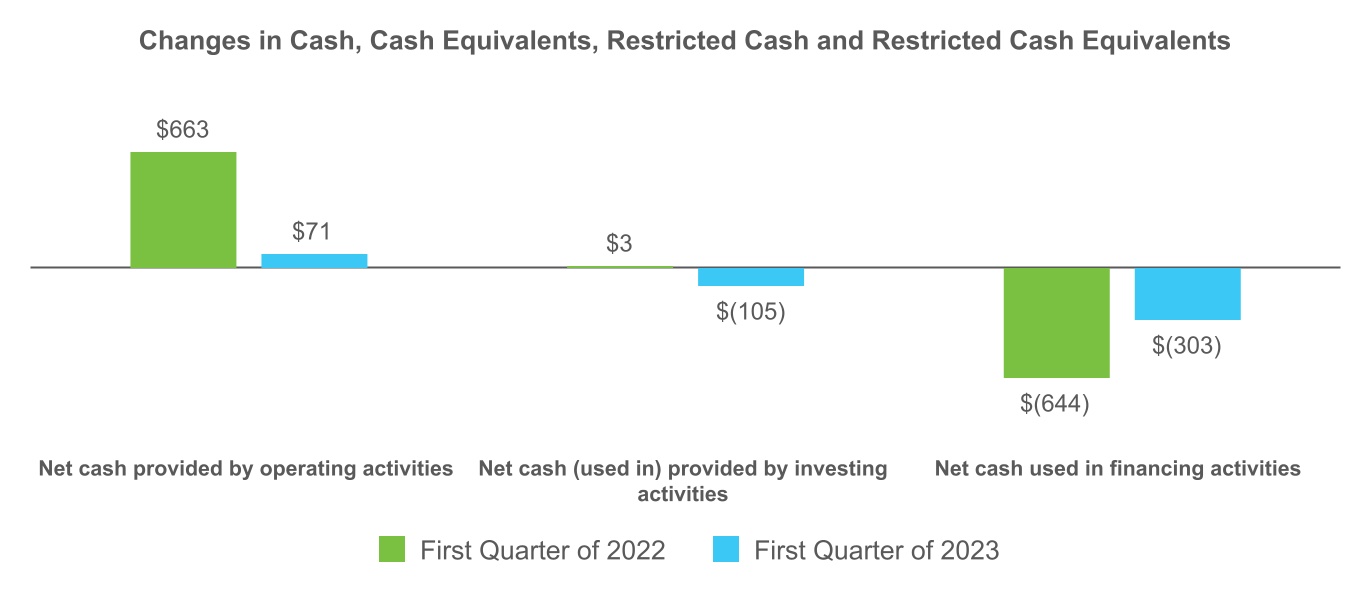
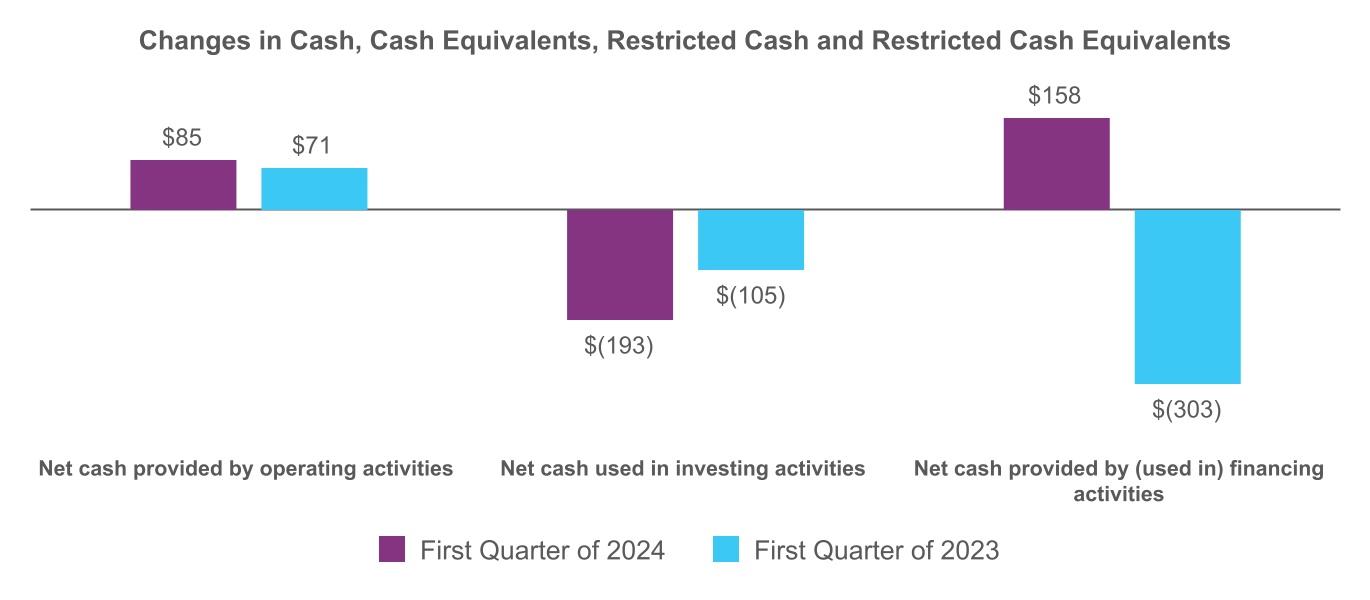
| Net cash provided by operating activities | Net cash provided by operating activities | 71 | | | 663 | |
| Investing activities: | Investing activities: | | | | Investing activities: | | | |
| | Proceeds from sale of investment in unconsolidated affiliates | — | | | 50 | |
| | Purchases of property, plant and equipment | |
| | Purchases of property, plant and equipment | |
| | Purchases of property, plant and equipment | Purchases of property, plant and equipment | (62) | | | (109) | |
| Proceeds from sales of property, plant and equipment | Proceeds from sales of property, plant and equipment | 7 | | | 78 | |
| Purchases of intangibles | Purchases of intangibles | (51) | | | (10) | |
| Issuance of related party note receivable | — | | | (6) | |
| | Investments in unconsolidated affiliates | |
| Investments in unconsolidated affiliates | |
| Investments in unconsolidated affiliates | Investments in unconsolidated affiliates | — | | | (3) | |
| | Other, net | Other, net | 1 | | | 3 | |
| Net cash (used in) provided by investing activities | $ | (105) | | | $ | 3 | |
| Other, net | |
| Other, net | |
| Net cash used in investing activities | |
|
The accompanying notes are an integral part of these unaudited condensed consolidated financial statements.
KEURIG DR PEPPER INC.
CONDENSED CONSOLIDATED STATEMENTS OF CASH FLOWS
(UNAUDITED, CONTINUED)
| | | | First Quarter | | First Quarter |
| (in millions) | (in millions) | 2023 | | 2022 | (in millions) | 2024 | | 2023 |
| Financing activities: | Financing activities: | | | | Financing activities: | | | |
| Proceeds from issuance of Notes | |
| Repayments of Notes | |
| Net (repayment) issuance of commercial paper | |
| | Repayments of Notes | $ | — | | | $ | (201) | |
| Proceeds from issuance of commercial paper | 3,523 | | | — | |
| Repayments of commercial paper | (3,258) | | | (149) | |
| | Proceeds from structured payables | |
| | Proceeds from structured payables | |
| | Proceeds from structured payables | Proceeds from structured payables | 34 | | | 38 | |
| Repayments of structured payables | Repayments of structured payables | (32) | | | (37) | |
| Cash dividends paid | Cash dividends paid | (281) | | | (265) | |
| Repurchases of common stock | Repurchases of common stock | (231) | | | — | |
| | Tax withholdings related to net share settlements | Tax withholdings related to net share settlements | (31) | | | (5) | |
| Tax withholdings related to net share settlements | |
| Tax withholdings related to net share settlements | |
| Payments on finance leases | Payments on finance leases | (24) | | | (20) | |
| Other, net | Other, net | (3) | | | (5) | |
| Net cash used in financing activities | (303) | | | (644) | |
| Cash, cash equivalents, and restricted cash and cash equivalents: | | | |
| Net cash provided by (used in) financing activities | |
| Cash and cash equivalents: | | Cash and cash equivalents: | | | |
| Net change from operating, investing and financing activities | Net change from operating, investing and financing activities | (337) | | | 22 | |
| Effect of exchange rate changes | Effect of exchange rate changes | 6 | | | 4 | |
| Beginning balance | Beginning balance | 535 | | | 568 | |
| Ending balance | Ending balance | $ | 204 | | | $ | 594 | |
| | Supplemental cash flow disclosures of non-cash investing activities: | Supplemental cash flow disclosures of non-cash investing activities: | |
| Supplemental cash flow disclosures of non-cash investing activities: | |
| Supplemental cash flow disclosures of non-cash investing activities: | |
| Capital expenditures included in accounts payable and accrued expenses | Capital expenditures included in accounts payable and accrued expenses | $ | 222 | | | $ | 139 | |
| Capital expenditures included in accounts payable and accrued expenses | |
| Capital expenditures included in accounts payable and accrued expenses | |
| Earned equity | |
| Transaction costs included in accounts payable and accrued expenses | Transaction costs included in accounts payable and accrued expenses | 8 | | | — | |
| | Supplemental cash flow disclosures of non-cash financing activities: | Supplemental cash flow disclosures of non-cash financing activities: | |
| | Supplemental cash flow disclosures of non-cash financing activities: | |
| | Supplemental cash flow disclosures of non-cash financing activities: | |
| Dividends declared but not yet paid | Dividends declared but not yet paid | 282 | | | 266 | |
| | Dividends declared but not yet paid | |
| Dividends declared but not yet paid | |
| Accrued excise tax on net share repurchases | |
| Supplemental cash flow disclosures: | Supplemental cash flow disclosures: | |
| Cash paid for interest | Cash paid for interest | 39 | | | 27 | |
| Cash paid for interest | |
| Cash paid for interest | |
| Cash paid for income taxes | Cash paid for income taxes | 49 | | | 37 | |
The accompanying notes are an integral part of these unaudited condensed consolidated financial statements.
KEURIG DR PEPPER INC.
CONDENSED CONSOLIDATED STATEMENTS OF CHANGES IN STOCKHOLDERS' EQUITY
(UNAUDITED)
| | | | Common Stock Issued | | Additional
Paid-In Capital | | Retained Earnings | | Accumulated Other Comprehensive Income | | Total Stockholders' Equity | | Non-controlling Interest | | Total
Equity | | Common Stock Issued | | Additional
Paid-In Capital | | Retained Earnings | | Accumulated Other Comprehensive Income | | Total Stockholders' Equity |
| (in millions, except per share data) | (in millions, except per share data) | Shares | | Amount | |
| Balance as of January 1, 2023 | 1,408.4 | | | $ | 14 | | | $ | 21,444 | | | $ | 3,539 | | | $ | 129 | | | $ | 25,126 | | | $ | (1) | | | $ | 25,125 | |
| Balance as of January 1, 2024 | |
| Balance as of January 1, 2024 | |
| Balance as of January 1, 2024 | |
| Net income | Net income | — | | | — | | | — | | | 467 | | | — | | | 467 | | | — | | | 467 | |
| Other comprehensive income | Other comprehensive income | — | | | — | | | — | | | — | | | 26 | | | 26 | | | — | | | 26 | |
| Dividends declared, $0.20 per share | — | | | — | | | — | | | (282) | | | — | | | (282) | | | — | | | (282) | |
| Dividends declared, $0.215 per share | |
| | Repurchases of common stock | (6.6) | | | — | | | (232) | | | — | | | — | | | (232) | | | — | | | (232) | |
| Repurchases of common stock, inclusive of excise tax obligation | |
| Repurchases of common stock, inclusive of excise tax obligation | |
| Repurchases of common stock, inclusive of excise tax obligation | |
| Shares issued under employee stock-based compensation plans and other | Shares issued under employee stock-based compensation plans and other | 1.9 | | | — | | | — | | | — | | | — | | | — | | | — | | | — | |
| Tax withholdings related to net share settlements | Tax withholdings related to net share settlements | — | | | — | | | (31) | | | — | | | — | | | (31) | | | — | | | (31) | |
| Stock-based compensation and stock options exercised | Stock-based compensation and stock options exercised | — | | | — | | | 29 | | | — | | | — | | | 29 | | | — | | | 29 | |
| Balance as of March 31, 2023 | 1,403.7 | | | $ | 14 | | | $ | 21,210 | | | $ | 3,724 | | | $ | 155 | | | $ | 25,103 | | | $ | (1) | | | $ | 25,102 | |
| Balance as of March 31, 2024 | |
| |
| | | | Common Stock Issued | | Additional
Paid-In Capital | | Retained Earnings | | Accumulated Other Comprehensive Income (Loss) | | Total Stockholders' Equity | | Non-controlling Interest | | Total Equity | | Common Stock Issued | | Additional
Paid-In Capital | | Retained Earnings | | Accumulated Other Comprehensive Income (Loss) | | Total Stockholders' Equity | | Non-controlling Interest | | Total Equity |
| (in millions, except per share data) | (in millions, except per share data) | Shares | | Amount | |
| Balance as of January 1, 2022 | 1,418.1 | | | $ | 14 | | | $ | 21,785 | | | $ | 3,199 | | | $ | (26) | | | $ | 24,972 | | | $ | — | | | $ | 24,972 | |
| Balance as of January 1, 2023 | |
| Balance as of January 1, 2023 | |
| Balance as of January 1, 2023 | |
| | Net income | Net income | — | | | — | | | — | | | 585 | | | — | | | 585 | | | — | | | 585 | |
| Other comprehensive loss | — | | | — | | | — | | | — | | | 241 | | | 241 | | | 241 | |
| Dividends declared, $0.1875 per share | — | | | — | | | — | | | (266) | | | — | | | (266) | | | — | | | (266) | |
| Net income | |
| Net income | |
| Other comprehensive income | |
| Dividends declared, $0.20 per share | |
| | Repurchases of common stock, inclusive of excise tax obligation | |
| Repurchases of common stock, inclusive of excise tax obligation | |
| Repurchases of common stock, inclusive of excise tax obligation | |
| Shares issued under employee stock-based compensation plans and other | Shares issued under employee stock-based compensation plans and other | 0.4 | | | — | | | — | | | — | | | — | | | — | | | — | | | — | |
| Tax withholdings related to net share settlements | Tax withholdings related to net share settlements | — | | | — | | | (5) | | | — | | | — | | | (5) | | | — | | | (5) | |
| Stock-based compensation and stock options exercised | Stock-based compensation and stock options exercised | — | | | — | | | (16) | | | — | | | — | | | (16) | | | — | | | (16) | |
| Balance as of March 31, 2022 | 1,418.5 | | | $ | 14 | | | $ | 21,764 | | | $ | 3,518 | | | $ | 215 | | | $ | 25,511 | | | $ | — | | | $ | 25,511 | |
| Balance as of March 31, 2023 | |
| |
The accompanying notes are an integral part of these unaudited condensed consolidated financial statements.
KEURIG DR PEPPER INC.
NOTES TO CONDENSED CONSOLIDATED FINANCIAL STATEMENTS
(UNAUDITED)
1. General
ORGANIZATION
References in this Quarterly Report on Form 10-Q to "KDP", "the Company", "we", or "the Company""our", refer to Keurig Dr Pepper Inc. and all entitieswholly-owned subsidiaries included in the unaudited condensed consolidated financial statements. Definitions of terms used in this Quarterly Report on Form 10-Q are included within the Master Glossary.
This Quarterly Report on Form 10-Q refers to some of KDP'sour owned or licensed trademarks, trade names and service marks, which are referred to as the Company'sour brands. All of the product names included herein are either KDP registered trademarks or those of the Company'sour licensors.
BASIS OF PRESENTATION
The accompanying unaudited condensed consolidated financial statements have been prepared in accordance with U.S. GAAP for interim financial information and in accordance with the instructions to Form 10-Q and Article 10 of Regulation S-X. Accordingly, they do not include all of the information and footnotes required by U.S. GAAP for complete consolidated financial statements. In the opinion of management, all adjustments, consisting principally of normal recurring adjustments, considered necessary for a fair presentation have been included. These unaudited condensed consolidated financial statements should be read in conjunction with KDP'sour consolidated financial statements and accompanying notes included in the Company'sour Annual Report.
References to the "first quarter" indicate the Company's quarterly periods ended March 31, 20232024 and 2022.2023.
USE OF ESTIMATES
The process of preparing KDP'sour unaudited condensed consolidated financial statements in conformity with U.S. GAAP requires the use of estimates and judgments that affect reported amounts. These estimates and judgments are based on historical experience, future expectations and other factors and assumptions the Company believeswe believe to be reasonable under the circumstances. These estimates and judgments are reviewed on an ongoing basis and are revised when necessary. Changes in estimates are recorded in the period of change. Actual amounts may differ from these estimates.
REPORTABLE SEGMENTSRECLASSIFICATIONS
AsWe reclassified amounts in the Financing Activities section of January 1,the unaudited condensed consolidated Statement of Cash Flows for the first quarter of 2023 the Company revised its segment structurein order to align with changes in how the Company’s Chief Operating Decision Maker manages the business, assesses performance and allocates resources. This change had no impact on the Company’s consolidated results of operations or financial position. Prior period segment results have been recastconform to reflect the Company’s new reportable segments. Refer to Note 6 for additional information on the Company’s reportable segments and Note 7current year presentation, as maturities for the Company’s disaggregated revenue portfolio for each reportable segment. The changecommercial paper program in segment structure also resulted in a change to the Company’s reporting units. Refer to Note 3 for additional information on the Company’s reporting units.both periods are 90 days or less.
| | | | | | | | | | | | | | |
| (in millions) | | Prior Presentation | | First Quarter of 2023 |
| Net (repayment) issuance of commercial paper | | Proceeds from issuance of commercial paper | | $ | 3,523 | |
| Net (repayment) issuance of commercial paper | | Repayments of commercial paper | | (3,258) | |
RECENTLY ADOPTED ACCOUNTING STANDARDS2. Long-term Obligations and Borrowing Arrangements
As of January 1, 2023, the Company adopted ASU 2022-04, Liabilities — Supplier Finance Programs (Subtopic 405-50): Disclosure of Supplier Finance Program Obligations. The objective of ASU 2022-04 is to require entities to disclose information about the use of supplier finance programs in connection with the purchase of goods and services. While the adoption of ASU 2022-04 did not have a material impact on the Company’s unaudited condensed consolidated financial statements, it did impact the nature of the disclosures. The previous disclosure was specific to the amount of KDP’s outstanding payment obligations that were voluntarily elected by the supplier and sold to financial institutions as informed by the third party administrators. ASU 2022-04 instead requires disclosure of the amount of KDP’s outstanding obligations loaded into the supplier finance programs by the Company at each reporting period regardless of whether the outstanding obligation has been elected by the supplier to be sold to financial institutions. Refer to Note 13 for additional information on the Company’s obligations to participating suppliers.following table summarizes our long-term obligations:
| | | | | | | | | | | |
| (in millions) | March 31, 2024 | | December 31, 2023 |
| Notes | $ | 12,929 | | | $ | 11,095 | |
| Less: current portion of long-term obligations | — | | | (1,150) | |
| Long-term obligations | $ | 12,929 | | | $ | 9,945 | |
KEURIG DR PEPPER INC.
NOTES TO CONDENSED CONSOLIDATED FINANCIAL STATEMENTS
(UNAUDITED, CONTINUED)
2. Long-term Obligations and Borrowing Arrangements
The following table summarizes the Company's long-term obligations:
| | | | | | | | | | | |
| (in millions) | March 31, 2023 | | December 31, 2022 |
| Notes | $ | 11,575 | | | $ | 11,568 | |
| Less: current portion of long-term obligations | (1,646) | | | (496) | |
| Long-term obligations | $ | 9,929 | | | $ | 11,072 | |
The following table summarizes the Company'sour short-term borrowings and current portion of long-term obligations:
| | (in millions) | (in millions) | March 31, 2023 | | December 31, 2022 | (in millions) | March 31, 2024 | | December 31, 2023 |
| Commercial paper notes | Commercial paper notes | $ | 664 | | | $ | 399 | |
| Current portion of long-term obligations | Current portion of long-term obligations | 1,646 | | | 496 | |
| Short-term borrowings and current portion of long-term obligations | Short-term borrowings and current portion of long-term obligations | $ | 2,310 | | | $ | 895 | |
SENIOR UNSECURED NOTES
The Company'sOur Notes consisted of the following:
| | (in millions, except %) | (in millions, except %) | | (in millions, except %) | | Maturity Date | | Rate | | March 31, 2024 | | December 31, 2023 |
| Issuance | | Maturity Date | | Rate | | March 31, 2023 | | December 31, 2022 |
| 2023 Notes | | December 15, 2023 | | 3.130% | | $ | 500 | | | $ | 500 | |
| 2024 Notes | 2024 Notes | | March 15, 2024 | | 0.750% | | 1,150 | | | 1,150 | |
| 2025 Merger Notes | 2025 Merger Notes | | May 25, 2025 | | 4.417% | | 529 | | | 529 | |
| 2025 Notes | 2025 Notes | | November 15, 2025 | | 3.400% | | 500 | | | 500 | |
| 2026 Notes | 2026 Notes | | September 15, 2026 | | 2.550% | | 400 | | | 400 | |
| 2027-B Notes | |
| 2027-C Notes | |
| 2027 Notes | 2027 Notes | | June 15, 2027 | | 3.430% | | 500 | | | 500 | |
| 2028 Merger Notes | 2028 Merger Notes | | May 25, 2028 | | 4.597% | | 1,112 | | | 1,112 | |
| 2029-B Notes | |
| 2029 Notes | 2029 Notes | | April 15, 2029 | | 3.950% | | 1,000 | | | 1,000 | |
| 2030 Notes | 2030 Notes | | May 1, 2030 | | 3.200% | | 750 | | | 750 | |
| 2031 Notes | 2031 Notes | | March 15, 2031 | | 2.250% | | 500 | | | 500 | |
| 2031-B Notes | |
| 2032 Notes | 2032 Notes | | April 15, 2032 | | 4.050% | | 850 | | | 850 | |
| 2034 Notes | |
| 2038 Merger Notes | 2038 Merger Notes | | May 25, 2038 | | 4.985% | | 211 | | | 211 | |
| 2045 Notes | 2045 Notes | | November 15, 2045 | | 4.500% | | 550 | | | 550 | |
| 2046 Notes | 2046 Notes | | December 15, 2046 | | 4.420% | | 400 | | | 400 | |
| 2048 Merger Notes | 2048 Merger Notes | | May 25, 2048 | | 5.085% | | 391 | | | 391 | |
| 2050 Notes | 2050 Notes | | May 1, 2050 | | 3.800% | | 750 | | | 750 | |
| 2051 Notes | 2051 Notes | | March 15, 2051 | | 3.350% | | 500 | | | 500 | |
| 2052 Notes | 2052 Notes | | April 15, 2052 | | 4.500% | | 1,150 | | | 1,150 | |
| Principal amount | Principal amount | | 11,743 | | | 11,743 | |
Adjustment from principal amount to carrying amount(1) | Adjustment from principal amount to carrying amount(1) | | (168) | | | (175) | |
| Carrying amount | Carrying amount | | $ | 11,575 | | | $ | 11,568 | |
(1)The carrying amount includes unamortized discounts, debt issuance costs and fair value adjustments related to the DPS Merger.
(2)The 2027-B Notes bear interest at a rate equal to Compounded SOFR (as defined in the respective indenture) plus 0.88% per annum, and the rate is reassessed quarterly.
On March 7, 2024, we completed the issuance of the 2027-B Notes, the 2027-C Notes, the 2029-B Notes, the 2031-B Notes, and the 2034 Notes, with an aggregate principal amount of $3 billion. The discount associated with these notes was approximately $5 million, and the Company incurred $16 million in debt issuance costs. The proceeds from the issuance were used for our share repurchase program, to repay outstanding commercial paper, and to repay the 2024 Notes at maturity, with the remainder intended for general corporate purposes.
KEURIG DR PEPPER INC.
NOTES TO CONDENSED CONSOLIDATED FINANCIAL STATEMENTS
(UNAUDITED, CONTINUED)
VARIABLE-RATE BORROWING ARRANGEMENTS
Revolving Credit Agreement
The following table summarizes information about the 2022 Revolving Credit Agreement:
| | | | | | | | | | | | | | | | | | | | | | | | | | |
| | | | | | Amounts Outstanding |
| (in millions) | | | | March 31, 2023 | | December 31, 2022 |
Issuance | | Maturity Date | | Capacity | | Carrying ValueMarch 31, 2024 | | Carrying ValueDecember 31, 2023 |
2022 Revolving Credit Agreement(1)
| | February 23, 2027 | | $ | 4,000 | | | $ | — | | | $ | — | |
| | | | | | | | |
| | | | | | | | |
(1)The 2022 Revolving Credit Agreement has $200 million letters of credit available, none of which were utilized as of March 31, 2023.2024.
As of March 31, 2023,2024, KDP was in compliance with its minimum interest coverage ratio relating to the 2022 Revolving Credit Agreement.
Commercial Paper Program
The following table provides information about the Companyour 's weighted average borrowings under itsour commercial paper program:
| | | | First Quarter |
| | | First Quarter | |
| | | First Quarter | |
| | | First Quarter | |
| (in millions, except %) | (in millions, except %) | | | 2023 | | 2022 | (in millions, except %) | | | | | 2024 | | 2023 |
| Weighted average commercial paper borrowings | Weighted average commercial paper borrowings | | | $ | 506 | | | $ | 45 | |
| Weighted average borrowing rates | Weighted average borrowing rates | | | 4.86 | % | | 0.30 | % | Weighted average borrowing rates | | | | | 5.62 | % | | 4.86 | % |
Letter of Credit Facility
In addition to the portion of the 2022 Revolving Credit Agreement reserved for issuance of letters of credit, KDP has an incremental letter of credit facility. Under this facility, $150 million is available for the issuance of letters of credit, $68$57 million of which was utilized as of March 31, 20232024 and $82$93 million of which remains available for use.
FAIR VALUE DISCLOSURES
The fair value of KDP'sour commercial paper approximates the carrying value and areis considered Level 2 within the fair value hierarchy.
The fair values of KDP'sour Notes are based on current market rates available to KDPus and are considered Level 2 within the fair value hierarchy. The difference between the fair value and the carrying value represents the theoretical net premium or discount that would be paid or received to retire all the Notes and related unamortized costs to be incurred at such date. The fair value of KDP'sour Notes was $10,777$12,085 million and $10,495$10,486 million as of March 31, 20232024 and December 31, 2022,2023, respectively.
KEURIG DR PEPPER INC.
NOTES TO CONDENSED CONSOLIDATED FINANCIAL STATEMENTS
(UNAUDITED, CONTINUED)
3. Goodwill and Other Intangible Assets
GOODWILL
Changes in the carrying amount of goodwill by reportable segment are as follows:
| | (in millions) | (in millions) | U.S. Refreshment Beverages | | U.S. Coffee | | International | | | Total |
| Balance as of January 1, 2023 | $ | 8,714 | | | $ | 8,622 | | | $ | 2,736 | | | | $ | 20,072 | |
| (in millions) | |
| (in millions) | | U.S. Refreshment Beverages | | U.S. Coffee | | International | | | | Total |
| Balance as of January 1, 2024 | |
| Foreign currency translation | Foreign currency translation | — | | | — | | | 45 | | | | 45 | |
| | Balance as of March 31, 2023 | $ | 8,714 | | | $ | 8,622 | | | $ | 2,781 | | | | $ | 20,117 | |
| Balance as of March 31, 2024 | |
| Balance as of March 31, 2024 | |
| Balance as of March 31, 2024 | |
KEURIG DR PEPPER INC.
NOTES TO CONDENSED CONSOLIDATED FINANCIAL STATEMENTS
(UNAUDITED, CONTINUED)
INTANGIBLE ASSETS OTHER THAN GOODWILL
The net carrying amounts of intangible assets other than goodwill with indefinite lives are as follows:
| | (in millions) | (in millions) | | March 31, 2023 | | December 31, 2022 | (in millions) | March 31, 2024 | | December 31, 2023 |
Brands(1) | Brands(1) | | $ | 19,363 | | | $ | 19,291 | |
| Trade names | Trade names | | 2,480 | | | 2,480 | |
| Contractual arrangements | | 122 | | | 122 | |
| Distribution rights(2) | |
Distribution rights(2) | |
Distribution rights(2) | Distribution rights(2) | | 151 | | | 100 | |
| Total | Total | | $ | 22,116 | | | $ | 21,993 | |
(1)The change in brands with indefinite lives was primarily driven by foreign currency translation of $72$33 million during the first quarter of 2023.2024.
(2)The Company acquired certainchange in distribution rights from Nutrabolt during the first quarterwith indefinite lives was primarily driven by acquired distribution rights related to Electrolit of 2023 for approximately $51$31 million.
The net carrying amounts of intangible assets other than goodwill with definite lives are as follows:
| | March 31, 2023 | | December 31, 2022 |
| March 31, 2024 | | | March 31, 2024 | | December 31, 2023 |
| (in millions) | (in millions) | Gross Amount | | Accumulated Amortization | | Net Amount | | Gross Amount | | Accumulated Amortization | | Net Amount | (in millions) | Gross Amount | | Accumulated Amortization | | Net Amount | | Gross Amount | | Accumulated Amortization | | Net Amount |
| Acquired technology | Acquired technology | $ | 1,146 | | | $ | (494) | | | $ | 652 | | | $ | 1,146 | | | $ | (475) | | | $ | 671 | |
| Customer relationships | Customer relationships | 638 | | | (212) | | | 426 | | | 638 | | | (204) | | | 434 | |
| Contractual arrangements | |
| Trade names | Trade names | 127 | | | (104) | | | 23 | | | 127 | | | (101) | | | 26 | |
| Brands | Brands | 51 | | | (20) | | | 31 | | | 51 | | | (19) | | | 32 | |
| Contractual arrangements | 24 | | | (10) | | | 14 | | | 24 | | | (10) | | | 14 | |
| Distribution rights | Distribution rights | 29 | | | (18) | | | 11 | | | 29 | | | (16) | | | 13 | |
| | Total | Total | $ | 2,015 | | | $ | (858) | | | $ | 1,157 | | | $ | 2,015 | | | $ | (825) | | | $ | 1,190 | |
| Total | |
| Total | |
Amortization expense for intangible assets with definite lives was as follows:
| | | | | | | | | | | | | | | |
| | | | First Quarter |
| (in millions) | | | | | 2023 | | 2022 |
| Amortization expense | | | | | $ | 34 | | | $ | 34 | |
Amortization expense of these intangible assets over the remainder of 2023 and the next five years is expected to be as follows:
| | | | | | | | | | | | | | | | | | | | | | | | | | | | | | | | | | | |
| Remainder of 2023 | | For the Years Ending December 31, |
| (in millions) | | 2024 | | 2025 | | 2026 | | 2027 | | 2028 |
| Expected amortization expense | $ | 101 | | | $ | 127 | | | $ | 115 | | | $ | 111 | | | $ | 95 | | | $ | 87 | |
KEURIG DR PEPPER INC.
NOTES TO CONDENSED CONSOLIDATED FINANCIAL STATEMENTS
(UNAUDITED, CONTINUED)
IMPAIRMENT TESTING
KDP conducts impairment tests on goodwill and all indefinite lived intangible assets annually, or more frequently if circumstances indicate that the carrying amount of an asset may not be recoverable. Changes to the Company’s operating segments effective January 1, 2023, as described in Note 6, resulted in a change to the Company’s reporting units. The Company’s reporting units are as follows:
| | | | | | | | |
Reportable Segments | | Reporting Units |
U.S. Refreshment Beverages | | U.S. Beverage Concentrates |
| | U.S. WD |
| | DSD |
U.S. Coffee | | U.S. Coffee |
International | | Canada Beverage Concentrates |
| | Canada WD |
| | Canada Coffee |
| | Latin America Beverages |
Management performed a step 0 analysis as of the effective date of the goodwill for the impacted reporting units. The Company also performed an analysis as of March 31, 2023 to ensure that there were no additional triggering events which occurred during the quarter. As a result of these analyses, management did not identify any indications that the carrying amount of any goodwill or any intangible asset may not be recoverable. | | | | | | | | | | | | | | | |
| | | | First Quarter |
| (in millions) | | | | | 2024 | | 2023 |
| Amortization expense | | | | | $ | 33 | | | $ | 34 | |
4. Derivatives
KDP is exposed to market risks arising from adverse changes in interest rates, commodity prices, and FX rates. KDP manages these risks through a variety of strategies, including the use of interest rate contracts, FX forward contracts, commodity forward, future, swap and option contracts and supplier pricing agreements. KDP does not hold or issue derivative financial instruments for trading or speculative purposes.
KDPWe formally designatesdesignate and accountsaccount for certain foreign exchange forward contracts and interest rate contracts that meet established accounting criteria under U.S. GAAP as cash flow hedges. For such contracts, the effective portion of the gain or loss on the derivative instruments is recorded, net of applicable taxes, in AOCI. When net income is affected by the variability of the underlying transaction, the applicable offsetting amount of the gain or loss from the derivative instrument deferred in AOCI is reclassified to net income. Cash flows from derivative instruments designated in a qualifying hedging relationship are classified in the same category as the cash flows from the hedged items. If a cash flow hedge were to cease to qualify for hedge accounting, or were terminated, the derivatives would continue to be carried on the balance sheet at fair value until settled, and hedge accounting would be discontinued prospectively. If the underlying hedged transaction ceases to exist, any associated amounts reported in AOCI would be reclassified to earnings at that time.
For derivatives that are not designated or for which the designated hedging relationship is discontinued, the gain or loss on the instrument is recognized in earnings in the period of change.
KEURIG DR PEPPER INC.
NOTES TO CONDENSED CONSOLIDATED FINANCIAL STATEMENTS
(UNAUDITED, CONTINUED)
We have exposure to credit losses from derivative instruments in an asset position in the event of nonperformance by the counterparties to the agreements. Historically, the Company haswe have not experienced material credit losses as a result of counterparty nonperformance. The Company selectsWe select and periodically reviewsreview counterparties based on credit ratings, limits itslimit our exposure to a single counterparty under defined guidelines, and monitorsmonitor the market position of the programs upon execution of a hedging transaction and at least on a quarterly basis.
KEURIG DR PEPPER INC.
NOTES TO CONDENSED CONSOLIDATED FINANCIAL STATEMENTS
(UNAUDITED, CONTINUED)
INTEREST RATES
Economic Hedges
KDP isWe are exposed to interest rate risk related to itsour borrowing arrangements and obligations. The Company entersWe enter into interest rate contracts to provide predictability in the Company'sour overall cost structure and to manage the balance of fixed-rate and variable-rate debt. KDPWe primarily entersenter into receive-fixed, pay-variable and receive-variable, pay-fixed swaps and swaption contracts. A natural hedging relationship exists in which changes in the fair value of the instruments act as an economic offset to changes in the fair value of the underlying items. Changes in the fair value of these instruments are recorded in earnings throughout the term of the derivative instrument and are generally reported in interest expense in the unaudited Condensed Consolidated Statements of Income. As of March 31, 2023,2024, economic interest rate derivative instruments have maturities ranging from February 2033April 2024 to December 2036.July 2043.
Cash Flow Hedges
In order to hedge the variability in cash flows from interest rate changes associated with the Company’s planned future issuancesAs of long-term debt, during the first quarterDecember 31, 2023, we had $500 million of 2021, the Company entered into forward starting swaps and designated them as cash flow hedges. During the first quarternotional amount of 2023, KDP terminated the remaining forward starting swaps which were designatedhad been de-designated and terminated; however, as cash flow hedges. As the forecasted debt transaction associated with the terminated forward starting swaps was no longerstill considered probable, the realized gains associatedfair value of the instruments as of the de-designation remained within AOCI. In March 2024, the forecasted debt transaction took place with the termination were recorded in interestissuance of the 2034 Notes, and the fair value of the instruments began amortizing to Interest expense, duringnet over the first quarterterm of 2023.the 2034 Notes.
FOREIGN EXCHANGE
KDP isWe are exposed to foreign exchange risk in itsour international subsidiaries or with certain counterparties in foreign jurisdictions, which may transact in currencies that are different from the functional currencies of KDP’sour legal entities. Additionally, the balance sheets of each of the Company’sour Canadian and Mexican businesses are subject to exposure from movements in exchange rates.
Economic Hedges
KDP holdsWe hold FX forward contracts to economically manage the balance sheet exposures resulting from changes in the FX exchange rates described above. The intent of these FX contracts is to minimize the impact of FX risk associated with balance sheet positions not in local currency. In these cases, a hedging relationship exists in which changes in the fair value of the instruments act as an economic offset to changes in the fair value of the underlying items. Changes in the fair value of these instruments are recorded in earnings throughout the term of the derivative instrument and are reported in the same caption of the unaudited Condensed Consolidated Statements of Income as the associated risk. As of March 31, 2023,2024, these FX contracts have maturities ranging from April 20232024 to September 2024.February 2025.
Cash Flow Hedges
KDP designatesWe designate certain FX forward contracts as cash flow hedges in order to manage the exposures resulting from changes in the FX rates described above. These designated FX forward contracts relate to either forecasted inventory purchases in U.S. dollars of theour Canadian and Mexican businesses or forecasted capital expenditures of certain equipment in euros for KDP’s U.S. manufacturing facilities.businesses. The intent of these FX contracts is to provide predictability in the Company's overall cost structure. As of March 31, 2023,2024, these FX contracts have maturities ranging from April 20232024 to October 2024.June 2025.
KEURIG DR PEPPER INC.
NOTES TO CONDENSED CONSOLIDATED FINANCIAL STATEMENTS
(UNAUDITED, CONTINUED)
COMMODITIES
Economic Hedges
KDPWe centrally managesmanage the exposure to volatility in the prices of certain commodities used in itsour production process and transportation through various derivative contracts. The CompanyWe generally holdshold some combination of future, swap and option contracts that economically hedge certain of itsour risks. In these cases, a hedging relationship exists in which changes in the fair value of the instruments act as an economic offset to changes in the fair value of the underlying items or as an offset to certain costs of production. Changes in the fair value of these instruments are recorded in earnings throughout the term of the derivative instrument and are reported in the same line item of the unaudited Condensed Consolidated Statements of Income as the hedged transaction. Unrealized gains and losses are recognized as a component of unallocated corporate costs until the Company'sour reportable segments are affected by the completion of the underlying transaction, at which time the gain or loss is reflected as a component of the respective segment's income from operations. As of March 31, 2023,2024, these commodity contracts have maturities ranging from April 20232024 to June 2024.
KEURIG DR PEPPER INC.
NOTES TO CONDENSED CONSOLIDATED FINANCIAL STATEMENTS
(UNAUDITED, CONTINUED)
January 2026.NOTIONAL AMOUNTS OF DERIVATIVE INSTRUMENTS
The following table presents the notional amounts of KDP'sour outstanding derivative instruments by type:
| | (in millions) | (in millions) | March 31, 2023 | | December 31, 2022 | (in millions) | March 31, 2024 | | December 31, 2023 |
| Interest rate contracts | Interest rate contracts | | | |
| Forward starting swaps, designated as cash flow hedges | $ | — | | | $ | 500 | |
| Forward starting swaps, not designated as hedging instruments | |
| Forward starting swaps, not designated as hedging instruments | |
| Forward starting swaps, not designated as hedging instruments | Forward starting swaps, not designated as hedging instruments | 1,500 | | | 1,000 | |
| | Receive-fixed, pay-variable interest rate swaps, not designated as hedging instruments | 700 | | | 1,900 | |
| | | Swaptions, not designated as hedging instruments | |
| | Swaptions, not designated as hedging instruments | |
| | Swaptions, not designated as hedging instruments | |
| FX contracts | FX contracts | |
| Forward contracts, not designated as hedging instruments | |
| Forward contracts, not designated as hedging instruments | |
| Forward contracts, not designated as hedging instruments | Forward contracts, not designated as hedging instruments | 589 | | | 490 | |
| Forward contracts, designated as cash flow hedges | Forward contracts, designated as cash flow hedges | 472 | | | 511 | |
Commodity contracts, not designated as hedging instruments(1) | Commodity contracts, not designated as hedging instruments(1) | 529 | | | 754 | |
(1)Notional value for commodity contracts is calculated as the expected volume times strike price per unit on a gross basis.
FAIR VALUE OF DERIVATIVE INSTRUMENTS
The fair values of commodity contracts, interest rate contracts and FX forward contracts are determined based on inputs that are readily available in public markets or can be derived from information available in publicly quoted markets. The fair value of commodity contracts are valued using the market approach based on observable market transactions, primarily underlying commodities futures or physical index prices, at the reporting date. Interest rate contracts are valued using models based primarily on readily observable market parameters, such as LIBOR or SOFR forward rates, for all substantial terms of the Company'sour contracts and credit risk of the counterparties. The fair value of FX forward contracts are valued using quoted forward FX prices at the reporting date. Therefore, the Company haswe have categorized these contracts as Level 2.
KEURIG DR PEPPER INC.
NOTES TO CONDENSED CONSOLIDATED FINANCIAL STATEMENTS
(UNAUDITED, CONTINUED)
Not Designated as Hedging Instruments
The following table summarizes the location of the fair value of the Company'sour derivative instruments which are not designated as hedging instruments within the unaudited Condensed Consolidated Balance Sheets. All such instruments are considered level 2 within the fair value hierarchy.
| | | | | | | | | | | | | | | | | |
| (in millions) | Balance Sheet Location | | March 31, 2023 | | December 31, 2022 |
| Assets: | | | | | |
| | | | | |
| FX contracts | Prepaid expenses and other current assets | | $ | 5 | | | $ | 8 | |
| Commodity contracts | Prepaid expenses and other current assets | | 7 | | | 6 | |
| Interest rate contracts | Other non-current assets | | 36 | | | 49 | |
| FX contracts | Other non-current assets | | 1 | | | 1 | |
| Commodity contracts | Other non-current assets | | 1 | | | 1 | |
| | | | | |
| Liabilities: | | | | | |
| Interest rate contracts | Other current liabilities | | $ | 22 | | | $ | 58 | |
| FX contracts | Other current liabilities | | 1 | | | — | |
| Commodity contracts | Other current liabilities | | 46 | | | 51 | |
| Interest rate contracts | Other non-current liabilities | | 123 | | | 194 | |
| | | | | |
| Commodity contracts | Other non-current liabilities | | 3 | | | 1 | |
KEURIG DR PEPPER INC.
NOTES TO CONDENSED CONSOLIDATED FINANCIAL STATEMENTS
(UNAUDITED, CONTINUED)
| | | | | | | | | | | | | | | | | |
| (in millions) | Balance Sheet Location | | March 31, 2024 | | December 31, 2023 |
| Assets: | | | | | |
| | | | | |
| FX contracts | Prepaid expenses and other current assets | | $ | 4 | | | $ | 5 | |
| Commodity contracts | Prepaid expenses and other current assets | | 16 | | | 9 | |
| | | | | |
| FX contracts | Other non-current assets | | 2 | | | — | |
| Commodity contracts | Other non-current assets | | — | | | 3 | |
| | | | | |
| Liabilities: | | | | | |
| Interest rate contracts | Other current liabilities | | 2 | | | 80 | |
| FX contracts | Other current liabilities | | 1 | | | 3 | |
| Commodity contracts | Other current liabilities | | 47 | | | 53 | |
| Interest rate contracts | Other non-current liabilities | | 298 | | | 186 | |
| FX contracts | Other non-current liabilities | | — | | | 4 | |
| Commodity contracts | Other non-current liabilities | | 2 | | | 11 | |
Designated as Hedging Instruments
The following table summarizes the location of the fair value of the Company'sour derivative instruments which are designated as hedging instruments within the unaudited Condensed Consolidated Balance Sheets. All such instruments are designated level 2 within the fair value hierarchy.
| | (in millions) | (in millions) | Balance Sheet Location | | March 31, 2023 | | December 31, 2022 | (in millions) | Balance Sheet Location | | March 31, 2024 | | December 31, 2023 |
| Assets: | Assets: | | | | | |
| FX contracts | FX contracts | Prepaid expenses and other current assets | | $ | 17 | | | $ | 21 | |
| FX contracts | FX contracts | Other non-current assets | | 1 | | | 1 | |
| FX contracts | |
| | Interest rate contracts | Other non-current assets | | — | | | 88 | |
| | Liabilities: | |
| | Liabilities: | |
| | | Liabilities: | Liabilities: | | | | | | | | | | |
| FX contracts | FX contracts | Other current liabilities | | $ | 11 | | | $ | 3 | |
| | FX contracts | |
| FX contracts | |
| FX contracts | |
|
IMPACT OF DERIVATIVE INSTRUMENTS NOT DESIGNATED AS HEDGING INSTRUMENTS
The following table presents the amount of (gains) losses, net, recognized in the unaudited Condensed Consolidated Statements of Income related to derivative instruments not designated as hedging instruments under U.S. GAAP during the periods presented. Amounts include both realized and unrealized gains and losses.
| | | |
| | | | | | First Quarter | | | | | First Quarter |
| (in millions) | (in millions) | Income Statement Location | | | 2023 | | 2022 | (in millions) | Income Statement Location | | | | | | 2024 | | 2023 |
| Interest rate contracts | Interest rate contracts | Interest expense | | | $ | (96) | | | $ | 67 | |
| | FX contracts | FX contracts | Cost of sales | | | 1 | | | 5 | |
| FX contracts | FX contracts | Other (income) expense, net | | | — | | | 8 | |
| FX contracts | |
| FX contracts | |
| Commodity contracts | Commodity contracts | Cost of sales | | | (15) | | | (97) | |
| Commodity contracts | Commodity contracts | SG&A expenses | | | 14 | | | (37) | |
|
KEURIG DR PEPPER INC.
NOTES TO CONDENSED CONSOLIDATED FINANCIAL STATEMENTS
(UNAUDITED, CONTINUED)
IMPACT OF CASH FLOW HEDGES
The following table presents the amount of (gains) losses, net, reclassified from AOCI into the unaudited Condensed Consolidated Statements of Income related to derivative instruments designated as cash flow hedging instruments during the periods presented:
| | | | First Quarter |
| | | | | First Quarter | |
| | | | | First Quarter | |
| | | | | First Quarter | |
| (in millions) | (in millions) | Income Statement Location | | | 2023 | | 2022 | (in millions) | Income Statement Location | | | | | | 2024 | | 2023 |
Interest rate contracts(1) | Interest expense | | | $ | (68) | | | $ | — | |
| Interest rate contracts | |
| FX contracts | FX contracts | Cost of sales | | | (1) | | | 3 | |
(1)Amounts recognized during the first quarter of 2023 include the realized gains associated with the termination of forward starting swaps designated as cash flow hedges of approximately $66 million.
KDP expectsWe expect to reclassify approximately $8 million and $9$13 million of pre-tax net gains and $10 million of pre-tax net losses from AOCI into net income during the next twelve months related to interest rate contracts and FX contracts, respectively.
KEURIG DR PEPPER INC.
NOTES TO CONDENSED CONSOLIDATED FINANCIAL STATEMENTS
(UNAUDITED, CONTINUED)
5. Leases
The following table presents the components of lease cost:
| | | |
| | | | | First Quarter | | | First Quarter |
| (in millions) | (in millions) | | 2023 | | 2022 | (in millions) | | | | | 2024 | | 2023 |
| Operating lease cost | Operating lease cost | | $ | 39 | | | $ | 32 | |
| Finance lease cost | Finance lease cost | | |
| Amortization of right-of-use assets | Amortization of right-of-use assets | | 22 | | | 18 | |
| Amortization of right-of-use assets | |
| Amortization of right-of-use assets | |
| Interest on lease liabilities | Interest on lease liabilities | | 6 | | | 6 | |
Variable lease cost(1) | Variable lease cost(1) | | 10 | | | 9 | |
| | Short-term lease cost | |
| | Total lease cost | Total lease cost | | $ | 77 | | | $ | 65 | |
| | Total lease cost | |
| Total lease cost | |
(1)Variable lease cost primarily consists of common area maintenance costs, property taxes, and adjustments for inflation.
The following table presents supplemental cash flow and other information about the Company'sour leases:
| | First Quarter |
| First Quarter | | | First Quarter |
| (in millions) | (in millions) | 2023 | | 2022 | (in millions) | 2024 | | 2023 |
| Cash paid for amounts included in the measurement of lease liabilities: | Cash paid for amounts included in the measurement of lease liabilities: | | | |
| Operating cash flows from operating leases | |
| Operating cash flows from operating leases | |
| Operating cash flows from operating leases | Operating cash flows from operating leases | $ | 36 | | | $ | 29 | |
| Operating cash flows from finance leases | Operating cash flows from finance leases | 6 | | | 6 | |
| Financing cash flows from finance leases | Financing cash flows from finance leases | 24 | | | 20 | |
| Right-of-use assets obtained in exchange for lease obligations: | Right-of-use assets obtained in exchange for lease obligations: | |
| Operating leases | Operating leases | 38 | | | 168 | |
| Operating leases | |
| Operating leases | |
| Finance leases | Finance leases | 17 | | | 23 | |
The following table presents information about the Company'sour weighted average discount rate and remaining lease term:
| | March 31, 2023 | | December 31, 2022 |
| March 31, 2024 | | | March 31, 2024 | | December 31, 2023 |
| Weighted average discount rate | Weighted average discount rate | | | |
| Operating leases | |
| Operating leases | |
| Operating leases | Operating leases | 5.1 | % | | 5.0 | % | 5.3 | % | | 5.3 | % |
| Finance leases | Finance leases | 3.7 | % | | 3.7 | % | Finance leases | 3.9 | % | | 3.9 | % |
| Weighted average remaining lease term | Weighted average remaining lease term | |
| Operating leases | Operating leases | 10 years | | 11 years |
| Operating leases | |
| Operating leases | | 10 years | | 10 years |
| Finance leases | Finance leases | 9 years | | 9 years | Finance leases | 9 years | | 9 years |
KEURIG DR PEPPER INC.
NOTES TO CONDENSED CONSOLIDATED FINANCIAL STATEMENTS
(UNAUDITED, CONTINUED)
Future minimum lease payments for non-cancellable leases that have commenced and are reflected on the unaudited Condensed Consolidated Balance Sheets as of March 31, 20232024 were as follows:
| | | | | | | | | | | |
| (in millions) | Operating Leases | | Finance Leases |
| Remainder of 2023 | $ | 98 | | | $ | 90 | |
| 2024 | 141 | | | 116 | |
| 2025 | 133 | | | 111 | |
| 2026 | 121 | | | 148 | |
| 2027 | 100 | | | 61 | |
| 2028 | 78 | | | 47 | |
| Thereafter | 519 | | | 264 | |
| Total future minimum lease payments | 1,190 | | | 837 | |
| Less: imputed interest | (275) | | | (131) | |
| Present value of minimum lease payments | $ | 915 | | | $ | 706 | |
KEURIG DR PEPPER INC.
NOTES TO CONDENSED CONSOLIDATED FINANCIAL STATEMENTS
(UNAUDITED, CONTINUED)
| | | | | | | | | | | |
| (in millions) | Operating Leases | | Finance Leases |
| Remainder of 2024 | $ | 107 | | | $ | 98 | |
| 2025 | 152 | | | 128 | |
| 2026 | 139 | | | 165 | |
| 2027 | 115 | | | 76 | |
| 2028 | 90 | | | 65 | |
| 2029 | 85 | | | 58 | |
| Thereafter | 454 | | | 274 | |
| Total future minimum lease payments | 1,142 | | | 864 | |
| Less: imputed interest | (250) | | | (143) | |
| Present value of minimum lease payments | $ | 892 | | | $ | 721 | |
SIGNIFICANT LEASES THAT HAVE NOT YET COMMENCED
As of March 31, 2023, the Company has2024, we have entered into leases that have not yet commenced with estimated aggregated future lease payments of approximately $208$197 million. These leases are expected to commence between the fourththird quarter of 2023 and 2025,2024 through 2027, with initial lease terms ranging from 45 years to 10 years.
ASSET SALE-LEASEBACK TRANSACTION
The Company entered into a sale-leaseback transaction with the Veyron SPEs during the first quarter of 2023. The following table presents details of the transaction. The gain on the sale-leaseback is recorded in Other operating income, net, and the leaseback is accounted for as an operating lease.
| | | | | | | | | | | | | | | | | | | | |
| (in millions) | | Sale Proceeds | | Carrying Value | | Gain on Sale |
March 31, 2023(1) | | $ | 7 | | | $ | 1 | | | $ | 6 | |
(1)The sale-leaseback transaction included one distribution property.
The initial term of the leaseback is approximately 15 years, with two 10-year renewal options. The renewal options are not reasonably assured as (i) the Company's position that the dynamic environment in which it operates precludes the Company's ability to be reasonably certain of exercising the renewal options in the distant future and (ii) the options are contingent on the Company remaining investment grade and no change-in-control as of the end of the lease term. The leaseback has a RVG. Refer to Note 15 for additional information about the RVG associated with the asset sale-leaseback transaction.
6. Segments
Effective January 1, 2023, the Company revised its segment structure to align with changes in how the Company’s Chief Operating Decision Maker manages the business, assesses performanceOur operating and allocates resources. The Company's reportable segments consist of the following:
•The U.S. Refreshment Beverages segment reflects sales in the U.S. from the manufacture and distribution of branded concentrates, syrup and finished beverages, including the sales of the Company'sour own brands and third-party brands, to third-party bottlers, distributors and retailers.
•The U.S. Coffee segment reflects sales in the U.S. from the manufacture and distribution of finished goods relating to the Company'sour K-Cup pods, single-serve brewers and accessories, and other coffee products to partners, retailers and directly to consumers through the Company’s Keurig.com website.
•The International segment reflects sales in international markets, including the following:
◦Sales in Canada, Mexico, the Caribbean and other international markets from the manufacture and distribution of branded concentrates, syrup and finished beverages, including sales of the Company'sour own brands and third-party brands, to third-party bottlers, distributors and retailers.
◦Sales in Canada from the manufacture and distribution of finished goods relating to the Company’sour single-serve brewers, K-Cup pods and other coffee products.
Segment results are based on management reports. Net sales and income from operations are the significant financial measures used to assess the operating performance of the Company's reportableour operating segments. Intersegment sales are recorded at cost and are eliminated in the unaudited Condensed Consolidated Statements of Income. “Unallocated corporate costs” are excluded from the Company'sour measurement of segment performance and include unrealized commodity derivative gains and losses, and certain general corporate expenses.
KEURIG DR PEPPER INC.
NOTES TO CONDENSED CONSOLIDATED FINANCIAL STATEMENTS
(UNAUDITED, CONTINUED)
Information about the Company'sour operations by reportable segment is as follows:
| | | |
| | | | | First Quarter | | | First Quarter |
| (in millions) | (in millions) | | 2023 | | 2022 | (in millions) | | | | | 2024 | | 2023 |
| Segment Results – Net sales | Segment Results – Net sales | | | | |
| U.S. Refreshment Beverages | |
| U.S. Refreshment Beverages | |
| U.S. Refreshment Beverages | U.S. Refreshment Beverages | | $ | 2,007 | | | $ | 1,781 | |
| U.S. Coffee | U.S. Coffee | | 931 | | | 943 | |
| International | International | | 415 | | | 354 | |
| Net sales | Net sales | | $ | 3,353 | | | $ | 3,078 | |
| | Segment Results – Income from operations | Segment Results – Income from operations | | |
| Segment Results – Income from operations | |
| Segment Results – Income from operations | |
| U.S. Refreshment Beverages | |
| U.S. Refreshment Beverages | |
| U.S. Refreshment Beverages | U.S. Refreshment Beverages | | $ | 490 | | | $ | 704 | |
| U.S. Coffee | U.S. Coffee | | 232 | | | 255 | |
| International | International | | 80 | | | 64 | |
| Unallocated corporate costs | Unallocated corporate costs | | (218) | | | (57) | |
| Income from operations | Income from operations | | $ | 584 | | | $ | 966 | |
| | | | | | | | | | | |
| (in millions) | March 31, 2023 | | December 31, 2022 |
| Identifiable operating assets | | | |
| U.S. Refreshment Beverages | $ | 28,991 | | | $ | 28,987 | |
| U.S. Coffee | 14,155 | | | 14,220 | |
| International | 6,903 | | | 6,873 | |
| Segment total | 50,049 | | | 50,080 | |
| Unallocated corporate assets | 602 | | | 757 | |
| Total identifiable operating assets | 50,651 | | | 50,837 | |
| Investments in unconsolidated affiliates | 1,009 | | | 1,000 | |
| Total assets | $ | 51,660 | | | $ | 51,837 | |
KEURIG DR PEPPER INC.
NOTES TO CONDENSED CONSOLIDATED FINANCIAL STATEMENTS
(UNAUDITED, CONTINUED)
7. Revenue Recognition
KDP recognizesWe recognize revenue when obligations under the terms of a contract with the customer are satisfied. Branded product sales, which include LRB, K-Cup pods and appliances, occur once control is transferred upon delivery to the customer. Revenue is measured as the amount of consideration that KDP expectswe expect to receive in exchange for transferring goods. The amount of consideration KDP receiveswe receive, and revenue KDP recognizeswe recognize, varies with changes in customer incentives that KDP offers to itswe offer our customers and their customers.end consumers. Sales taxes and other similar taxes are excluded from revenue. Costs associated with shipping and handling activities, such as merchandising, are included in SG&A expenses as revenue is recognized.
The following table disaggregates KDP'sour revenue by product portfolio and by reportable segment:
| | (in millions) | (in millions) | U.S. Refreshment Beverages | | U.S. Coffee | | International | | Total | (in millions) | U.S. Refreshment Beverages | | U.S. Coffee | | International | | Total |
| | For the first quarter of 2024: | |
| | For the first quarter of 2023: | | | | | | | |
| | For the first quarter of 2024: | |
| | For the first quarter of 2024: | |
| LRB | |
| LRB | |
| LRB | LRB | $ | 1,970 | | | $ | — | | | $ | 253 | | | $ | 2,223 | |
| K-Cup pods | K-Cup pods | — | | | 771 | | | 117 | | | 888 | |
| Appliances | Appliances | — | | | 125 | | | 12 | | | 137 | |
| Other | Other | 37 | | | 35 | | | 33 | | | 105 | |
| Net sales | Net sales | $ | 2,007 | | | $ | 931 | | | $ | 415 | | | $ | 3,353 | |
| | For the first quarter of 2022: | |
| For the first quarter of 2023: | |
| For the first quarter of 2023: | |
| For the first quarter of 2023: | |
| LRB | |
| LRB | |
| LRB | LRB | $ | 1,753 | | | $ | — | | | $ | 203 | | | $ | 1,956 | |
| K-Cup pods | K-Cup pods | — | | | 749 | | | 106 | | | 855 | |
| Appliances | Appliances | — | | | 161 | | | 17 | | | 178 | |
| Other | Other | 28 | | | 33 | | | 28 | | | 89 | |
| Net sales | Net sales | $ | 1,781 | | | $ | 943 | | | $ | 354 | | | $ | 3,078 | |
LRB represents net sales of owned, licensed, and partner brands within our portfolio and includes CSDs, NCBs,branded concentrates, syrup, and finished beverages, including contract manufacturing of KDPour branded products for our bottlers and distributors. K-Cup pods represents net sales from owned, brands,licensed, and partner brands and private label owners. Net sales for partner brands and private label owners are contractual and long-term in nature.
8. Earnings Per Share
The following table presents the Company's basic and diluted EPS and shares outstanding. Anti-dilutive stock-based awards excluded from the calculations of diluted EPS were immaterial during the periods presented.
| | | | | | | | | | | | | | | |
| | | | First Quarter |
| (in millions, except per share data) | | | | | 2023 | | 2022 |
| Net income attributable to KDP | | | | | $ | 467 | | | $ | 585 | |
| | | | | | | |
| Weighted average common shares outstanding | | | | | 1,406.2 | | | 1,418.2 | |
| Dilutive effect of stock-based awards | | | | | 10.8 | | | 11.5 | |
| Weighted average common shares outstanding and common stock equivalents | | | | | 1,417.0 | | | 1,429.7 | |
| | | | | | | |
| Basic EPS | | | | | $ | 0.33 | | | $ | 0.41 | |
| Diluted EPS | | | | | 0.33 | | | 0.41 | |
| | | | | | | |
| Anti-dilutive shares excluded from the diluted weighted average shares outstanding calculation | | | | | 1.0 | | | 0.9 | |
KEURIG DR PEPPER INC.
NOTES TO CONDENSED CONSOLIDATED FINANCIAL STATEMENTS
(UNAUDITED, CONTINUED)
8. Earnings Per Share
The following table presents basic and diluted EPS and shares outstanding.
| | | | | | | | | | | | | | | |
| | | | First Quarter |
| (in millions, except per share data) | | | | | 2024 | | 2023 |
| Net income | | | | | $ | 454 | | | $ | 467 | |
| | | | | | | |
| Weighted average common shares outstanding | | | | | 1,380.7 | | | 1,406.2 | |
| Dilutive effect of stock-based awards | | | | | 7.0 | | | 10.8 | |
| Weighted average common shares outstanding and common stock equivalents | | | | | 1,387.7 | | | 1,417.0 | |
| | | | | | | |
| Basic EPS | | | | | $ | 0.33 | | | $ | 0.33 | |
| Diluted EPS | | | | | 0.33 | | | 0.33 | |
| | | | | | | |
| Anti-dilutive shares excluded from the diluted weighted average shares outstanding calculation | | | | | 2.1 | | | 1.0 | |
9. Stock-Based Compensation
The components of stock-based compensation expense are presented below:
| | | First Quarter |
| | | First Quarter | |
| | | First Quarter | |
| | | First Quarter | |
| (in millions) | (in millions) | | 2023 | | 2022 | (in millions) | | | | | 2024 | | 2023 |
Total stock-based compensation expense(1) | | $ | 29 | | | $ | (15) | |
| Income tax (benefit) expense | | (5) | | | 4 | |
| Total stock-based compensation expense | |
| Income tax benefit | |
| Stock-based compensation expense, net of tax | Stock-based compensation expense, net of tax | | $ | 24 | | | $ | (11) | |
(1)The Company recorded a one-time $40 million reduction to stock-based compensation expense as a result of the change in forfeiture policy in the first quarter of 2022.
RESTRICTED SHARE UNITS
The table below summarizes RSU activity:
| | | | RSUs | | Weighted Average Grant Date Fair Value | | Weighted Average Remaining Contractual Term (Years) | | Aggregate Intrinsic Value (in millions) | | RSUs | | Weighted Average Grant Date Fair Value | | Weighted Average Remaining Contractual Term (Years) | | Aggregate Intrinsic Value
(in millions) |
| Outstanding as of December 31, 2022 | 18,038,745 | | | $ | 27.46 | | | 1.6 | | $ | 643 | |
| Outstanding as of December 31, 2023 | |
| Granted | Granted | 3,090,196 | | | 31.53 | | |
| Vested and released | Vested and released | (2,069,870) | | | 23.41 | | | 71 | |
| Vested and released | |
| Vested and released | |
| Forfeited | Forfeited | (184,830) | | | 28.24 | | |
| Outstanding as of March 31, 2023 | 18,874,241 | | | $ | 28.57 | | | 1.8 | | $ | 666 | |
| Outstanding as of March 31, 2024 | |
| Outstanding as of March 31, 2024 | |
| Outstanding as of March 31, 2024 | |
As of March 31, 2023,2024, there was $226$233 million of unrecognized compensation cost related to unvested RSUs that is expected to be recognized over a weighted average period of 3.43.5 years.
10. Investments
The following table summarizes investments in unconsolidated affiliates as of March 31, 2023 and December 31, 2022:
| | | | | | | | | | | | | | | | | | | | |
| (in millions) | | Ownership Interest | | March 31, 2023 | | December 31, 2022 |
| Nutrabolt | | 29.8 | % | | $ | 885 | | | $ | 874 | |
| | | | | | |
| Tractor | | 19.2 | % | | 48 | | | 49 | |
| Athletic Brewing | | 13.1 | % | | 50 | | | 51 | |
| Dyla LLC | | 12.4 | % | | 12 | | | 12 | |
Force Holdings LLC(1) | | 33.3 | % | | 4 | | | 4 | |
Beverage startup companies(2) | | (various) | | 5 | | | 5 | |
| Other | | (various) | | 5 | | | 5 | |
| Investments in unconsolidated affiliates | | | | $ | 1,009 | | | $ | 1,000 | |
(1)Force Holdings LLC has a 14.1% ownership interest in Dyla LLC.
(2)Beverage startup companies represent equity method investments in development stage entities and may include entities which are pre-revenue, in test markets, or in early operations.
11. Income Taxes
The Company’s effective tax rates were as follows:
| | | | | | | | | | | | | | | | | | |
| | | | First Quarter |
| (in millions) | | | | | | 2023 | | 2022 |
| Effective tax rate | | | | | | 19.6 | % | | 23.5 | % |
The change in the effective tax rate was largely driven by the tax benefit received from favorable adjustments upon foreign tax return filing and excess tax deductions that were generated from the vesting of RSUs during the first quarter of 2023.
KEURIG DR PEPPER INC.
NOTES TO CONDENSED CONSOLIDATED FINANCIAL STATEMENTS
(UNAUDITED, CONTINUED)
10. Investments
The following table summarizes our investments in unconsolidated affiliates:
| | | | | | | | | | | |
| March 31, | | December 31, |
| (in millions) | 2024 | | 2023 |
Nutrabolt(1) | $ | 1,014 | | | $ | 960 | |
| Chobani | 307 | | | 307 | |
| Tractor | 42 | | | 44 | |
| Athletic Brewing | 50 | | | 50 | |
| | | |
| | | |
| Beverage startup companies | 5 | | | 5 | |
| Other | 20 | | | 21 | |
| Investments in unconsolidated affiliates | $ | 1,438 | | | $ | 1,387 | |
(1)We hold a 33.6% interest on an as-converted basis in Nutrabolt, consisting of 30.8% in Class A preferred shares acquired through our December 2022 investment, which are treated as in-substance common stock, and 2.8% in Class B common shares earned through the achievement of certain milestones included in our distribution agreement with Nutrabolt.
11. Income Taxes
Our effective tax rates were as follows:
| | | | | | | | | | | | | | | | | | |
| | | | First Quarter |
| | | | | | 2024 | | 2023 |
| Effective tax rate | | | | | | 23.6 | % | | 19.6 | % |
The change in the effective tax rate was largely driven by a shift in the mix of income from lower tax jurisdictions to higher tax jurisdictions and the unfavorable comparison to the prior year tax benefit received from favorable adjustments upon foreign tax return filing.
12. Accumulated Other Comprehensive Income
The following table provides a summary of changes in AOCI, net of taxes:
| | (in millions) | (in millions) | Foreign Currency Translation Adjustments | | Pension and Post-Retirement Benefit Liabilities | | Cash Flow Hedges | | Accumulated Other Comprehensive Income | (in millions) | Foreign Currency Translation Adjustments | | Pension and Post-Retirement Benefit Liabilities | | Cash Flow Hedges | | Accumulated Other Comprehensive Income |
| | For the first quarter of 2024: | |
| | For the first quarter of 2024: | |
| | For the first quarter of 2024: | |
| Beginning balance | |
| Beginning balance | |
| Beginning balance | |
| Other comprehensive loss | |
| Amounts reclassified from AOCI | |
| Total other comprehensive loss | |
| Balance as of March 31, 2024 | |
| | For the first quarter of 2023: | For the first quarter of 2023: | | | | | | | |
| For the first quarter of 2023: | |
| For the first quarter of 2023: | |
| Beginning balance | |
| Beginning balance | |
| Beginning balance | Beginning balance | $ | (86) | | | $ | (10) | | | $ | 225 | | | $ | 129 | |
| Other comprehensive income (loss) | Other comprehensive income (loss) | 108 | | | — | | | (30) | | | 78 | |
| Amounts reclassified from AOCI | Amounts reclassified from AOCI | — | | | — | | | (52) | | | (52) | |
| Total other comprehensive income (loss) | Total other comprehensive income (loss) | 108 | | | — | | | (82) | | | 26 | |
| Balance as of March 31, 2023 | Balance as of March 31, 2023 | $ | 22 | | | $ | (10) | | | $ | 143 | | | $ | 155 | |
| | For the first quarter of 2022: | |
| Beginning balance | $ | 81 | | | $ | (4) | | | $ | (103) | | | $ | (26) | |
| Other comprehensive income | 99 | | | — | | | 140 | | | 239 | |
| Amounts reclassified from AOCI | — | | | — | | | 2 | | | 2 | |
| Total other comprehensive income | 99 | | | — | | | 142 | | | 241 | |
| Balance as of March 31, 2022 | $ | 180 | | | $ | (4) | | | $ | 39 | | | $ | 215 | |
KEURIG DR PEPPER INC.
NOTES TO CONDENSED CONSOLIDATED FINANCIAL STATEMENTS
(UNAUDITED, CONTINUED)
The following table presents the amount of (gains) losses reclassified from AOCI into the unaudited Condensed Consolidated Statements of Income:
| | | First Quarter |
| | | | | First Quarter | |
| | | | | First Quarter | |
| | | | | First Quarter | |
| (in millions) | (in millions) | Income Statement Caption | | | 2023 | | 2022 | (in millions) | Income Statement Caption | | | | | | 2024 | | 2023 |
| Cash Flow Hedges: | Cash Flow Hedges: | | | | | | |
Interest rate contracts(1) | Interest rate contracts(1) | Interest expense | | | $ | (68) | | | $ | — | |
| FX contracts | Cost of sales | | | — | | | 3 | |
| Total | | | (68) | | | 3 | |
| Income tax (benefit) expense | | | 16 | | | (1) | |
Interest rate contracts(1) | |
Interest rate contracts(1) | |
| | Income tax expense | |
| | Income tax expense | |
| | Income tax expense | |
| Total, net of tax | Total, net of tax | | | $ | (52) | | | $ | 2 | |
(1)Amounts reclassified from AOCI into interest expense during the first quarter of 2023 include the realized gains associated with the termination of forward starting swaps designated as cash flow hedges of approximately $66 million. Refer to Note 4 for additional information on the terminated forward starting swaps.
KEURIG DR PEPPER INC.
NOTES TO CONDENSED CONSOLIDATED FINANCIAL STATEMENTS
(UNAUDITED, CONTINUED)
13. Other Financial Information
SELECTED BALANCE SHEET INFORMATION
The tables below provide selected financial information from the unaudited Condensed Consolidated Balance Sheets:
| | | | March 31, | | December 31, | | March 31, | | December 31, |
| (in millions) | (in millions) | 2023 | | 2022 | (in millions) | 2024 | | 2023 |
| Inventories: | Inventories: | | | |
| Raw materials | |
| Raw materials | |
| Raw materials | Raw materials | $ | 471 | | | $ | 475 | |
| Work-in-progress | Work-in-progress | 9 | | | 8 | |
| Finished goods | Finished goods | 939 | | | 858 | |
| Total | Total | 1,419 | | | 1,341 | |
| Allowance for excess and obsolete inventories | Allowance for excess and obsolete inventories | (28) | | | (27) | |
| Total Inventories | Total Inventories | $ | 1,391 | | | $ | 1,314 | |
| Prepaid expenses and other current assets: | Prepaid expenses and other current assets: | | | |
| Other receivables | Other receivables | $ | 138 | | | $ | 167 | |
| Other receivables | |
| Other receivables | |
| Prepaid income taxes | Prepaid income taxes | 15 | | | 49 | |
| Customer incentive programs | Customer incentive programs | 104 | | | 25 | |
| Derivative instruments | Derivative instruments | 29 | | | 35 | |
| Prepaid marketing | Prepaid marketing | 39 | | | 19 | |
| Spare parts | Spare parts | 94 | | | 89 | |
| | Income tax receivable | |
| Income tax receivable | |
| Income tax receivable | Income tax receivable | 17 | | | 17 | |
| Other | Other | 104 | | | 70 | |
| Total prepaid expenses and other current assets | Total prepaid expenses and other current assets | $ | 540 | | | $ | 471 | |
| Other non-current assets: | Other non-current assets: | | | | Other non-current assets: | | | |
| Operating lease right-of-use assets | Operating lease right-of-use assets | $ | 892 | | | $ | 881 | |
| Customer incentive programs | Customer incentive programs | 40 | | | 46 | |
| Derivative instruments | Derivative instruments | 39 | | | 140 | |
| Equity securities(1) | Equity securities(1) | 59 | | | 48 | |
| Equity securities without readily determinable fair values | 1 | | | 1 | |
Equity securities(1) | |
Equity securities(1) | |
| | Other | |
| | Other | |
| | Other | Other | 129 | | | 136 | |
| Total other non-current assets | Total other non-current assets | $ | 1,160 | | | $ | 1,252 | |
(1)Fair values of these equity securities are determined using quoted market prices from daily exchange traded markets, based on the closing price as of the balance sheet date, and are classified as Level 1. Unrealized mark-to marketmark-to-market gains and losses are recorded to Other (income) expense,income, net. For the first quarter of 2024 and 2023, and 2022, the Companywe recorded an unrealized mark-to-market gainlosses of $2 million and gains of $8 million, and loss of $3 million, respectively, on itsour investment in Vita Coco.
KEURIG DR PEPPER INC.
NOTES TO CONDENSED CONSOLIDATED FINANCIAL STATEMENTS
(UNAUDITED, CONTINUED)
| | | | March 31, | | December 31, | | March 31, | | December 31, |
| (in millions) | (in millions) | 2023 | | 2022 | (in millions) | 2024 | | 2023 |
| Accrued expenses: | Accrued expenses: | | | |
| Accrued customer trade | Accrued customer trade | $ | 352 | | | $ | 429 | |
| Accrued customer trade | |
| Accrued customer trade | |
| Accrued compensation | Accrued compensation | 127 | | | 246 | |
| Insurance reserve | Insurance reserve | 39 | | | 53 | |
| Accrued interest | Accrued interest | 152 | | | 76 | |
| Accrued professional fees | 9 | | | 7 | |
| | Other accrued expenses | |
| Other accrued expenses | |
| Other accrued expenses | Other accrued expenses | 367 | | | 342 | |
| Total accrued expenses | Total accrued expenses | $ | 1,046 | | | $ | 1,153 | |
| Other current liabilities: | Other current liabilities: | | | |
| Dividends payable | |
| Dividends payable | |
| Dividends payable | Dividends payable | $ | 282 | | | $ | 281 | |
| Income taxes payable | Income taxes payable | 110 | | | 87 | |
| Operating lease liability | Operating lease liability | 105 | | | 100 | |
| Finance lease liability | Finance lease liability | 95 | | | 95 | |
| Derivative instruments | Derivative instruments | 80 | | | 112 | |
| | Other | Other | 15 | | | 10 | |
| Other | |
| Other | |
| Total other current liabilities | Total other current liabilities | $ | 687 | | | $ | 685 | |
| Other non-current liabilities: | Other non-current liabilities: | | | |
| Operating lease liability | |
| Operating lease liability | |
| Operating lease liability | Operating lease liability | $ | 810 | | | $ | 803 | |
| Finance lease liability | Finance lease liability | 611 | | | 618 | |
| Pension and post-retirement liability | Pension and post-retirement liability | 38 | | | 37 | |
| Insurance reserves | Insurance reserves | 70 | | | 69 | |
| | Derivative instruments | Derivative instruments | 126 | | | 195 | |
| | Derivative instruments | |
| | Derivative instruments | |
| Deferred compensation liability | Deferred compensation liability | 32 | | | 30 | |
| Other | Other | 76 | | | 73 | |
| Total other non-current liabilities | Total other non-current liabilities | $ | 1,763 | | | $ | 1,825 | |
ACCOUNTS PAYABLE
KDP hasWe have agreements with third party administrators which allow participating suppliers to track our payment obligations, from KDP, and, if voluntarily elected by the supplier, to sell our payment obligations from KDP to financial institutions. Suppliers can sell one or more of KDP'sour payment obligations, at their sole discretion, and theour rights and obligations of KDP to itsour suppliers, including amounts due and scheduled payment terms, are not impacted. KDP hasWe have no economic interest in a supplier’s decision to enter into these agreements and no direct financial relationship with the financial institutions. KDP's obligations to its suppliers, including amounts due and scheduled payment terms, are not impacted. The amount of the outstandingOutstanding obligations confirmed as valid included in accounts payable as of March 31, 20232024 and December 31, 2022 was $3,9032023 were $1,999 million and $4,113$2,389 million, respectively.
KEURIG DR PEPPER INC.
NOTES TO CONDENSED CONSOLIDATED FINANCIAL STATEMENTS
(UNAUDITED, CONTINUED)
14. Commitments and Contingencies
KDP is occasionally subject to litigation or other legal proceedings. Reserves are recorded for specific legal proceedings when the Company determines that the likelihood of an unfavorable outcome is probable and the amount of loss can be reasonably estimated. As of March 31, 2023 and December 31, 2022, the CompanyWe had litigation reserves of $18$8 million and $12 million, respectively. KDP hasrespectively, as of March 31, 2024 and December 31, 2023. We have also identified certain other legal matters where we believe an unfavorable outcome is reasonably possible and/or for which no estimate of possible losses can be made. The Company doesWe do not believe that the outcome of these, or any other, pending legal matters, individually or collectively, will have a material adverse effect on theour results of operations, financial condition, or liquidity of KDP.liquidity.
ANTITRUST LITIGATION
In February 2014, TreeHouse Foods, Inc. and certain affiliated entities filed suit against KDP’s wholly-owned subsidiary, Keurig (formerly known as Green Mountain Coffee Roasters, Inc.), in the U.S. District Court for the Southern District of New York (“SDNY”) (TreeHouse Foods, Inc. et al. v. Green Mountain Coffee Roasters, Inc. et al.). The TreeHouse complaint asserted claims under the federal antitrust laws and various state laws, contending that Keurig had monopolized alleged markets for single serve coffee brewers and single serve coffee pods. The TreeHouse complaint sought treble monetary damages, declaratory relief, injunctive relief and attorneys’ fees. In March 2014, JBR, Inc. filed suit against Keurig in the U.S. District Court for the Eastern Districtmonths that followed, a number of Californiaadditional actions, including claims from another coffee manufacturer (JBR, Inc. v. Keurig Green Mountain, Inc.). The, as well as putative class actions on behalf of direct and indirect purchasers of Keurig’s products, were filed in various federal district courts, asserting claims asserted and seeking relief sought in the JBR complaint were substantially similar to the claims asserted and relief sought in the TreeHouse complaint.
Beginning in 2014, a number of putative class Additional similar actions asserting similar claims and seeking similar relief to the matters described above were filed on behalf of purportedby individual direct purchasers (including McLane Company, Inc., BJ’s Wholesale Club, Inc., Winn-Dixie Stores Inc. and Bi-Lo Holding LLC) in 2019 and in 2021. All of Keurig’s products in various federal district courts. In June 2014, these various actions including the TreeHouse and JBR suits, were transferred to a single judicial districtthe SDNY for coordinated pre-trial proceedings (the “Multidistrict Antitrust Litigation”). A consolidated putative class action complaint by direct purchaser plaintiffs was filed in July 2014. In January 2019, McLane Company, Inc. filed suit against Keurig (McLane Company, Inc. v. Keurig Green Mountain, Inc.) in the SDNY asserting similar claims and was also transferred into the Multidistrict Antitrust Litigation. These actions are now pending in the SDNY (In re: Keurig Green Mountain Single-Serve Coffee Antitrust Litigation). Discovery in the Multidistrict (the “Multidistrict Antitrust Litigation concluded in 2021, with plaintiffs collectively claiming more than $5 billion of monetary damages. Keurig strongly disputes the merits of the claims and the calculation of damages. As a result, Keurig has fully briefed a summary judgment motion that, if successful, would end the cases entirely. Keurig has also fully briefed other significant motions, including challenges to the validity of plaintiffs’ damages calculations. Keurig is also pursuing its opposition to direct purchaser plaintiffs’ motion for class certification.Litigation”).
In July 2021, BJ’s Wholesale Club, Inc. filed suit against Keurig (BJ’s Wholesale Club, Inc. v. Keurig Green Mountain, Inc.) in the U.S. District Court for the Eastern District of New York (“EDNY”) asserting similar claims and also was transferred into the Multidistrict Antitrust Litigation. In August 2021, Winn-Dixie Stores, Inc. and Bi-Lo Holding LLC filed suit against Keurig (Winn-Dixie Stores, Inc. et al. v. Keurig Green Mountain, Inc. et al.) in the EDNY asserting similar claims and was also transferred into the Multidistrict Antitrust Litigation. These cases remain in the early stages of discovery.
A number of putative class actions asserting similar claims and seeking similar relief were previously filed on behalf of purported indirect purchasers of Keurig’s products. In July 2020, Keurig reached an agreement with one of the plaintiff groups in the Multidistrict Antitrust Litigation, the putative indirect purchaser class, plaintiffs in the Multidistrict Antitrust Litigation to settle the claims asserted for $31 million. The settlement class consistsconsisted of individuals and entities in the United States that purchased, from persons other than Keurig and not for purposes of resale, Keurig manufactured or licensed single serve beverage portion packs during the applicable class period (beginning in September 2010 for most states). The court granted preliminary approval of the settlement in December 2020,was approved and the Company paid, the settlement amount in January 2021. In June 2021, the Court granted final approval of the settlement, entered final judgment, and dismissed the indirect purchasers’ claims.claims have been dismissed.
Separate fromDiscovery in all remaining matters pending in the U.S. actions described above,Multidistrict Antitrust Litigation is concluded, with the plaintiffs collectively claiming more than $5 billion of monetary damages. Keurig strongly disputes the merits of the claims and the calculation of damages. As a statementresult, Keurig has fully briefed summary judgment motions that, if successful, would end the cases entirely. Keurig has also fully briefed other significant motions, including challenges to the validity of claim was filedplaintiffs’ damages calculations. Keurig is also pursuing its opposition to direct purchaser plaintiffs’ motion for class certification. Certain of Keurig’s motions and opposition have been pending in September 2014 against Keurig and Keurig Canada Inc. in Ontario, Canada, by Club Coffee L.P., a Canadian manufacturer of single serve beverage pods, asserting a breach of competition law and false and misleading statements by Keurig. To date, this plaintiff has not taken substantive action to prosecute its claims.the SDNY since 2021, with others pending since 2023.
KDPKeurig intends to continue vigorously defenddefending the remaining lawsuits described above.lawsuits. At this time, the Company iswe are unable to predict the outcome of these lawsuits, the potential loss or range of loss, if any, associated with the resolution of these lawsuits or any potential effect they may have on the Companyus or itsour results of operations. Accordingly, the Company haswe have not accrued for a loss contingency. Additionally, as the timelines in these cases may be beyond our control, we cannot assure you ifcan provide no assurance as to whether or when there will be material developments in these matters.
KEURIG DR PEPPER INC.
NOTES TO CONDENSED CONSOLIDATED FINANCIAL STATEMENTS
(UNAUDITED, CONTINUED)
15. Transactions with Variable Interest EntitiesRestructuring
TRANSACTIONS WITH VEYRON SPEsRESTRUCTURING PROGRAMS
The Company has a number2023 CEO Succession and Associated Realignment
In 2023, we began to enact several organization movements to ensure succession plans, to reinforce enterprise capabilities to support growth, and to control costs. A key component of leasing arrangements and one licensing arrangement with special purpose entities associatedthe program was the appointment of Tim Cofer as Chief Operating Officer, effective November 6, 2023, with the same sponsor, whichexpectation that Mr. Cofer will succeed Robert Gamgort as our CEO during the second quarter of 2024. We are referredalso realigning our executive and operating leadership structure to as the Veyron SPEs.enable faster decision making and to better support various strategic initiatives. The Veyron SPEs are VIEs for which KDPprogram is not the primary beneficiary, as KDP has limited power based on the contractual agreements to direct the activities that most significantly impact the VIEs’ performance.
Leasing Arrangements
As of March 31, 2023, the Company has entered into sixteen lease transactions with the Veyron SPEs, fifteen of which were associated with asset sale-leaseback transactions. Refer to Note 5 for additional information about the current period asset sale-leaseback transaction. Each lease has a RVG based on a percentage of Veyron SPEs’s purchase price; however, the Company concluded it was not probable that the Company will owe an amount at the end of each individual lease term, as the fair values of the properties are not expected to fall below the RVGs at the endincur charges of each individual lease term. As such, the Company recorded each lease obligation excluding the associated RVG. The aggregate maximum undiscounted RVG associated with the leasing arrangements as of March 31, 2023 and December 31, 2022 were $653approximately $52 million, and $650 million, respectively. This aggregate maximum value assumes that the fair value of each property at the end of either the original lease term or renewal term is equal to zero,primarily driven by severance costs, which the Company has concluded is not probable.
The following table provides the carrying amounts of the right-to-use assets and lease obligations recorded on the Company’s Consolidated Balance Sheets associated with these leasing arrangements related to the VIEs as of March 31, 2023 and December 31, 2022.
| | | | | | | | | | | | | | |
| (in millions) | | March 31, 2023(1) | | December 31, 2022(2) |
| Non-current assets | | $ | 430 | | | $ | 430 | |
| Current liabilities | | 22 | | | 22 | |
| Non-current liabilities | | 419 | | | 419 | |
(1)The leasing agreements included as of March 31, 2023 include nine manufacturing sites, five distribution centers and our Frisco, Texas headquarters.
(2)The leasing agreements included as of December 31, 2022 include nine manufacturing sites, four distribution centers and our Frisco, Texas headquarters.
Licensing Arrangement
ABC, a wholly-owned subsidiary of KDP, has provided a guarantee in connection with its distribution agreement with the Veyron SPEs to be paid only in the event the Veyron SPEs sell specific distribution rights and the value of those distribution rights does not exceed $142 million, which is the maximum undiscounted amount that KDP could pay under the guarantee. All obligations with respect to the guarantee will cease upon termination of the distribution agreement, which would occur upon notice by ABC not to renew the distribution agreement, KDP no longer being investment grade at the end of the term, or the sale of the distribution rights by the Veyron SPEs. As of March 31, 2023, KDP has not recorded a liability as it is not probable that the Company will have to make any payments required under the residual value guarantee, as the fair value of the distribution rights is not expected to fall below $142 million over the term of the agreement.
As of March 31, 2023, KDP had $98 million in fixed service fee commitments related to the 15-year distribution agreement which was effective on December 28, 2020, with Veyron SPEs. These commitments were used to assist the Veyron SPEs in obtaining financing. Such fixed service fee payments began on January 1, 2021.
Fixed service fees over the next five years are expected to be incurred through 2024, and the sign-on bonus for Mr. Cofer as our new Chief Operating Officer.
2024 Network Optimization
In March 2024, we announced the closure of our manufacturing facility in Williston, Vermont, with operations and employees to be relocated to other existing manufacturing locations, in order to more effectively and efficiently meet the needs of consumers and customers. The relocation is expected to take place during the second and third quarters of 2024, and the restructuring program is expected to incur pre-tax restructuring charges in an estimated range of $30 million to$40 million, primarily comprised of asset related costs.
RESTRUCTURING CHARGES
Restructuring and integration expenses for the defined programs during the periods presented were as follows:
| | | |
| | | Remainder of 2023 | | For the Years Ending December 31, | | | First Quarter |
| (in millions) | (in millions) | | 2024 | | 2025 | | 2026 | | 2027 | | 2028 | (in millions) | | | | | 2024 | | 2023 |
| Fixed service fees | $ | 5 | | | $ | 8 | | | $ | 8 | | | $ | 7 | | | $ | 8 | | | $ | 8 | |
| 2023 CEO Succession and Associated Realignment | |
| 2024 Network Optimization | |
|
KEURIG DR PEPPER INC.
NOTES TO CONDENSED CONSOLIDATED FINANCIAL STATEMENTS
(UNAUDITED, CONTINUED)
TRANSACTION WITH NUTRABOLT
The Company has a preferred equity investment in Nutrabolt, which will earn the greater of (i) a 5% annual coupon on the preferred equity units plus any accretion for amounts not yet paid or (ii) KDP’s share of Nutrabolt’s earnings as if KDP’s preferred equity was converted into common units. As the other investors of Nutrabolt have to share in Nutrabolt's earnings with KDP if in excess of the 5% annual coupon, the other investors lack certain characteristics of a controlling financial interest, which qualifies Nutrabolt as a VIE. KDP is not the primary beneficiary of the VIE and therefore is not required to consolidate Nutrabolt, as the primary shareholder of the VIE has control over the board and decision-making for the activities that most significantly impact the VIE’s economic performance, including sales, marketing, and operations. KDP has no obligation to provide additional funding to Nutrabolt, and thus the Company’s maximum exposure and risk of loss related to Nutrabolt is limited to the carrying value of KDP’s investment. Refer to Note 10 for the carrying value of the Company’s investment in Nutrabolt.
16. Restructuring LiabilitiesRESTRUCTURING LIABILITIES
Restructuring liabilities that qualify as exit and disposal costs under U.S. GAAP are included in accounts payable and accrued expenses on the unaudited condensed consolidated financial statements. Restructuring liabilities, primarily consisting of workforce reduction costs, were as follows:
| | | | | | | | | |
| (in millions) | Restructuring Liabilities | | | | |
Balance as of January 1, 20232024 | $ | 5527 | | | | | |
| Charges (credits) to expense | —(3) | | | | | |
| Cash payments | (29)(3) | | | | | |
| | | | | |
Balance as of March 31, 20232024 | $ | 2621 | | | | | |
16. Transactions with Related Parties
REPURCHASE OF KDP COMMON STOCK
In March 2024, JAB BevCo B.V., a subsidiary of JAB, sold 100 million shares of KDP’s common stock through an underwritten secondary offering. In connection with this offering, we repurchased 35 million shares at the per-share price paid by the underwriter, for a total of $1,012 million, which was effected under our existing share repurchase program.
ITEM 2. Management's Discussion and Analysis of Financial Condition and Results of Operations
The following discussion should be read in conjunction with our audited consolidated financial statements and notes thereto in our Annual Report.
This Quarterly Report on Form 10-Q contains forward-looking statements within the meaning of Section 27A of the Securities Act of 1933, as amended, and Section 21E of the Exchange Act, including, in particular, statements about the impact of the global COVID-19 pandemic, inflation, future events, future financial performance, plans (including our executive succession plan), strategies, expectations, prospects, competitive environment, regulation, labor matters, supply chain issues, inflation, and availability of raw materials. Forward-looking statements include all statements that are not historical facts and can be identified by the use of forward-looking terminology such as “outlook,” “guidance,” “anticipate,” “expect,” “believe,” “could,” “estimate,” “feel,” “forecast,” “intend,” “may,” “plan,” “potential,” “project,” “should,” “target,” “will,” “would,” and similar words, phrases or expressions and variations or negatives of these words in this Quarterly Report on Form 10-Q. We have based these forward-looking statements on our current views with respect to future events and financial performance. Our actual financial performance could differ materially from those projected in the forward-looking statements due to the inherent uncertainty of estimates, forecasts and projections, and our financial performance may be better or worse than anticipated. Given these uncertainties, you should not put undue reliance on any forward-looking statements. All of the forward-looking statements are qualified in their entirety by reference to the factors discussed under "Risk Factors" in Part I, Item 1A of our Annual Report, as well as our subsequent filings with the SEC. Forward-looking statements represent our estimates and assumptions only as of the date that they were made. We do not undertake any duty to update the forward-looking statements, and the estimates and assumptions associated with them, after the date of this Quarterly Report on Form 10-Q, except to the extent required by applicable securities laws.
This Quarterly Report on Form 10-Q contains the names of some of our owned or licensed trademarks, trade names and service marks, which we refer to as our brands. All of the product names included in this Quarterly Report on Form 10-Q are either our registered trademarks or those of our licensors.
OVERVIEW
KDP is a leading beverage company in North America with a diverse portfolio of LRBs, including flavored (non-cola) CSDs, water (enhancedthat manufactures, markets, distributes, and flavored), ready-to-drink teasells hot and coffee, juice, juice drinks, mixerscold beverages and specialty coffee, and is a leading producer of innovative single serve brewing systems. WithWe have a wide rangebroad portfolio of hot and cold beverages that meet virtually any consumer need, our keyiconic beverage brands, include Keurig,including Dr Pepper, Canada Dry, Mott's, A&W, Snapple, Mott's, Clamato, Core,Peñafiel, 7UP, Green Mountain Coffee Roasters, Core Hydration, and The Original Donut Shop. We haveShop, as well as the Keurig brewing system. KDP has some of the most recognized beverage brands in North America, with significant consumer awareness levels and long histories that evoke strong emotional connections with consumers. We offer more than 125 owned, licensed, and partner brands, including the top ten best-selling coffee brands and Dr Pepper as a leading flavored CSD in the U.S., according to IRi, which are available nearly everywhere people shop and consume beverages.beverages through our sales and distribution network.
KDP operates as an integrated brand owner, manufacturer, and distributor. We believe our integrated business model strengthens our route-to-market and provides opportunities for net sales and profit growth through the alignment of the economic interests of our brand ownership and our manufacturing and distribution businesses through both our DSD system and our WD systems. KDP marketssystem. We market and sells itssell our products to retailers, including supermarkets, mass merchandisers, club stores, pure-play e-commerce retailers, and office superstores, vending machines, grocery and drug stores, and convenience stores;superstores; to restaurants, hotel chains, office product and coffee distributors, and partner brand owners; and directly to consumers through its websites.our website. Our integrated business model enables us to be more flexible and responsive to the changing needs of our large retail customers and allows us to more fully leverage our scale and reduce costs by creating greater geographic manufacturing and distribution coverage.
Effective January 1, 2023, the Company revised its segment structure to align with how the Company’s Chief Operating Decision Maker manages the business, assesses performanceOur operating and allocates resources. The Company's reportable segments consist of the following:are as follows:
•The U.S. Refreshment Beverages segment reflects sales in the U.S. from the manufacture and distribution of branded concentrates, syrup and finished beverages, including the sales of the Company's own brands and third-party brands, to third-party bottlers, distributors and retailers.
•The U.S. Coffee segment reflects sales in the U.S. from the manufacture and distribution of finished goods relating to the Company's K-Cup pods, single-serve brewers and other coffee products to partners, retailers and directly to consumers through our Keurig.com website.
•The International segment reflects sales in international markets, including the following:
◦Sales in Canada, Mexico, the Caribbean, and other international markets from the manufacture and distribution of branded concentrates, syrup, and finished beverages, including sales of the Company's own brands and third-party brands, to third-party bottlers, distributors, and retailers.
◦Sales in Canada from the manufacture and distribution of finished goods relating to the Company’s single-serve brewers, K-Cup pods, and other coffee products.
COMPARABLE RESULTS OF OPERATIONS
Management believes that there are certain non-GAAP financial measures that allow management to evaluate our results, trends and ongoing performance on a comparable basis. In order to derive the adjusted financial information, we adjust certain financial statement captions and metrics prepared under U.S. GAAP for certain items affecting comparability and the impact of foreign currency. See Non-GAAP Financial Measures for further information.
EXECUTIVE SUMMARY
Financial Overview - First Quarter of 2023 as compared to First Quarter of 2022
As Reported, in millions (except EPS)
As Adjusted, in millions (except EPS)
RESULTS OF OPERATIONS
We eliminate from our financial results all applicable intercompany transactions between entities included in our consolidated financial statements and the intercompany transactions with our equity method investees.
References in the financial tables below to percentage changes that are not meaningful are denoted by "NM".
EXECUTIVE SUMMARY
Financial Overview - First Quarter of 2024 as compared to First Quarter of 2023
As Reported, in millions (except EPS)
Key Events During the First Quarter of 2024
March 2024 Debt Issuance
In March 2024, we completed the issuance of an aggregate principal amount of $3 billion of senior unsecured notes. The proceeds were used to repay the 2024 Notes at maturity, to repurchase KDP shares as described below, to repay outstanding commercial paper, and for general corporate purposes.
Repurchase of KDP Shares
In March 2024, JAB BevCo B.V., a subsidiary of JAB, sold 100 million shares of KDP’s common stock through an underwritten secondary offering. In connection with this offering, we repurchased 35 million shares at the per-share price paid by the underwriter, for a total of $1,012 million, which was effected under our existing share repurchase program.
RESULTS OF OPERATIONS
First Quarter of 2024 Compared to First Quarter of 20222023
Consolidated Operations
The following table sets forth our unaudited condensed consolidated results of operations for the first quarter of 20232024 and 2022:2023:
| | | | First Quarter | | Dollar | | Percentage | | First Quarter | | Dollar Change | | Percentage Change |
| ($ in millions, except per share amounts) | ($ in millions, except per share amounts) | 2023 | | 2022 | | Change | | Change |
| Net sales | |
| Net sales | |
| Net sales | Net sales | $ | 3,353 | | | $ | 3,078 | | | $ | 275 | | | 8.9 | % | $ | 3,468 | | | $ | | $ | 3,353 | | | $ | | $ | 115 | | | 3.4 | | 3.4 | % |
| Cost of sales | Cost of sales | 1,609 | | | 1,428 | | | 181 | | | 12.7 | |
| Gross profit | Gross profit | 1,744 | | | 1,650 | | | 94 | | | 5.7 | |
| Selling, general and administrative expenses | Selling, general and administrative expenses | 1,165 | | | 1,018 | | | 147 | | | 14.4 | |
| | Gain on litigation settlement | — | | | (299) | | | 299 | | | NM |
| | Other operating income, net | |
| | Other operating income, net | |
| | Other operating income, net | Other operating income, net | (5) | | | (35) | | | 30 | | | NM | (1) | | | (5) | | (5) | | | 4 | | 4 | | | NM | | NM |
| Income from operations | Income from operations | 584 | | | 966 | | | (382) | | | (39.5) | |
| Interest expense | Interest expense | 23 | | | 188 | | | (165) | | | (87.8) | | Interest expense | 178 | | | 23 | | 23 | | | 155 | | 155 | | | NM | | NM |
| Loss on early extinguishment of debt | — | | | 48 | | | (48) | | | NM |
| Gain on sale of equity method investment | — | | | (50) | | | 50 | | | NM |
| Impairment of investments and note receivable | — | | | 6 | | | (6) | | | NM |
| Other (income) expense, net | (20) | | | 9 | | | (29) | | | NM |
| | Other income, net | |
| | Other income, net | |
| | Other income, net | | (7) | | | (20) | | | 13 | | | NM |
| Income before provision for income taxes | Income before provision for income taxes | 581 | | | 765 | | | (184) | | | (24.1) | |
| Provision for income taxes | Provision for income taxes | 114 | | | 180 | | | (66) | | | (36.7) | |
| Net income including non-controlling interest | 467 | | | 585 | | | (118) | | | (20.2) | |
| Less: Net loss attributable to non-controlling interest | — | | | — | | | — | | | NM |
| Net income attributable to KDP | $ | 467 | | | $ | 585 | | | (118) | | | (20.2) | |
| Net income | |
| | Earnings per common share: | |
| Earnings per common share: | |
| Earnings per common share: | Earnings per common share: | | | | | | | | | | | | |
| Basic | Basic | $ | 0.33 | | | $ | 0.41 | | | $ | (0.08) | | | (19.5) | % | Basic | $ | 0.33 | | | $ | | $ | 0.33 | | | $ | | $ | — | | | — | | — | % |
| Diluted | Diluted | 0.33 | | | 0.41 | | | (0.08) | | | (19.5) | |
| | Gross margin | Gross margin | 52.0 | % | | 53.6 | % | | (160) bps |
| Gross margin | |
| Gross margin | | 55.9 | % | | 52.0 | % | | | | 390 bps |
| Operating margin | Operating margin | 17.4 | % | | 31.4 | % | | NM | Operating margin | 22.1 | % | | 17.4 | % | | | | 470 bps |
| Effective tax rate | Effective tax rate | 19.6 | % | | 23.5 | % | | (390) bps | Effective tax rate | 23.6 | % | | 19.6 | % | | | | 400 bps |
Sales Volume. The following table provides the percentage change in sales volumesvolume compared to the prior year period:
| | | | | | | | |
| | Percentage Change |
| LRB | | 0.8 (0.7) | % |
| K-Cup pods | | (0.6) | |
BrewersAppliances | | (25.7)21.7 | |
Net Sales. Net sales increased $275$115 million, or 8.9%3.4%, to $3,353$3,468 million for the first quarter of 20232024 compared to $3,078$3,353 million in the prior year period. This performance reflected favorable net price realization across all segments totaling 9.9%(3.1%) and favorable FX translation (0.6%), slightly offset by unfavorable volume/mix of 1.0%(0.3%).
Gross Profit. Gross profit increased $94$196 million, or 5.7%11.2%, to $1,744$1,940 million for the first quarter of 20232024 compared to $1,650$1,744 million in the prior year period. This performance primarily reflected the benefitsimpact to gross profit of the strong growth in net sales growth(6 percentage points), the benefit from the earned equity from the achievement of milestones associated with certain distribution agreements (3 percentage points), and a net benefit from changes in ingredients, materials, and productivity partially offset by broad-based inflation, and an unfavorable change in unrealized commodity mark-to-market activity.(2 percentage points). Gross margin decreased 160increased 390 bps versus the year ago period to 52.0%.
Selling, General and Administrative Expenses.SG&A expenses increased $147 million, or 14.4%, to $1,165 million for the first quarter of 2023 compared to $1,018 million in the prior year period. The increase was driven by broad-based inflation, an unfavorable comparison to the stock award forfeiture accounting policy change in the prior year period of $40 million, higher marketing expense and increases in other operating costs.
Gain on Litigation Settlement. Gain on litigation settlement reflected the portion of the settlement payment from BodyArmor which was allocated to the gain on the full settlement of the existing claims against BodyArmor in the first quarter of 2022.
Other Operating Income, net. Other operating income, net decreased $30 million for the first quarter of 2023 compared to the prior year period, primarily driven by a $32 million reduction in year-over-year asset sale-leaseback activity relating to our strategic asset investment program.55.9%.
Income from Operations. Income from operations decreased $382increased $181 million, or 39.5%31.0%, to $584$765 million for the first quarter of 20232024 compared to $966$584 million in the prior year period, primarily driven by unfavorable comparison to the gain on the litigation settlement and on the reduction in asset sale-leaseback activity. Other factors include higher SG&A expenses, partially offset by increased gross profit. Operating margin increased 470 bps from the prior year period to 22.1%.
Interest Expense. Interest expense decreased $165increased $155 million or 87.8%, to $23$178 million for the first quarter of 20232024 compared to $188$23 million for the prior year period, primarily driven by the favorableunfavorable change in unrealized mark-to-market activity of $164 million on interest rate contracts.
Loss on Early Extinguishment of Debt. Loss on early extinguishment of debt reflected a loss of $48 million in the prior year period associated with our 2022 Strategic Refinancing and our early retirement of our 2038 Notes, the 2021 364-Day Credit Agreement and the KDP Revolver.
Gain on Sale of Equity Method Investment. Gain on sale of equity method investment reflected the portion of the settlement paymentcontracts, resulting from BodyArmor in the first quarter of 2022 which was allocated to the satisfaction of the holdback amount owed to us in association with the sale of our equityincreasing interest in BodyArmor in 2021.
Impairment of Investments and Note Receivable.Impairment on investments and note receivable reflected a non-cash impairment charge of $6 million in the first quarter of 2022 associated with the wind-down of Bedford.
Other Non-operating (Income) Expense, net. Other (income) expense, net reflected a favorable change of $29 million from the prior year period, driven by gains on the Company’s investments in equity securities, primarily led by Nutrabolt’s preferred dividend and mark-to-market on our Vita Coco investment.rates.
Effective Tax Rate. The effective tax rate decreased 390increased 400 bps to 19.6%23.6% for the first quarter of 2023,2024, compared to 23.5%19.6% in the prior year period, primarily driven by a shift in the mix of income from lower tax jurisdictions to higher tax jurisdictions (210 bps) and the unfavorable comparison to the prior year tax benefit received from favorable adjustments upon foreign tax return filing and excess tax deductions that were generated from the vesting of RSUs during the first quarter of 2023.(150 bps).
Net Income Attributable to KDP.Income. Net income attributable to KDP decreased $118$13 million, or 20.2%2.8%, to $467$454 million for the first quarter of 20232024 as compared to $585$467 million in the prior year period, primarily driven by lower income from operations and the unfavorable comparison to the gain in the prior year period for the sale of our equity method investment in BodyArmor, partially offset by reducedas increased interest expense the favorable comparison to the loss on extinguishment of debt in the prior year, and the decreaseunfavorable changes in our effective tax rate.rate offset our increased income from operations.
Diluted EPS. Diluted EPS decreased 19.5%was flat relative to the prior year period at $0.33 per diluted share as compared to $0.41 in the prior year period.share.
Results of Operations by Segment
The following tables provide net sales and income from operations for our reportable segments for the first quarter of 20232024 and 2022,2023, as well as the other amounts necessary to reconcile our total segment results to our consolidated results presented in accordance with U.S. GAAP.
| | First Quarter | | | First Quarter |
| (in millions) | (in millions) | First Quarter | (in millions) | 2024 | | 2023 |
| Net sales | Net sales | 2023 | | 2022 |
| U.S. Refreshment Beverages | |
| U.S. Refreshment Beverages | |
| U.S. Refreshment Beverages | U.S. Refreshment Beverages | $ | 2,007 | | | $ | 1,781 | |
| U.S. Coffee | U.S. Coffee | 931 | | | 943 | |
| International | International | 415 | | | 354 | |
| Total net sales | Total net sales | $ | 3,353 | | | $ | 3,078 | |
| | Income from operations | Income from operations | | | |
| Income from operations | |
| Income from operations | | | | |
| U.S. Refreshment Beverages | U.S. Refreshment Beverages | $ | 490 | | | $ | 704 | |
| U.S. Coffee | U.S. Coffee | 232 | | | 255 | |
| International | International | 80 | | | 64 | |
| Unallocated corporate costs | Unallocated corporate costs | (218) | | | (57) | |
| Total income from operations | Total income from operations | $ | 584 | | | $ | 966 | |
U.S. REFRESHMENT BEVERAGES
The following table provides selected information about our U.S. Refreshment Beverages segment's results:
| | | | First Quarter | | Dollar | | Percent | | First Quarter | | Dollar Change | | Percentage Change |
| (in millions) | (in millions) | 2023 | | 2022 | | Change | | Change |
| Net sales | Net sales | $ | 2,007 | | | $ | 1,781 | | | $ | 226 | | | 12.7 | % |
| Net sales | |
| Net sales | | $ | 2,093 | | | $ | 2,007 | | | $ | 86 | | | 4.3 | % |
| Income from operations | Income from operations | 490 | | | 704 | | | (214) | | | (30.4) | |
| Operating margin | Operating margin | 24.4 | % | | 39.5 | % | | (1510) bps | Operating margin | 29.4 | % | | 24.4 | % | | | | 500 bps |
Sales Volume. Sales volumesvolume for the first quarter of 2023 were flat2024 decreased approximately 1.7% compared to the prior year period. Growthperiod, as growth in Dr Pepper, driven by our Strawberries & Cream innovation,Canada Dry and C4 Energy, as a resultcombined with the launch of Electrolit within our recently announced sales and distribution partnership,network, was fullymore than offset by declinessoftness in the remainder of our still portfolio.
Net Sales. Net sales increased 12.7%4.3% to $2,007$2,093 million in the first quarter of 2023,2024, compared to $1,781$2,007 million in the prior year period, driven by favorable net price realization of 12.5% and(5.6%), which was partially offset by unfavorable volume/mix growth of 0.2%(1.3%).
Income from Operations. Income from operations decreased $214increased $125 million, or 30.4%25.5%, to $490$615 million for the first quarter of 20232024 compared to $704$490 million for the prior year period, primarily drivenperiod. This performance was led by the unfavorable comparisonbenefits to the gains on the settlement of litigation with BodyArmor of $271 million and a reduction in year-over-year asset sale-leaseback activity of $32 million for our strategic asset investment program. Other drivers included the benefits ofgross profit from net sales growth (17 percentage points) and earned equity from the achievement of milestones associated with certain distribution agreements (9 percentage points), as well as a net benefit from changes in ingredients, materials, and productivity partially offset by broad-based inflation, higher marketing expense, and increases in other operating costs.(2 percentage points). Operating margin improved 500 bps versus the year ago period to 29.4%.
U.S. COFFEE
The following table provides selected information about our U.S. Coffee segment's results:
| | | | First Quarter | | Dollar | | Percent | | First Quarter | | Dollar Change | | Percentage Change |
| (in millions) | (in millions) | 2023 | | 2022 | | Change | | Change |
| Net sales | Net sales | $ | 931 | | | $ | 943 | | | $ | (12) | | | (1.3) | % |
| Net sales | |
| Net sales | | $ | 911 | | | $ | 931 | | | $ | (20) | | | (2.1) | % |
| Income from operations | Income from operations | 232 | | | 255 | | | (23) | | | (9.0) | |
| Operating margin | Operating margin | 24.9 | % | | 27.0 | % | | (210) bps | Operating margin | 27.2 | % | | 24.9 | % | | | | 230 bps |
Sales Volume. K-Cup pod volume decreased 1.9%1.1% for the first quarter of 20232024 compared to the prior year period, as improvements in our away-from-home business, driven by increasing office occupancy, were more than offset by softness in ourreflecting softer at-home business, driven by higher consumer mobility versus the prior year period. Brewercoffee category trends. Appliance volume decreased 29.0%increased 26.1% in the first quarter of 2023,2024, driven by retailer inventory shifts and category softness in small appliances.Keurig market share momentum.
Net Sales. Net sales decreased 1.3%2.1% to $931$911 million for the first quarter of 20232024 compared to $943$931 million in the prior year period, driven by unfavorable volume/mix declines of 6.6% partially offset by favorable(1.8%) and net price realization of 5.3%(0.3%).
Income from Operations. Income from operations decreased $23increased $16 million, or 9.0%6.9%, to $232$248 million for the first quarter of 2023,2024, compared to $255$232 million in the prior year period, asdriven by a result of inflationnet benefit from changes in inputingredients, materials, and productivity (10 percentage points) and reduced costs declines in volume/mix and increases in other operating costs. These decreases wereassociated with productivity projects (6 percentage points), partially offset by the benefitsimpact to gross profit of pricing actions and productivity.the decrease in net sales (8 percentage points). Operating margin declined 210improved 230 bps versus the year ago period to 24.9% due to these inflationary headwinds.27.2%.
INTERNATIONAL
The following table provides selected information about our International segment's results:
| | | | First Quarter | | Dollar | | Percent | | First Quarter | | Dollar Change | | Percentage Change |
| (in millions) | (in millions) | 2023 | | 2022 | | Change | | Change |
| Net sales | Net sales | $ | 415 | | | $ | 354 | | | $ | 61 | | | 17.2 | % |
| Net sales | |
| Net sales | | $ | 464 | | | $ | 415 | | | $ | 49 | | | 11.8 | % |
| Income from operations | Income from operations | 80 | | | 64 | | | 16 | | | 25.0 | |
| Operating margin | Operating margin | 19.3 | % | | 18.1 | % | | 120 bps | Operating margin | 24.1 | % | | 19.3 | % | | | | 480 bps |
Sales Volume. The following table provides the percentage change in sales volumesvolume for the International segment compared to the prior year period:
| | | | | | | | |
| | Percentage Change |
| LRB | | 5.84.0 | % |
| K-Cup pods | | 9.52.8 | |
BrewersAppliances | | 2.5 (4.2) | |
Net Sales. Net sales increased 17.2%11.8% to $415$464 million in the first quarter of 2023,2024, compared to $354$415 million in the prior year period, reflecting volume/mix growth (4.8%), favorable FX translation (4.8%), and higher net price realization of 9.0%, volume/mix growth of 7.7%, and favorable FX translation effects of 0.5%(2.2%).
Income from Operations. Income from operations increased $16$32 million, or 25.0%40.0%, to $80$112 million for the first quarter of 20232024 compared to $64$80 million in the prior year period. This performance reflected the benefitsimpact to gross profit of higher net salesprice realization and volume/mix growth (30 percentage points) and productivity, partially offset by broad-based inflation and higher costs associated with higher volumes.favorable FX impacts (9 percentage points). Operating margin increased 120improved 480 bps versus the year ago period to 19.3%24.1%.
NON-GAAP FINANCIAL MEASURES
To supplement the consolidated financial statements presented in accordance with U.S. GAAP, we have presented for certain constant currency adjusted or adjusted financial measures for the first quarter of 2023 and 2022, which are considered non-GAAP financial measures. The non-GAAP financial measures provided should be viewed in addition to, and not as an alternative for, results prepared in accordance with U.S. GAAP. The non-GAAP financial measures presented may differ from similarly titled non-GAAP financial measures presented by other companies, and other companies may not define these non-GAAP financial measures in the same way. The non-GAAP financial measures are not substitutes for their comparable U.S. GAAP financial measures, such as income from operations, net income, diluted EPS or other measures prescribed by U.S. GAAP, and there are limitations to using non-GAAP financial measures. We use these non-GAAP financial measures, in addition to U.S. GAAP financial measures, to evaluate our operating and financial performance and to compare such performance to that of prior periods and to the performance of our competitors. Additionally, we use these non-GAAP financial measures in making operational and financial decisions and in our budgeting and planning process. We believe that providing these non-GAAP financial measures to investors helps investors evaluate our operating performance, profitability and business trends in a way that is consistent with how management evaluates such performance and consistent with guidance previously provided by us. The non-GAAP measures are defined as follows:
Adjusted: Defined as certain financial statement captions and metrics adjusted for certain items affecting comparability.
Items affecting comparability: Defined as certain items that are excluded for comparison to prior year periods, adjusted for the tax impact as applicable. Tax impact is determined based upon an approximate rate for each item. For each period, management adjusts for (i) the unrealized mark-to-market impact of derivative instruments not designated as hedges in accordance with U.S. GAAP that do not have an offsetting risk reflected within the financial results, as well as the unrealized mark-to-market impact of our Vita Coco investment; (ii) the amortization associated with definite-lived intangible assets; (iii) the amortization of the deferred financing costs associated with the DPS Merger; (iv) the amortization of the fair value adjustment of the senior unsecured notes obtained as a result of the DPS Merger; (v) stock compensation expense and the associated windfall tax benefit attributable to the matching awards made to employees who made an initial investment in KDP; (vi) non-cash changes in deferred tax liabilities related to goodwill and other intangible assets as a result of tax rate or apportionment changes; and (vii) other certain items that are excluded for comparison purposes to prior year periods.
For the first quarter of 2023, the other certain items excluded for comparison purposes include productivity expenses.
For the first quarter of 2022, the other certain items excluded for comparison purposes include (i) restructuring and integration expenses related to significant business combinations; (ii) productivity expenses; (iii) costs related to significant non-routine legal matters, specifically the antitrust litigation; (iv) the loss on early extinguishment of debt related to the redemption of debt; (v) incremental costs to our operations related to risks associated with the COVID-19 pandemic, which were incurred to either maintain the health and safety of our front-line employees or temporarily increase compensation to such employees to ensure essential operations continue during the pandemic; (vi) the gain on the sale of our investment in BodyArmor as a result of the settlement of the associated holdback liability; (vii) the gain on the settlement of our prior litigation with BodyArmor, excluding recoveries of previously incurred litigation expenses which were included in our adjusted results; and (viii) losses recognized with respect to our equity method investment in Bedford as a result of funding our share of their wind-down costs.
Constant currency adjusted: Defined as certain financial statement captions and metrics adjusted for certain items affecting comparability, calculated on a constant currency basis by converting our current period local currency financial results using the prior period foreign currency exchange rates.
For the first quarter of 2023 and 2022, the supplemental financial data set forth below includes reconciliations of adjusted and constant currency adjusted financial measures to the applicable financial measure presented in the unaudited condensed consolidated financial statements for the same period.
KEURIG DR PEPPER INC.
RECONCILIATION OF CERTAIN REPORTED ITEMS TO CERTAIN NON-GAAP ADJUSTED ITEMS
(Unaudited, in millions, except per share and percentages)
| | | | | | | | | | | | | | | | | | | | | | | | | | | | | | | | | | | | | | | | | | | | | | | | | | | |
| | | Cost of sales | | Gross profit | | Gross margin | | Selling, general and administrative expenses | | | | Gain on litigation settlement | | Other operating income, net | | Income from operations | | Operating margin |
| For the First Quarter of 2023 | | | | | | | | | | | | | | | | | | | |
| Reported | | | $ | 1,609 | | | $ | 1,744 | | | 52.0 | % | | $ | 1,165 | | | | | $ | — | | | $ | (5) | | | $ | 584 | | | 17.4 | % |
| Items Affecting Comparability: | | | | | | | | | | | | | | | | | | | |
| Mark to market | | | 14 | | | (14) | | | | | (12) | | | | | — | | | — | | | (2) | | | |
| Amortization of intangibles | | | — | | | — | | | | | (34) | | | | | — | | | — | | | 34 | | | |
| | | | | | | | | | | | | | | | | | | |
| | | | | | | | | | | | | | | | | | | |
| Stock compensation | | | — | | | — | | | | | (5) | | | | | — | | | — | | | 5 | | | |
| | | | | | | | | | | | | | | | | | | |
| Productivity | | | (38) | | | 38 | | | | | (40) | | | | | — | | | — | | | 78 | | | |
| | | | | | | | | | | | | | | | | | | |
| | | | | | | | | | | | | | | | | | | |
| | | | | | | | | | | | | | | | | | | |
| | | | | | | | | | | | | | | | | | | |
| | | | | | | | | | | | | | | | | | | |
| | | | | | | | | | | | | | | | | | | |
| | | | | | | | | | | | | | | | | | | |
| | | | | | | | | | | | | | | | | | | |
| | | | | | | | | | | | | | | | | | | |
| | | | | | | | | | | | | | | | | | | |
| | | | | | | | | | | | | | | | | | | |
| Adjusted | | | $ | 1,585 | | | $ | 1,768 | | | 52.7 | % | | $ | 1,074 | | | | | $ | — | | | $ | (5) | | | $ | 699 | | | 20.8 | % |
| Impact of foreign currency | | | | | | | — | % | | | | | | | | | | | | 0.1 | % |
| Constant currency adjusted | | | | | | | 52.7 | % | | | | | | | | | | | | 20.9 | % |
| | | | | | | | | | | | | | | | | | | |
| For the First Quarter of 2022 | | | | | | | | | | | | | | | | | | | |
| Reported | | | $ | 1,428 | | | $ | 1,650 | | | 53.6 | % | | $ | 1,018 | | | | | $ | (299) | | | $ | (35) | | | $ | 966 | | | 31.4 | % |
| Items Affecting Comparability: | | | | | | | | | | | | | | | | | | | |
| Mark to market | | | 59 | | | (59) | | | | | 26 | | | | | — | | | — | | | (85) | | | |
| Amortization of intangibles | | | — | | | — | | | | | (34) | | | | | — | | | — | | | 34 | | | |
| | | | | | | | | | | | | | | | | | | |
| | | | | | | | | | | | | | | | | | | |
| Stock compensation | | | — | | | — | | | | | 7 | | | | | — | | | — | | | (7) | | | |
| Restructuring and integration costs | | | — | | | — | | | | | (33) | | | | | — | | | (3) | | | 36 | | | |
| Productivity | | | (28) | | | 28 | | | | | (22) | | | | | — | | | — | | | 50 | | | |
| | | | | | | | | | | | | | | | | | | |
| | | | | | | | | | | | | | | | | | | |
| | | | | | | | | | | | | | | | | | | |
| Non-routine legal matters | | | — | | | — | | | | | (4) | | | | | — | | | — | | | 4 | | | |
| COVID-19 | | | (4) | | | 4 | | | | | (1) | | | | | — | | | — | | | 5 | | | |
| Gain on litigation | | | — | | | — | | | | | — | | | | | 271 | | | — | | | (271) | | | |
| | | | | | | | | | | | | | | | | | | |
| | | | | | | | | | | | | | | | | | | |
| | | | | | | | | | | | | | | | | | | |
| | | | | | | | | | | | | | | | | | | |
| | | | | | | | | | | | | | | | | | | |
| Adjusted | | | $ | 1,455 | | | $ | 1,623 | | | 52.7 | % | | $ | 957 | | | | | $ | (28) | | | $ | (38) | | | $ | 732 | | | 23.8 | % |
Refer to page 35 for reconciliations of reported net sales to constant currency net sales and adjusted income from operations to constant currency adjusted income from operations.33
KEURIG DR PEPPER INC.
RECONCILIATION OF CERTAIN REPORTED ITEMS TO CERTAIN NON-GAAP ADJUSTED ITEMS
(Unaudited, in millions, except per share and percentages)
| | | | | | | | | | | | | | | | | | | | | | | | | | | | | | | | | | | | | | | | | | | | | | | | | | | | | | | | | | | |
| Interest expense | | Loss on early extinguishment of debt | | Gain on sale of equity method investment | | Impairment of investments and note receivable | | Other (income) expense, net | | Income before provision for income taxes | | Provision for income taxes | | Effective tax rate | | Net income attributable to KDP | | Diluted earnings per share |
| For the First Quarter of 2023 | | | | | | | | | | | | | | | | | | | |
| Reported | $ | 23 | | | $ | — | | | $ | — | | | $ | — | | | $ | (20) | | | $ | 581 | | | $ | 114 | | | 19.6 | % | | $ | 467 | | | $ | 0.33 | |
| Items Affecting Comparability: | | | | | | | | | | | | | | | | | | | |
| Mark to market | 93 | | | — | | | — | | | — | | | 9 | | | (104) | | | (29) | | | | | (75) | | | (0.05) | |
| Amortization of intangibles | — | | | — | | | — | | | — | | | — | | | 34 | | | 10 | | | | | 24 | | | 0.02 | |
| | | | | | | | | | | | | | | | | | | |
| Amortization of fair value debt adjustment | (4) | | | — | | | — | | | — | | | — | | | 4 | | | 1 | | | | | 3 | | | — | |
| Stock compensation | — | | | — | | | — | | | — | | | — | | | 5 | | | 2 | | | | | 3 | | | — | |
| | | | | | | | | | | | | | | | | | | |
| Productivity | — | | | — | | | — | | | — | | | — | | | 78 | | | 21 | | | | | 57 | | | 0.04 | |
| | | | | | | | | | | | | | | | | | | |
| | | | | | | | | | | | | | | | | | | |
| | | | | | | | | | | | | | | | | | | |
| | | | | | | | | | | | | | | | | | | |
| | | | | | | | | | | | | | | | | | | |
| | | | | | | | | | | | | | | | | | | |
| | | | | | | | | | | | | | | | | | | |
| | | | | | | | | | | | | | | | | | | |
| | | | | | | | | | | | | | | | | | | |
| | | | | | | | | | | | | | | | | | | |
| | | | | | | | | | | | | | | | | | | |
| Adjusted | $ | 112 | | | $ | — | | | $ | — | | | $ | — | | | $ | (11) | | | $ | 598 | | | $ | 119 | | | 19.9 | % | | $ | 479 | | | $ | 0.34 | |
| Impact of foreign currency | | | | | | | | | | | | | | | 0.3 | % | | | | |
| Constant currency adjusted | | | | | | | | | | | | | | | 20.2 | % | | | | |
| | | | | | | | | | | | | | | | | | | |
| | | | | | | | | | | | | | | | | | | |
| For the First Quarter of 2022 | | | | | | | | | | | | | | | | | | | |
| Reported | $ | 188 | | | $ | 48 | | | $ | (50) | | | $ | 6 | | | $ | 9 | | | $ | 765 | | | $ | 180 | | | 23.5 | % | | $ | 585 | | | $ | 0.41 | |
| Items Affecting Comparability: | | | | | | | | | | | | | | | | | | | |
| Mark to market | (71) | | | — | | | — | | | — | | | (3) | | | (11) | | | (2) | | | | | (9) | | | (0.01) | |
| Amortization of intangibles | — | | | — | | | — | | | — | | | — | | | 34 | | | 9 | | | | | 25 | | | 0.02 | |
| Amortization of deferred financing costs | (1) | | | — | | | — | | | — | | | — | | | 1 | | | — | | | | | 1 | | | — | |
| Amortization of fair value of debt adjustment | (5) | | | — | | | — | | | — | | | — | | | 5 | | | 1 | | | | | 4 | | | — | |
| Stock compensation | — | | | — | | | — | | | — | | | — | | | (7) | | | (1) | | | | | (6) | | | — | |
| Restructuring and integration costs | — | | | — | | | — | | | — | | | — | | | 36 | | | 9 | | | | | 27 | | | 0.02 | |
| Productivity | — | | | — | | | — | | | — | | | — | | | 50 | | | 12 | | | | | 38 | | | 0.03 | |
| | | | | | | | | | | | | | | | | | | |
| Impairment of investment | — | | | — | | | — | | | (6) | | | — | | | 6 | | | — | | | | | 6 | | | — | |
| Loss on early extinguishment of debt | — | | | (48) | | | — | | | — | | | — | | | 48 | | | 11 | | | | | 37 | | | 0.03 | |
| Non-routine legal matters | — | | | — | | | — | | | — | | | — | | | 4 | | | 1 | | | | | 3 | | | — | |
| COVID-19 | — | | | — | | | — | | | — | | | — | | | 5 | | | 1 | | | | | 4 | | | — | |
| Gain on litigation | — | | | — | | | — | | | — | | | — | | | (271) | | | (68) | | | | | (203) | | | (0.14) | |
| Gain on sale of equity-method investment | — | | | — | | | 50 | | | — | | | — | | | (50) | | | (12) | | | | | (38) | | | (0.03) | |
| | | | | | | | | | | | | | | | | | | |
| | | | | | | | | | | | | | | | | | | |
| | | | | | | | | | | | | | | | | | | |
| | | | | | | | | | | | | | | | | | | |
| Adjusted | $ | 111 | | | $ | — | | | $ | — | | | $ | — | | | $ | 6 | | | $ | 615 | | | $ | 141 | | | 22.9 | % | | $ | 474 | | | $ | 0.33 | |
| | | | | | | | | | | | | | | | | | | |
| Change - adjusted | 0.9 | % | | | | | | | | | | | | | | | | 1.1 | % | | 3.0 | % |
| Impact of foreign currency | — | % | | | | | | | | | | | | | | | | (0.5) | % | | — | % |
| Change - constant currency adjusted | 0.9 | % | | | | | | | | | | | | | | | | 0.6 | % | | 3.0 | % |
Diluted earnings per common share may not foot due to rounding.
34
KEURIG DR PEPPER INC.
RECONCILIATION OF CERTAIN REPORTED SEGMENT MEASURES
TO CERTAIN NON-GAAP ADJUSTED AND CURRENCY NEUTRAL ADJUSTED SEGMENT MEASURES
(Unaudited)
| | | | | | | | | | | | | | | | | |
| (in millions) | Reported | | Items Affecting Comparability | | Adjusted |
| For the first quarter of 2023: | | | | | |
| Income from operations | | | | | |
| U.S. Refreshment Beverages | $ | 490 | | | $ | 18 | | | $ | 508 | |
| U.S. Coffee | 232 | | | 53 | | | 285 | |
| International | 80 | | | 4 | | | 84 | |
| Unallocated corporate costs | (218) | | | 40 | | | (178) | |
| Total income from operations | $ | 584 | | | $ | 115 | | | $ | 699 | |
| | | | | |
| For the first quarter of 2022: | | | | | |
| Income from operations | | | | | |
| U.S. Refreshment Beverages | $ | 704 | | | $ | (249) | | | $ | 455 | |
| U.S. Coffee | 255 | | | 46 | | | 301 | |
| International | 64 | | | 7 | | | 71 | |
| Unallocated corporate costs | (57) | | | (38) | | | (95) | |
| Total income from operations | $ | 966 | | | $ | (234) | | | $ | 732 | |
| | | | | | | | | | | | | | | | | | | | |
| | Reported | | Impact of Foreign Currency | | Constant Currency |
| For the first quarter of 2023: | | | | | | |
| Net sales | | | | | | |
| U.S. Refreshment Beverages | | 12.7 | % | | — | % | | 12.7 | % |
| U.S. Coffee | | (1.3) | | | — | | | (1.3) | |
| International | | 17.2 | | | (0.5) | | | 16.7 | |
| Total net sales | | 8.9 | | | — | | | 8.9 | |
| | | | | | | | | | | | | | | | | | | | |
| | Adjusted | | Impact of Foreign Currency | | Constant Currency Adjusted |
| For the first quarter of 2023: | | | | | | |
| Income from operations | | | | | | |
| U.S. Refreshment Beverages | | 11.6 | % | | — | % | | 11.6 | % |
| U.S. Coffee | | (5.3) | | | — | | | (5.3) | |
| International | | 18.3 | | | — | | | 18.3 | |
| Total income from operations | | (4.5) | | | — | | | (4.5) | |
| | | | | | | | | | | | | | | | | | | | | | | | | | | | | | | | |
| | Reported | | Items Affecting Comparability | | Adjusted | | Impact of Foreign Currency | | Constant Currency Adjusted |
| For the first quarter of 2023: | | | | | | | | | | |
| Operating margin | | | | | | | | | | |
| U.S. Refreshment Beverages | | 24.4 | % | | 0.9 | % | | 25.3 | % | | — | % | | 25.3 | % |
| U.S. Coffee | | 24.9 | | | 5.7 | | | 30.6 | | | — | | | 30.6 | |
| International | | 19.3 | | | 0.9 | | | 20.2 | | | 0.1 | | | 20.3 | |
| Total operating margin | | 17.4 | | | 3.4 | | | 20.8 | | | 0.1 | | | 20.9 | |
CONSTANT CURRENCY ADJUSTED RESULTS OF OPERATIONS
First Quarter of 2023 Compared to First Quarter of 2022
The following discussion of our results for the first quarter of 2023 is presented on a constant currency adjusted basis. These adjusted financial results are calculated on a constant currency basis by converting our current-period local currency financial results using the prior-period foreign currency exchange rates
Consolidated Operations
Constant Currency Net Sales. Constant currency net sales increased 8.9% in the first quarter of 2023 compared to the prior year period, driven by favorable net price realization of 9.9%, partially offset by lower volume/mix of 1.0%.
Constant Currency Adjusted Income from Operations.Constant currency adjusted income from operations decreased 4.5% compared to the prior year period. This decrease primarily resulted from the impacts of broad-based inflation, higher marketing expense, increases in other operating costs, and the unfavorable comparison of a number of prior year benefits, partially offset by the benefits of strong net sales growth and productivity. In the prior year period, we had the benefit of the change in our accounting policy related to the recognition of forfeitures for our stock awards, the asset sale-leaseback activity related to our strategic asset investment program, and the portion of the settlement payment from BodyArmor for the reimbursement of attorney fees.
Constant Currency Adjusted Interest Expense.Constant currency adjusted interest expense increased 0.9% compared to the prior year period, primarily driven by increased use of our commercial paper facility in the current year period.
Constant Currency Adjusted Effective Tax Rate.The constant currency adjusted effective tax rate was 20.2% for the first quarter of 2023 compared to 22.9% for the prior year period, primarily driven by the tax benefit received from favorable adjustments upon foreign tax return filing and excess tax deductions that were generated from the vesting of RSUs during the first quarter of 2023.
Constant Currency Adjusted Net Income Attributable to KDP. Constant currency adjusted net income attributable to KDP increased 0.6% compared to the prior year period, as the decrease in our effective tax rate and the benefit of Nutrabolt’s preferred dividend was partially offset by lower constant currency adjusted income from operations.
Constant Currency Adjusted Diluted EPS.Constant currency adjusted diluted EPS increased approximately 3.0% over the prior year period, driven by lower weighted average shares outstanding compared to the prior year period and the increase in constant currency adjusted net income attributable to KDP.
Results of Operations by Segment
U.S. REFRESHMENT BEVERAGES
Constant Currency Net Sales. Constant currency net sales increased 12.7%, reflecting favorable net price realization of 12.5% and volume/mix growth of 0.2%.
Constant Currency Adjusted Income from Operations.Constant currency adjusted income from operations for the first quarter of 2023 increased 11.6% compared to the prior year period, driven by the benefits of net sales growth and productivity, partially offset by broad-based inflation, the unfavorable comparison to asset sale-leaseback activity relating to our strategic asset initiative in the prior year period, higher marketing expense and increases in other operating costs.
U.S. COFFEE
Constant Currency Net Sales.Constant currency net sales decreased 1.3%, driven by unfavorable volume/mix of 6.6%, partially offset by higher net price realization of 5.3%.
Constant Currency Adjusted Income from Operations.Constant currency adjusted income from operations decreased 5.3% compared to the prior year period, as a result of inflation in input costs and declines in volume/mix. These decreases were partially offset by the benefits of pricing actions and productivity.
INTERNATIONAL
Constant Currency Net Sales. Constant currency net sales increased 16.7%, driven by favorable net price realization of 9.0% and volume/mix growth of 7.7%.
Constant Currency Adjusted Income from Operations.Constant currency adjusted income from operations increased 18.3% compared to the prior year period, driven by the benefits of net sales growth and productivity, partially offset by broad-based inflation and higher costs associated with higher volumes.
CRITICAL ACCOUNTING ESTIMATES
The process of preparing our consolidated financial statements in conformity with U.S. GAAP requires the use of estimates and judgments that affect the reported amounts of assets, liabilities, revenue and expenses. Critical accounting estimates are both fundamental to the portrayal of a company’s financial condition and results and require difficult, subjective or complex estimates and assessments. These estimates and judgments are based on historical experience, future expectations and other factors and assumptions we believe to be reasonable under the circumstances. The most significant estimates and judgments are reviewed on an ongoing basis and revised when necessary. These critical accounting estimates are discussed in greater detail in Part II, Item 7 of our Annual Report.
LIQUIDITY AND CAPITAL RESOURCES
Overview
We believe our financial condition and liquidity remain strong. We continue to manage all aspects of our business, including, but not limited to, monitoring the financial health of our customers, suppliers and other third-party relationships, implementing gross margin enhancement strategies through our productivity initiatives, and developing new opportunities for growth such as innovation and agreements with partners to distribute brands that are accretive to our portfolio.
The following summarizes our cash activity for the first quarter of 2023 and 2022:
Cash, cash equivalents, restricted cash and restricted cash equivalents decreased $331 million from December 31, 2022 to March 31, 2023, primarily driven by the reduction in cash provided by operating activities, dividend payments and share repurchases, partially offset by net issuances of commercial paper.
Cash generated by our foreign operations is generally repatriated to the U.S. periodically as working capital funding requirements, where allowed. We do not expect restrictions or taxes on repatriation of cash held outside the U.S. to have a material effect on our overall business, liquidity, financial condition or results of operations for the foreseeable future.
The following summarizes our cash activity for the first quarter of 2024 and 2023:
Principal Sources of Capital Resources
Our principal sources of liquidity are our existing cash and cash equivalents, cash generated from our operations, and borrowing capacity currently available under our 2022 Revolving Credit Agreement. Additionally, we have an uncommitted commercial paper program where we can issue unsecured commercial paper notes on a private placement basis. Based on our current and anticipated level of operations, we believe that our operating cash flows will be sufficient to meet our anticipated obligations for the next twelve months.months and thereafter for the foreseeable future. To the extent that our operating cash flows are not sufficient to meet our liquidity needs, we may utilize cash on hand or amounts available under our financing arrangements, if necessary. At any time, and from time to time, we may seek additional deleveraging, refinancing or liquidity enhancing transactions, including entering into transactions to repurchase or redeem outstanding indebtedness or otherwise seek transactions to reduce interest expense, extend debt maturities and improve our capital and liquidity structure.
Sources of Liquidity - Operations
Net cash provided by operating activities decreased $592increased $14 million for the first quarter of 2023,2024, as compared to the first quarter of 2022,2023, driven by the decreasean increase in net income adjusted for non-cash items, led by the unfavorable year-over-year impact of the $349 million gain from BodyArmor in the first quarter of 2022 and a reduction in our cash conversion cycle.working capital.
Cash Conversion Cycle
Our cash conversion cycle is defined as DIO and DSO less DPO. The calculation of each component of the cash conversion cycle is provided below:
| | | | | | | | |
| Component | | Calculation (on a trailing twelve month basis) |
| DIO | | (Average inventory divided by cost of sales) * Number of days in the period |
| DSO | | (Accounts receivable divided by net sales) * Number of days in the period |
| DPO | | (Accounts payable * Number of days in the period) divided by cost of sales and SG&A expenses |
The following table summarizes our cash conversion cycle:
| | March 31, |
| 2023 | | 2022 |
| | March 31, | | | | March 31, |
| | 2024 | | | | 2024 | | 2023 |
| DIO | DIO | | 71 | | | 60 | |
| DSO | DSO | | 37 | | | 34 | |
| DPO | DPO | | 154 | | | 164 | |
| Cash conversion cycle | Cash conversion cycle | | (46) | | | (70) | |
Our cash conversion cycle increased 2448 days to approximately 2 days as of March 31, 2024 as compared to (46) days as of March 31, 2023, as compared to (70) days as of March 31, 2022. The increase in DIO reflects our efforts to restore inventory to meet customer service levels and the build up of our inventory of C4, and the increase in DSOwhich was primarily driven by rising inflation during the year. The decrease in DPO, was driven byreflecting the reduction of payment terms for certain suppliers.
Accounts Payable Program
As part of our ongoing efforts to improve our cash flow and related liquidity, we work with our suppliers to optimize our terms and conditions, which include the extension ofincludes payment terms. Excluding our suppliers who require cash at date of purchase or sale, our current payment terms with our suppliers generally range from 10 to 360 days. We also enter into agreements with third party administrators to allow participating suppliers to track payment obligations from us, and, if voluntarily elected by the supplier, sell payment obligations from us to financial institutions. Suppliers can sell one or more of our payment obligations at their sole discretion and our rights and obligations to our suppliers are not impacted. We have no economic interest in a supplier’s decision to enter into these agreements and no direct financial relationship with the financial institutions. Our obligations to our suppliers, including amounts due and scheduled payment terms, are not impacted. Refer to Note 13 of the Notes to our Unaudited Condensed Consolidated Financial Statements for additional information on our obligations to participating suppliers.
Sources of Liquidity - Financing
Refer to Note 2 of the Notes to our Unaudited Condensed Consolidated Financial Statements for management's discussion of our financing arrangements.
We also have an active shelf registration statement, filed with the SEC on August 19, 2022, which allows us to issue an indeterminate number or amount of common stock, preferred stock, debt securities and warrants from time to time in one or more offerings at the direction of our Board.
Sources of Liquidity - Asset Sale-Leaseback Transactions
We have leveraged our strategic asset investment program to create value from certain assets to enable reinvestment in KDP. These transactions are accounted for as sale-leaseback transactions. We received $7 million and $77 million of cash proceeds from our strategic asset investment program during the first quarter of 2023 and 2022, respectively, which are included in Proceeds from sales of property, plant and equipment in the unaudited Condensed Consolidated Statements of Cash Flows.
Debt Ratings
Our credit ratings are as follows:
| | | | | | | | | | | | | | | | | | | | |
| Rating Agency | | Long-Term Debt Rating | | Commercial Paper Rating | | Outlook |
Moody's(1) | | Baa1 | | P-2 | | Stable |
| S&P | | BBB | | A-2 | | Stable |
(1)On April 3, 2023, Moody’s upgraded our long-term debt rating to Baa1 from Baa2 and affirmed our P-2 commercial paper rating and outlook.
These debt and commercial paper ratings impact the interest we pay on our financing arrangements. A downgrade of one or both of our debt and commercial paper ratings could increase our interest expense and decrease the cash available to fund anticipated obligations.
As of March 31, 2023,2024, we were in compliance with all debt covenants and we have no reason to believe that we will be unable to satisfy these covenants.
Principal Uses of Capital Resources
Over the past several years,Our capital allocation priorities are investing to grow our principal uses ofbusiness both organically and inorganically, continuing to strengthen our capital resources were deleveraging, providing shareholder returnbalance sheet, and returning cash to our investorsshareholders through regular quarterly dividends and investingopportunistic share repurchases. We dynamically adjust our cash deployment plans based on the specific opportunities available in KDPa given period, but over time we allocate capital to capture market share and drive growth through innovation and routes to market.
Now that we have met our post-merger goals, we plan to further reduce our leverage ratio. We also plan to invest in inorganic value creation through mergers or acquisitions, which may include portfolio expansion, distribution scale, geographic expansion, and new capabilities. In addition, we have repurchased sharesbalance each of our outstanding common stock, as described below.these priorities.
Regular Quarterly Dividends
For the first quarter of 2023, weWe have declared total dividends of $0.215 per share and $0.20 per share.share for the first quarter of 2024 and 2023, respectively.
Repurchases of Common Stock
Our Board authorized a four-year share repurchase program, ending December 31, 2025, of up to $4 billion of our outstanding common stock, potentially enabling us to return value to shareholders.stock. We repurchased and retired $231$1,105 million of common stock during the first quarter of 2023.2024. As of March 31, 2023, $3,3902024, $1,810 million remained available for repurchase under the authorized share repurchase program.
Capital Expenditures
We are investingcontinue to invest in state-of-the-art manufacturing and warehousing facilities, including expansive investments in facilities in Spartanburg, South Carolina; and Allentown, Pennsylvania, in 2023 and 2022,Carolina, in order to optimize our supply chain network.
Purchases of property, plant and equipment were $62$158 million and $109$62 million for the first quarter of 20232024 and 2022,2023, respectively.
Capital expenditures, which includes both purchases of property, plant and equipment and amounts included in accounts payable and accrued expenses, for the first quarter of 20232024 and 20222023 primarily related to theinvestments in manufacturing and warehousing facilities discussed above.capabilities. Capital expenditures included in accounts payable and accrued expenses were $222$189 million and $139$222 million for the first quarter of 20232024 and 2022,2023, respectively, which primarily related to these investments.
Investments in Unconsolidated Affiliates
From time to time, we expect to invest in beverage startup companies or in brand ownership companies to grow our presence in certain product categories, or enter into various licensing and distribution agreements to expand our product portfolio. Our investments in beverage startup companies generally involve acquiring a minority interest in equity securities of a company, in certain cases with a protected path to ownership at our future option.
Purchases of Intangible Assets
We have invested in the expansion of our DSD network through transactions with strategic independent bottlers or third-party brand ownership companies to ensure competitive distribution scale. From time to time, we additionally acquire brand ownership companies to expand our portfolio. These transactions are generally accounted for as an asset acquisition, as the majority of the transaction price represents the acquisition of an intangible asset. Purchases of intangible assets were $51$31 million and $10$51 million for the first quarter of 20232024 and 2022,2023, respectively.
Uncertainties and Trends Affecting Liquidity
Disruptions in financial and credit markets, including those caused by inflation, global economic uncertainty and rising interest rates, may impact our ability to manage normal commercial relationships with our customers, suppliers and creditors. These disruptions could have a negative impact on the ability of our customers to timely pay their obligations to us, thus reducing our cash flow, or the ability of our vendors to timely supply materials.
Customer and consumer demand for our products may also be impacted by the risk factors discussed under "Risk Factors" in Part 1, Item 1A of our Annual Report, as well as subsequent filings with the SEC, that could have a material effect on production, delivery and consumption of our products, which could result in a reduction in our sales volume.
SUPPLEMENTAL GUARANTOR FINANCIAL INFORMATION
The Notes are fully and unconditionally guaranteed by certain of our direct and indirect subsidiaries (the "Guarantors"), as defined in the indentures governing the Notes. The Guarantors are 100% owned either directly or indirectly by us and jointly and severally guarantee, subject to the release provisions described below, our obligations under the Notes. None of our subsidiaries organized outside of the U.S., any of the subsidiaries held by Maple Parent Holdings Corp. prior to the DPS Merger or any of the subsidiaries acquired after the DPS Merger (collectively, the "Non-Guarantors") guarantee the Notes. The subsidiary guarantees with respect to the Notes are subject to release upon the occurrence of certain events, including the sale of all or substantially all of a subsidiary's assets, the release of the subsidiary's guarantee of our other indebtedness, our exercise of the legal defeasance option with respect to the Notes and the discharge of our obligations under the applicable indenture.
The following schedules present the summarized financial information for Keurig Dr Pepper Inc. (the “Parent”) and the Guarantors on a combined basis after intercompany eliminations; the Parent and the Guarantors' amounts due from and amounts due to Non-Guarantors are disclosed separately. The consolidating schedules are provided in accordance with the reporting requirements of Rule 13-01 under SEC Regulation S-X for the issuer and guarantor subsidiaries.
The summarized financial information for the Parent and Guarantors were as follows:
| | | | | |
| (in millions) | For the First Quarter of 20232024 |
| Net sales | $ | 2,0822,180 | |
| Gross profit | 1,227 | |
| Income from operations | 188390 | |
Net income attributable to KDP | 467454 | |
| | (in millions) | (in millions) | March 31, 2023 | | December 31, 2022 | (in millions) | March 31, 2024 | | December 31, 2023 |
| Current assets | Current assets | $ | 1,842 | | | $ | 1,712 | |
| Non-current assets | Non-current assets | 45,795 | | | 45,721 | |
Total assets(1) | Total assets(1) | $ | 47,637 | | | $ | 47,433 | |
| | Current liabilities | Current liabilities | $ | 6,007 | | | $ | 4,797 | |
| Current liabilities | |
| Current liabilities | |
| Non-current liabilities | Non-current liabilities | 16,481 | | | 17,463 | |
Total liabilities(2) | Total liabilities(2) | $ | 22,488 | | | $ | 22,260 | |
(1)Includes $4$157 million and $3$56 million of intercompany receivables due to the Parent and Guarantors from the Non-Guarantors as of March 31, 20232024 and December 31, 2022,2023, respectively.
(2)Includes $1,450$1,388 million and $1,186$1,399 million of intercompany payables due to the Non-Guarantors from the Parent and Guarantors as of March 31, 20232024 and December 31, 2022,2023, respectively.
ITEM 3. Quantitative and Qualitative Disclosures About Market Risk
There have been no material changes to the disclosures on market risk made in our Annual Report.
ITEM 4. Controls and Procedures
EVALUATION OF DISCLOSURE CONTROLS AND PROCEDURES
Based on evaluation of the effectiveness of our disclosure controls and procedures (as defined in Rule 13a-15(e) and 15d-15(e) of the Exchange Act) our management, including our Chief Executive Officer and Chief Financial Officer, has concluded that, as of March 31, 2023,2024, our disclosure controls and procedures are effective to (i) provide reasonable assurance that information required to be disclosed in the Exchange Act filings is recorded, processed, summarized and reported within the time periods specified by the SEC's rules and forms, and (ii) ensure that information required to be disclosed by us in the reports we file or submit under the Exchange Act are accumulated and communicated to our management, including our Chief Executive Officer and Chief Financial Officer, as appropriate to allow timely decisions regarding required disclosure.
No change in our internal control over financial reporting (as defined in Rule 13a-15(f) of the Exchange Act) occurred during the quarter ended March 31, 20232024 that materially affected, or is reasonably likely to materially affect, our internal control over financial reporting.
PART II – OTHER INFORMATION
ITEM 1. Legal Proceedings
We are occasionally subject to litigation or other legal proceedings relating to our business. See Note 14 of the Notes to our Unaudited Condensed Consolidated Financial Statements for more information related to commitments and contingencies, which is incorporated herein by reference.
The Staff of the SEC (the “Staff”) has been investigating certain statements by the Company in its prior Exchange Act reports regarding the recyclability of our K-Cup pods. We have been cooperating with this investigation and have now reached what we believe to be an agreement in principle with the Staff to resolve the matter. This agreement is subject to finalizing documentation and must be approved by the SEC. If approved, this agreement, which includes a $1.5 million penalty, would not have a material impact on the Company.
ITEM 1A. Risk Factors
There have been no material changes from the risk factors set forth in Part I, Item 1A in our Annual Report.
ITEM 2. Unregistered Sales of Equity Securities and Use of Proceeds
On October 1, 2021, our Board authorized a share repurchase program of up to $4 billion of our outstanding common stock, enabling us to opportunistically return value to shareholders. The $4 billion authorization is effective for four years, beginning on January 1, 2022 and expiring on December 31, 2025, and does not require the purchase of any minimum number of shares.
The following table summarizes shares repurchased by the Companyus under this program during the first quarter of 2023:2024:
| | Period | Period | | Total Number of Shares Purchased | | Average Price Paid per Share | | Total Number of Shares Purchased as Part of Publicly Announced Program | | Maximum Amount of Dollars that May Yet be Used to Purchase Shares Under the Program (in millions)(1) | Period | | Total Number of Shares Purchased | | Average Price Paid per Share | | Total Number of Shares Purchased as Part of Publicly Announced Program | | Maximum Amount of Dollars that May Yet be Used to Purchase Shares Under the Program |
| January 1 to January 31 | January 1 to January 31 | | 2,000,000 | | | $ | 34.59 | | | 2,000,000 | | | $ | 3,552 | |
| February 1 to February 28 | | 471,803 | | | 35.74 | | | 471,803 | | | 3,535 | |
| February 1 to February 29 | |
| March 1 to March 31 | March 1 to March 31 | | 4,135,722 | | | 35.05 | | | 4,135,722 | | | 3,390 | |
| Total | Total | | 6,607,525 | | | $ | 34.96 | | | 6,607,525 | | | $ | 3,390 | |
(1)TheIn March 2024, JAB BevCo B.V., a subsidiary of JAB, sold 100 million shares of KDP’s common stock through an underwritten secondary offering. In connection with this offering, we repurchased 35 million shares at the per-share price paid by the underwriter, which was effected under our existing share repurchase program was authorized prior to the issuance of the Inflation Reduction Act of 2022, which imposes a 1% excise tax on net share repurchases that occur after December 31, 2022. Forprogram.
ITEM 5. Other Information
During the first quarter of 2023,2024, no directors or executive officers of the Company recorded $1 million to additional paid-in capitaladopted or terminated any contract, instruction or written plan for the excise tax associated with shares repurchased duringpurchase or sale of Company securities that was intended to satisfy the quarter.affirmative defense conditions of Rule 10b5-1(c) or any “non-Rule 10b5-1 trading arrangement,” as defined in Item 408 of Regulation S-K.
ITEM 6. Exhibits
| | | | | | | | |
| No. | | | | | Exhibit Description |
| | Amended and Restated Certificate of Incorporation of Dr Pepper Snapple Group, Inc. (filed as Exhibit 3.1 to the Company's Current Report on Form 8-K (filed on May 12, 2008) and incorporated herein by reference). |
| | Certificate of Amendment to Amended and Restated Certificate of Incorporation of Dr Pepper Snapple Group, Inc. effective as of May 17, 2012 (filed as Exhibit 3.2 to the Company's Quarterly Report on Form 10-Q (filed July 26, 2012) and incorporated herein by reference). |
| | Certificate of Second Amendment to Amended and Restated Certificate of Incorporation of Dr Pepper Snapple Group, Inc. effective as of May 19, 2016 (filed as Exhibit 3.1 to the Company's Current Report on Form 8-K (filed May 20, 2016) and incorporated herein by reference). |
| | Certificate of Third Amendment to the Amended and Restated Certificate of Incorporation of Dr Pepper Snapple Group, Inc. effective as of July 9, 2018 (filed as Exhibit 3.1 to the Company's Current Report on Form 8-K (filed July 9, 2018) and incorporated herein by reference). |
| | Amended and Restated By-Laws of Keurig Dr Pepper Inc. effective as of July 9, 2018 (filed as Exhibit 3.2 to the Company's Current Report on Form 8-K (filed July 9, 2018) and incorporated herein by reference). |
| | Base Indenture, dated as of March 7, 2024, among Keurig Dr Pepper Inc., the guarantors party thereto and U.S. Bank Trust Company, National Association, as trustee (filed as Exhibit 4.1 to the Company’s Current Report on Form 8-K (filed March 7, 2024) and incorporated herein by reference). |
| | First Supplemental Indenture, dated as of March 7, 2024, among Keurig Dr Pepper Inc., the guarantors party thereto and U.S. Bank Trust Company, National Association, as trustee (filed as Exhibit 4.2 to the Company’s Current Report on Form 8-K (filed March 7, 2024) and incorporated herein by reference). |
| | Form of Floating Rate Senior Note due 2027 (included in Exhibit 4.2 to the Company’s Current Report on Form 8-K (filed March 7, 2024) and incorporated herein by reference). |
| | Form of 5.100% Senior Note due 2027 (included in Exhibit 4.2 to the Company’s Current Report on Form 8-K (filed March 7, 2024) and incorporated herein by reference). |
| | Form of 5.050% Senior Note due 2029 (included in Exhibit 4.2 to the Company’s Current Report on Form 8-K (filed March 7, 2024) and incorporated herein by reference). |
| | Form of 5.200% Senior Note due 2031 (included in Exhibit 4.2 to the Company’s Current Report on Form 8-K (filed March 7, 2024) and incorporated herein by reference). |
| | Form of 5.300% Senior Note due 2034 (included in Exhibit 4.2 to the Company’s Current Report on Form 8-K (filed March 7, 2024) and incorporated herein by reference). |
| | Certification of Chief Executive Officer of Keurig Dr Pepper Inc. pursuant to Rule 13a-14(a) or 15d-14(a) promulgated under the Exchange Act. |
| | Certification of Chief Financial Officer of Keurig Dr Pepper Inc. pursuant to Rule 13a-14(a) or 15d-14(a) promulgated under the Exchange Act. |
| | Certification of Chief Executive Officer of Keurig Dr Pepper Inc. pursuant to Rule 13a-14(b) or 15d-14(b) promulgated under the Exchange Act, and Section 1350 of Chapter 63 of Title 18 of the United States Code. |
| | Certification of Chief Financial Officer of Keurig Dr Pepper Inc. pursuant to Rule 13a-14(b) or 15d-14(b) promulgated under the Exchange Act, and Section 1350 of Chapter 63 of Title 18 of the United States Code. |
| 101* | | The following financial information from Keurig Dr Pepper Inc.'s Quarterly Report on Form 10-Q for the quarter ended March 31, 2023,2024, formatted in Inline XBRL: (i) Condensed Consolidated Statements of Income, (ii) Condensed Consolidated Statements of Comprehensive Income, (iii) Condensed Consolidated Balance Sheets, (iv) Condensed Consolidated Statements of Cash Flows, (v) Condensed Consolidated Statement of Changes in Stockholders' Equity, and (vi) the Notes to Condensed Consolidated Financial Statements. The Instance document does not appear in the Interactive Data File because its XBRL tags are embedded within the Inline XBRL document. |
| 104* | | The cover page from this Quarterly Report on Form 10-Q, formatted as Inline XBRL. |
* Filed herewith.
** Furnished herewith.
++ Indicates a management contract or compensatory plan or arrangement.
SIGNATURES
Pursuant to the requirements of the Securities Exchange Act of 1934, the registrant has duly caused this report to be signed on its behalf by the undersigned thereunto duly authorized.
| | | | | | | | | | | |
| | Keurig Dr Pepper Inc. |
| | By: | | /s/ Sudhanshu Priyadarshi |
| | | |
| Name: | | Sudhanshu Priyadarshi |
| | Title: | | Chief Financial Officer |
| | | | (Principal Financial Officer) |
Date: April 27, 202325, 2024 | | | |