UNITED STATES
SECURITIES AND EXCHANGE COMMISSION
Washington, D.C. 20549
FORM 10-Q
(MARK ONE)
|
| |
| ý | QUARTERLY REPORT PURSUANT TO SECTION 13 OR 15(d) OF THE SECURITIES EXCHANGE ACT OF 1934 |
FOR THE QUARTERLY PERIOD ENDED SEPTEMBERJUNE 30, 20172018
OR
|
| |
¨
| TRANSITION REPORT PURSUANT TO SECTION 13 OR 15(d) OF THE SECURITIES EXCHANGE ACT OF 1934 |
FOR THE TRANSITION PERIOD FROM TO
Commission File Number 001-36779
On Deck Capital, Inc.
(Exact name of registrant as specified in its charter)
|
| | |
| Delaware | | 42-1709682 |
(State or other jurisdiction of incorporation or organization) | | (I.R.S. Employer Identification No.) |
| | | |
| 1400 Broadway, 25th Floor, New York, New York | | 10018 |
| (Address of principal executive offices) | | (Zip Code) |
(888) 269-4246
(Registrant’s telephone number, including area code)
Indicate by check mark whether the registrant (1) has filed all reports required to be filed by Section 13 or 15(d) of the Securities Exchange Act of 1934 during the preceding 12 months (or for such shorter period that the registrant was required to file such reports), and (2) has been subject to such filing requirements for the past 90 days. YES ý NO ¨
Indicate by check mark whether the registrant has submitted electronically and posted on its corporate Web site, if any, every Interactive Data file required to be submitted and posted pursuant to Rule 405 of Regulation S-T (§232.405 of this chapter) during the preceding 12 months (or for such shorter period that the registrant was required to submit and post such files). YES ý NO ¨
Indicate by check mark whether the registrant is a large accelerated filer, an accelerated filer, a non-accelerated filer, smaller reporting company, or an emerging growth company. See the definitions of “large accelerated filer,” “accelerated filer,” “smaller reporting company,” and "emerging growth company" in Rule 12b-2 of the Exchange Act.
|
| | | | | | |
| Large accelerated filer | | ¨ | | Accelerated filer | | x |
| Non-accelerated filer | | ¨ (Do not check if a smaller reporting company) | | Smaller reporting company | | ¨
|
| | | | | Emerging growth company | | x |
| | | | | If an emerging growth company, indicate by check mark if the registrant has elected not to use the extended transition period for complying with any new or revised financial accounting standards provided pursuant to Section 13(a) of the Exchange Act. | | x |
Indicate by check mark whether the registrant is a shell company (as defined in Rule 12b-2 of the Exchange Act.
YES ¨ NO x
The number of shares of the registrant’s common stock outstanding as of OctoberJuly 31, 20172018 was 73,635,045.74,651,796.
On Deck Capital, Inc.
Table of Contents
|
| | |
| | | Page |
| PART I - FINANCIAL INFORMATION |
| | | |
| Item 1. | Financial Statements (Unaudited) | |
| | Unaudited Condensed Consolidated Balance Sheets | |
| | Unaudited Condensed Consolidated Statements of Operations and Comprehensive Income | |
| | Unaudited Condensed Consolidated Statements of Cash Flows | |
| | Notes to Unaudited Condensed Consolidated Financial Statements | |
| Item 2. | Management’s Discussion and Analysis of Financial Condition and Results of Operations | |
| Item 3. | Quantitative and Qualitative Disclosures About Market Risk | |
| Item 4. | Controls and Procedures | |
| | | |
| PART II - OTHER INFORMATION |
| | | |
| Item 1. | Legal Proceedings | |
| Item 1A. | Risk Factors | |
| Item 2. | Unregistered Sales of Equity Securities and Use of Proceeds | |
| Item 3. | Defaults Upon Senior Securities | |
| Item 4. | Mine Safety Disclosures | |
| Item 5. | Other Information | |
| Item 6 | Exhibits | |
| | | |
| | Signatures | |
PART I - FINANCIAL INFORMATION
Item 1. Financial Statements (Unaudited) |
| |
Item 1. | Financial Statements (Unaudited) |
ON DECK CAPITAL, INC. AND SUBSIDIARIES
Unaudited Condensed Consolidated Balance Sheets
(in thousands, except share and per share data)
| | | | September 30, | | December 31, | June 30, | | December 31, |
| | 2017 | | 2016 | 2018 | | 2017 |
| Assets | | | | | | |
| Cash and cash equivalents | $ | 64,292 |
| | $ | 79,554 |
| $ | 74,262 |
| | $ | 71,362 |
|
| Restricted cash | 56,729 |
| | 44,432 |
| 44,189 |
| | 43,462 |
|
| Loans held for investment | 957,203 |
| | 1,000,445 |
| 1,046,588 |
| | 952,796 |
|
| Less: Allowance for loan losses | (104,872 | ) | | (110,162 | ) | (124,058 | ) | | (109,015 | ) |
| Loans held for investment, net | 852,331 |
| | 890,283 |
| 922,530 |
| | 843,781 |
|
| Loans held for sale | — |
| | 373 |
| |
| Property, equipment and software, net | 24,975 |
| | 29,405 |
| 16,939 |
| | 23,572 |
|
| Other assets | 17,069 |
| | 20,044 |
| 14,264 |
| | 13,867 |
|
| Total assets | $ | 1,015,396 |
| | $ | 1,064,091 |
| $ | 1,072,184 |
| | $ | 996,044 |
|
| Liabilities and equity | | | | | | |
| Liabilities: | | | | | | |
| Accounts payable | $ | 2,918 |
| | $ | 5,271 |
| $ | 4,087 |
| | $ | 2,674 |
|
| Interest payable | 2,213 |
| | 2,122 |
| 2,574 |
| | 2,330 |
|
| Funding debt | 702,998 |
| | 726,639 |
| 755,720 |
| | 684,269 |
|
| Corporate debt | 17,180 |
| | 27,966 |
| — |
| | 7,985 |
|
| Accrued expenses and other liabilities | 30,987 |
| | 38,496 |
| 32,115 |
| | 32,730 |
|
| Total liabilities | 756,296 |
| | 800,494 |
| 794,496 |
| | 729,988 |
|
| Commitments and contingencies (Note 9) |
| |
|
| |
|
| Stockholders’ equity (deficit): | | | | | | |
| Common stock—$0.005 par value, 1,000,000,000 shares authorized and 77,002,976 and 74,801,825 shares issued and 73,623,312 and 71,605,708 outstanding at September 30, 2017 and December 31, 2016, respectively. | 385 |
| | 374 |
| |
| Common stock—$0.005 par value, 1,000,000,000 shares authorized and 78,189,980 and 77,284,266 shares issued and 74,641,004 and 73,822,001 outstanding at June 30, 2018 and December 31, 2017, respectively. | | 391 |
| | 386 |
|
| Treasury stock—at cost | (7,561 | ) | | (6,697 | ) | (8,406 | ) | | (7,965 | ) |
| Additional paid-in capital | 489,465 |
| | 477,526 |
| 499,347 |
| | 492,509 |
|
| Accumulated deficit | (227,973 | ) | | (211,299 | ) | (218,960 | ) | | (222,833 | ) |
| Accumulated other comprehensive loss | (6 | ) | | (379 | ) | (334 | ) | | (52 | ) |
| Total On Deck Capital, Inc. stockholders' equity | 254,310 |
| | 259,525 |
| 272,038 |
| | 262,045 |
|
| Noncontrolling interest | 4,790 |
| | 4,072 |
| 5,650 |
| | 4,011 |
|
| Total equity | 259,100 |
| | 263,597 |
| 277,688 |
| | 266,056 |
|
| Total liabilities and equity | $ | 1,015,396 |
| | $ | 1,064,091 |
| $ | 1,072,184 |
| | $ | 996,044 |
|
The accompanying notes are an integral part of these condensed consolidated financial statements.
ON DECK CAPITAL, INC. AND SUBSIDIARIES
Unaudited Condensed Consolidated Statements of Operations and Comprehensive Income
(in thousands, except share and per share data)
| | | | Three Months Ended September 30, | | Nine Months Ended September 30, | Three Months Ended June 30, | | Six Months Ended June 30, |
| | 2017 | | 2016 | | 2017 | | 2016 | 2018 | | 2017 | | 2018 | | 2017 |
| Revenue: | | | | | | | | | | | | | | |
| Interest income | $ | 80,122 |
| | $ | 71,361 |
| | $ | 250,954 |
| | $ | 188,726 |
| $ | 92,371 |
| | $ | 83,721 |
| | $ | 178,740 |
| | $ | 170,832 |
|
| Gain on sales of loans | 146 |
| | 2,670 |
| | 1,890 |
| | 12,594 |
| — |
| | 260 |
| | — |
| | 1,744 |
|
| Other revenue | 3,398 |
| | 3,340 |
| | 10,365 |
| | 8,168 |
| 3,247 |
| | 2,670 |
| | 7,158 |
| | 6,967 |
|
| Gross revenue | 83,666 |
| | 77,371 |
| | 263,209 |
| | 209,488 |
| 95,618 |
| | 86,651 |
| | 185,898 |
| | 179,543 |
|
| Cost of revenue: | | | | | | | | | | | | | | |
| Provision for loan losses | 39,582 |
| | 36,586 |
| | 118,495 |
| | 94,294 |
| 33,293 |
| | 32,733 |
| | 69,586 |
| | 78,913 |
|
| Funding costs | 11,330 |
| | 8,452 |
| | 34,223 |
| | 22,548 |
| 12,202 |
| | 11,616 |
| | 24,023 |
| | 22,893 |
|
| Total cost of revenue | 50,912 |
| | 45,038 |
| | 152,718 |
| | 116,842 |
| 45,495 |
| | 44,349 |
| | 93,609 |
| | 101,806 |
|
| Net revenue | 32,754 |
| | 32,333 |
| | 110,491 |
| | 92,646 |
| 50,123 |
| | 42,302 |
| | 92,289 |
| | 77,737 |
|
| Operating expense: | | | | | | | | | | | | | | |
| Sales and marketing | 11,903 |
| | 16,789 |
| | 42,090 |
| | 50,094 |
| 11,432 |
| | 15,368 |
| | 22,030 |
| | 30,187 |
|
| Technology and analytics | 11,748 |
| | 15,050 |
| | 41,960 |
| | 42,894 |
| 12,799 |
| | 14,769 |
| | 23,806 |
| | 30,212 |
|
| Processing and servicing | 4,160 |
| | 5,181 |
| | 13,521 |
| | 14,261 |
| 5,041 |
| | 4,826 |
| | 10,262 |
| | 9,361 |
|
| General and administrative | 9,440 |
| | 12,375 |
| | 30,917 |
| | 34,233 |
| 16,034 |
| | 9,590 |
| | 33,759 |
| | 21,477 |
|
| Total operating expense | 37,251 |
| | 49,395 |
| | 128,488 |
| | 141,482 |
| 45,306 |
| | 44,553 |
| | 89,857 |
| | 91,237 |
|
| Loss from operations | (4,497 | ) | | (17,062 | ) | | (17,997 | ) | | (48,836 | ) | |
| Income (loss) from operations | | 4,817 |
| | (2,251 | ) | | 2,432 |
| | (13,500 | ) |
| Other expense: | | | | | | | | | | | | | | |
| Interest expense | (35 | ) | | (111 | ) | | (706 | ) | | (186 | ) | 43 |
| | 318 |
| | 94 |
| | 671 |
|
| Total other expense | (35 | ) | | (111 | ) | | (706 | ) | | (186 | ) | 43 |
| | 318 |
| | 94 |
| | 671 |
|
| Loss before provision for income taxes | (4,532 | ) | | (17,173 | ) | | (18,703 | ) | | (49,022 | ) | |
| Income (loss) before provision for income taxes | | 4,774 |
| | (2,569 | ) | | 2,338 |
| | (14,171 | ) |
| Provision for income taxes | — |
| | — |
| | — |
| | — |
| — |
| | — |
| | — |
| | — |
|
| Net loss | (4,532 | ) | | (17,173 | ) | | (18,703 | ) | | (49,022 | ) | |
| Net loss attributable to noncontrolling interest | 458 |
| | 539 |
| | 2,073 |
| | 1,920 |
| |
| Net loss attributable to On Deck Capital, Inc. common stockholders | $ | (4,074 | ) | | $ | (16,634 | ) | | $ | (16,630 | ) |
| $ | (47,102 | ) | |
| Net loss per share attributable to On Deck Capital, Inc. common shareholders: | | | | | | | | |
| Basic and diluted | $ | (0.06 | ) | | $ | (0.23 | ) | | $ | (0.23 | ) | | $ | (0.67 | ) | |
| Net income (loss) | | 4,774 |
| | (2,569 | ) | | 2,338 |
| | (14,171 | ) |
| Less: Net income (loss) attributable to noncontrolling interest | | (1,016 | ) | | (1,071 | ) | | (1,535 | ) | | (1,615 | ) |
| Net income (loss) attributable to On Deck Capital, Inc. common stockholders | | $ | 5,790 |
|
| $ | (1,498 | ) | | $ | 3,873 |
| | $ | (12,556 | ) |
| Net income (loss) per share attributable to On Deck Capital, Inc. common shareholders: | | | | | | | | |
| Basic | | $ | 0.08 |
| | $ | (0.02 | ) | | $ | 0.05 |
| | $ | (0.17 | ) |
| Diluted | | $ | 0.07 |
| | $ | (0.02 | ) | | $ | 0.05 |
| | $ | (0.17 | ) |
| Weighted-average common shares outstanding: | | | | | | | | | | | | | | |
| Basic and diluted | 73,272,085 |
| | 70,971,895 |
| | 72,613,221 |
| | 70,750,037 |
| |
| | | | | | | | | |
| Comprehensive loss: | | | | | | | | |
| Net loss | $ | (4,532 | ) | | $ | (17,173 | ) | | $ | (18,703 | ) | | $ | (49,022 | ) | |
| Other comprehensive loss: | | | | | | | | |
| Basic | | 74,385,446 |
| | 72,688,815 |
| | 74,182,929 |
| | 72,276,734 |
|
| Diluted | | 78,288,267 |
| | 72,688,815 |
| | 77,786,748 |
| | 72,276,734 |
|
| Comprehensive income (loss): | | | | | | | | |
| Net income (loss) | | $ | 4,774 |
| | $ | (2,569 | ) | | $ | 2,338 |
| | $ | (14,171 | ) |
| Other comprehensive income (loss): | | | | | | | | |
| Foreign currency translation adjustment | 246 |
| | 210 |
| | 682 |
| | 393 |
| (396 | ) | | 36 |
| | (509 | ) | | 436 |
|
| Comprehensive loss | (4,286 | ) | | (16,963 | ) | | (18,021 | ) | | (48,629 | ) | |
| Comprehensive loss attributable to noncontrolling interests | (111 | ) | | (95 | ) | | (307 | ) | | (177 | ) | |
| Net loss attributable to noncontrolling interest | 458 |
| | 539 |
| | 2,073 |
| | 1,920 |
| |
| Comprehensive loss attributable to On Deck Capital, Inc. common stockholders | $ | (3,939 | ) | | $ | (16,519 | ) | | $ | (16,255 | ) | | $ | (46,886 | ) | |
| Comprehensive income (loss) | | 4,378 |
| | (2,533 | ) | | 1,829 |
| | (13,735 | ) |
| Less: Comprehensive income (loss) attributable to noncontrolling interests | | (178 | ) | | 16 |
| | (229 | ) | | 196 |
|
| Less: Net income (loss) attributable to noncontrolling interest | | (1,016 | ) | | (1,071 | ) | | (1,535 | ) | | (1,615 | ) |
| Comprehensive income (loss) attributable to On Deck Capital, Inc. common stockholders | | $ | 5,572 |
| | $ | (1,478 | ) | | $ | 3,593 |
| | $ | (12,316 | ) |
The accompanying notes are an integral part of these condensed consolidated financial statements.
ON DECK CAPITAL, INC. AND SUBSIDIARIES
Unaudited Condensed Consolidated Statements of Cash Flows
(in thousands)
| | | | Nine Months Ended September 30, | Six Months Ended
June 30, |
| | 2017 | | 2016 | 2018 | | 2017 |
| Cash flows from operating activities | | | | | | |
| Net income (loss) | $ | (18,703 | ) | | $ | (49,022 | ) | 2,338 |
| | (14,171 | ) |
| Adjustments to reconcile net loss to net cash provided by operating activities: |
| |
|
| | |
| Provision for loan losses | 118,495 |
| | 94,294 |
| 69,586 |
| | 78,913 |
|
| Depreciation and amortization | 7,623 |
| | 6,887 |
| 4,218 |
| | 5,172 |
|
| Amortization of debt issuance costs | 2,777 |
| | 3,733 |
| 3,756 |
| | 1,874 |
|
| Stock-based compensation | 9,521 |
| | 11,423 |
| 6,004 |
| | 6,465 |
|
| Amortization of net deferred origination costs | 36,419 |
| | 25,837 |
| 26,197 |
| | 24,648 |
|
| Changes in servicing rights, at fair value | 1,440 |
| | 4,074 |
| 188 |
| | 1,093 |
|
| Gain on sales of loans | (1,890 | ) | | (12,594 | ) | — |
| | (1,744 | ) |
| Unfunded loan commitment reserve | 227 |
| | (405 | ) | 640 |
| | 267 |
|
| Gain on extinguishment of debt | (312 | ) | | (940 | ) | — |
| | (272 | ) |
| Loss on disposal of fixed assets | | 5,713 |
| | — |
|
| Gain on lease termination | | (1,481 | ) | | — |
|
| Changes in operating assets and liabilities: |
| |
|
| |
|
| Other assets | 2,106 |
| | (1,221 | ) | (1,999 | ) | | 374 |
|
| Accounts payable | (2,353 | ) | | 1,386 |
| 1,413 |
| | 298 |
|
| Interest payable | 91 |
| | 826 |
| 244 |
| | 284 |
|
| Accrued expenses and other liabilities | (7,641 | ) | | (844 | ) | 1,676 |
| | (7,569 | ) |
| Originations of loans held for sale | (44,489 | ) | | (238,077 | ) | — |
| | (41,421 | ) |
| Capitalized net deferred origination costs of loans held for sale | (1,128 | ) | | (8,074 | ) | — |
| | (950 | ) |
| Proceeds from sale of loans held for sale | 45,921 |
| | 246,051 |
| — |
| | 42,730 |
|
| Principal repayments of loans held for sale | 1,039 |
| | 6,189 |
| — |
| | 1,004 |
|
| Net cash provided by operating activities | 149,143 |
|
| 89,523 |
| 118,493 |
|
| 96,995 |
|
| Cash flows from investing activities | | | | | | |
| Change in restricted cash | (12,297 | ) | | (4,364 | ) | |
| Purchases of property, equipment and software | (1,129 | ) | | (6,337 | ) | (695 | ) | | (1,081 | ) |
| Proceeds from sale of fixed assets | | (45 | ) | | — |
|
| Capitalized internal-use software | (2,226 | ) | | (3,702 | ) | (2,464 | ) | | (1,824 | ) |
| Originations of term loans and lines of credit, excluding rollovers into new originations | (1,302,889 | ) | | (1,333,192 | ) | (1,009,626 | ) | | (857,841 | ) |
| Proceeds from sale of loans held for investment | 12,396 |
| | 57,238 |
| — |
| | 10,008 |
|
| Payments of net deferred origination costs | (32,747 | ) | | (32,909 | ) | (29,642 | ) | | (21,317 | ) |
| Principal repayments of term loans and lines of credit | 1,220,673 |
| | 881,077 |
| 865,537 |
| | 804,875 |
|
| Other | — |
| | (201 | ) | |
| Purchase of loans | (13,730 | ) | | (6,672 | ) | (801 | ) | | (13,730 | ) |
| Net cash used in investing activities | (131,949 | ) |
| (449,062 | ) | (177,736 | ) |
| (80,910 | ) |
| Cash flows from financing activities | | | | | | |
| Investments by noncontrolling interests | 3,443 |
| | — |
| 3,403 |
| | 3,443 |
|
| Purchase of treasury shares | (864 | ) | | (576 | ) | (441 | ) | | (644 | ) |
| Proceeds from exercise of stock options and warrants | 490 |
| | 131 |
| 39 |
| | 347 |
|
| Issuance of common stock under employee stock purchase plan | 1,838 |
| | 2,606 |
| 668 |
| | 1,246 |
|
| Proceeds from the issuance of funding debt | 133,318 |
| | 606,051 |
| 397,184 |
| | 105,167 |
|
| Proceeds from the issuance of corporate debt | 24,200 |
|
| 10,000 |
| |
| Payments of debt issuance costs | (3,228 | ) | | (4,655 | ) | |
| Distribution to noncontrolling interest | (1,000 | ) |
| — |
| |
| | | | Nine Months Ended September 30, | Six Months Ended
June 30, |
| | 2017 | | 2016 | 2018 | | 2017 |
| Proceeds from the issuance of corporate debt | | 10,000 |
| | 7,000 |
|
| Payments of debt issuance costs | | (3,748 | ) | | (3,284 | ) |
| Repayments of funding debt principal | (156,477 | ) | | (328,321 | ) | (324,828 | ) | | (111,023 | ) |
| Repayments of corporate debt principal | (35,000 | ) |
| — |
| (18,000 | ) | | (10,000 | ) |
| Distribution to noncontrolling interest | | — |
| | (1,000 | ) |
| Net cash provided by (used in) financing activities | (33,280 | ) |
| 285,236 |
| 64,277 |
|
| (8,748 | ) |
| Effect of exchange rate changes on cash and cash equivalents | 824 |
| | 429 |
| (1,407 | ) | | 779 |
|
| Net decrease in cash and cash equivalents | (15,262 | ) | | (73,874 | ) | |
| Cash and cash equivalents at beginning of period | 79,554 |
| | 159,822 |
| |
| Cash and cash equivalents at end of period | $ | 64,292 |
|
| $ | 85,948 |
| |
| Net increase (decrease) in cash, cash equivalents, and restricted cash | | 3,627 |
| | 8,116 |
|
| Cash, cash equivalents, and restricted cash at beginning of year | | 114,824 |
| | 123,986 |
|
| Cash, cash equivalents, and restricted cash at end of period | | $ | 118,451 |
|
| $ | 132,102 |
|
| | | | | |
| Reconciliation to amounts on consolidated balance sheets | | | | |
| Cash and cash equivalents | | $ | 74,262 |
| | $ | 77,936 |
|
| Restricted cash | | 44,189 |
| | 54,166 |
|
| Total cash, cash equivalents and restricted cash | | $ | 118,451 |
| | $ | 132,102 |
|
| | | | | |
| Supplemental disclosure of other cash flow information | | | | | | |
| Cash paid for interest | $ | 31,467 |
| | $ | 16,282 |
| $ | 21,445 |
| | $ | 21,300 |
|
| Supplemental disclosures of non-cash investing and financing activities | | | | | | |
| Stock-based compensation included in capitalized internal-use software | $ | 154 |
| | $ | 1,025 |
| $ | 130 |
| | $ | 140 |
|
Loans transferred from loans held for sale to loans held for investment
| $ | — |
| | $ | 861 |
| |
| Unpaid principal balance of term loans rolled into new originations | $ | 220,925 |
| | $ | 200,637 |
| $ | 167,687 |
| | $ | 138,115 |
|
The accompanying notes are an integral part of these condensed consolidated financial statements.
ON DECK CAPITAL, INC. AND SUBSIDIARIES
Notes to Unaudited Condensed Consolidated Financial Statements
1. Organization and Summary of Significant Accounting Policies
On Deck Capital, Inc.’s principal activity is providing financing to small businesses located throughout the United States, as well as Canada and Australia, through term loans and lines of credit. We use technology and analytics to aggregate data about a small business and then quickly and efficiently analyze the creditworthiness of the business using our proprietary credit-scoring model. We originate most of the loans in our portfolio and also purchase loans from ouran issuing bank partner. We subsequently transfer most loansof our loan volume into one of our wholly-owned subsidiaries or, from timeand also have the option to time, depending upon market conditions and other factors, may sell them through OnDeckOnDeck Marketplace®.
Basis of Presentation and Principles of Consolidation
We prepare our condensed consolidated financial statements and footnotes in accordance with accounting principles generally accepted in the United States of America, or GAAP, as contained in the Financial Accounting Standards Board, or FASB, Accounting Standards Codification, or ASC. All intercompany transactions and accounts have been eliminated in consolidation. Certain reclassifications have been made to the prior year amounts to conform to the current year presentation. When used in these notes to condensed consolidated financial statements, the terms "we," "us," "our" or similar terms refers to On Deck Capital, Inc. and its consolidated subsidiaries.
We consolidate the financial position and results of operations of these entities. The noncontrolling interest, which is presented as a separate component of our consolidated equity, represents the minority owners' proportionate share of the equity of the jointly owned entities. The noncontrolling interest is adjusted for the minority owners' share of the earnings, losses, investments and distributions.
Use of Estimates
The preparation of financial statements in conformity with GAAP requires us to make estimates and assumptions that affect the reported amounts in the condensed consolidated financial statements and accompanying notes. Significant estimates include allowance for loan losses, valuation of warrants, stock-based compensation expense, servicing assets/liabilities, loans purchased, capitalized software development costs, the useful lives of long-lived assets, servicing assets/liabilities, loans purchased, and valuation allowance for deferred tax assets. We base our estimates on historical experience, current events and other factors we believe to be reasonable under the circumstances. These estimates and assumptions are inherently subjective in nature; actual results may differ from these estimates and assumptions.
Recently Adopted Accounting Standards
In March 2016, the FASB issued ASU 2016-09, Improvements to Employee Share-Based Payment Accounting. ASU 2016-09 simplifies several aspects of accounting for share-based payment award transactions which include the income tax consequences, classification of awards as either equity or liabilities, classification on the statement of cash flows and forfeiture rate calculations. We adopted the new standard effective January 1, 2017. The adoption of this standard did not have a material impact on our consolidated financial statements and no prior period amounts were adjusted.
Recent Accounting Pronouncements Not Yet Adopted
In May 2014, the FASB issued ASU 2014-09, Revenue Recognition, which creates ASC 606, Revenue from Contracts with Customers, and supersedes ASC 605, Revenue Recognition. ASU 2014-09 requires revenue to be recognized in an amount that reflects the consideration to which the entity expects to be entitled in exchange for goods or services and also requires additional disclosure about the nature, amount, timing, and uncertainty of revenue and cash flows from customer contracts. The new standard will be effective for annual reporting periods beginning after December 15, 2017,FASB subsequently issued numerous amendments including interim periods within that reporting period. Early adoption is permitted for annual reporting periods beginning after December 15, 2016. In March 2016, the FASB issued ASU 2016-08 - Principal versus Agent Considerations, which makes amendments to the new revenue standard on assessing whether an entity is a principal or an agent in a revenue transaction and impacts whether an entity reports revenue on a gross or net basis. In April 2016, the FASB issued ASU 2016-10 - Identifying Performance Obligations and Licensing, which makes amendments to the new revenue standard regarding the identification of performance obligations and accounting for the license of intellectual property. In May 2016, the FASB issued ASU 2016-12 - Narrow-Scope Improvements and Practical Expedients, which makes amendments to the new revenue standard regarding assessing collectibility, presentation of sales taxes, noncash consideration and completed contracts and contract modifications at the time of transition to the new standard.. Each amendment has the same effective date and transition requirements as the new revenue recognition standard. We completed our initial assessment of the impact of the new revenue standard noting that revenue generated in accordance with ASC 310, Receivables, and ASC 860, Transfers and Servicing, is explicitly excluded from the scope of ASC 606. Accordingly, we have concluded that our interest income, gains on loan sales and loan servicing income will not be affected by the adoption of ASC 606. Marketing fees from our
issuing bank partner as well as certain fees associated with OnDeck-as-a-Service will be within the scope of ASC 606. We will adopt the requirements ofadopted the new standard effective January 1, 2018 and intend to applyapplied the modified retrospective method of adoption. The adoption with theof ASC 606 did not have a material effect on our condensed consolidated financial statements and disclosures, nor did it result in a cumulative effect of adoption, if material, recognizedadjustment at the date of initial application. We believe that ASC 606 will have little, if any, impact
In November 2016, the FASB issued ASU 2016-18, Statement of Cash Flows (Topic 230): Restricted Cash. ASU 2016-18 intends to reduce diversity in practice for the classification and presentation of changes in restricted cash on the timingstatement of cash flows. ASU 2016-18 clarifies that transfers between cash, cash equivalents, and amountamounts generally described as restricted cash or restricted cash equivalents are not part of revenue recognitionthe entity’s operating, investing, and financing activities, and details of those transfers should not be reported as compared tocash flow activities in the currentstatement of cash flows. It requires that a statement of cash flows explain the change during the period in the total of cash, cash equivalents, and amounts generally described as restricted cash or restricted cash equivalents. Therefore, amounts generally described as restricted cash and restricted cash equivalents should be included with cash and cash equivalents when reconciling the beginning-of-period and end-of-period total amounts shown on the statement of cash flows. We adopted the new standard effective January 1, 2018 and that there will be no material impact upon adoption.longer present restricted cash as a reconciling item in our consolidated statement of cash flows. For the six months ended June 30, 2017, cash flows from investing activities increased $9.7 million and the net decrease in cash and cash equivalents of $1.6 million became a net increase in cash, cash equivalents and restricted cash of $8.1 million.
Recent Accounting Pronouncements Not Yet Adopted
In February 2016, the FASB issued ASU 2016-02, Leases, which creates ASC 842, Leases, and supersedes ASC 840, Leases. ASU 2016-02 requires lessees to recognize a right-of-use asset and lease liability for all leases with terms of more than 12 months. Recognition, measurement and presentation of expenses will depend on classification as a finance or operating lease. The new standardguidance will be effective for annual reporting periods beginning after December 15, 2018, including interim periods within that reporting period and is applied retrospectively. Early adoption is permitted. We are currently assessing the impact that the adoption of this standardguidance will have on our consolidated financial statements.
In June 2016, the FASB issued ASU 2016-13, Measurement of Credit Losses on Financial Instruments. ASU 2016-13 will change the impairment model and how entities measure credit losses for most financial assets. The standard requires entities to use the new expected credit loss impairment model which will replace the incurred loss model used today. The new standardguidance will be effective for annual reporting periods beginning after December 15, 2019. Early adoption is permitted, but not prior to December 15, 2018. We are currently assessing the impact that the adoption of this standardguidance will have on our consolidated financial statements.
2. Net LossEarnings Per Common Share
Basic and diluted net lossincome (loss) per common share is calculated as follows (in thousands, except share and per share data):
|
| | | | | | | | | | | | | | | |
| | Three Months Ended September 30, | | Nine Months Ended September 30, |
| | 2017 | | 2016 | | 2017 | | 2016 |
| Numerator: | | | | | | | |
| Net loss | $ | (4,532 | ) | | $ | (17,173 | ) | | $ | (18,703 | ) | | $ | (49,022 | ) |
| Less: net loss attributable to noncontrolling interest | 458 |
| | 539 |
| | 2,073 |
| | 1,920 |
|
| Net loss attributable to On Deck Capital, Inc. common stockholders | $ | (4,074 | ) | | $ | (16,634 | ) | | $ | (16,630 | ) | | $ | (47,102 | ) |
| Denominator: | | | | | | | |
| Weighted-average common shares outstanding, basic and diluted | 73,272,085 |
| | 70,971,895 |
| | 72,613,221 |
| | 70,750,037 |
|
| Net loss per common share, basic and diluted | $ | (0.06 | ) | | $ | (0.23 | ) | | $ | (0.23 | ) | | $ | (0.67 | ) |
|
| | | | | | | | | | | | | | | |
| | Three Months Ended June 30, | | Six Months Ended June 30, |
| | 2018 | | 2017 | | 2018 | | 2017 |
| Numerator: | | | | | | | |
| Net Income (loss) | $ | 4,774 |
| | $ | (2,569 | ) | | $ | 2,338 |
| | $ | (14,171 | ) |
| Less: Net Income (loss) attributable to noncontrolling interest | (1,016 | ) | | (1,071 | ) | | (1,535 | ) | | (1,615 | ) |
| Net income (loss) attributable to On Deck Capital, Inc. common stockholders | $ | 5,790 |
| | $ | (1,498 | ) | | $ | 3,873 |
| | $ | (12,556 | ) |
| Denominator: | | | | | | | |
| Weighted-average common shares outstanding, basic | 74,385,446 |
| | 72,688,815 |
| | 74,182,929 |
| | 72,276,734 |
|
| Net income (loss) per common share, basic | $ | 0.08 |
| | $ | (0.02 | ) | | $ | 0.05 |
| | $ | (0.17 | ) |
| Effect of dilutive securities | 3,902,821 |
| | — |
| | 3,603,819 |
| | — |
|
| Weighted-average common shares outstanding, diluted | 78,288,267 |
| | 72,688,815 |
| | 77,786,748 |
| | 72,276,734 |
|
| Net income (loss) per common share, diluted | $ | 0.07 |
| | $ | (0.02 | ) | | $ | 0.05 |
| | $ | (0.17 | ) |
| Anti-dilutive securities excluded | 5,174,846 |
| | 12,018,301 |
| | 5,351,219 |
| | 12,069,791 |
|
Diluted lossThe difference between basic and diluted income per common share ishas been calculated using the same as basic loss per common share for all periods presented becauseTreasury Stock Method based on the effectsassumed exercise of potentially dilutive items were anti-dilutive givenoutstanding stock options, the vesting of restricted stock awards, and the issuance of stock under our net losses.employee stock purchase plan. The following common share equivalent securities have been included in the calculation of dilutive weighted-average common shares outstanding: |
| | | | | | | | | | | |
| | Three Months Ended June 30, | | Six Months Ended June 30, |
| | 2018 | | 2017 | | 2018 | | 2017 |
| Dilutive Common Share Equivalents | | | | | | | |
| Weighted Average common shares outstanding | 74,385,446 |
| | 72,688,815 |
| | 74,182,929 |
| | 72,276,734 |
|
| Restricted stock units | 1,018,066 |
| | — |
| | 768,172 |
| | — |
|
| Stock options | 2,860,430 |
| | — |
| | 2,830,587 |
| | — |
|
| Employee stock purchase program | 24,325 |
| | — |
| | 5,060 |
| | — |
|
| Total dilutive common share equivalents | 78,288,267 |
| | 72,688,815 |
| | 77,786,748 |
| | 72,276,734 |
|
The following number of shares of common stock were excluded from the calculation of weighted-averagediluted net income per share attributable to common shares outstanding because thestockholders. Their effect is anti-dilutivewould have been antidilutive for the periods presented:
three and six months ended June 30, 2018 and 2017: | | | | Three Months Ended September 30, | | Nine Months Ended September 30, | Three Months Ended June 30, | | Six Months Ended June 30, |
| | 2017 | | 2016 | | 2017 | | 2016 | 2018 | | 2017 | | 2018 | | 2017 |
| Anti-Dilutive Common Share Equivalents | | | | | | | | | | | | | | |
| Warrants to purchase common stock | 22,000 |
| | 22,000 |
| | 22,000 |
| | 22,000 |
| 22,000 |
| | 22,000 |
| | 22,000 |
| | 22,000 |
|
| Restricted stock units | 3,528,871 |
| | 4,225,480 |
| | 3,528,871 |
| | 4,225,480 |
| 429,942 |
| | 2,757,192 |
| | 600,632 |
| | 2,757,192 |
|
| Stock options | 8,227,736 |
| | 11,997,551 |
| | 8,227,736 |
| | 11,997,551 |
| 4,722,904 |
| | 9,159,794 |
| | 4,728,587 |
| | 9,159,794 |
|
| Employee stock purchase program | 34,820 |
| | 40,706 |
| | 34,820 |
| | 40,706 |
| — |
| | 79,315 |
| | — |
| | 130,805 |
|
| Total anti-dilutive common share equivalents | 11,813,427 |
| | 16,285,737 |
| | 11,813,427 |
|
| 16,285,737 |
| 5,174,846 |
| | 12,018,301 |
|
| 5,351,219 |
|
| 12,069,791 |
|
The weighted-average exercise price for warrants to purchase 2,007,846 shares of common stock was $10.70 as of SeptemberJune 30, 2017.2018. For the three months and ninesix months ended SeptemberJune 30, 2017,2018 and 20162017, a warrant to purchase 1,985,846 and 2,206,4961,985,846 shares of common stock, respectively, was excluded from anti-dilutive common share equivalents as performance conditions had not been met.
3. Loans Held for Investment and Allowance for Loan Losses
3. Loans Held for Investment and Allowance for Loan Losses
Loans held for investment consisted of the following as of SeptemberJune 30, 20172018 and December 31, 20162017 (in thousands):
| | | | September 30, 2017 | | December 31, 2016 | June 30, 2018 | | December 31, 2017 |
| Term loans | $ | 815,043 |
| | $ | 864,066 |
| $ | 871,956 |
| | $ | 804,227 |
|
| Lines of credit | 125,837 |
| | 116,385 |
| 154,630 |
| | 132,012 |
|
| Total unpaid principal balance | 940,880 |
| | 980,451 |
| 1,026,586 |
| | 936,239 |
|
| Net deferred origination costs | 16,323 |
| | 19,994 |
| 20,002 |
| | 16,557 |
|
| Total loans held for investment | $ | 957,203 |
| | $ | 1,000,445 |
| $ | 1,046,588 |
| | $ | 952,796 |
|
During the ninesix months ended SeptemberJune 30, 2018 and 2017, we paid $0.8 million and $13.7 million, respectively, to purchase term loans that we previously sold to a third party which are included in the unpaid principal balance of loans held for investment.party.
We include both loans we originate and loans fundedoriginated by our issuing bank partner and later purchased by us as part of our originations. During the three months ended SeptemberJune 30, 20172018 and 2016,2017 we purchased such loans from our issuing bank partner in the amount of $101.6$109.3 million and $147.3$120.7 million, respectively. During the ninesix months ended SeptemberJune 30, 20172018 and 2016,2017 we purchased such loans from our issuing bank partner in the amount of $367.3$248.5 million and $381.0$265.7 million, respectively.
The activitychange in the allowance for loan losses for the three months and six months ended SeptemberJune 30, 20172018 and 20162017 consisted of the following (in thousands):
| | | | Three Months Ended September 30, | | Nine Months Ended September 30, | Three Months Ended June 30, | | Six Months Ended June 30, |
| | 2017 | | 2016 | | 2017 | | 2016 | 2018 | | 2017 | | 2018 | | 2017 |
| Balance at beginning of period | $ | 105,217 |
| | $ | 73,849 |
| | $ | 110,162 |
| | $ | 53,311 |
| $ | 118,921 |
| | $ | 118,075 |
| | $ | 109,015 |
| | $ | 110,162 |
|
| Recoveries of loans previously charged off | | 3,206 |
| | 4,226 |
| | 6,551 |
| | 6,843 |
|
| Loans charged off | | (31,362 | ) | | (49,817 | ) | | (61,094 | ) | | (90,701 | ) |
| Provision for loan losses | 39,582 |
| | 36,586 |
| | 118,495 |
| | 94,294 |
| 33,293 |
| | 32,733 |
| | 69,586 |
| | 78,913 |
|
| Loans charged off | (45,257 | ) | | (25,268 | ) | | (135,958 | ) | | (65,411 | ) | |
| Recoveries of loans previously charged off | 5,330 |
| | 2,201 |
| | 12,173 |
| | 5,174 |
| |
| Allowance for loan losses at end of period | $ | 104,872 |
| | $ | 87,368 |
| | $ | 104,872 |
| | $ | 87,368 |
| $ | 124,058 |
| | $ | 105,217 |
| | $ | 124,058 |
| | $ | 105,217 |
|
When loans are charged-off, we maytypically continue to attempt to recover amounts from the respective borrowers and guarantors, or pursue our rightsincluding, when we deem it appropriate, through formal legal action. Alternatively, we may sell such previously charged-off loans to a third-party debt collector. The proceeds from these sales are recorded as a component of the recoveries of loans previously charged off. For the three months ended SeptemberJune 30, 20172018 and 2016,2017, previously charged-off loans sold accounted for $2.4 $0.2
million and $1.2$1.9 million, respectively, of recoveries of loans previously charged off. For the ninesix months ended SeptemberJune 30, 20172018 and 2016,2017, previously charged-off loans sold accounted for $6.2$0.7 million and $3.1$3.8 million, respectively, of recoveries of loans previously charged off.
As of SeptemberJune 30, 20172018 and December 31, 2016,2017, our off-balance sheet credit exposure related to the undrawn line of credit balances was $194.0$228.0 million and $164.5$204.6 million, respectively. The related reserve on unfunded loan commitments was $4.1$5.1 million and $3.9$4.4 million as of SeptemberJune 30, 20172018 and December 31, 2016,2017, respectively. Net adjustments to the accrual for unfunded loan commitments are included in general and administrative expenses.expense.
The following table contains information, on a combined basis, regarding the unpaid principal balance of loans we originated and the amortized cost of loans purchased from third parties other than our issuing bank partner related to non-delinquent,current, paying and non-paying delinquent loans as of SeptemberJune 30, 20172018 and December 31, 20162017 (in thousands):
| | | | September 30, 2017 | | December 31, 2016 | June 30, 2018 | | December 31, 2017 |
| Non-delinquent loans | $ | 835,320 |
| | $ | 890,297 |
| |
| Current loans | | $ | 938,369 |
| | $ | 850,060 |
|
| Delinquent: paying (accrual status) | 61,953 |
| | 36,073 |
| 52,071 |
| | 49,252 |
|
| Delinquent: non-paying (non-accrual status) | 43,607 |
| | 54,081 |
| 36,146 |
| | 36,927 |
|
| Total | $ | 940,880 |
| | $ | 980,451 |
| $ | 1,026,586 |
| | $ | 936,239 |
|
The portion of the allowance for loan losses attributable to non-delinquentcurrent loans was $60.6$81.9 million and $59.5$74.0 million as of SeptemberJune 30, 20172018 and December 31, 2016,2017, respectively, while the portion of the allowance for loan losses attributable to delinquent loans was $44.3$42.2 million and $50.7$35.0 million as of SeptemberJune 30, 20172018 and December 31, 2016,2017, respectively.
The following table shows an aging analysis of the unpaid principal balance related to loans held for investment by delinquency status as of SeptemberJune 30, 20172018 and December 31, 20162017 (in thousands):
| | | | September 30, 2017 | | December 31, 2016 | June 30, 2018 | | December 31, 2017 |
| By delinquency status: | | | | | | |
| Non-delinquent loans | $ | 835,320 |
| | $ | 890,297 |
| |
| Current loans | | $ | 938,369 |
| | $ | 850,060 |
|
| 1-14 calendar days past due | 34,724 |
| | 25,899 |
| 18,466 |
| | 23,611 |
|
| 15-29 calendar days past due | 20,055 |
| | 15,990 |
| 12,722 |
| | 12,528 |
|
| 30-59 calendar days past due | 20,975 |
| | 22,677 |
| 17,788 |
| | 22,059 |
|
| 60-89 calendar days past due | 15,658 |
| | 13,952 |
| 14,320 |
| | 12,809 |
|
| 90 + calendar days past due | 14,148 |
| | 11,636 |
| 24,921 |
| | 15,172 |
|
| Total unpaid principal balance | $ | 940,880 |
| | $ | 980,451 |
| $ | 1,026,586 |
| | $ | 936,239 |
|
4. Servicing Rights
As of SeptemberJune 30, 20172018 and December 31, 2016, we serviced term loans owned by others with a2017, the remaining unpaid principal balance of $141.0term loans we serviced that previously were sold was $160.0 million and $222.0$181.0 million, respectively. No loans were sold during the three and six months ended June 30, 2018. During the three months and six months ended SeptemberJune 30, 2017, and 2016, we sold through OnDeck Marketplace loans with an unpaid principal balance of $5.3$9.1 million and $87.5 million, respectively, and during the nine months ended September 30, 2017 and 2016, we sold loans with an unpaid principal balance of $55.5 million and $284.9$50.2 million, respectively.
For the three months ended SeptemberJune 30, 20172018 and 2016,2017, we earned $0.4$0.2 million and $0.3$0.6 million of servicing revenue, respectively. For the ninesix months ended SeptemberJune 30, 20172018 and 2016,2017, we earned $1.3$0.5 million and $0.9 million of servicing revenue, respectively.
The following table summarizes the activity related to the fair value of our servicing assets for the three months and ninesix months ended SeptemberJune 30, 2018 and 2017 (in thousands):
|
| | | | | | | | | | | | | | | |
| | Three Months Ended September 30, | | Nine Months Ended
September 30, |
| | 2017 | | 2016 | | 2017 | | 2016 |
| Fair value at the beginning of period | $ | 701 |
| | $ | 1,989 |
| | $ | 1,131 |
| | $ | 3,489 |
|
| Addition: | | | | | | | |
| Servicing resulting from transfers of financial assets | 275 |
| | 717 |
| | 938 |
| | 2,272 |
|
| Changes in fair value: | | | | | | | |
Other changes in fair value (1) | (347 | ) | | (1,019 | ) | | (1,440 | ) | | (4,074 | ) |
| Fair value at the end of period (Level 3) | $ | 629 |
| | $ | 1,687 |
| | $ | 629 |
| | $ | 1,687 |
|
___________ |
| | | | | | | | | | | | | | | |
| | Three Months Ended June 30, | | Six Months Ended June 30, |
| | 2018 | | 2017 | | 2018 | | 2017 |
| Fair value at the beginning of period | $ | 75 |
| | $ | 860 |
| | $ | 154 |
| | $ | 1,131 |
|
| Addition: | | | | | | | |
| Servicing resulting from transfers of financial assets | 11 |
| | 233 |
| | 63 |
| | 663 |
|
| Changes in fair value: | | | | | | | |
| Change in inputs or assumptions used in the valuation model | — |
| | — |
| | — |
| | — |
|
Other changes in fair value (1) | (57 | ) | | (392 | ) | | (188 | ) | | (1,093 | ) |
| Fair value at the end of period (Level 3) | $ | 29 |
| | $ | 701 |
| | $ | 29 |
| | $ | 701 |
|
(1)Represents changes due to collection of expected cash flows through SeptemberJune 30, 20172018 and 2016.2017.
5. Debt
The following table summarizes our outstanding debt as of SeptemberJune 30, 20172018 and December 31, 20162017 (in thousands):
|
| | | | | | | | | | | | | |
| | | | | | | | Outstanding |
| Type | | Maturity Date | | Weighted Average Interest Rate at June 30, 2018 | | June 30, 2018 | | December 31, 2017 |
| Funding Debt: | | | | | | | | | |
| ODAST II | Securitization | | April 2022 (1) | | 3.8% | | $ | 225,000 |
| | $ | 250,000 |
|
| ODART | Revolving | | March 2019 | | 4.7% | | 87,446 |
| | 102,058 |
|
| RAOD | Revolving | | November 2018 | | 5.5% | | 92,644 |
| | 86,478 |
|
| ODAC | Revolving | | May 2019 | | 9.3% | | 73,599 |
| | 62,350 |
|
| ODAF | Revolving | | February 2020 (2) | | 9.2% | | 75,000 |
| | 75,000 |
|
| PORT II | Revolving | | December 2018 | | 4.7% | | 68,442 |
| | 63,851 |
|
| LAOD | Revolving | | October 2022 (3) | | 4.0% | | 72,220 |
| | — |
|
| Other Agreements | Various | | Various (4) | | 8.0% | | 67,543 |
| | 50,706 |
|
| | | | | | 5.6% | | 761,894 |
| | 690,443 |
|
| Deferred debt issuance cost | | | | | | | (6,174 | ) | | (6,174 | ) |
| Total Funding Debt | | | | | | | 755,720 |
| | 684,269 |
|
| | | | | | | | | | |
| Corporate Debt: | | | | | | | | | |
| Square 1 | Revolving | | October 2018 | | 6.0% | | — |
| | 8,000 |
|
| Deferred debt issuance cost | | | | | | | — |
| | (15 | ) |
| Total Corporate Debt | | | | | | | — |
| | 7,985 |
|
(1)The period during which new borrowings may be made under this facility expires in March 2020. |
| | | | | | | | | | | | | |
| Description | Type | | Maturity Date | | Weighted Average Interest
Rate at September 30, 2017 | | September 30, 2017 | | December 31, 2016 |
| Funding Debt: | | | | | | | | | |
| ODAST II Agreement | Securitization Facility | | May 2020 (1) | | 4.7% | | $ | 250,000 |
| | $ | 250,000 |
|
| ODART Agreement | Revolving | | March 2019 | | 3.9% | | 123,498 |
| | 133,767 |
|
| RAOD Agreement | Revolving | | November 2018 | | 3.7% | | 71,119 |
| | 99,985 |
|
| ODAF I Agreement | Revolving | | February 2020 (2) | | 8.5% | | 81,633 |
| | 100,000 |
|
| ODAC Agreement | Revolving | | May 2019 | | 8.5% | | 76,321 |
| | 65,486 |
|
| PORT II Agreement | Revolving | | December 2018 | | 3.7% | | 67,296 |
| | 52,397 |
|
| Other Agreements | Various | | Various (3) | | Various | | 39,385 |
| | 30,887 |
|
| | | | | | | | 709,252 |
| | 732,522 |
|
| Deferred Debt Issuance Cost | | | | | | | (6,254 | ) | | (5,883 | ) |
| Total Funding Debt | | | | | | | $ | 702,998 |
| | $ | 726,639 |
|
| | | | | | | | | | |
| Corporate Debt: | | | | | | | | | |
| Square 1 Agreement | Revolving | | October 2018 | | 5.5% | | 17,200 |
| | 28,000 |
|
| Deferred Debt Issuance Cost | | | | | | | (20 | ) | | (34 | ) |
| Total Corporate Debt | | | | | | | $ | 17,180 |
| | $ | 27,966 |
|
(3) The period during which new borrowings may be made under this debt facility expires in April 2022.
| |
(1)(4) Maturity dates range from July 2018 through November 2020. | The period during which remaining cash flow can be used to purchase additional loans expires April 2018. |
| |
(2)
| The period during which new borrowings may be made under this facility expires in February 2019. |
| |
(3)
| Maturity dates range from October 2017 to December 2018. |
On April 13, 2018, our wholly-owned subsidiary, Loan Assets of OnDeck, LLC, established a new asset-backed revolving debt facility with a commitment amount of $100 million and an interest rate of 1-month LIBOR + 2.0%. The period during which new borrowings may be made under this facility expires on April 13, 2022 and the final maturity date is October 13, 2022.
On April 17, 2018, our wholly-owned subsidiary, OnDeck Asset Securitization Trust II LLC, issued $225 million in initial principal amount of fixed-rate asset backed offered notes in a securitization transaction. The notes were issued in four classes
with a weighted average fixed interest rate of 3.75%. The revolving period expires on March 31, 2020 and the final maturity date is April 2022. The net proceeds of this transaction were used, together with other available funds, to voluntarily prepay in full all $250 million of notes from a prior securitization.
On June 27, 2018, our wholly-owned subsidiary, Canada OnDeck Asset Funding, L.P, established a new asset-backed revolving debt facility with a commitment amount of CAD25 million and an additional CAD25 million of capacity available at the discretion of the lenders. The interest rate for the facility is a commercial paper rate + 4%. The period during which new borrowings may be made under this facility expires on June 27, 2020 and the final maturity date is June 27, 2021.
On June 28, 2018, OnDeck Funding Trust No. 2, a wholly-owned subsidiary of On Deck Capital Australia Pty Ltd, established a new asset-backed revolving debt facility with a commitment amount of AUD75 million. The interest rate for the facility is 1-month BBSW+ 3.75%. The period during which new borrowings may be made under this facility expires on December 28, 2019 and the final maturity date is June 28, 2020.
Certain of our loans held for investment are pledged as collateral for borrowings in our funding debt facilities. These loans totaled $773.7$941.2 million and $886.4$852.3 million as of SeptemberJune 30, 20172018 and December 31, 2016,2017, respectively. Our corporate debt facility is collateralized by substantially all of our assets.
ODAF I Agreement
On February 14, 2017, we entered into an amendment of the ODAF I Agreement which provided for an increase in the Lenders' revolving commitment from an aggregate amount of $100 million to $150 million, the extension of the revolving commitment termination date by approximately six months to February 14, 2019, and various technical, definitional, conforming and other changes.
ODART Agreement
On March 20, 2017, we entered into an amendment and restatement of the ODART Agreement which provided for a $50 million increase in the maximum amount of the Class A revolving loans and an increase up to $1.8 million in the maximum amount of the Class B revolving loans, thereby increasing the total facility size up to $214.1 million, an extension of the revolving commitment period during which ODART may utilize funding capacity under the Deutsche Bank Facility to March 20, 2019, a borrowing base advance rate for the Class A revolving loans of 85% and a borrowing base advance rate for the Class B revolving loans of 91%; and various technical, definitional, conforming and other changes.
ODAC Agreement
On May 4, 2017, we renewed the ODAC facility with amended terms, which provided for an increase in the revolving commitments from $75 million to $100 million and an extension of the revolving commitment period to May 3, 2019. The interest rate decreased to LIBOR (minimum of 0.75%) + 7.25% from LIBOR (minimum of 0.0%) + 9.25% and the advance rate increased from 75% to 85%.
RAOD Agreement
On May 25, 2017, we renewed the RAOD facility with amended terms which provided for an extension of the revolving commitment period to November 22, 2018; a decrease in the interest rate to LIBOR + 2.5% from LIBOR + 3.0%; and various technical, definitional, conforming and other changes.
6. Fair Value of Financial Instruments
Assets and Liabilities Measured at Fair Value on a Recurring Basis Using Significant Unobservable Inputs (Level 3)
We evaluate our financial assets and liabilities subject to fair value measurements on a recurring basis to determine the appropriate level at which to classify them for each reporting period. Due to the lack of transparency and quantity of transactions related to trades of servicing rights of comparable loans, we utilize an income valuation technique to estimate fair value. We utilize industry-standard modeling, such as discounted cash flow models, to arrive at an estimate of fair value and may utilize third-party service providers to assist in the valuation process. This determination requires significant judgments to be made.
The following tables present information about our assets and liabilities that are measured at fair value on a recurring basis as of SeptemberJune 30, 20172018 and December 31, 20162017 (in thousands):
|
| | | | | | | | | | | | | | | |
| | September 30, 2017 |
| Description | Level 1 | | Level 2 | | Level 3 | | Total |
Assets: | | | | | | | |
| Servicing assets | $ | �� |
| | $ | — |
| | $ | 629 |
| | $ | 629 |
|
| Total assets | $ | — |
| | $ | — |
| | $ | 629 |
| | $ | 629 |
|
| | | | December 31, 2016 | June 30, 2018 |
| Description | Level 1 | | Level 2 | | Level 3 | | Total | |
| | | Level 1 | | Level 2 | | Level 3 | | Total |
Assets: | | | | | | | | | | | | | | |
| Servicing assets | $ | — |
| | $ | — |
| | $ | 1,131 |
| | $ | 1,131 |
| $ | — |
| | $ | — |
| | $ | 29 |
| | $ | 29 |
|
| Total assets | $ | — |
| | $ | — |
| | $ | 1,131 |
| | $ | 1,131 |
| $ | — |
| | $ | — |
| | $ | 29 |
| | $ | 29 |
|
|
| | | | | | | | | | | | | | | |
| | December 31, 2017 |
| | Level 1 | | Level 2 | | Level 3 | | Total |
Assets: | | | | | | | |
| Servicing assets | $ | — |
| | $ | — |
| | $ | 154 |
| | $ | 154 |
|
| Total assets | $ | — |
| | $ | — |
| | $ | 154 |
| | $ | 154 |
|
There were no transfers between levels for the ninesix months ended SeptemberJune 30, 20172018 or December 31, 2016.2017.
The following tables presents quantitative information about the significant unobservable inputs used for certain of our Level 3 fair value measurement as of SeptemberJune 30, 20172018 and December 31, 2016:2017:
| | | | September 30, 2017 | June 30, 2018 |
| | Unobservable input | | Minimum | | Maximum | | Weighted Average | Unobservable input | | Minimum | | Maximum | | Weighted Average |
| Servicing assets | Discount rate | | 30.00 | % | | 30.00 | % | | 30.00 | % | Discount rate | | 30.00 | % | | 30.00 | % | | 30.00 | % |
| | Cost of service(1) | | 0.09 | % | | 0.14 | % | | 0.12 | % | Cost of service(1) | | 0.04 | % | | 0.13 | % | | 0.13 | % |
| | Renewal rate | | 42.72 | % | | 56.07 | % | | 52.74 | % | Renewal rate | | 41.06 | % | | 51.83 | % | | 51.01 | % |
| | Default rate | | 10.22 | % | | 11.00 | % | | 10.84 | % | Default rate | | 10.63 | % | | 10.92 | % | | 10.67 | % |
(1) Estimated cost of servicing a loan as a percentage of unpaid principal balance. | (1) Estimated cost of servicing a loan as a percentage of unpaid principal balance. | (1) Estimated cost of servicing a loan as a percentage of unpaid principal balance. |
| | | | December 31, 2016 | December 31, 2017 |
| | Unobservable input | | Minimum | | Maximum | | Weighted Average | Unobservable input | | Minimum | | Maximum | | Weighted Average |
| Servicing assets | Discount rate | | 30.00 | % | | 30.00 | % | | 30.00 | % | Discount rate | | 30.00 | % | | 30.00 | % | | 30.00 | % |
| | Cost of service(1) | | 0.09 | % | | 0.14 | % | | 0.11 | % | Cost of service(1) | | 0.04 | % | | 0.13 | % | | 0.12 | % |
| | Renewal rate | | 46.20 | % | | 56.54 | % | | 50.14 | % | Renewal rate | | 41.06 | % | | 51.83 | % | | 49.59 | % |
| | Default rate | | 10.32 | % | | 10.75 | % | | 10.48 | % | Default rate | | 10.63 | % | | 10.92 | % | | 10.70 | % |
(1) Estimated cost of servicing a loan as a percentage of unpaid principal balance. | (1) Estimated cost of servicing a loan as a percentage of unpaid principal balance. | (1) Estimated cost of servicing a loan as a percentage of unpaid principal balance. |
Changes in certain of the unobservable inputs noted above may have a significant impact on the fair value of our servicing asset. The following table summarizes the effect adverse changes in estimate would have on the fair value of the servicing asset as of SeptemberJune 30, 20172018 and December 31, 20162017 given a hypothetical changes in default rate and cost to service (in thousands):
| | | | September 30, 2017 | | December 31, 2016 | June 30, 2018 | | December 31, 2017 |
| | Servicing Assets | Servicing Assets |
| Default rate assumption: | | | | | | |
| Default rate increase of 25% | $ | (62 | ) | | $ | (98 | ) | $ | (9 | ) | | $ | (40 | ) |
| Default rate increase of 50% | $ | (120 | ) | | $ | (188 | ) | $ | (16 | ) | | $ | (76 | ) |
| Cost to service assumption: | | | | | | |
| Cost to service increase by 25% | $ | (48 | ) | | $ | (60 | ) | $ | (14 | ) | | $ | (63 | ) |
| Cost to service increase by 50% | $ | (95 | ) | | $ | (120 | ) | $ | (28 | ) | | $ | (126 | ) |
Assets and Liabilities Disclosed at Fair Value
Because our loans held for investment loans held for sale and fixed-rate debt are not measured at fair value, we are required to disclose their fair value in accordance with ASC 825. Due to the lack of transparency and comparable loans, we utilize an income valuation technique to estimate fair value. We utilize industry-standard modeling, such as discounted cash flow models, to arrive at an estimate of fair value and may utilize third-party service providers to assist in the valuation process. This determination requires significant judgments to be made. The following tables summarize the carrying value and fair value of our loans held for investment loans held for sale and fixed-rate debt (in thousands):
|
| | | | | | | | | | | | | | | | | | | |
| | September 30, 2017 |
| Description | Carrying Value | | Fair Value | | Level 1 | | Level 2 | | Level 3 |
Assets: | | | | | | | | | |
| Loans held for investment | $ | 852,331 |
| | $ | 934,867 |
| | $ | — |
| | $ | — |
| | $ | 934,867 |
|
| Total assets | $ | 852,331 |
| | $ | 934,867 |
| | $ | — |
| | $ | — |
| | $ | 934,867 |
|
| | | | | | | | | | |
| Description | | | | | | | | | |
| Liabilities: | | | | | | | | | |
| Fixed-rate debt | $ | 276,324 |
| | $ | 262,216 |
| | $ | — |
| | $ | — |
| | $ | 262,216 |
|
| Total fixed-rate debt | $ | 276,324 |
| | $ | 262,216 |
| | $ | — |
| | $ | — |
| | $ | 262,216 |
|
| | | | December 31, 2016 | June 30, 2018 |
| Description | Carrying Value | | Fair Value | | Level 1 | | Level 2 | | Level 3 | |
Assets: | | | | | | | | | | |
| Loans held for investment | $ | 890,283 |
| | $ | 979,780 |
| | $ | — |
| | $ | — |
| | $ | 979,780 |
| |
| Loans held for sale | 373 |
| | 394 |
| | — |
| | | | 394 |
| |
| | | Carrying Value | | Fair Value | | Level 1 | | Level 2 | | Level 3 |
| Assets: | | | | | | | | | | |
| Loans held for investment, net | | $ | 922,530 |
| | $ | 1,024,712 |
| | $ | — |
| | $ | — |
| | $ | 1,024,712 |
|
| Total assets | $ | 890,656 |
| | $ | 980,174 |
| | $ | — |
| | $ | — |
| | $ | 980,174 |
| $ | 922,530 |
| | $ | 1,024,712 |
| | $ | — |
| | $ | — |
| | $ | 1,024,712 |
|
| | | | | | | | | | | | | | | | | | | |
| Description | | | | | | | | | | |
| | | | | | | | | | | |
| Liabilities: | | | | | | | | | | | | | | | | | | |
| Fixed-rate debt | $ | 280,886 |
| | $ | 275,200 |
| | $ | — |
| | $ | — |
| | $ | 275,200 |
| $ | 271,367 |
| | $ | 261,717 |
| | $ | — |
| | $ | — |
| | $ | 261,717 |
|
| Total fixed-rate debt | $ | 280,886 |
| | $ | 275,200 |
| | $ | — |
| | $ | — |
| | $ | 275,200 |
| $ | 271,367 |
| | $ | 261,717 |
| | $ | — |
| | $ | — |
| | $ | 261,717 |
|
The following techniques and assumptions are used in estimating fair value:Loans held for investment and loans held for sale - Fair value is based on discounted cash flow models which contain certain unobservable inputs such as discount rate, renewal rate and default rate. |
| | | | | | | | | | | | | | | | | | | |
| | December 31, 2017 |
| | Carrying Value | | Fair Value | | Level 1 | | Level 2 | | Level 3 |
| Assets: | | | | | | | | | |
| Loans held for investment, net | $ | 843,781 |
| | $ | 932,343 |
| | $ | — |
| | $ | — |
| | $ | 932,343 |
|
| Total assets | $ | 843,781 |
| | $ | 932,343 |
| | $ | — |
| | $ | — |
| | $ | 932,343 |
|
| | | | | | | | | | |
| | | | | | | | | | |
| Liabilities: | | | | | | | | | |
| Fixed-rate debt | $ | 300,706 |
| | $ | 293,512 |
| | $ | — |
| | $ | — |
| | $ | 293,512 |
|
| Total fixed-rate debt | $ | 300,706 |
| | $ | 293,512 |
| | $ | — |
| | $ | — |
| | $ | 293,512 |
|
Fixed-rate debt - Our ODAST II Agreement and certain other agreements are considered fixed-rate debt. Fair value of our fixed-rate debt is based on a discounted cash flow model with an unobservable input of discount rate. For our variable rate debt, carrying value approximates fair value.
7. Noncontrolling Interest
The following tables summarize changes in equity, including the equity attributable to noncontrolling interests, for the ninesix months ended SeptemberJune 30, 20172018 and September 30, 20162017 (in thousands):
| | | | | | Six Months Ended June 30, 2018 |
| | | | On Deck Capital, Inc.'s stockholders' equity | | Noncontrolling interest | | Total |
| Balance as of January 1, 2018 | | | 262,045 |
| | 4,011 |
| | 266,056 |
|
| Net income (loss) | | | 3,873 |
| | (1,535 | ) | | 2,338 |
|
| Stock based compensation | | | 5,834 |
| | — |
| | 5,834 |
|
| Exercise of options and warrants | | | 39 |
| | — |
| | 39 |
|
| Employee Stock Purchase Plan | | | 968 |
| | — |
| | 968 |
|
| Cumulative translation adjustment | | | (280 | ) | | (229 | ) | | (509 | ) |
| Purchase of treasury shares | | | (441 | ) | | — |
| | (441 | ) |
| Investments by noncontrolling interests | | | — |
| | 3,403 |
| | 3,403 |
|
| Balance at June 30, 2018 | | | 272,038 |
| | 5,650 |
| | 277,688 |
|
| | | | | | | | |
| Comprehensive loss: | | | | | | | |
| Net income (loss) | | | 3,873 |
| | (1,535 | ) | | 2,338 |
|
| Other comprehensive income (loss): | | | | | | | |
| Foreign currency translation adjustment | | | (280 | ) | | (229 | ) | | (509 | ) |
| Comprehensive income (loss): | | | 3,593 |
| | (1,764 | ) | | 1,829 |
|
| | | | | | | |
| | | | | | | | | | | | | |
| | | Nine Months Ended September 30, 2017 | | Six Months Ended June 30, 2017 |
| | | On Deck Capital, Inc.'s stockholders' equity | | Noncontrolling interest | | Total | | On Deck Capital, Inc.'s stockholders' equity | | Noncontrolling interest | | Total |
| Balance as of January 1, 2017 | | $ | 259,525 |
| | $ | 4,072 |
| | $ | 263,597 |
| | $ | 259,525 |
| | $ | 4,072 |
| | $ | 263,597 |
|
| Net income (loss) | | (16,630 | ) | | (2,073 | ) | | (18,703 | ) | | (12,556 | ) | | (1,615 | ) | | (14,171 | ) |
| Stock based compensation | | 9,115 |
| | — |
| | 9,115 |
| | 6,134 |
| | — |
| | 6,134 |
|
| Exercise of options and warrants | | 490 |
| | — |
| | 490 |
| | 347 |
| | — |
| | 347 |
|
| Employee stock purchase plan | | 2,299 |
| | — |
| | 2,299 |
| | 1,618 |
| | — |
| | 1,618 |
|
| Cumulative translation adjustment | | 375 |
| | 307 |
| | 682 |
| | 240 |
| | 196 |
| | 436 |
|
| Purchase of shares for treasury | | (864 | ) | | — |
| | (864 | ) | |
| Purchase of treasury shares | | | (644 | ) | | — |
| | (644 | ) |
| Investments by noncontrolling interests | | — |
| | 3,443 |
| | 3,443 |
| | — |
| | 3,443 |
| | 3,443 |
|
| Return of equity to noncontrolling interest | | — |
| | (959 | ) | | (959 | ) | | — |
| | (960 | ) | | (960 | ) |
| Balance at September 30, 2017 | | 254,310 |
| | 4,790 |
| | 259,100 |
| |
| Balance at June 30, 2017 | | | 254,664 |
| | 5,136 |
| | 259,800 |
|
| | | | | | | | | | | | | |
| Comprehensive loss: | | | | | | | | | | | | |
| Net loss | | (16,630 | ) | | (2,073 | ) | | (18,703 | ) | | (12,556 | ) | | (1,615 | ) | | (14,171 | ) |
| Other comprehensive income (loss): | | | | | | | | | | | | |
| Foreign currency translation adjustment | | 375 |
| | 307 |
| | 682 |
| | 240 |
| | 196 |
| | 436 |
|
| Comprehensive income (loss): | | $ | (16,255 | ) | | $ | (1,766 | ) | | $ | (18,021 | ) | | $ | (12,316 | ) | | $ | (1,419 | ) | | (13,735 | ) |
| | | | | | | | |
| | | | | | | | |
| | | Nine Months Ended September 30, 2016 | |
| | | On Deck Capital, Inc.'s stockholders' equity | | Noncontrolling interest | | Total | |
| Balance as of January 1, 2016 | | $ | 322,813 |
| | $ | 6,609 |
| | $ | 329,422 |
| |
| Net income (loss) | | (47,102 | ) | | (1,920 | ) | | (49,022 | ) | |
| Stock based compensation | | 11,399 |
| | — |
| | 11,399 |
| |
| Exercise of options and warrants | | 168 |
| | — |
| | 168 |
| |
| Employee stock purchase plan | | 3,996 |
| | — |
| | 3,996 |
| |
| Cumulative translation adjustment | | 216 |
| | 177 |
| | 393 |
| |
| Purchase of shares for treasury | | (576 | ) | | — |
| | (576 | ) | |
| Balance at September 30, 2016 | | 290,914 |
| | 4,866 |
| | 295,780 |
| |
| | | | | | | | |
| Comprehensive loss: | | | | | | | |
| Net loss | | (47,102 | ) | | (1,920 | ) | | (49,022 | ) | |
| Other comprehensive income (loss): | | | | | | | |
| Foreign currency translation adjustment | | 216 |
| | 177 |
| | 393 | |
| Comprehensive income (loss): | | $ | (46,886 | ) | | $ | (1,743 | ) | | $ | (48,629 | ) | |
In the third quarter of 2015, we acquired a 67% interest in an entity, with the remaining 33% owned by an unrelated third party strategic partner, for the purpose of providing small business loans to customers of the third party. We consolidate the financial position and results of operations of that entity. On June 29, 2017, OnDeck purchased the loans owned by that entity for an immaterial amount. That entity made a liquidating distribution to us of approximately $2 million and to the unrelated third
third party of approximately $1 million representing our respective proportionate share of the equity in that entity. The loan sale and distribution effectively ended the operations of that entity. No material gain or loss was recorded.
8. Stock-Based Compensation and Employee Benefit Plans
Options
The following is a summary of option activity for the ninesix months ended SeptemberJune 30, 2017:2018:
| | | | Number of
Options | | Weighted-
Average
Exercise
Price | | Weighted-
Average
Remaining
Contractual
Term
(in years) | | Aggregate
Intrinsic
Value
(in thousands) | Number of
Options | | Weighted-
Average
Exercise
Price | | Weighted-
Average
Remaining
Contractual
Term
(in years) | | Aggregate
Intrinsic
Value
(in thousands) |
| Outstanding at January 1, 2017 | 11,426,296 |
| | $ | 6.10 |
| | — |
| | — |
| |
| Outstanding at January 1, 2018 | | 7,918,853 |
| | $ | 5.75 |
| | — |
| | — |
|
| Granted | 368,894 |
| | $ | 4.13 |
| | — |
| | — |
| 1,031,550 |
| | $ | 5.41 |
| | — |
| | — |
|
| Exercised | (1,351,648 | ) | | $ | 0.87 |
| | — |
| | — |
| (380,151 | ) | | $ | 0.55 |
| | — |
| | — |
|
| Forfeited | (1,095,455 | ) | | $ | 9.07 |
| | — |
| | — |
| (211,743 | ) | | $ | 8.16 |
| | — |
| | — |
|
| Expired | (1,120,351 | ) | | $ | 11.36 |
| | — |
| | — |
| (93,402 | ) | | $ | 11.81 |
| | — |
| | — |
|
| Outstanding at September 30, 2017 | 8,227,736 |
| | $ | 5.76 |
| | 6.7 |
| | $ | 13,831 |
| |
| Exercisable at September 30, 2017 | 5,948,010 |
| | $ | 4.98 |
| | 6.1 |
| | $ | 13,510 |
| |
| Vested or expected to vest as of September 30, 2017 | 8,164,605 |
| | $ | 5.75 |
| | 6.7 |
| | $ | 13,827 |
| |
| Outstanding at June 30, 2018 | | 8,265,107 |
| | $ | 5.82 |
| | 6.1 |
| | $ | 22,721 |
|
| Exercisable at June 30, 2018 | | 6,393,532 |
| | $ | 5.62 |
| | 5.4 |
| | $ | 20,300 |
|
| Vested or expected to vest as of June 30, 2018 | | 8,142,643 |
| | $ | 5.82 |
| | 6.1 |
| | $ | 22,521 |
|
Total compensation cost related to nonvested option awards not yet recognized as of SeptemberJune 30, 20172018 was $7.3$4.3 million and will be recognized over a weighted-average period of approximately 1.82.0 years. The aggregate intrinsic value of employee options exercised during the ninesix months ended SeptemberJune 30, 2018 and 2017 and 2016 was $5.0$2.0 million and $2.4$3.6 million, respectively.
Restricted Stock Units
The following table summarizes our activities of Restricted Stock Units ("RSUs") and Performance Restricted Stock Units ("PRSUs") activity during the ninesix months ended SeptemberJune 30, 2017:2018:
|
| | | | | | |
| | Number of RSUs | | Weighted-Average Grant Date Fair Value |
| Unvested at January 1, 2017 | 3,888,768 |
| | $ | 8.46 |
|
| RSUs and PRSUs granted | 1,791,690 |
| | $ | 4.50 |
|
| RSUs vested | (546,671 | ) | | $ | 9.09 |
|
| RSUs and PRSUs forfeited/expired | (1,604,916 | ) | | $ | 8.15 |
|
| Unvested at September 30, 2017 | 3,528,871 |
| | $ | 6.30 |
|
| Expected to vest after September 30, 2017 | 3,121,430 |
| | $ | 6.36 |
|
|
| | | | | | |
| | Number of RSUs | | Weighted-Average Grant Date Fair Value |
| Unvested at January 1, 2018 | 3,342,640 |
| | $ | 6.18 |
|
| RSUs and PRSUs granted | 1,037,461 |
| | $ | 5.33 |
|
| RSUs vested | (365,198 | ) | | $ | 7.05 |
|
| RSUs forfeited/expired | (328,328 | ) | | $ | 6.42 |
|
| Unvested at June 30, 2018 | 3,686,575 |
| | $ | 5.84 |
|
| Expected to vest after June 30, 2018 | 3,129,517 |
| | $ | 5.94 |
|
As of SeptemberJune 30, 2017,2018, there was $16.3$15 million of unrecognized compensation cost related to unvested RSUs and PRSUs, which is expected to be recognized over the next 2.7a weighted-average period of 2.6 years.
Stock-based compensation expense related to stock options, RSUs, PRSUs and the Employee Stock Purchase ProgramPlan ("ESPP") are included in the following line items in our accompanying condensed consolidated statements of operations for the three months and ninesix months ended SeptemberJune 30, 20172018 and 20162017 (in thousands):
| | | | Three Months Ended September 30, | | Nine Months Ended September 30, | Three Months Ended June 30, | | Six Months Ended June 30, |
| | 2017 | | 2016 | | 2017 | | 2016 | 2018 | | 2017 | | 2018 | | 2017 |
| Sales and marketing | $ | 538 |
| | $ | 920 |
| | $ | 1,830 |
| | $ | 2,749 |
| $ | 505 |
| | $ | 521 |
| | $ | 1,040 |
| | $ | 1,292 |
|
| Technology and analytics | 499 |
| | 793 |
| | 1,824 |
| | 2,437 |
| 657 |
| | 542 |
| | 1,253 |
| | 1,325 |
|
| Processing and servicing | 99 |
| | 227 |
| | 429 |
| | 781 |
| 94 |
| | 157 |
| | 201 |
| | 330 |
|
| General and administrative | 1,920 |
| | 1,821 |
| | 5,438 |
| | 5,456 |
| 1,538 |
| | 1,754 |
| | 3,510 |
| | 3,518 |
|
| Total | $ | 3,056 |
| | $ | 3,761 |
| | $ | 9,521 |
| | $ | 11,423 |
| $ | 2,794 |
| | $ | 2,974 |
| | $ | 6,004 |
| | $ | 6,465 |
|
9. Commitments and Contingencies
Commitments under Operating Leases
Effective February 1, 2018, we terminated our lease obligation for the 12th floor of our New York office which accounted for approximately 32% of our total New York office space. The lease of the 12th floor was previously scheduled to continue through December 2026. As part of the termination, we paid the landlord a cash surrender fee of approximately $2.6 million and recorded a net charge of approximately $3.2 million in the quarter ending March 31, 2018. The net charge includes the surrender fee and approximately $4.0 million related to the impairment of leasehold improvements and other fixed assets in the surrendered space, which were partially offset by other deferred credits.
On March 29, 2018, we terminated our lease obligation with respect to a portion of our Denver office which accounted for approximately 38% of our total Denver office space. Our lease of that space was previously scheduled to continue through April 2026. As part of the termination, we paid a surrender fee and related charges of approximately $900,000 and recorded a net charge of approximately $1 million in the quarter ended March 31, 2018. The net charge includes the surrender fee and the impairment of leasehold improvements and other fixed assets in the surrendered space, which were partially offset by other deferred credits.
The net charges related to these lease terminations were allocated to each of our operating expense line items on our condensed consolidated statement of operations with the exception of the aggregate impairment charges of leasehold improvements and other fixed assets in the surrendered spaces of approximately $5.7 million which were included in general and administrative expense.
In the aggregate, the termination of these two leases reduced future required rental payments by approximately $23 million through 2026.
Concentrations of Credit Risk
Financial instruments that potentially subject us to significant concentrations of credit risk consist principally of cash, cash equivalents, restricted cash and loans. We hold cash, cash equivalents and restricted cash in accounts at regulated domestic financial institutions in amounts that exceed or may exceed FDIC insured amounts and at non-U.S. financial institutions where deposited amounts may be uninsured. We believe these institutions to be of acceptable credit qualityrecognized standing and we have not experienced any related losses to date.
There is no single customerWe are exposed to default risk on loans we originate and hold and that we purchase from our issuing bank partner. We perform an evaluation of each customer's financial condition and during the term of the customer's loan(s), we have the contractual right to limit a customer's ability to take working capital loans or groupother financing from other lenders that may cause a material adverse change in the financial condition of customers that comprise a significant portion of our loan portfolio.the customer.
Contingencies
From time to time we are subject to legal proceedings and claims in the ordinary course of business. The results of such matters cannot be predicted with certainty. However, we believe that the final outcome of any such current matters will not result in a material adverse effect on our consolidated financial condition, consolidated results of operations or consolidated cash flows.
|
| |
| Item 2. | Management’s Discussion and Analysis of Financial Condition and Results of Operations |
You should read the following discussion and analysis of our financial condition and results of operations together with our unaudited condensed consolidated financial statements and the related notes, and other financial information included elsewhere in this report. Some of the information contained in this discussion and analysis, including information with respect to our plans and strategy for our business, includes forward-looking statements that involve risks and uncertainties. You should review the “Cautionary Note Regarding Forward-Looking Statements” and Part II —- Item 1A. "Risk Factors""“Risk Factors” sections of this report for a discussion of important factors that could cause actual results to differ materially from the results described in, or implied by, the forward-looking statements contained in the following discussion and analysis.
CAUTIONARY NOTE REGARDING FORWARD-LOOKING STATEMENTS
This report contains forward-looking statements within the meaning of the Private Securities Litigation Reform Act of 1995 and other legal authority. These forward-looking statements concern our operations, economic performance, financial condition, goals, beliefs, future growth strategies, objectives, plans and current expectations.
Forward-looking statements appear throughout this report including in Part I - Item 2. Management’s Discussion and Analysis of Financial Condition and Results of Operations.Operations, Part II - Item 1. Legal Proceedings and Part II - Item 1A. Risk Factors. Forward-looking statements can generally be identified by words such as “will,” “enables,” “expects,” "intends," "may,"“intends,” “may,” “allows,” "plan,"“plan,” “continues,” “believes,” “anticipates,” “estimates” or similar expressions.
Forward-looking statements are neither historical facts nor assurances of future performance. They are based only on our current beliefs, expectations and assumptions regarding the future of our business, anticipated events and trends, the economy and other future conditions. As such, they are subject to inherent uncertainties, risks and changes in circumstances that are difficult to predict and in many cases outside our control. Therefore, you should not rely on any of these forward-looking statements. Our expected results may not be achieved, and actual results may differ materially from our expectations.
Important factors that could cause or contribute to such differences include risks relating to: our ability to attract potential customers to our platform and broaden our distribution capabilities and offerings; the degree to which potential customers apply for loans, are approved and borrow from us; anticipated trends, growth rates, loan originations, volume of loans sold and challenges in our business and in the markets in which we operate; the ability of our customers to repay loans and our ability to accurately assess creditworthiness; our ability to adequately forecast and reserve for loan losses; the impact of our decision to tighten our credit policies; our liquidity and working capital requirements, including the availability and pricing of new debt facilities, extensions and increases to existing debt facilities, increases in our corporate line of credit, securitizations and OnDeckOnDeck Marketplace® sales to fund our existing operations and planned growth, including the consequences of having inadequate resources to fund additional loans or draws on lines of credit; the impact on our customers of Hurricane Harvey and Hurricane Irma, which may reduce demand for our loans or cause our customers to suffer significant losses and/or incur significant disruption in their respective operations, which may affect their ability to repay their loans; our reliance on our third-party service providers and the effect on our business of originating loans without third-party funding sources; the impact of increased utilization of cash or incurred debt to fund originations; the effect on our business of utilizing cash for voluntary loan purchases from third parties; the effect on our business of the current credit environment and increases in interest rate benchmarks; our ability to hire and retain necessary qualified employees particularly following our workforce reductions announced in Februarya competitive labor market; practices and May 2017; our continuing compliance measures related tobehaviors of members of our funding advisor channel and their impact;other third parties who may refer potential customers to us; changes in our product distribution channel mix and/or our funding mix; our ability to anticipate market needs and develop new and enhanced offerings to meet those needs; anticipatedlack of customer acceptance of possible increases in interest rate increasesrates and origination fees on loans; maintaining and expanding our customer base; the impact of competition in our industry and innovation by our competitors; our anticipated and unanticipated growth and growth strategies, including the possible introduction of new typesproducts or features, expanding the availability of loansour platform to other lenders through OnDeck-as-a-Service and possible expansion intoin new or existing international markets, and our ability to effectively manage that growth; our reputation and possible adverse publicity about us or our industry; the availability and cost of our funding, including challenges faced by the expiration ofin replacing existing debt facilities;facilities and arranging funding for new types of loans; the impact on our business of funding loans from our cash reserves; locating funding sources for new types of loans that are ineligible for funding under our existing credit or securitization facilities and the possibility of reducing originations of these loan types; the effect of potential selective pricing increases; our expected utilization of OnDeck Marketplace and the available OnDeckMarketplace premiums; our failure to anticipate or adapt to future changes in our industry; the lackimpact of customer acceptancethe Tax Cuts and Jobs Act of 2017 and any related Treasury regulations, rules or failure of our loans; interpretations, if and when issued; our ability to offer loans to our small business customers that have terms that are competitive with alternative sources of capital; our ability to issue new loans to existing customers that seek additional capital; the evolution of technology affecting our offerings and our markets; our compliance with applicable local, state and federal and non-U.S. laws, rules and regulations and their application and interpretation, whether existing, modified or new; our ability to adequately protect our intellectual property; the effect of litigation or other disputes to which we are or may be a party; the increased expenses and administrative workload associated with being a public company; the unenforceability of choice of law provisions in our loan agreements and any potential violation of state interest rate limit laws; our ability to successfully evaluate, consummate and
integrate acquisitions; failure to maintain an effective system of internal controls necessary to accurately report our financial results and prevent fraud; the estimates and estimate methodologies used in preparing our consolidated financial statements; the future trading prices of our common stock, and the impact of securities analysts’ reports and shares eligible for future sale on these prices; our ability to prevent or discover security breaks,breaches, disruption in service and comparable events that could compromise the personal and confidential information held in our data systems, reduce the attractiveness of our platform or adversely impact our ability to service our loans; the impact of our cost rationalization programs; and other risks, including those described in Part II - Item 1A. "Risk Factors" included elsewhere in this report, Part I - Item 1A. "Risk Factors"“Risk Factors” in our most recent Annual Report on Form 10-K Part II - Item 1A. "Risk Factors" in our Quarterly Report for the quarteryear ended June 30,December 31, 2017 and other documents that we file with the Securities and Exchange Commission, or SEC, from time to time which are or will be available on the SEC website at www.sec.gov.
Except as required by law, we undertake no duty to update any forward-looking statements. Readers are also urged to carefully review and consider all of the information in this report, as well as the other documents we make available through the SEC’s website.
When we use the terms “OnDeck,” the “Company,” “we,” “us” or “our” in this report, we are referring to On Deck Capital, Inc. and its consolidated subsidiaries unless the context requires otherwise.
Overview
We are a leading online platform for small business lending.lender. We are seeking to make it efficient and convenient for small businesses to access capital.financing. Enabled by our proprietary technology and analytics, we aggregate and analyze thousands of data points from dynamic, disparate data sources to assess the creditworthiness of small businesses rapidly and accurately. Small businesses can apply for a term loan or line of credit on our website in minutes and, using our loan decision process, including our proprietary OnDeck Score®, we can make a funding decision immediately and, if approved, transfer funds as fast as the same day. Qualified customers may carryhave both a term loan and line of credit simultaneouslyconcurrently, which we believe provides additionalopportunities for repeat business, opportunities, as well as increased value to our customers. We have originated more than $7$9 billion of loans since we made our first loan in 2007.
We generate the majority of our revenue through interest income and fees earned on the term loans we retain.make to our customers. Our term loans, which we offer in principal amounts ranging from $5,000 to $500,000 and with maturities of 3 to 36 months, feature fixed dollar repayments. Our lines of credit range from $6,000 to $100,000, and are generally repayable within six months of the date of the most recent draw. We earn interest on the balance outstanding and lines of credit are subject to a monthly fee unless the customer makes a qualifying minimum draw, in which case it may bethe fee is waived under certain circumstances.for the first six months. The balance of our other revenue primarily comes from our servicing and other fee income, most of which consists of marketing fees from our issuing bank partner, fees generated by OnDeck-as-a-Service, and monthly fees we receive for servicing loans owned by third-parties.earned from lines of credit.
We rely on a diversified set of funding sources for the capitalloans we lendmake to our customers. Our primary source of this capitalfinancing has historically been debt facilities with various financial institutions. We have also used proceeds from operating cash flow to fund loans in the past and continue to finance a portion of our outstanding loans with these funds. As of SeptemberJune 30, 2017,2018, we had $709.3$761.9 million of funding debt principal outstanding and $983.1 million of$1.2 billion total borrowing capacity under such debt facilities, subject to borrowing conditions.facilities. No loans were sold through OnDeck Marketplace during the six months ended June 30, 2018. During the third quarter ofthree months and six months ended June 30, 2017, and 2016, we sold approximately $5.5loans with an unpaid principal balance of $9.1 million and $89.9$50.2 million, respectively, of loans to OnDeck Marketplace purchasers.respectively. Of ourthe total principal outstanding as of SeptemberJune 30, 2017,2018, including our loans held for investment, andplus loans sold to OnDeck Marketplace purchasers which had a balance remaining as of SeptemberJune 30, 2017, 3% were funded via OnDeck Marketplace purchasers, 58%2018, 66% were funded via our debt facilities, 30%25% were financed via proceeds raised from our securitization transaction, and 9%8% were funded via our own equity.cash on hand and 1% were funded via OnDeck Marketplace purchasers.
We originate loans throughout the United States, Canada and Australia, although, to date, substantially all of our revenue has been generated in the United States. These loans are originated through our direct marketing, including direct mail, social media and other online marketing channels, and also originated through our outbound sales team, referrals from our strategic partners, including banks, payment processors and small business-focused service providers, and through funding advisors who advise small businesses on available funding options.
Key Financial and Operating Metrics
We regularly monitor a number of metrics in order to measure our current performance and project our future performance. These metrics aid us in developing and refining our growth strategies and making strategic decisions.
| | | | As of or for the Three Months Ended
September 30,
| | As of or for the Nine Months Ended September 30, | As of for the Three Months Ended June 30, | | As of and for the Six Months Ended June 30, |
| | 2017 | | 2016 | | 2017 | | 2016 | 2018 | | 2017 | | 2018 | | 2017 |
| | (dollars in thousands) | | (dollars in thousands) | (dollars in thousands) | | (dollars in thousands) |
| Originations | $ | 530,926 |
| | $ | 612,557 |
| | $ | 1,568,303 |
| | $ | 1,771,906 |
| $586,728 | | $464,362 | | $1,177,313 | | $1,037,377 |
| Effective Interest Yield | 33.4 | % | | 32.8 | % | | 33.4% |
| | 33.4 | % | 36.1 | % | | 33.5 | % | | 35.9 | % | | 33.7 | % |
| Cost of Funds Rate | | 6.6 | % | | 6.2 | % | | 6.7 | % | | 6.1 | % |
| Net Interest Margin* | | 32.0 | % | | 29.3 | % | | 31.7 | % | | 29.8 | % |
Marketplace Gain on Sale Rate | 2.7 | % | | 3.0 | % | | 3.3 | % | | 4.3 | % | N/A |
| | 2.8 | % | | N/A |
| | 3.4 | % |
| Cost of Funds Rate | 6.4 | % | | 5.7 | % | | 6.2% |
| | 5.9 | % | |
| Reserve Ratio | | 12.1 | % | | 11.0 | % | | 12.1 | % | | 11.0 | % |
| Provision Rate | 7.5 | % | | 6.9 | % | | 7.8 | % | | 6.4 | % | 5.7 | % | | 7.2 | % | | 5.9 | % | | 8.0 | % |
| Reserve Ratio | 11.1 | % | | 9.8 | % | | 11.1 | % | | 9.8 | % | |
| 15+ Day Delinquency Ratio | 7.5 | % | | 6.2 | % | | 7.5 | % | | 6.2 | % | 6.8 | % | | 7.2 | % | | 6.8 | % | | 7.2 | % |
| Net Charge-off Rate | 16.9 | % | | 11.0 | % | | 16.8% |
| | 11.0 | % | 11.2 | % | | 18.5 | % | | 11.1 | % | | 16.8 | % |
| Net Interest Margin * | 29.1 | % | | 29.4 | % | | 29.4 | % | | 30.0 | % | |
| Net Interest Margin After Credit Losses (NIMAL) * | 12.2 | % | | 18.7 | % | | 12.6% |
| | 19.1 | % | |
| Adjusted Expense Ratio (AER) * | 12.6 | % | | 16.5 | % | | 13.7% |
| | 17.0 | % | |
| Adjusted Operating Yield (AOY) * | (0.4 | )% | | 2.2 | % | | (1.1 | )% | | 2.1 | % | |
* SeeNon-GAAP measure. Refer to "Non-GAAP Financial Measures" below for an explanation of this non-GAAP measure and a reconciliation to the nearest GAAP measure.GAAP.
Originations
Originations represent the total principal amount of the term loans we made during the period, plus the total amount drawn on lines of credit during the period. Many of our repeat term loan customers renew their term loan before their existing term loan is fully repaid. In accordance with industry practice, originations of such repeat term loans are presented as the full renewal loan principal, rather than the net funded amount, which would be the renewal term loan’s principal net of the unpaid principal balance on the existing term loan. Loans referred to, and originated by, our issuing bank partner and later purchased by us are included as part of our originations. Unless otherwise specified or the context otherwise requires, the term originations refers to the dollar amount of loans originated and not to the number of loans, which we refer to as units.
Effective Interest Yield
Effective Interest Yield is the rate of returninterest we achieve on loans outstanding during a period. It is calculated as our business day adjustedcalendar day-adjusted annualized interest income divided by average loans. Annualization isLoans. Prior to the first quarter of 2018, annualization was based on 252 business days per year, whichyear. Beginning with the three months ended March 31, 2018, annualization is typical weekdaysbased on 365 days per year less U.S. Federal Reserve Bank holidays.and is calendar day-adjusted. All revisions have been applied retrospectively.
Net deferred origination costs in loans held for investment and loans held for sale consist of deferred origination fees and costs. Deferred origination fees include fees paid up front to us by customers when loans are originated and decrease the carrying value of loans, thereby increasing the Effective Interest Yield earned.Yield. Deferred origination costs are limited to costs directly attributable to originating loans such as commissions, vendor costs and personnel costs directly related to the time spent by the personnel performing activities related to loan origination and increase the carrying value of loans, thereby decreasing the Effective Interest Yield earned.Yield.
Recent pricing trends are discussed under the subheading “Key Factors Affecting Our Performance - Pricing.”
Cost of Funds Rate
Cost of Funds Rate is the interest expense, fees and amortization of deferred debt issuance costs we incur in connection with our lending activities across all of our funding debt facilities. For full years, it is calculated as our funding cost divided by average funding debt outstanding and for interim periods it is calculated as our annualized funding cost for the period divided by average funding debt outstanding. Annualization is based on four quarters per year and is not business or calendar day-adjusted.
Net Interest Margin
Net Interest Margin is calculated as annualized Net Interest Income divided by average Interest Earning Assets. Net Interest Income represents interest income less funding costs during the period. Interest income is net of fees on loans held for investment and held for sale. Net deferred origination costs in loans held for investment and loans held for sale consist of deferred origination costs as offset by corresponding deferred origination fees. Deferred origination fees include fees paid up front to us by customers when loans are funded. Deferred origination costs are limited to costs directly attributable to originating loans such as commissions, vendor costs and personnel costs directly related to the time spent by the personnel performing activities related to loan origination.
Funding costs are the interest expense, fees, and amortization of deferred debt issuance costs we incur in connection with our lending activities across all of our debt facilities. Annualization is based on 365 days per year and is calendar day-adjusted.
Marketplace Gain on Sale Rate
Marketplace Gain on Sale Rate equals our gain on sale revenue from loans sold through OnDeck Marketplace divided by the carrying value of loans sold, which includes both unpaid principal balance sold and the remaining carrying value of the net deferred origination costs. A portion of any loans regularly sold through OnDeck Marketplace are or may be loans which were initially designated as held for investment upon origination. The portion of such loans sold, if any, in a given period may vary materially depending upon market conditions and other circumstances.
Cost of Funds RateReserve Ratio
Cost of Funds RateReserve Ratio is our funding cost, which isallowance for loan losses as of the interest expense, fees and amortizationend of deferred debt issuance costs we incur in connection with our lending activities across all of our debt facilities, divided by average funding debt outstanding. For full years, it is calculated as our funding cost divided by Average Funding Debt Outstanding and for interim periods it is calculated as our annualized funding cost for the period divided by Average Funding Debt Outstanding.the Unpaid Principal Balance as of the end of the period.
Provision Rate
Provision Rate equals the provision for loan losses divided by the new originations volume of loans held for investment, net of originations of sales of such loans within the period. Because we reserve for probable credit losses inherent in the portfolio upon origination, this rate is significantly impacted by the expectation of credit losses for the period’s originations volume. This rate may also be impacted by changes in loss estimates for loans originated prior to the commencement of the period.
The denominator of the Provision Rate formula includes the new originations volume of loans held for investment, net of originations of sales of such loans within the period. However, the numerator primarily reflects the additional provision required to provide for loan losses on the net funded amount during such period. Therefore, allAll other things equal, an increased volume of loan rollovers and line of credit repayments and re-borrowings in a period will reduce the Provision Rate.
The Provision Rate is not directly comparable to the net cumulative lifetime charge-off ratio because (i) the Provision Rate reflects estimated losses at the time of origination while the net cumulative lifetime charge-off ratio reflects actual charge-offs, (ii) the Provision Rate includes provisions for losses on both term loans and lines of credit while the net cumulative lifetime charge-off ratio reflects only charge-offs related to term loans and (iii) the Provision Rate for a period reflects the provision for losses related to all loans held for investment while the net cumulative lifetime charge-off ratio reflects lifetime charge-offs of term loans related to a particular cohort of term loans.
Reserve Ratio
Reserve Ratio is our allowance for loan losses as of the end of the period divided by the Unpaid Principal Balance as of the end of the period.
15+ Day Delinquency Ratio
15+ Day Delinquency Ratio equals the aggregate Unpaid Principal Balance for our loans that are 15 or more calendar days past due as of the end of the period as a percentage of the Unpaid Principal Balance. The Unpaid Principal Balance for our loans that are 15 or more calendar days past due includes loans that are paying and non-paying. Because our loans require weekly or daily repayments, excluding weekends and holidays, they may be deemed delinquent more quickly than loans from traditional lenders that require only monthly payments. As of September 30, 2017, a majority of our loans required weekly repayments.
15+ Day Delinquency Ratio is not annualized, but reflects balances as of the end of the period.
Net Charge-off Rate
Net Charge-off Rate is calculated as our annualized net charge-offs for the period divided by the average Unpaid Principal Balance outstanding. Annualization is based on four quarters per year and is not business day adjusted.or calendar day-adjusted. Net charge-offs are charged-off loans in the period, net of recoveries.
Net Interest Margin
Net Interest Margin is calculated as business day adjusted annualized Net Interest Income divided by average Interest Earning Assets. Interest Earning Assets represents the sum of Unpaid Principal Balance plus the amount of principal outstanding of loans held for sale at the end of the period. It excludes net deferred origination costs, allowance for loan losses and any loans sold or held for sale at the end of the period. Average Interest Earnings Assets is calculated as the average of Interest Earnings Assets at the beginning of the period and the end of each month in the period.
Net Interest Income represents interest income less funding cost during the period. Interest income is net of fees on loans held for investment and held for sale. Net deferred origination costs in loans held for investment and loans held for sale consist of deferred origination costs as offset by corresponding deferred origination fees. Deferred origination fees include fees paid up front to us by customers when loans are originated. Deferred origination costs are limited to costs directly attributable to originating loans such as commissions, vendor costs and personnel costs directly related to the time spent by the personnel performing activities related to loan origination. Funding cost is the interest expense, fees, and amortization of deferred debt issuance costs we incur in connection with our lending activities across all of our debt facilities. Annualization is based on 252 business days per year, which is typical weekdays per year less U.S. Federal Reserve Bank holidays.
Net Interest Margin After Credit Losses (NIMAL)
Net Interest Margin After Credit Losses (NIMAL), is calculated as our business day adjusted annualized Net Interest Income After Credit Losses divided by average Interest Earning Assets. Net Interest Income After Credit Losses represents interest income less funding cost and net charge-offs during the period. Interest income is net of deferred costs and fees on loans held for investment and held for sale. Net deferred origination costs in loans held for investment and loans held for sale consist of deferred origination costs as offset by corresponding deferred origination fees. Deferred origination fees include fees paid up front to us by customers when loans are originated. Deferred origination costs are limited to costs directly attributable to originating loans such as commissions, vendor costs and personnel costs directly related to the time spent by the personnel performing activities related to loan origination. Funding cost is the interest expense, fees, and amortization of deferred debt issuance costs we incur in connection with our lending activities across all of our debt facilities. Net charge-offs are charged-off loans in the period, net of recoveries. Annualization is based on 252 business days per year, which is typical weekdays per year less U.S. Federal Reserve Bank holidays.
Adjusted Expense Ratio (AER)
Adjusted Expense Ratio (AER) represents our annualized operating expense, adjusted to exclude the impact of stock-based compensation, divided by average Loans Under Management. Loans Under Management represents the Unpaid Principal Balance plus the unpaid principal balance of loans held for sale, excluding net deferred origination costs, plus the amount of principal outstanding of term loans we serviced for others at the end of the period. Average Loans Under Management is calculated as the average of Loans Under Management at the beginning of the period and the end of each month in the period. Annualization is based on 252 business days per year, which is typical weekdays per year less U.S. Federal Reserve Bank holidays.
Adjusted Operating Yield (AOY)
Adjusted Operating Yield (AOY) represents our Net Interest Margin After Credit Losses (NIMAL) less the Adjusted Expense Ratio (AER).
On Deck Capital, Inc. and Subsidiaries
Consolidated Average Balance Sheets
(in thousands, except share and per share data)thousands)
| | | | | | | | | | | | | Average | | Average |
| | Three Months Ended September 30, | | Nine Months Ended September 30, | | Three Months Ended June 30, | | Six Months Ended June 30, |
| 2017 | | 2016 | | 2017 | | 2016 | | 2018 | | 2017 | | 2018 | | 2017 |
| Assets | | | | | | | | | | | | | | | |
| Cash and cash equivalents | $ | 59,530 |
| | $ | 72,309 |
| | $ | 58,595 |
| | $ | 90,321 |
| | $ | 55,516 |
| | $ | 61,104 |
| | $ | 50,128 |
| | $ | 60,824 |
|
| Restricted cash | 58,659 |
| | 46,478 |
| | 59,316 |
| | 38,884 |
| | 54,859 |
| | 68,530 |
| | 55,251 |
| | 58,956 |
|
| Loans held for investment | 960,587 |
| | 851,457 |
| | 1,001,697 |
| | 739,946 |
| | 1,025,143 |
| | 1,003,103 |
| | 1,003,655 |
| | 1,020,727 |
|
| Less: Allowance for loan losses | (103,397 | ) | | (81,118 | ) | | (109,486 | ) | | (68,775 | ) | | (121,899 | ) | | (110,542 | ) | | (118,290 | ) | | (112,355 | ) |
| Loans held for investment, net | 857,190 |
| | 770,339 |
| | 892,211 |
| | 671,171 |
| | 903,244 |
| | 892,561 |
| | 885,365 |
| | 908,372 |
|
| Loans held for sale | — |
| | 4,846 |
| | 462 |
| | 9,051 |
| | — |
| | 561 |
| | — |
| | 660 |
|
| Property, equipment and software, net | 25,919 |
| | 30,328 |
| | 27,480 |
| | 29,636 |
| | 17,182 |
| | 27,776 |
| | 19,248 |
| | 28,298 |
|
| Other assets | 17,843 |
| | 19,676 |
| | 18,483 |
| | 21,376 |
| | 15,782 |
| | 18,030 |
| | 14,773 |
| | 18,940 |
|
| Total assets | $ | 1,019,141 |
| | $ | 943,976 |
| | $ | 1,056,547 |
| | $ | 860,439 |
| | $ | 1,046,583 |
| | $ | 1,068,562 |
| | $ | 1,024,765 |
| | $ | 1,076,050 |
|
| Liabilities and equity | | | | | | | | | | | | | | | |
| Liabilities: | | | | | | | | | | | | | | | |
| Accounts payable | $ | 3,077 |
| | $ | 3,332 |
| | $ | 3,377 |
| | $ | 4,203 |
| | $ | 3,627 |
| | $ | 3,412 |
| | $ | 3,269 |
| | $ | 3,862 |
|
| Interest payable | 2,300 |
| | 1,313 |
| | 2,322 |
| | 1,060 |
| | 2,519 |
| | 2,461 |
| | 2,407 |
| | 2,347 |
|
| Funding debt | 710,601 |
| | 597,678 |
| | 737,864 |
| | 505,406 |
| | 735,123 |
| | 747,009 |
| | 715,110 |
| | 750,761 |
|
| Corporate debt | 11,078 |
| | 7,699 |
| | 20,213 |
| | 4,698 |
| | 1,976 |
| | 24,723 |
| | 2,552 |
| | 26,114 |
|
| Accrued expenses and other liabilities | 32,276 |
| | 32,876 |
| | 33,786 |
| | 32,460 |
| | 29,856 |
| | 31,347 |
| | 30,795 |
| | 34,336 |
|
| Total liabilities | 759,332 |
| | 642,898 |
| | 797,562 |
| | 547,827 |
| | 773,101 |
| | 808,952 |
| | 754,133 |
| | 817,420 |
|
| | | | | | | | | | |
| Total On Deck Capital, Inc. stockholders' equity | 254,731 |
| | 295,989 |
| | 253,716 |
| | 306,913 |
| | 268,060 |
| | 253,260 |
| | 265,857 |
| | 253,271 |
|
| Noncontrolling interest | 5,077 |
| | 5,089 |
| | 5,269 |
| | 5,699 |
| | 5,422 |
| | 6,350 |
| | 4,775 |
| | 5,359 |
|
| Total equity | 259,808 |
| | 301,078 |
| | 258,985 |
| | 312,612 |
| | 273,482 |
| | 259,610 |
| | 270,632 |
| | 258,630 |
|
| Total liabilities and equity | $ | 1,019,140 |
| | $ | 943,976 |
| | $ | 1,056,547 |
| | $ | 860,439 |
| | $ | 1,046,583 |
| | $ | 1,068,562 |
| | $ | 1,024,765 |
| | $ | 1,076,050 |
|
| | | | | | | | | | | | | | | | |
| Memo: | | | | | | | | | | | | | | | |
| Unpaid Principal Balance | $ | 944,372 |
| | $ | 836,542 |
| | $ | 983,230 |
| | $ | 727,038 |
| | $ | 1,006,133 |
| | $ | 984,812 |
| | $ | 985,321 |
| | $ | 1,001,231 |
|
| Interest Earning Assets | $ | 944,372 |
| | $ | 841,270 |
| | $ | 983,689 |
| | $ | 735,825 |
| | $ | 1,006,133 |
| | $ | 985,370 |
| | $ | 985,321 |
| | $ | 1,001,887 |
|
| Loans | $ | 960,587 |
| | $ | 856,303 |
| | $ | 1,002,159 |
| | $ | 748,997 |
| | $ | 1,025,143 |
| | $ | 1,003,664 |
| | $ | 1,003,654 |
| | $ | 1,021,387 |
|
| Loans Under Management | $ | 1,089,406 |
| | $ | 1,087,641 |
| | $ | 1,159,438 |
| | $ | 1,015,768 |
| |
Average Balance Sheet Items for the period represent the average as ofmonthly averages based on the beginning ofand the month in theending period and as of the end of each month in the period.balances.
Non-GAAP Financial Measures
We believe that the non-GAAP metrics in this report can provide useful supplemental measures for period-to-period comparisons of our core business and useful supplemental information to investors and others in understanding and evaluating our operating results. However, non-GAAP metrics are not calculated in accordance with GAAP, and should not be considered an alternative to any measures of financial performance calculated and presented in accordance with GAAP. Other companies may calculate these non-GAAP metrics differently than we do. The reconciliations below reconcile each of our non-GAAP metrics to their most comparable respective GAAP metric.
Adjusted EBITDA
Adjusted EBITDANet Income (Loss) and Adjusted Net Income (Loss) per Share
Adjusted Net Income (Loss) represents our net income (loss), adjusted to exclude net income (loss) attributable to noncontrolling interest, expense associated with debt used for corporate purposes (rather than funding costs associated with lending activities), income tax expense, depreciation and amortization,
stock-based compensation expense, real estate disposition charges, and warrant liability fair value adjustments.severance and executive transition expenses. Stock-based compensation includes employee compensation as well as compensation to third-party service providers. Adjusted Net Income (Loss) per Share is calculated by dividing Adjusted Net Income (Loss) by the weighted average common shares outstanding during the period.
Our use of Adjusted EBITDANet Income has limitations as an analytical tool, and you should not consider it in isolation or as a substitute for analysis of our results as reported under GAAP. Some of these limitations are:
although depreciation and amortization are non-cash charges, the assets being depreciated and amortized may have to be replaced in the future, and Adjusted EBITDA does not reflect cash capital expenditure requirements for such replacements or for new capital expenditure requirements;
Adjusted EBITDA does not reflect changes in, or cash requirements for, our working capital needs;
Adjusted EBITDANet Income does not reflect the potentially dilutive impact of equity-basedstock-based compensation;
Adjusted EBITDA does not reflect interest associated with debt used for corporate purposes or tax payments that may represent a reduction in cash available to us;
Adjusted EBITDA does not reflect the potential costs we would incur if certain of our warrants were settled in cash.
The following table presents a reconciliation of net loss to Adjusted EBITDA for each of the periods indicated:
|
| | | | | | | | | | | | | | | |
| | Three Months Ended September 30, | | Nine Months Ended September 30, |
| | 2017 | | 2016 | | 2017 | | 2016 |
| | (in thousands) | | (in thousands) |
| Reconciliation of Net Income (Loss) to Adjusted EBITDA | | | | | | | |
| Net loss | $ | (4,532 | ) | | $ | (17,173 | ) | | $ | (18,703 | ) | | $ | (49,022 | ) |
| Adjustments: | | | | | | | |
| Corporate interest expense | 35 |
| | 111 |
| | 706 |
| | 186 |
|
| Income tax expense | — |
| | — |
| | — |
| | — |
|
| Depreciation and amortization | 2,451 |
| | 2,452 |
| | 7,623 |
| | 6,887 |
|
| Stock-based compensation expense | 3,056 |
| | 3,761 |
| | 9,521 |
| | 11,423 |
|
| Adjusted EBITDA | $ | 1,010 |
| | $ | (10,849 | ) | | $ | (853 | ) | | $ | (30,526 | ) |
Adjusted Net (Loss) Income
Adjusted Net (Loss) Income represents our net loss adjustedexcludes charges we are required to exclude stock-based compensation expenseincur in connection with real estate dispositions, severance obligations and warrant liability fair value adjustment, each on the same basis and with the same limitations as described above for Adjusted EBITDA.debt extinguishment costs.
The following table presents a reconciliation of net loss to Adjusted Net Income (Loss) and Adjusted Net Income (Loss) per Share for each of the periods indicated:
|
| | | | | | | | | | | | | | | |
| | Three Months Ended June 30, | | Six Months Ended June 30, |
| | 2018 | | 2017 | | 2018 | | 2017 |
| | (in thousands) | | (in thousands) |
| Reconciliation of Net Income Attributable to OnDeck to Adjusted Net Income (Loss) | | | | | | | |
| Net income (loss) attributable to On Deck Capital, Inc. common stockholders | $ | 5,790 |
| | $ | (1,498 | ) | | $ | 3,873 |
| | $ | (12,556 | ) |
| Adjustments: | | | | | | | |
| Stock-based compensation expense | 2,794 |
| | 2,974 |
| | 6,004 |
|
| 6,465 |
|
| Real estate disposition charges | — |
| | — |
| | 4,187 |
| | — |
|
| Severance and executive transition expenses | — |
| | 3,183 |
| | 911 |
| | 3,183 |
|
| Debt Extinguishment Costs | 1,384 |
| | — |
| | 1,384 |
| | — |
|
| Adjusted Net income (loss) | $ | 9,968 |
| | $ | 4,659 |
| | $ | 16,359 |
| | $ | (2,908 | ) |
| | | | | | | | |
| Adjusted Net income (loss) per share: | | | | | | | |
| Basic | $ | 0.13 |
| | $ | 0.06 |
| | $ | 0.22 |
| | $ | (0.04 | ) |
| Diluted | $ | 0.13 |
| | $ | 0.06 |
| | $ | 0.21 |
| | $ | (0.04 | ) |
| Weighted-average common shares outstanding: | | | | | | | |
| Basic | 74,385,446 |
| | 72,688,815 |
| | 74,182,929 |
| | 72,276,734 |
|
| Diluted | 78,288,267 |
| | 72,688,815 |
| | 77,786,748 |
| | 72,276,734 |
|
Below are reconciliations of the Adjusted Net income (loss) per basic and diluted share to the most directly comparable measures calculated in accordance with GAAP.
|
| | | | | | | | | | | | | | | |
| | Three Months Ended September 30, | | Nine Months Ended September 30, |
| | 2017 | | 2016 | | 2017 | | 2016 |
| | (in thousands) | | (in thousands) |
| Reconciliation of Net Income (Loss) to Adjusted Net (Loss) Income | | | | | | | |
| Net loss | $ | (4,532 | ) | | $ | (17,173 | ) | | $ | (18,703 | ) | | $ | (49,022 | ) |
| Adjustments: | | | | | | | |
| Net loss attributable to noncontrolling interest | 458 |
| | 539 |
| | 2,073 |
| | 1,920 |
|
| Stock-based compensation expense | 3,056 |
| | 3,761 |
| | 9,521 |
| | 11,423 |
|
| Adjusted Net Loss | $ | (1,018 | ) | | $ | (12,873 | ) | | $ | (7,109 | ) | | $ | (35,679 | ) |
|
| | | | | | | | | | | | | | | |
| | Three Months Ended June 30, | | Six Months Ended June 30, |
| | 2018 | | 2017 | | 2018 | | 2017 |
| | (per share) | | (per share) |
| Net income (loss) per basic share attributable to On Deck Capital, Inc. common shareholders | $ | 0.08 |
| | $ | (0.02 | ) | | $ | 0.05 |
| | $ | (0.17 | ) |
| Add/ (Subtract): | | | | | | | |
| Stock-based compensation expense | 0.03 |
| | 0.04 |
| | 0.08 |
| | 0.09 |
|
| Real estate disposition charges | — |
| | — |
| | 0.06 |
| | — |
|
| Severance and executive transition expenses | — |
| | 0.04 |
| | 0.01 |
| | 0.04 |
|
| Debt Extinguishment Costs | 0.02 |
| | — |
| | 0.02 |
| | — |
|
| Adjusted Net income (loss) per basic share | $ | 0.13 |
| | $ | 0.06 |
| | $ | 0.22 |
| | $ | (0.04 | ) |
|
| | | | | | | | | | | | | | | |
| | Three Months Ended June 30, | | Six Months Ended June 30, |
| | 2018 | | 2017 | | 2018 | | 2017 |
| | (per share) | | (per share) |
| Net income (loss) per diluted share attributable to On Deck Capital, Inc. common shareholders | $ | 0.07 |
| | $ | (0.02 | ) | | $ | 0.05 |
| | $ | (0.17 | ) |
| Add/ (Subtract): | | | | | | | |
| Stock-based compensation expense | 0.04 |
| | 0.04 |
| | 0.08 |
| | 0.09 |
|
| Real estate disposition charges | — |
| | — |
| | 0.05 |
| | — |
|
| Severance and executive transition expenses | — |
| | 0.04 |
| | 0.01 |
| | 0.04 |
|
| Debt Extinguishment Costs | 0.02 |
| | — |
| | 0.02 |
| | — |
|
| Adjusted Net income (loss) per diluted share | $ | 0.13 |
| | $ | 0.06 |
| | $ | 0.21 |
| | $ | (0.04 | ) |
Net Interest Margin
Net Interest Margin, is calculated as business day adjusted annualized Net Interest Income divided by average Interest Earning Assets. Net Interest Income represents interest income less funding costcosts during the period. Interest income is net of fees on loans held for investment and held for sale. Net deferred origination costs in loans held for investment and loans held for sale consist of deferred origination costs as offset by corresponding deferred origination fees. Deferred origination fees include fees paid up front to us by customers when loans are originated.funded. Deferred origination costs are limited to costs directly attributable to originating loans such as commissions, vendor costs and personnel costs directly related to the time spent by the personnel performing activities related to loan origination. Funding cost iscosts are the interest expense, fees, and amortization of deferred debt issuance costs we incur in connection with our lending activities across all of our debt facilities. Annualization is based on 252 business365 days per year whichand is typical weekdays per year less U.S. Federal Reserve Bank holidays.
calendar day-adjusted.
Our use of Net Interest Margin has limitations as an analytical tool, and you should not consider it in isolation or as a substitute for analysis of our results as reported under GAAP. Some of these limitations are:
Net Interest Margin is the rate of net return we achieve on our Average Interest Earning Assets outstanding during a period. It does not reflect the return from loans sold through OnDeck Marketplace, specifically our gain on sale revenue. Similarly, Average Interest Earning Assets does not include the unpaid principal balance of loans sold through OnDeck Marketplace. Further, Net Interest Margin does not include servicing revenue related to loans previously sold, fair value adjustments to servicing rights, monthly fees charged to customers for our line of credit, and marketing fees earned from our issuing bank partners, which are recognized as the related services are provided.
Funding cost does not reflect interest associated with debt used for corporate purposes.
The following table presents a reconciliation of interest income to Net Interest Margin for each of the periods indicated:
|
| | | | | | | | | | | | | | | |
| | Three Months Ended September 30, | | Nine Months Ended September 30, |
| | 2017 | | 2016 | | 2017 | | 2016 |
| | (in thousands) | | (in thousands) |
| Reconciliation of Interest Income to Net Interest Margin (NIM) | | | | | | | |
| Interest income | $ | 80,122 |
| | $ | 71,361 |
| | $ | 250,954 |
| | $ | 188,726 |
|
| Less: funding costs | (11,330 | ) | | (8,452 | ) | | (34,223 | ) | | (22,548 | ) |
| Net interest income | 68,792 |
| | 62,909 |
| | 216,731 |
| | 166,178 |
|
| Divided by: business days in period | 63 |
| | 64 |
| | 189 |
| | 190 |
|
| Net interest income per business day | 1,092 |
| | 983 |
| | 1,147 |
| | 875 |
|
| Multiplied by: average business days per year | 252 |
| | 252 |
| | 252 |
| | 252 |
|
| Annualized net interest income | 275,184 |
| | 247,716 |
| | 289,044 |
| | 220,500 |
|
| Divided by: average Interest Earning Assets | $ | 944,372 |
| | $ | 841,270 |
| | $ | 983,689 |
| | $ | 735,825 |
|
| Net Interest Margin (NIM) | 29.1 | % | | 29.4 | % | | 29.4 | % | | 30.0 | % |
Net Interest Margin After Credit Losses (NIMAL)
Net Interest Margin After Credit Losses (NIMAL) is calculated as our business day adjusted annualized Net Interest Income After Credit Losses divided by average Interest Earning Assets. Net Interest Income After Credit Losses represents interest income less funding cost and net charge-offs during the period. Interest income is net of deferred costs and fees on loans held for investment and held for sale. Net deferred origination costs in loans held for investment and loans held for sale consist of deferred origination costs as offset by corresponding deferred origination fees. Deferred origination fees include fees paid up front to us by customers when loans are originated. Deferred origination costs are limited to costs directly attributable to originating loans such as commissions, vendor costs and personnel costs directly related to the time spent by the personnel performing activities related to loan origination. Funding cost is the interest expense, fees, and amortization of deferred debt issuance costs we incur in connection with our lending activities across all of our debt facilities. Net charge-offs are charged-off loans in the period, net of recoveries. Annualization is based on 252 business days per year, which is typical weekdays per year less U.S. Federal Reserve Bank holidays.
Our use of Net Interest Margin After Credit Losses has limitations as an analytical tool, and you should not consider it in isolation or as a substitute for analysis of our results as reported under GAAP. Some of these limitations are:
Net Interest Margin After Credit Losses is the rate of net return we achieve on our Average Interest Earning Assets outstanding during a period. It does not reflect the return from loans sold through OnDeck Marketplace, specifically our gain on sale revenue. Similarly, Average Interest Earning Assets does not include the unpaid principal balance of loans sold through OnDeck Marketplace. Further, Net Interest Margin After Credit Losses does not include servicing revenue related to loans previously sold, fair value adjustments to servicing rights, monthly fees charged to customers for our line of credit, and marketing fees earned from our issuing bank partners, which are recognized as the related services are provided.
Net Interest Margin After Credit Losses reflects net charge-offs in the period rather than provision for loan losses. To the extent that originations grow significantly, our charge-offs will likely be lower than the probable credit losses inherent in the portfolio upon origination. Furthermore, provision for loan losses consists of amounts charged to income during the period to maintain our ALLL. In addition to net charge-offs, our ALLL represents our estimate of the expected credit losses inherent in our portfolio of term loans and lines of credit and is based on a variety of factors, including the composition and quality of the portfolio, loan specific information gathered through our collection efforts, delinquency levels, our historical loss experience and general economic conditions.
Funding cost doesdo not reflect interest associated with debt used for corporate purposes.
The following table presents a reconciliation of interest income to Net Interest Margin After Credit Losses for each of the periods indicated:
|
| | | | | | | | | | | | | | | |
| | Three Months Ended September 30, | | Nine Months Ended September 30, |
| | 2017 | | 2016 | | 2017 | | 2016 |
| | (in thousands) | | (in thousands) |
| Reconciliation of Interest Income to Net Interest Margin After Credit Losses (NIMAL) | | | | | | | |
| Interest income | $ | 80,122 |
| | $ | 71,361 |
| | $ | 250,954 |
| | $ | 188,726 |
|
| Less: funding costs | (11,330 | ) | | (8,452 | ) | | (34,223 | ) | | (22,548 | ) |
| Net interest income | 68,792 |
| | 62,909 |
| | 216,731 |
| | 166,178 |
|
| Less: net charge-offs | (39,927 | ) | | (23,067 | ) | | (123,785 | ) | | (60,237 | ) |
| Net interest income after credit losses | 28,865 |
| | 39,842 |
| | 92,946 |
| | 105,941 |
|
| Divided by: business days in period | 63 |
| | 64 |
| | 189 |
| | 190 |
|
| Net interest income after credit losses per business day | 458 |
| | 623 |
| | 492 |
| | 558 |
|
| Multiplied by: average business days per year | 252 |
| | 252 |
| | 252 |
| | 252 |
|
| Annualized net interest income after credit losses | 115,416 |
| | 156,996 |
| | 123,984 |
| | 140,616 |
|
| Divided by: average Interest Earning Assets | $ | 944,372 |
| | $ | 841,270 |
| | $ | 983,689 |
| | $ | 735,825 |
|
| Net Interest Margin After Credit Losses (NIMAL) | 12.2 | % | | 18.7 | % | | 12.6 | % | | 19.1 | % |
Adjusted Expense Ratio (AER)
Adjusted Expense Ratio (AER) represents our annualized operating expense, adjusted to exclude the impact of stock-based compensation, divided by average Loans Under Management. Annualization is based on 252 business days per year, which is typical weekdays per year less U.S. Federal Reserve Bank holidays. |
| | | | | | | | | | | | | | | |
| | Three Months Ended June 30, | | Six Months Ended June 30, |
| | 2018 | | 2017 | | 2018 | | 2017 |
| | (in thousands) | | (in thousands) |
| Reconciliation of Interest Income to Net Interest Margin (NIM) | | | | | | | |
| Interest income | $ | 92,371 |
| | $ | 83,721 |
| | $ | 178,740 |
| | $ | 170,832 |
|
| Less: Funding costs | (12,202 | ) | | (11,616 | ) | | (24,023 | ) | | (22,893 | ) |
| Net interest income | 80,169 |
| | 72,105 |
| | 154,717 |
|
| 147,939 |
|
| Divided by: calendar days in period | 91 |
| | 91 |
| | 181 |
| | 181 |
|
| Net interest income per calendar day | 881 |
| | 792 |
|
| 855 |
|
| 817 |
|
| Multiplied by: calendar days per year | 365 |
| | 365 |
| | 365 |
| | 365 |
|
| Annualized net interest income | 321,565 |
| | 289,080 |
| | 312,075 |
| | 298,205 |
|
| Divided by: Average Interest Earning Assets | $ | 1,006,133 |
| | $ | 985,370 |
| | $ | 985,321 |
| | $ | 1,001,887 |
|
| Net Interest Margin (NIM) | 32.0 | % | | 29.3 | % | | 31.7 | % |
| 29.8 | % |
Our use of Adjusted Expense Ratio has limitations as an analytical tool, and you should not consider it in isolation or as a substitute for analysis of our results as reported under GAAP. Some of these limitations are:
Adjusted Expense Ratio does not reflect the potentially dilutive impact of equity-based compensation.
Adjusted Expense Ratio is based on the unpaid principal balance of loans outstanding, regardless of funding source, and does not take into account the revenue earned in the period and may not correspond with the timing of the expenses incurred to originate new loans.
The following table presents a reconciliation of operating expense to Adjusted Expense Ratio for each of the periods indicated:
|
| | | | | | | | | | | | | | | |
| | Three Months Ended September 30, | | Nine Months Ended September 30, |
| | 2017 | | 2016 | | 2017 | | 2016 |
| | (in thousands) | | (in thousands) |
| Reconciliation of Operating Expense to Adjusted Expense Ratio (AER) | | | | | | | |
| Operating expense | $ | 37,251 |
| | $ | 49,395 |
| | $ | 128,488 |
| | $ | 141,482 |
|
| Less: stock based compensation | (3,056 | ) | | (3,761 | ) | | (9,521 | ) | | (11,423 | ) |
| Operating expense (Ex. SBC) | 34,195 |
| | 45,634 |
| | 118,967 |
| | 130,059 |
|
| Divided by: business days in period | 63 |
| | 64 |
| | 189 |
| | 190 |
|
| Operating expense (Ex. SBC) per business day | 543 |
| | 713 |
| | 629 |
| | 685 |
|
| Multiplied by: average business days per year | 252 |
| | 252 |
| | 252 |
| | 252 |
|
| Operating expense (Ex. SBC) | 136,836 |
| | 179,676 |
| | 158,508 |
| | 172,620 |
|
| Divided by: average Loans Under Management | $ | 1,089,406 |
| | $ | 1,087,641 |
| | $ | 1,159,438 |
| | $ | 1,015,768 |
|
| Adjusted Expense Ratio (AER) | 12.6 | % | | 16.5 | % | | 13.7 | % | | 17.0 | % |
Adjusted Operating Yield (AOY)
Adjusted Operating Yield (AOY) represents our Net Interest Margin After Credit Losses (NIMAL) less the Adjusted Expense Ratio (AER).
Our use of Adjusted Operating Yield has limitations as an analytical tool, and you should not consider it in isolation or as a substitute for analysis of our results as reported under GAAP. Some of these limitations are:
Net Interest Margin After Credit Losses uses Average Interest Earning Assets in the denominator of the calculation whereas Adjusted Expense Ratio uses Average Loans Under Management in the denominator. Subtracting one metric from the other is purely illustrative and does not reflect the operating performance of the business.
Using Adjusted Operating Yield as a measure to compare Net Interest Margin After Credit Losses to Adjusted Expense Ratio assumes that loans sold through the OnDeck Marketplace are of similar origination, performance characteristics and return as loans held for investment and held for sale, which are funded on-balance sheet through our asset-backed revolving facilities, asset-backed securitization facilities, and internal equity.
Using Net Interest Margin After Credit Losses as a measure to compare against Adjusted Expense Ratio assumes that the rate of return of loans funded through the OnDeck Marketplace is similar to that of our loans held for investment or held for sale. Should our OnDeck Marketplace Gain on Sale Rates materially differ, both positively or negatively, this may limit the utility of comparing Net Interest Margin After Credit Losses to Adjusted Expense Ratio as a means of measuring the operations of the business.
The following table presents a reconciliation of Net Interest Margin After Credit Losses to Adjusted Operating Yield for each of the periods indicated.
|
| | | | | | | | | | | |
| | Three Months Ended September 30, | | Nine Months Ended September 30, |
| | 2017 | | 2016 | | 2017 | | 2016 |
| Adjusted Operating Yield (AOY) Reconciliation and Calculation | | | | | | | |
| Net Interest Margin After Credit Losses (NIMAL) | 12.2 | % | | 18.7 | % | | 12.6 | % | | 19.1 | % |
| Less: Adjusted Expense Ratio (AER) | 12.6 | % | | 16.5 | % | | 13.7 | % | | 17.0 | % |
| Adjusted Operating Yield (AOY) | (0.4 | )% | | 2.2 | % | | (1.1 | )% | | 2.1 | % |
Key Factors Affecting Our Performance
Investment in Long-Term Growth
The core elements of our long-term growth strategy include expanding our financing offerings, acquiring new customers, broadening our distribution capabilities through strategic partners and funding advisors, enhancing our technology, data and analytics capabilities, and extending customer lifetime value. We plan to continue investingto invest significant resources to accomplish these goals. In addition,We anticipate that our total operating expense will increase during 2018 as we have been retaining moreplan to continue investing in marketing, technology and selling fewer charged off loans, with the goal of achieving higher recoveries.analytics, portfolio management and our collection capabilities. These investments are intended to contribute to our long-term growth, but they may affect our near-term operating performance.
Originations
Historically, our growth in originations has been driven by the addition of new customers, increasing business from existing and previous customers, and increasing average loan size. In addition, we continue to grow our line of credit originations, which made up 19.6% and 15.4% of total dollar originations during the third quarter of 2017 and 2016, respectively.
For the three months ended September 30, 2017, total originations were $530.9 million as compared to $464.4 million, $573.0 million and $631.9 million for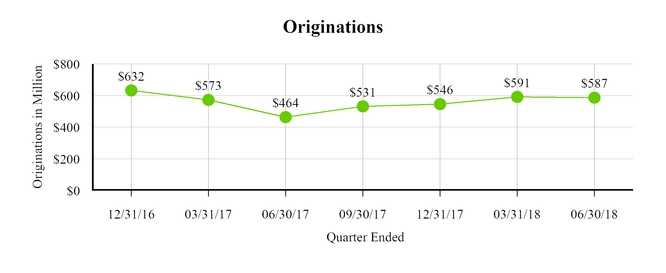
During the three months ended June 30, 2018 and June 30, 2017, March 31,we originated $586.7 million and $464.4 million of loans, respectively. During the six months ended June 30, 2018 and June 30, 2017, we originated $1.2 billion and December 31, 2016,$1.0 billion of loans, respectively. TotalThe increase in originations for the three and six months ended SeptemberJune 30, 2016 were $612.6 million. The general decrease2018 relative to the same periods in originations since December 31, 20162017 was largely due todriven by the tightening of our credit policies used to determine eligibility, pricing and loan size for certain customers which resulted in us offering smaller loans or declining to extend credit to certain customers. We decided to tighten our credit policies in order to better control credit risk, reduce our loss rates, and increase our margins with the understanding that the tightening would reduce originations. The changes to our credit policies began to take effect during the latterfirst half of the first quarter of 2017 resultingwhich constrained 2017 originations, and in the second quartercurrent year periods, the addition of 2017 being more impacted bynew customers, including those in newly credit-eligible industries, and the continued growth of our line of credit tightening than the first quarter.
Originations increased to $530.9 million during the third quarter of 2017 from $464.4 million in the second quarter of 2017 due to additional refinements to our credit policies and improved marketing efficiencies. We expect our originations to decrease in absolute dollars for the full year 2017 compared to the full year of 2016.originations.
The number of weekends and holidays in a period can impact our business. Many small businesses tend to apply for loans on weekdays, and their businesses may be closed at least part of a weekend and on holidays. In addition, our loan fundings and automated customer loan repayments only occur on weekdays (excluding bank holidays).
We anticipate that our future originationsgrowth will continue to depend significantlyin part on attracting new customers. As we continue to aggregate data on customers and prospective customers, we seek to use that data and our increasing knowledge to optimize our marketing spending to attract these customers as well as to continue to focus our analytics resources on better identifying potential customers. We have historically relied on all three of our channels for customer acquisition but remain focused on growing our direct and strategic partner channels. Collective originations through our direct and strategic partner channels made up 73%71% and 73%76% of total originations from all customers duringin the thirdsecond quarter of 20172018 and 2016,2017, respectively. We plan to continue investing in direct marketing and sales, increasing our brand awareness and growing our strategic partnerships.
The following tables summarizetable summarizes the percentage of loans made to all customers originated by our three distribution channels for the periods indicated. From time to time management is required to make judgments to determine customers' appropriate channel attribution.distribution.
|
| | | | | | | | | | | |
| | Three Months Ended September 30, | | Nine Months Ended September 30, |
| Percentage of Originations (Number of Loans) | 2017 | | 2016 | | 2017 | | 2016 |
| Direct and Strategic Partner | 76.5 | % | | 79.8 | % | | 77.5 | % | | 80.3 | % |
| Funding Advisor | 23.5 | % | | 20.2 | % | | 22.5 | % | | 19.7 | % |
| | | | Three Months Ended September 30, | | Nine Months Ended September 30, | Three Months Ended June 30, | | Six Months Ended June 30, |
| Percentage of Originations (Dollars) | 2017 | | 2016 | | 2017 | | 2016 | 2018 | | 2017 | | 2018 | | 2017 |
| Direct and Strategic Partner | 73.4 | % | | 73.0 | % | | 73.4 | % | | 73.1 | % | 71% | | 76% | | 71% | | 73% |
| Funding Advisor | 26.6 | % | | 27.0 | % | | 26.6 | % | | 26.9 | % | 29% | | 24% | | 29% | | 27% |
We originate term loans and lines of credit to customers who are new to OnDeck as well as to repeat customers. New originations are defined as new term loan originations plus all line of credit draws in the period, including subsequent draws on
existing lines of credit. Renewal originations include term loans only. We believe our ability to increase adoption of our loans within our existing customer base will be important to our future growth. A component of our future growth will include increasing the length of our customer life cycle by expanding our product offerings. DuringIn both the thirdsecond quarter of 2018 and 2017, originations from our repeat customers were generally comparableapproximately 50% of total originations to our historical levels of approximately 50%.all customers. We believe our significant number of repeat customers is primarily due to our high levels of customer service and continued improvement in our types of loansloan features and services. Repeat customers generally show improvements in several key metrics. From our 2014 customer cohort, customers who took at least three loans grew their revenue and bank balance, respectively, on average by 31% and 60% from their initial loan to their third loan. Similarly, from our 2015 customer cohort, customers who took at least three loans grew their revenue and bank balance respectively, on average by 31%32% and 47%. Historically,50%, respectively, from their initial loan to their third loan. Similarly, from our 2016 customer cohort, customers who took at least three loans grew their revenue and bank balance on average by 30% and 39%, respectively. In the net funded amountsecond quarter of loans to2018, 25% of our origination volume from repeat customers rangeswas due to unpaid principal balance rolled from approximately 60% to 70% of the total origination volume toexisting loans directly into such repeat customers.originations. In order for a current customer to qualify for a new term loan while a term loan payment obligation remains outstanding, the customer must pass the following standards:
the business must be approximately 50% or more paid down on its existing loan;
the business must be current on its outstanding OnDeck loan with no material delinquency history; and
the business must be fully re-underwritten and determined to be of adequate credit quality.
The extent to which we generate repeat business from our customers will be an important factor in our continued revenue growth and our visibility into future revenue. In conjunction with repeat borrowing activity, many of our customers also tend to increase their subsequent loan size compared to their initial loan size.
The following table summarizes the percentage of loans originated by new and repeat customers. Loans from cross-selling efforts are classified in the table as repeat loans.
|
| | | | | | | |
| | Three Months Ended June 30, | | Six Months Ended June 30, |
| Percentage of Originations (Dollars) | 2018 | | 2017 | | 2018 | | 2017 |
| New | 50% | | 49% | | 49% | | 50% |
| Repeat | 50% | | 51% | | 51% | | 50% |
Credit Performance
Credit performance refers to how credit losses on a portfolio of loans performs relative to expectations. Generally speaking, a loan with perfect credit performance is repaid in full and in accordance with the terms of the agreement, meaning that all amounts due were repaid in full and on time. However, no portfolio is without risk and aA certain amount of losses are expected. In this respect,expected so credit performance must be assessed relative to pricing and expectations. Because a certain degree of losses are expected, pricingPricing will be determined with the goal of allowing for estimated losses while still generating the desired rate of return after taking into account those estimated losses. When a portfolio has higher than estimated losses, the desired rate of return may not be achieved and that portfolio would be considered to have underperformed. Conversely, if the portfolio incurred lower than estimated losses, resulting in a higher than expected rate of return, the portfolio would be considered to have overperformed.
We originate and price our loans based on risk. When we originate our loans, we recordestablish a provisionreserve for estimated loan losses. As we gather more data as the portfolio performs, we may increase or decrease that reserve as deemed necessary to reflect our latest loss estimate. Some portions of our loan portfolio may be performing better than expected while other portions may perform below expectations. The net result of the underperforming and overperforming portfolio segments determines if we require an overall increase or decrease to our loan reserve related to those existing loans. A net
We evaluate and track credit performance primarily through four key financial metrics: 15+Day Delinquency Ratio; Net Charge-off Rate; Reserve Ratio; and Provision Rate.
15+ Day Delinquency Ratio
The 15+ Day Delinquency Ratio, which is the aggregate Unpaid Principal Balance for our loans that are 15 or more calendar days past due as of the end of the period as a percentage of the Unpaid Principal Balance, decreased from 7.2% at June 30, 2017 to 6.8% at June 30, 2018. This decrease is driven by continued improvement in credit, partially offset by the impact of our decision to the loan reserve relatedhold certain delinquent loans for a longer period and more actively pursue collections as opposed to the existingselling these loans tends to reduce provision expense, while a net increase to the loan reserve tends to increase provision expense.
As notedearlier in our Annual Report on Form 10-K forcollection cycle.
During the year ended Decemberpast two years, the 15+ Day Delinquency Ratio peaked at 7.8% at March 31, 2017 primarily as a result of 2016 originations of term loans that were 15 months or more in term length at origination. This credit deterioration was internally driven as our credit model was under-predicting losses, in the fourth quarter of 2016, we recorded provisionaggregate, for loan loss expense of $55.7 million which included approximately $19 million of additional expense required to build our reserve based on our latest estimate at that time of losses for loans with original maturities of 15 months or longer. Asmore due to our relatively limited experience at that time with loans of similar terms. We took corrective action during the first half of 2017 including tightening of credit policies used to determine eligibility, pricing, loan size and term. This tightening helped reduce the 15+ Day Delinquency Ratio in the subsequent quarters, which was partially offset by the impact of our decision to hold delinquent loans longer as we continue to pursue collections as opposed to selling our delinquent loans earlier in the collection cycle as we used to do.
Net Charge-off Rate
Our Net Charge-off Rate, which is calculated as our annualized net charge-offs for the period divided by the average Unpaid Principal Balance outstanding, declined from 18.5% during the three months ended June 30, 2017 to 11.2% during the three months ended June 30, 2018. Generally, the Net Charge-off Rate is expected to trail the 15+ Day Delinquency Ratio because loans become
delinquent before deteriorating further to charged-off status. The reduction in Net Charge-off Rate is also related to credit improvements since early 2017.
Reserve Ratio
The Reserve Ratio, which is the allowance for loan losses divided by the Unpaid Principal Balance as of the end of a result,specified period, is a comprehensive measurement of our allowance for loan losses because it presents, as a percentage, the portion of the total Unpaid Principal Balance for which an allowance has been recorded. Our Reserve Ratio increased from 11.0% as of June 30, 2017 to 12.1% as of June 30, 2018. This range of Reserve Ratio is in line with our business model objectives given the characteristics of our loan portfolio and other factors.
Provision Rate
The Provision Rate is the provision ratefor loan losses divided by the new originations volume of loans held for investment, net of originations of sales of such loans within the period. Originations include the full renewal loan principal of repeat loans, rather than the net funded amount.
Our Provision Rates decreased from 7.2% during the three months ended June 30, 2017 to 5.7% for the three months ended December 31, 2016 was 10.2%. June 30, 2018. The decline in our Provision Rate primarily reflects our internally driven credit improvements resulting from our previously described credit tightening in the first half of 2017.
In response to those new estimates and an analysis of the causes,2017, we began tighteningtightened our credit policies used to determine eligibility, pricing and loan size for certain customers. As additional seasoning took place on our loans and as our predictive model incorporated newer data, our Provision Rate generally improved during 2017. Our Provision Rate improved in the latter halfsecond quarter of 2018 to 5.7% as compared to 6.1% in the first quarter of 2017. Due to2018. The decrease was primarily driven by the credit tightening policies being in effect for only a portionimproved quality of the first quarter, the first quarter of 2017 Provision Rate remained elevated at 8.7%.our portfolio. The Provision Rate for the second quarter of 20172018 was 7.2% which reflected a full quartergenerally lower than our historical Provision Rates and may not be indicative of the impact of our credit tightening policies.
During the third quarter of 2017, our tighter credit policies continued to have the desired effect of improving credit performance while still permitting originations growth. During the period, two significant hurricanes struck the United States: Hurricane Harvey principally impacting Texas and Louisiana and Hurricane Irma principally impacting Florida. For the nine months ended September 30, 2017, 8.8% of our total originations wereProvision Rate in Texas and 9.5% were in Florida. At September 30, 2017, 11.5% of our Unpaid Principal Balance was in areas in Texas and Florida that had been designated as “individual assistance” disaster areas by the Federal Emergency Management Agency, or FEMA. As a result of the catastrophic impact on the people and businesses of the affected areas, we anticipate increased loan losses within those areas. Our provision rate for the third quarter of 2017 was 7.5% which included approximately 65 basis points attributable to the impact of these hurricanes.future periods.
Pricing
Customer pricing is determined primarily based on the customer’s risk level as measured by our decision structure, including the OnDeckScore, loan type (term loan or line of credit), the term loan duration, the customer type (new or repeat) and origination channel. In addition, general market conditions and the competitive environment may broadly influence pricing industry-wide. Loans originated through the direct and strategic partner channels are generally priced lower than loans originated through the funding advisor channel due to the lower historical loss rates within the direct and strategic partner channels as well as the higher commissions paid to funding advisors.
We provideOur customers generally pay between $0.003 and $0.042 per month in interest for every dollar they borrow under one of our customersterm loans, with multiple pricing metrics,the actual amount typically driven by the length of term of the particular loan. Historically, our term loans have been primarily quoted in addition to“Cents on Dollar,” or COD, and lines of credit in annual percentage rate, or APR, to assess the cost of a term loan or line of credit.APR. Given the use case and payback period associated with our shorter term loans, we believe many of our customers prefer to understand pricing on a “dollars in, dollars out” basis and are primarily focused on total payback cost. While annualized rates like APR may help a borrower understand and compare longer term loans, an annualized rate like APR may be less useful for loans of 12 months or less because APR is sensitive to duration and small differences in term can yield large changes in associated APR.
We quote our customers the “Cents on Dollar” borrowed, or COD, which reflects the total interest to be paid by a customer to us for each dollar of principal borrowed, and does not include the loan origination fee. Our customers generally pay between $0.003 and $0.04 per month in interest for every dollar they borrow under one of our term loans. We also quote our customers the APR of a term loan or line of credit. As of SeptemberJune 30, 2017,2018, the APRAPRs of our term loans outstanding ranged from 5.9%9.4% to 99.7% and the APRs of our lines of credit outstanding ranged from 11.0% to 60.8%63.2%. Because
“Cents on Dollar” is the total interest to be paid for each dollar of principal borrowed, excluding the origination fee. We believe our customers tend to evaluate our term loans, many of our loans are short-term in nature andwhich have terms of a year or less, primarily based on Cents on Dollar rather than APR. Because APR is calculated on an annualized basis, we believe that our small business customers tenddifferences in loan term can cause large changes in APR, making it harder to understand and evaluate our term loans primarily on the basis oftotal interest cost. We believe Cents on Dollar orand similar cost measures that provideof total interest expense rather than APR.
We continueare more useful to explore ways to increase standardization of pricinga borrower in comparing and comparison terms in our industry in order to help small business customers assess their credit options. During the fourth quarter of 2016,evaluating shorter term loans. Historically, we adopted the SMART Box™ - which stands for “Straightforward Metrics Around Rate and Total cost,” a model pricing disclosure and comparison tool introduced by the Innovative Lending Platform Association, or ILPA, of which we are a founding member. The SMART Box presents prospective customers with several standardized pricing metricshave not used APR as an internal metric to evaluate the costperformance of the term loanour business, compensate our employees or line of credit, including the total cost of capital, APR, the average monthly payback amount, and the COD cost. These pricing metrics give a borrower important information to understand and compare loans, and make an educated decision. We are providing APR data in this report as supplemental information for comparative purposes. APR is one of several metrics we use to measure their performance. The interest on commercial business loans is also, generally, tax deductible as permitted by law compared to typical personal loans, which do not provide a tax deduction. APR does not give effect to the small business customer’s possible tax deductions and cash savings associated with business related interest expenses.
We believe that our product pricing has historically fallen between traditional bank loans to small businesses and certain non-bank small business financing alternatives such as merchant cash advances. The weighted average pricing on our originations has generally declined over time as measured by both average COD borrowed per month and APR as shown in the table below.
| | | | | | For the Year | | For the Quarter |
| | Q3 2017 | Q2 2017 | Q1 2017 | Q4 2016 | Q3 2016 | Q2 2016 | Q1 2016 | 2015 | 2014 | 2013 | 2012 | 2013 | 2014 | 2015 | 2016 | | Q1 2017 | Q2 2017 | Q3 2017 | Q4 2017 | Q1 2018 | Q2 2018 |
| Weighted Average Term Loan "Cents on Dollar" Borrowed, per Month | 1.96¢ | 1.94¢ | 1.95¢ | 1.89¢ | 1.85¢ | 1.75¢ | 1.78¢ | 1.95¢ | 2.32¢ | 2.65¢ | 2.87¢ | 2.65¢ | 2.32¢ | 1.95¢ | 1.82¢ | | 1.95¢ | 1.94¢ | 1.96¢ | 1.97¢ | 2.08¢ | 2.15¢ |
| Weighted Average APR - Term Loans and Lines of Credit | 43.8% | 43.2% | 44.0% | 42.9% | 42.1% | 40.2% | 40.6% | 44.5% | 54.4% | 63.4% | 69.0% | 63.4% | 54.4% | 44.5% | 41.4% | | 44.0% | 43.2% | 43.8% | 46.0% | 47.1% |
| Weighted Average Term Loan Length at Origination | 12.1 | 11.8 | 12.3 | 12.8 | 13.1 | 13.7 | 13.2 | 12.4 | 11.2 | 10.0 | 9.2 | |
We attribute the declining
The pricing shift from 2012 through the second quarter ofdecrease between 2013 and 2016 was due to longer average loan term lengths, increased originations from our lower cost direct and strategic partner channels as a percentage of total originations, the growth of our line of credit product which is priced at a lower APR level than our term loans, the introduction of our customer loyalty program and our continued efforts to pass savings on to customers. During the third quarter of 2016, we implemented selective priceThe pricing increases which began to increase our weighted average CODin 2017 and weighted average APR. These price increases were more broadly adopted during the fourth quarterfirst half of 2016. During that same period, we reduced the average term length2018 were primarily a reflection of loans at origination. While this reduction of term length may not directly affect COD, it does effectively increase APR. Our pricing as expressed in APR generally increasedpast and expected future increases in the third quarter of 2017 compared to the second quarter for loans with the same basic attributes (new or renewal, term loan or LOC) and the same distribution channel (direct, strategic partner or funding advisor). The
blended, weighted average APRunderlying market interest rates that we, like many other lenders in the third quarter of 2017 increasedmarket, are passing on to 43.8% from 43.2%our customers. Additionally, in the second quarter. As previously noted, pricing within different channelspast year we have increased our originations in the Funding Advisor channel, which typically have higher APRs than the Direct and for different loan attributes can vary significantly. Accordingly, the weighted average APR can be impacted by the mix shift of a quarter's originations.Strategic Partner channels.
We consider Effective Interest Yield, or EIY, as a key pricing metric. EIY is the rate of return we achieve on loans outstanding during a period. Our EIY differs from APR in that it takes into account deferred origination fees and deferred origination costs. Deferred origination fees include fees paid up front to us by customers when loans are originated and decrease the carrying value of loans, thereby increasing the EIY. Deferred origination costs are limited to costs directly attributable to originating loans such as commissions, vendor costs and personnel costs directly related to the time spent by the personnel performing activities related to loan origination and increase the carrying value of loans, thereby decreasing the Effective Interest Yield.EIY.
In addition to individual loan pricing and the number of days in a period, there are many other factors that can affect EIY, including:
Channel Mix - In general, loans originated from the direct and strategic partner channelchannels have lower EIYs than loans from the direct and funding advisor channel. This is primarily due to the lower pricing of loans in the direct and strategic partner channels, which reflect lower acquisition costs and lower loss rates compared to loans in the funding advisor channel. The direct and strategic partner channels have, in the aggregate, made up 73%71% and 73%76% of total originations during the three monthssecond quarter ended SeptemberJune 30, 2017,2018 and 2016,2017, respectively. We expect the percentage of Originations attributable to the combined direct and strategic partner channels', as well aschannels and the funding advisor channel's, percentage of originationschannel in 20172018 to remain generally comparable to 20162017 levels.
Term Mix - In general, term loans with longer durations have lower annualized interest rates. Despite lower EIYs, total revenues from customers with longer loan durations are typically higher than the revenue of customers with shorter-term, higher EIY loans because total payback is typically higher compared to a shorter length term for the same principal loan amount. WithFollowing the introduction of our 24-month and 36-month term loans, the average length of new term loan originations had increased to 13.2 from 12.410.8 months for the yearsyear ended December 31, 2016 and 2015, respectively. The average length2014 to 13.3 months for the year ended December 31, 2016. As part of our 2017 credit tightening, when appropriate, the offered duration of term loans originated duringto certain customers was shortened to control duration risk. For the three months ended SeptemberJune 30, 20172018, the average length of new term loan originations had decreased to 12.1 months as part of our concerted effort to reduce the term length of our loans at origination to better control risk.11.3 months.
Customer Type Mix - In general, loans originated from repeat customers historically have had lower EIYs than loans from new customers. This is primarily due to the fact thatbecause repeat customers typically have a higher OnDeck Score and are therefore deemed to be lower risk. In addition, repeat customers are more likely to be approved for longer terms than new customers given their established payment history and lower risk profiles. Finally, origination fees are generallycan be reduced or waived for repeat customers, due to our loyalty program, contributing to lower EIYs.
Product Mix - In general, loans originated by linelines of credit customers have lower EIYs than loans from term loan customers. This is primarily due toloans. For the fact that lines of credit are expected to have longer lifetime usage than term loans, enabling more time to recoup upfront acquisition costs. For loans originated during the thirdsecond quarter of 2017,2018, the weighted average line of credit APR was 32.2%32.5%, compared to the average49.3% for term loan APR which was 45.2%. Further, drawsloans. Draws by line of credit customers have increaseddecreased to 19.6%20.7% of total originations in the thirdsecond quarter of 20172018 from 18.0%22.0% in the firstsecond quarter of 2017.
Competition - During 2015, new lenders entered the online lending market. Subsequent to 2015, we believe the number of new entrants into the market as well as the amount of funding invested in these competitors from private equity or venture capital sources slowed. At the same time, more traditional small business lenders such as banks have entered and may continue to enter the space. As these trends evolve, competitors may attempt to obtain new customers by pricing term loans and lines of credit below prevailing market rates. This could cause downward pricing pressure as these market participants attempt to win new customers even at the cost of pricing loans below market rates, or even at rates resulting in net losses to them. While the market for small business loans remains highly competitive, we do not believe it has had a significant impact on our EIY.
|
| | | | | | | | | | | | | | | | | | |
| Effective Interest Yield |
| For the Year | | For the Quarter |
| 2013 | | 2014 | | 2015 | | 2016 | | Q1 2017 | | Q2 2017 | | Q3 2017 | | Q4 2017 | | Q1 2018 | | Q2 2018 |
| 42.7% | | 40.4% | | 35.4% | | 33.2% | | 33.8% | | 33.5% | | 33.1% | | 34.8% | | 35.6% | | 36.1% |
|
| | | | | | | | | | | | | | | | | | |
| Effective Interest Yield |
| Q3 2017 | | Q2 2017 | | Q1 2017 | | Q4 2016 | | Q3 2016 | | Q2 2016 | | Q1 2016 | | 2015 | | 2014 | | 2013 |
| 33.4% | | 32.8% | | 33.9% | | 33.2% | | 32.8% | | 33.3% | | 34.5% | | 35.4% | | 40.3% | | 43.5% |
We expect EIYPrior to increase gradually over the next twelvefirst quarter of 2018, annualization was based on 252 business days per year. Beginning with the three months as we continue to manage the pricing of our loans to optimize between risk-adjusted yieldsended March 31, 2018, annualization is based on 365 days per year and loan origination volume.
is calendar day-adjusted. All revisions have been applied retrospectively.
Sale of Whole Loans through OnDeck Marketplace
We may sell whole loans to institutional investors through OnDeck Marketplace. Marketplace originations are defined as loans that are sold through OnDeck Marketplace in the period or are held for sale at the end of the period. ForNo loans were sold during the three or six months ended SeptemberJune 30, 2018. During the three and six months ended June 30, 2017, and 2016, approximately 1.3% and 16.6%, respectively,we sold through OnDeck Marketplace loans with an unpaid principal balance of total term loan originations were designated as OnDeck Marketplace originations, which resulted in loan sales of $5.5$9.1 million and $89.9$50.2 million, respectively.
We have the ability to fund our originations through a variety of funding sources, including OnDeck Marketplace. Due to the flexibility of our diversified funding model, management has the ability to exercise judgment to adjust the percentage of term loans originated through OnDeck Marketplace considering numerous factors including the pricespremiums, if any, available to us. DuringFor the three and six months ended SeptemberJune 30, 2017, premiums increased as compared to the three months ended September 30, 2016 due, in part, to market conditions and the loan mix2018, we elected not to sell. However,sell any loans through OnDeck Marketplace. Although premiums being offered and demand to purchase loans were consistent with prior quarters, our cash position, our available liquidity and our volume of loans eligible for debt financing permitted us to make the Marketplace Gain on Sale Rate for the three months ended September 30, 2017 decreasedstrategic decision not to 2.7% compared to 3.0% for the three months ended September 30, 2016, primarily as a result of the channel mix of the loans sold. Despite these trends, we electedutilize OnDeck Marketplace. We may elect to make OnDeck Marketplace loan sales duringin the third quarter of 2017future to provide us an additional source of liquidity and to maintain active relationships with our institutional loan purchasers. If premiums remain steady or decrease further, we may further reduce our percentageOur use of OnDeck Marketplace, originations,regardless of whether premiums increase or potentially suspend such originations. However,decrease, may fluctuate subject to our overall financing and liquidity needs as well as the eligibility to finance new originations under our existing debt facilities, we may use or increase our use of OnDeck facilities.Marketplace regardless of whether premiums increase or decrease.
To the extent our use of OnDeck Marketplace as a funding source increases or decreasesfluctuates in the future, our gross revenue and net revenue could be materially affected. The sale of whole loans generates gain on sales of loans which is recognized in the period the loan is sold. In contrast, holding loans on balance sheet generates interest income and funding costs over the term of the loans and generally generates a provision for loan loss expense in the period of origination. Typically, over the life of a loan, we generate more total revenue and income from loans we hold on our balance sheet to maturity as compared to loans we sell through OnDeck Marketplace.
Our OnDeck Marketplace originations come from one of the following two origination sources:
New loans whichthat are designated at origination to be sold, referred to as “Originations of loans held for sale;” and
Loans whichthat were originally designated as held for investment that are subsequently designated to be sold at the time of their renewal and which are considered modified loans, referred to as “Originations of loans held for investment, modified."
The following table summarizes the initial principal of originations of the aforementioned two sources as it relates to the statement of cash flows during the three months ended September 30, 2017periods shown for 2018 and 2016.2017.
| | | | | | | | | | | | Three Months Ended June 30, | | Six Months Ended June 30, |
| | Three Months Ended September 30, | | Nine Months Ended September 30, | 2018 | | 2017 | | 2018 | | 2017 |
| | 2017 | | 2016 | | 2017 | | 2016 | (in thousands) | | (in thousands) |
| Originations of loans held for sale | $ | 3,069 |
| | $ | 70,870 |
| | $ | 44,490 |
| | $ | 238,077 |
| — |
| | $ | 8,379 |
| | — |
| | $ | 41,421 |
|
| Originations of loans held for investment, modified | 2,271 |
| | 15,078 |
| | 11,475 |
| | 54,865 |
| — |
| | — |
| | — |
| | 9,204 |
|
Marketplace originations | $ | 5,340 |
| | $ | 85,948 |
| | $ | 55,965 |
| | $ | 292,942 |
| — |
| | $ | 8,379 |
| | — |
| | $ | 50,625 |
|
Customer Acquisition Costs
Our customer acquisition costs, or CACs, differ depending upon the acquisition channel. CACs in our direct channel include the commissions paid to our internal sales force and expenses associated with items such as direct mail, social media and other online marketing activities. CACs in our strategic partner channel include commissions paid to our internal sales force and strategic partners. CACs in our funding advisor channel include commissions paid to our internal sales force and funding advisors. CACs in all channels include new originations as well as renewals.
Our CACs, on a combined basis for all three acquisition channels and evaluated as a percentage of originations, declinedincreased for the three months ended SeptemberJune 30, 20172018 as compared to the three months ended SeptemberJune 30, 2016.2017. The decreaseincrease was primarily attributable to a decrease in CACs in our direct and strategic partner channels driven by improved customer targeting, and an increase in renewal loan and line of credit volume as a percentage of total originations, which have lower acquisition costs. These decreases were partially offset by an increase in CACs in our funding advisor channel driven by increasedan increase in external commissions.commissions and a decrease in the average size loan. The increase was partially offset by a decline in CACs in our direct channel resulting from improvements in customer targeting in the direct channel and a decrease in commission rates.
Increased competition for customer response could require us to incur higher customer acquisition costs and make it more difficult for us to grow our loan originations in both unit and volume for both new as well as repeat customers.
Customer Lifetime Value
The ongoing lifetime value of our customers will be an important component of our future performance. We analyze customer lifetime value not only by tracking the “contribution” of customers over their lifetime with us, but also by comparing this contribution to the acquisition costs incurred in connection with originating such customers’ initial loans, whether term loan, lines of credit or both. We define the contribution to include the interest income and fees collected on a cohort of customers’ initial and repeat loans less acquisition costs for their repeat loans, estimated third party processing and servicing expenses for their initial and repeat loans, estimated funding costs (excluding any cost of equity capital) for their initial and repeat loans, and charge-offs of their initial and repeat loans. Relative to the customer lifetime value of the 2014 cohort, against like periods, the 2015 and 2016 cohorts generally exhibit lower return on investment due primarily to the decline in our weighted average pricing.
In the future, we may incur greater marketing expenses to acquire new customers, we may decide to offer term loans with lower interest rates, our charge-offs may increase and our customers’ repeat purchase behavior may change, any of which could adversely impact our customers’ lifetime values to us and our operating results.
Historical Charge-Offs
We illustrate below our historical loan losses by providing information regarding our net lifetime charge-off ratios by cohort. Net lifetime charge-offs are the unpaid principal balanceUnpaid Principal Balance charged off less recoveries of loans previously charged off, and a given cohort’s net lifetime charge-off ratio equals the cohort’s net lifetime charge-offs through SeptemberJune 30, 20172018 divided by the cohort’s total original loan volume. Repeat loans in the denominator include the full renewal loan principal, rather than the net funded amount, which is the renewal loan’s principal net of the unpaid principal balance on the existing loan. Loans are typically charged off after 90 days of nonpayment. Loans originated and charged off between January 1, 20122013 and SeptemberJune 30, 20172018 were on average charged off near the end of their loan term. The chart immediately below includes all term loan originations, regardless of funding source, including loans sold through our OnDeck Marketplace or held for sale on our balance sheet.
Lifetime Net Charge-off Ratios by Cohort Through SeptemberJune 30, 20172018
|
| | | | | | | | | | | |
| | 2012 | 2013 | 2014 | 2015 | Q1 2016 | Q2 2016 | Q3 2016 | Q4 2016 | Q1 2017 | Q2 2017 | Q3 2017 |
| Principal Outstanding as of September 30, 2017 | —% | —% | —% | 0.2% | 1.4% | 3.4% | 6.1% | 14.2% | 27.2% | 57.2% | 88.3% |
|
| | | | | | | | | | | |
| | For the Year | | For the Quarter |
| | 2013 | 2014 | 2015 | 2016 | | Q1 2017 | Q2 2017 | Q3 2017 | Q4 2017 | Q1 2018 | Q2 2018 |
| Principal Outstanding as of June 30, 2018 by Period of Origination | 0.0% | 0.0% | 0.0% | 0.4% | | 1.4% | 3.5% | 10.5% | 26.9% | 56.1% | 86.5% |
The following chart displays the historical lifetime cumulative net charge-off ratios,ratio by cohort for the origination year.periods shown. The chart reflects all term loan originations, regardless of funding source, including loans sold through our OnDeck Marketplace or held for sale on our balance sheet. The data is shown as a static pool for annual cohorts,each cohort, illustrating how the cohort has performed given equivalent months of seasoning.
Given that the originations in the thirdfirst and second quarter of 2017 cohort2018 cohorts are relatively unseasoned as of SeptemberJune 30, 2017,2018, these cohorts reflect low lifetime charge-off ratios in the chart below. Further, given our loans are typically charged off after 90 days of nonpayment, all cohorts typically reflect approximately 0% charge offs for the first fourthree months in the chart below.
Net Cumulative Lifetime Charge-off Ratios
All Loans
Loans we originated in 2016 demonstrated higher than historical net cumulative lifetime charge-off ratios, which were primarily related to loans with longer terms and larger loan sizes. In response and as part of our focus on achieving profitability, during the first and second quarters of 2017 we broadly tightened our credit policies to eliminate originations of loans with expected negative unit economics and to reduce those with expected marginal unit economics.
By design, the broad credit tightening resulted in a significant decline in originations for the second quarter of 2017 and a significant decline in the net cumulative lifetime charge-off ratios for loans originated in that quarter. Subsequent cohorts have incorporated measured and targeted credit optimization designed to bring our net cumulative charge-off ratios in line with business model objectives. Loans originated after the third quarter of 2017 are not yet seasoned enough for meaningful comparison.
|
| | | | | | | | | | | | | | | | | | | | | | | | | | | | | | |
| Originations | 2013 | 2014 | 2015 | Q1 2016 | Q2 2016 | Q3 2016 | Q4 2016 | Q1 2017 | Q2 2017 | Q3 2017 |
| All term loans (in thousands) | $ | 455,931 |
| $ | 1,100,957 |
| $ | 1,703,617 |
| $ | 495,956 |
| $ | 506,097 |
| $ | 518,509 |
| $ | 531,287 |
| $ | 469,924 |
| $ | 362,219 |
| $ | 427,087 |
|
| Weighted average term (months) | 10.0 |
| 11.2 |
| 12.4 |
| 13.2 |
| 13.7 |
| 13.1 |
| 12.8 |
| 12.3 |
| 11.8 |
| 12.1 |
|
|
| | | | | | | | | | | |
| | For the Year | | For the Quarter | |
| Originations | 2013 | 2014 | 2015 | 2016 | | Q1 2017 | Q2 2017 | Q3 2017 | Q4 2017 | Q1 2018 | Q2 2018 |
| All term loans (in millions) | $459 | $1,158 | $1,874 | $2,404 | | $573 | $464 | $531 | $546 | $591 | $587 |
| Weighted average term (in months) | 10.0 | 11.2 | 12.4 | 13.2 | | 12.3 | 11.8 | 12.1 | 12.2 | 11.8 | 11.8 |
Economic Conditions
Changes in the overall economy may impact our business in several ways, including demand for our loans, credit performance, loan losses and funding costs.
Demand for Our Loans. InGenerally, we believe a strong economic climate tends to increase demand for our loans may increase as consumer spending increases and small businesses seek to expand. In addition,expand and more potential customers may meet our underwriting requirements, to qualify for a loan. At the same time,although some small businesses may experience improvedgenerate enough additional cash flow and liquidity resulting in fewer customers requiring loans to manage their cash flows.that they no longer require a loan. In that climate, traditional lenders may also approve loans for a higher percentage of our potential customers. In a weakening economic climate or recession, the opposite may occur.
Credit Performance. In a strong economic climate, our customers may experience improved cash flow and liquidity, which may result in lower loan losses. In a weakening economic climate or recession, the opposite may occur. We factor economic conditions into our loan underwriting analysis and reserves for loan losses, but changes in economic conditions, particularly sudden changes, may affect our actual loan losses. These effects may be partially mitigated by the short-term nature and repayment structure of our loans, which should allow us to react more quickly than if the terms of our loans were longer than our current offerings.longer.
Loan Losses. Our underwriting process is designed to limit our loan losses to levels compatibleconsistent with our business strategyrisk tolerance and financial model. TheOur aggregate performance of loans originatedloan loss rates from 20122013 through 2015 was generallywere consistent with our expectations,financial targets while loans originated in 2016 are experiencingwas higher than expected losses. Through September 30,our financial target as we incurred higher than estimated loss rates on certain larger and longer-term loans. Our 2017 the aggregate performance of loans originated inloan loss levels were also higher than our financial targets largely because we were taking corrective action throughout the first half of 2017 is generallythe year to address the higher 2016 loan losses. Our first half of 2018 loan loss levels are consistent with our expectations, excluding the loans impacted by the hurricanes.financial targets. Our overall loan losses are affected by a variety of factors, including external factors such as prevailing economic conditions, general small business sentiment and unusual events such as natural disasters, as well as internal factors such as the accuracy of the OnDeck Score, the effectiveness of our underwriting process and the introduction of new types of loans, such as our line of credit, with which we have less experience to draw upon when forecasting their loss rates. Our loan loss rates may vary in the future.
Funding Costs. Changes in macroeconomic conditionsmonetary and fiscal policy may affect generally prevailing interest rates, and such effects may be amplified or reduced by other factors such as fiscal and monetary policies, economic conditions in other markets and other factors.rates. Interest rates may also change for reasons unrelated to economic conditions. To the extent that interest rates rise, our funding costs will increase and the spread between our Effective Interest Yield and our Cost of Funds Rate may narrow to the extent we cannot correspondingly increase the paybackinterest rates we charge our customers. We expectcustomers or reduce the credit spreads in our Cost of Funds Rate to gradually increase during the remainder of 2017 due to, among other things, anticipated Federal Reserve interest rate increases.borrowing facilities.
Components of Our Results of Operations
Revenue
Interest Income. We generate revenue primarily through interest and origination fees earned on the term loans and lines of credit we originate. Interest income also includes interest income earned on loans held for sale from the time the loan is originated until it is ultimately sold, as well as other miscellaneous interest income. Our interest and origination fee revenue is amortized over the term of the loan using the effective interest method. Origination fees collected but not yet recognized as revenue are netted with direct origination costs and recorded as a component of loans held for investment or loans held for sale, as appropriate, on our consolidated balance sheets and recognized over the term of the loan. Direct origination costs include costs directly attributable to originating a loan, including commissions, vendor costs and personnel costs directly related to the time spent by those individuals performing activities related to loan origination.
Gain on Sales of Loans. We may sell term loans to third-party institutional investors through OnDeck Marketplace. We recognize a gain or loss on the sale of such loans as the difference between the proceeds received, adjusted for initial recognition of servicing assets or liabilities obtained at the date of sale, and the outstanding principal and net deferred origination costs. To the extent that premiums available to us remain consistent with the past several quarters, we expect both the volume and percentage of loans sold in 2017 to be less than the volume and percentage of loans sold in 2016. The Gain on Sale that will result from those sales will be a function of the premiums available in 2017.
Other Revenue. Other revenue includes servicing revenue related to loans serviced for others, fair value adjustments to servicing rights, platform fees, monthly fees charged to customers for our line of credit, and marketing fees earned from our issuing bank partner, which are recognized as the related services are provided, fees generated by OnDeck-as-a-Service, servicing revenue related to loans serviced for others, fair value adjustments to servicing rights, and monthly fees charged to customers for our line of credit.provided.
Cost of Revenue
Provision for Loan Losses. Provision for loan losses consists of amounts charged to income during the period to maintain an allowance for loan losses, or ALLL, estimated to be adequate to provide for probable credit losses inherent in our existing loan portfolio. Our ALLL represents our estimate of the credit losses inherent in our portfolio of term loans and lines of credit and is based on a variety of factors, including the composition and quality of the portfolio, loan specific information gathered through our collection efforts, delinquency levels, our historical charge-off and loss experience and general economic conditions. We expect our aggregate provision for loan losses to decreaseincrease in absolute dollars relative to 2016 quarterly levels based on lower anticipated origination volumeas the amount of term loans and by tighterlines of credit standards as we pursue initiatives to reduce loss rates.originate and hold for investment increases.
Funding Costs. Funding costs consist of the interest expense we pay on the debt we incur to fund our lending activities, certain fees and the amortization of deferred debt issuance costs incurred in connection with obtaining this debt, such as banker
fees, origination fees and legal fees. Such costs are expensed immediately upon early extinguishment of the related debt. Our Cost of Funds Rate will vary based on a variety of external factors, such as credit market conditions, general interest rate levels and interest rate spreads, as well as OnDeck-specific factors, such as origination volume and credit quality. We expect our funding costs will continue to increase in absolute dollars over the next four quarters dueas we increase borrowings to increased utilization of our funding debt facilities resulting from plannedfund portfolio growth and higher expected increases in market interest rates.
Operating Expense
Operating expense consists of sales and marketing, technology and analytics, processing and servicing, and general and administrative expenses. Salaries and personnel-related costs, including benefits, bonuses, stock-based compensation expense and occupancy, costs, comprise a significant component of each of these expense categories. We expect our stock-based compensation expense to decrease in 2017 relative to 2016, primarily as a result of our reduced headcount. The number of employees was 465528, 502 and 708475 at SeptemberJune 30, 20172018, March 31, 2018 and December 31, 2016,2017, respectively. All operating expense categories also include an allocation of overhead, such as rent and other overhead, which is based on employee headcount. In eachWe believe that continuing to invest in our business is essential to maintaining our competitive position, and therefore, we expect the absolute dollars of Februaryoperating expenses to increase in 2018, excluding charges related to real estate dispositions, severance and May 2017, we announced workforce reductions involving both layoffsexecutive transitions and actual and scheduled attrition. Statements below referringdebt extinguishment costs, but to our expectationsremain relatively constant as a percentage of future levels of expense include the anticipated effect of those workforce reductions.revenue.
Sales and Marketing. Sales and marketing expense consists of salaries and personnel-related costs of our sales and marketing and business development employees, as well as direct marketing and advertising costs, online and offline CACs (such as direct mail, paid search and search engine optimization costs), public relations, radio and television advertising, promotional event programs and sponsorships, corporate communications and allocated overhead. We expect our sales and marketing expense for 2017 to be less than 2016 in terms of absolute dollars andto remain generally consistent with 2017 levels but to decrease as a percentage of revenue in the near term as our sales and marketing activities mature and we continue to optimize marketing spend.
Technology and Analytics. Technology and analytics expense consists primarily of the salaries and personnel-related costs of our engineering and product employees as well as our credit and analytics employees who develop our proprietary credit-scoring models. Additional expenses include third-party data acquisition expenses, professional services, consulting costs, expenses related to the development of new types of loans and technologies and maintenance of existing technology assets, amortization of capitalized internal-use software costs related to our technology platform and allocated overhead. We believe continuing to invest in technology is essential to maintaining our competitive position; however, we expect our investment in technology and analytics in 2017 to be less than the amount invested in 2016 in terms of absolute dollars as well as a lower percentage of revenue.
Processing and Servicing. Processing and servicing expense consists primarily of salaries and personnel related costs of our credit analysis, underwriting, funding, fraud detection, customer service and collections employees. Additional expenses include vendor costs associated with third-party credit checks, lien filing fees and other costs to evaluate, close and fund loans and overhead costs. We anticipate our processing and servicing expense in 2017 will be less than 2016 in absolute dollars and to decrease as a percentage of revenue by driving department efficiencies.
General and Administrative. General and administrative expense consists primarily of salary and personnel-related costs for our executive, finance and accounting, legal and people operations employees. Additional expenses include a provision for the unfunded portion of our lines of credit, consulting and professional fees, insurance, legal, travel, gain or loss on foreign exchange, and other corporate expenses.expenses and costs associated with the early extinguishment of debt. These expenses also include costs associated with compliance with the Sarbanes-Oxley Act and other regulations governing public companies, directors’ and officers’ liability insurance and increased accounting costs. We anticipate that our general and administrative expense in 2017 will be less than 2016 in terms of absolute dollars as well as a percentage of revenue as our finance, accounting, legal and people operations functions mature.
Other (Expense) IncomeExpense
Interest Expense. Interest expense consists of interest expense and amortization of deferred debt issuance costs incurred on debt associated with our corporate activities. It does not include interest expense incurred on debt associated with our lending activities.
Provision for Income Taxes
ProvisionWe have not recorded any provision for income taxes consists of U.S. federal, state and foreign income taxes, if any.taxes. Through December 31, 2016, we have not been required to pay U.S. federal or state income taxes nor any foreign taxes because of our current and accumulated net operating losses. As of December 31, 2016,2017, we had $69.7$82.1 million of federal net operating loss carryforwards and $68.9$81.3 million of state net operating loss carryforwards available to reduce future taxable income, unless limited due to historical or future ownership changes. The federal net operating loss carryforwards will begin to expire at various dates beginning in 2029.
The Internal Revenue Code of 1986, as amended, or the Code, imposes substantial restrictions on the utilization of net operating losses and other tax attributes in the event of an “ownership change” of a corporation. Events which may cause limitation
in the amount of the net operating losses and other tax attributes that are able to be utilized in any one year include, but are not limited to, a cumulative ownership change of more than 50% over a three-year period, which has occurred as a result of historical ownership changes. Accordingly, our ability to use pre-change net operating loss and certain other attributes are limited as prescribed
under Sections 382 and 383 of the Code. Therefore, if we earn net taxable income in the future, our ability to reduce our federal income tax liability with our existing net operating losses is subject to limitation. Future offerings, as well as other future ownership changes that may be outside our control could potentially result in further limitations on our ability to utilize our net operating loss and tax attributes. Accordingly, achieving profitability may not result in a full release of the valuation allowance.
On December 22, 2017, the SEC issued Staff Accounting Bulletin No. 118, Income Tax Accounting Implications of the Tax Cuts and Jobs Act that was codified through the issuance of ASU No. 2018-05. This pronouncement permits us to record provisional amounts during a measurement period not to extend beyond one year of the enactment date. We recorded the impact of the Tax Cuts and Jobs Act for the year ended December 31, 2017, which included a provisional amount associated with our deferred tax asset. We did not revise our initial provisional estimate during the six months ended June 30, 2018, and continue to assess the income tax effects of the tax reform. Because a full valuation allowance has been and will continue to be recorded against our deferred tax asset, any change in our provisional amounts is expected to be offset by a corresponding change in our valuation allowance, resulting in no net impact to our results of operations.
As of December 31, 2016,2017, a full valuation allowance of $53.6$37.8 million was recorded against our net deferred tax assets.
Results of Operations
The following table summarizes our resultsconsolidated statements of operations for the periods presented anddata as a percentage of our totalgross revenue for those periods. The period-to-period comparisoneach of results is not necessarily indicative of results for future periods.the periods indicated.
Comparison of the Three Months Ended SeptemberJune 30, 20172018 and 20162017
Unless expressly stated otherwise, all comparisons and variance explanations are related to the three months ended September 30, 2017 as compared to the three months ended September 30, 2016.
| | | | Three Months Ended September 30, | | | | | Three Months Ended June 30, | | | | |
| | | | | | | | | | Period-to-Period | | | | | | | | | Period-to-Period |
| | 2017 | | 2016 | | Change | 2018 | | 2017 | | Change |
| | Amount | | Percentage of
Gross
Revenue | | Amount | | Percentage of
Gross
Revenue | | Amount | | Percentage | Amount | | Percentage of
Gross
Revenue | | Amount | | Percentage of
Gross
Revenue | | Amount | | Percentage |
| | (dollars in thousands) | (dollars in thousands) |
| Revenue: | | | | | | | | | | | | | | | | | | | | | | |
| Interest income | $ | 80,122 |
| | 95.8 | % | | $ | 71,361 |
| | 92.2 | % | | $ | 8,761 |
| | 12.3 | % | $ | 92,371 |
| | 96.6 | % | | $ | 83,721 |
| | 96.6 | % | | $ | 8,650 |
| | 10.3 | % |
| Gain on sales of loans | 146 |
| | 0.2 |
| | 2,670 |
| | 3.5 |
| | (2,524 | ) | | (94.5 | ) | — |
| | — |
| | 260 |
| | 0.3 |
| | (260 | ) | | (100.0 | ) |
| Other revenue | 3,398 |
| | 4.0 |
| | 3,340 |
| | 4.3 |
| | 58 |
| | 1.7 |
| 3,247 |
| | 3.4 |
| | 2,670 |
| | 3.1 |
| | 577 |
| | 21.6 |
|
| Gross revenue | 83,666 |
| | 100.0 |
| | 77,371 |
| | 100.0 |
| | 6,295 |
| | 8.1 |
| 95,618 |
| | 100.0 |
| | 86,651 |
| | 100.0 |
| | 8,967 |
| | 10.3 |
|
| Cost of revenue: | | | | | | | | | | | | | | | | | | | | | | |
| Provision for loan losses | 39,582 |
| | 47.3 |
| | 36,586 |
| | 47.3 |
| | 2,996 |
| | 8.2 |
| 33,293 |
| | 34.8 |
| | 32,733 |
| | 37.8 |
| | 560 |
| | 1.7 |
|
| Funding costs | 11,330 |
| | 13.5 |
| | 8,452 |
| | 10.9 |
| | 2,878 |
| | 34.1 |
| 12,202 |
| | 12.8 |
| | 11,616 |
| | 13.4 |
| | 586 |
| | 5.0 |
|
| Total cost of revenue | 50,912 |
| | 60.8 |
| | 45,038 |
| | 58.2 |
| | 5,874 |
| | 13.0 |
| 45,495 |
| | 47.6 |
| | 44,349 |
| | 51.2 |
| | 1,146 |
| | 2.6 |
|
| Net revenue | 32,754 |
| | 39.2 |
| | 32,333 |
| | 41.8 |
| | 421 |
| | 1.3 |
| 50,123 |
| | 52.4 |
| | 42,302 |
| | 48.8 |
| | 7,821 |
| | 18.5 |
|
| Operating expenses: | | | | | | |
| | | | | | | | | | | | | | | |
| Sales and marketing | 11,903 |
| | 14.2 |
| | 16,789 |
| | 21.7 |
| | (4,886 | ) | | (29.1 | ) | 11,432 |
| | 12.0 |
| | 15,368 |
| | 17.7 |
| | (3,936 | ) | | (25.6 | ) |
| Technology and analytics | 11,748 |
| | 14.0 |
| | 15,050 |
| | 19.5 |
| | (3,302 | ) | | (21.9 | ) | 12,799 |
| | 13.4 |
| | 14,769 |
| | 17.0 |
| | (1,970 | ) | | (13.3 | ) |
| Processing and servicing | 4,160 |
| | 5.0 |
| | 5,181 |
| | 6.7 |
| | (1,021 | ) | | (19.7 | ) | 5,041 |
| | 5.3 |
| | 4,826 |
| | 5.6 |
| | 215 |
| | 4.5 |
|
| General and administrative | 9,440 |
| | 11.3 |
| | 12,375 |
| | 16.0 |
| | (2,935 | ) | | (23.7 | ) | 16,034 |
| | 16.8 |
| | 9,590 |
| | 11.1 |
| | 6,444 |
| | 67.2 |
|
| Total operating expenses | 37,251 |
| | 44.5 |
| | 49,395 |
| | 63.9 |
| | (12,144 | ) | | (24.6 | ) | 45,306 |
| | 47.5 |
| | 44,553 |
| | 51.4 |
| | 753 |
| | 1.7 |
|
| Loss from operations | (4,497 | ) | | (5.3 | ) | | (17,062 | ) | | (22.1 | ) | | 12,565 |
| | 73.6 |
| |
| Income (loss) from operations | | 4,817 |
| | 4.9 |
| | (2,251 | ) | | (2.6 | ) | | 7,068 |
| | 314.0 |
|
| Other expense: | | | | | | |
| | | | | | | | | | | | | | | |
| Interest expense | (35 | ) | | — |
| | (111 | ) | | (0.1 | ) | | 76 |
| | 68.5 |
| 43 |
| | — |
| | 318 |
| | 0.4 |
| | (275 | ) | | (86.5 | ) |
| Total other expense: | (35 | ) | | — |
| | (111 | ) | | (0.1 | ) | | 76 |
| | 68.5 |
| 43 |
| | — |
| | 318 |
| | 0.4 |
| | (275 | ) | | (86.5 | ) |
| Loss before provision for income taxes | (4,532 | ) | | (5.3 | ) | | (17,173 | ) | | (22.2 | ) | | 12,641 |
| | 73.6 |
| 4,774 |
| | 4.9 |
| | (2,569 | ) | | (3.0 | ) | | 7,343 |
| | 285.8 |
|
| Provision for income taxes | — |
| | — |
| | — |
| | — |
| | — |
| | — |
| — |
| | — |
| | — |
| | — |
| | — |
| | — |
|
| Net loss | $ | (4,532 | ) | | (5.3 | )% | | $ | (17,173 | ) | | (22.2 | )% | | $ | 12,641 |
| | 73.6 | % | |
| Net income (loss) | | $ | 4,774 |
| | 4.9 | % | | $ | (2,569 | ) | | (3.0 | )% | | $ | 7,343 |
| | 285.8 | % |
Revenue
| | | | Three Months Ended September 30, | | | | | Three Months Ended June 30, | | | | |
| | | | | | | | | | Period-to-Period | | | | | | | | | Period-to-Period |
| | 2017 | | 2016 | | Change | 2018 | | 2017 | | Change |
| | Amount | | Percentage of
Gross
Revenue | | Amount | | Percentage of
Gross
Revenue | | Amount | | Percentage | Amount | | Percentage of
Gross
Revenue | | Amount | | Percentage of
Gross
Revenue | | Amount | | Percentage |
| | (dollars in thousands) | (dollars in thousands) |
| Revenue: | | |
| Interest income | $ | 80,122 |
| | 95.8 | % | | $ | 71,361 |
| | 92.2 | % | | $ | 8,761 |
| | 12.3 | % | $ | 92,371 |
| | 96.6 | % | | $ | 83,721 |
| | 96.6 | % | | $ | 8,650 |
| | 10.3 | % |
| Gain on sales of loans | 146 |
| | 0.2 |
| | 2,670 |
| | 3.5 |
| | (2,524 | ) | | (94.5 | ) | — |
| | — |
| | 260 |
| | 0.3 |
| | (260 | ) | | (100.0 | ) |
| Other revenue | 3,398 |
| | 4.0 |
| | 3,340 |
| | 4.3 |
| | 58 |
| | 1.7 |
| 3,247 |
| | 3.4 |
| | 2,670 |
| | 3.1 |
| | 577 |
| | 21.6 |
|
| Gross revenue | $ | 83,666 |
| | 100.0 | % | | $ | 77,371 |
| | 100.0 | % | | $ | 6,295 |
| | 8.1 | % | $ | 95,618 |
| | 100.0 | % | | $ | 86,651 |
| | 100.0 | % | | $ | 8,967 |
| | 10.3 | % |
Gross revenue increased by $6.3$9.0 million, or 8.1%10.3%, from $77.4$86.7 million to $83.7$95.6 million. This growthincrease was in part attributable to an $8.8$8.7 million, or 12.3%10.3%, increase in interest income.income, which was primarily driven by the increase in weighted average APR on term loans and lines of credit. The decreased utilization of OnDeck Marketplace resultedincrease in a greaterinterest income was also driven by higher volume of loans being held on our balance sheet as evidenced by the 12.2%3% increase in average loansAverage Loans to $960.6 million$1.03 billion from $856.3 million. The increase in interest income was also driven by the increase in our EIY on loans outstanding to 33.4% from 32.8%.$1 billion.
Gain on sales of loans decreased by $2.5 million. This decrease was$0.3 million to zero as no loans were sold in the quarter ending June 30, 2018.
Other revenue increased by $0.6 million, or 21.6%, primarily attributable to an $84.4increase of $1.1 million in platform fees. This was offset by a decrease of $0.5 million in loan servicing fees which was driven by the decrease in sales of loans through OnDeck Marketplace and a decrease in Marketplace Gain on Sale Rate from 3.0% to 2.7%.loan sales.
Cost of Revenue
| | | | Three Months Ended September 30, | | | | | Three Months Ended June 30, | | | | |
| | | | | | | | | | Period-to-Period | | | | | | | | | Period-to-Period |
| | 2017 | | 2016 | | Change | 2018 | | 2017 | | Change |
| | Amount | | Percentage of
Gross
Revenue | | Amount | | Percentage of
Gross
Revenue | | Amount | | Percentage | Amount | | Percentage of
Gross
Revenue | | Amount | | Percentage of
Gross
Revenue | | Amount | | Percentage |
| | (dollars in thousands) | (dollars in thousands) |
| Cost of revenue: | | | | | | | | | | | | | | | | | | | | | | |
| Provision for loan losses | $ | 39,582 |
| | 47.3 | % | | $ | 36,586 |
| | 47.3 | % | | $ | 2,996 |
| | 8.2 | % | $ | 33,293 |
| | 34.8 | % | | $ | 32,733 |
| | 37.8 | % | | $ | 560 |
| | 1.7 | % |
| Funding costs | 11,330 |
| | 13.5 |
| | 8,452 |
| | 10.9 |
| | 2,878 |
| | 34.1 |
| 12,202 |
| | 12.8 |
| | 11,616 |
| | 13.4 |
| | 586 |
| | 5.0 |
|
| Total cost of revenue | $ | 50,912 |
| | 60.8 | % | | $ | 45,038 |
| | 58.2 | % | | $ | 5,874 |
| | 13.0 | % | $ | 45,495 |
| | 47.6 | % | | $ | 44,349 |
| | 51.2 | % | | $ | 1,146 |
| | 2.6 | % |
Provision for Loan Losses. Provision for loan losses increased by $3.0$0.6 million, or 8.2%1.7%, from $36.6$32.7 million to $39.6 million. In accordance with GAAP, we recognize revenue on loans over their term, but provide for estimated credit losses on the loans at the time they are originated. We then periodically adjust those estimates based on actual performance and changes in loss assumptions. As a result, we believe that analyzing provision for loan losses as a percentage of originations in addition to as a percentage of gross revenue provides useful insight into our operating performance. Our provision for loan losses as a percentage of originations held for investment, or the Provision Rate, increased from 6.9% to 7.5%. The increase in the Provision Rate was primarily due to the impact of the hurricanes. In addition, based on subsequently available information, the 6.9% Provision Rate for the three months ended September 30, 2016 underestimated actual losses. For additional information on the impact of the hurricanes on our provision and the under prediction of loss in 2016, see Part I - Item 2 "Management's Discussion and Analysis of Financial Condition and Results of Operations - Key Factors Affecting our Performance - Credit Performance."
Funding Costs. Funding costs increased by $2.9 million, or 34.1%, from $8.4 million to $11.3 million. The increase in funding costs was primarily attributable to the increases in our aggregate outstanding borrowings and higher interest rates. The Average Funding Debt Outstanding was $710.6 million compared to $597.7 million while our Cost of Funds Rate increased to 6.4% from 5.7%. As a percentage of gross revenue, funding costs increased from 10.9% to 13.5%. The increase in funding costs as a percentage of gross revenue was the result of increased utilization of funding debt, which increased the numerator of the calculation. In addition, the decrease in the gain on sale rate, and the decrease in the volume of loans sold through OnDeck Marketplace decreased the denominator of the calculation.
Operating Expense
Sales and Marketing
|
| | | | | | | | | | | | | | | | | | | | |
| | Three Months Ended September 30, | | | | |
| | | | | | | | | | Period-to-Period |
| | 2017 | | 2016 | | Change |
| | Amount | | Percentage of
Gross
Revenue | | Amount | | Percentage of
Gross
Revenue | | Amount | | Percentage |
| | (dollars in thousands) |
| Sales and marketing | $ | 11,903 |
| | 14.2 | % | | $ | 16,789 |
| | 21.7 | % | | $ | (4,886 | ) | | (29.1 | )% |
Sales and marketing expense decreased by $4.9 million, or 29.1%, from $16.8 million to $11.9 million. The decrease was primarily attributable to a $2.3 million decrease in customer acquisition marketing spend and a decrease of $2.0 million in personnel related costs. Additionally, brand and radio/television advertising spend decreased by $1.3 million. This was partially offset by an increase of $0.6 million in syndication program costs.
Technology and Analytics
|
| | | | | | | | | | | | | | | | | | | | |
| | Three Months Ended September 30, | | | | |
| | | | | | Period-to-Period |
| | 2017 | | 2016 | | Change |
| | Amount | | Percentage of
Gross
Revenue | | Amount | | Percentage of
Gross
Revenue | | Amount | | Percentage |
| | (dollars in thousands) |
| Technology and analytics | $ | 11,748 |
| | 14.0 | % | | $ | 15,050 |
| | 19.5 | % | | $ | (3,302 | ) | | (21.9 | )% |
Technology and analytics expense decreased by $3.3 million, or 21.9%, from $15.1 million to $11.7 million. The decrease was primarily attributable to a $2.7 million decrease in personnel-related costs. Additionally, there was a $0.5 million decrease in software license, consulting and hosting spend.
Processing and Servicing
|
| | | | | | | | | | | | | | | | | | | | |
| | Three Months Ended September 30, | | | | |
| | | | | | Period-to-Period |
| | 2017 | | 2016 | | Change |
| | Amount | | Percentage of
Gross
Revenue | | Amount | | Percentage of
Gross
Revenue | | Amount | | Percentage |
| | (dollars in thousands) |
| Processing and servicing | $ | 4,160 |
| | 5.0 | % | | $ | 5,181 |
| | 6.7 | % | | $ | (1,021 | ) | | (19.7 | )% |
Processing and servicing expense decreased by $1.0 million, or 19.7%, from $5.2 million to $4.2 million. The decrease was primarily attributable to a $0.9 million decrease in personnel-related costs.
General and Administrative
|
| | | | | | | | | | | | | | | | | | | | |
| | Three Months Ended September 30, | | | | |
| | | | | | Period-to-Period |
| | 2017 | | 2016 | | Change |
| | Amount | | Percentage of
Gross
Revenue | | Amount | | Percentage of
Gross
Revenue | | Amount | | Percentage |
| | (dollars in thousands) |
| General and administrative | $ | 9,440 |
| | 11.3 | % | | $ | 12,375 |
| | 16.0 | % | | $ | (2,935 | ) | | (23.7 | )% |
General and administrative expense decreased by $2.9 million, or 23.7%, from $12.3 million to $9.4 million. Salary and personnel-related costs decreased by $0.8 million. The gain related to foreign currency transactions and holdings in Canadian Dollars decreased expenses by $1.1 million driven by the increased value of the Canadian Dollar. Additionally, travel and entertainment expenses decreased by $0.4 million.
Comparison of the Nine Months Ended September 30, 2017 and 2016
Unless expressly stated otherwise, all comparisons and variance explanations are related to the nine months ended September 30, 2017 as compared to the nine months ended September 30, 2016.
|
| | | | | | | | | | | | | | | | | | | | |
| | Nine Months Ended September 30, | | | | |
| | | | | | | | | | Period-to-Period |
| | 2017 | | 2016 | | Change |
| | Amount | | Percentage of
Gross
Revenue | | Amount | | Percentage of
Gross
Revenue | | Amount | | Percentage |
| | (dollars in thousands) |
| Revenue: | | | | | | | | | | | |
| Interest income | $ | 250,954 |
| | 95.3 | % | | $ | 188,726 |
| | 90.1 | % | | $ | 62,228 |
| | 33.0 | % |
| Gain on sales of loans | 1,890 |
| | 0.7 |
| | 12,594 |
| | 6.0 |
| | (10,704 | ) | | (85.0 | ) |
| Other revenue | 10,365 |
| | 4.0 |
| | 8,168 |
| | 3.9 |
| | 2,197 |
| | 26.9 |
|
| Gross revenue | 263,209 |
| | 100.0 |
| | 209,488 |
| | 100.0 |
| | 53,721 |
| | 25.6 |
|
| Cost of revenue: | | | | | | | | | | | |
| Provision for loan losses | 118,495 |
| | 45.0 |
| | 94,294 |
| | 45.0 |
| | 24,201 |
| | 25.7 |
|
| Funding costs | 34,223 |
| | 13.0 |
| | 22,548 |
| | 10.8 |
| | 11,675 |
| | 51.8 |
|
| Total cost of revenue | 152,718 |
| | 58.0 |
| | 116,842 |
| | 55.8 |
| | 35,876 |
| | 30.7 |
|
| Net revenue | 110,491 |
| | 42.0 |
| | 92,646 |
| | 44.2 |
| | 17,845 |
| | 19.3 |
|
| Operating expenses: | | | | | | | | | | | |
| Sales and marketing | 42,090 |
| | 16.0 |
| | 50,094 |
| | 23.9 |
| | (8,004 | ) | | (16.0 | ) |
| Technology and analytics | 41,960 |
| | 15.9 |
| | 42,894 |
| | 20.5 |
| | (934 | ) | | (2.2 | ) |
| Processing and servicing | 13,521 |
| | 5.1 |
| | 14,261 |
| | 6.8 |
| | (740 | ) | | (5.2 | ) |
| General and administrative | 30,917 |
| | 11.7 |
| | 34,233 |
| | 16.3 |
| | (3,316 | ) | | (9.7 | ) |
| Total operating expenses | 128,488 |
| | 48.7 |
| | 141,482 |
| | 67.5 |
| | (12,994 | ) | | (9.2 | ) |
| Loss from operations | (17,997 | ) | | (6.7 | ) | | (48,836 | ) | | (23.3 | ) | | 30,839 |
| | 63.1 |
|
| Other expense: | | | | | | | | | | | |
| Interest expense | (706 | ) | | (0.3 | ) | | (186 | ) | | (0.1 | ) | | (520 | ) | | (279.6 | ) |
| Total other expense: | (706 | ) | | (0.3 | ) | | (186 | ) | | (0.1 | ) | | (520 | ) | | (279.6 | ) |
| Loss before provision for income taxes | (18,703 | ) | | (7.0 | ) | | (49,022 | ) | | (23.4 | ) | | 30,319 |
| | 61.8 |
|
| Provision for income taxes | — |
| | — |
| | — |
| | — |
| | — |
| | — |
|
| Net loss | $ | (18,703 | ) | | (7.0 | )% | | $ | (49,022 | ) | | (23.4 | )% | | $ | 30,319 |
| | 61.8 | % |
Revenue
|
| | | | | | | | | | | | | | | | | | | | |
| | Nine Months Ended September 30, | | | | |
| | | | | | | | | | Period-to-Period |
| | 2017 | | 2016 | | Change |
| | Amount | | Percentage of
Gross
Revenue | | Amount | | Percentage of
Gross
Revenue | | Amount | | Percentage |
| | (dollars in thousands) |
| Revenue: | |
| Interest income | $ | 250,954 |
| | 95.3 | % | | $ | 188,726 |
| | 90.1 | % | | $ | 62,228 |
| | 33.0 | % |
| Gain on sales of loans | 1,890 |
| | 0.7 |
| | 12,594 |
| | 6.0 |
| | (10,704 | ) | | (85.0 | ) |
| Other revenue | 10,365 |
| | 4.0 |
| | 8,168 |
| | 3.9 |
| | 2,197 |
| | 26.9 |
|
| Gross revenue | $ | 263,209 |
| | 100.0 | % | | $ | 209,488 |
| | 100.0 | % | | $ | 53,721 |
| | 25.6 | % |
Gross revenue increased by $53.7 million, or 26%, from $209.5 million to $263.2 million. This growth was in part attributable to a $62.2 million, or 33.0%, increase in interest income. The decreased utilization of OnDeck Marketplace resulted in a greater volume of loans being held on our balance sheet as evidenced by the 34% increase in average loans to $1.0 billion from $749.0 million.
Gain on sales of loans decreased by $10.7 million, from $12.6 million to $1.9 million. This decrease was primarily attributable to a $236.2 million decrease in sales of loans through OnDeck Marketplace and a decrease in Marketplace Gain on Sale Rate from 4.3% to 3.3%.
Other revenue increased $2.2 million, or 27%, primarily attributable to an increase of $1.9 million in platform fees, and an increase of $0.7 million in monthly fees earned from lines of credit as the total number of units of outstanding lines of credit increased period over period. This was offset by a decrease in income of $0.6 million from our syndication partner program.
Cost of Revenue
|
| | | | | | | | | | | | | | | | | | | | |
| | Nine Months Ended September 30, | | | | |
| | | | | | | | | | Period-to-Period |
| | 2017 | | 2016 | | Change |
| | Amount | | Percentage of
Gross
Revenue | | Amount | | Percentage of
Gross
Revenue | | Amount | | Percentage |
| | (dollars in thousands) |
| Cost of revenue: | | | | | | | | | | | |
| Provision for loan losses | $ | 118,495 |
| | 45.0 | % | | $ | 94,294 |
| | 45.0 | % | | $ | 24,201 |
| | 25.7 | % |
| Funding costs | 34,223 |
| | 13.0 |
| | 22,548 |
| | 10.8 |
| | 11,675 |
| | 51.8 |
|
| Total cost of revenue | $ | 152,718 |
| | 58.0 | % | | $ | 116,842 |
| | 55.8 | % | | $ | 35,876 |
| | 30.7 | % |
Provision for Loan Losses. Provision for loan losses increased by $24.2 million, or 26%, from $94.3 million to $118.5$33.3 million. In accordance with GAAP, we recognize revenue on loans over their term, but provide for probable credit losses on the loans at the time they are originated. We then periodically adjust our estimate of those probable credit losses based on actual performance and changes in loss estimates. As a result, we believe that analyzing provision for loan losses as a percentage of originations in addition toheld for investment, rather than as a percentage of gross revenue, provides furthermore useful insight into our operating performance. Our provision for loan losses as a percentage of originations held for investment, or the Provision Rate, decreased from 7.2% to 5.7%. The decrease in the Provision Rate is largely attributable to the tightening of our credit policies used to determine eligibility, pricing and loan size for certain customers. The tightening of our credit policies began in early 2017.
Funding costs increased by $0.6 million, or 5.0%, from 6.4%$11.6 million to 7.8%$12.2 million. As a percentage of gross revenue, funding costs decreased from 13.4% to 12.8%. The increase in funding costs was primarily attributable to the increase in interest expense and unused fees in our facilities. Interest expense increased due to benchmark interest rates increases, which were partially offset by decreases in the interest rate margins (the applicable percentage rate above the benchmark interest rate charged by the lender) on our outstanding debt. The increase of unused fees was driven by decreased utilization of our more expensive facilities.
Average Funding Debt Outstanding decreased from $747.0 million to $735.1 million while our Cost of Funds Rate increased from 6.2% to 6.6%.
Operating Expense
Sales and marketing
|
| | | | | | | | | | | | | | | | | | | | |
| | Three Months Ended June 30, | | | | |
| | | | | | | | | | Period-to-Period |
| | 2018 | | 2017 | | Change |
| | Amount | | Percentage of
Gross
Revenue | | Amount | | Percentage of
Gross
Revenue | | Amount | | Percentage |
| | (dollars in thousands) |
| Sales and marketing | $ | 11,432 |
| | 12.0 | % | | $ | 15,368 |
| | 17.7 | % | | $ | (3,936 | ) | | (25.6 | )% |
Sales and marketing expense decreased by $3.9 million, or 26%, from $15.4 million to $11.4 million. The decrease was primarily attributable to a $1.4 million decrease in customer acquisition costs, a decrease of $1.1 million in personnel-related costs, and a $0.3 million decrease in occupancy costs due to the lease terminations which occurred during the first quarter of 2018. Additionally, syndication program costs decreased by $0.6 million, radio/television advertising decreased by $0.4 million, and general marketing spend decreased by $0.2 million.
Technology and analytics
|
| | | | | | | | | | | | | | | | | | | | |
| | Three Months Ended June 30, | | | | |
| | | | | | Period-to-Period |
| | 2018 | | 2017 | | Change |
| | Amount | | Percentage of
Gross
Revenue | | Amount | | Percentage of
Gross
Revenue | | Amount | | Percentage |
| | (dollars in thousands) |
| Technology and analytics | $ | 12,799 |
| | 13.4 | % | | $ | 14,769 |
| | 17.0 | % | | $ | (1,970 | ) | | (13.3 | )% |
Technology and analytics expense decreased by $2.0 million, or 13%, from $14.8 million to $12.8 million. The decrease was primarily attributable to a $1.8 million decrease in personnel-related costs.
Processing and servicing
|
| | | | | | | | | | | | | | | | | | | | |
| | Three Months Ended June 30, | | | | |
| | | | | | Period-to-Period |
| | 2018 | | 2017 | | Change |
| | Amount | | Percentage of
Gross
Revenue | | Amount | | Percentage of
Gross
Revenue | | Amount | | Percentage |
| | (dollars in thousands) |
| Processing and servicing | $ | 5,041 |
| | 5.3 | % | | $ | 4,826 |
| | 5.6 | % | | $ | 215 |
| | 4.5 | % |
Processing and servicing expense increased by $0.2 million, or 5%, from $4.8 million to $5.0 million. The increase was primarily attributable to an increase in costs associated with the increase of originations.
General and administrative
|
| | | | | | | | | | | | | | | | | | | | |
| | Three Months Ended June 30, | | | | |
| | | | | | Period-to-Period |
| | 2018 | | 2017 | | Change |
| | Amount | | Percentage of
Gross
Revenue | | Amount | | Percentage of
Gross
Revenue | | Amount | | Percentage |
| | (dollars in thousands) |
| General and administrative | $ | 16,034 |
| | 16.8 | % | | $ | 9,590 |
| | 11.1 | % | | $ | 6,444 |
| | 67.2 | % |
General and administrative expense increased by $6.4 million, or 67%, from $9.6 million to $16.0 million. The increase was in part attributable to a $1.8 million increase in personnel-related costs and by a $1.5 million increase in loss on foreign currency transactions and holdings driven by the decreased value of foreign currencies relative to the US Dollar in the second quarter of 2018 compared to the second quarter of 2017. Additionally, we recorded a $1.4 million loss on the extinguishment of debt resulting from the write- off of the remaining balance of deferred issuance costs in connection with the prepayment of the ODAST II 2016-1 debt during the second quarter of 2018. Professional fees increased by $0.9 million due to increased legal and finance consultant spend and recruiting fees increased by $0.6 million.
Comparison of the Six Months Ended June 30, 2018 and 2017
|
| | | | | | | | | | | | | | | | | | | | |
| | Six Months Ended June 30, | | | | |
| | | | | | | | | | Period-to-Period |
| | 2018 | | 2017 | | Change |
| | Amount | | Percentage of
Gross
Revenue | | Amount | | Percentage of
Gross
Revenue | | Amount | | Percentage |
| | (dollars in thousands) |
| Revenue: | | | | | | | | | | | |
| Interest income | $ | 178,740 |
| | 96.1 | % | | $ | 170,832 |
| | 95.1 | % | | $ | 7,908 |
| | 4.6 | % |
| Gain on sales of loans | — |
| | — |
| | 1,744 |
| | 1.0 |
| | (1,744 | ) | | (100.0 | ) |
| Other revenue | 7,158 |
| | 3.9 |
| | 6,967 |
| | 3.9 |
| | 191 |
| | 2.7 |
|
| Gross revenue | 185,898 |
| | 100.0 |
| | 179,543 |
| | 100.0 |
| | 6,355 |
| | 3.5 |
|
| Cost of revenue: | | | | | | | | | | | |
| Provision for loan losses | 69,586 |
| | 37.4 |
| | 78,913 |
| | 44.0 |
| | (9,327 | ) | | (11.8 | ) |
| Funding costs | 24,023 |
| | 12.9 |
| | 22,893 |
| | 12.8 |
| | 1,130 |
| | 4.9 |
|
| Total cost of revenue | 93,609 |
| | 50.4 |
| | 101,806 |
| | 56.8 |
| | (8,197 | ) | | (8.1 | ) |
| Net revenue | 92,289 |
| | 49.6 |
| | 77,737 |
| | 43.2 |
| | 14,552 |
| | 18.7 |
|
| Operating expenses: | | | | | | | | | | | |
| Sales and marketing | 22,030 |
| | 11.9 |
| | 30,187 |
| | 16.8 |
| | (8,157 | ) | | (27.0 | ) |
| Technology and analytics | 23,806 |
| | 12.8 |
| | 30,212 |
| | 16.8 |
| | (6,406 | ) | | (21.2 | ) |
| Processing and servicing | 10,262 |
| | 5.5 |
| | 9,361 |
| | 5.2 |
| | 901 |
| | 9.6 |
|
| General and administrative | 33,759 |
| | 18.2 |
| | 21,477 |
| | 12.0 |
| | 12,282 |
| | 57.2 |
|
| Total operating expenses | 89,857 |
| | 48.4 |
| | 91,237 |
| | 50.8 |
| | (1,380 | ) | | (1.5 | ) |
| Income (loss) from operations | 2,432 |
| | 1.3 |
| | (13,500 | ) | | (7.6 | ) | | 15,932 |
| | 118.0 |
|
| Other expense: | | | | | | | | | | | |
| Interest expense | 94 |
| | 0.1 |
| | 671 |
| | 0.4 |
| | (577 | ) | | (86.0 | ) |
| Total other expense: | 94 |
| | 0.1 |
| | 671 |
| | 0.4 |
| | (577 | ) | | (86.0 | ) |
| Loss before provision for income taxes | 2,338 |
| | 1.3 |
| | (14,171 | ) | | (8.0 | ) | | 16,509 |
| | 116.5 |
|
| Provision for income taxes | — |
| | — |
| | — |
| | — |
| | — |
| | — |
|
| Net income (loss) | $ | 2,338 |
| | 1.3 | % | | $ | (14,171 | ) | | (8.0 | )% | | $ | 16,509 |
| | 116.5 | % |
Revenue
|
| | | | | | | | | | | | | | | | | | | | |
| | Six Months Ended June 30, | | | | |
| | | | | | | | | | Period-to-Period |
| | 2018 | | 2017 | | Change |
| | Amount | | Percentage of
Gross
Revenue | | Amount | | Percentage of
Gross
Revenue | | Amount | | Percentage |
| | (dollars in thousands) |
| Revenue: | |
| Interest income | $ | 178,740 |
| | 96.1 | % | | $ | 170,832 |
| | 95.1 | % | | $ | 7,908 |
| | 4.6 | % |
| Gain on sales of loans | — |
| | — |
| | 1,744 |
| | 1.0 |
| | (1,744 | ) | | (100.0 | ) |
| Other revenue | 7,158 |
| | 3.9 |
| | 6,967 |
| | 3.9 |
| | 191 |
| | 2.7 |
|
| Gross revenue | $ | 185,898 |
| | 100.0 | % | | $ | 179,543 |
| | 100.0 | % | | $ | 6,355 |
| | 3.5 | % |
Gross revenue increased by $6.4 million, or 3.5%, from $179.5 million to $185.9 million. This increase was in part attributable to a $7.9 million, or 4.6%, increase in interest income, driven by the increase in weighted average APR on term loans and lines of credit, which was partially offset by the decrease of Average Loans from $1.02 billion to $1 billion.
Gain on sales of loans decreased by $1.7 million to zero as no loans were sold in the six months ended June 30, 2018.
Other revenue increased by $0.2 million, or 2.7%, primarily attributable to an increase of $1.4 million in platform fees. This was partially offset by a decrease of $0.5 million in marketing fees from our issuing bank partner and a $0.5 million decrease in other income due to a payment we received in 2017 for vacating office space in Australia.
Cost of Revenue
|
| | | | | | | | | | | | | | | | | | | | |
| | Six Months Ended June 30, | | | | |
| | | | | | | | | | Period-to-Period |
| | 2018 | | 2017 | | Change |
| | Amount | | Percentage of
Gross
Revenue | | Amount | | Percentage of
Gross
Revenue | | Amount | | Percentage |
| | (dollars in thousands) |
| Cost of revenue: | | | | | | | | | | | |
| Provision for loan losses | $ | 69,586 |
| | 37.4 | % | | $ | 78,913 |
| | 44.0 | % | | $ | (9,327 | ) | | (11.8 | )% |
| Funding costs | 24,023 |
| | 12.9 |
| | 22,893 |
| | 12.8 |
| | 1,130 |
| | 4.9 |
|
| Total cost of revenue | $ | 93,609 |
| | 50.4 | % | | $ | 101,806 |
| | 56.8 | % | | $ | (8,197 | ) | | (8.1 | )% |
Provision for loan losses. Provision for loan losses decreased by $9.3 million, or 11.8%, from $78.9 million to $69.6 million. In accordance with GAAP, we recognize revenue on loans over their term, but provide for probable credit losses on the loans at the time they are originated. We then periodically adjust our estimate of those probable credit losses based on actual performance and changes in loss estimates. As a result, we believe that analyzing provision for loan losses as a percentage of originations held for investment, rather than as a percentage of gross revenue, provides more useful insight into our operating performance. Our provision for loan losses as a percentage of originations held for investment, or the Provision Rate, was primarilydecreased from 8.0% to 5.9%. The decrease in the resultProvision Rate is largely attributable to the tightening of higher loss estimatesour credit policies used to determine eligibility, pricing and loan size for new originations as describedcertain customers. The tightening of our credit policies began in Part I - Item 2 "Management's Discussion and Analysis of Financial Condition and Results of Operations - Key Factors Affecting our Performance - Credit Performance."early 2017.
Funding Costscosts. Funding costs increased by $11.7$1.1 million, or 51.8%4.9%, from $22.5$22.9 million to $34.2$24 million. As a percentage of gross revenue, funding costs increased from 12.8% to 12.9%. The increase in funding costs was primarily attributable to the increases of interest expense, unused fees on our facilities and interest expense from the amortization of deferred debt issuance fees. Interest expense increased due to benchmark interest rates increases, which were partially offset by decreases in the interest rate margins (the applicable percentage rate above the benchmark interest rate charged by the lender) on our aggregate outstanding borrowings and higherdebt. The increase of unused fees was driven by decreased utilization of our more expensive facilities. We increased the borrowing
capacity of several debt facilities during 2017, which led to an increase in the unused portion of our facilities in the first half of 2018. Additionally, interest rates.expense from the amortization of our deferred debt issuance costs increased, as we incurred additional deferred debt issuance costs when amending several of the facilities during 2017. The Average Funding Debt Outstanding was $737.9decreased from $750.8 million compared to $505.4$715.1 million while our Cost of Funds Rate increased from 6.1% to 6.7%.
6.2% from 5.9%. As a percentage of gross revenue, funding costs increased from 10.8% to 13.0%. The increase in funding costs as a percentage of gross revenue was the result of increased utilization of funding debt, which increased the numerator of the calculation. In addition, the decrease in the gain on sale rate and the decrease in the volume of loans sold through OnDeck Marketplace decreased the denominator of the calculation.
Operating Expense
Sales and Marketingmarketing
|
| | | | | | | | | | | | | | | | | | | | |
| | Nine Months Ended September 30, | | | | |
| | | | | | | | | | Period-to-Period |
| | 2017 | | 2016 | | Change |
| | Amount | | Percentage of
Gross
Revenue | | Amount | | Percentage of
Gross
Revenue | | Amount | | Percentage |
| | (dollars in thousands) |
| Sales and marketing | $ | 42,090 |
| | 16.0 | % | | $ | 50,094 |
| | 23.9 | % | | $ | (8,004 | ) | | (16.0 | )% |
|
| | | | | | | | | | | | | | | | | | | | |
| | Six Months Ended June 30, | | | | |
| | | | | | | | | | Period-to-Period |
| | 2018 | | 2017 | | Change |
| | Amount | | Percentage of
Gross
Revenue | | Amount | | Percentage of
Gross
Revenue | | Amount | | Percentage |
| | (dollars in thousands) |
| Sales and marketing | $ | 22,030 |
| | 11.9 | % | | $ | 30,187 |
| | 16.8 | % | | $ | (8,157 | ) | | (27.0 | )% |
Sales and marketing expense decreased by $8.0$8.2 million, or 16%27%, from $50.1$30.2 million to $42.1$22.0 million. The decrease was primarily attributable to a $5.8$2.8 million decrease in customer acquisition marketing spend.costs, a decrease of $1.7 million in personnel-related costs, and a $0.9 million decrease in occupancy costs due to the lease terminations which occurred during the first quarter of 2018. Additionally, salary and personnel-relatedradio/television advertising decreased by $0.9 million, syndication program costs decreased by $1.8 million. Finally, brand$0.9 million and radio/television advertisinggeneral marketing spend decreased by $2.4 million, offset by an increase of $2.0 million in our syndication program and platform advertising costs.$0.4 million.
Technology and Analyticsanalytics
|
| | | | | | | | | | | | | | | | | | | | |
| | Nine Months Ended September 30, | | | | |
| | | | | | Period-to-Period |
| | 2017 | | 2016 | | Change |
| | Amount | | Percentage of
Gross
Revenue | | Amount | | Percentage of
Gross
Revenue | | Amount | | Percentage |
| | (dollars in thousands) |
| Technology and analytics | $ | 41,960 |
| | 15.9 | % | | $ | 42,894 |
| | 20.5 | % | | $ | (934 | ) | | (2.2 | )% |
|
| | | | | | | | | | | | | | | | | | | |
| | Six Months Ended June 30, | | | | |
| | | | | | | | | | Period-to-Period |
| | 2018 | | 2017 | | Change |
| | Amount | | Percentage of
Gross
Revenue | | Amount | | Percentage of
Gross
Revenue | | Amount | | Percentage |
| | (dollars in thousands) |
| Technology and analytics | $ | 23,806 |
| | 12.8 | % | | 30,212 |
| | 16.8 | % | | $ | (6,406 | ) | | (21.2 | )% |
Technology and analytics expense decreased by $0.9$6.4 million, or 2%21.2%, from $42.9$30.2 million to $42.0$23.8 million. The decrease was primarily attributable to a $1.7$5.1 million decrease in personnel-related costs. Additionally, there was a $0.7 million decrease in occupancy costs due to the lease terminations which occurred during the first quarter of 2018, a $0.8 million decrease in technology depreciation and a $0.4 million decrease in credit marketing data expense. This was partially offset by a $0.9$0.6 million increase in software license expense.technology consultant spend.
Processing and Servicingservicing
|
| | | | | | | | | | | | | | | | | | | | |
| | Nine Months Ended September 30, | | | | |
| | | | | | Period-to-Period |
| | 2017 | | 2016 | | Change |
| | Amount | | Percentage of
Gross
Revenue | | Amount | | Percentage of
Gross
Revenue | | Amount | | Percentage |
| | (dollars in thousands) |
| Processing and servicing | $ | 13,521 |
| | 5.1 | % | | $ | 14,261 |
| | 6.8 | % | | $ | (740 | ) | | (5.2 | )% |
|
| | | | | | | | | | | | | | | | | | | | |
| | Six Months Ended June 30, | | | | |
| | | | | | Period-to-Period |
| | 2018 | | 2017 | | Change |
| | Amount | | Percentage of
Gross
Revenue | | Amount | | Percentage of
Gross
Revenue | | Amount | | Percentage |
| | (dollars in thousands) |
| Processing and servicing | $ | 10,262 |
| | 5.5 | % | | $ | 9,361 |
| | 5.2 | % | | $ | 901 |
| | 9.6 | % |
Processing and servicing expense decreasedincreased by $0.7$0.9 million, or 5%9.6%, from $14.3$9.4 million to $13.5$10.3 million. The decreaseincrease was primarily attributable to an increase in costs associated with the increase of originations.
General and administrative
|
| | | | | | | | | | | | | | | | | | | | |
| | Six Months Ended June 30, | | | | |
| | | | | | Period-to-Period |
| | 2018 | | 2017 | | Change |
| | Amount | | Percentage of
Gross
Revenue | | Amount | | Percentage of
Gross
Revenue | | Amount | | Percentage |
| | (dollars in thousands) |
| General and administrative | $ | 33,759 |
| | 18.2 | % | | $ | 21,477 |
| | 12.0 | % | | $ | 12,282 |
| | 57.2 | % |
General and administrative expense increased by $12.3 million, or 57.2%, from $21.5 million to $33.8 million. The increase was primarily attributable to a $0.9$5.7 million decreasecharge related to the lease terminations in personnel-related costs partially offset bythe New York and Denver offices. We also had a $0.1$2.3 million increase in third-party processingpersonnel-related costs. Additionally, we recorded a $1.4 million of debt extinguishment costs and credit information.
General and Administrative
|
| | | | | | | | | | | | | | | | | | | | |
| | Nine Months Ended September 30, | | | | |
| | | | | | Period-to-Period |
| | 2017 | | 2016 | | Change |
| | Amount | | Percentage of
Gross
Revenue | | Amount | | Percentage of
Gross
Revenue | | Amount | | Percentage |
| | (dollars in thousands) |
| General and administrative | $ | 30,917 |
| | 11.7 | % | | $ | 34,233 |
| | 16.3 | % | | $ | (3,316 | ) | | (9.7 | )% |
General and administrative expense decreased by $3.3 million, or 10%, from $34.2 million to $30.9 million. Travel and entertainment expenses decreased by $1.8 million, and personnel related costs decreased by $1.4 million.write off the remaining balance of deferred issuance fees in connection with the extinguishment of the ODAST II 2016-1 debt that was prepaid during the second quarter of 2018. The gainloss related to foreign currency transactions and holdings increased in Canadian Dollars decreasedthe six months ended June 30, 2018, increasing expenses by $1.1$2.5 million, driven by the driven by the decreased value in exchange rates relative to the US Dollar in the second quarter of 2018 compared to the second quarter of 2017. Consulting fees also increased value of the Canadian Dollar. This decrease was partially offset by a $1.2$0.6 million increase in consulting, legal, accounting, and other professional fees.
Liquidity and Capital Resources
Sources of Liquidity
During the thirdsecond quarter of 2017,2018, we originated $530.9$586.7 million of loans and during the ninesix months ended SeptemberJune 30, 20172018 we originated $1.6$1.2 billion of loans utilizing a diversified set of funding sources, including cash on hand, third-party lenders (through debt facilities and securitization), OnDeck Marketplaceand the cash generated by our operating, investing and financing activities.
Cash on Hand
At SeptemberJune 30, 2017,2018, we had approximately $64$74 million of cash on hand to fund our future operations compared to approximately $80$71 million at December 31, 2016. The decline was primarily due to principal repayments we made on our corporate line of credit.
During the nine months ended September 30, 2017, our investment in the residual value of our portfolio, which is in general the portion of our financed loans in excess of the outstanding debt of our debt facilities, increased by approximately $2.2 million. Restricted cash also increased $12.3 million primarily due to the timing of when cash was transferred to unrestricted accounts. 2017.
Current Debt Facilities
The following table summarizes our current debt facilities available for funding our lending activities, referred to as funding debt, and for funding our operating expenditures, referred to as corporate debt, as of SeptemberJune 30, 2017.
2018.
| | | Description | Maturity
Date | | Weighted
Average
Interest Rate | | Borrowing
Capacity | | Principal
Outstanding | |
| | | (in millions) | Maturity
Date | | Weighted
Average
Interest Rate at June 30, 2018 | | Borrowing
Capacity | | Principal
Outstanding |
| Funding debt: | | | |
| | | | (in millions) |
| Funding Debt: | | | |
| OnDeck Asset Securitization Trust II LLC | May 2020 (1) | | 4.7% | | $ | 250.0 |
| | $ | 250.0 |
| April 2022 (1) | | 3.8% | | $ | 225.0 |
| | $ | 225.0 |
|
| OnDeck Account Receivables Trust 2013-1 LLC | March 2019 | | 3.9% | | 214.1 |
| | 123.5 |
| March 2019 | | 4.7% | | 214.1 |
| | 87.4 |
|
| Receivable Assets of OnDeck, LLC | November 2018 | | 3.7% | | 100.0 |
| | 71.1 |
| November 2018 | | 5.5% | | 119.7 |
| | 92.6 |
|
| On Deck Asset Company, LLC | | May 2019 | | 9.3% | | 100.0 |
| | 73.6 |
|
| OnDeck Asset Funding I, LLC | February 2020 (2) | | 8.5% | | 150.0 |
| | 81.6 |
| February 2020 (2) | | 9.2% | | 150.0 |
| | 75.0 |
|
| Prime OnDeck Receivable Trust II, LLC | December 2018 | | 3.7% | | 125.0 |
| (3) | 67.3 |
| December 2018 | | 4.7% | | 125.0 |
| | 68.4 |
|
| On Deck Asset Company, LLC | May 2019 | | 8.5% | | 100.0 |
| | 76.3 |
| |
| Loan Assets of OnDeck, LLC | | October 2022 (3) | | 4.0% | | 100.0 |
| | 72.2 |
|
| Other Agreements | Various(4) | | Various | | 44.0 |
| | 39.4 |
| Various (4) | | 8.0% | | 124.2 |
| | 67.5 |
|
| Total funding debt | | $ | 983.1 |
| | $ | 709.2 |
| |
| Corporate debt: | | | | | |
Total Funding Debt (5) | | | 5.6% | | $ | 1,158.0 |
| | $ | 761.9 |
|
| Corporate Debt: | | | | | |
| On Deck Capital, Inc. | October 2018 | | 5.5% | | $ | 30.0 |
| | $ | 17.2 |
| October 2018 | | 6.0% | | $ | 30.0 |
| | $ | — |
|
_________________________
(1) The period during which remaining cash flow can be used to purchase additional loans expires April 2018.
(2) The period during which new borrowings may be made under this facility expires in March 2020.
(2)The period during which new borrowings may be made under this debt facility expires in February 2019.
(3) Lenders obligation consists of a commitment to make loansThe period during which new borrowings may be made under this debt facility expires in amount of up to $125 million on a revolving basis. Lenders may also, in their sole discretion and on an uncommitted basis, make additional loans in amount of up to $75 million on a revolving basis.April 2022.
(4) Maturity dates range from October 2017July 2018 through December 2018.November 2020.
(5) May not sum due to rounding.
Our ability to fully utilize the available capacity of our debt facilities may also be impacted by provisionsrestrictions that limit concentration risk and eligibility. The debt facilities contain thresholds, known as concentration limitations, which restrict a debt facility’s collateral pool from being overly concentrated with loans that share pre-defined loan characteristics. In addition, debt facilities contain provisionrestrictions that limit the eligibility criteria of loans that may be financed, such as term length, loan amount and a borrower's home country. Loans that do not meet the criteria to be financed are referred to as ineligible loans. To the extent such concentration limits are exceeded or loans are deemed ineligible, newly originated loans with the pre-defined loan characteristics subject to that concentration limit or eligibility criteria may not be financed despite available capacity under the debt facilities.
OnDeck Marketplace
OnDeck Marketplace is our proprietary whole loan sale platform that allows participating third-party institutional investors to directly purchase small business loans from us. OnDeck Marketplace participants enter into whole loan purchase agreements, so as to purchase a pre-determined dollar amount of loans that satisfy certain eligibility criteria. Some participants agree to purchase such loans on what is known as a "forward flow basis" while other participants purchase larger pools of whole loans in isolated transactions. The loans are sold to the participant at a pre-determined purchase price above par. We recognize a gain or loss from OnDeck Marketplace loans when sold. We currently act as servicer in exchange for a servicing fee with respect to the loans purchased by the applicable OnDeck Marketplace participant. ForNo loans were sold during the ninesix months ended SeptemberJune 30, 2018. During the six months ended June 30, 2017, and 2016, 4.4% and 19.3%, respectively,we soldloans with an unpaid principal balance of total term loan originations were$50.2 million through OnDeckMarketplace originations.. The proportion of loans we sell if any, through OnDeck
Marketplace largely depends on the pricespremiums available to us. Tous as well as the extent our usecost and availability of other sources of liquidity. During the six months ended June 30, 2018, we did not sell any loans through OnDeck Marketplace and relied on liquidity from operating and financing activities. However, we may elect to make OnDeck Marketplace as a funding source decreases or ceasesloan sales in the future due to lower available premiums or otherwise, we may chooseprovide us an additional source of liquidity and to generate liquidity throughmaintain active relationships with our other available funding sources. However, subject to our overall financing and liquidity needs as well as the eligibility to finance new originations under our existing debt facilities, we may use or increase our use of OnDeck Marketplace regardless of whether premiums increase or decrease.institutional loan purchasers.
Cash and Cash Equivalents, Loans (Net of Allowance for Loan Losses), and Cash Flows
The following table summarizes our cash and cash equivalents, loans (net of ALLL) and cash flows:
| | | | As of and for the Nine Months Ended September 30, | As of and for the Six Months Ended June 30, |
| | 2017 | | 2016 | 2018 | | 2017 |
| | (in thousands) | (in thousands) |
| Cash and cash equivalents | $ | 64,292 |
| | $ | 85,948 |
| $ | 74,262 |
| | $ | 77,936 |
|
| Restricted cash | $ | 56,729 |
| | $ | 42,827 |
| $ | 44,189 |
| | $ | 54,166 |
|
| Loans held for investment, net | $ | 852,331 |
| | $ | 817,959 |
| $ | 922,530 |
| | $ | 865,255 |
|
| Cash provided by (used in): | | | | | | |
| Operating activities | $ | 149,143 |
| | $ | 89,523 |
| $ | 118,493 |
| | $ | 96,995 |
|
| Investing activities | $ | (131,949 | ) | | $ | (449,062 | ) | $ | (177,736 | ) | | $ | (80,910 | ) |
| Financing activities | $ | (33,280 | ) | | $ | 285,236 |
| $ | 64,277 |
| | $ | (8,748 | ) |
Our cash and cash equivalents at SeptemberJune 30, 20172018 were held primarily for working capital purposes. We may, from time to time, use excess cash and cash equivalents to fund our lending activities. We do not enter into investments for trading or speculative purposes. Our policy is to invest any cash in excess of our immediate working capital requirements in investments designed to preserve the principal balance and provide liquidity. Accordingly, our excess cash is invested primarily in demand deposit accounts that are currently providing only a minimal return.
Our restricted cash represents funds held in accounts as reserves on certain debt facilities and as collateral for issuing bank partner transactions. We have no ability to draw on such funds as long as they remain restricted under the applicable arrangements.
Cash Flows
Operating Activities
For the ninesix months ended SeptemberJune 30, 2018, net cash provided by our operating activities was $118.5 million, which was primarily the result of interest payments from our customers of $211.3 million, less $70.7 million utilized to pay our operating expenses and $21.4 million we used to pay the interest on our debt (both funding and corporate). During that same period, accounts payable and accrued expenses and other liabilities increased by approximately $3.1 million.
For the six months ended June 30, 2017, net cash provided by our operating activities was $149.1$97.0 million, which was primarily the result of our cash received from our customers including interest payments and other revenue of $297.7$202.4 million, plus proceeds from sale of loans held for sale of $45.9$42.7 million, less $43.5$40.4 million of loans held for sale originations in excess of loan repayments received, $118.9$85.9 million utilized to pay our operating expenses $31.5and $21.3 million we used to pay the interest on our debt (both funding and corporate) and $1.1 million of origination costs paid in excess of fees collected. During that same period, accounts payable and accrued expenses and other liabilities decreased by approximately $10.0 million.
For the nine months ended September 30, 2016, net cash provided by our operating activities was $89.5 million, which was primarily the result of our cash received from our customers including interest payments of $222.7 million, plus proceeds from sale of loans held for sale of $246.1 million, less $231.9 million of loans held for sale originations in excess of loan repayments received, $123.4 million utilized to pay our operating expense, $16.3 million we used to pay the interest on our debt (both funding and corporate) and $8.0$1.0 million of origination costs paid in excess of fees collected. During that same period, accounts payable and accrued expenses and other liabilities increased by approximately $0.5$7.3 million.
Investing Activities
Our investing activities have consisted primarily of funding our term loan and line of credit originations, including payment of associated direct costs and receipt of associated fees, offset by customer repayments of term loans and lines of credit, purchases of property, equipment and software, capitalized internal-use software development costs and proceeds from the sale of term loans which were not specifically identified at origination through our OnDeck Marketplace and changes in restricted cash.. Purchases of property, equipment and software and capitalized internal-use software development costs may vary from period to period due to the timing of the expansion of our operations, the addition of employee headcount and the development cycles of our internal-use technology.
From time to time in the past, we have voluntarily purchased and may again in the future voluntarily purchase our loans that were previously sold to third parties. The circumstances under which we effect these transactions depends on a variety of factors. In determining whether to engage in a certain voluntary purchase transactions, we consider, among other things, our relationship with the potential seller, the potential purchase price, credit profile of the target loans, our overall liquidity position and possible alternative uses of cash. Although these purchases have not been material in the past, depending upon the circumstances, they could be material in the future, depending on the quantity and timing of these purchases.
For the ninesix months ended SeptemberJune 30, 2018, net cash used to fund our investing activities was $177.7 million, and consisted primarily of $144.1 million of loan originations in excess of loan repayments received, $29.6 million of origination costs paid in excess of fees collected and $3.2 million for the purchase of property, equipment and software and capitalized internal-use software development costs.
For the six months ended June 30, 2017, net cash used to fund our investing activities was $131.9$80.9 million and consisted primarily of $82.2$66.7 million of loan originations in excess of loan repayments received, $32.7$21.3 million of origination costs paid in excess of fees collected, $13.7 million for the purchase of loans, a $12.3$9.7 million increase in restricted cash and $3.4$2.9 million for the purchase of property, equipment and software and capitalized internal-use software development costs. These uses of cash were partially offset by $12.4$10.0 million of proceeds from sales of loans held for investment.
For the nine months ended September 30, 2016, net cash used to fund our investing activities was $449.1 million, and consisted primarily of $458.8 million of loan originations in excess of loan repayments received, $32.9 million of origination costs paid in excess of fees collected and $10.0 million for the purchase of property, equipment and software and capitalized internal-use software development costs. These uses of cash were partially offset by $57.2 million of proceeds from sales of loans held for investment and a $4.4 million decrease in unrestricted cash during the year.
Financing Activities
Our financing activities have consisted primarily of net borrowings from our securitization facility and our revolving debt facilities as well as the issuance of common stock.
For the ninesix months ended SeptemberJune 30, 2018, net cash provided by our financing activities was $64.3 million and consisted primarily of $64.4 million in net additional debt drawn down from our debt facilities and $3.7 million of payments of debt issuance costs. These uses of cash were partially offset by $3.4 million of net cash received from noncontrolling interest, and $0.7 million of cash received from the issuance of common stock under the employee stock purchase plan.
For the six months ended June 30, 2017, net cash used in financing activities was $33.3$8.7 million and consisted primarily of $34.0$8.9 million in net repayments on our securitization and debt facilities and $3.2$3.3 million of payments of debt issuance costs. These uses of cash were partially offset by $2.4 million of net cash received from noncontrolling interest, and $1.8$1.2 million of cash received from the issuance of common stock under the employee stock purchase plan.
For the nine months ended September 30, 2016, net cash used to fund our financing activities was $285.2 million and consisted primarily of $287.7 million in net borrowings from our revolving debt facilities, primarily associated with the increase in loan originations during the year and $2.6 million cash received from the issuance of common stock under our employee stock
purchase plan, offset by $4.7 million in payments of debt issuance costs primarily associated with the closing of our $250 million securitization facility in May 2016 and the closing of our $100 million revolving facility in August 2016.
Operating and Capital Expenditure Requirements
As a result ofWe require substantial liquidity to fund our previouscurrent operating and capital expenditure requirements. We expect these requirements to increase as we pursue our growth strategy, we increased our annual originations significantly over each of the past three years. Our originations were $1.2 billion in 2014, $1.9 billion in 2015 and $2.4 billion in 2016, which equates to annual year over year growth rates of 152%, 62% and 28%, respectively.strategy.
In the near-term, we areOur strategy is to continue to grow in a disciplined manner while remaining highly focused on accelerating our timeline to profitability through improved credit quality, operating leverage and operating cost reductions.profitability. We expect our originations to decreasegrow in absolute dollars for the full year 20172018 as compared to the full year of 2016. The expected decline can be attributed to the tightening of our credit policies. Because we will remain focused on credit quality, we are prepared to forgo lending opportunities that do not meet our more stringent credit, underwriting and pricing standards. In addition, despite the continuing competition for customer response, we2017. We intend to allocate resources to continue to optimize marketing and customer acquisition costs based on targeted returns on investment.investment rather than spending inefficiently in these areas to achieve incremental growth.
Although by design our strategy will result in lower originations as compared to the prior year’s originations, we believe it will increase our operating leverage and improve our overall financial performance.
We estimate that at SeptemberJune 30, 2017,2018, approximately $285$305 million of our own cash had been invested in our loan portfolio, approximately 70%two-thirds of which was used to fund theour portfolio's residual value of loans financed using our debt facilities and the remainder was used to fund ineligible loans and to temporarily fund eligible loans not yet financed.loans. While investing in our portfolio's residual value is a requirement of our funding model and will remain a use of cash so long as we continue to grow loan balances, grow, the use of cash to fund ineligible loans may be mitigated if and to the extent we obtain funding capacity that permits the funding of the ineligible loans. Depending upon our existing and anticipated cash needs and other considerations, we may from time to time choose to pay down ourloans, either through debt facilities or finance loan originations with our own cash instead of debt to reduce funding costs.OnDeck Marketplace.
At SeptemberAs of June 30, 2017,2018, approximately $17.6$572.3 million of our funding debt capacity was scheduled to expire before June 30, 2019.
On April 13, 2018, our wholly-owned subsidiary, Loan Assets of OnDeck, LLC, established a new asset-backed revolving debt facility with a commitment amount of $100 million and an interest rate of 1-month LIBOR + 2.0%. The period during which new borrowings may be made under this facility expires on April 13, 2022 and the final maturity date is October 13, 2022.
On April 17, 2018, our wholly-owned subsidiary, OnDeck Asset Securitization Trust II LLC, issued $225 million in initial principal amount of fixed-rate asset backed offered notes in a securitization transaction. The notes were issued in four classes with a weighted average fixed interest rate of 3.75%. The revolving period expires on March 31, 2020 and the final maturity date
is April 2022. The net proceeds of this transaction were used, together with other available funds, to voluntarily prepay in full all $250 million of notes from a prior securitization.
On June 27, 2018, our wholly-owned subsidiary of the Company, Canada OnDeck Asset Funding, L.P, established a new asset-backed revolving debt facility with a commitment amount of CAD25 million and an additional CAD25 million of capacity available at the discretion of the lenders. The interest rate for the facility is a commercial paper rate + 4%. The period during which new borrowings may be made under this facility expires on June 27, 2020 and the final maturity date is June 27, 2021.
On June 28, 2018, OnDeck Funding Trust No. 2, a wholly-owned subsidiary of On Deck Capital Australia Pty Ltd, established a new asset-backed revolving debt facility with a commitment amount of AUD75 million. The interest rate for the facility is 1 Month BBSW+ 3.75%. The period during which new borrowings may be made under this facility expires on December 28, 2019 and the final maturity date is June 28, 2020.
In order to maintain or before September 30, 2018.grow our loan originations over the next 12 months, we will be required to extend existing debt facilities that have borrowing period expirations or final maturities during that period and/or secure new funding. We currently expect to be able to do so on market terms.
We expect to use cash flow generated from operations, available debt capacity andtogether with additional cash we may obtain by financing currently ineligible loans, to the extent that we are able to do so, to continue funding loan residuals.residual growth as our financed portfolio grows. In addition, we may also finance our loan residualsexpected residual growth through other unused liquidity sources such as our corporate line of credit or possible additional subordinated notes in our debt facilities.
Historically we have been successful in accessing the asset-backed loan market on terms acceptable to us, and we anticipate that we will be able to do so into the foreseeable future. However, if we deem the cost of accessing the asset-backed loan market to be in excess of an appropriate rate, we may elect to use available cash, seek to increase the use of OnDeck Marketplace, or use other financing options available to us. Furthermore, we could decide to alter the types of loans we originate, such that more loans are eligible for credit facilities, or we could decide to slow down the rate of originations.
In additionWe believe that our cash flow from operations, available capacity under our revolving lines of credit (and expected extensions or replacements of those lines) and existing cash balances, together with additional financing we expect to pursuing additional debt funding sources as described above, althoughbe able to obtain on market terms, are sufficient to meet both our existing operating and capital expenditure requirements and our currently planned growth for at least the next 12 months.
It is possible that we may require capital in excess of amounts we currently anticipate. Although it is not currently anticipated, depending upon the circumstances we may seek additional equity financing. The sale of equity may result in dilution to our stockholders, and those securities may have rights senior to those of our common stock. If we raise additional funds through the issuance of additional debt, the agreements governing such debt could contain covenants that would restrict our operations and such debt would rank senior to shares of our common stock.
We believe that our cash from operations, available capacity under our revolving lines of credit (and expected extensions or replacements of those lines), and existing cash balances, together with additional financing we expect to be able to obtain on market terms, are sufficient to meet both our existing operating and capital expenditure requirements for at least the next 12 months.
It is possible that we may require capital in excess of amounts we currently anticipate. Depending on market conditions and other factors, we may not be able to obtain additional capital for our current operations or anticipated future growth on reasonable terms or at all.
Contractual Obligations
Other than as described below, and as described under the subheading " - Liquidity"Liquidity and Capital Resources"Resources," and in Note 5 and Note 9 of Notes to Unaudited Condensed Consolidated Financial Statements, there have been no material changes in our commitments
under contractual obligations from those disclosed in our Annual Report on Form 10-K for the year ended December 31, 2016, Quarterly Report on Form 10-Q for2017.
As a result of the quarter ended March 31, 2017 and Quarterly Report on Form 10-Q forlease terminations described more fully in Note 9 of the quarter ended June 30, 2017.Notes to Unaudited Condensed Consolidated Financial Statements, our contractual obligations under our operating leases have decreased subsequent to year-end by approximately $23.4 million. Our projected future cash payments related to our operating leases are as follows:
|
| | | | | | | | | | | | | | | | | | |
| Contractual Obligations | | Total | | 2018 | | 2019-2020 | | 2021-2022 | | Thereafter |
| | | (in thousands) |
| Operating leases | | $ 55,304 | | $ | 6,424 |
| | $ | 13,386 |
| | $ | 12,641 |
| | $ | 22,853 |
|
Off-Balance Sheet Arrangements
As of SeptemberJune 30, 2017,2018, we did not have any off-balance sheet arrangements, as defined in Item 303(a)(4)(ii) of
Regulation S-K, such as the use of unconsolidated subsidiaries, structured finance, special purpose entities or variable interest entities.
Critical Accounting Policies and Significant Judgments and Estimates
There have been no material changes to our critical accounting policies and estimates as compared to those described in our Annual Report on Form 10-K for the year ended December 31, 2016.2017.
Our management’s discussion and analysis of our financial condition and results of operations isare based on our condensed consolidated financial statements, which have been prepared in accordance with GAAP. The preparation of these condensed consolidated financial statements requires us to make estimates and assumptions that affect the reported amounts of assets and liabilities, disclosure of contingent assets and liabilities at the date of the condensed consolidated financial statements, and the reported amounts of revenue and expenses during the reported period. In accordance with GAAP, we base our estimates on historical experience and on various other assumptions that we believe are reasonable under the circumstances. Actual results may differ from these estimates under different assumptions or conditions.
Recently Issued Accounting Pronouncements and JOBS Act Election
Recent Accounting Pronouncements Not Yet Adopted
Refer to Note 1, Organization and Summary of Significant Accounting Policies, contained in the Notes to Unaudited Condensed Consolidated Financial Statements in Item 1 of Part I of this report for a full description of the recent accounting pronouncements and our expectation of their impact, if any, on our results of operations and financial conditions.
Under the JOBS Act, we meet the definition of an “emerging growth company.” We have irrevocably elected to opt out of the extended transition period for complying with new or revised accounting standards pursuant to Section 107(b) of the JOBS Act.
|
| |
| Item 3. | Quantitative and Qualitative Disclosures About Market Risk |
There have been no material changes from the information previously reported under Part"Part II, Item 7A7A" of our Annual Report on Form 10-K for the year ended December 31, 2016.2017.
|
| |
| Item 4. | Controls and Procedures |
Disclosure Controls and Procedures
As required by Rule 13a-15 under the Securities Exchange Act of 1934, as amended, or the Exchange Act, management has evaluated, with the participation of our Chief Executive Officer and Chief Financial Officer, the effectiveness of our disclosure controls and procedures as of the end of the period covered by this report. Disclosure controls and procedures refer to controls and other procedures designed to ensure that information required to be disclosed in the reports we file or submit under the Exchange Act are recorded, processed, summarized, and reported within the time periods specified in the rules and forms of the Securities and Exchange Commission.SEC. Disclosure controls and procedures include, without limitation, controls and procedures designed to ensure that information required to be disclosed by us in our reports that we file or submit under the Exchange Act are accumulated and communicated to our management, including our Chief Executive Officer and Chief Financial Officer, as appropriate, to allow timely decisions regarding our required disclosure. In designing and evaluating our disclosure controls and procedures, management recognizes that any controls and procedures, no matter how well designed and operated, can provide only reasonable assurance of achieving the desired control objectives, and management iswas required to apply its judgment in evaluating and implementing possible controls and procedures.
Based on the foregoing evaluation, our Chief Executive Officer and Chief Financial Officer have concluded that, as of SeptemberJune 30, 2017,2018, the end of the period covered by this report, our disclosure controls and procedures were effective at a reasonable assurance level.
Changes in Internal Control over Financial Reporting
There were no changes in our internal control over financial reporting during the quarter ended SeptemberJune 30, 20172018 that have materially affected, or are reasonably likely to materially affect, our internal control over financial reporting.
PART II - OTHER INFORMATION
From time to time we are subject to legal proceedings and claims in the ordinary course of our business. The results of such matters cannot be predicted with certainty. However, we believe that the final outcome of any such current matters will not result in a material adverse effect on our consolidated financial condition, consolidated results of operations or consolidated cash flows.
Our current and prospective investors should carefully consider the following risks in addition to those described in "Part I, Item 1A. Risk Factors" in our Annual Report on Form 10-K for the year ended December 31, 2016, "Part II Item 1A. Risk Factors" in our Quarterly Report on Form 10-Q for the quarter ended June 30, 2017, and other documents that we file with the SEC from time to time which are available on the SEC website at www.sec.gov, and all other information contained in this report, including our unaudited condensed consolidated financial statements and the related notes, “Management’s Discussion and Analysis of Financial Condition and Results of Operations” and the “Cautionary Note Regarding Forward-Looking Statements,” before making investment decisions regarding our securities. The risks and uncertainties described below supplement, or to the extent inconsistent, supersede those in our above-mentioned Annual Report on Form 10-K. In addition, the risks and uncertainties below and in our above-mentioned Annual Report on Form 10-K and Quarterly Report on Form 10-Q are not the only ones we face, but include the most significant factors currently known by us. Additional risks and uncertainties that we are unaware of, or that we currently believe are not material, also may become important factors that affect us. If any of the followingthese risks materialize, our business, financial condition and results of operations could be materially harmed. In that case, the trading price of our securities could decline, and you may lose some or all of your investment.
Our business is subject to the risks of hurricanes, earthquakes, fires, floods and other natural disasters, power outages, telecommunications failures and similar events, and to interruption by man-made problems such as terrorism, cyberattack, and other actions. Comparable risks may also impact the demand for our loans or our customers’ ability to repay their loans.
Events beyond our control may damage our ability to accept our customers’ applications, underwrite loans, maintain our platform or perform our servicing obligations. Such events include, but are not limited to, hurricanes, earthquakes, fires, floods and other natural disasters, power outages, telecommunications failures and similar events. Despite any precautions we may take, system interruptions and delays could occur if there is a natural disaster, if a third-party provider closes a facility we use without adequate notice for financial or other reasons, or if there are other unanticipated problems at our leased facilities. As we rely heavily on our servers, computer and communications systems and the internet to conduct our business and provide high-quality customer service, such disruptions could harm our ability to run our business and cause lengthy delays which could harm our business, results of operations and financial condition. We currently are not able to switch instantly to our backup center in the event of failure of the main server site. This means that an outage at one facility could result in our system being unavailable for a significant period of time. Man-made problems such as terrorism, cyberattack, and other criminal, tortious or unintentional actions could also give rise to significant disruptions to our operations. Our business interruption insurance may not be sufficient to compensate us for losses that may result from interruptions in our service as a result of system failures or other disruptions. Comparable natural and man-made risks may reduce demand for our loans or cause our customers to suffer significant losses and/or incur significant disruption in their respective operations, which may affect their ability to repay their loans. All of the foregoing could materially and adversely affect our business, results of operations and financial condition.
The full impact of Hurricane Harvey and Hurricane Irma on our business and our customers is unknown, and could be worse than we currently expect.
Hurricane Harvey made landfall in Texas, on Friday, August 25, 2017 and Hurricane Irma made landfall in Florida on Sunday, September 10, 2017. For the nine months ended September 30, 2017, 8.8% of our total originations were in Texas and 9.5% were in Florida. In addition, at September 30, 2017, 11.5% of our Unpaid Principal Balance was in areas in Texas and Florida that had been designated as “individual assistance” disaster areas by the Federal Emergency Management Agency, or FEMA. The full impact of the hurricanes on our business, and on our customers’ businesses in the impacted areas, is unknown as of the date of this report. In preparing our financial statements as of and for the three and nine months ended September 30, 2017, we made significant estimates and assumptions, as we do each quarter, regarding the allowance for loan losses and other items. Our estimates and assumptions are based on historical experience, current events and other factors we believe to be reasonable under the circumstances. These estimates and assumptions are inherently subjective in nature and based on information that is available to us as of the date of this report. Actual results may differ from these estimates and assumptions and such differences may be material. Approximately $3.5 million of the third quarter’s provision for loan losses and 65 basis points of the Provision Rate related to anticipated losses from Hurricanes Harvey and Irma. There can be no assurance that additional hurricane related provision for loan losses will not be required or that our business and results of operations and financial condition will not be materially adversely impacted by the continuing impact of the hurricanes.
|
| |
| Item 2. | Unregistered Sales of Equity Securities and Use of Proceeds |
None.
|
| |
| Item 3. | Defaults Upon Senior Securities |
None.
|
| |
| Item 4. | Mine Safety Disclosures |
Not applicable.None.
None.
The documents listed in the Exhibit Index of this report are incorporated by reference or are filed with this Quarterly Report on Form 10-Q, in each case as indicated therein (numbered in accordance with Item 601 of Regulation S-K).
|
| | | | | | | | |
Exhibit Number | | Description | | Filed / Incorporated by Reference from Form * | | Incorporated by Reference from Exhibit Number | | Date Filed |
| | | | 8-K | | 3.1 | | 12/22/2014 |
| | | | 8-K | | 3.1 | | 8/3/2016 |
| | | | S-1 | | 4.1 | | 11/10/2014 |
| | | | S-1 | | 4.6 | | 11/10/2014 |
| | | | Filed herewith. | | | | |
| | | | Filed herewith. | | | | |
| | | | Filed herewith. | | | | |
| | | | Filed herewith. | | | | |
| | | | Filed herewith. | | | | |
| | | | Filed herewith. | | | | |
| | | | Filed herewith.
| | | | |
| 101.INS | | XBRL Instance Document | | Filed herewith. | | | | |
| 101.SCH | | XBRL Taxonomy Extension Schema Document | | Filed herewith. | | | | |
| 101.CAL | | XBRL Taxonomy Extension Calculation Linkbase Document | | Filed herewith. | | | | |
| 101.DEF | | XBRL Taxonomy Extension Definition Linkbase Document | | Filed herewith. | | | | |
101.LAB
| | XBRL Taxonomy Extension Labels Linkbase Document | | Filed herewith. | | | | |
| 101.PRE | | XBRL Taxonomy Extension Presentation Linkbase Document | | Filed herewith. | | | | |
|
| |
| * | All exhibits incorporated by reference to the Registrant's Form S-1 or S-1/A registration statements relate to Registration No. 333-200043 |
SIGNATURES
Pursuant to the requirements of Section 13 or 15(d) of the Securities Exchange Act of 1934, the registrant has duly caused this report to be signed on its behalf by the undersigned, thereunto duly authorized.
|
| |
| | On Deck Capital, Inc. |
| | |
| | /s/ Howard Katzenberg Kenneth A. Brause |
| | Howard KatzenbergKenneth A. Brause
Chief Financial Officer (Principal Financial Officer) |
Date: NovemberAugust 7, 20172018 | |
|
| |
| | |
| | /s/ Nicholas Sinigaglia |
| | Nicholas Sinigaglia
Senior Vice PresidentChief Accounting Officer
(Principal Accounting Officer) |
Date: NovemberAugust 7, 20172018 | |
Exhibit Index
|
| | | | | | | | |
Exhibit Number | | Description | | Filed / Incorporated by Reference from Form * | | Incorporated by Reference from Exhibit Number | | Date Filed |
| | | | 8-K | | 3.1 | | 12/22/2014 |
| | | | 8-K | | 3.1 | | 8/3/2016 |
| | | | S-1 | | 4.1 | | 11/10/2014 |
| | | | S-1 | | 4.2 | | 11/10/2014 |
| | | | S-1 | | 4.6 | | 11/10/2014 |
| | | | Filed herewith. | | | | |
| | | | Filed herewith. | | | | |
| | | | Filed herewith. | | | | |
| | | | Filed herewith. | | | | |
| | | | Filed herewith.
| | | | |
| | | | Filed herewith.
| | | | |
| 101.INS | | XBRL Instance Document | | Filed herewith. | | | | |
| 101.SCH | | XBRL Taxonomy Extension Schema Document | | Filed herewith. | | | | |
| 101.CAL | | XBRL Taxonomy Extension Calculation Linkbase Document | | Filed herewith. | | | | |
| 101.DEF | | XBRL Taxonomy Extension Definition Linkbase Document | | Filed herewith. | | | | |
101.LAB
| | XBRL Taxonomy Extension Labels Linkbase Document | | Filed herewith. | | | | |
| 101.PRE | | XBRL Taxonomy Extension Presentation Linkbase Document | | Filed herewith. | | | | |
|
| |
* | All exhibits incorporated by reference to the Registrant's Form S-1 registration statement relate to Registration No. 333-200043 |