UNITED STATES
SECURITIES AND EXCHANGE COMMISSION
Washington, D.C. 20549
FORM 10-Q
(MARK ONE)
|
| |
| ý | QUARTERLY REPORT PURSUANT TO SECTION 13 OR 15(d) OF THE SECURITIES EXCHANGE ACT OF 1934 |
FOR THE QUARTERLY PERIOD ENDED SEPTEMBERJUNE 30, 20182019
OR
|
| |
¨
| TRANSITION REPORT PURSUANT TO SECTION 13 OR 15(d) OF THE SECURITIES EXCHANGE ACT OF 1934 |
FOR THE TRANSITION PERIOD FROM TO
Commission File Number 001-36779
On Deck Capital, Inc.
(Exact name of registrant as specified in its charter)
|
| | |
| Delaware | | 42-1709682 |
(State or other jurisdiction of incorporation or organization) | | (I.R.S. Employer Identification No.) |
| | |
1400 Broadway, 25th Floor, New York, New York | | 10018 |
|
1400 Broadway, 25th Floor
New York, New York 10018
(Address of principal executive offices)
| (Zip Code) |
(888) 269-4246
(Registrant’s telephone number, including area code)
Securities registered pursuant to Section 12(b) of the Act:
|
| | |
| Title of each class | Trading Symbol(s) | Name of each exchange on which registered |
| Common Stock, par value $0.005 per share | ONDK | New York Stock Exchange |
Indicate by check mark whether the registrant (1) has filed all reports required to be filed by Section 13 or 15(d) of the Securities Exchange Act of 1934 during the preceding 12 months (or for such shorter period that the registrant was required to file such reports), and (2) has been subject to such filing requirements for the past 90 days. YES ý NO ¨
Indicate by check mark whether the registrant has submitted electronically every Interactive Data file required to be submitted pursuant to Rule 405 of Regulation S-T (§232.405 of this chapter) during the preceding 12 months (or for such shorter period that the registrant was required to submit such files). YES ý NO ¨
Indicate by check mark whether the registrant is a large accelerated filer, an accelerated filer, a non-accelerated filer, a smaller reporting company, or an emerging growth company. See the definitions of “large accelerated filer,” “accelerated filer,” “smaller reporting company,” and "emerging growth company" in Rule 12b-2 of the Exchange Act.:
|
| | | | | | |
| Large accelerated filer | | ¨
| | Accelerated filer | | x |
| Non-accelerated filer | | ¨
| | Smaller reporting company | | ¨
|
| | | | | Emerging growth company | | x |
| | | | | If an emerging growth company, indicate by check mark if the registrant has elected not to use the extended transition period for complying with any new or revised financial accounting standards provided pursuant to Section 13(a) of the Exchange Act. | | x |
Indicate by check mark whether the registrant is a shell company (as defined in Rule 12b-2 of the Exchange Act.
Act). YES ¨NO xý
The number of shares of the registrant’s common stock outstanding as of OctoberJuly 31, 20182019 was 75,046,285.76,301,387.
On Deck Capital, Inc.
Table of Contents
|
| | |
| | | Page |
PART I - FINANCIAL INFORMATION |
| | |
| Item 1. | Financial Statements (Unaudited) | |
| | Unaudited Condensed Consolidated Balance Sheets | |
| | Unaudited Condensed Consolidated Statements of Operations and Comprehensive Income | |
| | Unaudited Condensed Consolidated Statements of Changes in Equity and Redeemable Noncontrolling Interest | |
| Unaudited Condensed Consolidated Statements of Cash Flows | |
| | Notes to Unaudited Condensed Consolidated Financial Statements | |
| Item 2. | Management’s Discussion and Analysis of Financial Condition and Results of Operations | |
| Item 3. | Quantitative and Qualitative Disclosures About Market Risk | |
| Item 4. | Controls and Procedures | |
| | | |
| PART II - OTHER INFORMATION |
| | |
| Item 1. | Legal Proceedings | |
Item 1A.1A | Risk Factors | |
| Item 2. | Unregistered Sales of Equity Securities and Use of Proceeds | |
| Item 3. | Defaults Upon Senior Securities | |
| Item 4. | Mine Safety Disclosures | |
| Item 5. | Other Information | |
Item 66. | Exhibits | |
| | | |
| | Signatures | |
| | |
| | |
| | |
| | |
| | |
| | |
| | |
| | |
| | |
| | |
| | |
| | |
PART I - FINANCIAL INFORMATION
Item 1. Financial Statements (Unaudited)
ON DECK CAPITAL, INC. AND SUBSIDIARIES
Unaudited Condensed Consolidated Balance Sheets
(in thousands, except share and per share data)
| | | | September 30, | | December 31, | June 30, | | December 31, |
| | 2018 | | 2017 | 2019 | | 2018 |
| Assets | | | | | | |
| Cash and cash equivalents | $ | 71,304 |
| | $ | 71,362 |
| $ | 58,744 |
| | $ | 59,859 |
|
| Restricted cash | 48,919 |
| | 43,462 |
| 43,336 |
| | 37,779 |
|
| Loans held for investment | 1,117,828 |
| | 952,796 |
| |
| Less: Allowance for loan losses | (133,644 | ) | | (109,015 | ) | |
| Loans held for investment, net | 984,184 |
| | 843,781 |
| |
| Loans and finance receivables | | 1,207,609 |
| | 1,169,407 |
|
| Less: Allowance for credit losses | | (145,739 | ) | | (140,040 | ) |
| Loans and finance receivables held for investment, net | | 1,061,870 |
| | 1,029,367 |
|
| Property, equipment and software, net | 16,286 |
| | 23,572 |
| 17,088 |
| | 16,700 |
|
| Other assets | 19,240 |
| | 13,867 |
| 67,169 |
| | 18,115 |
|
| Total assets | $ | 1,139,933 |
| | $ | 996,044 |
| $ | 1,248,207 |
| | $ | 1,161,820 |
|
| Liabilities and equity | | | | |
| Liabilities, mezzanine equity and stockholders' equity | | | | |
| Liabilities: | | | | | | |
| Accounts payable | $ | 5,651 |
| | $ | 2,674 |
| $ | 5,819 |
| | $ | 4,011 |
|
| Interest payable | 2,132 |
| | 2,330 |
| 2,687 |
| | 2,385 |
|
| Funding debt | 812,428 |
| | 684,269 |
| |
| Corporate debt | — |
| | 7,985 |
| |
| Debt | | 841,602 |
| | 816,231 |
|
| Accrued expenses and other liabilities | 29,500 |
| | 32,730 |
| 65,135 |
| | 36,708 |
|
| Total liabilities | 849,711 |
| | 729,988 |
| 915,243 |
| | 859,335 |
|
| Commitments and contingencies (Note 9) |
| |
| |
| Stockholders’ equity (deficit): | | | | |
| Common stock—$0.005 par value, 1,000,000,000 shares authorized and 78,631,018 and 77,284,266 shares issued and 75,029,010 and 73,822,001 outstanding at September 30, 2018 and December 31, 2017, respectively. | 393 |
| | 386 |
| |
| Commitments and contingencies (Note 12) | |
| |
|
| Mezzanine equity: | | | | |
| Redeemable noncontrolling interest | | 15,122 |
| | — |
|
| Stockholders’ equity: | | | | |
| Common stock—$0.005 par value, 1,000,000,000 shares authorized and 79,338,337 and 78,412,291 shares issued and 76,301,387 and 75,375,341 outstanding at June 30, 2019 and December 31 2018, respectively. | | 401 |
| | 396 |
|
| Treasury stock—at cost | (8,766 | ) | | (7,965 | ) | (5,656 | ) | | (5,656 | ) |
| Additional paid-in capital | 503,049 |
| | 492,509 |
| 508,630 |
| | 502,003 |
|
| Accumulated deficit | (209,191 | ) | | (222,833 | ) | (186,997 | ) | | (196,959 | ) |
| Accumulated other comprehensive loss | (503 | ) | | (52 | ) | (1,894 | ) | | (1,832 | ) |
| Total On Deck Capital, Inc. stockholders' equity | 284,982 |
| | 262,045 |
| 314,484 |
| | 297,952 |
|
| Noncontrolling interest | 5,240 |
| | 4,011 |
| 3,358 |
| | 4,533 |
|
| Total equity | 290,222 |
| | 266,056 |
| |
| Total liabilities and equity | $ | 1,139,933 |
| | $ | 996,044 |
| |
| Total stockholders' equity | | 317,842 |
| | 302,485 |
|
| Total liabilities, mezzanine equity and stockholders' equity | | $ | 1,248,207 |
| | $ | 1,161,820 |
|
| | | | | |
The accompanying notes are an integral part of these condensed consolidated financial statements.
ON DECK CAPITAL, INC. AND SUBSIDIARIES
Unaudited Condensed Consolidated Statements of Operations and Comprehensive Income
(in thousands, except share and per share data)
| | | | Three Months Ended September 30, | | Nine Months Ended September 30, | Three Months Ended June 30, | | Six Months Ended June 30, |
| | 2018 | | 2017 | | 2018 | | 2017 | 2019 | | 2018 | | 2019 | | 2018 |
| Revenue: | | | | | | | | | | | | | | |
| Interest income | $ | 99,476 |
| | $ | 80,122 |
| | $ | 278,216 |
| | $ | 250,954 |
| |
| Gain on sales of loans | — |
| | 146 |
| | — |
| | 1,890 |
| |
| Interest and finance income | | $ | 105,641 |
| | $ | 92,209 |
| | $ | 211,440 |
| | $ | 178,438 |
|
| Other revenue | 3,523 |
| | 3,398 |
| | 10,681 |
| | 10,365 |
| 4,605 |
| | 3,247 |
| | 8,781 |
| | 7,158 |
|
| Gross revenue | 102,999 |
| | 83,666 |
| | 288,897 |
| | 263,209 |
| 110,246 |
| | 95,456 |
|
| 220,221 |
| | 185,596 |
|
| Cost of revenue: | | | | | | | | | | | | | | |
| Provision for loan losses | 39,102 |
| | 39,582 |
| | 108,688 |
| | 118,495 |
| |
| Funding costs | 11,665 |
| | 11,330 |
| | 35,688 |
| | 34,223 |
| |
| Provision for credit losses | | 42,951 |
| | 33,293 |
| | 86,242 |
| | 69,586 |
|
| Interest expense | | 11,381 |
| | 12,245 |
| | 22,713 |
| | 24,117 |
|
| Total cost of revenue | 50,767 |
| | 50,912 |
| | 144,376 |
| | 152,718 |
| 54,332 |
| | 45,538 |
|
| 108,955 |
| | 93,703 |
|
| Net revenue | 52,232 |
| | 32,754 |
| | 144,521 |
| | 110,491 |
| 55,914 |
| | 49,918 |
|
| 111,266 |
| | 91,893 |
|
| Operating expense: | | | | | | | | | | | | | | |
| Sales and marketing | 10,845 |
| | 11,903 |
| | 32,875 |
| | 42,090 |
| 13,307 |
| | 11,432 |
| | 25,267 |
| | 22,030 |
|
| Technology and analytics | 13,418 |
| | 11,748 |
| | 37,224 |
| | 41,960 |
| 16,681 |
| | 12,799 |
| | 33,487 |
| | 23,806 |
|
| Processing and servicing | 5,302 |
| | 4,160 |
| | 15,564 |
| | 13,521 |
| 5,609 |
| | 5,041 |
| | 11,098 |
| | 10,262 |
|
| General and administrative | 13,107 |
| | 9,440 |
| | 46,866 |
| | 30,917 |
| 16,353 |
| | 16,034 |
| | 30,382 |
| | 33,759 |
|
| Total operating expense | 42,672 |
| | 37,251 |
| | 132,529 |
| | 128,488 |
| 51,950 |
| | 45,306 |
|
| 100,234 |
| | 89,857 |
|
| Income (loss) from operations | 9,560 |
| | (4,497 | ) | | 11,992 |
| | (17,997 | ) | |
| Other expense: | | | | | | | | |
| Interest expense | 63 |
| | 35 |
| | 157 |
| | 706 |
| |
| Total other expense | 63 |
| | 35 |
| | 157 |
| | 706 |
| |
| Income (loss) before provision for income taxes | 9,497 |
| | (4,532 | ) | | 11,835 |
| | (18,703 | ) | |
| Income (loss) from operations, before provision for income taxes | | 3,964 |
| | 4,612 |
| | 11,032 |
| | 2,036 |
|
| Provision for income taxes | — |
| | — |
| | — |
| | — |
| 1,796 |
| | — |
| | 3,536 |
| | — |
|
| Net income (loss) | 9,497 |
| | (4,532 | ) | | 11,835 |
| | (18,703 | ) | 2,168 |
| | 4,612 |
|
| 7,496 |
| | 2,036 |
|
| Less: Net income (loss) attributable to noncontrolling interest | (272 | ) | | (458 | ) | | (1,807 | ) | | (2,073 | ) | (2,127 | ) | | (1,016 | ) | | (2,465 | ) | | (1,535 | ) |
| Net income (loss) attributable to On Deck Capital, Inc. common stockholders | $ | 9,769 |
|
| $ | (4,074 | ) | | $ | 13,642 |
| | $ | (16,630 | ) | $ | 4,295 |
|
| $ | 5,628 |
|
| $ | 9,961 |
| | $ | 3,571 |
|
| Net income (loss) per share attributable to On Deck Capital, Inc. common stockholders: | | | | | | | | | | | | | | |
| Basic | $ | 0.13 |
| | $ | (0.06 | ) | | $ | 0.18 |
| | $ | (0.23 | ) | $ | 0.06 |
| | $ | 0.08 |
| | $ | 0.13 |
| | $ | 0.05 |
|
| Diluted | $ | 0.12 |
| | $ | (0.06 | ) | | $ | 0.17 |
| | $ | (0.23 | ) | $ | 0.05 |
| | $ | 0.07 |
| | $ | 0.13 |
| | $ | 0.05 |
|
| Weighted-average common shares outstanding: | | | | | | | | | | | | | | |
| Basic | 74,715,592 |
| | 73,272,085 |
| | 74,362,211 |
| | 72,613,221 |
| 76,137,751 |
| | 74,385,446 |
| | 75,840,604 |
| | 74,182,929 |
|
| Diluted | 79,372,491 |
| | 73,272,085 |
| | 78,314,719 |
| | 72,613,221 |
| 78,901,601 |
| | 78,288,267 |
| | 79,013,757 |
| | 77,786,748 |
|
| Comprehensive income (loss): | | | | | | | | | | | | | | |
| Net income (loss) | $ | 9,497 |
| | $ | (4,532 | ) | | $ | 11,835 |
| | $ | (18,703 | ) | $ | 2,168 |
| | $ | 4,612 |
| | $ | 7,496 |
| | $ | 2,036 |
|
| Other comprehensive income (loss): | | | | | | | |
|
| |
|
| | | | |
| Unrealized (loss) on derivative instrument | | (124 | ) | | — |
| | (866 | ) | | — |
|
| Foreign currency translation adjustment | (306 | ) | | 246 |
| | (815 | ) | | 682 |
| 405 |
| | (395 | ) | | 771 |
| | (508 | ) |
| Comprehensive income (loss) | 9,191 |
| | (4,286 | ) | | 11,020 |
| | (18,021 | ) | 2,449 |
| | 4,217 |
| | 7,401 |
| | 1,528 |
|
| Less: Comprehensive income (loss) attributable to noncontrolling interests | (138 | ) | | 111 |
| | (367 | ) | | 307 |
| (58 | ) | | (179 | ) | | (32 | ) | | (229 | ) |
| Less: Net income (loss) attributable to noncontrolling interest | (272 | ) | | (458 | ) | | (1,807 | ) | | (2,073 | ) | (2,127 | ) | | (1,016 | ) | | (2,465 | ) | | (1,535 | ) |
| Comprehensive income (loss) attributable to On Deck Capital, Inc. common stockholders | $ | 9,601 |
| | $ | (3,939 | ) | | $ | 13,194 |
| | $ | (16,255 | ) | $ | 4,634 |
| | $ | 5,412 |
| | $ | 9,898 |
| | $ | 3,292 |
|
The accompanying notes are an integral part of these condensed consolidated financial statements.
ON DECK CAPITAL, INC. AND SUBSIDIARIES
Unaudited Condensed Consolidated Statements of Changes in Equity and Redeemable Noncontrolling Interest
(in thousands, except share data)
|
| | | | | | | | | | | | | | | | | | | | | | | | | | | | | | | | | | | | | | | |
| | On Deck Capital, Inc.'s stockholders' equity | | | | | | | | | | | |
| | Common Stock | | Additional Paid-in Capital | | Accumulated Deficit | | Treasury Stock | | Accumulated Other Comprehensive Income (Loss) | | Total Stockholders' Equity | | Noncontrolling interest | | Total Equity | | | Redeemable Noncontrolling Interest |
| | Shares | | Amount | | | |
| Balance at December 31, 2017 | 73,822,001 |
| | $ | 386 |
| | $ | 490,200 |
| | $ | (224,047 | ) | | $ | (5,656 | ) | | $ | (52 | ) | | $ | 260,831 |
| | $ | 4,011 |
| | $ | 264,842 |
| | | $ | — |
|
| Stock-based compensation | — |
| | — |
| | 3,122 |
| | — |
| | — |
| | — |
| | 3,122 |
| | — |
| | 3,122 |
| | | — |
|
| Issuance of common stock through vesting of restricted stock units and option exercises | 246,130 |
| | 2 |
| | 39 |
| | — |
| | — |
| | — |
| | 41 |
| | — |
| | 41 |
| | | — |
|
| Employee stock purchase plan | 196,360 |
| | 1 |
| | 918 |
| | — |
| | — |
| | — |
| | 919 |
| | — |
| | 919 |
| | | — |
|
| Tax withholding related to vesting of restricted stock units | — |
| | — |
| | (118 | ) | | — |
| | — |
| | — |
| | (118 | ) | | — |
| | (118 | ) | | | — |
|
| Currency translation adjustment | — |
| | — |
| | — |
| | — |
| | — |
| | (63 | ) | | (63 | ) | | (50 | ) | | (113 | ) | | | — |
|
| Net Income (loss) | — |
| | — |
| | — |
| | (2,058 | ) | | — |
| | — |
| | (2,058 | ) | | (518 | ) | | (2,576 | ) | | | — |
|
| Other | — |
| | — |
| | — |
| | (1 | ) | | — |
| | (3 | ) | | (4 | ) | | — |
| | (4 | ) | | | — |
|
| Balance-March 31, 2018 | 74,264,491 |
| | $ | 389 |
| | $ | 494,161 |
| | $ | (226,106 | ) | | $ | (5,656 | ) | | $ | (118 | ) | | $ | 262,670 |
| | $ | 3,443 |
| | $ | 266,113 |
| | | $ | — |
|
| Stock-based compensation | — |
| | — |
| | 2,712 |
| | — |
| | — |
| | — |
| | $ | 2,712 |
| | — |
| | $ | 2,712 |
| | | — |
|
| Issuance of common stock through vesting of restricted stock units and option exercises | 376,513 |
| | 2 |
| | (2 | ) | | — |
| | — |
| | — |
| | — |
| | — |
| | — |
| | | — |
|
| Employee stock purchase plan | — |
| | — |
| | 49 |
| | — |
| | — |
| | — |
| | 49 |
| | — |
| | 49 |
| | | — |
|
| Tax withholding related to vesting of restricted stock units | — |
| | — |
| | (323 | ) | | — |
| | — |
| | — |
| | (323 | ) | | — |
| | (323 | ) | | | — |
|
| Investment by noncontrolling interests | — |
| | — |
| | — |
| | — |
| | — |
| | — |
| | — |
| | 3,402 |
| | 3,402 |
| | | — |
|
| Currency translation adjustment | — |
| | — |
| | — |
| | — |
| | — |
| | (216 | ) | | (216 | ) | | (179 | ) | | (395 | ) | | | — |
|
| Net Income (loss) | — |
| | — |
| | — |
| | 5,628 |
| | — |
| | — |
| | 5,628 |
| | (1,016 | ) | | 4,612 |
| | | — |
|
| Balance-June 30, 2018 | 74,641,004 |
| | $ | 391 |
| | $ | 496,597 |
| | $ | (220,478 | ) | | $ | (5,656 | ) | | $ | (334 | ) | | $ | 270,520 |
| | $ | 5,650 |
| | $ | 276,170 |
| | | $ | — |
|
| | | | | | | | | | | | | | | | | | | | | |
| | | | | | | | | | | | | | | | | | | | | |
| | | | | | | | | | | | | | | | | | | | | |
| | | | | | | | | | | | | | | | | | | | | |
| | | | | | | | | | | | | | | | | | | | | |
| | | | | | | | | | | | | | | | | | | | | |
| | | | | | | | | | | | | | | | | | | | | |
| | | | | | | | | | | | | | | | | | | | | |
| | | | | | | | | | | | | | | | | | | | | |
| | | | | | | | | | | | | | | | | | | | | |
| | | | | | | | | | | | | | | | | | | | | |
| | | | | | | | | | | | | | | | | | | | | |
| | | | | | | | | | | | | | | | | | | | | |
|
| | | | | | | | | | | | | | | | | | | | | | | | | | | | | | | | | | | | | | | |
| | On Deck Capital, Inc.'s stockholders' equity | | | | | | | | | | | |
| | Common Stock | | Additional Paid-in Capital | | Accumulated Deficit | | Treasury Stock | | Accumulated Other Comprehensive Income (Loss) | | Total Stockholders' Equity | | Noncontrolling interest | | Total Equity | | | Redeemable Noncontrolling Interest |
| | Shares | | Amount | | | |
| | | | | | | | | | | | | | | | | | | | | |
| Balance at December 31, 2018 | 75,375,341 |
| | $ | 396 |
|
| $ | 502,003 |
|
| $ | (196,959 | ) |
| $ | (5,656 | ) |
| $ | (1,832 | ) |
| $ | 297,952 |
|
| $ | 4,533 |
| | $ | 302,485 |
| | | $ | — |
|
| Stock-based compensation | — |
| | — |
| | 2,743 |
| | — |
| | — |
| | — |
| | 2,743 |
| | — |
| | 2,743 |
| | | — |
|
| Issuance of common stock through vesting of restricted stock units and option exercises | 264,364 |
| | 2 |
| | 45 |
| | — |
| | — |
| | — |
| | 47 |
| | — |
| | 47 |
| | | — |
|
| Employee stock purchase plan | 267,688 |
| | 1 |
| | 1,659 |
| | — |
| | — |
| | — |
| | 1,660 |
| | — |
| | 1,660 |
| | | — |
|
| Tax withholding related to vesting of restricted stock units | — |
| | — |
| | (291 | ) | | — |
| | — |
| | — |
| | (291 | ) | | — |
| | (291 | ) | | | — |
|
| Currency translation adjustment | — |
| | — |
| | — |
| | — |
| | — |
| | 340 |
| | 340 |
| | 26 |
| | 366 |
| | | — |
|
| Cash flow hedge | — |
| | — |
| | — |
| | — |
| | — |
| | (742 | ) | | (742 | ) | | — |
| | (742 | ) | | | — |
|
| Net Income (loss) | — |
| | — |
| | — |
| | 5,666 |
| | — |
| | — |
| | 5,666 |
| | (338 | ) | | 5,328 |
| | | — |
|
| Balance-March 31, 2019 | 75,907,393 |
|
| $ | 399 |
|
| $ | 506,159 |
|
| $ | (191,293 | ) |
| $ | (5,656 | ) |
| $ | (2,234 | ) |
| $ | 307,375 |
|
| $ | 4,221 |
|
| $ | 311,596 |
| | | $ | — |
|
| Stock-based compensation | — |
| | — |
| | 2,965 |
| | — |
| | — |
| | — |
| | $ | 2,965 |
| | $ | — |
| | $ | 2,965 |
| | | — |
|
| Issuance of common stock through vesting of restricted stock units and option exercises | 393,994 |
| | 2 |
| | 26 |
| | — |
| | — |
| | — |
| | 28 |
| | — |
| | 28 |
| | | — |
|
| Employee stock purchase plan | — |
| | — |
| | 335 |
| | — |
| | — |
| | — |
| | 335 |
| | — |
| | 335 |
| | | — |
|
| Tax withholding related to vesting of restricted stock units | — |
| | — |
| | (844 | ) | | — |
| | — |
| | — |
| | (844 | ) | | — |
| | (844 | ) | | | — |
|
| Fair value of redeemable noncontrolling interest resulting from business combination | — |
| | — |
| | — |
| | — |
| | — |
| | — |
| | — |
| | — |
| | — |
| | | 16,444 |
|
| Currency translation adjustment | — |
| | — |
| | — |
| | — |
| | — |
| | 463 |
| | 463 |
| | (49 | ) | | 414 |
| | | (9 | ) |
| Cash flow hedge | — |
| | — |
| | — |
| | — |
| | — |
| | (124 | ) | | (124 | ) | | — |
| | (124 | ) | | | — |
|
| Other | — |
| | — |
|
| (11 | ) | | 1 |
| | — |
| | 1 |
| | (9 | ) | | — |
| | (9 | ) | | | — |
|
| Net Income (loss) | — |
| | — |
| | — |
| | 4,295 |
| | — |
| | — |
| | 4,295 |
| | (814 | ) | | 3,481 |
| | | (1,313 | ) |
| Balance-June 30, 2019 | 76,301,387 |
| | $ | 401 |
| | $ | 508,630 |
| | $ | (186,997 | ) | | $ | (5,656 | ) | | $ | (1,894 | ) | | $ | 314,484 |
| | $ | 3,358 |
| | $ | 317,842 |
| | | $ | 15,122 |
|
| | | | | | | | | | | | | | | | | | | | | |
The accompanying notes are an integral part of these condensed consolidated financial statements.
ON DECK CAPITAL, INC. AND SUBSIDIARIES
Unaudited Condensed Consolidated Statements of Cash Flows
(in thousands)
| | | | Nine Months Ended
September 30, | Six Months Ended June 30, |
| | 2018 | | 2017 | 2019 | | 2018 |
| Cash flows from operating activities | | | | | | |
| Net income (loss) | $ | 11,835 |
| | $ | (18,703 | ) | $ | 7,496 |
| | $ | 2,036 |
|
| Adjustments to reconcile net loss to net cash provided by operating activities: |
| | | |
| Provision for loan losses | 108,688 |
| | 118,495 |
| |
| Adjustments to reconcile net income (loss) to net cash provided by operating activities: | |
| |
|
| Provision for credit losses | | 86,242 |
| | 69,586 |
|
| Depreciation and amortization | 6,232 |
| | 7,623 |
| 3,574 |
| | 4,218 |
|
| Amortization of debt issuance costs | 5,575 |
| | 2,777 |
| 1,573 |
| | 3,756 |
|
| Stock-based compensation | 8,852 |
| | 9,521 |
| 6,331 |
| | 6,004 |
|
| Amortization of net deferred origination costs | 41,180 |
| | 36,419 |
| 35,277 |
| | 26,499 |
|
| Changes in servicing rights, at fair value | 223 |
| | 1,440 |
| 69 |
| | 188 |
|
| Gain on sales of loans | — |
| | (1,890 | ) | |
| Unfunded loan commitment reserve | 829 |
| | 227 |
| 452 |
| | 640 |
|
| Gain on extinguishment of debt | — |
| | (312 | ) | |
| Gain on lease termination | | — |
| | (1,481 | ) |
| Loss on disposal of fixed assets | 5,667 |
| | — |
| 1,537 |
| | 5,668 |
|
| Gain on lease termination | (1,481 | ) | | — |
| |
| Amortization of intangibles | | 189 |
| | — |
|
| Changes in operating assets and liabilities: |
| |
|
| |
|
| Other assets | (7,064 | ) | | 2,106 |
| (9,595 | ) | | (1,999 | ) |
| Accounts payable | 2,977 |
| | (2,353 | ) | 1,499 |
| | 1,413 |
|
| Interest payable | (198 | ) | | 91 |
| 302 |
| | 244 |
|
| Accrued expenses and other liabilities | (1,128 | ) | | (7,641 | ) | 1,613 |
| | 1,992 |
|
| Originations of loans held for sale | — |
| | (44,489 | ) | |
| Capitalized net deferred origination costs of loans held for sale | — |
| | (1,128 | ) | |
| Proceeds from sale of loans held for sale | — |
| | 45,921 |
| |
| Principal repayments of loans held for sale | — |
| | 1,039 |
| |
| Net cash provided by operating activities | 182,187 |
|
| 149,143 |
| 136,559 |
|
| 118,764 |
|
| Cash flows from investing activities | | | | | | |
| Purchases of property, equipment and software | (677 | ) | | (1,129 | ) | (1,360 | ) | | (695 | ) |
| Capitalized internal-use software | (3,738 | ) | | (2,226 | ) | (4,220 | ) | | (2,464 | ) |
| Originations of term loans and lines of credit, excluding rollovers into new originations | (1,566,889 | ) | | (1,302,889 | ) | |
| Proceeds from sale of loans held for investment | — |
| | 12,396 |
| |
| Originations of term loan, lines of credit and finance receivable, excluding rollovers into new originations | | (1,029,348 | ) | | (1,009,626 | ) |
| Payments of net deferred origination costs | (46,659 | ) | | (32,747 | ) | (33,505 | ) | | (29,958 | ) |
| Principal repayments of term loans and lines of credit | 1,324,078 |
| | 1,220,673 |
| |
| Principal repayments of term loans, lines of credit and finance receivables | | 946,025 |
| | 865,537 |
|
| Purchase of loans | (801 | ) | | (13,730 | ) | — |
| | (801 | ) |
| Acquisition of shares in business combination | | (3,004 | ) | | $ | — |
|
| Net cash used in investing activities | (294,686 | ) |
| (119,652 | ) | (125,412 | ) |
| (178,007 | ) |
| Cash flows from financing activities | | | | | | |
| Investments by noncontrolling interests | 3,403 |
| | 3,443 |
| — |
| | 3,403 |
|
| Purchase of treasury shares | (801 | ) | | (864 | ) | |
| Tax withholding related to vesting of restricted stock units | | (1,135 | ) | | (441 | ) |
| Proceeds from exercise of stock options and warrants | 76 |
| | 490 |
| 71 |
| | 39 |
|
| Issuance of common stock under employee stock purchase plan | 1,435 |
| | 1,838 |
| 1,281 |
| | 668 |
|
| Proceeds from the issuance of funding debt | 672,522 |
| | 133,318 |
| |
| Proceeds from the issuance of corporate debt | 25,000 |
| | 24,200 |
| |
| Proceeds from the issuance of debt | | 355,840 |
| | 407,184 |
|
| Payments of debt issuance costs | (5,460 | ) | | (3,228 | ) | (2,812 | ) | | (3,748 | ) |
| Repayments of debt principal | | (359,392 | ) | | (342,828 | ) |
| Net cash (used in) provided by financing activities | | (6,147 | ) |
| 64,277 |
|
| Effect of exchange rate changes on cash and cash equivalents | | (558 | ) | | (1,407 | ) |
| Net increase in cash, cash equivalents and restricted cash | | 4,442 |
| | 3,627 |
|
| Cash, cash equivalents, and restricted cash at beginning of year | | 97,638 |
| | 114,824 |
|
| Cash, cash equivalents, and restricted cash at end of period | | $ | 102,080 |
|
| $ | 118,451 |
|
| | | | Nine Months Ended
September 30, | Six Months Ended June 30, |
| | 2018 | | 2017 | |
| Repayments of funding debt principal | (544,586 | ) | | (156,477 | ) | |
| Repayments of corporate debt principal | (33,000 | ) | | (35,000 | ) | |
| Distribution to noncontrolling interest | — |
| | (1,000 | ) | |
| Net cash provided by (used in) financing activities | 118,589 |
|
| (33,280 | ) | |
| Effect of exchange rate changes on cash and cash equivalents | (691 | ) | | 824 |
| |
| Net increase (decrease) in cash, cash equivalents, and restricted cash | 5,399 |
| | (2,965 | ) | |
| Cash, cash equivalents, and restricted cash at beginning of year | 114,824 |
| | 123,986 |
| |
| Cash, cash equivalents, and restricted cash at end of period | $ | 120,223 |
|
| $ | 121,021 |
| |
| | | | | 2019 | | 2018 |
| Reconciliation to amounts on consolidated balance sheets | | | | | | |
| Cash and cash equivalents | $ | 71,304 |
| | $ | 64,292 |
| $ | 58,744 |
| | $ | 74,262 |
|
| Restricted cash | 48,919 |
| | 56,729 |
| 43,336 |
| | 44,189 |
|
| Total cash, cash equivalents and restricted cash | $ | 120,223 |
| | $ | 121,021 |
| $ | 102,080 |
| | $ | 118,451 |
|
| | | | | | | |
| Supplemental disclosure of other cash flow information | | | | | | |
| Cash paid for interest | $ | 32,329 |
| | $ | 31,467 |
| $ | 20,038 |
| | $ | 21,445 |
|
| Supplemental disclosures of non-cash investing and financing activities | | | | | | |
| Stock-based compensation included in capitalized internal-use software | $ | 180 |
| | $ | 154 |
| $ | 109 |
| | $ | 130 |
|
| Unpaid principal balance of term loans rolled into new originations | $ | 258,220 |
| | $ | 220,925 |
| $ | 198,319 |
| | $ | 167,687 |
|
The accompanying notes are an integral part of these condensed consolidated financial statements.
ON DECK CAPITAL, INC. AND SUBSIDIARIES
Notes to Unaudited Condensed Consolidated Financial Statements
1. Organization and Summary of Significant Accounting Policies
On Deck Capital, Inc.’s principal activity is providing financing to small businesses located throughout the United States as well as Canada and Australia, through term loans and lines of credit.credit, and additionally in Canada through merchant cash advances. We use technology and analytics to aggregate data about a business and then quickly and efficiently analyze the creditworthiness of the business using our proprietary credit-scoring model. We originate most of the loans in our portfolio and also purchase loans from an issuing bank partner. We subsequently transfer most of our loan volume into one of our wholly-owned subsidiaries for financing purposes.
In October 2018, we announced the launch of ODX, a wholly-owned subsidiary that helps banks digitize their small business lending process. ODX offers a combination of software, analytic insights, and alsoprofessional services that allow banks to bring their small business lending process online.
In April 2019, we combined our Canadian operations with Evolocity Financial Group, or Evolocity, to create a new holding company in which we own a 58.5% majority interest. We have accounted for this transaction as a business combination and have consolidated the optionfinancial position and results of operations of the holding company. The noncontrolling interest has been classified as mezzanine equity because it was deemed to sell them through OnDeck Marketplace®.be a redeemable noncontrolling interest. See Note 2 for further discussion.
Basis of Presentation and Principles of Consolidation
We prepare our condensed consolidated financial statements and footnotes in accordance with accounting principles generally accepted in the United States of America, or GAAP, as contained in the Financial Accounting Standards Board, or FASB, Accounting Standards Codification, or ASC. All intercompany transactions and accounts have been eliminated in consolidation. Certain reclassifications have been made to the prior year amounts to conform to the current year presentation. When used in these notes to condensed consolidated financial statements, the terms "we," "us," "our" or similar terms refersrefer to On Deck Capital, Inc. and its consolidated subsidiaries.
We consolidate the financial position and results of operations of these entities. The noncontrolling interest, which is presented as a separate component of our consolidated equity, represents the minority owners' proportionate share of the equity of the jointly owned entities. The noncontrolling interest is adjusted for the minority owners' share of the earnings, losses, investments and distributions.
Use of Estimates
The preparation of financial statements in conformity with GAAP requires us to make estimates and assumptions that affect the reported amounts in the condensed consolidated financial statements and accompanying notes. Significant estimates include allowance for loancredit losses, stock-based compensation expense, capitalized software development costs, interest rate cap, the useful lives of long-lived assets, servicing assets/liabilities, loans purchased,our effective income tax rate and valuation allowance for deferred tax assets. We base our estimates on historical experience, current events and other factors we believe to be reasonable under the circumstances. These estimates and assumptions are inherently subjective in nature; actual results may differ from these estimates and assumptions.
Recently Adopted Accounting Standards
In May 2014,August 2017, the FASB issued ASU 2014-09,2017-12, Revenue RecognitionDerivatives and Hedging: Targeted Improvements to Accounting for Hedging Activities, which creates ASC 606, Revenue from Contracts with Customers, and supersedes ASC 605, Revenue Recognition. ASU 2014-09 requires revenueimproves the financial reporting of hedging relationships to be recognizedbetter portray the economic results of an entity's risk management activities in an amount that reflects the consideration to which the entity expects to be entitled in exchange for goods or services and also requires additional disclosure about the nature, amount, timing, and uncertainty of revenue and cash flows from customer contracts. The FASB subsequently issued numerous amendments including ASU 2016-08 - Principal versus Agent Considerations, ASU 2016-10 - Identifying Performance Obligations and Licensing, and ASU 2016-12 - Narrow-Scope Improvements and Practical Expedients. Each amendment has the same effective date and transition requirements as the new revenue recognition standard. We adopted the new standard effective January 1, 2018 and applied the modified retrospective method of adoption. The adoption of ASC 606 did not have a material effect on our condensed consolidatedits financial statements and disclosures, nor did it resultmake certain targeted improvements to simplify the application of the hedge accounting guidance. The amendments in a cumulative effect adjustment atthis update better align an entity's risk management activities and financial reporting for hedging relationships through changes to both the date of initial application.
In November 2016, the FASB issued ASU 2016-18, Statement of Cash Flows (Topic 230): Restricted Cash. ASU 2016-18 intends to reduce diversity in practicedesignation and measurement guidance for the classificationqualifying hedging relationships and presentation of changeshedge results. The effective date for the standard is for fiscal years beginning after December 15, 2018. We elected to early adopt this ASU in restricted cash on the statementfiscal year 2018. See Note 10 for a discussion of cash flows. ASU 2016-18 clarifies that transfers between cash, cash equivalents, and amounts generally described as restricted cash or restricted cash equivalents are not part of the entity’s operating, investing, and financing activities, and details of those transfers should not be reported as cash flow activities in the statement of cash flows. It requires that a statement of cash flows explain the change during the period in the total of cash, cash equivalents, and amounts generally described as restricted cash or restricted cash equivalents. Therefore, amounts generally described as restricted cash and restricted cash equivalents should be included with cash and cash equivalents when reconciling the beginning-of-period and end-of-period total amounts shown on the statement of cash flows. We adopted the new standard effective January 1, 2018 using the retrospective transition method for each period presented and no longer present restricted cash as a reconciling item in our consolidated statement of cash flows. For the nine months ended September 30, 2017, cash flows from investing activities increased $12.3 million and the net decrease in cash and cash equivalents of $15.3 million became a net decrease in cash, cash equivalents and restricted cash of $3.0 million.derivatives.
Recent Accounting Pronouncements Not Yet Adopted
In February 2016, the FASB issued ASU 2016-02, Leases, which creates ASC 842, Leases, and supersedes ASC 840, Leases. ASU 2016-02 requires lessees to recognize a right-of-use asset and lease liability for all leases with terms of more than 12 months. The new standard will beis effective for annual reporting periods beginning after December 15, 2018, including interim periods within that reporting period. In July 2018, the FASB issued ASU No. 2018-11, Leases (Topic 842): Targeted Improvements. ImprovementsThis ASU provides a. We elected the prospective transition option provided by the ASU that would not require earlier periods to be restated upon adoption. We expect that most of our operating lease commitments will be recognized as operating lease liabilities and right-of-use assets upon adoption of the standard that will result in an offsetting increase in assets and liabilities on the Consolidated Balance Sheet. We do not expect the standard to impact our future results of operations or cash flows. The Company will adopt the standard in the first quarter of 2019 and apply the standard prospectively as of the adoption date. We expect to electelected the package of practical expedients afforded under the standard which permit an entity not to: (i) reassess whether existing or expired contracts are or contain a lease, (ii) reassess the lease classification, and (iii) reassess any initial direct costs for any existing leases. Our operating lease commitments, which were primarily real estate leases, were recognized as a $37.5 million lease liability when we adopted the new standard. The balance, which is included in Other Liabilities on the Consolidated Balance Sheet, is $36.5 million at June 30, 2019. We simultaneously recognized a $37.5 million right-of-use asset when we adopted the standard. Our right-of-use asset was partially offset by $10.1 million of existing deferred rent and lease incentives resulting in a net right-of-use asset of $27.6 million which is included in Other Assets on the Consolidated Balance Sheet. At June 30, 2019 the balance was $26.7 million. Our total operating lease cost for the three months ended June 30, 2019 was $1.5 million and allocated
within operating expenses. The weighted average remaining lease term was 6.8 years and we utilized a weighted average discount rate of approximately 7%.
Recent Accounting Pronouncements Not Yet Adopted
In June 2016, the FASB issued ASU 2016-13, Measurement of Credit Losses on Financial Instruments. ASU 2016-13 will change the impairment model and how entities measure credit losses for most financial assets. The standard requires entities to use the new expected credit loss impairment model which will replace the incurred loss model used today. The new guidance will be effective for annual reporting periods beginning after December 15, 2019. Early adoption is permitted, after December 15, 2018, however,although we anticipate adopting the standard on January 1, 2020.do not intend to do so. We are currently assessing the impact that the adoption of this guidance will have on our consolidated financial statements.
In January 2017, the FASB issued ASU 2017-04, Intangibles-Goodwill and Other: Simplifying the Test for Goodwill Impairment, which eliminates the requirement to determine the fair value of individual assets and liabilities of a reporting unit to measure goodwill impairment. Under the amendments in the new ASU, goodwill impairment testing will be performed by comparing the fair value of the reporting unit with its carrying amount and recognizing an impairment charge for the amount by which the carrying amount exceeds the reporting unit’s fair value. The new standard will become effective for annual reporting periods beginning after December 12, 2019. Early adoption is permitted, although we do not intend to do so. We are currently evaluating the impact the new standard may have on our disclosures, but we do not expect it to have a material impact.
In August 2018, the FASB issued ASU 2018-13, Fair Value Measurement (Topic 820): Disclosure Framework-Changes to the Disclosure Requirements for Fair Value Measurement, which modifies disclosure requirements for fair value measurements under ASC 820, Fair Value Measurement. The new guidance will be effective for annual reporting periods beginning after December 15, 2019. We are currently evaluating the impact the new standard may have on our disclosures, but we do not expect it to have a material impact.
Revision of Prior Period Financial Statements
During the second quarter of 2019, we identified an immaterial error in our historical financial statements relating to the accrual of commissions on a portion of our renewal loans. The aggregate amount of the under-accrual was $2.4 million, approximately 90% of which relates to 2015 and subsequent periods, and represents less than 1%, of our total stockholders’ equity at March 31, 2019. The amount of the error in each of the impacted annual and interim periods was less than 1% of total commissions paid for such period.
In accordance with the SEC’s SAB No. 99, “Materiality,” and SAB No. 108, “Considering the Effects of Prior Year Misstatements when Quantifying Misstatements in Current Year Financial Statements,” we evaluated the error and concluded that the impact was not material to our financial statements for any prior annual or interim period. Accordingly, we have revised our previously reported financial information to correct the immaterial error contained in our Quarterly Report on Form 10-Q for the three-months ended and six-months ended June 30, 2018. We will also revise previously reported financial information for this immaterial error in our future filings, as applicable.
A summary of revisions to certain previously reported financial information is presented in Note 11.
2. EarningsBusiness Combination
On April 1, 2019, we combined our Canadian operations with Evolocity Financial Group, or Evolocity, a Montreal-based online small business lender. The purpose of the transaction was to accelerate the growth of our Canadian operations and to enable us to provide a broader range of financing options to Canadian small businesses nationwide. In the transaction, Evolocity contributed its business to a holding company, and we contributed our Canadian business plus cash to that holding company such that we own a 58.5% majority interest in the holding company. The remainder is owned by former Evolocity stockholders. The Company has accounted for this transaction as a business combination.
The transaction has a preliminary purchase price for accounting purposes of approximately $16.7 million. Our provisional valuation of the assets acquired and liabilities assumed, including but not limited to loans, intangible assets and goodwill, is preliminary and the fair values are subject to change within the measurement period of up to one year from the business combination date. Goodwill arising from the business combination is not amortized, but is subject to impairment testing at least annually or more frequently if there is an indicator of impairment.
The following table summarizes the preliminary fair value of the assets acquired and liabilities assumed in connection with the business combination (in thousands):
|
| | | |
| | Fair Value |
| Loans and finance receivables | $ | 37,454 |
|
Intangibles and other assets (1) | 2,860 |
|
| Debt and other liabilities | (34,437 | ) |
Goodwill (1) | 10,844 |
|
| Net assets acquired | $ | 16,721 |
|
(1) Goodwill, and Intangibles and other assets were included in Other Assets on the Consolidated Balance Sheet as of June 30, 2019.
We consolidate the financial position and results of operations of the holding company.
As part of this business combination, the noncontrolling interest was deemed to be a redeemable noncontrolling interest. These interests are classified as mezzanine equity and measured at the greater of fair value at the end of each reporting period or the historical cost basis of the noncontrolling interest adjusted for cumulative earnings allocations.
3. Net Income (Loss) Per Common Share
Basic and diluted net income (loss) per common share is calculated as follows (in thousands, except share and per share data):
| | | | Three Months Ended September 30, | | Nine Months Ended September 30, | Three Months Ended June 30, | Six Months Ended June 30, |
| | 2018 | | 2017 | | 2018 | | 2017 | 2019 | | 2018 | | 2019 | | 2018 |
| Numerator: | | | | | | | | | | | | | | |
| Net Income (loss) | $ | 9,497 |
| | $ | (4,532 | ) | | $ | 11,835 |
| | $ | (18,703 | ) | $ | 2,168 |
| | $ | 4,612 |
| | $ | 7,496 |
| | $ | 2,036 |
|
| Less: Net income (loss) attributable to noncontrolling interest | (272 | ) | | (458 | ) | | (1,807 | ) | | (2,073 | ) | (2,127 | ) | | (1,016 | ) | | (2,465 | ) | | (1,535 | ) |
| Net income (loss) attributable to On Deck Capital, Inc. common stockholders | $ | 9,769 |
| | $ | (4,074 | ) | | $ | 13,642 |
| | $ | (16,630 | ) | $ | 4,295 |
| | $ | 5,628 |
| | $ | 9,961 |
| | $ | 3,571 |
|
| Denominator: | | | | | | | | | | | | | | |
| Weighted-average common shares outstanding, basic | 74,715,592 |
| | 73,272,085 |
| | 74,362,211 |
| | 72,613,221 |
| 76,137,751 |
| | 74,385,446 |
| | 75,840,604 |
| | 74,182,929 |
|
| Net income (loss) per common share, basic | $ | 0.13 |
| | $ | (0.06 | ) | | $ | 0.18 |
| | $ | (0.23 | ) | $ | 0.06 |
| | $ | 0.08 |
| | $ | 0.13 |
| | $ | 0.05 |
|
| Effect of dilutive securities | 4,656,899 |
| | — |
| | 3,952,508 |
| | — |
| 2,763,850 |
| | 3,902,821 |
| | 3,173,153 |
| | 3,603,819 |
|
| Weighted-average common shares outstanding, diluted | 79,372,491 |
| | 73,272,085 |
| | 78,314,719 |
| | 72,613,221 |
| 78,901,601 |
| | 78,288,267 |
| | 79,013,757 |
| | 77,786,748 |
|
| Net income (loss) per common share, diluted | $ | 0.12 |
| | $ | (0.06 | ) | | $ | 0.17 |
| | $ | (0.23 | ) | $ | 0.05 |
| | $ | 0.07 |
| | $ | 0.13 |
| | $ | 0.05 |
|
| Anti-dilutive securities excluded | 3,020,562 |
| | 11,813,427 |
| | 5,169,484 |
| | 11,813,427 |
| 6,747,782 |
| | 5,174,846 |
| | 5,591,794 |
| | 5,351,219 |
|
The difference between basic and diluted net income per common share has been calculated using the Treasury Stock Method based on the assumed exercise of outstanding stock options, the vesting of restricted stock awards,units, or RSUs, performance restricted stock units, or PRSUs, and the issuance of stock under our employee stock purchase plan. ForChanges in the three and nine months ended September 30, 2017, the effectsaverage market price of potentiallyour stock can impact when stock equivalents are considered dilutive items were anti-dilutive given our net losses.or anti-dilutive. The following common share equivalent securities have been included in the calculation of dilutive weighted-average common shares outstanding:
| | | | Three Months Ended September 30, | | Nine Months Ended September 30, | | | | | | | | |
| | 2018 | | 2017 | | 2018 | | 2017 | Three Months Ended June 30, | | Six Months Ended June 30, |
| Dilutive Common Share Equivalents | | | | | | | | 2019 | | 2018 | | 2019 | | 2018 |
| Weighted Average common shares outstanding | 74,715,592 |
| | 73,272,085 |
| | 74,362,211 |
| | 72,613,221 |
| |
| Restricted stock units | 1,616,072 |
| | — |
| | 1,083,237 |
| | — |
| |
| Weighted-average common shares outstanding | | 76,137,751 |
| | 74,385,446 |
| | 75,840,604 |
| | 74,182,929 |
|
| RSUs and PRSUs | | 489,080 |
| | 1,018,066 |
| | 755,731 |
| | 768,172 |
|
| Stock options | 3,040,827 |
| | — |
| | 2,869,271 |
| | — |
| 2,274,770 |
| | 2,860,430 |
| | 2,413,951 |
| | 2,830,587 |
|
| Employee stock purchase program | — |
| | — |
| | — |
| | — |
| |
| Employee stock purchase plan | | — |
| | 24,325 |
| | 3,471 |
| | 5,060 |
|
| Total dilutive common share equivalents | 79,372,491 |
| | 73,272,085 |
| | 78,314,719 |
| | 72,613,221 |
| 78,901,601 |
| | 78,288,267 |
| | 79,013,757 |
| | 77,786,748 |
|
The following common share equivalent securities were excluded from the calculation of diluted net income per share attributable to common stockholders. Their effect would have been antidilutive for the three and ninesix months ended SeptemberJune 30, 20182019 and 2017:2018.
|
| | | | | | | | | | | |
| | Three Months Ended September 30, | | Nine Months Ended September 30, |
| | 2018 | | 2017 | | 2018 | | 2017 |
| Anti-Dilutive Common Share Equivalents | | | | | | | |
| Warrants to purchase common stock | 22,000 |
| | 22,000 |
| | 22,000 |
| | 22,000 |
|
| Restricted stock units | 124,582 |
| | 3,528,871 |
| | 527,326 |
| | 3,528,871 |
|
| Stock options | 2,840,298 |
| | 8,227,736 |
| | 4,586,476 |
| | 8,227,736 |
|
| Employee stock purchase program | 33,682 |
| | 34,820 |
| | 33,682 |
| | 34,820 |
|
| Total anti-dilutive common share equivalents | 3,020,562 |
| | 11,813,427 |
|
| 5,169,484 |
|
| 11,813,427 |
|
The weighted-average exercise price for warrants to purchase 22,000 shares of common stock was $14.50 as of September 30, 2018. A warrant to purchase 1,985,846 shares expired in September 2018 as a result of performance conditions not being met by that time. That warrant was excluded in the prior year periods from the anti-dilutive common share equivalents as performance obligations had not been met. |
| | | | | | | | | | | |
| | Three Months Ended June 30, | | Six Months Ended June 30, |
| | 2019 | | 2018 | | 2019 | | 2018 |
| Anti-Dilutive Common Share Equivalents | | | | | | | |
| Warrants to purchase common stock | — |
| | 22,000 |
| | — |
| | 22,000 |
|
| RSUs and PRSUs | 2,361,583 |
| | 429,942 |
| | 1,633,192 |
| | 600,632 |
|
| Stock options | 4,176,551 |
| | 4,722,904 |
| | 3,958,602 |
| | 4,728,587 |
|
| Employee stock purchase plan | 209,648 |
| | — |
| | — |
| | — |
|
| Total anti-dilutive common share equivalents | 6,747,782 |
| | 5,174,846 |
| | 5,591,794 |
| | 5,351,219 |
|
3.4. Interest Income
Interest income was comprised of the following components for the three and six months ended June 30, 2019 and 2018 (in thousands):
|
| | | | | | | | | | | | | | | |
| | Three Months Ended June 30, | | Six Months Ended June 30, |
| | 2019 | | 2018 | | 2019 | | 2018 |
| Interest and finance income | $ | 122,799 |
| | $ | 106,090 |
| | $ | 246,234 |
| | $ | 204,845 |
|
| Amortization of net deferred origination costs | (17,451 | ) | | (13,913 | ) | | (35,344 | ) | | (26,459 | ) |
| Interest and finance income, net | 105,348 |
| | 92,177 |
| | 210,890 |
| | 178,386 |
|
| Interest on deposits and investments | 293 |
| | 32 |
| | 550 |
| | 52 |
|
| Total interest and finance income | $ | 105,641 |
| | $ | 92,209 |
| | $ | 211,440 |
| | $ | 178,438 |
|
5. Loans and Finance Receivables Held for Investment and Allowance for LoanCredit Losses
Loans Held for Investment and Allowance for Loan Losses
Loansfinance receivables held for investment consisted of the following as of SeptemberJune 30, 20182019 and December 31, 20172018 (in thousands):
| | | | September 30, 2018 | | December 31, 2017 | June 30, 2019 | | December 31, 2018 |
| Term loans | $ | 928,091 |
| | $ | 804,227 |
| $ | 936,053 |
| | $ | 956,755 |
|
| Lines of credit | 167,702 |
| | 132,012 |
| 238,105 |
| | 188,199 |
|
| Total unpaid principal balance | 1,095,792 |
| | 936,239 |
| |
Other loans and finance receivables (1) | | 10,964 |
| | — |
|
| Total Unpaid Principal Balance | | 1,185,122 |
| | 1,144,954 |
|
| Net deferred origination costs | 22,036 |
| | 16,557 |
| 22,487 |
| | 24,453 |
|
| Total loans held for investment | $ | 1,117,828 |
| | $ | 952,796 |
| |
| Total loans and finance receivables held for investment | | $ | 1,207,609 |
| | $ | 1,169,407 |
|
| |
(1) | Includes secured equipment loans and merchant cash advances. |
As part of the business combination with Evolocity, on April 1, 2019 we purchased $37.5 million of term loans and finance receivables. During the ninesix months ended SeptemberJune 30, 2018, and 2017, we paid $0.8 million and $13.7 million, respectively, to purchase term loans that we previously sold to a third party. No loans from third parties were purchased during 2019.
We include both loans we originate and loans originatedfunded by our issuing bank partner and later purchased by us as part of our originations. During the three months ended SeptemberJune 30, 20182019 and 20172018 we purchased loans from our issuing bank partner in the amount of $112.1$95.5 million and $101.6$109.3 million, respectively. During the ninesix months ended SeptemberJune 30, 20182019 and 20172018 we purchased loans from our issuing bank partner in the amount of $360.6$207.1 million and $367.3$248.5 million, respectively.
The change in the allowance for loancredit losses for the three months and ninesix months ended SeptemberJune 30, 20182019 and 20172018 consisted of the following (in thousands):
|
| | | | | | | | | | | | | | | |
| | Three Months Ended September 30, | | Nine Months Ended September 30, |
| | 2018 | | 2017 | | 2018 | | 2017 |
| Balance at beginning of period | $ | 124,058 |
| | $ | 105,217 |
| | $ | 109,015 |
| | $ | 110,162 |
|
| Recoveries of loans previously charged off | 3,306 |
| | 5,330 |
| | 9,857 |
| | 12,173 |
|
| Loans charged off | (32,822 | ) | | (45,257 | ) | | (93,916 | ) | | (135,958 | ) |
| Provision for loan losses | 39,102 |
| | 39,582 |
| | 108,688 |
| | 118,495 |
|
| Allowance for loan losses at end of period | $ | 133,644 |
| | $ | 104,872 |
| | $ | 133,644 |
| | $ | 104,872 |
|
|
| | | | | | | | | | | | | | | |
| | Three Months Ended June 30, | | Six Months Ended June 30, |
| | 2019 | | 2018 | | 2019 | | 2018 |
| Balance at beginning of period | $ | 147,406 |
| | $ | 118,921 |
| | $ | 140,040 |
| | $ | 109,015 |
|
| Recoveries of previously charged off amounts | 4,523 |
| | 3,206 |
| | 8,437 |
| | 6,551 |
|
| Loans and finance receivables charged off | (49,141 | ) | | (31,362 | ) | | (88,980 | ) | | (61,094 | ) |
| Provision for credit losses | 42,951 |
| | 33,293 |
| | 86,242 |
| | 69,586 |
|
| Allowance for credit losses at end of period | $ | 145,739 |
| | $ | 124,058 |
| | $ | 145,739 |
| | $ | 124,058 |
|
When loans and finance receivables are charged off, we typically continue to attempt to recover amounts from the respective borrowers and guarantors, including, when we deem it appropriate, through formal legal action. Alternatively, we may sell previously charged-off loans to a third-party debt collector. The proceeds from these sales are recorded as a component of the recoveries of loans previously charged off. We did not sell any previously charged-off loans for the three and six months ended June 30, 2019. For the three and six months ended SeptemberJune 30, 2018 and 2017, previously charged-off loans sold accounted for $0.2 million and $2.4$0.7 million respectively, of recoveries of loans previously charged off. For the nine months ended September 30, 2018 and 2017, previously charged-off loans sold accounted for $0.9 million and $6.2 million, respectively, of recoveries of loans previously charged off.
As of SeptemberJune 30, 20182019 and December 31, 2017,2018, our off-balance sheet credit exposure related to the undrawn line of credit balances was $243.2was $282.2 million and $204.6$264.2 million, respectively. The related reserve on unfunded loan commitments was $5.2$6.3 million and $4.4$5.9 million as of SeptemberJune 30, 20182019 and December 31, 2017,2018, respectively. Net adjustments to the accrualliability for unfunded loan commitmentscommitments are included in general and administrative expense.
TheThe following table contains information, on a combined basis, regarding the unpaid principal balance of loans we originated and the amortized cost of loans purchased from third parties other than our issuing bank partner related to current,non-delinquent, paying and non-paying delinquent loans and finance receivables as of SeptemberJune 30, 20182019 and December 31, 20172018 (in thousands):
| | | | September 30, 2018 | | December 31, 2017 | June 30, 2019 | | December 31, 2018 |
| Current loans | $ | 1,002,932 |
| | $ | 850,060 |
| |
| Current loans and finance receivables | | $ | 1,060,465 |
| | $ | 1,031,449 |
|
| Delinquent: paying (accrual status) | 52,275 |
| | 49,252 |
| 52,735 |
| | 54,427 |
|
| Delinquent: non-paying (non-accrual status) | 40,585 |
| | 36,927 |
| 71,922 |
| | 59,078 |
|
| Total | $ | 1,095,792 |
| | $ | 936,239 |
| $ | 1,185,122 |
| | $ | 1,144,954 |
|
The portion of the allowance for loancredit losses attributable to current loans and finance receivables was $87.1$70.5 million and $74.0$85.7 million as of SeptemberJune 30, 20182019 and December 31, 2017,2018, respectively, while the portion of the allowance for loancredit losses attributable to delinquent loans and finance receivables was $46.5$75.3 million and $35.0$54.3 million as of SeptemberJune 30, 20182019 and December 31, 2017,2018, respectively.
The following table shows an aging analysis of the unpaid principal balance related to loans held for investmentand finance receivables by delinquency statusstatus as of SeptemberJune 30, 20182019 and December 31, 20172018 (in thousands):
| | | | September 30, 2018 | | December 31, 2017 | June 30, 2019 | | December 31, 2018 |
| By delinquency status: | | | | | | |
| Current loans | $ | 1,002,932 |
| | $ | 850,060 |
| |
| Current loans and finance receivables | | $ | 1,060,465 |
| | $ | 1,031,449 |
|
| 1-14 calendar days past due | 22,573 |
| | 23,611 |
| 23,798 |
| | 27,655 |
|
| 15-29 calendar days past due | 10,261 |
| | 12,528 |
| 15,518 |
| | 14,665 |
|
| 30-59 calendar days past due | 18,671 |
| | 22,059 |
| 23,931 |
| | 21,470 |
|
| 60-89 calendar days past due | 15,161 |
| | 12,809 |
| 18,162 |
| | 19,031 |
|
| 90 + calendar days past due | 26,194 |
| | 15,172 |
| 43,248 |
| | 30,684 |
|
| Total unpaid principal balance | $ | 1,095,792 |
| | $ | 936,239 |
| $ | 1,185,122 |
| | $ | 1,144,954 |
|
4. Servicing Rights
As of September 30, 2018 and December 31, 2017, the remaining unpaid principal balance of term loans we serviced that previously were sold was $132.0 million and $181.0 million, respectively. No loans were sold during the three and nine months ended September 30, 2018. During the three months and nine months ended September 30, 2017, we sold through OnDeck Marketplace loans with an unpaid principal balance of $5.3 million and $55.5 million, respectively.
For the three months ended September 30, 2018 and 2017, we earned $0.1 million and $0.4 million of servicing revenue, respectively. For the nine months ended September 30, 2018 and 2017, we earned $0.6 million and $1.3 million of servicing revenue, respectively.
The following table summarizes the activity related to the fair value of our servicing assets for the three months and nine months ended September 30, 2018 and 2017 (in thousands):
|
| | | | | | | | | | | | | | | |
| | Three Months Ended September 30, | | Nine Months Ended September 30, |
| | 2018 | | 2017 | | 2018 | | 2017 |
| Fair value at the beginning of period | $ | 29 |
| | $ | 701 |
| | $ | 154 |
| | $ | 1,131 |
|
| Addition: | | | | | | | |
| Servicing resulting from transfers of financial assets | 16 |
| | 275 |
| | 78 |
| | 938 |
|
| Changes in fair value: | | | | | | | |
| Change in inputs or assumptions used in the valuation model | — |
| | — |
| | — |
| | — |
|
Other changes in fair value (1) | (36 | ) | | (347 | ) | | (223 | ) | | (1,440 | ) |
| Fair value at the end of period (Level 3) | $ | 9 |
| | $ | 629 |
| | $ | 9 |
| | $ | 629 |
|
(1)Represents changes due to collection of expected cash flows through September 30, 2018 and 2017.
5.6. Debt
The following table summarizes our outstanding debt as of SeptemberJune 30, 20182019 and December 31, 20172018 (in thousands):
|
| | | | | | | | | | | | | |
| | | | | | | | Outstanding |
| Type | | Maturity Date | | Weighted Average Interest Rate at September 30, 2018 | | September 30, 2018 | | December 31, 2017 |
| Funding Debt: | | | | | | | | | |
| ODAST II Series 2018-1 | Securitization | | April 2022 (1) | | 3.8% | | $ | 225,000 |
| | $ | — |
|
| ODAST II Series 2016-1 | Securitization | | May 2020 (2) | | N/A | | — |
| | 250,000 |
|
| ODART | Revolving | | March 2019 | | 4.7% | | 120,985 |
| | 102,058 |
|
| RAOD | Revolving | | November 2018 | | 5.3% | | 111,542 |
| | 86,478 |
|
| ODAC | Revolving | | May 2019 (3) | | N/A | | — |
| | 62,350 |
|
| ODAF | Revolving | | February 2020 (3) | | N/A | | — |
| | 75,000 |
|
| ODAF II | Revolving | | August 2022 (4) | | 4.4% | | 111,119 |
| | — |
|
| PORT II | Revolving | | December 2018 | | 4.7% | | 110,605 |
| | 63,851 |
|
| LAOD | Revolving | | October 2022 (5) | | 4.1% | | 95,096 |
| | — |
|
| Other Agreements | Various | | Various (6) | | 7.4% | | 44,194 |
| | 50,706 |
|
| | | | | | 4.6% | | 818,541 |
| | 690,443 |
|
| Deferred debt issuance cost | | | | | | | (6,113 | ) | | (6,174 | ) |
| Total Funding Debt | | | | | | | $ | 812,428 |
| | $ | 684,269 |
|
| | | | | | | | | | |
| Corporate Debt: | | | | | | | | | |
| Square 1 | Revolving | | October 2018 (7) | | 6.5% | | — |
| | 8,000 |
|
| Deferred debt issuance cost | | | | | | | — |
| | (15 | ) |
| Total Corporate Debt | | | | | | | $ | — |
| | $ | 7,985 |
|
(1)The period during which new borrowings may be made under this facility expires in March 2020. |
| | | | | | | | | | | | | |
| | | | | | Outstanding |
| | Type | | Maturity Date | | Weighted Average Interest
Rate at June 30, 2019 | | June 30, 2019 | | December 31, 2018 |
| Debt: | | | | | | | |
| OnDeck Asset Securitization Trust II | Securitization | | April 2022 | (1) | 3.8% | | $ | 225,000 |
| | $ | 225,000 |
|
| OnDeck Account Receivables Trust 2013-1 | Revolving | | March 2022 | (2) | 4.2% | | 111,827 |
| | 117,664 |
|
| Receivable Assets of OnDeck, LLC | Revolving | | September 2021 | (3) | 4.8% | | 101,453 |
| | 113,631 |
|
| OnDeck Asset Funding II LLC | Revolving | | August 2022 | (4) | 5.4% | | 110,202 |
| | 109,568 |
|
| Prime OnDeck Receivable Trust II | Revolving | | March 2022 | (5) | 4.4% | | 108,949 |
| | 108,816 |
|
| Loan Assets of OnDeck, LLC | Revolving | | October 2022 | (6) | 4.2% | | 98,469 |
| | 100,000 |
|
| Corporate Debt | Revolving | | January 2021 | | 5.4% | | 20,000 |
| | — |
|
| Other Agreements | Various | | Various | (7) | 6.8% | (8) | 72,909 |
| (9) | 47,318 |
|
| | | | | | 4.6% | | 848,809 |
| | 821,997 |
|
| Deferred debt issuance cost | | | | | | | (7,207 | ) | | (5,766 | ) |
| Total Debt | | | | | | | $ | 841,602 |
| | $ | 816,231 |
|
| |
(1) | The period during which new loans may be purchased under this securitization transaction expires in March 2020. |
| |
(2) | The period during which new borrowings may be made under this facility expires in March 2021. |
| |
(3) | The period during which new borrowings of Class A revolving loans may be made under this debt facility expires in December 2020. The $19.7 million of Class B borrowing capacity matures in December 2019. |
| |
(4) | The period during which new borrowings may be made under this facility expires in August 2021. |
| |
(5) | The period during which new borrowings may be made under this facility expires in March 2021. |
| |
(6) | The period during which new borrowings may be made under this debt facility expires in April 2022. |
| |
(7) | The periods during which new borrowings may be made under the various agreements expire between September 2019 and June 2020. Maturity dates range from September 2019 through December 2022. |
| |
(8) | Weighted average interest rate as of June 30, 2019 reflects the credit facilities assumed as a part of the combination with Evolocity Financial Group. |
| |
(9) | Outstanding amounts as of June 30, 2019 reflects the credit facilities assumed as a part of the combination with Evolocity Financial Group. |
(2)Certai In April 2018, we issued $225 million of debt in a new ODAST II securitization transaction (Series 2018-1) and the net proceeds were used, together with other available funds, to voluntarily prepay in full all $250 million of the prior Series 2016-1 Notes.
(3)This debt facility was voluntarily repaid in full and terminated in August 2018.
(4)The period during which new borrowings may be made under this debt facility expires in August 2021.
(5) The period during which new borrowings may be made under this debt facility expires in April 2022.
(6) Maturity dates range from January 2020 through June 2021.
(7) In October 2018 this debt facility was amended to extend the maturity date to January 2019.
On August 8, 2018, our wholly-owned subsidiary, OnDeck Asset Funding II LLC, established a new asset-backed revolving debt facility with a commitment amount of $175 million and an interest rate of 1-month LIBOR + 3.0%. The period during which new borrowings may be made under this facility expires on August 6, 2021 and the final maturity date is August 8, 2022. Concurrent with closing this facility, the Company optionally prepaid in full and terminated the $100 million asset-backed revolving debt facility by and between, among others, On Deck Asset Company, LLC, as borrower, and WM 2016-1, LLC, as administrative agent.
On August 14, 2018, our wholly-owned subsidiary, OnDeck Asset Funding I LLC, voluntarily prepaid in full and terminated the $150 million asset-backed revolving debt facility originally entered into in August 2016 by and between, among others, OnDeck Asset Funding I LLC, as borrower, and Ares Agent Services, L.P., as administrative agent.
On October 4, 2018, On Deck Capital, Inc. amended its existing $30 million revolving debt facility to extend the maturity date of the facility to January 2019 and made various technical, definitional, conforming and other changes.
Certainn of our loans held for investment are pledged as collateral for borrowings in our funding debt facilities. These loans totaled $970.2 million$1.0 billion and $852.3 million$1.0 billion as of SeptemberJune 30, 20182019 and December 31, 2017,2018, respectively. Our corporate debt facility is collateralized by substantially all of our assets.
6.7. Fair Value of Financial Instruments
Assets and Liabilities Measured at Fair Value on a Recurring Basis Using Significant Unobservable Inputs (Level 3)
We evaluate our financial assets and liabilities subject to fair value measurements on a recurring basis to determine the appropriate level at which to classify them for each reporting period. Due to the lack of transparency and quantity of transactions related to trades of servicing rights of comparable loans, we utilize an income valuation technique to estimate Our interest rate cap is reported at fair value. We utilize industry-standard modeling, such asvalue utilizing Level 2 inputs. The fair value is determined using third party valuations that are based on discounted cash flow models, to arrive at an estimate of fair value and may utilize third-party service providers to assist in the valuation process. This determination requires significant judgments to be made.analysis using observed market inputs.
The following tables present information about our assets and liabilities that are measured at fair value on a recurring basis as of SeptemberJune 30, 20182019 and December 31, 20172018 (in thousands):
|
| | | | | | | | | | | | | | | |
| | June 30, 2019 |
| | Level 1 | | Level 2 | | Level 3 | | Total |
Assets: | | | | | | | |
| Interest rate cap | — |
| | 41 |
| | — |
| | 41 |
|
| Total assets | $ | — |
| | $ | 41 |
| | $ | — |
| | $ | 41 |
|
| | | | September 30, 2018 | December 31, 2018 |
| | Level 1 | | Level 2 | | Level 3 | | Total | Level 1 | | Level 2 | | Level 3 | | Total |
Assets: | | | | | | | | | | | | | | |
| Servicing assets | $ | — |
| | $ | — |
| | $ | 9 |
| | $ | 9 |
| |
| Interest rate cap | | $ | — |
| | $ | 1,253 |
| | $ | — |
| | $ | 1,253 |
|
| Total assets | $ | — |
| | $ | — |
| | $ | 9 |
| | $ | 9 |
| $ | — |
| | $ | 1,253 |
| | $ | — |
| | $ | 1,253 |
|
|
| | | | | | | | | | | | | | | |
| | December 31, 2017 |
| | Level 1 | | Level 2 | | Level 3 | | Total |
Assets: | | | | | | | |
| Servicing assets | $ | — |
| | $ | — |
| | $ | 154 |
| | $ | 154 |
|
| Total assets | $ | — |
| | $ | — |
| | $ | 154 |
| | $ | 154 |
|
There were no transfers between levels for the ninethree months ended SeptemberJune 30, 2018 or December 31, 2017.
The following tables presents quantitative information about the significant unobservable inputs used for certain of our Level 3 fair value measurement as of September 30, 20182019 and December 31, 2017:2018.
|
| | | | | | | | | | |
| | September 30, 2018 |
| | Unobservable input | | Minimum | | Maximum | | Weighted Average |
| Servicing assets | Discount rate | | 30.00 | % | | 30.00 | % | | 30.00 | % |
| | Cost of service(1) | | 0.04 | % | | 0.13 | % | | 0.13 | % |
| | Renewal rate | | 41.06 | % | | 51.83 | % | | 50.56 | % |
| | Default rate | | 10.63 | % | | 10.92 | % | | 10.68 | % |
(1) Estimated cost of servicing a loan as a percentage of unpaid principal balance. |
|
| | | | | | | | | | |
| | December 31, 2017 |
| | Unobservable input | | Minimum | | Maximum | | Weighted Average |
| Servicing assets | Discount rate | | 30.00 | % | | 30.00 | % | | 30.00 | % |
| | Cost of service(1) | | 0.04 | % | | 0.13 | % | | 0.12 | % |
| | Renewal rate | | 41.06 | % | | 51.83 | % | | 49.59 | % |
| | Default rate | | 10.63 | % | | 10.92 | % | | 10.70 | % |
(1) Estimated cost of servicing a loan as a percentage of unpaid principal balance. |
Changes in certain of the unobservable inputs noted above may have a significant impact on the fair value of our servicing asset. The following table summarizes the effect adverse changes in estimate would have on the fair value of the servicing asset as of September 30, 2018 and December 31, 2017 given hypothetical changes in default rate and cost to service (in thousands):
|
| | | | | | | |
| | September 30, 2018 | | December 31, 2017 |
| | Servicing Assets |
| Default rate assumption: | | | |
| Default rate increase of 25% | $ | (3 | ) | | $ | (40 | ) |
| Default rate increase of 50% | $ | (5 | ) | | $ | (76 | ) |
| Cost to service assumption: | | | |
| Cost to service increase by 25% | $ | (4 | ) | | $ | (63 | ) |
| Cost to service increase by 50% | $ | (9 | ) | | $ | (126 | ) |
Assets and Liabilities Disclosed at Fair Value
Because our loans held for investmentand finance receivables and fixed-rate debt are not measured at fair value, we are required to disclose their fair value in accordance with ASC 825. Due to the lack of transparency and comparable loans and finance receivables, we utilize an income valuation technique to estimate fair value. We utilize industry-standard modeling, such as discounted cash flow models, to arrive at an estimate of fair value and may utilize third-party service providers to assist in the valuation process. This determination requires significant judgments to be made. The following tables summarize the carrying value and fair value of our loans held for investment and fixed-rate debt (in thousands):
| | | | September 30, 2018 | June 30, 2019 |
| | Carrying Value | | Fair Value | | Level 1 | | Level 2 | | Level 3 | Carrying Value | | Fair Value | | Level 1 | | Level 2 | | Level 3 |
| Assets: | | | | | | | | | | |
| Loans held for investment, net | $ | 984,184 |
| | $ | 1,095,854 |
| | $ | — |
| | $ | — |
| | $ | 1,095,854 |
| |
Assets: | | | | | | | | | | |
| Loans and finance receivables, net | | $ | 1,061,870 |
| | $ | 1,191,009 |
| | $ | — |
| | $ | — |
| | $ | 1,191,009 |
|
| Total assets | $ | 984,184 |
| | $ | 1,095,854 |
| | $ | — |
| | $ | — |
| | $ | 1,095,854 |
| $ | 1,061,870 |
| | $ | 1,191,009 |
| | $ | — |
| | $ | — |
| | $ | 1,191,009 |
|
| | | | | | | | | | | | | | | | | | | |
| | | | | | | | | | | | | | | | | | | |
| Liabilities: | | | | | | | | | | | | | | | | | | |
| Fixed-rate debt | $ | 232,982 |
| | $ | 223,022 |
| | $ | — |
| | $ | — |
| | $ | 223,022 |
| $ | 240,238 |
| | $ | 236,026 |
| | $ | — |
| | $ | — |
| | $ | 236,026 |
|
| Total fixed-rate debt | $ | 232,982 |
| | $ | 223,022 |
| | $ | — |
| | $ | — |
| | $ | 223,022 |
| $ | 240,238 |
| | $ | 236,026 |
| | $ | — |
| | $ | — |
| | $ | 236,026 |
|
| | | | December 31, 2017 | December 31, 2018 |
| | Carrying Value | | Fair Value | | Level 1 | | Level 2 | | Level 3 | Carrying Value | | Fair Value | | Level 1 | | Level 2 | | Level 3 |
| Assets: | | | | | | | | | | |
| Loans held for investment, net | $ | 843,781 |
| | $ | 932,343 |
| | $ | — |
| | $ | — |
| | $ | 932,343 |
| |
Assets: | | | | | | | | | | |
| Loans and finance receivables, net | | $ | 1,029,367 |
| | $ | 1,155,464 |
| | $ | — |
| | $ | — |
| | $ | 1,155,464 |
|
| Total assets | $ | 843,781 |
| | $ | 932,343 |
| | $ | — |
| | $ | — |
| | $ | 932,343 |
| $ | 1,029,367 |
| | $ | 1,155,464 |
| | $ | — |
| | $ | — |
| | $ | 1,155,464 |
|
| | | | | | | | | | | | | | | | | | | |
| | | | | | | | | | | | | | | | | | | |
| Liabilities: | | | | | | | | | | | | | | | | | | |
| Fixed-rate debt | $ | 300,706 |
| | $ | 293,512 |
| | $ | — |
| | $ | — |
| | $ | 293,512 |
| $ | 232,972 |
| | $ | 226,965 |
| | $ | — |
| | $ | — |
| | $ | 226,965 |
|
| Total fixed-rate debt | $ | 300,706 |
| | $ | 293,512 |
| | $ | — |
| | $ | — |
| | $ | 293,512 |
| $ | 232,972 |
| | $ | 226,965 |
| | $ | — |
| | $ | — |
| | $ | 226,965 |
|
7. Noncontrolling Interest8. Income Taxes
The following tables summarize changes in equity, includingFor interim periods, the equity attributable to noncontrolling interests,income tax provision is comprised of tax on ordinary income provided at the most recent estimated annual effective tax rate, adjusted for the ninetax effect of discrete items. We use an estimated annual effective tax rate which is based on expected annual income and statutory tax rates to determine our quarterly provision for income taxes. Certain significant or unusual items are separately recognized in the quarter in which they occur and can be a source of variability in the effective tax rates from quarter to quarter.
Our provision for income taxes for the three and six months ended SeptemberJune 30, 20182019 was $1.8 million and 2017 (in thousands):
|
| | | | | | | | | | | | |
| | | Nine Months Ended September 30, 2018 |
| | | On Deck Capital, Inc's stockholders' equity | | Noncontrolling interest | | Total |
| Balance as of January 1, 2018 | | $ | 262,045 |
| | $ | 4,011 |
| | $ | 266,056 |
|
| Net income (loss) | | 13,642 |
| | (1,807 | ) | | 11,835 |
|
| Stock based compensation | | 8,573 |
| | — |
| | 8,573 |
|
| Exercise of options and warrants | | 76 |
| | — |
| | 76 |
|
| Employee Stock Purchase Plan | | 1,895 |
| | — |
| | 1,895 |
|
| Cumulative translation adjustment | | (448 | ) | | (367 | ) | | (815 | ) |
| Purchase of treasury shares | | (801 | ) | | — |
| | (801 | ) |
| Investments by noncontrolling interests | | — |
| | 3,403 |
| | 3,403 |
|
| Balance at September 30, 2018 | | 284,982 |
| | 5,240 |
| | 290,222 |
|
| | | | | | | |
| Comprehensive loss: | | | | | | |
| Net income (loss) | | 13,642 |
| | (1,807 | ) | | 11,835 |
|
| Other comprehensive income (loss): | | | | | | |
| Foreign currency translation adjustment | | (448 | ) | | (367 | ) | | (815 | ) |
| Comprehensive income (loss): | | $ | 13,194 |
| | $ | (2,174 | ) | | $ | 11,020 |
|
| | | | | | | |
| | | | | | | |
| | | Nine Months Ended September 30, 2017 |
| | | On Deck Capital, Inc.'s stockholders' equity | | Noncontrolling interest | | Total |
| Balance as of January 1, 2017 | | $ | 259,525 |
| | $ | 4,072 |
| | $ | 263,597 |
|
| Net income (loss) | | (16,630 | ) | | (2,073 | ) | | (18,703 | ) |
| Stock based compensation | | 9,115 |
| | — |
| | 9,115 |
|
| Exercise of options and warrants | | 490 |
| | — |
| | 490 |
|
| Employee stock purchase plan | | 2,299 |
| | — |
| | 2,299 |
|
| Cumulative translation adjustment | | 375 |
| | 307 |
| | 682 |
|
| Purchase of treasury shares | | (864 | ) | | — |
| | (864 | ) |
| Investments by noncontrolling interests | | — |
| | 3,443 |
| | 3,443 |
|
| Return of equity to noncontrolling interest | | — |
| | (959 | ) | | (959 | ) |
| Balance at September 30, 2017 | | 254,310 |
| | 4,790 |
| | 259,100 |
|
| | | | | | | |
| Comprehensive loss: | | | | | | |
| Net income (loss) | | (16,630 | ) | | (2,073 | ) | | (18,703 | ) |
| Other comprehensive income (loss): | | | | | | |
| Foreign currency translation adjustment | | 375 |
| | 307 |
| | 682 |
|
| Comprehensive income (loss): | | $ | (16,255 | ) | | $ | (1,766 | ) | | $ | (18,021 | ) |
In the third quarter$3.5 million, representing an estimated quarterly effective income tax rate of 2015, we acquired a 67% interest in an entity, with the remaining 33% owned by an unrelated third party strategic partner,45% for the purposethree months ended June 30, 2019 and a year to date effective income tax rate of providing small business loans32%. The effective income tax rate for the full year 2018 was 0% due to customersthe availability of the third party. We consolidate the financial position and resultsnet operating loss carryforwards. A valuation allowance of operations of that entity. On June 29, 2017, OnDeck purchased the loans owned by that entity for an immaterial amount. That entity made a liquidating distribution to us$37.6 million was recorded against our net deferred tax assets of approximately $2$42.7 million and to the unrelated
third partyas of June 30, 2019 resulting in a net deferred tax asset of approximately $1 million representing our respective proportionate share of the equity in that entity. The loan sale and distribution effectively ended the operations of that entity. No material gain or loss was recorded.$5.0 million.
8.9. Stock-Based Compensation and Employee Benefit Plans
Options
The following is a summary of option activity for the ninesix months ended SeptemberJune 30, 2018:
2019:
|
| | | | | | | | | | | | | |
| | Number of
Options | | Weighted-
Average
Exercise
Price | | Weighted-
Average
Remaining
Contractual
Term
(in years) | | Aggregate
Intrinsic
Value
(in thousands) |
| Outstanding at January 1, 2018 | 7,918,853 |
| | $ | 5.75 |
| | — |
| | — |
|
| Granted | 1,031,550 |
| | $ | 5.41 |
| | — |
| | — |
|
| Exercised | (531,747 | ) | | $ | 0.98 |
| | — |
| | — |
|
| Forfeited | (212,410 | ) | | $ | 8.17 |
| | — |
| | — |
|
| Expired | (185,067 | ) | | $ | 10.91 |
| | — |
| | — |
|
| Outstanding at September 30, 2018 | 8,021,179 |
| | $ | 5.84 |
| | 5.9 |
| | $ | 24,922 |
|
| Exercisable at September 30, 2018 | 6,329,697 |
| | $ | 5.76 |
| | 5.2 |
| | $ | 21,739 |
|
| Vested and expected to vest as of September 30, 2018 | 7,917,209 |
| | $ | 5.85 |
| | 5.9 |
| | $ | 24,694 |
|
|
| | | | | | | | | | | | | |
| | Number of
Options | | Weighted-
Average
Exercise
Price | | Weighted-
Average
Remaining
Contractual
Term
(in years) | | Aggregate
Intrinsic
Value
(in thousands) |
| Outstanding at January 1, 2019 | 7,932,782 |
| | $ | 5.86 |
| | — |
| | — |
|
| Exercised | (389,335 | ) | | $ | 2.63 |
| | — |
| | — |
|
| Expired | (508,557 | ) | | $ | 11.24 |
| | — |
| | — |
|
| Outstanding at June 30, 2019 | 7,034,890 |
| | $ | 5.65 |
| | 5.5 |
| | $ | 9,043 |
|
| Exercisable at June 30, 2019 | 6,093,122 |
| | $ | 5.63 |
| | 5.1 |
| | $ | 9,043 |
|
| Vested or expected to vest as of June 30, 2019 | 6,984,662 |
| | $ | 5.65 |
| | 5.5 |
| | $ | 9,043 |
|
Total compensation cost related to nonvested option awards not yet recognized as of SeptemberJune 30, 20182019 was $3.4$1.9 million and will be recognized over a weighted-average period of approximately 2.02.1 years. The aggregate intrinsic value of employee options exercised during the ninesix months ended SeptemberJune 30, 2019 and 2018 and 2017 was $2.9$1.4 million and $5.0$2.0 million, respectively.
Restricted Stock Units
The following table summarizes our Restricted Stock Units ("RSUs")is a summary of activity in RSUs and Performance Restricted Stock Units ("PRSUs") activity duringPRSUs for the ninesix months ended SeptemberJune 30, 2018:
2019:
|
| | | | | | |
| | Number of RSUs | | Weighted-Average Grant Date Fair Value |
| Unvested at January 1, 2018 | 3,342,640 |
| | $ | 6.18 |
|
| RSUs and PRSUs granted | 1,304,194 |
| | $ | 5.71 |
|
| RSUs vested | (514,972 | ) | | $ | 7.60 |
|
| RSUs forfeited/expired | (404,092 | ) | | $ | 6.30 |
|
| Unvested at September 30, 2018 | 3,727,770 |
| | $ | 5.80 |
|
| Expected to vest after September 30, 2018 | 3,066,327 |
| | $ | 5.86 |
|
|
| | | | | | |
| | Number of RSUs and PRSUs | | Weighted-Average Grant Date Fair Value |
| Unvested at January 1, 2019 | 3,307,561 |
| | $ | 6.00 |
|
| RSUs and PRSUs granted | 1,984,378 |
| | $ | 5.64 |
|
| RSUs and PRSUs vested | (585,312 | ) | | $ | 6.57 |
|
| RSUs and PRSUs forfeited/expired | (294,195 | ) | | $ | 5.78 |
|
| Unvested at June 30, 2019 | 4,412,432 |
| | $ | 5.78 |
|
| Expected to vest after June 30, 2019 | 3,594,305 |
| | $ | 5.76 |
|
As of SeptemberJune 30, 2018,2019, there was $13$16 million of unrecognized compensation cost related to unvested RSUs and PRSUs, which is expected to be recognized over a weighted-average period of 2.62.8 years.
Stock-based compensation expense related to stock options, RSUs, PRSUs and the Employee Stock Purchase Plan ("ESPP")employee stock purchase plan are included in the following line items in our accompanying consolidated statements of operations for the three months and ninesix months ended SeptemberJune 30, 20182019 and 20172018 (in thousands):
| | | | Three Months Ended September 30, | | Nine Months Ended September 30, | Three Months Ended June 30, | | Six Months Ended June 30, |
| | 2018 | | 2017 | | 2018 | | 2017 | 2019 | | 2018 | | 2019 | | 2018 |
| Sales and marketing | $ | 452 |
| | $ | 538 |
| | $ | 1,492 |
| | $ | 1,830 |
| $ | 474 |
| | $ | 505 |
| | $ | 1,033 |
| | $ | 1,040 |
|
| Technology and analytics | 621 |
| | 499 |
| | 1,874 |
| | 1,824 |
| 889 |
| | 657 |
| | 1,717 |
| | 1,253 |
|
| Processing and servicing | 77 |
| | 99 |
| | 278 |
| | 429 |
| 49 |
| | 94 |
| | 139 |
| | 201 |
|
| General and administrative | 1,698 |
| | 1,920 |
| | 5,208 |
| | 5,438 |
| 1,836 |
| | 1,538 |
| | 3,442 |
| | 3,510 |
|
| Total | $ | 2,848 |
| | $ | 3,056 |
| | $ | 8,852 |
| | $ | 9,521 |
| $ | 3,248 |
| | $ | 2,794 |
| | $ | 6,331 |
| | $ | 6,004 |
|
10. Derivatives and Hedging
We are subject to interest rate risk in connection with borrowings under our debt agreements which are subject to variable interest rates. In December 2018 we entered into an interest rate cap, which is a derivative instrument, to manage our interest rate risk on a portion of our variable-rate debt. We do not use derivatives for speculative purposes. The interest rate cap is designated as a cash flow hedge. In exchange for our up-front premium, we would receive variable amounts from a counterparty if interest rates rise above the strike rate on the contract. The interest rate cap agreement is for a notional amount of $300 million and has a maturity date of January 2021.
For derivatives designated and that qualify as cash flow hedges of interest rate risk, the changes in the fair value of the derivative are recorded in Accumulated Other Comprehensive Income, or AOCI, and subsequently reclassified into interest expense in the same period(s) during which the hedged transaction affects earnings. Gains and losses on the derivative representing hedge components excluded from the assessment of effectiveness are recognized over the life of the hedge on a systematic and rational basis, as documented at hedge inception in accordance with our accounting policy election. The earnings recognition of excluded components is presented in interest expense. Amounts reported in AOCI related to derivatives will be reclassified to interest expense as interest payments are made on our variable-rate debt. We estimate that $1.0 million will be reclassified as an increase to interest expense over the next 12 months.
The table below presents the fair value of our derivative financial instruments as well as their classification on the Balance Sheet as ofJune 30, 2019 and December 31, 2018 (in thousands):
|
| | | | | | | | | | |
| Derivative Type | | Classification | | June 30, 2019 | | December 31, 2018 |
| Assets: | | | | | | |
| Interest rate cap agreement | | Other Assets | | $ | 41 |
| | $ | 1,253 |
|
The table below presents the effect of cash flow hedge accounting on AOCI as of June 30, 2019 and December 31, 2018 (in thousands):
|
| | | | | | | |
| | June 30, 2019 | | December 31, 2018 |
| Amount Recognized in OCI on Derivative: | | | |
| Interest rate cap agreement | $ | 866 |
| | $ | 456 |
|
The table below presents the effect of our derivative financial instruments on the Statement of Operations and Comprehensive Income as of three and six months ended June 30, 2019 and 2018 (in thousands):
|
| | | | | | | | | | | | | | | | |
| | | Location and Amount of Gain or (Loss) Recognized in Income on Cash Flow Hedging Relationships |
| | | Three Months Ended June 30, | | Six Months Ended June 30, |
| | | 2019 | | 2018 | | 2019 | | 2018 |
| Interest expense | | $ | (204 | ) | | $ | — |
| | $ | (338 | ) | | $ | — |
|
9. Commitments and Contingencies11. Revision of Prior Period Financial Statements
Commitments under Operating Leases
Effective February 1, 2018, we terminated our lease obligation for the 12th floor of our New York office which accounted for approximately 32% of our total New York office space. The lease of the 12th floor was previously scheduledWe revised prior period financial statements to continue through December 2026. As part of the termination, we paid the landlord a cash surrender fee of approximately $2.6 million and recorded a net charge of approximately $3.2 million in the quarter ending March 31, 2018. The net charge includes the surrender fee and approximately $4.0 millioncorrect an immaterial error related to the impairmentchannel attribution of leasehold improvementscertain loans and other fixed assets in the surrendered space, which were partially offset by other deferred credits.
On March 29, 2018, we terminated our lease obligationcommissions associated with respect tothose loans. Commissions become due upon the closing of a portion of our Denver office which accounted for approximately 38% of our total Denver office space. Our lease of that space was previously scheduled to continue through April 2026. As partloan. Those commissions are capitalized as a component of the termination, we paidloan balance and are amortized as an adjustment to interest income over the life of the loan. A summary of those revisions is as follows:
Revised Consolidated Balance Sheet as of December 31, 2018 (in thousands):
|
| | | | | | | | | | | |
| | As Reported | | Adjustment | | As Revised |
| Loans and finance receivables | $ | 1,169,157 |
| | $ | 250 |
| | $ | 1,169,407 |
|
| Total assets | $ | 1,161,570 |
| | $ | 250 |
| | $ | 1,161,820 |
|
| Accrued expenses and other liabilities | $ | 34,654 |
| | $ | 2,054 |
| | $ | 36,708 |
|
| Total liabilities | $ | 857,281 |
| | $ | 2,054 |
| | $ | 859,335 |
|
| Accumulated deficit | $ | (195,155 | ) | | $ | (1,804 | ) | | $ | (196,959 | ) |
| Total On Deck Capital, Inc. stockholders' equity | $ | 299,756 |
| | $ | (1,804 | ) | | $ | 297,952 |
|
| Total stockholders' equity | $ | 304,289 |
| | $ | (1,804 | ) | | $ | 302,485 |
|
Revised Consolidated Statements of Operations and Comprehensive Income (in thousands): |
| | | | | | | | | | | |
| | Three Months Ended June 30, 2018 | | Six Months Ended June 30, 2018 |
| | As Reported | | Adjustment | | As Revised | | As Reported | | Adjustment | | As Revised |
| Interest and finance income | $92,371 | | $(162) | | $92,209 | | $178,740 | | $(302) | | $178,438 |
| Gross revenue | $95,618 | | $(162) | | $95,456 | | $185,898 | | $(302) | | $185,596 |
| Net revenue | $50,080 | (1) | $(162) | | $49,918 | | $92,195 | (1) | $(302) | | $91,893 |
| Income (loss) from operations, before provision for income taxes | $4,774 | (1) | $(162) | | $4,612 | | $2,338 | (1) | $(302) | | $2,036 |
| Net income (loss) | $4,774 | | $(162) | | $4,612 | | $2,338 | | $(302) | | $2,036 |
(1) Includes a surrender fee and related chargesprior period reclassification to include interest expense as funding costs.
There was no impact to earnings per share for any period presented.
Revised Consolidated Statements of approximately $900,000 and recorded a net charge of approximately $1 million in the quarter ended March 31, 2018. The net charge includes the surrender fee and the impairment of leasehold improvements and other fixed assets in the surrendered space, which were partially offset by other deferred credits.Cash Flows
The net charges related to these lease terminations were allocated to each of our operating expense line items onWe revised our condensed consolidated statement of operations withcash flows for the exceptionsix months ended June 30, 2018 to reflect the correction of the aggregate impairment charges of leasehold improvementserror, which had no impact to net cash provided by operating activities, net cash used in investing activities and other fixed assetsnet cash provided by financing activities in the surrendered spaces of approximately $5.7 million which were included in generalperiod.
12. Commitments and administrative expense.
In the aggregate, the termination of these two leases reduced future required rental payments by approximately $23 million through 2026.
Contingencies
Concentrations of Credit Risk
Financial instruments that potentially subject us to significant concentrations of credit risk consist principally of cash, cash equivalents, restricted cash and loans. We hold cash, cash equivalents and restricted cash in accounts at regulated domestic financial institutions in amounts that exceed or may exceed FDIC insured amounts and at non-U.S. financial institutions where deposited amounts may be uninsured. We believe these institutions to be of recognized standingacceptable credit quality and we have not experienced any related losses to date.
We are exposed to default risk on loans we originate and hold and that we purchase from our issuing bank partner. We perform an evaluation of each customer's financial condition and during the term of the customer's loan(s), we have the contractual right to limit a customer's ability to take working capital loans or other financing from other lenders that may cause a material adverse change in the financial condition of the customer.
Contingencies
From time to time we are subject to legal proceedings and claims in the ordinary course of business. The results of such matters cannot be predicted with certainty. However, we believe that the final outcome of any such current matters will not result in a material adverse effect on our consolidated financial condition, consolidated results of operations or consolidated cash flows.
13. Subsequent Events
On July 19, 2019, we increased the commitment under our corporate revolving debt facility by $20 million to an aggregate commitment amount of $105 million. The facility's interest rate of 1-month LIBOR plus 3.0% and the final maturity date in January 2021 did not change.
|
| |
| Item 2. | Management’s Discussion and Analysis of Financial Condition and Results of Operations |
You should read the following discussion and analysis of our financial condition and results of operations together with our unaudited condensed consolidated financial statements and the related notes, and other financial information included elsewhere in this report. Some of the information contained in this discussion and analysis, including information with respect to our plans and strategy for our business, includes forward-looking statements that involve risks and uncertainties. You should review the “Cautionary Note Regarding Forward-Looking Statements” and Part II - Item 1A. "“Risk Factors”Factors sections of this report for a discussion of important factors that could cause actual results to differ materially from the results described in, or implied by, the forward-looking statements contained in the following discussion and analysis.
CAUTIONARY NOTE REGARDING FORWARD-LOOKING STATEMENTS
This report contains forward-looking statements within the meaning of the Private Securities Litigation Reform Act of 1995 and other legal authority. These forward-looking statements concern our operations, economic performance, financial condition, goals, beliefs, future growth strategies, objectives, plans and current expectations.
Forward-looking statements appear throughout this report including in Part I - Item 2. Management’s Discussion and Analysis of Financial Condition and Results of Operations, Part II - Item 1. Legal Proceedings and Part II - Item 1A. Risk Factors. Forward-looking statements can generally be identified by words such as “will,” “enables,” “expects,” “intends,” “may,”"intends," "may," “allows,” “plan,”"plan," “continues,” “believes,” “anticipates,” “estimates” or similar expressions.
Forward-looking statements are neither historical facts nor assurances of future performance. They are based only on our current beliefs, expectations and assumptions regarding the future of our business, anticipated events and trends, the economy and other future conditions. As such, they are subject to inherent uncertainties, risks and changes in circumstances that are difficult to predict and in many cases outside our control. Therefore, you should not rely on any of these forward-looking statements. Our expected results may not be achieved, and actual results may differ materially from our expectations.
Important factors that could cause or contribute to such differences include risks relating to: (1) our ability to attract potential customers to our platform and broaden our distribution capabilities and offerings; the degree to which potential customers apply for loans, are approved and borrow from us; anticipated trends, growth rates, loan originations, volume of loans sold and challenges in our business andachieve consistent profitability in the marketsfuture in which we operate; the abilitylight of our customers to repay loansprior loss history and competition; (2) our ability to accurately assess creditworthiness; our ability to adequately forecast and reserve for loan losses; the impact of our decision to tighten our credit policies; our liquidity and working capital requirements, including the availability and pricing of new debt facilities, extensions and increases to existing debt facilities, increases in our corporate line of credit, securitizations and OnDeck Marketplace®sales to fund our existing operations and planned growth, including the consequences of having inadequate resources to fund additional loans or draws on lines of credit; our reliance on our third-party service providers and the effect on our business of originating loans without third-party funding sources; the impact of increased utilization of cash or incurred debt to fund originations; the effect on our business of utilizing cash for voluntary loan purchases from third parties; the effect on our business of the current credit environment and increases in interest rate benchmarks; our ability to hire and retain necessary qualified employees in a competitive labor market; practices and behaviors of members of our funding advisor channel and other third parties who may refer potential customers to us; changes in our product distribution channel mix and/or our funding mix; our ability to anticipate market needs and develop new and enhanced offerings to meet those needs; lack of customer acceptance of possible increases in interest rates and origination fees on loans; maintaining and expanding our customer base; the impact of competition in our industry and innovation by our competitors; our anticipated and unanticipated growth and growth strategies, including the introduction of new products or features, expanding the availability of our platform to other lenders through our wholly-owned ODX, subsidiary and possiblemaintaining ODX’s current clients or losing a significant ODX client, expansion in new or existinginto international markets, offering equipment financing and our ability to effectively manage thatand fund our growth; (3) possible future acquisitions of complementary assets, businesses, technologies or products with the goal of growing our reputation and possible adverse publicity about us or our industry; the availability and cost of our funding, including challenges in replacing existing debt facilities and arranging funding for new types of loans; the impact of funding loans from our cash reserves; locating funding sources for new types of loans that are ineligible for funding under our existing credit or securitization facilitiesbusiness, and the possibilityintegration of reducing originations of these loan types; the effect of potential selective pricing increases; our expected utilization of OnDeck Marketplace and the available OnDeck Marketplace premiums; our failure to anticipate or adapt to future changesany such acquisitions including Evolocity Financial Group; (4) any material reduction in our industry; the impact of the Tax Cuts and Jobs Act of 2017 and any related Treasury regulations, rules or interpretations, if and when issued; our ability to offer loans to our small business customers that have terms that are competitive with alternative sources of capital; our ability to issue new loans to existing customers that seek additional capital; the evolution of technology affecting our offerings and our markets; our compliance with applicable local, state and federal and non-U.S. laws, rules and regulations and their application and interpretation, whether existing, modified or new; our ability to adequately protect our intellectual property; the effect of litigation or other disputes to which we are or may be a party; the increased expenses and administrative workload associated with being a public company; the unenforceability of choice of law
provisions in our loan agreements and any potential violation of state interest rate limit laws;spread and our ability to successfully evaluate, consummatemitigate this risk through interest rate hedging or raising interest rates or other means; (5) worsening economic conditions that may result in decreased demand for our loans or services and integrate acquisitions; failure to maintain an effective systemincrease our customers’ default rates; (6) supply and demand driven changes in credit and increases in the availability of internal controls necessarycapital for our competitors that negatively impacts our loan pricing; (7) our ability to accurately report our financial resultsassess creditworthiness and prevent fraud; the estimatesforecast and estimate methodologies used in preparing our consolidated financial statements; the future trading prices of our common stock, and the impact of securities analysts’ reports and shares eligiblereserve for future sale on these prices;loan losses; (8) our ability to prevent or discover security breaches, disruption in service and comparable events that could compromise the personal and confidential information held in our data systems reduce the attractiveness of our platform or adversely impact our ability to service our loans;loans; (9) incorrect or fraudulent information provided to us by customers causing us to misjudge their qualifications to receive a loan; (10) the impacteffectiveness of our efforts to identify, manage and mitigate our credit, market, liquidity, operational and other risks associated with our business and strategic objectives; (11) our ability to continue to innovate or respond to evolving technological changes and protect our intellectual property; (12) our reputation and possible adverse publicity about us or our industry; (13) failure of operating controls, including customer or partner experience degradation, and related legal expenses, increased regulatory cost, rationalization programs;significant fraud losses and vendor risk; (14) changes in federal or state laws or regulations, or judicial decisions involving licensing or supervision of commercial lenders, interest rate limitations, the enforceability of choice of law provisions in loan agreements, the validity of bank sponsor partnerships, the use of brokers or other significant changes; (15) risks associated with pursuing a bank charter, either de novo or in a transaction, and risks associated with either failing to obtain or obtaining a bank charter; and other risks, including those described in Part I - Item 1A. “Risk Factors”Risk Factors in our Annual Report on Form 10-K for the year ended December 31, 20172018, Part II - Item 1A. Risk Factors in this report and other documents that we file with the Securities and Exchange Commission, or SEC, from time to time which are or will be available on the SEC website at www.sec.gov.
Except as required by law, we undertake no duty to update any forward-looking statements. Readers are also urged to carefully review and consider all of the information in this report, as well as the other documents we make available through the SEC’s website.
WhenIn this report, when we use the terms “OnDeck,” the “Company,” “we,” “us” or “our” in this report,“our,” we are referring to On Deck Capital, Inc. and its consolidated subsidiaries, and when we use the term "ODX" we are referring to our wholly-owned subsidiary ODX, LLC, in each case unless the context requires otherwise.
OnDeck, the OnDeck logo, OnDeck Score, OnDeck Marketplace, ODX and other trademarks or service marks of OnDeck appearing in this report are the property of OnDeck. Trade names, trademarks and service marks of other companies appearing in this report are the property of their respective holders, including FICO®, a registered trademark of Fair Issac Corporation and Chase Business Quick Capital®, a registered trademark of JPMorgan Chase Bank, National Association. We have generally omitted the ® and TM designations, as applicable, for the trademarks used in this report.
Overview
We are a leading online small business lender. We make it efficient and convenient for small businesses to access financing. Enabled by our proprietary technology and analytics, we aggregate and analyze thousands of data points from dynamic, disparate data sources to assess the creditworthiness of small businesses rapidly and accurately. Small businesses can apply for a term loan or line of creditfinancing on our website in minutes and, using our loan decision process, including our proprietary OnDeck Score®Score®, we can make a funding decision immediately and, if approved, transfer fundsfund as fast as one business day.24 hours. We have originated more than $12 billion of loans since we made our first loan in 2007.
We have offered term loans since we made our first loan in 2007, lines of credit since 2013 and this year have begun offering equipment finance loans and, in Canada, merchant cash advances through Evolocity Financial Group with whom we combined operations on April 1, 2019. Our term loans range from $5,000 to $500,000, have maturities of 3 to 36 months and feature fixed dollar repayments. Our lines of credit range from $6,000 to $100,000, and are generally repayable within 6 or 12 months of the date of the most recent draw. We are generally targeting equipment finance loans from $5,000 to $150,000, with maturities of 2 to 5 years as we develop this offering, although we may offer larger loans in cases we deem appropriate. Qualified customers may have both a term loan and line of creditmultiple financings with us concurrently, which we believe provides opportunities for repeat business, as well as increased value to our customers.
We originate loans throughout the United States, Canada and Australia, although, to date, the majority of our revenue has been generated in the United States. These loans are originated more than $10 billion of loans since we madethrough our first loan in 2007.direct marketing channel, including direct mail, our outbound sales team, our social media and other online marketing channels; referrals from our strategic partner channel, including small business-focused service providers, payment processors, and other financial institutions; and through independent funding advisor program partners, or FAPs, who advise small businesses on available funding options.
We generate the majority of our revenue through interest income and fees earned on the loans we make to our customers. Our term loans, which we offer in principal amounts ranging from $5,000 to $500,000 and with maturities of 3 to 36 months, feature fixed dollar repayments. Our lines of credit range from $6,000 to $100,000, and are generally repayable within six months of the date of the most recent draw. We earn interest on the balance outstanding and lines of credit are subject to a monthly fee unless the customer makes a qualifying minimum draw, in which case the fee is waived for the first six months. The balance of our other revenue primarily comes from our servicing and other fee income, most of which consists of marketing fees from our issuing bank partner, fees generated by OnDeck-as-a-Service through our wholly-owned subsidiary, ODX, and monthly fees earned from lines of credit.
We rely on a diversified set of funding sources for the loans we make to our customers. Our primary source of this financing has historically been debt facilities with various financial institutions.institutions and securitizations. We have also used proceeds from operating cash flow to fund loans in the past and continue to finance a portion of our outstanding loans with these funds. As of SeptemberJune 30, 2018,2019, we had $818.5$848.8 million of funding debt principal outstanding and $1.0$1.2 billion total borrowing capacity undercapacity.
Recent Developments
On April 1, 2019, we combined our Canadian operations with Evolocity Financial Group, or Evolocity, a Montreal-based online small business lender. The purpose of the transaction was to accelerate the growth of our Canadian operations and to enable us to provide a broader range of financing options to Canadian small businesses nationwide. In the transaction, Evolocity contributed its business to a holding company, and we contributed our Canadian business plus cash to that holding company such debt facilities. No loans were sold through OnDeck Marketplace duringthat we own a 58.5% majority interest in the nine months ended September 30, 2018. Duringholding company. The remainder is owned by former Evolocity stockholders. The financial position and results of operations of Evolocity as of and for the three months ended June 30, 2019 are included in our consolidated financial statements and nine months ended September 30, 2017,other financial data contained within this quarterly report on Form 10-Q.
On July 29, 2019 we sold loansmade several important announcments. We announced that our Board of Directors authorized the repurchase of up to $50 million of common stock with an unpaid principal balancethe shares to be retained in Treasury and available for possible reissuance. Any share repurchases under the program will be made from time to time in the open market, in privately negotiated transactions or otherwise. The timing and amount of $5.3 millionany share repurchases will be subject to market conditions and $55.5 million, respectively. Ofother factors as we may determine. The repurchase authorization expires August 31, 2020, however, we may suspend, modify or discontinue the total principal outstanding as of September 30, 2018, includingprogram at any time in our loans held for investment, plus loans sold to OnDeck Marketplace purchasers which had a balance remaining as of September 30, 2018, 65% were funded via our debt facilities, 23% were financed via proceeds raised from our securitization transaction, 11% were funded via cash on hand and 1% were funded via OnDeck Marketplace purchasers.discretion without prior notice.
We also announced that JPMorgan Chase Bank, National Association, informed us that effective August 3, 2019, they no longer intend to originate new small business loans throughoutthrough our platform. We will continue to service the United States, Canada and Australia, although, to date, substantially all of our revenue has been generated in the United States. These loans arethey previously originated through our direct marketing, including direct mail, social mediaplatform and other online marketing channels, outbound sales team, referrals from our strategic partners, including banks, payment processorsbe entitled to receive related servicing revenue for up to two years. We recorded a charge of approximately $0.9 million during the three months ended June 30, 2019 related to the impairment of certain capitalized software built for and small business-focused service providers, anddedicated to their originations.
Additionally, we announced that we decided to pursue obtaining a bank charter, either de novo or through funding advisors who advise small businesses on available funding options.
a transaction.
Key Financial and Operating Metrics
We regularly monitor a number of metrics in order to measure our current performance and project our future performance. These metrics aid us in developing and refining our growth strategies and making strategic decisions.
| | | | As of and for the Three Months Ended September 30, | | As of and for the Nine Months Ended September 30, | As of or for the Three Months Ended June 30, |
| As of or for the Six Months Ended June 30, |
| | 2018 | | 2017 | | 2018 | | 2017 | 2019 | | 2018 | | 2019 | | 2018 |
| | (dollars in thousands) | | (dollars in thousands) | (dollars in thousands) | | (dollars in thousands) |
| Originations | $647,796 | | $530,926 | | $1,825,109 | | $1,568,303 | $ | 591,848 |
| | $ | 586,728 |
| | $ | 1,227,354 |
| | $ | 1,177,313 |
|
| Effective Interest Yield | 36.5 | % | | 33.1 | % | | 36.1 | % | | 33.5 | % | |
Portfolio Yield (a) | | 35.0 | % | | 36.1 | % | | 35.3 | % | | 35.8 | % |
| Cost of Funds Rate | 6.0 | % | | 6.4 | % | | 6.5 | % | | 6.2 | % | 5.5 | % | | 6.6 | % | | 5.4 | % | | 6.7 | % |
| Net Interest Margin* | 32.9 | % | | 28.9 | % | | 32.1 | % | | 29.5 | % | |
Marketplace Gain on Sale Rate | N/A |
| | 2.7 | % | | N/A |
| | 3.3 | % | |
Net Interest Margin (a) | | 29.0 | % | | 28.2 | % | | 29.3 | % | | 28.1 | % |
| Provision Rate | | 7.3 | % | | 5.7 | % | | 7.0 | % | | 5.9 | % |
| Reserve Ratio | 12.2 | % | | 11.1 | % | | 12.2 | % | | 11.1 | % | 12.3 | % | | 12.1 | % | | 12.3 | % | | 12.1 | % |
| Provision Rate | 6.0 | % | | 7.5 | % | | 6.0 | % | | 7.8 | % | |
| 15+ Day Delinquency Ratio | 6.4 | % | | 7.5 | % | | 6.4 | % | | 7.5 | % | 8.5 | % | | 6.8 | % | | 8.5 | % | | 6.8 | % |
| Net Charge-off Rate | 11.1 | % | | 16.9 | % | | 11.1 | % | | 16.8 | % | 15.1 | % | | 11.2 | % | | 13.6 | % | | 11.1 | % |
Efficiency Ratio (a) | | 47.1 | % | | 47.5 | % | | 45.5 | % | | 48.4 | % |
Adjusted Efficiency Ratio* (a) | | 44.2 | % | | 43.1 | % | | 42.6 | % | | 41.7 | % |
Return on Assets (a) | | 1.4 | % | | 2.2 | % | | 1.6 | % | | 0.7 | % |
Adjusted Return On Assets* (a) | | 2.2 | % | | 3.7 | % | | 2.5 | % | | 3.1 | % |
Return on Equity (a) | | 5.5 | % | | 8.4 | % | | 6.5 | % | | 2.7 | % |
Adjusted Return On Equity* (a) | | 8.8 | % | | 14.7 | % | | 9.8 | % | | 12.1 | % |
(a) The prior period metrics have been updated to reflect the impact of the revision. We believe the impact of the revision to each affected KPI is not meaningful with no impact being greater than 20 basis points. See Note 1 of Notes to Unaudited Condensed Consolidated Financial Statements.
*Non-GAAP measure. Refer to "Non-GAAP Financial Measures" below for an explanation and reconciliation to GAAP.
Originations
Originations represent the total principal amount of the term loans weLoans made during the period plus the total amount drawnadvanced on lines of credit during the period.other finance receivables. Many of our repeat term loan customers renew their term loanloans before their existing term loan is fully repaid. In accordance with industry practice, originations of such repeat term loans are presented as the full renewal loan principal, rather than the net funded amount, which would be the renewal term loan’s principal net of the unpaid principal balanceUnpaid Principal Balance on the existing term loan. Loans referred to, and originatedfunded by, our issuing bank partner and later purchased by us are included as part of our originations.
Effective InterestUnpaid Principal Balance represents the total amount of principal outstanding on Loans held for investment, plus outstanding advances relating to other finance receivables and the amortized cost of loans purchased from other than our issuing bank partner at the end of the period. It excludes net deferred origination costs, allowance for credit losses and any loans sold or held for sale at the end of the period.
Portfolio Yield
Effective InterestPortfolio Yield is the rate of interestreturn we achieve on loansLoans and finance receivables outstanding during a period. It is calculated as our calendar day-adjusted annualized interestInterest and finance income on Loans and finance receivables including amortization of net deferred origination costs divided by average loans. Prior to the first quarter of 2018, annualization was based on 252 business days per year. Beginning with the three months ended March 31, 2018, annualizationloans and finance receivables. Annualization is based on 365 days per year and is calendar day-adjusted. All revisions have been applied retrospectively.Loans and finance receivables represents the sum of term loans, lines of credit, equipment finance loans and finance receivables. Portfolio Yield replaces our previous metric, Loan Yield in order to include other finance receivables.
Net deferred origination costs in loansLoans and finance receivables held for investment and loans held for sale consist of deferred origination fees and costs. Deferred origination fees include fees paid up front to us by customers when loansLoans and finance receivables are originated and decrease the carrying value of loans,Loans and finance receivables, thereby increasing Effective InterestPortfolio Yield. Deferred origination costs are limited to costs directly attributable to originating loans and finance receivables such as commissions,
vendor costs and personnel costs directly related to the time spent by the personnel performing activities related to loan originationoriginations and increase the carrying value of loans and finance receivables, thereby decreasing Effective InterestPortfolio Yield.
Recent pricing trends are discussed under the subheading “Key Factors Affecting Our Performance - Pricing.”
Cost of Funds Rate
Cost of Funds Rate is calculated as interest expense divided by average debt outstanding for the period. For periods of less than one year, the metric is annualized based on four quarters per year and is not business day or calendar day-adjusted.
Net Interest Margin
Net Interest Margin is calculated as annualized net interest and finance income divided by average Interest Earning Assets. Net interest and finance income represents Interest and finance receivable income less Interest expense during the period. Annualization is based on 365 days per year and is calendar day-adjusted. Interest and finance receivable income is net of fees on loans held for investment and loans held for sale. Interest expense is the interest expense, fees, and amortization of deferred debt issuance costs we incur in connection with our lending activities across all of our funding debt facilities. For full years, it is calculated as our funding cost divided by average funding debt outstanding and for interim periods it is calculated as our annualized funding cost for the period divided by average funding debt outstanding. Annualization is based on four quarters per year and is not business or calendar day-adjusted.
Net Interest Margin
Net Interest Margin is calculated as annualized Net Interest Income divided by average Interest Earning Assets. Net Interest IncomeAssets represents interest income less funding costs during the period. Interest income is netsum of fees on loans held for investmentLoans and held for sale. Net deferred origination costs in loans held for investmentfinance receivables plus Cash and loans held for sale consist of deferred origination costs as offset by corresponding deferred origination fees. Deferred origination fees include fees paid up front to us by customers when loans are funded. Deferred origination costs are limited to costs directly attributable to originating loans such as commissions, vendor costs and personnel costs directly related to the time spent by the personnel performing activities related to loan origination.
Funding costs are the interest expense, fees, and amortization of deferred debt issuance costs we incur in connection with our lending activities across all of our debt facilities. Annualization is based on 365 days per year and is calendar day-adjusted.
Marketplace Gain on Sale Rate
Marketplace Gain on Sale Rate equals our gain on sale revenue from loans sold through OnDeck Marketplace divided by the carrying value of loans sold, which includes both unpaid principal balance sold and the remaining carrying value of the net deferred origination costs. A portion of any loans sold through OnDeck Marketplace may be loans which were initially designated as held for investment upon origination. The portion of such loans sold, if any, in a given period may vary materially depending upon market conditions and other circumstances.cash equivalents plus Restricted cash.
Reserve Ratio
Reserve Ratio is our allowance for loancredit losses as ofat the end of the period divided by the Unpaid Principal Balance as ofat the end of the period.
Provision Rate
Provision Rate equals the provision for loancredit losses for the period divided by the new originations volume of loans held for investment, net of originations of sales of such loans within the period. Because we reserve for probable credit losses inherent in the portfolio upon origination, this rate is significantly impacted by the expectation of credit losses for the period’s originations volume. This rate mayis also be impacted by changes in loss estimatesexpectations for loans and finance receivables originated prior to the commencement of the period.
All other things equal, an increased volume of loan rollovers and line of credit repayments and re-borrowings in a period will reduce the Provision Rate.
The Provision Rate is not directly comparable to the net cumulative lifetime charge-off ratio because (i) the Provision Rate reflects estimated losses at the time of origination while the net cumulative lifetime charge-off ratio reflects actual charge-offs, (ii) the Provision Rate includes provisions for losses on both term loansLoans and lines of creditfinance receivables while the net cumulative lifetime charge-off ratio reflects only charge-offs related to term loans and (iii) the Provision Rate for a period reflects the provision for losses related to all loans and finance receivables held for investment while the net cumulative lifetime charge-off ratio reflects lifetime charge-offs of term loans related to a particular cohort of term loans.
15+ Day Delinquency Ratio
15+ Day Delinquency Ratio equals the aggregate Unpaid Principal Balance for our loansLoans that are 15 or more calendar days pastcontractually passed due as of the end of the periodand for our finance receivables that are 15 or more payments behind schedule as a percentage of the Unpaid Principal Balance.Balance at the end of the period. The Unpaid Principal Balance for our loans and finance receivables that are 15 or more calendar days or payments past due includes loansLoans and finance receivables that are paying and non-paying. Because ourterm and line of credit loans require daily and weekly or daily repayments, excluding weekends and holidays, they may be deemed delinquent more quickly than loans from traditional lenders that require only monthly payments.
15+ Day Delinquency Ratio is not annualized, but reflects balances as ofat the end of the period.
Net Charge-off Rate
Net Charge-off Rate is calculated as our annualized net charge-offs for the period divided by the average Unpaid Principal Balance outstanding. Annualizationoutstanding during the period. Net charge-offs are charged-off loans and finance receivables in the period, net of recoveries of prior charged-off loans and finance receivables in the period. For periods of less than one year, the metric is annualized based on four quarters per year and is not business day or calendar day-adjusted.
Efficiency Ratio
Efficiency Ratio is a measure of operating efficiency and is calculated as Total operating expense for the period divided by Gross revenue for the period.
Adjusted Efficiency Ratio
Adjusted Efficiency Ratio is non-GAAP measure calculated as total operating expense divided by gross revenue for the period, adjusted to exclude (a) stock-based compensation expense and (b) items management deems to be non-representative of operating results or trends, all as shown in the non-GAAP reconciliation presentation of this metric. We believe Adjusted Efficiency Ratio is useful because it provides investors and others with a supplemental operating efficiency metric to present our operating
efficiency across multiple periods without the effects of stock-based compensation, which is a non-cash expense based on equity grants made to participants in our equity plans at specified prices and times but which does not necessarily reflect how our business is performing, and items which may only affect our operating results periodically. Our use of Adjusted Efficiency Ratio has limitations as an analytical tool and you should not consider it in isolation, as a substitute for or superior to our Efficiency Ratio, which is the most comparable GAAP metric. See Item 2. Management’s Discussion and Analysis of Financial Condition and Results of Operations—Non-GAAP Financial Measures for a discussion and reconciliation.
Return on Assets
Return on Assets is calculated as annualized net income (loss) attributable to On Deck Capital, Inc. common stockholders for the period divided by average total assets for the period. For periods of less than one year, the metric is annualized based on four quarters per year and is not business day or calendar day-adjusted.
Adjusted Return on Assets
Adjusted Return on Assets is a non-GAAP measure calculated as Adjusted Net Income (Loss) for the period divided by average total assets for the period. For periods of less than one year, the metric is annualized based on four quarters per year and is not business day or calendar day-adjusted. Net charge-offs are charged-off loansWe believe Adjusted Return on Assets is useful because it provides investors and others with a supplemental metric to assess our performance across multiple periods without the effects of stock-based compensation, which is a non-cash expense based on equity grants made to participants in our equity plans at specified prices and times but which does not necessarily reflect how our business is performing, and items which may only affect our operating results periodically, all as shown in the non-GAAP reconciliation presentation of this metric. Our use of Adjusted Return on Assets has limitations as an analytical tool and you should not consider it in isolation, as a substitute for or superior to Return on Assets, which is the most comparable GAAP metric. See Item 2. Management’s Discussion and Analysis of Financial Condition and Results of Operations—Non-GAAP Financial Measures for a discussion and reconciliation.
Return on Equity
Return on Equity is calculated as annualized net income (loss) attributable to On Deck Capital, Inc. common stockholders for the period divided by average total On Deck Capital, Inc. stockholders’ equity for the period. For periods of less than one year, the metric is annualized based on four quarters per year and is not business day or calendar day-adjusted.
Adjusted Return on Equity
Adjusted Return on Equity is a non-GAAP measure calculated as Adjusted Net Income (Loss) attributable to On Deck Capital, Inc. common stockholders for the period divided by average total On Deck Capital, Inc. stockholders’ equity for the period. For periods of less than one year, the metric is annualized based on four quarters per year and is not business day or calendar day-adjusted. We believe Adjusted Return on Equity is useful because it provides investors with a supplemental metric to assess our performance across multiple periods without the effects of stock-based compensation, which is a non-cash expense based on equity grants made to participants in our equity plans at specified prices and times but which does not necessarily reflect how our business is performing, and items which may only affect our operating results periodically, all as shown in the non-GAAP reconciliation presentation of this metric. Our use of Adjusted Return on Equity has limitations as an analytical tool and you should not consider it in isolation, as a substitute or superior to Return on Equity, which is the most comparable GAAP metric. See Item 2. Management’s Discussion and Analysis of Financial Condition and Results of Operations—Non-GAAP Financial Measures for a discussion and reconciliation of Adjusted Net Income (Loss) to net of recoveries.income (loss).
On Deck Capital, Inc. and Subsidiaries
Consolidated Average Balance Sheets
(in thousands)
| | | | | Average | | Average | | | | | | | |
| | | Three Months Ended September 30, | | Nine Months Ended September 30, | Three Months Ended June 30, | | Six Months Ended June 30, |
| | 2018 | | 2017 | | 2018 | | 2017 | 2019 | | 2018 | | 2019 | | 2018 |
| Assets | | | | | | | | | | | | | | | |
| Cash and cash equivalents | | $ | 55,851 |
| | $ | 59,530 |
| | $ | 50,004 |
| | $ | 58,595 |
| $ | 51,530 |
| | $ | 55,516 |
| | $ | 48,356 |
| | $ | 50,128 |
|
| Restricted cash | | 53,024 |
| | 58,659 |
| | 55,466 |
| | 59,316 |
| 45,677 |
| | 54,859 |
| | 47,258 |
| | 55,251 |
|
| Loans held for investment | | 1,081,259 |
| | 960,587 |
| | 1,030,403 |
| | 1,001,697 |
| |
| Less: Allowance for loan losses | | (129,804 | ) | | (103,397 | ) | | (122,319 | ) | | (109,486 | ) | |
| Loans held for investment, net | | 951,455 |
| | 857,190 |
| | 908,084 |
| | 892,211 |
| |
| Loans held for sale | | — |
| | — |
| | — |
| | 462 |
| |
| Loans and finance receivables | | 1,206,503 |
| | 1,025,337 |
| | 1,205,250 |
| | 1,003,845 |
|
| Less: Allowance for credit losses | | (146,612 | ) | | (121,899 | ) | | (146,002 | ) | | (118,290 | ) |
| Loans and finance receivables held for investment, net | | 1,059,891 |
| | 903,438 |
| | 1,059,248 |
| | 885,555 |
|
| Property, equipment and software, net | | 16,591 |
| | 25,919 |
| | 18,416 |
| | 27,480 |
| 17,413 |
| | 17,182 |
| | 17,064 |
| | 19,248 |
|
| Other assets | | 15,967 |
| | 17,843 |
| | 15,302 |
| | 18,483 |
| 58,022 |
| | 15,783 |
| | 48,404 |
| | 14,773 |
|
| Total assets | | $ | 1,092,888 |
| | $ | 1,019,141 |
| | $ | 1,047,272 |
| | $ | 1,056,547 |
| $ | 1,232,533 |
| | $ | 1,046,778 |
| | $ | 1,220,330 |
| | $ | 1,024,955 |
|
| Liabilities and equity | | | | | | | | | |
| Liabilities, mezzanine equity and stockholders' equity | | | | | | | | |
| Liabilities: | | | | | | | | | | | | | | | |
| Accounts payable | | $ | 4,318 |
| | $ | 3,077 |
| | $ | 3,607 |
| | $ | 3,377 |
| $ | 5,120 |
| | $ | 3,627 |
| | $ | 5,121 |
| | $ | 3,269 |
|
| Interest payable | | 2,402 |
| | 2,300 |
| | 2,388 |
| | 2,322 |
| 2,812 |
| | 2,519 |
| | 2,718 |
| | 2,407 |
|
| Funding debt | | 771,483 |
| | 710,601 |
| | 733,601 |
| | 737,864 |
| |
| Corporate debt | | — |
| | 11,078 |
| | 1,783 |
| | 20,213 |
| |
| Debt | | 834,582 |
| | 737,099 |
| | 835,926 |
| | 717,662 |
|
| Accrued expenses and other liabilities | | 31,645 |
| | 32,277 |
| | 31,004 |
| | 33,786 |
| 63,690 |
| | 31,400 |
| | 59,792 |
| | 32,257 |
|
| Total liabilities | | 809,848 |
| | 759,333 |
| | 772,383 |
| | 797,562 |
| 906,204 |
| | 774,645 |
| | 903,557 |
| | 755,595 |
|
| | | | | | | | | | |
| Mezzanine equity: | | | | | | | | |
Redeemable noncontrolling interest (1) | | 11,634 |
| | — |
| | 6,647 |
| | — |
|
| Stockholders’ equity: | | | | | | | | |
| Total On Deck Capital, Inc. stockholders' equity | | 277,570 |
| | 254,731 |
| | 269,924 |
| | 253,716 |
| 310,858 |
| | 266,711 |
| | 305,990 |
| | 264,585 |
|
| Noncontrolling interest | | 5,470 |
| | 5,077 |
| | 4,965 |
| | 5,269 |
| 3,837 |
| | 5,422 |
| | 4,136 |
| | 4,775 |
|
| Total equity | | 283,040 |
| | 259,808 |
| | 274,889 |
| | 258,985 |
| |
| Total liabilities and equity | | $ | 1,092,888 |
| | $ | 1,019,141 |
| | $ | 1,047,272 |
| | $ | 1,056,547 |
| |
| Total stockholders' equity | | 314,695 |
| | 272,133 |
| | 310,126 |
| | 269,360 |
|
| Total liabilities, mezzanine equity and stockholders' equity | | $ | 1,232,533 |
| | $ | 1,046,778 |
| | $ | 1,220,330 |
| | $ | 1,024,955 |
|
| | | | | | | | | | | | | | | | |
| Memo: | | | | | | | | | | | | | | | |
| Unpaid Principal Balance | | $ | 1,060,222 |
| | $ | 944,372 |
| | $ | 1,011,155 |
| | $ | 983,230 |
| $ | 1,183,056 |
| | $ | 1,006,133 |
| | $ | 1,180,831 |
| | $ | 985,321 |
|
| Interest Earning Assets | | $ | 1,060,222 |
| | $ | 944,372 |
| | $ | 1,011,155 |
| | $ | 983,689 |
| $ | 1,303,709 |
| | $ | 1,135,713 |
| | $ | 1,300,864 |
| | $ | 1,109,224 |
|
| Loans | | $ | 1,081,259 |
| | $ | 960,587 |
| | $ | 1,030,403 |
| | $ | 1,002,159 |
| |
| Loans and Finance Receivables | | $ | 1,206,503 |
| | $ | 1,025,337 |
| | $ | 1,205,250 |
| | $ | 1,003,845 |
|
(1) The six months ended balance only includes a balance for three months related to the Evolocity business combination which occurred on April 1, 2019.
Average Balance Sheet Itemsline items for the period represent monthly averages based onthe average of the balance at the beginning of the first month of the period and the ending period balances.end of each month in the period.
Non-GAAP Financial Measures
We believe that the non-GAAP metrics can provide useful supplemental measures for period-to-period comparisons of our core business and useful supplemental information to investors and others in understanding and evaluating our operating results.
However, non-GAAP metrics are not calculated in accordance with GAAP, and should not be considered an alternative to any measures of financial performance calculated and presented in accordance with GAAP. Other companies may calculate these non-GAAP metrics differently than we do. The reconciliations below reconcile each of our non-GAAP metrics to their most comparable respective GAAP metric.
Adjusted Net Income (Loss) and Adjusted Net Income (Loss) per Share
Adjusted Net Income (Loss) represents our net income (loss) adjusted to exclude net income (loss) attributable to noncontrolling interest, stock-based compensation expense, real estate disposition charges, and severance and executive transition expenses.OnDeck adjusted to exclude the items shown in the table below. Stock-based compensation includes employee compensation as well as compensation to third-party service providers. Adjusted Net Income (Loss) per Share is calculated by dividing Adjusted Net Income (Loss) by the weighted average common shares outstanding during the period.
Our use of Adjusted Net Income (Loss) has limitations as an analytical tool, and you should not consider it in isolation or as a substitute for analysis of our results as reported under GAAP. Some of these limitations are:
Adjusted Net Income (Loss) does not reflect the potentially dilutive impact of stock-based compensation; and
Adjusted Net Income (Loss) excludes charges we are required to incur in connection with real estate dispositions, severance obligations, and debt extinguishment costs.costs and sales tax refunds.
The following table presents a reconciliationtables present reconciliations of net lossincome (loss) to Adjusted Net Income (Loss) and net income (loss) per share to Adjusted Net Income (Loss) per Share for each of the periods indicated:
| | | | Three Months Ended September 30, | | Nine Months Ended September 30, | Three Months Ended June 30, | | Six Months Ended June 30, |
| | 2018 | | 2017 | | 2018 | | 2017 | 2019 | | 2018 | | 2019 | | 2018 |
| | (in thousands) | | (in thousands) | (in thousands, except shares and per share data) | | (in thousands, except shares and per share data) |
| Reconciliation of Net Income (Loss) Attributable to OnDeck to Adjusted Net Income (Loss) | | | | | | | | | | | | | | |
| Net income (loss) attributable to On Deck Capital, Inc. common stockholders | $ | 9,769 |
| | $ | (4,074 | ) | | $ | 13,642 |
| | $ | (16,630 | ) | $ | 4,295 |
| | $ | 5,628 |
| | $ | 9,961 |
| | $ | 3,571 |
|
| Adjustments: | | | | | | | | |
| Adjustments (after tax): | | | | | | | | |
| Stock-based compensation expense | 2,848 |
| | 3,056 |
| | 8,852 |
|
| 9,521 |
| 2,581 |
| | 2,794 |
| | 5,017 |
| | 6,004 |
|
| Real estate disposition charges | — |
| | — |
| | 4,187 |
| | — |
| — |
| | — |
| | — |
| | 4,187 |
|
| Severance and executive transition expenses | — |
| | — |
| | 911 |
| | 3,183 |
| — |
| | — |
| | — |
| | 911 |
|
| Debt Extinguishment Costs | 550 |
| | — |
| | 1,935 |
| | — |
| |
| Adjusted Net income (loss) | $ | 13,167 |
| | $ | (1,018 | ) | | $ | 29,527 |
| | $ | (3,926 | ) | |
| Debt extinguishment costs | | — |
| | 1,384 |
| | — |
| | 1,384 |
|
| Adjusted Net Income (Loss) | | $ | 6,876 |
| | $ | 9,806 |
| | $ | 14,978 |
| | $ | 16,057 |
|
| | | | | | | | | | | | | | | |
| Adjusted Net income (loss) per share: | | | | | | | | |
| Adjusted Net Income (Loss) per share: | | | | | | | | |
| Basic | $ | 0.18 |
| | $ | (0.01 | ) | | $ | 0.40 |
| | $ | (0.05 | ) | $ | 0.09 |
| | $ | 0.13 |
| | $ | 0.20 |
| | $ | 0.22 |
|
| Diluted | $ | 0.17 |
| | $ | (0.01 | ) | | $ | 0.38 |
| | $ | (0.05 | ) | $ | 0.09 |
| | $ | 0.13 |
| | $ | 0.19 |
| | $ | 0.21 |
|
| Weighted-average common shares outstanding: | | | | | | | | | | | | | | |
| Basic | 74,715,592 |
| | 73,272,085 |
| | 74,362,211 |
| | 72,613,221 |
| 76,137,751 |
| | 74,385,446 |
| | 75,840,604 |
| | 74,182,929 |
|
| Diluted | 79,372,491 |
| | 73,272,085 |
| | 78,314,719 |
| | 72,613,221 |
| 78,901,601 |
| | 78,288,267 |
| | 79,013,757 |
| | 77,786,748 |
|
Below are reconciliations of the Adjusted Net income (loss) per basic and diluted share to the most directly comparable measures calculated in accordance with GAAP.
| | | | Three Months Ended September 30, | | Nine Months Ended September 30, | Three Months Ended June 30, | | Six Months Ended June 30, |
| | 2018 | | 2017 | | 2018 | | 2017 | 2019 | | 2018 | | 2019 | | 2018 |
| | (per share) | | (per share) | (per share) | | (per share) |
| Reconciliation of Net Income (Loss) per Basic Share to Adjusted Net Income (Loss) per Basic Share | | | | | | | | |
| Net income (loss) per basic share attributable to On Deck Capital, Inc. common stockholders | $ | 0.13 |
| | $ | (0.06 | ) | | $ | 0.18 |
| | $ | (0.23 | ) | $ | 0.06 |
| | $ | 0.08 |
| | $ | 0.13 |
| | $ | 0.05 |
|
| Add / (Subtract): | | | | | | | | | | | | | | |
| Stock-based compensation expense | 0.04 |
| | 0.05 |
| | 0.12 |
| | 0.13 |
| 0.03 |
| | 0.04 |
| | 0.07 |
| | 0.08 |
|
| Real estate disposition charges | — |
| | — |
| | 0.06 |
| | — |
| — |
| | — |
| | — |
| | 0.06 |
|
| Severance and executive transition expenses | — |
| | — |
| | 0.01 |
| | 0.05 |
| — |
| | — |
| | — |
| | 0.01 |
|
| Debt Extinguishment Costs | 0.01 |
| | — |
| | 0.03 |
| | — |
| |
| Adjusted Net income (loss) per basic share | $ | 0.18 |
| | $ | (0.01 | ) | | $ | 0.40 |
| | $ | (0.05 | ) | |
| Debt extinguishment costs | | — |
| | 0.01 |
| | — |
| | 0.02 |
|
| Adjusted Net Income (Loss) per Basic Share | | $ | 0.09 |
| | $ | 0.13 |
| | $ | 0.20 |
| | $ | 0.22 |
|
| | | | Three Months Ended September 30, | | Nine Months Ended September 30, | Three Months Ended June 30, | | Six Months Ended June 30, |
| Diluted | 2018 | | 2017 | | 2018 | | 2017 | |
| | (per share) | | (per share) | 2019 | | 2018 | | 2019 | | 2018 |
| | | (per share) | | (per share) |
| Reconciliation of Net Income (Loss) per Diluted Share to Adjusted Net Income (Loss) per Diluted Share | | | | | | | | |
| Net income (loss) per diluted share attributable to On Deck Capital, Inc. common stockholders | $ | 0.12 |
| | $ | (0.06 | ) | | $ | 0.17 |
| | $ | (0.23 | ) | $ | 0.05 |
| | $ | 0.07 |
| | $ | 0.13 |
| | $ | 0.05 |
|
| Add/ (Subtract): | | | | | | | | |
| Add / (Subtract): | | | | | | | | |
| Stock-based compensation expense | 0.04 |
| | 0.05 |
| | 0.12 |
| | 0.13 |
| 0.04 |
| | 0.04 |
| | 0.06 |
| | 0.08 |
|
| Real estate disposition charges | — |
| | — |
| | 0.05 |
| | — |
| — |
| | — |
| | — |
| | 0.05 |
|
| Severance and executive transition expenses | — |
| | — |
| | 0.01 |
| | 0.05 |
| — |
| | — |
| | — |
| | 0.01 |
|
| Debt Extinguishment Costs | 0.01 |
| | — |
| | 0.03 |
| | — |
| |
| Adjusted Net income (loss) per diluted share | $ | 0.17 |
| | $ | (0.01 | ) | | $ | 0.38 |
| | $ | (0.05 | ) | |
| Debt extinguishment costs | | — |
| | 0.02 |
| | — |
| | 0.02 |
|
| Adjusted Net Income (Loss) per Diluted Share | | $ | 0.09 |
| | $ | 0.13 |
| | $ | 0.19 |
| | $ | 0.21 |
|
Net Interest Margin
Net Interest MarginAdjusted Efficiency Ratio
Adjusted Efficiency Ratio is non-GAAP measure calculated as annualized Net Interest Incometotal operating expense divided by gross revenue for the period, adjusted to exclude (a) stock-based compensation expense and (b) items management deems to be non-representative of operating results or trends.
|
| | | | | | | | | | | | | | | |
| | Three Months Ended June 30, | | Six Months Ended June 30, |
| | 2019 | | 2018 | | 2019 | | 2018 |
| | (in thousands) | | (in thousands) |
| Reconciliation of Efficiency Ratio to Adjusted Efficiency Ratio | | | | | | | |
| Total operating expense | $ | 51,950 |
| | $ | 45,306 |
| | $ | 100,234 |
| | $ | 89,857 |
|
| Gross revenue | $ | 110,246 |
| | $ | 95,456 |
| | $ | 220,221 |
| | $ | 185,596 |
|
| Efficiency Ratio | 47.1 | % | | 47.5 | % | | 45.5 | % | | 48.4 | % |
| Adjustments (pre-tax): | | | | | | | |
| Stock-based compensation expense | $ | 3,249 |
| | $ | 2,794 |
| | $ | 6,331 |
| | $ | 6,004 |
|
| Real estate disposition charges | — |
| | — |
| | — |
| | 4,187 |
|
| Severance and executive transition expenses | — |
| | — |
| | — |
| | 911 |
|
| Debt extinguishment costs | — |
| | 1,384 |
| | — |
| | 1,384 |
|
| Operating expenses less noteworthy items | $ | 48,701 |
| | $ | 41,128 |
| | $ | 93,903 |
| | $ | 77,371 |
|
| Gross revenue | $ | 110,246 |
| | $ | 95,456 |
| | $ | 220,221 |
| | $ | 185,596 |
|
| Adjusted Efficiency Ratio | 44.2 | % | | 43.1 | % | | 42.6 | % | | 41.7 | % |
Adjusted Return on Assets
Adjusted Return on Assets represents net income (loss) attributable to OnDeckadjusted to exclude the items shown in the table below divided by average Interest Earning Assets. Net Interest Income represents interest income less funding costs during the period. Funding costs are the interest expense, fees, and amortization of deferred debt issuance costs we incur in connection with our lending activities across all of our debt facilities. Annualization is based on 365 days per year and is calendar day-adjusted.
Our use of Net Interest Margin has limitations as an analytical tool, and you should not consider it in isolation or as a substitute for analysis of our results as reported under GAAP. Some of these limitations are:
Net Interest Margin is the rate of net return we achieve on our Average Interest Earning Assets outstanding during a period. It only includes interest income and funding costs and excludes all other revenues and operating expenses. As a result, it does not represent our overall financial results or profitability.
Funding costs do not reflect interest associated with debt used for corporate purposes.
The following table presents a reconciliation of interest income to Net Interest Margin for each of the periods indicated:total assets.
|
| | | | | | | | | | | | | | | |
| | Three Months Ended September 30, | | Nine Months Ended September 30, |
| | 2018 | | 2017 | | 2018 | | 2017 |
| | (in thousands) | | (in thousands) |
| Reconciliation of Interest Income to Net Interest Margin (NIM) | | | | | | | |
| Interest income | $ | 99,476 |
| | $ | 80,122 |
| | $ | 278,216 |
| | $ | 250,954 |
|
| Less: Funding costs | (11,665 | ) | | (11,330 | ) | | (35,688 | ) | | (34,223 | ) |
| Net interest income | 87,811 |
| | 68,792 |
| | 242,528 |
|
| 216,731 |
|
| Divided by: calendar days in period | 92 |
| | 92 |
| | 273 |
| | 273 |
|
| Net interest income per calendar day | 955 |
| | 748 |
|
| 888 |
|
| 794 |
|
| Multiplied by: calendar days per year | 365 |
| | 365 |
| | 365 |
| | 365 |
|
| Annualized net interest income | 348,575 |
| | 273,020 |
| | 324,120 |
| | 289,810 |
|
| Divided by: Average Interest Earning Assets | $1,060,222 | | $944,372 | | $1,011,155 | | $983,689 |
| Net Interest Margin (NIM) | 32.9 | % | | 28.9 | % | | 32.1 | % |
| 29.5 | % |
|
| | | | | | | | | | | | | | | |
| | Three Months Ended June 30, | | Six Months Ended June 30, |
| | 2019 | | 2018 | | 2019 | | 2018 |
| | (in thousands) | | (in thousands) |
| Reconciliation of Return on Assets to Adjusted Return on Assets | | | | | | | |
| Net income (loss) attributable to On Deck Capital, Inc. common stockholders | $ | 4,295 |
| | $ | 5,628 |
| | $ | 9,961 |
| | $ | 3,571 |
|
| Average total assets | $1,232,533 | | $1,046,778 | | $1,220,330 | | $1,024,955 |
| Return on Assets | 1.4 | % | | 2.2 | % | | 1.6 | % | | 0.7 | % |
| Adjustments (after tax): | | | | | | | |
| Stock-based compensation expense | $ | 2,581 |
| | $ | 2,794 |
| | $ | 5,017 |
| | $ | 6,004 |
|
| Real estate disposition charges | — |
| | — |
| | — |
| | 4,187 |
|
| Severance and executive transition expenses | — |
| | — |
| | — |
| | 911 |
|
| Debt extinguishment costs | — |
| | 1,384 |
| | — |
| | 1,384 |
|
| Adjusted Net Income (Loss) | $ | 6,876 |
| | $ | 9,806 |
| | $ | 14,978 |
| | $ | 16,057 |
|
| Average total assets | $1,232,533 | | $1,046,778 | | $1,220,330 | | $1,024,955 |
| Adjusted Return on Assets | 2.2 | % | | 3.7 | % | | 2.5 | % | | 3.1 | % |
Adjusted Return on Equity
Adjusted Return on Equity represents net income (loss) attributable to OnDeckadjusted to exclude the items shown in the table below divided by average total On Deck Capital, Inc. stockholders' equity.
|
| | | | | | | | | | | | | | | |
| | Three Months Ended June 30, | | Six Months Ended June 30, |
| | 2019 | | 2018 | | 2019 | | 2018 |
| | (in thousands) | | (in thousands) |
| Reconciliation of Return on Equity to Adjusted Return on Equity | | | | | | | |
| Net income (loss) attributable to On Deck Capital, Inc. common stockholders | $ | 4,295 |
| | $ | 5,628 |
| | $ | 9,961 |
| | $ | 3,571 |
|
| Average OnDeck stockholders' equity | $ | 310,858 |
| | $ | 266,711 |
| | $ | 305,990 |
| | $ | 264,585 |
|
| Return on Equity | 5.5 | % | | 8.4 | % | | 6.5 | % | | 2.7 | % |
| Adjustments (after tax): | | | | | | | |
| Stock-based compensation expense | $ | 2,581 |
| | $ | 2,794 |
| | $ | 5,017 |
| | $ | 6,004 |
|
| Real estate disposition charges | — |
| | — |
| | — |
| | 4,187 |
|
| Severance and executive transition expenses | — |
| | — |
| | — |
| | 911 |
|
| Debt extinguishment costs | — |
| | 1,384 |
| | — |
| | 1,384 |
|
| Adjusted Net Income (Loss) | $ | 6,876 |
| | $ | 9,806 |
| | $ | 14,978 |
| | $ | 16,057 |
|
| Average total On Deck Capital, Inc. stockholders' equity | $ | 310,858 |
| | $ | 266,711 |
| | $ | 305,990 |
| | $ | 264,585 |
|
| Adjusted Return on Equity | 8.8 | % | | 14.7 | % | | 9.8 | % | | 12.1 | % |
Key Factors Affecting Our Performance
2019 Strategic Priorities
Investment in Long-Term Growth
Our primary focus remains to prudently grow our business while increasing profitability. The core elements of our growth strategy include:
•expandingExpanding the scale and efficiency of our financing offerings;U.S. lending franchise;
•acquiring new customers;
•broadening our distribution capabilities through strategic partnersInvesting in growth adjacencies, including ODX, equipment finance and funding advisors;
•enhancing our technology, data and analytics capabilities;
•extending customer lifetime value;international; and
•developingInnovating on our core strengths in risk, technology and growing ODX.funding.
We recently announced the expansion of our strategic priorities to include:
•Increasing our capital efficiencies, including a common stock repurchase program of up to $50 million; and
•Actively pursuing a bank charter, either de novo or through a transaction.
We plan to continue to invest significant resources to accomplish these goals. As a result,We anticipate that our total operating expense increased in absolute dollars during the first nine months of 2018 and we anticipate it will continue to increase in absolute dollars through 2019.2019 relative to 2018. These investments are intended to contribute to our long-term growth, but they may affect our near-term financial results.
In October 2018, we announced the launch of ODX, a wholly-owned subsidiary that will focus on helpinghelps banks digitize their small business lending process. ODX offers a combination of software, analytic insights, and professional services that allow banks to bring their small business lending process online. At the core of theWe believe ODX solution is a modular and scalable SaaS platform that enablescan help banks to either create a fully end-to-end digital experience for their customers or to select certain components for specific functions. By utilizing ODX, banks can realize improvedimprove customer experiences, increasedincrease portfolio growth, and reducedreduce processing costs. We expect ODX results to reflect a period of net investment as it builds its infrastructure and capabilities to grow existing and develop additional bank relationships.
Originations
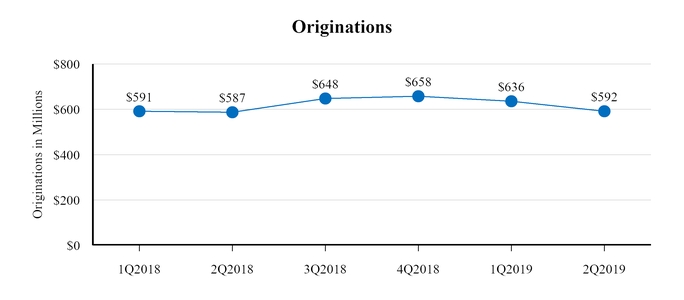
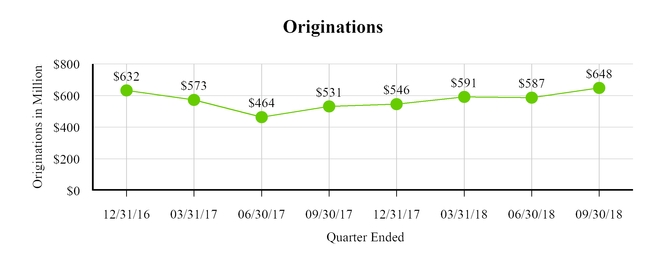
During the three months ended SeptemberJune 30, 20182019 and September 30, 2017,2018, we originated $647.8$592 million and $530.9$587 million of loans, respectively. During the nine months ended September 30, 2018 and September 30, 2017, we originated $1.8 billion and $1.6 billion of loans, respectively. The increase in originations forin the three and nine months ended SeptemberJune 30, 20182019 relative to the same periodsperiod in 20172018 was partly driven by the tightening of our credit policies in the first half of 2017 which constrained 2017 originations, and in the current year periods, the addition of new customers, including those in newly credit-eligible industries, an increase in renewals from existing customers andoriginated as part of our business combination with Evolocity, the continued growth of our line of credit originations. Lendingoriginations, and an increase in the volume of renewals from existing customers. The above-mentioned increase of originations was primarily due to growth in our strategic partner channel which was partially offset by a decline in the FAP channel and funding advisor channels continued to builda lesser extent, the direct channel. The average term loan size was $52 thousand at June 30, 2019, down from an average term loan size of $55 thousand at June 30, 2018.
Originations decreased approximately $44 million or 6.9% as we grew our networkcompared to the first quarter of partners. It also increased2019. Originations decreased across all origination channels; most significantly in our FAP channel followed by our strategic partner channel. We believe the decrease is in large part driven by more intense competition for small business customers. Within the direct channel, as a result of our marketing activitywe believe competition increased from public companies that have entered or expanded their presence in the small business lending space. Within the strategic partner and website traffic, which led to higher application volumes.FAP channels, competition from smaller, non-public lending companies has intensified.
The number of weekends and holidays in a period can impact our business. Many small businesses tend to apply for loans on weekdays, and their businesses may be closed at least part of a weekend and on holidays. In addition, our loan fundings and automated customer loan repayments only occur on weekdays (excluding bank holidays).
We anticipate that our future growth will continue to depend in part on attracting new customers. As we continue to aggregate data on existing customers and prospective customers, we seek to use that data and our increasing knowledge to optimize our marketing spending and business development efforts to attract theseretain existing customers as well as to continue to focus our analytics resources on better identifying potentialidentify and attract prospective customers. We have historically relied on all three of our channels for customer acquisition but remain focused on growing our direct and strategic partner channels. Collective originations through our direct and strategic partner channels made up 69% and 73% of total originations from all customers in the third quarter of 2018 and 2017, respectively.acquisition. We plan to continue investing in direct marketing, and sales, increasing our brand awareness and growing our strategic partnerships.
The following table summarizes the percentage of loans and finance receivables made to all customers originated by our three distribution channels for the periods indicated. From time to time management is requiredmay proactively adjust our originations channel mix based on market conditions. Our direct channel remains our largest channel as a percentage of origination dollars. Our strategic partner channel increased as a percentage of originations from the second quarter of 2018 compared to make judgments to determine customers' appropriatethe second quarter of 2019, while our direct and FAP channel distribution.
percentage of originations decreased.
| | | | Three Months Ended September 30, | | Nine Months Ended September 30, | Three Months Ended June 30, | | Six Months Ended June 30, |
| Percentage of Originations (Dollars) | 2018 | | 2017 | | 2018 | | 2017 | 2019 | | 2018 | | 2019 | | 2018 |
| Direct and Strategic Partner | 69% | | 73% | | 70% | | 73% | |
| Direct | | 42 | % | | 44 | % | | 42 | % | | 45 | % |
| Strategic Partner | | 32 | % | | 27 | % | | 31 | % | | 26 | % |
| Funding Advisor | 31% | | 27% | | 30% | | 27% | 26 | % | | 29 | % | | 27 | % | | 29 | % |
We originate term loans and lines of credit to customers who are new to OnDeck as well as to repeatexisting customers. New originations are defined as new term loan originations plus all line of credit draws in the period, including subsequent draws on existing lines of credit. Renewal originations include term loans only. We believe our ability to increase adoption of our loans within our existing customer base will be important to our future growth. A component of our future growth will include increasing the length of our customer life cycle by expanding our product offerings.loan offerings and features. In both the third quarter ofthree months ended June 30, 2019 and 2018 and 2017, originations from our repeat customers were comparable.53% and 50% respectively, of total originations to all customers. We believe our significant number of repeat customers is primarily due to our high levels of customer service and continued improvement in our loan features and services. Repeat customers generally show improvements in several key metrics. From our 2015 customer cohort,We believe the decrease in volume from new customers who took at least three loans grew their revenue and bank balance on average by 33% and 50%, respectively, from their initial loan to their third loan. Similarly, fromis indicative of the increased competition for new customers. From our 2016 customer cohort, customers who took at least three loans grew their revenue and bank balance, respectively, on average by 33%35% and 40% from their initial loan to their third loan. Similarly, from our 2017 customer cohort, customers who took at least three loans grew their revenue and bank balance, respectively, on average by 30% and 41%, respectively.. In the third quarter of 2018, 28%six months ended June 30, 2019, 30% of our origination volume from repeat customers was due to unpaid principal balance rolled from existing loans directly into such repeat originations. In order for a current customer to qualify for a newrenewal term loan while a term loan payment obligation remains outstanding, the customer must pass the following standards:
the business must be approximately 50% or more paid down on its existing loan;
the business must be current on its outstanding OnDeck loan with no material delinquency history; and
the business must be fully re-underwritten and determined to be of adequate credit quality.
The extent to which we generate repeat business from our customers will be an important factor in our continued revenue growth and our visibility into future revenue. In conjunction with repeat borrowing activity, many of our customers also tend to increase their subsequent loan size compared to their initial loan size.
The following table summarizes the percentage of loans originated by new and repeat customers. Loans from cross-selling efforts are classified in the table as repeat loans.
|
| | | | | | | |
| | Three Months Ended September 30, | | Nine Months Ended September 30, |
| Percentage of Originations (Dollars) | 2018 | | 2017 | | 2018 | | 2017 |
| New | 48% | | 45% | | 49% | | 49% |
| Repeat | 52% | | 55% | | 51% | | 51% |
Credit Performance
Credit performance refers to how credit losses on a portfolio of loans performs relative to expectations. A certain amount of losses are expected so credit performance must be assessed relative to pricing and expectations. Pricing is determined with the goal of generating a desired rate of return after taking portfolio estimated losses into account. When a portfolio realizes higher than estimated losses, the desired rate of return may not be achieved and that portfolio would be considered to have underperformed. |
| | | | | | | | | | | |
| | Three Months Ended June 30, | | Six Months Ended June 30, |
| Percentage of Originations (Dollars) | 2019 | | 2018 | | 2019 | | 2018 |
| New | 47 | % | | 50 | % | | 48 | % | | 49 | % |
| Repeat | 53 | % | | 50 | % | | 52 | % | | 51 | % |
Conversely, if
Loans
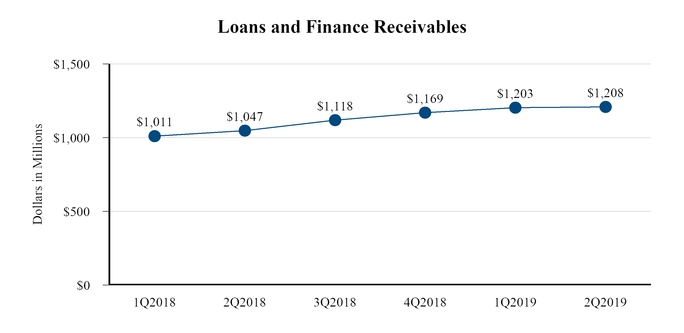
Loans and finance receivables held for investment consist of term loans, lines of credit, finance receivables and secured equipment finance loans that require daily, weekly or monthly repayments. We have both the portfolio incurred lower than estimated losses, resultingability and intent to hold these loans to maturity. Loans and finance receivables held for investment are carried at amortized cost. The amortized cost of a loan and finance receivable is the unpaid principal balance plus net deferred origination costs. Net deferred origination costs are comprised of certain direct origination costs, net of all loan origination fees received. Loan and finance receivable origination fees include fees charged to the borrower related to origination that increase the loan yield. Loan origination costs are limited to direct costs attributable to originating a loan, including commissions and personnel costs directly related to the time spent by those individuals performing activities related to origination. Direct origination costs in a higher than expected rateexcess of return,origination fees received are included in the portfolio would be considered to have overperformed.
We originateloan and price ourfinance receivable balance and for term loans based on risk. When we originate our loans, we establish a reserve for estimated loan losses. As we gather more data asand finance receivables are amortized over the portfolio performs, we may increase or decrease that reserve as deemed necessary to reflect our latest loss estimate. Some portions of our loan portfolio may be performing better than expected while other portions may perform below expectations. The net resultlife of the underperformingterm loan using the effective interest method, while for lines of credit principal amounts drawn are amortized using the straight line method over an average of 12 months. Loans and overperforming portfolio segments determines if we require an overallfinance receivables held for investment increased from $1.0 billion at June 30, 2018 to $1.2 billion at June 30, 2019, reflecting the increase or decrease to our loan reserve related to those existing loans.
We evaluate and track portfolio credit performance primarily through four key financial metrics: 15+Day Delinquency Ratio; Net Charge-off Rate; Reserve Ratio; and Provision Rate.
15+ Day Delinquency Ratio
The 15+ Day Delinquency Ratio, which is the aggregate Unpaid Principal Balance for our loans that are 15 or more calendar days past due as of the end ofin originations over the period as a percentagewell as the addition of the Unpaid Principal Balance, decreased from 7.5% at September 30, 2017 to 6.4% at September 30, 2018. This decrease is driven by continued improvement in credit, partially offset by the impact of our decision to hold certain delinquent loans for a longer period and more actively pursue collections as opposed to selling these loans earlier in our collection cycle.
During the past two years, the 15+ Day Delinquency Ratio peaked at 7.8% at March 31, 2017 primarilyportfolio acquired as a result of 2016 originations of term loans that were 15 months or more in term length at origination. This credit deterioration was internally driven ascombining our credit model was under-predicting losses, in the aggregate, for loans of 15 months or more due to our relatively limited experience at that timeCanadian operations with loans of similar terms. We took corrective action during the first half of 2017 including tightening of credit policies used to determine eligibility, pricing, loan size and term. This tightening helped reduce the 15+ Day Delinquency Ratio in the subsequent quarters, which was partially offset by the impact of our decision to hold delinquent loans longer as we continue to pursue collections as opposed to selling our delinquent loans earlier in the collection cycle as we used to do.
Net Charge-off RateEvolocity.
Our Net Charge-off Rate, which is calculated as our annualized net charge-offs for the period divided by the average Unpaid Principal Balance outstanding, declined from 16.9% during the three months ended September 30, 2017 to 11.1% during the three months ended September 30, 2018. Generally, the Net Charge-off Rate is expected to trail the 15+ Day Delinquency Ratio because loans become delinquent before deteriorating further to charged-off status. The reduction in Net Charge-off Rate is also related to credit improvements since early 2017.
Reserve Ratio
The Reserve Ratio, which is the allowance for loan losses divided by the Unpaid Principal Balance as of the end of a specified period, is a comprehensive measurement of our allowance for loan losses because it presents, as a percentage, the portion of the total Unpaid Principal Balance for which an allowance has been recorded. Our Reserve Ratio increased from 11.1% as of September 30, 2017 to 12.2% as of September 30, 2018. The increase in the Reserve Ratio is commensurate with our decision to hold certain delinquent loans for a longer period and more actively pursue collections as opposed to selling these loans earlier in our collection cycle. This range of Reserve Ratio is in line with our business model objectives given the characteristics of our loan portfolio and other factors.
Provision Rate
The Provision Rate is the provision for loan losses divided by the new originations volume of loans held for investment, net of originations of sales of such loans within the period. Originations include the full renewal loan principal of repeat loans, rather than the net funded amount.
Our Provision Rates decreased from 7.5% during the three months ended September 30, 2017 to 6.0% for the three months ended September 30, 2018. The decline in our Provision Rate primarily reflects our internally driven credit improvements resulting from our previously described credit tightening in the first half of 2017.
In 2017, we tightened our credit policies used to determine eligibility, pricing and loan size for certain customers. As additional seasoning took place on our loans and as our predictive model incorporated newer data, our Provision Rate generally improved during 2017. Our Provision Rate was 5.7% in the second quarter of 2018 and 6.0% in the third quarter of 2018, which is the low end of our target range. The 2018 provision rate improved relative to 2017 as a result of our improved credit policies, collection processes and fraud detection procedures. The Provision Rate for the third quarter of 2018 was generally lower than our historical Provision Rates and may not be indicative of the Provision Rate in future periods.
Two hurricanes recently struck the United States: Hurricane Florence in September 2018 and Hurricane Michael in October 2018. These hurricanes had a catastrophic impact on the people and businesses of Florida, Georgia, South Carolina, North Carolina and Virginia. For the past few years, Florida has been one of our top five states for loan originations. For the nine months ended September 30, 2018, 10% of our total originations were in Florida and less than 1% of our Unpaid Principal Balance was in areas in Florida that had been designated as “individual assistance” disaster areas by the Federal Emergency Management Agency, or FEMA, as a result of the two hurricanes. Hurricane Florence did not have a material impact on our financial results for the three months ended September 30, 2018. We do not expect Hurricane Florence or Hurricane Michael will have a material impact on our financial results for the quarter ending December 31, 2018.
Pricing
Customer pricing is determined primarily based on the customer’scredit risk level as measuredassessment generated by our proprietary data and analytics engine and cash flow assessments of the customer's ability to repay the loan. Our decision structure includingalso considers the OnDeck Score,FICO®Score,, loan type (term loan or line of credit), term loan duration, customer type (new or repeat) and origination channel. OnDeck assesses credit risk across several dimensions, including assessing the stability and credit worthiness of both the business and the personal guarantor and of the borrower's industry. Some of the most important factors assessed relate to the borrower's ability to pay, overall levels of indebtedness, cash flow and business outlook, and their personal and commercial credit history. These factors are assessed against certain minimum requirements in our underwriting standards, as well as through multivariate regressions and statistical models. In addition, general market conditions and the competitive environment may broadly influence pricing industry-wide. Loans originated through the direct and strategic partner channels are generally priced lower than loans originated through the funding advisor channel due to thecommission structure of the FAP program as well as the relative higher commissions paid to funding advisors.risk profile of the borrowers in the FAP channel.
OurAs of the three months ended June 30, 2019, our customers generally pay between $0.0030.005 and $0.0420.043 cents per month in interest for every dollar they borrow under one of our term loans. Historically, our term loans have been primarily quoted in “CentsCents on Dollar,” or COD, and lineswhich reflects the monthly interest paid by a customer to us per dollar borrowed for a loan. Lines of credit have been historically quoted in annual percentage rate, or APR. Given the use case and payback period associated with our shorter-term loans, we believe many of our customers prefer to understand pricing on a “dollars in, dollars out” basis and are primarily focused on total payback cost. As of Septemberthe three months ended June 30, 2018,2019, the APRs of our term loans outstanding ranged from 9.1%12.7% to 99.8%99.4% and the APRs of our lines of credit outstanding ranged from 12.5%19.9% to 63.2%61.9%.
We believe that our product pricing has historically fallen between traditional bank loans to small businesses and certain non-bank small business financing alternatives such as merchant cash advances.
| | | | For the Year | | For the Quarter | For the Year | | For the Quarter | |
| | 2013 | 2014 | 2015 | 2016 | | Q1 2017 | Q2 2017 | Q3 2017 | Q4 2017 | Q1 2018 | Q2 2018 | Q3 2018 | 2016 | 2017 | 2018 | | Q1 2018 | Q2 2018 | Q3 2018 | Q4
2018 | Q1 2019 | Q2 2019 |
| Weighted Average Term Loan "Cents on Dollar" Borrowed, per Month | 2.65¢ | 2.32¢ | 1.95¢ | 1.82¢ | | 1.95¢ | 1.94¢ | 1.96¢ | 1.97¢ | 2.08¢ | 2.15¢ | 2.17¢ | 1.82¢ | 1.95¢ | 2.14¢ | | 2.08¢ | 2.15¢ | 2.17¢ | 2.19¢ | 2.10¢ |
| Weighted Average APR - Term Loans and Lines of Credit | 63.4% | 54.4% | 44.5% | 41.4% | | 44.0% | 43.2% | 43.8% | 46.0% | 47.1% | 47.5% | 41.4% | 43.7% | 46.9% | | 46.0% | 47.2% | 47.5% | 47.0% | 46.9% | 45.4% |
The pricing decrease between 2013 and 2016 was due to longer average loan term lengths, increased originations from our lower cost direct and strategic partner channels as a percentage of total originations, the growth of our line of credit product which is priced at a lower APR level than our term loans, the introduction of our customer loyalty program and our efforts to pass savings on to customers. The pricing increases in 2017 and the first three quarters of 2018 were primarily a reflection of past and expected future increases in the underlying market interest rates that we, like many other lenders in the market, arewere passing on to our customers. Additionally, in the past year2017 and 2018 we have increased our originations in the Funding Advisorfunding advisor channel, which typically have higher APRs than the Directdirect and Strategic Partnerstrategic partner channels. The decrease in COD and APR over the first half of 2019 compared to the fourth quarter of 2018 reflected increased competition and the decrease in originations in the funding advisor channel. Additionally, the decrease in COD and APR from the first to second quarter in 2019 was primarily driven by our shift in strategy to offer longer term loans at a lower yields to select customers with higher credit scores.
We consider Effective InterestPortfolio Yield or EIY, as a key pricing metric. EIYmeasure. Portfolio Yield is the rate of return we achieveearn on loans and finance receivables outstanding during a period. Our EIYPortfolio Yield differs from APR in that it takes into account deferred origination fees and deferred origination costs. Deferred origination fees include fees paid up front to us by customers when loans are originated and decrease the carrying value of loans, thereby increasing the EIY.Portfolio Yield. Deferred origination costs are limited to costs directly attributable to originating loans and finance receivables such as commissions, vendor costs and personnel costs directly related to the time spent by the personnel performing activities related to loan originationoriginations and increase the carrying value of loans and finance receivables, thereby decreasing EIY.the Portfolio Yield. Our decision to hold more delinquent loans on balance sheet forcollection rather than sell those loans to third parties reduces Portfolio Yield.
|
| | | | | | | | | | | | | | | | | | | | |
| Portfolio Yield |
| For the Year | | For the Quarter |
| 2016 | | 2017 | | 2018 | | Q1 2018 | | Q2 2018 | | Q3 2018 | | Q4 2018 | | Q1 2019 | | Q2 2019 |
| 33.1% | | 33.7% | | 36.2% | | 35.5 | % | | 36.1 | % | | 36.4 | % | | 36.5 | % | | 35.6% | | 35.0% |
In addition to individual loan pricing, and the number of days in a period, there are many other factors that can affect EIY,Portfolio Yield, including:
Channel Mix - In general, loans originated from the strategic partner channel have lower EIYsPortfolio Yields than loans from the direct and funding advisor channel. This is primarily due to the strategic partner channel's higher commissions as compared to the direct channel, and lower pricing as compared to the funding advisor channel.
Term Mix- In general, term loans with longer durations have lower annualized interest rates. Despite lower EIYs,Portfolio Yields, total revenues from customers with longer loan durations are typically higher than the revenue of customers with shorter-term, higher EIYPortfolio Yield loans because total payback is typically higher compared to a shorter length term for the same principal loan amount. Following the introduction of our 24-month and 36-month term loans, the average length of new term loan originations had increased from 10.8 months for the year ended December 31, 2014 to 13.3 months for the year ended December 31, 2016. As part of our 2017 credit tightening, when appropriate, the offered duration of term loans to certain customers was shortened to control duration risk. For the three months ended SeptemberJune 30, 2018,2019, the average length of new term loan originations had decreased towas 12.3 months which increased from 11.4 months for the three months ended March 31, 2019 and 11.3 months.months for the three months ended June 30, 2018. The increase in average term length reflects the increased booking rate of longer term loans with larger balances of higher credit quality loans as our credit policy has recently been further optimized for loans with those specific characteristics.
Customer Type Mix - In general, loans originated from repeat customers historically have had lower EIYsPortfolio Yields than loans from new customers. This is primarily because repeat customers typically have a higher OnDeck Score and are therefore deemed to be lower risk. In addition, repeat customers are more likely to be approved for longer terms than new customers given their established payment history and lower risk profiles. Finally, origination fees can be reduced or waived for repeat customers, contributing to lower EIYs.Portfolio Yields.
ProductLoan Mix - In general, lines of credit have lower EIYsPortfolio Yields than term loans. For the third quarter of 2018,three months ended June 30, 2019, the weighted average line of credit APR was 32.7%34.4%, compared to 49.7%48.4% for term loans. Draws by line of credit customers increased to 19.8%22.8% of total originations for the three months ended June 30, 2019 from 20.7% in the third quarter of 2018 from 19.6% in the third quarter of 2017.three months ended June 30, 2018.
Interest Expense
We obtain outside financing principally through debt facilities and securitizations with a diverse group of banks, insurance companies and other institutional lenders. Interest expense consist of the interest expense we incur on our debt, certain fees and the amortization of deferred debt issuance costs incurred in connection with obtaining this debt, such as banker fees, origination fees and legal fees and, in applicable periods, certain costs associated with our interest rate hedging activity. Cost of Funds Rate is calculated as interest expense divided by average debt outstanding for the period. Our Cost of Funds Rate decreased to 5.5% for the three months ended June 30, 2019 as compared to 6.6% for the three months ended June 30, 2018. The decrease in our Cost of Funds Rate was driven by the decrease in our weighted average interest rate on debt outstanding. That decrease was attributable to decreases in interest rate spread (the applicable percentage rate above the benchmark interest rate charged by the lender) which was partially offset by an increase in benchmark rates. |
| | | | | | | | | | | | | | | | | | | | |
| Effective Interest Yield |
| For the Year | | For the Quarter | | |
| 2013 | | 2014 | | 2015 | | 2016 | | Q1 2017 | | Q2 2017 | | Q3 2017 | | Q4 2017 | | Q1 2018 | | Q2 2018 | | Q3 2018 |
| 42.7% | | 40.4% | | 35.4% | | 33.2% | | 33.8% | | 33.5% | | 33.1% | | 34.8% | | 35.6% | | 36.1% | | 36.5% |
Credit performance refers to how credit losses on a portfolio of loans and finance receivables perform relative to expectations. Generally speaking, perfect credit performance is a loan that is repaid in full and in accordance with the terms of the agreement, meaning that all amounts due were repaid in full and on time. However, no portfolio is without risk and a certain amount of losses are expected. In this respect, credit performance must be assessed relative to pricing and expectations. Because a certain degree of losses are expected, pricing will be determined with the goal of allowing for estimated losses while still generating the desired rate of return after taking into account those estimated losses. When a portfolio has higher than estimated losses, the desired rate of return may not be achieved, and that portfolio would be considered to have underperformed. Conversely, if the portfolio incurred lower than estimated losses, resulting in a higher than expected rate of return, the portfolio would be considered to have overperformed.
We originate and price our loans and finance receivables expecting that we will incur a degree of losses. When we originate our loans and finance receivables, we record a provision for estimated credit losses. As we gather more data as the portfolio performs, we may increase or decrease that reserve as deemed necessary to reflect our latest loss estimate. Some portions of our portfolio may be performing better than expected while other portions may perform below expectations. The net result of the underperforming and overperforming portfolio segments determines if we require an overall increase or decrease to our reserve related to the existing portfolio. A net decrease to the reserve related to the existing portfolio reduces provision expense, while a net increase to the loan reserve increases provision expense.
In accordance with our strategy to expand the range of our loan offerings, over time, we have expanded the offerings of our term loans by making available longer terms and larger amounts. When we begin to offer a new type of loan, we typically extrapolate our existing data to create an initial version of a credit model to permit us to underwrite and price the new type of loan. Thereafter, we begin to collect actual performance data on these new loans which allows us to refine our credit model based on actual data as opposed to extrapolated data. It often takes several quarters after we begin offering a new type of loan for that loan to be originated in sufficient volume to generate a critical mass of performance data. In addition, for loans with longer terms, it takes longer to acquire significant amounts of data because the loans take longer to season.
Each loan cohort is unique. A loan cohort refers to loans originated in the same specified time period. For a variety of reasons, one cohort may exhibit different performance characteristics over time compared to other cohorts at similar months of seasoning.
We evaluate and track portfolio credit performance primarily through four key financial metrics: 15+Day Delinquency Ratio; Net Charge-off Rate; Reserve Ratio; and Provision Rate.
PriorNet Charge-off Rate
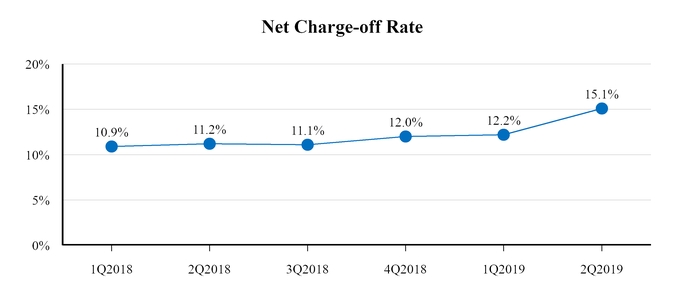
Our Net Charge-off Rate, which is calculated as our annualized net charge-offs for the period divided by the average Unpaid Principal Balance outstanding, increased from 11.2% in three months ended June 30, 2018 to 15.1% in three months ended June 30, 2019, driven by credit expansion, channel mix changes and changes in small business sentiment and behavior. Since 2018, we have held delinquent loans longer as we expanded our pre-charge-off collection efforts to maximize returns. While collections on those more severely delinquent loans have proven to be successful and have increased our recoveries and profitability, some portion of those loans ultimately remain uncollectible. Allowing several quarters to continue collection efforts delayed charge-off of some loans which have now accumulated. This quarter's increase net charge-off rate reflects the first quarterincreased charge-off rate as some of 2018, annualization was based on 252 business days per year. Beginning withthose accumulated loans are charged-off. In addition, the Net Charge-off Rate in the three months ended March 31, 2018 annualization is based on 365 days per year and is calendar day-adjusted. All revisions have been applied retrospectively.
Sale of Whole Loans through OnDeckMarketplace
We may sell whole loanswas unusually low by historical standards reflecting our decision to institutional investors through OnDeck Marketplace. Marketplace originations are defined as loans that are sold through OnDeck Marketplacetighten our credit policies in the period or are held for sale at the endfirst half of the period. No loans were sold during the nine months ended September 30, 2018. During the three and nine months ended September 30, 2017, we sold through OnDeck Marketplace loans with an unpaid principal balance of $5.3 million and $55.5 million, respectively.
Our OnDeck Marketplace originations come from one of the following two origination sources:
New loans that are designated at origination to be sold, referred to as “Originations of loans held for sale;” and
Loans that were originally designated as held for investment that are subsequently designated to be sold at the time of their renewal and which are considered modified loans, referred to as “Originations of loans held for investment, modified."
The following table summarizes the initial principal of originations of the aforementioned two sources as it relates to the statement of cash flows during the periods shown for 2018 and 2017.
|
| | | | | | | | | | | | | |
| | Three Months Ended September 30, | | Nine Months Ended September 30, |
| | 2018 | | 2017 | | 2018 | | 2017 |
| | (in thousands) | | (in thousands) |
| Originations of loans held for sale | — |
| | $ | 3,069 |
| | — |
| | $ | 44,490 |
|
| Originations of loans held for investment, modified | — |
| | 2,271 |
| | — |
| | 11,475 |
|
Marketplace originations | — |
| | $ | 5,340 |
| | — |
| | $ | 55,965 |
|
Customer Acquisition Costs
Our customer acquisition costs, or CACs, differ depending upon the acquisition channel. CACs in our direct channel include the commissions paid to our internal sales force and expenses associated with items such as direct mail, social media and other online marketing activities. CACs in our strategic partner channel include commissions paid to our internal sales force and strategic partners. CACs in our funding advisor channel include commissions paid to our internal sales force and funding advisors. CACs in all channels include new originations as well as renewals.
Our CACs, on a combined basis for all three acquisition channels and evaluated as a percentage of originations, increased for the three months ended September 30, 2018 as compared to the three months ended September 30, 2017. The increase was primarily attributable to an increase in CACs in our funding advisor channel driven by an increase in external commissions and origination volume. The increase was partially offset by a decline in CACs in our strategic partner channel due to a decrease in commission and a decline in our direct channel resulting from improvements in customer targeting.
Increased competition for customer response could require us to incur higher customer acquisition costs and make it more difficult for us to grow our loan originations in both unit and volume for both new as well as repeat customers.
Historical Charge-Offs
We illustrate below our historical loan losses by providing information regarding our net lifetime charge-off ratios by cohort. Net lifetime charge-offs are the Unpaid Principal Balanceunpaid principal balance charged off less recoveries of loans previously charged off, and aoff. A given cohort’s net lifetime charge-off ratio equalsis the cohort’s net lifetime charge-offs through SeptemberJune 30, 20182019 divided by the cohort’s
total original loan volume. Repeat loans in the denominator include the full renewal loan principal, rather than the net funded amount, which is the renewal loan’s principal net of the unpaid principal balance on the existing loan. Loans are typically charged off after 90 days of nonpayment. Loans originatednonpayment and charged off between January 1, 2013 and September 30 2018 were on average charged off near the enddays of their loan term.inactivity. The chart immediately below includes all term loan originations, regardless of funding source, including, if applicable, loans sold through OnDeck Marketplace or held for sale on our balance sheet.
Lifetime Net Charge-off Ratios by Cohort Through SeptemberJune 30, 20182019
|
| | | | | | | | | | | | |
| | For the Year | | For the Quarter |
| | 2013 | 2014 | 2015 | 2016 | | Q1 2017 | Q2 2017 | Q3 2017 | Q4 2017 | Q1 2018 | Q2 2018 | Q3 2018 |
| Principal Outstanding as of September 30, 2018 by Period of Origination | 0.0% | 0.0% | 0.0% | 0.2% | | 0.5% | 1.2% | 3.7% | 10.2% | 25.2% | 57.5% | 86.9% |
|
| | | | | | | | | | |
| | For the Year | | For the Quarter |
| | 2015 | 2016 | 2017 | | Q1 2018 | Q2 2018 | Q3 2018 | Q4 2018 | Q1 2019 | Q2 2019 |
| Principal Outstanding as of June 30, 2019 by Period of Origination | —% | —% | 0.3% | | 1.1% | 3.2% | 10.2% | 26.4% | 56.0% | 86.6% |
The following chart displays the historical lifetime cumulative net charge-off ratio by cohort for the origination periods shown. The chart reflects all term loan originations, regardless of funding source, including, if applicable, loans sold through our OnDeck Marketplace or held for sale on our balance sheet. The data is shown as a static pool for each cohort, illustrating how the cohort has performed given equivalent months of seasoning.
Given that the originations in the secondfirst and thirdsecond quarter of 20182019 cohorts are relatively unseasoned as of SeptemberJune 30, 2018,2019, these cohorts reflect low lifetime charge-off ratios in the total loans chart below. Further, given our loans are typically charged off after 90 days of nonpayment and 30 days of inactivity, all cohorts reflect approximately 0%minimal charge offs for the first three months in the chart below.
Net Cumulative Lifetime Charge-off Ratios
All Loans
|
| | | | | | | | | | | | | | | | | | | | | | | | | | | | | | | |
| | For the Year | | For the Quarter |
| Originations | 2015 | 2016 | 2017 | 2018 | | Q1 2018 | Q2 2018 | Q3 2018 | Q4 2018 | Q1 2019 | Q2 2019 |
All term loans (in millions) | $ | 1,704 |
| $ | 2,052 |
| $ | 1,697 |
| $ | 1,972 |
| | $ | 469 |
| $ | 465 |
| $ | 520 |
| $ | 517 |
| $ | 486 |
| $ | 457 |
|
| Weighted average term (months) at origination | 12.4 |
| 13.2 |
| 12.1 |
| 11.8 |
| | 11.8 |
| 11.8 |
| 11.9 |
| 11.8 |
| 11.7 |
| 12.2 |
|
Loans we originated in 2016 demonstrated higher than historical net cumulative lifetime charge-off ratios, which were primarily related to lower credit quality loans withof longer terms and larger loan sizes. In response and as part of our focus on achieving profitability, during the first and second quarters of 2017 we broadly tightened our credit policies to eliminate originations of loans with expected negative unit economics and to reduce those with expected marginal unit economics.
By design, the broad credit tightening resulted in a significant decline in originations for the second quarter of 2017 and a significant decline in the net cumulative lifetime charge-off ratios for loans originated in that quarter. Subsequent cohorts have incorporated measured and targeted credit optimization designed to bring our net cumulative charge-off ratios in line with business model objectives. Loans originated after the third quarter of 20172018 are not yet seasoned enough for meaningful comparison.
|
| | | | | | | | | | | | |
| | For the Year | | For the Quarter |
| Originations | 2013 | 2014 | 2015 | 2016 | | Q1 2017 | Q2 2017 | Q3 2017 | Q4 2017 | Q1 2018 | Q2 2018 | Q3 2018 |
| All term loans (in millions) | $456 | $1,101 | $1,704 | $2,052 | | $470 | $362 | $427 | $437 | $469 | $465 | $520 |
| Weighted average term (in months) | 10.0 | 11.2 | 12.4 | 13.2 | | 12.3 | 11.8 | 12.1 | 12.2 | 11.8 | 11.8 | 11.9 |
The 15+ Day Delinquency Ratio is the aggregate Unpaid Principal Balance for our portfolio that is 15 or more calendar days past due as of the end of the period as a percentage of the Unpaid Principal Balance.
The 15+ Day Delinquency ratio increased from 6.8% at June 30, 2018 to 8.5% at June 30, 2019 driven by our decision in 2018 to hold and collect delinquent loans longer, credit tests we performed in 2018, and a normalizing credit environment in 2019. The increase in loans 15-89 days past due was primarily driven by the credit testing we performed in 2018, while the increase in loans 90+ days past due primarily reflects the change in our collection strategy.
The decrease in the second quarter of 2019 of the percentage of 90+ days past due loans as compared to the first quarter of 2019 reflects the charge-off of delinquent loans accumulated over the past several quarters as we expanded our internal collection efforts and the increase in delinquencies which resulted from our credit expansion in the third and fourth quarter of 2018. The decrease of the percentage of 15-89 days past due loans over the same period reflects the improved credit performance of our more current cohorts.
Reserve Ratio
The Reserve Ratio, which is the allowance for credit losses divided by the Unpaid Principal Balance as of a specific date, is a comprehensive measurement of our allowance for credit losses because it presents, as a percentage, the portion of the total Unpaid Principal Balance for which an allowance has been recorded. Our Reserve Ratio increased from 12.1% at June 30, 2018, to 12.3% at June 30, 2019. The increase in the Reserve Ratio reflects higher delinquencies including a greater proportion of late stage delinquencies, ongoing credit testing, and a normalizing credit environment in 2019.
Provision Rate
The Provision Rate is the provision for credit losses divided by the new originations volume of loans and finance receivables held for investment. Originations include the full renewal loan principal of repeat loans, rather than the net funded amount.
Our Provision Rate increased in the second quarter of 2019 to 7.3% from 5.7% in the second quarter of 2018. This increase in Provision Rate was primarily driven by the deterioration of loans originated in the second half of 2018, and a normalizing credit environment.
Economic Conditions
Changes in the overall economy may impact our business in several ways, including demand for our loans, credit performance, and funding costs.interest expense.
Demand for Our Loans. Generally, we believe a strong economic climate tends to increase demand for our loans as consumer spending increases and small businesses seek to expand and more potential customers may meet our underwriting requirements, although some small businesses may generate enough additional cash flow that they no longer require a loan. In that climate, traditional lenders may also approve loans for a higher percentage of our potential customers.
Credit Performance. In a strong economic climate, our customers may experience improved cash flow and liquidity, which may result in lower loan losses. In a weakening economic climate or recession, the opposite may occur. We factor economic conditions into our loan underwriting analysis and reserves for loan losses, but changes in economic conditions, particularly sudden changes, may affect our actual loan losses. These effects may be partially mitigated by the short-term nature and repayment structure of our loans, which should allow us to react more quickly than if the terms of our loans were longer.
Loan Losses. Our underwriting process is designed to limit our loan losses to levels consistent with our risk tolerance and financial model. Our aggregate loan loss rates from 2013 through 2015 were consistent with our financial targets while 2016 was higher than our financial target as we incurred higher than estimated loss rates on certain larger and longer-term loans. Our 2017 loan loss levels were also higher than our financial targets largely because we were taking corrective action throughout the first half of the year to address the higher 2016 loan losses. Our first three quarters of 2018 loan loss levels are consistent with our financial targets. Our overall loan losses are affected by a variety of factors, including external factors such as prevailing economic conditions, general small business sentiment and unusual events such as natural disasters, as well as internal factors such as the accuracy of the OnDeck Score,our loan decisioning, the effectiveness of our underwriting process and the introduction of new loan types of loans, such as our line of credit,or features with which we have less experience to draw upon when forecasting their loss rates. Our loan loss rates may vary in the future.
Funding Costs.Interest Expense. Changes in monetary and fiscal policy may affect generally prevailing interest rates. Interest rates may also change for reasons unrelated to economic conditions. To the extent that interest rates rise, our funding costsinterest expense will increase and the spread between our Effective InterestPortfolio Yield and our Cost of Funds Rate may narrow to the extent we cannot correspondingly increase the interest rates we charge our customers or reduce the credit spreads in our borrowing facilities.
Customer Acquisition Costs
Our customer acquisition costs, or CACs, differ depending upon the acquisition channel. CACs in our direct channel include the commissions paid to our internal sales force and expenses associated with items such as direct mail, and online marketing activities. CACs in our strategic partner channel and FAP channel include commissions paid. CACs in all channels include new originations. For our United States portfolio, the FAP channel had the highest CAC per unit and our strategic partner channel had the lowest CAC per unit for both the three months ended June 30, 2019 and June 30, 2018.
The total amount of U.S. CACs decreased both in aggregate and for each of the three individual acquisition channels for the three months ended June 30, 2019 as compared to the three months ended June 30, 2018. Our U.S. CACs evaluated as a percentage of originations increased for our direct and FAP channel, and decreased slightly for our strategic partner channel period over period. The decrease in absolute dollars was primarily attributable to a decrease in U.S. CACs in our FAP channel driven by a decrease in external commissions and origination volume.
Increased competition for customer response could require us to incur higher customer acquisition costs and make it more difficult for us to grow our originations in both unit and volume for both new as well as repeat customers.
Components of Our Results of Operations
Revenue
Interest and Finance Income. We generate revenue primarily through interest and origination fees earned on the term loans and lines of credit we originate. Interest income in applicable periods also includes interest income earned on loans held for sale from the time the loan is originated until it is ultimately sold, as well as othersold. Interest income also includes miscellaneous interest income. income such as interest earned on invested cash. We also generate revenue through finance income on our Canadian merchant cash advances.
Our interest and origination fee revenue is amortized over the term of the loan or finance receivable using the effective interest method. Origination fees collected but not yet recognized as revenue are netted with direct origination costs and recorded
as a component of loans and finance receivables held for investment or loans held for sale, as appropriate, on our consolidated balance sheets and recognized over the term of the loan.loan or finance receivable. Direct origination costs include costs directly attributable to originating a loan or finance receivable, including commissions, vendor costs and personnel costs directly related to the time spent by those individuals performing activities related to loan origination.
Gain on Sales of Loans. We may sell term loans to third-party institutional investors through OnDeck Marketplace. We recognize a gain or loss on the sale of such loans as the difference between the proceeds received, adjusted for initial recognition of servicing assets or liabilities obtained at the date of sale, and the outstanding principal and net deferred origination costs.
Other Revenue. Other revenue includes servicing revenue related to loans serviced for others, fair value adjustments to servicing rights, fees generated by OnDeck-as-a-Service throughODX, marketing fees earned from our wholly-owned subsidiary, ODX,issuing bank partner, monthly fees charged to customers for our line of credit, marketing fees earned from our issuing bank partner, and referral fees from other lenders which are recognized as the related services are provided..
Cost of Revenue
Provision for LoanCredit Losses. Provision for loancredit losses consists of amounts charged to income during the period to maintain an allowance for loancredit losses, or ALLL, estimated to be adequate to provide for probable credit losses inherent in our existing loan and finance receivable portfolio. Our ALLL represents our estimate of the credit losses inherent in our portfolio of term loans and lines of creditfinance receivables and is based on a variety of factors, including the composition and quality of the portfolio, loan specific information gathered through our collection efforts, delinquency levels, our historical charge-off and loss experience and general economic conditions. We
In general, we expect our aggregate provision for loancredit losses to increase in absolute dollars as the amount of term loans and lines of credit we originate and hold for investment increases.
Funding CostsInterest Expense. Funding costs consistInterest expense consists of the interest expense we payincur on theour debt, we incur to fund our lending activities, certain fees and the amortization of deferred debt issuance costs incurred in connection with obtaining this debt, such as banker fees, origination fees and legal fees.fees and, in applicable periods, certain costs associated with our interest rate hedging activity. Our interest expense and Cost of Funds Rate will vary based on a variety of external factors, such as credit market conditions, general interest rate levels and spreads, as well as OnDeck-specific factors, such as origination volume and credit quality. We expect funding costsinterest expense will continue to increase in absolute dollars as we increase borrowings to fund portfolio growth and expected increases in market interest rates.growth.
Operating Expense
Operating expense consists of sales and marketing, technology and analytics, processing and servicing, and general and administrative expenses. Salaries and personnel-related costs, including benefits, bonuses, stock-based compensation expense and occupancy, comprise a significant component of each of these expense categories. All operating expense categories also include an allocation of overhead, such as rent and other overhead, which is based on employee headcount. We believe that continuing to invest in our business is essential to growing the business and maintaining our competitive position, and therefore, we expect the absolute dollars of operating expenses to increase, excluding charges related to real estate dispositions, severance and executive transitions and debt extinguishment costs.
During 2017, we reduced our headcount and personnel-related costs as we endeavored to achieve GAAP profitability and increase our efficiency. At September 30, 2018, we had 555 employees compared to 475 at December 31, 2017 and 708 at December 31, 2016. During 2018, we increased our headcount and personnel-related costs across our business in order to support our growth strategy. We plan to continue these increases in 2019 while remaining focused profitability and efficiency. Our headcount at September 30, 2018 was approximately 22% lower than at December 31, 2016. Our efficiency ratio (operating expenses divided by gross revenues) for the three months ended September 30, 2018 was significantly better than for the year ended December 31, 2016.increase.
Sales and Marketing. Sales and marketing expense consists of salaries and personnel-related costs of our sales and marketing and business development employees, as well as direct marketing and advertising costs, online and offline CACs (such as direct mail, paid search and search engine optimization costs), public relations, promotional event programs and sponsorships, corporate communications and allocated overhead. We expect our sales and marketing expense in terms of absolute dollars to remain generally consistent with 2017 levels but to decrease as a percentage of revenue in the near term as we continue to optimize marketing spend.
Technology and Analytics. Technology and analytics expense consists primarily of the salaries and personnel-related costs of our engineering and product employees as well as our credit and analytics employees who develop our proprietary credit-scoring models. Additional expenses include third-party data acquisition expenses, professional services, consulting costs, expenses related to the development of new types of loans and technologies and maintenance of existing technology assets, amortization of capitalized internal-use software costs related to our technology platform and allocated overhead.
We plan to hire additional highly skilled engineering, data analytics and risk management personnel in connection with our strategy to expand our financing offerings and enhance our technology and data analytics capabilities. As a result, we expect salary and personnel-related costs in these areas to increase over time. Competition for these employees is extremely intense. Recent U.S. immigration policy has made it more difficult for qualified foreign nationals to obtain or maintain work visas under the HB-1 classification. These HB-1 visa limitations make it more difficult and/or more expensive for us to hire the skilled professionals we need to execute our growth strategy and may adversely impact our business.
Processing and Servicing. Processing and servicing expense consists primarily of salaries and personnel related costs of our credit analysis, underwriting, funding, fraud detection, customer service and collections employees. Additional expenses include vendor costs associated with third-party credit checks, lien filing fees and other costs to evaluate, close and fund loans and overhead costs.
General and Administrative. General and administrative expense consists primarily of salary and personnel-related costs for our executive, finance and accounting, legal and people operations employees. Additional expenses include a provision for the unfunded portion of our lines of credit, consulting and professional fees, insurance, legal, travel, gain or loss on foreign exchange and other corporate expenses and costs associated with the early extinguishment of debt.expenses. These expenses also include costs associated with compliance with the Sarbanes-Oxley Act and other regulations governing public companies, directors’ and officers’ liability insurance and increased accounting costs.
Other Expense
Interest Expense. Interest expense consists of interest expense and amortization of deferred debt issuance costs incurred on debt associated with our corporate activities. It does not include interest expense incurred on debt associated with our lending activities.
Provision for Income Taxes
We have not recorded anyOur provision for U.S.income taxes includes tax expense for our global operations, including the tax expense incurred by our non-U.S. entities, and our annual effective tax rate is an estimated, blended rate of all jurisdictions; federal, state and foreignforeign. We expect to incur U.S. income taxes. tax expense for the remainder of 2019 and thereafter as we currently estimate that we will be profitable and will fully utilize our net operating losses. We may release portions of our valuation allowance in 2019 and thereafter if our actual or forecasted profitability levels are deemed sufficient to support the realizability of the net deferred tax assets.
Through December 31, 2017,2018, we havehad not been required to pay any material U.S. federal or state income taxes nor any foreign income taxes because of accumulated net operating losses. As of December 31, 2017,2018, we had $82.1approximately $3.7 million of federal net operating loss carryforwards and $81.3approximately $14.9 million of state net operating loss carryforwards available to reduce future taxable income, unless limited due to historical or future ownership changes. The federal net operating loss carryforwards will begin to expire at various dates beginning in 2029.
The Internal Revenue Code2028. We expect to use a significant portion of 1986, as amended, or the Code, imposes substantial restrictions on the utilization ofour U.S. net operating losses in 2018 and other tax attributes in the event of an “ownership change” of a corporation. Events which may cause limitation in the amount of theto fully utilize all remaining net U.S. operating losses and other tax attributes that are able to be utilized in any one year include, but are not limited to, a cumulative ownership change of more than 50% over a three-year period, which has occurred as a result of historical ownership changes. Accordingly, our ability to use pre-change net operating loss and certain other attributes are limited as prescribed under Sections 382 and 383 of the Code. Therefore, if we earn net taxable income in the future, our ability to reduce our federal income tax liability with our existing net operating losses is subject to limitation.2019.
On December 22, 2017, the SEC issued Staff Accounting Bulletin No. 118, Income Tax Accounting Implications of the Tax Cuts and Jobs Act that was codified through the issuance of ASU No. 2018-05. This pronouncement permits us to record provisional amounts during a measurement period not to extend beyond one year of the enactment date. We recorded the impact of the Tax Cuts and Jobs Act for the year ended December 31, 2017, which included a provisional amount associated with our deferred tax asset. We did not revise our initial provisional estimate during the nine months ended September 30, 2018, and continue to assess the income tax effects of the tax reform. Because a full valuation allowance has been and will continue to be recorded against our deferred tax asset, any change in our provisional amounts is expected to be offset by a corresponding change in our valuation allowance, resulting in no net impact to our results of operations.
As of December 31, 2017, a full valuation allowance of $37.8 million was recorded against our net deferred tax assets.
Results of Operations
The following table sets forth our consolidated statements of operations data as a percentage of gross revenue for each of the periods indicated.
Comparison of the Three Months Ended Septemberthree months ended June 30, 20182019 and 20172018
| | | | Three Months Ended September 30, | | | | | Three Months Ended June 30, |
| | | | | | | | | | Period-to-Period | | | | | | | | | |
| | 2018 | | 2017 | | Change | 2019 | | 2018 | | Period-to-Period Change |
| | Amount | | Percentage of
Gross
Revenue | | Amount | | Percentage of
Gross
Revenue | | Amount | | Percentage | Amount | | Percentage of
Gross
Revenue | | Amount | | Percentage of
Gross
Revenue | | Amount | | Percentage |
| | (dollars in thousands) | (dollars in thousands) |
| Revenue: | | | | | | | | | | | | | | | | | | | | | | |
| Interest income | $ | 99,476 |
| | 96.6 | % | | $ | 80,122 |
| | 95.8 | % | | $ | 19,354 |
| | 24.2 | % | |
| Gain on sales of loans | — |
| | — |
| | 146 |
| | 0.2 |
| | (146 | ) | | (100.0 | ) | |
| Interest and finance income | | $ | 105,641 |
| | 95.8 | % | | $ | 92,209 |
| | 96.6 | % | | $ | 13,432 |
| | 14.6 | % |
| Other revenue | 3,523 |
| | 3.4 |
| | 3,398 |
| | 4.0 |
| | 125 |
| | 3.7 |
| 4,605 |
| | 4.2 |
| | 3,247 |
| | 3.4 |
| | 1,358 |
| | 41.8 |
|
| Gross revenue | 102,999 |
| | 100.0 |
| | 83,666 |
| | 100.0 |
| | 19,333 |
| | 23.1 |
| 110,246 |
| | 100.0 |
| | 95,456 |
| | 100.0 |
| | 14,790 |
| | 15.5 |
|
| Cost of revenue: | | | | | | | | | | | | | | | | | | | | | | |
| Provision for loan losses | 39,102 |
| | 38.0 |
| | 39,582 |
| | 47.3 |
| | (480 | ) | | (1.2 | ) | |
| Funding costs | 11,665 |
| | 11.3 |
| | 11,330 |
| | 13.5 |
| | 335 |
| | 3.0 |
| |
| Provision for credit losses | | 42,951 |
| | 39.0 |
| | 33,293 |
| | 34.9 |
| | 9,658 |
| | 29.0 |
|
| Interest expense | | 11,381 |
| | 10.3 |
| | 12,245 |
| | 12.8 |
| | (864 | ) | | (7.1 | ) |
| Total cost of revenue | 50,767 |
| | 49.3 |
| | 50,912 |
| | 60.8 |
| | (145 | ) | | (0.3 | ) | 54,332 |
| | 49.3 |
| | 45,538 |
| | 47.7 |
| | 8,794 |
| | 19.3 |
|
| Net revenue | 52,232 |
| | 50.7 |
| | 32,754 |
| | 39.2 |
| | 19,478 |
| | 59.5 |
| 55,914 |
| | 50.7 |
| | 49,918 |
| | 52.3 |
| | 5,996 |
| | 12.0 |
|
| Operating expenses: | | | | | | | | | | | | |
| Operating expense: | | | | | | | | | | | | |
| Sales and marketing | 10,845 |
| | 10.5 |
| | 11,903 |
| | 14.2 |
| | (1,058 | ) | | (8.9 | ) | 13,307 |
| | 12.1 |
| | 11,432 |
| | 12.0 |
| | 1,875 |
| | 16.4 |
|
| Technology and analytics | 13,418 |
| | 13.0 |
| | 11,748 |
| | 14.0 |
| | 1,670 |
| | 14.2 |
| 16,681 |
| | 15.1 |
| | 12,799 |
| | 13.4 |
| | 3,882 |
| | 30.3 |
|
| Processing and servicing | 5,302 |
| | 5.1 |
| | 4,160 |
| | 5.0 |
| | 1,142 |
| | 27.5 |
| 5,609 |
| | 5.1 |
| | 5,041 |
| | 5.3 |
| | 568 |
| | 11.3 |
|
| General and administrative | 13,107 |
| | 12.7 |
| | 9,440 |
| | 11.3 |
| | 3,667 |
| | 38.8 |
| 16,353 |
| | 14.8 |
| | 16,034 |
| | 16.8 |
| | 319 |
| | 2.0 |
|
| Total operating expenses | 42,672 |
| | 41.3 |
| | 37,251 |
| | 44.5 |
| | 5,421 |
| | 14.6 |
| |
| Income (loss) from operations | 9,560 |
| | 9.4 |
| | (4,497 | ) | | (5.3 | ) | | 14,057 |
| | 312.6 |
| |
| Other expense: | | | | | | | | | | | | |
| Interest expense | 63 |
| | 0.1 |
| | 35 |
| | — |
| | 28 |
| | 80.0 |
| |
| Total other expense: | 63 |
| | 0.1 |
| | 35 |
| | — |
| | 28 |
| | 80.0 |
| |
| Income (loss) before provision for income taxes | 9,497 |
| | 9.3 |
| | (4,532 | ) | | (5.3 | ) | | 14,029 |
| | 309.6 |
| |
| Total operating expense | | 51,950 |
| | 47.1 |
| | 45,306 |
| | 47.5 |
| | 6,644 |
| | 14.7 |
|
| Income (loss) from operations, before provision for income taxes | | 3,964 |
| | 3.6 |
| | 4,612 |
| | 4.8 |
| | (648 | ) | | (14.1 | ) |
| Provision for income taxes | — |
| | — |
| | — |
| | — |
| | — |
| | — |
| 1,796 |
| | 1.6 |
| | — |
| | — |
| | 1,796 |
| | — |
|
| Net income (loss) | 9,497 |
| | 9.3 |
| | (4,532 | ) | | (5.3 | ) | | 14,029 |
| | 309.6 |
| $ | 2,168 |
| | 2.0 | % | | $ | 4,612 |
| | 4.8 | % | | $ | (2,444 | ) | | (53.0 | )% |
| Less: Net income (loss) attributable to noncontrolling interest | (272 | ) | | (0.2 | ) | | (458 | ) | | (0.4 | ) | | 186 |
| | 40.6 |
| |
| Net income (loss) attributable to On Deck Capital, Inc. common stockholders | $ | 9,769 |
| | 9.5 | % | | $ | (4,074 | ) | | (4.9 | )% | | $ | 13,843 |
| | 339.8 | % | |
Net income (loss)
For the three months ended June 30, 2019, net income decreased to $2.2 million from $4.6 million for the three months ended June 30, 2018 while adjusted net income, a non-GAAP measure, decreased to $6.9 million from $9.8 million over the same period. These decreases were primarily attributable to a 19.3% increase in cost of revenue and a 14.7% increase in operating expenses, partially offset by a 15.5% increase in revenue. Basic earnings per share decreased from $0.08 per share to $0.06 per share. Similarly, our Return on Assets decreased to 1.4% from 2.2% and our Return on Equity decreased to 5.5% from 8.4%.Our adjusted Return on Assets, a non-GAAP measure, decreased to 2.2% from 3.7% and our adjusted Return on Equity, a non-GAAP measure, decreased to 8.8% from 14.7%. See Item 2. Management’s Discussion and Analysis of Financial Condition and Results of Operations-Non-GAAP Financial Measures for a discussion and reconciliation of Non-GAAP measures.
Revenue
| | | | Three Months Ended September 30, | | | | | Three Months Ended June 30, |
| | | | | | | | | | Period-to-Period | | | | | | | | | |
| | 2018 | | 2017 | | Change | 2019 | | 2018 | | Period-to-Period Change |
| | Amount | | Percentage of
Gross
Revenue | | Amount | | Percentage of
Gross
Revenue | | Amount | | Percentage | Amount | | Percentage of
Gross
Revenue | | Amount | | Percentage of
Gross
Revenue | | Amount | | Percentage |
| | (dollars in thousands) | (dollars in thousands) |
| Revenue: | | |
| Interest income | $ | 99,476 |
| | 96.6 | % | | $ | 80,122 |
| | 95.8 | % | | $ | 19,354 |
| | 24.2 | % | |
| Gain on sales of loans | — |
| | — |
| | 146 |
| | 0.2 |
| | (146 | ) | | (100.0 | ) | |
| Interest and finance income | | $ | 105,641 |
| | 95.8 | % | | $ | 92,209 |
| | 96.6 | % | | $ | 13,432 |
| | 14.6 | % |
| Other revenue | 3,523 |
| | 3.4 |
| | 3,398 |
| | 4.0 |
| | 125 |
| | 3.7 |
| 4,605 |
| | 4.2 |
| | 3,247 |
| | 3.4 |
| | 1,358 |
| | 41.8 |
|
| Gross revenue | $ | 102,999 |
| | 100.0 | % | | $ | 83,666 |
| | 100.0 | % | | $ | 19,333 |
| | 23.1 | % | $ | 110,246 |
| | 100.0 | % | | $ | 95,456 |
| | 100.0 | % | | $ | 14,790 |
| | 15.5 | % |
Gross revenue increased by $19.3$14.8 million, or 23.1%15.5%, from $83.7$95.5 million to $103$110.2 million. This increasegrowth was in part attributable to a $19.4$13.4 million, or 24.2%14.6%, increase in interest income, which was primarily driven by thea higher portfolio balance of loans being held on our balance sheet as evidenced by the 13% an 18% increase in Average Loans and Finance Receivables from $1.0 billion to $1.08 billion from $0.96$1.2 billion. The increase in interest income was also driven by the increase in weighted average APR on our loans.
Gain on sales of loans decreased by $0.1 million to $0 as no loans were sold in the quarter ending September 30, 2018.
Other revenue increased by $0.1$1.4 million, or 3.7%41.8%, primarily attributable to an increase in referral fees from other lenders and ODX revenue. This wasrevenue, and partially offset by a decrease in loan servicing fees and a decrease in marketing fees from our issuing bank partner.
Cost of Revenue
| | | | Three Months Ended September 30, | | | | | Three Months Ended June 30, |
| | | | | | | | | | Period-to-Period | | | | | | | | | |
| | 2018 | | 2017 | | Change | 2019 | | 2018 | | Period-to-Period Change |
| | Amount | | Percentage of
Gross
Revenue | | Amount | | Percentage of
Gross
Revenue | | Amount | | Percentage | Amount | | Percentage of
Gross
Revenue | | Amount | | Percentage of
Gross
Revenue | | Amount | | Percentage |
| | (dollars in thousands) | (dollars in thousands) |
| Cost of revenue: | | | | | | | | | | | | | | | | | | | | | | |
| Provision for loan losses | $ | 39,102 |
| | 38.0 | % | | $ | 39,582 |
| | 47.3 | % | | $ | (480 | ) | | (1.2 | )% | |
| Funding costs | 11,665 |
| | 11.3 |
| | 11,330 |
| | 13.5 |
| | 335 |
| | 3.0 |
| |
| Provision for credit losses | | $ | 42,951 |
| | 39.0 | % | | $ | 33,293 |
| | 34.9 | % | | $ | 9,658 |
| | 29.0 | % |
| Interest expense | | 11,381 |
| | 10.3 |
| | 12,245 |
| | 12.8 |
| | (864 | ) | | (7.1 | ) |
| Total cost of revenue | $ | 50,767 |
| | 49.3 | % | | $ | 50,912 |
| | 60.8 | % | | $ | (145 | ) | | (0.3 | )% | $ | 54,332 |
| | 49.3 | % | | $ | 45,538 |
| | 47.7 | % | | $ | 8,794 |
| | 19.3 | % |
Total cost of revenue increased by $8.8 million, or 19.3%, from $45.5 million to $54.3 million. Provision for loancredit losses decreasedincreased by $0.5$9.7 million, or 1.2%29.0%, from $39.6$33.3 million to $39.1$43.0 million. In accordance with GAAP, we recognize revenue on loans and finance receivables over their term, but provide for probable credit losses on the loans and finance receivables at the time they are originated. We then periodically adjust our estimate of those probable credit losses based on actual performance and changes in loss estimates. As a result, we believe that analyzingOur provision for loancredit losses as a percentage of originations, held for investment, rather than as a percentage of gross revenue, provides more useful insight into our operating performance. Our provision for loan losses as a percentage of originations held for investment, or the Provision Rate, decreasedincreased from 7.5%5.7% to 6.0%7.3%. The decreaseincrease in Provision Rate was primarily driven by the deterioration of loans originated in the Provision Rate is largely attributable to the tighteningsecond half of our2018, and a normalizing credit policies used to determine eligibility, pricing and loan size for certain customers. The tightening of our credit policies began in early 2017.environment.
Funding costs increasedInterest expense decreased by $0.3$0.9 million, or 3.0%7.1%, from $11.3$12.2 million to $11.7 million.$11.4 million. As a percentage of gross revenue, funding costsinterest expense decreased from 13.5%12.8% to 11.3%10.3%. The increasedecrease in funding costs, whichinterest expense was primarily attributable to increases in Average Funding Debt outstanding and benchmark rates, was partially offset by a decreasedecreases in interest rate spread (the applicable percentage rate above the benchmark interest rate charged by the lender). and was partially offset by increases in Average FundingDebt outstanding and benchmark rates. The Average Debt Outstanding increasedduring the second quarter of 2019 was $834.6 million, up 13.2%, from $710.6$737.1 million to $771.5 millionduring the second quarter of 2018, while our Cost of Funds Rate decreased from 6.4%6.6% to 6.0%5.5%.
Operating Expense
Total operating expense increased by $6.6 million, or 14.7%, from $45.3 million to $52.0 million. At June 30, 2019, we had 726 employees compared to 587 at December 31, 2018. Approximately half of the headcount increase reflects the additional Evolocity employees, with the majority of the other half attributable to Technology and Analytics employees. We increased our headcount and personnel-related costs across our business in order to support our growth strategy and expect headcount to further increase in the remainder of 2019 reflecting our investment in growth initiatives.
Given our focus on growth and profitability, we evaluate trends in our efficiency ratio as a key measure of our progress. Our efficiency ratio for the quarter ended June 30, 2019 was 47.1% which was an improvement from 47.5% for the quarter ended June 30, 2018. Our Adjusted Efficiency Ratio, a non-GAAP measure, increased from 43.1% for the quarter ended June 30, 2018
to 44.2% for the quarter ended June 30, 2019. See Item 2. Management’s Discussion and Analysis of Financial Condition and Results of Operations-Non-GAAP Financial Measures for a discussion and reconciliation of Adjusted Efficiency Ratio.
Sales and marketing
Marketing
|
| | | | | | | | | | | | | | | | | | | | |
| | Three Months Ended September 30, | | | | |
| | | | | | | | | | Period-to-Period |
| | 2018 | | 2017 | | Change |
| | Amount | | Percentage of
Gross
Revenue | | Amount | | Percentage of
Gross
Revenue | | Amount | | Percentage |
| | (dollars in thousands) |
| Sales and marketing | $ | 10,845 |
| | 10.5 | % | | $ | 11,903 |
| | 14.2 | % | | $ | (1,058 | ) | | (8.9 | )% |
|
| | | | | | | | | | | | | | | | | | | | |
| | Three Months Ended June 30, |
| | | | | | | | | | |
| | 2019 | | 2018 | | Period-to-Period Change |
| | Amount | | Percentage of
Gross
Revenue | | Amount | | Percentage of
Gross
Revenue | | Amount | | Percentage |
| | (dollars in thousands) |
| Sales and marketing | $ | 13,307 |
| | 12.1 | % | | $ | 11,432 |
| | 12.0 | % | | $ | 1,875 |
| | 16.4 | % |
Sales and marketing expense decreasedincreased by $1.1$1.9 million, or 9%16.4%, from $11.9$11.4 million to $10.8 million. The decrease was primarily attributable to a $0.7 million decrease in customer acquisition costs and a decrease of $0.6 million in syndication program costs. Additionally, radio/television advertising decreased by $0.4 million and occupancy costs decreased by $0.3 million due to the lease terminations which occurred during the first quarter of 2018. These decreased costs were partially offset by a $0.9 million increase in personnel-related costs.
Technology and analytics
|
| | | | | | | | | | | | | | | | | | | | |
| | Three Months Ended September 30, | | | | |
| | | | | | Period-to-Period |
| | 2018 | | 2017 | | Change |
| | Amount | | Percentage of
Gross
Revenue | | Amount | | Percentage of
Gross
Revenue | | Amount | | Percentage |
| | (dollars in thousands) |
| Technology and analytics | $ | 13,418 |
| | 13.0 | % | | $ | 11,748 |
| | 14.0 | % | | $ | 1,670 |
| | 14.2 | % |
Technology and analytics expense increased by $1.7 million, or 14%, from $11.7 million to $13.4$13.3 million. The increase was primarily attributable to a $1.3 million increase in personnel-related costs and a $0.6 milliondue to an increase in technology consultant spend. Thesehead count as well as the additional personnel related to our business combination with Evolocity. For the three months ended June 30, 2019, our direct marketing and other marketing spend increased by $0.4 million. Additionally, the prior period quarter benefited from a $0.2 million credit to occupancy expense related to lease terminations.
Technology and Analytics
|
| | | | | | | | | | | | | | | | | | | | |
| | Three Months Ended June 30, |
| | | | | | |
| | 2019 | | 2018 | | Period-to-Period Change |
| | Amount | | Percentage of
Gross
Revenue | | Amount | | Percentage of
Gross
Revenue | | Amount | | Percentage |
| | (dollars in thousands) |
| Technology and analytics | $ | 16,681 |
| | 15.1 | % | | $ | 12,799 |
| | 13.4 | % | | $ | 3,882 |
| | 30.3 | % |
Technology and analytics expense increased by $3.9 million, or 30.3%, from $12.8 million to $16.7 million. The increase was primarily attributable to $2.9 million of additional personnel-related costs wereas we continue to invest in our strategic initiatives and build our internal capabilities for the future. The increase also included higher software license related costs of $0.5 million and an impairment of our capitalized software assets of $0.9 million, partially offset by a $0.3decrease of $0.5 million decrease in technology depreciation.related consulting expenses.
Processing and servicingServicing
|
| | | | | | | | | | | | | | | | | | | | |
| | Three Months Ended September 30, | | | | |
| | | | | | Period-to-Period |
| | 2018 | | 2017 | | Change |
| | Amount | | Percentage of
Gross
Revenue | | Amount | | Percentage of
Gross
Revenue | | Amount | | Percentage |
| | (dollars in thousands) |
| Processing and servicing | $ | 5,302 |
| | 5.1 | % | | $ | 4,160 |
| | 5.0 | % | | $ | 1,142 |
| | 27.5 | % |
|
| | | | | | | | | | | | | | | | | | | | |
| | Three Months Ended June 30, |
| | | | | | |
| | 2019 | | 2018 | | Period-to-Period Change |
| | Amount | | Percentage of
Gross
Revenue | | Amount | | Percentage of
Gross
Revenue | | Amount | | Percentage |
| | (dollars in thousands) |
| Processing and servicing | $ | 5,609 |
| | 5.1 | % | | $ | 5,041 |
| | 5.3 | % | | $ | 568 |
| | 11.3 | % |
Processing and servicing expense increased by $1.1$0.6 million, or 28%11.3%, from $4.2$5.0 million to $5.3$5.6 million. The increase was driven by an increase personnel related expenses of $0.1 million and an increase in other processing expenses of $0.4 million.
General and Administrative
|
| | | | | | | | | | | | | | | | | | | | |
| | Three Months Ended June 30, |
| | | | | | |
| | 2019 | | 2018 | | Period-to-Period Change |
| | Amount | | Percentage of
Gross
Revenue | | Amount | | Percentage of
Gross
Revenue | | Amount | | Percentage |
| | (dollars in thousands) |
| General and administrative | $ | 16,353 |
| | 14.8 | % | | $ | 16,034 |
| | 16.8 | % | | $ | 319 |
| | 2.0 | % |
General and administrative expense increased by $0.3 million, or 2.0%, from $16.0 million to $16.4 million. The increase was primarily attributable to a $0.6 million increaseincreases in personnel-related costs andof $1.6 million due to an increase in headcount as well as the additional personnel related to our business combination with Evolocity partially offset by a decrease in spend on professional fees during the three months ended June 30, 2019. The prior year period included a debt extinguishment charge of $0.5$1.4 million with no corresponding charge in costs associated with the increase of originations.current year period.
Provision for Income Taxes
General and administrative
|
| | | | | | | | | | | | | | | | | | | | |
| | Three Months Ended September 30, | | | | |
| | | | | | Period-to-Period |
| | 2018 | | 2017 | | Change |
| | Amount | | Percentage of
Gross
Revenue | | Amount | | Percentage of
Gross
Revenue | | Amount | | Percentage |
| | (dollars in thousands) |
| General and administrative | $ | 13,107 |
| | 12.7 | % | | $ | 9,440 |
| | 11.3 | % | | $ | 3,667 |
| | 38.8 | % |
|
| | | | | | | | | | | | | | | | | | | | |
| | Three Months Ended June 30, |
| | | | | | |
| | 2019 | | 2018 | | Period-to-Period Change |
| | Amount | | Percentage of
Gross
Revenue | | Amount | | Percentage of
Gross
Revenue | | Amount | | Percentage |
| | (dollars in thousands) |
| Provision for Income Taxes | $ | 1,796 |
| | 1.6 | % | | $ | — |
| | — | % | | $ | 1,796 |
| | — | % |
General and administrative expense increased by $3.7During the three months ended June 30, 2019 we recorded a provision for income taxes of $1.8 million, or 39%, from $9.4 million to $13.1 million.representing a quarterly effective tax rate of 45.3%. The increase was in part attributable to a $1.1 million increasethe effective tax rate from approximately 24% in personnel-related costs and a $0.6 million increase in loss on foreign currency transactions and holdingsthe first quarter of 2019 was driven by the decreased valuetiming of losses of our foreign currencies relativesubsidiaries combined with our revised forecast of 2019 U.S. taxable income. Through December 31, 2018, we had not been required to thepay any material U.S. dollar in the third quarterfederal or state income taxes nor any foreign income taxes because of 2018 compared to the third quarter of 2017. Additionally, we recorded a $0.5 million loss on the extinguishment of debt resulting from the write-off of the remaining balance of deferred issuance costs in connection with the prepayment of the ODAF debt during the third quarter of 2018. Recruiting fees increased by $0.7 million, travel spend increased by $0.3 million, and professional fees increased by $0.2 million.accumulated net operating losses.
Comparison of the Nine Months Ended Septembersix months ended June 30, 20182019 and 20172018
| | | | Nine Months Ended September 30, | | | | | Six Months Ended June 30, |
| | | | | | | | | | Period-to-Period | | | | | | | | | |
| | 2018 | | 2017 | | Change | 2019 | | 2018 | | Period-to-Period Change |
| | Amount | | Percentage of
Gross
Revenue | | Amount | | Percentage of
Gross
Revenue | | Amount | | Percentage | Amount | | Percentage of
Gross
Revenue | | Amount | | Percentage of
Gross
Revenue | | Amount | | Percentage |
| | (dollars in thousands) | (dollars in thousands) |
| Revenue: | | | | | | | | | | | | | | | | | | | | | | |
| Interest income | $ | 278,216 |
| | 96.3 | % | | $ | 250,954 |
| | 95.3 | % | | $ | 27,262 |
| | 10.9 | % | |
| Gain on sales of loans | — |
| | — |
| | 1,890 |
| | 0.7 |
| | (1,890 | ) | | (100.0 | ) | |
| Interest and finance income | | $ | 211,440 |
| | 96.0 | % | | $ | 178,438 |
| | 96.1 | % | | $ | 33,002 |
| | 18.5 | % |
| Other revenue | 10,681 |
| | 3.7 |
| | 10,365 |
| | 4.0 |
| | 316 |
| | 3.0 |
| 8,781 |
| | 4.0 |
| | 7,158 |
| | 3.9 |
| | 1,623 |
| | 22.7 |
|
| Gross revenue | 288,897 |
| | 100.0 |
| | 263,209 |
| | 100.0 |
| | 25,688 |
| | 9.8 |
| 220,221 |
| | 100.0 |
| | 185,596 |
| | 100.0 |
| | 34,625 |
| | 18.7 |
|
| Cost of revenue: | | | | | | | | | | | | | | | | | | | | | | |
| Provision for loan losses | 108,688 |
| | 37.6 |
| | 118,495 |
| | 45.0 |
| | (9,807 | ) | | (8.3 | ) | |
| Funding costs | 35,688 |
| | 12.4 |
| | 34,223 |
| | 13.0 |
| | 1,465 |
| | 4.3 |
| |
| Provision for credit losses | | 86,242 |
| | 39.2 |
| | 69,586 |
| | 37.5 |
| | 16,656 |
| | 23.9 |
|
| Interest expense | | 22,713 |
| | 10.3 |
| | 24,117 |
| | 13.0 |
| | (1,404 | ) | | (5.8 | ) |
| Total cost of revenue | 144,376 |
| | 50.0 |
| | 152,718 |
| | 58.0 |
| | (8,342 | ) | | (5.5 | ) | 108,955 |
| | 49.5 |
| | 93,703 |
| | 50.5 |
| | 15,252 |
| | 16.3 |
|
| Net revenue | 144,521 |
| | 50.0 |
| | 110,491 |
| | 42.0 |
| | 34,030 |
| | 30.8 |
| 111,266 |
| | 50.5 |
| | 91,893 |
| | 49.5 |
| | 19,373 |
| | 21.1 |
|
| Operating expenses: | | | | | | | | | | | | |
| Operating expense: | | | | | | | | | | | | |
| Sales and marketing | 32,875 |
| | 11.4 |
| | 42,090 |
| | 16.0 |
| | (9,215 | ) | | (21.9 | ) | 25,267 |
| | 11.5 |
| | 22,030 |
| | 11.9 |
| | 3,237 |
| | 14.7 |
|
| Technology and analytics | 37,224 |
| | 12.9 |
| | 41,960 |
| | 15.9 |
| | (4,736 | ) | | (11.3 | ) | 33,487 |
| | 15.2 |
| | 23,806 |
| | 12.8 |
| | 9,681 |
| | 40.7 |
|
| Processing and servicing | 15,564 |
| | 5.4 |
| | 13,521 |
| | 5.1 |
| | 2,043 |
| | 15.1 |
| 11,098 |
| | 5.0 |
| | 10,262 |
| | 5.5 |
| | 836 |
| | 8.1 |
|
| General and administrative | 46,866 |
| | 16.2 |
| | 30,917 |
| | 11.7 |
| | 15,949 |
| | 51.6 |
| 30,382 |
| | 13.8 |
| | 33,759 |
| | 18.2 |
| | (3,377 | ) | | (10.0 | ) |
| Total operating expenses | 132,529 |
| | 45.9 |
| | 128,488 |
| | 48.7 |
| | 4,041 |
| | 3.1 |
| |
| Income (loss) from operations | 11,992 |
| | 4.2 |
| | (17,997 | ) | | (6.7 | ) | | 29,989 |
| | 166.6 |
| |
| Other expense: | | | | | | | | | | | | |
| Interest expense | 157 |
| | 0.1 |
| | 706 |
| | 0.3 |
| | (549 | ) | | (77.8 | ) | |
| Total other expense: | 157 |
| | 0.1 |
| | 706 |
| | 0.3 |
| | (549 | ) | | (77.8 | ) | |
| Income (loss) before provision for income taxes | 11,835 |
| | 4.1 |
| | (18,703 | ) | | (7.0 | ) | | 30,538 |
| | 163.3 |
| |
| Total operating expense | | 100,234 |
| | 45.5 |
| | 89,857 |
| | 48.4 |
| | 10,377 |
| | 11.5 |
|
| Income (loss) from operations, before provision for income taxes | | 11,032 |
| | 5.0 |
| | 2,036 |
| | 1.1 |
| | 8,996 |
| | 441.8 |
|
| Provision for income taxes | — |
| | — |
| | — |
| | — |
| | — |
| | — |
| 3,536 |
| | 1.6 |
| | — |
| | — |
| | 3,536 |
| | — |
|
| Net income (loss) | 11,835 |
| | 4.1 |
| | (18,703 | ) | | (7.0 | ) | | 30,538 |
| | 163.3 |
| $ | 7,496 |
| | 3.4 | % | | $ | 2,036 |
| | 1.1 | % | | $ | 5,460 |
| | 268.2 | % |
| Less: Net income (loss) attributable to noncontrolling interest | (1,807 | ) | | (0.6 | ) | | (2,073 | ) | | (0.7 | ) | | 266 |
| | 12.8 |
| |
| Net income (loss) attributable to On Deck Capital, Inc. common stockholders | $ | 13,642 |
| | 4.7 | % | | $ | (16,630 | ) | | (6.3 | )% | | $ | 30,272 |
| | 182.0 | % | |
Net income (loss)
For the six months ended June 30, 2019, net income increased to $7.5 million from $2.0 million for the six months ended June 30, 2018 while adjusted net income, a non-GAAP measure, decreased to $15.0 million from $16.1 million over the same period. Basic earnings per share increased from $0.05 per share to $0.13 per share. Similarly, our Return on Assets increased to 1.6% from 0.7% while our Return on Equity increased to 6.5% from 2.7%.Our adjusted Return on Assets, a non-GAAP measure, decreased to 2.5% from 3.1% while our adjusted Return on Equity, a non-GAAP measure, decreased to 9.8% from 12.1%. See Item 2. Management’s Discussion and Analysis of Financial Condition and Results of Operations-Non-GAAP Financial Measures for a discussion and reconciliation of Non-GAAP measures.
Revenue
| | | | Nine Months Ended September 30, | | | | | Six Months Ended June 30, |
| | | | | | | | | | Period-to-Period | | | | | | | | | |
| | 2018 | | 2017 | | Change | 2019 | | 2018 | | Period-to-Period Change |
| | Amount | | Percentage of
Gross
Revenue | | Amount | | Percentage of
Gross
Revenue | | Amount | | Percentage | Amount | | Percentage of
Gross
Revenue | | Amount | | Percentage of
Gross
Revenue | | Amount | | Percentage |
| | (dollars in thousands) | (dollars in thousands) |
| Revenue: | | |
| Interest income | $ | 278,216 |
| | 96.3 | % | | $ | 250,954 |
| | 95.3 | % | | $ | 27,262 |
| | 10.9 | % | |
| Gain on sales of loans | — |
| | — |
| | 1,890 |
| | 0.7 |
| | (1,890 | ) | | (100.0 | ) | |
| Interest and finance income | | $ | 211,440 |
| | 96.0 | % | | $ | 178,438 |
| | 96.1 | % | | $ | 33,002 |
| | 18.5 | % |
| Other revenue | 10,681 |
| | 3.7 |
| | 10,365 |
| | 4.0 |
| | 316 |
| | 3.0 |
| 8,781 |
| | 4.0 |
| | 7,158 |
| | 3.9 |
| | 1,623 |
| | 22.7 |
|
| Gross revenue | $ | 288,897 |
| | 100.0 | % | | $ | 263,209 |
| | 100.0 | % | | $ | 25,688 |
| | 9.8 | % | $ | 220,221 |
| | 100.0 | % | | $ | 185,596 |
| | 100.0 | % | | $ | 34,625 |
| | 18.7 | % |
Gross revenue increased by $25.7$34.6 million, or 9.8%18.7%, from $263.2$185.6 million to $288.9$220.2 million. This increasegrowth was in part attributable to a $27.3$33.0 million, or 10.9%18.5%, increase in interest income, which was primarily driven by the higher balance of loans being held on our balance sheet as evidenced by the 17.7% increase of in Average Loans and Finance Receivables from $1.00$1.0 billion to $1.03$1.2 billion. The increase in interest income was also driven by the increase in weighted average APR on our loans.
Gain on sales of loans decreased by $1.9 million to zero as no loans were sold in the nine months ended September 30, 2018.
Other revenue increased by $0.3$1.6 million, or 3%22.7%,primarily attributable to an increase in referral fees from other lenders and ODX revenue. This wasrevenue, partially offset by a decrease in loan servicing fees and a decrease in marketing fees from our issuing bank partner.
Cost of Revenue
| | | | Nine Months Ended September 30, | | | | | Six Months Ended June 30, |
| | | | | | | | | | Period-to-Period | | | | | | | | | |
| | 2018 | | 2017 | | Change | 2019 | | 2018 | | Period-to-Period Change |
| | Amount | | Percentage of
Gross
Revenue | | Amount | | Percentage of
Gross
Revenue | | Amount | | Percentage | Amount | | Percentage of
Gross
Revenue | | Amount | | Percentage of
Gross
Revenue | | Amount | | Percentage |
| | (dollars in thousands) | (dollars in thousands) |
| Cost of revenue: | | | | | | | | | | | | | | | | | | | | | | |
| Provision for loan losses | $ | 108,688 |
| | 37.6 | % | | $ | 118,495 |
| | 45.0 | % | | $ | (9,807 | ) | | (8.3 | )% | |
| Funding costs | 35,688 |
| | 12.4 |
| | 34,223 |
| | 13.0 |
| | 1,465 |
| | 4.3 |
| |
| Provision for credit losses | | $ | 86,242 |
| | 39.2 | % | | $ | 69,586 |
| | 37.5 | % | | $ | 16,656 |
| | 23.9 | % |
| Interest expense | | 22,713 |
| | 10.3 |
| | 24,117 |
| | 13.0 |
| | (1,404 | ) | | (5.8 | ) |
| Total cost of revenue | $ | 144,376 |
| | 50.0 | % | | $ | 152,718 |
| | 58.0 | % | | $ | (8,342 | ) | | (5.5 | )% | $ | 108,955 |
| | 49.5 | % | | $ | 93,703 |
| | 50.5 | % | | $ | 15,252 |
| | 16.3 | % |
Total cost of revenue increased by $15.3 million, or 16.3% from $93.7 million to $109.0 million. Provision for loancredit losses. Provision for loan losses decreased increased by $9.8$16.7 million, or 8.3%23.9%, from $118.5$69.6 million to $108.7$86.2 million. In accordance with GAAP, we recognize revenue on loans and finance receivables over their term, but provide for probable credit losses on the loans and finance receivables at the time they are originated. We then periodically adjust our estimate of those probable credit losses based on actual performance and changes in loss estimates. As a result, we believe that analyzingOur provision for loancredit losses as a percentage of originations, held for investment, rather than as a percentage of gross revenue, provides more useful insight into our operating performance. Our provision for loan losses as a percentage of originations held for investment, or the Provision Rate, decreasedincreased from 7.8%5.9% to 6.0%7.0%. The decreaseincrease in Provision Rate was primarily driven by the deterioration of loans originated in the Provision Rate is largely attributable to the tighteningsecond half of our2018, and a normalizing credit policies used to determine eligibility, pricing and loan size for certain customers. The tightening of our credit policies began in early 2017.environment.
Funding costs. Funding costs increasedInterest expense decreased by $1.5$1.4 million, or 4.3%5.8%, from $34.2$24.1 million to $35.7$22.7 million. As a percentage of gross revenue, funding costsinterest expense decreased from 13.0% to 12.4%10.3%. The increasedecrease in funding costs, whichinterest expense was primarily attributable to an increase in benchmark rates, was partially offset by a decreasedecreases in interest rate spread (the applicable percentage rate above the benchmark interest rate charged by the lender). and was partially offset by increases in Average Debt outstanding and benchmark rates. The Average Funding Debt Outstanding decreasedduring the six months ended 2019 was $835.9 million up 16.5% from $737.9$717.7 million to $733.6 millionduring the six months ended 2018, while our Cost of Funds Rate increaseddecreased from 6.2%6.7% to 6.5%5.4%.
Operating Expense
Total operating expense increased by $10.4 million, or 11.5%, from $89.9 million to $100.2 million. At June 30, 2019, we had 726 employees compared to 587 at December 31, 2018. Approximately half of the headcount increase reflects the additional Evolocity employees, with the majority of the other half attributable to Technology and Analytics employees. We increased our headcount and personnel-related costs across our business in order to support our growth strategy and expect headcount to further increase in the remainder of 2019 reflecting investment in growth initiatives.
Given our focus on growth and profitability, we evaluate trends in our efficiency ratio as a key measure of our progress. Our efficiency ratio for the six months ended June 30, 2019 decreased to 45.5% from 48.4% for the six months ended June 30, 2018. Our Adjusted Efficiency Ratio, a non-GAAP measure, increased from 41.7% for the six months ended June 30, 2018 to 42.6% for the six months ended June 30, 2019. See Item 2. Management’s Discussion and Analysis of Financial Condition and Results of Operations-Non-GAAP Financial Measures for a discussion and reconciliation of Adjusted Efficiency Ratio.
Sales and marketing
Marketing
|
| | | | | | | | | | | | | | | | | | | | |
| | Nine Months Ended September 30, | | | | |
| | | | | | | | | | Period-to-Period |
| | 2018 | | 2017 | | Change |
| | Amount | | Percentage of
Gross
Revenue | | Amount | | Percentage of
Gross
Revenue | | Amount | | Percentage |
| | (dollars in thousands) |
| Sales and marketing | $ | 32,875 |
| | 11.4 | % | | $ | 42,090 |
| | 16.0 | % | | $ | (9,215 | ) | | (21.9 | )% |
|
| | | | | | | | | | | | | | | | | | | | |
| | Six Months Ended June 30, |
| | | | | | | | | | |
| | 2019 | | 2018 | | Period-to-Period Change |
| | Amount | | Percentage of
Gross
Revenue | | Amount | | Percentage of
Gross
Revenue | | Amount | | Percentage |
| | (dollars in thousands) |
| Sales and marketing | $ | 25,267 |
| | 11.5 | % | | $ | 22,030 |
| | 11.9 | % | | $ | 3,237 |
| | 14.7 | % |
Sales and marketing expense decreasedincreased by $9.2$3.2 million, or 21.9%14.7%, from $42.1$22.0 million to $32.9 million. The decrease was primarily attributable to a $3.5 million decrease in customer acquisition costs, a $1.2 million decrease in occupancy costs due to the lease terminations which occurred during the first quarter of 2018, and a decrease of $0.7 million in personnel-related costs. Additionally, radio/television advertising decreased by $1.2 million, syndication program costs decreased by $1.5 million and general marketing spend decreased by $0.7 million.
Technology and analytics
|
| | | | | | | | | | | | | | | | | | | |
| | Nine Months Ended September 30, | | | | |
| | | | | | | | | | Period-to-Period |
| | 2018 | | 2017 | | Change |
| | Amount | | Percentage of
Gross
Revenue | | Amount | | Percentage of
Gross
Revenue | | Amount | | Percentage |
| | (dollars in thousands) |
| Technology and analytics | $ | 37,224 |
| | 12.9 | % | | 41,960 |
| | 15.9 | % | | $ | (4,736 | ) | | (11.3 | )% |
Technology and analytics expense decreased by $4.7 million, or 11.3%, from $42.0 million to $37.2 million. The decrease was primarily attributable to a $3.8 million decrease in personnel-related costs. Additionally, there was a $0.7 million decrease in occupancy costs due to the lease terminations which occurred during the first quarter of 2018 and a $1.1 million decrease in technology depreciation. This was partially offset by a $1.1 million increase in technology consultant spend.
Processing and servicing
|
| | | | | | | | | | | | | | | | | | | | |
| | Nine Months Ended September 30, | | | | |
| | | | | | Period-to-Period |
| | 2018 | | 2017 | | Change |
| | Amount | | Percentage of
Gross
Revenue | | Amount | | Percentage of
Gross
Revenue | | Amount | | Percentage |
| | (dollars in thousands) |
| Processing and servicing | $ | 15,564 |
| | 5.4 | % | | $ | 13,521 |
| | 5.1 | % | | $ | 2,043 |
| | 15.1 | % |
Processing and servicing expense increased by $2.0 million, or 15.1%, from $13.5 million to $15.6$25.3 million. The increase was primarily attributable to a $1.5$2.0 million increase in personnel-related costs and anas well as a $0.3 million increase of $1.0 million in costs associated withgeneral marketing spend. Additionally, the increase of originations and loan servicing. This was partially offset byprior period benefited from a decrease in occupancy costs of $0.6 million duecredit to theour occupancy expense related to lease terminations which occurred during the first quarter of 2018.terminations.
General
Technology and administrativeAnalytics
|
| | | | | | | | | | | | | | | | | | | | |
| | Nine Months Ended September 30, | | | | |
| | | | | | Period-to-Period |
| | 2018 | | 2017 | | Change |
| | Amount | | Percentage of
Gross
Revenue | | Amount | | Percentage of
Gross
Revenue | | Amount | | Percentage |
| | (dollars in thousands) |
| General and administrative | $ | 46,866 |
| | 16.2 | % | | $ | 30,917 |
| | 11.7 | % | | $ | 15,949 |
| | 51.6 | % |
|
| | | | | | | | | | | | | | | | | | | | |
| | Six Months Ended June 30, |
| | | | | | |
| | 2019 | | 2018 | | Period-to-Period Change |
| | Amount | | Percentage of
Gross
Revenue | | Amount | | Percentage of
Gross
Revenue | | Amount | | Percentage |
| | (dollars in thousands) |
| Technology and analytics | $ | 33,487 |
| | 15.2 | % | | $ | 23,806 |
| | 12.8 | % | | $ | 9,681 |
| | 40.7 | % |
GeneralTechnology and administrativeanalytics expense increased by $15.9$9.7 million, or 51.6%40.7%, from $30.9$23.8 million to $46.9$33.5 million. The increase was primarily attributable to $6.6 million of additional personnel-related costs as we continue to invest in our strategic initiatives and build our internal capabilities for the future. Additionally, we incurred an increase in software license expenditures, and other software expenses during the six months ended June 30, 2019.
Processing and Servicing
|
| | | | | | | | | | | | | | | | | | | | |
| | Six Months Ended June 30, |
| | | | | | |
| | 2019 | | 2018 | | Period-to-Period Change |
| | Amount | | Percentage of
Gross
Revenue | | Amount | | Percentage of
Gross
Revenue | | Amount | | Percentage |
| | (dollars in thousands) |
| Processing and servicing | $ | 11,098 |
| | 5.0 | % | | $ | 10,262 |
| | 5.5 | % | | $ | 836 |
| | 8.1 | % |
Processing and servicing expense increased by $0.8 million, or 8.1%, from $10.3 million to $11.1 million. The increase was primarily attributable to a $0.8 million increase in costs related to our in-house collection initiatives. Additionally, the prior period benefited from a $0.4 million credit to our occupancy expense related to lease terminations. Our increases in expense were slightly offset by a $0.3 million decrease in personnel-related costs.
General and Administrative
|
| | | | | | | | | | | | | | | | | | | | |
| | Six Months Ended June 30, |
| | | | | | |
| | 2019 | | 2018 | | Period-to-Period Change |
| | Amount | | Percentage of
Gross
Revenue | | Amount | | Percentage of
Gross
Revenue | | Amount | | Percentage |
| | (dollars in thousands) |
| General and administrative | $ | 30,382 |
| | 13.8 | % | | $ | 33,759 |
| | 18.2 | % | | $ | (3,377 | ) | | (10.0 | )% |
General and administrative expense decreased by $3.4 million, or 10.0%, from $33.8 million to $30.4 million. The decrease was primarily attributable to additional expenses incurred during the six months ended June 30, 2018, including a $5.7 million charge for asset disposals related to theour 2018 lease terminations as well as a $1.4 million debt extinguishment costs in the New York and Denver offices. We also hadsix months ended 2018. The decrease in expense was partially offset by a $3.5$2.4 million increase in personnel-related costs. Additionally,personnel related charges due to an expansion of headcount which included the addition of the Evolocity subsidiary.
Provision for Income Taxes
|
| | | | | | | | | | | | | | | | | | | | |
| | Six Months Ended June 30, |
| | | | | | |
| | 2019 | | 2018 | | Period-to-Period Change |
| | Amount | | Percentage of
Gross
Revenue | | Amount | | Percentage of
Gross
Revenue | | Amount | | Percentage |
| | (dollars in thousands) |
| Provision for income taxes | $ | 3,536 |
| | 1.6 | % | | $ | — |
| | — | % | | $ | 3,536 |
| | — | % |
During the six months ended June 30, 2019 we recorded $1.9a provision for income taxes of $3.5 million, representing a year to date effective tax rate of debt extinguishment costs32.1%. Through December 31, 2018, we were not required to write off the remaining balancepay any material U.S. federal or state income taxes nor any foreign income taxes because of deferred issuance fees in connection with the extinguishment of the ODAST II 2016-1 debt and the ODAF debt in the nine month period ended September 30, 2018. The loss related to foreign currency transactions and holdings increased in the nine months ended September 30, 2018, increasing expenses by $3.1 million, driven by the decreased value in exchange rates relative to the U.S. dollar in the third quarter of 2018 compared to the third quarter of 2017. Recruiting costs increased by $1.3 million, consulting fees increased by $0.6 million and insurance costs decreased by $0.3 million in the current year period.accumulated net operating losses.
Liquidity and Capital Resources
During the thirdsecond quarter of 2018,2019, we originated $647.8$592 million of loans and during the ninesix months ended SeptemberJune 30, 20182019, we originated $1.8$1.2 billion of loans utilizing a diversified set of funding sources, including cash on hand, third-party lenders (through debt facilities and securitization), and the cash generated by our operating, investing and financing activities.
Cash on Hand
At SeptemberJune 30, 2018,2019, we had approximately $71$59 million of cash on hand to fund our future operations which was generally comparable to December 31, 2017.2018.
Current Debt Facilities
The following table summarizes our current debt facilities available for funding our lending activities, referred to as funding debt, and our operating expenditures, referred to as corporate debt, as of SeptemberJune 30, 2018.2019.
|
| | | | | | | | | | | |
| Maturity
Date | | Weighted
Average
Interest Rate at September 30, 2018 | | Borrowing
Capacity | | Principal
Outstanding |
| | | | | | (in millions) |
| Funding Debt: | | | | | |
| OnDeck Asset Securitization Trust II LLC | April 2022 (1) | | 3.8% | | $ | 225.0 |
| | $ | 225.0 |
|
| OnDeck Account Receivables Trust 2013-1 LLC | March 2019 | | 4.7% | | 214.1 |
| | 121.0 |
|
| Receivable Assets of OnDeck, LLC | November 2018 | | 5.3% | | 119.7 |
| | 111.5 |
|
| OnDeck Asset Funding II LLC | August 2022 (2) | | 4.4% | | 175.0 |
| | 111.1 |
|
| Prime OnDeck Receivable Trust II, LLC | December 2018 | | 4.7% | | 125.0 |
| | 110.6 |
|
| Loan Assets of OnDeck, LLC | October 2022 (3) | | 4.1% | | 100.0 |
| | 95.1 |
|
| Other Agreements | Various (4) | | 7.4% | | 81.4 |
| | 44.2 |
|
Total Funding Debt (5) | | | 4.6% | | $ | 1,040.2 |
| | $ | 818.5 |
|
| Corporate Debt: | | | | | | | |
| On Deck Capital, Inc. | October 2018 (6) | | 6.5% | | $ | 30.0 |
| | $ | — |
|
_________________________
(1)The period during which new borrowings may be made under this facility expires in March 2020.
(2)The period during which new borrowings may be made under this debt facility expires in August 2021.
(3) The period during which new borrowings may be made under this debt facility expires in April 2022.
(4) Maturity dates range from January 2020 through June 2021.
(5) May not sum due to rounding.
(6) In October 2018 the debt facility was amended to extend the maturity of the facility to January 2019. |
| | | | | | | | | | | |
| | Maturity
Date | | Weighted
Average
Interest Rate | | Borrowing
Capacity | | Principal
Outstanding |
| | | | | | (in millions) |
| Debt: | | | | | |
| OnDeck Asset Securitization Trust II LLC | April 2022 | (1) | 3.8% | | $ | 225.0 |
| | $ | 225.0 |
|
| OnDeck Account Receivables Trust 2013-1 LLC | March 2022 | (2) | 4.2% | | 180.0 |
| | 111.8 |
|
| Receivable Assets of OnDeck, LLC | September 2021 | (3) | 4.8% | | 119.7 |
| | 101.5 |
|
| OnDeck Asset Funding II LLC | August 2022 | (4) | 5.4% | | 175.0 |
| | 110.2 |
|
| Prime OnDeck Receivable Trust II, LLC | March 2022 | (5) | 4.4% | | 180.0 |
| | 108.9 |
|
| Loan Assets of OnDeck, LLC | October 2022 | (6) | 4.2% | | 150.0 |
| | 98.5 |
|
| Corporate Debt | January 2021 | | 5.4% | | 85.0 |
| (7) | 20.0 |
|
| Other Agreements | Various | (8) | 6.8% | (9) | 113.7 |
| (10) | 72.9 |
|
| Total Debt | | | 4.6% | | $ | 1,228.4 |
| | $ | 848.8 |
|
| |
(1) | The period during which new loans may be purchased under this securitization transaction expires in March 2020. |
| |
(2) | The period during which new borrowings may be made under this facility expires in March 2021. |
| |
(3) | The period during which new borrowings of Class A revolving loans may be made under this debt facility expires in December 2020. The $19.7 million of Class B borrowing capacity matures in December 2019. |
| |
(4) | The period during which new borrowings may be made under this facility expires in August 2021. |
| |
(5) | The period during which new borrowings may be made under this facility expires in March 2021. |
| |
(6) | The period during which new borrowings may be made under this debt facility expires in April 2022. |
| |
(7) | On July 19, 2019, the Company entered into an agreement which increased the commitment under its corporate revolving debt facility by $20 million, refer to Note 13 of Notes to Consolidated Financial Statements for additional information. |
| |
(8) | The periods during which new borrowings may be made under the various agreements expire between September 2019 and June 2020. Maturity dates range from September 2019 through December 2022. |
| |
(9) | Weighted Average Interest Rate as of June 30, 2019 reflects the credit facilities assumed as a part of the combination with Evolocity. |
| |
(10) | Outstanding amounts as of June 30, 2019 reflects the credit facilities assumed as a part of the combination with Evolocity. |
Our ability to fully utilize the available capacity of our debt facilities may also be impacted by restrictionsprovisions that limit concentration risk and eligibility. The debt facilities contain thresholds, known as concentration limitations, which restrict a debt facility’s collateral pool from being overly concentrated with loans that share pre-defined loan characteristics. In addition, debt facilities contain restrictions that limit the eligibility criteria of loans that may be financed, such as term length, loan amount and a borrower's home country. Loans that do not meet the criteria to be financed are referred to as ineligible loans. To the extent such concentration limits are exceeded or loans are deemed ineligible, newly originated loans with the pre-defined loan characteristics subject to that concentration limit or eligibility criteria may not be financed despite available capacity under the debt facilities.
OnDeck Marketplace
OnDeck Marketplace is our proprietary whole loan sale platform that allows participating third-party institutional investors to directly purchase small business loans from us. No loans were sold during the nine months ended September 30, 2018. During the nine months ended September 30, 2017, we soldloans with an unpaid principal balance of $55.5 million through OnDeck Marketplace. We may elect to make OnDeck Marketplace loan sales in the future to provide us an additional source of liquidity and to maintain active relationships with our institutional loan purchasers.
Cash and Cash Equivalents, Loans (Net of Allowance for LoanCredit Losses), and Cash Flows
The following table summarizes our cash and cash equivalents, loans (net of ALLL) and cash flows:
| | | | As of and for the Nine Months Ended September 30, | As of or for the Six Months Ended June 30, |
| | 2018 | | 2017 | 2019 | | 2018 |
| | (in thousands) | (in thousands) |
| Cash and cash equivalents | $ | 71,304 |
| | $ | 64,292 |
| $ | 58,744 |
| | $ | 74,262 |
|
| Restricted cash | $ | 48,919 |
| | $ | 56,729 |
| $ | 43,336 |
| | $ | 44,189 |
|
| Loans held for investment, net | $ | 984,184 |
| | $ | 852,331 |
| |
| Loans and finance receivables held for investment, net | | $ | 1,061,870 |
| | $ | 922,731 |
|
| Cash provided by (used in): | | | | | | |
| Operating activities | $ | 182,187 |
| | $ | 149,143 |
| $ | 136,559 |
| | $ | 118,764 |
|
| Investing activities | $ | (294,686 | ) | | $ | (119,652 | ) | $ | (125,412 | ) | | $ | (178,007 | ) |
| Financing activities | $ | 118,589 |
| | $ | (33,280 | ) | $ | (6,147 | ) | | $ | 64,277 |
|
Our cash and cash equivalents at SeptemberJune 30, 20182019 were held primarily for working capital purposes. We may, from time to time, use excess cash and cash equivalents to fund our lending activities. We do not enter into investments for trading or speculative purposes. Our policy is to invest any cash in excess of our immediate working capital requirements in short-term investments, deposit accounts or other arrangements designed to preserve the principal balance and providemaintain adequate liquidity. Accordingly, ourOur excess cash ismay
be invested primarily in demand depositovernight sweep accounts, money market instruments or similar arrangements that are currently providing only a minimal return.provide competitive returns consistent with our polices and market conditions.
Our restricted cash represents funds held in accounts as reserves on certain debt facilities and as collateral for issuing bank partner transactions. We have no ability to draw on such funds as long as they remain restricted under the applicable arrangements.arrangements but have the ability to use these funds to finance loan originations, subject to meeting borrowing base requirements. Our policy is to invest restricted cash held in debt facility related accounts in investments designed to preserve the principal balance and provide liquidity. Accordingly, such cash is invested primarily in money market instruments that offer daily purchase and redemption and provide competitive returns consistent with our policies and market conditions.
Cash Flows
Operating Activities
For the ninesix months ended SeptemberJune 30, 2018,2019, net cash provided by our operating activities was $182.2$136.6 million, which was primarily the result of interest payments from our customers of $320.4$245.8 million, less $107.0$86.3 million utilized to pay our operating expenses and $32.3$20.0 million we used to pay the interest on our debt (both funding and corporate).debt. During that same period, accounts payable and accrued expenses and other liabilities increased by approximately $1.8$3.1 million.
For the ninesix months ended SeptemberJune 30, 2017,2018, net cash provided by our operating activities was $149.1$118.8 million, which was primarily the result of our cash received from our customers, including interest payments and other revenue of $297.7 million, plus proceeds from sale of loans held for sale of $45.9$211.3 million, less $43.5 million of loans held for sale originations in excess of loan repayments received, $118.9$70.7 million utilized to pay our operating expenses $31.5and $21.4 million we used to pay the interest on our debt (both funding and corporate) and $1.1 million of origination costs paid in excess of fees collected.debt. During that same period, accounts payable and accrued expenses and other liabilities decreasedincreased by approximately $10.0$3.4 million.
Investing Activities
Our investing activities have consisted primarily of funding our term loan, and line of credit and finance receivable originations, including payment of associated direct costs and receipt of associated fees, offset by customer repayments of term loans, and lines of credit and finance receivables, purchases of property, equipment and software, capitalized internal-use software development costs and, historically, proceeds from the sale of term loans which were not specifically identified at origination through OnDeck Marketplaceas a loan held for sale. Purchases of property, equipment and software and capitalized internal-use software development costs may vary from period to period due to the timing of the expansion of our operations, the addition of employee headcount and the development cycles of our internal-use technology.
From time to time in the past, we have voluntarily purchased and may again in the future voluntarily purchase our loans that were previously sold to third parties. The circumstances under which we effect these transactions depends on a variety of factors. In determining whether to engage in a certain voluntary purchase transaction, we consider, among other things, our relationship with the potential seller, the potential purchase price, credit profile of the target loans, our overall liquidity position and possible alternative uses of cash. Although these purchases have not been material in the past, depending upon the circumstances, they could be material in the future, depending on the quantity and timing of these purchases.
For the ninesix months ended SeptemberJune 30, 2018,2019, net cash used to fund our investing activities was $294.7$125.4 million, and consisted primarily of $242.8$83.3 million of loan originations in excess of loan repayments received, $46.7$33.5 million of origination costs paid in excess of fees collected and $4.4$5.6 million for the purchase of property, equipment and software and capitalized internal-use software development costs.
For the ninesix months ended SeptemberJune 30, 2017,2018, net cash used to fund our investing activities was $119.7$178.0 million, and consisted primarily of $82.2$144.1 million of loan originations in excess of loan repayments received, $32.7$30.0 million of origination costs paid in excess of fees collected $13.7 million for the purchase of loans, a $12.3 million increase in restricted cash and $3.4$3.2 million for the purchase of property, equipment and software and capitalized internal-use software development costs. These uses of cash were partially offset by $12.4 million of proceeds from sales of loans held for investment.
Financing Activities
Our financing activities have consisted primarily of net borrowings from our securitization facility and our revolving debt facilities.
For the six months ended June 30, 2019, net cash used in our financing activities was $6.1 million and consisted primarily of $3.6 million in net additional debt repaid on our debt facilities as well asand $2.8 million of payments of debt issuance costs. These uses of cash were partially offset by $1.3 million of cash received from the issuance of common stock.stock under the employee stock purchase plan.
For the ninesix months ended SeptemberJune 30, 2018, net cash provided by our financing activities was $118.6$64.3 million and consisted primarily of $119.9$64.4 million in net additional debt drawn down from our debt facilities and $5.5$3.7 million of payments of debt issuance costs. These uses of cash were partially offset by $3.4 million of net cash received from noncontrolling interest, and $1.4 million of cash received from the issuance of common stock under the employee stock purchase plan.
For the nine months ended September 30, 2017, net cash used in financing activities was $33.3 million and consisted primarily of $34.0 million in net repayments on our securitization and debt facilities and $3.2 million of payments of debt issuance costs. These uses of cash were partially offset by $2.4 million of net cash received from noncontrolling interest, and $1.8$0.7 million of cash received from the issuance of common stock under the employee stock purchase plan.
Operating and Capital Expenditure Requirements
We require substantial liquidity to fund our current operating and capital expenditure requirements. We expect these requirements to increase as we pursue our growth strategy.
Our originations for the three months ended June 30, 2019 and 2018 were $592 million and $587 million, respectively. Our originations for the six months ended June 30, 2019 and 2018 were $1.23 billion and $1.18 billion, respectively.
Our strategy is to continue to grow in a disciplined manner while remaining highly focused on credit quality and operating leverage and profitability.leverage. We expect our originations to grow in absolute dollars for the full year 20182019 as compared to 2017. We2018.Because we will remain focused on credit quality, we are also prepared to forgo lending opportunities that do not meet our credit, underwriting and pricing standards. In addition, despite the continuing competition for customer response, we intend to allocate resources to continue to optimize marketing and customer acquisition costs based on targeted returns on investment rather than spending inefficiently in these areas to achieve incremental growth.
We estimate that at SeptemberJune 30, 2018,2019, approximately $322$352 million of our own cash had been invested in our loan portfolio, approximately two-thirdsone-half of which was used to fund our portfolio's residual value and the remainder was used to fund ineligible loans. While investingvalue. Investing in our portfolio's residual value is a requirement of our funding model and will remain a use of cash so long as we continue to grow loan balances, the use of cash to fund ineligible loans may be mitigated if and to the extent we obtain funding capacity that permits the funding of the ineligible loans, either through debt facilities or OnDeck Marketplace.
As of September 30, 2018, approximately $460 million of our funding debt capacity was scheduled to expire before September 30, 2019.
On April 13, 2018, our wholly-owned subsidiary, Loan Assets of OnDeck, LLC, established a new asset-backed revolving debt facility with a commitment amount of $100 million and an interest rate of 1-month LIBOR + 2.0%. The period during which new borrowings may be made under this facility expires on April 13, 2022 and the final maturity date is October 13, 2022.
On April 17, 2018, our wholly-owned subsidiary, OnDeck Asset Securitization Trust II LLC, issued $225 million in initial principal amount of fixed-rate asset backed offered notes in a securitization transaction. The notes were issued in four classes with a weighted average fixed interest rate of 3.75%. The revolving period expires on March 31, 2020 and the final maturity date is April 2022. The net proceeds of this transaction were used, together with other available funds, to voluntarily prepay in full all $250 million of notes from a prior securitization.
On June 27, 2018, our wholly-owned subsidiary of the Company, Canada OnDeck Asset Funding, L.P, established a new asset-backed revolving debt facility with a commitment amount of CAD25 million and an additional CAD25 million of capacity
available at the discretion of the lenders. The interest rate for the facility is a commercial paper rate + 4%. The period during which new borrowings may be made under this facility expires on June 27, 2020 and the final maturity date is June 27, 2021.
On June 28, 2018, OnDeck Funding Trust No. 2, a wholly-owned subsidiary of On Deck Capital Australia Pty Ltd, established a new asset-backed revolving debt facility with a commitment amount of AUD75 million. The interest rate for the facility is 1 Month BBSW+ 3.75%. The period during which new borrowings may be made under this facility expires on December 28, 2019 and the final maturity date is June 28, 2020.
On August 8, 2018, our wholly-owned subsidiary, OnDeck Asset Funding II LLC, established a new asset-backed revolving debt facility with a commitment amount of $175 million and an interest rate of 1-month LIBOR + 3.0%. The period during which new borrowings may be made under this facility expires on August 6, 2021 and the final maturity date is August 8, 2022. Concurrent with closing this facility, the Company optionally prepaid in full and terminated the $100 million asset-backed revolving debt facility by and between, among others, On Deck Asset Company, LLC, as borrower, and WM 2016-1, LLC, as administrative agent.
On August 14, 2018, our wholly-owned subsidiary, OnDeck Asset Funding I LLC, voluntarily prepaid in full and terminated the $150 million asset-backed revolving debt facility originally entered into in August 2016 by and between, among others, OnDeck Asset Funding I LLC, as borrower, and Ares Agent Services, L.P., as administrative agent.
On October 4, 2018, On Deck Capital, Inc. amended its existing $30 million revolving debt facility to extend the maturity date of the facility to January 2019 and made various technical, definitional, conforming and other changes.
In order to maintain or grow our loan originations over the next 12 months, we will be required to extend existing debt facilities that have borrowing period expirations or final maturities during that period and/or secure new funding. We currently expect to be able to do so on market terms.
balances.
We expect to use cash flow generated from operations together with additional cash we may obtain by financing currently ineligible loans,for various corporate purposes including to the extent that we are able to do so, to continuefund a portion of our lending activities including funding residual growth as our financed portfolio grows.growth. In addition, we may also finance our expected residual growth through other unused liquidityour available liquidly sources such as our corporate line of credit or possibleby introducing additional subordinated notes in our debt facilities.
As of June 30, 2019, $87 million of our capacity is scheduled to expire before June 30, 2020. In order to maintain and grow our current rate of loan originations over the next twelve months, we will be required to secure additional funding. We plan to do this through one or more of the following sources: new asset-backed securitization transactions, new debt facilities and extensions and increases to existing debt facilities. Historically we have been successful in accessing the asset-backed loan market on terms acceptable to us, and we anticipate that we will be able to do so into the foreseeable future. However, if we deem the cost of accessing the asset-backed loan market to be in excess of an appropriate rate, we may elect to use available cash, seek to increase the use of OnDeck Marketplace, or use other financing options available to us. Furthermore, we could decide to alter the types of loans we originate, such that more loans are eligible for credit facilities, or we could decide to slow down the rate of originations.
We believe that our cash flow from operations, available capacity under our revolving linesare currently in various stages of credit (and expected extensions or replacements of those lines) and existing cash balances, togetherdiscussions with additional financingmultiple potential funding sources. While we expect to be able to obtain additional capacity on market terms, are sufficient to meet both our existing operating and capital expenditure requirements and our currently planned growth for at least the next 12 months.
It is possiblethere can be no assurance that we may require capital in excess of amounts we currently anticipate. Althoughwill be successful.
In addition to pursuing funding as described above, although it is not currently anticipated, depending upon the circumstances we may seek additional equity financing. The sale or issuance of equity may result in dilution to our stockholders, and those securities may have rights senior to those of our common stock. If we raise additional funds through the issuance of additional debt, the agreements governing such debt could contain covenants that would restrict our operations and such debt would rank senior to shares of our common stock. Depending on
Our Board of Directors authorized the repurchase of up to $50 million of common stock with the shares to be retained in Treasury and available for possible reissuance. Any share repurchases under the program will be made from time to time in the open market, in privately negotiated transactions or otherwise. The timing and amount of any share repurchases will be subject to market conditions and other factors as we may notdetermine. The repurchase authorization expires August 31, 2020, however, we may suspend, modify or discontinue the program at any time in our discretion without prior notice.
We believe that our cash from operations, available capacity under our revolving lines of credit (and expected extensions or replacements of those lines), and existing cash balances, together with additional financing we expect to be able to obtain additionalon market terms, are sufficient to meet both our existing operating and capital expenditure requirements and our currently planned growth for our current operations or anticipated future growth on reasonable terms or at all.
least the next 12 months.
Contractual Obligations
Other than as described under the subheading "Liquidity and Capital Resources," and in Note 5 and Note 910 of Notes to Unaudited Condensed Consolidated Financial Statements, there have been no material changes in our commitments under contractual obligations from those disclosed in our Annual Report on Form 10-K for the year ended December 31, 2017.
As a result of the lease terminations described more fully in Note 9 of the Notes to Unaudited Condensed Consolidated Financial Statements, our contractual obligations under our operating leases have decreased subsequent to year-end by approximately $23.4 million. Our projected future cash payments related to our operating leases are as follows:
|
| | | | | | | | | | | | | | | | | | |
| Contractual Obligations | | Total | | 2018 | | 2019-2020 | | 2021-2022 | | Thereafter |
| | | (in thousands) |
| Operating leases | | $ 55,304 | | $ | 6,424 |
| | $ | 13,386 |
| | $ | 12,641 |
| | $ | 22,853 |
|
Off-Balance Sheet Arrangements
As of SeptemberJune 30, 2018,2019, we did not have any off-balance sheet arrangements, as defined in Item 303(a)(4)(ii) of Regulation S-K, such as the use of unconsolidated subsidiaries, structured finance, special purpose entities or variable interest entities.
Critical Accounting Policies and Significant Judgments and Estimates
There have been no material changes to our critical accounting policies and estimates as compared to those described in our Annual Report on Form 10-K for the year ended December 31, 2017.2018.
Our management’s discussion and analysis of our financial condition and results of operations areis based on our condensed consolidated financial statements, which have been prepared in accordance with GAAP. The preparation of these condensed consolidated financial statements requires us to make estimates and assumptions that affect the reported amounts of assets and liabilities, disclosure of
contingent assets and liabilities at the date of the condensed consolidated financial statements, and the reported amounts of revenue and expenses during the reported period. In accordance with GAAP, we base our estimates on historical experience and on various other assumptions that we believe are reasonable under the circumstances. Actual results may differ from these estimates under different assumptions or conditions.
Recently Issued Accounting Pronouncements and JOBS Act Election
RecentAccounting Pronouncements Not Yet Adopted
Refer to Note 1, Organization and Summary of Significant Accounting Policies, contained in the Notes to Unaudited Condensed Consolidated Financial Statements in Item 1 of Part I of this report for a full description of the recent accounting pronouncements and our expectation of their impact, if any, on our results of operations and financial conditions.conditions
Under the JOBS Act
We became a public company in December 2014, and since that time we meethave met the definition of an “emerging growth company.”company” under the JOBS Act. We have irrevocably elected to opt out of the extended transition period for complying with new or revised accounting standards pursuant to Section 107(b) of the JOBS Act. Our emerging growth company status will expire effective December 31, 2019.
|
| |
| Item 3. | Quantitative and Qualitative Disclosures About Market Risk |
There have been no material changes from the information previously reported under "Part II, Item 7A" of our Annual Report on Form 10-K for the year ended December 31, 2017.2018
|
| |
| Item 4. | Controls and Procedures |
DisclosureDisclosure Controls and Procedures
As required by Rule 13a-15 under the Exchange Act, management has evaluated, with the participation of our Chief Executive Officer and Chief Financial Officer, the effectiveness of our disclosure controls and procedures as of the end of the period covered by this report. Disclosure controls and procedures refer to controls and other procedures designed to ensure that information required to be disclosed in the reports we file or submit under the Exchange Act are recorded, processed, summarized, and reported within the time periods specified in the rules and forms of the SEC. Disclosure controls and procedures include, without limitation, controls and procedures designed to ensure that information required to be disclosed by us in our reports that we file or submit under the Exchange Act are accumulated and communicated to our management, including our Chief Executive Officer and Chief Financial Officer, as appropriate, to allow timely decisions regarding our required disclosure. In designing and evaluating our disclosure controls and procedures, management recognizes that any controls and procedures, no matter how well designed and operated, can provide only reasonable assurance of achieving the desired control objectives, and management was required to apply its judgment in evaluating and implementing possible controls and procedures.
Based on the foregoing evaluation, our Chief Executive Officer and Chief Financial Officer have concluded that, as of SeptemberJune 30, 2018,2019, the end of the period covered by this report, our disclosure controls and procedures were effective at a reasonable assurance level.
Changes in Internal Control over Financial Reporting
There were no changes in our internal control over financial reporting during the quarter ended SeptemberJune 30, 20182019 that have materially affected, or are reasonably likely to materially affect, our internal control over financial reporting.
PART II - OTHER INFORMATION
From time to time we are subject to legal proceedings and claims in the ordinary course of our business. The results of such matters cannot be predicted with certainty. However, we believe that the final outcome of any such current matters will not result in a material adverse effect on our consolidated financial condition, consolidated results of operations or consolidated cash flows.
Our current and prospective investors should carefully consider the following risks, in addition to those described in "Part I, Item 1A. Risk Factors" in our Annual Report on Form 10-K for the year ended December 31, 2017,2018, and other documents that we file with the SEC from time to time which are available on the SEC website at www.sec.gov, and all other information contained in this report, including our unaudited condensed consolidated financial statements and the related notes, “Management’s Discussion and Analysis of Financial Condition and Results of Operations” and the “Cautionary Note Regarding Forward-Looking Statements,” before making investment decisions regarding our securities. The risks and uncertainties described below supplement, or to the extent inconsistent, supersede those in our above-mentioned Annual Report on Form 10-K. In addition, the risks and uncertainties below and in our above-mentioned Annual Report on Form 10-K are not the only ones we face, but include the most significant factors currentlythen known by us. Additional risks and uncertainties that we are unaware of, or that we currently believe are not material, also may become important factors that affect us. If any of these risks materialize, our business, financial condition and results of operations could be materially harmed. In that case, the trading price of our securities could decline, and you may lose some or all of your investment.
Although we have decided to pursue obtaining a bank charter, there can be no assurances when we would obtain a bank charter, if at all, and whether we may do so either de novo or through a transaction.
On July 29, 2019, we announced that after careful consideration and analysis, we have decided to pursue obtaining a bank charter, either de novo or through a transaction.
There can be no assurances when we would obtain a bank charter, if at all, and whether we may do so either de novo or through a transaction. Since our formation, we have not been a bank, have not been regulated as a bank and do not have experience operating or managing a bank. Obtaining a bank charter is subject to significant regulatory requirements and consents, and we will not be able to obtain a bank charter, either de novo or through a transaction, without complying with applicable laws and regulations and obtaining required governmental approvals and consents. For example, if we were to attempt to acquire a commercial bank and become a bank holding company, we would be required to obtain the approval of federal and/or state bank regulatory agencies. Such approval process is time consuming, requires the submission of extensive information, is subject to considerations of safety and soundness, management capabilities and public convenience and needs, among other factors, and may be subject to regulatory delays. We may not receive any such required approvals and consents or we may not receive them in a timely manner, including as a result of factors or matters beyond our control.
Obtaining a bank charter, either de novo or through a transaction, would subject our business to significant new regulatory requirements that may significantly limit our operations and control the manner in which we conduct our business, which could have a material adverse effect on our business, financial condition and operating results.
U.S. banks and their holding companies are subject to extensive supervision and regulation by a number of governmental agencies, including one or more of the Board of Governors of the Federal Reserve System, the Office of the Comptroller of the Currency, the Federal Deposit Insurance Corporation, or the FDIC, and the Consumer Financial Protection Bureau and/or state banking supervisors. The statutes establishing these agencies and related regulations, which are generally intended to protect bank depositors and customers rather than stockholders, govern a comprehensive range of matters including:
ownership and control of stockholders;
acquisition of other companies and businesses;
permissible investments and activities;
maintenance of adequate capital levels;
sales practices;
anti-money laundering requirements;
an insolvency regime for insured depository institutions and the powers of the FDIC as receiver of insolvent insured depository institutions;
restrictions on repurchases of stock, dividends or other distributions by banking organizations;
restrictions on engaging in proprietary trading and investing in or sponsoring certain investment funds;
deposit insurance provided by the FDIC;
supervision and examination;
limitations on transactions between banks and their affiliates;
requirements of depository institutions to meet the credit needs of their local communities; and
enforcement actions and civil and criminal penalties for violations of banking statutes and regulations.
These and other regulations may significantly limit our operations and control the manner in which we conduct our business, including our lending practices, capital structure, investment practices, ability to effect stock repurchases (or pay dividends) and the scope of our activities, which could have a material adverse effect on our business, financial condition, operating results.
In addition, banks and bank holding companies generally are subject to rigorous capital requirements and are examined on a regular basis for their general safety and soundness and compliance with various federal and state legal regimes, including, but not limited to, the Dodd-Frank Act, the Community Reinvestment Act, the Truth in Lending Act, the Gramm-Leach-Bliley Act, the Equal Credit Opportunity Act, the Fair Credit Reporting Act and the Bank Secrecy Act, as amended by the USA PATRIOT Act of 2001. Any compliance failures (including actions by a banking organization prior to our acquisition of it if we were to
complete a transaction), or any failure by us or our subsidiaries to maintain satisfactory examination ratings or capital levels for any reason, could result in substantial penalties, requirements, and/or restrictions on our ability to conduct business. In addition, future legislation and government policy could adversely affect our operating results. We also would likely incur additional costs associated with such legal and regulatory compliance, which could adversely affect our operating results.
We cannot predict the impact our recent announcement regarding JPMorgan Chase Bank, National Association, or JPM, may have on our business or the business of ODX, but the impact could be material.
On July 29, 2019, we announced that effective August 3, 2019, JPM no longer intends to originate new small business loans through our platform hosting the Chase Business Quick Capital® program. We will continue to act as servicer for up to two years with respect to JPM’s loans previously originated through our platform. We took a $0.9 million impairment charge for the quarter ended June 30, 2019 for the remaining capitalized technology supporting JPM originations. We cannot predict the impact this announcement may have on our business or the business of ODX. For example, depending on how third parties react, it could make it more difficult for ODX to:
convert potential clients in its pipeline into actual clients (and even if they become actual clients, it could be more time consuming and expensive to do so);
retain an existing client;
attract potential clients willing to consider ODX’s solutions;
attract and/or to retain qualified employees necessary to support ODX’s business and growth plans and/ or remain competitive.
Any one or more of the foregoing could materially and adversely impact ODX’s opportunities and business prospects.
Adverse impacts at ODX could also impact OnDeck Capital, Inc. by requiring greater investment in ODX both in amount and duration. Similarly, OnDeck Capital, Inc. could find it more difficult to attract and/or retain qualified employees necessary to support its business and growth plans, which could negatively impact our consolidated financial results.
|
| |
| Item 2. | Unregistered Sales of Equity Securities and Use of Proceeds |
None.
|
| |
| Item 3. | Defaults Upon Senior Securities |
None.
|
| |
| Item 4. | Mine Safety Disclosures |
None.
Amendment and Restatement of BylawsNone.
On October 31, 2018, our board of directors adopted amendments to our third amended and restated bylaws as previously in effect and approved the further amendment and restatement of our bylaws to reflect the amendments approved on such date (as so amended, the “Amended and Restated Bylaws”). The Amended and Restated Bylaws were effective immediately.
The amendments changed Section 2.4(i)(a) of the bylaws to require our stockholders to provide advance notice, not less than 120 calendar days before the one-year anniversary of the date on which we mailed our previous year’s proxy statement, of any stockholder business to be acted upon at our next annual meeting of stockholders. Prior to the amendment, stockholders were required to provide advance notice no later than the 45th day, nor earlier than the 75th day, before the one-year anniversary of the date on which we mailed our previous year’s proxy statement.
The amendments changed Section 2.9 of the bylaws to require (i) that director nominees be elected by the affirmative vote of the majority of the votes cast by our stockholders and (ii) director nominees be elected by a plurality of the votes cast when the number of director nominees exceeds the number of directors to be elected. Prior to the amendment, all director nominees were required to be elected by a plurality of the voting power of the shares present at a stockholder meeting.
The amendments changed Section 2.14 of the bylaws to require that our board of directors appoint one or more inspectors of election prior to any stockholder meeting. Prior to the amendment, our board of directors was required to appoint either one or three inspectors of election prior to any stockholder meeting.
A copy of the Amended and Restated Bylaws is filed with this Quarterly Report on Form 10-Q as Exhibit 3.2.
.
The documents listed in the Exhibit Index of this report are incorporated by reference or are filed with this Quarterly Report on Form 10-Q, in each case as indicated therein (numbered in accordance with Item 601 of Regulation S-K).
|
| | | | | | | | |
Exhibit Number | | Description | | Filed / Incorporated by Reference from Form * | | Incorporated by Reference from Exhibit Number | | Date Filed |
| | | | 8-K | | 3.1 | | 12/22/2014 |
| | | | Filed herewith.
| | | | |
| | | | S-1 | | 4.1 | | 11/10/2014 |
| | | | S-1 | | 4.6 | | 11/10/2014 |
| | Credit Agreement, dated as of August 8, 2018, by and among OnDeck Asset Funding II LLC, as Company, the Lenders from time to time party thereto, Ares Agent Services, L.P., as Administrative Agent and Collateral Agent, and Wells Fargo Bank, N.A., as Paying Agent | | Filed herewith. | | | | |
| | | | Filed herewith. | | | | |
| | | | Filed herewith. | | | | |
| | | | Filed herewith. | | | | |
| | | | Filed herewith.
| | | | |
| 101.INS | | XBRL Instance Document | | Filed herewith. | | | | |
| 101.SCH | | XBRL Taxonomy Extension Schema Document | | Filed herewith. | | | | |
| 101.CAL | | XBRL Taxonomy Extension Calculation Linkbase Document | | Filed herewith. | | | | |
| 101.DEF | | XBRL Taxonomy Extension Definition Linkbase Document | | Filed herewith. | | | | |
101.LAB
| | XBRL Taxonomy Extension Labels Linkbase Document | | Filed herewith. | | | | |
| 101.PRE | | XBRL Taxonomy Extension Presentation Linkbase Document | | Filed herewith. | | | | |
|
| |
* | All exhibits incorporated by reference to the Registrant's Form S-1 or S-1/A registration statements relate to Registration No. 333-200043 |
SIGNATURES
Pursuant to the requirements of Section 13 or 15(d) of the Securities Exchange Act of 1934, the registrant has duly caused this report to be signed on its behalf by the undersigned, thereunto duly authorized.
|
| |
| | On Deck Capital, Inc. |
| | |
| | /s/ Kenneth A. Brause |
| | Kenneth A. Brause Chief Financial Officer (Principal Financial Officer) |
Date: November 6, 2018August 7, 2019 | |
|
| |
| | |
| | /s/ Nicholas Sinigaglia |
| | Nicholas Sinigaglia
Chief Accounting Officer
(Principal Accounting Officer) |
Date: November 6,August 7, 2019 | |
|
| | | | | | | | |
Exhibit Number | | Description | | Filed / Incorporated by Reference from Form * | | Incorporated by Reference from Exhibit Number | | Date Filed |
| | | | 8-K | | 3.1 | | 12/22/2014 |
| | | | 10-Q | | 3.2 | | 11/6/2018 |
| | | | S-1 | | 4.1 | | 11/10/2014 |
| | | | Filed Herewith.** | | | | |
| | | | Filed herewith. | | | | |
| | | | Filed herewith. | | | | |
| | | | Filed herewith.
| | | | |
| | | | Filed herewith.
| | | | |
| 101.INS | | XBRL Instance Document | | Filed herewith.
| | | | |
| 101.SCH | | XBRL Taxonomy Extension Schema Document | | Filed herewith.
| | | | |
| 101.CAL | | XBRL Taxonomy Extension Calculation Linkbase Document | | Filed herewith.
| | | | |
| 101.DEF | | XBRL Taxonomy Extension Definition Linkbase Document | | Filed herewith.
| | | | |
101.LAB
| | XBRL Taxonomy Extension Labels Linkbase Document | | Filed herewith.
| | | | |
| 101.PRE | | XBRL Taxonomy Extension Presentation Linkbase Document | | Filed herewith.
| | | | |
|
| |
| * | All exhibits incorporated by reference to the Registrant's Form S-1 or S-1/A registration statements relate to Registration No. 333-200043 |
| ** | Supersedes Exhibit 10.4 filed with the Form 10-K for the year ended December 31, 2018 filed on March 1, 2019 |
| |