March 31, 2016, the effective rate of the term loan was approximately 3.98%. On April 1, 2016, the Partnership repaid all amounts outstanding under the Credit Agreement and the Credit Agreement was terminated.2020 | 14
(13) Commitments and Contingencies
Leases and Unconditional Purchase Obligations
The minimum required payments for the Partnership’s operating leases and unconditional purchase obligations are as follows:
|
| | | | | | | |
| Operating Leases | | Unconditional Purchase Obligations |
| | | | |
| | (in thousands) |
| Three months ending December 31, 2017 | $ | 1,162 |
| | $ | 8,907 |
|
| Year Ending December 31, | | | |
| 2018 | 4,424 |
| | 17,321 |
|
| 2019 | 3,676 |
| | 12,099 |
|
| 2020 | 3,138 |
| | 6,978 |
|
| 2021 | 2,955 |
| | 5,572 |
|
| Thereafter | 3,039 |
| | 54,386 |
|
| | $ | 18,394 |
| | $ | 105,263 |
|
CRNF leases railcars and facilities under long-term operating leases. Lease expense included in cost of materials and other for the three months ended September 30, 2017 and 2016 totaled approximately $1.2 million and $1.3 million, respectively. Lease expense included in cost of materials and other for the nine months ended September 30, 2017 and 2016 totaled approximately $3.7 million and $3.6 million, respectively. The lease agreements have various remaining terms. Some agreements are renewable, at CRNF’s option, for additional periods. It is expected, in the ordinary course of business, that leases may be renewed or replaced as they expire. The Partnership leases railcars from a related party, which is included in the operating lease commitments shown above. See Note 14 ("Related Party Transactions") for further discussion.
CVR PARTNERS, LP AND SUBSIDIARIES
NOTES TO THE CONDENSED CONSOLIDATED FINANCIAL STATEMENTS (Continued)
September 30, 2017
(unaudited)
contract amounts. Contracts requiring prepayment are generally short-term in nature and, as discussed above, revenue is recognized at the point in time in which the customer obtains control of the product.
CRNF’s purchase obligation
A summary of the deferred revenue activity for pet coke fromthe three months ended March 31, 2020 is presented below:
| | | | | | | |
| (in thousands) | | | |
| Balance at December 31, 2019 | $ | 27,841 | | | |
| Add: | | | |
| New prepay contracts entered into during the period (1) | 16,725 | | | |
| Less: | | | |
| Revenue recognized that was included in the contract liability balance at the beginning of the period | 5,581 | | | |
| Revenue recognized related to contracts entered into during the period | 1,185 | | | |
| Other changes | 166 | | | |
| Balance at March 31, 2020 | $ | 37,634 | | | |
(1) Includes $15.6 million where payment associated with prepaid contracts was collected as of March 31, 2020.
(10) Share-Based Compensation
A summary of compensation expense for the three months ended March 31, 2020 and 2019 is presented below:
| | | | | | | | | | | | | | | |
| Three Months Ended
March 31, | | | | | | |
| (in thousands) | 2020 | | 2019 | | | | |
| Phantom Units | $ | (259) | | | $ | 790 | | | | | |
Other Awards (1) | (218) | | | 318 | | | | | |
| Total share-based compensation expense | $ | (477) | | | $ | 1,108 | | | | | |
(1)Other awards include the allocation of compensation expense for certain employees of CVR Energy and certain of its subsidiaries who perform services for the Partnership under the services agreement with CVR Energy and the Limited Partnership Agreement, respectively, and participate in equity compensation plans of CVR Partners’ affiliates.
(11) Commitments and Contingencies
There have been no material changes in the Partnership’s commitments and contingencies disclosed in the 2019 Form 10-K. In the ordinary course of business, the Partnership may become party to lawsuits, administrative proceedings, and governmental investigations, including environmental, regulatory, and other matters. The outcome of these matters cannot always be predicted accurately, but the Partnership accrues liabilities for these matters if the Partnership has determined that it is probable a loss has been incurred and the loss can be reasonably estimated. While it is not possible to predict the outcome of such proceedings, if one or more of them were decided against us, the Partnership believes there would be no material impact on its consolidated financial statements.
NOTES TO THE CONDENSED CONSOLIDATED FINANCIAL STATEMENTS
(unaudited)
(12) Supplemental Cash Flow Information
Cash flows related to income taxes, interest, leases, and capital expenditures included in accounts payable are as follows:
| | | | | | | | | | | |
| Three Months Ended March 31, | | |
| (in thousands) | 2020 | | 2019 |
| Supplemental disclosures: | | | |
| Cash received for income taxes, net of payments | $ | (1) | | | $ | — | |
| Cash paid for interest | 49 | | | 53 | |
| Cash paid for amounts included in the measurement of lease liabilities: | | | |
| Operating cash flows from operating leases | 1,118 | | | 966 |
| Operating cash flows from finance leases | 2 | | | 9 |
| Financing cash flows from finance leases | 25 | | | 135 |
| | | |
| Non-cash investing activities: | | | |
| | | |
| Change in capital expenditures included in accounts payable | (1,117) | | | (668) | |
(13) Related Party Transactions
Effective January 1, 2020, the Partnership entered into a new Coffeyville Master Service Agreement (the “Coffeyville MSA”) between Coffeyville Resources Nitrogen Fertilizer LLC (“CRNF”) and Coffeyville Resources Refining & Marketing, LLC, an indirect, wholly-owned subsidiary of CVR Refining has been derived fromEnergy (“CRRM”) and a calculationnew Corporate Master Service Agreement (the “Corporate MSA”) between CRLLC and certain of its affiliates, including CVR GP and the Partnership and its subsidiaries. For a description of these agreements, see Note 9 (“Related Party Transactions”) in Part II, Item 8 of the average pet coke price paid to such subsidiary over2019 Form 10-K.
Activity associated with the preceding two-year period. See Note 14 ("Partnership’s related party arrangements for the three months ended March 31, 2020 and 2019is summarized below.
Related Party Transactions") for further discussion of the coke supply agreement.Activity
| | | | | | | | | | | | |
| Three Months Ended March 31, | | | |
| (in thousands) | 2020 | | 2019 | |
| Sales to related parties (1) | $ | 540 | | | $ | 2 | | |
| Purchases from related parties (2) | 5,938 | | | 8,985 | | |
| | | | |
| March 31, 2020 | | December 31, 2019 | |
| Prepaid expenses (3) | 60 | | | 249 | | |
| Due to related parties (4) | 949 | | | 7,826 | | |
CRNF is party
(1)Sales to a hydrogen purchase and sale agreement with a subsidiary of CVR Refining, pursuant to which CRNF agrees to pay a monthly fixed fee. See Note 14 ("Related Party Transactions") for further discussion of the hydrogen purchase and sale agreement.
CRNF is party to the Amended and Restated On-Site Product Supply Agreement with The BOC Group, Inc. (as predecessor in interest to Linde LLC). Pursuant to the agreement, which expires in 2020, CRNF is required to take as available and pay for the supply of oxygen and nitrogen to the fertilizer operation. Expenses associated with this agreement arerelated parties, included in directNet sales, consist primarily of sales of feedstocks and services to CRRM under the Coffeyville MSA.
(2)Purchases from related parties, included in Cost of materials and other, Direct operating expenses (exclusive of depreciation and amortization), and for the three months ended September 30, 2017Selling, general and 2016, totaled approximately $1.1 million and $1.0 million, respectively, and for the nine months ended September 30, 2017 and 2016, totaled approximately $3.2 million and $2.9 million, respectively.
CRNF is a party to aadministrative expenses, consist primarily of pet coke supply agreement with HollyFrontier Corporation. The term of this agreement ends in December 2017. The delivered cost of this pet coke isand hydrogen purchased from CRRM under the Coffeyville MSA.
(3)Prepaid expenses, included in cost of materialsPrepaid expenses and other current assets, are amounts paid for feedstocks and totaled approximately $1.0 million and $1.1 million, respectively, forservices provided by CRRM under the three months ended September 30, 2017 and 2016 and totaled approximately $3.0 million and $3.6 million, respectively, for the nine months ended September 30, 2017 and 2016.Coffeyville MSA.
EDNF is a party(4)Due to a utility service agreement with Jo-Carroll Energy, Inc. The term of this agreement ends in 2019 and includes certain charges on a take-or-pay basis. The cost of utilities isrelated parties, included in direct operating expenses (exclusiveAccounts payable to affiliates, Other current liabilities, and Other long-term liabilities, consist primarily of depreciationamounts payable for feedstocks and amortization)other supplies and amounts associated with this agreement totaled approximately $2.5 million for bothservices provided by CRRM and CRLLC under the three months ended September 30, 2017Coffeyville MSA and 2016Corporate MSA.
Property Exchange
On October 22, 2019, the audit committee of CVR Energy and totaled approximately $8.0 million and $4.3 million, respectively, for the nine months ended September 30, 2017 and 2016.
Commitments for natural gas purchases consistConflicts Committee of the following:board of directors of CVR GP each agreed to authorize the exchange of certain parcels of property owned by subsidiaries of CVR Energy with an equal number of parcels owned by subsidiaries of CVR Partners, all located in Coffeyville, Kansas (the “Property Exchange”). On
|
| | | |
| | September 30,
2017 |
| | |
| | (in thousands, except weighted average rate) |
| MMBtus under fixed-price contracts | 2,169 |
|
| Commitments to purchase natural gas | $ | 6,488 |
|
| Weighted average rate per MMBtu (1) | $ | 2.99 |
|
| | | | | | | | |
(1) | Weighted average rate per MMBtu is based on the fixed rates applicable to each contract, exclusive of transportation costs. | |
LitigationMarch 31, 2020 | 16
From time to time, the Partnership is involved in various lawsuits arising in the normal course of business, including environmental, health and safety ("EHS") matters described below under "Environmental, Health and Safety Matters." Liabilities, if any, related to such litigation are recognized when the related costs are probable and can be reasonably estimated. These provisions are reviewed at least quarterly and adjusted to reflect the impacts of negotiations, settlements, rulings, advice of legal counsel and other information and events pertaining to a particular case. It is possible that management’s estimates of the outcomes will change within the next year due to uncertainties inherent in litigation and settlement negotiations. There were no new proceedings or material developments in proceedings from those provided in the 2016 Form 10-K. In the opinion of management, the ultimate resolution of any other litigation matters is not expected to have a material adverse effect on the accompanying condensed consolidated financial statements. There can be no assurance that management’s beliefs or opinions with respect to liability for potential litigation matters are accurate.
CVR PARTNERS, LP AND SUBSIDIARIES
NOTES TO THE CONDENSED CONSOLIDATED FINANCIAL STATEMENTS (Continued)
September 30, 2017
(unaudited)
Environmental, Health and Safety Matters
The Partnership's subsidiaries are subject to various stringent federal, state and local EHS rules and regulations. Liabilities related to EHS matters are recognized when the related costs are probable and can be reasonably estimated. EstimatesFebruary 19, 2020, a subsidiary of these costs are based upon currently available facts, existing technology, site-specific costs and currently enacted laws and regulations. In reporting EHS liabilities, no offset is made for potential recoveries. All liabilities are monitored and adjusted regularly as new facts emerge or changes in laws or technology occur.
There have been no new developments or material changes to the environmental accruals or expected capital expenditures related to compliance with environmental matters from those provided in the 2016 Form 10-K. The Partnership believes its subsidiaries are in material compliance with existing EHS rules and regulations. There can be no assurance that the EHS matters which may develop in the future will not have a material adverse effect on the Partnership's business, financial condition or results of operations.
(14) Related Party Transactions
Related Party Agreements
CVR Partners and its subsidiaries are party to, or otherwise subject to certain agreements with CVR Energy and its subsidiaries (including CVR Refining and itsa subsidiary Coffeyville Resources Refining & Marketing, LLC ("CRRM")) that govern the business relations among each party including: the (i) Feedstock and Shared Services Agreement; (ii) Hydrogen Purchase and Sale Agreement; (iii) Coke Supply Agreement; (iv) Environmental Agreement; (v) Services Agreement; (vi) GP Services Agreement; and (vii) Limited Partnership Agreement. The agreements are described as in effect at September 30, 2017. Except as otherwise described below, there have been no new developments or material changes to these agreements from those provided in the 2016 Form 10-K.
Amounts owed toof CVR Partners andexecuted the Property Exchange agreement. This Property Exchange will enable each such subsidiary to create a more usable, contiguous parcel of land near its subsidiaries fromown operating footprint. CVR Energy and its subsidiaries with respect to these agreements are included in prepaid expenses and other current assets and other long-term assets on the Condensed Consolidated Balance Sheets. Conversely, amounts owed to CVR Energy and its subsidiaries by CVR Partners and its subsidiaries with respect to these agreements are included in accounts payable, personnel accruals and accrued expenses and other current liabilities on the Partnership's Condensed Consolidated Balance Sheets.
Feedstock and Shared Services Agreement
CRNF is party to a feedstock and shared services agreement with CRRM under which the two parties provide feedstock and other services to one another. These feedstocks and services are utilized in the respective production processes of CRRM's Coffeyville, Kansas refinery and CRNF's Coffeyville Facility. The agreement was amended and restated effective January 1, 2017.
Prior to January 1, 2017, CRNF and CRRM transferred hydrogen to one another pursuant to the feedstock and shared services agreement. CRNF is not required to sell hydrogen to CRRM if such hydrogen is required for operation of CRNF's Coffeyville Facility, if such sale would adversely affect the Partnership's classification as a partnership for federal income tax purposes, or if such sale would not be in CRNF's best interest. Net monthly sales of hydrogen to CRRM have been reflected as net sales for CVR Partners, when applicable. Net monthly receipts of hydrogen from CRRM have been reflected in cost of materials and other for CVR Partners, when applicable. For the three and nine months ended September 30, 2016, the net sales generated from the sale of hydrogen to CRRM were approximately $1.2 million and $2.9 million, respectively. At December 31, 2016, there was approximately $0.1 million included in accounts payable on the Condensed Consolidated Balance Sheets associated with net hydrogen purchases.
Beginning January 1, 2017, hydrogen purchases from CRRM are governed pursuant to the hydrogen purchase and sale agreement discussed below, but hydrogen sales to CRRM remain governed pursuant to the feedstock and shared services agreement. For the nine months ended September 30, 2017, the gross sales generated from the sale of hydrogen to CRRM pursuant to the feedstock and shared services agreement were approximately $0.1 million, which is included in net sales in the Condensed Consolidated Statements of Operations. There were no gross sales generated from the sale of hydrogen to CRRM for the three months ended September 30, 2017. The monthly hydrogen sales are cash settled net on a monthly basis with hydrogen purchases, pursuant to the hydrogen purchase and sale agreement.
CVR PARTNERS, LP AND SUBSIDIARIES
NOTES TO THE CONDENSED CONSOLIDATED FINANCIAL STATEMENTS (Continued)
September 30, 2017
(unaudited)
The feedstock and shared services agreement also provides a mechanism pursuant to which CRNF transfers a tail gas stream to CRRM. CRNF receives the benefit of eliminating a waste gas stream and recovers the fuel value of the tail gas system. For the three and nine months ended September 30, 2017 and 2016, the net sales generated from the sale of tail gas to CRRM were nominal. In April 2011, in connection with the tail gas stream transfers to CRRM, CRRM installed a pipe between the Coffeyville, Kansas refinery and the Coffeyville Facility to transfer the tail gas. CRNF agreed to pay CRRM the cost of installing the pipe and provide an additional 15% to cover the cost of capital, which was due from CRNF to CRRM over four years. At both September 30, 2017 and December 31, 2016, there were assets of approximately $0.2 million included in prepaid expenses and other current assets and approximately $0.5 million and $0.6 million, respectively, included in other long-term assets in the Condensed Consolidated Balance Sheets.
At September 30, 2017 and December 31, 2016, receivables of $0.1 million and $0.3 million, respectively, were included in prepaid expenses and other current assets on the Condensed Consolidated Balance Sheets for amounts yet to be received related to components of the feedstock and shared services agreement, other than amounts related to hydrogen transfers and tail gas discussed above. At September 30, 2017 and December 31, 2016, current obligations of approximately $0.8 million and $0.9 million were included in accounts payable on the Condensed Consolidated Balance Sheets associated with unpaid balances related to components of the feedstock and shared services agreement.
Hydrogen Purchase and Sale Agreement
CRNF and CRRM entered into a hydrogen purchase and sale agreement that was effective on January 1, 2017, pursuant to which CRRM agrees to sell and deliver a committed hydrogen volume of 90,000 mscf per month, and CRNF agrees to purchase and receive the committed volume. The committed volume pricing is based on a monthly fixed fee (based on the fixed and capital charges associated with producing the committed volume) and a monthly variable fee (based on the natural gas price associated with hydrogen actually received). In the event CRNF fails to take delivery of the full committed volume in a month, CRNF remains obligated to pay CRRM for the monthly fixed fee and the monthly variable fee based upon the actual hydrogen volume received, if any. In the event CRRM fails to deliver any portion of the committed volume for the applicable month for any reason other than planned repairs and maintenance, CRNF will be entitled to a pro-rata reduction of the monthly fixed fee. CRNF also has the option to purchase excess volume of up to 60,000 mscf per month, or more upon mutual agreement, from CRRM, if available for purchase.
A portion of the monthly variable fee, as defined in the terms of the agreement, is determined according to the natural gas costs incurred by CRRM in operation of the hydrogen plant, which will reflect market-driven changes in the natural gas prices. In addition, certain fixed fees will be adjusted on an annual basis according to the changes in a cost index, as defined in the terms of the agreement.
CRRM is not required to sell hydrogen to CRNF if such sale would adversely affect CVR Refining’s classification as a partnership for federal income tax purposes, and is not required to sell hydrogen to CRNF in excess of the committed volume if such volumes are needed for CRRM’s operations.
The agreement has an initial term of 20 years and will be automatically extended following the initial term for additional successive five-year renewal terms unless either party gives 180 days written notice. Certain fees under the agreement are subject to modification after this initial term. The agreement contains customary terms related to indemnification, as well as termination for breach, by mutual consent, or due to insolvency or cessation of operations.
For the three and nine months ended September 30, 2017, the cost of hydrogen purchases from CRRM was approximately $0.9 million and $3.0 million, respectively, which were included in cost of materials and other in the Condensed Consolidated Statement of Operations. The monthly hydrogen purchases are cash settled net on a monthly basis with hydrogen sales pursuant to the feedstock and shared services agreement. At September 30, 2017, current obligations, net of any amounts due to CRNF under the feedstock and shared services agreement for hydrogen, of approximately $0.4 million were included in accounts payable on the Condensed Consolidated Balance Sheets associated with net hydrogen purchases from CRRM.
CVR PARTNERS, LP AND SUBSIDIARIES
NOTES TO THE CONDENSED CONSOLIDATED FINANCIAL STATEMENTS (Continued)
September 30, 2017
(unaudited)
Coke Supply Agreement
CRNF is party to a coke supply agreement with CRRM pursuant to which CRRM supplies CRNF with pet coke. This agreement provides that CRRM must deliver to CRNF during each calendar year an annual required amount of pet coke equal to the lesser of
(i) 100 percent of the pet coke produced at CRRM's Coffeyville, Kansas petroleum refinery or (ii) 500,000 tons of pet coke. CRNF is also obligated to purchase this annual required amount. If during a calendar month CRRM produces more than 41,667 tons of pet coke, then CRNF will have the option to purchase the excess at the purchase price provided for in the agreement. If CRNF declines to exercise this option, CRRM may sell the excess to a third party.
CRNF obtains most (over 70% on average during the last five years) of the pet coke it needs from CRRM's adjacent crude oil refinery pursuant to the pet coke supply agreement, and procures the remainder through a contract with HollyFrontier Corporation and on the open market. The price CRNF pays pursuant to the pet coke supply agreement is based on the lesser of a pet coke price derived from the price received for UAN (the "UAN-based price") or a pet coke price index. The UAN-based price begins with a pet coke price of $25 per ton based on a price per ton for UAN that excludes transportation cost ("netback price") of $205 per ton, and adjusts up or down $0.50 per ton for every $1.00 change in the netback price. The UAN-based price has a ceiling of $40 per ton and a floor of $5 per ton.
CRNF will pay any taxes associated with the sale, purchase, transportation, delivery, storage or consumption of the pet coke. CRNF is entitled to offset any amount payable for the pet coke against any amount due from CRRM under the feedstock and shared services agreement between the parties.
The cost of pet coke associated with the transfer of pet coke from CRRM to CRNF were approximately $0.6 million and $0.5 million for the three months ended September 30, 2017 and 2016, respectively, which was recorded in cost of materials and other. For the nine months ended September 30, 2017 and 2016, these expenses were approximately $1.6 million and $1.7 million, respectively. Payables of approximately $0.1 million related to the coke supply agreement were included in accounts payable on the Condensed Consolidated Balance Sheets at both September 30, 2017 and December 31, 2016.
Services Agreement
CVR Partners obtains certain management and other services from CVR Energy pursuant to a services agreement between the Partnership CVR GP and CVR Energy.
Net amounts incurred under the services agreementaccounted for the three and nine months ended September 30, 2017 and 2016 were as follows:
|
| | | | | | | | | | | | | | | |
| | Three Months Ended
September 30, | | Nine Months Ended
September 30, |
| | 2017 | | 2016 | | 2017 | | 2016 |
| | | | | | | | |
| | (in thousands) |
| Direct operating expenses (exclusive of depreciation and amortization) — Affiliates | $ | 766 |
| | $ | 976 |
| | $ | 2,158 |
| | $ | 2,616 |
|
| Selling, general and administrative expenses — Affiliates | 3,239 |
| | 2,939 |
| | 9,398 |
| | 8,562 |
|
| Total | $ | 4,005 |
| | $ | 3,915 |
| | $ | 11,556 |
| | $ | 11,178 |
|
For services performed in connection with the services agreement, the Partnership recognized personnel costs, excluding amounts related to share-based compensation that are disclosed in Note 5 ("Share‑Based Compensation"), of $1.8 million and $1.7 million, respectively, for the three months ended September 30, 2017 and 2016. For services performed in connection with the services agreement, the Partnership recognized personnel costs, excluding amounts related to share-based compensation, of $5.0 million for both the nine months ended September 30, 2017 and 2016. At September 30, 2017 and December 31, 2016, current obligations of $3.7 million and $3.5 million, respectively, were included in accounts payable and accrued expenses and other current liabilities on the Condensed Consolidated Balance Sheets with respect to amounts billedthis transaction in accordance with the services agreement.ASC 805-50 guidance on transferring assets between entities under common control. This transaction resulted in a net reduction to the Partnership’s partners’ capital of approximately $0.1 million.
Distributions to CVR Partners’ Unitholders
Distributions, if any, including the payment, amount, and timing thereof, are subject to change at the discretion of Contents
the Board of Directors of CVR PARTNERS, LP AND SUBSIDIARIES
NOTES TO THE CONDENSED CONSOLIDATED FINANCIAL STATEMENTS (Continued)
September 30, 2017
(unaudited)
Limited Partnership Agreement
The partnership agreement provides thatPartners’ general partner. There were 0 distributions paid by the Partnership will reimburse its general partner for all direct and indirect expenses it incurs or payments it makes on behalf of the Partnership (including salary, bonus, incentive compensation and other amounts paid to any person to perform services for the Partnership or for its general partner in connection with operating the Partnership). Pursuant to the partnership agreement, the Partnership incurred approximately $0.8 million and $0.7 million for the three months ended September 30, 2017 and 2016, respectively, primarily for personnel costs related to the compensation of executives at the general partner, who manage the Partnership's business. For the nine months ended September 30, 2017 and 2016, approximately $2.4 million and $2.9 million were incurred related to amounts due for reimbursement, respectively. At September 30, 2017 and December 31, 2016, current obligations of $1.9 million and $2.0 million, respectively, were included in personnel accruals on the Condensed Consolidated Balance Sheets related to amounts outstanding in accordance with the limited partnership agreement.
Insight Portfolio Group
Insight Portfolio Group LLC ("Insight Portfolio Group") is an entity formed by Mr. Carl C. Icahn in order to maximize the potential buying power of a group of entities with which Mr. Icahn has a relationship in negotiating with a wide range of suppliers of goods, services and tangible and intangible property at negotiated rates. In January 2013, CVR Energy acquired a minority equity interest in Insight Portfolio Group. The Partnership participates in Insight Portfolio Group’s buying group through its relationship with CVR Energy. The Partnership may purchase a variety of goods and services as members of the buying group at prices and on terms that management believes would be more favorable than those which would be achieved on a stand-alone basis. Transactions with Insight Portfolio Group for each of the reporting periods were nominal.
CRLLC Facility
On April 1, 2016, in connection with the closing of the East Dubuque Merger, the Partnership entered into the CRLLC Facility. See Note 12 ("Debt") for further discussion.
Parent Affiliate Units
In March 2016, CVR Energy purchased 400,000 CVR Nitrogen common units, representing approximately 1% of the outstanding CVR Nitrogen limited partner interests. CVR Energy did not receive merger consideration for these designated CVR Nitrogen common units. Subsequent to the East Dubuque Merger, the Partnership purchased 400,000 CVR Nitrogen common units from CVR Energy during the three months ended June 30, 2016 for $5.0 million.
Railcar Lease Agreements and Maintenance
CRNF has agreements to lease a total of 115 UAN railcars from ARI Leasing, LLC ("ARI"), a company controlled by IEP. The lease agreements will expire in 2023. For the three and nine months ended September 30, 2017, rent expense of approximately $0.2 million and $0.7 million, respectively, was recorded in cost of materials and other in the Condensed Consolidated Statement of OperationsMarch 31, 2020 related to these agreements. Rent expense related to these agreementsthe fourth quarter of 2019, and 0 distributions were nominaldeclared for the three and nine months ended September 30, 2016.
In the secondfirst quarter of 2017, CRNF entered into an agreement2020.
The following table presents distributions paid by the Partnership to lease an additional 70 UAN railcars from ARI. The lease agreement has a term of 5 years. The Partnership obtained physical receipt of the majority of the leased railcars and associated lease payment obligations commencedCVR Partners’ unitholders, including amounts paid to CVR Energy, during the third quarter of 2017. Almost all of the additional railcars were received in October 2017.2019.
| | | | | | | | | | | | | | | | | | | | | | | | | | | | | | | | |
| | | | | | Distributions Paid (in thousands) | | | | |
| Related Period | | Date Paid | | Distribution Per
Common Unit | | Public Unitholders | | CVR Energy | | Total |
| 2018 - 4th Quarter | | March 11, 2019 | | $ | 0.12 | | | $ | 8,924 | | | $ | 4,670 | | | $ | 13,594 | |
| 2019 - 1st Quarter | | May 13, 2019 | | 0.07 | | | 5,205 | | | 2,724 | | | 7,929 | |
| 2019 - 2nd Quarter | | August 12, 2019 | | 0.14 | | | 10,411 | | | 5,449 | | | 15,860 | |
| 2019 - 3rd Quarter | | November 11, 2019 | | 0.07 | | | 5,205 | | | 2,724 | | | 7,930 | |
| Total distributions | | | | $ | 0.40 | | | $ | 29,745 | | | $ | 15,567 | | | $ | 45,313 | |
American Railcar Industries, Inc., a company controlled by IEP, performed railcar maintenance for CRNF and the expense associated with this maintenance was approximately $0.2 million for the nine months ended September 30, 2017 and was included in cost of materials and other in the Condensed Consolidated Statement of Operations. There were no expenses associated with this maintenance for the three months ended September 30, 2017.
Item 2. Management’s Discussion and Analysis of Financial Condition andResults of Operations
The following discussion and analysis of our financial condition, results of operations, and cash flows should be read in conjunction with the unaudited condensed consolidated financial statements and related notes and with the statistical information and financial data appearing in this Report, as well as our Annual Report on Form 10-K for the 2016year ended December 31, 2019 filed with the Securities and Exchange Commission (“SEC”) on February 20, 2020 (the “2019 Form 10-K.10-K”). Results of operations for the three months ended March 31, 2020 and cash flows for the three and nine months ended September 30, 2017 and 2016March 31, 2020 are not necessarily indicative of results to be attained for any other period. See “Important Information Regarding Forward-Looking Statements”.
Forward-Looking Statements
This Report, including this Management’s Discussion and Analysis of Financial Condition and Results of Operations, contains "forward-looking statements" as defined by the Securities and Exchange Commission ("SEC"), including statements concerning contemplated transactions and strategic plans, expectations and objectives for future operations. Forward-looking statements include, without limitation:
statements, other than statements of historical fact, that address activities, events or developments that we expect, believe or anticipate will or may occur in the future;
statements relating to future financial or operational performance, future distributions, future capital sources and capital expenditures; and
any other statements preceded by, followed by or that include the words "anticipates," "believes," "expects," "plans," "intends," "estimates," "projects," "could," "should," "may" or similar expressions.
Although we believe that our plans, intentions and expectations reflected in or suggested by the forward-looking statements we make in this Report, including this Management’s Discussion and Analysis of Financial Condition and Results of Operations, are reasonable, we can give no assurance that such plans, intentions or expectations will be achieved. These statements are based on assumptions made by us based on our experience and perception of historical trends, current conditions, expected future developments and other factors that we believe are appropriate in the circumstances. Such statements are subject to a number of risks and uncertainties, many of which are beyond our control. You are cautioned that any such statements are not guarantees of future performance and that actual results or developments may differ materially from those projected in the forward-looking statements as a result of various factors, including but not limited to those set forth under the section captioned "Risk Factors" in the 2016 Form 10-K, filed with the SEC on February 21, 2017. Such factors include, among others:
our ability to make cash distributions on the common units;
the volatile nature of our business and the variable nature of our distributions;
the ability of our general partner to modify or revoke our distribution policy at any time;
the cyclical nature of our business;
the seasonal nature of our business;
the dependence of our operations on a few third-party suppliers, including providers of transportation services and equipment;
our reliance on pet coke that we purchase from CVR Refining;
our reliance on the natural gas and electricity that we purchase from third parties;
the supply and price levels of essential raw materials;
the risk of a material decline in production at our nitrogen fertilizer plants;
potential operating hazards from accidents, fire, severe weather, floods or other natural disasters;
competition in the nitrogen fertilizer businesses;
capital expenditures and potential liabilities arising from environmental laws and regulations;
existing and proposed environmental laws and regulations, including those relating to climate change, alternative energy or fuel sources, and the end-use and application of fertilizers;
new regulations concerning the transportation of hazardous chemicals, risks of terrorism and the security of chemical manufacturing facilities;
the risk of security breaches;
our lack of asset diversification;
our dependence on significant customers;
the potential loss of our transportation cost advantage over our competitors;
our partial dependence on customer and distributor transportation of purchased goods;
our potential inability to successfully implement our business strategies, including the completion of significant capital programs;
our reliance on CVR Energy’s senior management team and conflicts of interest they face operating each of CVR Partners, CVR Refining and CVR Energy;
the risk of labor disputes and adverse employee relations;
risks relating to our relationships with CVR Energy and CVR Refining;
control of our general partner by CVR Energy;
our ability to continue to license the technology used in our operations;
restrictions in our debt agreements;
changes in our treatment as a partnership for U.S. federal income or state tax purposes;
instability and volatility in the capital and credit markets; and
CVR Energy and its affiliates may compete with us.
All forward-looking statements contained in this Report speak only as of the date of this Report. We undertake no obligation to publicly update or revise any forward-looking statements to reflect events or circumstances that occur after the date of this Report, or to reflect the occurrence of unanticipated events, except to the extent required by law.
Partnership Overview
CVR Partners, LP ("(“CVR Partners,"Partners” or the "Partnership," "we," "us" or "our"“Partnership”) is a Delaware limited partnership formed in 2011 by CVR Energy, Inc. (“CVR Energy”) to own, operate, and grow our nitrogen fertilizer business. We produce and distribute nitrogen fertilizer products, which are used by farmers to improve the yield and quality of their crops. Our principal products are UAN and ammonia. All of our products are sold on a wholesale basis.
We produce our nitrogen fertilizerThe Partnership produces these products at two manufacturing facilities, which are located in Coffeyville, Kansas and East Dubuque, Illinois. Our principal products are ammonia and urea ammonium nitrate (“UAN”). All of our products are sold on a wholesale basis. References to CVR Partners, the Partnership, “we”, “us”, and “our” may refer to consolidated subsidiaries of CVR Partners or one or both of the facilities, as the context may require. Additionally, as the context may require, references to CVR Energy may refer to CVR Energy and its consolidated subsidiaries which include its petroleum refining, marketing, and logistics operations.
Strategy and Goals
Mission and Core Values
Our mission is to be a top tier North American nitrogen-based fertilizer company as measured by safe and reliable operations, superior performance and profitable growth. The foundation of how we operate is built on five core Values:
•Safety - We acquiredalways put safety first. The protection of our employees, contractors and communities is paramount. We have an unwavering commitment to safety above all else. If it’s not safe, then we don’t do it.
•Environment - We care for our environment. Complying with all regulations and minimizing any environmental impact from our operations is essential. We understand our obligation to the East Dubuque, Illinois facility in April 2016environment and that it’s our duty to protect it.
•Integrity - We require high business ethics. We comply with the law and practice sound corporate governance. We only conduct business one way—the right way with integrity.
•Corporate Citizenship - We are proud members of the communities where we operate. We are good neighbors and know that it’s a privilege we can’t take for granted. We seek to make a positive economic and social impact through our acquisitionfinancial donations and the contributions of CVR Nitrogen. Fortime, knowledge and talent of our employees to the places where we live and work.
•Continuous Improvement - We believe in both individual and team success. We foster accountability under a performance-driven culture that supports creative thinking, teamwork and personal development so that employees can realize their maximum potential. We use defined work practices for consistency, efficiency and to create value across the organization.
Our core Values are driven by our people, inform the way we do business each and every day and enhance our ability to accomplish our mission and related strategic objectives.
Strategic Objectives
discussion
We have outlined the following strategic objectives to drive the accomplishment of our mission:
Safety - We aim to achieve continuous improvement in all environmental, health and safety areas through ensuring our people’s commitment to environmental, health and safety comes first, the East Dubuque Merger, referrefinement of existing policies, continuous training, and enhanced monitoring procedures.
Reliability - Our goal is to Note 4 ("East Dubuque Merger")achieve industry-leading utilization rates at both of Part I, Item 1our facilities through safe and reliable operations. We are focusing on improvements in day-to-day plant operations, identifying alternative sources for plant inputs to reduce lost time due to third-party operational constraints, and optimizing our commercial and marketing functions to maintain plant operations at their highest level.
Market Capture - We continuously evaluate opportunities to improve the facilities’ realized pricing at the gate and reduce variable costs incurred in production to maximize our capture of this Report. The consolidated financial statementsmarket opportunities.
Financial Discipline - We strive to be efficient as possible by maintaining low operating costs and key operating metrics includedisciplined deployment of capital.
Achievements
During the resultsfirst quarter of the East Dubuque Facility beginning on April 1, 2016,2020, we successfully executed a number of achievements in support of our strategic objectives shown below through the date of this filing:
| | | | | | | | | | | | | | | | | | | | | | | |
| Safety | | Reliability | | Market Capture | | Financial Discipline |
| Operated all facilities and corporate offices safely and reliably and maintained financial discipline amid COVID-19 pandemic. | ü | | ü | | | | ü |
| Maintained high asset reliability and utilization at both facilities during the first quarter of 2020. | ü | | ü | | ü | | |
| Achieved 8% improvement in total recordable incident rate for the first quarter 2020 compared to the first quarter 2019. | ü | | | | | | |
Industry Factors and Market Conditions
Within the closing of the acquisition.
Our Coffeyville Facility includes a 1,300 ton-per-day capacity ammonia unit, a 3,000 ton-per-day capacity UAN unit, and a gasifier complex having a capacity of 89 million standard cubic feet per day of hydrogen. Our gasifier is a dual-train facility, with each gasifier able to function independently of the other, thereby providing redundancy and improving our reliability. Strategically located adjacent to CVR Refining’s refinery in Coffeyville, Kansas, our Coffeyville Facility is the only operation in North America that utilizes a petroleum coke, or pet coke, gasification process to produce nitrogen fertilizer. During the past five years, over 70% of the pet coke consumed by our Coffeyville Facility was produced and supplied by CVR Refining’s Coffeyville, Kansas crude oil refinery. We upgrade substantially all of the ammonia we produce at our Coffeyville Facility to higher margin UAN, which has historically commanded a premium price over ammonia. Approximately 93% of our Coffeyville Facility produced ammonia tons were upgraded into UAN in 2016. For the three months ended September 30, 2017 and 2016, approximately 95% and 96%, respectively, of our Coffeyville Facility produced ammonia tons were upgraded into UAN. For the nine months ended September 30, 2017 and 2016, approximately 88% and 92%, respectively, of our Coffeyville Facility produced ammonia tons were upgraded into UAN.
Our East Dubuque Facility includes a 1,075 ton-per-day capacity ammonia unit and a 1,100 ton-per-day capacity UAN unit. The facility is located on a 210-acre, 140-foot bluff above the Mississippi River, with access to the river for loading certain products. The East Dubuque Facility uses natural gas as its primary feedstock. The East Dubuque Facility has the flexibility to significantly vary its product mix. This enables us to upgrade our ammonia production into varying amounts of UAN, nitric acid and liquid and granulated urea each season, depending on market demand, pricing and storage availability. Product sales are heavily weighted toward sales of ammonia and UAN. For the post-acquisition period ended December 31, 2016, approximately 44% of our East Dubuque Facility produced ammonia tons were upgraded to other products. For the three months ended September 30, 2017 and 2016, approximately 44% and 41%, respectively, of our East Dubuque Facility produced ammonia tons were upgraded to other products. For the nine months ended September 30, 2017, approximately 44% of our East Dubuque Facility produced ammonia tons were upgraded to other products.
CVR Energy, which indirectly owns our general partner and approximately 34% of our outstanding common units, also indirectly owns the general partner and approximately 66% of the outstanding common units of CVR Refining at September 30, 2017. CVR Refining's subsidiaries own and operate a complex full coking medium-sour crude oil refinery with a rated capacity of 115,000 barrels per calendar day (bpcd) in Coffeyville, Kansas, a complex crude oil refinery with a rated capacity of 70,000 bpcd in Wynnewood, Oklahoma and ancillary businesses.
Major Influences on Results of Operations
Ourfertilizer business, earnings and cash flows from operations are primarily affected by the relationship between nitrogen fertilizer product prices, on-stream factorsutilization, and operating costs and expenses.expenses, including petroleum coke and natural gas feedstock costs.
The price at which ournitrogen fertilizer products are ultimately sold depends on numerous factors, including the global supply and demand for nitrogen fertilizer products which, in turn, depends on, among other factors, world grain demand and production levels, changes in world population, the cost and availability of fertilizer transportation infrastructure, weather conditions, the availability of imports, and the extent of government intervention in agriculture markets.
Nitrogen fertilizer prices are also affected by local factors, including local market conditions and the operating levels of competing facilities. An expansion or upgrade of competitors'competitors’ facilities, new facility development, political and economic developments, and other factors are likely to continue to play an important role in nitrogen fertilizer industry economics. These factors can impact, among other things, the level of inventories in the market, resulting in price volatility and a reduction in product margins. Moreover, the industry typically experiences seasonal fluctuations in demand for nitrogen fertilizer products.
General Business Environment
In March 2020, the World Health Organization categorized COVID-19 as a pandemic, and the President of the United States declared the COVID-19 outbreak a national emergency. The COVID-19 pandemic and actions taken by governments and others in response thereto is negatively impacting the worldwide economy, financial markets, and the agricultural industry. The COVID-19 pandemic has resulted in significant business and operational disruptions, including business closures in the
restaurant and food supply industries, amongst others, liquidity strains, destruction of non-essential demand, as well as supply chain challenges, travel restrictions, stay-at-home orders, and limitations on the availability of the workforce, including farmers in the agricultural industry. As a result, the global demand for liquid transportation fuels, including ethanol (the production of which is a significant driver of demand for fertilizer), has declined, causing many refineries and plants to reduce production or idle, evidenced by a decline in average ethanol production per day of 45% from 2019. The potential for a decline in production at refineries, including from Coffeyville Resources Refining & Marketing, LLC, an indirect, wholly-owned subsidiary of CVR Energy (“CRRM”), could result in increased costs incurred by the Partnership in future periods to source feedstocks, such as pet coke and natural gas, at spot prices. Concerns over the negative effects of the COVID-19 pandemic on economic and business prospects across the world have contributed to increased market and grain price volatility, uncertainty in food supply demands, and have diminished expectations for the global economy and may precipitate a prolonged economic slowdown and recession. As a result, the Partnership may witness some decline in demand for its products in 2020.
The Partnership believes the general business environment in which it operates will continue to remain volatile through at least the first half of 2020, and likely through the remainder of the year, driven by uncertainty around the availability and prices of its feedstocks and the demand for its products. As a result, the Partnership anticipates its future operating results and current and long-term financial condition may be negatively impacted. Due to the rapidly evolving situation, the uncertainty of its duration, and the timing of recovery, the Partnership is not able at this time to predict the extent to which these events may have a material, or any, effect on its financial or operational results, including any potential impairment of goodwill associated with our Coffeyville reporting unit.
With the adverse economic impacts discussed above and the uncertainty surrounding the COVID-19 pandemic, there is a heightened risk that amounts recognized, including goodwill, may not be recoverable. We have $41.0 million in goodwill at March 31, 2020 associated with our Coffeyville reporting unit for which the capacityestimated fair value has been in excess of carrying value based on our 2018 and 2019 assessments. While our assessment in 2020 has not identified the existence of an impairment indicator, we continue to store approximately 160,000monitor the current environment, including the duration and breadth of the impacts that the pandemic will have on demand for our fertilizer products, to assess whether qualitative factors indicate a quantitative assessment is required. If a quantitative assessment is performed, the extent to which the recoverability of our goodwill could be impaired is unknown. Such impairment could have a significant adverse impact on our results of operations; however, an impairment would have no impact on our financial condition or liquidity.
2020 Market Conditions
While there is risk of shorter-term volatility given the inherent nature of the commodity cycle and the impacts of the global COVID-19 pandemic, the Partnership believes the long-term fundamentals for the U.S. nitrogen fertilizer industry remain intact. The Partnership views the anticipated combination of (i) increasing global population, (ii) decreasing arable land per capita, (iii) continued evolution to more protein-based diets in developing countries, (iv) sustained use of corn as feedstock for the domestic production of ethanol, and (v) positioning at the lower end of the global cost curve should continue to provide a solid foundation for nitrogen fertilizer producers in the U.S. over the longer term.
Weather significantly impacted the demand for ammonia and UAN in 2019 due to a lack of extended dry conditions required for ammonia application and excessive moisture in the fall season. As a result, there was limited ability to apply ammonia after the fall harvest season and before the winter freeze. The decreased application resulted in a shift of deliveries from the fourth quarter of 2019 to the beginning of the second quarter in 2020. This has created a surplus of inventory in the market that was further exacerbated by continued imports of foreign UAN tons into the U.S. market. As a result of UANthese factors, the Partnership has seen a softening of prices related to these products. This softening is not expected to be sustained.
Corn and 80,000 tonssoybean are two major crops planted by farmers in North America. Corn crops result in the depletion of ammonia. Our storage tanks are located primarily at our two production facilities. Inventories are often allowedthe amount of nitrogen and ammonia within the soil in which it is grown, which in turn, results in the need for these nutrients to accumulatebe replenished after each growing cycle. Unlike corn, soybean is able to allow customersobtain its own nitrogen through a process known as “N fixation”. As such, upon the harvesting of soybean, the soil retains a certain amount of nitrogen which results in lower demand for nitrogen for the following corn planting cycle. Due to take deliverythese factors, nitrogen fertilizer consumers generally operate a balanced corn-soybean rotational planting cycle as, evident through the chart presented below for 2020 and 2019.
The relationship between the total acres planted for both corn and soybean has a direct impact on the overall demand for nitrogen products. As the number of corn acres increases, the market and demand for nitrogen also increases. Correspondingly, as the number of soybean acres increases, the market and demand for nitrogen decreases.
There has been a decline in the ethanol market due to decreased demand for transportation fuels as a result of the COVID-19 pandemic. Ethanol is blended with gasoline to meet renewable fuel standard requirements and for its octane value. Ethanol production has historically consumed approximately 35% of the seasonalU.S. corn crop, so demand for corn generally rises and falls with ethanol demand. While there is uncertainty surrounding when gasoline demand will return to normal levels, the drop in ethanol demand has not yet significantly impacted spring planting decisions, as evidenced through the chart below.
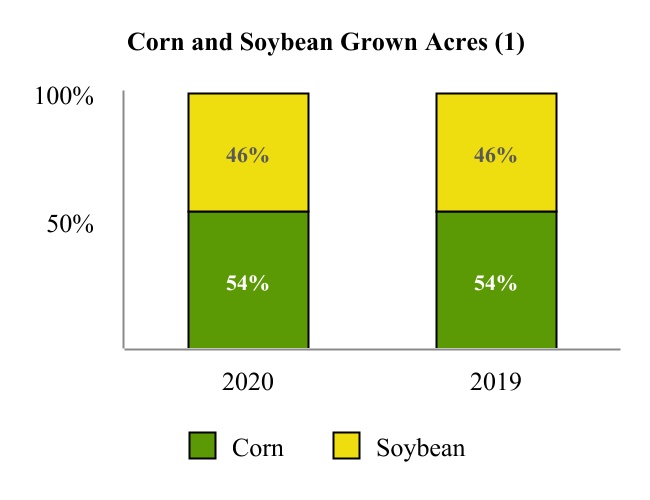
In orderThe preliminary 2020 United States Department of Agriculture (“USDA”) U.S. farmer planting intentions report indicated farmers’ intentions to plant 97.0 million acres of corn, representing an increase of 8.1% in corn acres planted as compared to 89.7 million corn acres in 2019. Planted soybean acres are estimated to be 83.5 million acres, representing a 9.7% increase in soybean acres planted as compared to 76.1 million soybean acres in 2019. Despite these anticipated increases in corn acres planted in 2020, if the current gasoline demand and ethanol blending continues to be weak, there is an expectation that corn planted acres could be lower than estimated while remaining above 2019 levels and corn inventories could be elevated after the harvest in fall 2020 leading to lower planted corn acres in future years. Despite the above potential risks for 2021 or later, the Partnership and industry expect solid demand for crop inputs for the 2020 spring season.
Although the spring planting season and current shipments have continued as expected, we will continue to monitor the COVID-19 pandemic and business environment and its potential impacts on the Partnership.
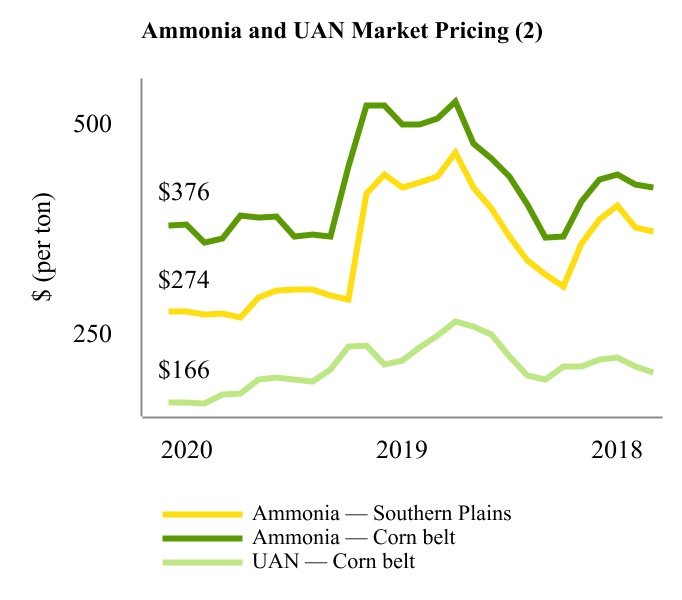
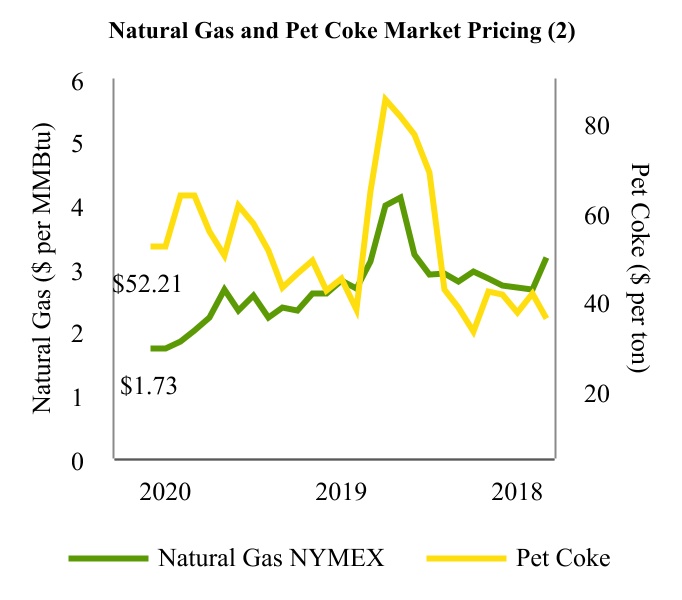
The tables below show relevant market indicators by month through March 31, 2020:
(1)Information used within this chart was obtained from the USDA, National Agricultural Statistics Services. Grown acres for 2020 are preliminary USDA estimated amounts and will be updated for actual amounts during the second quarter.
(2)Information used within these charts was obtained from various third-party sources, including Green Markets (a Bloomberg Company), Pace Petroleum Coke Quarterly, and the U.S. Energy Information Administration (“EIA”), amongst others.
Results of Operations
The following should be read in conjunction with the information outlined in the previous sections of this Part I, Item 2, the financial statements, and related notes thereto in Part I, Item 1 of this Report.
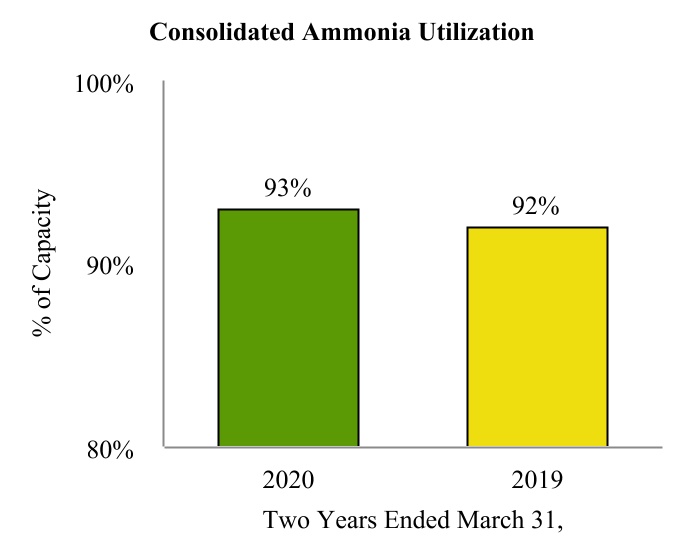
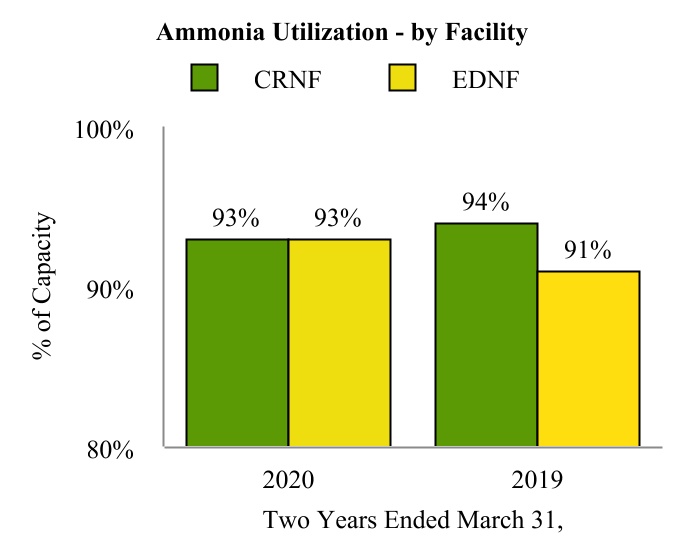
The charts presented below summarize our ammonia utilization rates on a consolidated basis and at each of our facilities. Utilization is an important measure used by management to assess operational output at each of the Partnership’s facilities. Utilization is calculated as actual tons produced divided by capacity adjusted for planned maintenance and turnarounds.
The presentation of our utilization is on a two-year rolling average which takes into account the impact of our planned and unplanned outages on any specific period. We believe the two-year rolling average is a more useful presentation of the long-term utilization performance of our facilities.
Utilization is presented solely on ammonia production rather than each nitrogen product as it provides a comparative baseline against industry peers and eliminates the disparity of facility configurations for upgrade of ammonia into other nitrogen products. With efforts primarily focused on ammonia upgrade capabilities, we believe this measure provides a meaningful view of how well we operate.
On a consolidated basis, utilization increased 1% to 93% for the two years ended March 31, 2020 compared to the two years ended March 31, 2019. The first quarter of 2019 ammonia storage capacity was constrained at the East Dubuque Facility impacting comparability to 2020.
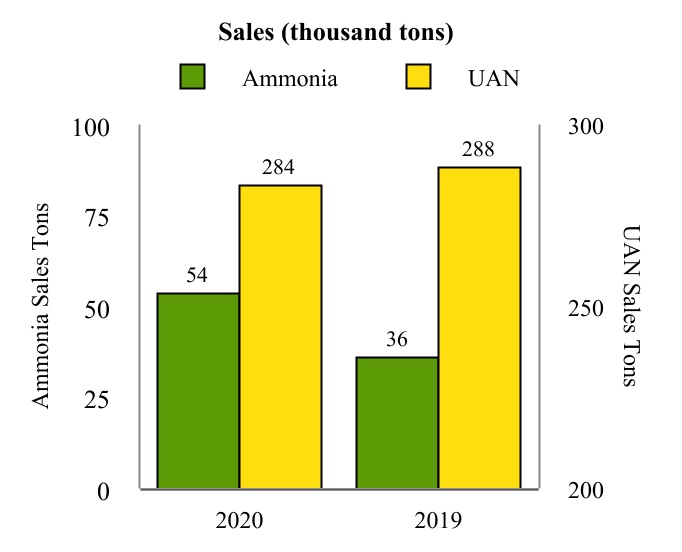
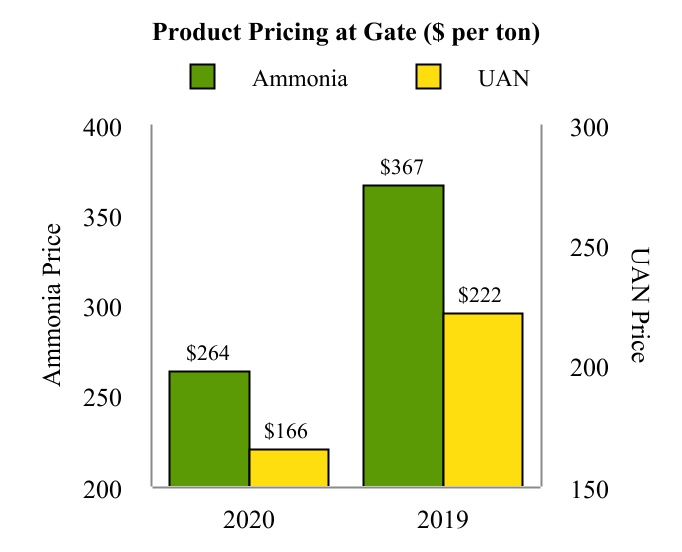
Sales and Pricing per Ton - Two of our key operating performance, we calculatemetrics are total sales for ammonia and UAN along with the product pricing per ton realized at gate as an input to determine our operating margin.the gate. Product pricing at the gate represents net sales less freight revenue divided by product sales volume in tons. We believe producttons and is shown in order to provide a pricing at gatemeasure that is a meaningful measure because we sell products at our plant gates and terminal locations' gates ("sold gate") and delivered tocomparable across the fertilizer industry.
Production Volumes - Gross tons produced for ammonia represent the customer's designated delivery site ("sold delivered").total ammonia produced, including ammonia produced that was upgraded into other fertilizer products. Net tons available for sale represent the ammonia available for sale that was not upgraded into other fertilizer products. The relative percentage of sold gate versus sold delivered can change period to period. The product pricing at gate provides a measure that is consistently comparable period to period.table below presents these metrics for the three months ended March 31, 2020 and 2019:
| | | | | | | | | | | | | | | |
| | | | | | Three Months Ended
March 31, | | |
| (in thousands of tons) | | | | | 2020 | | 2019 |
| Ammonia (gross produced) | | | | | 201 | | | 179 | |
| Ammonia (net available for sale) | | | | | 78 | | | 41 | |
| UAN | | | | | 317 | | | 335 | |
We and other competitors in the U.S. farm belt share a significant transportation cost advantage when compared to our out-of-region competitors in serving the U.S. farm belt agricultural market. Our products leave our Coffeyville Facility either in railcars for destinations located principally on the Union Pacific Railroad or in trucks for direct shipment to customers. We do not currently incur significant intermediate transfer, storage, barge freight or pipeline freight charges; however, we do incur costs to maintain and repair our railcar fleet. Selling products to customers within economic rail transportation limits of the Coffeyville Facility and keeping transportation costs low are keys to maintaining profitability.
The East Dubuque Facility is located in northwest Illinois, in the corn belt. The East Dubuque Facility primarily sells its product to customers located within 200 miles of the facility. In most instances, customers take delivery of nitrogen products at the plant and arrange and pay to transport them to their final destinations by truck. The East Dubuque Facility has direct access to a barge dock on the Mississippi River as well as a nearby rail spur serviced by the Canadian National Railway Company.
The high fixed cost of the Coffeyville Facility direct operating expense structure also directly affects our profitability. Feedstock - Our Coffeyville Facility'sFacilityutilizes a pet coke gasification process results in a significantly higher percentage of fixed costs than a natural gas-based fertilizer plant, such as ourto produce nitrogen fertilizer. Our East Dubuque Facility. Major fixed operating expenses include a large portion of electrical energy, employee labor, and maintenance, including contract labor and outside services.
Our largest raw material expense usedFacility uses natural gas in theits production of ammonia at our Coffeyville Facility is pet coke, which we purchase from CVR Refining and third parties. Forammonia. The table below presents these feedstocks for both facilities for the three months ended September 30, 2017March 31, 2020 and 2016, we incurred approximately $2.0 million and $1.7 million, respectively, for the cost of pet coke, which equaled an average cost per ton of $18 and $13, respectively. For the nine months ended September 30, 2017 and 2016, we incurred approximately $6.5 million and $5.4 million, respectively, for the cost of pet coke, which equaled an average cost per ton of $18 and $14, respectively.2019:
| | | | | | | | | | | | | | | |
| | | | | | Three Months Ended
March 31, | | |
| | | | | 2020 | | 2019 |
| Petroleum coke used in production (thousand tons) | | | | | 125 | | | 132 | |
| Petroleum coke (dollars per ton) | | | | | $ | 44.68 | | | $ | 37.70 | |
| Natural gas used in production (thousands of MMBtu) (1) | | | | | 2,141 | | | 1,440 | |
| Natural gas used in production (dollars per MMBtu) (1) | | | | | $ | 2.42 | | | $ | 3.83 | |
| Natural gas in cost of materials and other (thousands of MMBtu) (1) | | | | | 1,418 | | | 1,008 | |
| Natural gas in cost of materials and other (dollars per MMBtu) (1) | | | | | $ | 2.80 | | | $ | 3.87 | |
Our largest raw material expense used in the production of ammonia at our East Dubuque Facility is natural gas, which we purchase from third parties. Our East Dubuque Facility's natural gas process results in a higher percentage of variable costs as compared to the Coffeyville Facility. For the three months ended September 30, 2017 and 2016, we expensed approximately $6.1 million and $4.9 million, respectively, for
(1)The feedstock natural gas which equaled an average cost per MMBtu of $3.15 and $2.92, respectively. For the nine months ended September 30, 2017, we expensed approximately $19.5 million for feedstockshown above does not include natural gas which equaled an average cost per MMBtu of $3.30.
Consistent, safe and reliable operations at our nitrogen fertilizer plants are critical to our financial performance and results of operations. Unplanned downtime may result in lost margin opportunity, increased maintenance expense and a temporary increase in working capital investment and related inventory position.used for fuel. The financial impact of planned downtime, such as major turnaround maintenance, is mitigated through a diligent planning process that takes into account margin environment, the availability of resources to perform the needed maintenance, feedstock logistics and other factors.
Historically, the Coffeyville Facility has undergone a full facility turnaround approximately every two to three years. The Coffeyville Facility underwent a full facility turnaround in the third quarter of 2015, at a cost of approximately $7.0 million, exclusive of the impacts due to the lost production during the downtime. The Coffeyville Facilityfuel natural gas is planning to undergo the next scheduled full facility turnaround in 2018.
Historically, the East Dubuque Facility has also undergone a full facility turnaround approximately every two to three years. The East Dubuque Facility underwent a full facility turnaround in the second quarter of 2016, at a cost of approximately $6.6 million, exclusive of the impacts due to the lost production during the downtime. We determined that there were more pressing preventative maintenance issues at the East Dubuque Facility, so we completed a scheduled turnaround at the East Dubuque Facility in the third quarter of 2017 at a cost of approximately $2.6 million, exclusive of the impacts of the lost production during the downtime.
Production levels in the third quarter of 2017 were negatively impacted by the planned 14-day turnaround at our East Dubuque Facility. Production levels in the third quarter of 2017 were also impacted an additional eight days of unplanned downtime due to an exchanger outage at the East Dubuque Facility that resulted in repair costs which were not material. Subsequent to the third quarter of 2017, the East Dubuque Facility experienced an additional outage caused by refractory failing in piping. As of the date of this filing, the piping repair work is ongoing and the total outage is expected to last 12 days and the repair cost is estimated to be immaterial.
Agreements with CVR Energy and CVR Refining
We are party to several agreements with CVR Energy and its affiliates that govern the business relations among us, CVR Energy and its subsidiaries (including CVR Refining), and our general partner. These include the pet coke supply agreement under which we buy the pet coke we use in our Coffeyville Facility; a services agreement, under which CVR Energy and its subsidiaries provide us with management services including the services of its senior management team; a feedstock and shared services agreement, which governs the provision of feedstocks for our Coffeyville Facility, including, but not limited to, high-pressure steam, nitrogen, instrument air, oxygen and natural gas; a hydrogen purchase and sale agreement, which governs the purchase of hydrogen for our Coffeyville Facility; a raw water and facilities sharing agreement, which allocates raw water resources between the two facilities in Coffeyville; an easement agreement; an environmental agreement; a lease agreement pursuant to which we lease office space and laboratory space; and certain financing agreements that we entered into in connection with the East Dubuque Merger. These agreements were not the result of arm's-length negotiations and the terms of these agreements are not necessarily as favorable to the parties to these agreements as terms which could have been obtained from unaffiliated third parties. See Note 14 ("Related Party Transactions") to Part I, Item 1 of this Report for additional discussion of the agreements.
Factors Affecting Comparability of Our Financial Results
Our historical results of operations for the periods presented may not be comparable with prior periods or to our results of operations in the future for the reason discussed below.
East Dubuque Merger
On April 1, 2016, the Partnership completed the East Dubuque Merger, whereby the Partnership acquired the East Dubuque Facility. The consolidated financial statements and key operating metrics include the results of the East Dubuque Facility beginning on April 1, 2016, the date of the closing of the acquisition. During the three and nine months ended September 30, 2016, the Partnership incurred $0.7 million and $3.1 million, respectively, of legal and other professional fees and other merger-related expenses, which were included in selling, general and administrative expenses. See Note 4 ("East Dubuque Merger") to Part I, Item 1 of this Report for further discussion.
Major Scheduled Turnaround Activities
During the third quarter of 2017, the East Dubuque Facility completed a scheduled turnaround and the ammonia and UAN units were down for approximately 14 days. Overall results were negatively impacted due to the lost production during the downtime that resulted in lost sales and certain reduced variable expenses included in cost of materials and other and directDirect operating expenses (exclusive of depreciation and amortization). Exclusive of
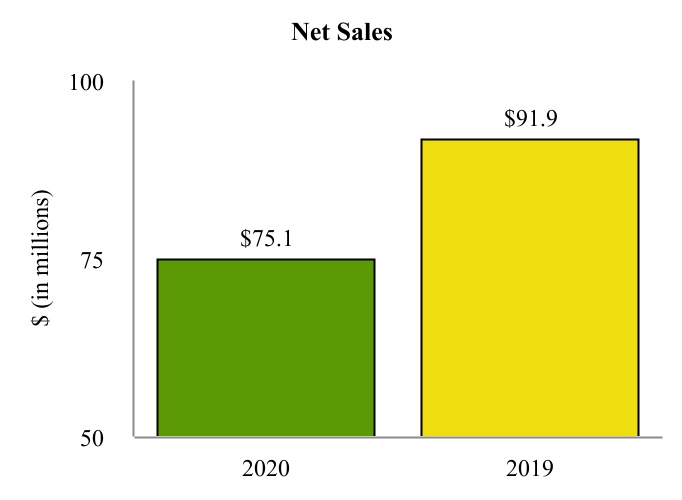
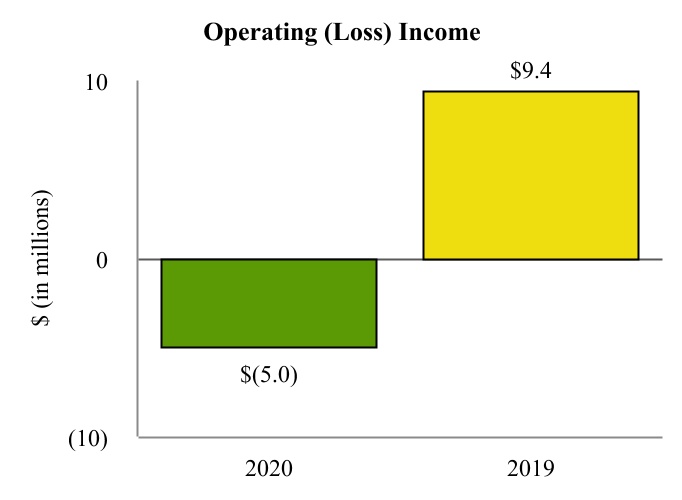
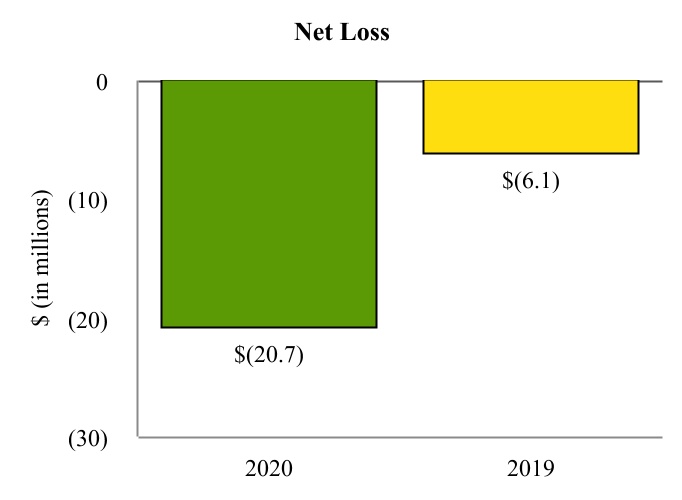
Financial Highlights for the impacts dueThree Months Ended March 31, 2020 and 2019
Overview - For the three months ended March 31, 2020, the Partnership's operating loss and net loss were $5.0 million and $20.7 million, a $14.4 million decrease and $14.6 million decrease, respectively, compared to the lost production during the turnaround downtime, costs of approximately $2.5 million and $2.6 million, respectively, are included in direct operating expenses (exclusive of depreciation and amortization) in the Consolidated Statements of Operations for the three and nine months ended September 30, 2017.
During the second quarter of 2016, the East Dubuque Facility completed a major scheduled turnaround and theMarch 31, 2019 driven primarily by decreased ammonia and UAN units were down for approximately 28 days. Overall results were negatively impacted due to the lost production during the downtime that resulted in lost sales and certain reduced variable expenses included in cost of materials and other and direct operating expenses (exclusive of depreciation and amortization). Exclusive of the impacts due to the lost production during the turnaround downtime, costs of approximately $6.6 million are included in direct operating expenses (exclusive of depreciation and amortization) in the Consolidated Statements of Operations for the nine months ended September 30, 2016.
Indebtedness
On April 1, 2016,pricing. Sales pricing has weakened as a result of the East Dubuque Merger, the Partnership acquired CVR Nitrogen, including its debt. During the second quartercompetitive domestic markets, seasonally high inventories, and increased imports of 2016, the Partnership used $300.0 million of funds from the senior term loan credit facility with Coffeyville Resources, LLC, a related party, to finance the payoff of CVR Partners' $125.0 million term loan, payoff CVR Nitrogen's credit facility outstanding balance of $49.1 million, and to fund the cash merger consideration and certain merger-related expenses. In June 2016, the Partnership issued $645.0 million aggregate principal of 9.250% Senior Secured Notes due 2023 to refinance the substantial majority of its existing debt. Also as a result of the financing transactions, the Partnership recognized a loss on debt extinguishment of approximately $5.1 million during the nine months ended September 30, 2016. As a result of the financing transactions, the Partnership's interest expense increased for the nine months ended September 30, 2017 as compared to the prior year. Further discussion regarding the Partnership's indebtedness can be found in Note 12 ("Debt") to Part I, Item 1 of this Report.
Results of Operations
The period to period comparisons of our results of operations have been prepared using the historical periods included in our condensed consolidated financial statements. In order to effectively review and assess our historical financial information below, we have also included supplemental operating measures and industry measures that we believe are material to understanding our business.
To supplement our actual results calculated in accordance with U.S. generally accepted accounting principles ("GAAP") for the applicable periods, the Partnership also uses certain non-GAAP financial measures, which are reconciled to our GAAP-based results below. These non-GAAP financial measures should not be considered as an alternative to GAAP results.
The following tables summarize the financial data and key operating statistics for CVR Partners and our subsidiaries for the three and nine months ended September 30, 2017 and 2016. The results of operations for our East Dubuque Facility are included for the post acquisition period beginning April 1, 2016. The following data should be read in conjunction with our condensed consolidated financial statements and the notes thereto included elsewhere in this Report. All information in "Management’s Discussion and Analysis of Financial Condition and Results of Operations," except for the balance sheet data as of December 31, 2016, is unaudited.
UAN.
|
| | | | | | | | | | | | | | | |
| | Three Months Ended
September 30, | | Nine Months Ended
September 30, |
| | 2017 |
| 2016 | | 2017 |
| 2016 |
| | | | | | | | |
| | (in millions) |
| Consolidated Statements of Operations Data: | | | | | | | |
| Net sales | $ | 69.4 |
| | $ | 78.5 |
| | $ | 252.6 |
| | $ | 271.4 |
|
| | | | | | | | |
| Cost of materials and other – Affiliates | 1.8 |
| | 0.6 |
| | 5.6 |
| | 1.9 |
|
| Cost of materials and other – Third parties | 17.6 |
| | 19.3 |
| | 57.7 |
| | 70.3 |
|
| | 19.4 |
| | 19.9 |
| | 63.3 |
| | 72.2 |
|
| Direct operating expenses – Affiliates (1) | 1.0 |
| | 1.1 |
| | 2.8 |
| | 3.2 |
|
| Direct operating expenses – Third parties (1) | 36.8 |
| | 31.4 |
| | 108.6 |
| | 100.6 |
|
| Major scheduled turnaround expenses | 2.5 |
| | — |
| | 2.6 |
| | 6.6 |
|
| | 40.3 |
| | 32.5 |
| | 114.0 |
| | 110.4 |
|
| Depreciation and amortization | 19.5 |
| | 16.4 |
| | 54.9 |
| | 41.0 |
|
| Cost of sales | 79.2 |
| | 68.8 |
| | 232.2 |
| | 223.6 |
|
| | | | | | | | |
| Selling, general and administrative expenses – Affiliates (2) | 3.9 |
| | 3.6 |
| | 11.4 |
| | 10.9 |
|
| Selling, general and administrative expenses – Third parties (2) | 2.2 |
| | 3.7 |
| | 7.4 |
| | 11.1 |
|
| | 6.1 |
| | 7.3 |
| | 18.8 |
| | 22.0 |
|
| Operating income (loss) | (15.9 | ) | | 2.4 |
| | 1.6 |
| | 25.8 |
|
| Interest expense and other financing costs | (15.7 | ) | | (15.6 | ) | | (47.1 | ) | | (32.8 | ) |
| Loss on extinguishment of debt | — |
| | — |
| | — |
| | (5.1 | ) |
| Other income, net | — |
| | — |
| | 0.1 |
| | — |
|
| Total other expense | (15.7 | ) | | (15.6 | ) | | (47.0 | ) | | (37.9 | ) |
| Loss before income tax expense | (31.6 | ) | | (13.2 | ) | | (45.4 | ) | | (12.1 | ) |
| Income tax expense | — |
| | 0.2 |
| | — |
| | 0.3 |
|
| Net loss | $ | (31.6 | ) | | $ | (13.4 | ) | | $ | (45.4 | ) | | $ | (12.4 | ) |
| | | | | | | | |
| EBITDA (3)* | $ | 3.6 |
| | $ | 18.8 |
| | $ | 56.6 |
| | $ | 61.7 |
|
| Adjusted EBITDA (3)* | $ | 5.0 |
| | $ | 17.4 |
| | $ | 58.1 |
| | $ | 74.4 |
|
| Available cash for distribution (4)* | $ | (1.2 | ) | | $ | 0.4 |
| | $ | 0.6 |
| | $ | 50.8 |
|
| | | | | | | | |
| Reconciliation to net sales: | | | | | | | |
| Fertilizer sales net at gate | $ | 59.4 |
| | $ | 66.7 |
| | $ | 223.0 |
| | $ | 234.8 |
|
| Freight in revenue | 8.3 |
| | 8.8 |
| | 23.6 |
| | 24.4 |
|
| Hydrogen revenue | — |
| | 1.2 |
| | 0.1 |
| | 2.9 |
|
| Other, including the impact of purchase accounting | 1.7 |
| | 1.8 |
| | 5.9 |
| | 9.3 |
|
| Total net sales | $ | 69.4 |
| | $ | 78.5 |
| | $ | 252.6 |
| | $ | 271.4 |
|
* See footnote (3) and (4) below for discussion of non-GAAP financial measures.
|
| | | | | | | |
| | As of
September 30,
2017 | | As of
December 31,
2016 |
| | | | (audited) |
| | (in millions) |
| Balance Sheet Data: | | | |
| Cash and cash equivalents | $ | 70.0 |
| | $ | 55.6 |
|
| Working capital | 73.3 |
| | 71.5 |
|
| Total assets | 1,275.8 |
| | 1,312.2 |
|
| Total debt, net of current portion | 625.2 |
| | 623.1 |
|
| Total partners’ capital | 577.3 |
| | 624.9 |
|
|
| | | | | | | | | | | | | | | |
| | Three Months Ended
September 30, | | Nine Months Ended
September 30, |
| | 2017 | | 2016 | | 2017 | | 2016 |
| | | | | | | | |
| | (in millions) |
| Cash Flow Data: | | | | | | | |
| Net cash flow provided by (used in): | | | | | | | |
| Operating activities | $ | 21.1 |
| | $ | 18.4 |
| | $ | 28.1 |
| | $ | 47.5 |
|
| Investing activities | (2.8 | ) | | (6.4 | ) | | (11.4 | ) | | (82.1 | ) |
| Financing activities | — |
| | (23.0 | ) | | (2.3 | ) | | 49.9 |
|
| Net increase (decrease) in cash and cash equivalents | $ | 18.3 |
| | $ | (11.0 | ) | | $ | 14.4 |
| | $ | 15.3 |
|
| | | | | | | | |
| Capital expenditures: | | | | | | | |
| Maintenance capital expenditures | $ | 2.7 |
| | $ | 3.4 |
| | $ | 11.1 |
| | $ | 8.3 |
|
| Growth capital expenditures | 0.1 |
| | 3.0 |
| | 0.3 |
| | 10.0 |
|
| Total capital expenditures | $ | 2.8 |
| | $ | 6.4 |
| | $ | 11.4 |
| | $ | 18.3 |
|
| | |
(1) | Direct operating expenses are shown exclusive of major scheduled turnaround expenses and depreciation and amortization. |
| |
(2) | The Partnership incurred approximately $0.7 million and $3.1 million, respectively, of legal and other professional fees and other merger-related expenses for the three and nine months ended September 30, 2016, as discussed in Note 4 ("East Dubuque Merger") to Part I, Item 1 of this Report, which are included in selling, general and administrative expenses. |
| |
(3) | EBITDA is defined as net income (loss) before (i) interest (income) expense, (ii) income tax expense and (iii) depreciation and amortization expense. |
Adjusted EBITDA is defined as EBITDA further adjusted(1)See “Non-GAAP Reconciliations” section below for the impact of major scheduled turnaround expenses, gain or loss on extinguishment of debt, loss on disposition of assets, expenses associated with the East Dubuque Merger and business interruption insurance recovery, when applicable.
We present EBITDA because we believe it allows users of our financial statements, such as investors and analysts, to assess our financial performance without regard to financing methods, capital structure or historical cost basis. We present Adjusted EBITDA because we have found it helpful to consider an operating measure that excludes amounts, such as major scheduled turnaround expenses, gain or loss on extinguishment of debt, loss on disposition of assets, expenses associated with the East Dubuque Merger and business interruption insurance recovery, relating to transactions not reflective of our core operations. When applicable, each of these amounts is discussed herein, so that investors have complete information about these amounts. We also present Adjusted EBITDA because it is the starting point used by the board of directors of our general partner when calculating our available cash for distribution.
EBITDA and Adjusted EBITDA are not recognized terms under GAAP and should not be substituted for net income (loss) or cash flows from operations. Management believes that EBITDA and Adjusted EBITDA enable investors and analysts to better understand our ability to make distributions to common unitholders, help investors and analysts evaluate our ongoing operating results and allow for greater transparency in reviewing our overall financial, operational and economic performance by allowing investors to evaluate the same information used by management. EBITDA and Adjusted EBITDA presented by other companies may not be comparable to our presentation, since each company may define these terms differently.
A reconciliation of consolidated Net loss to consolidated EBITDA and consolidated Adjusted EBITDA is as follows:
|
| | | | | | | | | | | | | | | |
| | Three Months Ended
September 30, | | Nine Months Ended
September 30, |
| | 2017 | | 2016 | | 2017 | | 2016 |
| | | | | | | | |
| | (in millions) |
| Net loss | $ | (31.6 | ) | | $ | (13.4 | ) | | $ | (45.4 | ) | | $ | (12.4 | ) |
| Add: | | | | | | | |
| Interest expense and other financing costs, net | 15.7 |
| | 15.6 |
| | 47.1 |
| | 32.8 |
|
| Income tax expense | — |
| | 0.2 |
| | — |
| | 0.3 |
|
| Depreciation and amortization | 19.5 |
| | 16.4 |
| | 54.9 |
| | 41.0 |
|
| EBITDA | $ | 3.6 |
| | $ | 18.8 |
| | $ | 56.6 |
| | $ | 61.7 |
|
| Add: | | | | | | | |
| Major scheduled turnaround expenses | 2.5 |
| | — |
| | 2.6 |
| | 6.6 |
|
| Loss on extinguishment of debt | — |
| | — |
| | — |
| | 5.1 |
|
| Expenses associated with the East Dubuque Merger | — |
| | 0.7 |
| | — |
| | 3.1 |
|
| Less: | | | | | | | |
| Insurance recovery - business interruption | (1.1 | ) | | (2.1 | ) | | (1.1 | ) | | (2.1 | ) |
| Adjusted EBITDA | $ | 5.0 |
| | $ | 17.4 |
| | $ | 58.1 |
| | $ | 74.4 |
|
| |
(4) | The board of directors of our general partner has a policy to calculate available cash for distribution starting with Adjusted EBITDA. For the three and nine months ended September 30, 2017 and 2016, available cash for distribution equaled our Adjusted EBITDA reduced for cash needed for (i) net cash interest expense (excluding capitalized interest) and debt service and other contractual obligations; (ii) maintenance capital expenditures; and (iii) to the extent applicable, major scheduled turnaround expenses, reserves for future operating or capital needs that the board of directors of the general partner deems necessary or appropriate, and expenses associated with the East Dubuque Merger, if any. Available cash for distribution may be increased by the release of previously established cash reserves, if any, at the discretion of the board of directors of our general partner, and available cash is increased by the business interruption insurance proceeds and the impact of purchase accounting. Actual distributions are set by the board of directors of our general partner. The board of directors of our general partner may modify our cash distribution policy at any time, and our partnership agreement does not require us to make distributions at all. |
Available cash for distribution is not a recognized term under GAAP. Available cash for distribution should not be considered in isolation or as an alternative to net income (loss) or operating income, or any other measure of financial performance or operating performance. In addition, available cash for distribution is not presented as, and should not be considered, an alternative to cash flows from operations or as a measure of liquidity. Available cash for distribution as reported by the Partnership may not be comparable to similarly titled measures of other entities, thereby limiting its usefulness as a comparative measure.
A reconciliation of consolidated available cash for distribution is as follows:
|
| | | | | | | | | | | | | | | |
| | Three Months Ended
September 30, | | Nine Months Ended
September 30, |
| | 2017 | | 2016 | | 2017 | | 2016 |
| | | | | | | | |
| | (in millions, except units and per unit data) |
| Adjusted EBITDA | $ | 5.0 |
| | $ | 17.4 |
| | $ | 58.1 |
| | $ | 74.4 |
|
| Adjustments: | | | | | | | |
| Less: | | | | | | | |
| Net cash interest expense (excluding capitalized interest) and debt service | (15.0 | ) | | (15.0 | ) | | (44.9 | ) | | (31.0 | ) |
| Maintenance capital expenditures | (2.7 | ) | | (3.4 | ) | | (11.1 | ) | | (8.3 | ) |
| Major scheduled turnaround expenses | (2.5 | ) | | — |
| | (2.6 | ) | | (6.6 | ) |
| Expenses associated with the East Dubuque Merger | — |
| | (0.7 | ) | | — |
| | (3.1 | ) |
| Add: | | | | | | | |
| Insurance recovery - business interruption | 1.1 |
| | 2.1 |
| | 1.1 |
| | 6.1 |
|
| Impact of purchase accounting | — |
| | — |
| | — |
| | 13.0 |
|
| Available cash associated with East Dubuque 2016 first quarter | — |
| | — |
| | — |
| | 6.3 |
|
| Release of previously established cash reserves, net | 12.9 |
| | — |
| | — |
| | — |
|
| Available cash for distribution | $ | (1.2 | ) | | $ | 0.4 |
| | $ | 0.6 |
| | $ | 50.8 |
|
| Available cash for distribution, per common unit | $ | (0.01 | ) | | $ | — |
| | $ | — |
| | $ | 0.45 |
|
| Distribution declared, per common unit | $ | — |
| | $ | — |
| | $ | 0.02 |
| | $ | 0.44 |
|
| Common units outstanding (in thousands) | 113,283 |
| | 113,283 |
| | 113,283 |
| | 113,283 |
|
The following tables show selected information about key operating statistics and market indicators for our business:
|
| | | | | | | | | | | | | | | |
| | Three Months Ended
September 30, | | Nine Months Ended
September 30, |
| | 2017 | | 2016 | | 2017 | | 2016 |
| Key Operating Statistics: | | | | | | | |
| Consolidated sales (thousand tons): | | | | | | | |
| Ammonia | 65.3 |
| | 47.7 |
| | 201.8 |
| | 145.7 |
|
| UAN | 299.1 |
| | 296.0 |
| | 951.6 |
| | 902.4 |
|
| Consolidated product pricing at gate (dollars per ton) (1): | | | | | | | |
| Ammonia | $ | 214 |
| | $ | 345 |
| | $ | 287 |
| | $ | 385 |
|
| UAN | $ | 138 |
| | $ | 154 |
| | $ | 158 |
| | $ | 187 |
|
| Consolidated production volume (thousand tons): | | | | | | | |
| Ammonia (gross produced) (2) | 180.7 |
| | 200.8 |
| | 615.2 |
| | 485.9 |
|
| Ammonia (net available for sale) (2) | 46.2 |
| | 60.3 |
| | 203.7 |
| | 121.0 |
|
| UAN | 306.6 |
| | 317.2 |
| | 962.3 |
| | 861.9 |
|
| Feedstock: | | | | | | | |
| Petroleum coke used in production (thousand tons) | 114.3 |
| | 126.8 |
| | 371.0 |
| | 384.4 |
|
| Petroleum coke used in production (dollars per ton) | $ | 18 |
| | $ | 13 |
| | $ | 18 |
| | $ | 14 |
|
| Natural gas used in production (thousands of MMBtu) | 1,555.4 |
| | 2,075.5 |
| | 5,780.7 |
| | 3,471.6 |
|
| Natural gas used in production (dollars per MMBtu) (3) | $ | 3.12 |
| | $ | 2.97 |
| | $ | 3.25 |
| | $ | 2.75 |
|
| Natural gas in cost of materials and other (thousands of MMBtu) | 1,934.9 |
| | 1,679.5 |
| | 5,898.3 |
| | 2,742.5 |
|
| Natural gas in cost of materials and other (dollars per MMBtu) (3) | $ | 3.15 |
| | $ | 2.92 |
| | $ | 3.30 |
| | $ | 2.68 |
|
| Coffeyville Facility on-stream factors (4): | | | | | | | |
| Gasification | 96.3 | % | | 95.9 | % | | 98.0 | % | | 97.2 | % |
| Ammonia | 93.5 | % | | 94.7 | % | | 96.7 | % | | 96.2 | % |
| UAN | 93.9 | % | | 94.1 | % | | 92.6 | % | | 93.1 | % |
| East Dubuque Facility on-stream factors (4): | | | | | | | |
| Ammonia | 76.3 | % | | 94.4 | % | | 91.9 | % | | 81.7 | % |
| UAN | 77.1 | % | | 92.9 | % | | 91.5 | % | | 81.1 | % |
| | | | | | | | |
| Market Indicators: | | | | | | | |
| Ammonia - Southern plains (dollars per ton) | $ | 238 |
| | $ | 315 |
| | $ | 314 |
| | $ | 368 |
|
| Ammonia - Corn belt (dollars per ton) | $ | 303 |
| | $ | 372 |
| | $ | 364 |
| | $ | 432 |
|
| UAN - Corn belt (dollars per ton) | $ | 165 |
| | $ | 188 |
| | $ | 192 |
| | $ | 218 |
|
| Natural gas NYMEX (dollars per MMBtu) | $ | 2.95 |
| | $ | 2.79 |
| | $ | 3.05 |
| | $ | 2.35 |
|
| |
(1)
| Product pricing at gate represents net sales less freight revenue divided by product sales volume in tons and is shown in order to provide a pricing measure that is comparable across the fertilizer industry. |
| |
(2) | Gross tons produced for ammonia represent total ammonia produced, including ammonia produced that was upgraded into other fertilizer products. Net tons available for sale represent ammonia available for sale that was not upgraded into other fertilizer products. |
| |
(3) | The cost per MMBtu excludes derivative activity, when applicable. The impact of natural gas derivative activity during the periods presented was not material. |
| |
(4) | On-stream factor is the total number of hours operated divided by the total number of hours in the reporting period and is included as a measure of operating efficiency. |
Coffeyville Facility
The Linde air separation unit experienced a shut down during the second quarter of 2017. Following the Linde outage, the Coffeyville Facility UAN unit experienced a number of operational challenges, resulting in approximately 11 days of UAN downtime during the second quarter of 2017. Excluding the impactreconciliations of the Linde air separation unit outage at the Coffeyville Facility, the UAN unit on-stream factors at the Coffeyville Facility would have been 96.7% for the nine months ended September 30, 2017.non-GAAP measures shown below.
East Dubuque Facility
Excluding the impact of approximately 14 days of downtime associated with the 2017 full facility turnaround at the East Dubuque Facility, the on-stream factors at the East Dubuque Facility would have been 91.3% for ammonia and 91.8% for UAN for the three months ended September 30, 2017 and 96.9% for ammonia and 96.4% for UAN for the nine months ended September 30, 2017.
Excluding the impact of approximately 28 days of downtime associated with the 2016 full facility turnaround at the East Dubuque Facility, the on-stream factors at the East Dubuque Facility would have been 97.2% for ammonia and 96.2% for UAN for the six months ended September 30, 2016.
Three Months Ended September 30, 2017 Compared to the Three Months Ended September 30, 2016
Net Sales.Net sales were $69.4decreased by $16.8 million to $75.1 million for the three months ended September 30, 2017compared to $78.5 million for the three months ended September 30, 2016. The decrease of $9.1 million for the three months ended September 30, 2017March 31, 2020compared to the three months ended September 30, 2016March 31, 2019. This decrease wasprimarily attributabledue to theunfavorable pricing conditions which contributed $21.6 million in lower ammonia sales prices ($8.4 million), lower UAN sales prices ($5.7 million),revenues, partially offset by higher ammoniaincreased sales volumes ($6.2 million). Forcontributing $5.3 million, as compared to the three months ended September 30, 2017, UAN and ammonia made up $48.8 million and $14.9 million of our consolidated net sales, respectively, including freight. This compared to UAN and ammonia consolidated net sales of $53.9 million and $17.1 million, respectively, for the three months ended September 30, 2016, including freight.March 31, 2019.
The following table demonstrates the impact of changes in sales volumes and pricing for the primary components of net sales, excluding freight, for the three months ended September 30, 2017March 31, 2020 as compared to the three months ended September 30, 2016:March 31, 2019:
| | | | | | | | | | | |
| (in thousands) | Price
Variance | | Volume
Variance |
| UAN | $ | (16,016) | | | $ | (1,030) | |
| Ammonia | $ | (5,550) | | | $ | 6,344 | |
|
| | | | | | | |
| | Price Variance | | Volume Variance |
| | | | |
| | (in millions) |
| UAN | $ | (5.7 | ) | | $ | 0.6 |
|
| Ammonia | $ | (8.4 | ) | | $ | 6.2 |
|
The decrease in UAN and ammonia sales pricespricing for the three months ended September 30, 2017March 31, 2020 as compared to the three months ended September 30, 2016March 31, 2019 was primarily attributable to competitive pricing fluctuationpressures seen throughout the domestic and international markets. For UAN, imported volumes increased as compared to 2019 because of the imposition of duties by the European Union on UAN imports from Russia, Trinidad, and the U.S. For ammonia, customers held a significant amount of inventory due to the delay in application from the fourth quarter 2019 to the beginning of the second quarter 2020. This delay in application was primarily due to excessive moisture in the market.2019 fall season which delayed normal application from occurring after the fall harvest and before the spring planting season. As ammonia application is slated to be applied prior to the spring planting season, requires extended dry conditions for success, and a majority of customers buy on a cyclical basis, there was an increase in the volumes of ammonia purchased during the three months ended March 31, 2020 as compared to the three months
ended March 31, 2019. These increases in application and Other. purchases were not seen in the UAN market, as it can be applied more ratably throughout the growing season.
(1)Exclusive of depreciation and amortization expense.
Cost of materials and other consists primarily of freight and distribution expenses, feedstock expenses, purchased ammonia and purchased hydrogen. other. Cost of materials and other for the three months ended September 30, 2017March 31, 2020 was $19.4$24.0 million compared to $19.9$23.7 million for the three months ended September 30, 2016. The $0.5 million decrease was primarily due to lowerMarch 31, 2019 with increased production costs from transactions with third parties of $1.7 million, partiallygiven higher volumes and higher pet coke pricing that were offset by an increase in transactions with affiliates of $1.2 million. The lower third-partynatural gas costs incurred were primarily the result of decreased distribution costs due to the timing of regulatory railcar repairs and maintenance. The higher affiliate costs incurred were primarily the result of increased hydrogen purchases from a subsidiary of CVR Refining.at our East Dubuque Facility.
Direct Operating Expenses (Exclusive of Depreciation and Amortization). Direct operating expenses consist primarily(exclusive of energydepreciation and utility costs, direct costs of labor, property taxes, plant-related maintenance services and environmental and safety compliance costs as well as catalyst and chemical costs. amortization).Direct operating expenses (exclusive of depreciation and amortization) for the three months ended September 30, 2017March 31, 2020were $40.3$35.1 million as compared to $32.5$34.8 million for the three months ended September 30, 2016.March 31, 2019. The $7.8 million increase was primarily due to the third quarter 2017 turnaround at East Dubuque, which resulted in turnaround expenses of $2.5 million. The remaining increase was primarily due to having tohigher personnel costs.
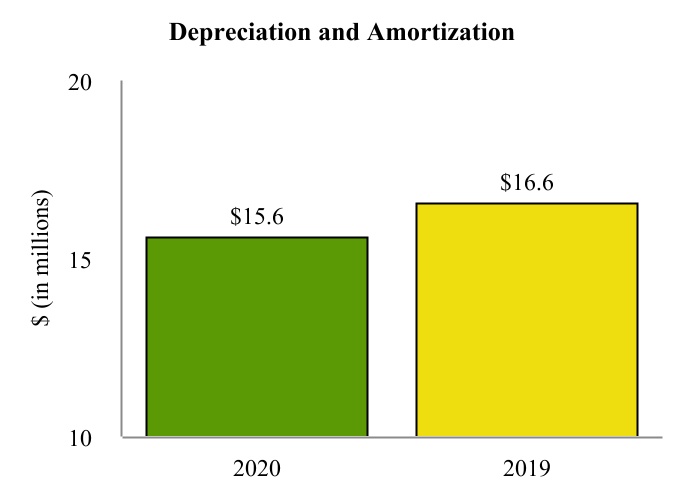
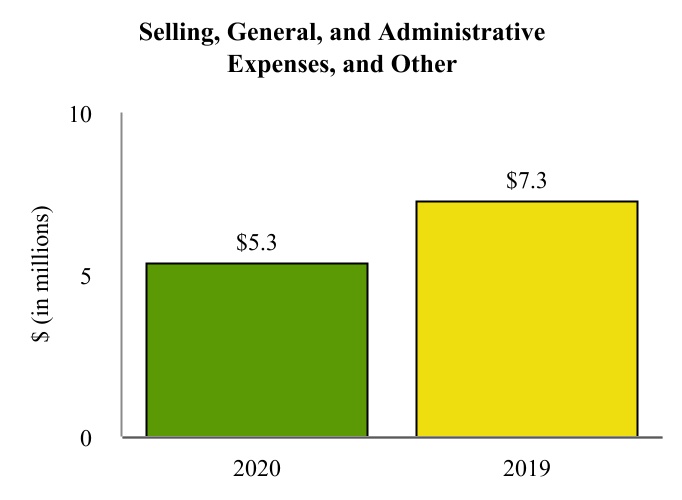
Depreciation and Amortization Expense - Depreciation and amortization expense fixed operating costs while idle as well as higher sales tons in the three months ended September 30, 2017 as compared to 2016, resulting in higher cost of inventory expensed during 2017.
Selling, General and Administrative Expenses. Selling, general and administrative expenses include the direct selling, general and administrative expenses of our business as well as certain expenses incurred by our affiliates, CVR Energy and its subsidiaries,
on our behalf and billed or allocated to us in accordance with the applicable agreements. We also reimburse our general partner in accordance with the partnership agreement for expenses it incurs on our behalf. Reimbursed expenses to our general partner are included as selling, general and administrative expenses from affiliates. Selling, general and administrative expenses were $6.1decreased $1.0 million for the three months ended March 31, 2020 compared to the three months ended March 31, 2019, as a result of higher depreciation on certain assets in January 2019 through September 30, 20172019 that are no longer being utilized following the 2019 turnaround at the East Dubuque Facility.
Selling, General, and $7.3Administrative Expenses, and Other - Selling, general and administrative expenses and other decreased $2.0 million for the three months ended September 30, 2016. The $1.2 million decrease was primarily dueMarch 31, 2020 compared to decreases in expenses associated with the East Dubuque Merger ($0.7 million).
Operating Income (Loss). Operating loss was $15.9 million for the three months ended September 30, 2017, as compared to operating income of $2.4 million for the three months ended September 30, 2016.March 31, 2019. The decrease of $18.3 million was the result of a decrease in net sales ($9.1 million), an increase in direct operating expenses ($7.8 million), an increase in depreciation and amortization ($3.1 million), partially offset by a decrease in cost of materials and other ($0.5 million) and a decrease in selling, general and administrative expenses ($1.2 million).
Net Loss.For the three months ended September 30, 2017, net loss was $31.6 million, as compared to $13.4 million of net loss for the three months ended September 30, 2016, an increase in net loss of $18.2 million. The increase in net loss was primarily due to the factors noted above.
Nine months ended September 30, 2017 Compared to the Nine months ended September 30, 2016
The nine months ended September 30, 2017 is not comparable to the nine months ended September 30, 2016 due to the acquisition of the East Dubuque Facility on April 1, 2016. Where appropriate, the East Dubuque Facility has been excluded from comparative discussions.
Net Sales. Consolidated net sales were $252.6 million for the nine months ended September 30, 2017compared to $271.4 million for the nine months ended September 30, 2016.
Excluding the East Dubuque Facility, net sales were $150.1 million for the nine months ended September 30, 2017 compared to $179.0 million for the nine months ended September 30, 2016. The decrease of $28.9 million was primarily attributable to the lower UAN sales prices ($22.4 million), lower ammonia sales prices ($3.7 million) and lower UAN sales volumes ($3.6 million), partially offset by higher ammonia sales volumes ($3.6 million) at the Coffeyville Facility. For the nine months ended September 30, 2017, UAN and ammonia made up $131.8 million and $13.4 million of our net sales, respectively, including freight. This compared to UAN and ammonia net sales of $157.8 million and $13.5 million, respectively, for the nine months ended September 30, 2016, including freight.
The following table demonstrates the impact of changes in sales volumes and pricing for the primary components of net sales at the Coffeyville Facility for the nine months ended September 30, 2017 as compared to the nine months ended September 30, 2016:
|
| | | | | | | |
| | Price Variance | | Volume Variance |
| | | | |
| | (in millions) |
| UAN | $ | (22.4 | ) | | $ | (3.6 | ) |
| Ammonia | $ | (3.7 | ) | | $ | 3.6 |
|
The decrease in UAN and ammonia sales prices at the Coffeyville Facility for the nine months ended September 30, 2017 compared to the nine months ended September 30, 2016 was primarily attributable to pricing fluctuation in the market.
Cost of Materials and Other. Cost of materials and other consists primarily of freight and distribution expenses, feedstock expenses, purchased ammonia and purchased hydrogen. Consolidated cost of materials and other was $63.3 million for the nine months ended September 30, 2017compared to $72.2 million for the nine months ended September 30, 2016.
Excluding the East Dubuque Facility, cost of materials and other was $41.3 million for the nine months ended September 30, 2017 compared to $42.3 million for the nine months ended September 30, 2016. The decrease of $1.0 million was attributable to lower costs from transactions with third parties of $4.7 million, partially offset by higher transactions with affiliates of $3.7 million. The decrease in transactions with third parties was primarily the result of decreased distribution costs due to the timing of regulatory railcar repairs and maintenance ($2.7 million) and lower freight expense ($1.3 million). The increase in transactions with affiliates was primarily the result of increased hydrogen purchases from a subsidiary of CVR Refining ($3.0 million).
Direct Operating Expenses (Exclusive of Depreciation and Amortization). Direct operating expenses consist primarily of energy and utility costs, direct costs of labor, property taxes, plant-related maintenance services and environmental and safety
compliance costs as well as catalyst and chemical costs. Consolidated direct operating expenses were $114.0 million for the nine months ended September 30, 2017compared to $110.4 million for the nine months ended September 30, 2016.
Excluding the East Dubuque Facility, direct operating expenses were $69.1 million for the nine months ended September 30, 2017 compared to $68.6 million for the nine months ended September 30, 2016. The increase of $0.5 million was attributable to higher costs from transactions with third parties of $1.5 million, partially offset by a decrease in transactions with affiliates of $1.0 million. The increase in transactions with third parties was primarily the result of increased electrical prices ($3.6 million), partially offset by lower repairs and maintenance ($2.3 million).
Depreciation and Amortization Expense. Consolidated depreciation expense was $54.9 million for the nine months ended September 30, 2017compared to $41.0 million for the nine months ended September 30, 2016.
Excluding the East Dubuque Facility, depreciation expense was $21.0 million for both the nine months ended September 30, 2017 and 2016.
Selling, General and Administrative Expenses. Selling, general and administrative expenses include the direct selling, general and administrative expenses of our business as well as certain expenses incurred by our affiliates, CVR Energy and its subsidiaries, on our behalf and billed or allocated to us in accordance with the applicable agreements. We also reimburse our general partner in accordance with the partnership agreement for expenses it incurs on our behalf. Reimbursed expenses to our general partner are included as selling, general and administrative expenses from affiliates. Consolidated selling, general and administrative expenses were $18.8 million for the nine months ended September 30, 2017compared to $22.0 million for the nine months ended September 30, 2016.
Excluding the East Dubuque Facility, selling, general and administrative expenses were $14.5 million for the nine months ended September 30, 2017 compared to $17.4 million for the nine months ended September 30, 2016. The decrease of $2.9 million was primarily attributablerelated to a decrease in expenses associatedshare-based compensation and corporate allocated costs.
Non-GAAP Measures
Our management uses certain non-GAAP performance measures, and reconciliations to those measures, to evaluate current and past performance and prospects for the future to supplement our GAAP financial information presented in accordance with U.S. GAAP. These non-GAAP financial measures are important factors in assessing our operating results and profitability and include the East Dubuque Merger ($3.1 million).performance and liquidity measures defined below.
Interest ExpenseEffective January 1, 2020, the Partnership no longer presents the non-GAAP performance measure of Adjusted EBITDA, as management no longer relies on this financial measure when evaluating the Partnership’s performance and Other Financing Costs. Consolidateddoes not believe it enhances the users understanding of its financial statements in a useful manner.
The following are non-GAAP measures that continue to be presented for the period ended March 31, 2020:
EBITDA - Net income (loss) before (i) interest expense, was $47.1 millionnet, (ii) income tax expense (benefit) and (iii) depreciation and amortization expense.
Reconciliation of Net Cash Provided By Operating Activities to EBITDA - Net cash provided by operating activities reduced by (i) interest expenses, net, (ii) income tax expense (benefit), (iii) change in working capital, and (iv) other non-cash adjustments.
Available Cash for Distribution - EBITDA reduced for cash reserves established by the nine months ended September 30, 2017,board of directors of our general partner for (i) debt service, (ii) maintenance capital expenditures, and, to the extent applicable, (iii) reserves for future operating or capital needs that the board of directors of our general partner deems necessary or appropriate, if any, in its sole discretion. Available cash for distribution may be increased by the release of previously established cash reserves, if any, and other excess cash, at the discretion of the board of directors of our general partner.
We present these measures because we believe they may help investors, analysts, lenders, and ratings agencies analyze our results of operations and liquidity in conjunction with our U.S. GAAP results, including, but not limited to, our operating performance as compared to $32.8 millionother publicly traded companies in the fertilizer industry, without regard to historical cost basis or financing methods, and our ability to incur and service debt and fund capital expenditures. Non-GAAP measures have important limitations as analytical tools, because they exclude some, but not all, items that affect net earnings and operating income. These measures should not be considered substitutes for their most directly comparable U.S. GAAP financial measures. Refer to the “Non-GAAP Reconciliations” included herein for reconciliation of these amounts. Due to rounding, numbers presented within this section may not add or equal to numbers or totals presented elsewhere within this document.
Non-GAAP Reconciliations
Reconciliation of Net Loss to EBITDA
| | | | | | | | | | | | | | | |
| Three Months Ended
March 31, | | | | | | |
| (in thousands) | 2020 | | 2019 | | | | |
| Net loss | $ | (20,735) | | | $ | (6,079) | | | | | |
| Add: | | | | | | | |
| Interest expense, net | 15,783 | | | 15,650 | | | | | |
| Income tax expense (benefit) | 7 | | | (112) | | | | | |
| Depreciation and amortization | 15,597 | | | 16,584 | | | | | |
| EBITDA | $ | 10,652 | | | $ | 26,043 | | | | | |
| | | | | | | |
| | | | | | | |
| | | | | | | |
Reconciliation of Net Cash Provided By Operating Activities to EBITDA
| | | | | | | | | | | | | | | |
| Three Months Ended
March 31, | | | | | | |
| (in thousands) | 2020 | | 2019 | | | | |
| Net cash provided by operating activities | $ | 27,707 | | | $ | 51,924 | | | | | |
| Add: | | | | | | | |
| Interest expense, net | 15,783 | | | 15,650 | | | | | |
| Income tax expense (benefit) | 7 | | | (112) | | | | | |
| Change in assets and liabilities | (32,060) | | | (39,099) | | | | | |
| Other non-cash adjustments | (785) | | | (2,320) | | | | | |
| EBITDA | $ | 10,652 | | | $ | 26,043 | | | | | |
Reconciliation of EBITDA to Available Cash for Distribution
| | | | | | | | | | | | | | | |
| Three Months Ended
March 31, | | | | | | |
| (in thousands) | 2020 | | 2019 | | | | |
| EBITDA | $ | 10,652 | | | $ | 26,043 | | | | | |
| Current reserves for amounts related to: | | | | | | | |
| Debt service | (14,999) | | | (14,827) | | | | | |
| Maintenance capital expenditures | (4,139) | | | (3,367) | | | | | |
| | | | | | | |
| | | | | | | |
| | | | | | | |
| | | | | | | |
| Other: | | | | | | | |
| | | | | | | |
| Release of previously established cash reserves | 2,567 | | | — | | | | | |
| Available Cash for distribution (1) (2) | $ | (5,919) | | | $ | 7,849 | | | | | |
| | | | | | | |
| | | | | | | |
| | | | | | | |
| Common units outstanding | 113,283 | | | 113,283 | | | | | |
(1)Amount represents the cumulative available cash based on year-to-date results. However, available cash for distribution is calculated quarterly, with distributions (if any) being paid in the period following declaration.
(2)The Partnership paid no cash distributions for the nine months ended September 30, 2016. The increase of $14.3 million was primarily due to lower outstanding debt in the firstfourth quarter of 2016. See Note 12 ("Debt") to Part I, Item 1 of this Report for a discussion of the financing transactions that occurred in the second quarter of 2016.2019.
Liquidity and Capital Resources
Our principal source of liquidity has historically been cash from operations, which can include cash advances from customers resulting from forward sales.prepay contracts. Our principal uses of cash are for working capital, capital expenditures, funding our debt service obligations, and paying distributions to our unitholders, as further discussed below.
WeThe effects of the COVID-19 pandemic have resulted in a significant and swift reduction in U.S. economic activity. These effects have caused significant volatility and disruption of the financial markets and may ultimately have an adverse impact on our financial performance and demand for our products. This period of extreme economic disruption, including business closures in the restaurant and food supply industries, idling of ethanol facilities, and limitations on the availability of the workforce, including farmers in the agricultural industry, may have an impact on our business, results of operations, and access to sources of liquidity. In view of the uncertainty of the depth and extent of the contraction in the U.S. economy and potential impact on the demand for our fertilizer products, we have taken proactive actions to address the impacts we may experience in our results of operations, liquidity, and financial condition, including the following:
•The deferment of the Coffeyville Facility turnaround from the fall of 2020 to the summer of 2021, enabled by certain maintenance we proactively performed during the quarter, and the East Dubuque Facility turnaround from 2021 to 2022; and
•A reduction in the amount of expected maintenance capital expenditures for the remainder of 2020 to only include those projects which are critical to continuing safe and reliable operations, or are required to support future activities.
When paired with the actions outlined above, we believe that our cash from operations and existing cash and cash equivalents, along with borrowings, as necessary, under the ABLAB Credit Facility, will be sufficient to satisfy anticipated cash commitmentsrequirements associated with our existing operations for at least the next 12 months. However, our future capital expenditures and other cash requirements could be higher than we currently expect as a result of various factors. Additionally, our ability to generate sufficient cash from our operating activities and secure additional financing depends on our future performance, which is subject to general economic, political, financial, competitive, and other factors, outsidesome of which may be beyond our control.
Depending on the needs of our business, contractual limitations, and market conditions, we may from time to time seek to issue equity securities, incur additional debt, issue debt securities, or otherwise refinance our existing debt. There can be no assurance that we will seek to do any of the foregoing or that we will be able to do any of the foregoing on terms acceptable to us or at all.
There have been no material changes in liquidity from our 2019 Form 10-K. The Partnership, and its subsidiaries, were in compliance with all covenants under their respective debt instruments as of March 31, 2020.
Cash Balance and Other Liquidity
As of September 30, 2017,March 31, 2020, we had cash and cash equivalents of $70.0$58.0 million, including $19.4$36.6 million offrom customer advances. Working capital at September 30, 2017 was $73.3Combined with $49.6 million consisting of $145.0 million in current assets and approximately $71.7 million in current liabilities. Working capital at December 31, 2016 was $71.5 million, consisting of $134.5 million in current assets and $63.0 million in current liabilities. As of October 30, 2017, we had cash and cash equivalents of $74.9 million.
2023 Notes
On June 10, 2016, the Partnership and CVR Nitrogen Finance Corporation issued $645.0 million aggregate principal amount of 9.250% Senior Secured Notes due 2023. The 2023 Notes were issued at a $16.1 million discount, which is being amortized over the term of the 2023 Notes as interest expense using the effective-interest method. As a result of the issuance, approximately $9.4 million of debt issuance costs were incurred, which are being amortized over the term of the 2023 Notes as interest expense using the effective-interest method.
The 2023 Notes are guaranteed on a senior secured basis by all of the Partnership’s existing subsidiaries.
At any time prior to June 15, 2019, we may on any of one or more occasions redeem up to 35% of the aggregate principal amount of the 2023 Notes issuedavailable under the indenture governing the 2023 Notes in an amount not greater than the net proceeds of one or more public equity offerings at a redemption price of 109.250% of the principal amount of the 2023 Notes, plus any accrued and unpaid interest to the date of redemption. Prior to June 15, 2019, we may on any one or more occasions redeem all or part of the 2023 Notes at a redemption price equal to the sum of: (i) the principal amount thereof, plus (ii) the Make Whole Premium, as defined in the indenture governing the 2023 Notes, at the redemption date, plus any accrued and unpaid interest to the applicable redemption date.
On and after June 15, 2019, we may on any one or more occasions redeem all or a part of the 2023 Notes at the redemption prices (expressed as percentages of principal amount) set forth below, plus any accrued and unpaid interest to the applicable redemption date on such Notes, if redeemed during the 12-month period beginning on June 15 of the years indicated below:
|
| | |
| Year | | Percentage |
| 2019 | | 104.625% |
| 2020 | | 102.313% |
| 2021 and thereafter | | 100.000% |
Upon the occurrence of certain change of control events as defined in the indenture (including the sale of all or substantially all of the properties or assets of the Partnership and its subsidiaries, taken as a whole), each holder of the 2023 Notes will have the right to require that the Partnership repurchase all or a portion of such holder’s 2023 Notes in cash at a purchase price equal to 101% of the aggregate principal amount thereof plus any accrued and unpaid interest to the date of repurchase.
The 2023 Notes contain customary covenants for a financing of this type that, among other things, restrict the Partnership’s ability and the ability of certain of its subsidiaries to: (i) sell assets; (ii) pay distributions on, redeem or repurchase the Partnership’s units or redeem or repurchase its subordinated debt; (iii) make investments; (iv) incur or guarantee additional indebtedness or issue preferred units; (v) create or incur certain liens; (vi) enter into agreements that restrict distributions or other payments from the Partnership’s restricted subsidiaries to the Partnership; (vii) consolidate, merge or transfer all or substantially all of the Partnership’s assets; (viii) engage in transactions with affiliates; and (ix) create unrestricted subsidiaries. Most of the foregoing covenants would cease to apply at such time that the 2023 Notes are rated investment grade by both Standard & Poor's Ratings Services and Moody's Investors Service, Inc. However, such covenants would be reinstituted if the 2023 Notes subsequently lost their investment grade rating. In addition, the indenture contains customary events of default, the occurrence of which would result in, or permit the trustee or the holders of at least 25% of the 2023 Notes to cause, the acceleration of the 2023 Notes, in addition to the pursuit of other available remedies.
The indenture governing the 2023 Notes prohibits us from making distributions to unitholders if any default or event of default (as defined in the indenture) exists. In addition, the indenture limits our ability to pay distributions to unitholders. The covenants will apply differently depending on our fixed charge coverage ratio (as defined in the indenture). If the fixed charge coverage ratio is not less than 1.75 to 1.0, we will generally be permitted to make restricted payments, including distributions to our unitholders, without substantive restriction. If the fixed charge coverage ratio is less than 1.75 to 1.0, we will generally be permitted to make restricted payments, including distributions to our unitholders, up to an aggregate $75.0 million basket plus certain other amounts referred to as "incremental funds" under the indenture. As of September 30, 2017, the ratio was less than 1.75 to 1.0. Restricted payments have been made, and $72.7 million of the basket was available as of September 30, 2017. As of September 30, 2017, we were in compliance with the covenants contained in the 2023 Notes.
Asset Based (ABL) Credit Facility
On September 30, 2016, the Partnership entered into the ABLAB Credit Facility with a group of lenders and UBS AG, Stamford Branch, as administrative agent and collateral agent. The ABL Credit Facility is a senior secured asset based revolving credit facility in an aggregate principal amount of availability of up to $50.0 million with an incremental facility, which permits an increase in borrowings of up toless $25.0 million in cash included in our borrowing base, we had total liquidity of $82.6 million as of March 31, 2020.
| | | | | | | | | | | |
| March 31, 2020 | | December 31, 2019 |
| (in thousands) | | | |
| 9.25% Senior Notes due 2023 | $ | 645,000 | | | $ | 645,000 | |
| 6.50% Senior Notes due 2021 | 2,240 | | | 2,240 | |
| Unamortized discount and debt issuance costs | (13,925) | | | (14,834) | |
| Total debt | $ | 633,315 | | | $ | 632,406 | |
The Partnership has the aggregate subject to additional lender commitments2023 Senior Notes, the 6.50% Senior Notes due 2021, and certain other conditions. Thean AB Credit Facility, the proceeds of the loanswhich may be used forto fund working capital, capital expenditures, and working capital and general corporate purposes of the Partnership and its subsidiaries. The ABL Credit Facility provides for loans and standby letters of credit in an amount up to the aggregate availability under the facility, subject to meeting certain borrowing base conditions, with sub-limits of the lesser of 10% of the total facility commitment and $5.0 million for swingline loans and $10.0 million for letters of credit. The ABL Credit Facility has a five-year maturity and will be used for working capital and other general corporate purposes.
At the option Refer to Note 5 (“Long-Term Debt”) in Part II, Item 8 of the borrowers, loans under the ABL Credit Facility initially bear interest at an annual rate equal to (i) 2.00% plus LIBOR or (ii) 1.00% plus a base rate, subject to a 0.50% step-down based on the previous quarter’s excess availability.2019 Form 10-K for further discussion.
The Partnership must also pay a commitment fee on the unutilized commitments to the lenders under the ABL Credit Facility equal to (a) 0.375% per annum for the first full calendar quarter after the closing date and (b) thereafter, (i) 0.375% per annum if utilization under the facility is less than 50% of the total commitments and (ii) 0.25% per annum if utilization under the facility is equal to or greater than 50% of the total commitments. The borrowers must also pay customary letter of credit fees equal to 2.00%, subject to a 0.50% step-down based on the previous quarter’s excess availability, on the maximum amount available to be drawn under, and customary facing fees equal to 0.125% of the face amount of, each letter of credit.
The ABL Credit Facility also contains customary covenants for a financing of this type that limit the ability of the Partnership to, among other things, incur liens, engage in a consolidation, merger, purchase or sale of assets, pay dividends, incur indebtedness, make advances, investments and loans, enter into affiliate transactions, issue equity interests, or create subsidiaries and unrestricted subsidiaries. The ABL Credit Facility also contains a fixed charge coverage ratio financial covenant, as defined therein. The Partnership was in compliance with the covenants of the ABL Credit Facility as of September 30, 2017.
As of September 30, 2017, the Partnership and its subsidiaries had availability under the ABL Credit Facility of $47.6 million. There were no borrowings outstanding under the ABL Credit Facility as of September 30, 2017.
Capital Spending
We divide our capital spending needs into two categories: maintenance and growth. Maintenance capital spending includes only non-discretionary maintenance projects and projects required to comply with environmental, health, and safety regulations. We also treat maintenance capital spending as a reduction of cash available for distribution to unitholders. Growth capital projects generally involve an expansion of existing capacity improvement in product yields and/or a reduction in direct operating expenses. Major scheduled turnaround expenses are expensed when incurred.We undertake growth capital spending based on the expected return on incremental capital employed. Our total capital expenditures for the ninethree months ended September 30, 2017 were approximately $11.4 million, including $11.1 millionMarch 31, 2020, along with our estimated expenditures for 2020 are as follows:
| | | | | | | | | | | |
| Three Months Ended March 31, | | Estimated full year |
| (in thousands) | 2020 | | 2020 |
| Maintenance capital | $ | 4,139 | | | $14,000 - 16,000 | |
| Growth capital | 1,454 | | | 5,000 - 7,000 | |
| Total capital expenditures | $ | 5,593 | | | $19,000 - 23,000 | |
In light of the changing environment and proactive maintenance capital spendingperformed during several outages at the third-party owned and operated air separation unit at Coffeyville, we are moving our turnaround from the remainder for growth capital projects.
Capital spending forpreviously planned timeframe of the fall of 2020 to the summer of 2021. We will continue to monitor market conditions and make adjustments, if needed, to our business has been and will be determined by the Board of Directors of our general partner. Our estimated maintenance capital expenditures are expected to be approximately $15 million for the year ending December 31, 2017.current plans. Our estimated capital expenditures are subject to change due to unanticipated changes in the cost, scope and completion time for our capital projects. For example, we may experience increases/decreasesunexpected changes in labor or equipment costs necessary to comply with government regulations or to complete projects that sustain or improve the profitability of our facilities.
Major Scheduled Turnaround Expenditures
Consistent, safe and reliable operations are criticalthe nitrogen fertilizer plants. We may also accelerate or defer some capital expenditures from time to our financial performance and results of operations. Unplanned downtime of either plant may result in lost margin opportunity, increased maintenance expense and a temporary increase in working capital investment and related inventory position. The financial impact of planned downtime, such as major turnaround maintenance,time. Capital spending is mitigated through a diligent planning process that takes into account margin environment,determined by the availability of resources to perform the needed maintenance, feedstock logistics and other factors.
Historically, the Coffeyville Facility has undergone a full facility turnaround every two to three years. The Coffeyville Facility underwent a full facility turnaround in the third quarter of 2015, at a cost of approximately $7.0 million, exclusive of the impacts due to the lost production during the downtime. The Partnership is planning to undergo the next scheduled full facility turnaround at the Coffeyville Facility in 2018.
Historically, the East Dubuque Facility has also undergone a full facility turnaround every two to three years. The East Dubuque Facility underwent a full facility turnaround in the second quarter of 2016, at a cost of approximately $6.6 million, exclusive of the impacts due to the lost production during the downtime. We determined that there were more pressing preventative maintenance issues at the East Dubuque Facility, so we completed a scheduled turnaround at the East Dubuque Facility in the third quarter of 2017 at a cost of approximately $2.6 million, exclusive of the impacts of the lost production during the downtime.
Distributions to Unitholders
The board of directors of the Partnership'sPartnership’s general partner.
Distributions to Unitholders
The current policy of the board of directors of the Partnership’s general partner has a policy for the Partnershipis to distribute all available cashAvailable Cash the Partnership generated on a quarterly basis. See Note 8 ("Available Cash for each quarter will be determined by the board of directors of the Partnership’s general partner following the end of such quarter. Available Cash for each quarter is calculated as Adjusted EBITDA reduced for cash needed for (i) debt service, (ii) maintenance capital expenditures, (iii) turnaround expenses, and, to the extent applicable, (iv) reserves for future operating or capital needs that the board of directors of our general partner deems necessary or appropriate, if any, in its sole discretion. Available Cash for distribution may be increased by the release of previously established cash reserves, if any, and other excess cash, at the discretion of the board of directors of our general partner.
Distributions, if any, including the payment, amount and timing thereof, are subject to change at the discretion of the board of directors of CVR Partners’ general partner. There were no distributions paid by the Partnership during the three months ended March 31, 2020 related to the fourth quarter of 2019, and no distributions were declared for the first quarter of 2020, as the board of directors determined there was no available cash for the quarter.
The following table presents distributions paid by the Partnership to CVR Partners’ unitholders, including amounts paid to CVR Energy, during 2019.
| | | | | | | | | | | | | | | | | | | | | | | | | | | | | | | | |
| | | | | | Distributions Paid (in thousands) | | | | |
| Related Period | | Date Paid | | Distribution Per
Common Unit | | Public Unitholders | | CVR Energy | | Total |
| 2018 - 4th Quarter | | March 11, 2019 | | $ | 0.12 | | | $ | 8,924 | | | $ | 4,670 | | | $ | 13,594 | |
| 2019 - 1st Quarter | | May 13, 2019 | | 0.07 | | | 5,205 | | | 2,724 | | | 7,929 | |
| 2019 - 2nd Quarter | | August 12, 2019 | | 0.14 | | | 10,411 | | | 5,449 | | | 15,860 | |
| 2019 - 3rd Quarter | | November 11, 2019 | | 0.07 | | | 5,205 | | | 2,724 | | | 7,930 | |
| Total distributions | | | | $ | 0.40 | | | $ | 29,745 | | | $ | 15,567 | | | $ | 45,313 | |
Capital Structure
On May 6, 2020, the board of directors of the Partnership’s general partner authorized a unit repurchase program (the “Unit Repurchase Program”). The Unit Repurchase Program enables the Partnership to repurchase up to $10 million of the Partnership’s common units. Repurchases under the Unit Repurchase Program may be made from time-to-time through open market transactions, block trades, privately negotiated transactions, or otherwise in accordance with applicable securities laws. The timing, price, and amount of repurchases (if any) will be made at the discretion of management of our general partner and are subject to market conditions, as well as corporate, regulatory, and other considerations. This Unit Repurchase Program does not obligate the Partnership Distributions") to Part I, Item 1acquire any common units and may be cancelled or terminated by our general partner’s board of directors at any time.
Recent Developments
As disclosed in our Current Report on Form 8-K filed with the SEC on April 24, 2020, on April 20, 2020, the average closing price of our common units had fallen below $1.00 per unit over a 30 consecutive trading-day period, which is the minimum average unit price for continued listing on the NYSE under Section 802.01C of the NYSE Listing Company Manual. Under the NYSE’s rules, the Partnership has six months following receipt of this Report for information on our distribution policy. The following is a summary of cash distributions paidnotification to regain compliance with the minimum unit price requirement. However, due to the Partnership's unitholders during 2017 forunprecedented market-wide declines as a result of the respective quartersongoing spread of COVID-19, the Securities and Exchange Commission approved the NYSE’s request to whichtoll the distributions relate:six month compliance period through and including June 30, 2020. As a result, the Partnership has until January 1, 2021 to regain compliance with this continued listing standard. Although the Partnership intends to pursue measures to cure the unit price non-compliance and return to compliance with the NYSE continued listing requirements in Section 802.01C of the NYSE Listed Company Manual, no assurance can be given that the Partnership will be able to regain compliance with the aforementioned listing requirement. Since the filing of our Form 8-K, our unit price has continued to trade under $1.00.
|
| | | | | | | | | | | | | | | |
| | December 31,
2016 | | March 31, 2017 | | June 30,
2017 | | Total Cash Distributions Paid in 2017 |
| | | | | | | | |
| | ($ in millions, except per common unit amounts) |
| Amount paid to CRLLC | $ | — |
| | $ | 0.8 |
| | $ | — |
| | $ | 0.8 |
|
| Amount paid to public unitholders | — |
| | 1.5 |
| | — |
| | 1.5 |
|
| Total amount paid | $ | — |
| | $ | 2.3 |
| | $ | — |
| | $ | 2.3 |
|
| Per common unit | $ | — |
| | $ | 0.02 |
| | $ | — |
| | $ | 0.02 |
|
| Common units outstanding (in thousands) | 113,283 |
| | 113,283 |
| | 113,283 |
| | |
Cash Flows
The following table sets forth our cash flows for the periods indicated below:
| | | | | | | | | | | | | | | | | |
| Three Months Ended March 31, | | | | |
| (in thousands) | 2020 | | 2019 | | Change |
| Net cash flow provided by (used in): | | | | | |
| Operating activities | $ | 27,707 | | | $ | 51,924 | | | $ | (24,217) | |
| Investing activities | (6,662) | | | (3,500) | | | (3,162) | |
| Financing activities | (25) | | | (13,594) | | | 13,569 | |
| Net increase in cash and cash equivalents | $ | 21,020 | | | $ | 34,830 | | | $ | (13,810) | |
|
| | | | | | | |
| Nine Months Ended
September 30, |
| | 2017 | | 2016 |
| | | | |
| | (in millions) |
| Net cash flow provided by (used in): | | | |
| Operating activities | $ | 28.1 |
| | $ | 47.5 |
|
| Investing activities | (11.4 | ) | | (82.1 | ) |
| Financing activities | (2.3 | ) | | 49.9 |
|
| Net increase in cash and cash equivalents | $ | 14.4 |
| | $ | 15.3 |
|
Cash Flows Provided by Operating Activities
For purposes of this cash flow discussion, we define trade working capital as accounts receivable, inventory and accounts payable. Other working capital is defined as all other current assets and liabilities except trade working capital.
NetThe change in net cash flows provided byfrom operating activities for the ninethree months ended September 30, 2017 were approximately $28.1 million. The positive cash flow from operating activities generated over this period was primarily driven by a net loss of $45.4 million offset by non-cash depreciation and amortization of $54.9 million, net cash inflows from other working capital of $17.1 million and net cash outflows from trade working capital of $2.8 million. The net cash inflow for other working capital was dueMarch 31, 2020 as compared to an increase to accrued expenses and other current liabilities of $8.0 million, an increase in deferred revenue of $7.4 million and a decrease to prepaid expenses and other current assets of $1.7 million. The increase in accrued expenses and other current liabilities is primarily a result of higher accrued interest of $14.9 million, partially offset by decreases in balances related to the timing of accrued railcar regulatory inspections of $2.4 million and timing of personnel expenses. The increase in deferred revenue was primarily due to collection of customer prepayments scheduled for deliveries during the three months ended DecemberMarch 31, 2017. The net cash outflow for trade working capital was2019 is primarily due to a decreasedecline in accounts payablenet income, excluding non-cash items, of $4.6$17.2 million, partially offset by a decreaseunfavorable changes in accounts receivablenon-current assets and liabilities of $1.6$1.4 million, and an increaseunfavorable changes in inventory of $0.2 million. The decrease in accounts payable was primarily attributable to normal fluctuations in the timing of payments.
Net cash flows provided by operating activities for the nine months ended September 30, 2016 were approximately $47.5 million. The positive cash flow from operating activities generated over this period was primarily driven by a net loss of $12.4 million offset by non-cash depreciation and amortization of $41.0 million and net cash inflows from trade working capital of $37.2 million, partially offset by net cash outflows from other working capital of $27.5$5.6 million. Fluctuations in trade working capital increased our operating cash flow by $37.2 million due to a decrease in inventory of $32.2 million, a decrease in accounts receivable of $3.4 million and an increase in accounts payable of $1.6 million. The decrease in inventory was primarily attributable to a decrease in finished goods inventory as a result of increased sales volumes for the nine months ended September 30, 2016. Fluctuations in other working capital of $27.5 million decreased our operating cash flow and were due to a decrease in deferred revenue of $27.7 million and a decrease to accrued expenses and other current liabilities of $4.0 million, partially offset by a decrease to prepaid expenses and other current assets of $4.2 million for the nine months ended September 30, 2016. The decrease in deferred revenue was primarily attributable to increased sales for the nine months ended September 30, 2016.
Cash Flows Used in Investing Activities
NetThe change in net cash used in investing activities for the ninethree months ended September 30, 2017 was $11.4 millionMarch 31, 2020 compared to $82.1 million for the ninethree months ended September 30, 2016. For the nine months ended September 30, 2017, net cash used in investing activitiesMarch 31, 2019, was the result of capital expenditures. For the nine months ended September 30, 2016, net cash used in investing activities was the result of cash merger consideration of $63.9 million, net of cash acquired, and was the result ofprimarily due to increased capital expenditures during 2020 of $18.3$3.2 million.
Cash Flows Used in Financing Activities
Cash flows usedThe change in financing activities for the nine months ended September 30, 2017 were $2.3 million, compared to net cash flows provided by financing activities for the nine months ended September 30, 2016 of $49.9 million. The net cash used in financing activities for the ninethree months ended September 30, 2017 was attributableMarch 31, 2020 compared to quarterly cash distributions. The net cash provided by financing activities for the ninethree months ended September 30, 2016March 31, 2019 was primarily attributable to the financing transactions discussed in Note 12 ("Debt") to Part I, Item 1result of this Report, partially offset by the quarterly cash distributions andpaid as of the purchasethree months ended March 31, 2019 of 400,000 CVR Nitrogen common units from CVR Energy for $5.0$13.6 million.
Contractual Obligations
As of September 30, 2017, our contractual obligations included long-term debt, operating leases, unconditional purchase obligations, other specified capital and commercial commitments and interest payments. There No distributions were no material changes outside the ordinary course of our business with respect to our contractual obligationspaid during the ninethree months ended September 30, 2017, from those disclosed in our 2016 Form 10-K.March 31, 2020.
Off-Balance Sheet Arrangements
We do not have any "off-balance“off-balance sheet arrangements"arrangements” as such term is defined within the rules and regulations of the SEC.
Recent Accounting Pronouncements
Refer to Note 3 ("Recent Accounting Pronouncements") to Part I, Item 1 of this Report for a discussion of recent accounting pronouncements applicable to the Partnership.
Critical Accounting Policies and Estimates
Our critical accounting policies are disclosed in the "Critical Accounting Policies" section of our 2016 Form 10-K. No modifications have been made to our critical accounting policies. See Note 9 ("Goodwill") to Part I, Item 1 of this Report for a discussion of goodwill considerations.
Item 3. Quantitative and Qualitative Disclosures About Market Risk
Commodity Price, Foreign Currency ExchangeThere have been no material changes to our market risks as of and Non-Operating Risks
We are exposed to significant market risk due to potential changes in prices for fertilizer products and natural gas. Natural gas is the primary raw material used in the production of various nitrogen-based products manufactured at our East Dubuque Facility. We have commitments to purchase natural gas for use in our East Dubuque Facility on the spot market, and through short-term, fixed supply, fixed price and index price purchase contracts. Natural gas prices have fluctuated during the last several years, increasing substantially in 2008 and subsequently decliningthree months ended March 31, 2020 as compared to the current lower pricing levels.
In the normal course of business, we produce nitrogen-based fertilizer products throughout the year to supply the needsrisks discussed in Part II, Item 7A of our customers during the high-delivery-volume spring and fall seasons. The value of fertilizer product inventory is subject to market risk due to fluctuations in the relevant commodity prices. Prices of nitrogen fertilizer products can be volatile. We believe that market prices of nitrogen products are affected by changes in grain prices and demand, natural gas prices and other factors. In the opinion of our management, there is no derivative financial instrument that correlates effectively with, and has a trading volume sufficient to hedge, our firm commitments and forecasted commodity sales transactions.2019 Form 10-K.
We do not currently use derivative financial instruments to manage risks related to changes in prices of commodities (e.g., UAN, ammonia, natural gas or pet coke), except as noted above. Given that our business is currently based entirely in the United States, we are not directly exposed to foreign currency exchange rate risk. We do not engage in activities that expose us to speculative or non-operating risks, including derivative trading activities. Our management may, in the future, elect to use derivative financial instruments consistent with our overall business objectives to avoid unnecessary risk and to limit, to the extent practical, risks associated with our operating activities.
Item 4. Controls and Procedures
Evaluation of Disclosure Controls and Procedures
As of September 30, 2017,March 31, 2020, we have evaluated, under the direction of our Executive Chairman, Chief Executive Officer, Chief Financial Officer and Chief FinancialAccounting Officer, the effectiveness of our disclosure controls and procedures, as defined in Rule 13a-15(e) under the Securities Exchange Act of 1934, as amended (the "Exchange Act")Rule 13a-15(e). There are inherent limitations to the effectiveness of any system of disclosure controls and procedures, including the possibility of human error and the circumvention or overriding of the controls and procedures. Accordingly, even effective disclosure controls and procedures can only provide reasonable assurance of achieving their control objectives. Based upon and as of the date of that evaluation, our Executive Chairman, Chief Executive Officer, Chief Financial Officer and Chief FinancialAccounting Officer concluded that our disclosure controls and procedures were effective to provide reasonable assurance that information required to be disclosed in the reports that we file or submit under the Exchange Act is recorded, processed, summarized and reported within the time periods specified in the SEC’s rules and forms, and that such information is accumulated and communicated to the Partnership’s management, including our Executive Chairman, Chief Executive Officer, Chief Financial Officer, and Chief FinancialAccounting Officer as appropriate, to allow timely decisions regarding required disclosure. It should be noted that any system
Changes in Internal Control Over Financial Reporting
There hashave been no material changechanges in ourthe Partnership’s internal controlcontrols over financial reporting required by Rule 13a-15 of the Exchange Act that occurred during the fiscal quarter ended September 30, 2017March 31, 2020 that has materially affected, or is reasonably likely to materially affect, ourthe Partnership’s internal control over financial reporting.
PART II. OTHER INFORMATION
Part II. Other Information
Item 1. Legal Proceedings
See Note 13 ("11 (“Commitments and Contingencies"Contingencies”) to Part I, Item 1 of this Report, which is incorporated by reference into this Part II, Item 1, for a description of certain litigation, legal, and administrative proceedings and environmental matters.
Item 1A. Risk Factors
There have been no material changes fromThe risk factors below should be read in conjunction with the risk factors previously discussed in Part I, Item 1A of our 2019 Form 10-K, which risk factors could also be affected by the potential effects of the outbreak of COVID-19 discussed below. Additional risks and uncertainties, including risks and uncertainties not presently known to us, or that we currently deem immaterial, could also have an adverse effect on our business, financial condition, and/or results of operations.
The COVID-19 pandemic, and actions taken in response thereto, could materially adversely affect our business, operations, financial condition, and results of operations.
The COVID-19 pandemic and actions of governments and others in response thereto is negatively impacting worldwide economic and commercial activity and financial markets. The COVID-19 pandemic has also resulted in significant business and operational disruptions, including closures, supply chain disruptions, travel restrictions, stay-at-home orders, and limitations on the availability and effectiveness of the workforce. The full impact of the COVID-19 pandemic is unknown and is rapidly evolving. The extent to which the COVID-19 pandemic negatively impacts our business and operations, including the availability and pricing of feedstocks, will depend on the severity, location, and duration of the effects and spread of COVID-19, the actions undertaken by national, regional, and local governments and health officials to contain such virus or remedy its effects, and if, how quickly and to what extent economic conditions recover and normal business and operating conditions resume.
If we fail to regain or maintain compliance with the continued listing standards of the NYSE, which may result in delisting of our common units from the NYSE.
As disclosed in our Form 8-K filed with the "Risk Factors" sectionSEC on April 24, 2020, on April 20, 2020, the average closing price of the Partnership’s common units fell below $1.00 per unit over a consecutive 30 trading-day period, which is the minimum average unit price for continued listing on the NYSE under Section 802.01C of the NYSE Listing Company Manual. While the Partnership is considering various options it may take in an effort to cure this deficiency and regain compliance, no assurance can be given that the Partnership will be able to regain compliance with the aforementioned listing requirement. If the Partnership fails to regain compliance, our common units will be subject to the NYSE’s suspension and delisting procedures. If the Partnership’s common units ultimately were to be delisted for any reason, such delisting could negatively impact the Partnership, by among other things, reducing the liquidity and market price of our 2016 Form 10-K.common units, reducing the number of investors willing to hold or acquire our common units, and limiting our ability to issue securities or obtain financing in the future.
Item 2. Unregistered Sales of Equity Securities and Use of Proceeds
See Note 1 (“Organization and Nature of Business”) to Part I, Item 1 of this Report, which is incorporated by reference into this Part II, Item 2, for a discussion of the Partnership’s Unit Repurchase Program.
Item 5. Other Information
None.
Item 6. Exhibits
| | | | | | | | |
| Exhibit | | Exhibit Description |
| | |
| |
EXHIBIT INDEX |
Exhibit
Number
31.1* | |
Exhibit Description
|
| |
| |
| | |
| 31.3* | | |
| 31.4* | | |
| 32.1† | | |
| |
| |
| |
| 101* | | The following financial information for CVR Partners, LP’s Quarterly Report on Form 10-Q for the quarter ended September 30, 2017,March 31, 2020, formatted in XBRL ("(“Extensible Business Reporting Language"Language”) includes: (1) Condensed Consolidated Balance Sheets (unaudited), (2) Condensed Consolidated Statements of Operations (unaudited), (3) Condensed Consolidated Statements of Comprehensive Income (Loss) (unaudited), (4) Condensed Consolidated Statement of Partners’ Capital (unaudited), (5)(4) Condensed Consolidated Statements of Cash Flows (unaudited) and (6)(5) the Notes to Condensed Consolidated Financial Statements (unaudited), tagged in detail. |
| | |
| | |
| | |
| | |
*Filed herewith.
†Furnished herewith.
PLEASE NOTE: Pursuant to the rules and regulations of the SEC, we may file or incorporate by reference agreements referenced as exhibits to the reports that we file with or furnish to the SEC. The agreements are filed to provide investors with information regarding their respective terms. The agreements are not intended to provide any other factual information about the Partnership, its business or operations. In particular, the assertions embodied in any representations, warranties and covenants contained in the agreements may be subject to qualifications with respect to knowledge and materiality different from those applicable to investors and may be qualified by information in confidential disclosure schedules not included with the exhibits. These disclosure schedules may contain information that modifies, qualifies and creates exceptions to the representations, warranties and covenants set forth in the agreements. Moreover, certain representations, warranties and covenants in the agreements may have been used for the purpose of allocating risk between the parties, rather than establishing matters as facts. In addition, information concerning the subject matter of the representations, warranties and covenants may have changed after the date of the respective agreement, which subsequent information may or may not be fully reflected in the Partnership’s public disclosures. Accordingly, investors should not rely on the representations, warranties and covenants in the agreements as characterizations of the actual state of facts about the Partnership, its business or operations on the date hereof.
SIGNATURES
Pursuant to the requirements of the Securities Exchange Act of 1934, the registrant has duly caused this report to be signed on its behalf by the undersigned thereunto duly authorized.
| | | | | | | | | | | |
| | CVR Partners, LP | |
| | By: | CVR GP, LLC, its general partner |
| | | |
| | | |
| | CVR Partners, LP | |
| | | |
| | By: | CVR GP, LLC, its general partner |
| | | |
November 1, 2017 | | By: | /s/ JOHN J. LIPINSKI |
| May 7, 2020 | | By: | Executive Chairman/s/ Tracy D. Jackson |
| | | (Principal Executive Officer) |
| | | |
November 1, 2017 | | By: | /s/ MARK A. PYTOSH |
| |
| Chief Executive OfficerVice President and President |
| |
| (Principal Executive Officer) |
| | | |
November 1, 2017 | | By: | /s/ SUSAN M. BALL |
| | | Chief Financial Officer and Treasurer |
| | | (Principal Financial Officer) |
| | | |
| | | |
| May 7, 2020 | | By: | /s/ Matthew W. Bley |
| | | Chief Accounting Officer and Corporate Controller |
| | | (Principal Accounting Officer) |
| | | |