UNITED STATES
SECURITIES AND EXCHANGE COMMISSION
Washington, D.C. 20549
Form 10-Q
|
| | | | | | | |
| (Mark One) | | |
| ☑ | QUARTERLY REPORT PURSUANT TO SECTION 13 OR 15(d) OF THE SECURITIES EXCHANGE ACT OF 1934 | |
| For the quarterly period ended | SeptemberJune 30, 20192020
|
| OR | | |
| ☐ | TRANSITION REPORT PURSUANT TO SECTION 13 OR 15(d) OF THE SECURITIES EXCHANGE ACT OF 1934 | |
| For the transition period from to . | |
Commission file number: 001-35120
CVR PARTNERS, LP
(Exact name of registrant as specified in its charter) |
| | | | | | | | | | | | | |
| Delaware | | | | 56-2677689 |
(State or other jurisdiction of
incorporation or organization) | | | | (I.R.S. Employer
Identification No.)
|
2277 Plaza Drive, Suite 500,, Sugar Land,, Texas77479
(Address of principal executive offices) (Zip Code)
(281) (281) 207-3200
(Registrant’s telephone number, including area code)
Securities registered pursuant to Section 12(b) of the Act:
|
| | | | | | | |
| Title of each class | Trading Symbol(s) | Name of each exchange on which registered |
| Common units representing limited partner interests | UAN | The New York Stock Exchange |
Indicate by check mark whether the registrant (1) has filed all reports required to be filed by Section 13 or 15(d) of the Securities Exchange Act of 1934 during the preceding 12 months (or for such shorter period that the registrant was required to file such reports), and (2) has been subject to such filing requirements for the past 90 days. Yes ☑ No ☐
Indicate by check mark whether the registrant has submitted electronically every Interactive Data File required to be submitted pursuant to Rule 405 of Regulation S-T (§232.405 of this chapter) during the preceding 12 months (or for such shorter period that the registrant was required to submit such files). Yes ☑ No ☐
Indicate by check mark whether the registrant is a large accelerated filer, an accelerated filer, a non-accelerated filer, a smaller reporting company, or an emerging growth company. See the definitions of “large accelerated filer,” “accelerated filer,” “smaller reporting company” and “emerging growth company” in Rule 12b-2 of the Exchange Act.
|
| | | | | | | | | | | | | | | | |
| Large accelerated filer | ☐ | Accelerated filer | ☑ | Non-Accelerated filer | ☐ |
| Smaller reporting company | ☐ | Emerging growth company | ☐ | | |
If an emerging growth company, indicate by check mark if the registrant has elected not to use the extended transition period for complying with any new or revised financial accounting standards provided pursuant to Section 13(a) of the Exchange Act. ☐
Indicate by check mark whether the registrant is a shell company (as defined by Rule 12b-2 of the Exchange Act). Yes ☐ No ☑
There were 113,282,973111,244,971 common units representing limited partner interests of CVR Partners, LP (“common units”) outstanding at October 22, 2019.
TABLE OF CONTENTS
CVR PARTNERS, LP - Quarterly Report on Form 10-Q
SeptemberJune 30, 20192020
| | | | | | | | | | | | | | | | | | | | |
| PART I. Financial Information | | | | PART II. Other Information | | |
| | | | | | |
| | | | Item 1. | | |
| | | | | | |
| | | | | | |
| | | | | | |
| | | | | | |
| | | | | | |
| | | | | | |
| | | | | | |
| | | | | | |
| | | | | | |
This Quarterly Report on Form 10-Q (including documents incorporated by reference herein) contains statements with respect to our expectations or beliefs as to future events. These types of statements are “forward-looking” and subject to uncertainties. See “Important Information Regarding Forward-Looking Statements” section of this filing.
SeptemberJune 30, 20192020 | 2
Important Information Regarding Forward-Looking Statements
This Quarterly Report on Form 10-Q (this “Report”) contains forward-looking statements within the meaning of Section 27A of the Securities Act of 1933, as amended (the “Securities Act”), and Section 21E of the Securities Exchange Act of 1934, as amended (the “Exchange Act”), including, but not limited to, those under Item 2. Management’s Discussion and Analysis of Financial Condition and Results of Operations. These forward-looking statements are subject to a number of risks and uncertainties, many of which are beyond our control. All statements other than statements of historical fact, including without limitation, statements regarding future operations, financial position, estimated revenues and losses, growth, capital projects, unit repurchases, impacts of legal proceedings, projected costs, prospects, plans and objectives are forward-looking statements. The words “could,” “believe,” “anticipate,” “intend,” “estimate,” “expect,” “may,” “continue,” “predict,” “potential,” “project,” and similar terms and phrases are intended to identify forward-looking statements.
Although we believe our assumptions concerning future events are reasonable, a number of risks, uncertainties and other factors could cause actual results and trends to differ materially from those projected or forward-looking. Forward-looking statements, as well as certain risks, contingencies, or uncertainties that may impact our forward-looking includingstatements, include, but are not limited to:to, the following:
•our ability to generate distributable cash or make cash distributions on our common units;
•the volatile nature of our business and the variable nature of our distributions;
•the severity, magnitude, duration, and impact of the novel coronavirus 2019 (“COVID-19”) pandemic and of businesses’ and governments’ responses to such pandemic on our operations, personnel, commercial activity, and supply and demand across our and our customers’ and suppliers’ businesses;
•changes in market conditions and market volatility arising from the COVID-19 pandemic, including fertilizer, natural gas, and other commodity prices and the impact of such changes on our operating results and financial position;
•the ability of our general partner to modify or revoke our distribution policy at any time;
volatile margins•the cyclical and seasonal nature of our business;
•the impact of weather on our business including our ability to produce, market, or sell fertilizer products profitably or at all;
•the dependence of our operations on a few third-party suppliers, including providers of transportation services, and equipment;
•our reliance on, or our ability to procure economically or at all, pet coke we purchase from CVR Energy, Inc. (together with its subsidiaries, but excluding the Partnership and its subsidiaries, “CVR Energy”) and third-party suppliers;
•our reliance on the natural gas, electricity, oxygen, nitrogen, sulfur processing, compressed dry air and other products that we purchase from third parties;
•the supply, availability, and prices of essential raw materials;
•our production levels, including the risk of a material decline in those levels;
•accidents or other unscheduled shutdowns or interruptions affecting our facilities, machinery, or equipment, or those of our suppliers or customers;
•potential operating hazards from accidents, fire, severe weather, tornadoes, floods or other natural disasters;
•our ability to obtain, retain, or renew permits, licenses and authorizations to operate our business;
•competition in the nitrogen fertilizer industrybusinesses including potential impacts of domestic and exposureglobal supply and demand and/or domestic or international duties, tariffs, or similar costs;
•capital expenditures;
•existing and future laws, rulings and regulations, including but not limited to risks associated withthose relating to the pricingenvironment, climate change, and/or the transportation or production of hazardous chemicals like ammonia, including potential liabilities or capital requirements arising from such laws, rulings, or regulations;
•alternative energy or fuel sources, and availability of feedstocks, pet coke, utilities, urea ammonium nitrate (“UAN”), ammonia, natural gas and other products;
the availability of adequate cash, credit and other sources of liquidity including volatility in the capital and credit markets and changes to our capital requirements;
changes in the expected value of, benefits derived from, and our ability to successfully implement, business strategies, transactions, turnarounds, maintenance and capital projects;
changes in (and in the application of) local, state and federal laws, rules, regulations and policies, including with respect to environmental matters (including climate change), health and safety, exports, transportation (including pipeline and trucking transportation), the end-use and application of fertilizers and taxes (includingfertilizers;
•risks of terrorism, cybersecurity attacks, the tax statussecurity of CVR Partners);
changes in economic conditions impacting our business and the business of our suppliers, customers, counterparties and lenders;
interruption of or changes in the cost, availability or regulation of pipelines, vessels, truckschemical manufacturing facilities and other meansmatters beyond our control;
•our lack of transporting feedstocks, pet coke, UAN, ammonia and other products relating to asset diversification;
•our business;
changes in competition in the nitrogen fertilizer business including to our competitive advantages;
the cyclical and/or seasonal nature of the nitrogen fertilizer business;
weather conditions, fires, tornadoes, floods or other natural disasters affecting our operations or the areas in which our feedstocks and fertilizers are marketed or sold;
risks associated with governmental policies affecting the agricultural industry;
direct or indirect effects from actual or threatened terrorist incidents, security or cyber-security breaches or acts of war;
dependence on significant customers and suppliers and the creditworthiness and performance by counterparties;
•our abilitypotential loss of transportation cost advantage over our competitors;
•our partial dependence on customers and distributors, including to license the technology used intransport goods and equipment;
•risks associated with third party operation of or secure permits requiredcontrol over important facilities necessary for our operations;
adverse rulings, judgments or settlements in litigation or other legal or tax matters, including unexpected environmental remediation costs in excess of any reserves;
competition with CVR Energy, Inc. and its affiliates (“CVR Energy”), controloperation of our general partner by CVR Energynitrogen fertilizer facilities;
•the volatile nature of ammonia, potential liability for accidents involving ammonia including damage or injury to persons, property, the environment, or human health and increased costs related to the transport or production of ammonia;
•our potential inability to successfully implement our business strategies, including the completion of significant capital programs or projects;
•our reliance on CVR Energy’s senior management team includingand conflicts of interest they may face operating each of CVR Partners and CVR Energy;
operating hazards•control of our general partner by CVR Energy;
•our ability to continue to license the technology used in our operations;
•restrictions in our debt agreements;
•asset impairments and interruptionsimpacts thereof;
•risks associated with noncompliance with continued listing standards of the New York Stock Exchange (“NYSE”) including potential suspension or production declines, including unscheduled maintenance or downtimedelisting and the availabilityimpacts thereof on our common unit price, valuation, access to capital, liquidity, the number of investors willing to hold or acquire our common units, and recoverability of adequateour ability to issue securities or obtain financing;
•changes in our treatment as a partnership for U.S. federal income or state tax purposes;
•rulings, judgments or settlements in litigation, tax or other legal or regulatory matters;
•instability and volatility in the capital and credit markets;
•competition with CVR Energy and its affiliates;
•our ability to recover under our insurance coverage;policies for damages or losses in full or at all; and
•the factors described in greater detail under “Risk Factors” in Item 1A of our Annual Report on Form 10-K for the year ended December 31, 20182019 and this Report and our other filings with the Securities and Exchange Commission.
All forward-looking statements included in this Report are based on information available to us on the date of this Report. Except as required by law, we undertake no obligation to revise or update any forward-looking statements as a result of new information, future events or otherwise.
SeptemberJune 30, 20192020 | 34
PART I. FINANCIAL INFORMATION
Item 1. Financial Statements
CVR PARTNERS, LP AND SUBSIDIARIES
CONDENSED CONSOLIDATED BALANCE SHEETS
(unaudited)
| | | | | | | | | | | |
| (in thousands) | June 30, 2020 | | December 31, 2019 |
| ASSETS | | | |
| Current assets: | | | |
| Cash and cash equivalents | $ | 32,557 | | | $ | 36,994 | |
| Accounts receivable | 15,062 | | | 34,264 | |
| Inventories | 46,668 | | | 48,296 | |
| Prepaid expenses and other current assets | 5,307 | | | 5,406 | |
| Total current assets | 99,594 | | | 124,960 | |
| Property, plant, and equipment, net | 924,586 | | | 951,959 | |
| | | |
| Goodwill | — | | | 40,969 | |
| Other long-term assets | 18,896 | | | 20,067 | |
| Total assets | $ | 1,043,076 | | | $ | 1,137,955 | |
| | | |
| LIABILITIES AND PARTNERS’ CAPITAL | | | |
| Current liabilities: | | | |
| Accounts payable | $ | 20,968 | | | $ | 21,069 | |
| Accounts payable to affiliates | 3,044 | | | 2,578 | |
| Deferred revenue | 2,666 | | | 27,841 | |
| Other current liabilities | 18,833 | | | 24,043 | |
| Total current liabilities | 45,511 | | | 75,531 | |
| Long-term liabilities: | | | |
| Long-term debt | 632,007 | | | 632,406 | |
| Other long-term liabilities | 9,432 | | | 10,474 | |
| Total long-term liabilities | 641,439 | | | 642,880 | |
Commitments and contingencies (See Note 12) | | | |
| Partners’ capital: | | | |
| Common unitholders, 112,392,755 and 113,282,973 units issued and outstanding at June 30, 2020 and December 31, 2019, respectively | 356,125 | | | 419,543 | |
| General partner interest | 1 | | | 1 | |
| Total partners’ capital | 356,126 | | | 419,544 | |
| Total liabilities and partners’ capital | $ | 1,043,076 | | | $ | 1,137,955 | |
|
| | | | | | | |
| (in thousands) | September 30, 2019 | | December 31, 2018 |
| ASSETS |
| Current assets: | | | |
| Cash and cash equivalents | $ | 83,667 |
| | $ | 61,776 |
|
| Accounts receivable | 14,909 |
| | 61,662 |
|
| Inventories | 56,864 |
| | 63,554 |
|
| Prepaid expenses and other current assets | 4,608 |
| | 6,989 |
|
| Total current assets | 160,048 |
| | 193,981 |
|
| Property, plant, and equipment, net | 964,502 |
| | 1,015,240 |
|
| Goodwill | 40,969 |
| | 40,969 |
|
| Other long-term assets | 14,803 |
| | 4,198 |
|
| Total assets | $ | 1,180,322 |
| | $ | 1,254,388 |
|
| LIABILITIES AND PARTNERS’ CAPITAL |
| Current liabilities: | | | |
| Accounts payable | $ | 29,389 |
| | $ | 26,789 |
|
| Accounts payable to affiliates | 2,131 |
| | 2,976 |
|
| Deferred revenue | 16,448 |
| | 68,804 |
|
| Other current liabilities | 36,687 |
| | 24,066 |
|
| Total current liabilities | 84,655 |
| | 122,635 |
|
| Long-term debt | 631,520 |
| | 628,989 |
|
| Other long-term liabilities | 11,791 |
| | 2,938 |
|
| Total long-term liabilities | 643,311 |
| | 631,927 |
|
|
|
| |
|
|
| Partners’ capital: | | | |
| Common unitholders, 113,282,973 units issued and outstanding at September 30, 2019 and December 31, 2018 | 452,355 |
| | 499,825 |
|
| General partner interest | 1 |
| | 1 |
|
| Total partners’ capital | 452,356 |
| | 499,826 |
|
| Total liabilities and partners’ capital | $ | 1,180,322 |
| | $ | 1,254,388 |
|
The accompanying notes are an integral part of these condensed consolidated financial statements.
SeptemberJune 30, 20192020 | 45
CVR PARTNERS, LP AND SUBSIDIARIES
CONDENSED CONSOLIDATED STATEMENTS OF OPERATIONS
(unaudited)
| | | | | | | | | | | | | | | | | | | | | | | |
| Three Months Ended
June 30, | | | | Six Months Ended
June 30, | | |
| (in thousands, except unit data) | 2020 | | 2019 | | 2020 | | 2019 |
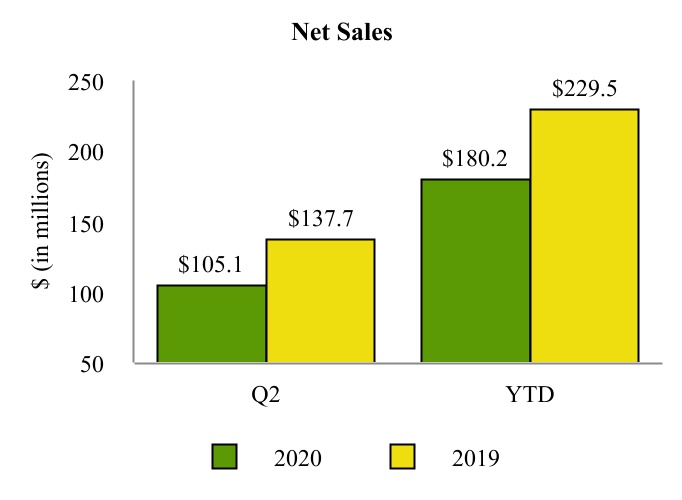
| Net sales | $ | 105,091 | | | $ | 137,660 | | | $ | 180,172 | | | $ | 229,533 | |
| Operating costs and expenses: | | | | | | | |
| Cost of materials and other | 21,948 | | | 26,000 | | | 45,939 | | | 49,730 | |
| Direct operating expenses (exclusive of depreciation and amortization) | 40,008 | | | 45,630 | | | 75,131 | | | 80,450 | |
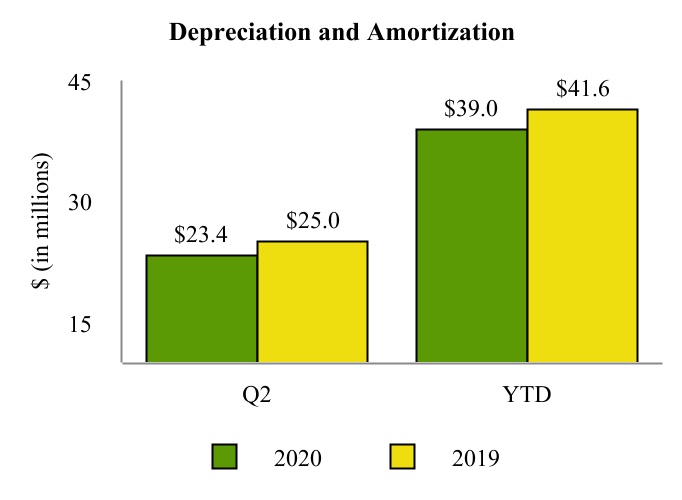
| Depreciation and amortization | 23,371 | | | 25,030 | | | 38,968 | | | 41,614 | |
| Cost of sales | 85,327 | | | 96,660 | | | 160,038 | | | 171,794 | |
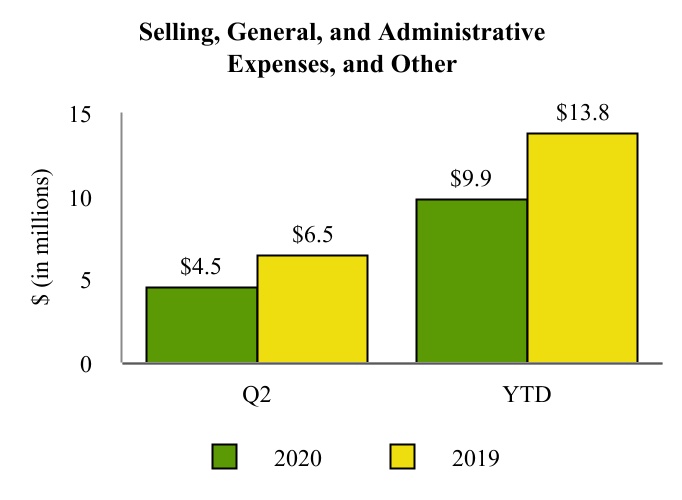
| Selling, general and administrative expenses | 4,451 | | | 6,465 | | | 9,806 | | | 13,311 | |
| Loss (gain) on asset disposals | 94 | | | (9) | | | 81 | | | 445 | |
| Goodwill impairment | 40,969 | | | — | | | 40,969 | | | — | |
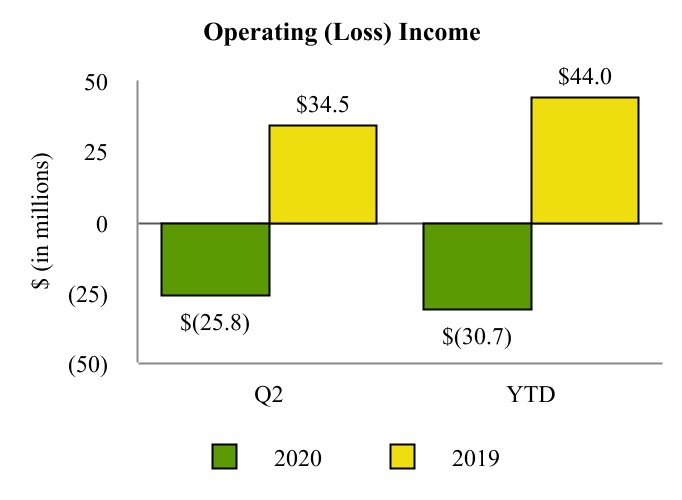
| Operating (loss) income | (25,750) | | | 34,544 | | | (30,722) | | | 43,983 | |
| Other (expense) income: | | | | | | | |
| Interest expense, net | (15,890) | | | (15,599) | | | (31,673) | | | (31,249) | |
| Other income, net | 38 | | | 35 | | | 65 | | | 55 | |
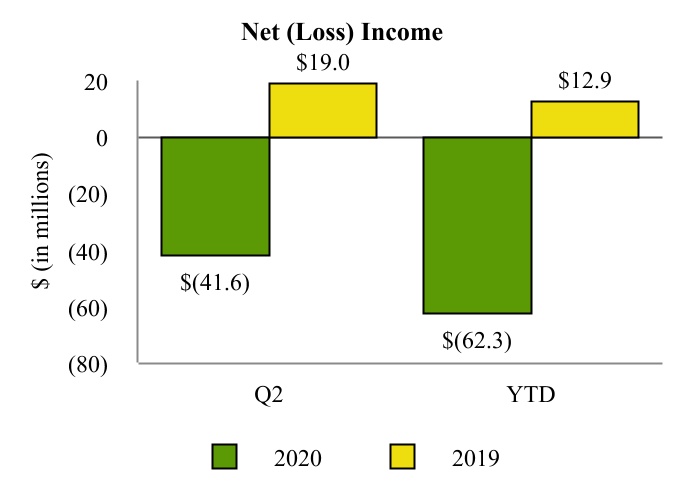
| (Loss) income before income taxes | (41,602) | | | 18,980 | | | (62,330) | | | 12,789 | |
| Income tax expense (benefit) | 10 | | | 12 | | | 17 | | | (100) | |
| Net (loss) income | $ | (41,612) | | | $ | 18,968 | | | $ | (62,347) | | | $ | 12,889 | |
| | | | | | | |
| Basic and diluted (loss) earnings per common unit | $ | (0.37) | | | $ | 0.17 | | | $ | (0.55) | | | $ | 0.11 | |
| Distributions declared and paid per common unit | $ | — | | | $ | 0.07 | | | $ | — | | | $ | 0.19 | |
| | | | | | | |
| Weighted-average common units outstanding: | | | | | | | |
| Basic and Diluted | 113,170 | | | 113,283 | | | 113,226 | | | 113,283 | |
|
| | | | | | | | | | | | | | | |
| | Three Months Ended
September 30, | | Nine Months Ended
September 30, |
| (in thousands, except unit data) | 2019 | | 2018 | | 2019 | | 2018 |
| Net sales | $ | 88,582 |
| | $ | 79,909 |
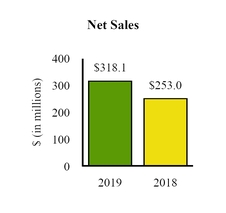
| | $ | 318,115 |
| | $ | 252,965 |
|
| Operating costs and expenses: | | | | | | | |
| Cost of materials and other | 21,617 |
| | 19,590 |
| | 71,347 |
| | 61,198 |
|
| Direct operating expenses (exclusive of depreciation and amortization) | 47,554 |
| | 35,334 |
| | 128,004 |
| | 121,468 |
|
| Depreciation and amortization | 18,418 |
| | 16,035 |
| | 60,032 |
| | 52,866 |
|
| Cost of sales | 87,589 |
| | 70,959 |
| | 259,383 |
| | 235,532 |
|
| Selling, general and administrative expenses | 6,326 |
| | 6,393 |
| | 19,637 |
| | 18,955 |
|
| Loss on asset disposals | 2,184 |
| | 28 |
| | 2,629 |
| | 160 |
|
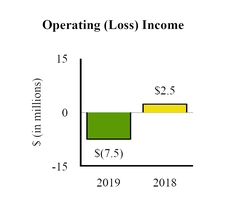
| Operating (loss) income | (7,517 | ) | | 2,529 |
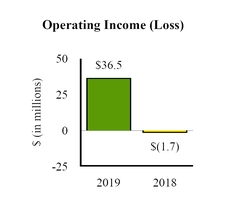
| | 36,466 |
| | (1,682 | ) |
| Other (expense) income: | | | | | | | |
| Interest expense, net | (15,621 | ) | | (15,693 | ) | | (46,870 | ) | | (47,080 | ) |
| Other income, net | 174 |
| | 30 |
| | 229 |
| | 100 |
|
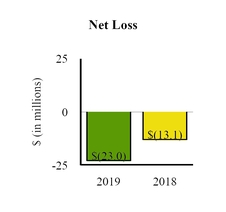
| Net loss before income taxes | (22,964 | ) | | (13,134 | ) | | (10,175 | ) | | (48,662 | ) |
| Income tax expense (benefit) | 12 |
| | 12 |
| | (88 | ) | | (6 | ) |
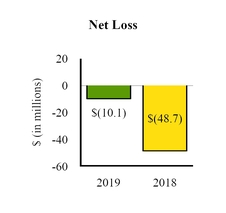
| Net loss | $ | (22,976 | ) | | $ | (13,146 | ) | | $ | (10,087 | ) | | $ | (48,656 | ) |
| | | | | | | | |
| Basic and diluted loss per unit data | $ | (0.20 | ) | | $ | (0.12 | ) | | $ | (0.09 | ) | | $ | (0.43 | ) |
| Distributions declared per unit | $ | 0.14 |
| | $ | — |
| | $ | 0.33 |
| | $ | — |
|
| | | | | | | | |
| Weighted-average common units outstanding: | | | | | | | |
| Basic and Diluted | 113,283 |
| | 113,283 |
| | 113,283 |
| | 113,283 |
|
The accompanying notes are an integral part of these condensed consolidated financial statements.
SeptemberJune 30, 20192020 | 56
CVR PARTNERS, LP AND SUBSIDIARIES
CONDENSED CONSOLIDATED STATEMENTS OF PARTNERS’ CAPITAL
(unaudited)
| | | | | | | | | | | | | | | | | | | | | | | | | | | |
| Common Units | | | | General
Partner
Interest | | | | | | Total Partners’ Capital |
| (in thousands, except unit data) | Issued | | Amount | | | | | | | | |
| Balance at December 31, 2019 | 113,282,973 | | | $ | 419,543 | | | $ | 1 | | | | | | | $ | 419,544 | |
| | | | | | | | | | | |
| | | | | | | | | | | |
| Land exchange with affiliate | — | | | (116) | | | — | | | | | | | (116) | |
| Net loss | — | | | (20,735) | | | — | | | | | | | (20,735) | |
| Balance at March 31, 2020 | 113,282,973 | | | $ | 398,692 | | | $ | 1 | | | | | | | $ | 398,693 | |
| | | | | | | | | | | |
| | | | | | | | | | | |
| Repurchase of common units | (890,218) | | | (955) | | | — | | | | | | | (955) | |
| Net loss | — | | | (41,612) | | | — | | | | | | | (41,612) | |
| Balance at June 30, 2020 | 112,392,755 | | | $ | 356,125 | | | $ | 1 | | | | | | | $ | 356,126 | |
| | | | | | | | | | | |
| | | | | | | | | | | |
| | | | | | | | | | | |
| | | | | | | | | | | |
|
| | | | | | | | | | | | | | |
| | Common Units | | General Partner Interest | | Total Partners’ Capital |
| (in thousands, except unit data) | Issued | | Amount | |
| Balance at December 31, 2018 | 113,282,973 |
| | $ | 499,825 |
| | $ | 1 |
| | $ | 499,826 |
|
| Cash distributions to common unitholders - Affiliates | — |
| | (4,670 | ) | | — |
| | (4,670 | ) |
| Cash distributions to common unitholders - Non-affiliates | — |
| | (8,924 | ) | | — |
| | (8,924 | ) |
| Net loss | — |
| | (6,079 | ) | | — |
| | (6,079 | ) |
| Balance at March 31, 2019 | 113,282,973 |
| | $ | 480,152 |
| | $ | 1 |
| | $ | 480,153 |
|
| Cash distributions to common unitholders - Affiliates | — |
| | (2,724 | ) | | — |
| | (2,724 | ) |
| Cash distributions to common unitholders - Non-affiliates | — |
| | (5,205 | ) | | — |
| | (5,205 | ) |
| Net income | — |
| | 18,968 |
| | — |
| | 18,968 |
|
| Balance at June 30, 2019 | 113,282,973 |
| | $ | 491,191 |
| | $ | 1 |
| | $ | 491,192 |
|
| Cash distributions to common unitholders - Affiliates | — |
| | (5,449 | ) | | — |
| | (5,449 | ) |
| Cash distributions to common unitholders - Non-affiliates | — |
| | (10,411 | ) | | — |
| | (10,411 | ) |
| Net loss | — |
| | (22,976 | ) | | — |
| | (22,976 | ) |
| Balance at September 30, 2019 | 113,282,973 |
| | $ | 452,355 |
| | $ | 1 |
| | $ | 452,356 |
|
| | | | | | | | | | | | | | | | | | | | | | | | | | | |
| Common Units | | | | General
Partner
Interest | | | | | | Total Partners’ Capital |
| (in thousands, except unit data) | Issued | | Amount | | | | | | | | |
| Balance at December 31, 2018 | 113,282,973 | | | $ | 499,825 | | | $ | 1 | | | | | | | $ | 499,826 | |
| Cash distributions to common unitholders - Affiliates | — | | | (4,670) | | | — | | | | | | | (4,670) | |
| Cash distributions to common unitholders - Non-affiliates | — | | | (8,924) | | | — | | | | | | | (8,924) | |
| Net loss | — | | | (6,079) | | | — | | | | | | | (6,079) | |
| Balance at March 31, 2019 | 113,282,973 | | | $ | 480,152 | | | $ | 1 | | | | | | | $ | 480,153 | |
| Cash distributions to common unitholders - Affiliates | — | | | (2,724) | | | — | | | | | | | (2,724) | |
| Cash distributions to common unitholders - Non-affiliates | — | | | (5,205) | | | — | | | | | | | (5,205) | |
| Net income | — | | | 18,968 | | | — | | | | | | | 18,968 | |
| Balance at June 30, 2019 | 113,282,973 | | | $ | 491,191 | | | $ | 1 | | | | | | | $ | 491,192 | |
| | | | | | | | | | | |
| | | | | | | | | | | |
| | | | | | | | | | | |
| | | | | | | | | | | |
|
| | | | | | | | | | | | | | |
| | Common Units | | General
Partner
Interest | | Total Partners’ Capital |
| (in thousands, except unit data) | Issued | | Amount | |
| Balance at December 31, 2017 | 113,282,973 |
| | $ | 549,852 |
| | $ | 1 |
| | $ | 549,853 |
|
| Net loss | — |
| | (19,051 | ) | | — |
| | (19,051 | ) |
| Balance at March 31, 2018 | 113,282,973 |
| | $ | 530,801 |
| | $ | 1 |
| | $ | 530,802 |
|
| Net loss | — |
| | (16,459 | ) | | — |
| | (16,459 | ) |
| Balance at June 30, 2018 | 113,282,973 |
| | $ | 514,342 |
| | $ | 1 |
| | $ | 514,343 |
|
| Net loss | — |
| | (13,146 | ) | | — |
| | (13,146 | ) |
| Balance at September 30, 2018 | 113,282,973 |
| | $ | 501,196 |
| | $ | 1 |
| | $ | 501,197 |
|
The accompanying notes are an integral part of these condensed consolidated financial statements.
SeptemberJune 30, 20192020 | 67
CVR PARTNERS, LP AND SUBSIDIARIES
CONDENSED CONSOLIDATED STATEMENTS OF CASH FLOWS
(unaudited)
| | | | | | | | | | | |
| Six Months Ended June 30, | | |
| (in thousands) | 2020 | | 2019 |
| Cash flows from operating activities: | | | |
| Net (loss) income | $ | (62,347) | | | $ | 12,889 | |
| Adjustments to reconcile net (loss) income to net cash provided by operating activities: | | | |
| Depreciation and amortization | 38,968 | | | 41,614 | |
| Goodwill impairment | 40,969 | | | — | |
| Share-based compensation | (169) | | | 2,218 | |
| Other adjustments | 2,380 | | | 2,108 | |
| Change in assets and liabilities: | | | |
| Current assets and liabilities | (13,026) | | | (24,822) | |
| Non-current assets and liabilities | 3 | | | 674 | |
| Net cash provided by operating activities | 6,778 | | | 34,681 | |
| Cash flows from investing activities: | | | |
| Capital expenditures | (10,204) | | | (5,757) | |
| | | |
| Proceeds from sale of assets | 47 | | | 89 | |
| Net cash used in investing activities | (10,157) | | | (5,668) | |
| Cash flows from financing activities: | | | |
| Repurchase of common units | (1,008) | | | — | |
| Cash distributions to common unitholders - Affiliates | — | | | (7,394) | |
| Cash distributions to common unitholders - Non-affiliates | — | | | (14,129) | |
| Other financing activities | (50) | | | — | |
| Net cash used in financing activities | (1,058) | | | (21,523) | |
| Net (decrease) increase in cash and cash equivalents | (4,437) | | | 7,490 | |
| Cash and cash equivalents, beginning of period | 36,994 | | | 61,776 | |
| Cash and cash equivalents, end of period | $ | 32,557 | | | $ | 69,266 | |
| | | |
| | | |
| | | |
| | | |
| | | |
| | | |
| | | |
| | | |
| | | |
|
| | | | | | | |
| | Nine Months Ended September 30, |
| (in thousands) | 2019 | | 2018 |
| Cash flows from operating activities: | | | |
| Net loss | $ | (10,087 | ) | | $ | (48,656 | ) |
| Adjustments to reconcile net loss to net cash provided by operating activities: | | | |
| Depreciation and amortization | 60,032 |
| | 52,866 |
|
| Share-based compensation | 2,970 |
| | 2,695 |
|
| Other adjustments | 5,256 |
| | 2,640 |
|
| Change in assets and liabilities: | | | |
| Current assets and liabilities | 9,283 |
| | 16,490 |
|
| Non-current assets and liabilities | 1,218 |
| | 1,083 |
|
| Net cash provided by operating activities | 68,672 |
| | 27,118 |
|
| Cash flows from investing activities: | | | |
| Capital expenditures | (9,487 | ) | | (15,022 | ) |
| Proceeds from sale of assets | 89 |
| | 172 |
|
| Net cash used in investing activities | (9,398 | ) | | (14,850 | ) |
| Cash flows from financing activities: | | | |
| Cash distributions to common unitholders - Affiliates | (12,843 | ) | | — |
|
| Cash distributions to common unitholders - Non-affiliates | (24,540 | ) | | — |
|
| Net cash used in financing activities | (37,383 | ) | | — |
|
| Net increase in cash and cash equivalents | 21,891 |
| | 12,268 |
|
| Cash and cash equivalents, beginning of period | 61,776 |
| | 49,173 |
|
| Cash and cash equivalents, end of period | $ | 83,667 |
| | $ | 61,441 |
|
The accompanying notes are an integral part of these condensed consolidated financial statements.
SeptemberJune 30, 20192020 | 78
NOTES TO THE CONDENSED CONSOLIDATED FINANCIAL STATEMENTS
(unaudited)
(1) Organization and Nature of Business
CVR Partners, LP (referred to as “CVR(“CVR Partners” or the “Partnership”) is a Delaware limited partnership formed by CVR Energy, Inc. (together with its subsidiaries, but excluding the Partnership and its subsidiaries, “CVR Energy”) to own, operate and grow its nitrogen fertilizer business. The Partnership produces nitrogen fertilizer products at 2 manufacturing facilities, which are located in Coffeyville, Kansas (the “Coffeyville Facility”) and East Dubuque, Illinois (the “East Dubuque Facility”). Both facilities manufacture ammonia and are able to further upgrade to other nitrogen fertilizer products, principally urea ammonium nitrate (“UAN”). Nitrogen fertilizer is used by farmers to improve the yield and quality of their crops, primarily corn and wheat. The Coffeyville Facility sells and distributes products to destinations located principallyPartnership’s product sales are sold on a wholesale basis in the Union Pacific railroad, the BNSF Railway railroad, or as direct shipments to customers, while the East Dubuque Facility primarily sells to customers located within 200 milesUnited States of the facility.America. As used in these financial statements, references to CVR Partners, the Partnership, “we”, “us”, and “our” may refer to consolidated subsidiaries of CVR Partners or one or both of the facilities, as the context may require.
The Partnership’s common units are listed on the New York Stock Exchange (the “NYSE”) under the symbol “UAN.” On April 20, 2020, the average closing price of the Partnership’s common units over a 30 consecutive trading-day period fell below $1.00 per common unit, resulting in noncompliance with the continued listing compliance standards in Section 802.01C of the NYSE Listing Company Manual. The Partnership received written notification of this noncompliance from the NYSE on April 22, 2020, and currently has until January 1, 2021 to regain compliance or be subject to the NYSE’s suspension and delisting procedures. As of June 30, 2020, the average closing price of the Partnership’s common units over a consecutive 30 trading-day period has remained below $1.00 per common unit. The Partnership currently intends to monitor the closing price of its common units and consider available options if its common units do not trade at a level likely to result in the Partnership regaining compliance with Section 802.01C by January 1, 2021. These options could include, but are not limited to, additional repurchases of common units, reverse unit splits, or other actions.
As of SeptemberJune 30, 2019,2020, public security holders held approximately 66%65% of the Partnership’s outstanding limited partner interests andinterests; CVR Services, LLC (“CVR Services”) (formerly Coffeyville Resources, LLC (“CRLLC”)LLC), a wholly-owned subsidiary of CVR Energy, held approximately 34%35% of the Partnership’s outstanding limited partner interestsinterests; and 100% of the Partnership’s general partner interest is held by CVR GP, LLC (“CVR GP” or the “general partner”), a wholly owned subsidiary of CVR Energy.Energy, held 100% of the Partnership’s general partner interest. As of SeptemberJune 30, 2019,2020, Icahn Enterprises L.P. (“IEP”) and its affiliates owned approximately 71% of the common stock of CVR Energy.
Unit Repurchase Program
On May 6, 2020, the board of directors of the Partnership’s general partner (the “Board”), on behalf of the Partnership, authorized a unit repurchase program (the “Unit Repurchase Program”). The Unit Repurchase Program enables the Partnership to repurchase up to $10 million of the Partnership’s common units. Repurchases under the Unit Repurchase Program may be made from time-to-time through open market transactions, block trades, privately negotiated transactions, or otherwise in accordance with applicable securities laws. The timing, price, and amount of repurchases (if any) will be made at the discretion of management of our general partner and are subject to market conditions, as well as corporate, regulatory, and other considerations. This Unit Repurchase Program does not obligate the Partnership to acquire any common units and may be cancelled or terminated by our general partner’s board of directors at any time. On May 20, 2020, the Partnership entered into a common unit repurchase agreement (the “Repurchase Agreement”), pursuant to Rules 10b5-1 and 10b-18 of the Exchange Act, to facilitate the repurchase of its common units and which the Partnership may terminate at any time by providing written notice. During the three and six months ended June 30, 2020, the Partnership repurchased 890,218 common units on the open market at a cost of $1.0 million, inclusive of transaction costs, or an average price of $1.07 per common unit. At June 30, 2020, the Partnership had $9.0 million in authority remaining under the Unit Repurchase Program.
Management and Operations
The Partnership, including CVR GP, is party to a number of agreements with CVR Energy and its subsidiaries to manage certain business relationships between the Partnership and the other parties thereto. The various rights and responsibilities of the Partnership, and its partners,general partner, are set forth in the Partnership’s limited partnership agreement, as amended, and, as applicable, those agreements with CVR Energy. CVR GP manages and operates the Partnership via a combination of the general partner’s senior management team and CVR Energy’s senior management team pursuant to a services agreement among CVR Energy, CVR GP, and the Partnership. See Note 13 (“Related Party Transactions”Part II, Item 8 of CVR Partners’ Annual Report on Form 10-K for the year ended December 31, 2019 (the “2019 Form 10-K”) for further discussion. Common unitholders have limited voting rights
NOTES TO THE CONDENSED CONSOLIDATED FINANCIAL STATEMENTS
(unaudited)
on matters affecting the Partnership and have no right to elect the general partner’s directors or officers, whether on an annual or continuing basis.basis or otherwise.
(2) Basis of Presentation
The accompanying condensed consolidated financial statements have been prepared in accordance with accounting principles generally accepted in the United States of America (“GAAP”) and in accordance with the rules and regulations of the Securities and Exchange Commission (the “SEC”). These condensed consolidated financial statements should be read in conjunction with the December 31, 20182019 audited consolidated financial statements and notes thereto included in CVR Partners’ Annual Report onthe 2019 Form 10-K for the year ended December 31, 2018 (the “2018 Form 10-K”).10-K.
In the opinion of the Partnership’s management, the accompanying condensed consolidated financial statements reflect all adjustments that are necessary for fair presentation of the financial position and results of operations of the Partnership for the periods presented. Such adjustments are of a normal recurring nature, unless otherwise disclosed.
Certain reclassifications have been made within the condensed consolidated balance sheets as of December 31, 2019 and the condensed consolidated statements of operations for the three and ninesix months ended SeptemberJune 30, 20182019. Catalyst inventory with a value of $5.6 million as of December 31, 2019 was reclassified in the first quarter of 2020 to Other long-term assets to conform withto current presentation.
The preparation of the condensed consolidated financial statements in conformity with GAAP requires management to make certain estimates and assumptions that affect the reported amounts of assets, liabilities, revenues, and expenses, and the disclosure of contingent assets and liabilities. Actual results could differ from those estimates. Results of operations and cash flows for the interim periods presented are not necessarily indicative of the results that will be realized for the year ending December 31, 20192020 or any other interim or annual period.
(3) Recent Accounting Pronouncements
Recent Accounting PronouncementPronouncements - Adoption of New LeaseCredit Losses Standard
In FebruaryJune 2016, the Financial Accounting Standards Board (“FASB”) issued Accounting Standard Update (“ASU”) No. 2016-02, “Leases” (“2016-13, Financial Instruments - Credit Losses (Topic 326). The ASU 2016-02”), creatingreplaces the incurred loss model with a new topic, FASB ASC Topic 842, “Leases” (“Topic 842”), which supersedes lease requirements in FASB ASC Topic 840, “Leases.” The new standard revises accountingcurrent expected credit loss model for operating leases by a lessee,
NOTES TO THE CONDENSED CONSOLIDATED FINANCIAL STATEMENTS
(unaudited)
amongexpected impairment losses for most financial assets and certain other changes, and requires a lessee to recognize a liability related to future lease payments and a right-of-use (“ROU”) asset representing its right to use the underlying asset for the lease terminstruments that are not measured at fair value through net income. Effective January 1, 2020, we adopted this ASU with no material impact on the balance sheet. The ROU asset is classified as Other long-term assets on the condensedPartnership’s consolidated balance sheet. The current and long-term lease liabilities are classified as Other current liabilities and Other long-term liabilities, respectively, on the condensed consolidated balance sheet.financial position or results of operations.
We adopted Topic 842 asRecent Accounting Pronouncements - Adoption of January 1, 2019, electing the option to apply the transition provisions at the adoption date instead of the earliest comparative period presented in the financial statements. In connection with the adoption of Topic 842, we made the following elections:Fair Value Measurement Standard
Under the short-term lease exception provided for in Topic 842, only ROU assets and the related lease liabilities for leases with an initial term greater than one year were recognized;
The accounting treatment for existing land easements was carried forward;
Lease and non-lease components were not, and will not, be bifurcated for all of the Partnership’s asset groups; and
The portfolio approach was, and will continue to be, used in the selection of the discount rate used to calculate minimum lease payments and the related ROU asset and operating lease liability amounts.
The adoption of Topic 842 on January 1, 2019 incrementally impacted the Partnership’s condensed consolidated balance sheet as of that date. The following presents the financial statement line items impacted by the Partnership’s Topic 842 adoption.
Effect of Topic 842 Adoption on the Condensed Consolidated Balance Sheet as of January 1, 2019
|
| | | | | | | | | | | |
| (in thousands) | December 31, 2018 As Stated | | Effect of Adoption of Topic 842 - Leases (Unaudited) | | January 1, 2019 As Adjusted |
| Current assets: | | | | | |
| Prepaid expenses and other current assets | $ | 6,989 |
| | $ | (2,650 | ) | (1) | $ | 4,339 |
|
| Total currents assets | 193,981 |
| | (2,650 | ) | | 191,331 |
|
| Other long-term assets | 4,198 |
| | 16,923 |
| (2) | 21,121 |
|
| Total assets | $ | 1,254,388 |
| | $ | 14,273 |
| | $ | 1,268,661 |
|
| Current liabilities: | | | | | |
| Other current liabilities | $ | 24,066 |
| | $ | 3,462 |
| (3) | $ | 27,528 |
|
| Total current liabilities | 122,635 |
| | 3,462 |
| | 126,097 |
|
| Long-term liabilities: | | | | | |
| Other long-term liabilities | 2,938 |
| | 10,811 |
| (3) | 13,749 |
|
| Total long-term liabilities | 631,927 |
| | 10,811 |
| | 642,738 |
|
| Equity: | | | | | |
| Total liabilities and partners’ capital | $ | 1,254,388 |
| | $ | 14,273 |
| | $ | 1,268,661 |
|
| |
(1) | Represents lease prepayments reclassified to ROU assets. |
| |
(2) | Represents recognition of initial ROU assets for operating leases, including the reclassification of certain lease prepayments. |
| |
(3) | Represents the initial recognition of lease liabilities. |
New Accounting Standards Issued But Not Yet Implemented
In August 2018, the FASB issued ASU 2018-13, Fair Value Measurement (Topic 820). The ASU eliminates such disclosures as the amount of, and reasons for, transfers between Level 1 and Level 2 of the fair value hierarchy. Certain disclosures are required to be applied on a retrospective basis and others on a prospective basis. This ASU is effective for the Partnership beginningEffective January 1, 2020, with early adoption permitted. The Partnership is evaluating the effect of adoptingwe adopted this ASU but does not currently expect adoption will have awith no material impact on the Partnership’s disclosures.
Recent Accounting Pronouncements - New Accounting Standards Issued But Not Yet Implemented
In August 2018,December 2019, the FASB issued ASU 2018-15, Intangibles-Goodwill and Other-Internal-Use Software (Subtopic 350-40)2019-12, Income Taxes (Topic 740). ThisThe ASU addresses customer’ssimplifies the accounting for implementation costs incurredincome taxes by removing certain exceptions to the general principles in Topic 740 and modifies other areas of the topic to clarify the application of GAAP. Certain amendments within the standard are required to be applied on a cloud computing arrangement that isretrospective basis and others on a service
NOTES TO THE CONDENSED CONSOLIDATED FINANCIAL STATEMENTS
(unaudited)
contract and also adds certain disclosure requirements related to implementation costs incurred for internal-use software and cloud computing arrangements. The amendment aligns the requirements for capitalizing implementation costs incurred in a hosting arrangement that is a service contract with the requirements for capitalizing implementation costs incurred to develop or obtain internal-use software (and hosting arrangements that include an internal-use software license).prospective basis. This standard is effective for the Partnership beginning January 1, 20202021, with early adoption permitted. The amendments in this standard can be applied either retrospectively or prospectively to all implementation costs incurred after the date of adoption. The Partnership is evaluating the effect of adopting this new accounting guidance on its consolidated financial statements, but does not currently expect adoption will have a material impact on the Partnership’s consolidated financial position or results of operations. The Partnership does not intend to early adopt this ASU.
In March 2020, the FASB issued ASU 2020-04, Reference Rate Reform (Topic 848). This ASU was issued because, by the end of 2021, banks will no longer be required to report information that is used to determine London Interbank Offered Rate (“LIBOR”), which is used globally by all types of entities. As a result, LIBOR could be discontinued, as well as other interest
NOTES TO THE CONDENSED CONSOLIDATED FINANCIAL STATEMENTS
(unaudited)
rates used globally. ASU 2020-04 provides companies with optional expedients for contract modifications under Topics 310, 470, 842, and 815-15, excluded components of certain hedging relationships, fair value hedges, and cash flow hedges, as well as certain exceptions, which are intended to help ease the potential accounting burden associated with transitioning away from these reference rates. Companies can apply the ASU immediately. However, the guidance will only be available for a limited time (generally through December 31, 2022). The Partnership is currently evaluating the impact that adopting this new accounting standard will have on its consolidated financial statements and related disclosures.
(4) Inventories
Inventories consisted of the following:
| | | | | | | | | | | |
| (in thousands) | June 30, 2020 | | December 31, 2019 |
| Finished goods | $ | 17,362 | | | $ | 17,612 | |
| Raw materials | 177 | | | 243 | |
| Parts, supplies and other | 29,129 | | | 30,441 | |
| Total inventories | $ | 46,668 | | | $ | 48,296 | |
|
| | | | | | | |
| (in thousands) | September 30, 2019 | | December 31, 2018 |
| Finished goods | $ | 19,919 |
| | $ | 25,136 |
|
| Raw materials | 362 |
| | 439 |
|
| Parts, supplies and other | 36,583 |
| | 37,979 |
|
| Total inventories | $ | 56,864 |
| | $ | 63,554 |
|
(5) Property, Plant and Equipment
Property, plant and equipment consisted of the following:
| | | | | | | | | | | |
| (in thousands) | June 30, 2020 | | December 31, 2019 |
| Machinery and equipment | $ | 1,386,140 | | | $ | 1,378,651 | |
| Buildings and improvements | 17,534 | | | 17,221 | |
| Automotive equipment | 16,637 | | | 16,691 | |
| Land and improvements | 14,058 | | | 14,075 | |
| | | |
| | | |
| Construction in progress | 7,047 | | | 5,198 | |
| Other | 1,791 | | | 1,752 | |
| 1,443,207 | | | 1,433,588 | |
| Less: Accumulated depreciation | 518,621 | | | 481,629 | |
| Total property, plant and equipment, net | $ | 924,586 | | | $ | 951,959 | |
|
| | | | | | | |
| (in thousands) | September 30, 2019 | | December 31, 2018 |
| Machinery and equipment | $ | 1,360,019 |
| | $ | 1,362,965 |
|
| Buildings and improvements | 17,116 |
| | 17,116 |
|
| Automotive equipment | 16,719 |
| | 16,773 |
|
| Land and improvements | 13,751 |
| | 13,250 |
|
| Construction in progress | 17,299 |
| | 15,126 |
|
| Other | 1,654 |
| | 2,753 |
|
| | 1,426,558 |
| | 1,427,983 |
|
| Less: Accumulated depreciation | 462,056 |
| | 412,743 |
|
| Total property, plant and equipment, net | $ | 964,502 |
| | $ | 1,015,240 |
|
On October 22, 2019, the Audit Committee of CVR Energy and the Conflicts Committee
(6) Goodwill
One of the BoardPartnership’s reporting units, the Coffeyville Facility, had a goodwill balance of Directors$41.0 million at December 31, 2019. During the second quarter of 2020, following completion of the general partnerspring planting season, the market pricing for ammonia and UAN, the Partnership’s 2 primary products, experienced significant pricing declines driven by updated market expectations around supply and demand fundamentals which are currently expected to continue into the second half of CVR Partners each agreed2020. Additionally, significant uncertainty remains as to authorize the exchangenature and extent of certain parcels of property owned by subsidiaries of CVR Energy with an equal number of parcels owned by subsidiaries of CVR Partners, all locatedimpacts to be seen on the overall demand for corn and soybean given reduced ethanol production and broader economic conditions which may negatively impact demand. Therefore, in Coffeyville, Kansas (the “Property Swap”). This Property Swap will enable each such subsidiary to create a more usable contiguous parcel of land near its own operating footprint. The Partnership will account for this transaction in accordanceconnection with the preparation of the financial statements for the three months ended June 30, 2020, given the pricing declines experienced in the second quarter of 2020, further muting of our near-term economic recovery assumptions, and market price performance of the Partnership’s common units, the Partnership concluded an impairment indicator was present and a triggering event under ASC 805-50 guidance350 had occurred as of June 30, 2020, requiring an interim quantitative impairment assessment to be performed. Significant assumptions inherent in the valuation methodologies for goodwill include, but are not limited to, prospective financial information, growth rates, discount rates, inflationary factors, and cost of capital. Based on transferring assets between entities under common control.
the interim quantitative analysis, it was determined that the estimated fair value of the Coffeyville Facility reporting unit did not exceed its carrying value. As a result, the Partnership recorded a non-cash impairment charge of $41.0 million during the three months ended June 30, 2020. (6)
NOTES TO THE CONDENSED CONSOLIDATED FINANCIAL STATEMENTS
(unaudited)
(7) Leases
Lease Overview
We lease railcars and certain facilities to support the Partnership’s operations. Most leases include one or more options to renew, with renewal terms that can extend the lease term from one to 20 years or more. The exercise of lease renewal options is at our sole discretion. Certain leases also include options to purchase the leased property. The depreciable life of assets and leasehold improvements are limited by the expected lease term, unless there is a transfer of title or purchase option reasonably certain of exercise. Certain of our lease agreements include rental payments which are adjusted periodically for factors such as inflation. Our lease agreements do not contain any material residual value guarantees or material restrictive covenants. Additionally, we do not have any material lessor or sub-leasing arrangements.
NOTES TO THE CONDENSED CONSOLIDATED FINANCIAL STATEMENTS
(unaudited)
Effect of Initial Adoption of New Lease Standard - January 1, 2019
ROU Assets. Upon initial recognition, our ROU assets for operating and finance leases were comprised of the following:
|
| | | |
| (in thousands) | January 1, 2019 (initial recognition) |
| Railcar leases | $ | 14,255 |
|
| Real Estate and other leases | 18 |
|
| Total ROU assets | $ | 14,273 |
|
Lease Liabilities. Upon initial recognition, our lease liabilities for operating and finance leases were comprised of the following:
|
| | | |
| (in thousands) | January 1, 2019 (initial recognition) |
| Current liabilities: | |
| Operating leases | $ | 3,462 |
|
| Long-term liabilities: | |
| Operating leases | 10,811 |
|
| Total lease liabilities | $ | 14,273 |
|
Balance Sheet Summary for the Period Ended Septemberas of June 30, 2020 and December 31, 2019
The following tables summarize the ROU asset and lease liability balances for the Partnership’s operating and finance leases at SeptemberJune 30, 2019:2020 and December 31, 2019:
|
| | | |
| (in thousands) | September 30, 2019 |
| Operating Leases: | |
| ROU asset, net | |
| Railcars | $ | 11,454 |
|
| Real estate and other | 2,396 |
|
| Lease liability | |
| Railcars | $ | 11,666 |
|
| | |
| Financing Leases: | |
| ROU asset, net | |
| Real estate and other | $ | 226 |
|
| Lease liability | |
| Real estate and other | $ | 229 |
|
| | | | | | | | | | | |
| (in thousands) | June 30, 2020 | | December 31, 2019 |
| Operating Leases: | | | |
| ROU asset, net | | | |
| | | |
| Railcars | $ | 8,994 | | | $ | 10,826 | |
| Real estate and other | 2,769 | | | 2,581 | |
| Lease liability | | | |
| | | |
| Railcars | $ | 9,327 | | | $ | 11,088 | |
| Real estate and other | 504 | | | 288 | |
| | | |
| Finance Leases: | | | |
| ROU asset, net | | | |
| Real estate and other | $ | 151 | | | $ | 201 | |
| Lease liability | | | |
| Real estate and other | $ | 155 | | | $ | 205 | |
September 30, 2019 | 11
NOTES TO THE CONDENSED CONSOLIDATED FINANCIAL STATEMENTS
(unaudited)
Lease Expense Summary for the Three and Nine months ended SeptemberSix Months Ended June 30, 2020 and 2019
We recognize lease expense on a straight-line basis over the lease term. For the three and ninesix months ended SeptemberJune 30, 2020 and 2019, we recognized lease expense comprised of the following components:
| | | | | | | | | | | | | | | | | | | | | | | |
| Three Months Ended
June 30, | | | | Six Months Ended
June 30, | | |
| (in thousands) | 2020 | | 2019 | | 2020 | | 2019 |
| Operating lease expense | $ | 1,033 | | | $ | 1,023 | | | $ | 2,144 | | | $ | 2,046 | |
| Finance lease expense: | | | | | | | |
| Amortization of ROU asset | $ | 23 | | | $ | 167 | | | $ | 50 | | | $ | 272 | |
| Interest expense on lease liability | 2 | | | 9 | | | 4 | | | 15 | |
|
| | | | | | | |
| (in thousands) | Three Months Ended
September 30, 2019 | | Nine Months Ended
September 30, 2019 |
| Operating lease expense | $ | 1,023 |
| | $ | 3,069 |
|
| Financing lease expense: | | | |
| Amortization of ROU asset | $ | 25 |
| | $ | 297 |
|
| Interest expense on lease liability | 2 |
| | 17 |
|
Short-term lease expense, recognized within directDirect operating expenses (exclusive of depreciation and amortization), was $0.2$0.1 million and $0.3$0.2 million for the three and ninesix months ended SeptemberJune 30, 2020, respectively, and $0.1 million and $0.1 million for the three and six months ended June 30, 2019, respectively.
NOTES TO THE CONDENSED CONSOLIDATED FINANCIAL STATEMENTS
(unaudited)
Lease Terms and Discount Rates
The following outlines the remaining lease terms and discount rates used in the measurement of the Partnership’s ROU assets and liabilities:liabilities at June 30, 2020 and December 31, 2019:
| | | | | | | | | | | |
| June 30, 2020 | | December 31, 2019 |
| Weighted-average remaining lease term (years) | | | |
| Operating Leases | 3.1 | | 3.4 |
| Finance Leases | 1.8 | | 2.3 |
| Weighted-average discount rate | | | |
| Operating Leases | 5.1 | % | | 5.1 | % |
| Finance Leases | 3.9 | % | | 3.9 | % |
|
| | | | | |
| | September 30, 2019 | | January 1, 2019 (initial recognition) |
| Weighted-average remaining lease term (years) | | | |
| Operating Leases | 3.7 |
| | 4.3 |
|
| Finance Leases | 2.5 |
| | 0.5 |
|
| Weighted-average discount rate | | | |
| Operating Leases | 5.1 | % | | 5.1 | % |
| Finance Leases | 3.9 | % | | 8.0 | % |
Maturities of Lease Liabilities
The following summarizes the remaining minimum lease payments through maturity of the Partnership’s ROU assets and liabilities at SeptemberJune 30, 2019:2020:
| | | | | | | | | | | |
| (in thousands) | Operating Leases | | Financing Leases |
| Remainder of 2020 | $ | 1,938 | | | $ | 53 | |
| 2021 | 3,567 | | | 107 | |
| 2022 | 3,131 | | | — | |
| 2023 | 1,262 | | | — | |
| 2024 | 579 | | | — | |
| Thereafter | 193 | | | — | |
| Total lease payments | 10,670 | | | 160 | |
| Less: imputed interest | (839) | | | (5) | |
| Total lease liability | $ | 9,831 | | | $ | 155 | |
|
| | | | | | | |
| (in thousands) | Operating Leases | | Financing Leases |
| Remainder of 2019 | $ | 1,023 |
| | $ | 27 |
|
| 2020 | 3,602 |
| | 107 |
|
| 2021 | 3,430 |
| | 107 |
|
| 2022 | 2,990 |
| | — |
|
| 2023 | 1,133 |
| | — |
|
| Thereafter | 648 |
| | — |
|
| Total lease payments | 12,826 |
| | 241 |
|
| Less: imputed interest | (1,160 | ) | | (12 | ) |
| Total lease liability | $ | 11,666 |
| | $ | 229 |
|
SeptemberJune 30, 20192020 | 1213
NOTES TO THE CONDENSED CONSOLIDATED FINANCIAL STATEMENTS
(unaudited)
(7)(8) Other Current Liabilities
Other current liabilities consisted of the following:
| | | | | | | | | | | |
| (in thousands) | June 30, 2020 | | December 31, 2019 |
| Personnel accruals | $ | 4,398 | | | $ | 8,187 | |
| Sales incentives | 3,737 | | | 1,614 | |
| Operating lease liabilities | 3,292 | | | 3,523 | |
| Accrued interest | 2,517 | | | 2,518 | |
| Current portion of long-term debt | 2,240 | | | — | |
| Share-based compensation | 303 | | | 5,011 | |
| Prepaid revenue contracts | 223 | | | 277 | |
| Other accrued expenses and liabilities | 2,123 | | | 2,913 | |
| Total other current liabilities | $ | 18,833 | | | $ | 24,043 | |
|
| | | | | | | |
| (in thousands) | September 30, 2019 | | December 31, 2018 |
| Accrued interest | $ | 17,470 |
| | $ | 2,516 |
|
| Personnel accruals | 7,099 |
| | 7,993 |
|
| Share-based compensation | 4,959 |
| | 2,667 |
|
| Operating lease liabilities | 3,220 |
| | — |
|
| Sales incentives | 613 |
| | 1,727 |
|
| Prepaid revenue contracts | 459 |
| | 5,863 |
|
| Other accrued expenses and liabilities | 2,867 |
| | 3,300 |
|
| Total other current liabilities | $ | 36,687 |
| | $ | 24,066 |
|
Other current liabilities include amounts accrued by the Partnership and owed to CVR Energy and its affiliates of $4.7 million and $3.5$5.5 million at September 30, 2019 and December 31, 2018, respectively.2019. The Partnership had a receivable of $0.6 million at June 30, 2020 with these entities, which is included within Accounts receivable. See Note 1314 (“Related Party Transactions”) for additional discussion.
(8)(9) Long-Term Debt
Long-term debt consists of the following:
| | | | | | | | | | | |
| (in thousands) | June 30, 2020 | | December 31, 2019 |
| 9.25% Senior Secured Notes, due June 2023 (1) | $ | 645,000 | | | $ | 645,000 | |
| 6.50% Notes, due April 2021, net of current portion (2) | — | | | 2,240 | |
| | | |
| Unamortized discount and debt issuance costs | (12,993) | | | (14,834) | |
| Total long-term debt, net of current portion | $ | 632,007 | | | $ | 632,406 | |
| Current portion of long-term debt (3) | 2,240 | | | — | |
| Total long-term debt, including current portion | $ | 634,247 | | | $ | 632,406 | |
|
| | | | | | | |
| (in thousands) | September 30, 2019 | | December 31, 2018 |
| 9.25% Senior Secured Notes, due 2023 (1) | $ | 645,000 |
| | $ | 645,000 |
|
| 6.50% Notes, due 2021 | 2,240 |
| | 2,240 |
|
| Unamortized discount and debt issuance costs | (15,720 | ) | | (18,251 | ) |
| Total long-term debt | $ | 631,520 |
| | $ | 628,989 |
|
(1)The estimated fair value of long-term debt outstanding was approximately $632.1 million and $673.8 million as of June 30, 2020 and December 31, 2019, respectively.
(2)The 6.50% Notes, due April 2021, mature within 12 months, and, therefore, the outstanding balance of $2.2 million has been classified as short-term as of June 30, 2020.
(3)Amounts reported in Other current liabilities.
Credit Facility
| | | | | | | | | | | | | | | | | | | | | | | | | | | | | |
| | | | | | | | | |
| (in thousands) | Total Capacity | | Amount Borrowed as of June 30, 2020 | | Outstanding Letters of Credit | | Available Capacity as of June 30, 2020 | | Maturity Date |
| Asset Based (AB) Credit Facility (4) | $ | 45,550 | | | $ | — | | | $ | — | | | $ | 45,550 | | | September 30, 2021 |
| | |
(1) | The estimated fair value of long-term debt outstanding was approximately $672.4 million and $670.8 million as of September 30, 2019 and December 31, 2018, respectively. |
Credit Facility
|
| | | | | | | | | | | | | | | | | |
| (in thousands) | Total Capacity | | Amount Borrowed as of September 30, 2019 | | Outstanding Letters of Credit | | Available Capacity as of September 30, 2019 | | Maturity Date |
| Asset Based (“AB”) Credit Facility (2) | $ | 47,517 |
| | $ | — |
| | $ | — |
| | $ | 47,517 |
| | September 30, 2021 |
| |
(2) | At the option of the borrowers, loans under the AB Credit Facility initially bear interest at an annual rate equal to (i) 2.00% plus LIBOR or (ii) 1.00% plus a base rate, subject to a 0.50% step-down based on the previous quarter’s excess availability. |
(4)At the option of the borrowers, loans under the AB Credit Facility initially bear interest at an annual rate equal to (i) 2.00% plus LIBOR or (ii) 1.00% plus a base rate, subject to a 0.50% step-down based on the previous quarter’s excess availability.
Covenant Compliance
The Partnership, isand its subsidiaries, were in compliance with all covenants of the AB Credit Facility, the 9.25% Senior Secured Notes, and the 6.50% Notesunder their respective debt instruments as of SeptemberJune 30, 2019.2020.
SeptemberJune 30, 20192020 | 1314
NOTES TO THE CONDENSED CONSOLIDATED FINANCIAL STATEMENTS
(unaudited)
(9)(10) Revenue
The following table presents the Partnership’s revenue, disaggregated by major product:
| | | | | | | | | | | | | | | | | | | | | | | |
| Three Months Ended
June 30, | | | | Six Months Ended
June 30, | | |
| (in thousands) | 2020 | | 2019 | | 2020 | | 2019 |
| Ammonia | $ | 36,765 | | | $ | 49,954 | | | $ | 50,911 | | | $ | 63,306 | |
| UAN | 55,294 | | | 73,542 | | | 102,308 | | | 137,606 | |
| Urea products | 3,535 | | | 5,006 | | | 7,068 | | | 9,677 | |
| Net sales, exclusive of freight and other | 95,594 | | | 128,502 | | | 160,287 | | | 210,589 | |
| Freight revenue | 6,954 | | | 7,139 | | | 14,677 | | | 15,157 | |
| Other revenue | 2,543 | | | 2,019 | | | 5,208 | | | 3,787 | |
| Net sales | $ | 105,091 | | | $ | 137,660 | | | $ | 180,172 | | | $ | 229,533 | |
|
| | | | | | | | | | | | | | | |
| | Three Months Ended
September 30, | | Nine Months Ended
September 30, |
| (in thousands) | 2019 | | 2018 | | 2019 | | 2018 |
| Ammonia | $ | 11,110 |
| | $ | 11,391 |
| | $ | 74,416 |
| | $ | 51,361 |
|
| UAN | 61,970 |
| | 52,681 |
| | 199,576 |
| | 156,838 |
|
| Urea products | 4,575 |
| | 4,987 |
| | 14,251 |
| | 14,834 |
|
| Net sales, exclusive of freight and other | 77,655 |
| | 69,059 |
| | 288,243 |
| | 223,033 |
|
| Freight revenue | 8,752 |
| | 8,805 |
| | 23,909 |
| | 23,908 |
|
| Other revenue | 2,175 |
| | 2,045 |
| | 5,963 |
| | 6,024 |
|
| Net sales | $ | 88,582 |
| | $ | 79,909 |
| | $ | 318,115 |
| | $ | 252,965 |
|
The Partnership sells its products, on a wholesale basis, under a contract or by purchase order. The Partnership’s contracts with customers generally contain fixed pricing and most have terms of less than one year. The Partnership recognizes revenue at the point in time at which the customer obtains control of the product, which is generally upon delivery and acceptance by the customer. The customer acceptance point is stated in the contract and may be at one of the Partnership’s manufacturing facilities, at one of the Partnership’s off-site loading facilities or at the customer’s designated facility. Freight revenue recognized by the Partnership represents the pass-through finished goods delivery costs incurred prior to customer acceptance and is reimbursed by customers. An offsetting expense for freight is included in Cost of materials and other. Qualifying taxes collected from customers and remitted to governmental authorities are not included in reported revenues.
Depending on the product sold and the type of contract, payments from customers are generally either due prior to delivery or within 15 to 30 days of product delivery.
The Partnership generally provides no warranty other than the implicit promise that goods delivered are free of liens and encumbrances and meet the agreed upon specifications. Product returns are rare, and as such, the Partnership does not record a specific warranty reserve or consider activities related to such warranty, if any, to be a separate performance obligation.
The Partnership has an immaterial amount of variable consideration for contracts with an original duration of less than a year. A small portion of the Partnership’s revenue includes contracts extending beyond one year, some of which contain variable pricing in which the majority of the variability is attributed to the market-based pricing. The Partnership’s contracts do not contain a significant financing component.
The Partnership has an immaterial amount of fee-based revenue, included in other revenue in the table above, that is recognized based on the net amount of the proceeds received.
Transaction price allocatedPrice Allocated to remaining performance obligationsRemaining Performance Obligations
As of SeptemberJune 30, 2019,2020, the Partnership had approximately $7.3$7.5 million of remaining performance obligations for contracts with an original expected duration of more than one year. The Partnership expects to recognize approximately 20%$1.4 million of these performance obligations as revenue by the end of 2019,2020, an additional 40%$3.5 million in 2020,2021, and the remaining balance thereafter. The Partnership has elected to not disclose the amount of transaction price allocated to remaining performance obligations for contracts with an original expected duration of less than one year. The Partnership has elected to not disclose variable consideration allocated to wholly unsatisfied performance obligations that are based on market prices that have not yet been determined.
Contract balancesBalances
The Partnership’s deferred revenue is a contract liability that primarily relates to nitrogen fertilizer sales contracts requiring customer prepayment prior to product delivery to guarantee a price and supply of nitrogen fertilizer. Deferred revenue is recorded at the point in time in which a prepaid contract is legally enforceable and the associated right to consideration is unconditional prior to transferring product to the customer. An associated receivable is recorded for uncollected prepaid contract amounts. Contracts
SeptemberJune 30, 20192020 | 1415
NOTES TO THE CONDENSED CONSOLIDATED FINANCIAL STATEMENTS
(unaudited)
contract amounts. Contracts requiring prepayment are generally short-term in nature and, as discussed above, revenue is recognized at the point in time in which the customer obtains control of the product. At September 30, 2019, $0.4 million of the deferred revenue balance pertained to prepaid contracts where the associated receivable was recognized as it had not yet been collected by the Partnership.
A summary of the deferred revenue activity for the ninesix months ended SeptemberJune 30, 20192020 is presented below:
| | | | | | | |
| (in thousands) | | | |
| Balance at December 31, 2019 | $ | 27,841 | | | |
| Add: | | | |
| New prepay contracts entered into during the period (1) | 18,025 | | | |
| Less: | | | |
| Revenue recognized that was included in the contract liability balance at the beginning of the period | 26,949 | | | |
| Revenue recognized related to contracts entered into during the period | 15,943 | | | |
| Other changes | 308 | | | |
| Balance at June 30, 2020 | $ | 2,666 | | | |
|
| | | |
| (in thousands) | |
| Balance at December 31, 2018 | $ | 68,804 |
|
| Add: | |
| New prepay contracts entered into during the period (1) | 24,121 |
|
| Less: | |
| Revenue recognized that was included in the contract liability balance at the beginning of the period | 67,823 |
|
| Revenue recognized related to contracts entered into during the period | 8,174 |
|
| Other changes | 480 |
|
| Balance at September 30, 2019 | $ | 16,448 |
|
(1) Includes $23.7$16.6 million where payment associated with prepaid contracts was collected.collected as of June 30, 2020.
(10)(11) Share-Based Compensation
A summary of compensation expense for the three and ninesix months ended SeptemberJune 30, 20192020 and 20182019 is presented below:
| | | | | | | | | | | | | | | | | | | | | | | |
| Three Months Ended
June 30, | | | | Six Months Ended
June 30, | | |
| (in thousands) | 2020 | | 2019 | | 2020 | | 2019 |
| Phantom Units | $ | 59 | | | $ | 755 | | | $ | (198) | | | $ | 1,545 | |
Other Awards (1) | 248 | | | 355 | | | 29 | | | 673 | |
| Total share-based compensation expense | $ | 307 | | | $ | 1,110 | | | $ | (169) | | | $ | 2,218 | |
|
| | | | | | | | | | | | | | | |
| | Three Months Ended
September 30, | | Nine Months Ended
September 30, |
| (in thousands) | 2019 | | 2018 | | 2019 | | 2018 |
| Phantom Units | $ | 544 |
| | $ | 710 |
| | $ | 2,089 |
| | $ | 1,663 |
|
Other Awards (1) | 208 |
| | 486 |
| | 881 |
| | 1,032 |
|
| Total share-based compensation expense | $ | 752 |
| | $ | 1,196 |
| | $ | 2,970 |
| | $ | 2,695 |
|
(1)Other awards include the allocation of compensation expense for certain employees of CVR Energy and certain of its subsidiaries who perform services for the Partnership under the services agreement with CVR Energy and the Limited Partnership Agreement, respectively, and participate in equity compensation plans of CVR Partners’ affiliates.
| |
(1) | Other awards include the allocation of compensation expense for certain employees of CVR Energy and certain of its subsidiaries who perform services for the Partnership under the services agreement with CVR Energy and the Limited Partnership Agreement, respectively, and participate in equity compensation plans of CVR Partners’ affiliates. |
(11)(12) Commitments and Contingencies
Except as noted below, thereThere have been no material changes in the Partnership’s commitments and contingencies disclosed in the 20182019 Form 10-K. In the ordinary course of business, the Partnership may become party to lawsuits, administrative proceedings, and governmental investigations, including environmental, regulatory, and other matters. The outcome of these matters cannot always be predicted accurately, but the Partnership accrues liabilities for these matters if the Partnership has determined that it is probable a loss has been incurred and the loss can be reasonably estimated. While it is not possible to predict the outcome of such proceedings, if one or more of them were decided against us, the Partnership believes there would be no material impact on its consolidated financial statements.
Litigation
In 2008, Coffeyville Resources Nitrogen Fertilizer LLC (“CRNF”), a subsidiary of CVR Partners LP, protestedThe Partnership is continuing to evaluate its contractual arrangements and customer, vendor, and supplier relationships to determine whether and to what extent, if any, the reclassification and reassessment by Montgomery County, Kansas (the “County”) of CRNF’s nitrogen fertilizer plant following expiration of its ten year property tax abatement that expired on December 31, 2007, which reclassification and reassessment resulted in an increase in CRNF’s annual property tax expense in excess of $10 million per year for the 2008 through 2012 tax years. Despite its protest, CRNF fully accrued and paid these property taxes. In February 2013, the County and CRNF agreed to a settlement for tax years 2009 through 2012 which resulted in decreased property taxes through 2017, leaving 2008 in dispute. In 2013, the Kansas Court of Appeals overturned an adverse rulingimpacts of the Kansas BoardCOVID-19 pandemic or recent price volatility will impair or excuse the performance of Tax Appeals (“BOTA”) and instructed BOTA to classify each CRNF asset on an asset-by-asset basis. In March 2015, BOTA concludedthe Partnership or its classification and determinedsubsidiaries or their customers, vendors, or suppliers under existing agreements. As of June 30, 2020, the Partnership had not experienced a substantial majoritymaterial financial impact from any actual or threatened impairment of CRNF’s assetsor excuse in dispute were personal property for the 2008 tax year. In September 2018, the Kansasits or others’ performance under such agreements.
SeptemberJune 30, 20192020 | 1516
NOTES TO THE CONDENSED CONSOLIDATED FINANCIAL STATEMENTS
(unaudited)
Court of Appeals upheld BOTA’s property tax determinations in CRNF’s favor. In October 2018, the County petitioned the Kansas Supreme Court to review the Court of Appeals determination. Subsequent briefs were filed by CRNF and the County. In April 2019, CRNF and the County executed an agreement under which the County agreed to withdraw its petition to the Kansas Supreme Court and CRNF is expected to recover $7.9 million through favorable property tax assessments from 2019 through 2028, subject to the terms of the settlement agreement.
(12)(13) Supplemental Cash Flow Information
Cash flows related to income taxes, interest, leases, and capital expenditures included in accounts payable are as follows:
| | | | | | | | | | | |
| Six Months Ended
June 30, | | |
| (in thousands) | 2020 | | 2019 |
| Supplemental disclosures: | | | |
| | | |
| Cash paid for interest | $ | 30,009 | | | $ | 30,016 | |
| Cash paid for amounts included in the measurement of lease liabilities: | | | |
| Operating cash flows from operating leases | 2,082 | | | 2,046 | |
| Operating cash flows from finance leases | 4 | | | 15 | |
| Financing cash flows from finance leases | 50 | | | 272 | |
| | | |
| Non-cash investing activities: | | | |
| | | |
| Change in capital expenditures included in accounts payable | (2,104) | | | (952) | |
|
| | | | | | | |
| | Nine Months Ended September 30, |
| (in thousands) | 2019 | | 2018 |
| Supplemental disclosures: | | | |
| Cash paid for interest | $ | 30,102 |
| | $ | 30,244 |
|
| Cash paid for amounts included in the measurement of lease liabilities (1): | | | |
| Operating cash flows from operating leases | 3,069 |
| | |
| Operating cash flows from finance leases | 17 |
| | |
| Financing cash flows from finance leases | 297 |
| | |
| Non-cash investing activities: | | | |
| Change in capital expenditures included in accounts payable | 2,087 |
| | 734 |
|
| |
(1) | The lease standard was adopted on January 1, 2019 on a prospective basis. Therefore only 2019 disclosures are applicable to be included within the table above. |
(13)(14) Related Party Transactions
Effective January 1, 2020, the Partnership entered into a new Coffeyville Master Service Agreement (the “Coffeyville MSA”) between Coffeyville Resources Nitrogen Fertilizer LLC (“CRNF”) and Coffeyville Resources Refining & Marketing, LLC, an indirect, wholly-owned subsidiary of CVR Energy (“CRRM”), and a new Corporate Master Service Agreement (the “Corporate MSA”) between CVR Services and certain of its affiliates, including CVR GP and the Partnership and its subsidiaries. For a description of these agreements, see Note 9 (“Related Party Transactions”) in Part II, Item 8 of the 2019 Form 10-K.
Activity associated with the Partnership’s related party arrangements for the three and ninesix months ended SeptemberJune 30, 20192020 and 2018 2019is summarized below.
Related Party Activity
| | | | | | | | | | | | | | | | | | | | | | | |
| Three Months Ended June 30, | | | | Six Months Ended June 30, | | |
| (in thousands) | 2020 | | 2019 | | 2020 | | 2019 |
| Sales to related parties (1) | $ | 342 | | | $ | — | | | $ | 882 | | | $ | 2 | |
| Purchases from related parties (2) | 5,326 | | | 7,914 | | | 11,264 | | | 16,900 | |
| | | | | | | | | | | |
| June 30, 2020 | | December 31, 2019 |
| Prepaid expenses (3) | $ | 30 | | | $ | 249 | |
| Due to related parties (4) | 388 | | | 7,826 | |
(1)Sales to related parties, included in Net sales, consist primarily of sales of feedstocks and services to CRRM under the Coffeyville MSA.
(2)Purchases from related parties, included in Cost of materials and other, Direct operating expenses (exclusive of depreciation and amortization), and Selling, general and administrative expenses, consist primarily of pet coke and hydrogen purchased from CRRM under the Coffeyville MSA. |
| | | | | | | | | | | | | | | | | |
| | | | Three Months Ended
September 30, | | Nine Months Ended
September 30, |
| (in thousands) | Related Party | | 2019 | | 2018 | | 2019 | | 2018 |
| Net Sales | | | | | | | | | |
| Feedstock and Shared Services Agreement | CRRM (1) | | $ | 113 |
| | $ | — |
| | $ | 115 |
| | $ | 292 |
|
Property Exchange
On October 22, 2019, the audit committee of CVR Energy and the Conflicts Committee of the board of directors of CVR GP each agreed to authorize the exchange of certain parcels of property owned by CRRM with an equal number of parcels owned by CRNF, all located in Coffeyville, Kansas (the “Property Exchange”). On February 19, 2020, CRRM and CRNF executed the Property Exchange agreement. This Property Exchange will enable each such subsidiary to create a more usable,
SeptemberJune 30, 20192020 | 1617
NOTES TO THE CONDENSED CONSOLIDATED FINANCIAL STATEMENTS
(unaudited)
Expenses from related parties
|
| | | | | | | | | | | | | | | | | |
| | | | Three Months Ended
September 30, | | Nine Months Ended
September 30, |
| (in thousands) | Related Party | | 2019 | | 2018 | | 2019 | | 2018 |
| Cost of materials and other | | | | | | | | | |
| Coke Supply Agreement | CRRM (1) | | $ | 705 |
| | $ | 1,057 |
| | $ | 3,255 |
| | $ | 2,133 |
|
| Hydrogen Purchase and Sale Agreement | CRRM (1) | | 984 |
| | 1,072 |
| | 3,719 |
| | 3,157 |
|
| | | | | | | | | | |
| Direct operating expenses (exclusive of depreciation and amortization) | | | | | | | | | |
| Services Agreement | CVR Energy | | $ | 797 |
| | $ | 761 |
| | $ | 2,586 |
| | $ | 2,145 |
|
| Limited Partnership Agreement | CVR GP | | 219 |
| | 242 |
| | 595 |
| | 572 |
|
| | | | | | | | | | |
| Selling, general and administrative expenses | | | | | | | | | |
| Services Agreement | CVR Energy | | $ | 3,915 |
| | $ | 3,595 |
| | $ | 11,724 |
| | $ | 10,353 |
|
| Limited Partnership Agreement | CVR GP | | 651 |
| | 626 |
| | 2,191 |
| | 1,920 |
|
Amounts due to related parties
|
| | | | | | | | | |
| (in thousands) | Related Party | | September 30, 2019 | | December 31, 2018 |
| Prepaid expenses and other current assets | | | | | |
| Feedstock and Shared Services Agreement | CRRM (1) | | $ | 128 |
| | $ | — |
|
| | | | | | |
| Accounts payable to affiliates | | | | | |
| Feedstock and Shared Services Agreement | CRRM (1) | | $ | 681 |
| | $ | 1,106 |
|
| Hydrogen Purchase and Sale Agreement and other | CRRM (1) | | 348 |
| | 324 |
|
| Coke Supply Agreement | CRRM (1) | | 132 |
| | 138 |
|
| Services Agreement | CVR GP | | 970 |
| | 1,372 |
|
| | | | | | |
| Other current liabilities | | | | | |
| Limited Partnership Agreement | CVR GP | | $ | 1,697 |
| | $ | 1,179 |
|
| Services Agreement | CVR Energy | | 3,009 |
| | 2,352 |
|
| | | | | | |
| Other long-term liabilities | | | | | |
| Limited Partnership Agreement | CVR Energy | | $ | 530 |
| | $ | 503 |
|
| |
(1) | Coffeyville Resources Refining & Marketing, LLC, an indirect, wholly-owned subsidiary of CVR Energy |
NOTES TO THE CONDENSED CONSOLIDATED FINANCIAL STATEMENTS
(unaudited)
Distributions to CVR Partners’ Unitholders
Distributions, if any, including the payment, amount, and timing thereof, are subject to change at the discretion of the Board. There were 0 distributions paid by the Partnership during the three and six months ended June 30, 2020 related to the fourth quarter of 2019 or first quarter of 2020, and 0 distributions were declared for the second quarter of 2020.
The following table presents distributions paid by the Partnership to CVR Partners’ unitholders, including amounts paid to CVR Energy, as of September 30,during 2019.
| | | | | | | | | | | | | | | | | | | | | | | | | | | | | | | | |
| | | | | | Distributions Paid (in thousands) | | | | |
| Related Period | | Date Paid | | Distribution Per
Common Unit | | Public Unitholders | | CVR Energy | | Total |
| 2018 - 4th Quarter | | March 11, 2019 | | $ | 0.12 | | | $ | 8,924 | | | $ | 4,670 | | | $ | 13,594 | |
| 2019 - 1st Quarter | | May 13, 2019 | | 0.07 | | | 5,205 | | | 2,724 | | | 7,929 | |
| 2019 - 2nd Quarter | | August 12, 2019 | | 0.14 | | | 10,411 | | | 5,449 | | | 15,860 | |
| 2019 - 3rd Quarter | | November 11, 2019 | | 0.07 | | | 5,205 | | | 2,724 | | | 7,930 | |
| Total distributions | | | | $ | 0.40 | | | $ | 29,745 | | | $ | 15,567 | | | $ | 45,313 | |
|
| | | | | | | | | | | | | | | | | | |
| | | | | | | Dividends Paid (in thousands) |
| Related Period | | Date Paid | | Dividend Per Common Unit | | Unitholders | | CVR Energy | | Total |
| 2018 - 4th Quarter | | March 11, 2019 | | $ | 0.12 |
| | $ | 8,924 |
| | $ | 4,670 |
| | $ | 13,594 |
|
| 2019 - 1st Quarter | | May 13, 2019 | | 0.07 |
| | 5,205 |
| | 2,724 |
| | 7,929 |
|
| 2019 - 2nd Quarter | | August 12, 2019 | | 0.14 |
| | 10,411 |
| | 5,449 |
| | 15,860 |
|
| Total | | | | $ | 0.33 |
| | $ | 24,540 |
| | $ | 12,843 |
| | $ | 37,383 |
|
For the third quarter of 2019, the Partnership, upon approval by the Board of Directors of CVR Partners’ general partner on October 22, 2019, declared a distribution of $0.07 per common unit, or $7.9 million, which is payable November 12, 2019 to unitholders of record as of November 4, 2019. Of this amount, CVR Energy will receive approximately $2.7 million, with the remaining amount payable to public unitholders.
Distributions, if any, including the payment, amount and timing thereof, are subject to change at the discretion of the Board of Directors of CVR Partners’ general partner.
SeptemberJune 30, 20192020 | 18
Item 2. Management’s Discussion and Analysis of Financial Condition and Results of Operations
The following discussion and analysis of our financial condition, results of operations, and cash flows should be read in conjunction with the unaudited condensed consolidated financial statements and related notes and with the statistical information and financial data appearing in this Report, as well as our Annual Report on Form 10-K for the year ended December 31, 20182019 filed with the Securities and Exchange Commission (“SEC”) on February 21, 201920, 2020 (the “2018“2019 Form 10-K”). Results of operations for the three and ninesix months ended SeptemberJune 30, 20192020 and cash flows for the ninesix months ended SeptemberJune 30, 20192020 are not necessarily indicative of results to be attained for any other period. See “Important Information Regarding Forward LookingForward-Looking Statements”.
Partnership Overview
CVR Partners, LP (“CVR Partners” or the “Partnership”) is a Delaware limited partnership formed in 2011 by CVR Energy, Inc. (“CVR Energy”) to own, operate, and grow our nitrogen fertilizer business. We produce and distribute nitrogen fertilizer products, which are used by farmers to improve the yield and quality of their crops. The Partnership produces these products at two manufacturing facilities, which are located in Coffeyville, Kansas and East Dubuque, Illinois. Our principal products are ammonia and urea ammonium nitrate (“UAN”). All of our products are sold on a wholesale basis. References to CVR Partners, the Partnership, “we”, “us”, and “our” may refer to consolidated subsidiaries of CVR Partners or one or both of the facilities, as the context may require. Additionally, as the context may require, references to CVR Energy may refer to CVR Energy and its consolidated subsidiaries which include its petroleum refining, marketing, and logistics operations.
Strategy and Goals
Mission and Core Values
Our mission is to be a top tier North American nitrogen-based fertilizer company as measured by safe and reliable operations, superior performance and profitable growth. The foundation of how we operate is built on five core values:Values:
| |
• | •Safety - We always put safety first. The protection of our employees, contractors and communities is paramount. We have an unwavering commitment to safety above all else. If it’s not safe, then we don’t do it.
•Environment - We care for our environment. Complying with all regulations and minimizing any environmental impact from our operations is essential. We understand our obligation to the environment and that it’s our duty to protect it.
•Integrity - We require high business ethics. We comply with the law and practice sound corporate governance. We only conduct business one way—the right way with integrity.
•Corporate Citizenship - We are proud members of the communities where we operate. We are good neighbors and know that it’s a privilege we can’t take for granted. We seek to make a positive economic and social impact through our financial donations and the contributions of time, knowledge and talent of our employees to the places where we live and work.
•Continuous Improvement - We believe in both individual and team success. We foster accountability under a performance-driven culture that supports creative thinking, teamwork and personal development so that employees can realize their maximum potential. We use defined work practices for consistency, efficiency and to create value across the organization.
- We always put safety first. The protection of our employees, contractors and communities is paramount. We have an unwavering commitment to safety above all else. If it’s not safe, then we don’t do it.
|
| |
• | Environment - We care for our environment. Complying with all regulations and minimizing any environmental impact from our operations is essential. We understand our obligation to the environment and that it’s our duty to protect it.
|
| |
• | Integrity - We require high business ethics. We comply with the law and practice sound corporate governance. We only conduct business one way—the right way with integrity.
|
| |
• | Corporate Citizenship - We are proud members of the communities where we operate. We are good neighbors and know that it’s a privilege we can’t take for granted. We seek to make a positive economic and social impact through our financial donations and the contributions of time, knowledge and talent of our employees to the places where we live and work.
|
| |
• | Continuous Improvement - We believe in both individual and team success. We foster accountability under a performance-driven culture that supports creative thinking, teamwork and personal development so that employees can realize their maximum potential. We use defined work practices for consistency, efficiency and to create value across the organization.
|
Our core valuesValues are driven by our people, inform the way we do business each and every day and enhance our ability to accomplish our mission and related strategic objectives.
Strategic Objectives
We have outlined the following strategic objectives to drive the accomplishment of our mission:
Safety - We aim to achieve continuous improvement in all environmental, health and safety areas through ensuring our people’s commitment to environmental, health and safety comes first, the refinement of existing policies, continuous training, and enhanced monitoring procedures.
Reliability - Our goal is to achieve industry-leading utilization rates at both of our facilities through safe and reliable operations. We are focusing on improvements in day-to-day plant operations, identifying alternative sources for plant inputs to reduce lost time due to third-party operational constraints, and optimizing our commercial and marketing functions to maintain plant operations at their highest level.
Market Capture - We continuously evaluate opportunities to improve the facilities’ realized pricing at the gate and reduce variable costs incurred in production to maximize our capture of market opportunities.
Financial Discipline - We strive to be efficient as possible by maintaining low operating costs and disciplined deployment of capital.
Achievements
During 2019,the first half of 2020, we successfully executed a number of achievements in support of our strategic objectives shown below through the date of this filing:
| | | | | | | | | | | | | | | | | | | | | | | |
| Safety | | Reliability | | Market Capture | | Financial Discipline |
| Operated all facilities and corporate offices safely and reliably and maintained financial discipline amid COVID-19 pandemic. | ü | | ü | | | | ü |
| Maintained high asset reliability and utilization at both facilities during the second quarter of 2020. | ü | | ü | | ü | | |
| Achieved record shipments of ammonia from the East Dubuque Facility in April 2020. | | | ü | | ü | | |
| Achieved 8% improvement in total recordable incident rate through the second quarter 2020 compared to 2019. | ü | | | | | | |
| Repurchased $1.0 million of CVR Partners common units during the second quarter 2020. | | | | | | | ü |
| | | | | | | |
| Safety | | Reliability | | Market Capture | | Financial Discipline |
Safely completed the East Dubuque turnaround | ü | | | | | | |
Maintained high asset reliability and utilization at both facilities through the third quarter of 2019 | ü | | ü | | | | ü |
Achieved monthly record ammonia volumes at the East Dubuque nitrogen fertilizer facility for April 2019 | | | | | ü | | |
Generated positive cash available for distribution for three consecutive quarters in 2019 | | | ü | | ü | | ü |
Declared cash distributions of 40 cents per unit in 2019 | | | | | | | ü |
Industry Factors and Market Conditions
Within the nitrogen fertilizer business, earnings and cash flows from operations are primarily affected by the relationship between nitrogen fertilizer product prices, utilization, and operating costs and expenses, including petroleum coke and natural gas feedstock costs.
The price at which nitrogen fertilizer products are ultimately sold depends on numerous factors, including the global supply and demand for nitrogen fertilizer products which, in turn, depends on, among other factors, world grain demand and production levels, changes in world population, the cost and availability of fertilizer transportation infrastructure, weather conditions, the availability of imports, and the extent of government intervention in agriculture markets.
Nitrogen fertilizer prices are also affected by local factors, including local market conditions weather patterns, and the operating levels of competing facilities. An expansion or upgrade of competitors’ facilities, new facility development, political and economic developments, and other factors are likely to continue to play an important role in nitrogen fertilizer industry economics. These factors can impact, among other things, the level of inventories in the market, resulting in price volatility and a reduction in product margins. Moreover, the industry typically experiences seasonal fluctuations in demand for nitrogen fertilizer products.
General Business Environment
In March 2020, the World Health Organization categorized COVID-19 as a pandemic, and the President of the United States declared the COVID-19 outbreak a national emergency. The COVID-19 pandemic and actions taken by governments and others in response thereto has and continues to negatively impact the worldwide economy, financial markets, and the agricultural industry. The COVID-19 pandemic resulted in significant business and operational disruptions, including business closures in the restaurant and food supply industries, amongst others, liquidity strains, demand destruction, as well as supply chain challenges, travel restrictions, stay-at-home orders, and limitations on the availability of the workforce, including farmers in the agricultural industry. As a result, the global demand for liquid transportation fuels, including ethanol (the production of which is a significant driver of demand for fertilizer), has declined, causing many refineries and plants to reduce production or idle, evidenced by a decline in the second quarter 2020 average ethanol production of 30% from 2019. As of July 2020, ethanol production has recovered 27% from the second quarter 2020 average. The potential for a decline in production at crude oil refineries, including from the crude oil refinery owned and operated by Coffeyville Resources Refining & Marketing, LLC, an indirect, wholly-owned subsidiary of CVR Energy, could result in increased costs incurred by the Partnership in future periods to source feedstocks, such as pet coke, at spot prices. Concerns over the negative effects of the COVID-19 pandemic on economic and business prospects across the world have contributed to increased market and grain price volatility, uncertainty in food supply demands, and have diminished expectations for the global economy and may precipitate a prolonged economic slowdown and recession. As a result, the Partnership may witness some decline in demand for its products in 2020 or beyond.
The Partnership believes the general business environment in which it operates will continue to remain volatile through the remainder of the year, driven by uncertainty around the availability and prices of its feedstocks and the demand for its products. As a result, the Partnership anticipates its future operating results and current and long-term financial condition may be negatively impacted. Due to the rapidly evolving situation, the uncertainty of its duration, and the timing of recovery, the Partnership is not able at this time to predict the extent to which these events may have a material, or any, effect on its financial or operational results.
With the adverse economic impacts discussed above and the uncertainty surrounding the COVID-19 pandemic, there is a heightened risk that amounts recognized, including goodwill and other long-lived assets, may not be recoverable. As of December 31, 2019, the Partnership had a goodwill balance of $41.0 million associated with our Coffeyville Facility reporting unit for which the estimated fair value had been in excess of carrying value based on our 2018 and 2019 assessments. As a result of lower expectations for market conditions in the fertilizer industry, the market price performance of the Partnership’s common units, a qualitative analysis, and additional risks associated with the business, the Partnership concluded a triggering event had occurred that required an interim quantitative impairment assessment of goodwill for this reporting unit as of June 30, 2020. The results of the impairment test indicated that the carrying amount of the Coffeyville Facility reporting unit exceeded the estimated fair value of the reporting unit, and a full impairment of the asset was required. Significant assumptions inherent in the valuation methodologies for goodwill include, but are not limited to, prospective financial information, growth rates, discount rates, inflationary factors, and cost of capital. To evaluate the sensitivity of the fair value calculations for the reporting unit, the Partnership applied a hypothetical 1% favorable change in the weighted average cost of capital, and separately, increased the revenue projections by 10%, holding gross margins steady. The results of these sensitivity analyses confirmed the need to record a non-cash impairment charge of $41.0 million during the three months ended June 30, 2020.
While our assessment in 2020 has not identified the existence of an impairment indicator for our long-lived asset groups, we continue to monitor the current environment, including the duration and breadth of the impacts that the pandemic will have on demand for our fertilizer products, to assess whether qualitative factors indicate a quantitative assessment is required. If a quantitative test is performed, the extent to which the recoverability of our long-lived assets could be impaired is unknown. Such impairment could have a significant adverse impact on our results of operations; however, an impairment would have no impact on our financial condition or liquidity.
Market Conditions
While there is risk of shorter-term volatility given the inherent nature of the commodity cycle and the impacts of the global COVID-19 pandemic, the Partnership believes the longer-termlong-term fundamentals for the U.S. nitrogen fertilizer industry remain intact. The Partnership views the anticipated combination of (i) increasing global population, (ii) decreasing arable land per capita, (iii) continued evolution to more protein-based diets in developing countries, (iv) sustained use of corn as feedstock for the domestic production of ethanol, and (v) positioning at the lower end of the global cost curve should continue to provide a solid foundation for nitrogen fertilizer producers in the U.S. over the longer term.
SeptemberJune 30, 20192020 | 2021
During 2019, weatherWeather significantly impacted the business by causing delaystiming of the planting season for corn and soybeans in 2019. Due to excessive wet conditions, crops were planted later than normal in the planting conditions. Increased amounts of rainspring which led to ineffectivea late harvest of these crops in the fall of 2019. As a result, the ammonia application season in the fall of 2019 was shortened. This created a surplus of ammonia inventory in the market during the winter of 2019 leading into 2020. UAN continues to be impacted by the imposition of import duties on UAN product by the European Union (the “EU”). This has resulted in shifts in UAN trade flows for product that had previously been shipped to the EU. In 2020, natural gas prices across the world declined significantly as compared to 2019. Natural gas is the primary feedstock for production of nitrogen fertilizers. As a result of these factors, the Partnership has seen a softening of prices related to these products.
Corn and soybean are two major crops planted by farmers in North America. Corn crops result in the depletion of the amount of nitrogen and ammonia within the soil in which it is grown, which in turn, results in the need for these nutrients to be replenished after each growing cycle. Unlike corn, soybeans are able to obtain their own nitrogen through a process known as “N fixation”. As such, upon the harvesting of soybeans, the soil retains a certain amount of nitrogen which results in lower demand for nitrogen fertilizer for the following corn planting ofcycle. Due to these factors, nitrogen fertilizer consumers generally operate a balanced corn-soybean rotational planting cycle as, evident through the chart presented below for 2020 and 2019.
The relationship between the total acres planted for both corn and soybean crops, resulting in an anticipated lower yield per planted acre in 2019. Furthermore,has a direct impact on the severe flooding in Kansas and Oklahoma curtailed UAN rail shipments in the second quarter. Despite these conditions, there was still strongoverall demand for nitrogen products. As the number of corn acres increases, the market and demand for nitrogen also increases. Correspondingly, as the number of soybean acres increases, the market and demand for nitrogen decreases.
Ethanol is blended with gasoline to meet renewable fuel standard requirements and for its octane value. Ethanol production has historically consumed approximately 35% of the U.S. corn crop, so demand for corn generally rises and falls with ethanol demand. There has been a decline in the ethanol market due to the catchup from the poor fall application and late start to spring. The late planting season extended well into July and fertilizer consumption brought customer inventories to very low levels by the enddecreased demand for transportation fuels as a result of the season, creating strongCOVID-19 pandemic. While there is uncertainty surrounding if and when gasoline demand will return to normal levels, the drop in ethanol demand has not significantly impacted spring planting decisions, as evidenced through the chart below.
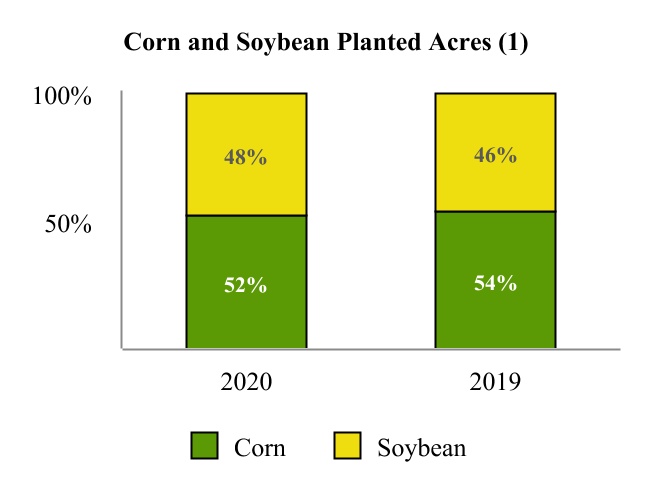
The preliminary 2020 United States Department of Agriculture (“USDA”) reports on corn and soybean acres planted indicated farmers’ intentions to plant 92.0 million acres of corn, representing an increase of 2.6% in corn acres planted as compared to 89.7 million corn acres in 2019. Planted soybean acres are estimated to be 83.8 million acres, representing a 10.2% increase in soybean acres planted as compared to 76.1 million soybean acres in 2019. Despite these anticipated increases in corn acres planted in 2020, if the current gasoline demand and ethanol blending continues to be weak, there is an expectation that corn planted acres could be lower than estimated while remaining above 2019 levels, and corn inventories could be elevated after the harvest in fall 2020 leading to lower planted corn acres in future years. Despite the above potential risks for 2021 or later, the Partnership currently expects solid demand for fertilizer incrop inputs for the third quarter.remainder of the year.
The tabletables below showsshow relevant market indicators by month through SeptemberJune 30, 2019:2020:
| |
(1) | Information used in the charts was obtained from various third-party sources, including Pace Petroleum Coke Quarterly, Green Markets (a Bloomberg Company) and the U.S. Energy Information Administration. |
Non-GAAP Measures
Our management uses certain non-GAAP performance measures, and reconciliations to those measures, to evaluate current and past performance and prospects for the future to supplement our GAAP financial information presented in accordance with U.S. GAAP. These non-GAAP financial measures are important factors in assessing our operating results and profitability and include the performance and liquidity measures defined below.
The following are non-GAAP measures presented for the period ended September 30, 2019:
EBITDA - Net income (loss) before (i) interest expense, net, (ii) income tax expense (benefit) and (iii) depreciation and amortization expense.
Adjusted EBITDA - EBITDA adjusted to exclude turnaround expenses and other significant, nonrecurring items which management believes are material to an investor’s understanding of the Partnership’s underlying operating results.
Reconciliation of Net Cash Provided By Operating Activities to EBITDA - Net cash provided by operating activities reduced by (i) interest expense, net, (ii) income tax expense (benefit), (iii) change in working capital, and (iv) other non-cash adjustments.
(1)Information used within this chart was obtained from the USDA, National Agricultural Statistics Services. Planted acres for 2020 are preliminary USDA estimated amounts and will be updated for actual amounts as the information becomes available, which is expected to be during the third quarter.
September 30, 2019 | (2)21
Available Cash for Distribution - Adjusted EBITDA reduced for cash reserves established by the board of directors of our general partner for (i) debt service, (ii) maintenance capital expenditures, (iii) turnaround expenses and, to the extent applicable, (iv) reserves for future operating or capital needs that the board of directors of our general partner deems necessary or appropriate, if any, in its sole discretion. Available cash for distribution may be increased by the release of previously established cash reserves, if any, and other excess cash, at the discretion of the board of directors of our general partner.
Factors Affecting Comparability of Our Financial Results
Our historical results of operations for the periods presented may not be comparable with prior periods or to our results of operations in the future for the reason discussed below.
Major Scheduled Turnaround Activities
On September 14, 2019, the East Dubuque facility began a major scheduled turnaroundInformation used within these charts was obtained from various third-party sources, including Green Markets (a Bloomberg Company), Pace Petroleum Coke Quarterly, and the ammonia and UAN units were down for approximately 17 days during the quarter. This turnaround was completed in October. Overall, quarterly results were negatively impacted due to the lost production during the downtime that resulted in lost sales and certain reduced variable expenses included in Cost of materials and other and Direct operating expenses (exclusive of depreciation and amortization). Exclusive of the impacts due to the lost production during the turnaround downtime, costs of approximately $6.8 million and $7.0 million are included in Direct operating expenses (exclusive of depreciation and amortization) in the Consolidated Statements of Operations for the three and nine months ended September 30, 2019, respectively.U.S. Energy Information Administration (“EIA”), amongst others.
Results of Operations
The following sections should be read in conjunction with the information outlined in the previous sections of this Part I, Item 2, and the financial statements, and related notes thereto in Part I, Item 1 of this Report.
Key Operating Data
Utilization - The following charts presented below summarize our ammonia utilization rates on a consolidated basis and at each of our facilities. Utilization is an important measure used by management to assess operational output at each of the Partnership’s facilities. Utilization is calculated as actual tons produced divided by capacity adjusted for planned maintenance and turnarounds.
We presentThe presentation of our utilization is on a two-year rolling average to takewhich takes into account the impact of our planned and unplanned outages on any specific period. We believe the two-year rolling average is a more useful presentation of the long-term utilization performance of our plants.facilities.
We present utilizationUtilization is presented solely on ammonia production rather than each nitrogen product as it provides a comparative baseline against industry peers and eliminates the disparity of plantfacility configurations for upgrade of ammonia into other nitrogen products. With our efforts being primarily focused on ammonia upgrade capabilities, we believe this measure provides a meaningful view of how well we operate.
SeptemberJune 30, 20192020 | 2223
Consolidated Ammonia Utilization - TheOn a consolidated ammoniabasis, utilization decreasedincreased 2% to 93%94% for the two years ended SeptemberJune 30, 20192020 compared to the two years ended SeptemberJune 30, 2018. This decrease was primarily a result2019. The first quarter of 2019 ammonia storage capacity constraintswas constrained at the East Dubuque facility in the first quarter of 2019 dueFacility impacting comparability to inclement weather impacting customers’ ability to apply ammonia.2020.
Sales and Pricing per Ton - Two of our key operating metrics are total sales for ammonia and UAN along with the product pricing per ton realized at the gate. Product pricing at the gate represents net sales less freight revenue divided by product sales volume in tons and is shown in order to provide a pricing measure that is comparable across the fertilizer industry.
Operating Highlights (three months ended SeptemberJune 30, 20192020 versus SeptemberJune 30, 2018)2019)
SeptemberJune 30, 2019 | 23
Operating Highlights (nine months ended September 30, 2019 versus September 30, 2018)
September 30, 20192020 | 24
Operating Highlights (six months ended June 30, 2020 versus June 30, 2019)
Production Volumes - Gross tons produced for ammonia represent the total ammonia produced, including ammonia produced that was upgraded into other fertilizer products. Net tons available for sale represent the ammonia available for sale that was not upgraded into other fertilizer products.
|
| | | | | | | | | | | |
| | Three Months Ended
September 30, | | Nine Months Ended
September 30, |
| (in thousands of tons) | 2019 | | 2018 | | 2019 | | 2018 |
| Ammonia (gross produced) | 196 |
| | 212 |
| | 586 |
| | 584 |
|
| Ammonia (net available for sale) | 56 |
| | 63 |
| | 168 |
| | 187 |
|
| UAN | 318 |
| | 338 |
| | 969 |
| | 919 |
|
|
| | | | | | | | | | | | | | | |
| | Three Months Ended
September 30, | | Nine Months Ended
September 30, |
| | 2019 | | 2018 | | 2019 | | 2018 |
| Petroleum coke used in production (thousand tons) | 137 |
| | 117 |
| | 404 |
| | 325 |
|
| Petroleum coke (dollars per ton) | $ | 37.75 |
| | $ | 25.65 |
| | $ | 36.68 |
| | $ | 22.89 |
|
| Natural gas used in production (thousands of MMBtu) (1) | 1,700 |
| | 2,118 |
| | 5,210 |
| | 5,933 |
|
| Natural gas used in production (dollars per MMBtu) (1) | $ | 2.40 |
| | $ | 3.03 |
| | $ | 2.88 |
| | $ | 3.01 |
|
| Natural gas in cost of materials and other (thousands of MMBtu) (1) | 1,294 |
| | 1,439 |
| | 5,487 |
| | 5,268 |
|
| Natural gas in cost of materials and other (dollars per MMBtu) (1) | $ | 2.46 |
| | $ | 2.98 |
| | $ | 3.22 |
| | $ | 3.03 |
|
| |
(1) | The feedstock natural gas shown above does not include natural gas used for fuel. The cost of fuel natural gas is included in direct operating expense (exclusive of depreciation and amortization). |
Financial Highlights (three The table below presents these metrics for the three and six months ended SeptemberJune 30, 2019 versus September2020 and 2019:
| | | | | | | | | | | | | | | | | | | | | | | |
| | Three Months Ended
June 30, | | | | Six Months Ended
June 30, | | |
| (in thousands of tons) | 2020 | | 2019 | | 2020 | | 2019 |
| Ammonia (gross produced) | 216 | | | 211 | | | 417 | | | 390 | |
| Ammonia (net available for sale) | 79 | | | 71 | | | 157 | | | 112 | |
| UAN | 321 | | | 316 | | | 638 | | | 651 | |
Feedstock - Our Coffeyville Facilityutilizes a pet coke gasification process to produce nitrogen fertilizer. Our East Dubuque Facility uses natural gas in its production of ammonia. The table below presents these feedstocks for both facilities for the three and six months ended June 30, 2018)2020 and 2019:
| | | | | | | | | | | | | | | | | | | | | | | |
| | Three Months Ended
June 30, | | | | Six Months Ended
June 30, | | |
| 2020 | | 2019 | | 2020 | | 2019 |
| Petroleum coke used in production (thousand tons) | 138 | | | 134 | | | 263 | | | 266 | |
| Petroleum coke (dollars per ton) | $ | 31.13 | | | $ | 34.60 | | | $ | 37.59 | | | $ | 36.14 | |
| Natural gas used in production (thousands of MMBtu) (1) | 2,131 | | | 2,070 | | | 4,272 | | | 3,510 | |
| Natural gas used in production (dollars per MMBtu) (1) | $ | 1.94 | | | $ | 2.61 | | | $ | 2.18 | | | $ | 3.11 | |
| Natural gas in cost of materials and other (thousands of MMBtu) (1) | 3,216 | | | 3,185 | | | 4,633 | | | 4,193 | |
| Natural gas in cost of materials and other (dollars per MMBtu) (1) | $ | 2.17 | | | $ | 3.32 | | | $ | 2.36 | | | $ | 3.45 | |
(1)The feedstock natural gas shown above does not include natural gas used for fuel. The cost of fuel natural gas is included in Direct operating expenses (exclusive of depreciation and amortization).
September 30, 2019 | 25
Financial Highlights (nine months ended September 30, 2019 versus September 30, 2018)
| |
(1) | See “Non-GAAP Reconciliations” section below for reconciliations of the non-GAAP measures shown above. |
Three and Six Months Ended SeptemberJune 30, 2020 and 2019 Compared to the Three Months Ended September 30, 2018
Net Sales.Overview - Net sales increased by $8.7 million to $88.6 million forFor the three months ended SeptemberJune 30, 20192020, the Partnership’s operating loss and net loss were $25.8 million and $41.6 million, a $60.3 million and $60.6 million decrease in operating and net income, respectively, compared to the three months ended SeptemberJune 30, 2018.2019. For the six months ended June 30, 2020, the Partnership’s operating loss and net loss were $30.7 million and $62.3 million, a $74.7 million and $75.2 million decrease in operating and net income, respectively, compared to
the six months ended June 30, 2019. The declines in income during both periods were driven primarily by a goodwill impairment of $41.0 million resulting from the expectation of continued weakening of sales pricing due to lower corn prices, a softening natural gas market, and increased imports of UAN, as was seen during the second quarter of 2020, as well as unfavorable ammonia and UAN pricing seen during the second quarter of 2020.
(1)See “Non-GAAP Reconciliations” section below for reconciliations of the non-GAAP measures shown below.
Net Sales -For the three months ended June 30, 2020, net sales decreased by $32.6 million to $105.1 million compared to the three months ended June 30, 2019. This increasedecrease wasprimarily due to favorableunfavorable pricing and volume conditions which contributed $5.5$31.5 million and $3.5in lower revenues, partially offset by increased sales volumes contributing $0.1 million, respectively, in higher revenues in the current period as compared to 2018.the three months ended June 30, 2019.
The following table demonstrates the impact of changes in sales volumes and pricing for the primary components of net sales, excluding urea products, freight, and other revenue, for the three months ended SeptemberJune 30, 20192020 as compared to the three months ended SeptemberJune 30, 2018:2019:
| | | | | | | | | | | |
| (in thousands) | Price
Variance | | Volume
Variance |
| UAN | $ | (17,781) | | | $ | (467) | |
| Ammonia | (13,725) | | | 535 | |
|
| | | | | | | |
| (in thousands) | Price Variance | | Volume Variance |
| UAN | $ | 4,188 |
| | $ | 5,100 |
|
| Ammonia | $ | 1,321 |
| | $ | (1,602 | ) |
The increasedecrease in UAN and ammonia sales pricing for the three months ended SeptemberJune 30, 20192020 as compared to the three months ended SeptemberJune 30, 20182019 was primarily attributable to inclement weathercompetitive pricing pressures seen throughout the regiondomestic and international markets. For UAN, a softening natural gas market, which is the typical feedstock for nitrogen plants, shifting trade flows in UAN due to the imposition of import duties on UAN in the first quarter of 2019, delaying the crop cycleEU, and also continuing nitrogen demand during the three months ended September 30, 2019. As a result of the aforementioned delay in the crop cycle, UAN sales volumes increased for the three months ended September 30, 2019 as compared to the three months ended September 30, 2018.
Cost of materials and other. Cost of materials and other for the three months ended September 30, 2019 was $21.6 million compared to $19.6 million for the three months ended September 30, 2018. The $2.0 million increase was comprised of a $2.1 million increase in pet coke costs at our Coffeyville facility, a $0.6 million increase in freight costs representing additional shipments made to our off-premise storage facilities, and a $1.5 million increaselower corn prices due to a draw in inventory resulting from increased demand. These amounts were partially offset by favorable natural gas pricing at our East Dubuque facility, contributing $2.3 milliondecreased demand for the three months ended September 30, 2019.
SeptemberJune 30, 20192020 | 26
Direct operating expenses (exclusive of depreciation and amortization).
Direct operating expenses (exclusive of depreciation and amortization) forFor the threesix months ended SeptemberJune 30, 2019were $47.62020, net sales decreased by $49.3 million to $180.2 million compared to $35.3 million for the threesix months ended SeptemberJune 30, 2018. The increase was primarily due to turnaround costs at the East Dubuque facility of $6.8 million coupled with an inventory draw contributing $3.8 million due to increased sales in the third quarter of 2019.
Nine Months Ended September 30, 2019 Compared to the Nine Months Ended September 30, 2018
Net Sales.Net sales increased by $65.2 million to $318.1 million for the nine months ended September 30, 2019 compared to the nine months ended September 30, 2018. This increasedecrease was primarily due to favorableunfavorable pricing and volume conditions which contributed $51.0$54.2 million and $14.7in lower revenues, partially offset by increased sales volumes contributing $6.5 million, respectively, in higher revenues in the current period as compared to 2018.the six months ended June 30, 2019.
The following table demonstrates the impact of changes in sales volumes and pricing for the primary components of net sales, excluding urea products, freight, and other revenue, for the ninesix months ended SeptemberJune 30, 20192020 as compared to the ninesix months ended SeptemberJune 30, 2018:2019:
| | | | | | | | | | | |
| (in thousands) | Price
Variance | | Volume
Variance |
| UAN | $ | (33,805) | | | $ | (1,489) | |
| Ammonia | (20,406) | | | 8,012 | |
|
| | | | | | | |
| (in thousands) | Price Variance | | Volume Variance |
| UAN | $ | 35,499 |
| | $ | 7,234 |
|
| Ammonia | $ | 15,546 |
| | $ | 7,509 |
|
The increasedecrease in UAN and ammonia sales pricing for the ninesix months ended SeptemberJune 30, 20192020 as compared to the ninesix months ended SeptemberJune 30, 20182019 was primarily attributable to a shift in the timing of demand fromcompetitive pricing pressures discussed above. For UAN, the fourth quarter of 2018 tosoftening natural gas markets, shifting trade flows, and lower corn prices seen during the second quarter of 2019, as customers delayed receipt of nitrogen products due2020 contributed to continued inclement weather. As a result, customerlower prices. For ammonia, lower natural gas and corn prices and reduced demand for industrial uses of ammonia increased in the second quartercontributed to lower prices.
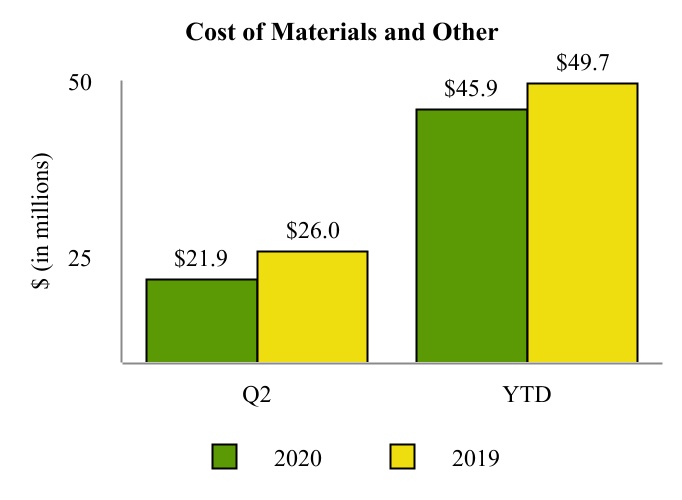
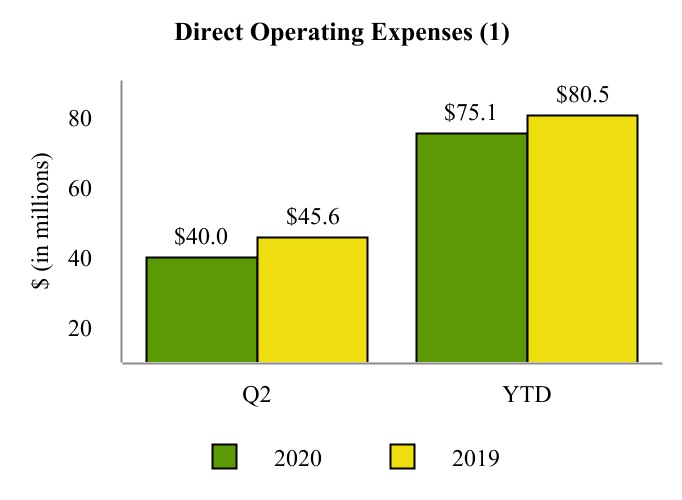
(1)Exclusive of 2019 as customers attempted to make up for the missed application. In addition, the aforementioned ammonia application coupled with freezing temperaturesdepreciation and flooding throughout the Midwest and Southern Plains in the current period shifted the demand for ammonia, resulting in increased sales volumes for the nine months ended September 30, 2019 compared to the nine months ended September 30, 2018.amortization expense.
Cost of materials and other.other - CostFor the three months ended June 30, 2020, cost of materials and other for the nine months ended September 30, 2019 was $71.3$21.9 million compared to $61.2$26.0 million for the ninethree months ended SeptemberJune 30, 2018. The $10.12019 as a result of lower natural gas costs and a lesser draw of ammonia at our East Dubuque Facility.
For the six months ended June 30, 2020, cost of materials and other was $45.9 million increase was comprised primarilycompared to $49.7 million for the six months ended June 30, 2019 as a result of a $6.3 million increasedecrease in freight and distribution costs at our Coffeyville Facility and lower natural gas prices and a lesser draw of ammonia than the prior period at our East Dubuque Facility, partially offset by increased pet coke costs at our Coffeyville facility, coupled with a draw in ammonia inventories as a result of increased sales contributing $4.5 million.Facility.
Direct Operating Expenses (exclusive of depreciation and amortization).Direct operating expenses (exclusive of depreciation and amortization) for-For the ninethree and six months ended SeptemberJune 30, 20192020, direct operating expenses (exclusive of depreciation and amortization) were $128.0$40.0 million asand $75.1 million, respectively, compared to $121.5$45.6 million and $80.5 million for the ninethree and six months ended SeptemberJune 30, 2018.2019, respectively. The $6.5 million increase wasdecreases for both periods were primarily due to spare partlower utility costs and a decrease of inventory write-offs totaling $1.3 million, increased personnel costs of $1.9 million, and an inventory draw contributing $3.3 million due to increased salesdraws in the second quarter of 2019.ammonia primarily at our East Dubuque Facility.
Non-GAAP Reconciliations
Reconciliation of Net Loss to EBITDA and Adjusted EBITDA
|
| | | | | | | | | | | | | | | |
| | Three Months Ended
September 30, | | Nine Months Ended
September 30, |
| (in thousands) | 2019 | | 2018 | | 2019 | | 2018 |
| Net loss | $ | (22,976 | ) | | $ | (13,146 | ) | | $ | (10,087 | ) | | $ | (48,656 | ) |
| Add: | | | | | | | |
| Interest expense, net | 15,621 |
| | 15,693 |
| | 46,870 |
| | 47,080 |
|
| Income tax expense (benefit) | 12 |
| | 12 |
| | (88 | ) | | (6 | ) |
| Depreciation and amortization | 18,418 |
| | 16,035 |
| | 60,032 |
| | 52,866 |
|
| EBITDA | $ | 11,075 |
| | $ | 18,594 |
| | $ | 96,727 |
| | $ | 51,284 |
|
| Add: | | | | | | | |
| Turnaround expenses | 6,805 |
| | — |
| | 6,956 |
| | 6,405 |
|
| Adjusted EBITDA | $ | 17,880 |
| | $ | 18,594 |
| | $ | 103,683 |
| | $ | 57,689 |
|
SeptemberJune 30, 20192020 | 27
Depreciation and Amortization Expense - For the three and six months ended June 30, 2020, depreciation and amortization expense decreased $1.6 million and $2.6 million compared to the three and six months ended June 30, 2019, respectively, as a result of higher depreciation on certain assets in January 2019 through September 2019 that are no longer being utilized following the 2019 turnaround at the East Dubuque Facility.
Selling, General, and Administrative Expenses, and Other - For the three and six months ended June 30, 2020, selling, general and administrative expenses and other decreased $2.0 million and $3.9 million compared to the three and six months ended June 30, 2019. These decreases were primarily related to a decrease in personnel costs and corporate allocated costs.
Non-GAAP Measures
Our management uses certain non-GAAP performance measures, and reconciliations to those measures, to evaluate current and past performance and prospects for the future to supplement our GAAP financial information presented in accordance with U.S. GAAP. These non-GAAP financial measures are important factors in assessing our operating results and profitability and include the performance and liquidity measures defined below.
Effective January 1, 2020, the Partnership no longer presents the non-GAAP performance measure of Adjusted EBITDA, as management no longer relies on this financial measure when evaluating the Partnership’s performance and does not believe it enhances the users understanding of its financial statements in a useful manner.
The following are non-GAAP measures that continue to be presented for the period ended June 30, 2020:
EBITDA - Net income (loss) before (i) interest expense, net, (ii) income tax expense (benefit) and (iii) depreciation and amortization expense.
Reconciliation of Net Cash Provided By Operating Activities to EBITDA - Net cash provided by operating activities reduced by (i) interest expenses, net, (ii) income tax expense (benefit), (iii) change in working capital, and (iv) other non-cash adjustments.
Available Cash for Distribution - EBITDA for the quarter excluding non-cash income or expense items (if any), for which adjustment is deemed necessary or appropriate by the board of directors (the “Board”) of our general partner in its sole discretion, less (i) reserves for maintenance capital expenditures, debt service and other contractual obligations, and (ii) reserves for future operating or capital needs (if any), in each case, that the Board deems necessary or appropriate in its sole discretion. Available cash for distribution may be increased by the release of previously established cash reserves, if any, and other excess cash, at the discretion of the Board.
We present these measures because we believe they may help investors, analysts, lenders, and ratings agencies analyze our results of operations and liquidity in conjunction with our U.S. GAAP results, including, but not limited to, our operating performance as compared to other publicly traded companies in the fertilizer industry, without regard to historical cost basis or financing methods, and our ability to incur and service debt and fund capital expenditures. Non-GAAP measures have
important limitations as analytical tools, because they exclude some, but not all, items that affect net earnings and operating income. These measures should not be considered substitutes for their most directly comparable U.S. GAAP financial measures. Refer to the “Non-GAAP Reconciliations” included herein for reconciliation of these amounts. Due to rounding, numbers presented within this section may not add or equal to numbers or totals presented elsewhere within this document.
Factors Affecting Comparability of Our Financial Results
Our historical results of operations for the periods presented may not be comparable with prior periods or to our results of operations in the future for the reason discussed below.
Goodwill Impairment
As of December 31, 2019, the Partnership had a goodwill balance of $41.0 million associated with our Coffeyville Facility reporting unit for which the estimated fair value had been in excess of carrying value based on our 2018 and 2019 assessments. As a result of lower expectations for market conditions in the fertilizer industry, the market performance of the Partnership’s common units, a qualitative analysis, and additional risks associated with the business, the Partnership concluded a triggering event had occurred that required an interim quantitative impairment assessment of goodwill for this reporting unit as of June 30, 2020. Significant assumptions inherent in the valuation methodologies for goodwill include, but are not limited to, prospective financial information, growth rates, discount rates, inflationary factors, and cost of capital. The results of the impairment test indicated that the carrying amount of the Coffeyville Facility reporting unit exceeded the estimated fair value of the reporting unit, and a full impairment of the asset was required. No such charge was recognized during 2019.
Non-GAAP Reconciliations
Reconciliation of Net (Loss) Income to EBITDA
| | | | | | | | | | | | | | | | | | | | | | | |
| Three Months Ended
June 30, | | | | Six Months Ended
June 30, | | |
| (in thousands) | 2020 | | 2019 | | 2020 | | 2019 |
| Net (loss) income | $ | (41,612) | | | $ | 18,968 | | | $ | (62,347) | | | $ | 12,889 | |
| Add: | | | | | | | |
| Interest expense, net | 15,890 | | | 15,599 | | | 31,673 | | | 31,249 | |
| Income tax expense (benefit) | 10 | | | 12 | | | 17 | | | (100) | |
| Depreciation and amortization | 23,371 | | | 25,030 | | | 38,968 | | | 41,614 | |
| EBITDA | $ | (2,341) | | | $ | 59,609 | | | $ | 8,311 | | | $ | 85,652 | |
| | | | | | | |
| | | | | | | |
| | | | | | | |
| | | | | | | |
Reconciliation of Net Cash Provided By Operating Activities to EBITDA
| | | | | | | | | | | | | | | | | | | | | | | |
| Three Months Ended
June 30, | | | | Six Months Ended
June 30, | | |
| (in thousands) | 2020 | | 2019 | | 2020 | | 2019 |
| Net cash provided by operating activities | $ | (20,929) | | | $ | (17,243) | | | $ | 6,778 | | | $ | 34,681 | |
| Non-cash items: | | | | | | | |
| Goodwill impairment | (40,969) | | | — | | | (40,969) | | | — | |
| Other | (1,426) | | | (2,005) | | | (2,211) | | | (4,326) | |
| Add: | | | | | | | |
| Interest expense, net | 15,890 | | | 15,599 | | | 31,673 | | | 31,249 | |
| Income tax expense (benefit) | 10 | | | 12 | | | 17 | | | (100) | |
| Change in assets and liabilities | 45,083 | | | 63,246 | | | 13,023 | | | 24,148 | |
| EBITDA | $ | (2,341) | | | $ | 59,609 | | | $ | 8,311 | | | $ | 85,652 | |
|
| | | | | | | | | | | | | | | |
| | Three Months Ended
September 30, | | Nine Months Ended
September 30, |
| (in thousands) | 2019 | | 2018 | | 2019 | | 2018 |
| Net cash provided by operating activities | $ | 33,991 |
| | $ | 39,588 |
| | $ | 68,672 |
| | $ | 27,118 |
|
| Add: | | | | | | | |
| Interest expense, net | 15,621 |
| | 15,693 |
| | 46,870 |
| | 47,080 |
|
| Income tax expense (benefit) | 12 |
| | 12 |
| | (88 | ) | | (6 | ) |
| Change in assets and liabilities | (34,649 | ) | | (34,615 | ) | | (10,501 | ) | | (17,573 | ) |
| Other non-cash adjustments | (3,900 | ) | | (2,084 | ) | | (8,226 | ) | | (5,335 | ) |
| EBITDA | $ | 11,075 |
| | $ | 18,594 |
| | $ | 96,727 |
| | $ | 51,284 |
|
Reconciliation of Adjusted EBITDA to Available Cash for Distribution
| | | | Three Months Ended
June 30, | | | Six Months Ended
June 30, | |
| (in thousands) | | (in thousands) | 2020 | | 2019 | | 2020 | | 2019 |
| EBITDA | | EBITDA | $ | (2,341) | | | $ | 59,609 | | | $ | 8,311 | | | $ | 85,652 | |
| Non-cash items: | | Non-cash items: | | | | |
| Goodwill impairment | | Goodwill impairment | 40,969 | | | — | | | 40,969 | | | — | |
| Current reserves for amounts related to: | | Current reserves for amounts related to: | |
| Debt service | | Debt service | (14,999) | | | (14,865) | | | (29,998) | | | (29,692) | |
| Maintenance capital expenditures | | Maintenance capital expenditures | (2,220) | | | (1,447) | | | (6,358) | | | (4,814) | |
| Common units repurchased | | Common units repurchased | (1,008) | | | — | | | (1,008) | | | — | |
| | | | Three Months Ended
September 30, | | Nine Months Ended
September 30, | |
| (in thousands) | 2019 | | 2018 | | 2019 | | 2018 | |
| Adjusted EBITDA | $ | 17,880 |
| | $ | 18,594 |
| | $ | 103,683 |
| | $ | 57,689 |
| |
| Current reserves for amounts related to: | | | | | | | | |
| Debt service | (14,833 | ) | | (14,873 | ) | | (44,525 | ) | | (44,664 | ) | |
| Maintenance capital expenditures | (6,594 | ) | | (4,526 | ) | | (11,409 | ) | | (10,894 | ) | |
| Turnaround expenses | (6,805 | ) | | — |
| | (6,956 | ) | | (6,405 | ) | |
| Other: | | | | | | | | |
| Future cash reserves | — |
| | — |
| | (28,000 | ) | | — |
| |
| | Other (reserves) releases: | | Other (reserves) releases: | |
| Reserve for future turnaround | | Reserve for future turnaround | (1,500) | | | (7,000) | | | (1,500) | | | (7,000) | |
| Reserve for repayment of current portion of long-term debt | | Reserve for repayment of current portion of long-term debt | (2,240) | | | — | | | (2,240) | | | — | |
| Reserve for recapture of prior negative available cash | | Reserve for recapture of prior negative available cash | (5,917) | | | — | | | (5,917) | | | — | |
| Cash reserves for future operating needs | | Cash reserves for future operating needs | (10,744) | | | (5,000) | | | (10,744) | | | (5,000) | |
| Reserve for maintenance capital expenditures | | Reserve for maintenance capital expenditures | — | | | (16,000) | | | — | | | (16,000) | |
| Release of previously established cash reserves | 18,399 |
| | 675 |
| | 18,399 |
| | — |
| Release of previously established cash reserves | — | | | — | | | 2,567 | | | — | |
| Available Cash for distribution (1) (2) | $ | 8,047 |
| | $ | (130 | ) | | $ | 31,192 |
| | $ | (4,274 | ) | Available Cash for distribution (1) (2) | $ | — | | | $ | 15,297 | | | $ | (5,918) | | | $ | 23,146 | |
| | | | | | | | | | | | | | | | |
| | Common units outstanding | 113,283 |
| | 113,283 |
| | 113,283 |
| | 113,283 |
| Common units outstanding | 112,393 | | | 113,283 | | | 112,393 | | | 113,283 | |
(1)Amount represents the cumulative available cash based on quarter-to-date and year-to-date results. However, available cash for distribution is calculated quarterly, with distributions (if any) being paid in the period following declaration.
| |
(1) | Amount represents the cumulative Available Cash based on quarter-to-date and year-to-date results, respectively. Available Cash for distribution is calculated quarterly, with distributions (if any) being paid in the following period. |
| |
(2) | The Partnership declared and paid cash distributions totaling $0.21 per common unit related to the first two quarters of 2019 for a total of $23.8 million. |
Liquidity and Capital Resources
Our principal source of liquidity has historically been cash from operations, which can include cash advances from customers resulting from prepay contracts. Our principal uses of cash are for working capital, capital expenditures, funding our debt service obligations, and paying distributions to our unitholders, as further discussed below.
We
The effects of the COVID-19 pandemic have resulted in a significant and swift reduction in U.S. economic activity. These effects have caused significant volatility and disruption of the financial markets, and we have observed adverse impacts to our business and financial performance, of which the nature and extent of such impacts remains uncertain. This period of extreme economic disruption, including business closures in the restaurant and food supply industries, idling of ethanol facilities, and limitations on the availability of the workforce, including farmers in the agricultural industry, may have an impact on our business, results of operations, and access to sources of liquidity. In view of the uncertainty of the depth and extent of the contraction in the U.S. economy and potential impact on the demand for our fertilizer products, we have taken proactive actions to address the impacts we may experience in our results of operations, liquidity, and financial condition, including the following:
•The deferment of the Coffeyville Facility turnaround from the fall of 2020 to the summer of 2021, enabled by certain maintenance we proactively performed during the quarter, and the East Dubuque Facility turnaround from 2021 to 2022; and
•A reduction in the amount of expected maintenance capital expenditures for the remainder of 2020 to only include those projects which are critical to continuing safe and reliable operations, or are required to support future activities.
When paired with the actions outlined above, we believe that our cash from operations and existing cash and cash equivalents, along with borrowings, as necessary, under the AB Credit Facility, will be sufficient to satisfy anticipated cash requirements associated with our existing operations for at least the next 12 months. However, our future capital expenditures
and other cash requirements could be higher than we currently expect as a result of various factors. Additionally, our ability to generate sufficient cash from our operating activities and secure additional financing depends on our future performance, which is subject to general economic, political, financial, competitive, and other factors, some of which may be beyond our control.
Depending on the needs of our business, contractual limitations, and market conditions, we may from time to time seek to issue equity securities, incur additional debt, issue debt securities, or otherwise refinance our existing debt. There can be no assurance that we will seek to do any of the foregoing or that we will be able to do any of the foregoing on terms acceptable to us or at all.
There have been no material changes in liquidity for the three months ended September 30, 2019.from our 2019 Form 10-K. The Partnership, wasand its subsidiaries, were in compliance with all covenants under itstheir respective debt instruments as of SeptemberJune 30, 2019.2020.
Cash and Other Liquidity
As of SeptemberJune 30, 2019,2020, we had cash and cash equivalents of $83.7$32.6 million, including $16.0$1.3 million from customer advances. Combined with $47.5$45.6 million available under our AB Credit Facility less $25.0 million in cash included in our borrowing base, we had total liquidity of $106.2$53.1 million as of SeptemberJune 30, 2019.2020.
|
| | | | | | | |
| Debt, including current maturities | September 30, 2019 | | December 31, 2018 |
| (in thousands) |
| 9.25% Senior Notes due 2023 | $ | 645,000 |
| | $ | 645,000 |
|
| 6.50% Senior Notes due 2021 | 2,240 |
| | 2,240 |
|
| Unamortized discount and debt issuance costs | (15,720 | ) | | (18,251 | ) |
| Total debt | $ | 631,520 |
| | $ | 628,989 |
|
| | | | | | | | | | | |
| June 30, 2020 | | December 31, 2019 |
| (in thousands) | | | |
| 9.25% Senior Notes due June 2023 | $ | 645,000 | | | $ | 645,000 | |
| 6.50% Senior Notes due April 2021, net of current portion (1) | — | | | 2,240 | |
| Unamortized discount and debt issuance costs | (12,993) | | | (14,834) | |
| Total long-term debt | $ | 632,007 | | | $ | 632,406 | |
| Current portion of long-term debt (2) | 2,240 | | | — | |
| Total long-term debt, including current portion | $ | 634,247 | | | $ | 632,406 | |
AB Credit Facility -
(1)The 6.50% Notes, due April 2021, mature within 12 months, and, therefore, the outstanding balance of $2 million has been classified as short-term as of June 30, 2020.
(2)Amounts reported in Other current liabilities.
The Partnership has the 2023 Senior Notes, the 6.50% Senior Notes due 2021, and an AB Credit Facility, the proceeds of which may be used to fund working capital, capital expenditures, and for other general corporate purposes. The AB Credit Facility is a senior secured asset-based revolving credit facility with an aggregate principal amount of availability of upRefer to $50 million with an incremental facility, which permits an increase in borrowings of up to $25 million in the aggregate subject to additional lender commitments and certain other conditions. The AB Credit Facility matures in September 2021.
2023 Notes - CVR Partners issued $645 million aggregate principal amount of 9.25% Senior Secured Notes due 2023 (the “2023 Notes”Note 5 (“Long-Term Debt”) in 2016. The 2023 Notes are guaranteed on a senior secured basis by allPart II, Item 8 of the Partnership’s existing subsidiaries. On or after June 15, 2019 we may on any one or more occasions, redeem all or part of the 2023 Notes at the redemption prices set forth below expressed as a percentage of the principal amount of the 2023 Notes plus accrued and unpaid interest to the applicable redemption date.Form 10-K for further discussion.
|
| |
| 12-month period beginning June 15, | Percentage |
| 2019 | 104.625% |
| 2020 | 102.313% |
| 2021 and thereafter | 100.000% |
Upon the occurrence of certain change of control events as defined in the 2023 Indenture (including the sale of all or substantially all of the properties or assets of the Partnership and its subsidiaries taken as a whole), each holder of the 2023 Notes will have the right to require that the Partnership repurchase all or a portion of such holder’s 2023 Notes in cash at a purchase price equal to 101% of the aggregate principal amount thereof plus any accrued and unpaid interest to the date of repurchase.
Capital Spending
We divide capital spending needs into two categories: maintenance and growth. Maintenance capital spending includes non-discretionary maintenance projects and projects required to comply with environmental, health, and safety regulations. Growth capital projects generally involve an expansion of existing capacity and/or a reduction in direct operating expenses. We undertake growth capital spending based on the expected return on incremental capital employed. Our total capital expenditures for the ninesix months ended SeptemberJune 30, 2019 and2020, along with our estimated expenditures for 20192020 are as follows:
|
| | | | | |
| | Nine Months Ended September 30, | | Estimated full year |
| (in thousands) | 2019 | | 2019 |
| Maintenance capital | $ | 10,763 |
| | $ 18,000 - 20,000 |
| Growth capital | 811 |
| | 2,000 - 5,000 |
| Total capital expenditures | $ | 11,574 |
| | $ 20,000 - 25,000 |
| | | | | | | | | | | |
| Six Months Ended June 30, | | Estimated full year |
| (in thousands) | 2020 | | 2020 |
| Maintenance capital | $ | 6,358 | | | $14,000 - 16,000 |
| Growth capital | 1,742 | | | 5,000 - 7,000 |
| Total capital expenditures | $ | 8,100 | | | $19,000 - 23,000 |
September 30, 2019 | 29
the changing environment and proactive maintenance performed during several outages at the third-party owned and operated air separation unit at Coffeyville during the first quarter of 2020, we moved our turnaround from the previously planned timeframe of the fall of 2020 to the summer of 2021. We will continue to monitor market conditions and make adjustments, if needed, to our current plans. Our estimated capital expenditures are subject to change due to unanticipated changes in the cost, scope, and completion time for capital projects. For example, we may experience unexpected changes in
labor or equipment costs necessary to comply with government regulations or to complete projects that sustain or improve the profitability of the refineries or nitrogen fertilizer plants.facilities. We may also accelerate or defer some capital expenditures from time to time. Capital spending is determined by the board of directors of the Partnership’s general partner.
On September 14, 2019, the East Dubuque facility began a major scheduled turnaround, which was completed in October. We have incurred $7.0 million in the nine months ended September 30, 2019 related to this turnaround and estimate total costs of approximately $9.3 million, with the remaining costs to be incurred in the fourth quarter of 2019.Board.
Distributions to Unitholders
The current policy of the board of directors of the Partnership’s general partnerBoard is to distribute all Available Cash the Partnership generated on a quarterly basis. Available Cash for each quarter will be determined by the board of directors of the Partnership’s general partnerBoard following the end of such quarter. Available Cash for each quarter is calculated as Adjusted EBITDA reduced for cash needed for (i) debt service, (ii) maintenance capital expenditures, (iii) turnaround expenses, and, to the extent applicable, (iv)(iii) reserves for future operating or capital needs that the board of directors of our general partnerBoard deems necessary or appropriate, if any, in its sole discretion. Available Cash for distribution may be increased by the release of previously established cash reserves, if any, and other excess cash, at the discretion of the board of directors of our general partner.Board.
The following table presents distributions paid by the Partnership to CVR Partners’ unitholders, including amounts paid to CVR Energy, as of September 30, 2019.
|
| | | | | | | | | | | | | | | | | | |
| | | | | | | Dividends Paid (in thousands) |
| Related Period | | Date Paid | | Dividend Per Common Unit | | Unitholders | | CVR Energy | | Total |
| 2018 - 4th Quarter | | March 11, 2019 | | $ | 0.12 |
| | $ | 8,924 |
| | $ | 4,670 |
| | $ | 13,594 |
|
| 2019 - 1st Quarter | | May 13, 2019 | | 0.07 |
| | 5,205 |
| | 2,724 |
| | 7,929 |
|
| 2019 - 2nd Quarter | | August 12, 2019 | | 0.14 |
| | 10,411 |
| | 5,449 |
| | 15,860 |
|
| Total | | | | $ | 0.33 |
| | $ | 24,540 |
| | $ | 12,843 |
| | $ | 37,383 |
|
For the third quarter of 2019, the Partnership, upon approval by the Board of Directors of CVR Partners’ general partner on October 22, 2019, declared a distribution of $0.07 per common unit, or $7.9 million, which is payable November 12, 2019 to unitholders of record as of November 4, 2019. Of this amount, CVR Energy will receive approximately $2.7 million, with the remaining amount payable to public unitholders.
Distributions, if any, including the payment, amount, and timing thereof, are subject to change at the discretion of the Board. There have been no distributions paid by the Partnership relating to the fourth quarter of 2019 or the first quarter of 2020, and there have also been no distributions declared for the second quarter of 2020, as the Board determined there was no available cash for each such quarter.
The following table presents distributions paid by the Partnership to CVR Partners’ common unitholders, including amounts paid to CVR Energy, during 2019.
| | | | | | | | | | | | | | | | | | | | | | | | | | | | | | | | |
| | | | | | Distributions Paid (in thousands) | | | | |
| Related Period | | Date Paid | | Distribution Per
Common Unit | | Public Unitholders | | CVR Energy | | Total |
| 2018 - 4th Quarter | | March 11, 2019 | | $ | 0.12 | | | $ | 8,924 | | | $ | 4,670 | | | $ | 13,594 | |
| 2019 - 1st Quarter | | May 13, 2019 | | 0.07 | | | 5,205 | | | 2,724 | | | 7,929 | |
| 2019 - 2nd Quarter | | August 12, 2019 | | 0.14 | | | 10,411 | | | 5,449 | | | 15,860 | |
| 2019 - 3rd Quarter | | November 11, 2019 | | 0.07 | | | 5,205 | | | 2,724 | | | 7,930 | |
| Total distributions | | | | $ | 0.40 | | | $ | 29,745 | | | $ | 15,567 | | | $ | 45,313 | |
Capital Structure
On May 6, 2020, the Board, on behalf of the Partnership, authorized a unit repurchase program (the “Unit Repurchase Program”). The Unit Repurchase Program enables the Partnership to repurchase up to $10 million of the Partnership’s common units. Repurchases under the Unit Repurchase Program may be made from time-to-time through open market transactions, block trades, privately negotiated transactions, or otherwise in accordance with applicable securities laws. The timing, price, and amount of repurchases (if any) will be made at the discretion of management of our general partner and are subject to market conditions, as well as corporate, regulatory, and other considerations. This Unit Repurchase Program does not obligate the Partnership to acquire any common units and may be cancelled or terminated by our general partner’s board of directors at any time. On May 20, 2020, the Partnership entered into a common unit repurchase agreement, pursuant to Rules 10b5-1 and 10b-18 of CVR Partners’ general partner.the Exchange Act, to facilitate the repurchase of its common units and which the Partnership may terminate at any time by providing written notice. During the three and six months ended June 30, 2020, the Partnership repurchased 890,218 common units on the open market at a cost of $1.0 million, inclusive of transaction costs, or an average price of $1.07 per common unit. At June 30, 2020, the Partnership had $9.0 million in authority remaining under the Unit Repurchase Program.
Recent Developments
As disclosed in our Current Report on Form 8-K filed with the SEC on April 24, 2020, on April 20, 2020, the average closing price of our common units had fallen below $1.00 per unit over a 30 consecutive trading-day period, which is the minimum average unit price for continued listing on the New York Stock Exchange (the “NYSE”) under Section 802.01C of the NYSE Listing Company Manual. Under the NYSE’s rules, the Partnership has six months following receipt of this notification to regain compliance with the minimum unit price requirement. However, due to the unprecedented market-wide declines as a result of the ongoing spread of COVID-19, the SEC approved the NYSE’s request to toll the six month compliance period through and including June 30, 2020. As a result, the Partnership has until January 1, 2021 to regain compliance with this continued listing standard. As of June 30, 2020, the average closing price of the Partnership’s common units over a consecutive 30 trading-day period has remained below $1.00 per common unit. Although the Partnership intends to
pursue measures to cure the unit price non-compliance and return to compliance with the NYSE continued listing requirements in Section 802.01C of the NYSE Listed Company Manual, no assurance can be given that the Partnership will be able to regain compliance with the aforementioned listing requirement.
Cash Flows
The following table sets forth our cash flows for the periods indicated below:
|
| | | | | | | | | | | |
| Nine Months Ended September 30, |
| (in thousands) | 2019 | | 2018 | | Change |
| Net cash flow provided by (used in): | | | | | |
| Operating activities | $ | 68,672 |
| | $ | 27,118 |
| | $ | 41,554 |
|
| Investing activities | (9,398 | ) | | (14,850 | ) | | 5,452 |
|
| Financing activities | (37,383 | ) | | — |
| | (37,383 | ) |
| Net increase in cash and cash equivalents | $ | 21,891 |
| | $ | 12,268 |
| | $ | 9,623 |
|
| | | | | | | | | | | | | | | | | |
| Six Months Ended June 30, | | | | |
| (in thousands) | 2020 | | 2019 | | Change |
| Net cash flow provided by (used in): | | | | | |
| Operating activities | $ | 6,778 | | | $ | 34,681 | | | $ | (27,903) | |
| Investing activities | (10,157) | | | (5,668) | | | (4,489) | |
| Financing activities | (1,058) | | | (21,523) | | | 20,465 | |
| Net increase (decrease) in cash and cash equivalents | $ | (4,437) | | | $ | 7,490 | | | $ | (11,927) | |
September 30, 2019 |
30
Cash Flows Provided by Operating Activities
The change in net cash flows from operating activities for the ninesix months ended SeptemberJune 30, 20192020 as compared to the ninesix months ended SeptemberJune 30, 20182019 is primarily due to improved operating results leading to a decline in net lossincome, excluding non-cash items, of $10.1$39.0 million, and unfavorable changes in 2019 compared to a net lossnon-current assets and liabilities of $48.7$0.7 million, partially offset by favorable changes in 2018.working capital of $11.8 million.
Cash Flows Used in Investing Activities
The change in net cash used in investing activities for the ninesix months ended SeptemberJune 30, 20192020 compared to the ninesix months ended SeptemberJune 30, 2018,2019, was primarily due to decreasedincreased capital expenditures during 20192020 of $5.5$4.4 million.
Cash Flows Used in Financing Activities
The change in net cash used in financing activities for the ninesix months ended SeptemberJune 30, 20192020 compared to the ninesix months ended SeptemberJune 30, 20182019 was the result of cash distributions totaling $37.4paid of $21.5 million during the six months ended June 30, 2019, which were not paid during the ninesix months ended SeptemberJune 30, 2019, compared to no distributions paid2020, partially offset by repurchasing common units for $1.0 million during 2018.2020.
Off-Balance Sheet Arrangements
We do not have any “off-balance sheet arrangements” as such term is defined within the rules and regulations of the SEC.
Item 3. Quantitative and Qualitative Disclosures About Market Risk
There have been no material changes to our market risks as of and for the three and ninesix months ended SeptemberJune 30, 20192020 as compared to the risks discussed in Part II, Item 7A of our 20182019 Form 10-K.
Item 4. Controls and Procedures
Evaluation of Disclosure Controls and Procedures
As of SeptemberJune 30, 2019,2020, we have evaluated, under the direction of our Executive Chairman, Chief Executive Officer, Chief Financial Officer and Chief Accounting Officer, the effectiveness of our disclosure controls and procedures, as defined in Exchange Act Rule 13a-15(e). Based upon and as of the date of that evaluation, our Executive Chairman, Chief Executive Officer, Chief Financial Officer and Chief Accounting Officer concluded that our disclosure controls and procedures were effective to provide reasonable assurance that information required to be disclosed in the reports that we file or submit under the Exchange Act is recorded, processed, summarized and reported within the time periods specified in the SEC’s rules and forms, and that such information is accumulated and communicated to the Partnership’s management, including our Executive
Chairman, Chief Executive Officer, Chief Financial Officer, and Chief Accounting Officer as appropriate, to allow timely decisions regarding required disclosure.
Changes in Internal Control Over Financial Reporting
There have been no material changes in the Partnership’s internal controls over financial reporting required by Rule 13a-15 of the Exchange Act that occurred during the fiscal quarter ended SeptemberJune 30, 20192020 that materially affected, or is reasonably likely to materially affect, the Partnership’s internal control over financial reporting. Despite many of our employees working in a remote environment due to the COVID-19 pandemic, we have not experienced any material impact to our internal controls over financial reporting. We are continually monitoring and assessing the COVID-19 pandemic to determine any potential impact on the design and operating effectiveness of our internal controls over financial reporting.
PART II. OTHER INFORMATION
Item 1. Legal Proceedings
See Note 1112 (“Commitments and Contingencies”) to Part I, Item 1 of this Report, which is incorporated by reference into this Part II, Item 1, for a description of certain litigation, legal, and administrative proceedings and environmental matters.
Item 1A. Risk Factors
There have been no material changes to ourThe risk factors as of and forbelow should be read in conjunction with the three and nine months ended September 30, 2019 as compared to the risksrisk factors previously discussed in Part I, Item 1A of our 20182019 Form 10-K.10-K, which risk factors could also be affected by the potential effects of the outbreak of COVID-19 discussed below. Additional risks and uncertainties, including risks and uncertainties not presently known to us, or that we currently deem immaterial, could also have an adverse effect on our business, financial condition, and/or results of operations.
The COVID-19 pandemic, and actions taken in response thereto, could materially adversely affect our business, operations, financial condition, liquidity, and results of operations.
The COVID-19 pandemic and actions of governments and others in response thereto is negatively impacting worldwide economic and commercial activity and financial markets. The COVID-19 pandemic has also resulted in significant business and operational disruptions, including closures, supply chain disruptions, travel restrictions, stay-at-home orders, and limitations on the availability and effectiveness of the workforce. Further, if general economic conditions continue to remain uncertain for an extended period of time, our liquidity and ability to repay our outstanding debt may be harmed. The full impact of the COVID-19 pandemic is unknown and is rapidly evolving. The extent to which the COVID-19 pandemic negatively impacts our business and operations, including the availability and pricing of feedstocks, will depend on the severity, location, and duration of the effects and spread of COVID-19, the actions undertaken by national, regional, and local governments and health officials to contain such virus or remedy its effects, and if, how quickly and to what extent economic conditions recover and normal business and operating conditions resume.
If we fail to regain or maintain compliance with the continued listing standards of the NYSE, which may result in delisting of our common units from the NYSE.
As disclosed in our Form 8-K filed with the SEC on April 24, 2020, on April 20, 2020, the average closing price of the Partnership’s common units fell below $1.00 per unit over a consecutive 30 trading-day period, which is the minimum average unit price for continued listing on the NYSE under Section 802.01C of the NYSE Listing Company Manual. While the Partnership is considering various options it may take in an effort to cure this deficiency and regain compliance, no assurance can be given that the Partnership will be able to regain compliance with the aforementioned listing requirement. If the Partnership fails to regain compliance, our common units will be subject to the NYSE’s suspension and delisting procedures. If the Partnership’s common units ultimately were to be delisted for any reason, such delisting could negatively impact the Partnership, by among other things, reducing the liquidity and market price of our common units, reducing the number of investors willing to hold or acquire our common units, and limiting our ability to issue securities or obtain financing in the future.
Item 2. Unregistered Sales of Equity Securities and Use of Proceeds
Issuer Purchases of Equity Securities
Repurchases of the Partnership’s equity securities during the three months ended June 30, 2020 were as follows:
| | | | | | | | | | | | | | | | | | | | | | | | | | |
| Period | | Total Number of Units Purchased | | Average Price paid per Unit | | Total Number of Units Purchased as Part of Publicly Announced Plans or Programs | | Approximate Dollar Value of Units that May Yet Be Purchased Under the Plans or Programs (1) |
| | | | | | | | |
| | | | | | | | |
| | | | | | | | |
| | | | | | | | |
| May 1 to May 31, 2020 | | — | | | $ | — | | | — | | | $ | 10,000,000 | |
| June 1 to June 30, 2020 | | 890,218 | | | 1.07 | | | 890,218 | | | 9,045,479 | |
| | | | | | | | |
| | | | | | | | |
| | | | | | | | |
| | | | | | | | |
| | | | | | | | |
| | | | | | | | |
| Total | | 890,218 | | | | | 890,218 | | | |
(1)On May 6, 2020, the Board, on behalf of the Partnership, authorized the Partnership to repurchase up to $10 million of the Partnership’s common units. Repurchases may be made through open market transactions, block trades, privately negotiated transactions, or otherwise in accordance with applicable securities laws. Through June 30, 2020, the Partnership has repurchased $1.0 million of its common units under this authorization and $9.0 million of authority may yet be used to purchase common units.
Item 5. Other Information
On October 22, 2019,July 31, 2020, Coffeyville Resources Nitrogen Fertilizers, LLC (“CRNF”) and Messer LLC (“Messer”) entered into an On-Site Product Supply Agreement (the “Agreement”) which replaced the Audit Committee of CVR EnergyAmended and Restated On-Site Product Supply Agreement between CRNF and The BOC Group, Inc. (as predecessor in interest to Messer) on substantially similar terms. The Agreement term is fifteen years, and renews for successive 12 month terms unless terminated by either party upon 12 months written notice given on the Conflicts Committeelast day of the Boardinitial term or any renewal term, or unless earlier terminated in the event of Directorsdefault. Under the Agreement, among other obligations, Messer is obligated to supply, and CRNF is obligated to take as available and pay for, oxygen, nitrogen, and compressed dry air, subject to certain technical specifications and other customary requirements contained therein. The Agreement also obligates Messer to install an oxygen storage vessel and other equipment and make additional capital investments in Messer’s facility intended to improve the reliability of such facility. This description of the general partner of CVR Partners each agreedAgreement is qualified in its entirety by reference to authorize the exchange of certain parcels of property ownedcopy thereof filed as Exhibit 10.1 to this Quarterly Report on Form 10-Q, which is incorporated herein by subsidiaries of CVR Energy with an equal number of parcels owned by subsidiaries of CVR Partners, all located in Coffeyville, Kansas (the “Property Swap”). This Property Swap will enable each such subsidiary to create a more usable contiguous parcel of land near its own operating footprint. The Partnership will account for this transaction in accordance with the ASC 805-50 guidance on transferring assets between entities under common control.reference.
Item 6. Exhibits
| | | | | | | | |
| Exhibit | | Exhibit Description |
| | |
| | |
Exhibit10.1*+ | |
|
| | |
| | |
| | |
| | |
| | |
| | |
| 101* | | The following financial information for CVR Partners, LP’s Quarterly Report on Form 10-Q for the quarter ended SeptemberJune 30, 2019,2020, formatted in XBRL (“Extensible Business Reporting Language”) includes: (1) Condensed Consolidated Balance Sheets (unaudited), (2) Condensed Consolidated Statements of Operations (unaudited), (3) Condensed Consolidated Statements of Partners’ Capital (unaudited), (4) Condensed Consolidated Statements of Cash Flows (unaudited) and (5) the Notes to Condensed Consolidated Financial Statements (unaudited), tagged in detail. |
| 104* | | Cover Page Interactive Data File (formatted as Inline XBRL and contained in Exhibit 101). |
| | |
| | |
| | |
| | |
*Filed herewith.
+ Certain portions of this Exhibit have been redacted pursuant to Item 601(b)(10) of Regulation S-K. The Partnership agrees to furnish an unredacted copy of this Exhibit to the SEC on a confidential basis upon request.
†Furnished herewith.
PLEASE NOTE: Pursuant to the rules and regulations of the SEC, we may file or incorporate by reference agreements referenced as exhibits to the reports that we file with or furnish to the SEC. The agreements are filed to provide investors with information regarding their respective terms. The agreements are not intended to provide any other factual information about the Partnership, its business or operations. In particular, the assertions embodied in any representations, warranties and covenants contained in the agreements may be subject to qualifications with respect to knowledge and materiality different from those applicable to investors and may be qualified by information in confidential disclosure schedules not included with the exhibits. These disclosure schedules may contain information that modifies, qualifies and creates exceptions to the representations, warranties and covenants set forth in the agreements. Moreover, certain representations, warranties and covenants in the agreements may have been used for the purpose of allocating risk between the parties, rather than establishing matters as facts. In addition, information concerning the subject matter of the representations, warranties and covenants may have changed after the date of the respective agreement, which subsequent information may or may not be fully reflected in the Partnership’s public disclosures. Accordingly, investors should not rely on the representations, warranties and covenants in the agreements as characterizations of the actual state of facts about the Partnership, its business or operations on the date hereof.
SeptemberJune 30, 20192020 | 3236
SIGNATURES
Pursuant to the requirements of the Securities Exchange Act of 1934, the registrant has duly caused this report to be signed on its behalf by the undersigned thereunto duly authorized.
| | | | | | | | | | | |
| | CVR Partners, LP | |
| | By: | CVR GP, LLC, its general partner |
| | | |
| | | |
| | CVR Partners, LP | |
| | By: | CVR GP, LLC, its general partner |
| | | |
| | | |
| | | |
October 24, 2019August 4, 2020 | | By: | /s/ Tracy D. Jackson |
| |
| Executive Vice President and Chief Financial Officer |
| |
| (Principal Financial Officer) |
| | | |
| | | |
October 24, 2019August 4, 2020 | | By: | /s/ Matthew W. Bley |
| | | Chief Accounting Officer and Corporate Controller |
| | | (Principal Accounting Officer) |
| | | |
SeptemberJune 30, 20192020 | 3337