UNITED STATES
SECURITIES AND EXCHANGE COMMISSION
Washington, D.C. 20549
Form 10-Q | | | | | | | | |
| (Mark One) |
| ☑ | QUARTERLY REPORT PURSUANT TO SECTION 13 OR 15(d) OF THE SECURITIES EXCHANGE ACT OF 1934 |
| For the quarterly period ended | June 30, 20222023 |
| OR |
| ☐ | TRANSITION REPORT PURSUANT TO SECTION 13 OR 15(d) OF THE SECURITIES EXCHANGE ACT OF 1934 |
| For the transition period from to . |
Commission file number: 001-35120
CVR PARTNERS, LP
(Exact name of registrant as specified in its charter) | | | | | | | | | | | | | | |
| Delaware | | | | 56-2677689 |
(State or other jurisdiction of
incorporation or organization) | | | (I.R.S. Employer
Identification No.) |
2277 Plaza Drive, Suite 500, Sugar Land, Texas 77479
(Address of principal executive offices) (Zip Code)
(281) 207-3200
(Registrant’s telephone number, including area code)
Securities registered pursuant to Section 12(b) of the Act:
| | | | | | | | |
| Title of each class | Trading Symbol(s) | Name of each exchange on which registered |
| Common units representing limited partner interests | UAN | The New York Stock Exchange |
Indicate by check mark whether the registrant (1) has filed all reports required to be filed by Section 13 or 15(d) of the Securities Exchange Act of 1934 during the preceding 12 months (or for such shorter period that the registrant was required to file such reports), and (2) has been subject to such filing requirements for the past 90 days. Yes ☑ No ☐
Indicate by check mark whether the registrant has submitted electronically every Interactive Data File required to be submitted pursuant to Rule 405 of Regulation S-T (§232.405 of this chapter) during the preceding 12 months (or for such shorter period that the registrant was required to submit such files). Yes ☑ No ☐
Indicate by check mark whether the registrant is a large accelerated filer, an accelerated filer, a non-accelerated filer, a smaller reporting company, or an emerging growth company. See the definitions of “large accelerated filer,” “accelerated filer,” “smaller reporting company” and “emerging growth company” in Rule 12b-2 of the Exchange Act.
| | | | | | | | | | | | | | | | | |
| Large accelerated filer | ☐ | Accelerated filer | ☑ | Non-AcceleratedNon-accelerated filer | ☐ |
| Smaller reporting company | ☐ | Emerging growth company | ☐ | | |
If an emerging growth company, indicate by check mark if the registrant has elected not to use the extended transition period for complying with any new or revised financial accounting standards provided pursuant to Section 13(a) of the Exchange Act. ☐
Indicate by check mark whether the registrant is a shell company (as defined by Rule 12b-2 of the Exchange Act). Yes ☐ No ☑
There were 10,569,637 common units representing limited partner interests of CVR Partners, LP (“common units”) outstanding at July 29, 2022.28, 2023.
TABLE OF CONTENTS
CVR PARTNERS, LP - Quarterly Report on Form 10-Q
June 30, 20222023
| | PART I. Financial Information | PART I. Financial Information | | PART II. Other Information | | PART I. Financial Information | | PART II. Other Information | |
| | | | | | | | | | | | | | | |
| | | | | | | | | | | | | | |
| | | | | | | | | | | | | | |
| | | | | | | | | | | | | | |
| | | | | | | | | | | | |
| | | | | | | | | | |
| | | | | | | | |
| | | | | | | | |
| | | | | | | | |
This Quarterly Report on Form 10-Q (including documents incorporated by reference herein) contains statements with respect to our expectations or beliefs as to future events. These types of statements are “forward-looking” and subject to uncertainties. See “Important Information Regarding Forward-Looking Statements” section of this filing.
Important Information Regarding Forward-Looking Statements
This Quarterly Report on Form 10-Q (this “Report”) contains forward-looking statements including, but not limited to, those under Item 2. Management’s Discussion and Analysis of Financial Condition and Results of Operations. These forward-looking statements are subject to a number of risks and uncertainties, many of which are beyond our control. All statements other than statements of historical fact, including without limitation, statements regarding future operations, financial position, estimated revenues and losses, growth, capital projects, unit repurchases, impacts of legal proceedings, projected costs, prospects, plans, and objectives of management are forward-looking statements. The words “could,” “believe,” “anticipate,” “intend,” “estimate,” “expect,” “may,” “continue,” “predict,” “potential,” “project,” and similar terms and phrases are intended to identify forward-looking statements.
Although we believe our assumptions concerning future events are reasonable, a number of risks, uncertainties and other factors could cause actual results and trends to differ materially from those projected or forward-looking. Forward-looking statements, as well as certain risks, contingencies, or uncertainties that may impact our forward-looking statements, include, but are not limited to, the following:
•our ability to generate distributable cash or make cash distributions on our common units, including reserves and future uses of cash;
•the ability of our general partner to modify or revoke our distribution policy at any time;
•the volatile nature of our business and the variable nature of our distributions;
•the severity, magnitude, duration, and impacteffects of the novel coronavirus 2019 and any variants thereof (collectively, “COVID-19”) pandemic and of businesses’ and governments’ responses to such pandemic on our operations, personnel, commercial activity, and supply and demand across our and our customers’ and suppliers’ businesses;
•changes in market conditions and market volatility, arising from the COVID-19 pandemic or inflation, including fertilizer, natural gas, and other commodity prices, including inflation, and the impact of such changes on our operating results and financial position;condition;
•the cyclical and seasonal nature of our business;
•the impact of weather on our business, including our ability to produce, market, sell, transport or deliver fertilizer products profitably or at all, and on commodity supply and/or pricing;
•the dependence of our operations on a few third-party suppliers, including providers of feedstocks, transportation services, and equipment;
•our reliance on, or our ability to procure economically or at all, petroleum coke (“pet cokecoke”) we purchase from CVR Energy, Inc. (together with its subsidiaries, but excluding the Partnership and its subsidiaries, “CVR Energy”) and other third-party suppliers;
•our reliance on the natural gas, electricity, oxygen, nitrogen, sulfur processing, compressed dry air and other products that we purchase from third parties;
•the supply, availability, and prices of essential raw materials and the effects of inflation thereupon;
•our production levels, including the risk of a material decline in those levels, including our ability to upgrade ammonia to UAN;
•product pricing, including contracted sales, the timing thereof, and our ability to realize market prices, in full or at all;
•accidents or other unscheduled shutdowns or interruptions affecting our facilities, machinery, or equipment, or those of our suppliers or customers;
•potential operating hazards from accidents, fire, severe weather, tornadoes, floods or other natural disasters;
•operational upsets or changes in laws that could impact the amount and receipt of credits (if any) under Section 45Q of the Internal Revenue Code of 1986, as amended;
•ability to meet certain carbon oxide capture and sequestration milestones;
•our ability to obtain, retain, or renew permits, licenses and authorizations to operate our business;
•competition in the nitrogen fertilizer business and foreign wheat and coarse grain production, including impacts theretothereof as a result of farm planting acreage, domestic and global supply and demand, and domestic or international duties tariffs or similar costs;
•capital expenditures;
•changes in our credit profile and the effects of higher interest rates;
•existing and future laws, rulings and regulations, including but not limited to those relating to the environment, climate change, and/or the transportation or production of hazardous chemicals, materials, or substances, like ammonia, including potential liabilities or capital requirements arising from such laws, rulings, or regulations;
•Environmental, Socialerosion of demand for our products due to increasing focus on climate change and Governanceenvironmental, social and governance (“ESG”) initiatives;
•ESG including but not limited to compliance with ESG-related recommendations or directives and risks or impacts relating thereto, whether from regulators, rating agencies, lenders, investors, litigants, customers, vendors, the public or others;
•alternative energy or fuel sources and impacts on corn prices (ethanol), and the end-use and application of fertilizers;
•risks of terrorism, cybersecurity attacks, the security of chemical manufacturing facilities and other matters beyond our control;
•political disturbances, geopolitical instability and tensions, and associated changes in global trade policies and economic sanctions, including, but not limited to, in connection with Russia’s invasion of Ukraine in February 2022 and any ongoing conflicts in the region;
•our lack of asset diversification;
•our dependence on significant customers and the creditworthiness and performance by counterparties;
•our potential loss of transportation cost advantage over our competitors;
•risks associated with third party operation of or control over important facilities necessary for operation of our nitrogen fertilizer facilities;
•the volatile nature of ammonia, potential liability for accidents involving ammonia including damage or injury to persons, property, the environment or human health and increased costs related to the transport or production of ammonia;
•our potential inability to successfully implement our business strategies, including the completion of significant capital programs or projects;
•our reliance on CVR Energy’s senior management team and conflicts of interest they may face operating each of CVR Partners and CVR Energy;
•control of our general partner by CVR Energy;Energy and control of CVR Energy by its controlling shareholder;
•our ability to continue to license the technology used in our operations;
•the potential inability to successfully implement our business strategies at all or on time and within our anticipated budgets, including significant capital programs or projects and turnarounds at our fertilizer facilities;
•restrictions in our debt agreements;
•asset useful lives and impairments and impacts thereof;
•asset useful life;
•realizable inventory value;
•the number of investors willing to hold or acquire our common units;
•our ability to issue securities or obtain financing;financing at favorable rates or at all;
•bank failures or other events affecting financial institutions;
•changes in tax and other law, regulations and policies;
•ability to qualify for and receive the benefit of 45Q tax credits;
•changes in our treatment as a partnership for U.S. federal income or state tax purposes;
•rulings, judgments or settlements in litigation, tax or other legal or regulatory matters;
•instability and volatility in the capital, credit and commodities markets and in the global economy, including due to the ongoing Russia-Ukraine conflict;
•risks related to the conclusion of a potential spin-off of the general and limited partner interests in the Partnership owned by CVR Energy or potential future reconsideration thereof;
•competition, transactions, and/or conflicts with CVR Energy and its affiliates;
•transactions and/or conflicts withaffiliates, including CVR Energy’s controlling shareholder;
•the value of payouts under our equity and non-equity incentive plans; and
•the cost and/or availability of insurance and our ability to recover under our insurance policies for damages or losses in full or at all; and
•the factors described in greater detail under “Risk Factors” in Item 1A of our Annual Report on Form 10-K for the year ended December 31, 20212022 and our other filings with the U.S. Securities and Exchange Commission (the “SEC”).
All forward-looking statements included in this Report are based on information available to us on the date of this Report. Except as required by law, we undertake no obligation to revise or update any forward-looking statements as a result of new information, future events or otherwise.
Information About Us
Investors should note that we make available, free of charge on our website at cvrenergy.com,www.CVRPartners.com, our annual reports on Form 10-K, quarterly reports on Form 10-Q, current reports on Form 8-K, and any amendments to those reports as soon as reasonably practicable after we electronically file such material with, or furnish it to, the SEC. We also post announcements, updates, events, investor information and presentations on our website in addition to copies of all recent news releases. We may use the Investor Relations section of our website to communicate with investors. It is possible that the financial and other information posted there could be deemed to be material information. Documents and information on our website are not incorporated by reference herein.
The SEC maintains a website at www.sec.gov that contains reports, proxy and information statements, and other information regarding issuers, including us, that file electronically with the SEC.
PART I. FINANCIAL INFORMATION
Item 1. Financial Statements
CVR PARTNERS, LP AND SUBSIDIARIES
CONDENSED CONSOLIDATED BALANCE SHEETS
(unaudited) | | | | | | | | | | | |
| (in thousands) | June 30, 2022 | | December 31, 2021 |
| ASSETS |
| Current assets: | | | |
| Cash and cash equivalents | $ | 156,312 | | | $ | 112,516 | |
| Accounts receivable | 35,998 | | | 88,351 | |
| Inventories | 85,402 | | | 52,270 | |
| Prepaid expenses and other current assets | 5,659 | | | 9,108 | |
| Total current assets | 283,371 | | | 262,245 | |
| Property, plant, and equipment, net | 820,940 | | | 850,462 | |
| | | |
| | | |
| Other long-term assets | 14,489 | | | 14,351 | |
| Total assets | $ | 1,118,800 | | | $ | 1,127,058 | |
| | | |
| LIABILITIES AND PARTNERS’ CAPITAL |
| Current liabilities: | | | |
| Accounts payable | $ | 49,928 | | | $ | 41,504 | |
| Accounts payable to affiliates | 11,713 | | | 8,895 | |
| Deferred revenue | 4,196 | | | 87,060 | |
| Other current liabilities | 29,960 | | | 24,401 | |
| Total current liabilities | 95,797 | | | 161,860 | |
| Long-term liabilities: | | | |
| Long-term debt, net | 546,558 | | | 610,642 | |
| Other long-term liabilities | 15,259 | | | 12,358 | |
| Total long-term liabilities | 561,817 | | | 623,000 | |
Commitments and contingencies (See Note 11) | 0 | | 0 |
| Partners’ capital: | | | |
| Common unitholders, 10,569,637 and 10,681,332 units issued and outstanding at June 30, 2022 and December 31, 2021, respectively | 461,185 | | | 342,197 | |
| General partner interest | 1 | | | 1 | |
| Total partners’ capital | 461,186 | | | 342,198 | |
| Total liabilities and partners’ capital | $ | 1,118,800 | | | $ | 1,127,058 | |
| | | | | | | | | | | |
| (in thousands) | June 30, 2023 | | December 31, 2022 |
| ASSETS |
| Current assets: | | | |
| Cash and cash equivalents | $ | 68,699 | | | $ | 86,339 | |
| Accounts receivable | 33,925 | | | 90,448 | |
| Inventories | 78,874 | | | 77,518 | |
| Prepaid expenses and other current assets | 6,825 | | | 11,399 | |
| Total current assets | 188,323 | | | 265,704 | |
| Property, plant, and equipment, net | 783,561 | | | 810,994 | |
| | | |
| | | |
| Other long-term assets | 47,106 | | | 23,704 | |
| Total assets | $ | 1,018,990 | | | $ | 1,100,402 | |
| | | |
| LIABILITIES AND PARTNERS’ CAPITAL |
| Current liabilities: | | | |
| Accounts payable | $ | 28,069 | | | $ | 45,522 | |
| Accounts payable to affiliates | 5,896 | | | 5,302 | |
| Deferred revenue | 6,666 | | | 47,516 | |
| Other current liabilities | 27,683 | | | 27,717 | |
| Total current liabilities | 68,314 | | | 126,057 | |
| Long-term liabilities: | | | |
| Long-term debt, net | 547,050 | | | 546,800 | |
| Long-term deferred revenue | 36,483 | | | — | |
| Other long-term liabilities | 14,827 | | | 15,734 | |
| Total long-term liabilities | 598,360 | | | 562,534 | |
Commitments and contingencies (See Note 11) | | | |
| Partners’ capital: | | | |
| Common unitholders, 10,569,637 and 10,569,637 units issued and outstanding at June 30, 2023 and December 31, 2022, respectively | 352,315 | | | 411,810 | |
| General partner interest | 1 | | | 1 | |
| Total partners’ capital | 352,316 | | | 411,811 | |
| Total liabilities and partners’ capital | $ | 1,018,990 | | | $ | 1,100,402 | |
The accompanying notes are an integral part of these condensed consolidated financial statements.
CVR PARTNERS, LP AND SUBSIDIARIES
CONDENSED CONSOLIDATED STATEMENTS OF OPERATIONS
(unaudited)
| | | Three Months Ended
June 30, | | Six Months Ended
June 30, | | Three Months Ended
June 30, | | Six Months Ended
June 30, |
| (in thousands, except per unit data) | (in thousands, except per unit data) | 2022 | | 2021 | | 2022 | | 2021 | (in thousands, except per unit data) | 2023 | | 2022 | | 2023 | | 2022 |
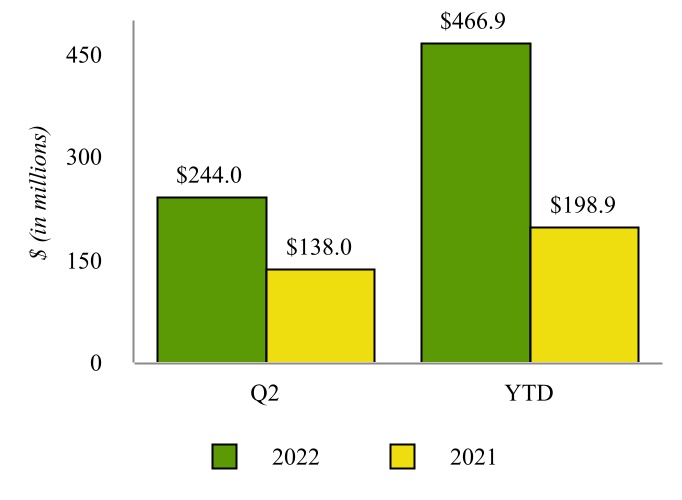
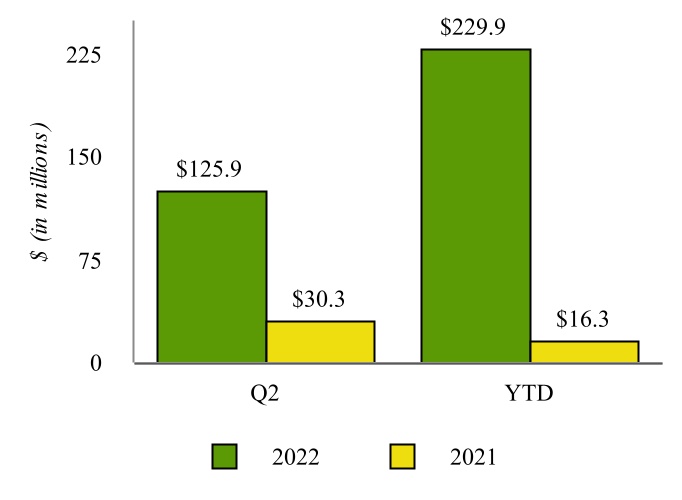
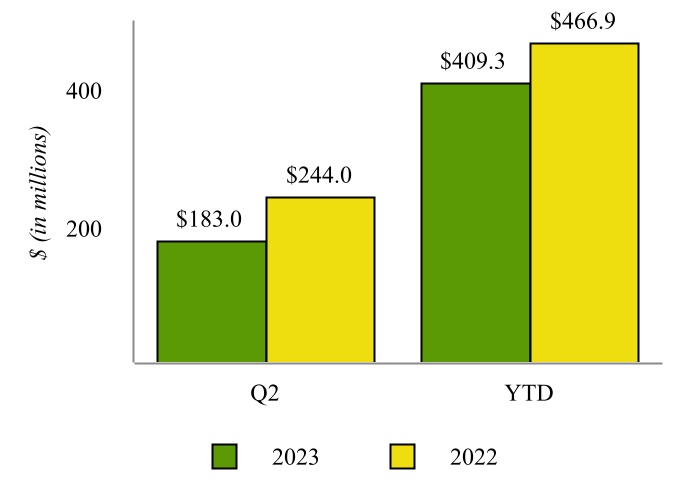
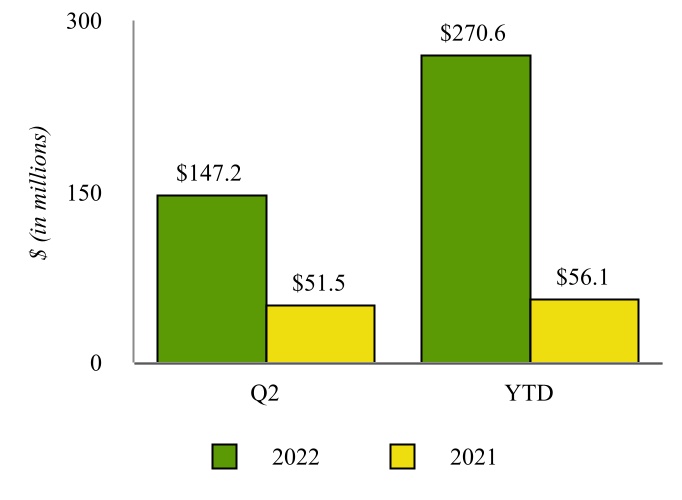
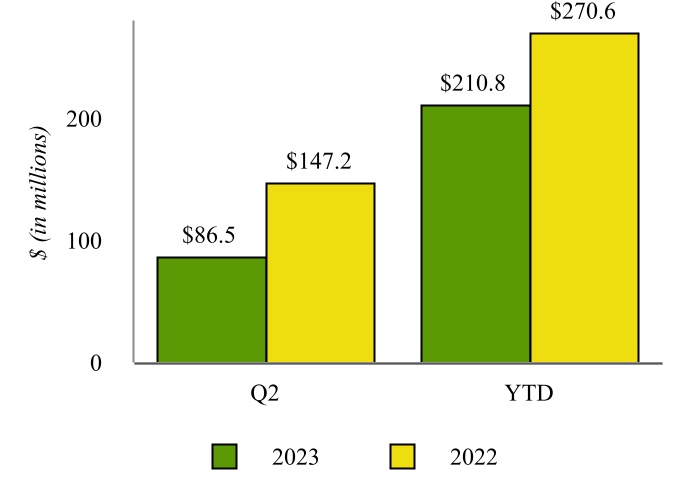
| Net sales | Net sales | $ | 244,000 | | | $ | 138,025 | | | $ | 466,874 | | | $ | 198,945 | | Net sales | $ | 183,005 | | | $ | 244,000 | | | $ | 409,266 | | | $ | 466,874 | |
| Operating costs and expenses: | Operating costs and expenses: | | Operating costs and expenses: | |
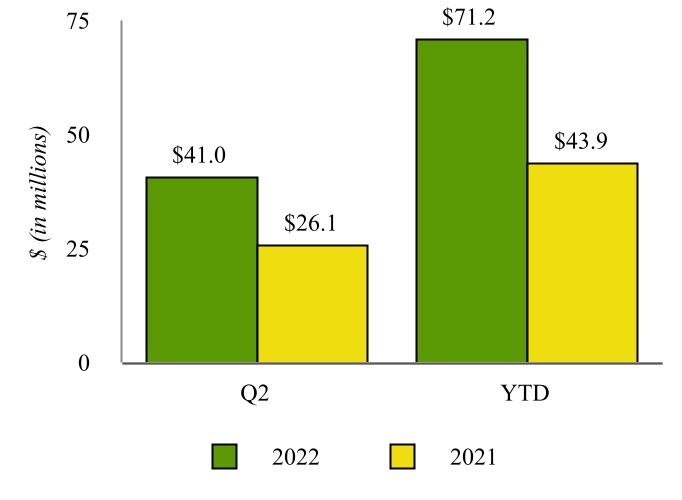
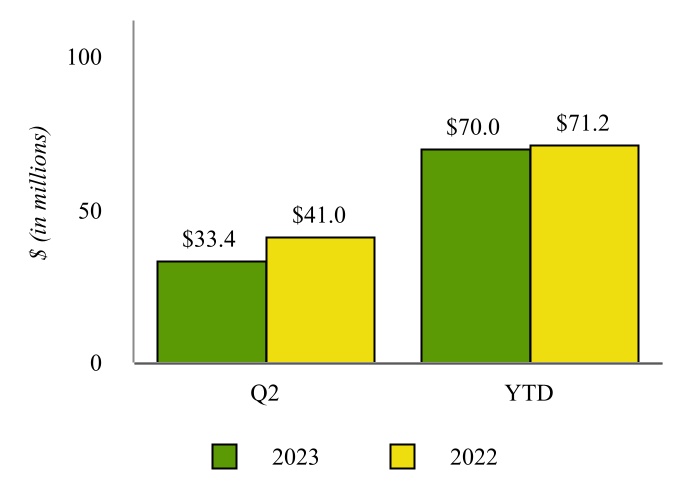
| Cost of materials and other | Cost of materials and other | 40,984 | | | 26,094 | | | 71,230 | | | 43,860 | | Cost of materials and other | 33,410 | | | 40,984 | | | 69,989 | | | 71,230 | |
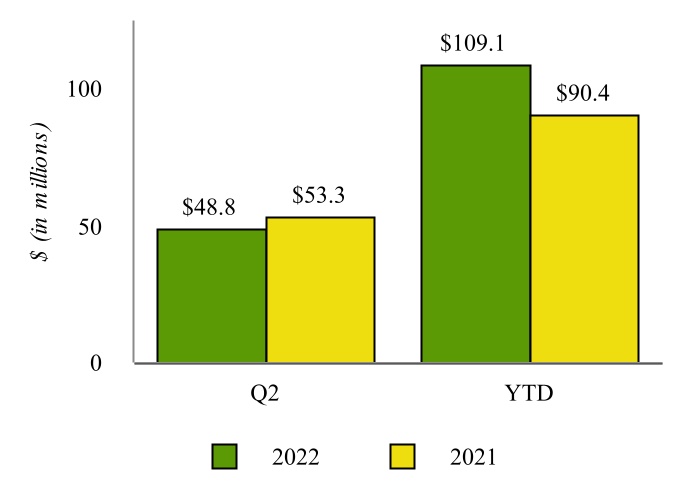
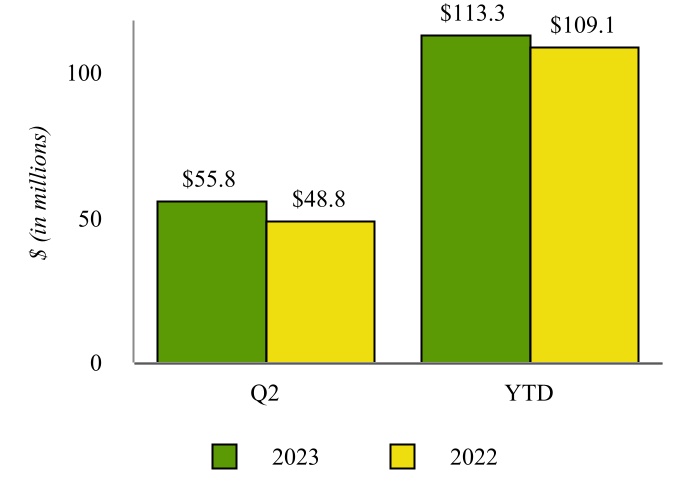
| Direct operating expenses (exclusive of depreciation and amortization) | Direct operating expenses (exclusive of depreciation and amortization) | 48,767 | | | 53,291 | | | 109,084 | | | 90,366 | | Direct operating expenses (exclusive of depreciation and amortization) | 55,759 | | | 48,767 | | | 113,303 | | | 109,084 | |
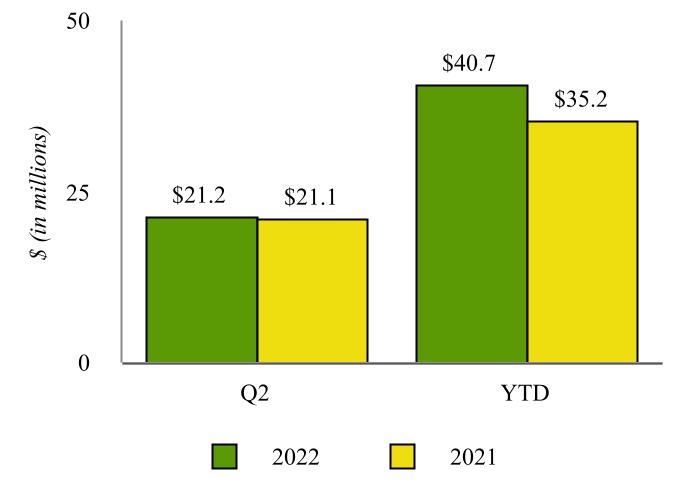
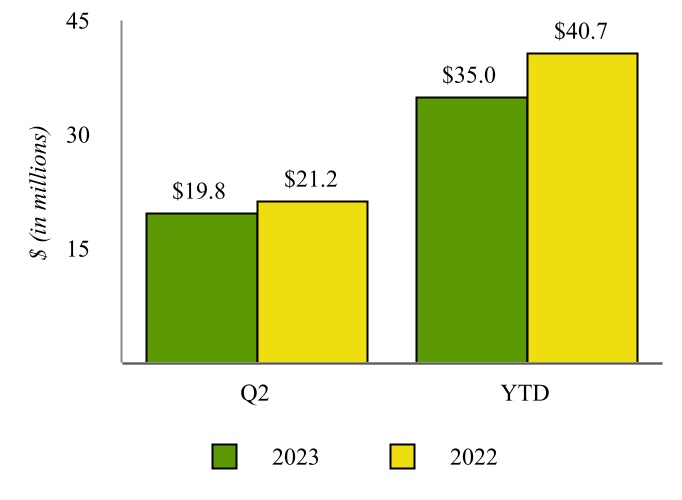
| Depreciation and amortization | Depreciation and amortization | 21,220 | | | 21,119 | | | 40,686 | | | 35,242 | | Depreciation and amortization | 19,755 | | | 21,220 | | | 34,965 | | | 40,686 | |
| Cost of sales | Cost of sales | 110,971 | | | 100,504 | | | 221,000 | | | 169,468 | | Cost of sales | 108,924 | | | 110,971 | | | 218,257 | | | 221,000 | |
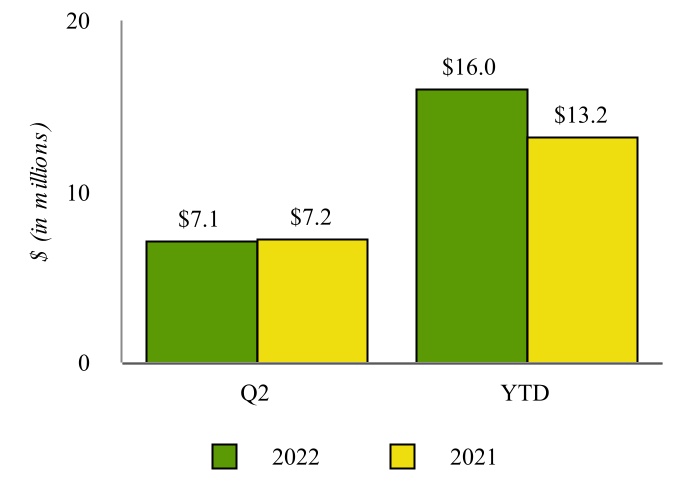
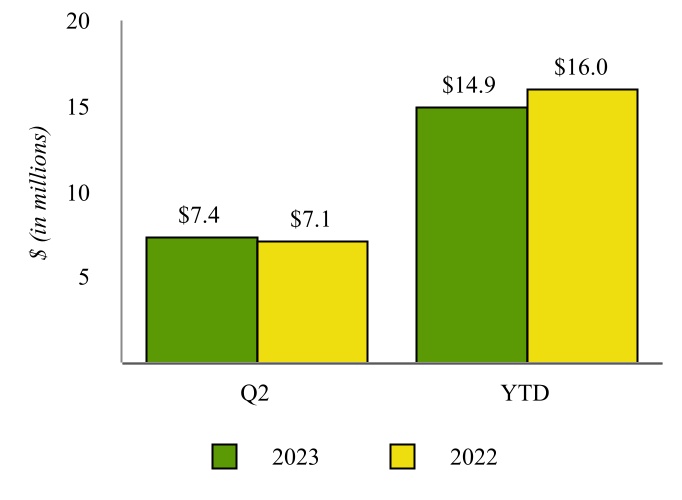
| Selling, general and administrative expenses | Selling, general and administrative expenses | 7,008 | | | 6,802 | | | 15,752 | | | 12,692 | | Selling, general and administrative expenses | 7,291 | | | 7,008 | | | 14,675 | | | 15,752 | |
| Loss on asset disposal | Loss on asset disposal | 93 | | | 405 | | | 267 | | | 477 | | Loss on asset disposal | 64 | | | 93 | | | 256 | | | 267 | |
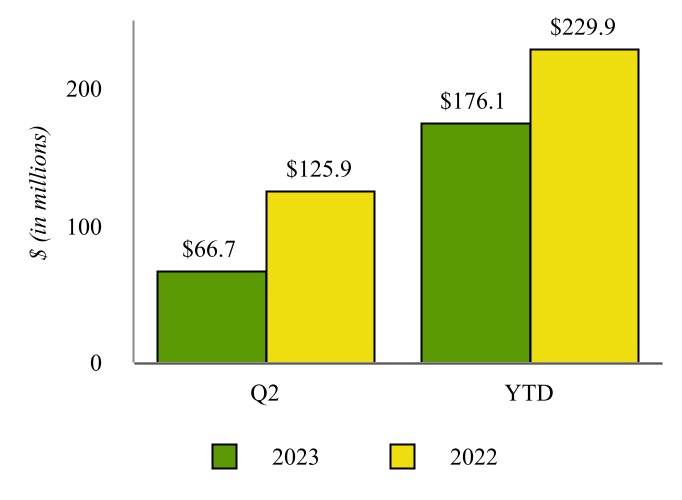
| | Operating income | Operating income | 125,928 | | | 30,314 | | | 229,855 | | | 16,308 | | Operating income | 66,726 | | | 125,928 | | | 176,078 | | | 229,855 | |
| Other (expense) income: | Other (expense) income: | | Other (expense) income: | |
| Interest expense, net | Interest expense, net | (8,308) | | | (23,334) | | | (18,343) | | | (39,251) | | Interest expense, net | (6,919) | | | (8,308) | | | (14,093) | | | (18,343) | |
| | Other income, net | 81 | | | 40 | | | 108 | | | 4,598 | | |
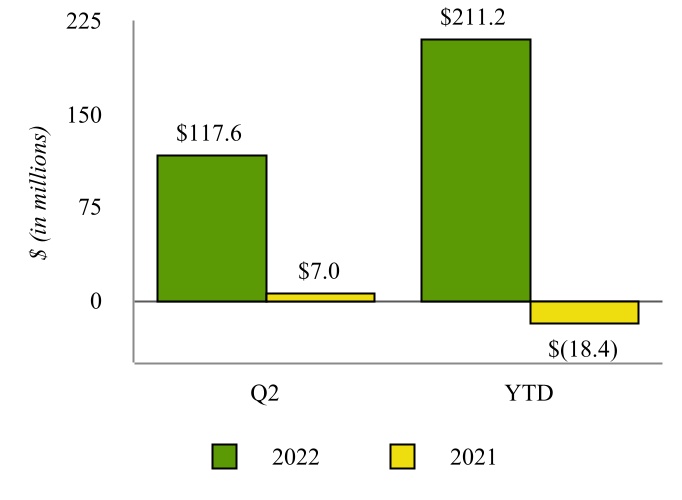
| Income (loss) before income tax expense | 117,701 | | | 7,020 | | | 211,620 | | | (18,345) | | |
| Other income (expense), net | | Other income (expense), net | 52 | | | 81 | | | (212) | | | 108 | |
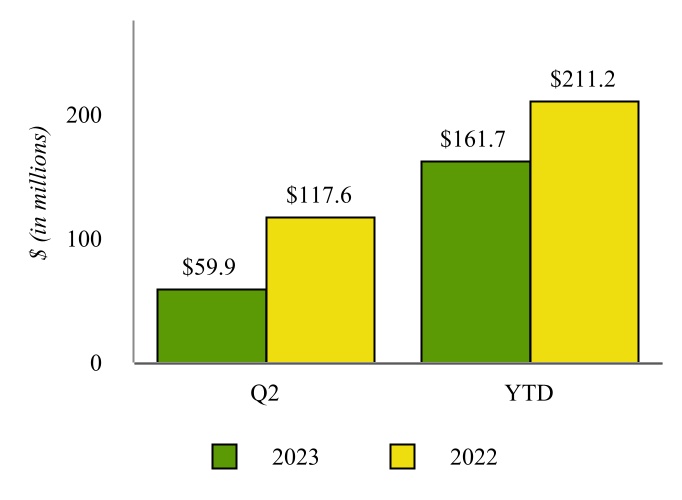
| Income before income tax expense | | Income before income tax expense | 59,859 | | | 117,701 | | | 161,773 | | | 211,620 | |
| Income tax expense | Income tax expense | 119 | | | — | | | 377 | | | 19 | | Income tax expense | 2 | | | 119 | | | 46 | | | 377 | |
| Net income (loss) | $ | 117,582 | | | $ | 7,020 | | | $ | 211,243 | | | $ | (18,364) | | |
| Net income | | Net income | $ | 59,857 | | | $ | 117,582 | | | $ | 161,727 | | | $ | 211,243 | |
| | Basic and diluted earnings (loss) per unit | $ | 11.12 | | | $ | 0.66 | | | $ | 19.90 | | | $ | (1.72) | | |
| Distributions declared per common unit | $ | 2.26 | | | $ | — | | | $ | 7.50 | | | $ | — | | |
| Basic and diluted earnings per common unit | | Basic and diluted earnings per common unit | $ | 5.66 | | | $ | 11.12 | | | $ | 15.30 | | | $ | 19.90 | |
| | | Weighted-average common units outstanding: | Weighted-average common units outstanding: | | Weighted-average common units outstanding: | |
| Basic and Diluted | Basic and Diluted | 10,570 | | | 10,681 | | | 10,617 | | | 10,688 | | Basic and Diluted | 10,570 | | | 10,570 | | | 10,570 | | | 10,617 | |
The accompanying notes are an integral part of these condensed consolidated financial statements.
CVR PARTNERS, LP AND SUBSIDIARIES
CONDENSED CONSOLIDATED STATEMENTS OF PARTNERS’ CAPITAL
(unaudited) | | | Common Units | | General
Partner
Interest | | | Total Partners’ Capital | | Common Units | | General
Partner
Interest | | | Total Partners’ Capital |
| (in thousands, except unit data) | (in thousands, except unit data) | Issued | | Amount | | Total Partners’ Capital | (in thousands, except unit data) | Issued | | Amount | | General
Partner
Interest | | Total Partners’ Capital |
| Balance at December 31, 2021 | 10,681,332 | | | $ | 342,197 | | | $ | 1 | | | | $ | 342,198 | | |
| Balance at December 31, 2022 | | Balance at December 31, 2022 | 10,569,637 | | | $ | 411,810 | | | $ | 1 | | | | $ | 411,811 | |
| Net income | | Net income | — | | | 101,870 | | | — | | | | 101,870 | |
| | Cash distributions to common unitholders - Affiliates | Cash distributions to common unitholders - Affiliates | — | | | (20,394) | | | — | | | | (20,394) | | Cash distributions to common unitholders - Affiliates | — | | | (40,866) | | | — | | | | (40,866) | |
| Cash distributions to common unitholders - Non-affiliates | Cash distributions to common unitholders - Non-affiliates | — | | | (35,576) | | | — | | | | (35,576) | | Cash distributions to common unitholders - Non-affiliates | — | | | (70,115) | | | — | | | | (70,115) | |
| | Repurchase of common units | (111,695) | | | (12,398) | | | — | | | | (12,398) | | |
| Balance at March 31, 2023 | | Balance at March 31, 2023 | 10,569,637 | | | 402,699 | | | 1 | | | | 402,700 | |
| Net income | Net income | — | | | 93,661 | | | — | | | | 93,661 | | Net income | — | | | 59,857 | | | — | | | | 59,857 | |
| Balance at March 31, 2022 | 10,569,637 | | | 367,490 | | | $ | 1 | | | | 367,491 | | |
| | Cash distributions to common unitholders - Affiliates | Cash distributions to common unitholders - Affiliates | — | | | (8,796) | | | — | | | | (8,796) | | Cash distributions to common unitholders - Affiliates | — | | | (40,594) | | | — | | | | (40,594) | |
| Cash distributions to common unitholders - Non-affiliates | Cash distributions to common unitholders - Non-affiliates | — | | | (15,091) | | | — | | | | (15,091) | | Cash distributions to common unitholders - Non-affiliates | — | | | (69,647) | | | — | | | | (69,647) | |
| | Net income | — | | | 117,582 | | | — | | | | 117,582 | | |
| Balance at June 30, 2022 | 10,569,637 | | | $ | 461,185 | | | $ | 1 | | | | $ | 461,186 | | |
| Balance at June 30, 2023 | | Balance at June 30, 2023 | 10,569,637 | | | $ | 352,315 | | | $ | 1 | | | | $ | 352,316 | |
|
| | | | | | | | | | | | | | | | | | | | | | | | | | | |
| Common Units | | General
Partner
Interest | | | | | | Total Partners’ Capital |
| (in thousands, except unit data) | Issued | | Amount | |
| Balance at December 31, 2020 | 10,705,710 | | | $ | 314,240 | | | $ | 1 | | | | | | | $ | 314,241 | |
| | | | | | | | | | | |
| | | | | | | | | | | |
| Repurchase of common units | (24,378) | | | (529) | | | — | | | | | | | (529) | |
| | | | | | | | | | | |
| Net loss | — | | | (25,384) | | | — | | | | | | | (25,384) | |
| Balance at March 31, 2021 | 10,681,332 | | | 288,327 | | | $ | 1 | | | | | | | 288,328 | |
| | | | | | | | | | | |
| | | | | | | | | | | |
| | | | | | | | | | | |
| Net income | — | | | 7,020 | | | — | | | | | | | 7,020 | |
| Balance at June 30, 2021 | 10,681,332 | | | $ | 295,347 | | | $ | 1 | | | | | | | $ | 295,348 | |
| | | | | | | | | | | |
| | | | | | | | | | | |
| | | | | | | | | | | |
| | | | | | | | | | | |
| | | | | | | | | | | |
| | | | | | | | | | | | | | | | | | | | | | | | | | | |
| Common Units | | General
Partner
Interest | | | | | | Total Partners’ Capital |
| (in thousands, except unit data) | Issued | | Amount | |
| Balance at December 31, 2021 | 10,681,332 | | | $ | 342,197 | | | $ | 1 | | | | | | | $ | 342,198 | |
| Net income | — | | | 93,661 | | | — | | | | | | | 93,661 | |
| Repurchase of common units | (111,695) | | | (12,398) | | | — | | | | | | | (12,398) | |
| Cash distributions to common unitholders - Affiliates | — | | | (20,394) | | | — | | | | | | | (20,394) | |
| Cash distributions to common unitholders - Non-affiliates | — | | | (35,576) | | | — | | | | | | | (35,576) | |
| Balance at March 31, 2022 | 10,569,637 | | | 367,490 | | | 1 | | | | | | | 367,491 | |
| Net income | — | | | 117,582 | | | — | | | | | | | 117,582 | |
| | | | | | | | | | | |
| Cash distributions to common unitholders - Affiliates | — | | | (8,796) | | | — | | | | | | | (8,796) | |
| Cash distributions to common unitholders - Non-affiliates | — | | | (15,091) | | | — | | | | | | | (15,091) | |
| Balance at June 30, 2022 | 10,569,637 | | | $ | 461,185 | | | $ | 1 | | | | | | | $ | 461,186 | |
| | | | | | | | | | | |
| | | | | | | | | | | |
| | | | | | | | | | | |
| | | | | | | | | | | |
| | | | | | | | | | | |
The accompanying notes are an integral part of these condensed consolidated financial statements.
CVR PARTNERS, LP AND SUBSIDIARIES
CONDENSED CONSOLIDATED STATEMENTS OF CASH FLOWS
(unaudited) | | | Six Months Ended June 30, | | Six Months Ended June 30, |
| (in thousands) | (in thousands) | 2022 | | 2021 | (in thousands) | 2023 | | 2022 |
| Cash flows from operating activities: | Cash flows from operating activities: | | | | Cash flows from operating activities: | | | |
| Net income (loss) | $ | 211,243 | | | $ | (18,364) | | |
| Adjustments to reconcile net income (loss) to net cash provided by operating activities: | |
| Net income | | Net income | $ | 161,727 | | | $ | 211,243 | |
| Adjustments to reconcile net income to net cash provided by operating activities: | | Adjustments to reconcile net income to net cash provided by operating activities: |
| Depreciation and amortization | Depreciation and amortization | 40,686 | | | 35,242 | | Depreciation and amortization | 34,965 | | | 40,686 | |
| | Share-based compensation | Share-based compensation | 11,353 | | | 9,971 | | Share-based compensation | 4,136 | | | 11,353 | |
| Loss on extinguishment of debt | Loss on extinguishment of debt | 628 | | | 7,763 | | Loss on extinguishment of debt | — | | | 628 | |
| Other adjustments | Other adjustments | 958 | | | 2,808 | | Other adjustments | 752 | | | 958 | |
| Change in assets and liabilities: | Change in assets and liabilities: | | Change in assets and liabilities: | |
| Current assets and liabilities | Current assets and liabilities | (48,892) | | | (15,852) | | Current assets and liabilities | (10,704) | | | (48,892) | |
| Non-current assets and liabilities | Non-current assets and liabilities | (365) | | | 1,411 | | Non-current assets and liabilities | 411 | | | (365) | |
| Net cash provided by operating activities | Net cash provided by operating activities | 215,611 | | | 22,979 | | Net cash provided by operating activities | 191,287 | | | 215,611 | |
| Cash flows from investing activities: | Cash flows from investing activities: | | | | Cash flows from investing activities: | | | |
| Capital expenditures | Capital expenditures | (13,771) | | | (5,386) | | Capital expenditures | (7,591) | | | (13,771) | |
| Proceeds from sale of assets | Proceeds from sale of assets | 41 | | | 42 | | Proceeds from sale of assets | — | | | 41 | |
| Net cash used in investing activities | (13,730) | | | (5,344) | | |
| Return of equity method investment | | Return of equity method investment | 19,885 | | | — | |
| Net cash provided by (used in) investing activities | | Net cash provided by (used in) investing activities | 12,294 | | | (13,730) | |
| Cash flows from financing activities: | Cash flows from financing activities: | | | | Cash flows from financing activities: | | | |
| Repurchase of common units | Repurchase of common units | (12,398) | | | (529) | | Repurchase of common units | — | | | (12,398) | |
| Proceeds from issuance of senior secured notes | — | | | 550,000 | | |
| | Principal payments on senior secured notes | Principal payments on senior secured notes | (65,000) | | | (552,240) | | Principal payments on senior secured notes | — | | | (65,000) | |
| | Cash distributions to common unitholders - Affiliates | Cash distributions to common unitholders - Affiliates | (29,190) | | | — | | Cash distributions to common unitholders - Affiliates | (81,460) | | | (29,190) | |
| Cash distributions to common unitholders - Non-affiliates | Cash distributions to common unitholders - Non-affiliates | (50,667) | | | — | | Cash distributions to common unitholders - Non-affiliates | (139,762) | | | (50,667) | |
| Payment of deferred financing costs | Payment of deferred financing costs | (830) | | | (2,554) | | Payment of deferred financing costs | — | | | (830) | |
| Other financing activities | Other financing activities | — | | | (52) | | Other financing activities | 1 | | | — | |
| Net cash used in financing activities | Net cash used in financing activities | (158,085) | | | (5,375) | | Net cash used in financing activities | (221,221) | | | (158,085) | |
| Net increase in cash and cash equivalents | 43,796 | | | 12,260 | | |
| Net (decrease) increase in cash and cash equivalents | | Net (decrease) increase in cash and cash equivalents | (17,640) | | | 43,796 | |
| Cash and cash equivalents, beginning of period | Cash and cash equivalents, beginning of period | 112,516 | | | 30,559 | | Cash and cash equivalents, beginning of period | 86,339 | | | 112,516 | |
| Cash and cash equivalents, end of period | Cash and cash equivalents, end of period | $ | 156,312 | | | $ | 42,819 | | Cash and cash equivalents, end of period | $ | 68,699 | | | $ | 156,312 | |
|
The accompanying notes are an integral part of these condensed consolidated financial statements.
NOTES TO THE CONDENSED CONSOLIDATED FINANCIAL STATEMENTS
(unaudited)
(1) Organization and Nature of Business
CVR Partners, LP (“CVR Partners” or the “Partnership”) is a Delaware limited partnership formed by CVR Energy, Inc. (together with its subsidiaries, but excluding the Partnership and its subsidiaries, “CVR Energy”) to own, operate and grow its nitrogen fertilizer business. The Partnership produces nitrogen fertilizer products at 2two manufacturing facilities, one located in Coffeyville, Kansas operated by our wholly owned subsidiary, Coffeyville Resources Nitrogen Fertilizers, LLC (“CRNF”) (the “Coffeyville Facility”) and one located in East Dubuque, Illinois operated by our wholly owned subsidiary, East Dubuque Nitrogen Fertilizers, LLC (“EDNF”) (the “East Dubuque Facility”). Both facilities manufacture ammonia and are able to further upgrade such ammonia to other nitrogen fertilizer products, principally urea ammonium nitrate (“UAN”). Nitrogen fertilizer is used by farmers to improve the yield and quality of their crops, primarily corn and wheat. The Partnership’s products are sold on a wholesale basis in the United States of America. As used in these financial statements, references to CVR Partners, the Partnership, “we”, “us”, and “our” may refer to consolidated subsidiaries of CVR Partners or one or both of the facilities, as the context may require.
Interest Holders
As of June 30, 2022,2023, public common unitholders held approximately 63% of the Partnership’s outstanding limited partner interests; CVR Services, LLC (“CVR Services”), a wholly ownedwholly-owned subsidiary of CVR Energy, held the remaining approximately 37% of the Partnership’s outstanding limited partner interests; and CVR GP, LLC (“CVR GP” or the “general partner”), a wholly ownedwholly-owned subsidiary of CVR Energy, held 100% of the Partnership’s general partner interest. As of June 30, 2022,2023, Icahn Enterprises L.P. (“IEP”) and its affiliates owned approximately 71% of the common stock of CVR Energy.
Unit Repurchase Program
On May 6, 2020, the board of directors of the Partnership’s general partner (the “Board”), on behalf of the Partnership, authorized a unit repurchase program (the “Unit Repurchase Program”), which was increased on February 22, 2021. The Unit Repurchase Program, as increased, authorized the Partnership to repurchase up to $20 million of the Partnership’s common units. During the three and six months ended June 30, 2023 and the three months ended June 30, 2022, and 2021, the Partnership did not repurchase any common units. During the six months ended June 30, 2022, and 2021, the Partnership repurchased 111,695 and 24,378 common units respectively, on the open market in accordance with a repurchase agreement under Rules 10b5-1 and 10b-18 of the Securities Exchange Act of 1934, as amended, at a cost of $12.4 million, and $0.5 million, respectively, exclusive of transaction costs, or an average price of $110.98 and $21.69 per common unit, respectively.unit. As of June 30, 2022,2023, the Partnership, considering all repurchases made since inception of the Unit Repurchase Program, had a 0minalnominal amount in authority remaining under the Unit Repurchase Program. This Unit Repurchase Program does not obligate the Partnership to repurchasepurchase any common units and may be cancelled, modified, or terminated by the Board at any time.
Management and Operations
The Partnership, including CVR GP, is managed by a combination of the Board, the general partner’s executive officers, CVR Services (as sole member of the general partner), and certain officers of CVR Energy and its subsidiaries, pursuant to the Partnership Agreement, as well as a number of agreements among the Partnership, CVR GP, CVR Energy, and certain of their respective subsidiaries, including a services agreement. See Part II, Item 8 of CVR Partners’ Annual Report on Form 10-K for the year ended December 31, 20212022 (the “2021“2022 Form 10-K”) for further discussion. Common unitholders have limited voting rights on matters affecting the Partnership and have no right to elect the general partner’s directors or officers, whether on an annual or continuing basis or otherwise.
Section 45Q Transaction
Certain carbon oxide capture and sequestration activities conducted at or in connection with the Coffeyville Facility qualify under the Internal Revenue Service (“IRS”) safe harbor described in Revenue Procedure 2020-12 for certain tax credits available to joint ventures under Section 45Q of the Internal Revenue Code of 1986, as amended (“Section 45Q Credits”). In January 2023, CVR Partners and its subsidiary, CRNF, entered into a series of agreements with CapturePoint LLC, an unaffiliated Texas limited liability company, and certain unaffiliated third-party investors intended to qualify under the IRS safe harbor, described in Revenue Procedure 2020-12, for certain joint ventures that are eligible to claim Section 45Q Credits and allow us to monetize Section 45Q Credits we expect to generate from January 6, 2023 until March 31, 2030 (the “45Q Transaction”). Among other items, the 45Q Transaction resulted in the creation of CVR-CapturePoint Parent LLC (“CVRP
NOTES TO THE CONDENSED CONSOLIDATED FINANCIAL STATEMENTS
(unaudited)
JV”), which was accounted for by the Partnership as an equity-method investment. See Note 5 (“Equity Method Investment”) for further discussion. In January 2023, we received an initial distribution, net of expenses, of approximately $18.1 million and could receive up to an additional $60.0 million in payments through March 31, 2030, if certain carbon oxide capture and sequestration milestones are met, subject to the terms of the applicable agreements. The foregoing description of the applicable agreements does not purport to be complete and is qualified in its entirety by the terms of the relevant agreements, which were filed with the Partnership’s quarterly report on Form 10-Q for the period ended March 31, 2023.
(2) Basis of Presentation
The accompanying condensed consolidated financial statements, have been prepared in accordance with accounting principles generally accepted in the United States of America (“GAAP”) and in accordance with the rules and regulations of the Securities and Exchange Commission (“SEC”). These, include the accounts of CVR Partners and its wholly-owned subsidiaries. All intercompany accounts and transactions have been eliminated. Certain notes and other information have been condensed or omitted from these condensed consolidated financial statements. Therefore, these condensed consolidated financial statements should be read in conjunction with the December 31, 20212022 audited consolidated financial statements and notes thereto included in the 20212022 Form 10-K.
NOTES TO THE CONDENSED CONSOLIDATED FINANCIAL STATEMENTS
(unaudited)
In the opinion of the Partnership’s management, the accompanying condensed consolidated financial statements reflect all adjustments that are necessary for fair presentation of the financial position and results of operations of the Partnership for the periods presented. Such adjustments are of a normal recurring nature, unless otherwise disclosed.
Certain reclassifications have been made within theThe condensed consolidated financial statements for prior periods to conform with current presentation.
The preparation of the condensed consolidated financial statementsare prepared in conformity with GAAP, which requires management to make certain estimates and assumptions that affect the reported amounts and disclosure of assets and liabilities at the date of the financial statements and the reported amounts of revenues and expenses andduring the disclosure of contingent assets and liabilities.reporting period. Actual results could differ from those estimates. Results of operations and cash flows for the interim periods presented are not necessarily indicative of the results that will be realized for the year ending December 31, 20222023 or any other interim or annual period.
(3) Recent Accounting Pronouncements
Recent Accounting Pronouncements - New Accounting Standards Issued But Not Yet Implemented
In March 2020, the Financial Accounting Standards Board (“FASB”) issued Accounting Standard Update (“ASU”) 2020-04, Reference Rate Reform (Topic 848) - Facilitation of the Effects of Reference Rate Reform on Financial Reporting, which provides optional guidance to ease the potential burden in accounting for (or recognizing the effects of) reference rate reform on financial reporting. This guidance applies to contracts, hedging relationships and other transactions affected by the discontinuation of the London Interbank Offered Rate (“LIBOR”) and other interbank offered rates. The guidance is effective beginning on March 12, 2020 through the sunset date of Topic 848, which is currently expected to occur on December 31, 2022. The Partnership has not utilized any of the optional expedients or exceptions available under this guidance and will continue to assess whether this guidance is applicable throughout the effective period.
(4) Inventories
Inventories consisted of the following:
| | (in thousands) | (in thousands) | June 30, 2022 | | December 31, 2021 | (in thousands) | June 30, 2023 | | December 31, 2022 |
| Finished goods | Finished goods | $ | 38,930 | | | $ | 17,141 | | Finished goods | $ | 29,511 | | | $ | 28,630 | |
| Raw materials | Raw materials | 1,803 | | | 833 | | Raw materials | 2,025 | | | 3,116 | |
| Parts, supplies and other | Parts, supplies and other | 44,669 | | | 34,296 | | Parts, supplies and other | 47,338 | | | 45,772 | |
| Total inventories | Total inventories | $ | 85,402 | | | $ | 52,270 | | Total inventories | $ | 78,874 | | | $ | 77,518 | |
(5)(4) Property, Plant and Equipment
Property, plant and equipment consisted of the following:
| | (in thousands) | (in thousands) | June 30, 2022 | | December 31, 2021 | (in thousands) | June 30, 2023 | | December 31, 2022 |
| Machinery and equipment | Machinery and equipment | $ | 1,413,757 | | | $ | 1,410,203 | | Machinery and equipment | $ | 1,449,208 | | | $ | 1,432,875 | |
| Buildings and improvements | Buildings and improvements | 17,598 | | | 17,598 | | Buildings and improvements | 18,021 | | | 17,461 | |
| Automotive equipment | Automotive equipment | 16,403 | | | 16,433 | | Automotive equipment | 16,377 | | | 16,377 | |
| Land and improvements | Land and improvements | 14,604 | | | 14,199 | | Land and improvements | 14,736 | | | 14,604 | |
| | Construction in progress | Construction in progress | 23,889 | | | 14,167 | | Construction in progress | 11,870 | | | 7,858 | |
| Other | Other | 1,914 | | | 2,221 | | Other | 2,799 | | | 3,035 | |
| | 1,488,165 | | | 1,474,821 | | | 1,513,011 | | | 1,492,210 | |
| Less: Accumulated depreciation and amortization | Less: Accumulated depreciation and amortization | (667,225) | | | (624,359) | | Less: Accumulated depreciation and amortization | (729,450) | | | (681,216) | |
| Total property, plant and equipment, net | Total property, plant and equipment, net | $ | 820,940 | | | $ | 850,462 | | Total property, plant and equipment, net | $ | 783,561 | | | $ | 810,994 | |
During the six months ended June 30, 2022,2023, the Partnership haddid not identifiedidentify the existence of an impairment indicator for our long-lived asset groups as outlined under the FASB Accounting Standards Codification (“ASC”) Topic 360, Property, Plant, and Equipment.
NOTES TO THE CONDENSED CONSOLIDATED FINANCIAL STATEMENTS
(unaudited)
Plant, and Equipment. Depreciation and amortization expense related to property, plant and equipment was $19.6 million and $34.6 million for the three and six months ended June 30, 2023, respectively, and $21.0 million and $40.3 million for the three and six months ended June 30, 2022, respectively.
(5) Equity Method Investment
As part of the 45Q Transaction, the Partnership received a 50% ownership interest in CVRP JV in connection with a modification to a carbon oxide contract (“CO Contract”) with a customer. The Partnership applied the variable interest entity (“VIE”) model under FASB ASC Topic 810, Consolidation, to its variable interest in CVRP JV and determined that CVRP JV is a VIE. While the Partnership concluded it is not the primary beneficiary of CVRP JV, it does have significant influence over CVRP JV’s operating and financial policies and, therefore, applied the equity method of accounting for its investment in CVRP JV.
The Partnership valued the equity interest received using a combination of the market approach and the discounted cash flow methodology with key inputs including the discount rate, contractual and expected future cash flows, and market multiples. The Partnership determined the estimated fair value of the consideration received to be $46.0 million, which was a non-recurring Level 3 measurement, as defined by FASB ASC Topic 820, Fair Value Measurements, based on the use of the Partnership’s own assumptions described above. There were no transfers into or out of Level 3 during the three and six months ended June 30, 2023.
The Partnership deferred the recognition of the noncash consideration received and expects to recognize such revenue as the performance obligation associated with the CO Contract is satisfied. Refer to Note 9 (“Revenue”) for further discussion. The Partnership has elected to record its share of the earnings or loss of CVRP JV one quarter in arrears. Distributions received from CVRP JV will reduce the Partnership’s equity method investment and will be recorded in the period they are received. The investment in CVRP JV is presented within Other long-term assets on our condensed consolidated financial statements.
| | | | | |
| (in thousands) | CVRP JV |
| Balance at inception | $ | 46,000 | |
Cash distributions (1) | (19,000) | |
| Cash contributions | 2 | |
| |
| Balance at March 31, 2023 | 27,002 | |
| Cash distributions | (885) | |
| Equity loss | (2) | |
| Balance at June 30, 2023 | $ | 26,115 | |
(1)Of this amount, approximately $0.9 million related to incremental costs associated with obtaining the CO contract were capitalized and included in Prepaid expenses and other current assets and Other long-term assets in our condensed consolidated financial statements.
(6) Leases
Lease Overview
We lease railcars and certain facilities to support the Partnership’s operations. Most of our leases include 1one or more renewal options to extend the lease term, from one to 20 years or more, which can be exercised at our sole discretion. Certain leases also include options to purchase the leased property. The depreciable life of assets and leasehold improvements are limited by the expected lease term, unless there is a transfer of title or purchase option reasonablyAdditionally, certain of exercise. Certain of our lease agreements include rental payments, which are adjusted periodically for factors such as inflation. Our lease agreements do not contain any material residual value guarantees or material restrictive covenants. Additionally,Furthermore, we do not have any material lessor or sub-leasing arrangements.
NOTES TO THE CONDENSED CONSOLIDATED FINANCIAL STATEMENTS
(unaudited)
Balance Sheet Summary as of June 30, 20222023 and December 31, 20212022
The following tables summarizetable summarizes the right-of-use (“ROU”) asset and lease liability balances for the Partnership’s operating and finance leases at June 30, 20222023 and December 31, 2021:2022. There were no finance lease balances at June 30, 2023 and December 31, 2022.
| | | June 30, 2022 | | December 31, 2021 | | | | | | | | | | | | | |
| (in thousands) | (in thousands) | Operating Leases | | Finance Leases | | Operating Leases | | Finance Leases | (in thousands) | June 30, 2023 | | | December 31, 2022 | |
| ROU asset, net | ROU asset, net | | | | | | | | ROU asset, net | | | | | |
| | Railcars | Railcars | $ | 4,152 | | | $ | — | | | $ | 4,570 | | | $ | — | | Railcars | $ | 8,915 | | | | $ | 10,449 | | |
| Real estate and other | Real estate and other | 2,565 | | | — | | | 2,755 | | | 34 | | Real estate and other | 2,200 | | | | 2,370 | | |
| Lease liability | Lease liability | | Lease liability | | | | |
| | Railcars | Railcars | 4,152 | | | — | | | 4,570 | | | — | | Railcars | 8,915 | | | | 10,449 | | |
| Real estate and other | Real estate and other | 562 | | | — | | | 665 | | | — | | Real estate and other | 373 | | | | 456 | | |
Lease Expense Summary for the Three and Six Months Ended June 30, 20222023 and 20212022
We recognize operating lease expense on a straight-line basis over the lease term and short-term lease expense within Direct operating expenses (exclusive of depreciation and amortization). and Cost of materials and other and finance lease expense on a straight-line basis over the lease term within Depreciation and amortization. For the three and six months ended June 30, 20222023 and 2021,2022, we recognized lease expense comprised of the following components:
| | | Three Months Ended
June 30, | | Six Months Ended
June 30, | | Three Months Ended
June 30, | | Six Months Ended
June 30, |
| (in thousands) | (in thousands) | 2022 | | 2021 | | 2022 | | 2021 | (in thousands) | 2023 | | 2022 | | 2023 | | 2022 |
| Operating lease expense | Operating lease expense | $ | 1,098 | | | $ | 1,004 | | | $ | 2,157 | | | $ | 1,920 | | Operating lease expense | $ | 1,143 | | | $ | 1,098 | | | $ | 2,366 | | | $ | 2,157 | |
| Finance lease expense: | Finance lease expense: | | Finance lease expense: | |
| Amortization of ROU asset | Amortization of ROU asset | 8 | | | 29 | | | 34 | | | 51 | | Amortization of ROU asset | — | | | 8 | | | — | | | 34 | |
| Interest expense on lease liability | — | | | — | | | — | | | 1 | | |
| | Short-term lease expense | Short-term lease expense | 767 | | | 430 | | | 1,532 | | | 590 | | Short-term lease expense | 619 | | | 767 | | | 1,269 | | | 1,532 | |
Lease Terms and Discount Rates
The following outlines the remaining lease terms and discount rates used in the measurement of the Partnership’s ROU assets and lease liabilities at June 30, 20222023 and December 31, 2021:2022:
| | | June 30, 2022 | | December 31, 2021 | | | | | | | | | | | | | |
| | Operating Leases | | Finance Leases | | Operating Leases | | Finance Leases | | June 30, 2023 | | | December 31, 2022 | |
| Weighted-average remaining lease term | Weighted-average remaining lease term | 2.6 years | | 0.0 years | | 2.1 years | | 0.0 years | Weighted-average remaining lease term | 3.9 years | | | 4.3 years | |
| Weighted-average discount rate | Weighted-average discount rate | 4.8 | % | | — | % | | 5.1 | % | | — | % | Weighted-average discount rate | 5.9 | % | | | 5.5 | % | |
NOTES TO THE CONDENSED CONSOLIDATED FINANCIAL STATEMENTS
(unaudited)
Maturities of Lease Liabilities
The following summarizes the remaining minimum operating lease payments through maturity of the Partnership’s liabilities at June 30, 2022. There were no finance lease payments remaining at 2023:
| | | | | | | |
| (in thousands) | Operating Leases | | |
| Remainder of 2023 | $ | 1,582 | | | |
| 2024 | 2,730 | | | |
| 2025 | 2,302 | | | |
| 2026 | 2,042 | | | |
| 2027 | 1,756 | | | |
| Thereafter | — | | | |
| Total lease payments | 10,412 | | | |
| Less: imputed interest | (1,124) | | | |
| Total lease liability | $ | 9,288 | | | |
| | | | | | | |
| (in thousands) | Operating Leases | | |
| Remainder of 2022 | $ | 1,590 | | | |
| 2023 | 1,621 | | | |
| 2024 | 937 | | | |
| 2025 | 522 | | | |
| 2026 | 261 | | | |
| Thereafter | 65 | | | |
| Total lease payments | 4,996 | | | |
| Less: imputed interest | (282) | | | |
| Total lease liability | $ | 4,714 | | | |
NOTES TO THE CONDENSED CONSOLIDATED FINANCIAL STATEMENTS
(unaudited)
The Partnership has entered into lease commitments that have not yet commenced as follows:
•On February 21, 2022, CRNF entered into the First Amendment to the On-Site Product Supply Agreement with Messer LLC (“Messer”), which amended the July 31, 2020 On-Site Product Supply Agreement (as amended, the “Messer Agreement”). Under the Messer Agreement, among other obligations, Messer is obligated to supply oxygen and make certain capital improvements during the term of the Messer Agreement, and CRNF is obligated to take as available and pay for oxygen nitrogen, and compressed dry air from Messer’s facility. This arrangement for CRNF’s purchase of oxygen nitrogen, and dry air from Messer does not meet the definition of a lease under FASB ASC Topic 842, Leases (“Topic 842”), as CRNF does not expect to receive substantially all of the output, which includes oxygen, nitrogen, and compressed air, of Messer’s on-site production from its air separation unit over the life of the Messer Agreement. The Messer Agreement also obligates Messer to install a new oxygen storage vessel, related equipment and infrastructure (“Oxygen Storage Vessel” or “Vessel”) to be used solely by the Coffeyville Facility. The arrangement for the use of the Oxygen Storage Vessel meets the definition of a lease under Topic 842, as CRNF will receive all output associated with the Vessel. Based on terms outlined in the Messer Agreement, the Partnership expects the lease of the Oxygen Storage Vessel to be classified as a financing lease with an estimated amount within the range of approximately$20 million to $25 million being capitalized upon lease commencement when the Vessel is placed in service.service, which is currently expected to occur within the next 12 months.
(7) Other Current Liabilities
Other current liabilities consisted of the following:
| | (in thousands) | (in thousands) | June 30, 2022 | | December 31, 2021 | (in thousands) | June 30, 2023 | | December 31, 2022 |
| Share-based compensation | Share-based compensation | $ | 10,605 | | | $ | 5,888 | | Share-based compensation | $ | 10,993 | | | $ | 9,231 | |
| Personnel accruals | Personnel accruals | 5,915 | | | 7,920 | | Personnel accruals | 5,487 | | | 7,539 | |
| Sales incentives | Sales incentives | 3,681 | | | 1,555 | | Sales incentives | 3,139 | | | 1,772 | |
| Operating lease liabilities | | Operating lease liabilities | 2,519 | | | 2,931 | |
| Accrued insurance | Accrued insurance | 2,969 | | | 718 | | Accrued insurance | 1,626 | | | 2,283 | |
| Operating lease liabilities | 2,387 | | | 3,052 | | |
| Accrued taxes other than income taxes | Accrued taxes other than income taxes | 1,871 | | | 1,744 | | Accrued taxes other than income taxes | 1,437 | | | 1,789 | |
| Accrued interest | Accrued interest | 1,404 | | | 1,654 | | Accrued interest | 1,404 | | | 1,404 | |
| Other accrued expenses and liabilities | Other accrued expenses and liabilities | 1,128 | | | 1,870 | | Other accrued expenses and liabilities | 1,078 | | | 768 | |
| Total other current liabilities | Total other current liabilities | $ | 29,960 | | | $ | 24,401 | | Total other current liabilities | $ | 27,683 | | | $ | 27,717 | |
(8) Long-Term Debt
Long-term debt consists of the following:
| | | | | | | | | | | |
| (in thousands) | June 30, 2023 | | December 31, 2022 |
6.125% Senior Secured Notes, due June 2028 (1) | $ | 550,000 | | | $ | 550,000 | |
| | | |
| Unamortized discount and debt issuance costs | (2,950) | | | (3,200) | |
| Total long-term debt | $ | 547,050 | | | $ | 546,800 | |
| | | |
| | | |
(1)The estimated fair value of the 6.125% Senior Secured Notes, due June 2028 (the “2028 Notes”) was approximately $478.4 million and $493.3 million as of June 30, 2023 and December 31, 2022, respectively. These estimates of fair value are a Level 2 measurement, as defined by FASB ASC Topic 820, Fair Value Measurements, as they were determined by quotations obtained from a broker-dealer who makes a market in these and similar securities.
Credit Agreements
| | | | | | | | | | | | | | | | | | | | | | | | | | | | | |
| | | | | | | | | |
| (in thousands) | Total Available Borrowing Capacity | | Amount Borrowed as of June 30, 2023 | | Outstanding Letters of Credit | | Available Capacity as of June 30, 2023 | | Maturity Date |
| ABL Credit Facility | $ | 35,000 | | | $ | — | | | $ | — | | | $ | 35,000 | | | September 30, 2024 |
NOTES TO THE CONDENSED CONSOLIDATED FINANCIAL STATEMENTS
(unaudited)
(8) Long-Term Debt
Long-term debt consists of the following:
| | | | | | | | | | | |
| (in thousands) | June 30, 2022 | | December 31, 2021 |
9.25% Senior Secured Notes, due June 2023 (1) | $ | — | | | $ | 65,000 | |
6.125% Senior Secured Notes, due June 2028 (1) | 550,000 | | | 550,000 | |
| | | |
Unamortized discount and debt issuance costs (2) | (3,442) | | | (4,358) | |
| Total long-term debt | $ | 546,558 | | | $ | 610,642 | |
| | | |
| | | |
(1)The $65 million outstanding balance of the 9.25% Senior Secured Notes, due June 2023 (the “2023 Notes”) was paid in full on February 22, 2022 at par, plus accrued and unpaid interest. The estimated fair value of the 2023 Notes was approximately $65.1 million as of December 31, 2021. The estimated fair value of the 6.125% Senior Secured Notes, due June 2028 (the “2028 Notes”) was approximately $486.6 million and $580.3 million as of June 30, 2022 and December 31, 2021, respectively. These estimates of fair value are a Level 2 measurement, as defined by ASC Topic 820 - Fair Value Measurements and Disclosures, as they were determined by quotations obtained from a broker-dealer who makes a market in these and similar securities.
(2)For the three and six months ended June 30, 2022, amortization of the discount on debt and amortization of deferred financing costs reported as Interest expense, net totaled approximately $0.1 million and $0.3 million, respectively, and for the three and six months ended June 30, 2021, Interest expense, net totaled approximately $1.0 million and $2.0 million, respectively.
Credit Agreements
| | | | | | | | | | | | | | | | | | | | | | | | | | | | | |
| | | | | | | | | |
| (in thousands) | Total Available Borrowing Capacity | | Amount Borrowed as of June 30, 2022 | | Outstanding Letters of Credit | | Available Capacity as of June 30, 2022 | | Maturity Date |
ABL Credit Facility (1) (2) | $ | 35,000 | | | $ | — | | | $ | — | | | $ | 35,000 | | | September 30, 2024 |
(1)Beginning September 30, 2021, loans under the Partnership’s ABL Credit Facility bear interest at an annual rate equal to, at the option of the borrowers, (i) (a) 1.615% plus the daily simple Secured Overnight Financing Rate (“SOFR”) or (b) 0.615% plus a base rate, if our quarterly excess availability is greater than or equal to 75%, (ii) (a) 1.865% plus SOFR or (b) 0.865% plus a base rate, if our quarterly excess availability is greater than or equal to 50% but less than 75%, or (iii) (a) 2.115% plus SOFR or (b) 1.115% plus a base rate, otherwise.
(2)Amortization expense was $0.1 million and $0.1 million for the three and six months ended June 30, 2022, respectively, and $0.1 million and $0.2 million for the three and six months ended June 30, 2021, respectively.
9.25%Senior Secured Notes due June 2023
On February 22, 2022, the Partnership redeemed all of the outstanding 2023 Notes at par and settled accrued and unpaid interest of approximately $1.1 million through the date of redemption. As a result of this transaction, the Partnership recognized a loss on extinguishment of debt of $0.6 million, which includes the write-off of unamortized deferred financing costs and discount of $0.2 million and $0.4 million, respectively.
Covenant Compliance
The Partnership and its subsidiaries were in compliance with all covenants under their respective debt instruments as of June 30, 2022.2023.
(9) Revenue
The following table presents the Partnership’s revenue, disaggregated by major products:
| | | | | | | | | | | | | | | | | | | | | | | |
| Three Months Ended
June 30, | | Six Months Ended
June 30, |
| (in thousands) | 2023 | | 2022 | | 2023 | | 2022 |
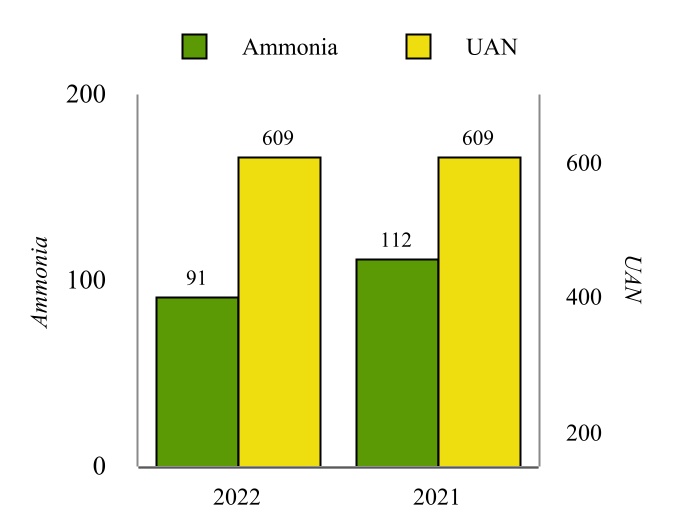
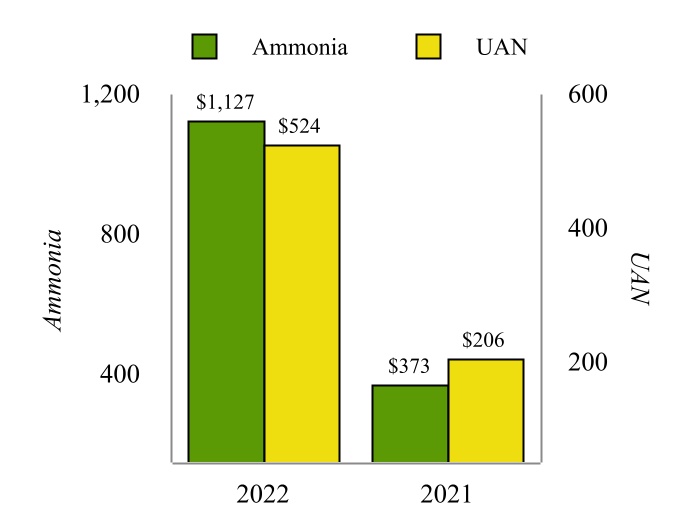
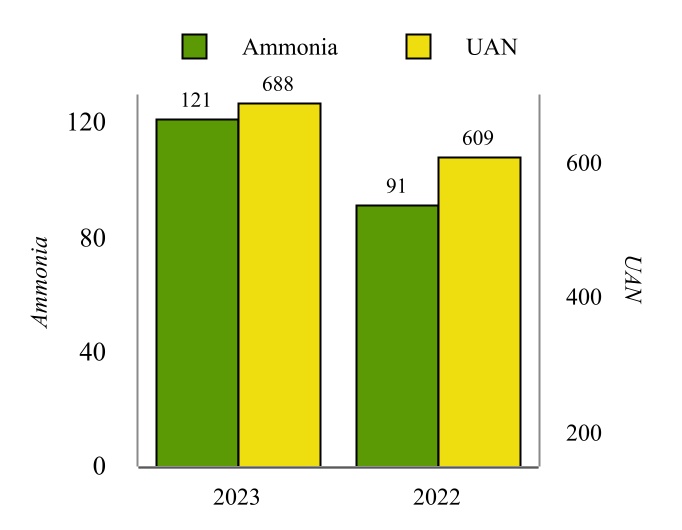
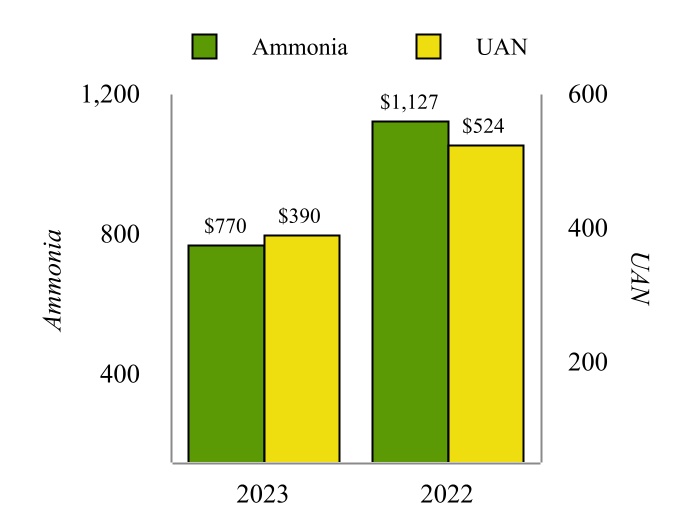
| Ammonia | $ | 56,032 | | | $ | 60,942 | | | $ | 93,532 | | | $ | 102,953 | |
| UAN | 103,773 | | | 159,399 | | | 268,115 | | | 319,006 | |
| Urea products | 7,201 | | | 10,544 | | | 15,371 | | | 19,767 | |
| Net sales, exclusive of freight and other | 167,006 | | | 230,885 | | | 377,018 | | | 441,726 | |
Freight revenue (1) | 10,910 | | | 9,856 | | | 21,846 | | | 19,071 | |
Other revenue (2) | 5,089 | | | 3,259 | | | 10,402 | | | 6,077 | |
| Total revenue | $ | 183,005 | | | $ | 244,000 | | | $ | 409,266 | | | $ | 466,874 | |
(1)Freight revenue recognized by the Partnership represents the pass-through finished goods delivery costs incurred prior to customer acceptance and is reimbursed by customers. An offsetting expense for freight is included in Cost of materials and other.
(2)Includes revenue from (i) nitric acid sales and (ii) carbon oxide sales, including sales in connection with the 45Q Transaction and the noncash consideration received, which is recognized as the performance obligation associated with the CO Contract is satisfied over its term of seven years, three months. Revenue from the CO Contract is recognized over time based on carbon oxide volumes measured at delivery.
Remaining Performance Obligations
We have spot and term contracts with customers and the transaction prices are either fixed or based on market indices (variable consideration). We do not disclose remaining performance obligations for contracts that have terms of one year or less and for contracts where the variable consideration was entirely allocated to an unsatisfied performance obligation.
As of June 30, 2023, the Partnership had approximately $2.4 million of remaining performance obligations for contracts with an original expected duration of more than one year. The Partnership expects to recognize approximately $2.2 million of these performance obligations as revenue by the end of 2023 and the remaining balance during 2024.
NOTES TO THE CONDENSED CONSOLIDATED FINANCIAL STATEMENTS
(unaudited)
(9) Revenue
The following table presents the Partnership’s revenue, disaggregated by major product:
| | | | | | | | | | | | | | | | | | | | | | | |
| Three Months Ended
June 30, | | Six Months Ended
June 30, |
| (in thousands) | 2022 | | 2021 | | 2022 | | 2021 |
| Ammonia | $ | 60,942 | | | $ | 32,097 | | | $ | 102,953 | | | $ | 41,630 | |
| UAN | 159,399 | | | 87,585 | | | 319,006 | | | 125,647 | |
| Urea products | 10,544 | | | 6,820 | | | 19,767 | | | 11,578 | |
| Net sales, exclusive of freight and other | 230,885 | | | 126,502 | | | 441,726 | | | 178,855 | |
| Freight revenue | 9,856 | | | 8,870 | | | 19,071 | | | 14,985 | |
| Other revenue | 3,259 | | | 2,653 | | | 6,077 | | | 5,105 | |
| Net sales | $ | 244,000 | | | $ | 138,025 | | | $ | 466,874 | | | $ | 198,945 | |
Transaction Price Allocated to Remaining Performance Obligations
As of June 30, 2022, the Partnership had approximately $7.7 million of remaining performance obligations for contracts with an original expected duration of more than one year. The Partnership expects to recognize approximately $3.6 million of these performance obligations as revenue by the end of 2022, an additional $3.9 million in 2023, and the remaining balance thereafter.
Contract Balances
The Partnership’s deferred revenue is a contract liability that primarily relates to nitrogen fertilizer sales contracts requiring customer prepayment prior to product delivery to guarantee a price and supply of nitrogen fertilizer. Deferred revenue is recorded at the point in time in which a prepaid contract is legally enforceable and the associated right to consideration is unconditional prior to transferring product to the customer. An associated receivable is recorded for uncollected prepaid contract amounts. Contracts requiring prepayment are generally short-term in nature and, as discussed above, revenue is recognized at the point in time in which the customer obtains control of the product.
A summary of the deferred revenue activity for the six months ended June 30, 20222023 is presented below:
| | | | | | | |
| (in thousands) | | | |
Balance at December 31, 20212022 | $ | 87,06047,516 | | | |
| Add: | | | |
New prepay contracts entered into during the period(1) | 15,55610,221 | | | |
| Noncash consideration received as part of the 45Q Transaction | 46,000 | | | |
| | | |
| Less: | | | |
| Revenue recognized that was included in the contract liability balance at the beginning of the period | (84,015)(46,215) | | | |
| Revenue recognized related to contracts entered into during the period | (13,668)(9,991) | | | |
| Revenue recognized related to noncash consideration | (3,172) | | | |
| Other changes | (737)(1,210) | | | |
Balance at June 30, 2022Total deferred revenue | 43,149 | | | |
Less: Current portion of deferred revenue | (6,666) | | | |
| Total long-term deferred revenue | $ | 4,19636,483 | | | |
(1) Includes $15.5 million where payment associated with prepaid contracts was collected as of June 30, 2022.
NOTES TO THE CONDENSED CONSOLIDATED FINANCIAL STATEMENTS
(unaudited)
(10) Share-Based Compensation
A summary of compensation expense for the three and six months ended June 30, 20222023 and 20212022 is presented below:
| | | Three Months Ended
June 30, | | Six Months Ended
June 30, | | Three Months Ended
June 30, | | Six Months Ended
June 30, |
| (in thousands) | (in thousands) | 2022 | | 2021 | | 2022 | | 2021 | (in thousands) | 2023 | | 2022 | | 2023 | | 2022 |
| Phantom Unit Awards | Phantom Unit Awards | $ | (2,259) | | | $ | 5,388 | | | $ | 7,653 | | | $ | 8,533 | | Phantom Unit Awards | $ | 1,556 | | | $ | (2,259) | | | $ | 2,464 | | | $ | 7,653 | |
Other Awards (1) | Other Awards (1) | 1,538 | | | 991 | | | 3,700 | | | 1,438 | | Other Awards (1) | 647 | | | 1,538 | | | 1,672 | | | 3,700 | |
| Total share-based compensation expense | Total share-based compensation expense | $ | (721) | | | $ | 6,379 | | | $ | 11,353 | | | $ | 9,971 | | Total share-based compensation expense | $ | 2,203 | | | $ | (721) | | | $ | 4,136 | | | $ | 11,353 | |
(1)Other awards include the allocationallocations, pursuant to the Corporate Master Services Agreement effective January 1, 2020, as amended (the “Corporate MSA”) and the Partnership’s Second Amended and Restated Agreement of Limited Partnership, of compensation expense for certain employees of CVR Energy and its subsidiaries who perform services for the Partnership under the Corporate Master Services Agreement effective January 1, 2020, as amended on April 12, 2022, with certain subsidiaries of CVR Energy (as amended, the “Corporate MSA”) and the Limited Partnership Agreement and participate in equity compensation plans of CVR Energy.
(11) Commitments and Contingencies
There have been no material changes in the Partnership’s commitments and contingencies to those disclosed in the 20212022 Form 10-K. In the ordinary course of business, the Partnership may become party to lawsuits, administrative proceedings, and governmental investigations, including environmental, regulatory, and other matters. The outcome of these matters cannot always be predicted accurately, but the Partnership accrues liabilities for these matters if the Partnership has determined that it is probable a loss has been incurred and the loss can be reasonably estimated. While it is not possible to predict the outcome of such proceedings, if one or more of them were decided against us, the Partnership believes there would be no material impact onto its consolidated financial statements.
The Partnership continues to monitor its contractual arrangements and customer, vendor, and supplier relationships to determine whether and to what extent, if any, the impacts of the COVID-19 pandemic, the Russia-Ukraine conflict, the current global and domestic economic environment, including increasing interest rates and inflation or a potential recession, or ongoing price volatility will impair or excuse the performance of the Partnership or its subsidiaries or their customers, vendors, or suppliers under existing agreements. As of June 30, 2022,2023, the Partnership had not experienced a material financial impact from any actual or threatened impairment of or excuse in its or others’ performance under such agreements.
(12) Supplemental Cash Flow Information
Cash flows related to income taxes, interest, leases, and capital expenditures and deferred financing costs included in accounts payable are as follows:
| | | | | | | | | | | |
| Six Months Ended
June 30, |
| (in thousands) | 2022 | | 2021 |
| Supplemental disclosures: | | | |
| Cash paid for interest | $ | 18,113 | | | $ | 32,872 | |
| Cash paid for income taxes, net of refunds | 27 | | | 31 | |
| Cash paid for amounts included in the measurement of lease liabilities: | | | |
| Operating cash flows from operating leases | 1,790 | | | 1,832 | |
| Operating cash flows from finance leases | — | | | 1 | |
| Financing cash flows from finance leases | — | | | 52 | |
| Non-cash investing and financing activities: | | | |
| Change in capital expenditures included in accounts payable | (109) | | | 1,470 | |
| | | |
NOTES TO THE CONDENSED CONSOLIDATED FINANCIAL STATEMENTS
(unaudited)
45Q Transaction
Under the agreements entered into in connection with the 45Q Transaction, the Partnership’s subsidiary, CRNF, is obligated to meet certain minimum quantities of carbon oxide supply each year during the term of the agreement and is subject to fees of up to $15.0 million per year (reduced pro rata for partial years) to the unaffiliated third-party investors, subject to an overall $45.0 million cap, if these minimum quantities are not delivered. The Partnership issued a guarantee to the unaffiliated third-party investors and certain affiliates involved in the 45Q Transaction of the payment and performance obligations of CRNF and CVRP JV, which include the aforementioned fees. This guarantee has no impacts on the accounting records of the Partnership unless the parties fail to comply with the terms of the 45Q Transaction contracts.
(12) Supplemental Cash Flow Information
Cash flows related to interest, leases, and capital expenditures included in accounts payable are as follows:
| | | | | | | | | | | |
| Six Months Ended
June 30, |
| (in thousands) | 2023 | | 2022 |
| Supplemental disclosures: | | | |
| Cash paid for interest | $ | 17,069 | | | $ | 18,113 | |
| Cash paid for income taxes, net of refunds | 240 | | | 27 | |
| Cash paid for amounts included in the measurement of lease liabilities: | | | |
| Operating cash flows from operating leases | 1,918 | | | 1,790 | |
| | | |
| | | |
| Non-cash investing and financing activities: | | | |
| Change in capital expenditures included in accounts payable | 2,223 | | | (109) | |
| | | |
(13) Related Party Transactions
Activity associated with the Partnership’s related party arrangements for the three and six months ended June 30, 20222023 and 20212022 is summarized below.below:
Related Party Activity
| | | | | | | | | | | | | | | | | | | | | | | |
| Three Months Ended
June 30, | | Six Months Ended
June 30, |
| (in thousands) | 2022 | | 2021 | | 2022 | | 2021 |
Sales to related parties (1) | $ | 124 | | | $ | 82 | | | $ | 172 | | | $ | 301 | |
Purchases from related parties (2) | 14,590 | | | 9,819 | | | 29,122 | | | 17,823 | |
| | | | | | | | | | | | | | | | | | | | | | | |
| Three Months Ended
June 30, | | Six Months Ended
June 30, |
| (in thousands) | 2023 | | 2022 | | 2023 | | 2022 |
| Sales to related parties: | | | | | | | |
CRRM (1) | $ | 4 | | | $ | 124 | | | $ | 4 | | | $ | 172 | |
CVRP JV (1) | 1,095 | | | — | | | 2,347 | | | — | |
| Purchases from related parties: | | | | | | | |
CRRM (2) | 12,383 | | | 14,590 | | | 27,972 | | | 29,122 | |
| | | | | | | | | | | |
| June 30, 2022 | | December 31, 2021 |
| | | |
Due to related parties (3) | $ | 7,612 | | | $ | 3,580 | |
| | | | | | | | | | | |
| June 30, 2023 | | December 31, 2022 |
Due to related parties (3) | $ | 5,208 | | | $ | 4,518 | |
(1)Sales to related parties, included in Net sales in our condensed consolidated financial statements, consist primarily ofof: (a) sales of feedstocks and services to Coffeyville Resources Refining & Marketing, LLC (“CRRM”) under the Master Service Agreement with CRNF (the “Coffeyville MSA”)., and (b) COsales to CVRP JV and its subsidiaries.
(2)Purchases from related parties, included in Cost of materials and other, Direct operating expenses (exclusive of depreciation and amortization), and Selling, general and administrative expenses in our condensed consolidated financial statements, consist primarily of pet coke and hydrogen purchased from CRRM under the Coffeyville MSA.
(3)Due to related parties, included in Accounts payable to affiliates, consists primarily of amounts payable for feedstocks and other supplies and services provided by CRRM and CVR Services under the Coffeyville MSA and the Corporate MSA.
NOTES TO THE CONDENSED CONSOLIDATED FINANCIAL STATEMENTS
(unaudited)
Distributions to CVR Partners’ Unitholders
Distributions, if any, including the payment, amount, and timing thereof, and the Board’s distribution policy, including the definition of Available Cash, are subject to change at the discretion of the Board. The following table presentstables present quarterly distributions paid by the Partnership to CVR Partners’ unitholders, including amounts paid to CVR Energy, during 2023 and 2022 and 2021.(amounts presented in table below may not add to totals presented due to rounding):
| | | | | | | | | | | | | | | | | | | | | | | | | | | | | | | | |
| | | | | | Distributions Paid (in thousands) |
| Related Period | | Date Paid | | Distribution Per
Common Unit | | Public Unitholders | | CVR Energy | | Total |
| 2021 - 4th Quarter | | March 14, 2022 | | $ | 5.24 | | | $ | 35,576 | | | $ | 20,394 | | | $ | 55,970 | |
| 2022 - 1st Quarter | | May 23, 2022 | | 2.26 | | | 15,091 | | | 8,796 | | | 23,887 | |
| | | | | | | | | | |
| | | | | | | | | | |
| Total 2022 distributions | | $ | 7.50 | | | $ | 50,667 | | | $ | 29,190 | | | $ | 79,857 | |
| | | | | | | | | | | | | | | | | | | | | | | | | | | | | | | | |
| | | | | | Quarterly Distributions Paid (in thousands) |
| Related Period | | Date Paid | | Quarterly Distributions
Per Common Unit | | Public Unitholders | | CVR Energy | | Total |
| 2022 - 4th Quarter | | March 13, 2023 | | $ | 10.50 | | | $ | 70,115 | | | $ | 40,866 | | | $ | 110,981 | |
| 2023 - 1st Quarter | | May 22, 2023 | | 10.43 | | | 69,647 | | | 40,594 | | | 110,241 | |
| | | | | | | | | | |
| Total 2023 quarterly distributions | | $ | 20.93 | | | $ | 139,762 | | | $ | 81,460 | | | $ | 221,222 | |
| | | | | | | | | | | | | | | | | | | | | | | | | | | | | | | | |
| | | | | | | | | | |
| | | | | | Distributions Paid (in thousands) |
| Related Period | | Date Paid | | Distribution Per
Common Unit | | Public Unitholders | | CVR Energy | | Total |
| | | | | | | | | | |
| | | | | | | | | | |
| 2021 - 2nd Quarter | | August 23, 2021 | | $ | 1.72 | | | $ | 11,678 | | | $ | 6,694 | | | $ | 18,372 | |
| 2021 - 3rd Quarter | | November 23, 2021 | | 2.93 | | | 19,893 | | | 11,404 | | | 31,297 | |
| Total 2021 distributions | | $ | 4.65 | | | $ | 31,571 | | | $ | 18,098 | | | $ | 49,669 | |
There were no distributions declared or paid by the Partnership related to the first quarter of 2021 and fourth quarter of 2020. | | | | | | | | | | | | | | | | | | | | | | | | | | | | | | | | |
| | | | | | Quarterly Distributions Paid (in thousands) |
| Related Period | | Date Paid | | Quarterly Distributions
Per Common Unit | | Public Unitholders | | CVR Energy | | Total |
| 2021 - 4th Quarter | | March 14, 2022 | | $ | 5.24 | | | $ | 35,576 | | | $ | 20,394 | | | $ | 55,970 | |
| 2022 - 1st Quarter | | May 23, 2022 | | 2.26 | | | 15,091 | | | 8,796 | | | 23,887 | |
| 2022 - 2nd Quarter | | August 22, 2022 | | 10.05 | | | 67,109 | | | 39,115 | | | 106,225 | |
| 2022 - 3rd Quarter | | November 21, 2022 | | 1.77 | | | 11,819 | | | 6,889 | | | 18,708 | |
| Total 2022 quarterly distributions | | $ | 19.32 | | | $ | 129,597 | | | $ | 75,193 | | | $ | 204,790 | |
For the second quarter of 2022,2023, the Partnership, upon approval by the Board on August 1, 2022,July 31, 2023, declared a distribution of $10.05$4.14 per common unit, or $106.2$43.8 million, which is payable August 22, 202221, 2023 to unitholders of record as of August 12, 2022.14, 2023. Of this amount, CVR Energy will receive approximately $39.1$16.1 million, with the remaining amount payable to public unitholders.
Item 2. Management’s Discussion and Analysis of Financial Condition and Results of Operations
The following discussion and analysis of our financial condition, results of operations, and cash flows should be read in conjunction with theour unaudited condensed consolidated financial statements and related notes and with the statistical information and financial data appearing in this Report, as well as our Annual Report on Form 10-K for the year ended December 31, 20212022 filed with the U.S. Securities and Exchange Commission (“SEC”) on February 23, 202222, 2023 (the “2021“2022 Form 10-K”). Results of operations for the three and six months ended June 30, 2022 2023and cash flows for the six months ended June 30, 20222023 are not necessarily indicative of results to be attained for any other period. See “Important Information Regarding Forward-Looking Statements.”
Reflected in this discussion and analysis is how management views the Partnership’s current financial condition and results of operations along with key external variables and management actions that may impact the Partnership. Understanding significant external variables, such as market conditions, weather, and seasonal trends, among others, and management actions taken to manage the Partnership, address external variables, among others, which will increase users’ understanding of the Partnership, its financial condition and results of operations. This discussion may contain forward-looking statements that reflect our plans, estimates and beliefs. Our actual results could differ materially from those discussed in the forward-looking statements. Factors that could cause or contribute to such differences include, but are not limited to those discussed below and elsewhere in this Report.
Partnership Overview
CVR Partners, LP (“CVR Partners” or the “Partnership”) is a Delaware limited partnership formed in 2011 by CVR Energy, Inc. (“CVR Energy”) to own, operate, and grow its nitrogen fertilizer business. The Partnership produces and distributes nitrogen fertilizer products, which are used by farmers to improve the yield and quality of their crops. The Partnership produces these products at two manufacturing facilities, one located in Coffeyville, Kansas operated by its wholly owned subsidiary, Coffeyville Resources Nitrogen Fertilizers, LLC (“CRNF”) (the “Coffeyville Facility”) and one located in East Dubuque, Illinois operated by its wholly owned subsidiary, East Dubuque Nitrogen Fertilizers, LLC (“EDNF”) (the “East Dubuque Facility”). OurThe principal products arewe produce include ammonia and urea ammonium nitrate (“UAN”). All of our products are sold on a wholesale basis. References to CVR Partners, the Partnership, “we”, “us”, and “our” may refer to consolidated subsidiaries of CVR Partners or one or both of the facilities, as the context may require. Additionally, as the context may require, references to CVR Energy may refer to CVR Energy and its consolidated subsidiaries, excluding the Partnership and its subsidiaries, which include its petroleum and renewables refining, marketing, and logistics operations.
Strategy and Goals
The Partnership has adopted Mission and Values, which articulate the Partnership’s expectations for how it and its employees do business each and every day.
Mission and Core Values
Our Mission is to be a top tier North American nitrogen-based fertilizer company as measured by safe and reliable operations, superior performance and profitable growth. The foundation of how we operate is built on five core Values:
•Safety - We always put safety first. The protection of our employees, contractors and communities is paramount. We have an unwavering commitment to safety above all else. If it’s not safe, then we don’t do it.
•Environment - We care for our environment. Complying with all regulations and minimizing any environmental impact from our operations is essential. We understand our obligation to the environment and that it’s our duty to protect it.
•Integrity - We require high business ethics. We comply with the law and practice sound corporate governance. We only conduct business one way—the right way with integrity.
•Corporate Citizenship - We are proud members of the communities where we operate. We are good neighbors and know that it’s a privilege we can’t take for granted. We seek to make a positive economic and social impact through
our financial donations and the contributions of time, knowledge and talent of our employees to the places where we live and work.
•Continuous Improvement - We believe in both individual and team success. We foster accountability under a performance-driven culture that supports creative thinking, teamwork, diversity and personal development so that employees can realize their maximum potential. We use defined work practices for consistency, efficiency and to create value across the organization.
Our core Values are driven by our people, inform the way we do business each and every day and enhance our ability to accomplish our mission and related strategic objectives.
Strategic Objectives
We have outlined the following strategic objectives to drive the accomplishment of our mission:
Environmental, Health & Safety (“EH&S”) - We aim to achieve continuous improvement in all EH&S areas through ensuring our people’s commitment to environmental, health and safety comes first, the refinement of existing policies, continuous training, and enhanced monitoring procedures.
Reliability - Our goal is to achieve industry-leading utilization rates at both of our facilities through safe and reliable operations. We are focusing on improvements in day-to-day plant operations, identifying alternative sources for plant inputs to reduce lost time due to third-party operational constraints, and optimizing our commercial and marketing functions to maintain plant operations at their highest level.
Market Capture - We continuously evaluate opportunities to improve the facilities’ realized pricing at the gate and reduce variable costs incurred in production to maximize our capture of market opportunities.
Financial Discipline - We strive to be as efficient as possible by maintaining low operating costs and disciplined deployment of capital.
Achievements
DuringFrom the first six monthsbeginning of 2022,the fiscal year through the date of filing, we successfully executed a number of achievements in support of our strategic objectives shown below through the date of this filing:below:
| | | | | | | | | | | | | | | | | | | | | | | |
| SafetyEH&S | | Reliability | | Market Capture | | Financial Discipline |
| | | | | | | |
| | | | | | | |
Achieved reductions in environmental events, process safety management tier 1 incidentssatisfactory Process Safety and total recordable incident rate of 50%, 100% and 77%, respectively, compared to the first six months of 2021 | ü | | | | | | |
Operated both facilities safelyEnvironmental performance | ü | | | | | | |
| Continued to operate both facilities safely and at high utilization rates. During the second quarter of 2023, achieved a combined utilization rate of 100% | ü | | ü | | ü | | |
Achieved record UAN production volumestruck shipments during March 2023 at the Coffeyville Facility in March 2022 through facility upgrades completed in October 2021 | | | ü | | ü | | |
| Achieved record daily ammonia shipments during April 2023 and record quarterly ammonia production during the second quarter of 2023 at the East Dubuque Facility | | | ü | | ü | | |
Declared a cash distribution of $10.05$4.14 per common unit for the second quarter of 2022,2023, bringing cumulative distributions declared to date of $12.31$14.57 per common unit related to the first six months of 20222023 | | | | | ü | | ü |
Generated over 1 million carbon offset creditsClosed on a transaction related to voluntary Nitrous Oxide abatementcarbon capture and sequestration activities at the Coffeyville Facility since 2020in January 2023 | ü | | | | ü | | ü |
| | | | | | | | | | | | | | | | | | | | | | | |
| Safety | | Reliability | | Market Capture | | Financial Discipline |
Completed targeted $95 million debt reduction plan with the repayment of the remaining $65 million balance of the 9.25% Senior Secured Notes, due 2023 (the “2023 Notes”) in the first quarter of 2022 for a total reduction in annual cash interest expense of approximately $9 million | | | | | | | ü |
Repurchased over 111,000 common units for $12.4 million | | | | | | | ü |
Industry Factors and Market Indicators
Within the nitrogen fertilizer business, earnings and cash flows from operations are primarily affected by the relationship between nitrogen fertilizer product prices, utilization, and operating costs and expenses, including pet coke and natural gas feedstock costs.
The price at which nitrogen fertilizer products are ultimately sold depends on numerous factors, including the global supply and demand for nitrogen fertilizer products which, in turn, depends on, among other factors, world grain demand and production levels, changes in world population, the cost and availability of fertilizer transportation infrastructure, weather conditions, the availability of imports, the availability and price of feedstocks to produce nitrogen fertilizer, and the extent of government intervention in agriculture markets.
Nitrogen fertilizer prices are also affected by local factors, including local market conditions and the operating levels of competing facilities. An expansion or upgrade of competitors’ facilities, new facility development, political and economic developments, and other factors are likely to continue to play an important role in nitrogen fertilizer industry economics. These factors can impact, among other things, the level of inventories in the market, resulting in price volatility and a reduction in product margins. Moreover, the industry typically experiences seasonal fluctuations in demand for nitrogen fertilizer products.
General Business Environment
COVID-19 - Throughout 2020 and into 2021,The Partnership believes the COVID-19 pandemic disrupted the worldwide economy, financial markets, and the energy and fertilizer industries. Actions taken by the U.S. government to provide stimulus to individuals and businesses have helped mitigate the impacts of the downturn caused by COVID-19, and wegeneral business environment in which it operates will continue to see businesses resuming operationsremain volatile, driven by uncertainty around the availability and the liftingprices of governmental restrictions. However, despite worldwide advances in containment of the virusits feedstocks, demand for its products, inflation, and economic market recovery in 2021global supply disruptions. As a result, future operating results and 2022, COVID-19 remains a dynamic and continuously evolving situation with unknown shortcurrent and long-term financial conditions could be negatively impacted if economic challenges that could reverse any recent improvements. Further, the spread of variants of COVID-19 could cause restrictionsconditions decline and remain volatile. The Partnership is not able at this time to be reinstated, andpredict the extent to which these events may have a material, or any, effect on its financial or operational results in future periods.
Regulatory Environment - Certain governmental regulations and incentives associated with the pandemic mayautomobile transportation and agricultural industries, including the ones related to corn-based ethanol and sustainable aviation fuel production or consumption can directly impact our business, financial condition, liquidity, or resultsbusiness. In August 2022, the Inflation Reduction Act was passed and introduced the Clean Fuel Production Credit incentivizing lower Carbon Intensity feedstocks, including corn oil, which may increase demand for corn planting. In June 2023, the United States Environmental Protection Agency (“EPA”) announced the renewable volume obligations for 2023, 2024, and 2025 which maintained the ethanol blending level at 15 billion gallons. These actions lead us to believe that the demand on food, in particular corn, for fuel will remain strong for the foreseeable future and support farmer economics that incentivize the use of operations cannot be determined at this time.nitrogen-based fertilizers.
On the contrary, in April 2023, the EPA announced the proposed federal vehicle emission standards for 2027 through 2032, which will essentially eliminate internal combustion engine vehicles and will reduce the demand for liquid fuels including ethanol. Production today of ethanol consumes approximately 35% of the annual United States corn crop.
Russia-Ukraine Conflict - In February 2022, Russia invaded Ukraine, significantly impacting global fertilizer and agriculture markets. The Black Sea is a major export point for nitrogen fertilizer and grains from Russia and Ukraine. SinceWhen the invasion began, the Black Sea has beenwas largely closed to exports which prompted tightening global supply conditions for nitrogen fertilizer in advance of spring planting and for wheat and corn availability, as Russia and Ukraine are major wheat exporters and Ukraine is a major corn exporter. Expectations areexporter from the Black Sea. Export restrictions on grain exports from Russia and Ukraine from the Black Sea were then relaxed and contributed to lower grain prices from the elevated levels in the spring and summer of 2022. However, in July 2023, Russia indicated that planted acresit would not extend the initiative to allow Ukraine to export grain, which could create instability in the grain markets. In 2022, grain harvested in Ukraine will be muchwas approximately 40% lower than in 20222021 due to lack of planting inputs, fuel, and workers to complete the planting of crops. The ability to export grains from the Ukraine, particularly wheat, continue to be restricted due to lack of access to export terminals in the Black Sea and limited rail or trucking capacity. Additionally, many Western countries have formally or informally adopted sanctions onAlthough at a number of Russian exports and individuals affiliated with Russian government leadership. While fertilizers have not been formally sanctioned, many Western customers are either unwilling to purchase Russian fertilizers or logistics make it too costly to import Russian fertilizers. Additionally, natural gas supplied from Russia to Western Europe has been constrained and prices have remained elevated since September 2021, causing a significant portion of European nitrogen fertilizer production capacity to be curtailed or costs to be elevated compared to competitors in other regions of the world. Overall, these events have caused grain and fertilizer prices to rise, and we currently expect these conditions to persist for the remainder of 2022. The ultimate outcome oflesser magnitude, the Russia-Ukraine conflict continues to impact the macro-economic environment in 2023 and its ultimate outcome and any associated market disruptions are difficult to predict and may affect our business in unforeseen ways.
The Partnership believes the general business environment in which it operates will continue to remain volatile throughout 2022, driven by uncertainty around the availability and prices of its feedstocks, demand for its products, inflation, and global supply disruptions. As a result, future operating results and current and long-term financial conditions could be negatively
impacted if economic conditions decline and remain volatile. Due to the uncertainty of the global recovery, including its duration, timing, and strength, the Partnership is not able at this time to predict the extent to which these events may have a material, or any, effect on its financial or operational results in future periods.
Market Indicators
While there is risk of shorter-term volatility given the inherent nature of the commodity cycle, the Partnership believes the long-term fundamentals for the U.S. nitrogen fertilizer industry remain intact. The Partnership views the anticipated combination of (i) increasing global population, (ii) decreasing arable land per capita, (iii) continued evolution to more protein-based diets in developing countries, (iv) sustained use of corn and soybeans as feedstock for the domestic production of ethanol
and other renewable fuels, and (v) positioning at the lower end of the global cost curve should provide a solid foundation for nitrogen fertilizer producers in the U.S.United States over the longer term.
Corn and soybeans are two major crops planted by farmers in North America. Corn crops result in the depletion of the amount of nitrogen within the soil in which it is grown, which in turn, results in the need for this nutrient to be replenished after each growing cycle. Unlike corn, soybeans are able to obtain most of their own nitrogen through a process known as “N fixation.” As such, upon harvesting of soybeans, the soil retains a certain amount of nitrogen which results in lower demand for nitrogen fertilizer for the following corn planting cycle. Due to these factors, nitrogen fertilizer consumers generally operate a balanced corn-soybean rotational planting cycle as evidentshown by the chart presented below as of June 30, 2022.2023.
The relationship between the total acres planted for both corn and soybeansoybeans has a direct impact on the overall demand for nitrogen products, as the market and demand for nitrogen increases with increased corn acres and decreases with increased soybean acres. Additionally, an estimated 1212.5 billion pounds of soybean oil is expected to be used in producing cleaner renewablesrenewable fuels in marketing year 2022/2023.2023/2024. Multiple refiners have announced renewable diesel expansion projects for 20222023 and beyond, which will only increase the demand for soybeans and potentially for corn and canola.
The United States Department of Agriculture (“USDA”) estimates that in spring 20222023 farmers planted 89.994.1 million corn acres, representing a decreasean increase of 3.7%6.2% as compared to 93.488.6 million corn acres in 2021.2022. Planted soybean acres are estimated to be 88.383.5 million, representing a 1.3% increasedecrease of 4.6% as compared to 87.287.5 million soybean acres in 2021.2022. The combined corn and soybean planted acres of 178.2177.6 million is in line withan increase of 0.9% compared to the acreage planted in 2021, which was the highest in history.2022. Due to higherlower input costs in 2023 for corn planting and increased demand forthe relative grain prices of corn versus soybeans, particularly for renewable diesel production, it was more favorable for farmers to plant soybeanseconomics favor planting corn compared to corn. The lower plantedsoybeans. Lower inventory levels of corn acres in 2022 isand soybeans are expected to be supportive of corn prices for 2022 andthe remainder of 2023.
Ethanol is blended with gasoline to meet renewable fuel standard requirements and for its octane value. Ethanol production has historically consumed approximately 35%36% of the U.S. corn crop, so demand for corn generally rises and falls with ethanol demand, as evidencedshown by the charts below, through June 30, 2022.2023.
| | | | | | | | |
U.S. Plant Production of Fuel Ethanol (1) | | Corn and Soybean Planted Acres (2) |
(1)Information used within this chart was obtained from the U.S. Energy Information Administration (“EIA”) through June 30, 2022.2023.
(2)Information used within this chart was obtained from the USDA, National Agricultural Statistics Services as of June 30, 2022.2023.
Weather continues to be a critical variable for crop production. Even with high planted acres and trendline yields per acre in the U.S., inventory levels for corn and soybeans remain below historical levels and prices have remained elevated. With tight grain and fertilizer inventory levels driven by the war in Ukraine, prices for grains and fertilizers are expected to remainremained elevated throughoutthrough the first half of 2023, although below the elevated prices experienced in the spring of 2022. While the weather conditions were difficult early in spring 2022, farmers were able to complete the crop planting later than normal. Demand for nitrogen fertilizer, as well as other crop inputs, was strong for the spring 20222023 planting season.season, primarily due to elevated grain prices and favorable weather conditions for planting.
On Fertilizer input costs have been volatile since the fall of 2021. Natural gas prices were elevated in the fall of 2022 due to shortages in Europe and demand being driven by building natural gas storage for winter. Winter 2022/2023 weather was warmer than average in Europe and when combined with natural gas conservation measures caused demand and prices for
June 30, 2021, CF Industries Nitrogen, L.L.C., Terra Nitrogen, Limited Partnership, and Terra International (Oklahoma) LLC filed petitions with the U.S. Department2023 | 21
natural gas in Europe to 9.84% and UAN imports from Trinidad are unfairly subsidized at a rate of 1.83%. On January 27, 2022, USDOC found that Russian UAN imports are sold at less than fair value into the U.S. market at rates ranging from 9.15% to 127.19% and that Trinidadian UAN imports at a rate of 63.08%. On June 21, 2022, USDOC issued its final affirmative determinations in anti-dumping and countervailing duty investigations where it found that imports from Russia are dumped at rates ranging from 8.16% to 122.93% and unfairly subsidized at rates ranging from 6.27% to 9.66%. Additionally, USDOC found that imports from Trinidad are dumped at a rate of 111.71% and unfairly subsidized at a rate of 1.83%. On July 18, 2022, the ITC made a negative final injury determination concerning its investigation of imports from Russia and Trinidad despite USDOC’s final determination in June that UAN is subsidized and dumpedfall significantly in the U.S. market by producersfirst quarter of 2023. The decline in both countries. Asnatural gas prices has led to a significant reduction in the result of this decision,price for nitrogen fertilizer globally due to lower input costs. While we expect world trade flowsthat natural gas prices might remain below the elevated levels experienced in 2022 in the near term, we believe that the structural shortage of UANnatural gas in Europe will continue to returnbe a source of volatility for the rest of 2023. Pet coke prices remain elevated compared to pre-investigation patterns.historical levels, but we believe that if natural gas prices remain lower than prices in 2022, pet coke prices will likely decline later in 2023.
The charts below show relevant market indicators by month through June 30, 2022:2023:
| | | | | | | | |
Ammonia and UAN Market Pricing (1) | | Natural Gas and Pet Coke Market Pricing (1) |
(1)Information used within these charts was obtained from various third-party sources, including Green Markets (a Bloomberg Company), Pace Petroleum Coke Quarterly, and the EIA, amongst others.
Results of Operations
The following should be read in conjunction with the information outlined in the previous sections of this Part I, Item 2 and the financial statements and related notes thereto in Part I, Item 1 of this Report.
The chartschart presented below summarizesummarizes our ammonia utilization rates on a consolidated basis for the three and six months ended June 30, 20222023 and 2021.2022. Utilization is an important measure used by management to assess operational output at each of the Partnership’s facilities. Utilization is calculated as actual tons of ammonia produced divided by capacity adjusted for planned maintenance and turnarounds.capacity.
Utilization is presented solely on ammonia production rather than on each nitrogen product as it provides a comparative baseline against industry peers and eliminates the disparity of facility configurations for upgrade of ammonia into other nitrogen products. With effortsproduction primarily focused on ammonia upgrade capabilities, we believe this measure provides a meaningful view of how well we operate.
| | | | | | | | |
Consolidated Ammonia Utilization | | Consolidated Ammonia Utilization |
| | |
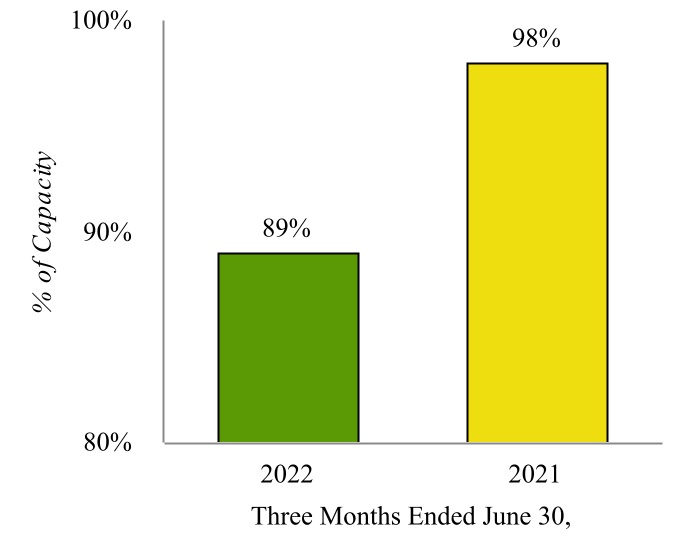
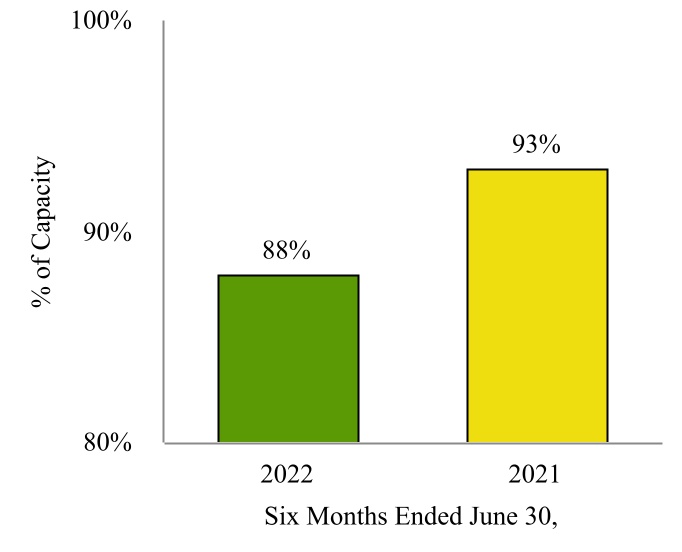
On a consolidated basis for the three and six months ended June 30, 2022,2023, utilization decreasedincreased to 100% and 103%, respectively, compared to 89% and 88%, for the three and six months ended June 30, 2022, respectively. The decreases during the current periodsincreases were primarily due to more reliable operations following the completion of planned turnarounds at both facilities in the third quarter of 2022, along with increased unplanned downtime in 2022 associated with the Messer air separation plant (“Messer”(the “Messer Outages”) at the Coffeyville Facility and various pieces of equipment at the East Dubuque Facility.
Sales and Pricing per Ton - Two of our key operating metrics are total sales volumes for ammonia and UAN, along with the product pricing per ton realized at the gate. TotalFor the three and six months ended June 30, 2023, total product sales volumes were unfavorable,favorable, driven by lowerincreased production at both facilities due to operating reliably after the planned turnarounds in the third quarter of 2022, as well as increased downtime from the Messer Outages at the Coffeyville Facility due to reduced downtime from Messer outages and various pieces of equipment at the East Dubuque Facility in 2022, as compared to 2021.2022. For the three and six months ended June 30, 2022,2023, total product sales prices were favorable,unfavorable for both periods, driven by sales price increasesdecreases of 193%40% and 202%32%, respectively, for ammonia and 134%43% and 154%26%, respectively, for UAN. Ammonia and UAN sales prices were favorableunfavorable primarily due to lower natural gas prices and deferred fertilizer supply driven by production outages from Hurricane Ida in August and September 2021, increased industry turnaround activity, energy shortages in Europe and Asia, anddemand at the impacts from the Russia-Ukraine conflict, coupled with higher crop pricing.retail level. Product pricing at the gate represents net sales less freight revenue divided by product sales volume in tons and is shown in order to provide a pricing measure comparable across the fertilizer industry.
Operating Highlights for the Three Months Ended June 30, 20222023 versus June 30, 20212022
| | | | | | | | |
Sales (thousand tons) | | Product Pricing at Gate ($ per ton) |
Operating Highlights for the Six Months Ended June 30, 20222023 versus June 30, 20212022
| | | | | | | | |
Sales (thousand tons) | | Product Pricing at Gate ($ per ton) |
Production Volumes - Gross tons produced forof ammonia represent the total ammonia produced, including ammonia produced that was upgraded into other fertilizer products. Net tons available for sale representrepresents the ammonia available for sale that was not upgraded into other fertilizer products. The table below presents these metrics for the three and six months ended June 30, 20222023 and 2021:2022:
| | | | Three Months Ended
June 30, | | Six Months Ended
June 30, | | Three Months Ended
June 30, | | Six Months Ended
June 30, |
| (in thousands of tons) | (in thousands of tons) | 2022 | | 2021 | | 2022 | | 2021 | (in thousands of tons) | 2023 | | 2022 | | 2023 | | 2022 |
| Ammonia (gross produced) | Ammonia (gross produced) | 193 | | | 217 | | | 380 | | | 404 | | Ammonia (gross produced) | 219 | | | 193 | | | 442 | | | 380 | |
| Ammonia (net available for sale) | Ammonia (net available for sale) | 50 | | | 70 | | | 102 | | | 140 | | Ammonia (net available for sale) | 70 | | | 50 | | | 132 | | | 102 | |
| UAN | UAN | 331 | | | 334 | | | 648 | | | 606 | | UAN | 339 | | | 331 | | | 705 | | | 648 | |
Feedstock - Our Coffeyville Facility utilizes a pet coke gasification process to produce nitrogen fertilizer. Our East Dubuque Facility uses natural gas in its production of ammonia. The table below presents these feedstocks for both facilities for the three and six months ended June 30, 20222023 and 2021:2022:
| | | | Three Months Ended
June 30, | | Six Months Ended
June 30, | | Three Months Ended
June 30, | | Six Months Ended
June 30, |
| | 2022 | | 2021 | | 2022 | | 2021 | | 2023 | | 2022 | | 2023 | | 2022 |
Petroleum coke used in production (thousand tons) | 116 | | | 134 | | | 224 | | | 262 | | |
Petroleum coke (dollars per ton) | $ | 49.91 | | | $ | 36.69 | | | $ | 53.06 | | | $ | 39.73 | | |
Petroleum coke used in production (thousands of tons) | | Petroleum coke used in production (thousands of tons) | 124 | | | 116 | | | 255 | | | 224 | |
Petroleum coke used in production (dollars per ton) | | Petroleum coke used in production (dollars per ton) | $ | 73.91 | | | $ | 49.91 | | | $ | 75.62 | | | $ | 53.06 | |
Natural gas used in production (thousands of MMBtu) (1) | Natural gas used in production (thousands of MMBtu) (1) | 1,936 | | | 2,154 | | | 3,697 | | | 4,036 | | Natural gas used in production (thousands of MMBtu) (1) | 2,194 | | | 1,936 | | | 4,296 | | | 3,697 | |
Natural gas used in production (dollars per MMBtu) (1) | Natural gas used in production (dollars per MMBtu) (1) | $ | 7.34 | | | $ | 3.04 | | | $ | 6.48 | | | $ | 3.07 | | Natural gas used in production (dollars per MMBtu) (1) | $ | 2.35 | | | $ | 7.34 | | | $ | 4.02 | | | $ | 6.48 | |
Natural gas in cost of materials and other (thousands of MMBtu) (1) | Natural gas in cost of materials and other (thousands of MMBtu) (1) | 1,707 | | | 2,711 | | | 3,235 | | | 3,650 | | Natural gas in cost of materials and other (thousands of MMBtu) (1) | 2,403 | | | 1,707 | | | 3,718 | | | 3,235 | |
Natural gas in cost of materials and other (dollars per MMBtu) (1) | Natural gas in cost of materials and other (dollars per MMBtu) (1) | $ | 5.98 | | | $ | 3.06 | | | $ | 5.81 | | | $ | 3.03 | | Natural gas in cost of materials and other (dollars per MMBtu) (1) | $ | 4.11 | | | $ | 5.98 | | | $ | 5.41 | | | $ | 5.81 | |
(1)The feedstock natural gas shown above does not include natural gas used for fuel. The cost of fuel natural gas is included in Direct operating expenses (exclusive of depreciation and amortization).
Financial Highlights for the Three and Six Months Ended June 30, 20222023 and 20212022
For the three months ended June 30, 2022,2023, the Partnership’s operating income and net income were $125.9$66.7 million and $117.6$59.9 million, respectively, representing improvementsreductions of $95.6$59.2 million and $110.6$57.7 million, respectively, compared to the three months ended June 30, 2021.2022. For the six months ended June 30, 2022,2023, the Partnership’s operating income and net income were $229.9$176.1 million and $211.2$161.7 million, respectively, representing a $213.6decreases of $53.8 million and $229.6$49.5 million increase in operating income
and net income, respectively, compared to the six months ended June 30, 2021.2022. These increases for both periodsreductions were primarily driven by higherdecreased product sales prices, for UANoffset by increased production and ammoniasales volumes, compared to the prior periods.three and six months ended June 30, 2022.
| | | | | | | | |
| Net Sales | | Operating Income |
| | | | | | | | |
Net Income (Loss) | | EBITDA (1) |
(1)See “Non-GAAP Reconciliations” section below for reconciliations of the non-GAAP measures shown above.
Net Sales - For the three months ended June 30, 2022,2023, net sales increaseddecreased by $106.0$61.0 million to $244.0$183.0 million compared to the three months ended June 30, 2021. This increase2022. The decrease was primarily due to unfavorable UAN and ammonia sales prices which reduced revenues by $116.2 million, offset by favorable UAN and ammonia pricing conditions which contributed $131.6sales volumes contributing $55.8 million in higher revenues, partially offset by decreased sales volumes which contributed $31.0 million in lower revenues, as compared to the three months ended June 30, 2021.2022.
The following table demonstrates the impact of changes in sales volumes and pricing for the primary components of net sales, excluding urea products, freight, and other revenue, for the three months ended June 30, 2022 as2023 compared to the three months ended June 30, 2021:2022:
| | | | | | | | | | | |
| (in thousands) | Price
Variance | | Volume
Variance |
| UAN | $ | 91,454 | | | $ | (19,640) | |
| Ammonia | 40,191 | | | (11,345) | |
| | | | | | | | | | | |
| (in thousands) | Price
Variance | | Volume
Variance |
| UAN | $ | (78,577) | | | $ | 23,059 | |
| Ammonia | (37,641) | | | 32,750 | |
The $779$475 and $318$239 per ton increasesdecreases in ammonia and UAN sales pricing, respectively, for the three months ended June 30, 2022, as2023 compared to the three months ended June 30, 2021,2022 were primarily attributable to continued tight market conditions followinglower natural gas prices and deferred fertilizer demand at the production outages related to Hurricane Idaretail level in 2021, heightened turnaround activity during the summer of 2021, energy shortages in Europe and Asia, and further supply concerns due to the Russia-Ukraine conflict, coupled with higher crop pricing.current period. The decreaseincreases in UAN and ammonia sales volumes for the three months ended June 30, 20222023 compared to the three months ended June 30, 2021 was2022 were primarily attributable to lowerincreased production at both facilities due to unplannedoperating reliably after the planned turnarounds in the third quarter of 2022, as well as increased downtime associated withfrom the Messer outagesOutages at the Coffeyville Facility and various pieces of equipment at the East Dubuque Facility in 2022.during the 2022 period.
For the six months ended June 30, 2022,2023, net sales increaseddecreased by $268.0$57.6 million to $466.9$409.3 million compared to the six months ended June 30, 2021.2022. This increasedecrease was primarily due to lower sales prices which reduced revenues by $135.5 million, offset by favorable UAN and ammonia pricing conditions which contributed $262.3 million in higher revenues, partially offset by decreased sales volumes which contributed $7.6increased revenues by $75.4 million, in lower revenues, as compared to the six months ended June 30, 2021.2022.
The following table demonstrates the impact of changes in sales volumes and pricing for the primary components of net sales, excluding urea products, freight, and other revenue, for the six months ended June 30, 20222023 as compared to the six months ended June 30, 2021:2022:
| | (in thousands) | Price
Variance | | Volume
Variance | |
(in thousands) | | (in thousands) | Price
Variance | | Volume
Variance |
| UAN | UAN | $ | 193,428 | | | $ | (69) | | UAN | $ | (92,107) | | | $ | 41,479 | |
| Ammonia | Ammonia | 68,847 | | | (7,524) | | Ammonia | (43,372) | | | 33,957 | |
The $754$357 and $318$134 per ton increasesdecreases in ammonia and UAN sales pricing, respectively, for the six months ended June 30, 2022 as2023 compared to the six months ended June 30, 20212022 were primarily attributable to continued tight market conditions followinglower natural gas prices and deferred fertilizer demand at the production outages related to Hurricane Idaretail level in 2021, heightened turnaround activity during the summer of 2021, energy shortagescurrent period. The increases in EuropeUAN and Asia, and further supply concerns due to the Russia-Ukraine conflict, coupled with higher crop pricing. The depressed ammonia sales volumes for the six months ended June 30, 20222023 compared to the six months ended June 30, 2021 was2022 were primarily attributable to a higher rate of ammoniaincreased production converted to UAN for sale, along with lower ammonia productionat both facilities due to unplannedoperating reliably after the planned turnarounds in the third quarter of 2022, as well as increased downtime associated withfrom the Messer outagesOutages at the Coffeyville Facility and various pieces of equipment at the East Dubuque Facility in 2022.during the 2022 period.
| | | | | | | | |
| Cost of Materials and Other | | Direct Operating Expenses (1) |
(1)Exclusive of depreciation and amortization expense.
Cost of Materials and Other - For the three and six months ended June 30, 2022, cost of materials and other was $41.0 million and $71.2 million, respectively, compared to $26.1 million and $43.9 million for the three and six months ended June 30, 2021, respectively. For the three and six months ended June 30, 2022, increased costs were comprised primarily of $11.5 million and $13.3 million increases in purchases of nitrogen and ammonia, respectively, $7.7 million and $11.8 million increases in natural gas pricing and usage at the East Dubuque Facility, respectively, $1.6 million and $4.6 million increases in distribution costs driven by freight, respectively, and $1.0 million and $2.3 million increases in pet coke and hydrogen feedstock costs at the Coffeyville Facility, respectively. The increases were partially offset by a higher build in inventories contributing $7.1 million and $4.6 million, respectively.
Direct Operating Expenses (exclusive of depreciation and amortization) -For the three months ended June 30, 2022, direct operating expenses (exclusive of depreciation and amortization) were $48.8 million, compared to $53.3 million for the three months ended June 30, 2021. The decrease was primarily due to lower personnel costs, mostly attributable to share-based compensation, of $4.7 million, as a result of a decrease in market prices for CVR Partners’ common units during the current period, and a higher build in inventories contributing $13.7 million. These decreases were partially offset by rising natural gas prices of $7.2 million, increased repairs and maintenance expenses due to outages of $4.0 million, increased operating materials, office costs and rent of $1.1 million, incurring turnaround expenses of $0.9 million, and increased insurance costs of $0.8 million.
For the six months ended June 30, 2022, direct operating expenses (exclusive of depreciation and amortization) were $109.1 million, compared to $90.4 million for the six months ended June 30, 2021. The increase was primarily due to rising natural gas prices of $11.2 million, increased repairs and maintenance expenses due to outages of $7.1 million, higher electricity pricing and usage of $2.4 million, increased insurance costs of $2.4 million, incurring turnaround expenses of $1.5 million, increased operating materials of $1.3 million, and higher personnel costs, mostly attributable to share-based compensation, of $1.0 million, as a result of an increase in market prices for CVR Partners’ common units during the current period. These increases are partially offset by a higher build in inventories contributing $8.1 million.
Cost of Materials and Other - For the three and six months ended June 30, 2023, cost of materials and other was $33.4 million and $70.0 million, respectively, compared to $41.0 million and $71.2 million for the three and six months ended June 30, 2022. These decreases were driven primarily by lower purchases of ammonia and UAN in 2023 due to improved plant utilization resulting in higher quantities of product available for sale, as well as lower natural gas costs in the current period.
Direct Operating Expenses (exclusive of depreciation and amortization) -For the three and six months ended June 30, 2023, direct operating expenses (exclusive of depreciation and amortization) were $55.8 million and $113.3 million, respectively, compared to $48.8 million and $109.1 million for the three and six months ended June 30, 2022, respectively. The increases were primarily a result of inventory impacts due to a draw in ammonia inventory, offset by lower utility costs of $6.4 million from lower natural gas and electricity prices in the current period.
| | | | | | | | |
| Depreciation and Amortization | | Selling, General and Administrative Expenses, and Other |
Depreciation and Amortization Expense - For the three and six months ended June 30, 2022,2023, depreciation and amortization expense waswere $19.8 million and $35.0 million, respectively, compared to $21.2 million and $40.7 million, respectively, compared to $21.1 million and $35.2 million for the three and six months ended June 30, 2021,2022, respectively. These increasesThe decreases were primarily due to inventory changes and an increase in accelerated depreciation relatedvarious assets fully depreciated prior to projects to be completed by 2025 that will retire assets earlier than their original expected useful life, coupled with additions to property, plant, and equipment duringthe start of the current year.period.
Selling, General, and Administrative Expenses, and Other - For the three months ended June 30, 2023 and 2022, selling, general and administrative expenses and other waswere $7.4 million and $7.1 million, comparedrespectively. The increase was primarily related to $7.2 millionincreased outside service and non-personnel costs, partially offset by lower share-based compensation due to a decrease in market prices for CVR Partners’ common units during the three months ended June 30, 2021.current period. For the six months ended June 30, 2023 and 2022, selling, general and administrative expenses and other waswere $14.9 million and $16.0 million, compared to $13.2 million for the six months ended June 30, 2021.respectively. The increasedecrease was primarily related to increased personnel costs, mostly attributable tolower share-based compensation contributing $2.0 million and increased expenses for outside services, public relations, insurance, and rentals contributing $1.1 million, partially offset bydue to a decrease in losses on asset disposal and impairments of $0.2 million.
Other Income, Net - Formarket prices for CVR Partners’ common units in the three and six months ended June 30, 2022, other income, net was $0.1 million for both periods, compared to less than $0.1 million and $4.6 million for the three and six months ended June 30, 2021, respectively. The decrease for the six months ended June 30, 2022 was due to sales of natural gas volumes at the East Dubuque Facility in February 2021.current period.
Non-GAAP Measures
Our management uses certain non-GAAP performance measures, and reconciliations to those measures, to evaluate current and past performance and prospects for the future to supplement our financial information presented in accordance with accounting principles generally accepted in the United States (“GAAP”). These non-GAAP financial measures are important factors in assessing our operating results and profitability and include the performance and liquidity measures defined below.
The following are non-GAAP measures we present for the period ended June 30, 2022:2023:
EBITDA - Net income (loss) before (i) interest expense, net, (ii) income tax expense (benefit) and (iii) depreciation and amortization expense.
Adjusted EBITDA - EBITDA adjusted for certain significant non-cash items and items that management believes are not attributable to or indicative of our on-going operations or that may obscure our underlying results and trends.
Reconciliation of Net Cash Provided By Operating Activities to EBITDA - Net cash provided by operating activities reduced by (i) interest expense, net, (ii) income tax expense (benefit), (iii) change in working capital, and (iv) other non-cash adjustments.
Available Cash for Distribution - EBITDA for the quarter excluding non-cash income or expense items (if any), for which adjustment is deemed necessary or appropriate by the board of directors of our general partner (the “Board”) in its sole discretion, less (i) reserves for maintenance capital expenditures, debt service and other contractual obligations and (ii) reserves for future operating or capital needs (if any), in each case, that the Board deems necessary or appropriate in its sole discretion. Available cash for distribution may be increased by the release of previously established cash reserves, if any, and other excess cash, at the discretion of the Board.
We present these measures because we believe they may help investors, analysts, lenders, and ratings agencies analyze our results of operations and liquidity in conjunction with our U.S. GAAP results, including, but not limited to, our operating performance as compared to other publicly traded companies in the fertilizer industry, without regard to historical cost basis or financing methods, and our ability to incur and service debt and fund capital expenditures. Non-GAAP measures have important limitations as analytical tools because they exclude some, but not all, items that affect net earnings and operating income. These measures should not be considered substitutes for their most directly comparable U.S. GAAP financial measures. Refer to the “Non-GAAP Reconciliations” included herein for reconciliation of these amounts. Due to rounding, numbers presented within this section may not add or equal to numbers or totals presented elsewhere within this document.
Factors Affecting Comparability of Our Financial Results
Our historical results of operations for the periods presented may not be comparable with prior periods or to our results of operations in the future for the reasons discussed below.
Coffeyville Facility - A planned turnaround at the Coffeyville Facility commenced in July 2022 and is expected to be completed in early to mid-August 2022. For the three and six months ended June 30, 2022, we incurred turnaround expense of $0.2 million and $0.3 million, respectively, related to planning for this turnaround.
East Dubuque Facility - The next planned turnaround at the East Dubuque Facility is expected to commence during August 2022. For the three and six months ended June 30, 2022, we incurred turnaround expense of $0.8 million and $1.3 million, respectively, related to planning for this turnaround.
Non-GAAP Reconciliations
Reconciliation of Net Income (Loss) to EBITDA and Adjusted EBITDA
| | | Three Months Ended
June 30, | | Six Months Ended
June 30, | | Three Months Ended
June 30, | | Six Months Ended
June 30, |
| (in thousands) | (in thousands) | 2022 | | 2021 | | 2022 | | 2021 | (in thousands) | 2023 | | 2022 | | 2023 | | 2022 |
| Net income (loss) | $ | 117,582 | | | $ | 7,020 | | | $ | 211,243 | | | $ | (18,364) | | |
| Net income | | Net income | $ | 59,857 | | | $ | 117,582 | | | $ | 161,727 | | | $ | 211,243 | |
| | Interest expense, net | Interest expense, net | 8,308 | | | 23,334 | | | 18,343 | | | 39,251 | | Interest expense, net | 6,919 | | | 8,308 | | | 14,093 | | | 18,343 | |
| Income tax expense | Income tax expense | 119 | | | — | | | 377 | | | 19 | | Income tax expense | 2 | | | 119 | | | 46 | | | 377 | |
| Depreciation and amortization | Depreciation and amortization | 21,220 | | | 21,119 | | | 40,686 | | | 35,242 | | Depreciation and amortization | 19,755 | | | 21,220 | | | 34,965 | | | 40,686 | |
| EBITDA and Adjusted EBITDA | EBITDA and Adjusted EBITDA | $ | 147,229 | | | $ | 51,473 | | | $ | 270,649 | | | $ | 56,148 | | EBITDA and Adjusted EBITDA | $ | 86,533 | | | $ | 147,229 | | | $ | 210,831 | | | $ | 270,649 | |
|
Reconciliation of Net Cash Provided By Operating Activities to EBITDA and Adjusted EBITDA
| | | | | | | | | | | | | | | | | | | | | | | |
| Three Months Ended
June 30, | | Six Months Ended
June 30, |
| (in thousands) | 2023 | | 2022 | | 2023 | | 2022 |
| Net cash provided by operating activities | $ | 60,844 | | | $ | 48,684 | | | $ | 191,287 | | | $ | 215,611 | |
| Non-cash items: | | | | | | | |
| Loss on extinguishment of debt | — | | | — | | | — | | | (628) | |
| | | | | | | |
| Share-based compensation | (2,203) | | | 721 | | | (4,136) | | | (11,353) | |
| Other | (250) | | | (345) | | | (752) | | | (958) | |
| Adjustments: | | | | | | | |
| Interest expense, net | 6,919 | | | 8,308 | | | 14,093 | | | 18,343 | |
| Income tax expense | 2 | | | 119 | | | 46 | | | 377 | |
| Change in assets and liabilities | 21,221 | | | 89,742 | | | 10,293 | | | 49,257 | |
| EBITDA and Adjusted EBITDA | $ | 86,533 | | | $ | 147,229 | | | $ | 210,831 | | | $ | 270,649 | |
| | | | | | | |
| | | | | | | |
Reconciliation of Net Cash Provided By Operating Activities to EBITDA and Adjusted EBITDA
| | | | | | | | | | | | | | | | | | | | | | | |
| Three Months Ended
June 30, | | Six Months Ended
June 30, |
| (in thousands) | 2022 | | 2021 | | 2022 | | 2021 |
| Net cash provided by operating activities | $ | 48,684 | | | $ | (2,572) | | | $ | 215,611 | | | $ | 22,979 | |
| Non-cash items: | | | | | | | |
| Loss on extinguishment of debt | — | | | (7,763) | | | (628) | | | (7,763) | |
| | | | | | | |
| Share-based compensation | 721 | | | (6,379) | | | (11,353) | | | (9,971) | |
| Other | (345) | | | (1,549) | | | (958) | | | (2,808) | |
| Adjustments: | | | | | | | |
| Interest expense, net | 8,308 | | | 23,334 | | | 18,343 | | | 39,251 | |
| Income tax expense | 119 | | | — | | | 377 | | | 19 | |
| Change in assets and liabilities | 89,742 | | | 46,402 | | | 49,257 | | | 14,441 | |
| EBITDA and Adjusted EBITDA | $ | 147,229 | | | $ | 51,473 | | | $ | 270,649 | | | $ | 56,148 | |
| | | | | | | |
| | | | | | | |
Reconciliation of EBITDA to Available Cash for Distribution
| | | Three Months Ended
June 30, | | Six Months Ended
June 30, | | Three Months Ended
June 30, | | Six Months Ended
June 30, |
| (in thousands) | (in thousands) | 2022 | | 2021 | | 2022 | | 2021 | (in thousands) | 2023 | | 2022 | | 2023 | | 2022 |
| EBITDA | EBITDA | $ | 147,229 | | | $ | 51,473 | | | $ | 270,649 | | | $ | 56,148 | | EBITDA | $ | 86,533 | | | $ | 147,229 | | | $ | 210,831 | | | $ | 270,649 | |
| | Current (reserves) adjustments for amounts related to: | Current (reserves) adjustments for amounts related to: | | Current (reserves) adjustments for amounts related to: | |
| Net cash interest expense (excluding capitalized interest) | Net cash interest expense (excluding capitalized interest) | (8,466) | | | — | | | (17,800) | | | — | | Net cash interest expense (excluding capitalized interest) | (8,466) | | | (8,466) | | | (16,932) | | | (17,800) | |
| Debt service | Debt service | — | | | (14,725) | | | (65,000) | | | (29,721) | | Debt service | — | | | — | | | — | | | (65,000) | |
| Financing fees | Financing fees | — | | | (3,244) | | | (815) | | | (3,244) | | Financing fees | — | | | — | | | — | | | (815) | |
| Maintenance capital expenditures | Maintenance capital expenditures | (7,981) | | | (2,855) | | | (13,109) | | | (4,939) | | Maintenance capital expenditures | (5,691) | | | (7,981) | | | (9,191) | | | (13,109) | |
| Utility pass-through | Utility pass-through | (675) | | | 4,145 | | | (1,350) | | | 4,145 | | Utility pass-through | (675) | | | (675) | | | (1,350) | | | (1,350) | |
| Major scheduled expenditures | | Major scheduled expenditures | 662 | | | — | | | 662 | | | — | |
| Common units repurchased | Common units repurchased | — | | | — | | | (12,397) | | | (529) | | Common units repurchased | — | | | — | | | — | | | (12,397) | |
| | Net cash proceeds from the 45Q Transaction | | Net cash proceeds from the 45Q Transaction | (701) | | | — | | | 17,351 | | | — | |
| Other (reserves) releases: | Other (reserves) releases: | | Other (reserves) releases: | |
| Reserve for recapture of prior negative available cash | — | | | (14,980) | | | — | | | (14,980) | | |
| | Future turnaround | Future turnaround | (9,875) | | | (1,403) | | | (16,750) | | | (2,880) | | Future turnaround | (3,334) | | | (9,875) | | | (6,500) | | | (16,750) | |
| Previously established cash reserves | — | | | — | | | — | | | 5,308 | | |
| | | Cash reserves for future operating needs | Cash reserves for future operating needs | (15,000) | | | — | | | (15,000) | | | — | | Cash reserves for future operating needs | (20,000) | | | (15,000) | | | (20,000) | | | (15,000) | |
| Reserve for maintenance capital expenditures | 974 | | | — | | | 1,613 | | | — | | |
| Reserve for capital growth expenditures | | Reserve for capital growth expenditures | (4,550) | | | 974 | | | (20,800) | | | 1,613 | |
Available Cash for distribution (1) (2) | Available Cash for distribution (1) (2) | $ | 106,206 | | | $ | 18,411 | | | $ | 130,041 | | | $ | 9,308 | | Available Cash for distribution (1) (2) | $ | 43,778 | | | $ | 106,206 | | | $ | 154,071 | | | $ | 130,041 | |
| | | Common units outstanding | Common units outstanding | 10,570 | | | 10,681 | | | 10,570 | | | 10,681 | | Common units outstanding | 10,570 | | | 10,570 | | | 10,570 | | | 10,570 | |
(1)Amount represents the cumulative available cash based on quarter-to-date and year-to-date results. However, available cash for distribution is calculated quarterly, with distributions (if any) being paid in the period following declaration.
(2)The Partnership declared and paid a $5.24$10.50 and $2.26$10.43 cash distribution related to the fourth quarter of 20212022 and first quarter of 2022,2023, respectively, and declared a cash distribution of $10.05$4.14 per common unit related to the second quarter of 20222023 to be paid in August 2022.2023.
Liquidity and Capital Resources
Our principal source of liquidity has historically been and continues to be cash from operations, which can include cash advances from customers resulting from prepay contracts. Our principal uses of cash are for working capital, capital expenditures, funding our debt service obligations, and paying distributions to our unitholders, as further discussed below.
Fertilizer market conditions improved steadilywere volatile throughout 2021 and into 2022 driven by a combination of increased demand for products amid a series of supply disruptions including the Russia-Ukraine conflict, that led to tight fertilizer
inventories and concerns around the availability of product. In early 2021, as the impactsThe Russian invasion of the COVID-19 pandemic started to recover, Winter Storm Uri caused unprecedented disruptions to natural gas and electricity supply throughout the Midwest and Gulf Coast regions, leading to lower fertilizer supply due to production outages which increased the price of fertilizer. In the summer of 2021, numerous U.S. nitrogen fertilizer facilities underwent turnarounds, several of which extended longer than planned due to start-up issues. Additionally,Ukraine in August 2021, Hurricane Ida caused additional fertilizer facility disruptions in the Gulf Coast, while the energy crunch in Europe and Asia reduced available supplies of nitrogen fertilizers further and caused prices to increase once more. In the first quarter of 2022 added to the supply concerns, which increased further following the Russian invasionshutdown of Ukraine,the Nordstream pipeline in the summer of 2022 and the resulting spike in European natural gas prices that led many European nitrogen fertilizer production facilities to cease or curtail operations. Following a mild winter in the U.S. and Europe, natural gas prices increased furtherdeclined significantly in 2023, which in turn drove prices lower for nitrogen fertilizers as supply fears were abated and have been volatile over concerns of a reduction in global supply of fertilizers duecurtailed European production capacity began to restrictions on supply of Russian fertilizers and Russia’s decision to restrict fertilizer exports through the end of 2022.restart. Despite the volatility in recent commodity pricing, the increase innitrogen fertilizer product pricing has had a favorable impact to our businessremains well above the recent 5-year average and has not significantly impacted our primary source of liquidity. While we believe demand for our fertilizer products is stable, there is still uncertainty on the horizon as countries and states continue to monitor their efforts against COVID-19, and variants thereof, and weigh potential impacts of the ongoing Russia-Ukraine conflict. In executing financial discipline, we successfully implemented the following measures:
•Deferred the planned turnarounds at the Coffeyville and East Dubuque Facilities after taking advantage of downtime in 2021 to complete maintenance activities; and
•Focused maintenance capital expenditures to only include those projects which are a priority to support continuing safe and reliable operations, or which are considered critical to support future activities.
When considering the market conditions and actions described above, we currently believe that our cash from operations and existing cash and cash equivalents, along with borrowings and reserves, as necessary, will be sufficient to satisfy anticipated cash requirements associated with our existing operations for at least the next 12 months. However, our future capital expenditures and other cash requirements could be higher than we currently expect as a result of various factors including, but not limited to, rising material and labor costs and other inflationary pressures. Additionally, our ability to generate sufficient cash from our operating activities and secure additional financing depends on our future performance, which is subject to general economic, political, financial, competitive, and other factors, some of which may be beyond our control.
Depending on the needs of our business, contractual limitations, and market conditions, we may from time to time seek to issue equity securities, incur additional debt, issue debt securities, or redeem, repurchase, refinance, or retire our outstanding debt through privately negotiated transactions, open market repurchases, redemptions, exchanges, tender offers or otherwise, but we are under no obligation to do so. There can be no assurance that we will seek to do any of the foregoing or that we will be able to do any of the foregoing on terms acceptable to us or at all.
On February 22, 2022, the Partnership redeemed the remaining $65 million in aggregate principal amount of its 2023 Notes at par, plus accrued and unpaid interest. This transaction represents a significant and favorable change in the Partnership’s cash flow and liquidity position, with annual savings of approximately $6 million in future interest expense. See Note 8 (“Long-Term Debt”) of this Report for further discussion. The Partnership and its subsidiaries were in compliance with all covenants under their respective debt instruments as of June 30, 2022,2023, as applicable.
We do not have any “off-balance sheet arrangements” as such term is defined within the rules and regulations of the SEC.
Cash and Other Liquidity
As of June 30, 2022,2023, we had cash and cash equivalents of $156.3$68.7 million, including $4.2$19.9 million of customer advances.dividends received from the equity method investment. Combined with $35.0 million available under our ABL Credit Facility, we had total liquidity of $191.3$103.7 million. As of December 31, 2021,2022, we had $112.5$86.3 million in cash and cash equivalents, including $34.2$13.7 million of customer advances. Long-term debt consists of the following:
| | | | | | | | | | | |
| (in thousands) | June 30, 2022 | | December 31, 2021 |
9.25% Senior Secured Notes, due June 2023 (1) | $ | — | | | $ | 65,000 | |
| 6.125% Senior Secured Notes, due June 2028 | 550,000 | | | 550,000 | |
| Unamortized discount and debt issuance costs | (3,442) | | | (4,358) | |
| Total long-term debt | $ | 546,558 | | | $ | 610,642 | |
| | | |
| | | |
(1)The $65 million outstanding balance of the 2023 Notes was paid in full on February 22, 2022 at par, plus accrued and unpaid interest. | | | | | | | | | | | |
| (in thousands) | June 30, 2023 | | December 31, 2022 |
| 6.125% Senior Secured Notes, due June 2028 | $ | 550,000 | | | $ | 550,000 | |
| Unamortized discount and debt issuance costs | (2,950) | | | (3,200) | |
| Total long-term debt | $ | 547,050 | | | $ | 546,800 | |
| | | |
| | | |
As of June 30, 2022,2023, the Partnership had the 6.125% Senior Secured Notes, due June 2028 (the “2028 Notes”) and the ABL Credit Facility, the proceeds of which may be used to fund working capital, capital expenditures, and for other general corporate purposes. Refer to Part I, Item 1, Note 8 (“Long-Term Debt”) of this Report and Part II, Item 8, Note 5 (“Long-Term Debt”) of our 20212022 Form 10-K for further information.
Capital Spending
We divide capital spending needs into two categories: maintenance and growth. Maintenance capital spending includes non-discretionary maintenance projects and projects required to comply with environmental, health, and safety regulations. Growth capital projects generally involve an expansion of existing capacity and/or a reduction in direct operating expenses. We undertake growth capital spending based on the expected return on incremental capital employed.
Our total capital expenditures for the six months ended June 30, 2022,2023, along with our estimated expenditures for 20222023 are as follows:
| | | Six Months Ended June 30, | | Estimated full year | | Six Months Ended June 30, | | Estimated full year |
| (in thousands) | (in thousands) | 2022 | | 2022 | (in thousands) | 2023 | | 2023 |
| Maintenance capital | Maintenance capital | $ | 13,109 | | | $43,000 - 45,000 | Maintenance capital | $ | 9,191 | | | $31,000 - 32,000 |
| Growth capital | Growth capital | 553 | | | 1,000 - 2,000 | Growth capital | 623 | | | 2,000 - 3,000 |
| Total capital expenditures | Total capital expenditures | $ | 13,662 | | | $44,000 - 47,000 | Total capital expenditures | $ | 9,814 | | | $33,000 - 35,000 |
Our estimated capital expenditures are subject to change due to unanticipated changes in the cost, scope, and completion time for capital projects. For example, we may experience unexpected changes in labor or equipment costs necessary to comply with government regulations or to complete projects that sustain or improve the profitability of the nitrogen fertilizer facilities. We may also accelerate or defer some capital expenditures from time to time. Capital spending for CVR Partners is determined by the Board. We will continue to monitor market conditions and make adjustments, if needed, to our current capital spending or turnaround plans.
A
The planned turnaround at the Coffeyville Facility commenced in July 2022 and is expected to bewas completed in early to mid-August 2022, with an estimated cost of $12 to $15 million.2022. The planned turnaround at ourthe East Dubuque Facility is expected to commence duringcommenced in August 2022 with an estimated cost of $19 to $21 million.and was completed in mid-September 2022. For the three and six months ended June 30, 2022, we incurred turnaround expense of $0.2 million and $0.3 million, respectively,
related to the Coffeyville Facility’s turnaround, and $0.8 million and $1.3 million, respectively, related to the East Dubuque Facility’s turnaround. The next planned turnarounds are currently scheduled to take place in 2025 and 2026 for the Coffeyville Facility and the East Dubuque Facility, respectively. For the three and six months ended June 30, 2023, we have incurred $0.7 million in turnaround expense for both periods related to planning for the Coffeyville Facility’s expected turnaround and $0.8 million and $1.3 million, respectively,a nominal amount in turnaround expense related to planning for the East Dubuque Facility’s expected turnaround. We will continue to monitor market conditions and make adjustments, if needed, to our current capital spending or turnaround plans.
Distributions to Unitholders
The current policy of the Board is to distribute all Available Cash, as determined by the Board in its sole discretion, the Partnership generated on a quarterly basis. Available Cash for each quarter will be determined by the Board following the end of such quarter. Available Cash for each quarter is calculated as EBITDA for the quarter excluding non-cash income or expense items (if any), for which adjustment is deemed necessary or appropriate by the Board in its sole discretion, less (i) reserves for maintenance capital expenditures, debt service and other contractual obligations, and (ii) reserves for future operating or capital needs (if any), in each case, that the Board deems necessary or appropriate in its sole discretion. Available cash for distribution may be increased by the release of previously established cash reserves, if any, and other excess cash, at the discretion of the Board.
Distributions, if any, including the payment, amount, and timing thereof, and the Board’s distribution policy, including the definition of Available Cash, are subject to change at the discretion of the Board. The following tables present quarterly distributions paid by the Partnership to CVR Partners’ unitholders, including amounts paid to CVR Energy, during 2023 and 2022 and 2021.(amounts presented in the table below may not add to totals presented due to rounding):
| | | | | | | | | | | | | | | | | | | | | | | | | | | | | | | | |
| | | | | | Distributions Paid (in thousands) |
| Related Period | | Date Paid | | Distribution Per
Common Unit | | Public Unitholders | | CVR Energy | | Total |
| 2021 - 4th Quarter | | March 14, 2022 | | $ | 5.24 | | | $ | 35,576 | | | $ | 20,394 | | | $ | 55,970 | |
| 2022 - 1st Quarter | | May 23, 2022 | | 2.26 | | | 15,091 | | | 8,796 | | | 23,887 | |
| | | | | | | | | | |
| Total 2022 distributions | | $ | 7.50 | | | $ | 50,667 | | | $ | 29,190 | | | $ | 79,857 | |
| | | | | | | | | | | | | | | | | | | | | | | | | | | | | | | | |
| | | | | | Quarterly Distributions Paid (in thousands) |
| Related Period | | Date Paid | | Quarterly Distributions
Per Common Unit | | Public Unitholders | | CVR Energy | | Total |
| 2022 - 4th Quarter | | March 13, 2023 | | $ | 10.50 | | | $ | 70,115 | | | $ | 40,866 | | | $ | 110,981 | |
| 2023 - 1st Quarter | | May 22, 2023 | | 10.43 | | | 69,647 | | | 40,594 | | | 110,241 | |
| | | | | | | | | | |
| | | | | | | | | | |
| Total 2023 quarterly distributions | | $ | 20.93 | | | $ | 139,762 | | | $ | 81,460 | | | $ | 221,222 | |
| | | | | | | | | | | | | | | | | | | | | | | | | | | | | | | | |
| | | | | | | | | | |
| | | | | | Distributions Paid (in thousands) |
| Related Period | | Date Paid | | Distribution Per
Common Unit | | Public Unitholders | | CVR Energy | | Total |
| | | | | | | | | | |
| | | | | | | | | | |
| 2021 - 2nd Quarter | | August 23, 2021 | | $ | 1.72 | | | $ | 11,678 | | | $ | 6,694 | | | $ | 18,372 | |
| 2021 - 3rd Quarter | | November 23, 2021 | | 2.93 | | | 19,893 | | | 11,404 | | | 31,297 | |
| Total 2021 distributions | | $ | 4.65 | | | $ | 31,571 | | | $ | 18,098 | | | $ | 49,669 | |
There were no distributions declared or paid by the Partnership related to the first quarter of 2021 and fourth quarter of 2020. | | | | | | | | | | | | | | | | | | | | | | | | | | | | | | | | |
| | | | | | Quarterly Distributions Paid (in thousands) |
| Related Period | | Date Paid | | Quarterly Distributions
Per Common Unit | | Public Unitholders | | CVR Energy | | Total |
| 2021 - 4th Quarter | | March 14, 2022 | | $ | 5.24 | | | $ | 35,576 | | | $ | 20,394 | | | $ | 55,970 | |
| 2022 - 1st Quarter | | May 23, 2022 | | 2.26 | | | 15,091 | | | 8,796 | | | 23,887 | |
| 2022 - 2nd Quarter | | August 22, 2022 | | 10.05 | | | 67,109 | | | 39,115 | | | 106,225 | |
| 2022 - 3rd Quarter | | November 21, 2022 | | 1.77 | | | 11,819 | | | 6,889 | | | 18,708 | |
| Total 2022 quarterly distributions | | $ | 19.32 | | | $ | 129,597 | | | $ | 75,193 | | | $ | 204,790 | |
For the second quarter of 2022,2023, the Partnership, upon approval by the Board on August 1, 2022,July 31, 2023, declared a distribution of $10.05$4.14 per common unit, or $106.2$43.8 million, which is payable August 22, 202221, 2023 to unitholders of record as of August 12, 2022.14, 2023. Of this amount, CVR Energy will receive approximately $39.1$16.1 million, with the remaining amount payable to public unitholders.
Capital Structure
On May 6, 2020, the Board, on behalf of the Partnership, authorized a unit repurchase program (the “Unit Repurchase Program”), which was increased on February 22, 2021. The Unit Repurchase Program, as increased, authorized the Partnership to repurchase up to $20 million of the Partnership’s common units. During the three and six months ended June 30, 2023 and the three months ended June 30, 2022, and 2021, the Partnership did not repurchase any common units. During the six months ended June 30, 2022, and 2021, the Partnership repurchased 111,695 and 24,378 common units respectively, on the open market in accordance with a repurchase agreement under Rules 10b5-1 and 10b-18 of the Securities Exchange Act of 1934, as amended, at a cost of $12.4 million, and $0.5 million, respectively, exclusive of transaction costs, or an average price of $110.98 and $21.69 per common unit, respectively.unit. As of June 30, 2022,2023, the Partnership, considering all repurchases made since inception of the Unit Repurchase Program, had a nominal authorized amount in authority remaining under the Unit Repurchase Program. This Unit Repurchase Program does not obligate the Partnership to repurchaseacquire any common units and may be cancelled or terminated by the Board at any time.
Cash Flows
The following table sets forth our cash flows for the periods indicated below:
| | | | | | | | | | | | | | | | | |
| Six Months Ended June 30, |
| (in thousands) | 2022 | | 2021 | | Change |
| Net cash flow provided by (used in): | | | | | |
| Operating activities | $ | 215,611 | | | $ | 22,979 | | | $ | 192,632 | |
| Investing activities | (13,730) | | | (5,344) | | | (8,386) | |
| Financing activities | (158,085) | | | (5,375) | | | (152,710) | |
| Net increase in cash and cash equivalents | $ | 43,796 | | | $ | 12,260 | | | $ | 31,536 | |
The following table sets forth our cash flows for the periods indicated below:
| | | | | | | | | | | | | | | | | |
| Six Months Ended June 30, |
| (in thousands) | 2023 | | 2022 | | Change |
| Net cash flow provided by (used in): | | | | | |
| Operating activities | $ | 191,287 | | | $ | 215,611 | | | $ | (24,324) | |
| Investing activities | 12,294 | | | (13,730) | | | 26,024 | |
| Financing activities | (221,221) | | | (158,085) | | | (63,136) | |
| Net (decrease) increase in cash and cash equivalents | $ | (17,640) | | | $ | 43,796 | | | $ | (61,436) | |
Cash Flows Provided by Operating Activities
The change in net cash flows from operating activities for the six months ended June 30, 2022 as2023 compared to the six months ended June 30, 20212022 is primarily due to a $214.5$49.5 million increasedecrease in EBITDA,net income during 2023 primarily due to lower product sales prices, a favorable change of $7.1$7.2 million in loss on extinguishment of debt, and a $1.4 million increasedecrease in non-cash share-based compensation as a result of higherlower market prices for CVR Partners’ units. These areunits in 2023 compared to 2022, and a decrease in depreciation and amortization of $5.7 million as a result of various assets being fully depreciated prior to the start of the current period. This is partially offset by unfavorable changesan increase in working capital of $33.0 million and a reduction of $1.7 million in non-cash amortization of deferred financing costs.$38.2 million.
Cash Flows Used in Investing Activities
The change in net cash used inprovided by investing activities for the six months ended June 30, 20222023 compared to the six months ended June 30, 2021,2022 was due to an increasedistributions received from CVR Partners’ equity method investment of $20 million associated with the 45Q Transaction, and a decrease in capital expenditures during 20222023 of $8.4$6.2 million resulting from fixed asset additions.additions related to both facilities’ turnarounds completed in 2022.
Cash Flows Used in Financing Activities
The change in net cash used in financing activities for the six months ended June 30, 20222023 compared to the six months ended June 30, 20212022 was primarily due to thean increase in cash distributions paid of $79.9$141.4 million in 20222023 compared to no distributions in 2021, a change2022, changes of $62.8$65.0 million infrom the redemption of the remaining balance of the 2023 Notes in 2022 and the 6.5% Notes due April 2021 in 2021, and an increase of $11.9$12.4 million infrom unit repurchases of the Partnership’s common units in 2022, compared to 2021. This is partially offset byneither having a $1.7 million reductioncorresponding amount in the payment of deferred financing costs during 2022 compared to 2021. Additionally, in June 2021, the Partnership completed a private offering of $550 million aggregate principal amount of the 2028 UAN Notes and used the proceeds, plus cash on hand, to redeem a portion of the 2023 UAN Notes.2023.
Critical Accounting Estimates
Our critical accounting estimates are disclosed in the “Critical Accounting Estimates” section of our 20212022 Form 10-K. No modifications have been made during the three and six months ended June 30, 20222023 to these estimates.
Item 3. Quantitative and Qualitative Disclosures About Market Risk
There have been no material changes to our market risks as of and for the three and six months ended June 30, 20222023 as compared to the risks discussed in Part II, Item 7A of our 20212022 Form 10-K.
Item 4. Controls and Procedures
Evaluation of Disclosure Controls and Procedures
The Partnership has evaluated, under the direction and with the participation of the Executive Chairman, Chief Executive Officer, and Chief Financial Officer, the effectiveness of our disclosure controls and procedures, as defined in Exchange Act Rule 13a-15(e) and 15d-15(e). Based upon this evaluation, the Partnership’s Executive Chairman, Chief Executive Officer, and Chief Financial Officer concluded that disclosure controls and procedures were effective as of June 30, 2022.2023.
Changes in Internal Control Over Financial Reporting
There have been no material changes in the Partnership’s internal controls over financial reporting required by Rule 13a-15 of the Exchange Act that occurred during the fiscal quarter ended June 30, 20222023 that materially affected, or is reasonably likely to materially affect, the Partnership’s internal control over financial reporting.
PART II. OTHER INFORMATION
Item 1. Legal Proceedings
See Part I, Item 1, Note 11 (“Commitments and Contingencies”) of this Report, which is incorporated by reference into this Part II, Item 1, for a description of certain litigation, legal, and administrative proceedings and environmental matters.
Item 1A. Risk Factors
There have been no material changes from the risk factors previously disclosed in Part I, Item 1A of our 20212022 Form 10-K, which risk factors could be affected by the potential effects of the Russia-Ukraine conflict.10-K. Additional risks and uncertainties, including risks and uncertainties not presently known to us, or that we currently deem immaterial, could also have an adverse effect on our business, financial condition, and/or results of operations.
Item 5. Other Information
None.During the three months ended June 30, 2023, no director or officer of the General Partner adopted or terminated a “Rule 10b5-1 trading arrangement” or “non-Rule 10b5-1 trading arrangement,” as each term is defined in Item 408(a) of Regulation S-K.
Item 6. Exhibits | | | | | | | | |
| INDEX TO EXHIBITS |
| Exhibit Number | | Exhibit Description |
| | |
10.1 ** | | |
| 31.1* | | |
| 31.2* | | |
| 31.3* | | |
| 31.4* | | |
| 32.1† | | |
| 101* | | The following financial information for CVR Partners, LP’s Quarterly Report on Form 10-Q for the quarter ended June 30, 2022,2023, formatted Inline XBRL (“Extensible Business Reporting Language”) includes: (1) Condensed Consolidated Balance Sheets (unaudited), (2) Condensed Consolidated Statements of Operations (unaudited), (3) Condensed Consolidated Statements of Partners’ Capital (unaudited), (4) Condensed Consolidated Statements of Cash Flows (unaudited) and (5) the Notes to Condensed Consolidated Financial Statements (unaudited), tagged in detail. |
| 104* | | Cover Page Interactive Data File (formatted as Inline XBRL and contained in Exhibit 101). |
| | |
| | |
| | |
| | |
* Filed herewith.
** Previously filed.
† Furnished herewith.
+ Denotes management contract or compensatory plan or arrangement.
PLEASE NOTE: Pursuant to the rules and regulations of the SEC, we may file or incorporate by reference agreements referenced as exhibits to the reports that we file with or furnish to the SEC. The agreements are filed to provide investors with information regarding their respective terms. The agreements are not intended to provide any other factual information about the Partnership, its business or operations. In particular, the assertions embodied in any representations, warranties and covenants contained in the agreements may be subject to qualifications with respect to knowledge and materiality different from those applicable to investors and may be qualified by information in confidential disclosure schedules not included with the exhibits. These disclosure schedules may contain information that modifies, qualifies and creates exceptions to the representations, warranties and covenants set forth in the agreements. Moreover, certain representations, warranties and covenants in the agreements may have been used for the purpose of allocating risk between the parties, rather than establishing matters as facts. In addition, information concerning the subject matter of the representations, warranties and covenants may have changed after the date of the respective agreement, which subsequent information may or may not be fully reflected in the Partnership’s public disclosures. Accordingly, investors should not rely on the representations, warranties and covenants in the agreements as characterizations of the actual state of facts about the Partnership, its business or operations on the date hereof.
SIGNATURES
Pursuant to the requirements of the Securities Exchange Act of 1934, the registrant has duly caused this report to be signed on its behalf by the undersigned thereunto duly authorized.
| | | | | | | | | | | |
| | CVR Partners, LP |
| | By: | CVR GP, LLC, its general partner |
| | | |
August 2, 20221, 2023 | | By: | /s/ Dane J. Neumann |
| | | Executive Vice President, Chief Financial
Officer, Treasurer and Assistant Secretary |
| | | (Principal Financial Officer) |
| | | |
| | | |
August 2, 20221, 2023 | | By: | /s/ Jeffrey D. Conaway |
| | | Vice President, Chief Accounting Officer
and Corporate Controller |
| | | (Principal Accounting Officer) |
| | | |