UNITED STATES
SECURITIES AND EXCHANGE COMMISSION
Washington, D.C. 20549
FORM 10-Q
|
| | | | |
ý☒ | QUARTERLY REPORT PURSUANT TO SECTION 13 OR 15(d) OF THE SECURITIES EXCHANGE ACT OF 1934 |
For the Quarterly Period Ended SeptemberJune 30, 20172021
Or
|
| | | | |
o☐ | TRANSITION REPORT PURSUANT TO SECTION 13 OR 15(d) OF THE SECURITIES EXCHANGE ACT OF 1934 |
For the transition period from to
Commission File No. 001-34063
LendingTree, Inc.
(Exact name of Registrant as specified in its charter)
|
| | | | | | | |
Delaware | | 26-2414818 |
| (State or other jurisdiction of incorporation or organization) | | 26-2414818
(I.R.S. Employer Identification No.) |
11115 Rushmore Drive,1415 Vantage Park Dr., Suite 700, Charlotte, North Carolina 2827728203
(Address of principal executive offices)(Zip Code)
(704) 541-5351
(Registrant's telephone number, including area code)
Securities registered pursuant to Section 12(b) of the Act:
| | | | | | | | | | | | | | |
| Title of each class | | Trading Symbol(s) | | Name of each exchange on which registered |
| Common Stock, $0.01 par value per share | | TREE | | The Nasdaq Stock Market LLC |
Indicate by check mark whether the Registrantregistrant (1) has filed all reports required to be filed by Section 13 or 15(d) of the Securities Exchange Act of 1934 during the preceding 12 months (or for such shorter period that the registrant was required to file such reports), and (2) has been subject to such filing requirements for the past 90 days. Yes ý☒ No o☐
Indicate by check mark whether the Registrantregistrant has submitted electronically and posted on its corporate Web site, if any, every Interactive Data File required to be submitted and posted pursuant to Rule 405 of Regulation S-T (§232.405 of this chapter) during the preceding 12 months (or for such shorter period that the Registrantregistrant was required to submit and post such files). Yes ý☒ No o☐
Indicate by check mark whether the Registrantregistrant is a large accelerated filer, an accelerated filer, a non-accelerated filer, a smaller reporting company, or an emerging growth company. See the definitions of "large accelerated filer," "accelerated filer," "smaller reporting company"company," and "emerging growth company" in Rule 12b-2 of the Exchange Act.
| | | | | | | | | | | | | | |
| Large accelerated filer | ☒ | | Accelerated filer | ☐ |
| Non-accelerated filer | ☐ | | Smaller reporting company | ☐ |
| | |
Large accelerated filer o
| | Accelerated filer x
|
Non-accelerated filer o
| | Smaller reporting company o
|
(Do not check if a smaller reporting company) | | |
| | Emerging growth companyo | ☐ |
If an emerging growth company, indicate by check mark if the registrant has elected not to use the extended transition period for complying with any new or revised financial accounting standards provided pursuant to Section 13(a) of the Exchange Act. o☐
Indicate by check mark whether the Registrantregistrant is a shell company (as defined in Rule 12b-2 of the Exchange Act). Yes o☐ No ý☒
As of OctoberJuly 23, 2017,2021, there were 11,968,79813,315,038 shares of the Registrant'sregistrant's common stock, par value $.01 per share, outstanding, excluding treasury shares.
PART I—FINANCIAL INFORMATION
Item 1. Financial Statements
LENDINGTREE, INC. AND SUBSIDIARIES
CONSOLIDATED STATEMENTS OF OPERATIONS AND COMPREHENSIVE INCOME
|
| | | | | | | | | | | | | | | |
| | Three Months Ended
September 30, |
| Nine Months Ended
September 30, |
| | 2017 |
| 2016 |
| 2017 |
| 2016 |
| | (in thousands, except per share amounts) |
| Revenue | $ | 171,494 |
|
| $ | 94,558 |
|
| $ | 456,782 |
|
| $ | 283,561 |
|
| Costs and expenses: | |
|
| |
|
| |
|
| |
|
Cost of revenue (exclusive of depreciation and amortization shown separately below) | 4,388 |
|
| 3,392 |
|
| 12,143 |
|
| 10,329 |
|
| Selling and marketing expense | 118,538 |
|
| 62,819 |
|
| 320,930 |
|
| 192,416 |
|
| General and administrative expense | 17,920 |
|
| 9,008 |
|
| 41,561 |
|
| 26,820 |
|
| Product development | 4,805 |
|
| 3,718 |
|
| 12,492 |
|
| 11,384 |
|
| Depreciation | 1,798 |
|
| 1,286 |
|
| 5,309 |
|
| 3,458 |
|
| Amortization of intangibles | 3,817 |
|
| 166 |
|
| 9,034 |
|
| 263 |
|
| Change in fair value of contingent consideration | 2,501 |
|
| — |
|
| 20,640 |
|
| — |
|
| Severance | — |
|
| — |
|
| 404 |
|
| 72 |
|
| Litigation settlements and contingencies | 272 |
|
| 19 |
|
| 961 |
|
| 109 |
|
| Total costs and expenses | 154,039 |
|
| 80,408 |
|
| 423,474 |
|
| 244,851 |
|
| Operating income | 17,455 |
|
| 14,150 |
|
| 33,308 |
|
| 38,710 |
|
| Other income (expense), net: | |
|
| |
|
| |
|
| |
|
| Interest expense, net | (2,804 | ) |
| (141 | ) |
| (4,048 | ) |
| (424 | ) |
| Other (expense) income | (228 | ) |
| — |
|
| (215 | ) | | — |
|
| Income before income taxes | 14,423 |
|
| 14,009 |
|
| 29,045 |
|
| 38,286 |
|
| Income tax expense | (4,292 | ) |
| (6,729 | ) |
| (3,109 | ) |
| (15,099 | ) |
| Net income from continuing operations | 10,131 |
|
| 7,280 |
|
| 25,936 |
|
| 23,187 |
|
| Loss from discontinued operations, net of tax | (1,011 | ) |
| (664 | ) |
| (2,632 | ) |
| (3,017 | ) |
| Net income and comprehensive income | $ | 9,120 |
|
| $ | 6,616 |
|
| $ | 23,304 |
|
| $ | 20,170 |
|
|
|
|
|
|
|
|
|
|
|
|
|
| Weighted average shares outstanding: |
|
|
|
|
|
|
|
|
|
|
|
| Basic | 11,999 |
|
| 11,754 |
|
| 11,931 |
|
| 11,827 |
|
| Diluted | 13,774 |
|
| 12,742 |
|
| 13,625 |
|
| 12,782 |
|
| Income per share from continuing operations: | |
|
| |
|
| |
|
| |
|
| Basic | $ | 0.84 |
|
| $ | 0.62 |
|
| $ | 2.17 |
|
| $ | 1.96 |
|
| Diluted | $ | 0.74 |
|
| $ | 0.57 |
|
| $ | 1.90 |
|
| $ | 1.81 |
|
| Loss per share from discontinued operations: | |
|
| |
|
| |
|
| |
|
| Basic | $ | (0.08 | ) |
| $ | (0.06 | ) |
| $ | (0.22 | ) |
| $ | (0.26 | ) |
| Diluted | $ | (0.07 | ) |
| $ | (0.05 | ) |
| $ | (0.19 | ) |
| $ | (0.24 | ) |
| Net income per share: | |
|
| |
|
| |
|
| |
|
| Basic | $ | 0.76 |
|
| $ | 0.56 |
|
| $ | 1.95 |
|
| $ | 1.71 |
|
| Diluted | $ | 0.66 |
|
| $ | 0.52 |
|
| $ | 1.71 |
|
| $ | 1.58 |
|
| | | | | | | | | | | | | | | | | | | | | | | |
| | Three Months Ended
June 30, | | Six Months Ended
June 30, |
| | 2021 | | 2020 | | 2021 | | 2020 |
| | (in thousands, except per share amounts) |
| Revenue | $ | 270,014 | | | $ | 184,326 | | | $ | 542,764 | | | $ | 467,410 | |
| Costs and expenses: | | | | | | | |
Cost of revenue (exclusive of depreciation and amortization shown separately below) | 13,934 | | | 13,464 | | | 27,829 | | | 27,716 | |
| Selling and marketing expense | 185,206 | | | 113,921 | | | 382,668 | | | 309,459 | |
| General and administrative expense | 39,811 | | | 28,489 | | | 74,800 | | | 60,571 | |
| Product development | 13,290 | | | 10,812 | | | 25,758 | | | 21,775 | |
| Depreciation | 4,443 | | | 3,550 | | | 8,161 | | | 6,928 | |
| Amortization of intangibles | 11,310 | | | 13,756 | | | 22,622 | | | 27,513 | |
| Change in fair value of contingent consideration | (8,850) | | | 9,175 | | | (8,053) | | | 1,053 | |
| Severance | 0 | | | 32 | | | 0 | | | 190 | |
| Litigation settlements and contingencies | 322 | | | (1,325) | | | 338 | | | (996) | |
| Total costs and expenses | 259,466 | | | 191,874 | | | 534,123 | | | 454,209 | |
| Operating income (loss) | 10,548 | | | (7,548) | | | 8,641 | | | 13,201 | |
| Other (expense) income, net: | | | | | | | |
| Interest expense, net | (9,840) | | | (4,955) | | | (20,055) | | | (9,789) | |
| Other income | 0 | | | 7 | | | 40,072 | | | 7 | |
| Income (loss) before income taxes | 708 | | | (12,496) | | | 28,658 | | | 3,419 | |
| Income tax benefit | 9,092 | | | 3,880 | | | 454 | | | 6,941 | |
| Net income (loss) from continuing operations | 9,800 | | | (8,616) | | | 29,112 | | | 10,360 | |
| Loss from discontinued operations, net of tax | (3,199) | | | (21,141) | | | (3,462) | | | (25,716) | |
| Net income (loss) and comprehensive income (loss) | $ | 6,601 | | | $ | (29,757) | | | $ | 25,650 | | | $ | (15,356) | |
| | | | | | | |
| Weighted average shares outstanding: | | | | | | | |
| Basic | 13,243 | | | 12,984 | | | 13,157 | | | 12,971 | |
| Diluted | 13,719 | | | 12,984 | | | 13,913 | | | 13,954 | |
| Income (loss) per share from continuing operations: | | | | | | | |
| Basic | $ | 0.74 | | | $ | (0.66) | | | $ | 2.21 | | | $ | 0.80 | |
| Diluted | $ | 0.71 | | | $ | (0.66) | | | $ | 2.09 | | | $ | 0.74 | |
| Loss per share from discontinued operations: | | | | | | | |
| Basic | $ | (0.24) | | | $ | (1.63) | | | $ | (0.26) | | | $ | (1.98) | |
| Diluted | $ | (0.23) | | | $ | (1.63) | | | $ | (0.25) | | | $ | (1.84) | |
| Net income (loss) per share: | | | | | | | |
| Basic | $ | 0.50 | | | $ | (2.29) | | | $ | 1.95 | | | $ | (1.18) | |
| Diluted | $ | 0.48 | | | $ | (2.29) | | | $ | 1.84 | | | $ | (1.10) | |
The accompanying notes to consolidated financial statements are an integral part of these statements.
LENDINGTREE, INC. AND SUBSIDIARIES
CONSOLIDATED BALANCE SHEETS
(Unaudited)
| | | | September 30,
2017 |
| December 31,
2016 | | June 30,
2021 | | December 31, 2020 |
| | (in thousands, except par value and share amounts) | | (in thousands, except par value and share amounts) |
| ASSETS: | |
|
| |
| ASSETS: | | | |
| Cash and cash equivalents | $ | 345,239 |
|
| $ | 91,131 |
| Cash and cash equivalents | $ | 203,164 | | | $ | 169,932 | |
| Restricted cash and cash equivalents | 4,087 |
|
| 4,089 |
| Restricted cash and cash equivalents | 83 | | | 117 | |
| Accounts receivable (net of allowance of $1,260 and $1,059, respectively) | 64,128 |
|
| 41,382 |
| |
| Accounts receivable (net of allowance of $1,473 and $1,402, respectively) | | Accounts receivable (net of allowance of $1,473 and $1,402, respectively) | 124,076 | | | 89,841 | |
| Prepaid and other current assets | 9,690 |
|
| 4,021 |
| Prepaid and other current assets | 18,211 | | | 27,949 | |
| Current assets of discontinued operations | | Current assets of discontinued operations | 0 | | | 8,570 | |
| Total current assets | 423,144 |
|
| 140,623 |
| Total current assets | 345,534 | | | 296,409 | |
| Property and equipment (net of accumulated depreciation of $12,172 and $9,739, respectively) | 35,345 |
|
| 35,462 |
| |
| Property and equipment (net of accumulated depreciation of $23,696 and $20,238, respectively) | | Property and equipment (net of accumulated depreciation of $23,696 and $20,238, respectively) | 74,701 | | | 62,381 | |
| Operating lease right-of-use assets | | Operating lease right-of-use assets | 79,967 | | | 84,109 | |
| Goodwill | 113,558 |
|
| 56,457 |
| Goodwill | 420,139 | | | 420,139 | |
| Intangible assets, net | 85,265 |
|
| 71,684 |
| Intangible assets, net | 105,880 | | | 128,502 | |
| Deferred income tax assets | 17,737 |
|
| 14,610 |
| Deferred income tax assets | 96,679 | | | 96,224 | |
| Equity investment | | Equity investment | 121,253 | | | 80,000 | |
| Other non-current assets | 826 |
|
| 810 |
| Other non-current assets | 5,440 | | | 5,334 | |
| Non-current assets of discontinued operations | 3,781 |
|
| 3,781 |
| Non-current assets of discontinued operations | 17,044 | | | 15,892 | |
| Total assets | $ | 679,656 |
|
| $ | 323,427 |
| Total assets | $ | 1,266,637 | | | $ | 1,188,990 | |
|
|
|
|
|
| |
| LIABILITIES: | |
|
| |
| LIABILITIES: | | | |
| Current portion of long-term debt | | Current portion of long-term debt | $ | 161,723 | | | $ | 0 | |
| Accounts payable, trade | $ | 3,552 |
|
| $ | 5,593 |
| Accounts payable, trade | 6,623 | | | 10,111 | |
| Accrued expenses and other current liabilities | 68,744 |
|
| 49,403 |
| Accrued expenses and other current liabilities | 106,376 | | | 101,196 | |
| Current contingent consideration | 24,014 |
|
| — |
| Current contingent consideration | 196 | | | 0 | |
| Current liabilities of discontinued operations (Note 14) | 13,396 |
|
| 11,711 |
| |
| Current liabilities of discontinued operations | | Current liabilities of discontinued operations | 4,933 | | | 536 | |
| Total current liabilities | 109,706 |
|
| 66,707 |
| Total current liabilities | 279,851 | | | 111,843 | |
| Long-term debt | 235,120 |
| | — |
| Long-term debt | 465,876 | | | 611,412 | |
| Operating lease liabilities | | Operating lease liabilities | 100,153 | | | 92,363 | |
| Non-current contingent consideration | 30,544 |
|
| 23,600 |
| Non-current contingent consideration | 0 | | | 8,249 | |
| | Other non-current liabilities | 1,473 |
|
| 1,685 |
| Other non-current liabilities | 389 | | | 362 | |
| Total liabilities | 376,843 |
|
| 91,992 |
| Total liabilities | 846,269 | | | 824,229 | |
| Commitments and contingencies (Note 11) |
|
|
|
|
| |
| Commitments and contingencies (Note 14) | | Commitments and contingencies (Note 14) | 0 | | 0 |
| SHAREHOLDERS' EQUITY: | |
|
| |
| SHAREHOLDERS' EQUITY: | | | |
| Preferred stock $.01 par value; 5,000,000 shares authorized; none issued or outstanding | — |
|
| — |
| |
Common stock $.01 par value; 50,000,000 shares authorized; 14,174,357 and 13,955,378 shares issued, respectively, and 11,968,459 and 11,791,633 shares outstanding, respectively | 142 |
|
| 140 |
| |
| Preferred stock $.01 par value; 5,000,000 shares authorized; NaN issued or outstanding | | Preferred stock $.01 par value; 5,000,000 shares authorized; NaN issued or outstanding | 0 | | | 0 | |
| Common stock $.01 par value; 50,000,000 shares authorized; 15,955,742 and 15,766,193 shares issued, respectively, and 13,314,424 and 13,124,875 shares outstanding, respectively | | Common stock $.01 par value; 50,000,000 shares authorized; 15,955,742 and 15,766,193 shares issued, respectively, and 13,314,424 and 13,124,875 shares outstanding, respectively | 160 | | | 158 | |
| Additional paid-in capital | 1,076,748 |
|
| 1,018,010 |
| Additional paid-in capital | 1,218,628 | | | 1,188,673 | |
| Accumulated deficit | (700,628 | ) |
| (722,630 | ) | Accumulated deficit | (615,259) | | | (640,909) | |
| Treasury stock; 2,205,898 and 2,163,745 shares, respectively | (74,086 | ) |
| (64,085 | ) | |
| Noncontrolling interest (Note 5) | 637 |
| | — |
| |
| Treasury stock; 2,641,318 shares | | Treasury stock; 2,641,318 shares | (183,161) | | | (183,161) | |
| Total shareholders' equity | 302,813 |
|
| 231,435 |
| Total shareholders' equity | 420,368 | | | 364,761 | |
| Total liabilities and shareholders' equity | $ | 679,656 |
|
| $ | 323,427 |
| Total liabilities and shareholders' equity | $ | 1,266,637 | | | $ | 1,188,990 | |
The accompanying notes to consolidated financial statements are an integral part of these statements.
LENDINGTREE, INC. AND SUBSIDIARIES
CONSOLIDATED STATEMENTSTATEMENTS OF SHAREHOLDERS' EQUITY
(Unaudited)
| | | | | | | | | | | | | | | | | | | | | | | | | | | | | | | | | | | | | | | | | |
| | | | Common Stock | | | | | | Treasury Stock |
| | Total | | Number
of Shares | | Amount | | Additional
Paid-in
Capital | | Accumulated
Deficit | | Number
of Shares | | Amount |
| | (in thousands) |
| Balance as of December 31, 2020 | $ | 364,761 | | | 15,766 | | | $ | 158 | | | $ | 1,188,673 | | | $ | (640,909) | | | 2,641 | | | $ | (183,161) | |
| Net income and comprehensive income | 19,049 | | | — | | | — | | | — | | | 19,049 | | | — | | | — | |
| Non-cash compensation | 16,436 | | | — | | | — | | | 16,436 | | | — | | | — | | | — | |
| | | | | | | | | | | | | |
| Issuance of common stock for stock options, restricted stock awards and restricted stock units, net of withholding taxes | (4,801) | | | 31 | | | — | | | (4,801) | | | — | | | — | | | — | |
| Other | (2) | | | — | | | — | | | (2) | | | — | | | — | | | — | |
| Balance as of March 31, 2021 | $ | 395,443 | | | 15,797 | | $ | 158 | | | $ | 1,200,306 | | | $ | (621,860) | | | 2,641 | | $ | (183,161) | |
| Net income and comprehensive income | 6,601 | | | — | | | — | | | — | | | 6,601 | | | — | | | — | |
| Non-cash compensation | 18,294 | | | — | | | — | | | 18,294 | | | — | | | — | | | — | |
| | | | | | | | | | | | | |
| Issuance of common stock for stock options, restricted stock awards and restricted stock units, net of withholding taxes | 30 | | | 159 | | | 2 | | | 28 | | | — | | | — | | | — | |
| | | | | | | | | | | | | |
| Balance as of June 30, 2021 | $ | 420,368 | | | 15,956 | | | $ | 160 | | | $ | 1,218,628 | | | $ | (615,259) | | | 2,641 | | | $ | (183,161) | |
| | | | | | | | | | | | | |
| | | | | | | | | | | | | |
| | | | | | | | | | | | | |
| | | | | | | | | | | | | |
| | | | | | | | | | | | | |
| | | | | | | | | | | | | |
|
| | | | | | | | | | | | | | | | | | | | | | | | | | | | |
| | | | Common Stock | | | | | | Treasury Stock | |
| | Total | | Number of Shares | | Amount | | Additional Paid-in Capital | | Accumulated Deficit | | Number of Shares | | Amount | Noncontrolling Interest |
| | (in thousands) | |
| Balance as of December 31, 2016 | $ | 231,435 |
| | 13,955 |
| | $ | 140 |
| | $ | 1,018,010 |
| | $ | (722,630 | ) | | 2,164 |
| | $ | (64,085 | ) | $ | — |
|
| Net income and comprehensive income | 23,304 |
| | — |
| | — |
| | — |
| | 23,304 |
| | — |
| | — |
| — |
|
| Non-cash compensation | 13,068 |
| | — |
| | — |
| | 13,068 |
| | — |
| | — |
| | — |
| — |
|
| Purchase of treasury stock | (10,001 | ) | | — |
| | — |
| | — |
| | — |
| | 42 |
| | (10,001 | ) | — |
|
| Issuance of common stock for stock options, restricted stock awards and restricted stock units, net of withholding taxes | 1,064 |
| | 219 |
| | 2 |
| | 1,062 |
| | — |
| | — |
| | — |
|
|
|
| Cumulative effect adjustment due to ASU 2016-09 | 985 |
| | — |
| | — |
| | 2,287 |
| | (1,302 | ) | | — |
| | — |
| — |
|
| Issuance of 0.625% Convertible Senior Notes, net | 60,411 |
| | — |
| | — |
| | 60,411 |
| | — |
| | — |
| | — |
| — |
|
| Convertible note hedge | (61,500 | ) | | — |
| | — |
| | (61,500 | ) | | — |
| | — |
| | — |
| — |
|
| Sale of warrants | 43,410 |
| | — |
| | — |
| | 43,410 |
| | — |
| | — |
| | — |
| — |
|
| Noncontrolling interest (Note 5) | 637 |
| | | | | | | | | | | | | 637 |
|
| Balance as of September 30, 2017 | $ | 302,813 |
| | 14,174 |
| | $ | 142 |
| | $ | 1,076,748 |
| | $ | (700,628 | ) | | 2,206 |
| | $ | (74,086 | ) | $ | 637 |
|
| | | | | | | | | | | | | | | | | | | | | | | | | | | | | | | | | | | | | | | | | |
| | | | Common Stock | | | | | | Treasury Stock |
| | Total | | Number
of Shares | | Amount | | Additional
Paid-in
Capital | | Accumulated
Deficit | | Number
of Shares | | Amount |
| | (in thousands) |
| Balance as of December 31, 2019 | $ | 402,326 | | | 15,677 | | | $ | 157 | | | $ | 1,177,984 | | | $ | (592,654) | | | 2,641 | | | $ | (183,161) | |
| Net income and comprehensive income | 14,401 | | | — | | | — | | | — | | | 14,401 | | | — | | | — | |
| Non-cash compensation | 11,917 | | | — | | | — | | | 11,917 | | | — | | | — | | | — | |
| | | | | | | | | | | | | |
| Issuance of common stock for stock options, restricted stock awards and restricted stock units, net of withholding taxes | (5,087) | | | 27 | | | — | | | (5,087) | | | — | | | — | | | — | |
| Other | 0 | | | — | | | — | | | (1) | | | 1 | | | — | | | — | |
| Balance as of March 31, 2020 | $ | 423,557 | | | 15,704 | | $ | 157 | | | $ | 1,184,813 | | | $ | (578,252) | | | 2,641 | | $ | (183,161) | |
| Net loss and comprehensive loss | (29,757) | | | — | | | — | | | — | | | (29,757) | | | — | | | — | |
| Non-cash compensation | 13,158 | | | — | | | — | | | 13,158 | | | — | | | — | | | — | |
| | | | | | | | | | | | | |
| Issuance of common stock for stock options, restricted stock awards and restricted stock units, net of withholding taxes | (981) | | | 27 | | | — | | | (981) | | | — | | | — | | | — | |
| | | | | | | | | | | | | |
| Balance as of June 30, 2020 | $ | 405,977 | | | 15,731 | | | $ | 157 | | | $ | 1,196,990 | | | $ | (608,009) | | | 2,641 | | | $ | (183,161) | |
| | | | | | | | | | | | | |
| | | | | | | | | | | | | |
| | | | | | | | | | | | | |
| | | | | | | | | | | | | |
| | | | | | | | | | | | | |
| | | | | | | | | | | | | |
| | | | | | | | | | | | | |
| | | | | | | | | | | | | |
| | | | | | | | | | | | | |
| | | | | | | | | | | | | |
The accompanying notes to consolidated financial statements are an integral part of these statements.
LENDINGTREE, INC. AND SUBSIDIARIES
CONSOLIDATED STATEMENTS OF CASH FLOWS
(Unaudited)
| | | | | Six Months Ended
June 30, |
| | | | 2021 | | 2020 |
| | | | (in thousands) |
| Cash flows from operating activities attributable to continuing operations: | | Cash flows from operating activities attributable to continuing operations: | | | |
| Net income (loss) and comprehensive income (loss) | | Net income (loss) and comprehensive income (loss) | $ | 25,650 | | | $ | (15,356) | |
| Less: Loss from discontinued operations, net of tax | | Less: Loss from discontinued operations, net of tax | 3,462 | | | 25,716 | |
| Income from continuing operations | | Income from continuing operations | 29,112 | | | 10,360 | |
| Adjustments to reconcile income from continuing operations to net cash provided by operating activities attributable to continuing operations: | | Adjustments to reconcile income from continuing operations to net cash provided by operating activities attributable to continuing operations: | |
| Loss on impairments and disposal of assets | | Loss on impairments and disposal of assets | 1,400 | | | 552 | |
| Amortization of intangibles | | Amortization of intangibles | 22,622 | | | 27,513 | |
| Depreciation | | Depreciation | 8,161 | | | 6,928 | |
| Non-cash compensation expense | | Non-cash compensation expense | 34,730 | | | 25,075 | |
| Deferred income taxes | | Deferred income taxes | (455) | | | (7,000) | |
| Change in fair value of contingent consideration | | Change in fair value of contingent consideration | (8,053) | | | 1,053 | |
| Unrealized gain on investments | | Unrealized gain on investments | (40,072) | | | 0 | |
| Bad debt expense | | Bad debt expense | 1,145 | | | 949 | |
| Amortization of debt issuance costs | | Amortization of debt issuance costs | 2,547 | | | 1,158 | |
| | Amortization of convertible debt discount | | Amortization of convertible debt discount | 14,670 | | | 6,250 | |
| | Reduction in carrying amount of ROU asset, offset by change in operating lease liabilities | | Reduction in carrying amount of ROU asset, offset by change in operating lease liabilities | 11,079 | | | 1,956 | |
| Changes in current assets and liabilities: | | Changes in current assets and liabilities: | |
| Accounts receivable | | Accounts receivable | (35,381) | | | 35,501 | |
| Prepaid and other current assets | | Prepaid and other current assets | (680) | | | 1,369 | |
| Accounts payable, accrued expenses and other current liabilities | | Accounts payable, accrued expenses and other current liabilities | 3,845 | | | (19,134) | |
| Current contingent consideration | | Current contingent consideration | 0 | | | (2,670) | |
| Income taxes receivable | | Income taxes receivable | 10,322 | | | 63 | |
| Other, net | | Other, net | (412) | | | (2,007) | |
| Net cash provided by operating activities attributable to continuing operations | | Net cash provided by operating activities attributable to continuing operations | 54,580 | | | 87,916 | |
| Cash flows from investing activities attributable to continuing operations: | | Cash flows from investing activities attributable to continuing operations: | |
| Capital expenditures | | Capital expenditures | (23,585) | | | (9,108) | |
| | Equity investment | | Equity investment | (1,180) | | | (80,000) | |
| | Net cash used in investing activities attributable to continuing operations | | Net cash used in investing activities attributable to continuing operations | (24,765) | | | (89,108) | |
| Cash flows from financing activities attributable to continuing operations: | | Cash flows from financing activities attributable to continuing operations: | |
| Payments related to net-share settlement of stock-based compensation, net of proceeds from exercise of stock options | | Payments related to net-share settlement of stock-based compensation, net of proceeds from exercise of stock options | (4,771) | | | (6,068) | |
| | | | Nine Months Ended September 30, | |
| | 2017 | | 2016 | |
| | (in thousands) | |
| Cash flows from operating activities attributable to continuing operations: | |
| | |
| |
| Net income and comprehensive income | $ | 23,304 |
| | $ | 20,170 |
| |
| Less: Loss from discontinued operations, net of tax | 2,632 |
| | 3,017 |
| |
| Income from continuing operations | 25,936 |
| | 23,187 |
| |
| Adjustments to reconcile income from continuing operations to net cash provided by operating activities attributable to continuing operations: | |
| | |
| |
| Loss on disposal of fixed assets | 673 |
| | 388 |
| |
| Amortization of intangibles | 9,034 |
| | 263 |
| |
| Depreciation | 5,309 |
| | 3,458 |
| |
| Rental amortization of intangibles and depreciation | 1,011 |
| | — |
| |
| Non-cash compensation expense | 13,068 |
| | 7,410 |
| |
| Deferred income taxes | (5,571 | ) | | 333 |
| |
| Change in fair value of contingent consideration | 20,640 |
| | — |
| |
| Bad debt expense | 401 |
| | 378 |
| |
| Amortization of debt issuance costs | 622 |
| | 183 |
| |
| Amortization of convertible debt discount | 3,635 |
| | — |
| |
| Changes in current assets and liabilities: | | | | |
| Accounts receivable | (22,271 | ) | | (8,565 | ) | |
| Prepaid and other current assets | (5,070 | ) | | (2,051 | ) | |
| Accounts payable, accrued expenses and other current liabilities | 19,361 |
| | (5 | ) | |
| Income taxes payable | (1,399 | ) | | 13,261 |
| |
| Other, net | (296 | ) | | 645 |
| |
| Net cash provided by operating activities attributable to continuing operations | 65,083 |
| | 38,885 |
| |
| Cash flows from investing activities attributable to continuing operations: | |
| | |
| |
| Capital expenditures | (5,925 | ) | | (8,017 | ) | |
| Acquisition of SnapCap | (11,886 | ) | | — |
| |
| Acquisition of DepositAccounts | (25,000 | ) | | — |
| |
| Acquisition of MagnifyMoney, net of cash acquired | (29,511 | ) | | — |
| |
| Acquisition of a business | — |
| | (4,500 | ) | |
| Decrease in restricted cash | 2 |
| | 2,450 |
| |
| Net cash used in investing activities attributable to continuing operations | (72,320 | ) | | (10,067 | ) | |
| Cash flows from financing activities attributable to continuing operations: | |
| | |
| |
| Proceeds from exercise of stock options, net of payments related to net-share settlement of stock-based compensation | 1,065 |
| | (3,093 | ) | |
| Proceeds from the issuance of 0.625% Convertible Senior Notes | 300,000 |
| | — |
| |
| Payment of convertible note hedge transactions | (61,500 | ) | | — |
| |
| Proceeds from the sale of warrants | 43,410 |
| | — |
| |
| Payment of equity offering costs | — |
| | (23 | ) | |
| | Net proceeds from revolving credit facility | | Net proceeds from revolving credit facility | 0 | | | 55,000 | |
| Payment of debt issuance costs | (9,264 | ) | | (8 | ) | Payment of debt issuance costs | (168) | | | (306) | |
| Purchase of treasury stock | (10,001 | ) | | (48,524 | ) | |
| Net cash provided by (used in) financing activities attributable to continuing operations | 263,710 |
| | (51,648 | ) | |
| Total cash provided by (used in) continuing operations | 256,473 |
| | (22,830 | ) | |
| Net cash used in operating activities attributable to discontinued operations | (2,365 | ) | | (7,220 | ) | |
| Total cash used in discontinued operations | (2,365 | ) | | (7,220 | ) | |
| Net increase (decrease) in cash and cash equivalents | 254,108 |
| | (30,050 | ) | |
| Cash and cash equivalents at beginning of period | 91,131 |
| | 206,975 |
| |
| Cash and cash equivalents at end of period | $ | 345,239 |
| | $ | 176,925 |
| |
| Contingent consideration payments | | Contingent consideration payments | 0 | | | (3,330) | |
| | Other financing activities | | Other financing activities | (31) | | | (14) | |
| Net cash (used in) provided by financing activities attributable to continuing operations | | Net cash (used in) provided by financing activities attributable to continuing operations | (4,970) | | | 45,282 | |
| Total cash provided by continuing operations | | Total cash provided by continuing operations | 24,845 | | | 44,090 | |
| Discontinued operations: | | Discontinued operations: | |
| Net cash provided by (used in) operating activities attributable to discontinued operations | | Net cash provided by (used in) operating activities attributable to discontinued operations | 8,353 | | | (2,571) | |
| Total cash provided by (used in) discontinued operations | | Total cash provided by (used in) discontinued operations | 8,353 | | | (2,571) | |
| Net increase in cash, cash equivalents, restricted cash and restricted cash equivalents | | Net increase in cash, cash equivalents, restricted cash and restricted cash equivalents | 33,198 | | | 41,519 | |
| Cash, cash equivalents, restricted cash and restricted cash equivalents at beginning of period | | Cash, cash equivalents, restricted cash and restricted cash equivalents at beginning of period | 170,049 | | | 60,339 | |
| Cash, cash equivalents, restricted cash and restricted cash equivalents at end of period | | Cash, cash equivalents, restricted cash and restricted cash equivalents at end of period | $ | 203,247 | | | $ | 101,858 | |
|
The accompanying notes to consolidated financial statements are an integral part of these statements.
LENDINGTREE, INC. AND SUBSIDIARIES
NOTES TO CONSOLIDATED FINANCIAL STATEMENTS
(Unaudited)
NOTE 1—ORGANIZATION
Company Overview
LendingTree, Inc. ("LendingTree" or the "Company"), is the parent of LT Intermediate Company, LLC, which holds all of the outstanding ownership interests of LendingTree, LLC, and LendingTree, LLC owns several companies owned by LendingTree, LLC.(collectively, "LendingTree" or the "Company").
LendingTree operates what it believes to be the leading online loan marketplace forconsumer platform that connects consumers seeking loans and other credit-based offerings.with the choices they need to be confident in their financial decisions. The Company offers consumers tools and resources, including free credit scores, that facilitate comparison-shopping for mortgage loans, home equity loans and lines of credit, reverse mortgage loans, auto loans, credit cards, deposit accounts, personal loans, deposit accounts, student loans, small business loans, insurance quotes and other related offerings. The Company primarily seeks to match in-market consumers with multiple lendersproviders on its marketplace who can provide them with competing quotes for the loans, depositsdeposit products, insurance or credit-basedother related offerings they are seeking. The Company also serves as a valued partner to lenders and other providers seeking an efficient, scalable and flexible source of customer acquisition with directly measurable benefits, by matching the consumer loan inquiries it generates with these lenders.providers.
The consolidated financial statements include the accounts of LendingTree and all its wholly-owned entities.entities, except Home Loan Center, Inc. ("HLC") subsequent to its bankruptcy filing on July 21, 2019 which resulted in the Company's loss of a controlling interest in HLC under applicable accounting standards. The HLC Bankruptcy case was closed on July 14, 2021. See Note 17—Discontinued Operations for additional information. Intercompany transactions and accounts have been eliminated.
Discontinued Operations
The LendingTree Loans business, which consisted of originating various consumer mortgage loans through HLC (the "LendingTree Loans Business"), is presented as discontinued operations in the accompanying consolidated balance sheets, consolidated statements of operations and comprehensive income and consolidated cash flows for all periods presented. The notes accompanying these consolidated financial statements reflect the Company's continuing operations and, unless otherwise noted, exclude information related to the discontinued operations. See Note 14 17—Discontinued Operations for additional information.
Basis of Presentation
The accompanying unaudited interim consolidated financial statements as of SeptemberJune 30, 20172021 and for the three and ninesix months ended SeptemberJune 30, 20172021 and 2016,2020, respectively, have been prepared in accordance with accounting principles generally accepted in the United States of America ("GAAP") for interim financial information and pursuant to the rules and regulations of the U.S. Securities and Exchange Commission ("SEC"). In the opinion of management, the unaudited interim consolidated financial statements have been prepared on the same basis as the audited financial statements, and include all adjustments, consisting only of normal recurring adjustments, necessary for the fair statement of the Company's financial position for the periods presented. The results for the three and ninesix months ended SeptemberJune 30, 20172021 are not necessarily indicative of the results to be expected for the year ending December 31, 2017,2021, or any other period. The accompanying consolidated balance sheet as of December 31, 20162020 was derived from audited financial statements included in the Company's annual report on Form 10-K for the year ended December 31, 20162020 (the "2016"2020 Annual Report"). The accompanying consolidated financial statements do not include all of the information and footnotes required by GAAP for annual financial statements. Accordingly, they should be read in conjunction with the audited financial statements and notes thereto included in the 20162020 Annual Report.
NOTE 2—SIGNIFICANT ACCOUNTING POLICIES
Accounting Estimates
Management is required to make certain estimates and assumptions during the preparation of the consolidated financial statements in accordance with GAAP. These estimates and assumptions impact the reported amount of assets and liabilities and disclosures of contingent assets and liabilities as of the date of the consolidated financial statements. They also impact the reported amount of net earnings during any period. Actual results could differ from those estimates.
LENDINGTREE, INC. AND SUBSIDIARIES
NOTES TO CONSOLIDATED FINANCIAL STATEMENTS (Continued)
Significant estimates underlying the accompanying consolidated financial statements, including discontinued operations, include: loan loss obligations; the recoverability of long-lived assets, goodwill and intangible assets; the determination of income taxes payable and deferred income taxes, including related valuation allowances; fair value of assets acquired in a business combination; contingent consideration related to business combinations; litigation accruals; HLC ownership related claims; contract assets; various other allowances, reserves and accruals; and assumptions related to the determination of stock-based compensation.compensation; and the determination of right-of-use assets and lease liabilities.
LENDINGTREE, INC. AND SUBSIDIARIES
NOTES TO CONSOLIDATED FINANCIAL STATEMENTS (Continued)
the COVID-19 pandemic on the assumptions and estimates used when preparing its financial statements including, but not limited to, the allowance for doubtful accounts, valuation allowances, contract asset and contingent consideration. These assumptions and estimates may change as new events occur and additional information is obtained. If economic conditions caused by the COVID-19 pandemic do not recover as currently estimated by management, such future changes may have an adverse impact on the Company's results of operations, financial position and liquidity.
Certain Risks and Concentrations
LendingTree's business is subject to certain risks and concentrations including dependence on third-party technology providers, exposure to risks associated with online commerce security and credit card fraud.
Financial instruments, which potentially subject the Company to concentration of credit risk at SeptemberJune 30, 2017,2021, consist primarily of cash and cash equivalents and accounts receivable, as disclosed in the consolidated balance sheet. Cash and cash equivalents are in excess of Federal Deposit Insurance Corporation insurance limits, but are maintained with quality financial institutions of high credit. The Company generally requires certain network lendersNetwork Partners to maintain security deposits with the Company, which in the event of non-payment, would be applied against any accounts receivable outstanding.
Due to the nature of the mortgage lending industry, interest rate fluctuations may negatively impact future revenue from the Company's lender marketplace.
Lenders and lead purchasers participating on the Company's marketplace can offer their products directly to consumers through brokers, mass marketing campaigns or through other traditional methods of credit distribution. These lenders and lead purchasers can also offer their products online, either directly to prospective borrowers, through one or more online competitors, or both. If a significant number of potential consumers are able to obtain loans and other products from participating lendersNetwork Partners without utilizing the Company's services, itsthe Company's ability to generate revenue may be limited. Because the Company does not have exclusive relationships with the lendersNetwork Partners whose loan offeringsloans and other financial products are offered on its online marketplace, consumers may obtain offers and loans from these lendersNetwork Partners without using its service.
The Company maintainsOther than a support services office in India, the Company's operations solely inare geographically limited to and dependent upon the economic condition of the United States.
Litigation Settlements and Contingencies
Litigation settlements and contingencies consists of expenses related to actual or anticipated litigation settlements, in addition to legal fees incurred in connection with various patent litigation claims the Company pursues against others.settlements.
RecentRecently Adopted Accounting Pronouncements
In May 2017,2021, the FASB issued ASU 2021-04 to clarify and reduce diversity in accounting for modifications or exchanges of freestanding equity-classified written call options that remain equity classified after modification or exchange. The amendments clarify that a modification of the terms or conditions or an exchange of a freestanding equity-classified written call option that remains equity classified after modification or exchange should be accounted for as an exchange of the original instrument for a new instrument. This ASU is effective for annual and interim reporting periods beginning after December 15, 2021. Early adoption is permitted, including adoption in interim periods. An entity should adopt the guidance as of the beginning of its annual fiscal year. The amendments should be applied prospectively to modifications or exchanges occurring on or after the date of adoption. The Company adopted ASU 2021-04 in the second quarter of 2021.
In December 2019, the Financial Accounting Standards Board ("FASB") issued Accounting Standards Update ("ASU") 2017-092019-12, which clarifies when to accountsimplifies the accounting for a changeincome taxes by removing certain exceptions to the terms or conditions of a share-based payment award as a modification. Under the new guidance, modification accounting is required only if the fair value, the vesting conditions or the classificationgeneral principles in ASC Topic 740, Income Taxes, and clarifies certain aspects of the award changes as a result of the change in terms or conditions.current guidance to improve consistency among reporting entities. This ASU is effective prospectively for annual and interim reporting periods beginning on or after December 15, 2017, with2020. Early adoption was permitted, including adoption in interim periods. Entities electing early adoption permitted.were required to adopt all amendments in the same period. Most amendments require prospective application while others are to be applied on a retrospective basis for all
LENDINGTREE, INC. AND SUBSIDIARIES
NOTES TO CONSOLIDATED FINANCIAL STATEMENTS (Continued)
periods presented or a modified retrospective basis through a cumulative-effect adjustment to retained earnings as of the beginning of the fiscal year of adoption. The Company adopted ASU 2019-12 in the first quarter of 2021. The amendments applicable to the Company required prospective application, and do not have material impacts to its consolidated financial statements.
Recently Issued Accounting Pronouncements
In August 2020, the FASB issued ASU 2020-06, which simplifies the accounting for convertible instruments, amends the derivatives scope exception guidance for contracts in an entity’s own equity, and amends the related earnings-per-share guidance. This ASU is effective for annual and interim reporting periods beginning after December 15, 2021. Early adoption is permitted for fiscal years beginning after December 15, 2020, including adoption in interim periods. An entity should adopt the guidance as of the beginning of its annual fiscal year. An entity may adopt the amendments through either a modified retrospective method of transition or a fully retrospective method of transition. The Company expects the amendments to impact its convertible senior notes and warrants issued and is evaluating the impact this ASU will have on its consolidated financial statements and whether to early adopt.
In January 2017,
NOTE 3—REVENUE
Revenue is as follows (in thousands):
| | | | | | | | | | | | | | | | | | | | | | | |
| Three Months Ended
June 30, | | Six Months Ended
June 30, |
| 2021 | | 2020 | | 2021 | | 2020 |
| Home | $ | 104,861 | | | $ | 74,123 | | | $ | 232,986 | | | $ | 153,297 | |
| Credit cards | 22,424 | | | 7,194 | | | 40,061 | | | 58,780 | |
| Personal loans | 25,208 | | | 8,827 | | | 40,076 | | | 40,336 | |
| Other Consumer | 28,044 | | | 21,097 | | | 53,446 | | | 57,926 | |
| Total Consumer | 75,676 | | | 37,118 | | | 133,583 | | | 157,042 | |
| Insurance | 89,263 | | | 72,919 | | | 175,877 | | | 155,656 | |
| Other | 214 | | | 166 | | | 318 | | | 1,415 | |
| Total revenue | $ | 270,014 | | | $ | 184,326 | | | $ | 542,764 | | | $ | 467,410 | |
The Company derives its revenue primarily from match fees and closing fees. Revenue is recognized when performance obligations under the FASB issued ASU 2017-04 which eliminatesterms of a contract with a customer are satisfied and promised services have transferred to the requirementcustomer. The Company's services are generally transferred to calculate the implied fair valuecustomer at a point in time.
Revenue from Home products is primarily generated from upfront match fees paid by mortgage Network Partners that receive a loan request, and in some cases upfront fees for clicks or call transfers. Match fees and upfront fees for clicks and call transfers are earned through the delivery of goodwillloan requests that originated through the Company's websites or affiliates. The Company recognizes revenue at the time a loan request is delivered to measure a goodwill impairment charge (Step 2the customer, provided that no significant obligations remain. The Company's contractual right to the match fee consideration is contemporaneous with the satisfaction of the goodwill impairment test). Instead, an impairment charge will be basedperformance obligation to deliver a loan request to the customer.
Revenue from Consumer products is generated by match and other upfront fees for clicks or call transfers, as well as from closing fees, approval fees and upfront service and subscription fees. Closing fees are derived from lenders on certain auto loans, business loans, personal loans and student loans when the excess oflender funds a loan with the carrying amountconsumer. Approval fees are derived from credit card issuers when the credit card consumer receives card approval from the credit card issuer. Upfront service fees and subscription fees are derived from consumers in the Company's credit services product. Upfront fees paid by consumers are recognized as revenue over the fair value. This ASUestimated time the consumer will remain a customer and receive services. Subscription fees are recognized over the period a consumer is effective for annual and interim impairment tests performed in periods beginning after December 15, 2019. Early adoption is permitted for annual and interim goodwill impairment testing dates after January 1, 2017. receiving services.
The Company is evaluating the impact this ASU will haverecognizes revenue on its consolidated financial statements and whether to early adopt.
In November 2016, the FASB issued ASU 2016-18 which is intended to reduce the diversity in the classification and presentation of changes in restricted cash in the statement of cash flows, by requiring entities to combine the changes in cash and cash equivalents and restricted cash in one line. As a result, entities will no longer present transfers between cash and cash equivalents and restricted cash in the statement of cash flows. In addition, if more than one line item is recorded on the balance sheet for cash and cash equivalents and restricted cash, a reconciliation between the statement of cash flows and balance sheet is required. This ASU is effective for annual and interim reporting periods beginning after December 15, 2017, with early adoption permitted. The retrospective transition method, requiring adjustment to all comparative periods presented, is required. The Company is evaluating the impact this ASU will have on its consolidated financial statements and whether to early adopt.
In August 2016, the FASB issued ASU 2016-15 which addresses eight cash flow classification issues, eliminating the diversity in practice. This ASU is effective for annual and interim reporting periods beginning after December 15, 2017, with early adoption permitted. The retrospective transition method, requiring adjustment to all comparative periods presented, is required unless it is impracticable for some of the amendments, in which case those amendments would be prospectively applied as of the earliest date practicable. The Company is evaluating the impact this ASU will have on its consolidated financial statements and whether to early adopt.
LENDINGTREE, INC. AND SUBSIDIARIES
NOTES TO CONSOLIDATED FINANCIAL STATEMENTS (Continued)
In March 2016, the FASB issued ASU 2016-09 which simplifies various aspects related to how share-based payments are accounted for and presented in the financial statements, including the income tax consequences, classification of awards as either equity or liabilities, forfeitures and classification of excess tax benefits on the statement of cash flows. This ASU was effective for annual and interim reporting periods beginning after December 15, 2016, with early adoption permitted. Upon adoption, any adjustments are to be reflected as of the beginning of the fiscal year of adoption. The Company adopted this ASU during the first quarter of 2017.
The new standard requires excess tax benefits and deficiencies, which arise due to the difference in the measure of stock compensation and the amount deductible for tax purposes, to be recorded in earnings in income tax expense. These excess tax benefits and deficiencies were generally previously recorded in additional paid-in capital and had no impact on net income. The standard required prospective adoption for this portion of the new guidance. During the third quarter and first nine months of 2017, the Company recognized $0.8 million and $8.4 million, respectively, of excess tax benefit in income tax expense in the accompanying consolidated statements of operations and comprehensive income. Additionally, the new standard requires the excess tax benefits and deficiencies to be classified as an operating activity in the accompanying consolidated statements of cash flows. These excess tax benefits and deficiencies were previously recorded as a financing activity in the statement of cash flows. The standard allowed for either prospective or retrospective adoption for the change in presentation in the statement of cash flows. The Company elected to retrospectively adopt the classification change in the statement of cash flows. Accordingly, prior periods have been adjusted, which increased the cash provided by operating activities and decreased the cash provided by financing activities by $5.7 million in the first nine months of 2016 in the accompanying consolidated statements of cash flows. The standard also allows for an election by the Company to either estimate forfeitures, as required under previous guidance, or recognize forfeitures when they occur. The Company elected to recognize forfeitures of stock awards as they occur, with the modified retrospective transition method required. Accordingly, the Company recognized a $1.4 million cumulative-effect adjustment to retained earnings as of January 1, 2017.
In February 2016, the FASB issued ASU 2016-02 related to leases. This ASU requires the recognition of a right-of-use lease asset and a lease liability by lessees for all leases greater than one year in duration. This ASU is effective for annual and interim reporting periods beginning after December 15, 2018, with early adoption permitted. The guidance must be adopted using a modified retrospective transition. The Company is evaluating the impact this ASU will have on its consolidated financial statements and whether to early adopt.
In May 2014, the FASB issued ASU 2014-09 related to revenue recognition. This ASU was initiated as a joint project between the FASB and the International Accounting Standards Board ("IASB") to clarify the principles for recognizing revenue and to develop a common revenue standard for GAAP and international financial reporting standards ("IFRS"). This guidance will supersede the existing revenue recognition requirements in Accounting Standards Codification ("ASC") Topic 605, Revenue Recognition and was set to be effective for annual reporting periods beginning after December 15, 2016. However, in July 2015, the FASB deferred the effective date by one year, such that the standard will be effective for annual reporting periods beginning after December 15, 2017. The ASU can be applied (i) retrospectively to each prior period presented or (ii) retrospectively with the cumulative effect of initially adopting the ASU recognized at the date of initial application. In March 2016, the FASB issued ASU 2016-08, which clarifies the principal versus agent guidance under ASU 2014-09. In April 2016, the FASB issued ASU 2016-10, which clarifies the identification of distinct performance obligations in a contract. In May 2016, the FASB issued ASU 2016-12, which clarifies the guidance on assessing collectability, presenting sales taxes, measuring noncash consideration and certain other transition matters. The clarification ASUs must be adopted concurrently with the adoption of ASU 2014-09. The Company will adopt the ASUs as of January 1, 2018 and apply the modified retrospective transition approach. Under this approach revenue for 2016 and 2017 will be reported in the consolidated statements of operations and comprehensive income on the historical basis and revenue for 2018 will be reported in the consolidated statements of operations and comprehensive income applying the new ASUs. Additionally, the Company will disclose revenue for 2018 periods on the historical basis in the footnotes to the financial statements. Under the new ASUs, the timing of recognizing revenue for closing fees and approval fees will be accelerated toat the point when a loan request or a credit card consumer is delivered to the customer as opposedcustomer. The Company's contractual right to whenclosing fees and approval fees is not contemporaneous with the consumersatisfaction of the performance obligation to deliver a loan is closed by the lenderrequest or a credit card approval is made byconsumer to the issuer. Thecustomer. As such, the Company does not expectrecords a contract asset at each reporting period-end related to the adoption of the ASUs to have a material effect on annual revenue or net income from continuing operations.estimated variable
LENDINGTREE, INC. AND SUBSIDIARIES
NOTES TO CONSOLIDATED FINANCIAL STATEMENTS (Continued)
consideration on closing fees and approval fees for which the Company has satisfied the related performance obligation but are still pending the loan closing or credit card approval before the Company has a contractual right to payment. This estimate is based on the Company's historical closing rates and historical time between when a consumer request for a loan or credit card is delivered to the lender or card issuer and when the loan is closed by the lender or approved by the card issuer.
Revenue from the Company's Insurance products is primarily generated from upfront match fees and upfront fees for website clicks or fees for calls. Match fees and upfront fees for clicks and call transfers are earned through the delivery of consumer requests that originated through the Company's websites or affiliates. The Company recognizes revenue at the time a consumer request is delivered to the customer, provided that no significant obligations remain. The Company's contractual right to the match fee consideration is contemporaneous with the satisfaction of the performance obligation to deliver a consumer request to the customer.
The contract asset recorded within prepaid and other current assets on the consolidated balance sheets related to estimated variable consideration in the Company's Consumer business was $7.3 million and $6.4 million at June 30, 2021 and December 31, 2020, respectively.
The contract liability recorded within accrued expenses and other current liabilities on the consolidated balance sheets related to upfront fees paid by consumers in the Company's Consumer business was $1.1 million and $0.7 million at June 30, 2021 and December 31, 2020, respectively. During the second quarter and first six months of 2021, the Company recognized revenue of $0.1 million and $0.7 million, respectively, that was included in the contract liability balance at December 31, 2020. During the second quarter and first six months of 2020, the Company recognized revenue of $0.1 million and $0.6 million, respectively, that was included in the contract liability balance at December 31, 2019.
Revenue recognized in any reporting period includes estimated variable consideration for which the Company has satisfied the related performance obligations but are still pending the occurrence or non-occurrence of a future event outside the Company's control (such as lenders providing loans to consumers or credit card approvals of consumers) before the Company has a contractual right to payment. The Company recognized increases to such revenue from prior periods of $0.1 million and $0.3 million in the second quarters of 2021 and 2020, respectively.
NOTE 3—4—CASH AND RESTRICTED CASH
RestrictedTotal cash, cash equivalents, restricted cash and restricted cash equivalents consistsconsist of the following (in thousands):
| | | | | | | | | | | |
| June 30,
2021 | | December 31, 2020 |
| Cash and cash equivalents | $ | 203,164 | | | $ | 169,932 | |
| Restricted cash and cash equivalents | 83 | | | 117 | |
| Total cash, cash equivalents, restricted cash and restricted cash equivalents | $ | 203,247 | | | $ | 170,049 | |
|
| | | | | | | |
| | September 30,
2017 | | December 31,
2016 |
Cash in escrow from sale of LendingTree Loans (a) | $ | 4,033 |
| | $ | 4,032 |
|
| Other | 54 |
| | 57 |
|
| Total restricted cash and cash equivalents | $ | 4,087 |
| | $ | 4,089 |
|
| |
(a) | Home Loan Center, Inc. ("HLC"), a subsidiary of the Company, continues to be liable for certain indemnification obligations, repurchase obligations and premium repayment obligations following the sale of substantially all of the operating assets of its LendingTree Loans business in the second quarter of 2012. |
NOTE 4—5—ALLOWANCE FOR DOUBTFUL ACCOUNTS
Accounts receivable are stated at amounts due from customers, net of an allowance for doubtful accounts.
The Company determines its allowance for doubtful accounts by considering a number of factors, including the length of time accounts receivable are past due, previous loss history, current and expected economic conditions and the specific customer's current and expected ability to pay its obligation. Accounts receivable are considered past due when they are outstanding longer than the contractual payment terms. Accounts receivable are written off when management deems them uncollectible.
LENDINGTREE, INC. AND SUBSIDIARIES
NOTES TO CONSOLIDATED FINANCIAL STATEMENTS (Continued)
A reconciliation of the beginning and ending balances of the allowance for doubtful accounts is as follows (in thousands):
| | | | | | | | | | | | | | | | | | | | | | | |
| | Three Months Ended
June 30, | | Six Months Ended
June 30, |
| | 2021 | | 2020 | | 2021 | | 2020 |
| Balance, beginning of the period | $ | 1,429 | | | $ | 2,021 | | | $ | 1,402 | | | $ | 1,466 | |
| Charges to earnings | 629 | | | 69 | | | 1,145 | | | 949 | |
| Write-off of uncollectible accounts receivable | (585) | | | (337) | | | (1,079) | | | (669) | |
| Recoveries collected | 0 | | | 3 | | | 5 | | | 10 | |
| Balance, end of the period | $ | 1,473 | | | $ | 1,756 | | | $ | 1,473 | | | $ | 1,756 | |
NOTE 6—GOODWILL AND INTANGIBLE ASSETS
The balance of goodwill, net is as follows (in thousands):
|
| | | | | | | | | | | |
| | Goodwill | | Accumulated Impairment Loss | | Net Goodwill |
| Balance at December 31, 2016 | $ | 539,545 |
| | $ | (483,088 | ) | | $ | 56,457 |
|
| Acquisition of DepositAccounts | 19,389 |
| | — |
| | 19,389 |
|
| Acquisition of MagnifyMoney | 23,784 |
| | — |
| | 23,784 |
|
| Acquisition of SnapCap | 13,928 |
| | — |
| | 13,928 |
|
| Balance at September 30, 2017 | $ | 596,646 |
| | $ | (483,088 | ) | | $ | 113,558 |
|
The balance ofand intangible assets, net is as follows (in thousands):
| | | | | | | | June 30,
2021 | | December 31, 2020 |
| Goodwill | | Goodwill | $ | 903,227 | | | $ | 903,227 | |
| Accumulated impairment losses | | Accumulated impairment losses | (483,088) | | | (483,088) | |
| Net goodwill | | Net goodwill | $ | 420,139 | | | $ | 420,139 | |
| | September 30,
2017 | | December 31,
2016 | |
| Intangible assets with indefinite lives | $ | 10,142 |
| | $ | 10,142 |
| Intangible assets with indefinite lives | $ | 10,142 | | | $ | 10,142 | |
| Intangible assets with definite lives, net | 75,123 |
| | 61,542 |
| Intangible assets with definite lives, net | 95,738 | | | 118,360 | |
| Total intangible assets, net | $ | 85,265 |
| | $ | 71,684 |
| Total intangible assets, net | $ | 105,880 | | | $ | 128,502 | |
Goodwill and Indefinite-Lived Intangible Assets
The Company's goodwill isat each of June 30, 2021 and December 31, 2020 consists of $59.3 million associated with its one reportablethe Home segment, $166.1 million associated with the Consumer segment, and $194.7 million associated with the Insurance segment.
Intangible assets with indefinite lives relate to the Company's trademarks.
Intangible Assets with Definite Lives
Intangible assets with definite lives relate to the following (in thousands):
| | | | | | | | | | | | | | | | | |
| | Cost | | Accumulated
Amortization | | Net |
| Technology | $ | 87,700 | | | $ | (58,768) | | | $ | 28,932 | |
| Customer lists | 77,300 | | | (21,614) | | | 55,686 | |
| Trademarks and tradenames | 17,000 | | | (11,513) | | | 5,487 | |
| Website content | 43,200 | | | (37,567) | | | 5,633 | |
| Balance at June 30, 2021 | $ | 225,200 | | | $ | (129,462) | | | $ | 95,738 | |
| | | | | | | | | | | | | | | | | |
| | Cost | | Accumulated
Amortization | | Net |
| Technology | $ | 87,700 | | | $ | (48,166) | | | $ | 39,534 | |
| Customer lists | 77,300 | | | (18,560) | | | 58,740 | |
| Trademarks and tradenames | 17,200 | | | (9,947) | | | 7,253 | |
| Website content | 43,200 | | | (30,367) | | | 12,833 | |
| Balance at December 31, 2020 | $ | 225,400 | | | $ | (107,040) | | | $ | 118,360 | |
|
| | | | | | | | | | | |
| | Cost | | Accumulated Amortization | | Net |
| Technology | $ | 37,500 |
| | $ | (6,437 | ) | | $ | 31,063 |
|
| Customer lists | 32,900 |
| | (2,506 | ) | | 30,394 |
|
| Trademarks and tradenames | 6,942 |
| | (1,674 | ) | | 5,268 |
|
| Tenant leases | 2,030 |
| | (785 | ) | | 1,245 |
|
| Website content | 7,800 |
| | (650 | ) | | 7,150 |
|
| Other | 250 |
| | (247 | ) | | 3 |
|
| Balance at September 30, 2017 | $ | 87,422 |
| | $ | (12,299 | ) | | $ | 75,123 |
|
LENDINGTREE, INC. AND SUBSIDIARIES
NOTES TO CONSOLIDATED FINANCIAL STATEMENTS (Continued)
|
| | | | | | | | | | | |
| | Cost | | Accumulated Amortization | | Net |
| Technology | $ | 28,300 |
| | $ | (659 | ) | | $ | 27,641 |
|
| Customer lists | 28,100 |
| | (639 | ) | | 27,461 |
|
| Trademarks and tradenames | 5,342 |
| | (937 | ) | | 4,405 |
|
| Tenant leases | 2,030 |
| | — |
| | 2,030 |
|
| Other | 250 |
| | (245 | ) | | 5 |
|
| Balance at December 31, 2016 | $ | 64,022 |
| | $ | (2,480 | ) | | $ | 61,542 |
|
Amortization of intangible assets with definite lives is computed on a straight-line basis and, based on balances as of SeptemberJune 30, 2017,2021, future amortization is estimated to be as follows (in thousands):
|
| | | |
| | Amortization Expense |
| Remainder of current year | $ | 4,345 |
|
| Year ending December 31, 2018 | 16,228 |
|
| Year ending December 31, 2019 | 15,973 |
|
| Year ending December 31, 2020 | 13,948 |
|
| Year ending December 31, 2021 | 5,743 |
|
| Thereafter | 18,886 |
|
| Total intangible assets with definite lives, net | $ | 75,123 |
|
| | | | | |
| Amortization Expense |
| Remainder of current year | $ | 20,116 | |
| Year ending December 31, 2022 | 25,256 | |
| Year ending December 31, 2023 | 8,602 | |
| Year ending December 31, 2024 | 6,747 | |
| Year ending December 31, 2025 | 6,259 | |
| Thereafter | 28,758 | |
| Total intangible assets with definite lives, net | $ | 95,738 | |
NOTE 5—BUSINESS ACQUISITION
CompareCards7—EQUITY INVESTMENT
On November 16, 2016,February 28, 2020, the Company acquired all of the membership interests of Iron Horse Holdings, LLC, which does business under the name CompareCards ("CompareCards"). CompareCards is an online marketing platformequity interest in Stash Financial, Inc. (“Stash”) for credit cards, which$80.0 million. On January 6, 2021, the Company acquired additional equity interest for $1.2 million. Stash is utilizing to grow its existing credit card business. a consumer investing and banking platform. Stash brings together banking, investing, and financial services education into one seamless experience offering a full suite of personal investment accounts, traditional and Roth IRAs, custodial investment accounts, and banking services, including checking accounts and debit cards with a Stock-Back® rewards program.
The Company paid $80.7 million in initial cash consideration and will make two earnout payments, each ranging from zero to $22.5 million, based on the amount of earnings before interest, taxes, depreciation and amortization CompareCards generates during the periods of January 1, 2017 through December 31, 2017 and January 1, 2018 through December 31, 2018, or up to $45.0 million in aggregate payments (the “Earnout Payments”). The purchase price for the acquisition is $103.8 million comprised of an upfront cash payment of $80.7 million on November 16, 2016 and $23.1 million for the estimatedStash equity securities do not have a readily determinable fair value ofand, upon acquisition, the Earnout Payments atCompany elected the time of closing the acquisition.
As of September 30, 2017, the estimated fairmeasurement alternative to value of the Earnout Payments totaled $43.1 million, $22.0 million of which is included in current contingent consideration and $21.1 million of which is included in non-current contingent consideration in the accompanying consolidated balance sheet.its securities. The estimated fair value of the Earnout Payments is determined using an option pricing model. The estimated value of the Earnout Payments is based upon available information and certain assumptions, known at the time of this report, which management believes are reasonable. Any differences in the actual Earnout Payments from the current estimated fair value of the Earnout PaymentsStash equity securities will be carried at cost and subsequently marked to market upon observable market events with any gains or losses recorded in operating income in the consolidated statements of operations. During the third quarter and first nine months of 2017, the Company recorded $1.9 million and $20.0 million, respectively, of contingent consideration expense into the consolidated statement of operations and comprehensive income dueincome. During the first six months of 2021, the Company recorded a gain on the investment in Stash of $40.1 million as a result of an adjustment to the change in estimated fair value of the Earnout Payments.
LENDINGTREE, INC. AND SUBSIDIARIES
NOTES TO CONSOLIDATED FINANCIAL STATEMENTS (Continued)
The acquisition has been accounted for as a business combination. During the quarter ended March 31, 2017, the Company completed the determination of the final allocation of the purchase price with respect to the assets acquired and liabilities assumed as follows (in thousands):
|
| | | |
| | Fair Value |
| Accounts receivable | $ | 3,538 |
|
| Total intangible assets with definite lives, net | 55,400 |
|
| Goodwill | 52,450 |
|
| Accounts payable and accrued liabilities | (7,638 | ) |
| Total purchase price | $ | 103,750 |
|
Acquisition-related costs in the first nine months of 2017 of $0.1 million are included in general and administrative expense in the accompanying consolidated statement of operations and comprehensive income.
DepositAccounts
On June 14, 2017, the Company acquired substantially all of the assets of Deposits Online, LLC, which does business under the name DepositAccounts.com (“DepositAccounts”). DepositAccounts is a leading consumer-facing media property in the depository industry and is one of the most comprehensive sources of depository deals and analysis on the Web, covering all major deposit product categories through editorial content, programmatic rate tables and user-generated content.
The Company paid $24.0 million of initial cash consideration and could make additional contingent consideration payments of up to $9.0 million. The potential contingent consideration payments are comprised of (i) up to seven payments of $1.0 million eachStash equity securities based on specified increases in Federal Funds interest rates during the period commencing on the closing date and ending on June 30, 2020 and (ii) a one-time performance payment of up to $2.0 million based on the net revenue of deposit products during the period of January 1, 2018 through December 31, 2018 (the “Contingent Consideration”). These additional payments, to the extent earned, will be payable in cash. The purchase price for the acquisition is $29.0 million, comprised of the upfront cash payment of $24.0 million and $5.0 million for the estimated fair value of the Contingent Consideration at the time of closing the acquisition.
In the third quarter of 2017, the Company made a payment of $1.0 million associated with a specified increase in the Federal Funds rate in June 2017. As of September 30, 2017, the estimated fair value of the Contingent Consideration totaled $4.6 million, of which $1.5 million is included in current contingent consideration and $3.1 million ofobservable market events, which is included in non-current contingent consideration in the accompanying consolidated balance sheet. The estimated fair value of the portion of the Contingent Consideration payments based on increases in interest rates is determined using a scenario approach based on the interest rate forecasts of Federal Open Market Committee participants. The estimated fair value of the portion of the Contingent Consideration payments potentially earned based on net revenue is determined using an option pricing model. The estimated value of the Contingent Consideration is based upon available information and certain assumptions, known at the time of this report, which management believes are reasonable. Any differences in the actual Contingent Consideration payments will be recorded in operatingwithin other income in the consolidated statements of operations and comprehensive income. During the third quarter and first nine months of 2017, the Company recorded $0.6 million of contingent consideration expense in the consolidated statement of operations and comprehensive income due to the change in estimated fair value of the Contingent Consideration.
The acquisition has been accounted for as a business combination. During the quarter ended September 30, 2017, the Company completed the determination of the final allocation of purchase price to the assets acquired and liabilities assumed as follows (in thousands):
|
| | | |
| | Fair Value |
| Intangible assets | $ | 9,600 |
|
| Goodwill | 19,389 |
|
| Total purchase price | $ | 28,989 |
|
The Company primarily used the income approach for the valuation as appropriate, and used valuation inputs in these models and analyses that were based on market participant assumptions. Market participants are buyers and sellers unrelated to the Company
LENDINGTREE, INC. AND SUBSIDIARIES
NOTES TO CONSOLIDATED FINANCIAL STATEMENTS (Continued)
and fair value is determined as the price that would be received to sell an asset or paid to transfer a liability in an orderly transaction at the measurement date.
The acquired intangible assets are definite-lived assets consisting primarily of developed technology, customer relationships and trade name and trademarks. The estimated fair values of the developed technology were determined using excess earnings analysis, the customer relationships were determined using the distributor method and the trade name and trademarks were determined using relief from royalty analysis. The fair value of the intangible assets with definite lives are as follows (dollars in thousands):
|
| | | | |
| | Fair Value | Weighted Average Amortization Life |
| Technology | $ | 8,600 |
| 5 years |
| Customer lists | 600 |
| 8 years |
| Trade name and trademarks | 400 |
| 4 years |
| Total intangible assets | $ | 9,600 |
| 5.2 years |
The Company recorded goodwill of $19.4 million, which represents the excess of the purchase price over the estimated fair value of the intangible assets acquired. The goodwill is primarily attributable to DepositAccounts as a going concern which represents the ability of the Company to earn a higher return on the collection of assets and business of DepositAccounts than if those assets were to be acquired and managed separately. The benefit of access to the workforce is an additional element of goodwill. The goodwill is recorded in the Company’s one reportable segment. For income tax purposes, the Company treated the acquisition as an asset purchase and the goodwill will be tax deductible.
As of the acquisition date, the Company’s consolidated results of operations include the results of the acquired DepositAccounts business. In the third quarter and first nine months of 2017, revenue of $1.9 million and $2.2 million, respectively, and net income from continuing operations of $0.4 million and $0.6 million, respectively, have been included in the Company’s consolidated results of operations. Acquisition-related costs were $0.1 million and $0.3 million, respectively, in the third quarter and first nine months of 2017 and are included in general and administrative expense on the consolidated statement of operations and comprehensive income. As of June 30, 2021, there have been 0 impairments to the acquisition cost of the Stash equity securities.
MagnifyMoney
On June 20, 2017,NOTE 8—BUSINESS ACQUISITIONS
Changes in Contingent Consideration
In 2018, the Company acquired all of the membershipoutstanding equity interests of Camino Del Avion (Delaware),QuoteWizard.com, LLC which does business under the name MagnifyMoney (“MagnifyMoney”QuoteWizard”) for $29.6 million cash consideration at the closing of the transaction. Camino del Avion (Delaware), LLC was immediately merged with and into LendingTree, LLC following such acquisition. MagnifyMoney is a leading consumer-facing media property that offers unbiased editorial content, expert commentary, tools and resources to help consumers compare financial products and make informed financial decisions. The Company also has an option to acquire a foreign affiliate of one of the principals for $0.5 million at any time during the three years after the closing. This foreign affiliate provides technology and research support to MagnifyMoney under a services agreement.
In addition,Ovation Credit Services, Inc. (“Ovation”). During 2020, the Company issued two key employees of MagnifyMoney restricted stock unit awards for a total of 38,468 shares of Company common stock, and may issue a further restricted stock unit award for 19,234 shares to a third key employee of the foreign affiliate should he become employed by the Company following the Company’s exercise of the option to acquire the foreign affiliate. The total value of these restricted stock unit awards was $10.0 million on June 20, 2017. All of these restricted stock units will vest, if at all, on the basis of performance conditions following the acquisition.
LENDINGTREE, INC. AND SUBSIDIARIES
NOTES TO CONSOLIDATED FINANCIAL STATEMENTS (Continued)
The acquisition has been accounted for as a business combination. During the quarter ended September 30, 2017, the Company completed the determination ofmade the final allocation of purchase priceearnout payment related to the assets acquired and liabilities assumed as follows (in thousands):achievement of certain defined operating metrics for Ovation.
|
| | | |
| | Fair Value |
| Net working capital | $ | 921 |
|
| Intangible assets | 9,700 |
|
| Goodwill | 23,784 |
|
| Deferred tax liabilities | (4,176 | ) |
| Noncontrolling interest | (637 | ) |
| Total purchase price | $ | 29,592 |
|
The Company primarily used the income approach for the valuation as appropriate, and used valuation inputs in these models and analyses that were based on market participant assumptions. Market participants are buyers and sellers unrelated to the Company and fair value is determined as the price that would be received to sell an asset or paid to transfer a liability in an orderly transaction at the measurement date.
The acquired intangible assets are definite-lived assets consisting primarily of content, developed technology, customer relationships and trade name and trademarks. The estimated fair values of the content was determined using excess earnings analysis, developed technology was determined using cost savings analysis, the customer relationships were determined using the distributor method and the trade name and trademarks were determined using relief from royalty analysis.
The fair value of the intangible assets with definite lives are as follows (dollars in thousands):
|
| | | | |
| | Fair Value | Weighted Average Amortization Life |
| Technology | $ | 200 |
| 3 years |
| Customer lists | 1,100 |
| 9 years |
| Trade name and trademarks | 600 |
| 4 years |
| Content | 7,800 |
| 3 years |
| Total intangible assets | $ | 9,700 |
| 3.7 years |
The Company recorded goodwill of $23.8 million, which represents the excess of the purchase price over the estimated fair value of the tangible and intangible assets acquired, net of the liabilities assumed. The goodwill is primarily attributable to MagnifyMoney as a going concern which represents the ability of the Company to earn a higher return on the collection of assets and business of MagnifyMoney than if those assets were to be acquired and managed separately. The benefit of access to the workforce is an additional element of goodwill. The goodwill is recorded in the Company’s one reportable segment. For income tax purposes, the Company treated the acquisition as an equity purchase and the goodwill will not be tax deductible.
The Company has determined that the foreign entity which provides technology and research support to MagnifyMoney under a services agreement is a variable interest entity which must be consolidated for financial reporting. The Company has recorded the assets, liabilities and non-controlling interest in this entity at their estimated fair value.
As of the acquisition date, the Company’s consolidated results of operations include the results of the acquired MagnifyMoney business. In the third quarter and first nine months of 2017, revenue of $1.2 million and $1.3 million, respectively, and net loss from continuing operations of $0.3 million and $0.3 million, respectively, have been included in the Company’s consolidated results of operations and comprehensive income. Acquisition-related costs were $0.4 million in the first nine months of 2017 and are included in general and administrative expense on the consolidated statement of operations and comprehensive income.
SnapCap
On September 19, 2017, the Company acquired certain assets of Snap Capital LLC, which does business under the name SnapCap (“SnapCap”). SnapCap, a tech-enabled online platform, connects business owners with lenders offering small business loans, linesDuring 2020, the Company made the final earnout payments related to the achievement of credit and merchant cash advance products through a concierge-based sales approach.certain defined earnings targets for SnapCap.
The Company will make an earnout payment ranging from 0 to $23.4 million based on the achievement of certain defined performance targets for QuoteWizard.
Changes in the fair value of contingent consideration is summarized as follows (in thousands):
| | | | | | | | | | | | | | | | | | | | | | | |
| Three Months Ended
June 30, | | Six Months Ended
June 30, |
| 2021 | | 2020 | | 2021 | | 2020 |
| QuoteWizard | $ | (8,850) | | | $ | 8,058 | | | $ | (8,053) | | | $ | (204) | |
| Ovation | 0 | | | 1,039 | | | 0 | | | 1,180 | |
| SnapCap | 0 | | | 78 | | | 0 | | | 77 | |
| Total changes in fair value of contingent consideration | $ | (8,850) | | | $ | 9,175 | | | $ | (8,053) | | | $ | 1,053 | |
As of June 30, 2021, the estimated fair value of the contingent consideration for the QuoteWizard acquisition totaled $0.2 million, which is included in current contingent consideration in the accompanying consolidated balance sheet. The
LENDINGTREE, INC. AND SUBSIDIARIES
NOTES TO CONSOLIDATED FINANCIAL STATEMENTS (Continued)
The Company paid $11.9 million of initial cash consideration and could make up to three additional contingent consideration payments, each ranging from zero to $3.0 million, based on certain defined operating results during the periods of October 1, 2017 through September 30, 2018, October 1, 2018 through September 30, 2019 and October 1, 2019 through March 31, 2020. These additional payments, to the extent earned, will be payable in cash. The Company has estimated a preliminary purchase price of $18.2 million, comprised of the upfront cash payment of $11.9 million and $6.3 million for the estimated fair value of the contingent consideration, which is included in non-current contingent consideration in the accompanying balance sheet.
The estimated fair value of the contingent consideration payments is determined using an option pricing model. The estimated value of the contingent consideration is based upon available information and certain assumptions, known at the time of this report, which management believes are reasonable.
Any differences in the actual contingent consideration payments after the final determination of purchase price will be recorded in operating income (expense) in the consolidated statements of operations and comprehensive income.
The acquisition has been accounted for as a business combination. The preliminary allocation of purchase price to the assets acquired and liabilities assumed is as follows (in thousands):
|
| | | |
| | Preliminary Fair Value |
| Net working capital and other assets | $ | 42 |
|
| Fixed assets | 146 |
|
| Intangible assets | 4,100 |
|
| Goodwill | 13,928 |
|
| Total preliminary purchase price | $ | 18,216 |
|
The Company primarily used the income approach for the valuation as appropriate, and used valuation inputs in these models and analyses that were based on market participant assumptions. Market participants are buyers and sellers unrelated to the Company and fair value is determined as the price that would be received to sell an asset or paid to transfer a liability in an orderly transaction at the measurement date.
The acquired intangible assets are definite-lived assets consisting primarily of developed technology, customer relationships and trade name and trademarks. The estimated fair values of the developed technology were determined using excess earnings analysis, the customer relationships were determined using the distributor method and the trade name and trademarks were determined using relief from royalty analysis. The fair value of the intangible assets with definite lives are as follows (dollars in thousands):
|
| | | | |
| | Preliminary Fair Value | Weighted Average Amortization Life |
| Technology | $ | 400 |
| 3 years |
| Customer lists | 3,100 |
| 10 years |
| Trade name and trademarks | 600 |
| 5 years |
| Total intangible assets | $ | 4,100 |
| 8.6 years |
As of September 30, 2017, the Company has not completed its determination of the final purchase price or the final allocation of the purchase price to the assets and liabilities of the acquisition. The purchase price and final allocation of purchase price is expected to be finalized in the fourth quarter of 2017. Any adjustment to the preliminary purchase price or the assets and liabilities assumed with the acquisition will adjust goodwill.
The Company recorded preliminary goodwill of $13.9 million, which represents the excess of the purchase price over the estimated fair value of the intangible assets acquired. The goodwill is primarily attributable to SnapCap as a going concern which represents the ability of the Company to earn a higher return on the collection of assets and business of SnapCap than if those assets were to be acquired and managed separately. The benefit of access to the workforce is an additional element of goodwill. The goodwill is recorded in the Company’s one reportable segment. For income tax purposes, the Company treated the acquisition as an asset purchase and the goodwill will be tax deductible.
As of the acquisition date, the Company’s consolidated results of operations include the results of the acquired SnapCap business. In the third quarter of 2017, revenue of $0.2 million and net loss from continuing operations of $0.1 million have be
LENDINGTREE, INC. AND SUBSIDIARIES
NOTES TO CONSOLIDATED FINANCIAL STATEMENTS (Continued)
en included in the Company’s consolidated results of operations. Acquisition-related costs were $0.2 million in the third quarter of 2017 and are included in general and administrative expense on the consolidated statement of operations and comprehensive income.
Pro forma Financial Results
The unaudited pro forma financial results for the third quarter and first nine months of 2017 and 2016 combines the consolidated results of the Company and CompareCards, DepositAccounts, MagnifyMoney and SnapCap giving effect to the acquisitions as if the CompareCards acquisition had been completed on January 1, 2015 and as if the DepositAccounts, MagnifyMoney and SnapCap acquisitions had been completed on January 1, 2016. This unaudited pro forma financial information is presented for informational purposes only and is not indicative of future operations or results had the acquisition been completed as of January 1, 2015 or 2016, or any other date.
The unaudited pro forma financial results include adjustments for additional amortization expense based on the fair value of the intangible assets with definite lives and their estimated useful lives. The provision for income taxes from continuing operations has also been adjusted to reflect taxes on the historical results of operations of CompareCards, DepositAccounts and SnapCap. CompareCards, DepositAccounts and SnapCap did not pay taxes at the entity level as these entities were limited liability companies whose members elected for them to be taxed as a partnership.
|
| | | | | | | | | | | | | | | |
| | Three Months Ended
September 30, | | Nine Months Ended
September 30, |
| | 2017 | | 2016 | | 2017 | | 2016 |
| | (in thousands) |
| Pro forma revenue | $ | 172,400 |
| | $ | 118,219 |
| | $ | 465,624 |
| | $ | 347,442 |
|
| Pro forma net income from continuing operations | $ | 10,043 |
| | $ | 8,776 |
| | $ | 26,072 |
| | $ | 23,556 |
|
The pro forma net income from continuing operations in the third quarter and first nine months of 2017 include the after tax contingent consideration expense associated with the CompareCards and DepositAccounts Earnouts of $1.5 million and $12.4 million, respectively. The pro forma net income from continuing operations for the first nine months of 2016 have been adjusted to include acquisition-related costs of $1.0 million incurred by the Company, DepositAccounts, MagnifyMoney and SnapCap that are directly attributable to the acquisitions, which will not have an on-going impact. Accordingly, the acquisition-related costs have been eliminated from the pro forma net income from continuing operations for the third quarter and first nine month of 2017.
NOTE 6—9—ACCRUED EXPENSES AND OTHER CURRENT LIABILITIES
Accrued expenses and other current liabilities consist of the following (in thousands):
| | | | | | | | | | | |
| | June 30,
2021 | | December 31, 2020 |
| Accrued advertising expense | $ | 62,840 | | | $ | 54,045 | |
| Accrued compensation and benefits | 10,632 | | | 14,081 | |
| Accrued professional fees | 3,278 | | | 1,869 | |
| Customer deposits and escrows | 7,467 | | | 8,153 | |
| Contribution to LendingTree Foundation | 3,333 | | | 3,333 | |
| Current lease liabilities | 5,286 | | | 5,375 | |
| Other | 13,540 | | | 14,340 | |
| Total accrued expenses and other current liabilities | $ | 106,376 | | | $ | 101,196 | |
|
| | | | | | | |
| | September 30,
2017 | | December 31,
2016 |
| Accrued litigation liabilities | $ | 588 |
| | $ | 736 |
|
| Accrued advertising expense | 44,698 |
| | 26,976 |
|
| Accrued compensation and benefits | 5,905 |
| | 5,626 |
|
| Accrued professional fees | 1,003 |
| | 1,411 |
|
| Customer deposits and escrows | 5,522 |
| | 5,041 |
|
| Other | 11,028 |
| | 9,613 |
|
| Total accrued expenses and other current liabilities | $ | 68,744 |
| | $ | 49,403 |
|
LENDINGTREE, INC. AND SUBSIDIARIES
NOTES TO CONSOLIDATED FINANCIAL STATEMENTS (Continued)
NOTE 7—10—SHAREHOLDERS' EQUITY
Basic and diluted income per share was determined based on the following share data (in thousands):
| | | | Three Months Ended September 30, | | Nine Months Ended September 30, | | Three Months Ended
June 30, | | Six Months Ended
June 30, |
| | 2017 | | 2016 | | 2017 | | 2016 | | 2021 | | 2020 | | 2021 | | 2020 |
| Weighted average basic common shares | 11,999 |
| | 11,754 |
| | 11,931 |
| | 11,827 |
| Weighted average basic common shares | 13,243 | | | 12,984 | | | 13,157 | | | 12,971 | |
| Effect of stock options | 1,619 |
| | 913 |
| | 1,598 |
| | 877 |
| Effect of stock options | 394 | | | 0 | | | 523 | | | 592 | |
| Effect of dilutive share awards | 101 |
| | 75 |
| | 96 |
| | 78 |
| Effect of dilutive share awards | 72 | | | 0 | | | 103 | | | 91 | |
| Effect of Convertible Senior Notes | 55 |
| | — |
| | — |
| | — |
| |
| Effect of Convertible Senior Notes and warrants | | Effect of Convertible Senior Notes and warrants | 10 | | | 0 | | | 130 | | | 300 | |
| Weighted average diluted common shares | 13,774 |
| | 12,742 |
| | 13,625 |
| | 12,782 |
| Weighted average diluted common shares | 13,719 | | | 12,984 | | | 13,913 | | | 13,954 | |
For the three months ended September 30, 2017,second quarter of 2021, the weighted average shares that were anti-dilutive, and therefore excluded from the calculation of diluted income per share, included options to purchase 0.30.9 million shares of common stock and 0.2 million restricted stock units. For the first six months of 2021, the weighted average shares that were anti-dilutive included options to purchase 0.4 million shares of common stock.
For the second quarter of 2020, the Company had a loss from continuing operations and, as a result, no potentially dilutive securities were included in the denominator for computing diluted loss per share, because the impact would have been anti-dilutive. Accordingly, the weighted average basic shares outstanding was used to compute loss per share. Approximately 0.8 million shares related to potentially dilutive securities were excluded from the calculation of diluted loss per share for the second quarter of 2020, because their inclusion would have been anti-dilutive. For the second quarter of 2020, the weighted average shares that were anti-dilutive included options to purchase 0.7 million shares of common stock and 0.1 million restricted stock awards.units. For the ninefirst six months ended September 30, 2017,of 2020, the weighted average shares that were anti-dilutive and therefore excluded from the calculation of diluted income per share included options to purchase 0.10.2 million shares of common stock.
The 0.625% Convertible Senior Notes due June 1, 2022convertible notes and the warrants issued by the Company in the second quarter of 2017 could be converted into the Company’s common stock, in the future, subject to certain contingencies. See Note 10 —Debt13—Debt for additional information. Shares of the Company’sCompany's common stock associated with these instrumentsthe 0.50% Convertible Senior Notes due July 15, 2025 were excluded from the calculation of diluted income per share duringfor the second quarter and first ninesix months of 20172021 as they arewere anti-dilutive since the conversion price of the Convertible Senior Notes and the strike price of the warrants werenotes was greater than the average market price of the Company’s common stock.stock during the relevant periods. Shares of the Company's common stock associated with the warrants were excluded from the calculation of diluted income per share duringfor the three
LENDINGTREE, INC. AND SUBSIDIARIES
NOTES TO CONSOLIDATED FINANCIAL STATEMENTS (Continued)
second quarter and first six months ended September 30, 2017of 2021 and the first six months of 2020 as they were anti-dilutive since the strike price of the warrants was greater than the average market price of the Company's common stock.
stock during the relevant periods.
Common Stock Repurchases
In each of January 2010, May 2014, January 2016February 2018 and February 2016,2019, the board of directors authorized and the Company announced the repurchase of up to $10.0 million, $10.0 million, $50.0$100.0 million and $40.0$150.0 million, respectively, of LendingTree's common stock. DuringThere were no repurchases of the nine months ended September 30, 2017 and 2016, the Company purchased 42,153 and 690,218 shares, respectively, of itsCompany's common stock pursuant to this stock repurchase program.during the first six months of 2021 and 2020. At SeptemberJune 30, 2017,2021, approximately $38.7$179.7 million of the previous authorizations to repurchase common stock remain available for the Company to purchase its common stock. available.
NOTE 8—11—STOCK-BASED COMPENSATION
Non-cash compensation related to equity awards is included in the following line items in the accompanying consolidated statements of operations and comprehensive income (in thousands):
|
| | | | | | | | | | | | | | | |
| | Three Months Ended
September 30, | | Nine Months Ended
September 30, |
| | 2017 | | 2016 | | 2017 | | 2016 |
| Cost of revenue | $ | 41 |
|
| $ | 29 |
| | $ | 129 |
| | $ | 99 |
|
| Selling and marketing expense | 1,366 |
|
| 737 |
| | 2,543 |
| | 2,118 |
|
| General and administrative expense | 5,864 |
|
| 1,072 |
| | 8,684 |
| | 3,511 |
|
| Product development | 667 |
|
| 510 |
| | 1,712 |
| | 1,682 |
|
| Total non-cash compensation | $ | 7,938 |
| | $ | 2,348 |
| | $ | 13,068 |
| | $ | 7,410 |
|
LENDINGTREE, INC. AND SUBSIDIARIES
NOTES TO CONSOLIDATED FINANCIAL STATEMENTS (Continued)
| | | | | | | | | | | | | | | | | | | | | | | |
| | Three Months Ended
June 30, | | Six Months Ended
June 30, |
| | 2021 | | 2020 | | 2021 | | 2020 |
| Cost of revenue | $ | 463 | | | $ | 333 | | | $ | 860 | | | $ | 575 | |
| Selling and marketing expense | 1,976 | | | 1,597 | | | 3,778 | | | 2,753 | |
| General and administrative expense | 13,254 | | | 9,729 | | | 25,425 | | | 18,852 | |
| Product development | 2,601 | | | 1,499 | | | 4,667 | | | 2,895 | |
| Total non-cash compensation | $ | 18,294 | | | $ | 13,158 | | | $ | 34,730 | | | $ | 25,075 | |
Stock Options
A summary of changes in outstanding stock options is as follows:
| | | | | | | | | | | | | | | | | | | | | | | |
| | Number of Options | | Weighted
Average
Exercise
Price | | Weighted
Average
Remaining
Contractual
Term | | Aggregate Intrinsic Value(a) |
| | | | (per option) | | (in years) | | (in thousands) |
| Options outstanding at January 1, 2021 | 924,710 | | | $ | 111.82 | | | | | |
Granted (b) | 69,258 | | | 243.71 | | | | | |
| Exercised | (156,113) | | | 7.17 | | | | | |
| Forfeited | (4,727) | | | 263.72 | | | | | |
| Expired | (35) | | | 371.25 | | | | | |
| Options outstanding at June 30, 2021 | 833,093 | | | 141.52 | | | 5.20 | | $ | 82,110 | |
| Options exercisable at June 30, 2021 | 543,666 | | | $ | 71.06 | | | 3.20 | | $ | 82,039 | |
(a)The aggregate intrinsic value represents the total pre-tax intrinsic value (the difference between the Company's closing stock price of $211.88 on the last trading day of the quarter ended June 30, 2021 and the exercise price, multiplied by the number of shares covered by in-the-money options) that would have been received by the option holder had the option holder exercised these options on June 30, 2021. The intrinsic value changes based on the market value of the Company's common stock.
(b)During the six months ended June 30, 2021, the Company granted stock options to certain employees and members of the board of directors with a weighted average grant date fair value per share of $130.25, calculated using the Black-Scholes option pricing model, which vesting periods include (a) immediate vesting on grant date (b) earlier of one year from grant date and the Company's annual meeting of stockholders for 2022 and (c) three years from grant date.
|
| | | | | | | | | | | | |
| | Number of Options | | Weighted Average Exercise Price | | Weighted Average Remaining Contractual Term | | Aggregate Intrinsic Value(a) |
| | | | (per option) | | (in years) | | (in thousands) |
| Options outstanding at January 1, 2017 | 1,991,802 |
| | $ | 21.23 |
| | | | |
|
Granted (b) | 51,089 |
| | 187.82 |
| | | | |
|
| Exercised | (179,165 | ) | | 31.75 |
| | | | |
|
| Forfeited | (20,001 | ) | | 71.04 |
| | | | |
|
| Expired | — |
| | — |
| | | | |
|
| Options outstanding at September 30, 2017 | 1,843,725 |
| | 24.28 |
| | 4.58 | | $ | 405,934 |
|
| Options exercisable at September 30, 2017 | 1,072,151 |
| | $ | 11.82 |
| | 2.71 | | $ | 249,411 |
|
| |
(a) | The aggregate intrinsic value represents the total pre-tax intrinsic value (the difference between the Company's closing stock price of $244.45 on the last trading day of the quarter ended September 30, 2017 and the exercise price, multiplied by the number of shares covered by in-the-money options) that would have been received by the option holders had all option holders exercised their options on September 30, 2017. The intrinsic value changes based on the market value of the Company's common stock. |
| |
(b) | During the nine months ended September 30, 2017, the Company granted stock options to certain employees and members of the board of directors with a weighted average grant date fair value per share of $93.26, calculated using the Black-Scholes option pricing model, which vesting periods include (a) three years from the grant date, (b) two years from the grant date and (c) immediately upon grant. |
LENDINGTREE, INC. AND SUBSIDIARIES
NOTES TO CONSOLIDATED FINANCIAL STATEMENTS (Continued)
For purposes of determining stock-based compensation expense, the weighted average grant date fair value per share of the stock options was estimated using the Black-Scholes option pricing model, which requires the use of various key assumptions. The weighted average assumptions used are as follows:
|
| | | | |
Expected term (1) | 5.00 - 6.00 years |
Expected dividend (2) | 0 | |
Expected dividend (2)volatility (3) | — |
53 - 59% |
Expected volatility (3)
| 51% - 52% |
|
Risk-free interest rate (4) | 1.74%0.59 - 2.17% |
1.07% |
| |
(1) | (1)The expected term of stock options granted was calculated using the "Simplified Method," which utilizes the midpoint between the weighted average time of vesting and the end of the contractual term. This method was utilized for the stock options due to a lack of historical exercise behavior by the Company's employees. |
| |
(2) | For all stock options granted in 2017, no dividends are expected to be paid over the contractual term of the stock options, resulting in a zero expected dividend rate. |
| |
(3) | The expected volatility rate is based on the historical volatility of the Company's common stock. |
| |
(4) | The risk-free interest rate is specific to the date of grant. The risk-free interest rate is based on U.S. Treasury yields for notes with comparable expected terms as the awards, in effect at the grant date. |
LENDINGTREE, INC. AND SUBSIDIARIES
NOTES TO CONSOLIDATED FINANCIAL STATEMENTS (Continued)
Restricted Stock Units and Restricted Stock
A summary of the changescontractual term. This method was utilized for the stock options due to a lack of historical exercise behavior by the Company's employees.
(2)For all stock options granted in outstanding nonvested restricted stock units ("RSUs") and restricted stock is as follows:
|
| | | | | | |
| | RSUs |
| | Number of Units | | Weighted Average Grant Date Fair Value |
| | | | (per unit) |
| Nonvested at January 1, 2017 | 152,374 |
| | $ | 65.64 |
|
| Granted | 83,113 |
| | 138.07 |
|
| Vested | (72,112 | ) | | 54.79 |
|
| Forfeited | (14,078 | ) | | 82.37 |
|
| Nonvested at September 30, 2017 | 149,297 |
| | $ | 109.64 |
|
|
| | | | | | |
| | Restricted Stock |
| | Number of Shares | | Weighted Average Grant Date Fair Value |
| | | | (per share) |
| Nonvested at January 1, 2017 | 14,464 |
| | $ | 25.14 |
|
| Granted | — |
| | — |
|
| Vested | (14,464 | ) | | 25.14 |
|
| Forfeited | — |
| | — |
|
| Nonvested at September 30, 2017 | — |
| | $ | — |
|
Restricted Stock Units with Performance Conditions
A summary2021, 0 dividends are expected to be paid over the contractual term of the changesstock options, resulting in outstanding nonvested RSUs with performance conditionsa zero expected dividend rate.
(3)The expected volatility rate is as follows:
|
| | | | | | |
| | RSUs with Performance Conditions |
| | Number of Units | | Weighted Average Grant Date Fair Value |
| | | | (per unit) |
| Nonvested at January 1, 2017 | 44,509 |
| | $ | 88.28 |
|
| Granted | 53,306 |
| | 164.07 |
|
| Vested | (1,931 | ) | | 96.46 |
|
| Forfeited | — |
| | — |
|
| Nonvested at September 30, 2017 | 95,884 |
| | $ | 130.25 |
|
Chairman and Chief Executive Officer Grants
As disclosed inbased on the historical volatility of the Company's reportcommon stock.
(4)The risk-free interest rate is specific to the date of grant. The risk-free interest rate is based on Form 10-QU.S. Treasury yields for notes with comparable expected terms as the quarterly period ending June 30, 2017, on July 25, 2017,awards, in effect at the Company’s Compensation Committee of its Board of Directors approved new compensation arrangements for its Chairman and Chief Executive Officer. The new compensation arrangements include the issuance of performance based equity compensation grants with a modeled total grant date value of $87.5 million of which 25% (119,015 shares) would be in the form of time-vested restricted stock awards with a performance condition and 75% (a maximum of 769,376 shares) would be in the form of performance-based nonqualified stock options.
LENDINGTREE, INC. AND SUBSIDIARIES
NOTES TO CONSOLIDATED FINANCIAL STATEMENTS (Continued)
date.
Stock Options with Market Conditions
The performance-based nonqualifiedA summary of changes in outstanding stock options have awith market conditions at target is as follows:
| | | | | | | | | | | | | | | | | | | | | | | |
| | Number of Options with Market Conditions | | Weighted
Average
Exercise
Price | | Weighted
Average
Remaining
Contractual
Term | | Aggregate Intrinsic Value(a) |
| | | | (per option) | | (in years) | | (in thousands) |
| Options outstanding at January 1, 2021 | 700,209 | | | $ | 236.01 | | | | | |
| Granted | 0 | | | 0 | | | | | |
| Exercised | 0 | | | 0 | | | | | |
| Forfeited | 0 | | | 0 | | | | | |
| Expired | 0 | | | 0 | | | | | |
| Options outstanding at June 30, 2021 | 700,209 | | | 236.01 | | | 7.25 | | $ | 11,308 | |
| Options exercisable at June 30, 2021 | 0 | | | $ | 0 | | | 0.00 | | $ | 0 | |
(a)The aggregate intrinsic value represents the total pre-tax intrinsic value (the difference between the Company's closing stock price of $211.88 on the last trading day of the quarter ended June 30, 2021 and the exercise price, multiplied by the number of shares covered by in-the-money options) that vest upon achieving targeted total shareholder return performancewould have been received by the option holder had the option holder exercised these options on June 30, 2021. The intrinsic value changes based on the market value of 110% stock price appreciation and athe Company's common stock.
A maximum number of 1,169,349 shares may be earned for achieving superior performance up to 167% of the target number of shares. No shares will vest unless 70%As of the targeted performance is achieved. Time-based service vesting conditions would also have to be satisfied in order for performance-vested shares to become fully vested and no longer subject to forfeiture. In connection with the new compensation arrangements, on July 26, 2017, an initial grant ofJune 30, 2021, performance-based nonqualified stock options with a target numbermarket condition of shares of 402,694 and481,669 had been earned, which have a maximum number of shares of 672,499 were issued with an exercise price of $183.80, the closing stock price on July 26, 2017. The fair value of the performance-based stock options will be recognized on a straight-line basis through the vest date of September 30, 2022, whether or not any of the total shareholder return targets are met. In the three months ended September 30, 2017, the Company recorded $2.0 million in stock-based compensation expense in the consolidated statement of operations and comprehensive income.
The Company's Fifth Amended and Restated 2008 Stock and Annual Incentive Plan (the "2008 Plan") imposes a per employee upper annual grant limit of 672,500 shares. As a result, the remaining 58,010 target performance-based nonqualified stock options (and potential performance-based restricted stock awards) will be awarded on or about January 2, 2018. The form of the awards will consist of a performance-based nonqualified stock option award with a per share exercise price of $183.80 or the closing price of the Company's common stock on such future grant date (“2018 Performance Option”) if the closing price on such future grant date is greater than $183.80; and, if the closing share price of the Company's common stock on January 2, 2018 is greater than the closing share price on July 26, 2017, a second performance-based restricted stock award will be granted, substituting for an equal number of the performance-based options, to compensate for the increase in the exercise price of the performance-based option granted on July 26, 2017. The number of performance-based options and performance-based restricted stock shares will not be determined until January 2, 2018. As of September 30, 2017, the Company estimated the fair value of the remaining 58,010 target shares using a Monte Carlo simulation model and the Company's common stock price on September 30, 2017 to record mark-to-market expense associated with the commitment to issue the shares. In the three months ended September 30, 2017, the Company recorded $0.4 million in stock-based compensation expense based on the current estimated fair value on a straight-line basis.
As of September 30, 2017, the performance conditions associated with the performance-based nonqualified stock options and the potential performance-based restricted stock shares had not been met.
A summary of changes in outstanding stock options with market conditions is as follows:2022.
|
| | | | | | | | | | | | |
| | Number of Options with Market Conditions | | Weighted Average Exercise Price | | Weighted Average Remaining Contractual Term | | Aggregate Intrinsic Value(a) |
| | | | (per option) | | (in years) | | (in thousands) |
| Options outstanding at January 1, 2017 | — |
| | $ | — |
| | | | |
|
| Granted (b) | 402,694 |
| | 183.80 |
| | | | |
|
| Exercised | — |
| | — |
| | | | |
|
| Forfeited | — |
| | — |
| | | | |
|
| Expired | — |
| | — |
| | | | |
|
| Options outstanding at September 30, 2017 | 402,694 |
| | 183.80 |
| | 9.82 | | $ | 24,423 |
|
| Options exercisable at September 30, 2017 | — |
| | $ | — |
| | 0 | | $ | — |
|
| |
(a) | The aggregate intrinsic value represents the total pre-tax intrinsic value (the difference between the Company's closing stock price of $244.45 on the last trading day of the quarter ended September 30, 2017 and the exercise price, multiplied by the number of shares covered by in-the-money options) that would have been received by the option holders had all option holders exercised their options on September 30, 2017. The intrinsic value changes based on the market value of the Company's common stock. |
| |
(b) | During the nine months ended September 30, 2017, the Company granted stock options to an employee with a weighted average grant date fair value per share of $142.45, calculated using the Monte Carlo simulation model, which have a vesting date of September 30, 2022. |
LENDINGTREE, INC. AND SUBSIDIARIES
NOTES TO CONSOLIDATED FINANCIAL STATEMENTS (Continued)
Restricted Stock Units
For purposesA summary of determining stock-based compensation expense, the weighted average grant date fair value per share of thechanges in outstanding nonvested restricted stock options was estimated using the Monte Carlo simulation model, which requires the use of various key assumptions. The weighted average assumptions used areunits ("RSUs") is as follows:
| | | | | | | | | | | |
| | RSUs |
| | Number of Units | | Weighted Average Grant Date Fair Value |
| | | (per unit) |
| Nonvested at January 1, 2021 | 194,686 | | | $ | 289.82 | |
| Granted | 149,259 | | | 245.00 | |
| Vested | (54,644) | | | 290.38 | |
| Forfeited | (20,735) | | | 269.88 | |
| Nonvested at June 30, 2021 | 268,566 | | | $ | 266.34 | |
|
| | |
| Restricted Stock Units with Performance Conditions A summary of changes in outstanding nonvested RSUs with performance conditions is as follows: | | | | | | | | | | | | | | RSUs with Performance Conditions | | | Number of Units | | Weighted Average Grant Date Fair Value | | | | (per unit) | | Nonvested at January 1, 2021 | 6,328 | | | $ | 223.90 | | | Granted | 0 | | | 0 | | | Vested | 0 | | | 0 | | | Forfeited | 0 | | | 0 | | | Nonvested at June 30, 2021 | 6,328 | | | $ | 223.90 | |
Expected term (1)
| 7.50 years |
|
Expected dividend (2)
| — |
|
Expected volatility (3)
| 50% |
|
Risk-free interest rate (4)
| 2.12% |
|
| |
(1) | The expected term of stock options with a market condition granted was calculated using the "Simplified Method," which utilizes the midpoint between the weighted average time of vesting and the end of the contractual term. This method was utilized for the stock options with market conditions due to a lack of historical exercise behavior by the Company's employees. |
| |
(2) | For all stock options with a market condition granted in 2017, no dividends are expected to be paid over the contractual term of the stock options, resulting in a zero expected dividend rate. |
| |
(3) | The expected volatility rate is based on the historical volatility of the Company's common stock. |
| |
(4) | The risk-free interest rate is specific to the date of grant. The risk-free interest rate is based on U.S. Treasury yields for notes with comparable expected terms as the awards, in effect at the grant date. |
Time Vested Restricted Stock Awards with Performance Conditions
On January 2, 2018, 119,015A summary of changes in outstanding nonvested restricted stock awards ("RSAs") with performance conditions is as follows:
| | | | | | | | | | | |
| | RSAs with Performance Conditions |
| | Number of Awards | | Weighted Average Grant Date Fair Value |
| | | (per unit) |
| Nonvested at January 1, 2021 | 23,804 | | | $ | 340.25 | |
| Granted | 0 | | | 0 | |
| Vested | (11,902) | | | 340.25 | |
| Forfeited | 0 | | | 0 | |
| Nonvested at June 30, 2021 | 11,902 | | | $ | 340.25 | |
LENDINGTREE, INC. AND SUBSIDIARIES
NOTES TO CONSOLIDATED FINANCIAL STATEMENTS (Continued)
Restricted Stock Awards with Market Conditions
A summary of changes in outstanding nonvested RSAs with market conditions at target is as follows:
| | | | | | | | | | | |
| | RSAs with Market Conditions |
| | Number of Awards | | Weighted Average Grant Date Fair Value |
| | | (per unit) |
| Nonvested at January 1, 2021 | 26,674 | | | $ | 340.25 | |
| Granted | 0 | | | 0 | |
| Vested | 0 | | | 0 | |
| Forfeited | 0 | | | 0 | |
| Nonvested at June 30, 2021 | 26,674 | | | $ | 340.25 | |
A maximum of 44,545 shares may be earned for achieving superior performance up to 167% of the target number of shares. As of June 30, 2021, performance-based restricted stock awards with time-vesting and a performancemarket condition will be granted. The terms of these awards were fixed in the approved new compensation agreements in July 2017. In the three months ended29,601 had been earned, which have a vest date of September 30, 2017,2022.
NOTE 12—INCOME TAXES
| | | | | | | | | | | | | | | | | | | | | | | |
| | Three Months Ended
June 30, | | Six Months Ended
June 30, |
| | 2021 | | 2020 | | 2021 | | 2020 |
| (in thousands, except percentages) |
| Income tax benefit | $ | 9,092 | | | $ | 3,880 | | | $ | 454 | | | $ | 6,941 | |
| Effective tax rate | (1,284.2) | % | | 31.0 | % | | (1.6) | % | | (203.0) | % |
For the Company recorded $1.3 million in stock-based compensation to reflect the commitment to issue the shares in the consolidated statement of operationssecond quarter and comprehensive income. The performance condition is tied to the Company's operating results during the first six months of 2018. As of September 30, 2017, the performance condition associated with the awards had not been met.
NOTE 9—INCOME TAXES
|
| | | | | | | | | | | | | | | |
| | Three Months Ended
September 30, | | Nine Months Ended
September 30, |
| | 2017 | | 2016 | | 2017 | | 2016 |
| | (in thousands, except percentages) |
| Income tax expense | $ | (4,292 | ) | | $ | (6,729 | ) | | $ | (3,109 | ) | | $ | (15,099 | ) |
| Effective tax rate | 29.8 | % | | 48.0 | % | | 10.7 | % | | 39.4 | % |
For the three and nine months ended September 30, 2017,2021, the effective tax rate varied from the federal statutory rate of 35% primarily21% in part due to a tax benefit of $0.8$8.3 million and $8.4 million, respectively, recognized for excess tax benefits due toresulting from employee exercises of stock options and vesting of restricted stock in accordance with ASU 2016-09. See Note 2 —Significant Accounting Policies —Recent Accounting Pronouncements for additional information.2016-09 and the effect of state taxes.
For the thirdsecond quarter and first six months of 2016,2020, the effective tax rate varied from the federal statutory rate of 35% primarily21% in part due to a tax benefit of $0.8 million and $1.8 million, respectively, recognized for excess tax benefits resulting from employee exercises of stock options and vesting of restricted stock in accordance with ASU 2016-09 and the effect of state taxes, includingtaxes. The effective tax rate for the first six months of 2020 was also impacted by a tax benefit of $6.1 million for the impact of a reductionthe Coronavirus Aid, Relief, and Economic Security ("CARES") Act, as described below.
On March 27, 2020, President Trump signed into law the CARES Act. This legislation is an economic relief package in response to the public health and economic impacts of COVID-19 and includes various provisions that impact the Company, including, but not limited to, modifications for net operating losses, accelerated timeframe for refunds associated with prior minimum taxes and modifications of the limitation on business interest.
The Company revalued deferred tax assets related to net operating losses in light of the changes in the North Carolina state incomeCARES Act and recorded a net tax rates which reducedbenefit of $6.1 million during the valuefirst six months of the Company's2020. These deferred tax assets.
Forassets are being revalued, as they have been carried back to 2016 and 2017, which are tax periods prior to the nine months ended September 30, 2016, the effective tax rate varied fromTax Cuts and Jobs Act ("TCJA") when the federal statutory tax rate ofwas 35% primarily due toversus the benefit derived from21% federal statutory tax rate in effect after the federal research tax credit, partially offset by state taxes. The federal research tax credit benefit was the result of a study completed during the second quarter of 2016 for the open tax years 2011 through 2015, plus an estimateenactment of the benefit from 2016 research activities.
TCJA.
LENDINGTREE, INC. AND SUBSIDIARIES
NOTES TO CONSOLIDATED FINANCIAL STATEMENTS (Continued)
| | | | | | | | | | | | | | | | | | | | | | | |
| | Three Months Ended
June 30, | | Six Months Ended
June 30, |
| | 2021 | | 2020 | | 2021 | | 2020 |
| (in thousands) |
| Income tax benefit (expense) - excluding excess tax benefit on stock compensation and CARES Act | $ | 831 | | | $ | 3,127 | | | $ | (7,839) | | | $ | (970) | |
| Excess tax benefit on stock compensation | 8,261 | | | 753 | | | 8,293 | | | 1,807 | |
| Income tax benefit from CARES Act | 0 | | | 0 | | | 0 | | | 6,104 | |
| Income tax benefit | $ | 9,092 | | | $ | 3,880 | | | $ | 454 | | | $ | 6,941 | |
|
| | | | | | | | | | | | | | | |
| | Three Months Ended
September 30, | | Nine Months Ended
September 30, |
| | 2017 | | 2016 | | 2017 | | 2016 |
| | (in thousands) |
| Income tax expense - excluding excess tax benefit on stock compensation | $ | (5,103 | ) | | $ | (6,729 | ) | | $ | (11,523 | ) | | $ | (15,099 | ) |
| Excess tax benefit on stock compensation | 811 |
| | — |
| | 8,414 |
| | — |
|
| Income tax expense | $ | (4,292 | ) | | $ | (6,729 | ) | | $ | (3,109 | ) | | $ | (15,099 | ) |
NOTE 10—13—DEBT
Convertible Senior Notes
2025 Notes
On July 24, 2020, the Company issued $575.0 million aggregate principal amount of its 0.50% Convertible Senior Notes due July 15, 2025 (the “2025 Notes”) in a private placement. The issuance included $75.0 million aggregate principal amount of 2025 Notes under a 13-day purchase option which was exercised in full. The 2025 Notes bear interest at a rate of 0.50% per year, payable semi-annually on January 15 and July 15 of each year, beginning on January 15, 2021. The 2025 Notes will mature on July 15, 2025, unless earlier repurchased, redeemed or converted.
The initial conversion rate of the 2025 Notes is 2.1683 shares of the Company's common stock per $1,000 principal amount of 2025 Notes (which is equivalent to an initial conversion price of approximately $461.19 per share). The conversion rate will be subject to adjustment upon the occurrence of certain specified events but will not be adjusted for accrued and unpaid interest. In addition, upon the occurrence of a make-whole fundamental change prior to the maturity of the 2025 Notes or if the Company issues a notice of redemption for the 2025 Notes, the Company will, in certain circumstances, increase the conversion rate by a specified number of additional shares for a holder that elects to convert the 2025 Notes in connection with such make-whole fundamental change or to convert its 2025 Notes called for redemption, as the case may be. Upon conversion, the 2025 Notes will settle for cash, shares of the Company’s stock, or a combination thereof, at the Company’s option. It is the intent of the Company to settle the principal amount of the 2025 Notes in cash and any conversion premium in shares of its common stock.
The 2025 Notes are the Company’s senior unsecured obligations and will rank senior in right of payment to any of the Company’s indebtedness that is expressly subordinated in right of payment to the 2025 Notes; equal in right of payment to any of the Company’s unsecured indebtedness that is not so subordinated; effectively junior in right of payment to any of the Company’s secured indebtedness, including borrowings under the senior secured revolving credit facility, described below, to the extent of the value of the assets securing such indebtedness; and structurally junior to all indebtedness and other liabilities (including trade payables) of the Company’s subsidiaries.
Prior to the close of business on the business day immediately preceding March 13, 2025, the 2025 Notes will be convertible at the option of the holders thereof only under the following circumstances:
•during any calendar quarter commencing after the calendar quarter ending on September 30, 2020 (and only during such calendar quarter), if the last reported sale price of the common stock for at least 20 trading days (whether or not consecutive) during the 30 consecutive trading day period ending on, and including the last trading day of the immediately preceding calendar quarter is greater than or equal to 130% of the conversion price on each applicable trading day;
•during the 5 business day period after any 5 consecutive trading day period in which, for each trading day of that period, the trading price (as defined in the 2025 Notes) per $1,000 principal amount of 2025 Notes for such trading day was less than 98% of the product of the last reported sale price of the common stock and the conversion rate on each such trading day;
•if the Company calls such 2025 Notes for redemption, at any time prior to the close of business on the scheduled trading day immediately preceding the redemption date, but only with respect to the notes called for redemption; or
LENDINGTREE, INC. AND SUBSIDIARIES
NOTES TO CONSOLIDATED FINANCIAL STATEMENTS (Continued)
•upon the occurrence of specified corporate events including but not limited to a fundamental change.
Holders of the 2025 Notes were not entitled to convert the 2025 Notes during the calendar quarter ended June 30, 2021 as the last reported sale price of the Company's common stock, for at least 20 trading days (whether or not consecutive) during the period of 30 consecutive trading days ending on March 31, 2021, was not greater than or equal to 130% of the conversion price of the 2025 Notes on each applicable trading day. Holders of the 2025 Notes are not entitled to convert the 2025 Notes during the calendar quarter ended September 30, 2021 as the last reported sale price of the Company's common stock, for at least 20 trading days (whether or not consecutive) during the period of 30 consecutive trading days ending on June 30, 2021, was not greater than or equal to 130% of the conversion price of the 2025 Notes on each applicable trading day.
On or after March 13, 2025, until the close of business on the second scheduled trading day immediately preceding the maturity date of the 2025 Notes, holders of the 2025 Notes may convert all or a portion of their 2025 Notes regardless of the foregoing conditions.
The Company may not redeem the 2025 Notes prior to July 20, 2023. On or after July 20, 2023 and before the 41st scheduled trading day immediately before the maturity date, the Company may redeem for cash all or a portion of the 2025 Notes, at its option, if the last reported sale price of the common stock for at least 20 trading days (whether or not consecutive) during the 30 consecutive trading day period (and including the last trading day of such period) ending on, and including the last trading day immediately preceding the date of notice of redemption is greater than or equal to 130% of the conversion price on each applicable trading day. The redemption price will be equal to 100% of the principal amount of the 2025 Notes to be redeemed, plus any accrued and unpaid interest to, but excluding, the redemption date. No sinking fund is provided for the 2025 Notes.
Upon the occurrence of a fundamental change prior to the maturity date of the 2025 Notes, holders of the 2025 Notes may require the Company to repurchase all or a portion of the 2025 Notes for cash at a price equal to 100% of the principal amount of the 2025 Notes to be repurchased, plus any accrued and unpaid interest to, but excluding, the fundamental change repurchase date.
If the market price per share of the common stock, as measured under the terms of the 2025 Notes, exceeds the conversion price of the 2025 Notes, the 2025 Notes could have a dilutive effect, unless the Company elects, subject to certain conditions, to settle the principal amount of the 2025 Notes and any conversion premium in cash.
The initial measurement of convertible debt instruments that may be settled in cash is separated into a debt and an equity component whereby the debt component is based on the fair value of a similar instrument that does not contain an equity conversion option. The separate components of debt and equity of the Company’s 2025 Notes were determined using an interest rate of 5.30%, which reflects the nonconvertible debt borrowing rate of the Company at the date of issuance. As a result, the initial components of debt and equity were $455.6 million and $119.4 million, respectively. Financing costs related to the issuance of the 2025 Notes were approximately $15.1 million, of which $12.0 million were allocated to the liability component and are being amortized to interest expense over the term of the debt and $3.1 million were allocated to the equity component.
In the first six months of 2021, the Company recorded interest expense on the 2025 Notes of $13.5 million which consisted of $1.4 million associated with the 0.50% coupon rate, $11.0 million associated with the accretion of the debt discount, and $1.1 million associated with the amortization of the debt issuance costs. The debt discount is being amortized over the term of the debt.
As of June 30, 2021, the fair value of the 2025 Notes is estimated to be approximately $520.4 million using the Level 1 observable input of the last quoted market price on June 30, 2021.
LENDINGTREE, INC. AND SUBSIDIARIES
NOTES TO CONSOLIDATED FINANCIAL STATEMENTS (Continued)
A summary of the gross carrying amount, unamortized debt cost, debt issuance costs and net carrying value of the liability component of the 2025 Notes, all of which is recorded as a non-current liability in the June 30, 2021 consolidated balance sheet, are as follows (in thousands):
| | | | | | | | | | | |
| | June 30,
2021 | | December 31, 2020 |
| Gross carrying amount | $ | 575,000 | | | $ | 575,000 | |
| Unamortized debt discount | 99,166 | | | 110,110 | |
| Debt issuance costs | 9,958 | | | 11,056 | |
| Net carrying amount | $ | 465,876 | | | $ | 453,834 | |
2022 Notes
On May 31, 2017, the Company issued $300.0 million aggregate principal amount of its 0.625% Convertible Senior Notes due June 1, 2022 (the “Notes”“2022 Notes”) in a private placement. The issuance included $35.0 million aggregate principal amount of Notes under a 30-day purchase option, solely to cover over-allotments, which was exercised in full. The2022 Notes bear interest at a rate of 0.625% per year, payable semi-annually on June 1 and December 1 of each year, beginning on December 1, 2017. The 2022 Notes will mature on June 1, 2022, unless earlier repurchased or converted.
The initial conversion rate of the 2022 Notes is 4.8163 shares of Common Stockthe Company's common stock per $1,000 principal amount of 2022 Notes (which is equivalent to an initial conversion price of approximately $207.63 per share). The conversion rate will be subject to adjustment upon the occurrence of certain specified events but will not be adjusted for accrued and unpaid interest. In addition, upon the occurrence of a make-whole fundamental change prior to the maturity of the 2022 Notes, the Company will, in certain circumstances, increase the conversion rate by a specified number of additional shares for a holder that elects to convert the 2022 Notes in connection with such make-whole fundamental change. Upon conversion, the 2022 Notes will settle for cash, shares of the Company’s stock, or a combination thereof, at the Company’s option. It is the intent of the Company to settle the principal amount of the 2022 Notes in cash and any conversion premium in shares of its common stock.
The 2022 Notes are the Company’s senior unsecured obligations and will rank senior in right of payment to any of the Company’s indebtedness that is expressly subordinated in right of payment to the 2022 Notes; equal in right of payment to any of the Company’s unsecured indebtedness that is not so subordinated; effectively junior in right of payment to any of the Company’s secured indebtedness, including borrowings under the Senior Secured Credit Facility,senior secured revolving credit facility, described below, to the extent of the value of the assets securing such indebtedness; and structurally junior to all indebtedness and other liabilities (including trade payables) of the Company’s subsidiaries.
Prior to the close of business on the business day immediately preceding February 1, 2022, the 2022 Notes will be convertible at the option of the holders thereof only under the following circumstances:
•during any calendar quarter commencing after the calendar quarter ending on September 30, 2017 (and only during such calendar quarter), if the last reported sale price of the common stock for at least 20 trading days (whether or not consecutive) during the 30 consecutive trading day period ending on, and including the last trading day of the immediately preceding calendar quarter is greater than or equal to 130% of the conversion price on each applicable trading day;
•during the five5 business day period after any five5 consecutive trading day period in which, for each trading day of that period, the trading price (as defined in the 2022 Notes) per $1,000 principal amount of 2022 Notes for such trading day was less than 98% of the product of the last reported sale price of the Common Stockcommon stock and the conversion rate on each such trading day; or
•upon the occurrence of specified corporate events including but not limited to a fundamental change.
Holders of the 2022 Notes were not entitled to convert the 2022 Notes during the calendar quarter ended June 30, 2021 as the last reported sale price of the Company's common stock, for at least 20 trading days (whether or not consecutive) during the period of 30 consecutive trading days ending on March 31, 2021, was not greater than or equal to 130% of the conversion price of the 2022 Notes on each applicable trading day. Holders of the 2022 Notes are not entitled to convert the 2022 Notes during the calendar quarter ended September 30, 2021 as the last reported sale price of the Company's common stock, for at least 20 trading days (whether or not consecutive) during the period of 30 consecutive trading days ending on June 30, 2021, was not greater than or equal to 130% of the conversion price of the 2022 Notes on each applicable trading day.
LENDINGTREE, INC. AND SUBSIDIARIES
NOTES TO CONSOLIDATED FINANCIAL STATEMENTS (Continued)
On or after February 1, 2022, until the close of business on the second scheduled trading day immediately preceding the maturity date of the 2022 Notes, holders of the 2022 Notes may convert all or a portion of their 2022 Notes regardless of the foregoing conditions.
The Company may not redeem the 2022 Notes prior to the maturity date and no sinking fund is provided for the 2022 Notes. Upon the occurrence of a fundamental change prior to the maturity date of the 2022 Notes, holders of the 2022 Notes may require the Company to
LENDINGTREE, INC. AND SUBSIDIARIES
NOTES TO CONSOLIDATED FINANCIAL STATEMENTS (Continued)
repurchase all or a portion of the 2022 Notes for cash at a price equal to 100% of the principal amount of the 2022 Notes to be repurchased, plus any accrued and unpaid interest to, but excluding, the fundamental change repurchase date.
If the market price per share of the Common Stock,common stock, as measured under the terms of the 2022 Notes, exceeds the conversion price of the 2022 Notes, the 2022 Notes could have a dilutive effect, unless the Company elects, subject to certain conditions, to settle the principal amount of the 2022 Notes and any conversion premium in cash.
The initial measurement of convertible debt instruments that may be settled in cash are separated into a debt and equity component whereby the debt component is based on the fair value of a similar instrument that does not contain an equity conversion option. The separate components of debt and equity of the Company’s 2022 Notes were determined using an interest rate of 5.36%, which reflects the nonconvertible debt borrowing rate of the Company at the date of issuance. As a result, the initial components of debt and equity were $238.4 million and $61.6 million, respectively.
In the first nine months of 2017, the Company recorded interest expense on the Notes of $4.7 million which consisted of $0.6 million associated with the 0.625% coupon rate, $3.6 million associated with the accretion of the debt discount, and $0.4 million associated with the amortization of the debt issuance costs. The debt discount will be amortized over the term of the debt.
Financing costs related to the issuance of the 2022 Notes were approximately $9.3 million, of which $7.4 million were allocated to the liability component and are being amortized to interest expense over the term of the debt and $1.9 million were allocated to the equity component.
On July 24, 2020, the Company used approximately $234.0 million of the net proceeds from the issuance of the 2025 Notes to repurchase approximately $130.3 million principal amount of the 2022 Notes, including the payment of accrued and unpaid interest of approximately $0.1 million, through separate transactions with certain holders of the 2022 Notes. Of the consideration paid, $126.0 million was allocated to the extinguishment of the liability component of the notes, while the remaining $107.9 million was allocated to the reacquisition of the equity component and recorded as a reduction to additional paid-in capital in the consolidated statement of shareholders’ equity. The Company recognized a loss on debt extinguishment of $7.8 million in the third quarter of 2020.
In the first six months of 2021, the Company recorded interest expense on the 2022 Notes of $4.7 million which consisted of $0.5 million associated with the 0.625% coupon rate, $3.8 million associated with the accretion of the debt discount, and $0.4 million associated with the amortization of the debt issuance costs. In the first six months of 2020, the Company recorded interest expense on the 2022 Notes of $7.9 million which consisted of $0.9 million associated with the 0.625% coupon rate, $6.3 million associated with the accretion of the debt discount, and $0.7 million associated with the amortization of the debt issuance costs. The debt discount is being amortized over the term of the debt.
As of SeptemberJune 30, 2017,2021, the fair value of the 2022 Notes is estimated to be approximately $398.7$208.7 million using the Level 1 observable input of the last quoted market price on September 29, 2017.June 30, 2021.
A summary of the gross carrying amount, unamortized debt cost, debt issuance costs and net carrying value of the liability component of the 2022 Notes, all of which is recorded as a current liability in the June 30, 2021 consolidated balance sheet, are as follows (in thousands):
| | | | September 30,
2017 | | December 31,
2016 | | June 30,
2021 | | December 31, 2020 |
| Gross carrying amount | $ | 300,000 |
| | $ | — |
| Gross carrying amount | $ | 169,659 | | | $ | 169,690 | |
| Unamortized debt discount | 57,953 |
| | — |
| Unamortized debt discount | 7,086 | | | 10,815 | |
| Debt issuance costs | 6,927 |
| | — |
| Debt issuance costs | 850 | | | 1,297 | |
| Net carrying amount | $ | 235,120 |
| | $ | — |
| Net carrying amount | $ | 161,723 | | | $ | 157,578 | |
Convertible Note Hedge and Warrant Transactions
2020 Hedge and Warrants
On May 31, 2017,July 24, 2020, in connection with the issuance of the 2025 Notes, the Company entered into Convertible Note Hedge (the “Hedge”“2020 Hedge”) and Warrantwarrant transactions with respect to the Company’s common stock. The Company used approximately $18.1$63.0 million of the net proceeds from the 2025 Notes to pay for the cost of the 2020 Hedge, after such cost was partially offset by the proceeds from the Warrantwarrant transactions.
LENDINGTREE, INC. AND SUBSIDIARIES
NOTES TO CONSOLIDATED FINANCIAL STATEMENTS (Continued)
On May 31, 2017,July 24, 2020, the Company paid $61.5$124.2 million to the counterparties for the 2020 Hedge transactions. The 2020 Hedge transactions cover approximately 1.41.2 million shares of the Company’s common stock, the same number of shares initially underlying the 2025 Notes, and are exercisable upon any conversion of the 2025 Notes. The 2020 Hedge Transactionstransactions are expected generally to reduce the potential dilution to the Common StockCompany's common stock upon conversion of the 2025 Notes and/or offset any cash payments the Company is required to make in excess of the principal amount of the converted 2025 Notes, as the case may be, in the event that the market price per share of Common Stock,common stock, as measured under the terms of the 2020 Hedge transactions, is greater than the strike price of the 2020 Hedge transactions, which initially corresponds to the initial conversion price of the 2025 Notes, or approximately $461.19 per share of common stock. The 2020 Hedge transactions will expire upon the maturity of the Notes.
On July 24, 2020, the Company sold to the counterparties, warrants (the “2020 Warrants”) to acquire 1.2 million shares of the Company's common stock at an initial strike price of $709.52 per share, which represents a premium of 100% over the last reported sale price of the common stock of $354.76 on July 21, 2020. On July 24, 2020, the Company received aggregate proceeds of approximately $61.2 million from the sale of the 2020 Warrants. If the market price per share of the common stock, as measured under the terms of the 2020 Warrants, exceeds the strike price of the 2020 Warrants, the 2020 Warrants could have a dilutive effect, unless the Company elects, subject to certain conditions, to settle the 2020 Warrants in cash.
The 2020 Hedge and 2020 Warrants transactions are indexed to, and potentially settled in, the Company's common stock and the net cost of $63.0 million has been recorded as a reduction to additional paid-in capital in the consolidated statement of shareholders’ equity.
2017 Hedge and Warrants
On May 31, 2017, in connection with the issuance of the 2022 Notes, the Company entered into Convertible Note Hedge (the “2017 Hedge”) and warrant transactions with respect to the Company’s common stock. The Company used approximately $18.1 million of the net proceeds from the 2022 Notes to pay for the cost of the 2017 Hedge, after such cost was partially offset by the proceeds from the warrant transactions.
On May 31, 2017, the Company paid $61.5 million to the counterparties for the 2017 Hedge transactions. The 2017 Hedge transactions initially covered 1.4 million shares of the Company’s common stock, the same number of shares initially underlying the 2022 Notes, and are exercisable upon any conversion of the 2022 Notes. The 2017 Hedge transactions are expected generally to reduce the potential dilution to the Company's common stock upon conversion of the 2022 Notes and/or offset any cash payments the Company is required to make in excess of the principal amount of the converted 2022 Notes, as the case may be, in the event that the market price per share of common stock, as measured under the terms of the 2017 Hedge transactions, is greater than the strike price of the 2017 Hedge transactions, which initially corresponds to the initial conversion price of the 2022 Notes, or approximately $207.63 per share of Common Stock.common stock. The 2017 Hedge transactions will expire upon the maturity of the Notes.
On May 31, 2017, the Company sold to the counterparties, warrants (the "Warrants"“2017 Warrants”) to acquire 1.4 million shares of Common Stockthe Company's common stock at an initial strike price of $266.39 per share, which represents a premium of 70% over the last reported sale price of the Common Stockcommon stock of $156.70 on May 24, 2017. On May 31, 2017, the Company received aggregate proceeds of approximately $43.4 million from the sale of the 2017 Warrants.
LENDINGTREE, INC. AND SUBSIDIARIES
NOTES TO CONSOLIDATED FINANCIAL STATEMENTS (Continued)
If the market price per share of the Common Stock,common stock, as measured under the terms of the 2017 Warrants, exceeds the strike price of the 2017 Warrants, the 2017 Warrants could have a dilutive effect, unless the Company elects, subject to certain conditions, to settle the 2017 Warrants in cash.
The 2017 Hedge and Warrant2017 Warrants transactions are indexed to, and potentially settled in, the Company's common stock and the net cost of $18.1 million has beenwas recorded as a reduction to additional paid-in capital in the consolidated statement of shareholders’ equity.
To the extent of the repurchases of the 2022 Notes noted above, the Company entered into agreements with the counterparties for the 2017 Hedge and 2017 Warrants transactions to terminate a portion of these call spread transactions effective July 24, 2020 in notional amounts corresponding to the principal amount of the 2022 Notes repurchased. Subsequent to such termination, the outstanding portion of the 2017 Hedge covers 0.8 million shares of the Company's common stock and 2017 Warrants to acquire 0.8 million shares of the Company's common stock remain outstanding. The Company received $109.9 million and paid $94.3 million as a result of terminating such portions of the 2017 Hedge and 2017 Warrants, respectively. The net $15.6 million has been recorded as an increase to additional paid-in capital in the consolidated statement of shareholders’ equity.
LENDINGTREE, INC. AND SUBSIDIARIES
NOTES TO CONSOLIDATED FINANCIAL STATEMENTS (Continued)
Senior Secured Revolving Credit Facility
On October 22, 2015,December 10, 2019, the Company's wholly-owned subsidiary, LendingTree, LLC, entered into a $125.0an amended and restated $500.0 million five-year senior secured revolving credit facility (the "Amended Revolving Credit Facility") which matures on October 22, 2020amended and restated the Company's previous $350.0 million five-year senior secured revolving credit facility (the “Revolving“2017 Revolving Credit Facility”). The proceeds ofAmended Revolving Credit Facility matures on December 10, 2024. Borrowings under the Amended Revolving Credit Facility can be used to finance the working capital needs, capital expenditures and general corporate purposes, including to finance permitted acquisitions. As of SeptemberJune 30, 2017,2021 and December 31, 2020, the Company does not have anyhad 0 borrowings outstanding under the Amended Revolving Credit Facility.
Up to $10.0 million of the Amended Revolving Credit Facility will be available for short-term loans, referred to as swingline loans. Additionally, up to $10.0 million of the Revolving Credit Facility will be available for the issuance of letters of credit. Under certain conditions, the Company will be permitted to add one or more term loans and/or increase revolving commitments under the Amended Revolving Credit Facility by an additional amount equal to the greater of $185.0 million or 100% of Consolidated EBITDA as defined, or a greater amount provided that a total consolidated senior secured debt to EBITDA ratio does not exceed 2.50 to 1.00. Additionally, up to an aggregate$10.0 million of the Amended Revolving Credit Facility will be available for the issuance of letters of credit. At each of June 30, 2021 and December 31, 2020, the Company had outstanding one letter of credit issued in the amount of $50.0$0.2 million.
The Company’s borrowings under the Amended Revolving Credit Facility bear interest at annual rates that, at the Company’s option, will be either:
•a base rate generally defined as the sum of (i) the greater of (a) the prime rate of SunTrustTruist Bank, (b) the federal funds effective rate plus 0.5% and (c) the LIBO rate (defined below) on a daily basis applicable for an interest period of one month plus 1.0% and (ii) an applicable percentage of 1.0%0.25% to 2.0%1.0% based on the fundeda total consolidated debt to consolidated EBITDA ratio; or
•a LIBO rate generally defined as the sum of (i) the rate for Eurodollar deposits in the applicable currency and (ii) an applicable percentage of 2.0%1.25% to 3.0%2.0% based on the fundeda total consolidated debt to consolidated EBITDA ratio.
All swingline loans bear interest at the base rate defined above. Interest on the Company’s borrowings are payable quarterly in arrears for base rate loans and on the last day of each interest rate period (but not less often than three months) for LIBO rate loans.
The Amended Revolving Credit Facility contains certaina restrictive financial covenants,covenant, which include a fundedinitially limits the total consolidated debt to consolidated EBITDA ratio andto 4.5, with step downs to 4.0 over time, except that this may increase by 0.5 for the four fiscal quarters following a consolidated EBITDA to interest expense ratio.material acquisition. In addition, the Amended Revolving Credit Facility contains customary affirmative and negative covenants in addition to events of default for a transaction of this type that, among other things, restrict additional indebtedness, liens, mergers or certain fundamental changes, asset dispositions, dividends, stock repurchases and other restricted payments, transactions with affiliates, sale-leaseback transactions, hedging transactions, loans and investments and other matters customarily restricted in such agreements.
On July 21, 2020, the Company executed a temporary amendment to its Amended Revolving Credit Facility to provide for certain covenant relief, primarily to facilitate the issuance of the 2025 Notes, the repurchase of a portion of the 2022 Notes, and to pay down existing borrowings under the credit facility.
The amendment amends the existing credit agreement to, among other things: (i) temporarily replace the total consolidated debt to EBITDA ratio covenant with a consolidated liquidity covenant requiring the Company to maintain unrestricted cash and cash equivalents in the United States plus amounts available and permitted to be drawn under the Amended Revolving Credit Facility to be no less than $200.0 million; (ii) impose additional limitations on certain restricted payments during such temporary period; and (iii) increase the applicable margins to (x) 2.25% for loans based on the LIBO rate and (y) 1.25% for loans based on the base rate, subject to a 0.75% floor, and unused commitment fees to 0.50% under the Amended Revolving Credit Facility during the temporary period. These amendments were applicable from the effective date through the fiscal quarter ending June 30, 2021.
The Company was in compliance with all covenants at SeptemberJune 30, 2017.
During the second quarter of 2017, the Company entered into the Second Amendment to Credit Agreement (the “Second Amendment”). Among other things, the Second Amendment modified the original credit agreement to allow for the Notes and the Hedge and Warrant transactions, discussed above. The Second Amendment also increased the restrictive financial covenant for funded debt to consolidated EBITDA ratio. In addition, the Second Amendment also allows the Company to enter into a potential real estate term loan of an aggregate principal amount of no more than (a) $20.0 million which shall be used to finance all or a portion of the purchase price of certain real estate purchased in December 2016 and located in Charlotte, North Carolina, and (b) $25.0 million which shall be used to finance post-acquisition improvements to such real estate, related equipment, and related hedging obligations. As of October 26, 2017, the Company has not entered into the real estate term loan.2021.
The Amended Revolving Credit Facility requires LendingTree, LLC to pledge as collateral, subject to certain customary exclusions, 100%substantially all of its assets, including 100% of its equity in all of its subsidiaries.domestic subsidiaries and 66% of the voting
LENDINGTREE, INC. AND SUBSIDIARIES
NOTES TO CONSOLIDATED FINANCIAL STATEMENTS (Continued)
equity, and 100% of the non-voting equity, in all of its material foreign subsidiaries (of which there are currently none). The obligations under this facility are unconditionally guaranteed on a senior basis by LendingTree, Inc. and specificmaterial domestic subsidiaries of LendingTree, LLC, which guaranties are secured by a pledge as collateral, subject to certain customary exclusions, of 100% of each of such guarantor's assets, including 100% of itseach such guarantor’s equity in all of its subsidiaries.domestic subsidiaries and 66% of the voting equity, and 100% of the non-voting equity, in all of its material foreign subsidiaries (of which there are currently none).
LENDINGTREE, INC. AND SUBSIDIARIES
NOTES TO CONSOLIDATED FINANCIAL STATEMENTS (Continued)
TheExcept as noted in the covenant relief discussion above, the Company is required to pay an unused commitment fee quarterly in arrears on the difference between committed amounts and amounts actually borrowed under the Amended Revolving Credit Facility equal to an applicable percentage of 0.25% to 0.5%0.45% per annum based on a fundedtotal consolidated debt to consolidated EBITDA ratio. The Company is required to pay a letter of credit participation fee and a letter of credit fronting fee quarterly in arrears. The letter of credit participation fee is based upon the aggregate face amount of outstanding letters of credit at an applicable percentage of 2.0%1.25% to 3.0%2.0% based on the fundeda total consolidated debt to consolidated EBITDA ratio. The letter of credit fronting fee is 0.125% per annum on the face amount of each letter of credit.
The Company incurredIn addition to the remaining unamortized debt issuance costs associated with the original revolving credit facility and the Revolving Credit Facility, debt issuance costs of $1.3$2.8 million forrelated to the Amended Revolving Credit Facility which isentered into on December 10, 2019 are being amortized to interest expense over the life of the Amended Revolving Credit Facility. Debt issuance costs of $1.1 million related to the July 21, 2020 temporary amendment were amortized to interest expense through June 30, 2021. Unamortized debt issuance costs are included in prepaid and other current assets and other non-current assets in the Company's consolidated balance sheet and is being amortized tosheet.
In the first six months of 2021, the Company recorded interest expense overrelated to the life of theAmended Revolving Credit Facility of five years.$2.3 million which consisted of $1.3 million in unused commitment fees and $1.0 million associated with the amortization of the debt issuance costs. In the first six months of 2020, the Company recorded interest expense related to the Amended Revolving Credit Facility of $2.1 million which consisted of $1.1 million associated with borrowings bearing interest at the LIBO rate, $0.5 million in unused commitment fees, and $0.5 million associated with the amortization of the debt issuance costs.
NOTE 11—14—CONTINGENCIES
Overview
LendingTree is involved in legal proceedings on an ongoing basis. In assessing the materiality of a legal proceeding, the Company evaluates, among other factors, the amount of monetary damages claimed, as well as the potential impact of non-monetary remedies sought by plaintiffs (e.g., injunctive relief) that may require it to change its business practices in a manner that could have a material and adverse impact on the Company's business. With respect to the matters disclosed in this Note 11,14, unless otherwise indicated, the Company is unable to estimate the possible loss or range of losses that could potentially result from the application of such non-monetary remedies.
As of SeptemberJune 30, 2017 and December 31, 2016,2021, the Company had a litigation settlement accrualaccruals of $0.6$1.0 million and $0.7$4.9 million respectively, in continuing operations and $4.0discontinued operations, respectively. As of December 31, 2020, the Company had litigation settlement accruals of $0.1 million and $4.0$0.5 million respectively, in continuing operations and discontinued operations.operations, respectively. The litigation settlement accrual relatesaccruals relate to litigation matters that were either settled or a firm offer for settlement was extended, thereby establishing an accrual amount that is both probable and reasonably estimable. See Note 17—Discontinued Operations for additional information.
Specific Matters
Intellectual Property LitigationNOTE 15—FAIR VALUE MEASUREMENTS
Zillow
LendingTree v. Zillow, Inc., et al. Civil Action No. 3:10-cv-439. On September 8, 2010,Other than the Company filed an action for patent infringementconvertible notes and warrants, as well as the equity interest in Stash, the US District Court for the Western District of North Carolina against Zillow, Inc., NexTag, Inc., Quinstreet, Inc., Quinstreet Media, Inc. and Adchemy, Inc. The complaint was amended to include Leadpoint, Inc. d/b/a Securerights on September 24, 2010. The complaint alleged that each of the defendants infringed one or bothcarrying amounts of the Company's patents-U.S. Patent No. 6,385,594, entitled "Method and Computer Networkfinancial instruments are equal to fair value at June 30, 2021. See Note 13—Debt for Co-Ordinating a Loan over the Internet," and U.S. Patent No. 6,611,816, entitled "Method and Computer Network for Co-Ordinating a Loan over the Internet." The defendants in this action asserted various defenses and counterclaims against the Company, including the assertion by certain of the defendants of counterclaims alleging illegal monopolization via the Company's maintenance of the asserted patents. Defendant NexTag asserted defenses of laches and equitable estoppel. In July 2011, the Company reached a settlement agreement with Leadpoint, Inc., pursuant to which all claims against Leadpoint, Inc. and all counterclaims against the Company by Leadpoint, Inc. were dismissed. In November 2012, the Company reached a settlement agreement with Quinstreet, Inc. and Quinstreet Media, Inc. (collectively, the "Quinstreet Parties"), pursuant to which all claims against the Quinstreet Parties and all counterclaims against the Company by the Quinstreet Parties were dismissed. After an unsuccessful attempt to reach settlement through mediation with the remaining parties, this matter went to trial beginning in February 2014, and on March 12, 2014, the jury returned a verdict. The jury found that the defendants Zillow, Inc., Adchemy, Inc. and NexTag, Inc. did not infringe the two patents referenced above and determined that those patents are invalid due to an inventorship defect, and the court found that NexTag was entitled to defense of laches and equitable estoppel. The jury found in the Company's favoradditional information on the defendants' counterclaims alleging inequitable conductconvertible notes and antitrust violations. Judgment was enteredwarrants, and see Note7—Equity Investment for additional information on March 31, 2014. After the court entered judgment, on May 27, 2014, the Company reached a settlement agreement with defendant Adchemy, Inc., including an agreement to dismiss and withdraw all claims, counterclaims, and motions between the Company and Adchemy, Inc. As a result, a joint and voluntary dismissal was filed June 12, 2014 with respect to claims between the Company and Adchemy. The parties filed various post-trial motions;equity interest in particular, defendants collectively sought up to $9.7 million in fees and costs. On October 9, 2014, the court denied the Company's post-trial motion for judgment as a matter of law and denied Zillow's post-trial motions for sanctions and attorneys' fees. The court also
Stash.
LENDINGTREE, INC. AND SUBSIDIARIES
NOTES TO CONSOLIDATED FINANCIAL STATEMENTS (Continued)
denied in part and granted in part NexTag's post-trial motion for attorneys' fees, awarding NexTag a portion of its attorney's fees and costs totaling $2.3 million, plus interest.
In November 2014, the Company filed a notice of appeal to the U.S. Court of Appeals for the Federal Circuit with respect to the jury verdict concerning Zillow, Inc. and NexTag, Inc. and the award of attorneys' fees. In March 2015, the U.S. Court of Appeals for the Federal Circuit granted the Company's motion to stay appellate briefing pending an en banc review by such court of the laches defense in an unrelated patent infringement matter and ruled in favor of Zillow, Inc. on an immaterial amount of costsContingent consideration payments related to acquisitions are measured at fair value each reporting period using Level 3 unobservable inputs. The changes in the trial process. In June 2015, the Company reached a settlement agreement for $1.1 million with defendant NexTag pursuant to which the Company dismissed its appeal of the jury verdict and the award of attorney's fees concerning NexTag, and NexTag dismissed its cross-appeal and claims relating to the jury verdict and the award of attorneys' fees. In July 2015, the stay was lifted on the Company's appeal with respect to the jury verdict concerning Zillow, Inc. The appeal was heard by the U.S. Court of Appeals for the Federal Circuit in June 2016, and in July 2016 the Court determined that certain of the claims of the two patents referenced above were directed to ineligible subject matter and thus such claims were invalid under 35 U.S.C. Section 101. With respect to the remaining claims that the Court did not hold were ineligible, the Court granted a remand to the federal district court to allow LendingTree to file a motion to vacate the judgment of invalidity for incorrect inventorship.
In June 2017, the Federal District Court vacated the invalidity judgment arising from the March 2014 jury verdict. As a result, certain claimsfair value of the Company's two issued patents remain valid. Level 3 liabilities are as follows (in thousands):
| | | | | | | | | | | | | | | | | | | | | | | |
| Three Months Ended
June 30, | | Six Months Ended
June 30, |
| | 2021 | | 2020 | | 2021 | | 2020 |
| Contingent consideration, beginning of period | $ | 9,046 | | | $ | 22,342 | | | $ | 8,249 | | | $ | 33,464 | |
| Transfers into Level 3 | — | | | — | | | — | | | — | |
| Transfers out of Level 3 | — | | | — | | | — | | | — | |
| Total net losses (gains) included in earnings (realized and unrealized) | (8,850) | | | 9,175 | | | (8,053) | | | 1,053 | |
| Purchases, sales and settlements: | | | | | | | |
| Additions | 0 | | | 0 | | | 0 | | | 0 | |
| Payments | 0 | | | (3,000) | | | 0 | | | (6,000) | |
| Contingent consideration, end of period | $ | 196 | | | $ | 28,517 | | | $ | 196 | | | $ | 28,517 | |
The casecontingent consideration liability at June 30, 2021 is now closedthe estimated fair value of the remaining earnout payment for the QuoteWizard acquisition. The Company will make an earnout payment ranging from 0 to $23.4 million based on the achievement of certain defined performance targets for QuoteWizard. See Note 8—Business Acquisitions for additional information.
The significant unobservable inputs used to calculate the fair value of the contingent consideration for QuoteWizard are the operating results growth rate and the Company expects no furtherdiscount rate. Actual results will differ from the projected results and could have a significant events regarding this litigation.
Legal Matters
Next Advisor Continued, Inc.
Next Advisor Continued, Inc. v. LendingTree, Inc. and LendingTree, LLC, No. 15-cvs-20775 (N.C. Super. Ct.). On November 6, 2015,impact on the plaintiff filed this action against LendingTree, Inc. and LendingTree, LLC (together "LendingTree"). The plaintiff generally alleged that LendingTree breached a non-disclosure agreement and misappropriated trade secretsestimated fair value of the contingent consideration. Additionally, as the liability is stated at present value, the passage of time alone will increase the estimated fair value of the liability each reporting period. Any changes in fair value will be recorded in operating income in the contextconsolidated statements of aoperations and comprehensive income.
The following table provides quantitative information about Level 3 fair value measurements.
| | | | | | | | | | | | | | |
| Fair Value at
June 30, 2021 | Valuation Technique | Unobservable Input | Range (Weighted Average)(a) |
| (in thousands) | | | |
| Contingent consideration | $ | 196 | | Option pricing model | Operating results growth rate | (21.4) | % |
| | | Discount rate | 3.1 | % |
(a) Discount rates are weighted by the relative undiscounted value of expected earnout payments. Other unobservable inputs are weighted by the relative maximum potential earnout payments.
NOTE 16—SEGMENT INFORMATION
The Company manages its business acquisitionand reports its financial results through the following 3 operating and reportable segments: Home, Consumer and Insurance. Characteristics which were relied upon in making the determination of the plaintiff by LendingTree. Based upon these allegations,reportable segments include the plaintiff asserted claims for breach of contract, misappropriation of trade secrets and violation of North Carolina Unfair and Deceptive Trade Practices Act. The plaintiff requested money damages, attorneys' fees and injunctive relief.
On December 16, 2015, LendingTree filed its answer to the plaintiff's complaint, denying the material allegations and asserting numerous defenses thereto. In June 2016, the Court granted the plaintiff's motion for preliminary injunction and temporarily ordered, pending trial, that LendingTree cease any utilization of confidential and trade secret informationnature of the plaintiff and cease marketing credit card products, via certain third party content marketing platforms. However, LendingTree continued to believe that the plaintiff's allegations lacked merit and to vigorously defend the case. In July 2016, LendingTree filed a notice of interlocutory appeal to the North Carolina Supreme Court with respect to the preliminary injunction, but the interlocutory appeal was dismissed in December 2016. In February 2017, LendingTree filed a motion for partial summary judgment. In June 2017, the court granted LendingTree's motion for partial summary judgment, restricting the duration of any injunction and ruling that the plaintiff is not entitled to recover compensatory damages on any of its claims. On September 14, 2017, LendingTreeorganization's internal structure, and the plaintiff finalizedinformation that is regularly reviewed by the chief operating decision maker for the purpose of assessing performance and allocating resources.
The Home segment includes the following products: purchase mortgage, refinance mortgage, home equity loans and lines of credit, reverse mortgage loans, and real estate. The Consumer segment includes the following products: credit cards, personal loans, small business loans, student loans, auto loans, deposit accounts, and other credit products such as credit repair and debt settlement. The Insurance segment consists of insurance quote products. Revenue from the resale of online advertising space to third parties in the first six months of 2020 is included within the Other category. The Company ceased reselling online advertising space during the first quarter of 2020.
The following tables are a settlement agreement pursuantreconciliation of segment profit, which is the Company's primary segment profitability measure, to which (i) LendingTree defrayed aincome before income taxes and discontinued operations. Segment cost of revenue and marketing expense represents the portion of plaintiff’s litigationselling and marketing expense attributable to variable costs paid for advertising, direct marketing and (ii) the parties agreed that the injunction would be of no further effect as of January 3, 2018. The Court’s order approving the settlement was a final judgment and this matter is otherwise now closed.
Massachusetts Division of Banks
On February 11, 2011, the Massachusetts Division of Banks (the "Division") delivered a Report of Examination/Inspection to LendingTree, LLC, which identified various alleged violations of Massachusetts and federal laws, including the alleged insufficient delivery by LendingTree, LLC of various disclosures to its customers. On October 14, 2011, the Division provided a proposed Consent Agreement and Order to settle the Division's allegations, which the Division had shared with other state mortgage lending regulators. Thirty-four of such state mortgage lending regulators (the "Joining Regulators") indicated that if LendingTree, LLC would enter into the Consent Agreement and Order, they would agree not to pursue any analogous allegations that they otherwise might assert. None of the Joining Regulators have asserted any such allegations.
The proposed Consent Agreement and Order calls for a fine to be allocated among the Division and the Joining Regulators and for LendingTree, LLC to adopt various new procedures and practices. The Company has commenced negotiations toward an acceptable Consent Agreement and Order. It does not believe its mortgage marketplace business violated any federal or state
related
LENDINGTREE, INC. AND SUBSIDIARIES
NOTES TO CONSOLIDATED FINANCIAL STATEMENTS (Continued)
expenses, that are directly attributable to the segments' products. This measure excludes overhead, fixed costs and personnel-related expenses. For the Other category, segment cost of revenue and marketing expense in the first six months of 2020 also includes the portion of cost of revenue attributable to costs paid for advertising re-sold to third parties.
| | | | | | | | | | | | | | | | | |
| Three Months Ended June 30, 2021 |
| Home | Consumer | Insurance | Other | Total |
| (in thousands) |
| Revenue | $ | 104,861 | | $ | 75,676 | | $ | 89,263 | | $ | 214 | | $ | 270,014 | |
| Segment marketing expense | 65,844 | | 42,282 | | 56,025 | | 263 | | 164,414 | |
| Segment profit (loss) | 39,017 | | 33,394 | | 33,238 | | (49) | | 105,600 | |
| Cost of revenue | | | | | 13,934 | |
| Brand and other marketing expense | | | | | 20,792 | |
| General and administrative expense | | | | | 39,811 | |
| Product development | | | | | 13,290 | |
| Depreciation | | | | | 4,443 | |
| Amortization of intangibles | | | | | 11,310 | |
| Change in fair value of contingent consideration | | | | | (8,850) | |
| | | | | |
| Litigation settlements and contingencies | | | | | 322 | |
| Operating income | | | | | 10,548 | |
| Interest expense, net | | | | | (9,840) | |
| | | | | |
| Income before income taxes and discontinued operations | | | | | $ | 708 | |
| | | | | | | | | | | | | | | | | |
| Three Months Ended June 30, 2020 |
| Home | Consumer | Insurance | Other | Total |
| (in thousands) |
| Revenue | $ | 74,123 | | $ | 37,118 | | $ | 72,919 | | $ | 166 | | $ | 184,326 | |
| Segment marketing expense | 35,397 | | 17,716 | | 42,797 | | 85 | | 95,995 | |
| Segment profit (loss) | 38,726 | | 19,402 | | 30,122 | | 81 | | 88,331 | |
| Cost of revenue | | | | | 13,464 | |
| Brand and other marketing expense | | | | | 17,926 | |
| General and administrative expense | | | | | 28,489 | |
| Product development | | | | | 10,812 | |
| Depreciation | | | | | 3,550 | |
| Amortization of intangibles | | | | | 13,756 | |
| Change in fair value of contingent consideration | | | | | 9,175 | |
| Severance | | | | | 32 | |
| Litigation settlements and contingencies | | | | | (1,325) | |
| Operating loss | | | | | (7,548) | |
| Interest expense, net | | | | | (4,955) | |
| Other income | | | | | 7 | |
| Loss before income taxes and discontinued operations | | | | | $ | (12,496) | |
LENDINGTREE, INC. AND SUBSIDIARIES
NOTES TO CONSOLIDATED FINANCIAL STATEMENTS (Continued)
| | | | | | | | | | | | | | | | | |
| Six Months Ended June 30, 2021 |
| Home | Consumer | Insurance | Other | Total |
| (in thousands) |
| Revenue | $ | 232,986 | | $ | 133,583 | | $ | 175,877 | | $ | 318 | | $ | 542,764 | |
| Segment marketing expense | 154,979 | | 75,582 | | 109,797 | | 459 | | 340,817 | |
| Segment profit (loss) | 78,007 | | 58,001 | | 66,080 | | (141) | | 201,947 | |
| Cost of revenue | | | | | 27,829 | |
| Brand and other marketing expense | | | | | 41,851 | |
| General and administrative expense | | | | | 74,800 | |
| Product development | | | | | 25,758 | |
| Depreciation | | | | | 8,161 | |
| Amortization of intangibles | | | | | 22,622 | |
| Change in fair value of contingent consideration | | | | | (8,053) | |
| | | | | |
| Litigation settlements and contingencies | | | | | 338 | |
| Operating income | | | | | 8,641 | |
| Interest expense, net | | | | | (20,055) | |
| Other income | | | | | 40,072 | |
| Income before income taxes and discontinued operations | | | | | $ | 28,658 | |
| | | | | | | | | | | | | | | | | |
| Six Months Ended June 30, 2020 |
| Home | Consumer | Insurance | Other | Total |
| (in thousands) |
| Revenue | $ | 153,297 | | $ | 157,042 | | $ | 155,656 | | $ | 1,415 | | $ | 467,410 | |
| Segment cost of revenue and marketing expense | 78,660 | | 94,541 | | 95,001 | | 1,662 | | 269,864 | |
| Segment profit (loss) | 74,637 | | 62,501 | | 60,655 | | (247) | | 197,546 | |
| Cost of revenue (exclusive of cost of advertising re-sold to third parties included above) | | | | | 26,630 | |
| Brand and other marketing expense | | | | | 40,681 | |
| General and administrative expense | | | | | 60,571 | |
| Product development | | | | | 21,775 | |
| Depreciation | | | | | 6,928 | |
| Amortization of intangibles | | | | | 27,513 | |
| Change in fair value of contingent consideration | | | | | 1,053 | |
| Severance | | | | | 190 | |
| Litigation settlements and contingencies | | | | | (996) | |
| Operating income | | | | | 13,201 | |
| Interest expense, net | | | | | (9,789) | |
| Other income | | | | | 7 | |
| Income before income taxes and discontinued operations | | | | | $ | 3,419 | |
NOTE 17—DISCONTINUED OPERATIONS
The LendingTree Loans Business is presented as discontinued operations in the accompanying financial statements. The LendingTree Loans Business originated various consumer mortgage lending laws; nor does it believe that any past operationsloans through HLC. On June 6, 2012, the Company sold substantially all of the mortgage businessoperating assets of HLC, including the LendingTree Loans Business, for $55.9 million in cash to a wholly-owned subsidiary of Discover Financial Services ("Discover"). Discover generally did not assume liabilities of HLC that arose before the closing date, except for certain liabilities directly related to assets Discover acquired. A portion of the purchase price received was deposited in escrow in accordance with the purchase agreement with Discover for certain loan loss obligations that remained with HLC following the sale. During 2018, the remaining funds in escrow were released to HLC in accordance with the terms of the purchase agreement with Discover.
Upon closing of the sale of substantially all of the operating assets of HLC on June 6, 2012, HLC ceased to originate consumer loans. HLC agreed to retain certain liability for losses on previously sold loans.
LENDINGTREE, INC. AND SUBSIDIARIES
NOTES TO CONSOLIDATED FINANCIAL STATEMENTS (Continued)
Litigation settlements and contingencies and legal fees associated with related bankruptcy and ongoing legal proceedings against the Company are included in discontinued operations in the accompanying financial statements.
Home Loan Center, Inc. Bankruptcy Filing
On June 21, 2019, the U.S. District Court of Minnesota entered judgment in ResCap Liquidating Trust v. Home Loan Center, Inc., against HLC for $68.5 million, see Litigation Related to Discontinued Operations below. The judgment against HLC exceeded the assets of HLC, which were $11.2 million at July 21, 2019, including cash of $5.9 million. On July 19, 2019, HLC appealed the judgment to the United States Court of Appeals for the Eighth Circuit.
On July 21, 2019, at the direction of the sole independent director of HLC, HLC voluntarily filed a petition under Chapter 11 of the United States Bankruptcy Code (the “Bankruptcy Code”) with the U.S. Bankruptcy Court in the Northern District of California in San Jose, California (the “Bankruptcy Court”) in order to preserve assets for the benefit of all creditors of HLC. On September 16, 2019, the Bankruptcy Court converted the bankruptcy to Chapter 7 of the Bankruptcy Code and appointed a Trustee to liquidate HLC's assets.
HLC’s voluntary petition under the Bankruptcy Code does not represent an event of default under LendingTree, LLC’s Second Amended and Restated Credit Agreement dated as of December 10, 2019, the Company’s indenture dated May 31, 2017 with respect to the Company’s 0.625% Convertible Senior Notes due 2022, or the Company’s indenture dated July 24, 2020 with respect to the Company’s 0.50% Convertible Senior Notes due 2025.
As a result of the voluntary petition, LendingTree, LLC was, as of the initial July 21, 2019 bankruptcy petition filing date, no longer deemed to have resulteda controlling interest in HLC under applicable accounting standards. As a material violationresult, HLC and its consolidated subsidiary were deconsolidated from the Company’s consolidated financial statements as of anyJuly 21, 2019. The effect of such laws. Shoulddeconsolidation was the Division or any Joining Regulator bring any actionselimination of the consolidated assets and liabilities of HLC (and its consolidated subsidiary) from the Company’s consolidated balance sheets. Upon deconsolidation, in 2019 the Company recognized a loss of $5.5 million which includes a net gain of $4.5 million related to the removal of HLC's (and its consolidated subsidiary's) assets and liabilities and the recognition of a liability of $10.0 million related to LendingTree, LLC's ownership in HLC. No consideration was received by the Company as a result of the deconsolidation.
During its bankruptcy, HLC indicated that it believed that it had claims against HLC’s sole shareholder, LendingTree, LLC, and certain of its officers and directors, relating to the matters allegeddeclaration of a dividend by HLC in January 2016 of $40.0 million. LendingTree, LLC believes the declaration of the dividend was proper, that the amounts paid to LendingTree, LLC following such declaration are not subject to recovery by HLC and that any claims by HLC relating to such dividend declaration are without merit. During the second quarter of 2020, LendingTree, LLC and HLC entered into a settlement agreement in the February 2011 Reportamount of Examination/Inspection,$36.0 million for the release of any and all claims against the Company intendsdefendants by HLC, including the dividend claim. The bankruptcy court held a hearing on July 16, 2020 on the motion to defend against such actions vigorously.approve the settlement to which no objections were made, and approved the settlement the same day. The range of possible loss is estimated to be between $0.5$36.0 million and $6.5 million, and an estimated liability of $0.5 million has been established for this mattersettlement payment was made in the accompanying consolidated balance sheet asthird quarter of September 30, 2017. 2020.
During the HLC bankruptcy, a bar date for claims against HLC was set, establishing a deadline for all HLC’s creditors to assert any claim they may have had against HLC. Distributions were made to holders of allowed claims deemed timely filed. After all distributions to creditors were made and HLC’s Chapter 7 bankruptcy estate was fully administered, the HLC bankruptcy case was closed on July 14, 2021.
Litigation Related to Discontinued Operations
Residential Funding Company
ResCap Liquidating Trust v. Home Loan Center, Inc., Case No. 14-cv-1716 (U.S. Dist. Ct., Minn.), successor toResidential Funding Company, LLC v Home Loan Center, Inc., No. 13-cv-3451 (U.S. Dist. Ct., Minn.). On or about December 16, 2013, Home Loan Center, Inc. was served in the aboveoriginal captioned matter. Generally,matter, which involves claims of Residential Funding Company, LLC ("RFC") seeksfor damages for breach of contract and indemnification for certain residential mortgage loans as well as residential mortgage-backed securitizations ("RMBS") containing mortgage loans. RFC assertsasserted that, beginning in 2008, RFC faced massive repurchase demands and lawsuits from purchasers or insurers of the loans and RMBS that RFC had sold. RFC filed for bankruptcy protection in May 2012. Plaintiff allegesalleged that, after RFC filed for Chapter 11 protection, hundreds of proofs of claim were filed, many of which mirrored the litigation filed against RFC prior to its bankruptcy.
LENDINGTREE, INC. AND SUBSIDIARIES
NOTES TO CONSOLIDATED FINANCIAL STATEMENTS (Continued)
In December 2013, the United States Bankruptcy Court for the Southern District of New York entered an Order confirming the Second Amended Joint Chapter 11 Plan Proposed by Residential Capital, LLC et al. and the Official Committee of Unsecured Creditors. Plaintiff then began filing substantially similar complaints against approximately 80 of the loan originators from whom RFC had purchased loans, including Home Loan Center,HLC, in federal and state courts in Minnesota and New York. In each case, Plaintiff claimsplaintiff claimed that the defendant is liable for a portion of the global settlement in RFC’s bankruptcy.
Plaintiff asserts twoHLC’s filing under the Bankruptcy Code discussed above in Home Loan Center, Inc. Bankruptcy Filing created an automatic stay of enforcement of the judgment entered against HLC by the U.S. District Court in Minnesota. On August 27, 2019, plaintiff filed a lawsuit captioned ResCap Liquidating Trust v. LendingTree, LLC, et al., Case No. 19-cv-2360 (U.S. Dist. Ct., Minn.), seeking to hold the Company liable for the judgment against HLC, under assumption of liability, agency and alter ego theories. On June 17, 2020, the Company entered into a settlement agreement with ResCap, pursuant to which, the Company agreed to, among other things, pay ResCap $58.5 million, less any amounts ResCap receives in the HLC bankruptcy, in exchange for, among other things, ResCap releasing any and all claims against HLC: (1) breachthe Company, and the Company’s directors and officers, including any claims asserted in ResCap v. LendingTree. Pursuant to the settlement agreement, the Company was responsible for the difference of contract based$58.5 million minus the amount that ResCap received through the HLC Bankruptcy. In the third and fourth quarters of 2020, the Company made payments of $26.5 million and $6.4 million, respectively, to the ResCap Liquidating Trust, and the ResCap Liquidating Trust, in turn, assigned its allowed claims against HLC to the Company. In the second quarter of 2021, the Company received a refund of $8.6 million related to these amounts, from the final distributions in the HLC Bankruptcy on HLC’s alleged breach of representations and warranties concerning the quality and characteristicsaccount of the mortgage loans it sold to RFC (Count One); and (2) contractual indemnification for alleged liabilities, losses, and damages incurred by RFC arising out of purported defects in loans that RFC purchased from HSBC and sold to third parties (Count Two). Plaintiff allegesallowed claims that the “types of defects” contained inResCap Liquidating Trust had assigned to the loans it purchased from HLC included “income misrepresentation, employment misrepresentation, appraisal misrepresentations or inaccuracies, undisclosed debt, and missing or inaccurate documents.”
HLC filed a Motion to Dismiss under Rule 12(b)(6) of the Federal Rules of Civil Procedure or, in the alternative, a Motion for More Definite Statement under Rule 12(e). On June 25, 2015 the judge denied HLC's motion.
On July 9, 2015, HLC filed its answer to RFC’s complaint, denying the material allegations of the complaint and asserting numerous defenses thereto. Discovery is ongoing in this matter. Plaintiff is seeking damages of $61.0 million in this action; HLC intends to vigorously defend this action. An estimated liability of $3.0 million for this matter is included in the accompanying consolidated balance sheet as of September 30, 2017.Company.
Lehman Brothers Holdings, Inc.
Lehman Brothers Holdings Inc. v. 1st Advantage Mortgage, LLC et al., Case No. 08-13555 (SCC), Adversary Proceeding No. 16-01342 (SCC) (Bankr. S.D.N.Y.). In February 2016, Lehman Brothers Holdings, Inc. (“LBHI”) filed an Adversary Complaint against Home Loan CenterHLC and approximately 149 other defendants (the "Complaint"). The Complaint generally seeks (1)On December 4, 2019, LBHI filed a declaratory judgment that$44.7 million proof of claim in HLC’s bankruptcy seeking recovery for the settlements entered into by LBHI with Fannie Mae and Freddie Mac as part of LBHI's bankruptcy proceedings gave rise to LBHI's contractual indemnification claims against defendants allegedasserted in the Complaint; (2) indemnification from HLC andlawsuit.
HLC’s filing under the other defendants for losses allegedly incurred byBankruptcy Code discussed above in Home Loan Center, Inc. Bankruptcy Filing created an automatic stay of this proceeding. On June 11, 2020, LBHI in respect of defective mortgage loans sold by defendants to LBHI or its affiliates; and (3) interest, attorneys' fees and costs incurred by LBHI in the litigation. On March 31, 2017, HLC filed an omnibus motion to dismiss with other defendants. HLC intends to defend this action vigorously. HLC had previously received a demand letter (the "Letter") from LBHI in December 2014 with respect to 64 loans (the “Loans”) that LBHI alleges were sold by HLC to lawsuit captioned Lehman Brothers Bank, FSB (“LBB”Holdings Inc. v. LendingTree, LLC, et al., Case No. 20-cv-01351 (U.S. Dist. Ct., Minn.) between 2004 and 2008 pursuant, transferred to Case No. 08-13555 (SCC), Adversary Proceeding No. 21-01107 (SCC) (Bankr. S.D.N.Y.), seeking to hold the Company liable for its allowed bankruptcy claim of $13.3 million. In July 2021, the Company reached a loan purchase agreement (the “LPA”) between HLC and LBB. The Letter generally sought indemnification from HLC in accordancesettlement with the LPA for certain claims that LBHI, alleged it allowed in its bankruptcy with respect to the Loans. An estimated liability of $1.0 million for this matterwhich is included inas a liability on the accompanying consolidated balance sheet as of SeptemberJune 30, 2017.2021.
Financial Information of Discontinued Operations
LENDINGTREE, INC. AND SUBSIDIARIES
NOTES TO CONSOLIDATED FINANCIAL STATEMENTS (Continued)
NOTE 12—FAIR VALUE MEASUREMENTS
Other than the 0.625% Convertible Senior Notes and the Warrants, the carrying amounts of the Company's financial instruments are equal to fair value at September 30, 2017. See Note 10—Debt for additional information on the 0.625% Convertible Senior Notes and the Warrants.
Contingent consideration payments related to acquisitions are measured at fair value each reporting period using Level 3 unobservable inputs. The changes in the fair value of the Company's Level 3 liabilities during the nine months ended September 30, 2017 are as follows (in thousands):
|
| | | |
| | Contingent Consideration |
| Balance at December 31, 2016 | $ | 23,100 |
|
| Transfers into Level 3 | — |
|
| Transfers out of Level 3 | — |
|
| Total net (gains) losses included in earnings (realized and unrealized) | 20,640 |
|
| Purchases, sales and settlements: | |
| Additions | 11,318 |
|
| Payments | (1,000 | ) |
| Balance at September 30, 2017 | $ | 54,058 |
|
The contingent consideration liability at September 30, 2017 is the estimated fair value of the earnout payments of the CompareCards, DepositAccounts and SnapCap acquisitions. The Company will make earnout payments ranging from zero to $45.0 million based on the achievement of certain defined earnings targets for CompareCards, payments ranging from zero to $9.0 million based on the achievement of defined milestone and performance targets for DepositAccounts, and payments ranging from zero to $9.0 million based on the achievement of certain defined earnings targets for SnapCap. See Note 5—Business Acquisition for additional information on the contingent consideration for each of these respective acquisitions. The significant unobservable inputs used to calculate the fair value of the contingent consideration are estimated future cash flows for the acquisitions, estimated date and likelihood of an increase in interest rates and the discount rate. Actual results will differ from the projected results and could have a significant impact on the estimated fair value of the contingent considerations. Additionally, as the liability is stated at present value, the passage of time alone will increase the estimated fair value of the liability each reporting period. Any changes in fair value will be recorded in operating income in the consolidated statements of operations and comprehensive income.
NOTE 13—SEGMENT INFORMATION
The Company has one reportable segment.
Mortgage and non-mortgage product revenue is as follows (in thousands):
|
| | | | | | | | | | | | | |
| | Three Months Ended
September 30, | | Nine Months Ended
September 30, |
| | 2017 | 2016 | | 2017 | 2016 |
| Mortgage products | $ | 73,756 |
| $ | 53,523 |
| | $ | 208,209 |
| $ | 164,571 |
|
| Non-mortgage products | 97,738 |
| 41,035 |
| | 248,573 |
| 118,990 |
|
| Total revenue | $ | 171,494 |
| $ | 94,558 |
| | $ | 456,782 |
| $ | 283,561 |
|
LENDINGTREE, INC. AND SUBSIDIARIES
NOTES TO CONSOLIDATED FINANCIAL STATEMENTS (Continued)
NOTE 14—DISCONTINUED OPERATIONS
The revenue and net loss reported as discontinued operations in the accompanying consolidated statements of operations and comprehensive income are as follows (in thousands):
| | | | | | | | | | | | | | | | | | | | | | | |
| | Three Months Ended
June 30, | | Six Months Ended
June 30, |
| | 2021 | | 2020 | | 2021 | | 2020 |
| Revenue | $ | 0 | | | $ | 0 | | | $ | 0 | | | $ | 0 | |
| | | | | | | |
| Loss before income taxes | (4,261) | | | (28,424) | | | (4,614) | | | (34,526) | |
| Income tax benefit | 1,062 | | | 7,283 | | | 1,152 | | | 8,810 | |
| Net loss | $ | (3,199) | | | $ | (21,141) | | | $ | (3,462) | | | $ | (25,716) | |
|
| | | | | | | | | | | | | | | |
| | Three Months Ended
September 30, | | Nine Months Ended
September 30, |
| | 2017 | | 2016 | | 2017 | | 2016 |
| Revenue | $ | — |
| | $ | 1,834 |
| | $ | (750 | ) | | $ | 1,835 |
|
| | | | | | | | |
| Loss before income taxes | $ | (1,555 | ) | | $ | (1,021 | ) | | $ | (4,049 | ) | | $ | (4,640 | ) |
| Income tax benefit | 544 |
| | 357 |
| | 1,417 |
| | 1,623 |
|
| Net loss | $ | (1,011 | ) | | $ | (664 | ) | | $ | (2,632 | ) | | $ | (3,017 | ) |
The results of discontinued operations also include litigation settlements and contingencies and legal fees associated with ongoing legal proceedings against LendingTree, Loans
On June 6, 2012, the Company sold substantially all of the operating assets of itsInc. or LendingTree, Loans business for $55.9 million in cashLLC that arose due to a wholly-owned subsidiary of Discover Financial Services ("Discover"). Discover generally did not assume liabilities of the LendingTree Loans business that arose beforeBusiness or the closing date, except for certain liabilities directly related to assets Discover acquired. Of the purchase price paid, as of September 30, 2017, $4.0 million is being held in escrow in accordance with the agreement with Discover for certain loan loss obligations that remain with the Company following the sale. The escrowed amount is recorded as restricted cash as of September 30, 2017.HLC bankruptcy filing.
Significant Assets and Liabilities of LendingTree Loans
Upon closing of the sale of substantially all of the operating assets of the LendingTree Loans business on June 6, 2012, LendingTree Loans ceased to originate consumer loans. Liability for losses on previously sold loans will remain with LendingTree Loans and are discussed below.
Loan Loss Obligations
LendingTree Loans sold loans it originated to investors on a servicing-released basis, so the risk of loss or default by the borrower was generally transferred to the investor. However, LendingTree Loans was required by these investors to make certain representations and warranties relating to credit information, loan documentation and collateral. These representations and warranties may extend through the contractual life of the loan. Subsequent to the loan sale, if underwriting deficiencies, borrower fraud or documentation defects are discovered in individual loans, LendingTree Loans may be obligated to repurchase the respective loan or indemnify the investors for any losses from borrower defaults if such deficiency or defect cannot be cured within the specified period following discovery. In the case of early loan payoffs and early defaults on certain loans, LendingTree Loans may be required to repay all or a portion of the premium initially paid by the investor.
HLC, a subsidiary of the Company, continues to be liable for these indemnification obligations, repurchase obligations and premium repayment obligations following the sale of substantially all of the operating assets of its LendingTree Loans business in the second quarter of 2012.
The following table represents the aggregate loans sold, subsequent settlements and remaining unsettled loans.
|
| | | | | | |
| | Number of Loans | | Original Issue Balance |
| | (in thousands) | | (in billions) |
| Loans sold by HLC | 234 |
| | $ | 38.9 |
|
| Subsequent settlements | (172 | ) | | (28.8 | ) |
| Remaining unsettled balance as of September 30, 2017 | 62 |
| | $ | 10.1 |
|
During the fourth quarter of 2015, LendingTree Loans completed a settlement agreement for $0.6 million with one of the investors to which it had sold loans. This investor accounted for approximately 10% of the total number of loans sold and 12% of the original issue balance. This settlement related to all existing and future losses on loans sold to this investor.
LENDINGTREE, INC. AND SUBSIDIARIES
NOTES TO CONSOLIDATED FINANCIAL STATEMENTS (Continued)
During the fourth quarter of 2014, LendingTree Loans completed a settlement agreement for $5.4 million with the largest investor to which it had sold loans. This investor accounted for approximately 40% of both the total number of loans sold and the original issue balance. This settlement related to all existing and future losses on loans sold to this investor.
In the second quarter of 2014, LendingTree Loans completed settlements with two buyers of previously purchased loans.
The Company has been negotiating with certain of the remaining secondary market purchasers to settle any existing and future contingent liabilities, but it may not be able to complete such negotiations on acceptable terms, or at all. Because LendingTree Loans does not service the loans it sold, it does not maintain nor generally have access to the current balances and loan performance data with respect to the individual loans previously sold to investors. Accordingly, LendingTree Loans is unable to determine, with precision, its maximum exposure for breaches of the representations and warranties it made to the investors that purchased such loans.
The Company uses a settlement discount framework for evaluating the adequacy of the reserve for loan losses. This model estimates lifetime losses on the population of remaining loans originated and sold by LendingTree Loans using actual defaults for loans with similar characteristics and projected future defaults. It also considers the likelihood of claims expected due to alleged breaches of representations and warranties made by LendingTree Loans and the percentage of those claims investors estimate LendingTree Loans may agree to repurchase. A settlement discount factor is then applied to the result of the foregoing to reflect publicly-announced bulk settlements for similar loan types and vintages, as well as LendingTree Loans' non-operating status, in order to estimate a range of potential obligation.
The estimated range of remaining loan losses using this settlement discount framework was determined to be $4.3 million to $7.9 million at September 30, 2017. The reserve balance recorded as of September 30, 2017 was $7.6 million. Management has considered both objective and subjective factors in the estimation process, but given current general industry trends in mortgage loans as well as housing prices and market expectations, actual losses related to LendingTree Loans' obligations could vary significantly from the obligation recorded as of the balance sheet date or the range estimated above.
Additionally, LendingTree has guaranteed certain loans sold to two investors in the event that LendingTree Loans is unable to satisfy its repurchase and warranty obligations related to such loans.
Based on historical experience, it is anticipated that LendingTree Loans will continue to receive repurchase requests and incur losses on loans sold in prior years.
The activity related to loss reserves on previously sold loans is as follows (in thousands):
|
| | | | | | | | | | | | | | | |
| | Three Months Ended
September 30, | | Nine Months Ended
September 30, |
| | 2017 | | 2016 | | 2017 | | 2016 |
| Loan loss reserve, beginning of period | $ | 7,554 |
| | $ | 8,127 |
| | $ | 6,804 |
| | $ | 8,127 |
|
| Provisions | — |
| | (1,834 | ) | | 750 |
| | (1,834 | ) |
| Charge-offs to reserves | — |
| | — |
| | — |
| | — |
|
| Loan loss reserve, end of period | $ | 7,554 |
| | $ | 6,293 |
| | $ | 7,554 |
| | $ | 6,293 |
|
The liability for losses on previously sold loans is presented as current liabilities of discontinued operations in the accompanying consolidated balance sheet as of September 30, 2017 and December 31, 2016.
Item 2. Management's Discussion and Analysis of Financial Condition and Results of Operations
Cautionary Statement Regarding Forward-Looking Information
This report contains "forward-looking statements" within the meaning of the Securities Act of 1933 and the Securities Exchange Act of 1934, as amended by the Private Securities Litigation Reform Act of 1995. These forward-looking statements also include statements related to our anticipated financial performance, business prospects and strategy; anticipated trends and prospects in the various industries in which our businesses operate; new products, services and related strategies; and other similar matters. These forward-looking statements are based on management's current expectations and assumptions about future events, which are inherently subject to uncertainties, risks and changes in circumstances that are difficult to predict. The use of words such as "anticipates," "estimates," "expects," "projects," "intends," "plans" and "believes," among others, generally identifyidentifies forward-looking statements.
Actual results could differ materially from those contained in the forward-looking statements. Factors currently known to management that could cause actual results to differ materially from those in forward-looking statements include those matters discussed or referenced in Part II, Item 1A. Risk Factors included elsewhere in this quarterly report and Part I, Item 1A. Risk Factors of the 20162020 Annual Report.
Other unknown or unpredictable factors that could also adversely affect our business, financial condition and results of operations may arise from time to time. In light of these risks and uncertainties, the forward-looking statements discussed in this report may not prove to be accurate. Accordingly, you should not place undue reliance on these forward-looking statements, which only reflect the views of LendingTree, Inc.'s management as of the date of this report. We undertake no obligation to update or revise forward-looking statements to reflect changed assumptions, the occurrence of unanticipated events or changes to future operating results or expectations, except as required by law.
Company Overview
LendingTree, Inc., is the parent of LT Intermediate Company, LLC, which holds all of the outstanding ownership interests of LendingTree, LLC, and LendingTree, LLC owns several companies owned by LendingTree, LLC.companies.
LendingTree operatesWe operate what we believe to be the leading online loan marketplace forconsumer platform that connects consumers seeking loans, deposit accounts and other credit-based offerings.with the choices they need to be confident in their financial decisions. Our online marketplaceconsumer platform provides consumers with access to product offerings from our Network Lenders,Partners, including mortgage loans, home equity loans and lines of credit, reverse mortgage loans, auto loans, credit cards, deposit accounts, personal loans, student loans, small business loans, insurance quotes and other related offerings. In addition, we offer tools and resources, including free credit scores, that facilitate comparison shopping for these loanloans, deposit products, insurance and other credit-based offerings. We seek to match consumers with multiple lenders,providers, who can provideoffer them with competing quotes for the product, or products, they are seeking. We also serve as a valued partner to lenders and other providers seeking an efficient, scalable and flexible source of customer acquisition with directly measurable benefits, by matching the consumer inquiries we generate with these lenders. Network Partners.
Our My LendingTree platform offers a personalized loan comparison-shopping experience by providing free credit scores and credit score analysis. This platform enables us to observemonitor consumers' credit profiles and then identify and alert them to loanloans and other credit-based opportunitiesofferings on our marketplace that may be more favorable than the loansterms they may have at a given point in time. This is designed to provide consumers with measurable savings opportunities over their lifetimes.
In addition to operating our core mortgage business, weWe are focused on growing our non-mortgage lending businesses and developing new product offerings and enhancements to improve the experiences that consumers and lendersNetwork Partners have as they interact with us. By expanding our portfolio of loan and credit-basedfinancial services offerings, we are growing and diversifying our business and sources of revenue. We intend to capitalize on our expertise in performance marketing, product development and technology, and to leverage the widespread recognition of the LendingTree brand, to effect this strategy.
We believe the consumer and small business financial services industry is still in the early stages of a fundamental shift to online product offerings, similar to the shift that started in retail and travel many years ago and is now well established. We believe that like retail and travel, as consumers continue to move towards online shopping and transactions for financial services, suppliers will increasingly shift their product offerings and advertising budgets toward the online channel. We believe the strength of our brands and of our lenderpartner network place us in a strong position to continue to benefit from this market shift.
The LendingTree Loans business is presented as discontinued operations in the accompanying consolidated balance sheets, consolidated statements of operations and comprehensive income and consolidated cash flows for all periods presented. Except
for the discussion under the heading "Discontinued operations,Operations," the analysis within Management's Discussion and Analysis of Financial Condition and Results of Operations reflects our continuing operations.
Economic Conditions
a novel strain of coronavirus ("COVID-19"). The pandemic has significantly impacted the economic conditions in the U.S., as federal, state and local governments react to the public health crisis, creating significant uncertainties in the U.S. economy. The downstream impact of various lockdown orders and related economic pullback are affecting our business and marketplace participants to varying degrees. We are continuously monitoring the impacts of the current economic conditions related to the COVID-19 pandemic and the effect on our business, financial condition and results of operations.
Convertible Senior NotesOf our three reportable segments, the Consumer segment has been most impacted. The impact to our Home and HedgeInsurance segments was much less substantial and Warrant Transactions
On May 31, 2017, we issued $300.0 million aggregate principal amountthese segments recovered by the end of 2020. While forecasting the timeline of full recovery for the Consumer segment remains challenging, the momentum of recovery has increased in each quarter subsequent to the onset of the COVID-19 pandemic. We are encouraged by the progress made, and continue to view the Consumer segment with optimism over the medium to long term. Most of our 0.625% Convertible Senior Notes due June 1, 2022selling and marketing expenses are variable costs that we adjust dynamically in connection therewith, entered into Convertible Note Hedgerelation to revenue opportunities to profitably meet demand. Thus, as our revenue was negatively impacted during the recession, our marketing expenses generally decreased in line with revenue.
Segment Reporting
We have three reportable segments: Home, Consumer and Warrant transactions with respect to our common stock. For more information, see Note 10—Debt, in the notes to the consolidated financial statements included elsewhere in this report.Insurance.
Recent Business Acquisitions
On September 19, 2017,February 28, 2020, we acquired certain assets of Snap Capital LLC, which does business under the name SnapCapan equity interest in Stash Financial, Inc. (“Stash”) for $11.9 million in cash at closing and contingent consideration payments of up to $9.0 million through March 31, 2020. SnapCap$80.0 million. On January 6, 2021, we acquired additional equity interest for $1.2 million. Stash is a tech-enabled online platform, which connects business ownersconsumer investing and banking platform. Stash brings together banking, investing, and financial services education into one seamless experience offering a full suite of personal investment accounts, traditional and Roth IRAs, custodial investment accounts, and banking services, including checking accounts and debit cards with lenders offering small business loans, lines of credit and merchant cash advance products through a concierge-based sales approach.
On June 20, 2017, we acquired the membership interests of Camino Del Avion, LLC, which does business under the name MagnifyMoneyStock-Back® rewards program. See Note 7—Equity Investment for $29.6 million cash consideration at the closing of the transaction. MagnifyMoney is a leading consumer-facing media property that offers unbiased editorial content, expert commentary, tools and resources to help consumers compare financial products and make informed financial decisions.
On June 14, 2017, we acquired substantially all of the assets of Deposits Online, LLC, which does business under the name DepositAccounts.com (“DepositAccounts”) for $24.0 million in cash at closing and contingent consideration payments of up to $9.0 million through June 30, 2020. DepositAccounts is a leading consumer-facing media property in the depository industry and is one of the most comprehensive sources of depository deals and analysisadditional information on the Web, covering all major deposit product categories through editorial content, programmatic rate tables and user-generated content.equity interest in Stash.
On November 16, 2016, we acquired Iron Horse Holdings, LLC, which does business under the name CompareCards for $80.7 million in cash at closing and contingent consideration payments of up to $22.5 million for each of 2017 and 2018, subject to achieving specific growth targets. CompareCards is a leading online source for side-by-side credit card comparison shopping. CompareCards provides consumers with one centralized location for pertinent credit card information needed to find the best card for their needs.
These acquisitions continue our diversification strategy.
Acquisition of North Carolina Office Properties
In December 2016, we completed the acquisitionOur new corporate office is located on approximately 176,000 square feet of two office buildingsspace in Charlotte, North Carolina for $23.5under an approximate 15-year lease that contractually commenced in April 2021.
With our expansion in North Carolina, in December 2016, we received a grant from the state that provides up to $4.9 million in cash. We intend to utilize one or both buildingsreimbursements over 12 years beginning in the future as our principal executive offices, and any unused space will continue to be occupied by tenants.
Seasonality
Revenue2017 for investing in our lending business is subject to cyclical and seasonal trends. Home sales (and purchase mortgages) typically rise during the spring and summer months and decline during the fall and winter months, while refinancing and home equity activity is principally driven by mortgage interest rates as well as real estate values.
We anticipate revenueand infrastructure in our newer productsaddition to increasing jobs in North Carolina at specific targeted levels through 2020, and maintaining the jobs thereafter. Additionally, the city of Charlotte and the county of Mecklenburg provided a grant that will be cyclical as well; however,paid over five years and is based on a percentage of new property tax we have limited historical datapay on the development of a corporate headquarters. In December 2018, we received an additional grant from the state that provides up to predict$8.4 million in reimbursements over 12 years beginning in 2020 for increasing jobs in North Carolina at specific targeted levels through 2023, and maintaining the nature and magnitude of this cyclicality. Based on industry data, we anticipate as our personal loan product matures we will experience less consumer demand during the fourth and first quarters of each year. We also anticipate less consumer demand for credit cards in the fourth quarter of each year. Other factors affecting our business include macro factors such as credit availability in the market, interest rates, the strength of the economy and employment.jobs thereafter.
Recent Mortgage Interest Rate Trends
Interest rate and market risks can be substantial in the mortgage lead generation business. Short-term fluctuations in mortgage interest rates primarily affect consumer demand for mortgage refinancings, while long-term fluctuations in mortgage interest rates, coupled with the U.S. real estate market, affect consumer demand for new mortgages. Consumer demand, in turn, affects lender demand for mortgage leads from third-party sources. sources, as well as our own ability to attract online consumers to our website.
Typically, a decline in mortgagewhen interest rates will leaddecline, we see increased consumer demand for mortgage refinancing, which in turn leads to reducedincreased traffic to our website and decreased selling and marketing efforts associated with that traffic. At the same time, lender demand for leads from third-party sources typically decreases, as there are more consumers in the marketplace seeking financing
refinancings and, accordingly, lenders receive more organic mortgage lead volume. Due to lower lender demand, our revenue earned per consumer typically decreases, but with correspondingly lower selling and marketing costs.
volume. Conversely, an increase in mortgagewhen interest rates willincrease, we typically leadsee decreased consumer demand for mortgage refinancing, leading to an increase indecreased traffic to our website and higher associated selling and marketing efforts associated with that traffic. At the same time, lender demand for leads from third-party sources typically increases, as there are fewer consumers in the marketplace and, accordingly, the supply of organic mortgage lead volume decreases. Due to high lender demand, we typically see an increase in the amount lenders will pay per matched lead, which often leads to higher revenue earned per consumer. However, increases in the amount lenders will pay per matched lead in this situation is limited by the overall cost models of our lenders, and our revenue earned per consumer can be adversely affected by the overall reduced demand for refinancing in a rising rate environment.
We dynamically adjust selling and marketing expenditures in all interest rate environments to optimize our results against these variables.
According to Freddie Mac, 30-year mortgage interest rates have fallengenerally increased from a monthly average of 2.68% in December 2020 to a monthly average of 3.8%2.98% in September 2017.June 2021. On a quarterly basis, 30-year mortgage interest rates in the thirdsecond quarter of 20172021 averaged 3.89%3.00%, as compared to 3.45% in the third quarter of 2016 and 3.99%3.23% in the second quarter of 2017.2020 and 2.88% in the first quarter of 2021.
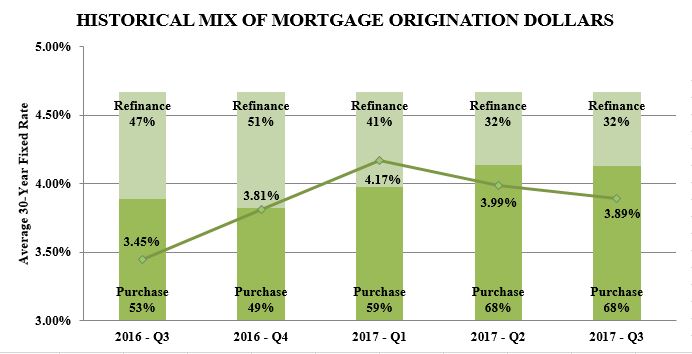
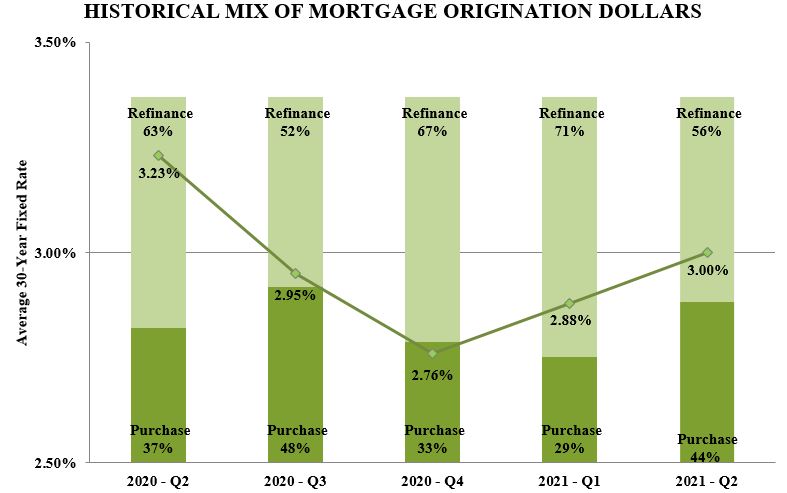
Typically, as mortgage interest rates rise, there are fewer consumers in the marketplace seeking refinancings and, accordingly, the mix of mortgage origination dollars moves towardswill move toward purchase mortgages. According to Mortgage Bankers Association ("MBA") data, total refinance origination dollars remained at 32%decreased to 56% of total mortgage origination dollars while purchasein the second quarter of 2021 compared to 71% in the first quarter of 2021. In the second quarter of 2021, total refinance origination dollars remained at 68% indecreased 24% from the thirdfirst quarter of 20172021 and increased 2% from the second quarter of 2017.2020. Industry-wide mortgage origination dollars in the second quarter of 2021 decreased 4% from the first quarter of 2021 and increased 13% from the second quarter of 2020.
Looking forward,In July 2021, the MBA is projectingprojected 30-year mortgage interest rates to increase slightly through the end ofduring 2021, to an average 3.4% for the year. According to MBA projections, the mix of mortgage origination dollars willis expected to move back towards refinancepurchase mortgages in the fourth quarter of 2017 with the refinance share representing 36%approximately 54% for 2017.2021.
The U.S. Real Estate Market
The health of the U.S. real estate market and interest rate levels are the primary drivers of consumer demand for new mortgages. Consumer demand, in turn, affects lender demand for purchase mortgage leads from third-party sources. Typically, a strong real estate market will lead to reduced lender demand for leads, as there are more consumers in the marketplace seeking financing and, accordingly, lenders receive more organic lead volume. Conversely, a weaker real estate market will typically lead to an increase in lender demand, as there are fewer consumers in the marketplace seeking mortgages.
According to Fannie Mae data, existing-home sales decreased 8% in the National Associationsecond quarter of Realtors ("NAR"), 2017 started with2021 compared to the fastest pacefirst quarter of existing home2021, and increased 32% compared to the second quarter of 2020. Fannie Mae predicts an overall increase in existing-home sales of approximately 3% in almost a decade. However, pending home sales declined in August for the fifth time in six months due2021 compared to limited supply. The NAR expects inventory to remain low for 2017 and forecasts a decrease of 0.2% in existing home sales from 2016.2020.
Results of Operations for the Three and NineSix Months ended SeptemberJune 30, 20172021 and 20162020
| | | | | | | | | | | | | | | | | | | | Three Months Ended June 30, | | Six Months Ended June 30, |
| | Three Months Ended September 30, | | Nine Months Ended September 30, | | 2021 | 2020 | $
Change | %
Change | | 2021 | 2020 | $
Change | %
Change |
| | 2017 | 2016 | $ Change | % Change | | 2017 | 2016 | $ Change | % Change | | (Dollars in thousands) |
| | (Dollars in thousands) | |
| Mortgage products | $ | 73,756 |
| $ | 53,523 |
| $ | 20,233 |
| 38 | % | | $ | 208,209 |
| $ | 164,571 |
| $ | 43,638 |
| 27 | % | |
| Non-mortgage products | 97,738 |
| 41,035 |
| 56,703 |
| 138 | % | | 248,573 |
| 118,990 |
| 129,583 |
| 109 | % | |
| Home | | Home | $ | 104,861 | | $ | 74,123 | | $ | 30,738 | | 41 | % | | $ | 232,986 | | $ | 153,297 | | $ | 79,689 | | 52 | % |
| Consumer | | Consumer | 75,676 | | 37,118 | | 38,558 | | 104 | % | | 133,583 | | 157,042 | | (23,459) | | (15) | % |
| Insurance | | Insurance | 89,263 | | 72,919 | | 16,344 | | 22 | % | | 175,877 | | 155,656 | | 20,221 | | 13 | % |
| Other | | Other | 214 | | 166 | | 48 | | 29 | % | | 318 | | 1,415 | | (1,097) | | (78) | % |
| Revenue | 171,494 |
| 94,558 |
| 76,936 |
| 81 | % | | 456,782 |
| 283,561 |
| 173,221 |
| 61 | % | Revenue | 270,014 | | 184,326 | | 85,688 | | 46 | % | | 542,764 | | 467,410 | | 75,354 | | 16 | % |
| Costs and expenses: | |
| |
| |
| |
| | | | Costs and expenses: | |
Cost of revenue (exclusive of depreciation and amortization shown separately below) | 4,388 |
| 3,392 |
| 996 |
| 29 | % | | 12,143 |
| 10,329 |
| 1,814 |
| 18 | % | Cost of revenue (exclusive of depreciation and amortization shown separately below) | 13,934 | | 13,464 | | 470 | | 3 | % | | 27,829 | | 27,716 | | 113 | | — | % |
| Selling and marketing expense | 118,538 |
| 62,819 |
| 55,719 |
| 89 | % | | 320,930 |
| 192,416 |
| 128,514 |
| 67 | % | Selling and marketing expense | 185,206 | | 113,921 | | 71,285 | | 63 | % | | 382,668 | | 309,459 | | 73,209 | | 24 | % |
| General and administrative expense | 17,920 |
| 9,008 |
| 8,912 |
| 99 | % | | 41,561 |
| 26,820 |
| 14,741 |
| 55 | % | General and administrative expense | 39,811 | | 28,489 | | 11,322 | | 40 | % | | 74,800 | | 60,571 | | 14,229 | | 23 | % |
| Product development | 4,805 |
| 3,718 |
| 1,087 |
| 29 | % | | 12,492 |
| 11,384 |
| 1,108 |
| 10 | % | Product development | 13,290 | | 10,812 | | 2,478 | | 23 | % | | 25,758 | | 21,775 | | 3,983 | | 18 | % |
| Depreciation | 1,798 |
| 1,286 |
| 512 |
| 40 | % | | 5,309 |
| 3,458 |
| 1,851 |
| 54 | % | Depreciation | 4,443 | | 3,550 | | 893 | | 25 | % | | 8,161 | | 6,928 | | 1,233 | | 18 | % |
| Amortization of intangibles | 3,817 |
| 166 |
| 3,651 |
| 2,199 | % | | 9,034 |
| 263 |
| 8,771 |
| 3,335 | % | Amortization of intangibles | 11,310 | | 13,756 | | (2,446) | | (18) | % | | 22,622 | | 27,513 | | (4,891) | | (18) | % |
| Change in fair value of contingent consideration | 2,501 |
| — |
| 2,501 |
| N/A |
| | 20,640 |
| — |
| 20,640 |
| N/A |
| Change in fair value of contingent consideration | (8,850) | | 9,175 | | (18,025) | | (196) | % | | (8,053) | | 1,053 | | (9,106) | | (865) | % |
| Severance | — |
| — |
| — |
| — | % | | 404 |
| 72 |
| 332 |
| 461 | % | Severance | — | | 32 | | (32) | | (100) | % | | — | | 190 | | (190) | | (100) | % |
| Litigation settlements and contingencies | 272 |
| 19 |
| 253 |
| 1,332 | % | | 961 |
| 109 |
| 852 |
| 782 | % | Litigation settlements and contingencies | 322 | | (1,325) | | 1,647 | | 124 | % | | 338 | | (996) | | 1,334 | | 134 | % |
| Total costs and expenses | 154,039 |
| 80,408 |
| 73,631 |
| 92 | % | | 423,474 |
| 244,851 |
| 178,623 |
| 73 | % | Total costs and expenses | 259,466 | | 191,874 | | 67,592 | | 35 | % | | 534,123 | | 454,209 | | 79,914 | | 18 | % |
| Operating income | 17,455 |
| 14,150 |
| 3,305 |
| 23 | % | | 33,308 |
| 38,710 |
| (5,402 | ) | (14 | )% | |
| Other income (expense), net: | |
| |
| |
| |
| | | | |
| Operating income (loss) | | Operating income (loss) | 10,548 | | (7,548) | | 18,096 | | 240 | % | | 8,641 | | 13,201 | | (4,560) | | (35) | % |
| Other (expense) income, net: | | Other (expense) income, net: | |
| Interest expense, net | (2,804 | ) | (141 | ) | 2,663 |
| 1,889 | % | | (4,048 | ) | (424 | ) | 3,624 |
| 855 | % | Interest expense, net | (9,840) | | (4,955) | | 4,885 | | 99 | % | | (20,055) | | (9,789) | | 10,266 | | 105 | % |
| Other (expense) income | (228 | ) | — |
| 228 |
| N/A |
| | (215 | ) | — |
| 215 |
| N/A |
| |
| Income before income taxes | 14,423 |
| 14,009 |
| 414 |
| 3 | % | | 29,045 |
| 38,286 |
| (9,241 | ) | (24 | )% | |
| Income tax expense | (4,292 | ) | (6,729 | ) | (2,437 | ) | (36 | )% | | (3,109 | ) | (15,099 | ) | (11,990 | ) | (79 | )% | |
| Net income from continuing operations | 10,131 |
| 7,280 |
| 2,851 |
| 39 | % | | 25,936 |
| 23,187 |
| 2,749 |
| 12 | % | |
| Other income | | Other income | — | | 7 | | (7) | | (100) | % | | 40,072 | | 7 | | 40,065 | | n/a |
| Income (loss) before income taxes | | Income (loss) before income taxes | 708 | | (12,496) | | 13,204 | | 106 | % | | 28,658 | | 3,419 | | 25,239 | | 738 | % |
| Income tax benefit | | Income tax benefit | 9,092 | | 3,880 | | 5,212 | | 134 | % | | 454 | | 6,941 | | (6,487) | | (93) | % |
| Net income (loss) from continuing operations | | Net income (loss) from continuing operations | 9,800 | | (8,616) | | 18,416 | | 214 | % | | 29,112 | | 10,360 | | 18,752 | | 181 | % |
| Loss from discontinued operations, net of tax | (1,011 | ) | (664 | ) | 347 |
| 52 | % | | (2,632 | ) | (3,017 | ) | (385 | ) | (13 | )% | Loss from discontinued operations, net of tax | (3,199) | | (21,141) | | (17,942) | | (85) | % | | (3,462) | | (25,716) | | (22,254) | | (87) | % |
| Net income and comprehensive income | $ | 9,120 |
| $ | 6,616 |
| $ | 2,504 |
| 38 | % | | $ | 23,304 |
| $ | 20,170 |
| $ | 3,134 |
| 16 | % | |
| Net income (loss) and comprehensive income (loss) | | Net income (loss) and comprehensive income (loss) | $ | 6,601 | | $ | (29,757) | | $ | 36,358 | | 122 | % | | $ | 25,650 | | $ | (15,356) | | $ | 41,006 | | 267 | % |
Revenue
Revenue increased in the thirdsecond quarter and first nine months of 20172021 compared to the thirdsecond quarter andof 2020 due to increases in all our segments. Revenue increased in the first ninesix months of 20162021 compared to the first six months of 2020 due to increases in our non-mortgage products of $56.7 millionHome and $129.6 million, respectively, andInsurance segments, partially offset by decreases in our mortgage products of $20.2 millionConsumer segment and $43.6 million, respectively.Other category.
Our non-mortgage products includeConsumer segment includes the following non-mortgage lending products: personal loans, credit cards, home equity loans and lines of credit, reverse mortgage loans, autopersonal loans, small business loans, and student loans. Our non-mortgage products also includeloans, auto loans, deposit accounts, home improvement referrals and other credit products such as credit repair and debt settlement. Many of our non-mortgageConsumer segment products are not individually significant to revenue. The increase in revenueRevenue from our non-mortgage productsConsumer segment increased $38.6 million in the thirdsecond quarter and first nine months of 20172021 from the thirdsecond quarter and first nine months of 2016 is2020, or 104%, primarily due to increases in our personal loans, credit cards, home equity, and personalsmall business loans products. Revenue from our Consumer segment decreased $23.5 million in the first six months of 2021 from the first six months of 2020, or 15%, primarily due to decreases in our credit cards and deposits products.
Revenue from our credit cards product increased $32.8$15.2 million to $39.4$22.4 million in the thirdsecond quarter of 20172021 from $6.6$7.2 million in the thirdsecond quarter of 2016,2020, or 500%212%, primarily due to an increase in the number of approvals and increased $86.6an increase in revenue earned per approval. Revenue from our credit cards product decreased $18.7 million to $110.1$40.1 million in the first ninesix months of 20172021 from $23.5$58.8 million in the first ninesix months of 2016,2020, or 369%32%, primarily due to a decrease in the contribution fromnumber of approvals and a decrease in revenue earned per approval.
For the CompareCards acquisition, completed on November 16, 2016.
periods presented, no other products in our Consumer segment represented more than 10% of revenue; however, certain other Consumer products experienced notable changes. Revenue from our personal loans product increased $7.8 million to $25.4$16.4 million in the thirdsecond quarter of 2017 from $17.6 million in2021 compared to the thirdsecond quarter of 2016, or 44%, primarily2020, due to increasesan increase in the number of consumers completing request forms as a result of increaseswell as an increase in lender demand and corresponding increases in selling and marketing efforts.revenue earned per consumer. Revenue from our personal
small business loans product increased $11.1$7.7 million in the second quarter of 2021 compared to $63.0the second quarter of 2020, due to loosening underwriting standards and improved flow of capital, as well as an increase in revenue earned per consumer. Revenue from our deposits product decreased $7.9 million in the first ninesix months of 2017 from $51.9 million in2021 compared to the first ninesix months of 2016, or 21%, primarily2020, due to increasesa decrease in the number of consumers completing request forms as a result of increases in lender demand and corresponding increases in selling and marketing efforts, partially offset by decreases in revenue earned per consumer. Certain of our online personal loan lenders experienced well-publicized challenges in 2016, in particular, general unavailability of capital, increased pricing demanded by investors of personal loans, which in some cases led to reductions in marketing spend, and tightening in underwriting standards.
For the periods presented, no other non-mortgage product represented more than 10% of revenue, however certain other non-mortgage products experienced notable increases. Revenue from our home equity product increased by $9.0 million in the third quarter of 2017 compared to the third quarter of 2016 and increased by $20.6 million in the first nine months of 2017 compared to the first nine months of 2016 due to increases in the number of consumers completing request formswell as a result of increasesdecrease in lender coverage and lender demand, corresponding increases in selling and marketing efforts, and increased revenue earned per consumer.
The increaseongoing COVID-19 pandemic is anticipated to continue to impact our Consumer product revenues in the near-term.
Our Home segment includes the following products: purchase mortgage, refinance mortgage, home equity loans and lines of credit, reverse mortgage loans, and real estate. Revenue from our Home segment increased $30.7 million in the second quarter of 2021 from the second quarter of 2020, or 41%, primarily due to increases in revenue from our refinance mortgage, products in the third quarterpurchase mortgage, and first nine monthshome equity loans and lines of 2017 compared to the third quarter and first nine months of 2016 is primarily due to an increase in revenue from both our purchase and refinancecredit products. The revenueRevenue from our purchase productHome segment increased $10.4 million in the third quarter of 2017 from the third quarter of 2016 and increased $27.5$79.7 million in the first ninesix months of 20172021 from the first ninesix months of 2016. The2020, or 52%, primarily due to increases in revenue from those same products. Revenue from our refinance mortgage product increased $9.9$12.7 million in the thirdsecond quarter of 2017 from2021 compared to the thirdsecond quarter of 20162020, and $16.1increased $64.7 million in the first ninesix months of 2017 from2021 compared to the first ninesix months of 2016. The increase in revenue from our mortgage product is primarily2020, due to an increase in revenue earned per consumer. Additionally,consumer, partially offset by a decrease in the number of consumers completing request formsforms. Revenue from our home equity loans and lines of credit product increased $10.0 million in the second quarter of 2021 compared to the second quarter of 2020, and increased $9.9 million in the first six months of 2021 compared to the first six months of 2020. Revenue from our purchase mortgage product increased $8.2 million in the second quarter of 2021 compared to the second quarter of 2020, and increased $5.5 million in the first six months of 2021 compared to the first six months of 2020. Revenue from our home equity loans and lines of credit product and our purchase mortgage product increased due to a shift in both lender and consumer focus away from refinance products as well as an increase in revenue earned per consumer.
Revenue from our Insurance segment increased $16.3 million to $89.3 million in the second quarter of 2021 from $72.9 million in the second quarter of 2020, or 22%, and increased $20.2 million to $175.9 million in the first six months of 2021 from $155.7 million in the first six months of 2020, or 13%, due to an increase in lender demand andthe number of consumers seeking insurance coverage, partially offset by a corresponding increasedecrease in selling and marketing efforts.revenue earned per consumer.
Revenue in the Other category decreased $1.1 million in the first six months of 2021 compared to the first six months of 2020, primarily as we ceased reselling online advertising space during the first quarter of 2020.
Cost of revenue
Cost of revenue consists primarily of costs associated with compensation and other employee-related costs (including stock-based compensation) relating to internally-operated customer call centers, third-party customer call center fees, costs for online advertising resold to third parties, credit scoring fees, credit card fees, website network hosting and server fees.
Cost of revenue increased in the thirdsecond quarter of 20172021 from the thirdsecond quarter of 2016,2020, primarily due to increases of $0.5 millionan increase in compensation and benefits of $0.8 million, partially offset by a $0.6 million decrease in credit card fees. Cost of revenue increased slightly in the first six months of 2021 from the first six months of 2020, primarily due to an increase in compensation and benefits of $1.7 million, partially offset by a $1.3 million decrease in credit card fees, as well as a result$1.1 million decrease for the cost of increases in headcount.resold advertising space.
Cost of revenue as a percentage of revenue decreased from 4% forto 5% in the thirdsecond quarter of 20162021 compared to 3% for7% in the thirdsecond quarter of 2017.
Cost of revenue increased2020, and decreased to 5% in the first ninesix months of 2017 from2021 compared to 6% in the first ninesix months of 2016, primarily due to increases2020.
Cost of revenue as a percentage of revenue decreased from 4% for the first nine months of 2016 to 3% for the first nine months of 2017.
Selling and marketing expense
Selling and marketing expense consists primarily of advertising and promotional expenditures and compensation and other employee-related costs (including stock-based compensation) for personnel engaged in sales or marketing functions. Advertising and promotional expenditures primarily include online marketing, as well as television, print and radio spending. Advertising production costs are expensed in the period the related ad is first run.
The increases in sellingSelling and marketing expense increased in the thirdsecond quarter and first ninesix months of 20172021 compared to the thirdsecond quarter and first ninesix months of 2016 were2020 primarily due to the increases in advertising and promotional expense of $54.2 million and $126.8 million, respectively, as discussed below.
Advertising and promotional expense is the largest component of selling and marketing expense, and is comprised of the following:
| | | | Three Months Ended September 30, | | Nine Months Ended September 30, | | Three Months Ended June 30, | | Six Months Ended June 30, |
| | 2017 | | 2016 | | $ Change | | % Change | | 2017 | | 2016 | | $ Change | | % Change | | 2021 | 2020 | $
Change | %
Change | | 2021 | 2020 | $
Change | %
Change |
| | (Dollars in thousands) | | (Dollars in thousands) |
| Online | $ | 98,080 |
| | $ | 48,982 |
| | $ | 49,098 |
| | 100 | % | | $ | 271,531 |
| | $ | 150,075 |
| | $ | 121,456 |
| | 81 | % | Online | $ | 165,038 | | $ | 96,416 | | $ | 68,622 | | 71 | % | | $ | 341,859 | | $ | 269,497 | | $ | 72,362 | | 27 | % |
| Broadcast | 12,372 |
| | 8,251 |
| | 4,121 |
| | 50 | % | | 29,776 |
| | 25,888 |
| | 3,888 |
| | 15 | % | Broadcast | 2,649 | | 3,154 | | (505) | | (16) | % | | 3,816 | | 9,478 | | (5,662) | | (60) | % |
| Other | 1,968 |
| | 1,003 |
| | 965 |
| | 96 | % | | 4,575 |
| | 3,167 |
| | 1,408 |
| | 44 | % | Other | 3,908 | | 2,259 | | 1,649 | | 73 | % | | 9,623 | | 6,621 | | 3,002 | | 45 | % |
| Total advertising expense | $ | 112,420 |
| | $ | 58,236 |
| | $ | 54,184 |
| | 93 | % | | $ | 305,882 |
| | $ | 179,130 |
| | $ | 126,752 |
| | 71 | % | Total advertising expense | $ | 171,595 | | $ | 101,829 | | $ | 69,766 | | 69 | % | | $ | 355,298 | | $ | 285,596 | | $ | 69,702 | | 24 | % |
Revenue is primarily driven by lenderNetwork Partner demand for our products, which is matched to corresponding consumer loan requests. We adjust our selling and marketing expenditures dynamically in relation to anticipated revenue opportunities in order to ensure sufficient consumer inquiries to profitably meet lendersuch demand. An increase in a product’s revenue is generally met by a corresponding increase in marketing spend, and conversely a decrease in a product’s revenue is generally met by a corresponding decrease in marketing spend. This relationship exists for both mortgageour Home, Consumer and non-mortgage products.Insurance segments.
We increasedadjusted our advertising expenditures in the thirdsecond quarter and first ninesix months of 20172021 compared to the thirdsecond quarter and first ninesix months of 20162020 in orderresponse to generate additional consumer inquiries to meet the increasedchanges in Network Partner demand of lenders on our marketplace.
marketplace as a result of the ongoing COVID-19 pandemic discussed above. We will continue to adjust selling and marketing expenditures dynamically in relation to this and in response to anticipated revenue opportunities.
General and administrative expense
General and administrative expense consists primarily of compensation and other employee-related costs (including stock-based compensation) for personnel engaged in finance, legal, tax, corporate information technology, human resources and executive management functions, as well as facilities and infrastructure costs and fees for professional services.
General and administrative expense increased in the thirdsecond quarter of 2017 from2021 compared to the thirdsecond quarter of 2016,2020, primarily due to increases in compensation and benefits, technology expense, and facilities expense of $6.4$5.5 million, $1.7 million, and $1.4 million, respectively, as well as a result of increases$1.0 million increase in headcountlosses on asset impairments and long term equity awards granted to the CEO in the third quarter of 2017, which awards have both time and significant performance-based vesting conditions. We recently made additional long-term awards to certain members of our leadership team and expect additional long-term awards to other members of our leadership team in the fourth quarter of 2017 or the first quarter of 2018.disposals. General and administrative expense is expectedincreased in the first six months of 2021 compared to increase in future periodsthe first six months of 2020, primarily due to the non-cashincreases in compensation and benefits, facilities expense, related to these grants.and technology expense of $10.2 million, $2.9 million, and $2.3 million, respectively. This increasewas partially offset by a decrease in general and administrative expense is expected to result in material reductions in net income from continuing operations in future periods compared to historical periods. The amount and timingprofessional fees of these effects will depend on the nature of the equity awards that the independent Compensation Committee of the Board of Directors determines to grant and the assumptions used to determine associated stock-based compensation expense. For additional information regarding the awards granted in the third quarter of 2017, see Note 8 —Stock-Based Compensation included in Part I, Item 1. Financial Statements. Non-cash compensation expense is excluded from Adjusted EBITDA. See “Adjusted EBITDA” below.$1.3 million.
General and administrative expense as a percentage of revenue remained consistent at 10%decreased to 15% in the thirdsecond quarter of 2017 and2021 compared to 16% in the thirdsecond quarter of 2016.
General2020, and administrative expense increased to 14% in the first ninesix months of 2017 from the first nine months of 2016, primarily due2021 compared to increases in compensation and benefits of $10.7 million as a result of increases in headcount and the long term equity awards granted to the CEO in the third quarter of 2017 discussed above.
General and administrative expense as a percentage of revenue remained consistent at 9%13% in the first ninesix months of 2017 and the first nine months of 2016.
Contingent consideration
During the third quarter and first nine months of 2017, we recorded $2.5 million and $20.6 million, respectively, of contingent consideration expense due to an adjustment in the estimated fair value of the earnout payments related to the CompareCards and DepositAccounts acquisitions. The contingent consideration expense for the CompareCards acquisition was $1.9 million and $20.0 million, respectively, in the third quarter and first nine months of 2017, primarily due to an increased probability of achievement
of certain defined earning targets for CompareCards. The contingent consideration expense for the DepositAccounts acquisition was $0.6 million in both the third quarter and first nine months of 2017 and was primarily due to an increased probability of achievement of certain defined revenue targets for deposits products.2020.
Product development
Product development expense consists primarily of compensation and other employee-related costs (including stock-based compensation) and third-party labor costs that are not capitalized, for employees and consultants engaged in the design, development, testing and enhancement of technology.
Product development expense increased in the thirdsecond quarter and first ninesix months of 20172021 compared to the thirdsecond quarter and first ninesix months of 2016,2020 as we continued to invest in internal development of new and enhanced features, functionality and business opportunities that we believe will enable us to better and more fully serve consumers and lenders. Product development expenses are comprisedNetwork Partners.
Depreciation
The increase in depreciation expense in the second quarter and first six months of 2021 compared to the second quarter and first six months of 2020 was primarily the result of compensationdepreciation on assets related to our new corporate office, which lease contractually commenced in the second quarter of 2021.
Amortization of intangibles
The decrease in amortization of intangibles in the second quarter and first six months of 2021 compared to the second quarter and first six months of 2020 was due to certain intangible assets associated with our recent business acquisitions becoming fully amortized.
Contingent consideration
During the second quarter and first six months of 2021, we recorded contingent consideration gains of $8.9 million and $8.1 million, respectively, due to adjustments in the estimated fair value of the remaining earnout payment related to the QuoteWizard acquisition.
During the second quarter and first six months of 2020, we recorded aggregate contingent consideration expense of $9.2 million and $1.1 million, respectively, due to adjustments in the estimated fair value of the earnout payments related to our recent acquisitions. For the second quarter of 2020, the contingent consideration expense for the QuoteWizard, Ovation and SnapCap acquisitions was $8.1 million, $1.0 million and $0.1 million, respectively. For the first six months of 2020, the contingent consideration expense for the Ovation and SnapCap acquisitions was $1.2 million and $0.1 million, respectively, partially offset by a contingent consideration gain for the QuoteWizard acquisition of $0.2 million.
Interest expense
Interest expense increased in the second quarter and first six months of 2021 compared to the second quarter and first six months of 2020 due to the issuance of $575.0 million of our 0.50% Convertible Senior Notes due July 15, 2025 (the “2025 Notes”) as well as the repurchase of a portion of our existing 0.625% Convertible Senior Notes due June 1, 2022 (the “2022 Notes”) in July 2020. In the second quarter and first six months of 2021, interest expense of $6.7 million and $13.5 million, respectively, was recognized on the 2025 Notes. This increase to interest expense was partially offset by lower interest expense on the 2022 Notes in the second quarter and first six months of 2021 compared to the second quarter and first six months of 2020 as a result of the July 2020 repurchase of $130.3 million principal amount of the 2022 Notes. See Note 13—Debt for additional information on the issuance of the 2025 Notes and the partial repurchase of the 2022 Notes.
Other income
For the first six months of 2021, other employee-related costs.income primarily consists of a $40.1 million gain on our investment in Stash as a result of an adjustment to the fair value based on observable market events. See Note 7—Equity Investment for additional information on the equity interest in Stash.
Income tax expense
For the thirdsecond quarter and first ninesix months of 2017,2021, the effective tax rate varied from the federal statutory rate of 35% primarily21% in part due to a tax benefit of $0.8$8.3 million and $8.4 million, respectively, recognized for excess tax benefits due toresulting from employee exercises of stock options and vesting of restricted stock in accordance with ASU 2016-09. See Note 2 —Significant Accounting Policiesin Part I, Item 1. Financial Statements for additional information.2016-09 and the effect of state taxes.
For the thirdsecond quarter and first six months of 2016,2020, the effective tax rate varied from the federal statutory rate of 35% primarily21% in part due to a tax benefit of $0.8 million and $1.8 million, respectively, recognized for excess tax benefits resulting from employee exercises of stock options and vesting of restricted stock in accordance with ASU 2016-09 and the effect of state taxes, includingtaxes. The effective tax rate for the first six months of 2020 was also impacted by a tax benefit of $6.1 million for the impact of a reduction in the North Carolina state income tax rates which reduced the value of our deferred tax assets.
For the first nine months of 2016, the effective tax rate varied from the federal statutory rate of 35% primarily due to the benefit derived from the federal research tax credit, partially offset by state taxes. The federal research tax credit benefit was the result of a study completed during the second quarter of 2016Coronavirus Aid, Relief, and Economic Security ("CARES") Act. See Note 12—Income Taxes for the open tax years 2011 through 2015, plus an estimate of the benefit from 2016 research activities.
There have been no changes to our valuation allowance assessment for the third quarter of 2017.additional information.
Discontinued operations
Losses fromThe results of discontinued operations are attributable to losses associated withinclude the results of the LendingTree Loans business theformerly operated by our wholly-owned subsidiary, Home Loan Center, Inc., or HLC. The sale of whichsubstantially all of the assets of HLC, including the LendingTree Loans business, was completed on June 6, 2012. LossesHLC filed a petition under Chapter 11 of the United States
Bankruptcy Code on July 21, 2019, which was converted to Chapter 7 of the United States Bankruptcy Code on September 16, 2019.
As a result of the voluntary bankruptcy petition, as of the initial July 21, 2019 bankruptcy petition filing date, HLC and its consolidated subsidiary were deconsolidated from discontinued operationsLendingTree’s consolidated financial statements. The effect of such deconsolidation was the elimination of the consolidated assets and liabilities of HLC (and its consolidated subsidiary) from LendingTree’s consolidated balance sheets.
During the HLC bankruptcy, a bar date for claims against HLC was set, establishing a deadline for all HLC’s creditors to assert any claim they may have had against HLC. Distributions were made to holders of allowed claims deemed timely filed. After all distributions to creditors were made and HLC’s Chapter 7 bankruptcy estate was fully administered, the HLC bankruptcy case was closed on July 14, 2021.
Prior to the bankruptcy filing, losses from the LendingTree Loans business were primarily due to litigation settlements and contingencies and legal fees associated with ongoing legal proceedings.
The results of discontinued operations include litigation settlements and contingencies and legal fees associated with ongoing legal proceedings against LendingTree, Inc. or LendingTree, LLC that arose due to the LendingTree Loans business or the HLC bankruptcy filing.
See Note 17—Discontinued Operations to the consolidated financial statements included elsewhere in this report for more information.
Segment Profit
| | | | | | | | | | | | | | | | | | | | | | | | | | | | | |
| | Three Months Ended June 30, | | Six Months Ended June 30, |
| | 2021 | 2020 | $
Change | %
Change | | 2021 | 2020 | $
Change | %
Change |
| | (Dollars in thousands) |
| Home | $ | 39,017 | | $ | 38,726 | | $ | 291 | | 1 | % | | $ | 78,007 | | $ | 74,637 | | $ | 3,370 | | 5 | % |
| Consumer | 33,394 | | 19,402 | | 13,992 | | 72 | % | | 58,001 | | 62,501 | | (4,500) | | (7) | % |
| Insurance | 33,238 | | 30,122 | | 3,116 | | 10 | % | | 66,080 | | 60,655 | | 5,425 | | 9 | % |
| Other | (49) | | 81 | | (130) | | (160) | % | | (141) | | (247) | | 106 | | 43 | % |
| Segment profit | $ | 105,600 | | $ | 88,331 | | $ | 17,269 | | 20 | % | | $ | 201,947 | | $ | 197,546 | | $ | 4,401 | | 2 | % |
Segment profit is our primary segment operating metric. Segment profit is calculated as segment revenue less segment selling and marketing expenses attributed to variable costs paid for advertising, direct marketing and related expenses that are directly attributable to the segments' products. See Note 16—Segment Information in the notes to the consolidated financial statements for additional information on segments and a reconciliation of segment profit to pre-tax income from continuing operations.
Consumer segment profit increased $14.0 million in the second quarter of 2021 from the second quarter of 2020, primarily due to an increase in revenue, partially offset by a corresponding increase in selling and marketing expense. Consumer segment profit decreased $4.5 million in the first six months of 2021 from the first six months of 2020, primarily due to a decrease in revenue, partially offset by a corresponding decrease in selling and marketing expense. We continue to build momentum in the Consumer segment as demand from both consumers and our Network Partners returns. Consumer demand for personal loans began to return as the economy begins to reopen. Lender demand in our personal loans product continues to improve, with more lenders currently on our marketplace than prior to the onset of the COVID-19 pandemic. Credit card issuer budgets continue to increase, with an increasing number of issuers returning to our marketplace and increasing approval rates. The profitability of our credit card product remains constrained as we continue to re-invest incremental revenue into the product to capture wallet share. Our small business loans product continues steady recovery from the impact of the COVID-19 pandemic.
Insurance segment profit increased $3.1 million in the second quarter of 2021 from the second quarter of 2020, and increased $5.4 million in the first six months of 2021 from the first six months of 2020, primarily due to an increase in revenue, partially offset by a corresponding increase in selling and marketing expense. We continue to diversify and increase the durability of the Insurance segment by broadening traffic acquisition sources, expanding our insurance carrier network, and growing into non-automobile categories. During the second quarter of 2021, our publisher platform again delivered record performance, and our inbound channel continued positive momentum. These additional traffic sources enable incremental
growth while reducing our reliance on paid search marketing, in which we have observed increasing competition in recent months. Additionally, our efforts to scale non-automobile categories continue to deliver returns. We again observed record revenue from the home category in the second quarter of 2021, as we increasingly leverage our presence in the mortgage industry. We continue to make significant investments in our Medicare category, ahead of the annual fourth quarter enrollment season.
Home segment profit remained relatively consistent in the second quarter of 2021 from the second quarter of 2020. Home segment profit increased $3.4 million in the first six months of 2021 from the first six months of 2020, primarily due to an increase in revenue, partially offset by a corresponding increase in selling and marketing expense. Although refinance activity is decelerating from the peak experienced earlier this year, the Home segment continues to perform well as we are an integral part of our Network Partners' marketing model. Demand for our services, and competition on our network, drove a 71% increase in mortgage revenue per lead in the second quarter of 2021 compared to the second quarter of 2020. The Home segment margin increased to 37% of revenue in the second quarter of 2021, compared to 30% in the first quarter of 2021. While there is uncertainty over the current low interest rate environment and corresponding impact to refinance activity, we are confident in our market-leading position and flexible business model.
Adjusted EBITDA
We report Adjusted EBITDA as a supplemental measure to GAAP. This measure is the primary metric by which we evaluate the performance of our businesses, on which our marketing expenditures and internal budgets are based and by which, in most years, management and many employees are compensated. We believe that investors should have access to the same set of tools that we use in analyzing our results. This non-GAAP measure should be considered in addition to results prepared in accordance with GAAP but should not be considered a substitute for or superior to GAAP results. We provide and encourage investors to examine the reconciling adjustments between the GAAP and non-GAAP measures discussed below.
Definition of Adjusted EBITDA
We report Adjusted EBITDA as net income from continuing operations adjusted to exclude interest, income tax, amortization of intangibles and depreciation, and to further exclude (1) non-cash compensation expense, (2) non-cash impairment charges, (3) gain/loss on disposal of assets, (4) gain/loss on investments, (5) restructuring and severance expenses, (5)(6) litigation settlements and contingencies, and legal fees for certain patent litigation, (6)(7) acquisitions and dispositions income or expense (including with respect to changes in fair value of contingent consideration), and (7)(8) one-time items. Adjusted EBITDA has certain limitations in that it does not take into account the impact to our statement of operations of certain expenses, including depreciation, non-cash compensation and acquisition-related accounting. We endeavor to compensate for the limitations of the non-GAAP measures presented by also providing the comparable GAAP measures with equal or greater prominence and descriptions of the reconciling items, including
quantifying such items, to derive the non-GAAP measures. These non-GAAP measures may not be comparable to similarly titled measures used by other companies.
One-Time Items
Adjusted EBITDA is adjusted for one-time items, if applicable. Items are considered one-time in nature if they are non-recurring, infrequent or unusual and have not occurred in the past two years or are not expected to recur in the next two years, in accordance with SEC rules. For the periods presented in this report,below, there are no adjustments for one-time items.
Non-Cash Expenses that are Excluded from Adjusted EBITDA
Non-cash compensation expense consists principally of expense associated with grants of restricted stock, restricted stock units and stock options.options, some of which awards have performance-based vesting conditions. These expenses are not paid in cash, and we include the related shares in our calculations of fully diluted shares outstanding. Upon settlement of restricted stock units, exercise of certain stock options or vesting of restricted stock awards, the awards may be settled, on a net basis, with us remitting the required tax withholding amount from our current funds.
Amortization of intangibles are non-cash expenses relating primarily to intangible assets acquired through acquisitions. At the time of an acquisition, the intangible assets of the acquired company, such as purchase agreements, technology and customer relationships, are valued and amortized over their estimated lives.
The following table is a reconciliation of net income from continuing operations to Adjusted EBITDA (in thousands).
| | | | | | | | | | | | | | | | | | | | | | | |
| Three Months Ended
June 30, | | Six Months Ended
June 30, |
| | 2021 | | 2020 | | 2021 | | 2020 |
| Net income (loss) from continuing operations | $ | 9,800 | | | $ | (8,616) | | | $ | 29,112 | | | $ | 10,360 | |
| Adjustments to reconcile to Adjusted EBITDA: | | | | | | | |
| Amortization of intangibles | 11,310 | | | 13,756 | | | 22,622 | | | 27,513 | |
| Depreciation | 4,443 | | | 3,550 | | | 8,161 | | | 6,928 | |
| Severance | — | | | 32 | | | — | | | 190 | |
| Loss on impairments and disposal of assets | 1,052 | | | 22 | | | 1,400 | | | 552 | |
| Unrealized gain on investments | — | | | — | | | (40,072) | | | — | |
| Non-cash compensation expense | 18,294 | | | 13,158 | | | 34,730 | | | 25,075 | |
| Change in fair value of contingent consideration | (8,850) | | | 9,175 | | | (8,053) | | | 1,053 | |
| Acquisition expense | 1,110 | | | 20 | | | 1,139 | | | 2,200 | |
| Litigation settlements and contingencies | 322 | | | (1,325) | | | 338 | | | (996) | |
| Interest expense, net | 9,840 | | | 4,955 | | | 20,055 | | | 9,789 | |
| Income tax benefit | (9,092) | | | (3,880) | | | (454) | | | (6,941) | |
| Adjusted EBITDA | $ | 38,229 | | | $ | 30,847 | | | $ | 68,978 | | | $ | 75,723 | |
|
| | | | | | | | | | | | | | | |
| | Three Months Ended
September 30, | | Nine Months Ended
September 30, |
| | 2017 | | 2016 | | 2017 | | 2016 |
| | | | | | |
| Net income from continuing operations | $ | 10,131 |
| | $ | 7,280 |
| | $ | 25,936 |
| | $ | 23,187 |
|
| Adjustments to reconcile to Adjusted EBITDA: | |
| | |
| | | | |
| Amortization of intangibles | 3,817 |
| | 166 |
| | 9,034 |
| | 263 |
|
| Depreciation | 1,798 |
| | 1,286 |
| | 5,309 |
| | 3,458 |
|
| Severance | — |
| | — |
| | 404 |
| | 72 |
|
| Loss on disposal of assets | 364 |
| | 121 |
| | 673 |
| | 388 |
|
| Non-cash compensation | 7,938 |
| | 2,348 |
| | 13,068 |
| | 7,410 |
|
| Change in fair value of contingent consideration | 2,501 |
| | — |
| | 20,640 |
| | — |
|
| Acquisition expense | 320 |
| | 362 |
| | 1,357 |
| | 499 |
|
| Litigation settlements and contingencies | 272 |
| | 19 |
| | 961 |
| | 109 |
|
| Interest expense, net | 2,804 |
| | 141 |
| | 4,048 |
| | 424 |
|
| Rental depreciation and amortization of intangibles | 486 |
| | — |
| | 1,011 |
| | — |
|
| Income tax expense | 4,292 |
| | 6,729 |
| | 3,109 |
| | 15,099 |
|
| Adjusted EBITDA | $ | 34,723 |
| | $ | 18,452 |
| | $ | 85,550 |
| | $ | 50,909 |
|
Financial Position, Liquidity and Capital Resources
General
As of SeptemberJune 30, 2017,2021, we had $345.2$203.2 million of cash and cash equivalents, and $4.1compared to $169.9 million of restricted cash and cash equivalents, compared to $91.1 million of cash and cash equivalents and $4.1 million of restricted cash and cash equivalents as of December 31, 2016.2020.
In May 2017, we issued $300.0 millionthe first quarter of our 0.625% Convertible Senior Notes for net proceeds of $290.8 million. We used approximately $18.1 million of the net proceeds to enter into Convertible Note Hedge and Warrant transactions. For additional information on the Convertible Senior Notes and the Convertible Note Hedge and Warrant transactions, see Note 10—Debt, in the notes to the consolidated financial statements included elsewhere in this report.
In September 2017,2021, we acquired certain assets of SnapCapadditional equity interest in Stash for $11.9 million in cash at closing and potential future contingent consideration payments of up to $9.0 million through March 31, 2020, subject to achieving specific targets.
In June 2017, we acquired the membership interests of MagnifyMoney for $29.6 million cash consideration at the closing of the transaction.
In June 2017, we acquired substantially all of the assets of DepositAccounts for $24.0 million in cash at closing and potential future contingent consideration payments of up to $9.0 million through June 30, 2020, subject to achieving specified targets.
In November 2016, we acquired CompareCards for $80.7 million cash at closing and potential future contingent consideration payments of up to $22.5 million for each of 2017 and 2018, subject to achieving specified targets. $1.2 million. See Note 5—Business Acquisitions in the notes7—Equity Investment to the consolidated financial statements included elsewhere in this report for additional information for these acquisitions.on the equity interest in Stash.
We could make an additional potential contingent consideration payment of up to $23.4 million related to the prior acquisition of QuoteWizard.
We expect our cash and cash equivalents and cash flows from operations to be sufficient to fund our operating needs for the next twelve months and beyond. Our revolving credit facility described below is an additional potential sourceWe will continue to monitor the impact of liquidity.the ongoing COVID-19 pandemic on our liquidity and capital resources. We expect our cashflow from operating activities to be negatively impacted by the economic recession.
Senior Secured Revolving Credit Facility
On October 22, 2015,December 10, 2019, we established a $125.0entered into an amended and restated $500.0 million five-year Senior Secured Revolving Credit Facilitysenior secured revolving credit facility, which matures on October 22, 2020December 10, 2024 (the “Revolving“Amended Revolving Credit Facility”). The proceeds ofBorrowings under the Amended Revolving Credit Facility can be used to finance working capital needs, capital expenditures and general corporate purposes, including to finance permitted acquisitions. In July 2020, we executed a temporary amendment to the Amended Revolving Credit Facility to provide for certain covenant relief, primarily to facilitate the issuance of the 2025 Notes, the repurchase of a portion of the 2022 Notes, and to pay down existing borrowings under the credit facility. The amendment was applicable from the effective date through the fiscal quarter ending June 30, 2021. As a result of the expiration of the temporary amendment, we are currently unable to draw on the Amended Revolving Credit Facility and we are in the process of establishing a new facility during the third quarter of 2021. See Note 13—Debt for additional information.
As of October 26, 2017,July 29, 2021, we do not have any borrowings outstanding a $0.2 million letter of credit under the Amended Revolving Credit Facility.
For additional information on the Revolving Credit Facility, see Note 10—Debt, in the notes to the consolidated financial statements included elsewhere in this report.
Cash Flows from Continuing Operations
Our cash flows attributable to continuing operations are as follows:
| | | | Nine Months Ended September 30, | | Six Months Ended
June 30, |
| | 2017 | | 2016 | | 2021 | | 2020 |
| | (in thousands) | | (in thousands) |
| Net cash provided by operating activities | $ | 65,083 |
| | $ | 38,885 |
| Net cash provided by operating activities | $ | 54,580 | | | $ | 87,916 | |
| Net cash used in investing activities | (72,320 | ) | | (10,067 | ) | Net cash used in investing activities | (24,765) | | | (89,108) | |
| Net cash provided by (used in) financing activities | 263,710 |
| | (51,648 | ) | |
| Net cash (used in) provided by financing activities | | Net cash (used in) provided by financing activities | (4,970) | | | 45,282 | |
Cash Flows from Operating Activities
Our largest source of cash provided by our operating activities is revenues generated by our mortgage and non-mortgage products. Our primary uses of cash from our operating activities include advertising and promotional payments. In addition, our uses of cash from operating activities include compensation and other employee-related costs, other general corporate expenditures, litigation settlements and contingencies, certain contingent consideration payments, and income taxes.
Net cash provided by operating activities attributable to continuing operations increaseddecreased in the first ninesix months of 20172021 from the first ninesix months of 20162020 primarily due to an increase in revenue, partially offset by an increase in selling and marketing expense. Additionally, there was a net decrease in cash from changes in working capital primarily driven byunfavorable changes in accounts receivable, and income taxes, partially offset by favorable changes in accounts payable, accrued expenses and other current liabilities.liabilities, and income taxes receivable.
Cash Flows from Investing Activities
Net cash used in investing activities attributable to continuing operations in the first ninesix months of 20172021 of $72.3$24.8 million consisted primarily of the acquisition of MagnifyMoney for $29.5 million, the acquisition of DepositAccounts for $25.0 million, the acquisition of SnapCap for $11.9 million and capital expenditures of $5.9$23.6 million primarily related to internally developed software.software and leasehold improvements for our new principal corporate offices, as well as the purchase of an additional $1.2 million equity interest in Stash, described above.
Net cash used in investing activities attributable to continuing operations in the first ninesix months of 20162020 of $10.1$89.1 million consisted primarily of the initial purchase of an $80.0 million equity interest in Stash and capital expenditures of $8.0$9.1 million primarily related to internally developed software and the acquisition of an aircraft and $4.5 million for the acquisition of SimpleTuition, partially offset by a $2.5 million decrease in restricted cash due to the release of funds in escrow for the surety bonds due to a reduction in collateral requirements.
software.
Cash Flows from Financing Activities
Net cash used in financing activities attributable to continuing operations in the first six months of 2021 of $5.0 million consisted primarily of $4.8 million in withholding taxes paid upon surrender of shares to satisfy obligations on equity awards, net of proceeds from the exercise of stock options.
Net cash provided by financing activities attributable to continuing operations in the first ninesix months of 20172020 of $263.7$45.3 million consisted primarily of $300.0$55.0 million of grossnet proceeds from the issuance of convertible senior notes and $43.4 million of proceeds from the sale of warrants in connection with the convertible senior notes,our Amended Revolving Credit Facility, partially offset by $61.5 million for the payment of convertible note hedge transactions, $9.3 million for the payment of convertible senior note issuance costs and $10.0 million for the repurchase of our stock.
Net cash used in financing activities attributable to continuing operations in the first nine months of 2016 of $51.6 million consisted primarily of the repurchase of our stock of $48.5 million and $3.1$6.1 million in withholding taxes paid by us upon surrender of shares to satisfy obligations on equity awards.awards, net of proceeds from the exercise of stock options, and a $3.3 million contingent consideration payment for SnapCap.
Off-Balance Sheet Arrangements
We have no off-balance sheet arrangements other than a letter of credit and our operating lease obligations and funding commitments pursuant to our surety bonds, none of which have or are reasonably likely to have a current or future effect on our financial condition, changes in financial condition, revenues or expenses, results of operations, liquidity, capital expenditures or capital resources that is material to investors.
New Accounting Pronouncements
For information regarding new accounting pronouncements, see Note 2- 2—Significant Accounting Policies, in Part I, Item 1 Financial Statements.
Item 3. Quantitative and Qualitative Disclosures about Market Risk
Other than our Amended Revolving Credit Facility, which currently has no borrowings outstanding, we do not have any financial instruments that are exposed to significant market risk. We maintain our cash and cash equivalents in bank deposits and short-term, highly liquid money market investments. A hypothetical 100-basis point increase or decrease in market interest rates would not have a material impact on the fair value of our cash equivalents securities, or our earnings on such cash equivalents, but would have an effect on the interest paid on borrowings under the Amended Revolving Credit Facility, if any. As of October 26, 2017,July 29, 2021, there were no borrowings under the Amended Revolving Credit Facility.
Fluctuations in interest rates affect consumer demand for new mortgages and the level of refinancing activity which, in turn, affects lender demand for mortgage leads. Typically, a decline in mortgagewhen interest rates will leaddecline, we see increased consumer demand for mortgage refinancing, which in turn leads to reducedincreased traffic to our website and decreased selling and marketing efforts associated with that traffic. At the same time, lender demand for leads from third-party sources typically decreases, as there are more consumers in the marketplace seeking refinancings and, accordingly, lenders receive more organic lead volume. Due to lower lender demand, our revenue earned per consumer typically decreases but with correspondingly lower selling and marketing costs. Conversely, an increase in mortgagewhen interest rates willincrease, we typically leadsee decreased consumer demand for mortgage refinancing, leading to an increase indecreased traffic to our website and higher associated selling and marketing efforts associated with that traffic. At the same time, lender demand for leads from third-party leads,sources typically increases, as there are fewer consumers in the marketplace and, accordingly, the supply of organic mortgage lead volume decreases. See also the risk factor "Adverse conditionsDue to high lender demand, we typically see an increase in the primaryamount lenders will pay per matched lead, which often leads to higher revenue earned per consumer. However, increases in the amount lenders will pay per matched lead in this situation is limited by the overall cost models of our lenders, and secondary mortgage markets, as well asour revenue earned per consumer can be adversely affected by the general economy, could materially and adversely affect our business, financial condition and results of operations,"overall reduced demand for refinancing in Part I, Item 1A (Risk Factors) in our 2016 Annual Report.a rising rate environment.
Item 4. Controls and Procedures
Evaluation of Disclosure Controls and Procedures
As required by Rule 13a-15(b) of the Securities Exchange Act of 1934, as amended (the "Exchange Act"), management, with the participation of our principal executive officer (our Chief Executive Officer) and principal financial officer (our Chief Financial Officer), evaluated, as of the end of the period covered by this report, the effectiveness of our disclosure controls and procedures as defined in Exchange Act Rule 13a-15(e). Based upon that evaluation, our Chief Executive Officer and Chief Financial Officer concluded that our disclosure controls and procedures are effective, as of SeptemberJune 30, 2017,2021, to reasonably ensure that information required to be disclosed and filed under the Exchange Act is recorded, processed, summarized and reported within the time periods specified, and that management will be timely alerted to material information required to be included in our periodic reports filed with the Securities and Exchange Commission.
Changes in Internal Control Over Financial Reporting
There was no change in our internal control over financial reporting that occurred during the quarter ended SeptemberJune 30, 20172021 that has materially affected, or is reasonably likely to materially affect, our internal controls over financial reporting.
PART II—OTHER INFORMATION
Item 1. Legal Proceedings
In the ordinary course of business, we are party to litigation involving property, contract, intellectual property and a variety of other claims. The amounts that may be recovered in such matters may be subject to insurance coverage. We have provided information about certain legal proceedings in which we are involved in Part I, Item 3. Legal Proceedings of our 20162020 Annual Report and updated that information in Note 11—14—Contingencies and Note 17—Discontinued Operations to the consolidated financial statements included elsewhere in this report.
Item 1A. Risk Factors
There have been no material changes to the risk factors included in Part II, Item 1A. Risk Factors of our quarterly report on Form 10-Q for the quarter ended June 30, 2017 and Part I, Item 1A. Risk Factors of our 20162020 Annual Report.
Item 2. Unregistered Sales of Equity Securities and Use of Proceeds
Issuer Purchases of Equity Securities
In each of January 2010, May 2014, January 2016February 2018 and February 2016,2019, the board of directors authorized and we announced a stock repurchase program which allowed for the repurchase of up to $10.0 million, $10.0 million, $50.0$100.0 million and $40.0$150.0 million, respectively, of our common stock. At September 30, 2017, approximately $38.7 million remains authorized for share repurchase under this program. Under this program, we can repurchase stock in the open market or through privately-negotiated transactions. We have used available cash to finance these repurchases. We will determine the timing and amount of any additional repurchases based on our evaluation of market conditions, applicable SEC guidelines and regulations, and other factors. This program may be suspended or discontinued at any time at the discretion of our board of directors. During the quarter ended SeptemberJune 30, 2017, 42,1532021, no shares of common stock were repurchased under the stock repurchase program. As of October 26, 2017,July 23, 2021, approximately $38.7$179.7 million remains authorized for share repurchase.
Additionally, the LendingTree FifthSeventh Amended and Restated 2008 Stock and Award Incentive Plan approved by our stockholders on June 9, 2021 allows, and the LendingTree 2017 Inducement Grant Plan allowterminated by us in April 2021 allowed, employees to forfeit shares of our common stock to satisfy federal and state withholding obligations upon the exercise of stock options, the settlement of restricted stock unit awards and the vesting of restricted stock awards granted to those individuals under the plans. During the quarter ended SeptemberJune 30, 2017, 2,5872021, 3,506 shares were purchased related to these obligations under the LendingTree FifthSeventh Amended and Restated 2008 Stock and Award Incentive Plan and no721 shares have yet beenwere purchased related to these obligations under the LendingTree 2017 Inducement Grant Plan. The withholding of those shares does not affect the dollar amount or number of shares that may be purchased under the stock repurchase program described above.
The following table provides information about the company'sCompany's purchases of equity securities during the quarter ended SeptemberJune 30, 2017.2021.
| | | | | | | | | | | | | | | | | | | | | | | | | | |
| Period | | Total Number of Shares Purchased (1) | | Average Price
Paid per Share | | Total Number of Shares Purchased as Part of Publicly Announced Plans or Programs (2) | | Approximate
Dollar Value of Shares
that May Yet Be
Purchased Under the
Plans or Programs |
| | | | | | | | (in thousands) |
| 4/1/2021 - 4/30/2021 | | 264 | | | $ | 226.78 | | | — | | | $ | 179,673 | |
| 5/1/2021 - 5/31/2021 | | 347 | | | $ | 211.68 | | | — | | | $ | 179,673 | |
| 6/1/2021 - 6/30/2021 | | 3,616 | | | $ | 216.81 | | | — | | | $ | 179,673 | |
| Total | | 4,227 | | | $ | 217.02 | | | — | | | $ | 179,673 | |
|
| | | | | | | | | | | | | | |
| Period | | Total Number of Shares Purchased (1) | | Average Price Paid per Share | | Total Number of Shares Purchased as Part of Publicly Announced Plans or Programs (2) | | Approximate Dollar Value of Shares that May Yet be Purchased Under the Plans or Programs |
| | | | | | | | | (in thousands) |
| 7/1/17 - 7/31/17 | | 243 |
| | $ | 183.48 |
| | — |
| | $ | 48,748 |
|
| 8/1/17 - 8/31/17 | | 1,953 |
| | $ | 229.04 |
| | — |
| | $ | 48,748 |
|
| 9/1/17 - 9/30/17 | | 42,544 |
| | $ | 237.31 |
| | 42,153 |
| | $ | 38,747 |
|
| Total | | 44,740 |
| | $ | 236.66 |
| | 42,153 |
| | $ | 38,747 |
|
| |
(1) | During July 2017, August 2017 and September 2017, 243 shares, 1,953 shares and 391 shares, respectively (totaling 2,587 shares), were purchased to satisfy federal and state withholding obligations of our employees upon the settlement of restricted stock unit awards, all in accordance with our Fifth Amended and Restated 2008 Stock and Award Incentive Plan, as described above. |
| |
(2) | See the narrative disclosure above the table for further description of our publicly announced stock repurchase program. |
(2)See the narrative disclosure above the table for further description of our publicly announced stock repurchase program.
Item 5.Other Information
Approved Compensation Arrangement & Employment Amendment
On October 22, 2017, the Compensation Committee (“Committee”) of our Board of Directors approved new compensation arrangements in the form of a term sheet (the “Term Sheet”) with Neil Salvage, our President. The Term Sheet contemplates that we will in the near-term enter into a new employment agreement with Mr. Salvage to replace his current letter agreement dated November 28, 2016. Mr. Salvage will continue to serve in his current roles. His new employment agreement will have a four-year term ending October 31, 2021, although employment is “at will” and may be terminated by either us or Mr. Salvage at any time.None.
The Term Sheet provides that Mr. Salvage will receive an annual base salary of $450,000, and he is eligible to receive a target annual incentive of 100% of his base salary. The Term Sheet further provides that Mr. Salvage is eligible to participate in employee benefits programs (including paid time off and participation in the Company’s 401(k) plan). In connection with his new employment arrangement, Mr. Salvage received 25,309 restricted stock units and stock options to purchase 49,821 shares of common stock, each of which vest in four equal installments beginning on October 22, 2018. In addition to continued service over the 4-year vesting period, vesting of the restricted stock unit award is subject to a performance condition as follows: our company must achieve either (a) Adjusted EBITDA of at least $1 million in the first quarter of 2018 or (b) aggregate Adjusted EBITDA for the first half of 2018 in excess of $2 million. These awards are expected to comprise the entirety of Mr. Salvage’s long-term incentive compensation through October 31, 2021. For two years after his employment has terminated, Mr. Salvage will be obligated to comply with non-compete and non-soliciting of employees and customers restrictions. If Mr. Salvage’s employment is terminated by us without cause or if he resigns his employment for good reason, he will be eligible to receive an aggregate cash amount equal to his then-annual base salary paid in installments over a one-year period and he will vest in equity awards scheduled to vest within 9 months of the termination date (subject to Mr. Salvage providing a release of claims and also subject to cessation of cash severance if he secures new employment). If there is a change in control, Mr. Salvage will immediately become fully vested in all his outstanding equity awards. In addition, if there is a change in control and during the 12-month period following such change in control, Mr. Salvage’s employment is terminated by us without cause or by Mr. Salvage for good reason, Mr. Salvage will receive a severance payment equal to two years of base salary.
On October 22, 2017, the Committee amended the terms of J.D. Moriarty’s employment as previously disclosed in Form 8-K filed September 6, 2017, to provide for an anticipated four-year term of employment (although employment is “at will” and may be terminated by either us or Mr. Moriarty at any time). We expect that we will in the near-term enter into a new employment agreement with Mr. Moriarty to reflect these amended terms and to replace his current letter agreement dated March 29, 2017. In connection with this extension, Mr. Moriarty received 5,583 restricted stock units and stock options to purchase 10,416 shares of common stock, each of which vest in a single installment on October 22, 2021. This award and the awards previously granted to Mr. Moriarty are expected to comprise the entirety of Mr. Moriarty’s long-term incentive compensation through August 31, 2021. For two years after his employment has terminated, Mr. Moriarty will be obligated to comply with non-compete and non-soliciting of employees and customers restrictions. If on or after December 3, 2017 Mr. Moriarty’s employment is terminated by us without cause or if he resigns his employment for good reason, he will be eligible to receive an aggregate cash amount equal to his then-annual base salary paid in installments over a one-year period. Upon termination by us without cause or resignation by Mr. Moriarty for good reason, he will also vest in equity awards scheduled to vest within 9 months of the termination date. All such benefits upon termination without cause or resignation for good reason are subject to Mr. Moriarty providing a release of claims and also subject to cessation of cash severance if he secures new employment. If there is a change in control, Mr. Moriarty will immediately become fully vested in all his outstanding equity awards. In addition, if there is a change in control and during the 12-month period following such change in control, Mr. Moriarty’s employment is terminated by us without cause or by Mr. Moriarty for good reason, Mr. Moriarty will receive a severance payment equal to two years of base salary.
This disclosure is provided in lieu of disclosure in Item 5.02 of Form 8-K, in accordance with SEC rules.
Assignment and Assumption of Spinco Agreement
On October 26, 2017, our board of directors approved an Assignment and Assumption Agreement which permits Liberty Interactive Corporation (f/k/a Liberty Media Corporation) (“Liberty”) to assign its rights and obligations under the Spinco Agreement between Liberty and us (“Spinco Agreement”) to General Communication, Inc. (to be renamed GCI Liberty, Inc., “SplitCo”) in connection with a contemplated reorganization transaction between Liberty and SplitCo (the "Liberty Reorganization"). The Liberty Reorganization includes Liberty contributing its subsidiaries holding our common stock, as well as other assets and liabilities of Liberty and its subsidiaries attributed to its Ventures Group, to SplitCo and then splitting SplitCo off to the stockholders of Liberty's Liberty Ventures Series A and Series B common stock. If the Liberty Reorganization is consummated, we expect SplitCo to continue the operations of Liberty with respect to its ownership of our common stock. The Assignment and Assumption Agreement was also approved by a majority of the “Qualified Directors” (as that term is defined in the Spinco Agreement).
The Assignment and Assumption Agreement also provides that following the Liberty Reorganization, neither Liberty nor its affiliates may acquire beneficial ownership of our equity securities other than the acquisition of less than 1% of our outstanding equity securities through the acquisition of or investments in third parties holding such equity securities. SplitCo will be subject to the present restrictions in the Spinco Agreement limiting the beneficial ownership of it and its affiliates to 34.9% of our voting power.
The Assignment and Assumption Agreement also modifies certain of the limited circumstances in which Liberty and its affiliates (or following the Liberty Reorganization, SplitCo and its affiliates) would have limited relief from the standstill restrictions under the Spinco Agreement. The Spinco Agreement provides that in the event a third party discloses beneficial ownership of our common stock exceeding 20% and our board of directors does not within 10 business days of such announcement take certain defensive actions, Liberty and its affiliates (or following the Liberty Reorganization, SplitCo and its affiliates) are relieved of certain standstill obligations to the extent reasonably necessary to permit Liberty (or following the Liberty Reorganization SplitCo) to commence and consummate an offer to acquire all of the outstanding equity securities of our company. The Assignment and Assumption Agreement provides that the percentage threshold of ownership triggering this limited relief from standstill obligations will be 30% solely with respect to ownership by Douglas R. Lebda, his immediate family members acquiring securities directly or indirectly from Mr. Lebda, his estate and certain family-controlled entities (collectively, the “Lebda Group”). Further, the 30% threshold for the Lebda Group will be calculated on the basis of outstanding shares held by the Lebda Group and will not include securities that the Lebda Group may acquire upon the conversion, exercise, redemption or exchange of warrants, options or other convertible securities. The foregoing modification will not be applicable to the extent that it is publicly disclosed that any member of the Lebda Group has formed or become a member of a “group” (as such term is used in Sections 13(d) and 14(d) of the Securities Exchange Act) with any person not a member of the Lebda Group.
For further discussion of the Spinco Agreement, please see our definitive proxy statement filed with the SEC on April 28, 2017.
As of June 6, 2017, Liberty beneficially owned 27.0% of our common stock and as of April 21, 2017, Douglas R. Lebda beneficially owned 20.8% of our common stock. Liberty has (and following consummation of the Liberty Reorganization, SplitCo will have) the right to designate two directors of our board in accordance with the Spinco Agreement.
This disclosure is provided in lieu of disclosure in Item 1.01 of Form 8-K, in accordance with SEC rules.
Item 6. Exhibits
|
| | | | | | | | | | | | | |
| Exhibit | | Description | | Location |
| | | | |
| 3.1 |
| | | | Exhibit 3.1 to the Registrant's Current Report on Form 8-K filed August 25, 2008 |
| 3.2 |
| | | | Exhibit 3.23.1 to the Registrant's Current Report on Form 8-K filed December 31, 2014November 15, 2017 |
| 10.1 |
| | | | † |
10.231.1 |
| | | | † |
10.3 |
| | | | † |
31.1 |
| | | | † |
| 31.2 |
| | | | † |
| 32.1 |
| | | | †† |
| 32.2 |
| | | | †† |
| 101.INS |
| | XBRL Instance Document— The instance document does not appear in the Interactive Data File because its XBRL tags are embedded within the Inline XBRL document. | | ††† |
| 101.SCH |
| | XBRL Taxonomy Extension Schema Document | | ††† |
| 101.CAL |
| | XBRL Taxonomy Extension Calculation Linkbase Document | | ††† |
| 101.DEF |
| | XBRL Taxonomy Extension Definition Linkbase Document | | ††† |
| 101.LAB |
| | XBRL Taxonomy Extension Label Linkbase Document | | ††† |
| 101.PRE |
| | XBRL Taxonomy Extension Presentation Linkbase Document | | ††† |
| 104 | | Cover Page Interactive Data File (embedded within the Inline XBRL document contained in Exhibit 101) | | ††† |
† Filed herewithherewith.
†† Furnished herewith. This certification is being furnished solely to accompany this report pursuant to 18 U.S.C. 1350, and is not being filed for purposes of Section 18 of the Securities Exchange Act of 1934, as amended, and is not to be incorporated by reference into any filing of the registrant, whether made before or after the date hereof, regardless of any general incorporation language in such filing.
††† Furnished herewith. Pursuant to Rule 406T of Regulation S-T, the Interactive Data Files on Exhibit 101 hereto are deemed not filed or part of a registration statement or prospectus for purposes of Sections 11 or 12 of the Securities Act of 1933, as amended, are deemed not filed for purposes of Section 18 of the Securities Exchange Act of 1934, as amended, and otherwise are not subject to liability under those sections.
SIGNATURE
Pursuant to the requirements of the Securities Exchange Act of 1934, the registrant has duly caused this report to be signed on its behalf by the undersigned thereunto duly authorized.
Date: October 26, 2017July 29, 2021
|
| | | | | | | |
| LENDINGTREE, INC. |
| | |
| By: | /s/ J.D. MORIARTYTRENT ZIEGLER |
| | J.D. MoriartyTrent Ziegler |
| | Chief Financial Officer |
| | (principal financial officer and duly authorized officer) |