UNITED STATES
SECURITIES AND EXCHANGE COMMISSION
Washington, D.C. 20549
FORM 10-Q
| | | | | |
| ☒ | QUARTERLY REPORT PURSUANT TO SECTION 13 OR 15(d) OF THE SECURITIES EXCHANGE ACT OF 1934 |
For the Quarterly Period Ended June 30, 20222023
or
| | | | | |
| ☐ | TRANSITION REPORT PURSUANT TO SECTION 13 OR 15(d) OF THE SECURITIES EXCHANGE ACT OF 1934 |
For the transition period from to
Commission File No. 001-34063
LendingTree, Inc.
(Exact name of Registrant as specified in its charter)
| | | | | | | | |
| Delaware | | 26-2414818 |
| (State or other jurisdiction of incorporation or organization) | | (I.R.S. Employer Identification No.) |
1415 Vantage Park Dr., Suite 700, Charlotte, North Carolina 28203
(Address of principal executive offices)(Zip Code)
(704) 541-5351
(Registrant's telephone number, including area code)
Securities registered pursuant to Section 12(b) of the Act:
| | | | | | | | | | | | | | |
| Title of each class | | Trading Symbol(s) | | Name of each exchange on which registered |
| Common Stock, $0.01 par value per share | | TREE | | The Nasdaq Stock Market LLC |
Indicate by check mark whether the registrant (1) has filed all reports required to be filed by Section 13 or 15(d) of the Securities Exchange Act of 1934 during the preceding 12 months (or for such shorter period that the registrant was required to file such reports), and (2) has been subject to such filing requirements for the past 90 days. Yes ☒ No ☐
Indicate by check mark whether the registrant has submitted electronically every Interactive Data File required to be submitted pursuant to Rule 405 of Regulation S-T (§232.405 of this chapter) during the preceding 12 months (or for such shorter period that the registrant was required to submit such files). Yes ☒ No ☐
Indicate by check mark whether the registrant is a large accelerated filer, an accelerated filer, a non-accelerated filer, a smaller reporting company, or an emerging growth company. See the definitions of “large accelerated filer,” “accelerated filer,” “smaller reporting company,” and “emerging growth company” in Rule 12b-2 of the Exchange Act.
| | | | | | | | | | | | | | |
| Large accelerated filer | ☒☐ | | Accelerated filer | ☐☒ |
| Non-accelerated filer | ☐ | | Smaller reporting company | ☐ |
| | | Emerging growth company | ☐ |
If an emerging growth company, indicate by check mark if the registrant has elected not to use the extended transition period for complying with any new or revised financial accounting standards provided pursuant to Section 13(a) of the Exchange Act. ☐
Indicate by check mark whether the registrant is a shell company (as defined in Rule 12b-2 of the Exchange Act). Yes ☐ No ☒
As of July 21, 2022,24, 2023, there were 12,785,99112,971,481 shares of the registrant's common stock, par value $.01 per share, outstanding, excluding treasury shares.
PART I—FINANCIAL INFORMATION
Item 1. Financial Statements
LENDINGTREE, INC. AND SUBSIDIARIES
CONSOLIDATED STATEMENTS OF OPERATIONS AND COMPREHENSIVE INCOME
(Unaudited) | | | | Three Months Ended
June 30, | | Six Months Ended
June 30, | | Three Months Ended
June 30, | | Six Months Ended
June 30, |
| | | 2022 | | 2021 | | 2022 | | 2021 | | 2023 | | 2022 | | 2023 | | 2022 |
| | | (in thousands, except per share amounts) | | (in thousands, except per share amounts) |
| Revenue | Revenue | $ | 261,923 | | | $ | 270,014 | | | $ | 545,101 | | | $ | 542,764 | | Revenue | $ | 182,453 | | | $ | 261,923 | | | $ | 382,961 | | | $ | 545,101 | |
| Costs and expenses: | Costs and expenses: | | | | | | | | Costs and expenses: | | | | | | | |
Cost of revenue (exclusive of depreciation and amortization shown separately below) | Cost of revenue (exclusive of depreciation and amortization shown separately below) | 14,574 | | | 13,934 | | | 30,135 | | | 27,829 | | Cost of revenue (exclusive of depreciation and amortization shown separately below) | 9,302 | | | 14,574 | | | 23,062 | | | 30,135 | |
| Selling and marketing expense | Selling and marketing expense | 184,537 | | | 185,206 | | | 388,694 | | | 382,668 | | Selling and marketing expense | 116,065 | | | 184,537 | | | 253,176 | | | 388,694 | |
| General and administrative expense | General and administrative expense | 40,289 | | | 39,811 | | | 76,262 | | | 74,800 | | General and administrative expense | 29,160 | | | 40,291 | | | 65,843 | | | 76,268 | |
| Product development | Product development | 14,318 | | | 13,290 | | | 28,370 | | | 25,758 | | Product development | 10,601 | | | 14,318 | | | 25,256 | | | 28,370 | |
| Depreciation | Depreciation | 4,896 | | | 4,443 | | | 9,750 | | | 8,161 | | Depreciation | 4,684 | | | 4,896 | | | 9,479 | | | 9,750 | |
| Amortization of intangibles | Amortization of intangibles | 7,075 | | | 11,310 | | | 14,992 | | | 22,622 | | Amortization of intangibles | 1,982 | | | 7,075 | | | 4,031 | | | 14,992 | |
| Change in fair value of contingent consideration | — | | | (8,850) | | | — | | | (8,053) | | |
| | Restructuring and severance | Restructuring and severance | 135 | | | — | | | 3,760 | | | — | | Restructuring and severance | 3,558 | | | 135 | | | 8,012 | | | 3,760 | |
| Litigation settlements and contingencies | Litigation settlements and contingencies | (7) | | | 322 | | | (34) | | | 338 | | Litigation settlements and contingencies | 488 | | | (7) | | | 500 | | | (34) | |
| Total costs and expenses | Total costs and expenses | 265,817 | | | 259,466 | | | 551,929 | | | 534,123 | | Total costs and expenses | 175,840 | | | 265,819 | | | 389,359 | | | 551,935 | |
| Operating (loss) income | (3,894) | | | 10,548 | | | (6,828) | | | 8,641 | | |
| Other (expense) income, net: | | | | | | | | |
| Interest expense, net | (6,765) | | | (9,840) | | | (14,270) | | | (20,055) | | |
| Operating income (loss) | | Operating income (loss) | 6,613 | | | (3,896) | | | (6,398) | | | (6,834) | |
| Other income (expense), net: | | Other income (expense), net: | | | | | | | |
| Interest (expense) income, net | | Interest (expense) income, net | (6,940) | | | (6,765) | | | 18,089 | | | (14,270) | |
| Other income | Other income | 284 | | | — | | | 283 | | | 40,072 | | Other income | 439 | | | 284 | | | 2,273 | | | 283 | |
| (Loss) income before income taxes | (10,375) | | | 708 | | | (20,815) | | | 28,658 | | |
| Income tax benefit | 2,337 | | | 9,092 | | | 1,954 | | | 454 | | |
| Net (loss) income from continuing operations | (8,038) | | | 9,800 | | | (18,861) | | | 29,112 | | |
| Loss from discontinued operations, net of tax | — | | | (3,199) | | | (3) | | | (3,462) | | |
| Income (loss) before income taxes | | Income (loss) before income taxes | 112 | | | (10,377) | | | 13,964 | | | (20,821) | |
| Income tax (expense) benefit | | Income tax (expense) benefit | (227) | | | 2,339 | | | (622) | | | 1,957 | |
| Net (loss) income and comprehensive (loss) income | Net (loss) income and comprehensive (loss) income | $ | (8,038) | | | $ | 6,601 | | | $ | (18,864) | | | $ | 25,650 | | Net (loss) income and comprehensive (loss) income | $ | (115) | | | $ | (8,038) | | | $ | 13,342 | | | $ | (18,864) | |
| | Weighted average shares outstanding: | Weighted average shares outstanding: | | Weighted average shares outstanding: | |
| Basic | Basic | 12,723 | | | 13,243 | | | 12,812 | | | 13,157 | | Basic | 12,915 | | | 12,723 | | | 12,881 | | | 12,812 | |
| Diluted | Diluted | 12,723 | | | 13,719 | | | 12,812 | | | 13,913 | | Diluted | 12,915 | | | 12,723 | | | 12,912 | | | 12,812 | |
| (Loss) income per share from continuing operations: | | | | | |
| Basic | $ | (0.63) | | | $ | 0.74 | | | $ | (1.47) | | | $ | 2.21 | | |
| Diluted | $ | (0.63) | | | $ | 0.71 | | | $ | (1.47) | | | $ | 2.09 | | |
| Loss per share from discontinued operations: | | | | | |
| Basic | $ | — | | | $ | (0.24) | | | $ | — | | | $ | (0.26) | | |
| Diluted | $ | — | | | $ | (0.23) | | | $ | — | | | $ | (0.25) | | |
| Net (loss) income per share: | Net (loss) income per share: | | | | | Net (loss) income per share: | | | | |
| Basic | Basic | $ | (0.63) | | | $ | 0.50 | | | $ | (1.47) | | | $ | 1.95 | | Basic | $ | (0.01) | | | $ | (0.63) | | | $ | 1.04 | | | $ | (1.47) | |
| Diluted | Diluted | $ | (0.63) | | | $ | 0.48 | | | $ | (1.47) | | | $ | 1.84 | | Diluted | $ | (0.01) | | | $ | (0.63) | | | $ | 1.03 | | | $ | (1.47) | |
The accompanying notes to consolidated financial statements are an integral part of these statements.
LENDINGTREE, INC. AND SUBSIDIARIES
CONSOLIDATED BALANCE SHEETS
(Unaudited)
| | | | June 30,
2022 | | December 31,
2021 | | June 30,
2023 | | December 31,
2022 |
| | | (in thousands, except par value and share amounts) | | (in thousands, except par value and share amounts) |
| ASSETS: | ASSETS: | | | | ASSETS: | | | |
| Cash and cash equivalents | Cash and cash equivalents | $ | 279,108 | | | $ | 251,231 | | Cash and cash equivalents | $ | 162,641 | | | $ | 298,845 | |
| Restricted cash and cash equivalents | Restricted cash and cash equivalents | 125 | | | 111 | | Restricted cash and cash equivalents | 34 | | | 124 | |
| Accounts receivable (net of allowance of $2,300 and $1,456, respectively) | 115,441 | | | 97,658 | | |
| Accounts receivable (net of allowance of $2,609 and $2,317, respectively) | | Accounts receivable (net of allowance of $2,609 and $2,317, respectively) | 75,710 | | | 83,060 | |
| Prepaid and other current assets | Prepaid and other current assets | 27,419 | | | 25,379 | | Prepaid and other current assets | 26,045 | | | 26,250 | |
| | Assets held for sale (Note 7) | | Assets held for sale (Note 7) | — | | | 5,689 | |
| Total current assets | Total current assets | 422,093 | | | 374,379 | | Total current assets | 264,430 | | | 413,968 | |
| Property and equipment (net of accumulated depreciation of $30,274 and $28,315, respectively) | 68,315 | | | 72,477 | | |
| Property and equipment (net of accumulated depreciation of $35,865 and $33,851, respectively) | | Property and equipment (net of accumulated depreciation of $35,865 and $33,851, respectively) | 56,549 | | | 59,160 | |
| Operating lease right-of-use assets | Operating lease right-of-use assets | 71,336 | | | 77,346 | | Operating lease right-of-use assets | 64,415 | | | 67,050 | |
| Goodwill | Goodwill | 420,139 | | | 420,139 | | Goodwill | 420,139 | | | 420,139 | |
| Intangible assets, net | Intangible assets, net | 70,772 | | | 85,763 | | Intangible assets, net | 54,284 | | | 58,315 | |
| Deferred income tax assets | 130,174 | | | 87,581 | | |
| Equity investment | 174,580 | | | 158,140 | | |
| | Equity investments | | Equity investments | 173,140 | | | 174,580 | |
| Other non-current assets | Other non-current assets | 6,693 | | | 6,942 | | Other non-current assets | 6,182 | | | 6,101 | |
| Non-current assets of discontinued operations | — | | | 16,589 | | |
| | Total assets | Total assets | $ | 1,364,102 | | | $ | 1,299,356 | | Total assets | $ | 1,039,139 | | | $ | 1,199,313 | |
| | LIABILITIES: | LIABILITIES: | | | | LIABILITIES: | | | |
| Current portion of long-term debt | Current portion of long-term debt | $ | 2,491 | | | $ | 166,008 | | Current portion of long-term debt | $ | 2,500 | | | $ | 2,500 | |
| Accounts payable, trade | Accounts payable, trade | 7,850 | | | 1,692 | | Accounts payable, trade | 3,174 | | | 2,030 | |
| Accrued expenses and other current liabilities | Accrued expenses and other current liabilities | 94,925 | | | 106,731 | | Accrued expenses and other current liabilities | 74,204 | | | 75,095 | |
| | Current liabilities of discontinued operations | — | | | 1 | | |
| | Liabilities held for sale (Note 7) | | Liabilities held for sale (Note 7) | — | | | 2,909 | |
| Total current liabilities | Total current liabilities | 105,266 | | | 274,432 | | Total current liabilities | 79,878 | | | 82,534 | |
| Long-term debt | Long-term debt | 813,252 | | | 478,151 | | Long-term debt | 625,240 | | | 813,516 | |
| Operating lease liabilities | Operating lease liabilities | 92,557 | | | 96,165 | | Operating lease liabilities | 84,599 | | | 88,232 | |
| | Deferred income tax liabilities | Deferred income tax liabilities | 2,265 | | | 2,265 | | Deferred income tax liabilities | 7,369 | | | 6,783 | |
| Other non-current liabilities | Other non-current liabilities | 276 | | | 351 | | Other non-current liabilities | 338 | | | 308 | |
| Total liabilities | Total liabilities | 1,013,616 | | | 851,364 | | Total liabilities | 797,424 | | | 991,373 | |
| Commitments and contingencies (Note 13) | 0 | | 0 | |
| Commitments and contingencies (Note 14) | | Commitments and contingencies (Note 14) | |
| SHAREHOLDERS' EQUITY: | SHAREHOLDERS' EQUITY: | | | | SHAREHOLDERS' EQUITY: | | | |
| Preferred stock $.01 par value; 5,000,000 shares authorized; none issued or outstanding | — | | | — | | |
| Common stock $.01 par value; 50,000,000 shares authorized; 16,140,889 and 16,070,720 shares issued, respectively, and 12,785,423 and 13,095,149 shares outstanding, respectively | 161 | | | 161 | | |
| Preferred stock $0.01 par value; 5,000,000 shares authorized; none issued or outstanding | | Preferred stock $0.01 par value; 5,000,000 shares authorized; none issued or outstanding | — | | | — | |
| Common stock $0.01 par value; 50,000,000 shares authorized; 16,323,675 and 16,167,184 shares issued, respectively, and 12,968,209 and 12,811,718 shares outstanding, respectively | | Common stock $0.01 par value; 50,000,000 shares authorized; 16,323,675 and 16,167,184 shares issued, respectively, and 12,968,209 and 12,811,718 shares outstanding, respectively | 163 | | | 162 | |
| Additional paid-in capital | Additional paid-in capital | 1,162,714 | | | 1,242,794 | | Additional paid-in capital | 1,209,687 | | | 1,189,255 | |
| Accumulated deficit | Accumulated deficit | (546,211) | | | (571,794) | | Accumulated deficit | (701,957) | | | (715,299) | |
| Treasury stock; 3,355,466 and 2,975,571 shares, respectively | (266,178) | | | (223,169) | | |
| Treasury stock; 3,355,466 and 3,355,466 shares, respectively | | Treasury stock; 3,355,466 and 3,355,466 shares, respectively | (266,178) | | | (266,178) | |
| Total shareholders' equity | Total shareholders' equity | 350,486 | | | 447,992 | | Total shareholders' equity | 241,715 | | | 207,940 | |
| Total liabilities and shareholders' equity | Total liabilities and shareholders' equity | $ | 1,364,102 | | | $ | 1,299,356 | | Total liabilities and shareholders' equity | $ | 1,039,139 | | | $ | 1,199,313 | |
The accompanying notes to consolidated financial statements are an integral part of these statements.
LENDINGTREE, INC. AND SUBSIDIARIES
CONSOLIDATED STATEMENTS OF SHAREHOLDERS' EQUITY
(Unaudited)
| | | | | | Common Stock | | | | Treasury Stock | | | | Common Stock | | | | Treasury Stock |
| | | Total | | Number
of Shares | | Amount | | Additional
Paid-in
Capital | | Accumulated
Deficit | | Number
of Shares | | Amount | | Total | | Number
of Shares | | Amount | | Additional
Paid-in
Capital | | Accumulated
Deficit | | Number
of Shares | | Amount |
| | | (in thousands) | | (in thousands) |
| Balance as of December 31, 2021 | $ | 447,992 | | | 16,071 | | | $ | 161 | | | $ | 1,242,794 | | | $ | (571,794) | | | 2,976 | | | $ | (223,169) | | |
| Balance as of December 31, 2022 | | Balance as of December 31, 2022 | $ | 207,940 | | | 16,167 | | | $ | 162 | | | $ | 1,189,255 | | | $ | (715,299) | | | 3,355 | | | $ | (266,178) | |
| Net income and comprehensive income | | Net income and comprehensive income | 13,457 | | | — | | | — | | | — | | | 13,457 | | | — | | | — | |
| Non-cash compensation | | Non-cash compensation | 11,274 | | | — | | | — | | | 11,274 | | | — | | | — | | | — | |
| | Issuance of common stock for stock options, restricted stock awards and restricted stock units, net of withholding taxes | | Issuance of common stock for stock options, restricted stock awards and restricted stock units, net of withholding taxes | (1,693) | | | 98 | | | 1 | | | (1,694) | | | — | | | — | | | — | |
| | Other | | Other | 1 | | | — | | | — | | | 1 | | | — | | | — | | | — | |
| Balance as of March 31, 2023 | | Balance as of March 31, 2023 | $ | 230,979 | | | 16,265 | | | $ | 163 | | | $ | 1,198,836 | | | $ | (701,842) | | | 3,355 | | | $ | (266,178) | |
| Net income and comprehensive income | Net income and comprehensive income | (10,826) | | | — | | | — | | | — | | | (10,826) | | | — | | | — | | Net income and comprehensive income | (115) | | | — | | | — | | | — | | | (115) | | | — | | | — | |
| Non-cash compensation | Non-cash compensation | 15,080 | | | — | | | — | | | 15,080 | | | — | | | — | | | — | | Non-cash compensation | 10,199 | | | — | | | — | | | 10,199 | | | — | | | — | | | — | |
| Purchase of treasury stock | Purchase of treasury stock | (43,009) | | | — | | | — | | | — | | | — | | | 379 | | | (43,009) | | Purchase of treasury stock | — | | | — | | | — | | | — | | | — | | | — | | | — | |
| Issuance of common stock for stock options, restricted stock awards and restricted stock units, net of withholding taxes | (3,086) | | | 49 | | | — | | | (3,086) | | | — | | | — | | | — | | |
| Cumulative effect adjustment due to ASU 2020-06 | (65,303) | | | — | | | — | | | (109,750) | | | 44,447 | | | — | | | — | | |
| | Balance as of March 31, 2022 | $ | 340,848 | | | 16,120 | | $ | 161 | | | $ | 1,145,038 | | | $ | (538,173) | | | 3,355 | | $ | (266,178) | | |
| Net loss and comprehensive loss | (8,038) | | | — | | | — | | | — | | | (8,038) | | | — | | | — | | |
| Non-cash compensation | 17,335 | | | — | | | — | | | 17,335 | | | — | | | — | | | — | | |
| | Issuance of common stock for stock options, employee stock purchase plan, restricted stock awards and restricted stock units, net of withholding taxes | Issuance of common stock for stock options, employee stock purchase plan, restricted stock awards and restricted stock units, net of withholding taxes | 341 | | | 21 | | | — | | | 341 | | | — | | | — | | | — | | Issuance of common stock for stock options, employee stock purchase plan, restricted stock awards and restricted stock units, net of withholding taxes | 652 | | | 59 | | | — | | | 652 | | | — | | | — | | | — | |
| Other | Other | — | | | — | | | — | | | — | | | — | | | — | | | — | | Other | — | | | — | | | — | | | — | | | — | | | — | | | — | |
| Balance as of June 30, 2022 | $ | 350,486 | | | 16,141�� | | | $ | 161 | | | $ | 1,162,714 | | | $ | (546,211) | | | 3,355 | | | $ | (266,178) | | |
| Balance as of June 30, 2023 | | Balance as of June 30, 2023 | $ | 241,715 | | | 16,324 | | | $ | 163 | | | $ | 1,209,687 | | | $ | (701,957) | | | 3,355 | | | $ | (266,178) | |
|
| | | | | | Common Stock | | | | Treasury Stock | | | | Common Stock | | | | Treasury Stock |
| | | Total | | Number
of Shares | | Amount | | Additional
Paid-in
Capital | | Accumulated
Deficit | | Number
of Shares | | Amount | | Total | | Number
of Shares | | Amount | | Additional
Paid-in
Capital | | Accumulated
Deficit | | Number
of Shares | | Amount |
| | | (in thousands) | | (in thousands) |
| Balance as of December 31, 2020 | $ | 364,761 | | | 15,766 | | | $ | 158 | | | $ | 1,188,673 | | | $ | (640,909) | | | 2,641 | | | $ | (183,161) | | |
| Balance as of December 31, 2021 | | Balance as of December 31, 2021 | $ | 447,992 | | | 16,071 | | | $ | 161 | | | $ | 1,242,794 | | | $ | (571,794) | | | 2,976 | | | $ | (223,169) | |
| Net loss and comprehensive loss | | Net loss and comprehensive loss | (10,826) | | | — | | | — | | | — | | | (10,826) | | | — | | | — | |
| Non-cash compensation | | Non-cash compensation | 15,080 | | | — | | | — | | | 15,080 | | | — | | | — | | | — | |
| Purchase of treasury stock | | Purchase of treasury stock | (43,009) | | | — | | | — | | | — | | | — | | | 379 | | | (43,009) | |
| Issuance of common stock for stock options, restricted stock awards and restricted stock units, net of withholding taxes | | Issuance of common stock for stock options, restricted stock awards and restricted stock units, net of withholding taxes | (3,086) | | | 49 | | | — | | | (3,086) | | | — | | | — | | | — | |
| Cumulative effect adjustment due to ASU 2020-06 | | Cumulative effect adjustment due to ASU 2020-06 | (65,303) | | | — | | | — | | | (109,750) | | | 44,447 | | | — | | | — | |
| | Balance as of March 31, 2022 | | Balance as of March 31, 2022 | $ | 340,848 | | | 16,120 | | $ | 161 | | | $ | 1,145,038 | | | $ | (538,173) | | | 3,355 | | $ | (266,178) | |
| Net income and comprehensive income | Net income and comprehensive income | 19,049 | | | — | | | — | | | — | | | 19,049 | | | — | | | — | | Net income and comprehensive income | (8,038) | | | — | | | — | | | — | | | (8,038) | | | — | | | — | |
| Non-cash compensation | Non-cash compensation | 16,436 | | | — | | | — | | | 16,436 | | | — | | | — | | | — | | Non-cash compensation | 17,335 | | | — | | | — | | | 17,335 | | | — | | | — | | | — | |
| | Issuance of common stock for stock options, restricted stock awards and restricted stock units, net of withholding taxes | (4,801) | | | 31 | | | (4,801) | | | — | | | — | | | — | | |
| Other | (2) | | | — | | | — | | | (2) | | | — | | | — | | | — | | |
| Balance as of March 31, 2021 | $ | 395,443 | | | 15,797 | | $ | 158 | | | $ | 1,200,306 | | | $ | (621,860) | | | 2,641 | | $ | (183,161) | | |
| Net income and comprehensive income | 6,601 | | | — | | | — | | | — | | | 6,601 | | | — | | | — | | |
| Non-cash compensation | 18,294 | | | — | | | — | | | 18,294 | | | — | | | — | | | — | | |
| | Purchase of treasury stock | | Purchase of treasury stock | — | | | — | | | — | | | — | | | — | | | — | | | — | |
| Issuance of common stock for stock options, restricted stock awards and restricted stock units, net of withholding taxes | Issuance of common stock for stock options, restricted stock awards and restricted stock units, net of withholding taxes | 30 | | | 159 | | | 2 | | | 28 | | | — | | | — | | | — | | Issuance of common stock for stock options, restricted stock awards and restricted stock units, net of withholding taxes | 341 | | | 21 | | | — | | | 341 | | | — | | | — | | | — | |
| | Balance as of June 30, 2021 | $ | 420,368 | | | 15,956 | | | $ | 160 | | | $ | 1,218,628 | | | $ | (615,259) | | | 2,641 | | | $ | (183,161) | | |
| Balance as of June 30, 2022 | | Balance as of June 30, 2022 | $ | 350,486 | | | 16,141 | | | $ | 161 | | | $ | 1,162,714 | | | $ | (546,211) | | | 3,355 | | | $ | (266,178) | |
|
The accompanying notes to consolidated financial statements are an integral part of these statements.
LENDINGTREE, INC. AND SUBSIDIARIES
CONSOLIDATED STATEMENTS OF CASH FLOWS
(Unaudited)
| | | | Six Months Ended
June 30, | | Six Months Ended
June 30, |
| | | 2022 | | 2021 | | 2023 | | 2022 |
| | | (in thousands) | | (in thousands) |
| Cash flows from operating activities attributable to continuing operations: | | | | |
| Net (loss) income and comprehensive (loss) income | $ | (18,864) | | | $ | 25,650 | | |
| Less: Loss from discontinued operations, net of tax | 3 | | | 3,462 | | |
| Net (loss) income from continuing operations | (18,861) | | | 29,112 | | |
| Adjustments to reconcile net (loss) income from continuing operations to net cash provided by operating activities attributable to continuing operations: | | |
| Cash flows from operating activities: | | Cash flows from operating activities: | | | |
| Net income (loss) and comprehensive income (loss) | | Net income (loss) and comprehensive income (loss) | $ | 13,342 | | | $ | (18,864) | |
| Adjustments to reconcile net income (loss) to net cash provided by operating activities: | | Adjustments to reconcile net income (loss) to net cash provided by operating activities: | |
| Loss on impairments and disposal of assets | Loss on impairments and disposal of assets | 3,427 | | | 1,400 | | Loss on impairments and disposal of assets | 5,167 | | | 3,427 | |
| Amortization of intangibles | Amortization of intangibles | 14,992 | | | 22,622 | | Amortization of intangibles | 4,031 | | | 14,992 | |
| Depreciation | Depreciation | 9,750 | | | 8,161 | | Depreciation | 9,479 | | | 9,750 | |
| Non-cash compensation expense | Non-cash compensation expense | 32,415 | | | 34,730 | | Non-cash compensation expense | 21,473 | | | 32,415 | |
| Deferred income taxes | Deferred income taxes | (2,026) | | | (455) | | Deferred income taxes | 586 | | | (2,026) | |
| Change in fair value of contingent consideration | — | | | (8,053) | | |
| Gain on investments | — | | | (40,072) | | |
| | Bad debt expense | Bad debt expense | 2,029 | | | 1,145 | | Bad debt expense | 1,894 | | | 2,029 | |
| Amortization of debt issuance costs | Amortization of debt issuance costs | 4,454 | | | 2,547 | | Amortization of debt issuance costs | 2,736 | | | 4,454 | |
| | Write-off of previously-capitalized debt issuance costs | | Write-off of previously-capitalized debt issuance costs | 2,373 | | | — | |
| Amortization of debt discount | Amortization of debt discount | 1,475 | | | 14,670 | | Amortization of debt discount | — | | | 1,475 | |
| | Reduction in carrying amount of ROU asset, offset by change in operating lease liabilities | Reduction in carrying amount of ROU asset, offset by change in operating lease liabilities | (333) | | | 11,079 | | Reduction in carrying amount of ROU asset, offset by change in operating lease liabilities | (1,923) | | | (333) | |
| Gain on settlement of convertible debt | | Gain on settlement of convertible debt | (34,308) | | | — | |
| Loss on impairment of investments | | Loss on impairment of investments | 1,440 | | | — | |
| Changes in current assets and liabilities: | Changes in current assets and liabilities: | | Changes in current assets and liabilities: | |
| Accounts receivable | Accounts receivable | (19,812) | | | (35,381) | | Accounts receivable | 6,809 | | | (19,812) | |
| Prepaid and other current assets | Prepaid and other current assets | (5,593) | | | (680) | | Prepaid and other current assets | 280 | | | (5,593) | |
| Accounts payable, accrued expenses and other current liabilities | Accounts payable, accrued expenses and other current liabilities | (5,223) | | | 3,845 | | Accounts payable, accrued expenses and other current liabilities | (4,337) | | | (5,226) | |
| | Income taxes receivable | Income taxes receivable | (293) | | | 10,322 | | Income taxes receivable | (227) | | | (293) | |
| Other, net | Other, net | (302) | | | (412) | | Other, net | (591) | | | (302) | |
| Net cash provided by operating activities attributable to continuing operations | 16,099 | | | 54,580 | | |
| Cash flows from investing activities attributable to continuing operations: | | |
| Net cash provided by operating activities | | Net cash provided by operating activities | 28,224 | | | 16,093 | |
| Cash flows from investing activities: | | Cash flows from investing activities: | |
| Capital expenditures | Capital expenditures | (6,346) | | | (23,585) | | Capital expenditures | (4,853) | | | (6,346) | |
| | Equity investment | (16,440) | | | (1,180) | | |
| Equity investments | | Equity investments | — | | | (16,440) | |
| | Net cash used in investing activities attributable to continuing operations | (22,786) | | | (24,765) | | |
| Cash flows from financing activities attributable to continuing operations: | | |
| Net cash used in investing activities | | Net cash used in investing activities | (4,853) | | | (22,786) | |
| Cash flows from financing activities: | | Cash flows from financing activities: | |
| Proceeds from term loan | Proceeds from term loan | 250,000 | | | — | | Proceeds from term loan | — | | | 250,000 | |
| Repayment of 0.625% Convertible Senior Notes | (169,659) | | | — | | |
| Repayment of term loan | | Repayment of term loan | (1,250) | | | — | |
| | Payments related to net-share settlement of stock-based compensation, net of proceeds from exercise of stock options | Payments related to net-share settlement of stock-based compensation, net of proceeds from exercise of stock options | (2,745) | | | (4,771) | | Payments related to net-share settlement of stock-based compensation, net of proceeds from exercise of stock options | (1,042) | | | (2,745) | |
| Purchase of treasury stock | Purchase of treasury stock | (43,009) | | | — | | Purchase of treasury stock | — | | | (43,009) | |
| | Repurchase of 0.50% Convertible Senior Notes | | Repurchase of 0.50% Convertible Senior Notes | (156,294) | | | — | |
| Repayment of 0.625% Convertible Senior Notes | | Repayment of 0.625% Convertible Senior Notes | — | | | (169,659) | |
| | Payment of debt costs | | Payment of debt costs | (1,079) | | | (3) | |
| | Payment of debt issuance costs | (3) | | | (168) | | |
| | Other financing activities | — | | | (31) | | |
| Net cash provided by (used in) financing activities attributable to continuing operations | 34,584 | | | (4,970) | | |
| Total cash provided by continuing operations | 27,897 | | | 24,845 | | |
| Discontinued operations: | | |
| Net cash (used in) provided by operating activities attributable to discontinued operations | (6) | | | 8,353 | | |
| Total cash (used in) provided by discontinued operations | (6) | | | 8,353 | | |
| Net increase in cash, cash equivalents, restricted cash and restricted cash equivalents | 27,891 | | | 33,198 | | |
| Net cash (used in) provided by financing activities | | Net cash (used in) provided by financing activities | (159,665) | | | 34,584 | |
| Net (decrease) increase in cash, cash equivalents, restricted cash and restricted cash equivalents | | Net (decrease) increase in cash, cash equivalents, restricted cash and restricted cash equivalents | (136,294) | | | 27,891 | |
| Cash, cash equivalents, restricted cash and restricted cash equivalents at beginning of period | Cash, cash equivalents, restricted cash and restricted cash equivalents at beginning of period | 251,342 | | | 170,049 | | Cash, cash equivalents, restricted cash and restricted cash equivalents at beginning of period | 298,969 | | | 251,342 | |
| Cash, cash equivalents, restricted cash and restricted cash equivalents at end of period | Cash, cash equivalents, restricted cash and restricted cash equivalents at end of period | $ | 279,233 | | | $ | 203,247 | | Cash, cash equivalents, restricted cash and restricted cash equivalents at end of period | $ | 162,675 | | | $ | 279,233 | |
|
The accompanying notes to consolidated financial statements are an integral part of these statements.
LENDINGTREE, INC. AND SUBSIDIARIES
NOTES TO CONSOLIDATED FINANCIAL STATEMENTS
(Unaudited)
NOTE 1—ORGANIZATION
Company Overview
LendingTree, Inc. is the parent of LT Intermediate Company, LLC, which holds all of the outstanding ownership interests of LendingTree, LLC, and LendingTree, LLC owns several companies (collectively, “LendingTree” or the “Company”).
LendingTree operates what it believes to be the leading online consumer platform that connects consumers with the choices they need to be confident in their financial decisions. The Company offers consumers tools and resources, including free credit scores, that facilitate comparison-shopping for mortgage loans, home equity loans and lines of credit, reverse mortgage loans, auto loans, credit cards, deposit accounts, personal loans, student loans, small business loans, insurance quotes, sales of insurance policies, and other related offerings. The Company primarily seeks to match in-market consumers with multiple providers on its marketplace who can provide them with competing quotes for loans, deposit products, insurance, or other related offerings they are seeking. The Company also serves as a valued partner to lenders and other providers seeking an efficient, scalable, and flexible source of customer acquisition with directly measurable benefits, by matching the consumer inquiries it generates with these providers.
The consolidated financial statements include the accounts of LendingTree and all its wholly-owned entities, except Home Loan Center, Inc. (“HLC”) subsequent to its bankruptcy filing on July 21, 2019 which resulted in the Company's loss of a controlling interest in HLC under applicable accounting standards.entities. Intercompany transactions and accounts have been eliminated. The HLC Bankruptcy case was closed on July 14, 2021. The HLC entity was legally dissolved in the first quarter of 2022. See Note 16—Discontinued Operations for additional information.
Discontinued Operations
The LendingTree Loans business, which consisted of originating various consumer mortgage loans through HLC (the “LendingTree Loans Business”), is presented as discontinued operations in the accompanying consolidated balance sheets, consolidated statements of operations and comprehensive income and consolidated statements of cash flows for all periods presented. The notes accompanying these consolidated financial statements reflect the Company's continuing operations and, unless otherwise noted, exclude information related to the discontinued operations. See Note 16—Discontinued Operations for additional information.
Basis of Presentation
The accompanying unaudited interim consolidated financial statements as of June 30, 20222023 and for the three and six months ended June 30, 20222023 and 2021,2022, respectively, have been prepared in accordance with accounting principles generally accepted in the United States of America (“GAAP”) for interim financial information and pursuant to the rules and regulations of the U.S. Securities and Exchange Commission (“SEC”). In the opinion of management, the unaudited interim consolidated financial statements have been prepared on the same basis as the audited financial statements, and include all adjustments, consisting only of normal recurring adjustments, necessary for the fair statement of the Company's financial position for the periods presented. The results for the three and six months ended June 30, 20222023 are not necessarily indicative of the results to be expected for the year ending December 31, 2022,2023, or any other period. The accompanying consolidated balance sheet as of December 31, 20212022 was derived from audited financial statements included in the Company's annual reportAnnual Report on Form 10-K for the year ended December 31, 20212022 (the “2021“2022 Annual Report”). The accompanying consolidated financial statements do not include all of the information and footnotes required by GAAP for annual financial statements. Accordingly, they should be read in conjunction with the audited financial statements and notes thereto included in the 20212022 Annual Report. The Company reclassified certain amounts in the prior year consolidated statements of operations and comprehensive income and consolidated statement of cash flows to be consistent with the current year presentation.
NOTE 2—SIGNIFICANT ACCOUNTING POLICIES
Accounting Estimates
Management is required to make certain estimates and assumptions during the preparation of the consolidated financial statements in accordance with GAAP. These estimates and assumptions impact the reported amount of assets and liabilities and disclosures of contingent assets and liabilities as of the date of the consolidated financial statements. They also impact the reported amount of net earnings during any period. Actual results could differ from those estimates.
LENDINGTREE, INC. AND SUBSIDIARIES
NOTES TO CONSOLIDATED FINANCIAL STATEMENTS (Continued)
Significant estimates underlying the accompanying consolidated financial statements including discontinued operations, include: the recoverability of long-lived assets, goodwill and intangible assets; the determination of income taxes payable and deferred income taxes, including related valuation allowances; fair value of assets acquired in a business combination; contingent consideration related to business combinations; litigation accruals; contract assets; various other allowances, reserves and accruals; assumptions related to the determination of stock-based compensation; and the determination of right-of-use assets and lease liabilities.
The Company considered the impact of the current economic conditions, including interest rates, inflation, and the COVID-19 pandemic on the assumptions and estimates used when preparing its consolidated financial statements including, but not limited to, the allowance for doubtful accounts, valuation allowances, contract asset, and contingent consideration.the recoverability of long-lived assets, goodwill and intangible assets. These assumptions and estimates may change as new events occur and additional
LENDINGTREE, INC. AND SUBSIDIARIES
NOTES TO CONSOLIDATED FINANCIAL STATEMENTS (Continued)
information is obtained. If economic conditions caused by the COVID-19 pandemic do not recover as currently estimated by management,worsen, such future changes may have an adverse impact on the Company's results of operations, financial position and liquidity.
Certain Risks and Concentrations
LendingTree's business is subject to certain risks and concentrations including dependence on third-party technology providers, exposure to risks associated with online commerce security and credit card fraud.
Financial instruments, which potentially subject the Company to concentration of credit risk at June 30, 2022,2023, consist primarily of cash and cash equivalents and accounts receivable, as disclosed in the consolidated balance sheet. Cash and cash equivalents are in excess of Federal Deposit Insurance Corporation insurance limits, but are maintained with quality financial institutions of high credit. The Company requires certain Network Partners to maintain security deposits with the Company, which, in the event of non-payment, would be applied against any accounts receivable outstanding.
Due to the nature of the mortgage lending industry, interest rate fluctuations may negatively impact future revenue from the Company's marketplace.
Lenders and lead purchasers participating on the Company's marketplace can offer their products directly to consumers through brokers, mass marketing campaigns or through other traditional methods of credit distribution. These lenders and lead purchasers can also offer their products online, either directly to prospective borrowers, through one or more online competitors, or both. If a significant number of potential consumers are able to obtain loans and other products from Network Partners without utilizing the Company's services, the Company's ability to generate revenue may be limited. Because the Company does not have exclusive relationships with the Network Partners whose loans and other financial products are offered on its online marketplace, consumers may obtain offers from these Network Partners without using its service.
Other than a support services office in India, the Company's operations are geographically limited to and dependent upon the economic condition of the United States.
Litigation Settlements and Contingencies
Litigation settlements and contingencies consists of expenses related to actual or anticipated litigation settlements.
Recently Adopted Accounting Pronouncements
In August 2020, the FASBFinancial Accounting Standards Board issued ASUAccounting Standards Update ("ASU") 2020-06, which simplifies the accounting for convertible instruments, amends the derivatives scope exception guidance for contracts in an entity’s own equity, and amends the related earnings-per-share guidance. Under the new guidance, the embedded conversion features are no longer separated from the host contract for convertible instruments with conversion features that are not required to be accounted for as derivatives under Topic 815, or that do not result in substantial premiums accounted for as paid-in capital. As a result, a convertible debt instrument will be accounted for as a single liability measured at its amortized cost, as long as no other features require bifurcation and recognition as derivatives. Additionally, the new guidance requires the if-converted method to be applied for all convertible instruments when calculating diluted earnings per share. This ASU is effective for annual and interim reporting periods beginning after December 15, 2021, with early adoption permitted for periods beginning after December 15, 2020. An entity may adopt the amendments through either a modified retrospective method of transition or a fully retrospective method of transition.
The Company adopted ASU 2020-06 on January 1, 2022 using the modified retrospective transition approach and recognized the cumulative effect of initially applying ASU 2020-06 as a $44.4 million adjustment to the opening balance of accumulated deficit, comprised of $60.8 million for the interest adjustment, net of $16.4 million for the related tax impacts. The recombination of the equity conversion component of ourthe Company's convertible debt remaining outstanding caused a reduction in
LENDINGTREE, INC. AND SUBSIDIARIES
NOTES TO CONSOLIDATED FINANCIAL STATEMENTS (Continued)
additional paid-in capital and an increase in deferred income tax assets. The removal of the remaining debt discounts recorded for this previous separation had the effect of increasing our net debt balance. ASU 2020-06 also requires the dilutive impact of convertible debt instruments to utilize the if-converted method when calculating diluted earnings per share and the result is more dilutive. The prior period consolidated financial statements have not been retrospectively adjusted and continue to be reported under the accounting standards in effect for those periods. See Note 12—Debt for further information.
The cumulative effect of the changes made to the consolidated January 1, 2022 balance sheet for the adoption of ASU 2020-06 were as follows (in thousands):
| | | | | | | | | | | |
| December 31, 2021 | Adjustments due to
ASU 2020-06 | January 1, 2022 |
| Assets: | | | |
| Deferred income tax assets | $ | 87,581 | | $ | 23,979 | | $ | 111,560 | |
| | | |
| Liabilities: | | | |
| Current portion of long-term debt | $ | 166,008 | | $ | 3,213 | | $ | 169,221 | |
| Long-term debt | 478,151 | | 86,069 | | 564,220 | |
| | | |
| Shareholders' equity: | | | |
| Additional paid-in capital | $ | 1,242,794 | | $ | (109,750) | | $ | 1,133,044 | |
| Accumulated deficit | (571,794) | | 44,447 | | (527,347) | |
The adoption of ASU 2020-06 did not impact ourthe Company's cash flows or compliance with debt covenants.
Recently Issued Accounting Pronouncements
The Company has considered the applicability of recently issued accounting pronouncements by the Financial Accounting Standards Board and have determined that they are either not applicable or are not expected to have a material impact on ourthe Company's consolidated financial statements.
LENDINGTREE, INC. AND SUBSIDIARIES
NOTES TO CONSOLIDATED FINANCIAL STATEMENTS (Continued)
NOTE 3—REVENUE
Revenue is as follows (in thousands):
| | | Three Months Ended
June 30, | | Six Months Ended
June 30, | | Three Months Ended
June 30, | | Six Months Ended
June 30, |
| | 2022 | | 2021 | | 2022 | | 2021 | | 2023 | | 2022 | | 2023 | | 2022 |
| Home | Home | $ | 73,938 | | | $ | 104,861 | | | $ | 175,882 | | | $ | 232,986 | | Home | $ | 41,563 | | | $ | 73,938 | | | $ | 85,238 | | | $ | 175,882 | |
| Credit cards | Credit cards | 27,306 | | | 22,424 | | | 57,128 | | | 40,061 | | Credit cards | 21,083 | | | 27,306 | | | 39,371 | | | 57,128 | |
| Personal loans | Personal loans | 42,298 | | | 25,208 | | | 77,508 | | | 40,076 | | Personal loans | 28,137 | | | 42,298 | | | 51,736 | | | 77,508 | |
| Other Consumer | Other Consumer | 36,540 | | | 28,044 | | | 72,576 | | | 53,446 | | Other Consumer | 33,257 | | | 36,540 | | | 71,079 | | | 72,576 | |
| Total Consumer | Total Consumer | 106,144 | | | 75,676 | | | 207,212 | | | 133,583 | | Total Consumer | 82,477 | | | 106,144 | | | 162,186 | | | 207,212 | |
| Insurance | Insurance | 81,756 | | | 89,263 | | | 161,794 | | | 175,877 | | Insurance | 58,398 | | | 81,756 | | | 135,480 | | | 161,794 | |
| Other | Other | 85 | | | 214 | | | 213 | | | 318 | | Other | 15 | | | 85 | | | 57 | | | 213 | |
| Total revenue | Total revenue | $ | 261,923 | | | $ | 270,014 | | | $ | 545,101 | | | $ | 542,764 | | Total revenue | $ | 182,453 | | | $ | 261,923 | | | $ | 382,961 | | | $ | 545,101 | |
The Company derives its revenue primarily from match fees and closing fees. Revenue is recognized when performance obligations under the terms of a contract with a customer are satisfied and promised services have transferred to the customer. The Company's services are generally transferred to the customer at a point in time.
Revenue from Home products is primarily generated from upfront match fees paid by mortgage Network Partners that receive a loan request, and in some cases upfront fees for clicks or call transfers. Match fees and upfront fees for clicks and call transfers are earned through the delivery of loan requests that originated through the Company's websites or affiliates. The
LENDINGTREE, INC. AND SUBSIDIARIES
NOTES TO CONSOLIDATED FINANCIAL STATEMENTS (Continued)
Company recognizes revenue at the time a loan request is delivered to the customer, provided that no significant obligations remain. The Company's contractual right to the match fee consideration is contemporaneous with the satisfaction of the performance obligation to deliver a loan request to the customer.
Revenue from Consumer products is generated by match and other upfront fees for clicks or call transfers, as well as from closing fees, approval fees and upfront service and subscription fees. Closing fees are derived from lenders on certain auto loans, business loans, personal loans, and student loans when the lender funds a loan with the consumer. Approval fees are derived from credit card issuers when the credit card consumer receives card approval from the credit card issuer. Upfront service fees and subscription fees are derived from consumers in the Company's credit services product. Upfront fees paid by consumers are recognized as revenue over the estimated time the consumer will remain a customer and receive services. Subscription fees are recognized over the period a consumer is receiving services. As of the second quarter of 2023, the Company discontinued providing its credit services product to consumers and no longer receives upfront and subscription fees.
The Company recognizes revenue on closing fees and approval fees at the point when a loan request or a credit card consumer is delivered to the customer. The Company's contractual right to closing fees and approval fees is not contemporaneous with the satisfaction of the performance obligation to deliver a loan request or a credit card consumer to the customer. As such, the Company records a contract asset at each reporting period-end related to the estimated variable consideration on closing fees and approval fees for which the Company has satisfied the related performance obligation but are still pending the loan closing or credit card approval before the Company has a contractual right to payment. This estimate is based on the Company's historical closing rates and historical time between when a consumer request for a loan or credit card is delivered to the lender or card issuer and when the loan is closed by the lender or approved by the card issuer.
Revenue from the Company's Insurance products is primarily generated from upfront match fees and upfront fees for website clicks or fees for calls. Match fees and upfront fees for clicks and call transfers are earned through the delivery of consumer requests that originated through the Company's websites or affiliates. The Company recognizes revenue at the time a consumer request is delivered to the customer, provided that no significant obligations remain. The Company's contractual right to the match fee consideration is contemporaneous with the satisfaction of the performance obligation to deliver a consumer request to the customer.
The contract asset recorded within prepaid and other current assets on the consolidated balance sheets related to estimated variable consideration was $11.7$13.5 million and $9.1$12.2 million at June 30, 20222023 and December 31, 2021,2022, respectively.
LENDINGTREE, INC. AND SUBSIDIARIES
NOTES TO CONSOLIDATED FINANCIAL STATEMENTS (Continued)
The contract liability recorded within accrued expenses and other current liabilities on the consolidated balance sheets related to upfront fees paid by consumers was $0.9 million and $0.8 million at June 30, 2022 and December 31, 2021, respectively.2022. During the second quarter and first six months of 2023, the Company recognized revenue of $0.1 million and $0.9 million, respectively, that was included in the contract liability balance at December 31, 2022. During the second quarter and first six months of 2022, the Company recognized revenue of $0.1 million and $0.8 million respectively, that was included in the contract liability balance at December 31, 2021. During the second quarter and first six months of 2021, the Company recognized revenue of $0.1 million and $0.7 million, respectively, that was included in the contract liability balance at December 31, 2020.
Revenue recognized in any reporting period includes estimated variable consideration for which the Company has satisfied the related performance obligations but are still pending the occurrence or non-occurrence of a future event outside the Company's control (such as lenders providing loans to consumers or credit card approvals of consumers) before the Company has a contractual right to payment. The Company recognized increasesdecreases to such revenue from prior periods. This increasedecrease was $0.9 million in the second quarter of 2023, and not material in the second quarter of 2022, and was $0.1 million in the second quarter of 2021.2022.
NOTE 4—CASH AND RESTRICTED CASH
Total cash, cash equivalents, restricted cash and restricted cash equivalents consist of the following (in thousands):
| | | June 30,
2022 | | December 31,
2021 | | June 30,
2023 | | December 31,
2022 |
| Cash and cash equivalents | Cash and cash equivalents | $ | 279,108 | | | $ | 251,231 | | Cash and cash equivalents | $ | 162,641 | | | $ | 298,845 | |
| Restricted cash and cash equivalents | Restricted cash and cash equivalents | 125 | | | 111 | | Restricted cash and cash equivalents | 34 | | | 124 | |
| Total cash, cash equivalents, restricted cash and restricted cash equivalents | Total cash, cash equivalents, restricted cash and restricted cash equivalents | $ | 279,233 | | | $ | 251,342 | | Total cash, cash equivalents, restricted cash and restricted cash equivalents | $ | 162,675 | | | $ | 298,969 | |
NOTE 5—ALLOWANCE FOR DOUBTFUL ACCOUNTS
Accounts receivable are stated at amounts due from customers, net of an allowance for doubtful accounts.
LENDINGTREE, INC. AND SUBSIDIARIES
NOTES TO CONSOLIDATED FINANCIAL STATEMENTS (Continued)
The Company determines its allowance for doubtful accounts by considering a number of factors, including the length of time accounts receivable are past due, previous loss history, current and expected economic conditions and the specific customer's current and expected ability to pay its obligation. Accounts receivable are considered past due when they are outstanding longer than the contractual payment terms. Accounts receivable are written off when management deems them uncollectible.
A reconciliation of the beginning and ending balances of the allowance for doubtful accounts is as follows (in thousands):
| | | | Three Months Ended
June 30, | | Six Months Ended
June 30, | | Three Months Ended
June 30, | | Six Months Ended
June 30, |
| | | 2022 | | 2021 | | 2022 | | 2021 | | 2023 | | 2022 | | 2023 | | 2022 |
| Balance, beginning of the period | Balance, beginning of the period | $ | 1,803 | | | $ | 1,429 | | | $ | 1,456 | | | $ | 1,402 | | Balance, beginning of the period | $ | 2,688 | | | $ | 1,803 | | | $ | 2,317 | | | $ | 1,456 | |
| Charges to earnings | Charges to earnings | 1,179 | | | 629 | | | 2,029 | | | 1,145 | | Charges to earnings | 931 | | | 1,179 | | | 1,894 | | | 2,029 | |
| Write-off of uncollectible accounts receivable | Write-off of uncollectible accounts receivable | (682) | | | (585) | | | (1,185) | | | (1,079) | | Write-off of uncollectible accounts receivable | (1,010) | | | (682) | | | (1,973) | | | (1,185) | |
| Recoveries collected | — | | | — | | | — | | | 5 | | |
| | Assets held for sale (Note 7) | | Assets held for sale (Note 7) | — | | | — | | | 371 | | | — | |
| Balance, end of the period | Balance, end of the period | $ | 2,300 | | | $ | 1,473 | | | $ | 2,300 | | | $ | 1,473 | | Balance, end of the period | $ | 2,609 | | | $ | 2,300 | | | $ | 2,609 | | | $ | 2,300 | |
LENDINGTREE, INC. AND SUBSIDIARIES
NOTES TO CONSOLIDATED FINANCIAL STATEMENTS (Continued)
NOTE 6—GOODWILL AND INTANGIBLE ASSETS
The balance of goodwill, net and intangible assets, net is as follows (in thousands):
| | | | June 30,
2022 | | December 31,
2021 | | June 30,
2023 | | December 31,
2022 |
| Goodwill | Goodwill | $ | 903,227 | | | $ | 903,227 | | Goodwill | $ | 903,227 | | | $ | 903,227 | |
| Accumulated impairment losses | Accumulated impairment losses | (483,088) | | | (483,088) | | Accumulated impairment losses | (483,088) | | | (483,088) | |
| Net goodwill | Net goodwill | $ | 420,139 | | | $ | 420,139 | | Net goodwill | $ | 420,139 | | | $ | 420,139 | |
| | Intangible assets with indefinite lives | Intangible assets with indefinite lives | $ | 10,142 | | | $ | 10,142 | | Intangible assets with indefinite lives | $ | 10,142 | | | $ | 10,142 | |
| Intangible assets with definite lives, net | Intangible assets with definite lives, net | 60,630 | | | 75,621 | | Intangible assets with definite lives, net | 44,142 | | | 48,173 | |
| Total intangible assets, net | Total intangible assets, net | $ | 70,772 | | | $ | 85,763 | | Total intangible assets, net | $ | 54,284 | | | $ | 58,315 | |
Goodwill and Indefinite-Lived Intangible Assets
The Company's goodwill at each of June 30, 20222023 and December 31, 20212022 consists of $59.3 million associated with the Home segment, $166.1 million associated with the Consumer segment, and $194.7 million associated with the Insurance segment.
At June 30, 2022, the Company assessed the qualitative factors in its impairment testing of goodwill and determined that the effects of the challenging interest rate environment, consumer price inflation, and the decline in the Company's market capitalization required a quantitative impairment test be performed. The quantitative goodwill impairment test found that the fair value of each reporting unit exceeded its carrying amount, indicating no goodwill impairment. The Company will monitor the recovery of the Insurance reporting unit and the Mortgage reporting unit. The property and casualty auto industry is experiencing challenges caused by inflation, supply chain challenges, and rising severity and frequency of claims. Additionally, the significant increase in mortgage interest rates have had a negative impact on the Mortgage reporting unit. Changes in the timing of the recovery compared to current expectations could cause an impairment to the Insurance or Mortgage reporting unit.
Intangible assets with indefinite lives relate to the Company's trademarks.
Intangible Assets with Definite Lives
Intangible assets with definite lives relate to the following (in thousands):
| | | | | | | | | | | | | | | | | |
| | Cost | | Accumulated
Amortization | | Net |
| | | | | |
| Customer lists | 77,300 | | | (33,830) | | | 43,470 | |
| Trademarks and tradenames | 9,100 | | | (8,428) | | | 672 | |
| | | | | |
| Balance at June 30, 2023 | $ | 86,400 | | | $ | (42,258) | | | $ | 44,142 | |
| | | | | | | | | | | | | | | | | |
| | Cost | | Accumulated
Amortization | | Net |
| | | | | |
| Customer lists | $ | 77,300 | | | $ | (30,775) | | | $ | 46,525 | |
| Trademarks and tradenames | 10,100 | | | (8,452) | | | 1,648 | |
| | | | | |
| Balance at December 31, 2022 | $ | 87,400 | | | $ | (39,227) | | | $ | 48,173 | |
LENDINGTREE, INC. AND SUBSIDIARIES
NOTES TO CONSOLIDATED FINANCIAL STATEMENTS (Continued)
Intangible Assets with Definite Lives
Intangible assets with definite lives relate to the following (in thousands):
| | | | | | | | | | | | | | | | | |
| | Cost | | Accumulated
Amortization | | Net |
| Technology | $ | 83,500 | | | $ | (75,187) | | | $ | 8,313 | |
| Customer lists | 77,300 | | | (27,721) | | | 49,579 | |
| Trademarks and tradenames | 11,700 | | | (8,962) | | | 2,738 | |
| | | | | |
| Balance at June 30, 2022 | $ | 172,500 | | | $ | (111,870) | | | $ | 60,630 | |
| | | | | | | | | | | | | | | | | |
| | Cost | | Accumulated
Amortization | | Net |
| Technology | $ | 87,700 | | | $ | (69,369) | | | $ | 18,331 | |
| Customer lists | 77,300 | | | (24,668) | | | 52,632 | |
| Trademarks and tradenames | 11,700 | | | (7,767) | | | 3,933 | |
| Website content | 26,100 | | | (25,375) | | | 725 | |
| Balance at December 31, 2021 | $ | 202,800 | | | $ | (127,179) | | | $ | 75,621 | |
Amortization of intangible assets with definite lives is computed on a straight-line basis and, based on balances as of June 30, 2022,2023, future amortization is estimated to be as follows (in thousands):
| | | | | |
| | Amortization Expense |
| Remainder of current year | $ | 10,264 | |
Year ending December 31, 2023 | 8,6023,664 | |
| Year ending December 31, 2024 | 6,7475,889 | |
| Year ending December 31, 2025 | 6,2595,830 | |
| Year ending December 31, 2026 | 5,504 | |
| Year ending December 31, 2027 | 5,198 | |
| Thereafter | 23,25418,057 | |
| Total intangible assets with definite lives, net | $ | 60,63044,142 | |
See Note 7—Assets and Liabilities Held for Sale for intangible assets with definite lives classified as held for sale.
NOTE 7—EQUITY INVESTMENTASSETS AND LIABILITIES HELD FOR SALE
In Januarythe fourth quarter of 2022, the Company acquiredapproved a plan to sell its Ovation credit services business, an equity interestasset group associated with the Company's Consumer segment. The asset group was expected to be sold in EarnUp Inc. (“EarnUp”)2023 to an unrelated third party and is classified, at its carrying value, as current assets held for $15.0 million.sale and current liabilities held for sale in the consolidated balance sheet as of December 31, 2022.
In the first quarter of 2023, the third party withdrew the letter of intent to purchase the asset group held for sale. The company isCompany made the decision to close the Ovation credit services business. As a consumer-first mortgage payment platform that intelligently automates loan payment scheduling and helps consumers better manage their money and improve their financial well-being.
On February 28, 2020,result, the Company acquiredrecorded asset impairment charges of $4.2 million, of which $2.1 million related to intangible assets, $1.7 million related to property and equipment, and $0.4 million related to an equity interestoperating lease right-of-use asset.
The carrying value of the accounts receivable, prepaid and other assets, and other non-current assets previously held for sale, and the liabilities previously held for sale approximate their fair value and were no longer classified as assets and liabilities held for sale in Stash Financial, Inc. (“Stash”) for $80.0 million. On January 6, 2021, the Company acquired additional equity interest for $1.2 million. On October 18, 2021, the Company entered into a stock transfer agreement with third parties to sell a portion of its Stash equity securities for $46.3 million. The Company sold $35.3 million in October and closed on an additional $11.0 million in November 2021. The Company recorded a realized gain of $27.9 million based on the sale of Stash equity securities under the stock transfer agreement, which is included within other income on the consolidated statementbalance sheet as of operationsMarch 31, 2023.
The following table presents information related to the major classes of assets and comprehensive income. Stash is a consumer investing and banking platform. Stash brings together banking, investing, and financial services education into one seamless experience offering a full suiteliabilities that were classified as held for sale (in thousands):
| | | | | |
| December 31, 2022 |
| Accounts receivable, net of allowance | $ | 1,353 | |
| Prepaid and other current assets | 79 | |
| Property and equipment, net of accumulated depreciation of $1,102 | 1,665 | |
| Operating lease right-of-use assets | 436 | |
| Intangible assets, net of accumulated amortization of $3,857 | 2,143 | |
| Other non-current assets | 13 | |
| Total assets held for sale | $ | 5,689 | |
| |
| Accounts payable, trade | $ | 253 | |
| Accrued expenses and other current liabilities | 2,551 | |
| Operating lease liabilities | 105 | |
| Total liabilities held for sale | $ | 2,909 | |
LENDINGTREE, INC. AND SUBSIDIARIES
NOTES TO CONSOLIDATED FINANCIAL STATEMENTS (Continued)
NOTE 8—EQUITY INVESTMENT
The investments in equity securities do not have a readily determinable fair value and, upon their acquisition, the Company elected the measurement alternative to value its securities. The equity securities will be carried at cost less impairment, if any, and subsequently measured to fair value upon observable price changes in an orderly transaction for the identical or similar investments with any gains or losses recorded to the consolidated statement of operations and comprehensive income. In 2021,the second quarter of 2023, the Company recorded a net unrealized gainan impairment charge of $1.4 million on the investment in Stashone of $95.4 million as a result of an adjustment to the fair value of the Stash equity securities based on observable price changes, whichits investments. The impairment is included within other income on the consolidated statement of operations and comprehensive income.
LENDINGTREE, INC. AND SUBSIDIARIES
NOTES TO CONSOLIDATED FINANCIAL STATEMENTS (Continued)
As of June 30,December 31, 2022, there havehad been no impairments to the acquisition cost of the equity securities.
NOTE 8—9—ACCRUED EXPENSES AND OTHER CURRENT LIABILITIES
Accrued expenses and other current liabilities consist of the following (in thousands):
| | | | June 30,
2022 | | December 31,
2021 | | June 30,
2023 | | December 31,
2022 |
| Accrued advertising expense | Accrued advertising expense | $ | 57,532 | | | $ | 59,150 | | Accrued advertising expense | $ | 35,294 | | | $ | 37,703 | |
| Accrued compensation and benefits | Accrued compensation and benefits | 11,361 | | | 16,330 | | Accrued compensation and benefits | 10,497 | | | 11,444 | |
| Accrued professional fees | Accrued professional fees | 1,367 | | | 1,887 | | Accrued professional fees | 1,387 | | | 1,393 | |
| Customer deposits and escrows | Customer deposits and escrows | 7,338 | | | 7,546 | | Customer deposits and escrows | 7,459 | | | 7,273 | |
| Contribution to LendingTree Foundation | Contribution to LendingTree Foundation | — | | | 3,333 | | Contribution to LendingTree Foundation | — | | | 500 | |
| Current lease liabilities | Current lease liabilities | 8,758 | | | 8,595 | | Current lease liabilities | 8,777 | | | 8,513 | |
| Accrued restructuring and severance | | Accrued restructuring and severance | 2,608 | | | 304 | |
| Other | Other | 8,569 | | | 9,890 | | Other | 8,182 | | | 7,965 | |
| Total accrued expenses and other current liabilities | Total accrued expenses and other current liabilities | $ | 94,925 | | | $ | 106,731 | | Total accrued expenses and other current liabilities | $ | 74,204 | | | $ | 75,095 | |
See Note 7—Assets and Liabilities Held for Sale for accrued expenses and other current liabilities classified as held for sale.
NOTE 9—10—SHAREHOLDERS' EQUITY
Basic and diluted income per share was determined based on the following share data (in thousands):
| | | | | Three Months Ended
June 30, | | Six Months Ended
June 30, |
| | | | 2023 | | 2022 | | 2023 | | 2022 |
| | | | | Three Months Ended
June 30, | | Six Months Ended
June 30, | |
| | | 2022 | | 2021 | | 2022 | | 2021 | |
| Weighted average basic common shares | Weighted average basic common shares | 12,723 | | | 13,243 | | | 12,812 | | | 13,157 | | Weighted average basic common shares | 12,915 | | | 12,723 | | | 12,881 | | | 12,812 | |
| Effect of stock options | Effect of stock options | — | | | 394 | | | — | | | 523 | | Effect of stock options | — | | | — | | | 10 | | | — | |
| Effect of dilutive share awards | Effect of dilutive share awards | — | | | 72 | | | — | | | 103 | | Effect of dilutive share awards | — | | | — | | | 21 | | | — | |
| Effect of Convertible Senior Notes and warrants | — | | | 10 | | | — | | | 130 | | |
| | Weighted average diluted common shares | Weighted average diluted common shares | 12,723 | | | 13,719 | | | 12,812 | | | 13,913 | | Weighted average diluted common shares | 12,915 | | | 12,723 | | | 12,912 | | | 12,812 | |
|
For the second quarter of 2023, the Company was in a net loss position and, as a result, no potentially dilutive securities were included in the denominator for computing diluted loss per share, because the impact would have been anti-dilutive. Accordingly, the weighted average basic shares outstanding was used to compute loss per share. For the second quarter of 2023, the weighted average shares that were anti-dilutive, and therefore excluded from the calculation of diluted income per share, included options to purchase 1.2 million shares of common stock and 0.6 million restricted stock units. For the first six months of 2023, the weighted average shares that were anti-dilutive, and therefore excluded from the calculation of diluted income per share, included options to purchase 1.0 million shares of common stock and 0.5 million restricted stock units.
For the second quarter and first six months of 2022, the Company had losses from continuing operationswas in a net loss position and, as a result, no potentially dilutive securities were included in the denominator for computing diluted loss per share, because the impact would have been anti-dilutive. Accordingly, the weighted average basic shares outstanding was used to compute loss per share. Approximately 0.2 million shares related to potentially dilutive securities were excluded from the calculation of diluted loss per share for the second quarter and first six months of 2022 because their inclusion would have been anti-dilutive. For the second quarter of 2022, the weighted average shares that were anti-dilutive, and therefore excluded from the calculation of diluted income per
LENDINGTREE, INC. AND SUBSIDIARIES
NOTES TO CONSOLIDATED FINANCIAL STATEMENTS (Continued)
share, included options to purchase 1.0 million shares of common stock and 0.5 million restricted stock units. For the first six months of 2022, the weighted average shares that were anti-dilutive, and therefore excluded from the calculation of diluted income per share, included options to purchase 1.0 million shares of common stock and 0.4 million restricted stock units.
For the second quarter of 2021, the weighted average shares that were anti-dilutive, and therefore excluded from the calculation of diluted income per share, included options to purchase 0.9 million shares of common stock and 0.2 million restricted stock units. For the first six months of 2021, the weighted average shares that were anti-dilutive included options to purchase 0.4 million shares of common stock.
The convertible notes and the warrants issued by the Company could be converted into the Company’s common stock, subject to certain contingencies. See Note 12—13—Debt for additional information. On January 1, 2022, the Company adopted ASU 2020-06 using the modified retrospective method. Following the adoption, the if-converted method is used for diluted net income per share calculation of our convertible notes. Prior to the adoption of ASU 2020-06 the dilutive impact of the convertible notes was calculated using the treasury stock method. See Note 2—Significant Accounting Policies for additional information.
Approximately 0.8 million and 1.2 million shares related to the potentially dilutive shares of the Company's common stock associated with the 0.50% Convertible Senior Notes due July 15, 2025 were excluded from the calculation of diluted loss (income) per share for the second quarter and first six months of 2023, respectively, because their inclusion would have been anti-dilutive. Approximately 2.1 million shares related to the potentially dilutive shares of the Company's common stock associated with the 0.50% Convertible Senior Notes due July 15, 2025 and the 0.625% Convertible Senior Notes due June 1, 2022 were
LENDINGTREE, INC. AND SUBSIDIARIES
NOTES TO CONSOLIDATED FINANCIAL STATEMENTS (Continued)
excluded from the calculation of diluted loss per share for the second quarter and first six months of 2022 because their inclusion would have been anti-dilutive. Shares of the Company's stock associated with the warrants issued by the Company in 2020 were excluded from the calculation of diluted loss per share for the second quarter and first six months of 2023, and shares of the Company's stock associated with the warrants issued by the Company in 2017 and 2020 were excluded from the calculation of diluted loss per share for the second quarter and first six months of 2022 and 2021 as they were anti-dilutive since the strike price of the warrants was greater than the average market price of the Company's common stock during the relevant periods.
Shares of the Company's common stock associated with the 0.50% Convertible Senior Notes due July 15, 2025 were excluded from the calculation of diluted income per share for the second quarter and first six months of 2021 as they were anti-dilutive since the conversion price of the notes was greater than the average market price of the Company's common stock during the relevant periods.
The employee stock purchase plan did not have a material impact to the calculation of diluted shares.
Common Stock Repurchases
In each of February 2018 and February 2019, the board of directors authorized and the Company announced the repurchase of up to $100.0 million and $150.0 million, respectively, of LendingTree's common stock. During the first six months ended June 30,of 2023, the Company did not repurchase shares of its common stock. During the first six months of 2022, the Company purchasedrepurchased 379,895 shares of its common stock pursuant to thisthe stock repurchase program. At June 30, 2022,2023, approximately $96.7 million of the previous authorizations to repurchase common stock remain available.
NOTE 10—11—STOCK-BASED COMPENSATION
Non-cash compensation related to equity awards is included in the following line items in the accompanying consolidated statements of operations and comprehensive income (in thousands):
| | | | | | | | | | | | | | | | | | | | | | | |
| | Three Months Ended
June 30, | | Six Months Ended
June 30, |
| | 2022 | | 2021 | | 2022 | | 2021 |
| Cost of revenue | $ | 442 | | | $ | 463 | | | $ | 835 | | | $ | 860 | |
| Selling and marketing expense | 2,285 | | | 1,976 | | | 4,324 | | | 3,778 | |
| General and administrative expense | 11,873 | | | 13,254 | | | 21,473 | | | 25,425 | |
| Product development | 2,735 | | | 2,601 | | | 4,700 | | | 4,667 | |
| Restructuring and severance | — | | | — | | | 1,083 | | | — | |
| Total non-cash compensation | $ | 17,335 | | | $ | 18,294 | | | $ | 32,415 | | | $ | 34,730 | |
Stock Options
A summary of changes in outstanding stock options is as follows:
| | | | | | | | | | | | | | | | | | | | | | | |
| | Number of Options | | Weighted
Average
Exercise
Price | | Weighted
Average
Remaining
Contractual
Term | | Aggregate Intrinsic Value(a) |
| | | | (per option) | | (in years) | | (in thousands) |
| Options outstanding at January 1, 2022 | 676,293 | | | $ | 169.71 | | | | | |
Granted (b) | 154,664 | | | 104.63 | | | | | |
| Exercised | — | | | — | | | | | |
| Forfeited | (10,233) | | | 258.14 | | | | | |
| Expired | (1,327) | | | 281.86 | | | | | |
| Options outstanding at June 30, 2022 | 819,397 | | | 156.14 | | | 5.73 | | $ | 4,612 | |
| Options exercisable at June 30, 2022 | 494,026 | | | $ | 127.28 | | | 3.62 | | $ | 4,612 | |
(a)The aggregate intrinsic value represents the total pre-tax intrinsic value (the difference between the Company's closing stock price of $43.82 on the last trading day of the quarter ended June 30, 2022 and the exercise price, multiplied by the number of shares covered by in-the-money options) that would have been received by the option holder had the | | | | | | | | | | | | | | | | | | | | | | | |
| | Three Months Ended
June 30, | | Six Months Ended
June 30, |
| | 2023 | | 2022 | | 2023 | | 2022 |
| Cost of revenue | $ | 31 | | | $ | 442 | | | $ | 245 | | | $ | 835 | |
| Selling and marketing expense | 1,336 | | | 2,285 | | | 3,080 | | | 4,324 | |
| General and administrative expense | 6,550 | | | 11,873 | | | 13,893 | | | 21,473 | |
| Product development | 1,287 | | | 2,735 | | | 3,189 | | | 4,700 | |
| Restructuring and severance | 995 | | | — | | | 1,066 | | | 1,083 | |
| Total non-cash compensation | $ | 10,199 | | | $ | 17,335 | | | $ | 21,473 | | | $ | 32,415 | |
LENDINGTREE, INC. AND SUBSIDIARIES
NOTES TO CONSOLIDATED FINANCIAL STATEMENTS (Continued)
option holder exercised these options on June 30, 2022. The intrinsic value changes based on the market value of the Company's common stock.
(b)During the six months ended June 30, 2022, the Company granted stock options to certain employees with a weighted average grant date fair value per share of $53.75, calculated using the Black-Scholes option pricing model, which vesting periods include (1) immediate vesting on grant date (b) earlier of one year from grant date and the Company's annual meeting of stockholders for 2023 and (c) three years from grant date.
For purposes of determining stock-based compensation expense, the weighted average grant date fair value per share of the stock options was estimated using the Black-Scholes option pricing model, which requires the use of various key assumptions. The weighted average assumptions used are as follows:
| | | | | |
Expected term (1)
| 5.00 - 6.00 years |
Expected dividend (2)
| — | |
Expected volatility (3)
| 53 - 56% |
Risk-free interest rate (4)
| 1.62 - 3.23% |
(1)The expected term of stock options granted was calculated using the “Simplified Method,” which utilizes the midpoint between the weighted average time of vesting and the end of the contractual term. This method was utilized for the stock options due to a lack of historical exercise behavior by the Company's employees.
(2)For all stock options granted in 2022, no dividends are expected to be paid over the contractual term of the stock options, resulting in a zero expected dividend rate.
(3)The expected volatility rate is based on the historical volatility of the Company's common stock.
(4)The risk-free interest rate is specific to the date of grant. The risk-free interest rate is based on U.S. Treasury yields for notes with comparable expected terms as the awards, in effect at the grant date.
Stock Options with Market Conditions
A summary of changes in outstanding stock options with market conditions at target is as follows:
| | | | Number of Options with Market Conditions | | Weighted
Average
Exercise
Price | | Weighted
Average
Remaining
Contractual
Term | | Aggregate Intrinsic Value(a) | | Number of Options | | Weighted
Average
Exercise
Price | | Weighted
Average
Remaining
Contractual
Term | | Aggregate Intrinsic Value(a) |
| | | | | (per option) | | (in years) | | (in thousands) | | | | (per option) | | (in years) | | (in thousands) |
| Options outstanding at January 1, 2022 | 700,209 | | | $ | 236.01 | | | |
| Options outstanding at January 1, 2023 | | Options outstanding at January 1, 2023 | 805,079 | | | $ | 155.10 | | |
| Granted | Granted | — | | | — | | | Granted | — | | | — | | |
| Exercised | Exercised | — | | | — | | | Exercised | — | | | — | | |
| Forfeited | Forfeited | — | | | — | | | Forfeited | (7,763) | | | 132.89 | | |
| Expired | Expired | (13,163) | | | 378.95 | | | Expired | (49,250) | | | 224.70 | | |
| Options outstanding at June 30, 2022 | 687,046 | | | 233.27 | | | 6.26 | | $ | — | | |
| Options exercisable at June 30, 2022 | — | | | $ | — | | | 0.00 | | $ | — | | |
| Options outstanding at June 30, 2023 | | Options outstanding at June 30, 2023 | 748,066 | | | 150.75 | | | 4.78 | | $ | — | |
| Options exercisable at June 30, 2023 | | Options exercisable at June 30, 2023 | 569,185 | | | $ | 129.77 | | | 3.80 | | $ | — | |
(a)The aggregate intrinsic value represents the total pre-tax intrinsic value (the difference between the Company's closing stock price of $43.82$22.11 on the last trading day of the quarter ended June 30, 20222023 and the exercise price, multiplied by the number of shares covered by in-the-money options) that would have been received by the option holder had the option holder exercised these options on June 30, 2022.2023. The intrinsic value changes based on the market value of the Company's common stock.
Stock Options with Market Conditions
A summary of changes in outstanding stock options with market conditions at target is as follows:
| | | | | | | | | | | | | | | | | | | | | | | |
| | Number of Options with Market Conditions | | Weighted
Average
Exercise
Price | | Weighted
Average
Remaining
Contractual
Term | | Aggregate Intrinsic Value(a) |
| | | | (per option) | | (in years) | | (in thousands) |
| Options outstanding at January 1, 2023 | 734,685 | | | $ | 230.79 | | | | | |
| Granted | — | | | — | | | | | |
| Exercised | — | | | — | | | | | |
| Forfeited | — | | | — | | | | | |
| Expired | (16,247) | | | 308.96 | | | | | |
| Options outstanding at June 30, 2023 | 718,438 | | | 229.02 | | | 5.18 | | $ | — | |
| Options exercisable at June 30, 2023 | 481,669 | | | $ | 195.10 | | | 4.10 | | $ | — | |
(a)The aggregate intrinsic value represents the total pre-tax intrinsic value (the difference between the Company's closing stock price of $22.11 on the last trading day of the quarter ended June 30, 2023 and the exercise price, multiplied by the number of shares covered by in-the-money options) that would have been received by the option holder had the option holder exercised these options on June 30, 2023. The intrinsic value changes based on the market value of the Company's common stock.
As of June 30, 2023, a maximum of 1,147,367395,404 shares may be earned for achieving superior performance up to 167% of the remaining unvested target number of shares. As of June 30, 2022,2023, no additional performance-based nonqualified stock options with a market condition of 481,669 had been earned, which have a vest date of September 30, 2022.
LENDINGTREE, INC. AND SUBSIDIARIES
NOTES TO CONSOLIDATED FINANCIAL STATEMENTS (Continued)
Restricted Stock Units
A summary of changes in outstanding nonvested restricted stock units (“RSUs”) is as follows:
| | | | RSUs | | RSUs |
| | | Number of Units | | Weighted Average Grant Date Fair Value | | Number of Units | | Weighted Average Grant Date Fair Value |
| | | (per unit) | | | (per unit) |
| Nonvested at January 1, 2022 | 308,068 | | | $ | 226.55 | | |
| Nonvested at January 1, 2023 | | Nonvested at January 1, 2023 | 485,053 | | | $ | 127.46 | |
| Granted | Granted | 361,910 | | | 108.41 | | Granted | 389,738 | | | 32.71 | |
| Vested | Vested | (85,978) | | | 272.78 | | Vested | (175,087) | | | 138.76 | |
| Forfeited | Forfeited | (47,464) | | | 186.22 | | Forfeited | (104,948) | | | 74.16 | |
| Nonvested at June 30, 2022 | 536,536 | | | $ | 143.02 | | |
| Nonvested at June 30, 2023 | | Nonvested at June 30, 2023 | 594,756 | | | $ | 71.79 | |
Restricted Stock Units with Performance Conditions
A summary of changes in outstanding nonvested RSUs with performance conditions is as follows:
| | | | | | | | | | | |
| | RSUs with Performance Conditions |
| | Number of Units | | Weighted Average Grant Date Fair Value |
| | | (per unit) |
| Nonvested at January 1, 2022 | — | | | $ | — | |
| Granted | 16,000 | | | 83.25 | |
| Vested | — | | | — | |
| Forfeited | — | | | — | |
| Nonvested at June 30, 2022 | 16,000 | | | $ | 83.25 | |
A maximum of 24,000 shares may be earned for achieving superior performance up to 150% of the target number of shares.
Restricted Stock Awards with Market Conditions
A summary of changes in outstanding nonvested RSAs with market conditions at target is as follows:
| | | | | | | | | | | |
| | RSAs with Market Conditions |
| | Number of Awards | | Weighted Average Grant Date Fair Value |
| | | (per unit) |
| Nonvested at January 1, 2022 | 26,674 | | | $ | 340.25 | |
| Granted | — | | | — | |
| Vested | — | | | — | |
| Forfeited | — | | | — | |
| Nonvested at June 30, 2022 | 26,674 | | | $ | 340.25 | |
A maximum of 44,545 shares may be earned for achieving superior performance up to 167% of the target number of shares. As of June 30, 2022, performance-based restricted stock awards with a market condition of 29,601 had been earned, which have a vest date of September 30, 2022. | | | | | | | | | | | |
| | RSUs with Performance Conditions |
| | Number of Units | | Weighted Average Grant Date Fair Value |
| | | (per unit) |
| Nonvested at January 1, 2023 | 16,000 | | | $ | 83.25 | |
| Granted | — | | | — | |
| Vested | — | | | — | |
| Forfeited | (16,000) | | | 83.25 | |
| Nonvested at June 30, 2023 | — | | | $ | — | |
Employee Stock Purchase Plan
In 2021, the Company implemented an employee stock purchase plan (“ESPP”), under which a total of 262,731 shares of the Company's common stock were reserved for issuance. As of June 30, 2022, 243,9292023, 190,277 shares of common stock were available for issuance under the ESPP. The ESPP is a tax-qualified plan under Section 423 of the Internal Revenue Code. Under the
LENDINGTREE, INC. AND SUBSIDIARIES
NOTES TO CONSOLIDATED FINANCIAL STATEMENTS (Continued)
terms of the ESPP, eligible employees are granted options to purchase shares of the Company's common stock at 85% of the lesser of (1) the fair market value at time of grant or (2) the fair market value at time of exercise. The offering periods and purchase periods are typically six-month periods ending on June 30 and December 31 of each year. During the six months ended June 30, 2022, 13,2592023, 36,536 shares were issued under the ESPP.
During the six months ended June 30, 2023 and 2022, the Company granted employee stock purchase rights to certain employees with a grant date fair value per share of $8.19 and $35.43, respectively, calculated using the Black-Scholes option pricing model. For purposes of determining stock-based compensation expense, the grant date fair value per share estimated using the Black-Scholes option pricing model required the use of the following key assumptions:
| | | | | |
Expected term (1)
| 0.50 years |
Expected dividend (2)
| — | |
Expected volatility (3)
| 49 | % |
Risk-free interest rate (4)
| 0.19 | % |
| | | | | | | | | | | |
| Six Months Ended
June 30, |
| 2023 | | 2022 |
Expected term (1) | 0.50 years | | 0.50 years |
Expected dividend (2) | — | | | — | |
Expected volatility (3) | 82 | % | | 49% |
Risk-free interest rate (4) | 4.76 | % | | 0.19% |
(1)The expected term was calculated using the time period between the grant date and the purchase date.
(2)No dividends are expected to be paid, resulting in a zero expected dividend rate.
LENDINGTREE, INC. AND SUBSIDIARIES
NOTES TO CONSOLIDATED FINANCIAL STATEMENTS (Continued)
(3)The expected volatility rate is based on the historical volatility of the Company's common stock.
(4)The risk-free interest rate is specific to the date of grant. The risk-free interest rate is based on U.S. Treasury yields for notes with comparable expected terms as the employee stock purchase rights, in effect at the grant date.
NOTE 11—12—INCOME TAXES
| | | | Three Months Ended
June 30, | | Six Months Ended
June 30, | | Three Months Ended
June 30, | | Six Months Ended
June 30, |
| | | 2022 | | 2021 | | 2022 | | 2021 | | 2023 | | 2022 | | 2023 | | 2022 |
| | (in thousands, except percentages) | | (in thousands, except percentages) |
| Income tax benefit | $ | 2,337 | | | $ | 9,092 | | | $ | 1,954 | | | $ | 454 | | |
| Income tax (expense) benefit | | Income tax (expense) benefit | $ | (227) | | | $ | 2,339 | | | $ | (622) | | | $ | 1,957 | |
| Effective tax rate | Effective tax rate | 22.5 | % | | (1,284.2) | % | | 9.4 | % | | (1.6) | % | Effective tax rate | 202.7 | % | | 22.5 | % | | 4.5 | % | | 9.4 | % |
For the second quarter and first six months of 2023, the effective tax rate varied from the federal statutory rate of 21% primarily due to the change in the valuation allowance, net of the current period change in tax effected net indefinite-lived intangibles. For the second quarter and first six months of 2022, the effective tax rate varied from the federal statutory rate of 21% primarily due to excess tax expense of $0.4 million and $2.9 million, respectively, resulting from vesting of restricted stock in accordance with ASU 2016-09 and the effect of state taxes. For
The Company has a valuation allowance against the secondnet deferred tax assets, with the exception of the deferred tax liabilities that result from indefinite-life intangibles. The Company has determined that using the general methodology for calculating income taxes during an interim period for the quarter ending June 30, 2023 provided for a wide range of potential annual effective rates. Therefore, the Company has calculated the tax provision on a discrete basis under ASC 740-270-30- 36(b) for the quarter ending June 30, 2023. At September 30, 2022, the Company recorded a net deferred tax asset of zero as the cumulative net deferred tax asset had a full valuation on it and first six months of 2021,there was not enough positive evidence that would warrant recognizing the effective tax rate varied from the federal statutory rate of 21% in part due to a tax benefit of $8.3 million recognized for excessthe net deferred tax benefitsasset. In addition, the net indefinite lived deferred tax items were determined to be a net liability resulting from employee exercisesin the recognition of stock options and vesting of restricted stock in accordance with ASU 2016-09 and the effect of state taxes.a deferred tax liability.
| | | | | | | | | | | | | | | | | | | | | | | |
| | Three Months Ended
June 30, | | Six Months Ended
June 30, |
| | 2022 | | 2021 | | 2022 | | 2021 |
| (in thousands) |
| Income tax benefit (expense) - excluding excess tax benefit on stock compensation | $ | 2,775 | | | $ | 831 | | | $ | 4,860 | | | $ | (7,839) | |
| Excess tax (expense) benefit on stock compensation | (438) | | | 8,261 | | | (2,906) | | | 8,293 | |
| | | | | | | |
| Income tax benefit | $ | 2,337 | | | $ | 9,092 | | | $ | 1,954 | | | $ | 454 | |
| | | | | | | | | | | | | | | | | | | | | | | |
| | Three Months Ended
June 30, | | Six Months Ended
June 30, |
| | 2023 | | 2022 | | 2023 | | 2022 |
| (in thousands) |
| Income tax benefit - excluding excess tax expense on stock compensation | $ | (227) | | | $ | 2,777 | | | $ | (622) | | | $ | 4,863 | |
| | | | | | | |
| Excess tax expense on stock compensation | — | | | (438) | | | — | | | (2,906) | |
| | | | | | | |
| Income tax (expense) benefit | $ | (227) | | | $ | 2,339 | | | $ | (622) | | | $ | 1,957 | |
LENDINGTREE, INC. AND SUBSIDIARIES
NOTES TO CONSOLIDATED FINANCIAL STATEMENTS (Continued)
NOTE 12—13—DEBT
Convertible Senior Notes
2025 Notes
On July 24, 2020, the Company issued $575.0 million aggregate principal amount of its 0.50% Convertible Senior Notes due July 15, 2025 (the “2025 Notes”) in a private placement. The issuance included $75.0 million aggregate principal amount of 2025 Notes under a 13-day purchase option which was exercised in full. The 2025 Notes bear interest at a rate of 0.50% per year, payable semi-annually on January 15 and July 15 of each year, beginning on January 15, 2021. The 2025 Notes will mature on July 15, 2025, unless earlier repurchased, redeemed or converted.
The initial conversion rate of the 2025 Notes is 2.1683 shares of the Company's common stock per $1,000 principal amount of 2025 Notes (which is equivalent to an initial conversion price of approximately $461.19 per share). The conversion rate will be subject to adjustment upon
On March 8, 2023, the occurrenceCompany repurchased approximately $190.6 million in principal amount of its 2025 Notes, through individual privately-negotiated transactions with certain specified events but will not be adjusted for accrued and unpaid interest. In addition, upon the occurrence of a make-whole fundamental change prior to the maturityholders of the 2025 Notes, or iffor $156.3 million in cash plus accrued and unpaid interest of approximately $0.1 million. In the first quarter of 2023, the Company issuesrecognized a notice of redemption for the 2025 Notes, the Company will, in certain circumstances, increase the conversion rate by a specified number of additional shares for a holder that elects to convert the 2025 Notes in connection with such make-whole fundamental change or to convert its 2025 Notes called for redemption, as the case may be. Upon conversion, the 2025 Notes will settle for cash, shares of the Company’s stock, or a combination thereof, at the Company’s option. It is the intent of the Company to settle the principal amount of the 2025 Notes in cash and any conversion premium in shares of its common stock.
The 2025 Notes are the Company’s senior unsecured obligations and will rank senior in right of payment to any of the Company’s indebtedness that is expressly subordinated in right of payment to the 2025 Notes; equal in right of payment to any of the Company’s unsecured indebtedness that is not so subordinated; effectively junior in right of payment to any of the Company’s secured indebtedness, including borrowings under the senior secured credit facility, described below, to the extent of the value of the assets securing such indebtedness; and structurally junior to all indebtedness and other liabilities (including trade payables) of the Company’s subsidiaries.
Prior to the close of businessgain on the business day immediately preceding March 13, 2025,extinguishment of debt of $34.3 million, a loss on the 2025 Notes will be convertible at the optionwrite-off of the holders thereof only under the following circumstances:unamortized debt issuance costs of $2.4 million and incurred
•
LENDINGTREE, INC. AND SUBSIDIARIES
NOTES TO CONSOLIDATED FINANCIAL STATEMENTS (Continued)
during the 5 business day period after any 5 consecutive trading day period
debt repayment costs of $1.0 million, all of which are included in which, for each trading day of that period, the trading price (as definedinterest income/expense, net in the 2025 Notes) per $1,000 principal amountconsolidated statements of 2025 Notes for such trading day was less than 98% of the product of the last reported sale price of the common stockoperations and the conversion rate on each such trading day;
•if the Company calls such 2025 Notes for redemption, at any time prior to the close of business on the scheduled trading day immediately preceding the redemption date, but only with respect to the notes called for redemption; or
•upon the occurrence of specified corporate events including but not limited to a fundamental change.comprehensive income.
Holders of the 2025 Notes were not entitled to convert the 2025 Notes during the calendar quarter ended June 30, 20222023 as the last reported sale price of the Company's common stock, for at least 20 trading days (whether or not consecutive) during the period of 30 consecutive trading days ending on March 31, 2022, was not greater than or equal to 130% of the conversion price of the 2025 Notes on each applicable trading day. Holders of the 2025 Notes are not entitled to convert the 2025 Notes during the calendar quarter ended September 30, 2022 as the last reported sale price of the Company's common stock, for at least 20 trading days (whether or not consecutive) during the period of 30 consecutive trading days ending on June 30, 2022,2023, was not greater than or equal to 130% of the conversion price of the 2025 Notes on each applicable trading day.
LENDINGTREE, INC. AND SUBSIDIARIES
NOTES TO CONSOLIDATED FINANCIAL STATEMENTS (Continued)
On or after March 13, 2025, until2023, the close of businessCompany recorded interest expense on the second scheduled trading day immediately preceding the maturity date of the 2025 Notes holders of $2.3 million which consisted of $1.1 million associated with the 2025 Notes may convert all or a portion of their 2025 Notes regardless of0.50% coupon rate and $1.2 million associated with the foregoing conditions.
The Company may not redeem the 2025 Notes prior to July 20, 2023. On or after July 20, 2023 and before the 41st scheduled trading day immediately before the maturity date, the Company may redeem for cash all or a portion of the 2025 Notes, at its option, if the last reported sale price of the common stock for at least 20 trading days (whether or not consecutive) during the 30 consecutive trading day period (and including the last trading day of such period) ending on, and including the last trading day immediately preceding the date of notice of redemption is greater than or equal to 130% of the conversion price on each applicable trading day. The redemption price will be equal to 100% of the principal amount of the 2025 Notes to be redeemed, plus any accrued and unpaid interest to, but excluding, the redemption date. No sinking fund is provided for the 2025 Notes.
Upon the occurrence of a fundamental change prior to the maturity date of the 2025 Notes, holders of the 2025 Notes may require the Company to repurchase all or a portion of the 2025 Notes for cash at a price equal to 100% of the principal amount of the 2025 Notes to be repurchased, plus any accrued and unpaid interest to, but excluding, the fundamental change repurchase date.
If the market price per share of the common stock, as measured under the terms of the 2025 Notes, exceeds the conversion price of the 2025 Notes, the 2025 Notes could have a dilutive effect, unless the Company elects, subject to certain conditions, to settle the principal amount of the 2025 Notes and any conversion premium in cash.
Accounting for the Notes After Adoption of ASU 2020-06
The Company adopted ASU 2020-06 on January 1, 2022 as further described in Note 2—Significant Accounting Policies. Following the adoption of ASU 2020-06, the 2025 Notes are recorded as a single unit within liabilities on the consolidated balance sheets as the conversion features within the 2025 Notes are not derivatives that require bifurcation and the 2025 Notes do not involve a substantial premium. Debt issuance costs to issue the 2025 Notes were recorded as direct deduction from the related liability and amortized to interest expense over the term of Notes. The new guidance also requires the if-converted method to be applied for all convertible instruments when calculating diluted earnings per share. See Note 2—Significant Accounting Policies for additional information.
Accounting for the Notes Before Adoption of ASU 2020-06
The initial measurement of convertible debt instruments that may be settled in cash was separated into a debt and an equity component whereby the debt component was based on the fair value of a similar instrument that does not contain an equity conversion option. The separate components of debt and equity of the Company’s 2025 Notes were determined using an interest rate of 5.30%, which reflects the nonconvertible debt borrowing rate of the Company at the date of issuance. As a result, the initial components of debt and equity were $455.6 million and $119.4 million, respectively. Financing costs related to the issuance of the 2025 Notes were approximately $15.1 million, of which $12.0 million were allocated to the liability component and are being amortized to interest expense over the termamortization of the debt and $3.1 million were allocated to the equity component.
issuance costs. In the first six months of 2022, the Company recorded interest expense on the 2025 Notes of $3.0 million which consisted of $1.5 million associated with the 0.50% coupon rate and $1.5 million associated with the amortization of the debt issuance costs. In the first six months of 2021, the Company recorded interest expense on the 2025 Notes of $13.5 million which consisted of $1.4 million associated with the 0.50% coupon rate, $11.0 million associated with the accretion of the debt discount, and $1.1 million associated with the amortization of the debt issuance costs.
As of June 30, 2022,2023, the fair value of the 2025 Notes is estimated to be approximately $391.0$296.0 million using the Level 1 observable input of the last quoted market price on June 30, 2022.
LENDINGTREE, INC. AND SUBSIDIARIES
NOTES TO CONSOLIDATED FINANCIAL STATEMENTS (Continued)
2023.A summary of the gross carrying amount, unamortized debt cost, debt issuance costs, and net carrying value of the liability component of the 2025 Notes, all of which is recorded as a non-current liability in the June 30, 20222023 consolidated balance sheet, are as follows (in thousands):
| | | | June 30,
2022 | | December 31,
2021 | | June 30,
2023 | | December 31,
2022 |
| Gross carrying amount | Gross carrying amount | $ | 575,000 | | | $ | 575,000 | | Gross carrying amount | $ | 384,398 | | | $ | 575,000 | |
| Unamortized debt discount | — | | | 87,994 | | |
| Debt issuance costs | Debt issuance costs | 9,257 | | | 8,855 | | Debt issuance costs | 4,158 | | | 7,734 | |
| Net carrying amount | Net carrying amount | $ | 565,743 | | | $ | 478,151 | | Net carrying amount | $ | 380,240 | | | $ | 567,266 | |
2022 Notes
On May 31, 2017, the Company issued $300.0 million aggregate principal amount of its 0.625% Convertible Senior Notes due June 1, 2022 (the “2022 Notes”"2022 Notes") in a private placement. The Company settled the outstanding balance of the 2022 Notes of $169.7 million in cash on June 1, 2022. The initial conversion rate of the 2022 Notes was 4.8163 shares of the Company's common stock per $1,000 principal amount of 2022 Notes (which is equivalent to an initial conversion price of approximately $207.63 per share).
Accounting for the Notes After Adoption of ASU 2020-06
The Company adopted ASU 2020-06 on January 1, 2022 as further described in Note 2—Significant Accounting Policies. Following the adoption of ASU 2020-06, the 2022 Notes are recorded as a single unit within liabilities on the consolidated balance sheets as the conversion features within the 2022 Notes are not derivatives that require bifurcation and the 2022 Notes do not involve a substantial premium. Debt issuance costs to issue the 2022 Notes were recorded as direct deduction from the related liability and amortized to interest expense over the term of Notes. The new guidance also requires the if-converted method to be applied for all convertible instruments when calculating diluted earnings per share. See Note 2—Significant Accounting Policies for additional information.
Accounting for the Notes Before Adoption of ASU 2020-06
The separate components of debt and equity of the Company’s 2022 Notes were determined using an interest rate of 5.36%, which reflects the nonconvertible debt borrowing rate of the Company at the date of issuance. As a result, the initial components of debt and equity were $238.4 million and $61.6 million, respectively. Financing costs related to the issuance of the 2022 Notes were approximately $9.3 million, of which $7.4 million were allocated to the liability component and are being amortized to interest expense over the term of the debt and $1.9 million were allocated to the equity component.
On July 24, 2020, the Company used approximately $234.0 million of the net proceeds from the issuance of the 2025 Notes to repurchase approximately $130.3 million principal amount of the 2022 Notes, including the payment of accrued and unpaid interest of approximately $0.1 million, through separate transactions with certain holders of the 2022 Notes. Of the consideration paid, $126.0 million was allocated to the extinguishment of the liability component of the notes, while the remaining $107.9 million was allocated to the reacquisition of the equity component and recorded as a reduction to additional paid-in capital in the consolidated statement of shareholders’ equity. The Company recognized a loss on debt extinguishment of $7.8 million in the third quarter of 2020, which is included in interest expense, net in the consolidated statements of operations and comprehensive income.
In the first six months of 2022, the Company recorded interest expense on the 2022 Notes of $0.8 million which consisted of $0.4 million associated with the 0.625% coupon rate and $0.4 million associated with the amortization of the debt issuance costs. In the first six months of 2021, the Company recorded interest expense on theThe 2022 Notes of $4.7 million which consisted of $0.5 million associated with the 0.625% coupon rate, $3.8 million associated with the accretion of the debt discount, and $0.4 million associated with the amortization of the debt issuance costs.
LENDINGTREE, INC. AND SUBSIDIARIES
NOTES TO CONSOLIDATED FINANCIAL STATEMENTS (Continued)
A summary of the gross carrying amount, unamortized debt cost, debt issuance costs and net carrying value of the liability component of the 2022 Notes, are as follows (were fully settled in thousands):
| | | | | | | | | | | |
| June 30,
2022 | | December 31,
2021 |
Gross carrying amount | $ | — | | | $ | 169,659 | |
Unamortized debt discount | — | | | 3,260 | |
Debt issuance costs | — | | | 391 | |
Net carrying amount | $ | — | | | $ | 166,008 | |
June 2022.Convertible Note Hedge and Warrant Transactions
2020 Hedge and Warrants
On July 24, 2020, in connection with the issuance of the 2025 Notes, the Company entered into Convertible Note Hedge (the “2020 Hedge”) and warrant transactions with respect to the Company’s common stock. The Company used approximately $63.0 million of the net proceeds from the 2025 Notes to pay for the cost of the 2020 Hedge, after such cost was partially offset by the proceeds from the warrant transactions.
On July 24, 2020, the Company paid $124.2 million to the counterparties for the 2020 Hedge transactions. The 2020 Hedge transactions cover 1.2 million shares of the Company’s common stock, the same number of shares initially underlying the 2025 Notes, and are exercisable upon any conversion of the 2025 Notes. The 2020 Hedge transactions are expected generally to reduce the potential dilution to the Company's common stock upon conversion of the 2025 Notes and/or offset any cash payments the Company is required to make in excess of the principal amount of the converted 2025 Notes, as the case may be, in the event that the market price per share of common stock, as measured under the terms of the 2020 Hedge transactions, is greater than the strike price of the 2020 Hedge transactions, which initially corresponds to the initial conversion price of the 2025 Notes, or approximately $461.19 per share of common stock. The 2020 Hedge transactions will expire upon the maturity of the 2025 Notes.
On July 24, 2020, the Company sold to the counterparties, warrants (the “2020 Warrants”) to acquire 1.2 million shares of the Company's common stock at an initial strike price of $709.52 per share, which represents a premium of 100% over the last reported sale price of the common stock of $354.76 on July 21, 2020. On July 24, 2020, the Company received aggregate proceeds of approximately $61.2 million from the sale of the 2020 Warrants. If the market price per share of the common stock, as measured under the terms of the 2020 Warrants, exceeds the strike price of the 2020 Warrants, the 2020 Warrants could have a dilutive effect, unless the Company elects, subject to certain conditions, to settle the 2020 Warrants in cash.
TheIn connection with the March 8, 2023 repurchases of the 2025 Notes noted above, the Company entered into agreements with the counterparties for the 2020 Hedge and 2020 Warrants transactions are indexed to and potentially settledterminate a portion of these call spread transactions effective March 8, 2023 in the Company's common stock and the net cost of $63.0 million has been recorded as a reductionnotional amounts corresponding to additional paid-in capital in the consolidated statement of shareholders’ equity.
2017 Hedge and Warrants
On May 31, 2017, in connection with the issuance of the 2022 Notes, the Company entered into Convertible Note Hedge (the “2017 Hedge”) and warrant transactions with respect to the Company’s common stock. The Company used approximately $18.1 million of the net proceeds from the 2022 Notes to pay for the cost of the 2017 Hedge, after such cost was partially offset by the proceeds from the warrant transactions.
On May 31, 2017, the Company paid $61.5 million to the counterparties for the 2017 Hedge transactions. The 2017 Hedge transactions initially covered 1.4 million shares of the Company’s common stock, the same number of shares initially underlying the 2022 Notes, and were exercisable upon any conversion of the 2022 Notes. The 2017 Hedge transactions were expected generally to reduce the potential dilution to the Company's common stock upon conversion of the 2022 Notes and/or offset any cash payments the Company was required to make in excess of the principal amount of the converted 20222025 Notes as the case may be, in the event that the market price per share of common stock, as measured under the terms of the 2017 Hedge transactions, was greater than the strike price of the 2017 Hedge transactions, which initially corresponded to the initial conversion price of the 2022 Notes, or approximately $207.63 per share of common stock. The 2017 Hedge transactions expired on June 1, 2022 upon the maturity of the Notes.repurchased.
LENDINGTREE, INC. AND SUBSIDIARIES
NOTES TO CONSOLIDATED FINANCIAL STATEMENTS (Continued)
On May 31, 2017,Subsequent to such termination, the Company sold tooutstanding portion of the counterparties, warrants (the “2017 Warrants”) to acquire 1.42020 Hedge covers 0.8 million shares of the Company's common stock at an initial strike price of $266.39 per share, which represents a premium of 70% over the last reported sale price of the common stock of $156.70 on May 24, 2017. On May 31, 2017, the Company received aggregate proceeds of approximately $43.4 million from the sale of the 2017 Warrants. If the market price per share of the common stock, as measured under the terms of the 2017and 2020 Warrants exceeds the strike price of the 2017 Warrants, the 2017 Warrants could have a dilutive effect, unless the Company elects, subject to certain conditions, to settle the 2017 Warrants in cash. As of June 30, 2022, there wereacquire 0.8 million warrants outstanding. The warrants expire ratably from October 14, 2022 through December 12, 2022.
The 2017 Hedge and 2017 Warrants transactions are indexed to, and potentially settled in,shares of the Company's common stock and the net cost of $18.1 million was recorded as a reduction to additional paid-in capital in the consolidated statement of shareholders’ equity.
To the extent of the repurchases of the 2022 Notes noted above, the Company entered into agreements with the counterparties for the 2017 Hedge and 2017 Warrants transactions to terminate a portion of these call spread transactions effective July 24, 2020 in notional amounts corresponding to the principal amount of the 2022 Notes repurchased. The Company received $109.9 million and paid $94.3 million as a result of terminating such portions of the 2017 Hedge and 2017 Warrants, respectively. The net $15.6 million was recorded as an increase to additional paid-in capital in the consolidated statement of shareholders’ equity.remain outstanding.
Credit Facility
On September 15, 2021, the Company entered into a credit agreement (the “Credit Agreement”), consisting of a $200.0 million revolving credit facility (the “Revolving Facility”), which matures on September 15, 2026, and a $250.0 million delayed draw term loan facility (the “Term Loan Facility” and together with the Revolving Facility, the “Credit Facility”), which matures on September 15, 2028. The proceeds of the Revolving Facility can be used to finance working capital, for general corporate purposes and any other purpose not prohibited by the Credit Agreement. On May 31, 2022, the Company received proceeds of $250.0 million from the Term Loan Facility and on June 1, 2022, used $170.2 million of the proceeds to settle the Company’s 2022 Notes, including interest. The remaining proceeds of $79.8 million may be used for general corporate purposes and any other purposes not prohibited by the Credit Agreement. The Credit Facility replaces the Company's $500.0 million five-year senior secured revolving credit facility (the “Amended Revolving Credit Facility”) which was entered into on December 10, 2019.
As of June 30, 2022,2023, the Company had $250.0$247.5 million of borrowings outstanding under the Term Loan Facility bearing interest at the LIBO option rate of 5.42%9.0% and had no borrowings under the Revolving Facility. As of December 31, 2021,2022, the Company had no$248.8 million of borrowings outstanding under the Credit Facility and no borrowings under the Revolving Facility. As of June 30, 2022,2023, borrowings of $2.5 million under the Term Loan Facility are recorded as current portion of long-term debt on the consolidated balance sheet.
The full amount of the Revolving Facility will be available on a same-day basis, with respect to base rate loans and upon advance notice with respect to LIBO rate loans, subject to customary terms and conditions. Under certain conditions, the Company will be permitted to add one or more term loans and/or increase revolving or term loan commitments under the Credit Facility by an amount set at the greater of $116.0 million and 100% of consolidated EBITDA (subject to adjustments for certain prepayments), plus an unlimited amount provided that the first lien net leverage ratio does not exceed 3.00 to 1.00. Additionally, up to $20.0 million of the Revolving Facility will be available for the issuance of letters of credit. At each of June 30, 20222023 and December 31, 2021,2022, the Company had outstanding one letter of credit issued in the amount of $0.2 million.
The Company’s borrowings under the Credit Facility bear interest at annual rates that, at the Company’s option, will be either:
•a base rate generally defined as the sum of (i) the greater of (a) the prime rate of Truist Bank, (b) the federal funds effective rate plus 0.5% and (c) the LIBO rate (defined below) on a daily basis applicable for an interest period of one month plus 1.0% and (ii) an applicable percentage of 1.25% to 1.75% for loans under the Revolving Facility and 2.75% to 3.00% for loans under the Term Loan Facility, in each case, based on a first lien net leverage ratio; or
•a LIBO rate generally defined as the sum of (i) the rate for Eurodollar deposits for the applicable interest period and (ii) an applicable percentage of 2.25% to 2.75% for loans under the Revolving Facility and 3.75% to 4.00% for loans under the Term Loan Facility, in each case, based on a first lien net leverage ratio.
LENDINGTREE, INC. AND SUBSIDIARIES
NOTES TO CONSOLIDATED FINANCIAL STATEMENTS (Continued)
Interest on the Company’s borrowings is payable quarterly in arrears for base rate loans and on the last day of each interest rate period (but not less often than three months) for LIBO rate loans.
The Credit Facility contains a restrictive financial covenant, which is set at a first lien net leverage ratio of 2.50 to 1.00, except that this may increase by 0.50:1.00 for the four fiscal quarters following a material acquisition. The financial covenant will be tested only if the loans and certain other obligations under the Revolving Facility exceed $20.0 million as of the last date of any fiscal quarter (starting with the fiscal quarter ending on December 31, 2021). The Credit Facility also includes a restricted payment covenant which is set at a total net leverage ratio of 4.0 to 1. In addition, the Credit Facility contains mandatory prepayment events, affirmative and negative covenants and events of default customary for a transaction of this type. The covenants, among other things, restrict additional indebtedness, liens, mergers or certain fundamental changes, asset dispositions, dividends and other restricted payments, transactions with affiliates, loans and investments and other matters customarily restricted in credit agreements of this type. The Company is required to make mandatory prepayments of the outstanding principal amount of loans under the Term Loan Facility with the net cash proceeds from certain disposition of assets and the receipt of insurance proceeds upon certain casualty and condemnation events, in each case, to the extent not reinvested within a specified time period, from excess cash flow beyond stated threshold amounts, and from the incurrence of certain indebtedness. The Company has the right to prepay its term loans under the Credit Agreement, in whole or in part, at any time without premium or penalty, subject to certain limitations and a 1.0% soft call premium applicable during the first six months following the closing date.
The Company was in compliance with all covenants at June 30, 2022.2023.
The Credit Facility requiresIn the first six months of 2023, the Company and certain ofrecorded interest expense related to its subsidiaries to pledge as collateral, subject to certain customary exclusions, substantially all of its assets, including 100% of the equity in certain domestic subsidiaries and 65% of the voting equity, and 100% of the non-voting equity, in certain foreign subsidiaries. The obligations under the Credit Facility are unconditionally guaranteed on a senior basis by the Company's material domestic subsidiaries, which guaranties are secured by the collateral.
With respect to the Revolving Facility the Company is required to pay anof $0.7 million which consisted of $0.2 million in unused commitment fee quarterly in arrears on the difference between committed amountsfees and amounts actually borrowed under the Revolving Facility equal to an applicable percentage of 0.25% to 0.50% per annum based on a first lien net leverage ratio. The Company is required to pay a letter of credit participation fee and a letter of credit fronting fee quarterly in arrears. The letter of credit participation fee is based upon the aggregate face amount of outstanding letters of credit at an applicable percentage of 2.25% to 2.75% based on a first lien net leverage ratio. The letter of credit fronting fee is 0.125% per annum on the face amount of each letter of credit.
With respect to the Term Loan Facility, the Company was required to pay an unused commitment fee quarterly in arrears on the difference between committed amounts and amounts actually borrowed under the Term Loan Facility equal to an applicable LIBO rate plus an applicable percentage of 3.75% to 4.00% per annum based on a first lien net leverage ratio.
The Company recognized $1.1$0.5 million in additional interest expense in 2021 due to the write-off of certain unamortized debt issuance costs associated with the Amended Revolving Credit Facility. In addition toamortization of the remaining unamortized debt issuance costs associated withcosts. In the Amended Revolving Credit Facility, debt issuance costsfirst six months of $2.8 million related to2023, the Revolving Facility are being amortized toCompany recorded interest expense over the life of the Revolving Facility. Debt issuance costs of $3.5 million related to the Term Loan Facility andof $10.7 million associated with borrowings bearing interest at the original issue discount of $2.5 million paid on the undrawn term loan facility were amortized to interest expense over the delayed draw access period, until such time that the loans thereunder are drawn. These deferred costs are included in prepaid and other current assets and other non-current assets in the Company's consolidated balance sheet.LIBO rate.
In the first six months of 2022, the Company recorded interest expense related to its Revolving Facilityrevolving credit facilities of $0.7 million which consisted of $0.2 million in unused commitment fees, and $0.5 million associated with the amortization of the debt issuance costs. In the first six months of 2022, the Company recorded interest expense related to the Term Loan Facility of $9.6 million which consisted of $1.0 million associated with borrowings bearing interest at the LIBO rate, $5.1 million in unused commitment fees, $2.0 million associated with the amortization of the debt issuance costs, and $1.5 million associated with the amortization of the original issue discount.
In the first six months of 2021, the Company recorded interest expense related to its revolving credit facilities of $2.3 million which consisted of $1.3 million in unused commitment fees, and $1.0 million associated with the amortization of the debt issuance costs.
LENDINGTREE, INC. AND SUBSIDIARIES
NOTES TO CONSOLIDATED FINANCIAL STATEMENTS (Continued)
NOTE 13—14—CONTINGENCIES
Overview
LendingTree is involved in legal proceedings on an ongoing basis. In assessing the materiality of a legal proceeding, the Company evaluates, among other factors, the amount of monetary damages claimed, as well as the potential impact of non-monetary remedies sought by plaintiffs (e.g., injunctive relief) that may require it to change its business practices in a manner that could have a material and adverse impact on the Company's business. With respect to the matters disclosed in this Note 13,14, unless otherwise indicated, the Company is unable to estimate the possible loss or range of losses that could potentially result from the application of such non-monetary remedies.
As of June 30, 20222023 and December 31, 2021,2022, the Company had litigation settlement accruals of $0.6 million and $0.1 million, in continuing operations.respectively. The litigation settlement accruals relate to litigation matters that were either settled or a firm offer for settlement was extended, thereby establishing an accrual amount that is both probable and reasonably estimable.
NOTE 14—15—FAIR VALUE MEASUREMENTS
Other than the convertible notes and warrants, as well as the equity interests, the carrying amounts of the Company's financial instruments are equal to fair value at June 30, 2022.2023. See Note 12—13—Debt for additional information on the convertible notes and warrants, and see Note7—Equity Investment for additional information on the equity interests in Stash and EarnUp.warrants.
In 2018, the Company acquired all
Contingent consideration payments related to acquisitions are measured at fair value each reporting period using Level 3 unobservable inputs. The changes in the fair value of the Company's Level 3 liabilities are as follows (in thousands):
| | | | | | | | | | | | | | |
| | Three Months Ended
June 30, | | Six Months Ended
June 30, |
| | | 2021 | | 2021 |
| Contingent consideration, beginning of period | | $ | 9,046 | | | $ | 8,249 | |
| Transfers into Level 3 | | — | | | — | |
| Transfers out of Level 3 | | — | | | — | |
| Total net losses (gains) included in earnings (realized and unrealized) | | (8,850) | | | (8,053) | |
| Purchases, sales and settlements: | | | | |
| Additions | | — | | | — | |
| Payments | | — | | | — | |
| Contingent consideration, end of period | | $ | 196 | | | $ | 196 | |
NOTES TO CONSOLIDATED FINANCIAL STATEMENTS (Continued)
NOTE 15—16—SEGMENT INFORMATION
The Company manages its business and reports its financial results through the following 3three operating and reportable segments: Home, Consumer, and Insurance. Characteristics which were relied upon in making the determination of the reportable segments include the nature of the products, the organization's internal structure, and the information that is regularly reviewed by the chief operating decision maker for the purpose of assessing performance and allocating resources.
The Home segment includes the following products: purchase mortgage, refinance mortgage, and home equity loans and lines of credit,credit. The Company ceased offering reverse mortgage loans and real estate.in the fourth quarter of 2022. The Consumer segment includes the following products: credit cards, personal loans, small business loans, student loans, auto loans, deposit accounts, and other credit products such as credit repair and debt settlement. The Insurance segment consists of insurance quote products and sales of insurance policies in the agency businesses.
The following tables are a reconciliation of segment profit, which is the Company's primary segment profitability measure, to income before income taxes and discontinued operations.taxes. Segment marketing expense represents the portion of selling and
LENDINGTREE, INC. AND SUBSIDIARIES
NOTES TO CONSOLIDATED FINANCIAL STATEMENTS (Continued)
marketing expense attributable to variable costs paid for advertising, direct marketing and related expenses, that are directly attributable to the segments' products. This measure excludes overhead, fixed costs and personnel-related expenses.
| | | | | | | | | | | | | | | | | |
| Three Months Ended June 30, 2022 |
| Home | Consumer | Insurance | Other | Total |
| (in thousands) |
| Revenue | $ | 73,938 | | $ | 106,144 | | $ | 81,756 | | $ | 85 | | $ | 261,923 | |
| Segment marketing expense | 47,198 | | 61,556 | | 59,172 | | 232 | | 168,158 | |
| Segment profit (loss) | 26,740 | | 44,588 | | 22,584 | | (147) | | 93,765 | |
| Cost of revenue | | | | | 14,574 | |
| Brand and other marketing expense | | | | | 16,379 | |
| General and administrative expense | | | | | 40,289 | |
| Product development | | | | | 14,318 | |
| Depreciation | | | | | 4,896 | |
| Amortization of intangibles | | | | | 7,075 | |
| | | | | |
| Severance | | | | | 135 | |
| Litigation settlements and contingencies | | | | | (7) | |
| Operating loss | | | | | (3,894) | |
| Interest expense, net | | | | | (6,765) | |
| Other income | | | | | 284 | |
| Loss before income taxes and discontinued operations | | | | | $ | (10,375) | |
| | | | | | | | | | | | | | | | | |
| Three Months Ended June 30, 2021 |
| Home | Consumer | Insurance | Other | Total |
| (in thousands) |
| Revenue | $ | 104,861 | | $ | 75,676 | | $ | 89,263 | | $ | 214 | | $ | 270,014 | |
| Segment marketing expense | 65,844 | | 42,282 | | 56,025 | | 263 | | 164,414 | |
| Segment profit (loss) | 39,017 | | 33,394 | | 33,238 | | (49) | | 105,600 | |
| Cost of revenue | | | | | 13,934 | |
| Brand and other marketing expense | | | | | 20,792 | |
| General and administrative expense | | | | | 39,811 | |
| Product development | | | | | 13,290 | |
| Depreciation | | | | | 4,443 | |
| Amortization of intangibles | | | | | 11,310 | |
| Change in fair value of contingent consideration | | | | | (8,850) | |
| | | | | |
| Litigation settlements and contingencies | | | | | 322 | |
| Operating loss | | | | | 10,548 | |
| Interest expense, net | | | | | (9,840) | |
| | | | | |
| Income before income taxes and discontinued operations | | | | | $ | 708 | |
| | | | | | | | | | | | | | | | | |
| Three Months Ended June 30, 2023 |
| Home | Consumer | Insurance | Other | Total |
| (in thousands) |
| Revenue | $ | 41,563 | | $ | 82,477 | | $ | 58,398 | | $ | 15 | | $ | 182,453 | |
| Segment marketing expense | 28,216 | | 41,807 | | 33,647 | | 274 | | 103,944 | |
| Segment profit (loss) | 13,347 | | 40,670 | | 24,751 | | (259) | | 78,509 | |
| Cost of revenue | | | | | 9,302 | |
| Brand and other marketing expense | | | | | 12,121 | |
| General and administrative expense | | | | | 29,160 | |
| Product development | | | | | 10,601 | |
| Depreciation | | | | | 4,684 | |
| Amortization of intangibles | | | | | 1,982 | |
| | | | | |
| Restructuring and severance | | | | | 3,558 | |
| Litigation settlements and contingencies | | | | | 488 | |
| Operating income | | | | | 6,613 | |
| Interest expense, net | | | | | (6,940) | |
| Other income | | | | | 439 | |
| Income before income taxes | | | | | $ | 112 | |
LENDINGTREE, INC. AND SUBSIDIARIES
NOTES TO CONSOLIDATED FINANCIAL STATEMENTS (Continued)
| | | | | | | | | | | | | | | | | |
| Six Months Ended June 30, 2022 |
| Home | Consumer | Insurance | Other | Total |
| (in thousands) |
| Revenue | $ | 175,882 | | $ | 207,212 | | $ | 161,794 | | $ | 213 | | $ | 545,101 | |
| Segment marketing expense | 113,233 | | 120,117 | | 118,107 | | 415 | | 351,872 | |
| Segment profit (loss) | 62,649 | | 87,095 | | 43,687 | | (202) | | 193,229 | |
| Cost of revenue | | | | | 30,135 | |
| Brand and other marketing expense | | | | | 36,822 | |
| General and administrative expense | | | | | 76,262 | |
| Product development | | | | | 28,370 | |
| Depreciation | | | | | 9,750 | |
| Amortization of intangibles | | | | | 14,992 | |
| | | | | |
| Severance | | | | | 3,760 | |
| Litigation settlements and contingencies | | | | | (34) | |
| Operating loss | | | | | (6,828) | |
| Interest expense, net | | | | | (14,270) | |
| Other income | | | | | 283 | |
| Loss before income taxes and discontinued operations | | | | | $ | (20,815) | |
| | | Six Months Ended June 30, 2021 | | Three Months Ended June 30, 2022 |
| | Home | Consumer | Insurance | Other | Total | | Home | Consumer | Insurance | Other | Total |
| | (in thousands) | | (in thousands) |
| Revenue | Revenue | $ | 232,986 | | $ | 133,583 | | $ | 175,877 | | $ | 318 | | $ | 542,764 | | Revenue | $ | 73,938 | | $ | 106,144 | | $ | 81,756 | | $ | 85 | | $ | 261,923 | |
| Segment marketing expense | Segment marketing expense | 154,979 | | 75,582 | | 109,797 | | 459 | | 340,817 | | Segment marketing expense | 47,198 | | 61,556 | | 59,172 | | 232 | | 168,158 | |
| Segment profit (loss) | Segment profit (loss) | 78,007 | | 58,001 | | 66,080 | | (141) | | 201,947 | | Segment profit (loss) | 26,740 | | 44,588 | | 22,584 | | (147) | | 93,765 | |
| Cost of revenue | Cost of revenue | | 27,829 | | Cost of revenue | | 14,574 | |
| Brand and other marketing expense | Brand and other marketing expense | | 41,851 | | Brand and other marketing expense | | 16,379 | |
| General and administrative expense | General and administrative expense | | 74,800 | | General and administrative expense | | 40,291 | |
| Product development | Product development | | 25,758 | | Product development | | 14,318 | |
| Depreciation | Depreciation | | 8,161 | | Depreciation | | 4,896 | |
| Amortization of intangibles | Amortization of intangibles | | 22,622 | | Amortization of intangibles | | 7,075 | |
| Change in fair value of contingent consideration | | (8,053) | | |
| | Restructuring and severance | | Restructuring and severance | | 135 | |
| Litigation settlements and contingencies | Litigation settlements and contingencies | | 338 | | Litigation settlements and contingencies | | (7) | |
| Operating loss | Operating loss | | 8,641 | | Operating loss | | (3,896) | |
| Interest expense, net | Interest expense, net | | (20,055) | | Interest expense, net | | (6,765) | |
| Other income | Other income | | 40,072 | | Other income | | 284 | |
| Income before income taxes and discontinued operations | | $ | 28,658 | | |
| Loss before income taxes | | Loss before income taxes | | $ | (10,377) | |
NOTE 16—DISCONTINUED OPERATIONS
The results of discontinued operations include litigation settlements and contingencies and legal fees associated with legal proceedings against LendingTree, Inc. or LendingTree, LLC that arose due to the LendingTree Loans business or the HLC bankruptcy filing. | | | | | | | | | | | | | | | | | |
| Six Months Ended June 30, 2023 |
| Home | Consumer | Insurance | Other | Total |
| (in thousands) |
| Revenue | $ | 85,238 | | $ | 162,186 | | $ | 135,480 | | $ | 57 | | $ | 382,961 | |
| Segment marketing expense | 56,783 | | 86,640 | | 80,577 | | 495 | | 224,495 | |
| Segment profit (loss) | 28,455 | | 75,546 | | 54,903 | | (438) | | 158,466 | |
| Cost of revenue | | | | | 23,062 | |
| Brand and other marketing expense | | | | | 28,681 | |
| General and administrative expense | | | | | 65,843 | |
| Product development | | | | | 25,256 | |
| Depreciation | | | | | 9,479 | |
| Amortization of intangibles | | | | | 4,031 | |
| | | | | |
| Restructuring and severance | | | | | 8,012 | |
| Litigation settlements and contingencies | | | | | 500 | |
| Operating loss | | | | | (6,398) | |
| Interest income, net | | | | | 18,089 | |
| Other income | | | | | 2,273 | |
| Income before income taxes | | | | | $ | 13,964 | |
LENDINGTREE, INC. AND SUBSIDIARIES
NOTES TO CONSOLIDATED FINANCIAL STATEMENTS (Continued)
The components of net loss reported as discontinued operations in the accompanying consolidated statements of operations and comprehensive income are as follows (in thousands):
| | | | | | | | | | | | | | | | | | | | | | | Six Months Ended June 30, 2022 |
| | | Three Months Ended
June 30, | | Six Months Ended
June 30, | | Home | Consumer | Insurance | Other | Total |
| | | 2022 | | 2021 | | 2022 | | 2021 | | (in thousands) |
| Revenue | Revenue | $ | — | | | $ | — | | | $ | — | | | $ | — | | Revenue | $ | 175,882 | | $ | 207,212 | | $ | 161,794 | | $ | 213 | | $ | 545,101 | |
| Segment marketing expense | | Segment marketing expense | 113,233 | | 120,117 | | 118,107 | | 415 | | 351,872 | |
| Segment profit (loss) | | Segment profit (loss) | 62,649 | | 87,095 | | 43,687 | | (202) | | 193,229 | |
| Cost of revenue | | Cost of revenue | | 30,135 | |
| Brand and other marketing expense | | Brand and other marketing expense | | 36,822 | |
| General and administrative expense | | General and administrative expense | | 76,268 | |
| Product development | | Product development | | 28,370 | |
| Depreciation | | Depreciation | | 9,750 | |
| Amortization of intangibles | | Amortization of intangibles | | 14,992 | |
| | Restructuring and severance | | Restructuring and severance | | 3,760 | |
| Litigation settlements and contingencies | | Litigation settlements and contingencies | | (34) | |
| Operating loss | | Operating loss | | (6,834) | |
| Interest expense, net | | Interest expense, net | | (14,270) | |
| Other income | | Other income | | 283 | |
| Loss before income taxes | Loss before income taxes | (2) | | | (4,261) | | | (6) | | | (4,614) | | Loss before income taxes | | $ | (20,821) | |
| Income tax benefit | 2 | | | 1,062 | | | 3 | | | 1,152 | | |
| Net loss | $ | — | | | $ | (3,199) | | | $ | (3) | | | $ | (3,462) | | |
NOTE 17—RESTRUCTURING ACTIVITIES
InOn April 6, 2023, the Company made the decision to close the Ovation credit services business ( the "Ovation Closure".) The Ovation Closure includes the elimination of approximately 197 employees, or 18%, of the Company's current workforce. As a result of the Ovation Closure, the Company incurred $2.1 million in restructuring expense in connection with cash expenditures for employee separation costs. The Ovation Closure, including cash payments, is expected to be completed by the first quarter of 2022,2024.
On March 24, 2023, the Company completedcommitted to a workforce reduction plan (the “Reduction Plan”), to reduce operating costs. The Reduction Plan includes the elimination of approximately 75162 employees, or 13%, of the Company’s current workforce. As a result of the Reduction Plan, the Company estimates that it will incur approximately $5.3 million in severance charges in connection with the workforce reduction, consisting of cash expenditures for employee separation costs of approximately $4.3 million and non-cash charges for the accelerated vesting of certain equity awards of approximately $1.0 million.
The Company has incurred restructuring expense of $4.3 million in the first quarter of 2023 and an additional $1.0 million of restructuring expense in the second quarter of 2023 related to the Reduction Plan. The Reduction Plan, including cash payments, is expected to be substantially completed by the end of the second quarter of 2024.
LENDINGTREE, INC. AND SUBSIDIARIES
NOTES TO CONSOLIDATED FINANCIAL STATEMENTS (Continued)
During 2022, the Company completed a workforce reductionreductions in each of the first, second, and fourth quarters of approximately 75 employees, 25 employees. Theemployees, and 50 employees, respectively. In the first six months of 2022, the Company incurred total expense of $3.8 million consisting of employee separation costs of $2.7 million and non-cash compensation expense of $1.1 million due to the accelerated vesting of certain equity awards. All employee separation costs for 2022 actions are expected to be paid by the firstthird quarter of 2023.
| | | Accrued Balance at December 31, 2021 | Income Statement Impact | Payments | Non-Cash | Accrued Balance at June 30, 2022 | | Accrued Balance at December 31, 2022 | Income Statement Impact | Payments | Non-Cash | Accrued Balance at June 30, 2023 |
| Q2 2023 action | | Q2 2023 action | |
| Employee separation payments | | Employee separation payments | $ | — | | $ | 2,064 | | $ | (1,404) | | $ | — | | $ | 660 | |
| Q1 2023 action | | Q1 2023 action | |
| Employee separation payments | | Employee separation payments | — | | 4,261 | | (2,935) | | — | | 1,326 | |
| Non-cash compensation | | Non-cash compensation | — | | 1,066 | | — | | (1,066) | | — | |
| 2022 action | 2022 action | | 2022 action | |
| Employee separation payments | Employee separation payments | $ | — | | $ | 2,677 | | $ | (2,304) | | $ | — | | $ | 373 | | Employee separation payments | 304 | | 25 | | $ | (273) | | — | | 56 | |
| Non-cash compensation | — | | 1,083 | | — | | (1,083) | | — | | |
| | $ | — | | $ | 3,760 | | $ | (2,304) | | $ | (1,083) | | $ | 373 | | | $ | 304 | | $ | 7,416 | | $ | (4,612) | | $ | (1,066) | | $ | 2,042 | |
Item 2. Management's Discussion and Analysis of Financial Condition and Results of Operations
Cautionary Statement Regarding Forward-Looking Information
This report contains “forward-looking statements” within the meaning of the Securities Act of 1933, as amended, and the Securities Exchange Act of 1934, as amended by the Private Securities Litigation Reform Act of 1995. These forward-looking statements include statements related to our anticipated financial performance, business prospects and strategy; anticipated trends and prospects in the various industries in which our businesses operate; new products, services and related strategies; and other similar matters. These forward-looking statements are based on management's current expectations and assumptions about future events, which are inherently subject to uncertainties, risks and changes in circumstances that are difficult to predict. The use of words such as “anticipates,” “estimates,” “expects,” “projects,” “intends,” “plans” and “believes,” among others, generally identifies forward-looking statements.
Actual results could differ materially from those contained in the forward-looking statements. Factors currently known to management that could cause actual results to differ materially from those in forward-looking statements include those matters discussed or referenced in Part II, Item 1A. Risk Factors included elsewhere in this quarterly reportQuarterly Report on Form 10-Q and Part I, Item 1A. Risk Factors of the 2021 Annual Report.Report on Form 10-K for the year ended December 31, 2022 (the "2022 Annual Report").
Other unknown or unpredictable factors that could also adversely affect our business, financial condition and results of operations may arise from time to time. In light of these risks and uncertainties, the forward-looking statements discussed in this reportQuarterly Report on Form 10-Q may not prove to be accurate. Accordingly, you should not place undue reliance on these forward-looking statements, which only reflect the views of LendingTree, Inc.'s management as of the date of this report.Quarterly Report on Form 10-Q. We undertake no obligation to update or revise forward-looking statements to reflect changed assumptions, the occurrence of unanticipated events or changes to future operating results or expectations, except as required by law.
Company Overview
LendingTree, Inc. is the parent of LT Intermediate Company, LLC, which holds all of the outstanding ownership interests of LendingTree, LLC, and LendingTree, LLC owns several companies.
We operate what we believe to be the leading online consumer platform that connects consumers with the choicessolutions they need to be confident in their financial decisions. Our online consumer platform provides consumers with access to product offerings from our Network Partners, including mortgage loans, home equity loans reverse mortgage loans,and lines of credit, auto loans, credit cards, deposit accounts, personal loans, student loans, small business loans, insurance quotes, sales of insurance policies and other related offerings. In addition, we offer tools and resources, including free credit scores, that facilitate comparison shopping for loans, deposit products, insurance, and other offerings. We seek to match consumers with multiple providers, who can offer them competing quotes for the product, or products,product(s) they are seeking. We also serve as a valued partner to lenders and other providers seeking an efficient, scalable and flexible source of customer acquisition with directly measurable benefits, by matching the consumer inquiries we generate with these Network Partners.
Our My LendingTreeMyLendingTree platform offers a personalized comparison-shopping experience by providing free credit scores and credit score analysis. This platform enables us to monitor consumers' credit profiles and then identify and alert them to loans and other offerings on our marketplace that may be more favorable than the terms they may have at a given point in time. This is designed to provide consumers with measurable savings opportunities over their lifetimes.
We are focused on developing new product offerings and enhancements to improve the experiences that consumers and Network Partners have as they interact with us. By expanding our portfolio of financial services offerings, we are growing and diversifying our business and sources of revenue. We intend to capitalize on our expertise in performance marketing, product development and technology and to leverageby leveraging the widespread recognition of the LendingTree brand, to effect this strategy.brand.
We believe the consumer and small business financial services industry is still in the early stages of a fundamental shift to online product offerings, similar to the shift that started in retail and travel many years ago and is now well established. We believe that like retail and travel, as consumers continue to move towards online shopping and transactions for financial services, suppliers will increasingly shift their product offerings and advertising budgets toward the online channel. We believe the strength of our brands and of our partner networkNetwork Partners place us in a strong position to continue to benefit from this market shift.
The LendingTree Loans business is presented as discontinued operations in the accompanying consolidated balance sheets, consolidated statements of operations and comprehensive income and consolidated statements of cash flows for all periods
presented. Except for the discussion under the heading “Discontinued Operations,” the analysis within Management's Discussion and Analysis of Financial Condition and Results of Operations reflects our continuing operations.
Economic Conditions
During March 2020, a global pandemic was declared byWe continue to monitor the World Health Organization related to the rapidly growing outbreak of a novel strain of coronavirus (“COVID-19”). The pandemic has significantly impacted the economic conditions in the U.S., as federal, state and local governments react to the public health crisis, creating significant uncertainties in the U.S. economy. The downstream impact of various lockdown orders and related economic pullback are affecting our business and marketplace participants to varying degrees. We are continuously monitoring the impacts of the current economic conditions related to the COVID-19 pandemic, government actions and measures taken to prevent its spread, and the effectpotential to affect our operations. We are also monitoring the current global economic environment, specifically including inflationary pressures and interest rates, and any resulting impacts on our business, financial conditionposition and results of operations. Refer to Part I, Item 1A. “Risk Factors” of our 2022 Annual Report for additional information.
Of our three reportable segments, the Consumer segment was impacted the most impactedfrom the COVID-19 pandemic as unsecured credit and the flow of capital in certain areas of the market have contracted. Most of our selling and marketing expenses are variable costs that we adjust dynamically in relation to revenue opportunities to profitably meet demand. Thus, as our revenue was negatively impacted during the COVID-19 pandemic and the macro-economic conditions that followed, our marketing expenses generally decreased in line with revenue.
During the first six months of 2022,2023, the challenging interest rate environment combined with annual inflation persistently running above 8% has presented additionaland inflationary pressures have continued to present challenges for many of our mortgage lending and insurance partners. We have seen the most significant impact inIn our Home segment, as mortgage rates have remained relatively consistent in the second quarter of 2023 compared to the fourth quarter of 2022, but nearly doubled overcompared to the first six monthsquarter of 2022, causing2022. The significant increases in mortgage rates caused a sharp decline in refinance volumes and more recentare putting pressure on purchase activity. AlthoughIn our Insurance segment, continues to rebound from the trough in the fourth quarter of2021, the recovery has been slower than expected as demand from our carrier partners remains volatile as premium increasesthey continue to chase inflation.deal with persistent industry headwinds.
Segment Reporting
We have three reportable segments: Home, Consumer, and Insurance.
Recent Business Acquisitions
On February 28, 2020, we acquired an equity interest in Stash for $80.0 million. On January 6, 2021 we acquired an additional equity interest for $1.2 million. Stash is a consumer investing and banking platform. Stash brings together banking, investing, and financial services education into one seamless experience offering a full suite of personal investment accounts, traditional and Roth IRAs, custodial investment accounts, and banking services, including checking accounts and debit cards with a Stock-Back® rewards program. In the fourth quarter of 2021, we sold a portion of our investment in Stash for $46.3 million, realizing a gain on the sale of $27.9 million.
In January 2022, the Companywe acquired an equity interest in EarnUp for $15.0 million. EarnUp is a consumer-first mortgage payment platform that intelligently automates loan payment scheduling and helps consumers better manage their money and improve their financial well-being.See Note 7—Equity Investment for additional information on the equity interest in EarnUp.
North Carolina Office Properties
Our new corporate office is located on approximately 176,000 square feet of office space in Charlotte, North Carolina under an approximate 15-year lease that contractually commenced in the second quarter of 2021.
With our expansion in North Carolina, in December 2016, we received a grant from the state that provides up to $4.9 million in reimbursements through 2029 beginning in 2017 for investing in real estate and infrastructure in addition to increasing jobs in North Carolina at specific targeted levels through 2021, and maintaining the jobs thereafter. We have received approximately $0.7 million related to the December 2016 grants. If we are unable to maintain the specified target levels, our ability to earn further reimbursements could be limited. Additionally, the city of Charlotte and the county of Mecklenburg provided a grant that will be paid over five years and is based on a percentage of new property tax we pay on the development of a corporate headquarters. In December 2018, we received an additional grant from the state that provides an aggregate amount up to $8.4 million in reimbursements through 2032 beginning in 2021 for increasing jobs in North Carolina at specific targeted levels through 2024, and maintaining the jobs thereafter.
We have currently not met the specified target levels set forth in the December 2018 grant and may not realize any reimbursements from this grant. Recent Mortgage Interest Rate Trends
Interest rate and market risks can be substantial in the mortgage lead generation business. Short-term fluctuations in mortgage interest rates primarily affect consumer demand for mortgage refinancings, while long-term fluctuations in mortgage interest rates, coupled with the U.S. real estate market, affect consumer demand for new mortgages. Consumer demand, in turn, affects lender demand for mortgage leads from third-party sources, as well as our own ability to attract online consumers to our website.
Typically, when interest rates decline, we see increased consumer demand for mortgage refinancing, which in turn leads to increased traffic to our website and decreased selling and marketing efforts associated with that traffic. At the same time, lender demand for leads from third-party sources typically decreases, as there are more consumers in the marketplace seeking refinancings and, accordingly, lenders receive more organic mortgage lead volume. Due to lower lender demand, our revenue earned per consumer typically decreases, but with correspondingly lower selling and marketing costs.
Conversely, when interest rates increase, we typically see decreased consumer demand for mortgage refinancing, leading to decreased traffic to our website and higher associated selling and marketing efforts associated with that traffic. At the same time, lender demand for leads from third-party sources typically increases, as there are fewer consumers in the marketplace and, accordingly, the supply of organic mortgage lead volume decreases. Due to high lender demand, we typically see an increase in the amount lenders will pay per matched lead, which often leads to higher revenue earned per consumer. However, increases in the amount lenders will pay per matched lead in this situation is limited by the overall cost models of our lenders, and our revenue earned per consumer can be adversely affected by the overall reduced demand for refinancing in a rising rate environment.
We dynamically adjust selling and marketing expenditures in all interest rate environments to optimize our results against these variables.
According to Freddie Mac, 30-year mortgage interest rates increased from a monthly average of 3.10%6.36% in December 20212022 to a monthly average of 5.52%6.71% in June 2022.2023. On a quarterly basis, 30-year mortgage interest rates in the second quarter of 20222023 averaged 5.24%6.49%, compared to 3.00%5.24% in the second quarter of 20212022 and 3.08%6.69% in the fourth quarter of 2021.2022.
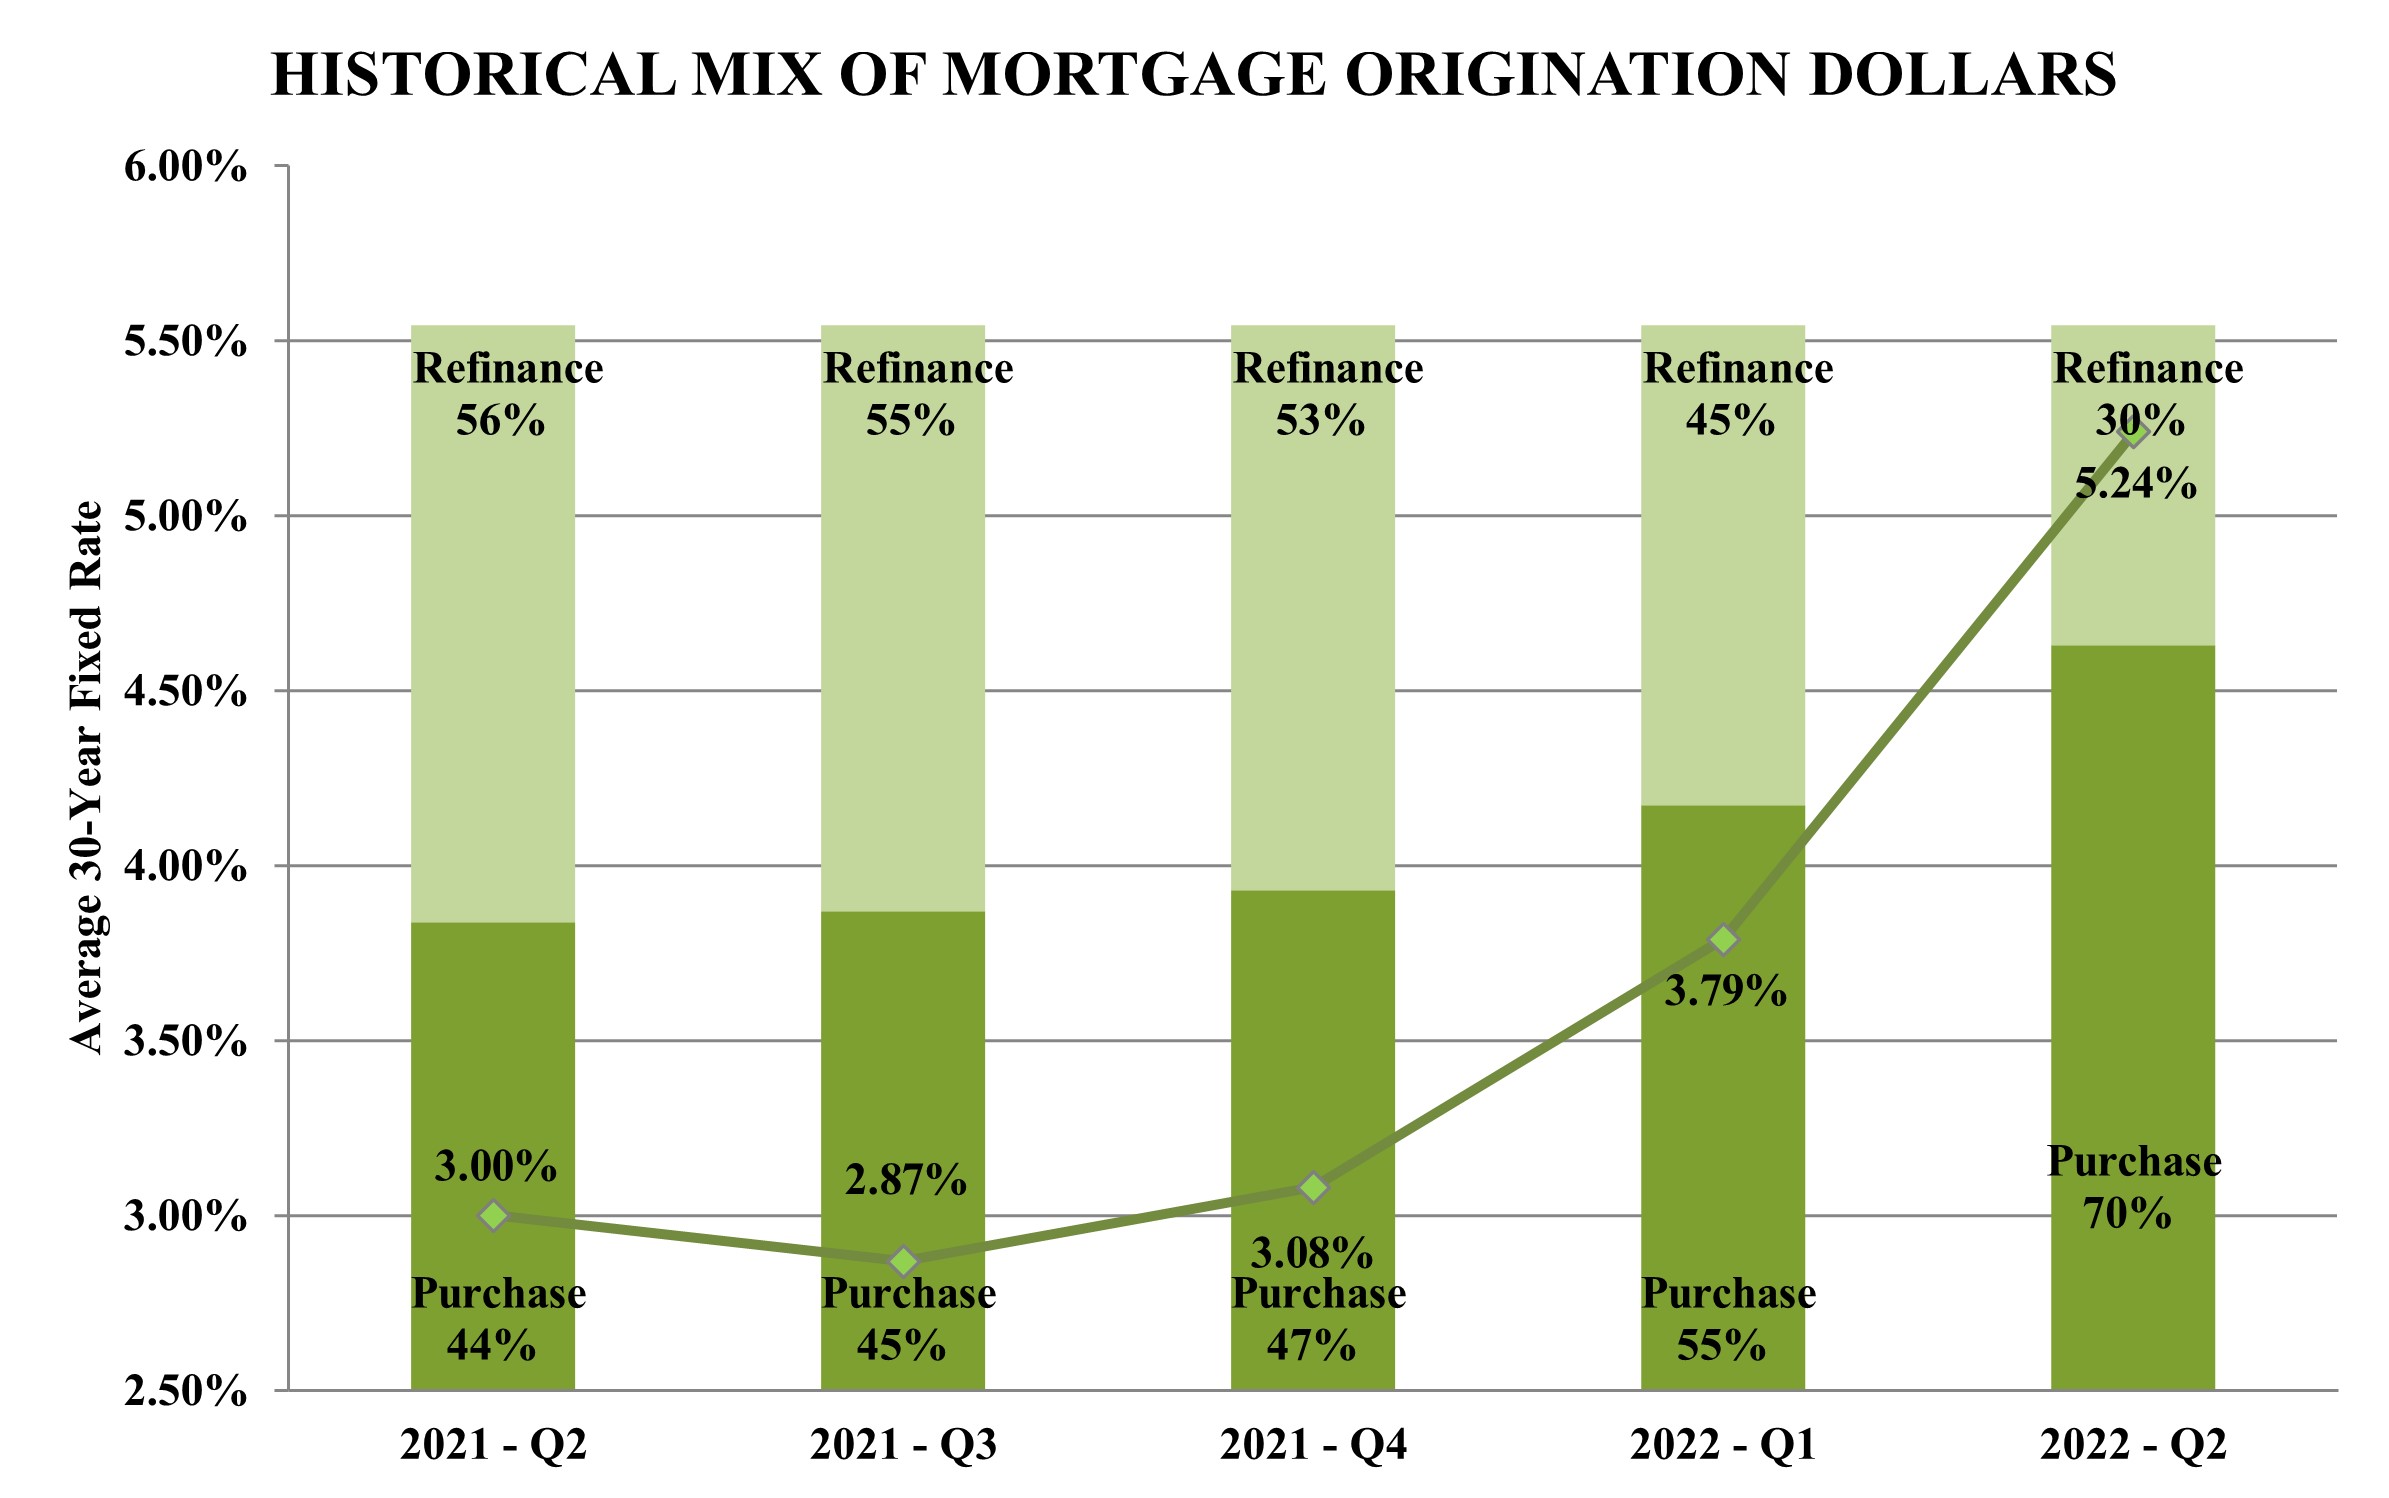
Typically, as mortgage interest rates rise, there are fewer consumers in the marketplace seeking refinancings and, accordingly, the mix of mortgage origination dollars will move toward purchase mortgages. According to Mortgage Bankers Association (“MBA”) data, total refinance origination dollars decreasedincreased to 30%20% of total mortgage origination dollars in the second quarter of 20222023 compared to 53%17% in the fourth quarter of 2021.2022 but decreased from 30% in the second quarter of 2022. In the second quarter of 2022,2023, total refinance origination dollars decreased 57%increased 39% from the fourth quarter of 20212022 and 66%decreased 54% from the second quarter of 2021.2022. Industry-wide mortgage origination dollars in the second quarter of 2022 decreased 24%2023 increased 16% from the fourth quarter of 20212022 and 35%decreased 32% from second quarter of 2021.2022.
In July 2022, the MBA projected 30-year mortgage interest rates to increase during 2022, to an average 5.2% for the year.
According to MBA projections, the mix of mortgage origination dollars is expected to move backcontinue to be weighted towards purchase mortgages with the refinance share representing approximately 30%21% for 2022.2023.
The U.S. Real Estate Market
The health of the U.S. real estate market and interest rate levels are the primary drivers of consumer demand for new mortgages. Consumer demand, in turn, affects lender demand for purchase mortgage leads from third-party sources. Typically, a strong real estate market will lead to reduced lender demand for leads, as there are more consumers in the marketplace seeking financing and, accordingly, lenders receive more organic lead volume. Conversely, a weaker real estate market will typically lead to an increase in lender demand, as there are fewer consumers in the marketplace seeking mortgages.
According to Fannie Mae data, existing-homeexisting home sales decreased 16%increased 2% in the second quarter of 20222023 compared to the fourth quarter of 2021,2022, and 12%decreased 21% compared to the second quarter of 2021.2022. Fannie Mae predicts an overall decrease in existing-home sales of approximately 16% in 20222023 compared to 2021.2022.
MyLendingTree
We consider certain metrics related to MyLendingTree set forth below to help us evaluate our business and growth trends and assess operational efficiencies. The calculation of the metrics discussed below may differ from other similarly titled metrics used by other companies, securities analysts or investors.
We continued to grow our user base and added 1.2 million new users in the second quarter of 2023, bringing cumulative sign-ups to 26.9 million at June 30, 2023. We attribute $22 million of revenue in the second quarter of 2023 to registered MyLendingTree members across the LendingTree platform.
Our focus on improving the MyLendingTree experience for consumers remains a top priority. Becoming an integrated digital advisor will greatly improve the consumer experience, which we expect to result in higher levels of engagement, improved membership growth rates, and ultimately stronger financial results.
Cost Reductions and Simplification of Business
On March 24, 2023, we committed to a workforce reduction plan (the “Reduction Plan”), to reduce operating costs, which included the elimination of approximately 13% of the Company’s workforce. As a result of the Reduction Plan, we expect to incur approximately $5.3 million in severance charges in connection with the workforce reduction, $4.3 million of which was incurred in the first quarter of 2023 and $1.0 million was incurred in the second quarter of 2023. Part of this Reduction Plan included the shut down of our LendingTree customer call center as well as our Medicare insurance agency operations within QuoteWizard. We anticipate the Reduction Plan will reduce annual compensation expense by approximately $14 million, comprised of $2 million in cost of revenue, $4 million in selling and marketing expense, $3 million in general and administrative expense, and $5 million in product development.
Separately, we made the decision to close our Ovation credit services business, an asset group within our Consumer segment, by mid- 2023. As a result, the Company recorded an asset impairment charge of $4.2 million in the first quarter of 2023 related to the write-off of certain long-term assets. Additionally, we incurred $2.1 million in severance charges in the second quarter of 2023 in connection with cash expenditures for employee separation costs. We acquired Ovation in 2018 to better serve those customers who come to LendingTree and receive suboptimal offers of credit. The business grew for a number of years before running into challenges in the wake of COVID-19, and more recently the industry has faced increased regulatory pressure. The business is capital-intensive, requires elevated overhead, and future prospects were becoming uncertain.
The Ovation business accounted for approximately 3% of total Revenue and 3% of Total Costs and Expenses, with an immaterial impact to Net Income on the Consolidated Statement of Operations and Comprehensive Income (Loss) for the year ended December 31, 2022.
Results of Operations for the Three and Six Months ended June 30, 20222023 and 20212022
| | | | Three Months Ended June 30, | | Six Months Ended June 30, | | Three Months Ended June 30, | | Six Months Ended June 30, |
| | | 2022 | 2021 | $
Change | %
Change | | 2022 | 2021 | $
Change | %
Change | | 2023 | 2022 | $
Change | %
Change | | 2023 | 2022 | $
Change | %
Change |
| | | (Dollars in thousands) | | (Dollars in thousands) |
| Home | Home | $ | 73,938 | | $ | 104,861 | | $ | (30,923) | | (29) | % | | $ | 175,882 | | $ | 232,986 | | $ | (57,104) | | (25) | % | Home | $ | 41,563 | | $ | 73,938 | | $ | (32,375) | | (44) | % | | $ | 85,238 | | $ | 175,882 | | $ | (90,644) | | (52) | % |
| Consumer | Consumer | 106,144 | | 75,676 | | 30,468 | | 40 | % | | 207,212 | | 133,583 | | 73,629 | | 55 | % | Consumer | 82,477 | | 106,144 | | (23,667) | | (22) | % | | 162,186 | | 207,212 | | (45,026) | | (22) | % |
| Insurance | Insurance | 81,756 | | 89,263 | | (7,507) | | (8) | % | | 161,794 | | 175,877 | | (14,083) | | (8) | % | Insurance | 58,398 | | 81,756 | | (23,358) | | (29) | % | | 135,480 | | 161,794 | | (26,314) | | (16) | % |
| Other | Other | 85 | | 214 | | (129) | | (60) | % | | 213 | | 318 | | (105) | | (33) | % | Other | 15 | | 85 | | (70) | | (82) | % | | 57 | | 213 | | (156) | | (73) | % |
| Revenue | Revenue | 261,923 | | 270,014 | | (8,091) | | (3) | % | | 545,101 | | 542,764 | | 2,337 | | — | % | Revenue | 182,453 | | 261,923 | | (79,470) | | (30) | % | | 382,961 | | 545,101 | | (162,140) | | (30) | % |
| Costs and expenses: | Costs and expenses: | | Costs and expenses: | |
Cost of revenue (exclusive of depreciation and amortization shown separately below) | Cost of revenue (exclusive of depreciation and amortization shown separately below) | 14,574 | | 13,934 | | 640 | | 5 | % | | 30,135 | | 27,829 | | 2,306 | | 8 | % | Cost of revenue (exclusive of depreciation and amortization shown separately below) | 9,302 | | 14,574 | | (5,272) | | (36) | % | | 23,062 | | 30,135 | | (7,073) | | (23) | % |
| Selling and marketing expense | Selling and marketing expense | 184,537 | | 185,206 | | (669) | | — | % | | 388,694 | | 382,668 | | 6,026 | | 2 | % | Selling and marketing expense | 116,065 | | 184,537 | | (68,472) | | (37) | % | | 253,176 | | 388,694 | | (135,518) | | (35) | % |
| General and administrative expense | General and administrative expense | 40,289 | | 39,811 | | 478 | | 1 | % | | 76,262 | | 74,800 | | 1,462 | | 2 | % | General and administrative expense | 29,160 | | 40,291 | | (11,131) | | (28) | % | | 65,843 | | 76,268 | | (10,425) | | (14) | % |
| Product development | Product development | 14,318 | | 13,290 | | 1,028 | | 8 | % | | 28,370 | | 25,758 | | 2,612 | | 10 | % | Product development | 10,601 | | 14,318 | | (3,717) | | (26) | % | | 25,256 | | 28,370 | | (3,114) | | (11) | % |
| Depreciation | Depreciation | 4,896 | | 4,443 | | 453 | | 10 | % | | 9,750 | | 8,161 | | 1,589 | | 19 | % | Depreciation | 4,684 | | 4,896 | | (212) | | (4) | % | | 9,479 | | 9,750 | | (271) | | (3) | % |
| Amortization of intangibles | Amortization of intangibles | 7,075 | | 11,310 | | (4,235) | | (37) | % | | 14,992 | | 22,622 | | (7,630) | | (34) | % | Amortization of intangibles | 1,982 | | 7,075 | | (5,093) | | (72) | % | | 4,031 | | 14,992 | | (10,961) | | (73) | % |
| Change in fair value of contingent consideration | — | | (8,850) | | 8,850 | | 100 | % | | — | | (8,053) | | 8,053 | | 100 | % | |
| | Restructuring and severance | Restructuring and severance | 135 | | — | | 135 | | — | % | | 3,760 | | — | | 3,760 | | — | % | Restructuring and severance | 3,558 | | 135 | | 3,423 | | 2,536 | % | | 8,012 | | 3,760 | | 4,252 | | 113 | % |
| Litigation settlements and contingencies | Litigation settlements and contingencies | (7) | | 322 | | (329) | | (102) | % | | (34) | | 338 | | (372) | | (110) | % | Litigation settlements and contingencies | 488 | | (7) | | 495 | | 7,071 | % | | 500 | | (34) | | 534 | | 1,571 | % |
| Total costs and expenses | Total costs and expenses | 265,817 | | 259,466 | | 6,351 | | 2 | % | | 551,929 | | 534,123 | | 17,806 | | 3 | % | Total costs and expenses | 175,840 | | 265,819 | | (89,979) | | (34) | % | | 389,359 | | 551,935 | | (162,576) | | (29) | % |
| Operating (loss) income | (3,894) | | 10,548 | | (14,442) | | (137) | % | | (6,828) | | 8,641 | | (15,469) | | (179) | % | |
| Other (expense) income, net: | | |
| Interest expense, net | (6,765) | | (9,840) | | (3,075) | | (31) | % | | (14,270) | | (20,055) | | (5,785) | | (29) | % | |
| Operating income (loss) | | Operating income (loss) | 6,613 | | (3,896) | | 10,509 | | 270 | % | | (6,398) | | (6,834) | | 436 | | 6 | % |
| Other income (expense), net: | | Other income (expense), net: | |
| Interest (expense) income, net | | Interest (expense) income, net | (6,940) | | (6,765) | | (175) | | (3) | % | | 18,089 | | (14,270) | | 32,359 | | 227 | % |
| Other income | Other income | 284 | | — | | 284 | | — | % | | 283 | | 40,072 | | (39,789) | | (99) | % | Other income | 439 | | 284 | | 155 | | 55 | % | | 2,273 | | 283 | | 1,990 | | 703 | % |
| (Loss) income before income taxes | (10,375) | | 708 | | (11,083) | | (1,565) | % | | (20,815) | | 28,658 | | (49,473) | | (173) | % | |
| Income tax benefit | 2,337 | | 9,092 | | (6,755) | | (74) | % | | 1,954 | | 454 | | 1,500 | | 330 | % | |
| Net (loss) income from continuing operations | (8,038) | | 9,800 | | (17,838) | | (182) | % | | (18,861) | | 29,112 | | (47,973) | | (165) | % | |
| Loss from discontinued operations, net of tax | — | | (3,199) | | (3,199) | | (100) | % | | (3) | | (3,462) | | (3,459) | | (100) | % | |
| Income (loss) before income taxes | | Income (loss) before income taxes | 112 | | (10,377) | | 10,489 | | 101 | % | | 13,964 | | (20,821) | | 34,785 | | 167 | % |
| Income tax (expense) benefit | | Income tax (expense) benefit | (227) | | 2,339 | | (2,566) | | (110) | % | | (622) | | 1,957 | | (2,579) | | (132) | % |
| Net (loss) income and comprehensive (loss) income | Net (loss) income and comprehensive (loss) income | $ | (8,038) | | $ | 6,601 | | $ | (14,639) | | (222) | % | | $ | (18,864) | | $ | 25,650 | | $ | (44,514) | | (174) | % | Net (loss) income and comprehensive (loss) income | $ | (115) | | $ | (8,038) | | $ | 7,923 | | 99 | % | | $ | 13,342 | | $ | (18,864) | | $ | 32,206 | | 171 | % |
Revenue
Revenue decreased in the second quarter and first six months of 20222023 compared to the second quarter and first six months of 20212022 due to decreases in our Home, and Insurance segments, partially offset by an increase in our Consumer, segment. Revenue increased in the first six months of 2022 compared to the first six months of 2021 due to an increase in our Consumer segment, partially offset by decreases in our Home and Insurance segments.
Our Consumer segment includes the following products: credit cards, personal loans, small business loans, student loans, auto loans, deposit accounts, and other credit products such as credit repair and debt settlement. Many of our Consumer segment products are not individually significant to revenue. Revenue from our Consumer segment increased $30.5decreased $23.7 million, or 40%22%, in the second quarter of 20222023 from the second quarter of 20212022, and increased $73.6decreased $45.0 million, or 55%22%, in the first six months of 20222023 from the first six months of 2021,2022 primarily due to increasesdecreases in our personal loans, credit cards, and small business loans. Many of our products in the Consumer segment experienced increases in revenue in the second quarter and first six months of 2022 from the second quarter and first six months of 2021 due to the recovery from the impacts of the COVID-19 pandemic.business.
Revenue from our personal loans product increased $17.1decreased $14.2 million, or 68%33%, to $28.1 million in the second quarter of 2023 from $42.3 million in the second quarter of 2022, from $25.2 million in the second quarter of 2021, and increased $37.4decreased $25.8 million, or 93%33%, to $77.5 million in the first six months
of 2022 from $40.1$51.7 million in the first six months of 20212023 from $77.5 million in the first six months of 2022 primarily due to an increasea decrease in the number of consumers completing request forms and an increase in revenue earned per consumer.forms.
Revenue from our credit cards product increased $4.9decreased $6.2 million, or 22%23%, to $21.1 million in the second quarter of 2023 from $27.3 million in the second quarter of 2022 from $22.4 million in the second quarter of 2021 primarily due to an increasea decrease in revenue earned per approval.the number of consumer clicks. Revenue from our credit cards product increased $17.1decreased $17.8 million, or 43%31%, to $39.4 million in the first six months of 2023 compared to $57.1 million in the first six months of 2022, comparedprimarily due to $40.1 milliona decrease in the first six monthsnumber of 2021, due to an increaseconsumer clicks and in revenue earned per approval and an increase in the number of approvals.click.
For the periods presented, no other products in our Consumer segment represented more than 10% of revenue; however, certain other Consumer products experienced notable changes primarily due to the impact of economic conditions related to the COVID-19 pandemic.changes. Revenue from our small business loans product increased $7.8 decreased $4.0
million, or 81%23%, in the second quarter of 20222023 compared to the second quarter of 2021,2022, primarily due to an increasea decrease in revenue earned per consumer.consumer and a decrease in the number of consumers completing request forms. Revenue from our small business loans product increased $18.5produced decreased $6.0 million, or 106%17%, in the first six months of 20222023 compared to the first six months of 2021,2022, primarily due to an increase in revenue earned per consumer and an increasea decrease in the number of consumers completing request forms.
Our Home segment includes the following products: purchase mortgage, refinance mortgage, and home equity loans and lines of credit. We ceased offering reverse mortgage loans and real estate.in the fourth quarter of 2022. Revenue from our Home segment decreased $30.9$32.4 million, or 29%44%, in the second quarter of 20222023 from the second quarter of 2021,2022, and $57.1decreased $90.6 million, or 25%52%, in the first six months of 2022 compared to2023 from the first six months of 2021,2022 primarily due to a decreasedecreases in revenue from our refinance mortgage product, partially offset by increases in our home equity and purchase mortgage products.
Revenue from our mortgage products decreased $43.1$28.1 million, or 49%63%, to $16.2 million in the second quarter of 2023 from $44.4 million in the second quarter of 2022, from $87.5and decreased $86.1 million, or 70%, to $36.2 million in the second quarterfirst six months of 2021, and decreased $81.5 million or 40%, to2023 from $122.3 million in the first six months of 2022. Revenue from our refinance mortgage product decreased $19.9 million in the second quarter of 2023 compared to the second quarter of 2022 from $203.8and decreased $68.1 million in the first six months of 2021. Revenue from our refinance mortgage product decreased $44.0 million in the second quarter of 2022 compared to the second quarter of 2021, and $91.6 million in the first six months of 20222023 compared to the first six months of 2021,2022 due to a decrease in the number of consumers completing request forms and a decrease in revenue earned per consumer, as interest rates have risen. Revenue from our purchase mortgage product increased $0.9decreased $8.2 million in the second quarter of 20222023 compared to the second quarter of 20212022, and $10.1decreased $18.1 million in the first six months of 20222023 compared to the first six months of 2021,2022 primarily due to an increase in revenue earned per consumer.
Revenue from our home equity loans product increased $11.8 million, or 71%, to $28.4 million in the second quarter of 2022 from $16.5 million in to the second quarter of 2021, and increased $24.0 million, or 87%, to $51.5 million in the first six months of 2022 from $27.5 million in the first six months of 2021, primarily due to an increase in consumers completing request forms, and an increase in revenue earned per consumer.
Revenue from our Insurance segment decreased $7.5 million, or 8%, to $81.8 million in the second quarter of 2022 from $89.3 million in the second quarter of 2021, and $14.1 million, or 8%, to $161.8 million in the first six months of 2022 from $175.9 million in the first six months of 2021 due to a decrease in the number of consumers seeking insurance coverage, partially offset by an increasecompleting request forms and a decrease in revenue earned per consumer. Revenue from our home equity loans product decreased $3.0 million, or 11%, to $25.3 million in the second quarter of 2023 from $28.4 million in the second quarter of 2022, and decreased $2.5 million, or 5%, to $49.0 million in the first six months of 2023 from $51.5 million in the first six months of 2022.
Revenue from our Insurance segment decreased $23.4 million, or 29%, to $58.4 million in the second quarter of 2023 from $81.8 million in the second quarter of 2022, and decreased $26.3 million, or 16%, to $135.5 million in the first six months of 2023 from $161.8 million first six months of 2022 primarily due to a decrease in revenue earned per consumer.
Cost of revenue
Cost of revenue consists primarily of costs associated with compensation and other employee-related costs (including stock-based compensation) relating to internally-operated customer call centers, third-party customer call center fees, credit scoring fees, credit card fees, website network hosting, and server fees.
Cost of revenue remained relatively consistentdecreased in the second quarter of 20222023 from the second quarter of 2021, increasing $0.62022, primarily due to a decrease in compensation and benefits of $4.0 million. Cost of revenue increaseddecreased in the first six months of 20222023 from the first six months of 2021,2022 primarily due to a $1.5decrease in compensation and benefits of $4.2 million increaseand a decrease in website network hosting and server hosting fees.fees of $1.8 million. The decreases in the second quarter and first six months are primarily due to the Reduction Plan at the end of the first quarter of 2023, including shutting down the LendingTree customer call center.
Cost of revenue as a percentage of revenue increaseddecreased to 5% in the second quarter of 2023 compared to 6% in the second quarter of 2022, compared to 5% in the second quarter of 2021, and increased toremained consisted at 6% in the first six months of 2022 compared to 5% in the first six months of 2021.2023 and 2022.
Selling and marketing expense
Selling and marketing expense consists primarily of advertising and promotional expenditures and compensation and other employee-related costs (including stock-based compensation) for personnel engaged in sales or marketing functions.
Advertising and promotional expenditures primarily include online marketing, as well as television, print, and radio spending. Advertising production costs are expensed in the period the related ad is first run.
Selling and marketing expense remained relatively consistentdecreased in the second quarter of 20222023 compared to the second quarter 2021, decreasing $0.7 million. Selling2022 by $68.5 million, and marketing expense increaseddecreased $135.5 million in the first six months of 2022 from2023 compared to the first six months of 2021,2022 primarily due to the changes in advertising and promotional expense discussed below. Additionally, compensation and benefits increased $1.1decreased $3.3 million in the second quarter of 2023 compared to the second quarter of 2022 and decreased $5.6 million in the first six months of 20222023 compared to the first six months of 2021, as a result2022.
Advertising and promotional expense is the largest component of selling and marketing expense, and is comprised of the following:
| | | | Three Months Ended June 30, | | Six Months Ended June 30, | | Three Months Ended June 30, | | Six Months Ended June 30, |
| | | 2022 | 2021 | $
Change | %
Change | | 2022 | 2021 | $
Change | %
Change | | 2023 | 2022 | $
Change | %
Change | | 2023 | 2022 | $
Change | %
Change |
| | | (Dollars in thousands) | | (Dollars in thousands) |
| Online | Online | $ | 167,711 | | $ | 165,038 | | $ | 2,673 | | 2 | % | | $ | 350,184 | | $ | 341,859 | | $ | 8,325 | | 2 | % | Online | $ | 104,354 | | $ | 167,711 | | $ | (63,357) | | (38) | % | | $ | 225,074 | | $ | 350,184 | | $ | (125,110) | | (36) | % |
| Broadcast | Broadcast | 770 | | 2,649 | | (1,879) | | (71) | % | | 1,610 | | 3,816 | | (2,206) | | (58) | % | Broadcast | (86) | | 770 | | (856) | | (111) | % | | 220 | | 1,610 | | (1,390) | | (86) | % |
| Other | Other | 2,670 | | 3,908 | | (1,238) | | (32) | % | | 8,434 | | 9,623 | | (1,189) | | (12) | % | Other | 1,690 | | 2,671 | | (981) | | (37) | % | | 5,063 | | 8,434 | | (3,371) | | (40) | % |
| Total advertising expense | Total advertising expense | $ | 171,151 | | $ | 171,595 | | $ | (444) | | — | % | | $ | 360,228 | | $ | 355,298 | | $ | 4,930 | | 1 | % | Total advertising expense | $ | 105,958 | | $ | 171,152 | | $ | (65,194) | | (38) | % | | $ | 230,357 | | $ | 360,228 | | $ | (129,871) | | (36) | % |
In the periods presented, advertising and promotional expenses are equivalent to the non-GAAP measure variable marketing expense. See Variable Marketing Expense and Variable Marketing Margin below for additional information.
Revenue is primarily driven by Network Partner demand for our products, which is matched to corresponding consumer requests. We adjust our selling and marketing expenditures dynamically in relation to anticipated revenue opportunities in order to ensure sufficient consumer inquiries to profitably meet such demand. An increase in a product’s revenue is generally met by a corresponding increase in marketing spend, and conversely a decrease in a product’s revenue is generally met by a corresponding decrease in marketing spend. This relationship exists for our Home, Consumer, and Insurance segments.
We adjusted our advertising expenditures in the second quarter and first six months of 20222023 compared to the second quarter and first six months of 20212022 in response to changes in Network Partner demand on our marketplace. We will continue to adjust selling and marketing expenditures dynamically in response to anticipated revenue opportunities.
General and administrative expense
General and administrative expense consists primarily of compensation and other employee-related costs (including stock-based compensation) for personnel engaged in finance, legal, tax, corporate information technology, human resources and executive management functions, as well as facilities and infrastructure costs and fees for professional services.
General and administrative expense increaseddecreased in the second quarter of 2022 compared to2023 from the second quarter of 2021,2022 primarily due to increasesa decrease in compensation and benefits of $5.9 million, a decrease in loss on assets of $1.9$2.9 million, and in technology expenses of $1.1 million, partially offset by a $2.5 million decrease in compensation and benefits.facilities expense of $0.9 million. General and administrative expense increaseddecreased in the first six months of 2022 compared to2023 from the first six months of 20212022 primarily due to increasesa decrease in technologycompensation and benefits of $2.6$7.6 million, loss on assetsa decrease in facilities expenses of $2.0$1.6 million, othera decrease in franchise tax expense of $1.5 million, partially offset by an increase in travel and entertainment expensesloss on assets of $1.1$1.7 million. We incurred a $4.2 million and an increaseloss on the impairment of assets for our Ovation business in fees and chargesthe first quarter of $1.1 million. This was partially offset by decreases in compensation and benefits of $4.9 million and a decrease in professional fees of $2.0 million.2023.
General and administrative expense as a percentage of revenue remained consistent at 15% for each ofincreased to 16% in the second quartersquarter of 2023 compared to 15% in the second quarter of 2022, and 2021, and remained consistent at 14% forincreased to 17% in the first six months of 2022 and 2021.2023 compared to 14% in the first six months of 2022.
Product development
Product development expense consists primarily of compensation and other employee-related costs (including stock-based compensation) and third-party labor costs that are not capitalized, for employees and consultants engaged in the design, development, testing and enhancement of technology.
Product development expense increaseddecreased in the second quarter and first six months of 20222023 compared to the second quarter and first six months of 2021 as we2022 primarily due to the Reduction Plan at the end of the first quarter of 2023. We continued to invest in internal development of new and enhanced features, functionality and business opportunities that we believe will enable us to better and more fully serve consumers and Network Partners.
Amortization of intangibles
The decrease in amortization of intangibles in the second quarter and first six months of 20222023 compared to the second quarter and first six months of 20212022 was primarily due to certain intangible assets associated with our recent business acquisitions becoming fully amortized.
DuringRestructuring and severance
On March 24, 2023, we committed to the Reduction Plan to reduce operating costs, which included the elimination of approximately 13% of the Company’s workforce. As a result of the Reduction Plan, we estimate that we will incur approximately $5.3 million in severance charges in connection with the workforce reduction, consisting of cash expenditures for employee separation costs of approximately $4.3 million and non-cash charges for the accelerated vesting of certain equity awards of approximately $1.0 million.
We incurred restructuring expense of $4.3 million in the first quarter of 2023 and an additional $1.0 million of restructuring expense in the second quarter and first six months of 2022, we did not record contingent consideration expense. All earnouts were2023 related to the Reduction Plan. We anticipate that the execution of the Reduction Plan, including cash payments, will be completed prior to 2022.
Duringby the end of the second quarter and first six months of 2021, we recorded an aggregate gain2024.
We made the decision to close the Ovation credit services business by mid-2023. We incurred $2.1 million of $8.9 million and $8.1 million respectively, due to adjustments in the estimated fair value of the earnout paymentsrestructuring expense related to the QuoteWizard acquisition.
Restructuring and severanceOvation closure in the second quarter of 2023 in connection with cash expenditures for employee separation costs. We anticipate the cash payments for separation costs will be completed by the second quarter of 2024.
In the first quarter of 2022, we completed a workforce reduction of approximately 75 employees and in the second quarter of 2022 completed a workforce reduction of approximately 25 employees. The CompanyWe incurred total expense of $3.8 million in the first six months of 2022 related to these actions, consisting of employee separation costs of $2.7 million and non-cash compensation expense of $1.1 million due to the accelerated vesting of certain equity awards. All employee separation costs are expected to be paid by
Interest income/expense
In the first quarter of 2023.2023, we repurchased approximately $190.6 million in principal amount of our 0.50% Convertible Senior Notes due July 15, 2025 (the "2025 Notes") for $156.3 million plus accrued and unpaid interest of approximately $0.1 million. As a result of the repurchase, we recognized a gain on the extinguishment of $34.3 million, a loss on the write-off of unamortized debt issuance costs of $2.4 million, and incurred debt repayment costs of $1.0 million, all of which are included in interest income/expense, net in the consolidated statements of operations and comprehensive income. See Note 13—Debt for additional information.
Interest expenseOther income
Interest expense decreased inFor the second quarter and first six months of 2023 and 2022, compared toother income primarily consisted of dividend income.
Income tax expense
For the second quarter and first six months of 20212023, the effective tax rate varied from the federal statutory rate of 21% primarily due to the adoptionchange in the valuation allowance, net of ASU 2020-06 on January 1, 2022, whereby we derecognized the remaining debt discounts on the 2022 Notes and 2025 Notes and therefore no longer recognize any amortization of debt discounts as interest expense partially offset by an increasecurrent period change in interest from our Term Loan Facility. See Note—2 Significant Accounting Policies for additional information.
Other income
For the first six months of 2021, other income primarily consists of a $40.1 million gain on our investment in Stash as a result of an adjustment to the fair value based on observable market events. See Note 7—Equity Investment for additional information on the equity interest in Stash.
Income tax expenseeffected net indefinite-lived intangibles.
For the second quarter and first six months of 2022, the effective tax rate varied from the federal statutory rate of 21% primarily due to excess tax expense of $0.4 million and $2.9 million, respectively, resulting from vesting of restricted stock in accordance with ASU 2016-09 and the effect of state taxes. For the second quarter and first six months of 2021, the effective tax rate varied from the federal statutory rate of 21% in part due to a tax benefit of $8.3 million recognized for excess tax benefits resulting from employee exercises of stock options and vesting of restricted stock in accordance with ASUAccounting Standards Update 2016-09 and the effect of state taxes.
Segment Profit
| | | | Three Months Ended June 30, | | Six Months Ended June 30, | | Three Months Ended June 30, | | Six Months Ended June 30, |
| | | 2022 | 2021 | $
Change | %
Change | | 2022 | 2021 | $
Change | %
Change | | 2023 | 2022 | $
Change | %
Change | | 2023 | 2022 | $
Change | %
Change |
| | | (Dollars in thousands) | | (Dollars in thousands) |
| Home | Home | $ | 26,740 | | $ | 39,017 | | $ | (12,277) | | (31) | % | | $ | 62,649 | | $ | 78,007 | | $ | (15,358) | | (20) | % | Home | $ | 13,347 | | $ | 26,740 | | $ | (13,393) | | (50) | % | | $ | 28,455 | | $ | 62,649 | | $ | (34,194) | | (55) | % |
| Consumer | Consumer | 44,588 | | 33,394 | | 11,194 | | 34 | % | | 87,095 | | 58,001 | | 29,094 | | 50 | % | Consumer | 40,670 | | 44,588 | | (3,918) | | (9) | % | | 75,546 | | 87,095 | | (11,549) | | (13) | % |
| Insurance | Insurance | 22,584 | | 33,238 | | (10,654) | | (32) | % | | 43,687 | | 66,080 | | (22,393) | | (34) | % | Insurance | 24,751 | | 22,584 | | 2,167 | | 10 | % | | 54,903 | | 43,687 | | 11,216 | | 26 | % |
| Other | Other | (147) | | (49) | | (98) | | 200 | % | | (202) | | (141) | | (61) | | (43) | % | Other | (259) | | (147) | | (112) | | (76) | % | | (438) | | (202) | | (236) | | (117) | % |
| Segment profit | Segment profit | $ | 93,765 | | $ | 105,600 | | $ | (11,835) | | (11) | % | | $ | 193,229 | | $ | 201,947 | | $ | (8,718) | | (4) | % | Segment profit | $ | 78,509 | | $ | 93,765 | | $ | (15,256) | | (16) | % | | $ | 158,466 | | $ | 193,229 | | $ | (34,763) | | (18) | % |
Segment profit is our primary segment operating metric. Segment profit is calculated as segment revenue less segment selling and marketing expenses attributed to variable costs paid for advertising, direct marketing and related expenses that are
directly attributable to the segments' products. See Note 15—16—Segment Information in the notes to the consolidated financial statements for additional information on segments and a reconciliation of segment profit to pre-tax income from continuing operations.income.
Home
The rapid riseHome segment revenue of $41.6 million in interest rates throughout the second quarter significantly impacted the performance of our Home segment. The 30-year fixed mortgage rate, as measured by the Freddie Mac Mortgage Market Survey, approached 6% during2023 decreased 44% from the second quarter of 2022 causing refinance volumes to decline sharply. Combined with persistently low inventoryand segment profit of homes for sale,$13.3 million in the purchase market also declined steadily throughoutsecond quarter of 2023 decreased 50% from the second quarter recording activity belowof 2022. The Home segment margin of 32% in the peaksecond quarter of the pandemic, dropping to levels not seen since 2015 according to the MBA purchase index. As a result, during2023 decreased from 36% in the second quarter of 2022, as lower close rates realized by our Network Partners has negatively impacted revenue per consumer. Our home equity business again produced the majority of the Home segment's revenue, declining 11% in the second quarter of 2023 from the second quarter of 2022. Consumer demand to borrow against a near record level of equity in their homes remains strong, and we recordedexpect this channel will continue to generate the majority of segment revenue going forward.
Consumer
Our Consumer segment revenue of $73.9$82.5 million in the second quarter of 2023 was down 22% from the second quarter of 2022, while segment profit of $40.7 million was down a more modest 9% as segment margin improved to 49% in the second quarter of 2023 compared to 42% in the second quarter of 2022.
Personal loans revenue of $28.1 million in the second quarter of 2023 decreased 33% from the second quarter of 2022 as close rates again declined from the prior quarter, most notably in prime and mid-prime segments. Although partner appetite to extend credit appears to have stabilized since multiple regional banks failed in March 2023, capital market headwinds and the outlook for additional increases in short-term rates by the Federal Reserve mean a return to year over year revenue growth is unlikely to occur this year.
Small business revenue decreased 23% in the second quarter of 2022 from the second quarter of 2023. Ongoing tightening of credit by our lender partners again negatively impacted conversion rates, most notably for lower credit quality borrowers. Close rates have now declined steadily for four consecutive quarters. The average loan size has also declined across borrower credit spectrum, which directly impacts revenue we earn on funded loans. We have focused on optimizing our marketing mix to target higher credit quality borrowers as well as bringing on new lender partners to improve close rates.
Credit card revenue of $21.1 million in the second quarter of 2023 decreased 23% from the second quarter of 2022. During the second quarter of 2023 we continued to migrate traffic to our LendingTree website from our CompareCards domain. The results have been positive, with notably improved consumer engagement and higher approval rates observed. The implementation of LightSpeed, our new credit card tech platform, has performed as expected, greatly improving page load speeds and redirect rates. These improvements in consumer experience represent the beginning of our approach to recapture market share in this large and important vertical.
Insurance
Revenue of $58.4 million in the second quarter of 2023 decreased 29% from the second quarter of 2021, with2022, however, segment profit of $26.7$24.8 million in the second quarter of 2022, down 31%2023 increased 10% from the second quarter of 2021. Home equity continues2022. As expected, carriers reduced advertising budgets in the quarter due to be an important part of our overall product mix, achieving record revenue with 71% growthworse than expected loss rates on personal auto policies. Continued operating efficiency gains generated a 42% segment margin compared to a 28% segment margin in the second quarter of 2022 compared to the second quarter of 2021. Purchase revenue grew 6% in the second quarter of 2022 compared to the second quarter of 2021 despite volumes declining. As is typically the case during difficult origination markets, revenue per lead expanded significantly as purchase leads become more valuable for our lending partners. However, we expect that limited home inventory.
Variable Marketing Expense and affordability concerns will continue to weigh on home sales going forward.
As a leader in the mortgage marketplace, we are committed to supporting our lender partners during this rising rate environment. We anticipate that our broadcast marketing campaign will help to increase lead volume for our partners over time. We remain focused on optimizing higher converting products, such as cash-out refinance and home equity loans, to help them meet their origination goals. Despite the sharp uptick in interest rates, loans secured with home equity remain the lowest cost source of financing for most consumers that own a home.
Consumer
We continue to be pleased with the ongoing recovery of our Consumer segment, which again performed quite well, with revenue of $106.1 million in the second quarter of 2022, up 40% from the second quarter of 2021, and profit of $44.6 million in the second quarter of 2022, up 34% from the second quarter of 2021.
Personal loans revenue of $42.3 million in the second quarter of 2022 was up 68% from the second quarter of 2021 as consumers are able to access attractive rates for debt consolidation. Credit card balances continue to increase as a result of enduring consumer spending growth. Some of our lenders, however, have begun to tighten their underwriting criteria on the margin in order to reduce portfolio risk should a recession occur over the next few quarters. In response, we are helping our partners by providing segment level insights to help them win in this environment. Also, our new brand campaign features commercials specifically targeting our personal loan offering, providing additional awareness and driving demand, which we anticipate will lead to increased monetization.
Our credit card business generated revenue of $27.3 million in the second quarter of 2022, up 22% from the second quarter of 2021, driven by an increase in revenue per approval, as issuers looked to capitalize on summer travel demand. Margins in the segment remain lower than historical levels as we prioritize capturing partner spend and maximizing variable marketing dollars. The card business remains competitive, and we continue to diversify our marketing mix to pursue more profitable marketing channels and partnerships to expand our reach and attract more consumers. We expect these actions will lead to improved unit economics over time.
Small business again delivered a solid performance, achieving revenue growth of 81% in the second quarter of 2022 compared to the second quarter of 2021. We continue to add new lenders to our network, expanding and diversifying our marketplace for borrowers. We are focused on driving lender performance by providing insights and recommendations to grow originations and improve conversion rates. We believe being a valued partner to our lenders will help us continue to secure more marketing budget and gain share over time.
Insurance
The Insurance segment continues to recover after troughing in the fourth quarter of 2021, but the pace of recovery has been slower than initially expected. The industry is facing prolonged headwinds due to inflation, supply chain challenges, and rising accident severity and frequency. This challenging environment limited growth in the quarter, with revenue of $81.8 million in
the second quarter of 2022, down 8% from the second quarter of 2021. Segment profit of $22.6 million in the second quarter of 2022 was down 32% from the second quarter of 2021.
We anticipate the property and casualty insurance industry will continue to be challenged through the rest of the year. Most of our top carrier partners have indicated lower budgets in the third quarter of 2022 due to profitability concerns as well as the threat of hurricane season. Our top priority is to maintain as much budget as possible with our partners by delivering high quality, high intent leads that achieve and exceed their targets. We believe positioning ourselves as a first class partner will allow us to capture additional share of carrier marketing spend when budgets return.
We continued our focus on agency expansion and efficiency for both the property and casualty and Medicare businesses.
Variable Marketing Margin
We report variable marketing expense and variable marketing margin as a supplemental measuremeasures to GAAP. This measure isaccounting principles generally accepted in the United States of America ("GAAP".) These related measures are the primary metricmetrics by which we measure the effectiveness of our marketing efforts. Variable marketing expense represents the portion of selling and marketing expense attributable to variable costs paid for advertising, direct marketing, and related expenses, and excludes overhead, fixed costs, and personnel-related expenses. Variable marketing margin is a measure of the efficiency of our operating model, measuring revenue after subtracting variable marketing and advertising costs that directly influence revenue.expense. Our operating model is highly sensitive to the amount and efficiency of variable marketing expenditures, and our proprietary systems are able to make rapidly changing decisions concerning the deployment of variable marketing expenditures (primarily but not exclusively online and mobile advertising placement) based on proprietary and sophisticated analytics. We believe that investors should have access to the same set of tools that we use in analyzing our results. This non-GAAP measure should be considered in addition to results prepared in
accordance with GAAP but should not be considered a substitute for or superior to GAAP results. We provide and encourage investors to examine the reconciling adjustments between the GAAP and non-GAAP measures discussed below.
Variable marketing expense is defined as the expense attributable to variable costs paid for advertising, direct marketing and related expenses, and excluding overhead, fixed costs and personnel-related expenses. The majority of these variable advertising costs are expressly intended to drive traffic to our websites and these variable advertising costs are included in selling and marketing expense on our consolidated statements of operations and comprehensive income (loss). Variable marketing margin is defined as revenue less variable marketing expense.
The following shows the calculation of variable marketing margin:
| | | | | | | | | | | | | | | | | | | | | | | |
| Three Months Ended
June 30, | | Six Months Ended
June 30, |
| | 2023 | | 2022 | | 2023 | | 2022 |
| (in thousands) |
| Revenue | $ | 182,453 | | | $ | 261,923 | | | $ | 382,961 | | | $ | 545,101 | |
| Variable marketing expense | 105,958 | | | 171,152 | | | 230,357 | | | 360,228 | |
| Variable marketing margin | $ | 76,495 | | | $ | 90,771 | | | $ | 152,604 | | | $ | 184,873 | |
Below is a reconciliation of selling and marketing expense, the most directly comparable GAAP measure, to variable marketing expense:
| | | | | | | | | | | | | | | | | | | | | | | |
| Three Months Ended
June 30, | | Six Months Ended
June 30, |
| | 2023 | | 2022 | | 2023 | | 2022 |
| (in thousands) |
| Selling and marketing expense | $ | 116,065 | | | $ | 184,537 | | | $ | 253,176 | | | $ | 388,694 | |
| Non-variable selling and marketing expense | (10,107) | | | (13,385) | | | (22,819) | | | (28,466) | |
| Variable marketing expense | $ | 105,958 | | | $ | 171,152 | | | $ | 230,357 | | | $ | 360,228 | |
The following is a reconciliation of net (loss) income, from continuing operationsthe most directly comparable GAAP measure, to variable marketing margin (in thousands):margin:
| | | Three Months Ended
June 30, | | Six Months Ended
June 30, | | Three Months Ended
June 30, | | Six Months Ended
June 30, |
| | | 2022 | | 2021 | | 2022 | | 2021 | | 2023 | | 2022 | | 2023 | | 2022 |
| Net (loss) income from continuing operations | $ | (8,038) | | $ | 9,800 | | $ | (18,861) | | $ | 29,112 | |
| | | (in thousands) |
| Net (loss) income | | Net (loss) income | $ | (115) | | $ | (8,038) | | $ | 13,342 | | $ | (18,864) |
| | | Adjustments to reconcile to variable marketing margin: | Adjustments to reconcile to variable marketing margin: | | Adjustments to reconcile to variable marketing margin: | |
| Cost of revenue | Cost of revenue | 14,574 | | 13,934 | | 30,135 | | 27,829 | Cost of revenue | 9,302 | | 14,574 | | 23,062 | | 30,135 |
| Non-variable selling and marketing expense (1) | Non-variable selling and marketing expense (1) | 13,385 | | 13,610 | | 28,466 | | 27,370 | Non-variable selling and marketing expense (1) | 10,107 | | 13,385 | | 22,819 | | 28,466 |
| General and administrative expense | General and administrative expense | 40,289 | | 39,811 | | 76,262 | | 74,800 | General and administrative expense | 29,160 | | 40,291 | | 65,843 | | 76,268 |
| Product development | Product development | 14,318 | | 13,290 | | 28,370 | | 25,758 | Product development | 10,601 | | 14,318 | | 25,256 | | 28,370 |
| Depreciation | Depreciation | 4,896 | | 4,443 | | 9,750 | | 8,161 | Depreciation | 4,684 | | 4,896 | | 9,479 | | 9,750 |
| Amortization of intangibles | Amortization of intangibles | 7,075 | | 11,310 | | 14,992 | | 22,622 | Amortization of intangibles | 1,982 | | 7,075 | | 4,031 | | 14,992 |
| Change in fair value of contingent consideration | — | | (8,850) | | — | | (8,053) | |
| | Restructuring and severance | Restructuring and severance | 135 | | — | | 3,760 | | — | Restructuring and severance | 3,558 | | 135 | | 8,012 | | 3,760 |
| Litigation settlements and contingencies | Litigation settlements and contingencies | (7) | | 322 | | (34) | | 338 | Litigation settlements and contingencies | 488 | | (7) | | 500 | | (34) |
| Interest expense, net | 6,765 | | 9,840 | | 14,270 | | 20,055 | |
| Other income | (284) | | — | | (283) | | (40,072) | |
| Income tax benefit | (2,337) | | (9,092) | | (1,954) | | (454) | |
| Interest expense (income), net | | Interest expense (income), net | 6,940 | | 6,765 | | (18,089) | | 14,270 |
| Other (income) expense | | Other (income) expense | (439) | | (284) | | (2,273) | | (283) |
| Income tax expense (benefit) | | Income tax expense (benefit) | 227 | | (2,339) | | 622 | | (1,957) |
| Variable marketing margin | Variable marketing margin | $ | 90,771 | | $ | 98,418 | | $ | 184,873 | | $ | 187,466 | Variable marketing margin | $ | 76,495 | | $ | 90,771 | | $ | 152,604 | | $ | 184,873 |
|
| | | | | |
| |
| (1) | | Represents the portion of selling and marketing expense not attributable to variable costs paid for advertising, direct marketing and related expenses. Includes overhead, fixed costs and personnel-related expenses. |
Adjusted EBITDA
We report Adjusted EBITDA as a supplemental measure to GAAP. This measure is the primary metric by which we evaluate the performance of our businesses, on which our marketing expenditures and internal budgets are based and by which, in most years, management and many employees are compensated. We believe that investors should have access to the same set of tools that we use in analyzing our results. This non-GAAP measure should be considered in addition to results prepared in accordance with GAAP but should not be considered a substitute for or superior to GAAP results. We provide and encourage investors to examine the reconciling adjustments between the GAAP and non-GAAP measures discussed below.
Definition of Adjusted EBITDA
We report Adjusted EBITDA as net income from continuing operations adjusted to exclude interest, income tax, amortization of intangibles and depreciation, and to further exclude (1) non-cash compensation expense, (2) non-cash impairment charges, (3) gain/loss on disposal of assets, (4) gain/loss on investments (5) restructuring and severance expenses, (6) litigation settlements and contingencies, (7) acquisitions and dispositions income or expense (including with respect to changes in fair value of contingent consideration), (8) contributions to the LendingTree Foundation, (9) dividend income, and (9)(10) one-time items. Adjusted EBITDA has certain limitations in that it does not take into account the impact to our statement of operations of certain expenses, including depreciation, non-cash compensation and acquisition-related accounting. We endeavor to compensate for the limitations of the non-GAAP measures presented by also providing the comparable GAAP measures with equal or greater prominence and descriptions of the reconciling items, including quantifying such items, to derive the non-GAAP measures. These non-GAAP measures may not be comparable to similarly titled measures used by other companies.
One-Time Items
Adjusted EBITDA is adjusted for one-time items, if applicable. Items are considered one-time in nature if they are non-recurring, infrequent, or unusual and have not occurred in the past two years or are not expected to recur in the next two years,
in accordance with SEC rules. For the periods presented below, one-time items consisted of the franchise tax caused by the equity investment gain in Stash.Stash Financial, Inc..
Non-Cash Expenses that are Excluded from Adjusted EBITDA
Non-cash compensation expense consists principally of expense associated with grants of restricted stock, restricted stock units and stock options, some of which awards have performance-based vesting conditions. Non-cash compensation expense also includes expense associated with employee stock purchase plans. These expenses are not paid in cash, and we include the related shares in our calculations of fully diluted shares outstanding. Upon settlement of restricted stock units, exercise of certain stock options or vesting of restricted stock awards, the awards may be settled, on a net basis, with us remitting the required tax withholding amount from our current funds.
Amortization of intangibles are non-cash expenses relating primarily to intangible assets acquired through acquisitions. At the time of an acquisition, the intangible assets of the acquired company, such as purchase agreements, technology and customer relationships, are valued and amortized over their estimated lives.
The following table is a reconciliation of net (loss) income, from continuing operationsthe most directly comparable GAAP measure, to Adjusted EBITDA (in thousands).EBITDA.
| | | Three Months Ended
June 30, | | Six Months Ended
June 30, | | Three Months Ended
June 30, | | Six Months Ended
June 30, |
| | | 2022 | | 2021 | | 2022 | | 2021 | | 2023 | | 2022 | | 2023 | | 2022 |
| Net (loss) income from continuing operations | $ | (8,038) | | | $ | 9,800 | | | $ | (18,861) | | | $ | 29,112 | | |
| | | (in thousands) |
| Net (loss) income | | Net (loss) income | $ | (115) | | | $ | (8,038) | | | $ | 13,342 | | | $ | (18,864) | |
| Adjustments to reconcile to Adjusted EBITDA: | Adjustments to reconcile to Adjusted EBITDA: | | | | | Adjustments to reconcile to Adjusted EBITDA: | | | | |
| Amortization of intangibles | Amortization of intangibles | 7,075 | | | 11,310 | | | 14,992 | | | 22,622 | | Amortization of intangibles | 1,982 | | | 7,075 | | | 4,031 | | | 14,992 | |
| Depreciation | Depreciation | 4,896 | | | 4,443 | | | 9,750 | | | 8,161 | | Depreciation | 4,684 | | | 4,896 | | | 9,479 | | | 9,750 | |
| Restructuring and severance | Restructuring and severance | 135 | | | — | | | 3,760 | | | — | | Restructuring and severance | 3,558 | | | 135 | | | 8,012 | | | 3,760 | |
| Loss on impairments and disposal of assets | Loss on impairments and disposal of assets | 2,996 | | | 1,052 | | | 3,427 | | | 1,400 | | Loss on impairments and disposal of assets | 140 | | | 2,996 | | | 5,167 | | | 3,427 | |
| Gain on investments | — | | | — | | | — | | | (40,072) | | |
| Loss on investments | | Loss on investments | 1,440 | | | — | | | 1,440 | | | — | |
| Non-cash compensation expense | Non-cash compensation expense | 17,335 | | | 18,294 | | | 31,332 | | | 34,730 | | Non-cash compensation expense | 9,204 | | | 17,335 | | | 20,407 | | | 31,332 | |
| Franchise tax caused by equity investment gain | Franchise tax caused by equity investment gain | — | | | — | | | 1,500 | | | — | | Franchise tax caused by equity investment gain | — | | | — | | | — | | | 1,500 | |
| Change in fair value of contingent consideration | — | | | (8,850) | | | — | | | (8,053) | | |
| | Acquisition expense | Acquisition expense | 58 | | | 1,110 | | | 67 | | | 1,139 | | Acquisition expense | 4 | | | 58 | | | (5) | | | 67 | |
| Litigation settlements and contingencies | Litigation settlements and contingencies | (7) | | | 322 | | | (34) | | | 338 | | Litigation settlements and contingencies | 488 | | | (7) | | | 500 | | | (34) | |
| Interest expense, net | 6,765 | | | 9,840 | | | 14,270 | | | 20,055 | | |
| Interest (income) expense, net | | Interest (income) expense, net | 6,940 | | | 6,765 | | | (18,089) | | | 14,270 | |
| Dividend income | Dividend income | (282) | | | — | | | (282) | | | — | | Dividend income | (1,879) | | | (282) | | | (3,713) | | | (282) | |
| Income tax benefit | (2,337) | | | (9,092) | | | (1,954) | | | (454) | | |
| Income tax expense (benefit) | | Income tax expense (benefit) | 227 | | | (2,339) | | | 622 | | | (1,957) | |
| Adjusted EBITDA | Adjusted EBITDA | $ | 28,596 | | | $ | 38,229 | | | $ | 57,967 | | | $ | 68,978 | | Adjusted EBITDA | $ | 26,673 | | | $ | 28,594 | | | $ | 41,193 | | | $ | 57,961 | |
Financial Position, Liquidity and Capital Resources
General
As of June 30, 2022,2023, we had $279.1$162.6 million of cash and cash equivalents, compared to $251.2$298.8 million of cash and cash equivalents as of December 31, 2021.2022.
On March 8, 2023, we repurchased approximately $190.6 million in principal amount of our 2025 Notes, through separate transactions with certain holders of the 2025 Notes, for $156.3 million plus accrued and unpaid interest of approximately $0.1 million. In the first quarter of 2022,2023, we acquired an equityrecognized a gain on the extinguishment of $34.3 million, a loss on the write-off of unamortized debt issuance costs of $2.4 million and incurred debt repayment costs of $1.0 million, all of which are included in interest income/expense, net in EarnUp Inc. (“EarnUp”) for $15.0 million.the consolidated statement of operations and comprehensive income. See Note 7—Equity Investment to the consolidated financial statements included elsewhere in this report for additional information on the equity interest.
On May 31, 2022, we drew $250.0 million on the Term Loan Facility. A portion of this was used to pay the outstanding balance of $169.7 million and interest on our 0.625% Convertible Senior Notes that matured on June 1, 2022. See Note 12—13—Debt for additional information.
We expect our cash and cash equivalents and cash flows from operations to be sufficient to fund our operating needs for the next twelve months and beyond. Our credit facility described below is an additional potential source of liquidity. We will
continue to monitor the impact of the current economic conditions, including interest rates, inflation, and ongoing COVID-19 pandemic and inflation on our liquidity and capital resources.
Credit Facility
On September 15, 2021, we entered into a credit agreement (the “Credit Agreement”), consisting of a $200.0 million revolving credit facility (the “Revolving Facility”), which matures on September 15, 2026, and a $250.0 million delayed draw term loan facility (the “Term Loan Facility” and together with the Revolving Facility, the “Credit Facility”), which matures on September 15, 2028. The proceeds of the Revolving Facility can be used to finance working capital, for general corporate purposes and any other purpose not prohibited by the Credit Agreement. We borrowed $250.0 million under the delayed draw term loan on May 31, 2022 and used $170.2 million of the proceeds to settle the Company’s 2022 Notes, including interest. The remaining proceeds of $79.8 million may be used for general corporate purposes and any other purposes not prohibited by the Credit Agreement. See Note 12—13—Debt for additional information.
As of July 29, 2022,27, 2023, we have outstanding $250.0$247.5 million under the Term Loan Facility, a $0.2 million letter of credit under the Revolving Facility and the remaining borrowing capacity under the Revolving Facility is $199.8 million. We have $101.1 million available for borrowing under the Revolving Facility as of July 27, 2023.
Our cash flows attributable to continuing operations are as follows:
| | | | Six Months Ended
June 30, | | Six Months Ended
June 30, |
| | | 2022 | | 2021 | | 2023 | | 2022 |
| | | (in thousands) | | (in thousands) |
| Net cash provided by operating activities | Net cash provided by operating activities | $ | 16,099 | | | $ | 54,580 | | Net cash provided by operating activities | $ | 28,224 | | | $ | 16,093 | |
| Net cash used in investing activities | Net cash used in investing activities | (22,786) | | | (24,765) | | Net cash used in investing activities | (4,853) | | | (22,786) | |
| Net cash provided by (used in) financing activities | 34,584 | | | (4,970) | | |
| Net cash (used in) provided by financing activities | | Net cash (used in) provided by financing activities | (159,665) | | | 34,584 | |
Cash Flows from Operating Activities
Our largest source of cash provided by our operating activities is revenues generated by our products. Our primary uses of cash from our operating activities include advertising and promotional payments. In addition, our uses of cash from operating activities include compensation and other employee-related costs, other general corporate expenditures, litigation settlements and contingencies, certain contingent consideration payments, and income taxes.
Net cash provided by operating activities attributable to continuing operations decreasedincreased in the first six months of 20222023 from the first six months of 20212022 primarily due to unfavorablefavorable changes in income taxesaccounts receivable and prepaid and other current assets, and accounts payable, accrued expenses and other current liabilities, partially offset by favorable changes in accounts receivable.assets.
Cash Flows from Investing Activities
Net cash used in investing activities attributablein the first six months of 2023 of $4.9 million consisted of capital expenditures primarily related to continuing operationsinternally developed software.
Net cash used in investing activities in the first six months of 2022 of $22.8 million consisted of the purchase of a $16.4 million equity interest in EarnUp and another small investment, as well as capital expenditures of $6.3 million primarily related to internally developedinternally-developed software.
Net cash used in investing activities attributable to continuing operations in the first six months of 2021 of $24.8 million consisted of capital expenditures of $23.6 million primarily related to internally developed software and leasehold improvements for our new principal corporate offices, as well as the purchase of an additional $1.2 million equity interest in Stash.
Cash Flows from Financing Activities
Net cash used in financing activities in the first six months of 2023 of $159.7 million consisted primarily of the repurchase of our Convertible Senior Notes for $156.3 million.
Net cash provided by financing activities attributable to continuing operations in the first six months of 2022 of $34.6 million consisted primarily of $250.0 million in proceeds from the term loan and the repayment of $169.7 million to settle the Company’sour 2022 Notes discussed in the “Credit Facility” section above, $43.0 million for the repurchase of our stock, and $2.7 million in withholding taxes paid upon surrender of shares to satisfy obligations on equity awards, net of proceeds from the exercise of stock options.
Net cash used in financing activities attributable to continuing operations in the first six months
Off-Balance Sheet Arrangements
We have no off-balance sheet arrangements other than a letter of credit and our funding commitments pursuant to our surety bonds, none of which have or are reasonably likely to have a current or future effect on our financial condition, changes in financial condition, revenues or expenses, results of operations, liquidity, capital expenditures or capital resources that is material to investors.
New Accounting Pronouncements
For information regarding new accounting pronouncements, see Note 2—Significant Accounting Policies, in Part I, Item 1 Financial Statements.
Item 3. Quantitative and Qualitative Disclosures about Market Risk
Other than our Credit Facility, we do not have any financial instruments that are exposed to significant market risk. We maintain our cash and cash equivalents in bank deposits and short-term, highly liquid money market investments. A hypothetical 100-basis point increase or decrease in market interest rates would not have a material impact on the fair value of our cash equivalents securities, or our earnings on such cash equivalents, but would have a $2.5 million annual effect on the interest paid on borrowings under the Credit Facility. As of July 29, 2022,27, 2023, the Company had $250$247.5 million outstanding on its Term Loan Facility, and there were no outstanding borrowings under its Revolving Facility.
Fluctuations in interest rates affect consumer demand for new mortgages and the level of refinancing activity which, in turn, affects lender demand for mortgage leads. Typically, when interest rates decline, we see increased consumer demand for mortgage refinancing, which in turn leads to increased traffic to our website and decreased selling and marketing efforts associated with that traffic. At the same time, lender demand for leads from third-party sources typically decreases, as there are more consumers in the marketplace seeking refinancings and, accordingly, lenders receive more organic lead volume. Due to lower lender demand, our revenue earned per consumer typically decreases but with correspondingly lower selling and marketing costs. Conversely, when interest rates increase, we typically see decreased consumer demand for mortgage refinancing, leading to decreased traffic to our website and higher associated selling and marketing efforts associated with that traffic. At the same time, lender demand for leads from third-party sources typically increases, as there are fewer consumers in the marketplace and, accordingly, the supply of organic mortgage lead volume decreases. Due to high lender demand, we typically see an increase in the amount lenders will pay per matched lead, which often leads to higher revenue earned per consumer. However, increases in the amount lenders will pay per matched lead in this situation is limited by the overall cost models of our lenders, and our revenue earned per consumer can be adversely affected by the overall reduced demand for refinancing in a rising rate environment.
Item 4. Controls and Procedures
Evaluation of Disclosure Controls and Procedures
As required by Rule 13a-15(b) of the Securities Exchange Act of 1934, as amended (the “Exchange Act”), management, with the participation of our principal executive officer (our Chief Executive Officer) and principal financial officer (our Chief Financial Officer), evaluated, as of the end of the period covered by this report, the effectiveness of our disclosure controls and procedures. The term “disclosure controls and procedures,” as defined in Rules 13a-15(e) and 15d-15(e) under the Exchange Act, Rule 13a-15(e).means controls and other procedures of a company that are designed to ensure that information required to be disclosed by a company in the reports that it files under the Exchange Act is recorded, processed, summarized and reported, within the time periods specified in the SEC’s rules and forms. Disclosure controls and procedures include, without limitation, controls and procedures designed to ensure that information required to be disclosed by a company in the reports that it files under the Exchange Act is accumulated and communicated to a company’s management, including its principal executive officer and principal financial officer, as appropriate to allow timely decisions regarding required disclosure. Based upon that evaluation, our Chief Executive Officer and Chief Financial Officer concluded that our disclosure controls and procedures are effective, as of June 30, 2022,2023, to reasonably ensure that information required to be disclosed and filed under the Exchange Act is recorded, processed, summarized and reported within the time periods specified, and that management will be timely alerted to material information required to be included in our periodic reports filed with the Securities and Exchange Commission.
Changes in Internal Control Over Financial Reporting
There was no change in our internal control over financial reporting that occurred during the quarter ended June 30, 20222023 that has materially affected, or is reasonably likely to materially affect, our internal controls over financial reporting.
PART II—OTHER INFORMATION
Item 1. Legal Proceedings
In the ordinary course of business, we are party to litigation involving property, contract, intellectual property, data privacy and security, and a variety of other claims. The amounts that may be recovered in such matters may be subject to insurance coverage. We have provided information about certain legal proceedings in which we are involved in Part I, Item 3. Legal Proceedings of our 20212022 Annual Report and updated that information in Note 13—14—Contingencies to the consolidated financial statements included elsewhere in this report.Quarterly Report on Form 10-Q.
Item 1A. Risk Factors
Risk factors that affect our business and financial results are discussed in Part I, Item 1A "Risk Factors," in our 2022 Annual Report. There have been no material changes to the risk factors included in Part I, Item 1A. Risk Factors of our 20212022 Annual Report.
You should carefully consider the risks described in our 2022 Annual Report, which could materially affect our business, financial condition or future results. The risks described in our 2022 Annual Report are not the only risks we face. Additional risks and uncertainties not currently known to us or that we currently deem to be immaterial also may materially adversely affect our business, financial condition, and/or operating results. If any of the risks actually occur, our business, financial condition, and/or results of operations could be negatively affected.
Item 2. Unregistered Sales of Equity Securities and Use of Proceeds
Issuer Purchases of Equity Securities
In each of February 2018 and February 2019, the board of directors authorized and we announced a stock repurchase program which allowed for the repurchase of up to $100.0 million and $150.0 million, respectively, of our common stock. Under this program, we can repurchase stock in the open market or through privately-negotiated transactions. We have used available cash to finance these repurchases. We will determine the timing and amount of any additional repurchases based on our evaluation of market conditions, applicable SEC guidelines and regulations, and other factors. This program may be suspended or discontinued at any time at the discretion of our board of directors. During the quarter ended June 30, 2022,2023, no shares of common stock were repurchased under the stock repurchase program. As of July 21, 202224, 2023, approximately $96.7 million remains authorized for share repurchase.
Additionally, the LendingTree Seventh Amended and Restated 2008 Stock Plan allowed employees to forfeit shares of our common stock to satisfy federal and state withholding obligations upon the exercise of stock options, the settlement of restricted stock unit awards and the vesting of restricted stock awards granted to those individuals under the plans. During the quarter ended June 30, 2022, 2,2102023, 5,644 shares were purchased related to these obligations under the LendingTree Seventh Amended and Restated 2008 Stock Plan. The withholding of those shares does not affect the dollar amount or number of shares that may be purchased under the stock repurchase program described above.
The following table provides information about the Company's purchases of equity securities during the quarter ended June 30, 2022.2023.
| | | | | | | | | | | | | | | | | | | | | | | | | | |
| Period | | Total Number of Shares Purchased (1) | | Average Price
Paid per Share | | Total Number of Shares Purchased as Part of Publicly Announced Plans or Programs (2) | | Approximate
Dollar Value of Shares
that May Yet Be
Purchased Under the
Plans or Programs |
| | | | | | | | (in thousands) |
| 4/1/2022 - 4/30/2022 | | 568 | | | $ | 114.96 | | | — | | | $ | 96,655 | |
| 5/1/2022 - 5/31/2022 | | 691 | | | $ | 79.40 | | | — | | | $ | 96,655 | |
| 6/1/2022 - 6/30/2022 | | 951 | | | $ | 68.74 | | | — | | | $ | 96,655 | |
| Total | | 2,210 | | | $ | 83.95 | | | — | | | $ | 96,655 | |
| | | | | | | | | | | | | | | | | | | | | | | | | | |
| Period | | Total Number of Shares Purchased (1) | | Average Price
Paid per Share | | Total Number of Shares Purchased as Part of Publicly Announced Plans or Programs (2) | | Approximate
Dollar Value of Shares
that May Yet Be
Purchased Under the
Plans or Programs |
| | | | | | | | (in thousands) |
| 4/1/2023 - 4/30/2023 | | 573 | | | $ | 25.08 | | | — | | | $ | 96,655 | |
| 5/1/2023 - 5/31/2023 | | 861 | | | $ | 18.46 | | | — | | | $ | 96,655 | |
| 6/1/2023 - 6/30/2023 | | 4,210 | | | $ | 21.62 | | | — | | | $ | 96,655 | |
| Total | | 5,644 | | | $ | 21.49 | | | — | | | $ | 96,655 | |
(1)During April 2022,2023, May 20222023 and June 2022, 5682023, 573 shares, 691861 shares and 9514,210 shares, respectively (totaling 2,2105,644 shares), were purchased to satisfy federal and state withholding obligations of our employees upon the settlement of restricted stock units, all in accordance with our Seventh Amended and Restated 2008 Stock Plan, as described above.
(2)See the narrative disclosure above the table for further description of our publicly announced stock repurchase program.
Item 5. Other Information
During the fiscal quarter ended June 30, 2023, none of the Company's directors or executive officers adopted or terminated any contract, instruction or written plan for the purchase or sale of Company securities that was intended to satisfy the affirmative defense conditions of Rule 10b5-1(c) or any "non-Rule 10b5-1 trading arrangement."
On July 26, 2023, the Company’s directors adopted the LendingTree, Inc. 2023 Inducement Grant Plan (the “Inducement Plan”) and, subject to the adjustment provisions of the Inducement Plan, reserved 100,000 shares of the Company’s common stock for issuance pursuant to equity awards to be granted under the Inducement Plan.
The Inducement Plan was adopted without stockholder approval pursuant to Rule 5635(c)(4) of the Nasdaq Listing Rules. The Inducement Plan provides for the grant of stock options, stock appreciation rights, restricted stock units, and other types of equity-based incentive compensation. The terms and conditions of the Inducement Plan are substantially similar to the Company’s 2023 Stock Plan (as was described in our proxy statement for the 2023 annual stockholder meeting), but with such other terms and conditions intended to comply with the Nasdaq inducement award rules and which are generally not applicable to inducement plans (e.g., no statutory incentive stock options could be granted under the Inducement Plan and only non-qualified options may be granted). On July 26, 2023, the Board also adopted forms of award agreements for use with the Inducement Plan.
In accordance with Rule 5635(c)(4) of the Nasdaq Listing Rules, the only persons eligible to receive grants of equity awards under the Inducement Plan are individuals who were not previously an employee or director of the Company, or following a bona fide period of non-employment, as an inducement material to such persons entering into employment with the Company.
The above description of the Inducement Plan and the award agreements thereunder is not complete and is qualified in its entirety by reference to the text of the Inducement Plan and its forms of award agreements, complete copies of which are filed herewith as Exhibits 10.1, 10.2, and 10.3, respectively, and are incorporated herein by reference.
None.
Item 6. Exhibits
| | | | | | | | | | | | | | |
| Exhibit | | Description | | Location |
| | | | |
| 3.1 | | | | | Exhibit 3.1 to the Registrant's Current Report on Form 8-K filed August 25, 2008 |
| 3.2 | | | | | Exhibit 3.1 to the Registrant's Current Report on Form 8-K filed November 15, 2017 |
| 10.1 | | | | | † |
| 10.2 | | | | | † |
| 10.3 | | | | | † |
| 31.1 | | | | | † |
| 31.2 | | | | | † |
| 32.1 | | | | | †† |
| 32.2 | | | | | †† |
| 101.INS | | XBRL Instance Document — The instance document does not appear in the Interactive Data File because its XBRL tags are embedded within the Inline XBRL document. | | ††† |
| 101.SCH | | XBRL Taxonomy Extension Schema Document | | ††† |
| 101.CAL | | XBRL Taxonomy Extension Calculation Linkbase Document | | ††† |
| 101.DEF | | XBRL Taxonomy Extension Definition Linkbase Document | | ††† |
| 101.LAB | | XBRL Taxonomy Extension Label Linkbase Document | | ††† |
| 101.PRE | | XBRL Taxonomy Extension Presentation Linkbase Document | | ††† |
| 104 | | Cover Page Interactive Data File (embedded within the Inline XBRL document contained in Exhibit 101) | | ††† |
† Filed herewith.
†† Furnished herewith. This certification is being furnished solely to accompany this report pursuant to 18 U.S.C. 1350, and is not being filed for purposes of Section 18 of the Securities Exchange Act of 1934, as amended, and is not to be incorporated by reference into any filing of the registrant, whether made before or after the date hereof, regardless of any general incorporation language in such filing.
††† Furnished herewith. Pursuant to Rule 406T of Regulation S-T, the Interactive Data Files on Exhibit 101 hereto are deemed not filed or part of a registration statement or prospectus for purposes of Sections 11 or 12 of the Securities Act of 1933, as amended, are deemed not filed for purposes of Section 18 of the Securities Exchange Act of 1934, as amended, and otherwise are not subject to liability under those sections.
SIGNATURE
Pursuant to the requirements of the Securities Exchange Act of 1934, the registrant has duly caused this report to be signed on its behalf by the undersigned thereunto duly authorized.
Date: July 29, 202227, 2023
| | | | | | | | |
| | LENDINGTREE, INC. |
| | | |
| | By: | /s/ TRENT ZIEGLER |
| | | Trent Ziegler |
| | | Chief Financial Officer |
| | (principal financial officer and duly authorized officer) |