UNITED STATES
SECURITIES AND EXCHANGE COMMISSION
Washington, D.C. 20549
FORM 10-Q
| | | | | |
| ☒ | QUARTERLY REPORT PURSUANT TO SECTION 13 OR 15(d) OF THE SECURITIES EXCHANGE ACT OF 1934 |
For the Quarterly Period Ended June 30, 2023March 31, 2024
or
| | | | | |
| ☐ | TRANSITION REPORT PURSUANT TO SECTION 13 OR 15(d) OF THE SECURITIES EXCHANGE ACT OF 1934 |
For the transition period from to
Commission File No. 001-34063
LendingTree, Inc.
(Exact name of Registrant as specified in its charter)
| | | | | | | | |
| Delaware | | 26-2414818 |
| (State or other jurisdiction of incorporation or organization) | | (I.R.S. Employer Identification No.) |
1415 Vantage Park Dr., Suite 700, Charlotte, North Carolina 28203
(Address of principal executive offices)(Zip Code)
(704) 541-5351
(Registrant's telephone number, including area code)
Securities registered pursuant to Section 12(b) of the Act:
| | | | | | | | | | | | | | |
| Title of each class | | Trading Symbol(s) | | Name of each exchange on which registered |
| Common Stock, $0.01 par value per share | | TREE | | The Nasdaq Stock Market LLC |
Indicate by check mark whether the registrant (1) has filed all reports required to be filed by Section 13 or 15(d) of the Securities Exchange Act of 1934 during the preceding 12 months (or for such shorter period that the registrant was required to file such reports), and (2) has been subject to such filing requirements for the past 90 days. Yes ☒ No ☐
Indicate by check mark whether the registrant has submitted electronically every Interactive Data File required to be submitted pursuant to Rule 405 of Regulation S-T (§232.405 of this chapter) during the preceding 12 months (or for such shorter period that the registrant was required to submit such files). Yes ☒ No ☐
Indicate by check mark whether the registrant is a large accelerated filer, an accelerated filer, a non-accelerated filer, a smaller reporting company, or an emerging growth company. See the definitions of “large accelerated filer,” “accelerated filer,” “smaller reporting company,” and “emerging growth company” in Rule 12b-2 of the Exchange Act.
| | | | | | | | | | | | | | |
| Large accelerated filer | ☐ | | Accelerated filer | ☒ |
| Non-accelerated filer | ☐ | | Smaller reporting company | ☐ |
| | | Emerging growth company | ☐ |
If an emerging growth company, indicate by check mark if the registrant has elected not to use the extended transition period for complying with any new or revised financial accounting standards provided pursuant to Section 13(a) of the Exchange Act. ☐
Indicate by check mark whether the registrant is a shell company (as defined in Rule 12b-2 of the Exchange Act). Yes ☐ No ☒
As of July 24, 2023,April 26, 2024, there were 12,971,48113,224,515 shares of the registrant's common stock, par value $.01$0.01 per share, outstanding, excluding treasury shares.
PART I—FINANCIAL INFORMATION
Item 1. Financial Statements
LENDINGTREE, INC. AND SUBSIDIARIES
CONSOLIDATED STATEMENTS OF OPERATIONS AND COMPREHENSIVE INCOMEBALANCE SHEETS
(Unaudited) | | | | | | | | | | | | | | | | | | | | | | | |
| | Three Months Ended
June 30, | | Six Months Ended
June 30, |
| | 2023 | | 2022 | | 2023 | | 2022 |
| | (in thousands, except per share amounts) |
| Revenue | $ | 182,453 | | | $ | 261,923 | | | $ | 382,961 | | | $ | 545,101 | |
| Costs and expenses: | | | | | | | |
Cost of revenue (exclusive of depreciation and amortization shown separately below) | 9,302 | | | 14,574 | | | 23,062 | | | 30,135 | |
| Selling and marketing expense | 116,065 | | | 184,537 | | | 253,176 | | | 388,694 | |
| General and administrative expense | 29,160 | | | 40,291 | | | 65,843 | | | 76,268 | |
| Product development | 10,601 | | | 14,318 | | | 25,256 | | | 28,370 | |
| Depreciation | 4,684 | | | 4,896 | | | 9,479 | | | 9,750 | |
| Amortization of intangibles | 1,982 | | | 7,075 | | | 4,031 | | | 14,992 | |
| | | | | | | |
| Restructuring and severance | 3,558 | | | 135 | | | 8,012 | | | 3,760 | |
| Litigation settlements and contingencies | 488 | | | (7) | | | 500 | | | (34) | |
| Total costs and expenses | 175,840 | | | 265,819 | | | 389,359 | | | 551,935 | |
| Operating income (loss) | 6,613 | | | (3,896) | | | (6,398) | | | (6,834) | |
| Other income (expense), net: | | | | | | | |
| Interest (expense) income, net | (6,940) | | | (6,765) | | | 18,089 | | | (14,270) | |
| Other income | 439 | | | 284 | | | 2,273 | | | 283 | |
| Income (loss) before income taxes | 112 | | | (10,377) | | | 13,964 | | | (20,821) | |
| Income tax (expense) benefit | (227) | | | 2,339 | | | (622) | | | 1,957 | |
| Net (loss) income and comprehensive (loss) income | $ | (115) | | | $ | (8,038) | | | $ | 13,342 | | | $ | (18,864) | |
| | | | | | | |
| Weighted average shares outstanding: | | | | | | | |
| Basic | 12,915 | | | 12,723 | | | 12,881 | | | 12,812 | |
| Diluted | 12,915 | | | 12,723 | | | 12,912 | | | 12,812 | |
| Net (loss) income per share: | | | | | | | |
| Basic | $ | (0.01) | | | $ | (0.63) | | | $ | 1.04 | | | $ | (1.47) | |
| Diluted | $ | (0.01) | | | $ | (0.63) | | | $ | 1.03 | | | $ | (1.47) | |
| | | | | | | | | | | |
| | March 31,
2024 | | December 31,
2023 |
| | (in thousands, except par value and share amounts) |
| ASSETS: | | | |
| Cash and cash equivalents | $ | 230,745 | | | $ | 112,051 | |
| Restricted cash and cash equivalents | 16 | | | 5 | |
| Accounts receivable (net of allowance of $2,026 and $2,222, respectively) | 63,318 | | | 54,954 | |
| Prepaid and other current assets | 31,604 | | | 29,472 | |
| | | |
| | | |
| Total current assets | 325,683 | | | 196,482 | |
| Property and equipment (net of accumulated depreciation of $36,702 and $36,827, respectively) | 48,300 | | | 50,481 | |
| Operating lease right-of-use assets | 56,094 | | | 57,222 | |
| Goodwill | 381,539 | | | 381,539 | |
| Intangible assets, net | 49,132 | | | 50,620 | |
| | | |
| Equity investments | 60,076 | | | 60,076 | |
| Other non-current assets | 5,871 | | | 6,339 | |
| | | |
| Total assets | $ | 926,695 | | | $ | 802,759 | |
| | | |
| LIABILITIES: | | | |
| Current portion of long-term debt | $ | 14,899 | | | $ | 3,125 | |
| Accounts payable, trade | 3,097 | | | 1,960 | |
| Accrued expenses and other current liabilities | 69,717 | | | 70,544 | |
| | | |
| | | |
| | | |
| Total current liabilities | 87,713 | | | 75,629 | |
| Long-term debt | 631,333 | | | 525,617 | |
| Operating lease liabilities | 73,637 | | | 75,023 | |
| | | |
| Deferred income tax liabilities | 2,219 | | | 2,091 | |
| Other non-current liabilities | 278 | | | 267 | |
| Total liabilities | 795,180 | | | 678,627 | |
| Commitments and contingencies (Note 13) | | | |
| SHAREHOLDERS' EQUITY: | | | |
| Preferred stock $0.01 par value; 5,000,000 shares authorized; none issued or outstanding | — | | | — | |
| Common stock $0.01 par value; 50,000,000 shares authorized; 16,577,446 and 16,396,911 shares issued, respectively, and 13,221,980 and 13,041,445 shares outstanding, respectively | 166 | | | 164 | |
| Additional paid-in capital | 1,234,214 | | | 1,227,849 | |
| Accumulated deficit | (836,687) | | | (837,703) | |
| Treasury stock; 3,355,466 and 3,355,466 shares, respectively | (266,178) | | | (266,178) | |
| Total shareholders' equity | 131,515 | | | 124,132 | |
| Total liabilities and shareholders' equity | $ | 926,695 | | | $ | 802,759 | |
The accompanying notes to consolidated financial statements are an integral part of these statements.
LENDINGTREE, INC. AND SUBSIDIARIES
CONSOLIDATED BALANCE SHEETSSTATEMENTS OF OPERATIONS AND COMPREHENSIVE INCOME
(Unaudited)
| | | | | | | | | | | |
| | June 30,
2023 | | December 31,
2022 |
| | (in thousands, except par value and share amounts) |
| ASSETS: | | | |
| Cash and cash equivalents | $ | 162,641 | | | $ | 298,845 | |
| Restricted cash and cash equivalents | 34 | | | 124 | |
| Accounts receivable (net of allowance of $2,609 and $2,317, respectively) | 75,710 | | | 83,060 | |
| Prepaid and other current assets | 26,045 | | | 26,250 | |
| | | |
| Assets held for sale (Note 7) | — | | | 5,689 | |
| Total current assets | 264,430 | | | 413,968 | |
| Property and equipment (net of accumulated depreciation of $35,865 and $33,851, respectively) | 56,549 | | | 59,160 | |
| Operating lease right-of-use assets | 64,415 | | | 67,050 | |
| Goodwill | 420,139 | | | 420,139 | |
| Intangible assets, net | 54,284 | | | 58,315 | |
| | | |
| Equity investments | 173,140 | | | 174,580 | |
| Other non-current assets | 6,182 | | | 6,101 | |
| | | |
| Total assets | $ | 1,039,139 | | | $ | 1,199,313 | |
| | | |
| LIABILITIES: | | | |
| Current portion of long-term debt | $ | 2,500 | | | $ | 2,500 | |
| Accounts payable, trade | 3,174 | | | 2,030 | |
| Accrued expenses and other current liabilities | 74,204 | | | 75,095 | |
| | | |
| | | |
| Liabilities held for sale (Note 7) | — | | | 2,909 | |
| Total current liabilities | 79,878 | | | 82,534 | |
| Long-term debt | 625,240 | | | 813,516 | |
| Operating lease liabilities | 84,599 | | | 88,232 | |
| | | |
| Deferred income tax liabilities | 7,369 | | | 6,783 | |
| Other non-current liabilities | 338 | | | 308 | |
| Total liabilities | 797,424 | | | 991,373 | |
| Commitments and contingencies (Note 14) | | | |
| SHAREHOLDERS' EQUITY: | | | |
| Preferred stock $0.01 par value; 5,000,000 shares authorized; none issued or outstanding | — | | | — | |
| Common stock $0.01 par value; 50,000,000 shares authorized; 16,323,675 and 16,167,184 shares issued, respectively, and 12,968,209 and 12,811,718 shares outstanding, respectively | 163 | | | 162 | |
| Additional paid-in capital | 1,209,687 | | | 1,189,255 | |
| Accumulated deficit | (701,957) | | | (715,299) | |
| Treasury stock; 3,355,466 and 3,355,466 shares, respectively | (266,178) | | | (266,178) | |
| Total shareholders' equity | 241,715 | | | 207,940 | |
| Total liabilities and shareholders' equity | $ | 1,039,139 | | | $ | 1,199,313 | |
| | | | | | | | | | | | | | | |
| | Three Months Ended
March 31, | | |
| | 2024 | | 2023 | | | | |
| | (in thousands, except per share amounts) |
| Revenue | $ | 167,768 | | | $ | 200,508 | | | | | |
| Costs and expenses: | | | | | | | |
Cost of revenue (exclusive of depreciation and amortization shown separately below) | 8,545 | | | 13,760 | | | | | |
| Selling and marketing expense | 108,176 | | | 137,111 | | | | | |
| General and administrative expense | 25,796 | | | 36,683 | | | | | |
| Product development | 11,857 | | | 14,655 | | | | | |
| Depreciation | 4,667 | | | 4,795 | | | | | |
| Amortization of intangibles | 1,489 | | | 2,049 | | | | | |
| | | | | | | |
| Restructuring and severance | 23 | | | 4,454 | | | | | |
| Litigation settlements and contingencies | 36 | | | 12 | | | | | |
| Total costs and expenses | 160,589 | | | 213,519 | | | | | |
| Operating income (loss) | 7,179 | | | (13,011) | | | | | |
| Other income (expense), net: | | | | | | | |
| Interest (expense) income, net | (6,638) | | | 25,029 | | | | | |
| Other income | 1,034 | | | 1,834 | | | | | |
| Income before income taxes | 1,575 | | | 13,852 | | | | | |
| Income tax expense | (559) | | | (395) | | | | | |
| Net income and comprehensive income | $ | 1,016 | | | $ | 13,457 | | | | | |
| | | | | | | |
| Weighted average shares outstanding: | | | | | | | |
| Basic | 13,100 | | | 12,846 | | | | | |
| Diluted | 13,276 | | | 12,935 | | | | | |
| Net income per share: | | | | | | | |
| Basic | $ | 0.08 | | | $ | 1.05 | | | | | |
| Diluted | $ | 0.08 | | | $ | 1.04 | | | | | |
The accompanying notes to consolidated financial statements are an integral part of these statements.
LENDINGTREE, INC. AND SUBSIDIARIES
CONSOLIDATED STATEMENTS OF SHAREHOLDERS' EQUITY
(Unaudited)
| | | | | | | | | | | | | | | | | | | | | | | | | | | | | | | | | | | | | | | | | |
| | | | Common Stock | | | | | | Treasury Stock |
| | Total | | Number
of Shares | | Amount | | Additional
Paid-in
Capital | | Accumulated
Deficit | | Number
of Shares | | Amount |
| | (in thousands) |
| Balance as of December 31, 2022 | $ | 207,940 | | | 16,167 | | | $ | 162 | | | $ | 1,189,255 | | | $ | (715,299) | | | 3,355 | | | $ | (266,178) | |
| Net income and comprehensive income | 13,457 | | | — | | | — | | | — | | | 13,457 | | | — | | | — | |
| Non-cash compensation | 11,274 | | | — | | | — | | | 11,274 | | | — | | | — | | | — | |
| | | | | | | | | | | | | |
| Issuance of common stock for stock options, restricted stock awards and restricted stock units, net of withholding taxes | (1,693) | | | 98 | | | 1 | | | (1,694) | | | — | | | — | | | — | |
| | | | | | | | | | | | | |
| Other | 1 | | | — | | | — | | | 1 | | | — | | | — | | | — | |
| Balance as of March 31, 2023 | $ | 230,979 | | | 16,265 | | | $ | 163 | | | $ | 1,198,836 | | | $ | (701,842) | | | 3,355 | | | $ | (266,178) | |
| Net income and comprehensive income | (115) | | | — | | | — | | | — | | | (115) | | | — | | | — | |
| Non-cash compensation | 10,199 | | | — | | | — | | | 10,199 | | | — | | | — | | | — | |
| Purchase of treasury stock | — | | | — | | | — | | | — | | | — | | | — | | | — | |
| Issuance of common stock for stock options, employee stock purchase plan, restricted stock awards and restricted stock units, net of withholding taxes | 652 | | | 59 | | | — | | | 652 | | | — | | | — | | | — | |
| Other | — | | | — | | | — | | | — | | | — | | | — | | | — | |
| Balance as of June 30, 2023 | $ | 241,715 | | | 16,324 | | | $ | 163 | | | $ | 1,209,687 | | | $ | (701,957) | | | 3,355 | | | $ | (266,178) | |
| | | | | | | | | | | | | |
| | | | | | | | | | | | | |
| | | | | | | | | | | | | |
| | | | | | | | | | | | | |
| | | | | | | | | | | | | |
| | | | | | | | | | | | | |
| | | | | | | | | | | | | | | | | | | | | | | | | | | | | | | | | | | | | | | | | |
| | | | Common Stock | | | | | | Treasury Stock |
| | Total | | Number
of Shares | | Amount | | Additional
Paid-in
Capital | | Accumulated
Deficit | | Number
of Shares | | Amount |
| | (in thousands) |
| Balance as of December 31, 2023 | $ | 124,132 | | | 16,397 | | | $ | 164 | | | $ | 1,227,849 | | | $ | (837,703) | | | 3,355 | | | $ | (266,178) | |
| Net income and comprehensive income | 1,016 | | | — | | | — | | | — | | | 1,016 | | | — | | | — | |
| Non-cash compensation | 7,789 | | | — | | | — | | | 7,789 | | | — | | | — | | | — | |
| | | | | | | | | | | | | |
| Issuance of common stock for stock options, restricted stock awards and restricted stock units, net of withholding taxes | (1,422) | | | 180 | | | 2 | | | (1,424) | | | — | | | — | | | — | |
| | | | | | | | | | | | | |
| | | | | | | | | | | | | |
| Balance as of March 31, 2024 | $ | 131,515 | | | 16,577 | | | $ | 166 | | | $ | 1,234,214 | | | $ | (836,687) | | | 3,355 | | | $ | (266,178) | |
| | | | | | | | | | | | | |
| | | | | | | | | | | | | |
| | | | | | | | | | | | | |
| | | | | | | | | | | | | |
| | | | | | | | | | | | | |
| | | | | | | | | | | | | |
| | | | | | | | | | | | | |
| | | | | | | | | | | | | |
| | | | | | | | | | | | | |
| | | | | | | | | | | | | |
| | | | | | | | | | | | | |
| | | | | | | | | | | | | |
| | | | | | | | | | | | | | | | | | | | | | | | | | | | | | | | | | | | | | | | | |
| | | | Common Stock | | | | | | Treasury Stock |
| | Total | | Number
of Shares | | Amount | | Additional
Paid-in
Capital | | Accumulated
Deficit | | Number
of Shares | | Amount |
| | (in thousands) |
| Balance as of December 31, 2021 | $ | 447,992 | | | 16,071 | | | $ | 161 | | | $ | 1,242,794 | | | $ | (571,794) | | | 2,976 | | | $ | (223,169) | |
| Net loss and comprehensive loss | (10,826) | | | — | | | — | | | — | | | (10,826) | | | — | | | — | |
| Non-cash compensation | 15,080 | | | — | | | — | | | 15,080 | | | — | | | — | | | — | |
| Purchase of treasury stock | (43,009) | | | — | | | — | | | — | | | — | | | 379 | | | (43,009) | |
| Issuance of common stock for stock options, restricted stock awards and restricted stock units, net of withholding taxes | (3,086) | | | 49 | | | — | | | (3,086) | | | — | | | — | | | — | |
| Cumulative effect adjustment due to ASU 2020-06 | (65,303) | | | — | | | — | | | (109,750) | | | 44,447 | | | — | | | — | |
| | | | | | | | | | | | | |
| Balance as of March 31, 2022 | $ | 340,848 | | | 16,120 | | $ | 161 | | | $ | 1,145,038 | | | $ | (538,173) | | | 3,355 | | $ | (266,178) | |
| Net income and comprehensive income | (8,038) | | | — | | | — | | | — | | | (8,038) | | | — | | | — | |
| Non-cash compensation | 17,335 | | | — | | | — | | | 17,335 | | | — | | | — | | | — | |
| Purchase of treasury stock | — | | | — | | | — | | | — | | | — | | | — | | | — | |
| Issuance of common stock for stock options, restricted stock awards and restricted stock units, net of withholding taxes | 341 | | | 21 | | | — | | | 341 | | | — | | | — | | | — | |
| | | | | | | | | | | | | |
| Balance as of June 30, 2022 | $ | 350,486 | | | 16,141 | | | $ | 161 | | | $ | 1,162,714 | | | $ | (546,211) | | | 3,355 | | | $ | (266,178) | |
| | | | | | | | | | | | | |
| | | | | | | | | | | | | |
| | | | | | | | | | | | | |
| | | | | | | | | | | | | |
| | | | | | | | | | | | | |
| | | | | | | | | | | | | |
| | | | | | | | | | | | | | | | | | | | | | | | | | | | | | | | | | | | | | | | | |
| | | | Common Stock | | | | | | Treasury Stock |
| | Total | | Number
of Shares | | Amount | | Additional
Paid-in
Capital | | Accumulated
Deficit | | Number
of Shares | | Amount |
| | (in thousands) |
| Balance as of December 31, 2022 | $ | 207,940 | | | 16,167 | | | $ | 162 | | | $ | 1,189,255 | | | $ | (715,299) | | | 3,355 | | | $ | (266,178) | |
| Net income and comprehensive loss | 13,457 | | | — | | | — | | | — | | | 13,457 | | | — | | | — | |
| Non-cash compensation | 11,274 | | | — | | | — | | | 11,274 | | | — | | | — | | | — | |
| | | | | | | | | | | | | |
| Issuance of common stock for stock options, restricted stock awards and restricted stock units, net of withholding taxes | (1,693) | | | 98 | | | 1 | | | (1,694) | | | — | | | — | | | — | |
| | | | | | | | | | | | | |
| Other | 1 | | | — | | | — | | | 1 | | | — | | | — | | | — | |
| Balance as of March 31, 2023 | $ | 230,979 | | | 16,265 | | $ | 163 | | | $ | 1,198,836 | | | $ | (701,842) | | | 3,355 | | $ | (266,178) | |
| | | | | | | | | | | | | |
| | | | | | | | | | | | | |
| | | | | | | | | | | | | |
| | | | | | | | | | | | | |
| | | | | | | | | | | | | |
| | | | | | | | | | | | | |
| | | | | | | | | | | | | |
| | | | | | | | | | | | | |
| | | | | | | | | | | | | |
| | | | | | | | | | | | | |
| | | | | | | | | | | | | |
| | | | | | | | | | | | | |
The accompanying notes to consolidated financial statements are an integral part of these statements.
LENDINGTREE, INC. AND SUBSIDIARIES
CONSOLIDATED STATEMENTS OF CASH FLOWS
(Unaudited)
| | | | Six Months Ended
June 30, | | Three Months Ended
March 31, |
| | | 2023 | | 2022 | | 2024 | | 2023 |
| | | (in thousands) | | (in thousands) |
| Cash flows from operating activities: | Cash flows from operating activities: | | | | Cash flows from operating activities: | | | |
| Net income (loss) and comprehensive income (loss) | $ | 13,342 | | | $ | (18,864) | |
| Adjustments to reconcile net income (loss) to net cash provided by operating activities: | |
| Net income and comprehensive income | |
| Adjustments to reconcile net income to net cash provided by operating activities: | |
| Loss on impairments and disposal of assets | |
| Loss on impairments and disposal of assets | |
| Loss on impairments and disposal of assets | Loss on impairments and disposal of assets | 5,167 | | | 3,427 | |
| Amortization of intangibles | Amortization of intangibles | 4,031 | | | 14,992 | |
| Depreciation | Depreciation | 9,479 | | | 9,750 | |
| Non-cash compensation expense | Non-cash compensation expense | 21,473 | | | 32,415 | |
| Deferred income taxes | Deferred income taxes | 586 | | | (2,026) | |
| | Bad debt expense | Bad debt expense | 1,894 | | | 2,029 | |
| | Bad debt expense | |
| | Bad debt expense | |
| Amortization of debt issuance costs | Amortization of debt issuance costs | 2,736 | | | 4,454 | |
| Write-off of previously-capitalized debt issuance costs | Write-off of previously-capitalized debt issuance costs | 2,373 | | | — | |
| Amortization of debt discount | Amortization of debt discount | — | | | 1,475 | |
| | Reduction in carrying amount of ROU asset, offset by change in operating lease liabilities | Reduction in carrying amount of ROU asset, offset by change in operating lease liabilities | (1,923) | | | (333) | |
| Reduction in carrying amount of ROU asset, offset by change in operating lease liabilities | |
| Reduction in carrying amount of ROU asset, offset by change in operating lease liabilities | |
| Gain on settlement of convertible debt | Gain on settlement of convertible debt | (34,308) | | | — | |
| Loss on impairment of investments | 1,440 | | | — | |
| Changes in current assets and liabilities: | Changes in current assets and liabilities: | |
| Accounts receivable | |
| Accounts receivable | |
| Accounts receivable | Accounts receivable | 6,809 | | | (19,812) | |
| Prepaid and other current assets | Prepaid and other current assets | 280 | | | (5,593) | |
| Accounts payable, accrued expenses and other current liabilities | Accounts payable, accrued expenses and other current liabilities | (4,337) | | | (5,226) | |
| | Income taxes receivable | Income taxes receivable | (227) | | | (293) | |
| Income taxes receivable | |
| Income taxes receivable | |
| Other, net | Other, net | (591) | | | (302) | |
| Net cash provided by operating activities | Net cash provided by operating activities | 28,224 | | | 16,093 | |
| Cash flows from investing activities: | Cash flows from investing activities: | |
| Capital expenditures | Capital expenditures | (4,853) | | | (6,346) | |
| Capital expenditures | |
| Capital expenditures | |
| | Equity investments | — | | | (16,440) | |
| | Net cash used in investing activities | |
| | Net cash used in investing activities | |
| | | Net cash used in investing activities | Net cash used in investing activities | (4,853) | | | (22,786) | |
| Cash flows from financing activities: | Cash flows from financing activities: | |
| Proceeds from term loan | Proceeds from term loan | — | | | 250,000 | |
| Proceeds from term loan | |
| Proceeds from term loan | |
| Repayment of term loan | Repayment of term loan | (1,250) | | | — | |
| | Payments related to net-share settlement of stock-based compensation, net of proceeds from exercise of stock options | Payments related to net-share settlement of stock-based compensation, net of proceeds from exercise of stock options | (1,042) | | | (2,745) | |
| Purchase of treasury stock | — | | | (43,009) | |
| Payments related to net-share settlement of stock-based compensation, net of proceeds from exercise of stock options | |
| Payments related to net-share settlement of stock-based compensation, net of proceeds from exercise of stock options | |
| | | Repurchase of 0.50% Convertible Senior Notes | Repurchase of 0.50% Convertible Senior Notes | (156,294) | | | — | |
| Repayment of 0.625% Convertible Senior Notes | — | | | (169,659) | |
| | Repurchase of 0.50% Convertible Senior Notes | |
| | Repurchase of 0.50% Convertible Senior Notes | |
| | Payment of debt costs | (1,079) | | | (3) | |
| | Payment of debt issuance costs | |
| | Net cash (used in) provided by financing activities | (159,665) | | | 34,584 | |
| Net (decrease) increase in cash, cash equivalents, restricted cash and restricted cash equivalents | (136,294) | | | 27,891 | |
| | Payment of debt issuance costs | |
| | Payment of debt issuance costs | |
| Payment of original issue discount | |
| | Net cash provided by (used in) financing activities | |
| | Net cash provided by (used in) financing activities | |
| | Net cash provided by (used in) financing activities | |
| Net increase (decrease) in cash, cash equivalents, restricted cash and restricted cash equivalents | |
| Cash, cash equivalents, restricted cash and restricted cash equivalents at beginning of period | Cash, cash equivalents, restricted cash and restricted cash equivalents at beginning of period | 298,969 | | | 251,342 | |
| Cash, cash equivalents, restricted cash and restricted cash equivalents at end of period | Cash, cash equivalents, restricted cash and restricted cash equivalents at end of period | $ | 162,675 | | | $ | 279,233 | |
|
The accompanying notes to consolidated financial statements are an integral part of these statements.
LENDINGTREE, INC. AND SUBSIDIARIES
NOTES TO CONSOLIDATED FINANCIAL STATEMENTS
(Unaudited)
NOTE 1—ORGANIZATION
Company Overview
LendingTree, Inc. is the parent of LT Intermediate Company, LLC, which holds all of the outstanding ownership interests of LendingTree, LLC, and LendingTree, LLC owns several companies (collectively, “LendingTree” or the “Company”).
LendingTree operates what it believes to be the leading online consumer platform that connects consumers with the choices they need to be confident in their financial decisions. The Company offers consumers tools and resources, including free credit scores, that facilitate comparison-shopping for mortgage loans, home equity loans and lines of credit, auto loans, credit cards, deposit accounts, personal loans, student loans, small business loans, insurance quotes, sales of insurance policies, and other related offerings. The Company primarily seeks to match in-market consumers with multiple providers on its marketplace who can provide them with competing quotes for loans, deposit products, insurance, or other related offerings they are seeking. The Company also serves as a valued partner to lenders and other providers seeking an efficient, scalable, and flexible source of customer acquisition with directly measurable benefits, by matching the consumer inquiries it generates with these providers.
The consolidated financial statements include the accounts of LendingTree and all its wholly-owned entities. Intercompany transactions and accounts have been eliminated.
Basis of Presentation
The accompanying unaudited interim consolidated financial statements as of June 30, 2023March 31, 2024 and for the three and six months ended June 30,March 31, 2024 and 2023, and 2022, respectively, have been prepared in accordance with accounting principles generally accepted in the United States of America (“GAAP”) for interim financial information and pursuant to the rules and regulations of the U.S. Securities and Exchange Commission (“SEC”). In the opinion of management, the unaudited interim consolidated financial statements have been prepared on the same basis as the audited financial statements, and include all adjustments, consisting only of normal recurring adjustments, necessary for the fair statement of the Company's financial position for the periods presented. The results for the three and six months ended June 30, 2023March 31, 2024 are not necessarily indicative of the results to be expected for the year ending December 31, 2023,2024, or any other period. The accompanying consolidated balance sheet as of December 31, 20222023 was derived from audited financial statements included in the Company's Annual Report on Form 10-K for the year ended December 31, 20222023 (the “2022“2023 Annual Report”). The accompanying consolidated financial statements do not include all of the information and footnotes required by GAAP for annual financial statements. Accordingly, they should be read in conjunction with the audited financial statements and notes thereto included in the 20222023 Annual Report. The Company reclassified certain amounts in the prior year consolidated statements of operations and comprehensive income and consolidated statement of cash flows to be consistent with the current year presentation.
NOTE 2—SIGNIFICANT ACCOUNTING POLICIES
Accounting Estimates
Management is required to make certain estimates and assumptions during the preparation of the consolidated financial statements in accordance with GAAP. These estimates and assumptions impact the reported amount of assets and liabilities and disclosures of contingent assets and liabilities as of the date of the consolidated financial statements. They also impact the reported amount of net earnings during any period. Actual results could differ from those estimates.
Significant estimates underlying the accompanying consolidated financial statements include: the recoverability of long-lived assets, goodwill and intangible assets; the determination of income taxes payable and deferred income taxes, including related valuation allowances; fair value of assets acquired in a business combination; litigation accruals; contract assets; various other allowances, reserves and accruals; assumptions related to the determination of stock-based compensation; and the determination of right-of-use assets and lease liabilities.
The Company considered the impact of the current economic conditions, including interest rates inflation, and the COVID-19 pandemicinflation on the assumptions and estimates used when preparing its consolidated financial statements including, but not limited to, the allowance for doubtful accounts, valuation allowances, contract asset, and the recoverability of long-lived assets, goodwill and intangible assets. These assumptions and estimates may change as new events occur and additional information is obtained. If economic conditions worsen, such future changes may have an adverse impact on the Company's results of operations, financial position and liquidity.
LENDINGTREE, INC. AND SUBSIDIARIES
NOTES TO CONSOLIDATED FINANCIAL STATEMENTS (Continued)
information is obtained. If economic conditions worsen, such future changes may have an adverse impact on the Company's results of operations, financial position and liquidity.
Certain Risks and Concentrations
LendingTree's business is subject to certain risks and concentrations including dependence on third-party technology providers, exposure to risks associated with online commerce security and credit card fraud.
Financial instruments, which potentially subject the Company to concentration of credit risk at June 30, 2023,March 31, 2024, consist primarily of cash and cash equivalents and accounts receivable, as disclosed in the consolidated balance sheet. Cash and cash equivalents are in excess of Federal Deposit Insurance Corporation insurance limits, but are maintained with quality financial institutions of high credit. The Company requires certain Network Partners to maintain security deposits with the Company, which in the event of non-payment, would be applied against any accounts receivable outstanding.
Due to the nature of the mortgage lending industry, interest rate fluctuations may negatively impact future revenue from the Company's marketplace.
Lenders and lead purchasers participating on the Company's marketplace can offer their products directly to consumers through brokers, mass marketing campaigns or through other traditional methods of credit distribution. These lenders and lead purchasers can also offer their products online, either directly to prospective borrowers, through one or more online competitors, or both. If a significant number of potential consumers are able to obtain loans and other products from Network Partners without utilizing the Company's services, the Company's ability to generate revenue may be limited. Because the Company does not have exclusive relationships with the Network Partners whose loans and other financial products are offered on its online marketplace, consumers may obtain offers from these Network Partners without using its service.
Other than a support services office in India, the Company's operations are geographically limited to and dependent upon the economic condition of the United States.
Litigation Settlements and Contingencies
Litigation settlements and contingencies consists of expenses related to actual or anticipated litigation settlements.
Recently AdoptedIssued Accounting Pronouncements
In August 2020,November 2023, the Financial Accounting Standards Board ("FASB") issued Accounting StandardsStandard Update ("ASU") 2020-06,2023-07 which simplifiesexpands annual and interim disclosure requirements for reportable segments, primarily through enhanced disclosures about significant segment expenses. This ASU is effective for annual periods beginning after December 15, 2023, and interim periods in fiscal years beginning after December 15, 2024. Early adoption is permitted, including adoption in interim periods. An entity should adopt the accountingguidance as of the beginning of the earliest period presented. The Company is evaluating the impact this ASU will have on its consolidated financial statements and whether to early adopt.
In December 2023, the FASB issued ASU 2023-09 which expands annual disclosure requirements for convertible instruments, amends the derivatives scope exceptionincome taxes, primarily through disclosure about disaggregated information about an entity's effective tax rate reconciliation and information on income taxes paid. This ASU is effective for annual periods beginning after December 15, 2024, with early adoption permitted. The guidance for contracts in an entity’s own equity, and amends the related earnings-per-share guidance. Under the new guidance, the embedded conversion features are no longer separated from the host contract for convertible instruments with conversion features that are not required to be accounted for as derivatives under Topic 815, or that do not result in substantial premiums accounted for as paid-in capital. As a result, a convertible debt instrument will be accounted for asapplied on a single liability measured at its amortized cost, as long as no other features require bifurcation and recognition as derivatives.prospective basis with the option to adopt the guidance retrospectively. The Company adoptedis evaluating the impact this ASU 2020-06will have on January 1, 2022 using the modified retrospective transition approach and recognized the cumulative effect of initially applying ASU 2020-06 as a $44.4 million adjustment to the opening balance of accumulated deficit, comprised of $60.8 million for the interest adjustment, net of $16.4 million for the related tax impacts. The recombination of the equity conversion component of the Company's convertible debt remaining outstanding caused a reduction in additional paid-in capital and an increase in deferred income tax assets. The removal of the remaining debt discounts recorded for this previous separation had the effect of increasing our net debt balance. ASU 2020-06 also requires the dilutive impact of convertible debt instruments to utilize the if-converted method when calculating diluted earnings per share and the result is more dilutive. The adoption of ASU 2020-06 did not impact the Company's cash flows or compliance with debt covenants.
Recently Issued Accounting Pronouncements
The Company has considered the applicability of recently issued accounting pronouncements by the Financial Accounting Standards Board and have determined that they are either not applicable or are not expected to have a material impact on the Company'sits consolidated financial statements.statements and whether to early adopt.
LENDINGTREE, INC. AND SUBSIDIARIES
NOTES TO CONSOLIDATED FINANCIAL STATEMENTS (Continued)
NOTE 3—REVENUE
Revenue is as follows (in thousands):
| | Three Months Ended
June 30, | | Six Months Ended
June 30, |
| 2023 | | 2022 | | 2023 | | 2022 |
| Three Months Ended
March 31, | |
| Three Months Ended
March 31, | |
| Three Months Ended
March 31, | |
| 2024 | |
| 2024 | |
| 2024 | |
| Home | Home | $ | 41,563 | | | $ | 73,938 | | | $ | 85,238 | | | $ | 175,882 | |
| Credit cards | 21,083 | | | 27,306 | | | 39,371 | | | 57,128 | |
| Home | |
| Home | |
| Personal loans | |
| Personal loans | |
| Personal loans | Personal loans | 28,137 | | | 42,298 | | | 51,736 | | | 77,508 | |
| Other Consumer | Other Consumer | 33,257 | | | 36,540 | | | 71,079 | | | 72,576 | |
| Other Consumer | |
| Other Consumer | |
| Total Consumer | |
| Total Consumer | |
| Total Consumer | Total Consumer | 82,477 | | | 106,144 | | | 162,186 | | | 207,212 | |
| Insurance | Insurance | 58,398 | | | 81,756 | | | 135,480 | | | 161,794 | |
| Insurance | |
| Insurance | |
| Other | |
| Other | |
| Other | Other | 15 | | | 85 | | | 57 | | | 213 | |
| Total revenue | Total revenue | $ | 182,453 | | | $ | 261,923 | | | $ | 382,961 | | | $ | 545,101 | |
| Total revenue | |
| Total revenue | |
The Company derives its revenue primarily from match fees and closing fees. Revenue is recognized when performance obligations under the terms of a contract with a customer are satisfied and promised services have transferred to the customer. The Company's services are generally transferred to the customer at a point in time.
Revenue from Home products is primarily generated from upfront match fees paid by mortgage Network Partners that receive a loan request, and in some cases upfront fees for clicks or call transfers. Match fees and upfront fees for clicks and call transfers are earned through the delivery of loan requests that originated through the Company's websites or affiliates. The Company recognizes revenue at the time a loan request is delivered to the customer, provided that no significant obligations remain. The Company's contractual right to the match fee consideration is contemporaneous with the satisfaction of the performance obligation to deliver a loan request to the customer.
Revenue from Consumer products is generated by match and other upfront fees for clicks or call transfers, as well as from closing fees, approval fees and upfront service and subscription fees. Closing fees are derived from lenders on certain auto loans, business loans, personal loans, and student loans when the lender funds a loan with the consumer. Approval fees are derived from credit card issuers when the credit card consumer receives card approval from the credit card issuer. Upfront service fees and subscription fees arewere derived from consumers in the Company's credit services product. Upfront fees paid by consumers arewere recognized as revenue over the estimated time the consumer willwas expected to remain a customer and receive services. Subscription fees arewere recognized over the period a consumer iswas receiving services. As of the second quarter of 2023, the Company discontinued providing its credit services product to consumers and no longer receives upfront fees and subscription fees.
The Company recognizes revenue on closing fees and approval fees at the point when a loan request or a credit card consumer is delivered to the customer. The Company's contractual right to closing fees and approval fees is not contemporaneous with the satisfaction of the performance obligation to deliver a loan request or a credit card consumer to the customer. As such, the Company records a contract asset at each reporting period-end related to the estimated variable consideration on closing fees and approval fees for which the Company has satisfied the related performance obligation but are still pending the loan closing or credit card approval before the Company has a contractual right to payment. This estimate is based on the Company's historical closing rates and historical time between when a consumer request for a loan or credit card is delivered to the lender or card issuer and when the loan is closed by the lender or approved by the card issuer.
Revenue from the Company's Insurance products is primarily generated from upfront match fees and upfront fees for website clicks or fees for calls. Match fees and upfront fees for clicks and call transfers are earned through the delivery of consumer requests that originated through the Company's websites or affiliates. The Company recognizes revenue at the time a consumer request is delivered to the customer, provided that no significant obligations remain. The Company's contractual right to the match fee consideration is contemporaneous with the satisfaction of the performance obligation to deliver a consumer request to the customer.
The contract asset recorded within prepaid and other current assets on the consolidated balance sheets related to estimated variable consideration was $13.5$15.1 million and $12.2$13.7 million at June 30, 2023March 31, 2024 and December 31, 2022,2023, respectively.
LENDINGTREE, INC. AND SUBSIDIARIES
NOTES TO CONSOLIDATED FINANCIAL STATEMENTS (Continued)
TheAs the contract liability recorded within accrued expenses and other current liabilities onwas in the consolidated balance sheets related to upfront fees paid by consumersOvation business that was $0.9 millionclosed during 2023, there was no contract liability at December 31, 2022.2023. During the second quarter and first sixthree months of 2023, the Company recognized revenue of $0.1 million and $0.9 million, respectively, that was included in the contract liability balance at December 31, 2022. During the second quarter and first six months of 2022, the Company recognized revenue of $0.1 million and $0.8 million that was included in the contract liability balance at December 31, 2021.2022.
Revenue recognized in any reporting period includes estimated variable consideration for which the Company has satisfied the related performance obligations but are still pending the occurrence or non-occurrence of a future event outside the Company's control (such as lenders providing loans to consumers or credit card approvals of consumers) before the Company has a contractual right to payment. The Company recognizedrecognizes increases or decreases to such revenue from prior periods. This decreaseincrease was $0.9$0.3 million in the secondfirst quarter of 2023,2024 and not material$0.2 million in the secondfirst quarter of 2022.2023.
NOTE 4—CASH AND RESTRICTED CASH
Total cash, cash equivalents, restricted cash and restricted cash equivalents consist of the following (in thousands):
| | June 30,
2023 | | December 31,
2022 |
| March 31,
2024 | | | March 31,
2024 | | December 31,
2023 |
| Cash and cash equivalents | Cash and cash equivalents | $ | 162,641 | | | $ | 298,845 | |
| Restricted cash and cash equivalents | Restricted cash and cash equivalents | 34 | | | 124 | |
| Total cash, cash equivalents, restricted cash and restricted cash equivalents | Total cash, cash equivalents, restricted cash and restricted cash equivalents | $ | 162,675 | | | $ | 298,969 | |
NOTE 5—ALLOWANCE FOR DOUBTFUL ACCOUNTS
Accounts receivable are stated at amounts due from customers, net of an allowance for doubtful accounts.
The Company determines its allowance for doubtful accounts by considering a number of factors, including the length of time accounts receivable are past due, previous loss history, current and expected economic conditions and the specific customer's current and expected ability to pay its obligation. Accounts receivable are considered past due when they are outstanding longer than the contractual payment terms. Accounts receivable are written off when management deems them uncollectible.
A reconciliation of the beginning and ending balances of the allowance for doubtful accounts is as follows (in thousands):
| | | |
| | |
| | |
| | | | Three Months Ended
June 30, | | Six Months Ended
June 30, |
| | | 2023 | | 2022 | | 2023 | | 2022 |
| Balance, beginning of the period | Balance, beginning of the period | $ | 2,688 | | | $ | 1,803 | | | $ | 2,317 | | | $ | 1,456 | |
| Balance, beginning of the period | |
| Balance, beginning of the period | |
| Charges to earnings | |
| Charges to earnings | |
| Charges to earnings | Charges to earnings | 931 | | | 1,179 | | | 1,894 | | | 2,029 | |
| Write-off of uncollectible accounts receivable | Write-off of uncollectible accounts receivable | (1,010) | | | (682) | | | (1,973) | | | (1,185) | |
| Write-off of uncollectible accounts receivable | |
| Write-off of uncollectible accounts receivable | |
| | Assets held for sale (Note 7) | — | | | — | | | 371 | | | — | |
| Assets held for sale | |
| | Assets held for sale | |
| | Assets held for sale | |
| Balance, end of the period | Balance, end of the period | $ | 2,609 | | | $ | 2,300 | | | $ | 2,609 | | | $ | 2,300 | |
| Balance, end of the period | |
| Balance, end of the period | |
LENDINGTREE, INC. AND SUBSIDIARIES
NOTES TO CONSOLIDATED FINANCIAL STATEMENTS (Continued)
NOTE 6—GOODWILL AND INTANGIBLE ASSETS
The balance of goodwill, net and intangible assets, net is as follows (in thousands):
| | | | June 30,
2023 | | December 31,
2022 | | March 31,
2024 | | December 31,
2023 |
| Goodwill | Goodwill | $ | 903,227 | | | $ | 903,227 | |
| Accumulated impairment losses | Accumulated impairment losses | (483,088) | | | (483,088) | |
| Net goodwill | Net goodwill | $ | 420,139 | | | $ | 420,139 | |
| | Intangible assets with indefinite lives | Intangible assets with indefinite lives | $ | 10,142 | | | $ | 10,142 | |
| Intangible assets with indefinite lives | |
| Intangible assets with indefinite lives | |
| Intangible assets with definite lives, net | Intangible assets with definite lives, net | 44,142 | | | 48,173 | |
| Total intangible assets, net | Total intangible assets, net | $ | 54,284 | | | $ | 58,315 | |
LENDINGTREE, INC. AND SUBSIDIARIES
NOTES TO CONSOLIDATED FINANCIAL STATEMENTS (Continued)
Goodwill and Indefinite-Lived Intangible Assets
The Company's goodwill at each of June 30, 2023March 31, 2024 and December 31, 2022 consists2023 consisted of $59.3 million associated with the Home segment, $166.1 million associated with the Consumer segment, and $194.7$156.1 million associated with the Insurance segment.
At June 30, 2022,During the third quarter of 2023, the Company assessed the qualitative factors inconcluded that a triggering event had occurred related to its impairment testing of goodwill and determined thatan interim quantitative impairment test was performed as of September 30, 2023. During the third quarter of 2023, the Company's market capitalization fell below its book value. Additionally, the Home reporting unit continued to struggle due to the effects of the challenging interest rate environment,significant increases in mortgage rates, low for-sale home inventories and the rise in home prices. The Insurance reporting unit continued to see pressure due to the consumer price inflation and the decline in the Company's market capitalization requirednegatively impacting carrier underwriting. Upon completing a quantitative impairment test be performed. The quantitative goodwill impairment test, foundthe Company concluded that the faircarrying value of eachthe Insurance reporting unit exceeded its fair value which resulted in a goodwill impairment charge of $38.6 million in the third quarter of 2023. The fair value of the Home and Consumer reporting units exceeded their carrying amount,amounts, indicating no goodwill impairment. The Company will monitor the recovery of the Insurance reporting unit and the MortgageHome reporting unit. The propertyunit and casualty auto industry is experiencing challenges caused by inflation, supply chain challenges, and rising severity and frequency of claims. Additionally, the significant increase in mortgage interest rates have had a negative impact on the Mortgage reporting unit. Changesany changes in the timing of the recovery compared to current expectations could cause an impairment to the Insurance or MortgageHome reporting unit.
Intangible assets with indefinite lives relate to the Company's trademarks.
Intangible Assets with Definite Lives
Intangible assets with definite lives relate to the following (in thousands):
| | | | | | | | | | | | | | | | | |
| | Cost | | Accumulated
Amortization | | Net |
| | | | | |
| Customer lists | 77,300 | | | (33,830) | | | 43,470 | |
| Trademarks and tradenames | 9,100 | | | (8,428) | | | 672 | |
| | | | | |
| Balance at June 30, 2023 | $ | 86,400 | | | $ | (42,258) | | | $ | 44,142 | |
| | | | | | | | | | | | | | | | | |
| | Cost | | Accumulated
Amortization | | Net |
| | | | | |
| Customer lists | 76,100 | | | (37,110) | | | 38,990 | |
| | | | | |
| | | | | |
| Balance at March 31, 2024 | $ | 76,100 | | | $ | (37,110) | | | $ | 38,990 | |
| | | | | | | | | | | | | | | | | |
| | Cost | | Accumulated
Amortization | | Net |
| | | | | |
| Customer lists | $ | 77,300 | | | $ | (30,775) | | | $ | 46,525 | |
| Trademarks and tradenames | 10,100 | | | (8,452) | | | 1,648 | |
| | | | | |
| Balance at December 31, 2022 | $ | 87,400 | | | $ | (39,227) | | | $ | 48,173 | |
LENDINGTREE, INC. AND SUBSIDIARIES
NOTES TO CONSOLIDATED FINANCIAL STATEMENTS (Continued)
| | | | | | | | | | | | | | | | | |
| | Cost | | Accumulated
Amortization | | Net |
| | | | | |
| Customer lists | $ | 76,100 | | | $ | (35,644) | | | $ | 40,456 | |
| Trademarks and tradenames | 1,300 | | | (1,278) | | | 22 | |
| | | | | |
| Balance at December 31, 2023 | $ | 77,400 | | | $ | (36,922) | | | $ | 40,478 | |
Amortization of intangible assets with definite lives is computed on a straight-line basis and, based on balances as of June 30, 2023,March 31, 2024, future amortization is estimated to be as follows (in thousands):
| | | | | |
| | Amortization Expense |
| Remainder of current year | $ | 3,6644,401 | |
Year ending December 31, 2024 | 5,889 | |
| Year ending December 31, 2025 | 5,830 | |
| Year ending December 31, 2026 | 5,504 | |
| Year ending December 31, 2027 | 5,198 | |
| Year ending December 31, 2028 | 4,685 | |
| Thereafter | 18,05713,372 | |
| Total intangible assets with definite lives, net | $ | 44,14238,990 | |
See
Note 7—Assets and Liabilities Held for Sale for intangible assets with definite lives classified as held for sale.
NOTE 7—ASSETS AND LIABILITIES HELD FOR SALE
In the fourth quarter of 2022, the Company approved a plan to sell its Ovation credit services business, an asset group associated with the Company's Consumer segment. The asset group was expected to be sold in 2023 to an unrelated third party and is classified, at its carrying value, as current assets held for sale and current liabilities held for sale in the consolidated balance sheet as of December 31, 2022.
In the first quarter of 2023, the third party withdrew the letter of intent to purchase the asset group held for sale. The Company made the decision to close the Ovation credit services business. As a result, the Company recorded asset impairment charges of $4.2 million, of which $2.1 million related to intangible assets, $1.7 million related to property and equipment, and $0.4 million related to an operating lease right-of-use asset.
The carrying value of the accounts receivable, prepaid and other assets, and other non-current assets previously held for sale, and the liabilities previously held for sale approximate their fair value and were no longer classified as assets and liabilities held for sale in the consolidated balance sheet as of March 31, 2023.
The following table presents information related to the major classes of assets and liabilities that were classified as held for sale (in thousands):
| | | | | |
| December 31, 2022 |
Accounts receivable, net of allowance | $ | 1,353 | |
Prepaid and other current assets | 79 | |
Property and equipment, net of accumulated depreciation of $1,102 | 1,665 | |
Operating lease right-of-use assets | 436 | |
Intangible assets, net of accumulated amortization of $3,857 | 2,143 | |
Other non-current assets | 13 | |
Total assets held for sale | $ | 5,689 | |
| |
Accounts payable, trade | $ | 253 | |
Accrued expenses and other current liabilities | 2,551 | |
Operating lease liabilities | 105 | |
Total liabilities held for sale | $ | 2,909 | |
LENDINGTREE, INC. AND SUBSIDIARIES
NOTES TO CONSOLIDATED FINANCIAL STATEMENTS (Continued)
NOTE 8—7—EQUITY INVESTMENTINVESTMENTS
The investments in equity securitiesinvestments do not have a readily determinable fair value and, upon their acquisition, the Company elected the measurement alternative to value its securities. Theinvestments. Accordingly, the equity securitiesinvestments will be carried at cost less impairment, if any, and subsequently measured to fair value upon observable price changes in an orderly transaction for the identical or similar investments. Additionally, if a qualitative assessment identifies impairment indicators, then the equity investments with anymust be evaluated for impairment and written down to its fair value, if it is determined that the fair value is less than the carrying value. Any gains or losses recorded toare included within other income (expense) in the consolidated statement of operations and comprehensive income.
In the secondthird quarter of 2023, the Company determined there was an impairment indicator related to its Stash investment and performed a valuation of the investment. Based on the valuation, the Company determined the estimated fair value was below the carrying value of the investment and recorded an impairment charge of $1.4 million on one of its investments. The impairment is included within other income on the consolidated statement of operations and comprehensive income. As of December 31, 2022, there had been no impairments to the acquisition cost of the equity securities.$113.1 million.
NOTE 9—8—ACCRUED EXPENSES AND OTHER CURRENT LIABILITIES
Accrued expenses and other current liabilities consist of the following (in thousands):
| | | | June 30,
2023 | | December 31,
2022 | | March 31,
2024 | | December 31,
2023 |
| Accrued advertising expense | Accrued advertising expense | $ | 35,294 | | | $ | 37,703 | |
| Accrued compensation and benefits | Accrued compensation and benefits | 10,497 | | | 11,444 | |
| Accrued professional fees | Accrued professional fees | 1,387 | | | 1,393 | |
| Customer deposits and escrows | Customer deposits and escrows | 7,459 | | | 7,273 | |
| Contribution to LendingTree Foundation | — | | | 500 | |
| | Current lease liabilities | Current lease liabilities | 8,777 | | | 8,513 | |
| Accrued restructuring and severance | 2,608 | | | 304 | |
| Current lease liabilities | |
| Current lease liabilities | |
| | Other | |
| Other | |
| Other | Other | 8,182 | | | 7,965 | |
| Total accrued expenses and other current liabilities | Total accrued expenses and other current liabilities | $ | 74,204 | | | $ | 75,095 | |
See Note 7—Assets and Liabilities Held for Sale for accrued expenses and other current liabilities classified as held for sale.
NOTE 10—9—SHAREHOLDERS' EQUITY
Basic and diluted income per share was determined based on the following share data (in thousands):
| | | |
| | |
| | |
| | | | Three Months Ended
June 30, | | Six Months Ended
June 30, |
| | | 2023 | | 2022 | | 2023 | | 2022 |
| | Weighted average basic common shares | Weighted average basic common shares | 12,915 | | | 12,723 | | | 12,881 | | | 12,812 | |
| | Weighted average basic common shares | |
| | Weighted average basic common shares | |
| Effect of stock options | |
| Effect of stock options | |
| Effect of stock options | Effect of stock options | — | | | — | | | 10 | | | — | |
| Effect of dilutive share awards | Effect of dilutive share awards | — | | | — | | | 21 | | | — | |
| Effect of dilutive share awards | |
| Effect of dilutive share awards | |
| | Weighted average diluted common shares | |
| | Weighted average diluted common shares | |
| | Weighted average diluted common shares | Weighted average diluted common shares | 12,915 | | | 12,723 | | | 12,912 | | | 12,812 | |
|
For the secondfirst quarter of 2023, the Company was in a net loss position and, as a result, no potentially dilutive securities were included in the denominator for computing diluted loss per share, because the impact would have been anti-dilutive. Accordingly, the weighted average basic shares outstanding was used to compute loss per share. For the second quarter of 2023,2024, the weighted average shares that were anti-dilutive, and therefore excluded from the calculation of diluted income per share, included options to purchase 1.21.0 million shares of common stock and 0.60.3 million restricted stock units.
For the first six monthsquarter of 2023, the weighted average shares that were anti-dilutive, and therefore excluded from the calculation of diluted income per share, included options to purchase 1.0 million shares of common stock and 0.5 million restricted stock units.
For the second quarter and first six months of 2022, the Company was in a net loss position and, as a result, no potentially dilutive securities were included in the denominator for computing diluted loss per share, because the impact would have been anti-dilutive. Accordingly, the weighted average basic shares outstanding was used to compute loss per share. Approximately 0.2 million shares related to potentially dilutive securities were excluded from the calculation of diluted loss per share for the second quarter and first six months of 2022 because their inclusion would have been anti-dilutive. For the second quarter of 2022, the weighted average shares that were anti-dilutive, and therefore excluded from the calculation of diluted income per
LENDINGTREE, INC. AND SUBSIDIARIES
NOTES TO CONSOLIDATED FINANCIAL STATEMENTS (Continued)
share, included options to purchase 1.0 million shares of common stock and 0.5 million restricted stock units. For the first six months of 2022, the weighted average shares that were anti-dilutive, and therefore excluded from the calculation of diluted income per share, included options to purchase 1.0 million and 0.4 million restricted stock units.
The convertible notes and the warrants issued by the Company could be converted into the Company’s common stock, subject to certain contingencies. See Note 13—Debt for additional information. On January 1, 2022, the Company adopted ASU 2020-06 using the modified retrospective method. Following the adoption, the if-converted method is used for diluted net income per share calculation of our convertible notes. Prior to the adoption of ASU 2020-06 the dilutive impact of the convertible notes was calculated using the treasury stock method. See Note 2—Significant Accounting Policies for additional information.
Approximately 0.8 million and 1.20.6 million shares related to the potentially dilutive shares of the Company's common stock associated with the 0.50% Convertible Senior Notes due July 15, 2025 were excluded from the calculation of diluted loss (income) per share for the secondfirst quarter and first six months of 2023, respectively,2024 because their inclusion would have been anti-dilutive. Approximately 2.11.2 million shares related to the potentially dilutive shares of the Company's common stock associated with the 0.50% Convertible Senior Notes due July 15, 2025 andfor the 0.625% Convertible Senior Notes due June 1, 2022first quarter of 2023 were excluded from the calculation of diluted loss income
LENDINGTREE, INC. AND SUBSIDIARIES
NOTES TO CONSOLIDATED FINANCIAL STATEMENTS (Continued)
per share for the secondfirst quarter and first six months of 20222023 because their inclusion would have been anti-dilutive. Shares of the Company's stock associated with the warrants issued by the Company in 2020 were excluded from the calculation of diluted loss per share for the secondfirst quarter and first six months of 2023,2024 and shares of the Company's stock associated with the warrants issued by the Company in 2017 and 2020 were excluded from the calculation of diluted loss per share for the secondfirst quarter and first six months of 20222023, as they were anti-dilutive since the strike price of the warrants was greater than the average market price of the Company's common stock during the relevant periods.
Common Stock Repurchases
In each of February 2018 and February 2019,The Company has a plan authorized for the board of directors authorized and the Company announced the repurchase of up to $100.0 million and $150.0 million, respectively, of LendingTree's common stock. During the first six monthsquarter of 2024 and the first quarter of 2023, the Company did not repurchasepurchase shares of its common stock. During the first six months of 2022, the Company repurchased 379,895 shares of its common stock pursuant to the stock repurchase program. At June 30, 2023,March 31, 2024, approximately $96.7 million of the previous authorizations to repurchase common stock remain available.
NOTE 11—10—STOCK-BASED COMPENSATION
Non-cash compensation related to equity awards is included in the following line items in the accompanying consolidated statements of operations and comprehensive income (in thousands):
| | | | | | | | | | | | | | | | | | | | | | | |
| | Three Months Ended
June 30, | | Six Months Ended
June 30, |
| | 2023 | | 2022 | | 2023 | | 2022 |
| Cost of revenue | $ | 31 | | | $ | 442 | | | $ | 245 | | | $ | 835 | |
| Selling and marketing expense | 1,336 | | | 2,285 | | | 3,080 | | | 4,324 | |
| General and administrative expense | 6,550 | | | 11,873 | | | 13,893 | | | 21,473 | |
| Product development | 1,287 | | | 2,735 | | | 3,189 | | | 4,700 | |
| Restructuring and severance | 995 | | | — | | | 1,066 | | | 1,083 | |
| Total non-cash compensation | $ | 10,199 | | | $ | 17,335 | | | $ | 21,473 | | | $ | 32,415 | |
LENDINGTREE, INC. AND SUBSIDIARIES
NOTES TO CONSOLIDATED FINANCIAL STATEMENTS (Continued)
| | | | | | | | | | | | | | | |
| | Three Months Ended
March 31, | | |
| | 2024 | | 2023 | | | | |
| Cost of revenue | $ | 95 | | | $ | 214 | | | | | |
| Selling and marketing expense | 1,024 | | | 1,744 | | | | | |
| General and administrative expense | 5,333 | | | 7,343 | | | | | |
| Product development | 1,337 | | | 1,902 | | | | | |
| Restructuring and severance | — | | | 71 | | | | | |
| Total non-cash compensation | $ | 7,789 | | | $ | 11,274 | | | | | |
Stock Options
A summary of changes in outstanding stock options is as follows:
| | | | Number of Options | | Weighted
Average
Exercise
Price | | Weighted
Average
Remaining
Contractual
Term | | Aggregate Intrinsic Value(a) | | Number of Options | | Weighted
Average
Exercise
Price | | Weighted
Average
Remaining
Contractual
Term | | Aggregate Intrinsic Value(a) |
| | | | | (per option) | | (in years) | | (in thousands) | | | | (per option) | | (in years) | | (in thousands) |
| Options outstanding at January 1, 2023 | 805,079 | | | $ | 155.10 | | |
| Options outstanding at January 1, 2024 | |
| Granted | |
| Granted | |
| Granted | Granted | — | | | — | | |
| Exercised | Exercised | — | | | — | | |
| Exercised | |
| Exercised | |
| Forfeited | |
| Forfeited | |
| Forfeited | Forfeited | (7,763) | | | 132.89 | | |
| Expired | Expired | (49,250) | | | 224.70 | | |
| Options outstanding at June 30, 2023 | 748,066 | | | 150.75 | | | 4.78 | | $ | — | |
| Options exercisable at June 30, 2023 | 569,185 | | | $ | 129.77 | | | 3.80 | | $ | — | |
| Expired | |
| Expired | |
| Options outstanding at March 31, 2024 | |
| Options outstanding at March 31, 2024 | |
| Options outstanding at March 31, 2024 | |
| Options exercisable at March 31, 2024 | |
(a)The aggregate intrinsic value represents the total pre-tax intrinsic value (the difference between the Company's closing stock price of $22.11$42.34 on the last trading day of the quarter ended June 30, 2023March 31, 2024 and the exercise price, multiplied by the number of shares covered by in-the-money options) that would have been received by the option holder had the option holder exercised these options on June 30, 2023.March 31, 2024. The intrinsic value changes based on the market value of the Company's common stock.
LENDINGTREE, INC. AND SUBSIDIARIES
NOTES TO CONSOLIDATED FINANCIAL STATEMENTS (Continued)
Stock Options with Market Conditions
A summary of changes in outstanding stock options with market conditions at target is as follows:
| | | | Number of Options with Market Conditions | | Weighted
Average
Exercise
Price | | Weighted
Average
Remaining
Contractual
Term | | Aggregate Intrinsic Value(a) | | Number of Options with Market Conditions | | Weighted
Average
Exercise
Price | | Weighted
Average
Remaining
Contractual
Term | | Aggregate Intrinsic Value(a) |
| | | | | (per option) | | (in years) | | (in thousands) | | | | (per option) | | (in years) | | (in thousands) |
| Options outstanding at January 1, 2023 | 734,685 | | | $ | 230.79 | | |
| Options outstanding at January 1, 2024 | |
| Granted | |
| Granted | |
| Granted | Granted | — | | | — | | |
| Exercised | Exercised | — | | | — | | |
| Exercised | |
| Exercised | |
| Forfeited | |
| Forfeited | |
| Forfeited | Forfeited | — | | | — | | |
| Expired | Expired | (16,247) | | | 308.96 | | |
| Options outstanding at June 30, 2023 | 718,438 | | | 229.02 | | | 5.18 | | $ | — | |
| Options exercisable at June 30, 2023 | 481,669 | | | $ | 195.10 | | | 4.10 | | $ | — | |
| Expired | |
| Expired | |
| Options outstanding at March 31, 2024 | |
| Options outstanding at March 31, 2024 | |
| Options outstanding at March 31, 2024 | |
| Options exercisable at March 31, 2024 | |
(a)The aggregate intrinsic value represents the total pre-tax intrinsic value (the difference between the Company's closing stock price of $22.11$42.34 on the last trading day of the quarter ended June 30, 2023March 31, 2024 and the exercise price, multiplied by the number of shares covered by in-the-money options) that would have been received by the option holder had the option holder exercised these options on June 30, 2023.March 31, 2024. The intrinsic value changes based on the market value of the Company's common stock.
As of June 30, 2023,March 31, 2024, a maximum of 395,404363,464 shares may be earned for achieving superior performance up to 167% of the remaining unvested target number of shares. As of June 30, 2023,March 31, 2024, no additional performance-based nonqualified stock options with a market condition had been earned.
Restricted Stock Units
A summary of changes in outstanding nonvested restricted stock units (“RSUs”) is as follows:
| | | | | | | | | | | |
| | RSUs |
| | Number of Units | | Weighted Average Grant Date Fair Value |
| | | (per unit) |
| Nonvested at January 1, 2024 | 471,593 | | | $ | 66.42 | |
| Granted | 363,765 | | | 39.93 | |
| Vested | (194,992) | | | 76.76 | |
| Forfeited | (17,931) | | | 55.31 | |
| Nonvested at March 31, 2024 | 622,435 | | | $ | 48.02 | |
Restricted Stock Units with Market Conditions
A summary of changes in outstanding nonvested RSUs with performance conditions is as follows:
| | | | | | | | | | | |
| | RSUs with Market Conditions |
| | Number of Units | | Weighted Average Grant Date Fair Value |
| | | (per unit) |
| Nonvested at January 1, 2024 | — | | | $ | — | |
Granted (a) | 69,000 | | | 35.83 | |
| Vested | — | | | — | |
| Forfeited | — | | | — | |
| Nonvested at March 31, 2024 | 69,000 | | | $ | 35.83 | |
LENDINGTREE, INC. AND SUBSIDIARIES
NOTES TO CONSOLIDATED FINANCIAL STATEMENTS (Continued)
Restricted Stock Units
A summary of changes in outstanding nonvested restricted stock units (“RSUs”) is as follows:
| | | | | | | | | | | |
| | RSUs |
| | Number of Units | | Weighted Average Grant Date Fair Value |
| | | (per unit) |
| Nonvested at January 1, 2023 | 485,053 | | | $ | 127.46 | |
| Granted | 389,738 | | | 32.71 | |
| Vested | (175,087) | | | 138.76 | |
| Forfeited | (104,948) | | | 74.16 | |
| Nonvested at June 30, 2023 | 594,756 | | | $ | 71.79 | |
Restricted Stock Units with Performance Conditions
A summary of changes in outstanding nonvested(a)During the three months ended March 31, 2024, the Company granted RSUs with market conditions that will vest if the Company's 45 trading day average closing stock prices equals or exceeds certain price hurdles ($41.17, $52.94 and $64.70) during the performance period of March 1, 2024 to March 1, 2028. Upon achievement of each price hurdle, one-half of the awards will vest immediately, and the other half of the awards will vest on the first anniversary of the achievement date.
For purposes of determining stock-based compensation expense, the weighted average grant date fair value per share of the RSUs with market conditions was estimated using the Monte Carlo simulation model, which requires the use of various key assumptions.
| | | | | |
Expected term (1) | 5.00 years |
Expected volatility (2) | 68.06 | % |
Risk-free interest rate (3) | 4.13 | % |
Expected dividend (4) | — | |
(1)The expected term of RSUs with market conditions granted was calculated using a four-year performance period plus one year to account for the time-based vesting requirement.
(2)The expected volatility rate is based on the historical volatility of the Company's common stock.
(3)The risk-free interest rate is specific to the date of grant. The risk-free interest rate is based on U.S. Treasury yields for notes with comparable expected terms as follows:the awards, in effect at the grant date.
| | | | | | | | | | | |
| | RSUs with Performance Conditions |
| | Number of Units | | Weighted Average Grant Date Fair Value |
| | | (per unit) |
| Nonvested at January 1, 2023 | 16,000 | | | $ | 83.25 | |
| Granted | — | | | — | |
| Vested | — | | | — | |
| Forfeited | (16,000) | | | 83.25 | |
| Nonvested at June 30, 2023 | — | | | $ | — | |
Employee Stock Purchase Plan
In 2021, the Company implemented an employee stock purchase plan (“ESPP”), under which a total of 262,731 shares of the Company's common stock were reserved for issuance. As of June 30, 2023, 190,277March 31, 2024, 162,264 shares of common stock were available for issuance under the ESPP. The ESPP is a tax-qualified plan under Section 423 of the Internal Revenue Code. Under the terms of the ESPP, eligible employees are granted options to purchase shares of the Company's common stock at 85% of the lesser of (1) the fair market value at time of grant or (2) the fair market value at time of exercise. The offering periods and purchase periods are typically six-month periods ending on June 30 and December 31 of each year. During the six months ended June 30, 2023, 36,536No shares were issued under the ESPP.ESPP during the three months ended March 31, 2024.
During the sixthree months ended June 30,March 31, 2024 and 2023, and 2022, the Company granted employee stock purchase rights to certain employees with a grant date fair value per share of $8.19$11.27 and $35.43,$8.19, respectively, calculated using the Black-Scholes option pricing model. For purposes of determining stock-based compensation expense, the grant date fair value per share estimated using the Black-Scholes option pricing model required the use of the following key assumptions:
| | Six Months Ended
June 30, |
| 2023 | | 2022 |
| Three Months Ended
March 31, | | | Three Months Ended
March 31, |
| 2024 | | | 2024 | | 2023 |
Expected term (1) | Expected term (1) | 0.50 years | | 0.50 years | Expected term (1) | 0.50 years | | 0.50 years |
Expected dividend (2) | Expected dividend (2) | — | | | — | |
Expected volatility (3) | Expected volatility (3) | 82 | % | | 49% | Expected volatility (3) | 82 | % | | 82% |
Risk-free interest rate (4) | Risk-free interest rate (4) | 4.76 | % | | 0.19% | Risk-free interest rate (4) | 5.28 | % | | 4.76% |
(1)The expected term was calculated using the time period between the grant date and the purchase date.
(2)No dividends are expected to be paid, resulting in a zero expected dividend rate.
(3)The expected volatility rate is based on the historical volatility of the Company's common stock.
LENDINGTREE, INC. AND SUBSIDIARIES
NOTES TO CONSOLIDATED FINANCIAL STATEMENTS (Continued)
(3)The expected volatility rate is based on the historical volatility of the Company's common stock.
(4)The risk-free interest rate is specific to the date of grant. The risk-free interest rate is based on U.S. Treasury yields for notes with comparable expected terms as the employee stock purchase rights, in effect at the grant date.
NOTE 12—11—INCOME TAXES
| | | | Three Months Ended
June 30, | | Six Months Ended
June 30, |
| | | 2023 | | 2022 | | 2023 | | 2022 |
| | (in thousands, except percentages) |
| Income tax (expense) benefit | $ | (227) | | | $ | 2,339 | | | $ | (622) | | | $ | 1,957 | |
| | |
| | |
| | |
| (in thousands, except percentages) | |
| (in thousands, except percentages) | |
| (in thousands, except percentages) | |
| Income tax expense | |
| Income tax expense | |
| Income tax expense | |
| Effective tax rate | Effective tax rate | 202.7 | % | | 22.5 | % | | 4.5 | % | | 9.4 | % |
| Effective tax rate | |
| Effective tax rate | |
For the secondfirst quarter of 2024 and the first six monthsquarter of 2023, the effective tax rate varied from the federal statutory rate of 21% primarily due to the change in the valuation allowance, net of the current period change in tax effected net indefinite-lived intangibles. For the second quarter and first six months of 2022, the effective tax rate varied from the federal statutory rate of 21% primarily due to excess tax expense of $0.4 million and $2.9 million, resulting from vesting of restricted stock in accordance with ASU 2016-09 and the effect of state taxes.
The Company has a valuation allowance against the net deferred tax assets, with the exception of the deferred tax liabilities that result from indefinite-life intangibles. The Company has determined that using the general methodology for calculating income taxes during an interim period for the quarter ending June 30, 2023 provided for a wide range of potential annual effective rates. Therefore, the Company has calculated the tax provision on a discrete basis under ASC 740-270-30- 36(b) for the quarter ending June 30, 2023. At September 30, 2022, the Company recorded a net deferred tax asset of zero as the cumulative net deferred tax asset had a full valuation on it and there was not enough positive evidence that would warrant recognizing the benefit of the net deferred tax asset. In addition, the net indefinite lived deferred tax items were determined to be a net liability resulting in the recognition of a deferred tax liability.
| | | | | | | | | | | | | | | | | | | | | | | |
| | Three Months Ended
June 30, | | Six Months Ended
June 30, |
| | 2023 | | 2022 | | 2023 | | 2022 |
| (in thousands) |
| Income tax benefit - excluding excess tax expense on stock compensation | $ | (227) | | | $ | 2,777 | | | $ | (622) | | | $ | 4,863 | |
| | | | | | | |
| Excess tax expense on stock compensation | — | | | (438) | | | — | | | (2,906) | |
| | | | | | | |
| Income tax (expense) benefit | $ | (227) | | | $ | 2,339 | | | $ | (622) | | | $ | 1,957 | |
NOTE 13—12—DEBT
Convertible Senior Notes
2025 Notes
On July 24, 2020, the Company issued $575.0 million aggregate principal amount of its 0.50% Convertible Senior Notes due July 15, 2025 (the “2025 Notes”) in a private placement. The 2025 Notes bear interest at a rate of 0.50% per year, payable semi-annually on January 15 and July 15 of each year, beginning on January 15, 2021. The 2025 Notes will mature on July 15, 2025, unless earlier repurchased, redeemed or converted. The initial conversion rate of the 2025 Notes is 2.1683 shares of the Company's common stock per $1,000 principal amount of 2025 Notes (which is equivalent to an initial conversion price of approximately $461.19 per share).
On March 8, 2023, the Company repurchased approximately $190.6 million in principal amount of its 2025 Notes, through individual privately-negotiated transactions with certain holders of the 2025 Notes, for $156.3 million in cash plus accrued and unpaid interest of approximately $0.1 million. InOn December 7, 2023, the first quarterCompany repurchased approximately $100.2 million in principal amount of its 2025 Notes, through individual privately-negotiated transactions with certain holders of the 2025 Notes, for $81.2 million in cash plus accrued and unpaid interest of approximately $0.2 million. During the year ended December 31, 2023, the Company recognized a gain on the extinguishment of debt of $34.3$53.3 million, a loss on the write-off of unamortized debt issuance costs of $2.4$3.2 million and incurred
LENDINGTREE, INC. AND SUBSIDIARIES
NOTES TO CONSOLIDATED FINANCIAL STATEMENTS (Continued)
debt repayment costs of $1.0$1.6 million, all of which are included in interest income/expense,(expense) income, net in the consolidated statements of operations and comprehensive income.
Holders of the 2025 Notes were not entitled to convert the 2025 Notes during the calendar quarter ended June 30, 2023March 31, 2024 as the last reported sale price of the Company's common stock, for at least 20 trading days (whether or not consecutive) during the period of 30 consecutive trading days ending on MarchDecember 31, 2023, was not greater than or equal to 130% of the conversion price of the 2025 Notes on each applicable trading day.
In the first sixthree months of 2024, the Company recorded interest expense on the 2025 Notes of $0.8 million which consisted of $0.4 million associated with the 0.50% coupon rate and $0.4 million associated with the amortization of the debt issuance costs. In the first three months of 2023, the Company recorded interest expense on the 2025 Notes of $2.3$1.4 million which consisted of $1.1$0.7 million associated with the 0.50% coupon rate and $1.2 million associated with the amortization of the debt issuance costs. In the first six months of 2022, the Company recorded interest expense on the 2025 Notes of $3.0 million which consisted of $1.5 million associated with the 0.50% coupon rate and $1.5$0.7 million associated with the amortization of the debt issuance costs.
As of June 30, 2023,March 31, 2024, the fair value of the 2025 Notes is estimated to be approximately $296.0$265.0 million using the Level 1 observable input of the last quoted market price on June 30, 2023.March 31, 2024.
LENDINGTREE, INC. AND SUBSIDIARIES
NOTES TO CONSOLIDATED FINANCIAL STATEMENTS (Continued)
A summary of the gross carrying amount, debt issuance costs, and net carrying value of the 2025 Notes, all of which is recorded as a non-current liability in the June 30, 2023March 31, 2024 consolidated balance sheet, are as follows (in thousands):
| | | | | | | | | | | |
| | June 30,
2023 | | December 31,
2022 |
| Gross carrying amount | $ | 384,398 | | | $ | 575,000 | |
| Debt issuance costs | 4,158 | | | 7,734 | |
| Net carrying amount | $ | 380,240 | | | $ | 567,266 | |
2022 Notes
On May 31, 2017, the Company issued $300.0 million aggregate principal amount of its 0.625% Convertible Senior Notes due June 1, 2022 (the "2022 Notes") in a private placement. In the first six months of 2022, the Company recorded interest expense on the 2022 Notes of $0.8 million which consisted of $0.4 million associated with the 0.625% coupon rate and $0.4 million associated with the amortization of the debt issuance costs. The 2022 Notes were fully settled in June 2022. | | | | | | | | | | | |
| | March 31,
2024 | | December 31,
2023 |
| Gross carrying amount | $ | 284,188 | | | $ | 284,188 | |
| Debt issuance costs | 1,945 | | | 2,321 | |
| Net carrying amount | $ | 282,243 | | | $ | 281,867 | |
Convertible Note Hedge and Warrant Transactions
2020 Hedge and Warrants
On July 24, 2020, in connection with the issuance of the 2025 Notes, the Company entered into Convertible Note Hedge (the “2020 Hedge”) and warrant transactions with respect to the Company’s common stock.
The 2020 Hedge transactions cover 1.2 million shares of the Company’s common stock, the same number of shares initially underlying the 2025 Notes, and are exercisable upon any conversion of the 2025 Notes. The 2020 Hedge transactions are expected generally to reduce the potential dilution to the Company'sCompany’s common stock upon conversion of the 2025 Notes and/or offset any cash payments the Company is required to make in excess of the principal amount of the converted 2025 Notes, as the case may be, in the event that the market price per share of common stock, as measured under the terms of the 2020 Hedge transactions, is greater than the strike price of the 2020 Hedge transactions, which initially corresponds to the initial conversion price of the 2025 Notes, or approximately $461.19 per share of common stock. The 2020 Hedge transactions will expire upon the maturity of the 2025 Notes.
On July 24, 2020, the Company sold to the counterparties, warrants (the “2020 Warrants”) to acquire 1.2 million shares of the Company's common stock at an initial strike price of $709.52 per share, which represents a premium of 100% over the last reported sale price of the common stock of $354.76 on July 21, 2020. If the market price per share of the common stock, as measured under the terms of the 2020 Warrants, exceeds the strike price of the 2020 Warrants, the 2020 Warrants could have a dilutive effect, unless the Company elects, subject to certain conditions, to settle the 2020 Warrants in cash.
In connection with the December 7, 2023 and the March 8, 2023 repurchases of the 2025 Notes noted above, the Company entered into agreements with the counterparties for the 2020 Hedge and 2020 Warrants transactions to terminate a portion of these call spread transactions effective December 7, 2023 and March 8, 2023, respectively, in notional amounts corresponding to the principal amount of the 2025 Notes repurchased.
LENDINGTREE, INC. AND SUBSIDIARIES
NOTES TO CONSOLIDATED FINANCIAL STATEMENTS (Continued)
Subsequent to such termination,terminations, the outstanding portion of the 2020 Hedge covers 0.80.6 million shares of the Company's common stock and the 2020 Warrants to acquire 0.80.6 million shares of the Company's common stock remain outstanding.
2021 Credit Facility
On September 15, 2021, the Company entered into a credit agreement (the “Credit Agreement”), consisting of a $200.0 million revolving credit facility (the “Revolving Facility”), which matures on September 15, 2026, and a $250.0 million delayed draw term loan facility (the “Term Loan Facility”“2021 Term Loan” and together with the Revolving Facility, the “Credit Facility”), which matures on September 15, 2028.
As of June 30, 2023,March 31, 2024, the Company had $247.5$246.3 million of borrowings outstanding under the 2021 Term Loan Facility bearing interest at the LIBOSOFR option rate of 9.0%9.2% and had no borrowings under the Revolving Facility. As of December 31, 2022,2023, the Company had $248.8$246.9 million of borrowings outstanding under the Credit Facility2021 Term Loan and no borrowings under the Revolving Facility. As of June 30, 2023,March 31, 2024, borrowings of $2.5$3.1 million under the 2021 Term Loan Facility are recorded as current portion of long-term debt on the consolidated balance sheet.
At each of June 30, 2023March 31, 2024 and December 31, 2022,2023, the Company had outstanding one letter of credit issued in the amount of $0.2 million.
The Company was in compliance with all covenants at June 30, 2023.March 31, 2024.
In the first sixthree months of 2024, the Company recorded interest expense related to its Revolving Facility of $0.4 million which consisted of $0.2 million in unused commitment fees and $0.2 million associated with the amortization of the debt
LENDINGTREE, INC. AND SUBSIDIARIES
NOTES TO CONSOLIDATED FINANCIAL STATEMENTS (Continued)
issuance costs. In the first three months of 2024, the Company recorded interest expense related to the 2021 Term Loan of $5.7 million associated with borrowings bearing interest at the SOFR rate.
In the first three months of 2023, the Company recorded interest expense related to its Revolving Facility of $0.7$0.4 million which consisted of $0.2 million in unused commitment fees and $0.5$0.2 million associated with the amortization of the debt issuance costs. In the first sixthree months of 2023, the Company recorded interest expense related to the 2021 Term Loan Facility of $10.7$5.2 million associated with borrowings bearing interest at the LIBO rate.
2024 Term Loan
On March 27, 2024, the Company entered into a $175.0 million first lien term loan facility (the “2024 Term Loan”), which matures on March 27, 2031. The Company drew $125.0 million of the 2024 Term Loan upon closing while the remaining $50.0 million will be available as a delayed draw term loan until March 27, 2025. The proceeds of the 2024 Term Loan made on March 27, 2024 will be used to pay fees and expenses incurred in connection with the closing of the 2024 Term Loan and delayed draw term loan, and will be used for working capital and general corporate purposes, which may include repayment of the 2025 Notes. As of March 31, 2024, the Company had $125.0 million borrowings outstanding under the 2024 Term Loan bearing interest at the SOFR rate of 11.08%. As of March 31, 2024, borrowings of $12.5 million under the 2024 Term Loan are recorded as current portion of long-term debt on the consolidated balance sheet.
The 2024 Term Loan is pre-payable at par, after 12 months of call protection (during which time prepayment would be at 101% of par), or with respect to prepayments made with respect to a change of control, at 101% of par, and carries a seven-year term. The Company's borrowings under the 2024 Term Loan bear interest at annual rates at (i) a SOFR rate on a daily basis applicable for an interest period of one month and (ii) 5.75%, with the opportunity for a one-time 25 basis point step-down at a gross first lien leverage ratio less than or equal to 3.75x after six fiscal quarters from the date of closing.
The 2024 Term Loan has certain financial covenants which are tested on a quarterly basis. The covenants include a requirement for the Company to have a minimum cash balance of $40.0 million and a minimum Consolidated EBITDA (as such term is defined in the 2024 Term Loan agreement dated as of March 27, 2024) based on the applicable quarter. The Company was in compliance with all covenants at March 31, 2024.
In addition, the 2024 Term Loan contains mandatory prepayment events, affirmative and negative covenants and events of default customary for a transaction of this type. The covenants, among other things, restrict additional indebtedness, liens, mergers or certain fundamental changes, asset dispositions, dividends and other restricted payments, transactions with affiliates, loans and investments and other matters customarily restricted in agreements of this type, all subject to certain exceptions. In addition, the Company is required to file an ATM Shelf Registration (as defined in the 2024 Term Loan agreement) with the SEC. In the event of a default in the minimum Consolidated EBITDA covenant, the Company is required to utilize the ATM Equity Program (as defined in the 2024 Term Loan agreement) to sell common stock and use the proceeds to cure the event of default in the minimum Consolidated EBITDA covenant.
The Company is required to make mandatory prepayments of the outstanding principal amount of loans under the 2024 Term Loan with the net cash proceeds from certain disposition of assets and the receipt of insurance proceeds upon certain casualty and condemnation events, in each case, to the extent not reinvested within a specified time period, from excess cash flow beyond stated threshold amounts, and from the incurrence of certain indebtedness.
The 2024 Term Loan includes customary events of default, that include among other things, non-payment of principal, interest or fees, inaccuracy of representations and warranties, violation of certain covenants, cross default to certain other indebtedness, bankruptcy and insolvency events, material judgments, change of control, and certain material ERISA events. The occurrence of a default could result in the acceleration of the obligations under the facility.
As security for its obligations under the facility, the Company granted a security interest to substantially all of the Company’s assets and the assets of its material subsidiaries, subject to certain exceptions.
With respect to the 2024 Term Loan, the Company incurred financing costs of $7.3 million upon closing consisting of $4.2 million of debt issuance costs and $3.1 million of original issue discount which are being amortized to interest expense over the life of the 2024 Term Loan. Additionally, the Company is required to pay an unused commitment fee quarterly in arrears in an amount equal to 1.50% per annum on the amount of the undrawn portion of the delayed draw term loan commitments under the 2024 Term Loan.
LENDINGTREE, INC. AND SUBSIDIARIES
NOTES TO CONSOLIDATED FINANCIAL STATEMENTS (Continued)
In the first sixthree months of 2022, the Company recorded interest expense related to its revolving credit facilities of $0.7 million which consisted of $0.2 million in unused commitment fees, and $0.5 million associated with the amortization of the debt issuance costs. In the first six months of 2022,2024, the Company recorded interest expense related to the 2024 Term Loan Facility of $9.6$0.2 million which consisted of $1.0$0.2 million associated with borrowings bearing interest at the LIBOSOFR rate $5.1 million inand immaterial amounts associated with unused commitment fees, $2.0 million associated with the amortization of the debt issuance costs, and $1.5 million associated with the amortizationaccretion of the original issue discount.
A summary of the gross carrying amount, debt issuance costs, original issue discount, and net carrying value of the 2024 Term Loan in the March 31, 2024 consolidated balance sheet, are as follows (in thousands):
| | | | | | | | | |
| March 31,
2024 | | |
| Current Portion | | | |
| Gross carrying amount | $ | 12,500 | | | |
| Debt issuance costs | 414 | | | |
| Unamortized original issue discount | 312 | | | |
| Net carrying amount | $ | 11,774 | | | |
| Long-term Portion | | | |
| Gross carrying amount | $ | 112,500 | | | |
| Debt issuance costs | 3,728 | | | |
| Unamortized original issue discount | 2,807 | | | |
| Net carrying amount | $ | 105,965 | | | |
NOTE 14—13—CONTINGENCIES
Overview
LendingTree is involved in legal proceedings on an ongoing basis. In assessing the materiality of a legal proceeding, the Company evaluates, among other factors, the amount of monetary damages claimed, as well as the potential impact of non-monetary remedies sought by plaintiffs (e.g., injunctive relief) that may require it to change its business practices in a manner that could have a material and adverse impact on the Company's business. With respect to the matters disclosed in this Note 14,13, unless otherwise indicated, the Company is unable to estimate the possible loss or range of losses that could potentially result from the application of such non-monetary remedies.
As of June 30, 2023March 31, 2024 and December 31, 2022,2023, the Company had litigation settlement accruals of $0.6$0.7 million and $0.1$0.6 million, respectively. The litigation settlement accruals relate to litigation matters that were either settled or a firm offer for settlement was extended, thereby establishing an accrual amount that is both probable and reasonably estimable.
NOTE 15—14—FAIR VALUE MEASUREMENTS
Other than the convertible notes and warrants, as well as the equity interests, the carrying amounts of the Company's financial instruments are equal to fair value at June 30, 2023.March 31, 2024. See Note 13—12—Debt for additional information on the convertible notes and warrants.
LENDINGTREE, INC. AND SUBSIDIARIES
NOTES TO CONSOLIDATED FINANCIAL STATEMENTS (Continued)
NOTE 16—15—SEGMENT INFORMATION
The Company manages its business and reports its financial results through the following three operating and reportable segments: Home, Consumer, and Insurance. Characteristics which were relied upon in making the determination of the reportable segments include the nature of the products, the organization's internal structure, and the information that is regularly reviewed by the chief operating decision maker for the purpose of assessing performance and allocating resources.
The Home segment includes the following products: purchase mortgage, refinance mortgage, and home equity loans and lines of credit. The Company ceased offering reverse mortgage loans in the fourth quarter of 2022. The Consumer segment includes the following products: credit cards, personal loans, small business loans, student loans, auto loans, deposit accounts, and other credit products such as credit repair and debt settlement. The credit repair business was closed at the end of the second quarter of 2023. The Insurance segment consists of insurance quote products and sales of insurance policies in the agency businesses.
LENDINGTREE, INC. AND SUBSIDIARIES
NOTES TO CONSOLIDATED FINANCIAL STATEMENTS (Continued)
The following tables are a reconciliation of segment profit, which is the Company's primary segment profitability measure, to income before income taxes. Segment marketing expense represents the portion of selling and marketing expense attributable to variable costs paid for advertising, direct marketing and related expenses, that are directly attributable to the segments' products. This measure excludes overhead, fixed costs and personnel-related expenses.
| | Three Months Ended June 30, 2023 |
| Home | Consumer | Insurance | Other | Total |
| (in thousands) |
| Three Months Ended March 31, 2024 | | | Three Months Ended March 31, 2024 |
| Home | | | Home | Consumer | Insurance | Other | Total |
| (in thousands) | | | (in thousands) |
| Revenue | Revenue | $ | 41,563 | | $ | 82,477 | | $ | 58,398 | | $ | 15 | | $ | 182,453 | |
| Segment marketing expense | Segment marketing expense | 28,216 | | 41,807 | | 33,647 | | 274 | | 103,944 | |
| Segment profit (loss) | 13,347 | | 40,670 | | 24,751 | | (259) | | 78,509 | |
| Segment profit | |
| Cost of revenue | Cost of revenue | | 9,302 | |
| Brand and other marketing expense | Brand and other marketing expense | | 12,121 | |
| General and administrative expense | General and administrative expense | | 29,160 | |
| Product development | Product development | | 10,601 | |
| Depreciation | Depreciation | | 4,684 | |
| Amortization of intangibles | Amortization of intangibles | | 1,982 | |
| | Restructuring and severance | Restructuring and severance | | 3,558 | |
| Restructuring and severance | |
| Restructuring and severance | |
| Litigation settlements and contingencies | Litigation settlements and contingencies | | 488 | |
| Operating income | Operating income | | 6,613 | |
| Interest expense, net | Interest expense, net | | (6,940) | |
| Other income | Other income | | 439 | |
| Income before income taxes | Income before income taxes | | $ | 112 | |
| | | | | | | | | | | | | | | | | |
| Three Months Ended March 31, 2023 |
| Home | Consumer | Insurance | Other | Total |
| (in thousands) |
| Revenue | $ | 43,675 | | $ | 79,709 | | $ | 77,082 | | $ | 42 | | $ | 200,508 | |
| Segment marketing expense | 28,567 | | 44,833 | | 46,930 | | 221 | | 120,551 | |
| Segment profit (loss) | 15,108 | | 34,876 | | 30,152 | | (179) | | 79,957 | |
| Cost of revenue | | | | | 13,760 | |
| Brand and other marketing expense | | | | | 16,560 | |
| General and administrative expense | | | | | 36,683 | |
| Product development | | | | | 14,655 | |
| Depreciation | | | | | 4,795 | |
| Amortization of intangibles | | | | | 2,049 | |
| | | | | |
| Restructuring and severance | | | | | 4,454 | |
| Litigation settlements and contingencies | | | | | 12 | |
| Operating loss | | | | | (13,011) | |
| Interest income, net | | | | | 25,029 | |
| Other income | | | | | 1,834 | |
| Income before income taxes | | | | | $ | 13,852 | |
NOTE 16—RESTRUCTURING ACTIVITIES
During September 2023, the Company initiated workforce reductions of 14 employees. The Company incurred approximately $0.9 million in severance charges in connection with the workforce reductions, consisting of cash expenditures for employee separation costs of approximately $0.7 million and non-cash charges for the accelerated vesting of certain equity awards of approximately $0.2 million. The cash payments are expected to be substantially completed by the third quarter of 2024.
On April 6, 2023, the Company made the decision to close the Ovation credit services business ( the "Ovation Closure".) The Ovation Closure included the elimination of approximately 197 employees, or 18%, of the Company's workforce. As a
LENDINGTREE, INC. AND SUBSIDIARIES
NOTES TO CONSOLIDATED FINANCIAL STATEMENTS (Continued)
| | | | | | | | | | | | | | | | | |
| Three Months Ended June 30, 2022 |
| Home | Consumer | Insurance | Other | Total |
| (in thousands) |
| Revenue | $ | 73,938 | | $ | 106,144 | | $ | 81,756 | | $ | 85 | | $ | 261,923 | |
| Segment marketing expense | 47,198 | | 61,556 | | 59,172 | | 232 | | 168,158 | |
| Segment profit (loss) | 26,740 | | 44,588 | | 22,584 | | (147) | | 93,765 | |
| Cost of revenue | | | | | 14,574 | |
| Brand and other marketing expense | | | | | 16,379 | |
| General and administrative expense | | | | | 40,291 | |
| Product development | | | | | 14,318 | |
| Depreciation | | | | | 4,896 | |
| Amortization of intangibles | | | | | 7,075 | |
| | | | | |
| Restructuring and severance | | | | | 135 | |
| Litigation settlements and contingencies | | | | | (7) | |
| Operating loss | | | | | (3,896) | |
| Interest expense, net | | | | | (6,765) | |
| Other income | | | | | 284 | |
| Loss before income taxes | | | | | $ | (10,377) | |
| | | | | | | | | | | | | | | | | |
| Six Months Ended June 30, 2023 |
| Home | Consumer | Insurance | Other | Total |
| (in thousands) |
| Revenue | $ | 85,238 | | $ | 162,186 | | $ | 135,480 | | $ | 57 | | $ | 382,961 | |
| Segment marketing expense | 56,783 | | 86,640 | | 80,577 | | 495 | | 224,495 | |
| Segment profit (loss) | 28,455 | | 75,546 | | 54,903 | | (438) | | 158,466 | |
| Cost of revenue | | | | | 23,062 | |
| Brand and other marketing expense | | | | | 28,681 | |
| General and administrative expense | | | | | 65,843 | |
| Product development | | | | | 25,256 | |
| Depreciation | | | | | 9,479 | |
| Amortization of intangibles | | | | | 4,031 | |
| | | | | |
| Restructuring and severance | | | | | 8,012 | |
| Litigation settlements and contingencies | | | | | 500 | |
| Operating loss | | | | | (6,398) | |
| Interest income, net | | | | | 18,089 | |
| Other income | | | | | 2,273 | |
| Income before income taxes | | | | | $ | 13,964 | |
LENDINGTREE, INC. AND SUBSIDIARIES
NOTES TO CONSOLIDATED FINANCIAL STATEMENTS (Continued)
| | | | | | | | | | | | | | | | | |
| Six Months Ended June 30, 2022 |
| Home | Consumer | Insurance | Other | Total |
| (in thousands) |
| Revenue | $ | 175,882 | | $ | 207,212 | | $ | 161,794 | | $ | 213 | | $ | 545,101 | |
| Segment marketing expense | 113,233 | | 120,117 | | 118,107 | | 415 | | 351,872 | |
| Segment profit (loss) | 62,649 | | 87,095 | | 43,687 | | (202) | | 193,229 | |
| Cost of revenue | | | | | 30,135 | |
| Brand and other marketing expense | | | | | 36,822 | |
| General and administrative expense | | | | | 76,268 | |
| Product development | | | | | 28,370 | |
| Depreciation | | | | | 9,750 | |
| Amortization of intangibles | | | | | 14,992 | |
| | | | | |
| Restructuring and severance | | | | | 3,760 | |
| Litigation settlements and contingencies | | | | | (34) | |
| Operating loss | | | | | (6,834) | |
| Interest expense, net | | | | | (14,270) | |
| Other income | | | | | 283 | |
| Loss before income taxes | | | | | $ | (20,821) | |
NOTE 17—RESTRUCTURING ACTIVITIES
On April 6, 2023, the Company made the decision to close the Ovation credit services business ( the "Ovation Closure".) The Ovation Closure includes the elimination of approximately 197 employees, or 18%, of the Company's current workforce. As a result of the Ovation Closure, the Company incurred $2.1 million in restructuring expense in connection with cash expenditures for employee separation costs. The Ovation Closure, including cash payments, is expected to bewas completed byin the first quarter of 2024. In connection with the Ovation Closure, in the first quarter of 2023, the Company recorded asset impairment charges of $4.2 million, of which $2.1 million related to intangible assets, $1.7 million related to property and equipment, and $0.4 million related to an operating lease right-of-use asset.
On March 24, 2023, the Company committed to a workforce reduction plan (the “Reduction Plan”), to reduce operating costs. The Reduction Plan includesincluded the elimination of approximately 162 employees, or 13%, of the Company’s current workforce. As a result of the Reduction Plan, the Company estimates that it will incurincurred approximately $5.3 million in severance charges in connection with the workforce reduction, consisting of cash expenditures for employee separation costs of approximately $4.3 million and non-cash charges for the accelerated vesting of certain equity awards of approximately $1.0 million.
The Company has incurred restructuring expense of $4.3 million in the first quarter of 2023 and an additional $1.0 million of restructuring expense in the second quarter of 2023 related to the Reduction Plan. The Reduction Plan, including cash payments, is expected to be substantially completed by the end of the secondthird quarter of 2024.
Table of Contents | | | | | | | | | | | | | | | |
| Accrued Balance at December 31, 2023 | Income Statement Impact | Payments | | Accrued Balance at March 31, 2024 |
| Q3 2023 action | | | | | |
| Employee separation payments | $ | 254 | | $ | (7) | | $ | (82) | | | $ | 165 | |
| | | | | |
| Q2 2023 action | | | | | |
| Employee separation payments | 34 | | 4 | | (38) | | | — | |
| Q1 2023 action | | | | | |
| Employee separation payments | 421 | | 15 | | (181) | | | 255 | |
| | | | | |
| $ | 709 | | $ | 12 | | $ | (301) | | | $ | 420 | |
LENDINGTREE, INC. AND SUBSIDIARIES
NOTES TO CONSOLIDATED FINANCIAL STATEMENTS (Continued)NOTE 17—SUBSEQUENT EVENTS
During 2022,In April 2024, the Company completed workforce reductionsrepurchased approximately $37.7 million in eachprincipal amount of its 2025 Notes, through individual privately-negotiated transactions with certain holders of the first, second,2025 Notes, for $35.3 million in cash plus accrued and fourth quarters of approximately 75 employees, 25 employees, and 50 employees, respectively. In the first six months of 2022, the Company incurred total expense of $3.8 million consisting of employee separation costs of $2.7 million and non-cash compensation expense of $1.1 million due to the accelerated vesting of certain equity awards. All employee separation costs for 2022 actions are expected to be paid by the third quarter of 2023.
| | | | | | | | | | | | | | | | | |
| Accrued Balance at December 31, 2022 | Income Statement Impact | Payments | Non-Cash | Accrued Balance at June 30, 2023 |
| Q2 2023 action | | | | | |
| Employee separation payments | $ | — | | $ | 2,064 | | $ | (1,404) | | $ | — | | $ | 660 | |
| Q1 2023 action | | | | | |
| Employee separation payments | — | | 4,261 | | (2,935) | | — | | 1,326 | |
| Non-cash compensation | — | | 1,066 | | — | | (1,066) | | — | |
| 2022 action | | | | | |
| Employee separation payments | 304 | | 25 | | $ | (273) | | — | | 56 | |
| $ | 304 | | $ | 7,416 | | $ | (4,612) | | $ | (1,066) | | $ | 2,042 | |
Item 2. Management's Discussion and Analysis of Financial Condition and Results of Operations
Cautionary Statement Regarding Forward-Looking Information
This report contains “forward-looking statements” within the meaning of the Securities Act of 1933, as amended, and the Securities Exchange Act of 1934, as amended by the Private Securities Litigation Reform Act of 1995. These forward-looking statements include statements related to our anticipated financial performance, business prospects and strategy; anticipated trends and prospects in the various industries in which our businesses operate; new products, services and related strategies; and other similar matters. These forward-looking statements are based on management's current expectations and assumptions about future events, which are inherently subject to uncertainties, risks and changes in circumstances that are difficult to predict. The use of words such as “anticipates,” “estimates,” “expects,” “projects,” “intends,” “plans” and “believes,” among others, generally identifies forward-looking statements.
Actual results could differ materially from those contained in the forward-looking statements. Factors currently known to management that could cause actual results to differ materially from those in forward-looking statements include those matters discussed or referenced in Part II, Item 1A. Risk Factors included elsewhere in this Quarterly Report on Form 10-Q and Part I, Item 1A. Risk Factors of the Company's Annual Report on Form 10-K for the year ended December 31, 20222023 (the "2022“2023 Annual Report"Report”).
Other unknown or unpredictable factors that could also adversely affect our business, financial condition and results of operations may arise from time to time. In light of these risks and uncertainties, the forward-looking statements discussed in this Quarterly Report on Form 10-Q may not prove to be accurate. Accordingly, you should not place undue reliance on these forward-looking statements, which only reflect the views of LendingTree, Inc.'s management as of the date of this Quarterly Report on Form 10-Q. We undertake no obligation to update or revise forward-looking statements to reflect changed assumptions, the occurrence of unanticipated events or changes to future operating results or expectations, except as required by law.
Company Overview
LendingTree, Inc. is the parent of LT Intermediate Company, LLC, which holds all of the outstanding ownership interests of LendingTree, LLC, and LendingTree, LLC owns several companies.
We operate what we believe to be the leading online consumer platform that connects consumers with the solutionschoices they need to be confident in their financial decisions. Our online consumer platform providesWe offer consumers with access to product offerings from our Network Partners,tools and resources, including free credit scores, that facilitate comparison-shopping for mortgage loans, home equity loans and lines of credit, auto loans, credit cards, deposit accounts, personal loans, student loans, small business loans, insurance quotes, sales of insurance policies and other related offerings. In addition, we offer tools and resources, including free credit scores, that facilitate comparison shoppingWe primarily seek to match to match in-market consumers with multiple providers on its marketplace who can provide them with competing quotes for loans, deposit products, insurance andor other offerings. We seek to match consumers with multiple providers, who can offer them competing quotes for the product(s)related offerings they are seeking. We also serve as a valued partner to lenders and other providers seeking an efficient, scalable and flexible source of customer acquisition with directly measurable benefits, by matching the consumer inquiries we generate with these Network Partners.providers.
Our MyLendingTreeSpring platform offers a personalized comparison-shopping experience, financial health advice and credit simulations by providing free credit scores and credit score analysis. This authenticated and secure platform enables us to monitor consumers' credit profiles, and then identify and alert them to changes in their financial health, and to recommend loans and other offerings on our marketplace that may be more favorable than the terms they may have at a given point in time. This is designed to provide consumers with measurable savings opportunitiesCustomers can track the progress of their financial health over their lifetimes.time based on actions they have taken and see recommended credit score improvement actions, and loans or other products offered by LendingTree.
We are focused on developing new product offerings and enhancements to improve the experiences thatexperience of consumers and Network Partners have as they interact with us. By expanding our portfolio of financial services offerings, we are growing and diversifying our business and sources of revenue. We intend to capitalize on our expertise in performance marketing, product development and technology by leveraging the widespread recognition of the LendingTree brand.
We believe the consumer and small business financial services industry is still in the earlymiddle stages of a fundamental shift to online product offerings, similar to the shift that started in retail and travel many years ago and is now well established. We believe that like retail and travel, as consumers continue to move towards online shopping and transactions for financial services, suppliers will increasingly shift their product offerings and advertising budgets toward the online channel. We believe the strength of our brands and of our Network Partners place us in a strong position to continue to benefit from this market shift.
Economic Conditions
We continue to monitor the impact of the COVID-19 pandemic, government actions and measures taken to prevent its spread, and the potential to affect our operations. We are also monitoring the current global economic environment, specifically including inflationary pressures and interest rates, and any resulting impacts on our financial position and results of operations. Refer to Part I, Item 1A. “Risk Factors” of our 20222023 Annual Report for additional information.
Of our three reportable segments,During the Consumer segment was impacted the most from the COVID-19 pandemic as unsecured credit and the flowfirst quarter of capital in certain areas of the market contracted. Most of our selling and marketing expenses are variable costs that we adjust dynamically in relation to revenue opportunities to profitably meet demand. Thus, as our revenue was negatively impacted during the COVID-19 pandemic and the macro-economic conditions that followed, our marketing expenses generally decreased in line with revenue.
During 2023,2024, the challenging interest rate environment and inflationary pressures have continued to present challenges for many of our mortgage lending and insurance partners. In our Home segment, mortgage rates have remained relatively consistent in the secondfirst quarter of 20232024 compared to the fourth quarter of 2022,2023 and the first quarter of 2023, but nearly doubled compared to the first quarter of 2022. The significant increases inincreased mortgage rates caused a sharp decline incontinue to cause reduced refinance volumes and are puttingcontinue to put pressure on purchase activity. In our Insurance segment, demand from our carrier partners remains volatile as theyhas increased and we continue to deal with persistent industry headwinds.be optimistic about 2024.
Segment Reporting
We have three reportable segments: Home, Consumer, and Insurance.
Business Acquisitions
In January 2022, we acquired an equity interest in EarnUp for $15.0 million. EarnUp is a consumer-first mortgage payment platform that intelligently automates loan payment scheduling and helps consumers better manage their money and improve their financial well-being.
North Carolina Office Properties
Our corporate office is located on approximately 176,000 square feet of office space in Charlotte, North Carolina under an approximate 15-year lease that contractually commenced in the second quarter of 2021.
With our expansion in North Carolina, in December 2016, we received a grant from the state that provides up to $4.9 million in reimbursements through 2029 beginning in 2017 for investing in real estate and infrastructure in addition to increasing jobs in North Carolina at specific targeted levels through 2021, and maintaining the jobs thereafter. We have received approximately $0.7 million related to the December 2016 grants. If we are unable to maintain the specified target levels, our ability to earn further reimbursements could be limited. Additionally, the city of Charlotte and the county of Mecklenburg provided a grant that will be paid over five years and is based on a percentage of new property tax we pay on the development of a corporate headquarters. In December 2018, we received an additional grant from the state that provides an aggregate amount up to $8.4 million in reimbursements through 2032 beginning in 2021 for increasing jobs in North Carolina at specific targeted levels through 2024, and maintaining the jobs thereafter. We have currently not met the specified target levels set forth in the December 2018 grant and may not realize any reimbursements from this grant.
Recent Mortgage Interest Rate Trends
Interest rate and market risks can be substantial in the mortgage lead generation business. Short-term fluctuations in mortgage interest rates primarily affect consumer demand for mortgage refinancings, while long-term fluctuations in mortgage interest rates, coupled with the U.S. real estate market, affect consumer demand for new mortgages. Consumer demand, in turn, affects lender demand for mortgage leads from third-party sources, as well as our own ability to attract online consumers to our website.
Typically, when interest rates decline, we see increased consumer demand for mortgage refinancing, which in turn leads to increased traffic to our website and decreased selling and marketing efforts associated with that traffic. At the same time, lender demand for leads from third-party sources typically decreases, as there are more consumers in the marketplace seeking refinancings and, accordingly, lenders receive more organic mortgage lead volume. Due to lower lender demand, our revenue earned per consumer typically decreases, but with correspondingly lower selling and marketing costs.
Conversely, when interest rates increase, we typically see decreased consumer demand for mortgage refinancing, leading to decreased traffic to our website and higher associated selling and marketing efforts associated with that traffic. At the same time, lender demand for leads from third-party sources typically increases, as there are fewer consumers in the marketplace and, accordingly, the supply of organic mortgage lead volume decreases. Due to high lender demand, we typically see an increase in the amount lenders will pay per matched lead, which often leads to higher revenue earned per consumer. However, increases in the amount lenders will pay per matched lead in this situation is limited by the overall cost models of our lenders, and our revenue earned per consumer canmay be adversely affected by the overall reduced demand for refinancing in a rising rate environment.
We dynamically adjust selling and marketing expenditures in all interest rate environments to optimize our results against these variables.
According to Freddie Mac, the monthly average 30-year mortgage interest rates increased from a monthly average of 6.36%remained consistent at 6.82% in December 2022 to a monthly average of 6.71%2023 and in June 2023.March 2024. On a quarterly basis, 30-year mortgage interest rates decreased in the secondfirst quarter of 2023 averaged 6.49%2024 to an average 6.75%, compared to 5.24% in the second quarter of 2022 and 6.69%from 7.29% in the fourth quarter of 2022.2023. The quarterly average was up slightly in the first quarter of 2024 compared to 6.36% in the first quarter of 2023.
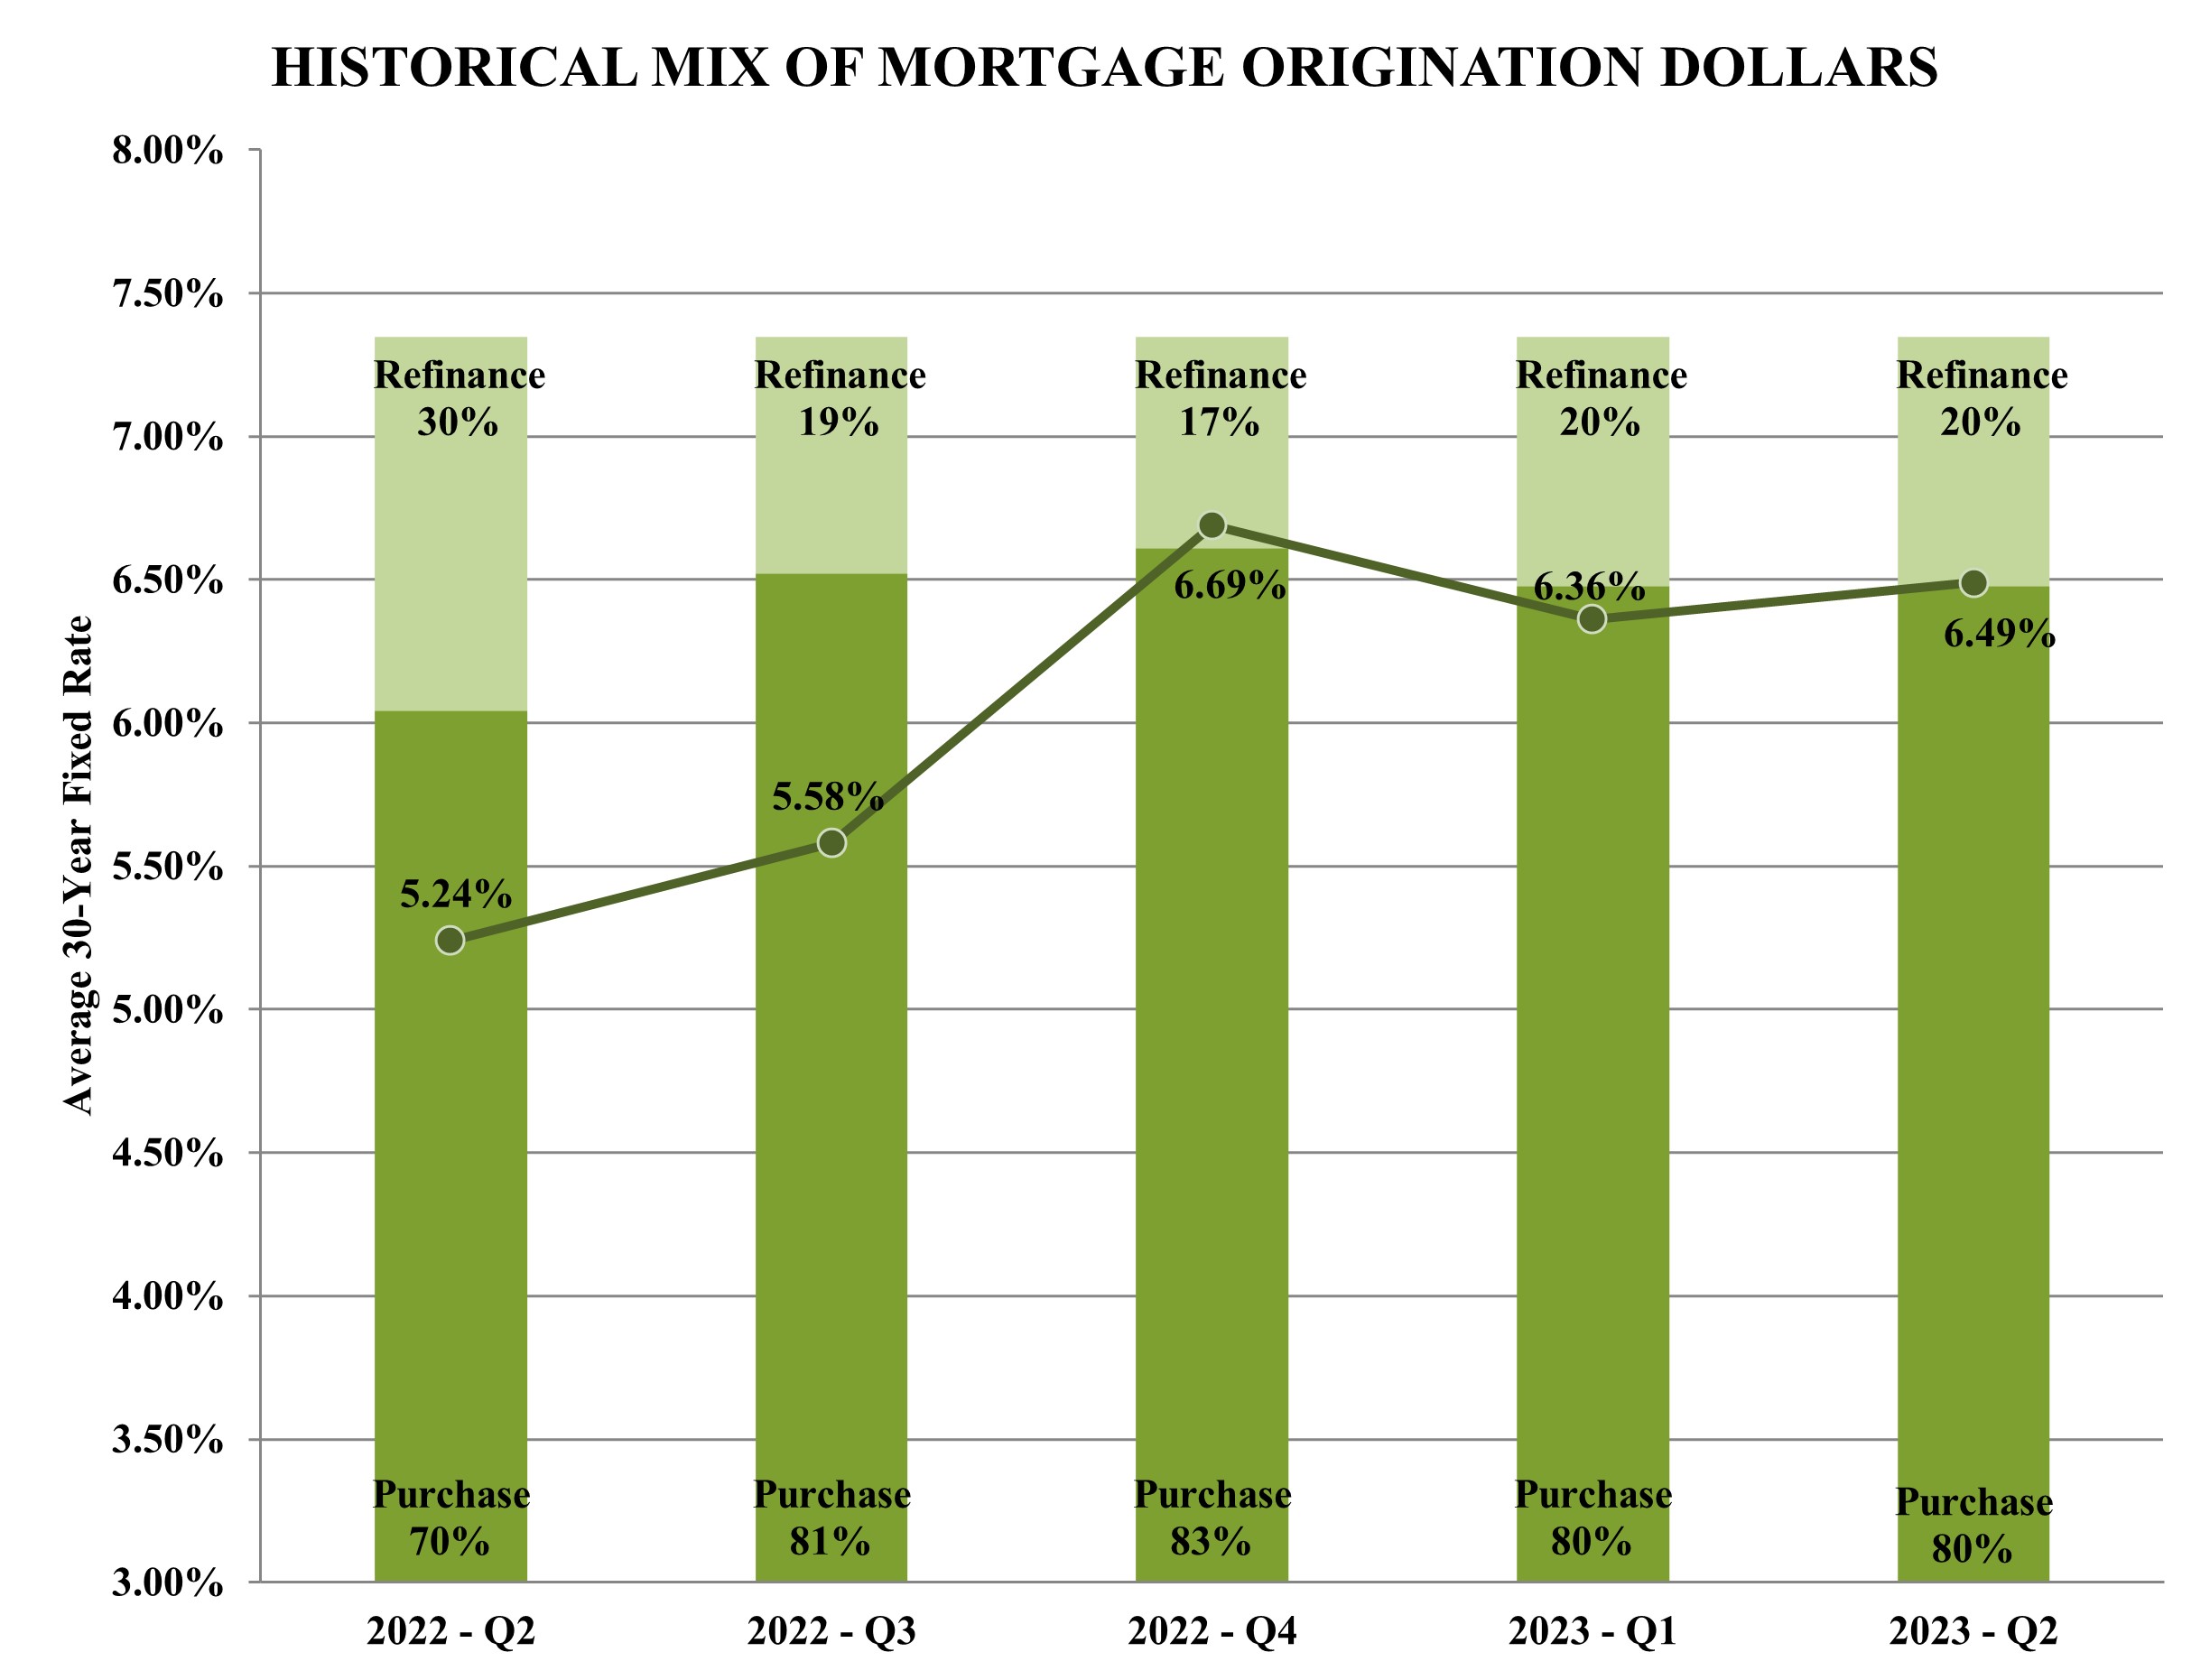
Typically, as mortgage interest rates rise, there are fewer consumers in the marketplace seeking refinancings and, accordingly, the mix of mortgage origination dollars will move toward purchase mortgages. According to Mortgage Bankers Association (“MBA”) data, total refinance origination dollars increased to 20%23% of total mortgage origination dollars in the secondfirst quarter of 20232024 compared to 17%19% in the fourth quarter of 2022 but decreased from 30%2023 and 20% in the secondfirst quarter of 2022.2023. In the secondfirst quarter of 2023,2024, total refinance origination dollars increased 39%15% from the fourth quarter of 20222023 and decreased 54%increased 30% from the secondfirst quarter of 2022.2023. Industry-wide mortgage origination dollars in the secondfirst quarter of 2023 increased 16%2024 decreased 6% from the fourth quarter of 2022 and decreased 32%2023, but increased 13% from secondfirst quarter of 2022.
According to MBA projections, the mix of mortgage origination dollars is expected to continue to be weighted towards purchase mortgages with the refinance share representing approximately 21%23% for 2024 compared to 19% in 2023.
The U.S. Real Estate Market
The health of the U.S. real estate market and interest rate levels are the primary drivers of consumer demand for new mortgages. Consumer demand, in turn, affects lender demand for purchase mortgage leads from third-party sources. Typically, a strong real estate market will lead to reduced lender demand for leads, as there are more consumers in the marketplace seeking financing and, accordingly, lenders receive more organic lead volume. Conversely, a weaker real estate market will typically lead to an increase in lender demand, as there are fewer consumers in the marketplace seeking mortgages.
According to Fannie Mae data, existing home sales increased 2%8% in the secondfirst quarter of 20232024 compared to the fourth quarter of 2022,2023, and decreased 21%3% compared to the secondfirst quarter of 2022.2023. Fannie Mae predicts an overall decreaseincrease in existing-home sales of approximately 16%4.3% in 20232024 compared to 2022.2023.
SpringTM
We consider certain metrics related to MyLendingTreeSpring set forth below to help us evaluate our business and growth trends and assess operational efficiencies. The calculation of the metrics discussed below may differ from other similarly titled metrics used by other companies, securities analysts or investors.
We continued to grow our user base and added 1.20.6 million new users in the secondfirst quarter of 2023,2024, bringing cumulative sign-ups to 26.928.8 million at June 30, 2023. We attribute $22 million of revenue in the second quarter of 2023 to registered MyLendingTree members across the LendingTree platform.March 31, 2024.
Our focus on improving the MyLendingTreeSpring experience for consumers remains a top priority. Becoming an integrated digital advisor will greatly improve the consumer experience, which we expect to result in higher levels of engagement improved membership growth rates, and ultimately stronger financial results.
Cost Reductions and Simplification of Business
On March 24, 2023, we committed to a workforce reduction plan (the “Reduction Plan”), to reduce operating costs, whichcosts. The Reduction Plan included the elimination of approximately 13% of the Company’s workforce. As a result of the Reduction Plan, we expect to incurincurred approximately $5.3 million in severance charges in connection with the workforce reduction, $4.3 million of which was incurred in the first quarter of 2023 and $1.0 million was incurred in the second quarter of 2023. Part of this Reduction Plan included the shut down of our LendingTree customer call center as well as our Medicare insurance agency operations within QuoteWizard. We anticipateestimate the Reduction Plan will reducereduced annual compensation expense by approximately $14 million, comprised of $2 million in cost of revenue, $4 million in selling and marketing expense, $3 million in general and administrative expense, and $5 million in product development.
Separately, in 2023, we made the decision to close our Ovation credit services business, an asset group within our Consumer segment, by mid- 2023. As a result, the Company recorded an asset impairment charge of $4.2 million in the first quarter of 2023 related to the write-off of certain long-term assets. Additionally, we incurred $2.1 million in severance charges in the second quarter of 2023 in connection with cash expenditures for employee separation costs. We acquired Ovation in 2018 to better serve those customers who come to LendingTree and receive suboptimal offers of credit. The business grew for a number of years before running into challenges in the wake of COVID-19, and more recently the industry has faced increased regulatory pressure. The business is capital-intensive, requires elevated overhead, and future prospects were becoming uncertain.
The Ovation business accounted for approximately 3% of total Revenuerevenue and 3% of Total Coststotal costs and Expenses,expenses, with an immaterial impact to Net Incomenet income on the Consolidated Statementconsolidated statement of Operationsoperations and Comprehensive Income (Loss)comprehensive income (loss) for the year ended December 31, 2022.
Recent Developments
In April 2024, we repurchased approximately $37.7 million in principal amount of our 0.50% Convertible Senior Notes due July 15, 2025, through individual privately-negotiated transactions with certain holders of such notes, for approximately $35.3 million in cash plus accrued and unpaid interest.
Results of Operations for the Three and Six Months ended June 30,March 31, 2024 and 2023 and 2022
| | | |
| | |
| | |
| | |
| | |
| | | | Three Months Ended June 30, | | Six Months Ended June 30, |
| | | 2023 | 2022 | $
Change | %
Change | | 2023 | 2022 | $
Change | %
Change |
| | | (Dollars in thousands) |
| Home | Home | $ | 41,563 | | $ | 73,938 | | $ | (32,375) | | (44) | % | | $ | 85,238 | | $ | 175,882 | | $ | (90,644) | | (52) | % |
| Home | |
| Home | |
| Consumer | |
| Consumer | |
| Consumer | Consumer | 82,477 | | 106,144 | | (23,667) | | (22) | % | | 162,186 | | 207,212 | | (45,026) | | (22) | % |
| Insurance | Insurance | 58,398 | | 81,756 | | (23,358) | | (29) | % | | 135,480 | | 161,794 | | (26,314) | | (16) | % |
| Insurance | |
| Insurance | |
| Other | |
| Other | |
| Other | Other | 15 | | 85 | | (70) | | (82) | % | | 57 | | 213 | | (156) | | (73) | % |
| Revenue | Revenue | 182,453 | | 261,923 | | (79,470) | | (30) | % | | 382,961 | | 545,101 | | (162,140) | | (30) | % |
| Revenue | |
| Revenue | |
| Costs and expenses: | |
| Costs and expenses: | |
| Costs and expenses: | Costs and expenses: | |
Cost of revenue (exclusive of depreciation and amortization shown separately below) | Cost of revenue (exclusive of depreciation and amortization shown separately below) | 9,302 | | 14,574 | | (5,272) | | (36) | % | | 23,062 | | 30,135 | | (7,073) | | (23) | % |
Cost of revenue (exclusive of depreciation and amortization shown separately below) | |
Cost of revenue (exclusive of depreciation and amortization shown separately below) | |
| Selling and marketing expense | |
| Selling and marketing expense | |
| Selling and marketing expense | Selling and marketing expense | 116,065 | | 184,537 | | (68,472) | | (37) | % | | 253,176 | | 388,694 | | (135,518) | | (35) | % |
| General and administrative expense | General and administrative expense | 29,160 | | 40,291 | | (11,131) | | (28) | % | | 65,843 | | 76,268 | | (10,425) | | (14) | % |
| General and administrative expense | |
| General and administrative expense | |
| Product development | |
| Product development | |
| Product development | Product development | 10,601 | | 14,318 | | (3,717) | | (26) | % | | 25,256 | | 28,370 | | (3,114) | | (11) | % |
| Depreciation | Depreciation | 4,684 | | 4,896 | | (212) | | (4) | % | | 9,479 | | 9,750 | | (271) | | (3) | % |
| Depreciation | |
| Depreciation | |
| Amortization of intangibles | |
| Amortization of intangibles | |
| Amortization of intangibles | Amortization of intangibles | 1,982 | | 7,075 | | (5,093) | | (72) | % | | 4,031 | | 14,992 | | (10,961) | | (73) | % |
| | Restructuring and severance | Restructuring and severance | 3,558 | | 135 | | 3,423 | | 2,536 | % | | 8,012 | | 3,760 | | 4,252 | | 113 | % |
| | Restructuring and severance | |
| | Restructuring and severance | |
| Litigation settlements and contingencies | |
| Litigation settlements and contingencies | |
| Litigation settlements and contingencies | Litigation settlements and contingencies | 488 | | (7) | | 495 | | 7,071 | % | | 500 | | (34) | | 534 | | 1,571 | % |
| Total costs and expenses | Total costs and expenses | 175,840 | | 265,819 | | (89,979) | | (34) | % | | 389,359 | | 551,935 | | (162,576) | | (29) | % |
| Total costs and expenses | |
| Total costs and expenses | |
| Operating income (loss) | |
| Operating income (loss) | |
| Operating income (loss) | Operating income (loss) | 6,613 | | (3,896) | | 10,509 | | 270 | % | | (6,398) | | (6,834) | | 436 | | 6 | % |
| Other income (expense), net: | Other income (expense), net: | |
| Other income (expense), net: | |
| Other income (expense), net: | |
| Interest (expense) income, net | |
| Interest (expense) income, net | |
| Interest (expense) income, net | Interest (expense) income, net | (6,940) | | (6,765) | | (175) | | (3) | % | | 18,089 | | (14,270) | | 32,359 | | 227 | % |
| Other income | Other income | 439 | | 284 | | 155 | | 55 | % | | 2,273 | | 283 | | 1,990 | | 703 | % |
| Income (loss) before income taxes | 112 | | (10,377) | | 10,489 | | 101 | % | | 13,964 | | (20,821) | | 34,785 | | 167 | % |
| Income tax (expense) benefit | (227) | | 2,339 | | (2,566) | | (110) | % | | (622) | | 1,957 | | (2,579) | | (132) | % |
| Net (loss) income and comprehensive (loss) income | $ | (115) | | $ | (8,038) | | $ | 7,923 | | 99 | % | | $ | 13,342 | | $ | (18,864) | | $ | 32,206 | | 171 | % |
| Other income | |
| Other income | |
| Income before income taxes | |
| Income before income taxes | |
| Income before income taxes | |
| Income tax expense | |
| Income tax expense | |
| Income tax expense | |
| Net income and comprehensive income | |
| Net income and comprehensive income | |
| Net income and comprehensive income | |
Revenue
Revenue decreased in the secondfirst quarter and first six months of 20232024 compared to the secondfirst quarter and first six months of 20222023 due to decreases in our Home, Consumer and Home segments, partially offset by an increase in our Insurance segments.segment.
Our Consumer segment includes the following products: credit cards, personal loans, small business loans, student loans, auto loans, deposit accounts, and other credit products such as credit repair and debt settlement. The credit repair business was closed at the end of the second quarter of 2023. Many of our Consumer segment products are not individually significant to revenue. Revenue from our Consumer segment decreased $23.7$28.3 million, or 22%, in the second quarter of 2023 from the second quarter of 2022, and decreased $45.0 million, or 22%35%, in the first six monthsquarter of 20232024 from the first six monthsquarter of 20222023 primarily due to decreases in our personal loans, credit cards and small business.other credit products.
Revenue from our personal loans product decreased $14.2$3.5 million, or 33%15%, to $28.1 million in the second quarter of 2023 from $42.3 million in the second quarter of 2022, and decreased $25.8 million, or 33%, to $51.7$20.1 million in the first six monthsquarter of 20232024 from $77.5$23.6 million in the first six monthsquarter of 20222023 primarily due to a decrease in the number of consumers completing request forms.
Revenue from our credit cards product decreased $6.2 million, or 23%, to $21.1 million in the second quarter of 2023 from $27.3 million in the second quarter of 2022 primarily due toforms and a decrease in the number of consumer clicks. Revenue from our credit cards product decreased $17.8 million, or 31%, to $39.4 million in the first six months of 2023 compared to $57.1 million in the first six months of 2022, primarily due to a decrease in the number of consumer clicks and in revenue earned per click.consumer.
For the periods presented, no other products in our Consumer segment represented more than 10% of revenue; however, certain other Consumer products experienced notable changes. Revenue from our small business loans productcredit cards decreased $4.0
$10.5 million, or 23%57%, in the first quarter of 2024 from the first quarter of 2023 primarily due to decreases in the number of consumer clicks and in revenue earned per click. Revenue from other credit products decreased $7.4 million, or 65%, in the first quarter of 2024 from the first quarter of 2023 due to the closure of our Ovation credit services business at the end of the second quarter of 2023 compared to the second quarter of 2022, primarily due to a decrease in revenue earned per consumer and a decrease in the number of consumers completing request forms.2023. Revenue from our small business loans produced decreased $6.0$3.0 million, or 17%18%, in the first six monthsquarter of 2023 compared to2024 from the first six monthsquarter of 2022, primarily2023 due to a decrease in the number of consumers completing request forms.forms partially offset by an increase in revenue earned per consumer.
Our Home segment includes the following products: purchase mortgage, refinance mortgage, and home equity loans and lines of credit. We ceased offering reverse mortgage loans in the fourth quarter of 2022. Revenue from our Home segment decreased $32.4$13.2 million, or 44%, in the second quarter of 2023 from the second quarter of 2022, and decreased $90.6 million, or 52%30%, in the first six monthsquarter of 20232024 from the first six monthsquarter of 20222023 primarily due to decreases in revenue from our refinance and purchase mortgage products.
Revenue from our mortgage products decreased $28.1$10.3 million, or 63%52%, to $16.2 million in the second quarter of 2023 from $44.4 million in the second quarter of 2022, and decreased $86.1 million, or 70%, to $36.2$9.6 million in the first six monthsquarter of 20232024 from $122.3$20.0 million in the first six months of 2022. Revenue from our refinance mortgage product decreased $19.9 million in the second quarter of 2023 compared to the second quarter of 2022 and decreased $68.1 million in the first six months of 2023 compared to the first six months of 2022 due to a decrease in the number of consumers completing request forms and a decrease in revenue earned per consumer, as interest rates have risen.2023. Revenue from our purchase mortgage product decreased $8.2 million in the second quarter of 2023 compared to the second quarter of 2022, and decreased $18.1$5.9 million in the first six monthsquarter of 20232024 compared to the first six monthsquarter of 20222023, primarily due to a decrease in the number of consumers completing request forms and a decrease in revenue earned per consumer. Revenue from our refinance mortgage product decreased $4.4 million in the first quarter of 2024 compared to the first quarter of 2023 due to a decrease in the number of consumers completing request forms and a decrease in revenue earned per consumer. Increased mortgage rates continue to cause reduced refinance volumes and continue to put pressure on purchase activity. Revenue from our home equity loans product decreased $3.0$2.9 million, or 11%12%, to $25.3 million in the second quarter of 2023 from $28.4 million in the second quarter of 2022, and decreased $2.5 million, or 5%, to $49.0$20.8 million in the first six monthsquarter of 20232024 from $51.5$23.7 million in the first six monthsquarter of 2022.2023.
Revenue from our Insurance segment decreased $23.4increased $8.8 million, or 29%11%, to $58.4 million in the second quarter of 2023 from $81.8 million in the second quarter of 2022, and decreased $26.3 million, or 16%, to $135.5$85.9 million in the first six monthsquarter of 2024 from $77.1 million in the first quarter of 2023 from $161.8 million first six monthsdue to an increase in the number of 2022 primarily due toconsumers seeking insurance, partially offset by a decrease in revenue earned per consumer.
Cost of revenue
Cost of revenue consists primarily of costs associated with compensation and other employee-related costs (including stock-based compensation) relating to internally-operated customer call centers, third-party customer call center fees, credit scoring fees, credit card fees, website network hosting, and server fees.
Cost of revenue decreased in the secondfirst quarter of 2024 from the first quarter of 2023 from the second quarter of 2022,by $5.2 million, primarily due to a decrease in compensation and benefits of $4.0 million. Cost of revenue decreased in the first six months of 2023 from the first six months of 2022 primarily due to a decrease in compensation and benefits of $4.2 million and a decrease in website network hosting and server hosting fees of $1.8$4.3 million. The decreases in the second quarter and first six months aredecrease is primarily due to the Reduction Plan at the end of the first quarter of 2023, including shutting down the LendingTree call customer call center.center and the closure of our Ovation credit services business at the end of the second quarter of 2023.
Cost of revenue as a percentage of revenue decreased to 5% in the secondfirst quarter of 20232024 compared to 6% in the second quarter of 2022, and remained consisted at 6%7% in the first six monthsquarter of 2023 and 2022.2023.
Selling and marketing expense
Selling and marketing expense consists primarily of advertising and promotional expenditures and compensation and other employee-related costs (including stock-based compensation) for personnel engaged in sales or marketing functions. Advertising and promotional expenditures primarily include online marketing, as well as television, print, and radio spending. Advertising production costs are expensed in the period the related ad is first run.
Selling and marketing expense decreased in the secondfirst quarter of 2023 compared to the second quarter 2022 by $68.5 million, and decreased $135.5 million in the first six months of 20232024 compared to the first six months of 2022quarter 2023 by $28.9 million primarily due to the changes in advertising and promotional expense discussed below. Additionally, compensation and benefits decreased $3.3 million in the second quarter of 2023 compared to the second quarter of 2022 and decreased $5.6$2.9 million in the first six monthsquarter of 20232024 compared to the first six months of 2022.
Advertising and promotional expense is the largest component of selling and marketing expense, and is comprised of the following:
| | | |
| | |
| | |
| | |
| | |
| | | | Three Months Ended June 30, | | Six Months Ended June 30, |
| | | 2023 | 2022 | $
Change | %
Change | | 2023 | 2022 | $
Change | %
Change |
| | | (Dollars in thousands) |
| Online | Online | $ | 104,354 | | $ | 167,711 | | $ | (63,357) | | (38) | % | | $ | 225,074 | | $ | 350,184 | | $ | (125,110) | | (36) | % |
| Online | |
| Online | |
| Broadcast | |
| Broadcast | |
| Broadcast | Broadcast | (86) | | 770 | | (856) | | (111) | % | | 220 | | 1,610 | | (1,390) | | (86) | % |
| Other | Other | 1,690 | | 2,671 | | (981) | | (37) | % | | 5,063 | | 8,434 | | (3,371) | | (40) | % |
| Other | |
| Other | |
| Total advertising expense | Total advertising expense | $ | 105,958 | | $ | 171,152 | | $ | (65,194) | | (38) | % | | $ | 230,357 | | $ | 360,228 | | $ | (129,871) | | (36) | % |
| Total advertising expense | |
| Total advertising expense | |
In the periods presented, advertising and promotional expenses are equivalent to the non-GAAP measure variable marketing expense. See Variable Marketing Expense and Variable Marketing Margin below for additional information.
Revenue is primarily driven by Network Partner demand for our products, which is matched to corresponding consumer requests. We adjust our selling and marketing expenditures dynamically in relation to anticipated revenue opportunities in order to ensure sufficient consumer inquiries to profitably meet such demand. An increase in a product’s revenue is generally met by a corresponding increase in marketing spend, and conversely a decrease in a product’s revenue is generally met by a corresponding decrease in marketing spend. This relationship exists for our Home, Consumer, and Insurance segments.
We adjusted our advertising expenditures in the secondfirst quarter and first six months of 20232024 compared to the secondfirst quarter and first six months of 20222023 in response to changes in Network Partner demand on our marketplace. We will continue to adjust selling and marketing expenditures dynamically in response to anticipated revenue opportunities.
General and administrative expense
General and administrative expense consists primarily of compensation and other employee-related costs (including stock-based compensation) for personnel engaged in finance, legal, tax, corporate information technology, human resources and executive management functions, as well as facilities and infrastructure costs and fees for professional services.
General and administrative expense decreased $10.9 million in the secondfirst quarter of 2023 from2024 compared to the secondfirst quarter of 2022 primarily due to a decrease in compensation2023. Compensation and benefits of $5.9 million, a decrease in loss on assets of $2.9 million, and a decrease in facilities expense of $0.9 million. General and administrativebad debt expense decreased in the first six monthsquarter of 2024 compared to the first quarter of 2023 fromby $3.8 million and $1.1 million, respectively. In the first six monthsquarter of 2022 primarily due to a decrease in compensation and benefits of $7.6 million, a decrease in facilities expenses of $1.6 million, a decrease in franchise tax expense of $1.5 million, partially offset by an increase in loss on assets of $1.7 million. We2023 we incurred a $4.2 million loss on the impairment of assets for our Ovation business in the first quarter of 2023.business.
General and administrative expense as a percentage of revenue increased to 16% in the second quarter of 2023 compared to 15% in the second quarter of 2022, and increased to 17% in the first six monthsquarter of 20232024 was 15% compared to 14% in18% for the first six monthsquarter of 2022.
2023.
Product development
Product development expense consists primarily of compensation and other employee-related costs (including stock-based compensation) and third-party labor costs that are not capitalized, for employees and consultants engaged in the design, development, testing and enhancement of technology.
Product development expense decreased in the secondfirst quarter and first six months of 20232024 compared to the secondfirst quarter and first six months of 20222023 primarily due to the Reduction Plan at the end of the first quarter of 2023. We continued to invest in internal development of new and enhanced features, functionality and business opportunities that we believe will enable us to better and more fully serve consumers and Network Partners.
Amortization of intangibles
The decrease in amortization of intangibles in the second quarter and first six months of 2023 compared to the second quarter and first six months of 2022 was primarily due to certain intangible assets associated with our recent business acquisitions becoming fully amortized.
Restructuring and severance
On March 24, 2023, we committed to the Reduction Plan to reducethat reduced operating costs, whichcosts. The Reduction Plan included the elimination of approximately 13% of the Company’s workforce. As a result of the Reduction Plan, we estimate that we will incurincurred approximately $5.3 million in severance charges in connection with the workforce reduction, consisting of cash expenditures for employee separation costs of approximately $4.3 million and non-cash charges for the accelerated vesting of certain equity awards of approximately $1.0 million.
We incurred restructuring expense of $4.3 million in the first quarter of 2023 and an additional $1.0 million of restructuring expense in the second quarter of 2023 related to the Reduction Plan. We anticipate that the execution of the Reduction Plan, including cash payments, will be completed by the end of the second quarter of 2024.
We made the decision to close the Ovation credit services business by mid-2023. We incurred $2.1 million of restructuring expense related to the Ovation closure in the second quarter of 2023 in connection with cash expenditures for employee separation costs. We anticipate the cash payments for separation costs will be completed by the second quarter of 2024.
In the first quarter of 2022, we completed a workforce reduction of approximately 75 employees and in the second quarter of 2022 completed a workforce reduction of approximately 25 employees. We incurred total expense of $3.8 million in the first six months of 2022 related to these actions, consisting of employee separation costs of $2.7 million and non-cash compensation expense of $1.1 million due to the accelerated vesting of certain equity awards.2023.
Interest income/expense
In the first quarter of 2023, we repurchased approximately $190.6 million in principal amount of our 0.50% Convertible Senior Notes due July 15, 2025 (the "2025 Notes") for $156.3 million plus accrued and unpaid interest of approximately $0.1 million. As a result of the repurchase, we recognized a gain on the extinguishment of $34.3 million, a loss on the write-off of unamortized debt issuance costs of $2.4 million, and incurred debt repayment costs of $1.0 million, all of which are included in interest income/expense,(expense) income, net in the consolidated statementsstatement of operations and comprehensive income. See Note 13—12—Debt for additional information.
Other income
For the second quarter and first six months of 2023 and 2022, otherOther income primarily consistedconsists of dividend income.
Income tax expense
For the secondfirst quarter of 2024 and first six months of 2023, the effective tax rate varied from the federal statutory rate of 21% primarily due to the change in the valuation allowance, net of the current period change in tax effected net indefinite-lived intangibles.
For the second quarter and first six months
Segment Profit
| | | |
| | |
| | |
| | |
| | |
| | | | Three Months Ended June 30, | | Six Months Ended June 30, |
| | | 2023 | 2022 | $
Change | %
Change | | 2023 | 2022 | $
Change | %
Change |
| | | (Dollars in thousands) |
| Home | Home | $ | 13,347 | | $ | 26,740 | | $ | (13,393) | | (50) | % | | $ | 28,455 | | $ | 62,649 | | $ | (34,194) | | (55) | % |
| Home | |
| Home | |
| Consumer | |
| Consumer | |
| Consumer | Consumer | 40,670 | | 44,588 | | (3,918) | | (9) | % | | 75,546 | | 87,095 | | (11,549) | | (13) | % |
| Insurance | Insurance | 24,751 | | 22,584 | | 2,167 | | 10 | % | | 54,903 | | 43,687 | | 11,216 | | 26 | % |
| Insurance | |
| Insurance | |
| Other | |
| Other | |
| Other | Other | (259) | | (147) | | (112) | | (76) | % | | (438) | | (202) | | (236) | | (117) | % |
| Segment profit | Segment profit | $ | 78,509 | | $ | 93,765 | | $ | (15,256) | | (16) | % | | $ | 158,466 | | $ | 193,229 | | $ | (34,763) | | (18) | % |
| Segment profit | |
| Segment profit | |
Segment profit is our primary segment operating metric. Segment profit is calculated as segment revenue less segment selling and marketing expenses attributed to variable costs paid for advertising, direct marketing and related expenses that are
directly attributable to the segments' products. See Note 16—15—Segment Information in the notes to the consolidated financial statements for additional information on segments and a reconciliation of segment profit to pre-tax income.
Home
Revenue in the Home segment revenue of $41.6decreased 30% to $30.4 million in the secondfirst quarter of 2023 decreased 44% from the second quarter of 2022 and2024, with segment profit of $13.3$9.6 million in the secondfirst quarter of 2023 decreased 50%2024, a decrease of 36% from the secondfirst quarter of 2022. The Home2023. Despite the decrease in revenue in the first quarter of 2024, our variable marketing model generated a 32% segment margin, of 32%which was down from 35% in the secondfirst quarter of 2023 decreased from 36% in the second quarter of 2022, as lower close rates realized by our Network Partners has negatively impacted revenue per consumer.2023. Our home equity business again produced the majority of the Home segment's revenue, declining 11%12% in the secondfirst quarter of 20232024 from the secondfirst quarter of 2022. 2023. According to the National Association of Realtors, the inventory of existing homes for sale was up 14% in the first quarter of 2024 compared to the first quarter of 2023. This remains a depressed level historically, but may indicate that sellers are beginning to adjust to higher mortgage rates and prioritizing normal life changes that require moves.
Consumer demand to borrow against a near record level of equity in their homes remains strong, and wewith volume for the product increasing 14% in the first quarter of 2024 compared to the first quarter of 2023. We expect this channelthe home equity product will continue to generateaccount for the majority of segmentHome revenue going forward.for the remainder of the year.
Consumer
Revenue in our Consumer segment decreased 35% to $51.5 million in the first quarter of 2024 from the first quarter of 2023, with segment profit $27.4 million in the first quarter of 2024 a decrease of 21% from the first quarter of 2023. Our Consumer segment revenue of $82.5 millionmargin increased to 53% in the secondfirst quarter of 2024 from 44% in the first quarter of 2023 was down 22%due to a mix-shift towards higher earning products and lower partner demand allowing us to decrease usage of our highest cost marketing channels.
Revenue from our personal loan product of $20.1 million decreased 15% in the first quarter of 2024 from the second quarter of 2022, while segment profit of $40.7 million was down a more modest 9% as segment margin improved to 49% in the secondfirst quarter of 2023 compared to 42% inas lending standards remained restrictive, although this tightening has remained stable for the second quarter of 2022.
Personal loans revenue of $28.1 million in the second quarter of 2023 decreased 33% from the second quarter of 2022 as close rates again declined from the prior quarter, most notably in prime and mid-prime segments. Although partner appetite to extend credit appears to have stabilized since multiple regional banks failed in March 2023, capital market headwinds and the outlook for additional increases in short-term rates by the Federal Reserve mean a return to year over year revenue growth is unlikely to occur this year.past several months.
Small business revenue decreased 23%declined 18% in the secondfirst quarter of 20222024 from the secondfirst quarter of 2023. Ongoing tightening ofThe causes were similar to those experienced in personal loans. Tighter credit by our lender partners again negatively impactedconditions are decreasing conversion rates most notably for lower credit quality borrowers. Close rates have now declined steadily for four consecutive quarters. The average loan size has also declined across borrower credit spectrum, which directly impacts revenue we earn on funded loans. We have focused on optimizingat our marketing mix to target higher credit quality borrowers as well as bringing on new lender partners to improve close rates.lending partners.
Credit cardInsurance
Insurance revenue of $21.1$85.9 million in the secondfirst quarter of 2024 increased 11% from the first quarter of 2023 decreased 23%as our carrier partners began to prioritize new customer acquisition after spending most of the last two years increasing premium rates for new policies. Segment profit of $33.4 million in the first quarter of 2024 increased 11% from the second quarter of 2022. During the secondfirst quarter of 2023 as segment profit margin remained consistent at 39%. We believe we continuedare in the beginning stages of a broad recovery in personal insurance marketing spend by our partners.
According to migrate trafficthe Bureau of Labor Statistics, the cost of consumer auto insurance increased 22% in March 2024 compared to our LendingTree website from our CompareCards domain. The resultsMarch 2023. Consumers have been positive,coming to us in record numbers to obtain new quotes as these premium increases are communicated to them. However, until recently carriers have shown limited demand to provide new customers quotes. We
expect significantly higher prices to consumers will drive an increase in switching between insurers, which in turn will encourage carriers to advertise more aggressively with notably improved consumer engagementus to defend and higher approval rates observed. The implementation of LightSpeed, our new credit card tech platform, has performed as expected, greatly improving page load speeds and redirect rates. These improvements in consumer experience represent the beginning of our approach to recapturegrow market share in this large and important vertical.
Insurance
Revenue of $58.4 million in the second quarter of 2023 decreased 29% from the second quarter of 2022, however, segment profit of $24.8 million in the second quarter of 2023 increased 10% from the second quarter of 2022. As expected, carriers reduced advertising budgets in the quarter due to worse than expected loss rates on personal auto policies. Continued operating efficiency gains generated a 42% segment margin compared to a 28% segment margin in the second quarter of 2022.share.
Variable Marketing Expense and Variable Marketing Margin
We report variable marketing expense and variable marketing margin as supplemental measures to accounting principles generally accepted in the United States of America ("GAAP").) These related measures are the primary metrics by which we measure the effectiveness of our marketing efforts. Variable marketing expense represents the portion of selling and marketing expense attributable to variable costs paid for advertising, direct marketing, and related expenses, and excludes overhead, fixed costs, and personnel-related expenses. Variable marketing margin is a measure of the efficiency of our operating model, measuring revenue after subtracting variable marketing expense. Our operating model is highly sensitive to the amount and efficiency of variable marketing expenditures, and our proprietary systems are able to make rapidly changing decisions concerning the deployment of variable marketing expenditures (primarily but not exclusively online and mobile advertising placement) based on proprietary and sophisticated analytics. We believe that investors should have access to the same set of tools that we use in analyzing our results. This non-GAAP measure should be considered in addition to results prepared in
accordance with GAAP but should not be considered a substitute for or superior to GAAP results. We provide and encourage investors to examine the reconciling adjustments between the GAAP and non-GAAP measures discussed below.
Variable marketing expense is defined as the expense attributable to variable costs paid for advertising, direct marketing and related expenses, and excluding overhead, fixed costs and personnel-related expenses. The majority of these variable advertising costs are expressly intended to drive traffic to our websites and these variable advertising costs are included in selling and marketing expense on our consolidated statements of operations and comprehensive income (loss).income. Variable marketing margin is defined as revenue less variable marketing expense.
The following shows the calculation of variable marketing margin:
| | Three Months Ended
March 31, | |
| Three Months Ended
March 31, | |
| Three Months Ended
March 31, | |
| | | Three Months Ended
June 30, | | Six Months Ended
June 30, |
| | | 2023 | | 2022 | | 2023 | | 2022 |
| (in thousands) |
| (in thousands) | |
| (in thousands) | |
| (in thousands) | |
| Revenue | |
| Revenue | |
| Revenue | Revenue | $ | 182,453 | | | $ | 261,923 | | | $ | 382,961 | | | $ | 545,101 | |
| Variable marketing expense | Variable marketing expense | 105,958 | | | 171,152 | | | 230,357 | | | 360,228 | |
| Variable marketing expense | |
| Variable marketing expense | |
| Variable marketing margin | Variable marketing margin | $ | 76,495 | | | $ | 90,771 | | | $ | 152,604 | | | $ | 184,873 | |
| Variable marketing margin | |
| Variable marketing margin | |
Below is a reconciliation of selling and marketing expense, the most directly comparable GAAP measure, to variable marketing expense:
| | Three Months Ended
March 31, | |
| Three Months Ended
March 31, | |
| Three Months Ended
March 31, | |
| | | Three Months Ended
June 30, | | Six Months Ended
June 30, |
| | | 2023 | | 2022 | | 2023 | | 2022 |
| (in thousands) |
| (in thousands) | |
| (in thousands) | |
| (in thousands) | |
| Selling and marketing expense | |
| Selling and marketing expense | |
| Selling and marketing expense | Selling and marketing expense | $ | 116,065 | | | $ | 184,537 | | | $ | 253,176 | | | $ | 388,694 | |
| Non-variable selling and marketing expense | Non-variable selling and marketing expense | (10,107) | | | (13,385) | | | (22,819) | | | (28,466) | |
| Non-variable selling and marketing expense | |
| Non-variable selling and marketing expense | |
| Variable marketing expense | Variable marketing expense | $ | 105,958 | | | $ | 171,152 | | | $ | 230,357 | | | $ | 360,228 | |
| Variable marketing expense | |
| Variable marketing expense | |
The following is a reconciliation of net (loss) income, the most directly comparable GAAP measure, to variable marketing margin:
| | Three Months Ended
March 31, | |
| Three Months Ended
March 31, | |
| Three Months Ended
March 31, | |
| | | Three Months Ended
June 30, | | Six Months Ended
June 30, |
| | | 2023 | | 2022 | | 2023 | | 2022 |
| (in thousands) | |
| (in thousands) | |
| (in thousands) | |
| Net income | |
| Net income | |
| Net income | |
| | (in thousands) |
| Net (loss) income | $ | (115) | | $ | (8,038) | | $ | 13,342 | | $ | (18,864) |
| | Adjustments to reconcile to variable marketing margin: | |
| | Adjustments to reconcile to variable marketing margin: | |
| | | Adjustments to reconcile to variable marketing margin: | Adjustments to reconcile to variable marketing margin: | |
| Cost of revenue | Cost of revenue | 9,302 | | 14,574 | | 23,062 | | 30,135 |
| Cost of revenue | |
| Cost of revenue | |
| Non-variable selling and marketing expense (1) | |
| Non-variable selling and marketing expense (1) | |
| Non-variable selling and marketing expense (1) | Non-variable selling and marketing expense (1) | 10,107 | | 13,385 | | 22,819 | | 28,466 |
| General and administrative expense | General and administrative expense | 29,160 | | 40,291 | | 65,843 | | 76,268 |
| General and administrative expense | |
| General and administrative expense | |
| Product development | |
| Product development | |
| Product development | Product development | 10,601 | | 14,318 | | 25,256 | | 28,370 |
| Depreciation | Depreciation | 4,684 | | 4,896 | | 9,479 | | 9,750 |
| Depreciation | |
| Depreciation | |
| Amortization of intangibles | |
| Amortization of intangibles | |
| Amortization of intangibles | Amortization of intangibles | 1,982 | | 7,075 | | 4,031 | | 14,992 |
| | Restructuring and severance | Restructuring and severance | 3,558 | | 135 | | 8,012 | | 3,760 |
| | Restructuring and severance | |
| | Restructuring and severance | |
| Litigation settlements and contingencies | |
| Litigation settlements and contingencies | |
| Litigation settlements and contingencies | Litigation settlements and contingencies | 488 | | (7) | | 500 | | (34) |
| Interest expense (income), net | Interest expense (income), net | 6,940 | | 6,765 | | (18,089) | | 14,270 |
| Other (income) expense | (439) | | (284) | | (2,273) | | (283) |
| Income tax expense (benefit) | 227 | | (2,339) | | 622 | | (1,957) |
| Interest expense (income), net | |
| Interest expense (income), net | |
| Other income | |
| Other income | |
| Other income | |
| Income tax expense | |
| Income tax expense | |
| Income tax expense | |
| Variable marketing margin | |
| Variable marketing margin | |
| Variable marketing margin | Variable marketing margin | $ | 76,495 | | $ | 90,771 | | $ | 152,604 | | $ | 184,873 |
|
| | | | | |
| |
| (1) | | Represents the portion of selling and marketing expense not attributable to variable costs paid for advertising, direct marketing and related expenses. Includes overhead, fixed costs and personnel-related expenses. |
Adjusted EBITDA
We report Adjusted EBITDA as a supplemental measure to GAAP. This measure is the primary metric by which we evaluate the performance of our businesses, on which our marketing expenditures and internal budgets are based and by which, in most years, management and many employees are compensated. We believe that investors should have access to the same set of tools that we use in analyzing our results. This non-GAAP measure should be considered in addition to results prepared in accordance with GAAP but should not be considered a substitute for or superior to GAAP results. We provide and encourage investors to examine the reconciling adjustments between the GAAP and non-GAAP measures discussed below.
Definition of Adjusted EBITDA
We report Adjusted EBITDA as net income adjusted to exclude interest, income tax, amortization of intangibles and depreciation, and to further exclude (1) non-cash compensation expense, (2) non-cash impairment charges, (3) gain/loss on disposal of assets, (4) gain/loss on investments (5) restructuring and severance expenses, (6) litigation settlements and contingencies, (7) acquisitions and dispositions income or expense (including with respect to changes in fair value of contingent consideration), (8) contributions to the LendingTree Foundation, (9) dividend income, and (10) one-time items. Adjusted EBITDA has certain limitations in that it does not take into account the impact to our statement of operations of certain expenses, including depreciation, non-cash compensation and acquisition-related accounting. We endeavor to compensate for the limitations of the non-GAAP measures presented by also providing the comparable GAAP measures with equal or greater prominence and descriptions of the reconciling items, including quantifying such items, to derive the non-GAAP measures. These non-GAAP measures may not be comparable to similarly titled measures used by other companies.
One-Time Items
Adjusted EBITDA is adjusted for one-time items, if applicable. Items are considered one-time in nature if they are non-recurring, infrequent, or unusual and have not occurred in the past two years or are not expected to recur in the next two years,
in accordance with SEC rules. For the periods presented below, there are no adjustments for one-time items consisteditems.
Non-Cash Expenses that are Excluded from Adjusted EBITDA
Non-cash compensation expense consists principally of expense associated with grants of restricted stock, restricted stock units and stock options, some of which awards have performance-based vesting conditions. Non-cash compensation expense also includes expense associated with employee stock purchase plans. These expenses are not paid in cash, and we include the related shares in our calculations of fully diluted shares outstanding. Upon settlement of restricted stock units, exercise of certain stock options or vesting of restricted stock awards, the awards may be settled, on a net basis, with us remitting the required tax withholding amount from our current funds.
Amortization of intangibles are non-cash expenses relating primarily to intangible assets acquired through acquisitions. At the time of an acquisition, the intangible assets of the acquired company, such as purchase agreements, technology and customer relationships, are valued and amortized over their estimated lives.
The following table is a reconciliation of net (loss) income, the most directly comparable GAAP measure, to Adjusted EBITDA.
| | Three Months Ended
March 31, | |
| Three Months Ended
March 31, | |
| Three Months Ended
March 31, | |
| | | Three Months Ended
June 30, | | Six Months Ended
June 30, |
| | | 2023 | | 2022 | | 2023 | | 2022 |
| (in thousands) |
| Net (loss) income | $ | (115) | | | $ | (8,038) | | | $ | 13,342 | | | $ | (18,864) | |
| (in thousands) | |
| (in thousands) | |
| (in thousands) | |
| Net income | |
| Net income | |
| Net income | |
| Adjustments to reconcile to Adjusted EBITDA: | |
| Adjustments to reconcile to Adjusted EBITDA: | |
| Adjustments to reconcile to Adjusted EBITDA: | Adjustments to reconcile to Adjusted EBITDA: | | | | |
| Amortization of intangibles | Amortization of intangibles | 1,982 | | | 7,075 | | | 4,031 | | | 14,992 | |
| Amortization of intangibles | |
| Amortization of intangibles | |
| Depreciation | |
| Depreciation | |
| Depreciation | Depreciation | 4,684 | | | 4,896 | | | 9,479 | | | 9,750 | |
| Restructuring and severance | Restructuring and severance | 3,558 | | | 135 | | | 8,012 | | | 3,760 | |
| Restructuring and severance | |
| Restructuring and severance | |
| Loss on impairments and disposal of assets | Loss on impairments and disposal of assets | 140 | | | 2,996 | | | 5,167 | | | 3,427 | |
| Loss on investments | 1,440 | | | — | | | 1,440 | | | — | |
| Loss on impairments and disposal of assets | |
| Loss on impairments and disposal of assets | |
| | Non-cash compensation expense | Non-cash compensation expense | 9,204 | | | 17,335 | | | 20,407 | | | 31,332 | |
| Franchise tax caused by equity investment gain | — | | | — | | | — | | | 1,500 | |
| | Non-cash compensation expense | |
| | Non-cash compensation expense | |
| | Acquisition expense | |
| | Acquisition expense | |
| | | Acquisition expense | Acquisition expense | 4 | | | 58 | | | (5) | | | 67 | |
| Litigation settlements and contingencies | Litigation settlements and contingencies | 488 | | | (7) | | | 500 | | | (34) | |
| Interest (income) expense, net | 6,940 | | | 6,765 | | | (18,089) | | | 14,270 | |
| Litigation settlements and contingencies | |
| Litigation settlements and contingencies | |
| Interest expense (income), net | |
| Interest expense (income), net | |
| Interest expense (income), net | |
| Dividend income | Dividend income | (1,879) | | | (282) | | | (3,713) | | | (282) | |
| Income tax expense (benefit) | 227 | | | (2,339) | | | 622 | | | (1,957) | |
| Dividend income | |
| Dividend income | |
| Income tax expense | |
| Income tax expense | |
| Income tax expense | |
| Adjusted EBITDA | Adjusted EBITDA | $ | 26,673 | | | $ | 28,594 | | | $ | 41,193 | | | $ | 57,961 | |
| Adjusted EBITDA | |
| Adjusted EBITDA | |
Financial Position, Liquidity and Capital Resources
General
As of June 30, 2023,March 31, 2024, we had $162.6$230.7 million of cash and cash equivalents, compared to $298.8$112.1 million of cash and cash equivalents as of December 31, 2022.
On March 8, 2023, we repurchased approximately $190.6 million in principal amount of our 2025 Notes, through separate transactions with certain holders of the 2025 Notes, for $156.3 million plus accrued and unpaid interest of approximately $0.1 million. In the first quarter of 2023, we recognized a gain on the extinguishment of $34.3 million, a loss on the write-off of unamortized debt issuance costs of $2.4 million and incurred debt repayment costs of $1.0 million, all of which are included in interest income/expense, net in the consolidated statement of operations and comprehensive income. See Note 13—Debt for additional information.2023.
We expect our cash and cash equivalents and cash flows from operations to be sufficient to fund our operating needs for the next twelve months and beyond. Our credit facilityfacilities described below is anare additional potential sourcesources of liquidity. We will
continue to monitor the impact of the current economic conditions, including interest rates, inflation, and ongoing COVID-19 pandemicinflation on our liquidity and capital resources.
Credit FacilityFacilities
On September 15, 2021, we entered into a credit agreement (the “Credit Agreement”), consisting of a $200.0 million revolving credit facility (the “Revolving Facility”), which matures on September 15, 2026, and a $250.0 million delayed draw term loan facility (the “Term Loan Facility”“2021 Term Loan” and together with the Revolving Facility, the “Credit Facility”), which matures on September 15, 2028. The proceeds of the Revolving Facility can be used to finance working capital, for general corporate purposes and any other purpose not prohibited by the Credit Agreement. We borrowed $250.0 million under the delayed draw term loan on May 31, 2022 and used $170.2 million of the proceeds to settle the Company’s 0.625% Convertible Senior Notes due June 1, 2022, Notes, including interest. The remaining proceeds of $79.8 million may be used for general corporate purposes and any other purposes not prohibited by the Credit Agreement. See Note 13—Debt for additional information.
As of July 27, 2023,May 1, 2024, we have outstanding $247.5$245.6 million under the
2021 Term Loan, Facility, a $0.2 million letter of credit under the Revolving Facility and the remaining borrowing capacity under the Revolving Facility is $199.8 million. We have $101.1As of March 31, 2024, we had $91.2 million available for borrowing under the Revolving Facility, however this availability will be limited as our cash on hand is utilized to repay our 0.50% Convertible Senior Notes due July 15, 2025.
On March 27, 2024, we entered a first lien term loan facility (the “2024 Term Loan”), consisting of $175.0 million which matures on March 27, 2031. We drew $125.0 million of the 2024 Term Loan upon closing while the remaining $50.0 million will be available as a delayed draw term loan until March 27, 2025. The proceeds of the 2024 Term Loan will be used for working capital and general corporate purposes, which may include repayment of our 0.50% Convertible Senior Notes due July 27, 2023.15, 2025. The funding had a $3.1 million original issue discount and associated debt issuance costs of $4.2 million.
As of May 1, 2024, the Company had $125.0 million borrowings outstanding under the 2024 Term Loan.
See Note 12—Debt for additional information.
Cash Flows
Our cash flows are as follows:
| | | | Six Months Ended
June 30, | | Three Months Ended
March 31, |
| | | 2023 | | 2022 | | 2024 | | 2023 |
| | | (in thousands) | | (in thousands) |
| Net cash provided by operating activities | Net cash provided by operating activities | $ | 28,224 | | | $ | 16,093 | |
| Net cash used in investing activities | Net cash used in investing activities | (4,853) | | | (22,786) | |
| Net cash (used in) provided by financing activities | (159,665) | | | 34,584 | |
| Net cash provided by (used in) financing activities | |
Cash Flows from Operating Activities
Our largest source of cash provided by our operating activities is revenues generated by our products. Our primary uses of cash from our operating activities include advertising and promotional payments. In addition, our uses of cash from operating activities include compensation and other employee-related costs, other general corporate expenditures, litigation settlements and contingencies, and income taxes.
Net cash provided by operating activities increaseddecreased in the first sixthree months of 2024 from the first three months of 2023 from the first six months of 2022 primarily due to favorableunfavorable changes in accounts receivable and prepaidaccounts payable, accrued expenses and other current assets.liabilities.
Cash Flows from Investing Activities
Net cash used in investing activities in the first sixthree months of 2024 and 2023 of $4.9$2.7 million and $2.5 million, respectively, consisted of capital expenditures primarily related to internally developed software.
Net cash used in investing activities in the first six months of 2022 of $22.8 million consisted of the purchase of a $16.4 million equity interest in EarnUp and another small investment, as well as capital expenditures of $6.3 million primarily related to internally-developed software.
Cash Flows from Financing Activities
Net cash used in financing activities in the first six months of 2023 of $159.7 million consisted primarily of the repurchase of our Convertible Senior Notes for $156.3 million.
Net cash provided by financing activities in the first sixthree months of 20222024 of $34.6$115.7 million consisted primarily of $250.0the $117.8 million innet proceeds from the term loan and the repayment of $169.7 million to settle our 2022 Notes discussed in the “Credit Facility” section above, $43.0 million for the repurchase of our stock, and $2.72024 Term Loan partially offset by $1.4 million in withholding taxes paid upon surrender of shares to satisfy obligations on equity awards, net of proceeds from the exercise of stock options.
Net cash used in financing activities in the first three months of 2023 of $159.6 million consisted primarily of the repurchase of our 0.50% Convertible Senior Notes due July 15, 2025 for $156.3 million and $1.7 million in withholding taxes paid upon surrender of shares to satisfy obligations on equity awards, net of proceeds from the exercise of stock options.
New Accounting Pronouncements
For information regarding new accounting pronouncements, see Note 2—Significant Accounting Policies, in Part I, Item 1 Financial Statements. of this Quarterly Report on Form 10-Q.
Item 3. Quantitative and Qualitative Disclosures about Market Risk
Other than our Credit Facility and the 2024 Term Loan, we do not have any financial instruments that are exposed to significant market risk. We maintain our cash and cash equivalents in bank deposits and short-term, highly liquid money market investments. A hypothetical 100-basis point increase or decrease in market interest rates would not have a material impact on the fair value of our cash equivalents securities, or our earnings on such cash equivalents, but would have a $2.5 million annual effect on the interest paid on borrowings under the Credit Facility.Facility and a $1.3 million annual effect on the interest paid on borrowings under the 2024 Term Loan. As of July 27, 2023,May 1, 2024, the Company had $247.5$245.6 million outstanding on its 2021 Term Loan Facility, and there were no outstanding borrowings under its Revolving Facility. As of May 1, 2024, the Company had $125.0 million outstanding on its 2024 Term Loan.
Fluctuations in interest rates affect consumer demand for new mortgages and the level of refinancing activity which, in turn, affects lender demand for mortgage leads. Typically, when interest rates decline, we see increased consumer demand for mortgage refinancing, which in turn leads to increased traffic to our website and decreased selling and marketing efforts associated with that traffic. At the same time, lender demand for leads from third-party sources typically decreases, as there are more consumers in the marketplace seeking refinancings and, accordingly, lenders receive more organic lead volume. Due to lower lender demand, our revenue earned per consumer typically decreases but with correspondingly lower selling and marketing costs. Conversely, when interest rates increase, we typically see decreased consumer demand for mortgage refinancing, leading to decreased traffic to our website and higher associated selling and marketing efforts associated with that traffic. At the same time, lender demand for leads from third-party sources typically increases, as there are fewer consumers in the marketplace and, accordingly, the supply of organic mortgage lead volume decreases. Due to high lender demand, we typically see an increase in the amount lenders will pay per matched lead, which often leads to higher revenue earned per consumer. However, increases in the amount lenders will pay per matched lead in this situation is limited by the overall cost models of our lenders, and our revenue earned per consumer can be adversely affected by the overall reduced demand for refinancing in a rising rate environment.
Item 4. Controls and Procedures
Evaluation of Disclosure Controls and Procedures
As required by Rule 13a-15(b) of the Securities Exchange Act of 1934, as amended (the “Exchange Act”), management, with the participation of our principal executive officer (our Chief Executive Officer) and principal financial officer (our Chief Financial Officer), evaluated, as of the end of the period covered by this report, the effectiveness of our disclosure controls and procedures. The term “disclosure controls and procedures,” as defined in Rules 13a-15(e) and 15d-15(e) under the Exchange Act, means controls and other procedures of a company that are designed to ensure that information required to be disclosed by a company in the reports that it files under the Exchange Act is recorded, processed, summarized and reported, within the time periods specified in the SEC’s rules and forms. Disclosure controls and procedures include, without limitation, controls and procedures designed to ensure that information required to be disclosed by a company in the reports that it files under the Exchange Act is accumulated and communicated to a company’s management, including its principal executive officer and principal financial officer, as appropriate to allow timely decisions regarding required disclosure. Based upon that evaluation, our Chief Executive Officer and Chief Financial Officer concluded that our disclosure controls and procedures are effective, as of June 30, 2023,March 31, 2024, to reasonably ensure that information required to be disclosed and filed under the Exchange Act is recorded, processed, summarized and reported within the time periods specified, and that management will be timely alerted to material information required to be included in our periodic reports filed with the Securities and Exchange Commission.SEC.
Changes in Internal Control Over Financial Reporting
There was no change in our internal control over financial reporting that occurred during the quarter ended June 30, 2023March 31, 2024 that has materially affected, or is reasonably likely to materially affect, our internal controls over financial reporting.
PART II—OTHER INFORMATION
Item 1. Legal Proceedings
In the ordinary course of business, we are party to litigation involving property, contract, intellectual property, data privacy and security, and a variety of other claims. The amounts that may be recovered in such matters may be subject to insurance coverage. We have provided information about certain legal proceedings in which we are involved in Part I, Item 3. Legal Proceedings of our 20222023 Annual Report and updated that information in Note 14—13—Contingencies to the consolidated financial statements included elsewhere in this Quarterly Report on Form 10-Q.
Item 1A. Risk Factors
Risk factors that affect our business and financial results are discussed in Part I, Item 1A ""Risk FactorsFactors" ," in our 20222023 Annual Report. There have been no material changes to the risk factors included in our 20222023 Annual Report.
You should carefully consider the risks described in our 20222023 Annual Report, which could materially affect our business, financial condition or future results. The risks described in our 20222023 Annual Report are not the only risks we face. Additional risks and uncertainties not currently known to us or that we currently deem to be immaterial also may materially adversely affect our business, financial condition, and/or operating results. If any of the risks actually occur, our business, financial condition, and/or results of operations could be negatively affected.
Item 2. Unregistered Sales of Equity Securities and Use of Proceeds
Issuer Purchases of Equity Securities
In each of February 2018 and February 2019, the board of directors authorized and we announced a stock repurchase program which allowed for the repurchase of up to $100.0 million and $150.0 million, respectively, of our common stock. Under this program, we can repurchase stock in the open market or through privately-negotiated transactions. We have used available cash to finance these repurchases. We will determine the timing and amount of any additional repurchases based on our evaluation of market conditions, applicable SEC guidelines and regulations, and other factors. This program may be suspended or discontinued at any time at the discretion of our board of directors. Our 2024 Term Loan limits stock repurchases. During the quarter ended June 30, 2023,March 31, 2024, no shares of common stock were repurchased under the stock repurchase program. As of July 24, 2023,May 1, 2024, approximately $96.7 million remains authorized for share repurchase.
Additionally, the LendingTree Seventh Amended and Restated 20082023 Stock Plan allowedand LendingTree 2023 Inducement Grant Plan allows employees to forfeitelect for us to withhold (or take back, with respect to restricted stock awards) shares of our common stock to satisfy federal and state withholding obligations upon the exercise of stock options, the settlement of restricted stock unit awards and the vesting of restricted stock awards granted to those individuals under the plans. During the quarter ended June 30, 2023, 5,644March 31, 2024, 68,950 shares were purchasedwithheld related to these obligations under the LendingTree Seventh Amended and Restated 20082023 Stock Plan. The withholding of those shares does not affect the dollar amount or number of shares that may be purchased under the stock repurchase program described above.
The following table provides information about the Company's purchases of equity securities during the quarter ended June 30, 2023.March 31, 2024.
| | | | | | | | | | | | | | | | | | | | | | | | | | |
| Period | | Total Number of Shares Purchased (1) | | Average Price
Paid per Share | | Total Number of Shares Purchased as Part of Publicly Announced Plans or Programs (2) | | Approximate
Dollar Value of Shares
that May Yet Be
Purchased Under the
Plans or Programs |
| | | | | | | | (in thousands) |
| 4/1/2023 - 4/30/2023 | | 573 | | | $ | 25.08 | | | — | | | $ | 96,655 | |
| 5/1/2023 - 5/31/2023 | | 861 | | | $ | 18.46 | | | — | | | $ | 96,655 | |
| 6/1/2023 - 6/30/2023 | | 4,210 | | | $ | 21.62 | | | — | | | $ | 96,655 | |
| Total | | 5,644 | | | $ | 21.49 | | | — | | | $ | 96,655 | |
| | | | | | | | | | | | | | | | | | | | | | | | | | |
| Period | | Total Number of Shares Purchased (1) | | Average Price
Paid per Share | | Total Number of Shares Purchased as Part of Publicly Announced Plans or Programs (2) | | Approximate
Dollar Value of Shares
that May Yet Be
Purchased Under the
Plans or Programs |
| | | | | | | | (in thousands) |
| 1/1/2024 - 1/31/2024 | | 625 | | | $ | 26.80 | | | — | | | $ | 96,655 | |
| 2/1/2024 - 2/29/2024 | | 74 | | | $ | 31.66 | | | — | | | $ | 96,655 | |
| 3/1/2024 - 3/31/2024 | | 68,251 | | | $ | 40.00 | | | — | | | $ | 96,655 | |
| Total | | 68,950 | | | $ | 39.87 | | | — | | | $ | 96,655 | |
(1)During April 2023, May 2023January 2024, February 2024 and June 2023, 573March 2024, 625 shares, 86174 shares and 4,21068,251 shares, respectively (totaling 5,64468,950 shares), were purchased to satisfy federal and state withholding obligations of our employees upon the settlement of restricted stock units, all in accordance with our Seventh Amended and Restated 20082023 Stock Plan, as described above.
(2)See the narrative disclosure above the table for further description of our publicly announced stock repurchase program.
Item 5. Other Information
During the fiscal quarter ended June 30, 2023,March 31, 2024, none of the Company's directors or executive officers adopted or terminated any contract, instruction or written plan for the purchase or sale of Company securities that was intended to satisfy the affirmative defense conditions of Rule 10b5-1(c) or any "non-Rule 10b5-1 trading arrangement."
On July 26, 2023, Further, during the Company’s directors adopted the LendingTree, Inc. 2023 Inducement Grant Plan (the “Inducement Plan”) and, subject to the adjustment provisions of the Inducement Plan, reserved 100,000 shares of the Company’s common stock for issuance pursuant to equity awards to be granted under the Inducement Plan.
The Inducement Plan was adopted without stockholder approval pursuant to Rule 5635(c)(4) of the Nasdaq Listing Rules. The Inducement Plan provides for the grant of stock options, stock appreciation rights, restricted stock units, and other types of equity-based incentive compensation. The terms and conditions of the Inducement Plan are substantially similar to the Company’s 2023 Stock Plan (as was described in our proxy statement for the 2023 annual stockholder meeting), but with such other terms and conditions intended to comply with the Nasdaq inducement award rules and which are generally not applicable to inducement plans (e.g., no statutory incentive stock options could be granted under the Inducement Plan and only non-qualified options may be granted). On July 26, 2023, the Board also adopted forms of award agreements for use with the Inducement Plan.
In accordance with Rule 5635(c)(4) of the Nasdaq Listing Rules, the only persons eligible to receive grants of equity awards under the Inducement Plan are individuals who were not previously an employee or director offiscal quarter ended March 31, 2024, the Company did not adopt or followingterminate a bona fide period of non-employment, as an inducement material to such persons entering into employment with the Company.
The above description of the Inducement Plan and the award agreements thereunder is not complete and is qualified in its entirety by reference to the text of the Inducement Plan and its forms of award agreements, complete copies of which are filed herewith as Exhibits 10.1, 10.2, and 10.3, respectively, and are incorporated herein by reference.
Item 6. Exhibits
| | | | | | | | | | | | | | |
| Exhibit | | Description | | Location |
| | | | |
| 3.1 | | | | | Exhibit 3.1 to the Registrant's Current Report on Form 8-K filed August 25, 2008 |
| 3.2 | | | | | Exhibit 3.1 to the Registrant's Current Report on Form 8-K filed November 15, 2017 |
| 10.1 | | | Second Amendment made as of February 16, 2024 and effective as of February 20, 2024, to the Employment Agreement, dated as of November 30, 2020, and effective as of December 1, 2020, as previously amended December 29, 2023, by and among Douglas R. Lebda, LendingTree, Inc. 2023 Inducement Grant Plan*and LendingTree, LLC.* | | †Exhibit 10.38 to the Registrant’s Annual Report on Form 10-K filed February 29, 2024 |
| 10.2 | | | | | † |
10.3 | | | | | †** |
| 31.1 | | | | | † |
| 31.2 | | | | | † |
| 32.1 | | | | | †† |
| 32.2 | | | | | †† |
| 101.INS | | Inline XBRL Instance Document — The instance document does not appear in the Interactive Data File because its XBRL tags are embedded within the Inline XBRL document. | | ††† |
| 101.SCH | | Inline XBRL Taxonomy Extension Schema Document | | ††† |
| 101.CAL | | Inline XBRL Taxonomy Extension Calculation Linkbase Document | | ††† |
| 101.DEF | | Inline XBRL Taxonomy Extension Definition Linkbase Document | | ††† |
| 101.LAB | | Inline XBRL Taxonomy Extension Label Linkbase Document | | ††† |
| 101.PRE | | Inline XBRL Taxonomy Extension Presentation Linkbase Document | | ††† |
| 104 | | Cover Page Interactive Data File (embedded within the Inline XBRL document contained in Exhibit 101) | | ††† |
† Filed herewith.
†† Furnished herewith. This certification is being furnished solely to accompany this report pursuant to 18 U.S.C. 1350, and is not being filed for purposes of Section 18 of the Securities Exchange Act of 1934, as amended, and is not to be incorporated by reference into any filing of the registrant, whether made before or after the date hereof, regardless of any general incorporation language in such filing.
††† Furnished herewith. Pursuant* Management contract or compensation plan or arrangement.
**Certain schedules to Rule 406Tthis Exhibit have been omitted in accordance with Regulation S-K Item 601(a)(5). The Company agrees to furnish supplementally a copy of Regulation S-T,all omitted schedules to the Interactive Data Files on Exhibit 101 hereto are deemed not filed or part of a registration statement or prospectus for purposes of Sections 11 or 12 of the Securities Act of 1933, as amended, are deemed not filed for purposes of Section 18 of the Securities Exchange Act of 1934, as amended, and otherwise are not subject to liability under those sections.SEC upon its request.
SIGNATURE
Pursuant to the requirements of the Securities Exchange Act of 1934, the registrant has duly caused this report to be signed on its behalf by the undersigned thereunto duly authorized.
Date: July 27, 2023May 1, 2024
| | | | | | | | |
| | LENDINGTREE, INC. |
| | | |
| | By: | /s/ TRENT ZIEGLER |
| | | Trent Ziegler |
| | | Chief Financial Officer |
| | (principal financial officerPrincipal Financial Officer and duly authorized officer)Duly Authorized) |