UNITED STATES
SECURITIES AND EXCHANGE COMMISSION
WASHINGTON, D.C. 20549
Form 10-Q
(Mark One)
|
| |
| x | QUARTERLY REPORT PURSUANT TO SECTION 13 OR 15(d) OF THE SECURITIES EXCHANGE ACT OF 1934 |
For the quarterly period ended June 30, 2017March 31, 2018
OR
|
| |
| o | TRANSITION REPORT PURSUANT TO SECTION 13 OR 15(d) OF THE SECURITIES EXCHANGE ACT OF 1934 |
Commission file number 001-35281
Forbes Energy Services Ltd.
(Exact name of registrant as specified in its charter)
|
| | |
| Delaware | | 98-0581100 |
(State or other jurisdiction of incorporation or organization) | | (I.R.S. Employer Identification No.) |
| | | |
3000 South Business Highway 281 Alice, Texas | | 78332 |
| (Address of principal executive offices) | | (Zip Code) |
Registrant’s telephone number, including area code:
(361) 664-0549
Indicate by check mark whether the registrant (1) has filed all reports required to be filed by Section 13 or 15(d) of the Securities Exchange Act of 1934 during the preceding 12 months (or for such shorter period that the registrant was required to file such reports), and (2) has been subject to such filing requirements for the past 90 days. x Yes ¨ No
Indicate by check mark whether the registrant has submitted electronically and posted on its corporate Web site, if any, every Interactive Data File required to be submitted and posted pursuant to Rule 405 of Regulation S-T (§232.405 of this chapter) during the preceding 12 months (or for such shorter period that the registrant was required to submit and post such files). x Yes ¨ No
Indicate by check mark whether the registrant is a large accelerated filer, an accelerated filer, a non-accelerated filer, or a smaller reporting company, or an emerging growth company. See definitions of “large accelerated filer,” “accelerated filer” andfiler,” “smaller reporting company”company,” and "emerging growth company" in Rule 12b-2 of the Exchange Act.
|
| | | |
| Large accelerated filer | ¨ | Accelerated filer | ¨ |
| | | | |
| Non-accelerated filer | ¨ (Do not check if a smaller reporting company) | Smaller reporting company | x |
| | | | |
| | | Emerging growth company | ¨ |
| | | | |
If an emerging growth company, indicate by check mark if the registrant has elected not to use the extended transition period for complying with any new or revised financial accounting standards provided pursuant to Section 13(a) of the Exchange Act. ¨ |
Indicate by check mark whether the registrant is a shell company (as defined in Exchange Act Rule 12b-2). ¨ Yes x No
Indicate by check mark whether the registrant has filed all documents and reports required to be filed by Section 12, 13 or 15(d) of the Securities Exchange Act of 1934 subsequent to the distribution of securities under a plan confirmed by a court (as defined in Exchange Act Rule 12b-2). x Yes ¨ No
The number of shares of common stock, par value $0.01 per share, of Forbes Energy Services Ltd. outstanding as of August 14, 2017May 10, 2018 was 5,249,997.5,336,397.
FORBES ENERGY SERVICES LTD.
TABLE OF CONTENTS
|
| | |
| | | Page |
| |
| Item 1. | | |
| Item 2. | | |
| Item 3. | | |
| Item 4. | | |
| | |
| |
| Item 1. | | |
| Item 1A. | | |
| Item 2. | | |
| Item 3. | | |
| Item 4. | | |
| Item 5. | Other Information | |
| Item 6. | Exhibits | |
| | Signatures | |
FORWARD-LOOKING STATEMENTS
This Quarterly Report on Form 10-Q and any oral statements made in connection with it include certain forward-looking statements within the meaning of the federal securities laws. You can generally identify forward-looking statements by the appearance in such a statement of words like “anticipate,” “believe,” “continue,” “could,” “estimate,” “expect,” “intend,” “may,” “plan,” “potential,” “predict,” “project” or “should” or other comparable words or the negative of these words. When you consider our forward-looking statements, you should keep in mind the risk factors we describe and other cautionary statements we make in this Quarterly Report on Form 10-Q. Our forward-looking statements are only predictions based on expectations that we believe are reasonable. Our actual results could differ materially from those anticipated in, or implied by, these forward-looking statements as a result of known risks and uncertainties set forth below and elsewhere in this Quarterly Report on Form 10-Q. These factors include or relate to the following:
the effect of the industry-wide downturn incyclical nature of energy exploration and development activities;
continuing incurrence of operating losses due to such downturn;
oil and natural gas commodity prices;
market response to global demands to curtail use of oil and natural gas;
capital budgets and spending by the oil and natural gas industry;
the ability or willingness of the Organization of Petroleum Exporting Countries, or OPEC, to set and maintain production levels for oil;
oil and natural gas production levels by non-OPEC countries;
supply and demand for oilfield services and industry activity levels;
our ability to maintain stable pricing;
possible impairment of our long-lived assets;
potential for excess capacity;
competition;
substantial capital requirements;
significant operating and financial restrictions under our loan and security agreement which provides for a term loan of $50.0 million, or the New Loan Agreement;
technological obsolescence of operating equipment;
dependence on certain key employees;
concentration of customers;
substantial additional costs of compliance with reporting obligations, the Sarbanes-Oxley Act and New Loan Agreement covenants;
seasonality of oilfield services activity;
collection of accounts receivable;
environmental and other governmental regulation;
the potential disruption of business activities caused by the physical effects, if any, of climate change;
risks inherent in our operations;
ability to fully integrate future acquisitions;
variation from projected operating and financial data;
variation from budgeted and projected capital expenditures;
volatility of global financial markets; and
the other factors discussed under “Risk Factors” beginning on page 1110 of the Annual Report on Form 10-K for the year ended December 31, 2016, as amended.2017.
We undertake no obligation to update or revise any forward-looking statements, whether as a result of new information, future events or otherwise. To the extent these risks, uncertainties and assumptions give rise to events that vary from our expectations, the forward-looking events discussed in this Quarterly Report on Form 10-Q may not occur. All forward-looking statements attributable to us are qualified in their entirety by this cautionary statement.
PART I—FINANCIAL INFORMATION
Item 1. Unaudited Condensed Consolidated Financial Statements
Forbes Energy Services Ltd.
(Debtor-in-Possession January 22, 2017 through April 12, 2017)
Condensed Consolidated Balance Sheets (unaudited)
(in thousands, except par value amounts) | |
| Successor |
|
| Predecessor | Successor |
| June 30,
2017 |
|
| December 31,
2016 | March 31,
2018 |
|
| December 31,
2017 |
| Assets |
|
|
|
|
|
|
|
| Current assets |
|
|
|
|
|
|
|
| Cash and cash equivalents | $ | 16,139 |
|
|
| $ | 20,437 |
| $ | 7,572 |
|
| $ | 5,465 |
|
| Cash - restricted | 33,979 |
|
|
| 27,563 |
| 25,601 |
|
| 30,015 |
|
| Accounts receivable - trade, net of allowance for doubtful accounts of $1.7 million and $1.4 million as of June 30, 2017 and December 31, 2016, respectively | 19,756 |
|
|
| 16,962 |
| |
| Accounts receivable - trade, net | | 26,623 |
|
| 24,341 |
|
| Accounts receivable - other | 714 |
|
|
| 290 |
| 207 |
|
| 496 |
|
| Prepaid expenses and other current assets | 5,290 |
|
|
| 8,778 |
| 8,926 |
|
| 11,212 |
|
| Total current assets | 75,878 |
|
|
| 74,030 |
| 68,929 |
|
| 71,529 |
|
| Property and equipment, net | 117,941 |
|
|
| 233,362 |
| 115,401 |
|
| 117,191 |
|
| Intangible assets, net | 12,446 |
|
|
| 3,220 |
| 11,572 |
|
| 11,852 |
|
| Other assets | 2,295 |
|
|
| 2,269 |
| 1,104 |
|
| 1,185 |
|
| Total assets | $ | 208,560 |
|
|
| $ | 312,881 |
| $ | 197,006 |
|
| $ | 201,757 |
|
| Liabilities, Temporary Equity and Stockholders’ Equity (Deficit) |
|
|
|
| |
| Liabilities and Stockholders’ Equity | |
|
|
|
| Current liabilities |
|
|
|
|
|
|
|
| Current portions of long-term debt | $ | 1,456 |
|
|
| $ | 298,932 |
| $ | 5,097 |
|
| $ | 7,566 |
|
| Accounts payable - trade | 11,244 |
|
|
| 4,505 |
| 11,206 |
|
| 7,497 |
|
| Accounts payable - related parties | — |
|
|
| 18 |
| 1 |
|
| 11 |
|
| Accrued interest payable | 145 |
|
|
| 26,578 |
| 991 |
|
| 998 |
|
| Accrued expenses | 8,291 |
|
|
| 8,740 |
| 12,268 |
|
| 11,084 |
|
| Total current liabilities | 21,136 |
|
|
| 338,773 |
| 29,563 |
|
| 27,156 |
|
| Long-term debt, net of current portion | 46,447 |
|
|
| 240 |
| 52,447 |
|
| 51,288 |
|
| Deferred tax liability | 347 |
|
|
| 1,096 |
| 358 |
|
| 379 |
|
| Total liabilities | 67,930 |
|
|
| 340,109 |
| 82,368 |
|
| 78,823 |
|
| | Commitments and contingencies (Note 9) |
| | |
| |
| Commitments and contingencies (Note 8) | |
| |
|
| | Temporary equity |
|
|
|
| |
| Predecessor Series B senior convertible preferred shares, 588 shares outstanding at December 31, 2016 | — |
|
|
| 15,298 |
| |
| Stockholders’ equity (deficit) |
|
|
|
| |
| Predecessor common stock, $0.04 par value, 112,500 shares authorized, 22,215 shares outstanding at December 31, 2016 | — |
|
|
| 889 |
| |
| Predecessor additional paid-in capital | — |
|
|
| 193,477 |
| |
Successor common stock, $0.01 par value, 40,000 shares authorized, 5,250 shares issued and outstanding at June 30, 2017
| 53 |
| | | — |
| |
| Successor additional paid-in capital | 147,578 |
| | | — |
| |
| Common stock, $0.01 par value, 40,000 shares authorized, 5,336 shares issued and outstanding at March 31, 2018 and December 31, 2017 | | 53 |
| | 53 |
|
| Additional paid-in capital | | 149,117 |
| | 148,866 |
|
| Accumulated deficit | (7,001 | ) |
|
| (236,892 | ) | (34,532 | ) |
| (25,985 | ) |
| Total stockholders’ equity (deficit) | 140,630 |
|
|
| (42,526 | ) | |
| Total liabilities, temporary equity and stockholders’ equity (deficit) | $ | 208,560 |
|
|
| $ | 312,881 |
| |
| Total stockholders’ equity | | 114,638 |
|
| 122,934 |
|
| Total liabilities and stockholders’ equity | | $ | 197,006 |
|
| $ | 201,757 |
|
The accompanying notes are an integral part of these condensed consolidated financial statements.
Forbes Energy Services Ltd.
(Debtor-in-Possession January 22, 2017 through April 12, 2017)
Condensed Consolidated Statements of Operations (unaudited)
(in thousands, except per share amounts)
|
| | | | | | | | | | | | |
| | Successor | | | Predecessor |
| | April 13 through June 30, 2017 | | | April 1 through April 12, 2017 | | Three months ended June 30, 2016 |
| Revenues | | | | | | |
| Well servicing | $ | 18,139 |
| | | $ | 2,449 |
| | $ | 16,796 |
|
| Fluid logistics | 9,711 |
| | | 1,269 |
| | 11,615 |
|
| Total revenues | 27,850 |
| | | 3,718 |
| | 28,411 |
|
| Expenses | | | | | | |
| Well servicing | 13,814 |
| | | 1,813 |
| | 15,668 |
|
| Fluid logistics | 9,053 |
| | | 1,260 |
| | 10,931 |
|
| General and administrative | 3,130 |
| | | 500 |
| | 5,420 |
|
| Depreciation and amortization | 5,681 |
| | | 1,533 |
| | 13,670 |
|
| Impairment of assets | — |
| | | — |
| | 14,512 |
|
| Total expenses | 31,678 |
| | | 5,106 |
| | 60,201 |
|
| Operating loss | (3,828 | ) | | | (1,388 | ) | | (31,790 | ) |
| Other income (expense) | | | | | | |
| Interest income | 6 |
| | | — |
| | 7 |
|
| Interest expense | (1,897 | ) | | | (40 | ) | | (6,912 | ) |
| Gain (loss) on reorganization items, net | (1,299 | ) | | | 51,090 |
| | — |
|
| Pre-tax income (loss) | (7,018 | ) | | | 49,662 |
| | (38,695 | ) |
| Income tax benefit | (17 | ) | | | (4 | ) | | (9 | ) |
| Net income (loss) | (7,001 | ) | | | 49,666 |
| | (38,686 | ) |
| Preferred stock dividends | — |
| | | — |
| | (194 | ) |
| Net income (loss) attributable to common stockholders | $ | (7,001 | ) | | | $ | 49,666 |
| | $ | (38,880 | ) |
| Income (loss) per share of common stock | | | | | | |
| Basic and diluted income (loss) per share | $ | (1.33 | ) | | | $ | 1.81 |
| | $ | (1.75 | ) |
| Weighted average number of shares outstanding | | | | | | |
| Basic and diluted | 5,250 |
| | | 27,508 |
| | 22,214 |
|
The accompanying notes are an integral part of these condensed consolidated financial statements.
Forbes Energy Services Ltd.
(Debtor-in-Possession January 22, 2017 through April 12, 2017)
Condensed Consolidated Statements of Operations (unaudited)
(in thousands, except per share amounts)
| | | | | | | | | | Successor | | | Predecessor |
| | Successor | | | Predecessor | Three Months Ended | | | Three Months Ended |
| | April 13 through June 30, 2017 | | | January 1 through April 12, 2017 | | Six months ended June 30, 2016 | March 31, 2018 | | | March 31, 2017 |
| Revenues | | | | | | | | | | |
| Well servicing | $ | 18,139 |
| | | $ | 19,554 |
| | $ | 35,509 |
| $ | 22,857 |
| | | $ | 17,105 |
|
| Fluid logistics | 9,711 |
| | | 11,211 |
| | 24,833 |
| 12,735 |
| | | 9,942 |
|
| Total revenues | 27,850 |
| | | 30,765 |
| | 60,342 |
| 35,592 |
| | | 27,047 |
|
| Expenses | | | | | | | | | | |
| Well servicing | 13,814 |
| | | 15,952 |
| | 32,388 |
| 19,017 |
| | | 14,140 |
|
| Fluid logistics | 9,053 |
| | | 11,207 |
| | 24,092 |
| 10,689 |
| | | 9,948 |
|
| General and administrative | 3,130 |
| | | 5,012 |
| | 11,476 |
| 4,888 |
| | | 4,512 |
|
| Depreciation and amortization | 5,681 |
| | | 13,601 |
| | 27,159 |
| 7,163 |
| | | 12,068 |
|
| Impairment of assets | — |
| | | — |
| | 14,512 |
| |
| Total expenses | 31,678 |
| | | 45,772 |
| | 109,627 |
| 41,757 |
| | | 40,668 |
|
| Operating loss | (3,828 | ) | | | (15,007 | ) | | (49,285 | ) | (6,165 | ) | | | (13,621 | ) |
| Other income (expense) | | | | | | | | | | |
| Interest income | 6 |
| | | 13 |
| | 29 |
| 2 |
| | | 13 |
|
| Interest expense | (1,897 | ) | | | (2,254 | ) | | (13,858 | ) | |
| Gain (loss) on reorganization items, net | (1,299 | ) | | | 44,503 |
| | — |
| |
| Pre-tax income (loss) | (7,018 | ) | | | 27,255 |
| | (63,114 | ) | |
| Income tax expense (benefit) | (17 | ) | | | 27 |
| | 40 |
| |
| Net income (loss) | (7,001 | ) | | | 27,228 |
| | (63,154 | ) | |
| Interest expense (excludes contractual interest of $4.7 million on Prior Senior Notes subject to compromise for the period January 22, 2017 through March 31, 2017) | | (2,367 | ) | | | (2,214 | ) |
| Loss on reorganization items, net | | — |
| | | (6,587 | ) |
| Pre-tax loss | | (8,530 | ) | | | (22,409 | ) |
| Income tax expense | | 17 |
| | | 31 |
|
| Net loss | | (8,547 | ) | | | (22,440 | ) |
| Preferred stock dividends | — |
| | | (46 | ) | | (388 | ) | — |
| | | (46 | ) |
| Net income (loss) attributable to common stockholders | $ | (7,001 | ) | | | $ | 27,182 |
| | $ | (63,542 | ) | |
| Income (loss) per share of common stock | | | | | | | |
| Basic and diluted income (loss) per share | $ | (1.33 | ) | | | $ | 0.99 |
| | $ | (2.86 | ) | |
| Net loss attributable to common stockholders | | $ | (8,547 | ) | | | $ | (22,486 | ) |
| Loss per share of common stock | | | | | |
| Basic and diluted loss per share | | $ | (1.60 | ) | | | $ | (1.01 | ) |
| Weighted average number of shares outstanding | | | | | | | | | | |
| Basic and diluted | 5,250 |
| | | 27,508 |
| | 22,213 |
| 5,336 |
| | | 22,215 |
|
The accompanying notes are an integral part of these condensed consolidated financial statements.
Forbes Energy Services Ltd.
(Debtor-in-Possession January 22, 2017 through April 12, 2017)
Condensed Consolidated StatementStatements of Changes in Stockholders’ Equity (Deficit)Cash Flows (unaudited)
(in thousands)
|
| | | | | | | | | | | | | | | | | | | | | | | | | |
| | Temporary Equity | | Permanent Equity |
| | Preferred Stock | | Common Stock | | Additional Paid-In Capital | | Accumulated Deficit | | Total Stockholders’ Equity (Deficit) |
| | Shares | | Amount | | Shares | | Amount | | | |
| Predecessor | | | | | | | | | | | | | |
| Balance: December 31, 2016 | 588 |
| | $ | 15,298 |
| | 22,215 |
| | $ | 889 |
| | $ | 193,477 |
| | $ | (236,892 | ) | | $ | (42,526 | ) |
| Net income, January 1, 2017 - April 12, 2017 | — |
| | — |
| | — |
| | — |
| | — |
| | 27,228 |
| | 27,228 |
|
Preferred stock dividends and accretion | — |
| | 46 |
| | — |
| | — |
| | (46 | ) | | — |
| | (46 | ) |
| Balance: April 12, 2017 | 588 |
| | 15,344 |
| | 22,215 |
| | 889 |
| | 193,431 |
| | (209,664 | ) | | (15,344 | ) |
| Cancellation of temporary equity and predecessor permanent equity | (588 | ) | | (15,344 | ) | | (22,215 | ) | | (889 | ) | | (193,431 | ) | | 209,664 |
| | 15,344 |
|
| Balance: April 12, 2017 | — |
| | $ | — |
| | — |
| | $ | — |
| | $ | — |
| | $ | — |
| | $ | — |
|
| | | | | | | | | | | | | | |
| | | | | | | | | | | | | | |
| Successor | | | | | | | | | | | | | |
| Issuance of Successor common stock | — |
| | $ | — |
| | 5,250 |
| | $ | 53 |
| | $ | 147,578 |
| | $ | — |
| | $ | 147,631 |
|
| Net loss, April 13, 2017 - June 30, 2017 | — |
| | — |
| | — |
| | — |
| | — |
| | (7,001 | ) | | (7,001 | ) |
| Balance: June 30, 2017 | — |
| | $ | — |
| | 5,250 |
| | $ | 53 |
| | $ | 147,578 |
| | $ | (7,001 | ) | | $ | 140,630 |
|
|
| | | | | | | | |
| | Successor | | | Predecessor |
| | Three months ended March 31, 2018 | | | Three months ended March 31, 2017 |
| | | | | |
| Cash flows from operating activities: | | | | |
| Net loss | $ | (8,547 | ) | | | $ | (22,440 | ) |
| Adjustments to reconcile net loss to net cash provided by (used in) operating activities: | | | | |
| Depreciation and amortization | 7,163 |
| | | 12,068 |
|
| Share-based compensation | 250 |
| | | — |
|
| Reorganization items (non-cash) | — |
| | | 2,104 |
|
| Deferred tax benefit | (21 | ) | | | (44 | ) |
| Gain on disposal of assets | (20 | ) | | | (700 | ) |
| Bad debt expense | 100 |
| | | 175 |
|
| Amortization of debt discount | 196 |
| | | 234 |
|
| Interest paid in kind | 924 |
| | | — |
|
| Changes in operating assets and liabilities: | | | | |
| Accounts receivable | (2,093 | ) | | | (477 | ) |
| Prepaid expenses and other assets | (135 | ) | | | (71 | ) |
| Accounts payable - trade | 1,296 |
| | | 3,519 |
|
| Accounts payable - related parties | (10 | ) | | | (18 | ) |
| Accrued expenses | 1,171 |
| | | 1,122 |
|
| Accrued interest payable | (7 | ) | | | 1,546 |
|
| Net cash provided by (used in) operating activities | 267 |
| | | (2,982 | ) |
| Cash flows from investing activities: | | | | |
| Proceeds from sale of property and equipment | 300 |
| | | 979 |
|
| Purchases of property and equipment | (2,363 | ) | | | (377 | ) |
| Net cash provided by (used in) investing activities | (2,063 | ) | | | 602 |
|
| Cash flows from financing activities: | | | | |
| Payments for capital leases | (511 | ) | | | (394 | ) |
| Net cash used in financing activities | (511 | ) | | | (394 | ) |
| Net decrease in cash, cash equivalents, and cash - restricted | (2,307 | ) | | | (2,774 | ) |
| Cash, cash equivalents, and cash - restricted: | | | | |
| Beginning of period | 35,480 |
| | | 48,000 |
|
| End of period | $ | 33,173 |
| | | $ | 45,226 |
|
The accompanying notes are an integral part of these condensed consolidated financial statements.
Forbes Energy Services Ltd.
(Debtor-in-Possession January 22, 2017 through April 12, 2017)
Condensed Consolidated Statements of Cash Flows (unaudited)
(in thousands)
|
| | | | | | | | | | | | |
| | Successor | | | Predecessor |
| | April 13, through June 30, 2017 | | | January 1 through April 12, 2017 | | Six months ended June 30, 2016 |
| Cash flows from operating activities: | | | | | | |
| Net income (loss) | $ | (7,001 | ) | | | $ | 27,228 |
| | $ | (63,154 | ) |
| Adjustments to reconcile net income (loss) to net cash provided by (used in) operating activities: | | | | | | |
| Depreciation and amortization | 5,681 |
| | | 13,601 |
| | 27,159 |
|
| Share-based compensation | — |
| | | — |
| | 127 |
|
| Reorganization items (non-cash) | — |
| | | (51,166 | ) | | — |
|
| Deferred tax (benefit) expense | (17 | ) | | | (47 | ) | | 49 |
|
| (Gain) loss on disposal of assets | — |
| | | (950 | ) | | 582 |
|
| Impairment of assets | — |
| | | — |
| | 14,512 |
|
| Bad debt expense | 217 |
| | | 1 |
| | 520 |
|
| Amortization of debt discount | 398 |
| | | 234 |
| | 711 |
|
| Interest paid in kind | 768 |
| | | — |
| | — |
|
| Changes in operating assets and liabilities: | | | | | | |
| Accounts receivable | (2,520 | ) | | | (916 | ) | | 10,527 |
|
| Prepaid expenses and other assets | (49 | ) | | | (851 | ) | | (1,717 | ) |
| Other assets | (129 | ) | | | 103 |
| | — |
|
| Accounts payable - trade | 131 |
| | | 6,608 |
| | (1,127 | ) |
| Accounts payable - related parties | (20 | ) | | | 2 |
| | (6 | ) |
| Accrued expenses | (782 | ) | | | 324 |
| | 1,507 |
|
| Accrued interest payable | 63 |
| | | 1,575 |
| | 12,559 |
|
| Net cash provided by (used in) operating activities | (3,260 | ) | | | (4,254 | ) | | 2,249 |
|
| Cash flows from investing activities: | | | | | | |
| Proceeds from sale of property and equipment | 839 |
| | | 937 |
| | 249 |
|
| Purchases of property and equipment | (1,015 | ) | | | (400 | ) | | (6,237 | ) |
| Change in restricted cash | — |
| | | — |
| | 51 |
|
| Net cash provided by (used in) investing activities | (176 | ) | | | 537 |
| | (5,937 | ) |
| Cash flows from financing activities: | | | | | | |
| Change in restricted cash | — |
| | | (6,416 | ) | | — |
|
| Payments for capital leases | (285 | ) | | | (444 | ) | | (2,120 | ) |
| Payments for debt issuance costs | — |
| | | (5,000 | ) | | — |
|
| Payment of Prior Senior Notes | — |
| | | (20,000 | ) | | — |
|
| Repayment of Prior Loan Agreement | — |
| | | (15,000 | ) | | — |
|
| Proceeds from New Loan Agreement | — |
| | | 50,000 |
| | — |
|
| Payment of tax withholding obligations related to restricted stock | — |
| | | — |
| | (115 | ) |
| Dividends paid on Predecessor Series B senior convertible preferred shares | — |
| | | — |
| | (61 | ) |
| Net cash provided by (used in) financing activities | (285 | ) | | | 3,140 |
| | (2,296 | ) |
| Net decrease in cash and cash equivalents | (3,721 | ) | | | (577 | ) | | (5,984 | ) |
| Cash and cash equivalents: | | | | | | |
| Beginning of period | 19,860 |
| | | 20,437 |
| | 74,611 |
|
| End of period | $ | 16,139 |
| | | $ | 19,860 |
| | $ | 68,627 |
|
The accompanying notes are an integral part of these condensed consolidated financial statements.
Forbes Energy Services Ltd.
(Debtor-in-Possession January 22, 2017 through April 12, 2017)
Notes to Condensed Consolidated Financial Statements
(unaudited)
1. Organization and Nature of Operations
Nature of Business
Forbes Energy Services Ltd., or FES Ltd., is an independent oilfield services contractor that provides a wide range of well site services to oil and natural gas drilling and producing companies to help develop and enhance the production of oil and natural gas. These services include fluid hauling, fluid disposal, well maintenance, completion services, workovers and re-completions, plugging and abandonment, and tubing testing. The Company's operations are concentrated in the major onshore oil and natural gas producing regions of Texas, with an additional location in Pennsylvania. The Company believes that its broad range of services, which extends from initial drilling, through production, to eventual abandonment, is fundamental to establishing and maintaining the flow of oil and natural gas throughout the life cycle of its customers' wells.
As used in these Consolidated Financial Statements, the “Company,” “we,” and “our” mean FES Ltd. and its direct and indirect subsidiaries, except as otherwise indicated.
Chapter 11 Proceedings2. Basis of Presentation
Fresh Start Accounting
On January 22, 2017, FES Ltd. and its domestic subsidiaries, or collectively, the Debtors, filed voluntary petitions or the Bankruptcy Petitions, for reorganization under chapter 11 of the United States Bankruptcy Code, or the Bankruptcy Code in the United States Bankruptcy Court for the Southern District of Texas-Corpus Christi Division, or the Bankruptcy Court, pursuant to the terms of a restructuring support agreement that contemplated the reorganization of the Debtors pursuant to a prepackaged plan of reorganization, as amended and supplemented, the Plan. On March 29, 2017, the Bankruptcy Court entered an order confirming the Plan. On April 13, 2017, or the Effective Date, the Plan became effective pursuant to its terms and the Debtors emerged from their chapter 11 cases.
Effect of the Bankruptcy Proceedings
During theUpon emergence from bankruptcy proceedings, the Debtors conducted normal business activities and were authorized to pay certain vendor payments, wage payments and tax payments in the ordinary course. In addition, subject to certain specific exceptions under the Bankruptcy Code, the Bankruptcy Petitions automatically stayed most judicial or administrative actions against the Debtors or their property to recover, collect, or secure a prepetition claim. For example, the Bankruptcy Petitions prohibited lenders or note holders from pursuing claims for defaults under the Debtors’ debt agreements during the pendency of the chapter 11 cases.
The Plan
Under the Plan, which was approved by the Bankruptcy Court and became effective on the Effective Date,:
•FES Ltd. converted from a Texas corporation to a Delaware corporation;
•All prior equity interests (which included the Company qualified for and adopted fresh start accounting in accordance with the provisions of ASC 852 as (i) the holders of FES Ltd.’s prior common stock, par value $0.04 per share, or the Old Common Stock, FES Ltd.’s prior preferred stock, awards under FES Ltd.’s prior incentive compensation plans, orreceived none of the Prior Compensation Plans, and the preferred stock purchase rights under the rights agreement dated as of May 19, 2008 as subsequently amended on July 8, 2013, or the Rights Agreement, between FES Ltd. and CIBC Mellon Trust Company, as rights agent) in FES Ltd. were extinguished without recovery;
•FES Ltd. created a new class of common stock, par value $0.01 per share, or the New Common Stock;
•Approximately $280 million in principal amount of FES Ltd.'s prior 9% senior notes due 2019, or the Prior Senior Notes, plus accrued interest of $28.1 million were canceled and each holder of the Prior Senior Notes received such holder’s pro rata share of (i) $20.0 million in cash and (ii) 100% of the New Common Stock, subject to dilution only as a result of the shares of New Common Stock issued or available for issuance in connection with a management incentive plan, or the Management Incentive Plan. A total of 5,249,997 shares of New Common Stock was issued to the holders of the Prior Senior Notes;
•The Debtors entered into the New Loan Agreement (see Note 6 - Long-Term Debt), with certain financial institutions party thereto from time to time as lenders, or the Lenders, and Wilmington Trust, National Association, as agent for the Lenders;
•FES Ltd. adopted the Management Incentive Plan, which provides for the issuance of equity-based awards with respect to, in the aggregate, up to 750,000 shares of New Common Stock;
•The Debtors’ loan and security agreement governing their revolving credit facility dated as of September 9, 2011 as subsequently amended, or the Prior Loan Agreement, with Regions Bank, or Regions, as the sole lender party thereto, or the Lender, was terminated and a new letter of credit facility was entered into with Regions, or the New Regions Letters of Credit Facility, which covers letters of credit and credit card program. Regions continues to hold the cash pledged to support the New Regions Letters of Credit Facility in the amount of $10.1 million as of August 14, 2017;
•The Debtors paid off the outstanding principal balance of $15 million plus outstanding interest and fees under the Prior Loan Agreement, and the Prior Loan Agreement was terminated in accordance with the Plan;
•Holders of allowed creditor claims, aside from holders of the Prior Senior Notes, received, on account of such claims, either payment in full in cash or otherwise had their rights reinstated; and
•FES Ltd. entered into a registration rights agreement with certain of its stockholders to provide registration rights with respect to the New Common Stock.
Fresh Start Accounting
Upon emergence from bankruptcy, the Company adopted fresh start accounting in accordance with the provisions of Accounting Standards Codification, or ASC, 852, “Reorganizations,” or ASC 852, as (i) the holders of Old Common Stock received none of the New Common Stock, issued upon the Debtors' emergence from bankruptcy and (ii) the reorganization value of the Company's assets immediately prior to confirmation of the Plan was less than the post-petition liabilities and allowed claims. The Company applied fresh start accounting from and after the Effective Date. Fresh start accounting required the Company to present its assets, liabilities and equity as if it were a new entity upon emergence from bankruptcy, with no beginning retained earnings or deficit aseffects of the fresh start reporting date. The cancellation of the Old Common StockPlan and the issuance of the New Common Stock on the Effective Date caused a change of control of FES Ltd. under ASC 852. As a result of the adoptionapplication of fresh start accounting are reflected in the Company’s unauditedCompany's condensed consolidated financial statements from and after April 13, 2017 will not be comparable to its financial statements prior to such date.2017. References to “Successor” or “Successor Company” relatethe "Successor" pertain to the financial position and results of operations of the reorganized Company from and after April 13, 2017.the Effective Date. References to “Predecessor” or “Predecessor Company” relate"Predecessor" pertain to the financial position and results of operations of the Company on or prior to April 12, 2017.
Upon the application of fresh start accounting, the Company allocated the reorganization value to its individual assets and liabilities in conformity with ASC 805, Business Combinations, or ASC 805. Reorganization value represents the fair value of the Successor Company’s assets before considering liabilities.
Under ASC 852, the Successor Company must determine a value to be assigned to the equity of the emerging company as of the date of adoption of fresh start accounting. Enterprise value represents the fair value of an entity’s interest-bearing debt and stockholders’ equity. In the updated valuation analysis submitted to (and confirmed by) the Bankruptcy Court, the Company estimated a range of enterprise values between $176 million and $210 million, with a midpoint of $193 million. The Company deemed it appropriate to use the low end of the range to determine the final enterprise value of $176 million for fresh-start accounting. The low end of the enterprise value range was selected based on significant market volatility around the emergence. The Company calculated an enterprise value for the Successor Company using a discounted cash flow, or DCF, analysis under the income approach.
Under our DCF analysis, the Company calculated an estimate of future cash flows for the period ranging from 2017 to 2021 and discounted estimated future cash flows to present value. The estimated cash flows for the period 2017 to 2021 were derived from earnings forecasts and assumptions regarding growth and margin projections, as applicable, and a tax rate of 35.0%. A terminal value was included based on the cash flows of the final year of the forecast period. The discount rate of 16.9% was estimated based on an after-tax weighted average cost of capital, or the WACC, reflecting the rate of return that would be expected by a market participant. The WACC also takes into consideration a company specific risk premium reflecting the risk associated with the overall uncertainty of the financial projections used to estimate future cash flows.
The estimated enterprise value and the equity value are highly dependent on the achievement of the future financial results contemplated in the projections that were set forth in the Plan. The estimates and assumptions made in the valuation are inherently subject to significant uncertainties. The primary assumptions for which there is a reasonable possibility of the occurrence of a variation that would have significantly affected the reorganization value include revenue growth, operating expenses, the amount and timing of capital expenditures and the discount rate utilized.
Fresh start accounting reflects the value of the Successor Company as determined in the confirmed Plan. Under fresh start accounting, asset values are remeasured and allocated based on their respective fair values in conformity with the acquisition method of accounting for business combinations in ASC 805. Liabilities existing as of the Effective Date, other than deferred taxes, were recorded at the present value of amounts expected to be paid using appropriate risk adjusted interest rates. Deferred taxes were determined in conformity with applicable accounting standards. Predecessor accumulated depreciation, accumulated amortization and retained deficit were eliminated.Date.
Machinery and Equipment
To estimate the fair value of machinery and equipment, the Company considered the income approach, the cost approach, and the sales comparison (market) approach for each individual asset. The primary approaches that were relied upon to value these assets were the cost approach and the market approach. Although the income approach was not applied to value the machinery and equipment assets individually, the Company did consider the earnings of the enterprise of which these assets are a part. When more than one approach is used to develop a valuation, the various approaches are reconciled to determine a final value conclusion.
The typical starting point or basis of the valuation estimate is replacement cost new, or the RCN, reproduction cost new, or the CRN, or a combination of both. Once the RCN and CRN estimates are adjusted for physical and functional conditions, they are then compared to market data and other indications of value, where available, to confirm results obtained by the cost approach.
Where direct RCN estimates were not available or deemed inappropriate, the CRN for machinery and equipment was estimated using the indirect (trending) method, in which percentage changes in applicable price indices are applied to historical costs to convert them into indications of current costs. To estimate the CRN amounts, inflation indices from established external sources were then applied to historical costs to estimate the CRN for each asset.
The market approach measures the value of an asset through an analysis of recent sales or offerings of comparable property, and considers physical, functional and economic conditions. Where direct or comparable matches could not be reasonably obtained, the Company utilized the percent of cost technique of the market approach. This technique looks at general sales, sales listings, and auction data for each major asset category. This information is then used in conjunction with each asset’s effective age to develop ratios between the sales price and RCN or CRN of similar asset types. A market-based depreciation curve was developed and applied to asset categories where sufficient sales and auction information existed.
Where market information was not available or a market approach was deemed inappropriate, the Company developed a cost approach. In doing so, an indicated value is derived by deducting physical deterioration from the RCN or CRN of each identifiable asset or group of assets. Physical deterioration is the loss in value or usefulness of a property due to the using up or expiration of its useful life caused by wear and tear, deterioration, exposure to various elements, physical stresses, and similar factors.
Functional and economic obsolescence related to these was also considered. Any functional obsolescence due to excess capital costs was eliminated through the direct method of the cost approach to estimate the RCN. Economic obsolescence was also applied to stacked and underutilized assets based on the status of the asset. Economic obsolescence was also considered in situations in which the earnings of the applicable business segment in which the assets are employed suggest economic obsolescence. When penalizing assets for economic obsolescence, an additional economic obsolescence penalty was levied, while considering scrap value to be the floor value for an asset.
Intangible Assets
The financial information used to estimate the fair values of intangible assets was consistent with the information used in estimating the Company’s enterprise value.
Trademarks were valued utilizing the relief from royalty method of the income approach. Significant inputs and assumptions included remaining useful lives, the forecasted revenue streams, an applicable royalty rate, tax rate, and applicable discount rate.
Customer relationships were valued using a multi-period excess earnings method, and were split between well servicing relationships and fluid servicing relationships. There was no value attributed to the fluid servicing customer relationships. Significant inputs and assumptions for both relationship analyses included the expected attrition rate, forecasted revenue streams, contributory asset charges, and an applicable discount rate.
Covenants not to compete were valued using a with and without method under the income approach. Significant inputs and assumptions included the expected impact on revenues under competition, the forecasted revenue streams, the probability of competition if the non-compete were not in place, and an applicable discount rate.
The following table reconciles the enterprise value to the estimated reorganization value as of the Effective Date (in millions):
|
| | | | |
| Enterprise value | | $ | 176 |
|
| Plus: Cash and cash equivalents | | 20 |
|
| Plus: Fair value on non-debt liabilities, net | | 20 |
|
| Reorganization value of Successor assets | | $ | 216 |
|
Condensed Consolidated Balance Sheet
The adjustments set forth in the following condensed consolidated balance sheet as of the Effective Date reflect the effects of the transactions contemplated by the Plan and carried out by the Company, which are reflected in the column titled “Reorganization Adjustments,” as well as fair value adjustments as a result of the adoption of fresh start accounting, which are reflected in the column titled “Fresh Start Adjustments.”
The following table reflects the reorganization and application of ASC 852 on the Company's condensed consolidated balance sheet at April 12, 2017:
|
| | | | | | | | | | | | | | | |
| | Predecessor Company | | Reorganization Adjustments | | Fresh Start Adjustments | | Successor Company |
| | (in thousands, except par value) |
| Assets | | | | | | | |
| Current assets | | | | | | | |
| Cash and cash equivalents | $ | 17,500 |
| | $ | 2,360 |
| (a) | $ | — |
| | $ | 19,860 |
|
| Cash - restricted | 27,579 |
| | 6,400 |
| (a) | — |
| | 33,979 |
|
| Accounts receivable - trade, net | 17,237 |
| | — |
| | — |
| | 17,237 |
|
| Accounts receivable - other | 930 |
| | — |
| | — |
| | 930 |
|
| Prepaid expenses and other | 6,099 |
| | 45 |
| (b) | — |
| | 6,144 |
|
| Other current assets | 567 |
| | — |
| | — |
| | 567 |
|
| Total current assets | 69,912 |
| | 8,805 |
| | — |
| | 78,717 |
|
| Property and equipment, net | 220,326 |
| | — |
| | (97,442 | ) | (g) | 122,884 |
|
| Intangible assets, net | 3,068 |
| | — |
| | 9,587 |
| (h) | 12,655 |
|
| Other assets | 2,178 |
| | (12 | ) | (b) | — |
| | 2,166 |
|
| Total assets | $ | 295,484 |
| | $ | 8,793 |
| | $ | (87,855 | ) | | $ | 216,422 |
|
| | | | | | | | |
| Liabilities, Temporary Equity and Shareholders’ Equity (Deficit) | | | |
| Current liabilities | | | | | | | |
| Current portions of long-term debt | $ | 18,064 |
| | $ | (15,000 | ) | (a) | $ | — |
| | $ | 3,064 |
|
| Accounts payable - trade | 12,238 |
| | (1,125 | ) | (b) | — |
| | 11,113 |
|
| Accounts payable - related parties | 20 |
| | — |
| | — |
| | 20 |
|
| Accrued expenses | 9,293 |
| | (82 | ) | (a) | (65 | ) | (i) | 9,146 |
|
| Total current liabilities | 39,615 |
| | (16,207 | ) | | (65 | ) | | 23,343 |
|
| Long-term debt, net of current portion | 84 |
| | 45,000 |
| (c) | — |
| | 45,084 |
|
| Deferred tax liability | 1,049 |
| | — |
| | (685 | ) | (j) | 364 |
|
| Liabilities subject to compromise | 308,072 |
| | (308,072 | ) | (d) | — |
| | — |
|
| Total liabilities | 348,820 |
| | (279,279 | ) | | (750 | ) | | 68,791 |
|
| | | | | | | | |
| Temporary equity | | | | | | | |
| Predecessor Series B senior convertible preferred shares, 588 shares outstanding at December 31, 2016 | 15,344 |
| | (15,344 | ) | (e) | — |
| | — |
|
| Stockholders’ equity (deficit) | | | | | | | |
| Predecessor common stock, $0.04 par value, 112,500 shares authorized; 22,215 shares outstanding at December 31, 2016 | 889 |
| | (889 | ) | (e) | — |
| | — |
|
| Predecessor additional paid-in capital | 193,431 |
| | (193,431 | ) | (e) | — |
| | — |
|
| Successor common stock, $0.01 par value, 40,000 shares authorized; 5,250 shares issued and outstanding | — |
| | 53 |
| (f) | — |
| | 53 |
|
| Successor additional paid-in capital | — |
| | 147,578 |
| (f) | — |
| | 147,578 |
|
| Accumulated retained earnings (deficit) | (263,000 | ) | | 350,105 |
| (e) | (87,105 | ) | (k) | — |
|
| Total stockholders’ equity (deficit) | (68,680 | ) | | 303,416 |
| | (87,105 | ) | | 147,631 |
|
| Total liabilities, temporary equity and stockholders’ equity (deficit) | $ | 295,484 |
| | $ | 8,793 |
| | $ | (87,855 | ) | | $ | 216,422 |
|
Reorganization Adjustments
Reorganization adjustments reflect amounts recorded on the Effective Date for the effect of implementation of the Plan. The significant reorganization adjustments are summarized as follows (in thousands):
| |
(a) | Reflects the net sources of cash on the Effective Date from implementation of the Plan: |
|
| | | | |
| Sources: | | |
| First Lien Term Loan | | $ | 50,000 |
|
| | | |
| Uses: | | |
| Payment to Holders of the Prior Senior Notes | | $ | (20,000 | ) |
| Payoff of Prior Loan Agreement | | (15,000 | ) |
| Payoff of Prior Loan Agreement accrued interest | | (82 | ) |
| Restricted cash | | (6,400 | ) |
| Debt issuance costs | | (5,000 | ) |
| Professional Fees | | (1,158 | ) |
| Total Uses | | (47,640 | ) |
| Net Sources | | $ | 2,360 |
|
(b) Reflects the net payment of $1.1 million in professional fees.
(c) Represents the issuance of the new debt, net of loan costs, in connection with the Plan.
(d) Reflects the settlement of Liabilities Subject to Compromise in accordance with the Plan as follows:
|
| | | | |
| Liabilities subject to compromise of the Predecessor Company: |
| Prior Senior Notes and accrued interest | | $ | 308,072 |
|
| Fair value of equity issued to Prior Senior Noteholders | | (147,631 | ) |
| Cash payments to Prior Senior Noteholders | | (20,000 | ) |
| Gain on settlement of liabilities subject to compromise | | $ | 140,441 |
|
(e) Reflects the cumulative impact of reorganization adjustments discussed above:
|
| | | | |
| Gain on settlement of liabilities subject to compromise | | $ | 140,441 |
|
| Cancellation of Predecessor temporary equity and permanent equity | | 209,664 |
|
| Net impact to retained earnings (deficit) | | $ | 350,105 |
|
(f) Reflects the issuance of 5,249,997 shares, valued at $28.12 per share, of New Common Stock in accordance with the Plan.
Fresh start Accounting Adjustments
Fresh start accounting adjustments are necessary to reflect assets at their estimated fair values and to eliminate accumulated deficit.
(g) An adjustment of $97.4 million was recorded to decrease the net book value of property and equipment to estimated fair value. The components of property and equipment, net as of the Effective Date and the fair value at the Effective Date are summarized in the following table (in thousands).
|
| | | | | | | | | | | |
| | Predecessor Company | | Fresh start adjustments | | Successor Company |
| Well servicing equipment | $ | 165,585 |
| | $ | (88,033 | ) | | $ | 77,552 |
|
| Autos and trucks | 26,660 |
| | 7,392 |
| | 34,052 |
|
| Disposal wells | 15,890 |
| | (12,080 | ) | | 3,810 |
|
| Buildings and improvements | 9,766 |
| | (4,424 | ) | | 5,342 |
|
| Furniture and fixtures | 901 |
| | 359 |
| | 1,260 |
|
| Land | 1,524 |
| | (656 | ) | | 868 |
|
| | $ | 220,326 |
| | $ | (97,442 | ) | | $ | 122,884 |
|
(h) An adjustment of $9.6 million was recorded to increase the net book value of intangible assets to estimated fair value. The components of intangibles, net as of the Effective Date and the fair value at the Effective Date are summarized in the following table (in thousands).
|
| | | | | | | | | | | | |
| | Useful Life (years) | Predecessor Company | | Fresh start adjustments | | Successor Company |
| Trade Names | 15 | $ | 3,068 |
| | $ | (596 | ) | | $ | 2,472 |
|
| Covenants not to compete | 4 | — |
| | 1,505 |
| | 1,505 |
|
| Customer relationships | 15 | — |
| | 8,678 |
| | 8,678 |
|
| | | $ | 3,068 |
| | $ | 9,587 |
| | $ | 12,655 |
|
Estimated amortization expense of the intangible assets is as follows (in thousands):
|
| | | |
| Year ending December 31, | Amortization |
| 2017 | $ | 793 |
|
| 2018 | 1,120 |
|
| 2019 | 1,120 |
|
| 2020 | 1,120 |
|
| 2021 | 853 |
|
| 2022 | 743 |
|
| Thereafter | 6,906 |
|
| | $ | 12,655 |
|
(i) Reflects adjustment decreasing the Company's asset retirement obligation to estimated fair value.
(j) Reflects a reduction in deferred tax liabilities recorded as of the Effective Date as determined in accordance with ASC 740 - Income Taxes. The reduction in deferred tax liabilities was primarily the result of the revaluation of the Company’s property and equipment and intangible assets under fresh start accounting.
(k) Reflects the cumulative impact of fresh start adjustments discussed above (in thousands):
|
| | | | |
| Intangible assets fair value adjustments | | $ | 9,587 |
|
| Property and equipment fair value adjustments | | (97,442 | ) |
| Asset retirement obligation adjustment | | 65 |
|
| Deferred tax liability adjustments | | 685 |
|
| Net impact to retained earnings (deficit) | | $ | (87,105 | ) |
Reorganization Items
Reorganization items represent amounts incurred subsequent to the filing of the Bankruptcy Petitions as a direct result of the filing of the Plan and are comprised of the following (in thousands):
|
| | | | | | | | | | | | |
| | | Successor | | | Predecessor |
| | | April 13 through June 30, 2017 | | | April 1 through April 12, 2017 | January 1 through April 12, 2017 |
| Reorganization legal and professional fees | | $ | (1,299 | ) | | | $ | (2,246 | ) | $ | (6,729 | ) |
| Deferred loan costs expensed | | — |
| | | — |
| (2,104 | ) |
| Gain on settlement of liabilities subject to compromise | | — |
| | | 140,441 |
| 140,441 |
|
| Fresh start adjustments | | — |
| | | (87,105 | ) | (87,105 | ) |
| Gain (loss) on reorganization items, net | | $ | (1,299 | ) | | | $ | 51,090 |
| $ | 44,503 |
|
2. Risk and Uncertainties
As an independent oilfield services contractor that provides a broad range of drilling-related and production-related services to oil and natural gas companies, primarily onshore in Texas, the Company's revenue, profitability, cash flows and future rate of growth are substantially dependent on it's ability to (1) maintain adequate equipment utilization, (2) maintain adequate pricing for the services it provides, and (3) maintain a trained workforce. Failure to do so could adversely affect the Company's financial position, results of operations, and cash flows.
Because the Company's revenues are generated primarily from customers who are subject to the same factors as the Company that are generally impacting the oil and natural gas industry, the Company's operations are also susceptible to market volatility resulting from economic, cyclical, weather related, or other factors related to such industry. Changes experienced in the level of operating and capital spending in the industry, decreases in oil and natural gas prices, and/or industry perception about future oil and natural gas prices has materially decreased the demand for the Company's services, and has had an adverse effect on its financial position, results of operations and cash flows.
3. Basis of Presentation
Fresh Start Accounting
As discussed in Note 1 - Chapter 11 Proceedings, upon emergence from bankruptcy, the Company qualified for and adopted fresh start accounting in accordance with the provisions of ASC 852 as (i) the holders of Old Common Stock received none of the New Common Stock issued upon the Debtors' emergence from bankruptcy and (ii) the reorganization value of the Company's assets immediately prior to confirmation of the Plan was less than the post-petition liabilities and allowed claims. The Company applied fresh start accounting from and after the Effective Date. Fresh start accounting required the Company to present its assets, liabilities and equity as if it were a new entity upon emergence from bankruptcy, with no beginning retained earnings or deficit as of the fresh start reporting date. As a result of the adoption of fresh start accounting, the Company’s unaudited condensed consolidated financial statements from and after the Effective Date will not be comparable to its financial statements prior to such date.
Interim Financial Information
The unaudited condensed consolidated financial statements of the Company are prepared in conformity with accounting principles generally accepted in the United States of America, or GAAP, for interim financial reporting. Certain information and footnote disclosures normally included in annual financial statements prepared in accordance with GAAP have been condensed or omitted pursuant to the rules and regulations of the Securities and Exchange Commission. Therefore, these condensed consolidated financial statements should be read along with the annual audited consolidated financial statements and notes thereto included in the Company's Annual Report on Form 10-K for the year ended December 31, 2016, as amended. Interim results for the periods presented may not be indicative of results that will be realized for the future periods to the adoption of fresh start accounting during the second quarter of 2017. All significant intercompany accounts and transactions have been eliminated in consolidation. In the opinion of management, all adjustments which are of normal recurring natures considered necessary for a fair representation have been made in the accompanying unaudited financial statements.
Use of Estimates
The preparation of condensed consolidated financial statements in conformity with GAAP requires management to make estimates and assumptions that affect the reported amounts of assets and liabilities and disclosure of contingent assets and liabilities at the date of the consolidated balance sheets and the reported amounts of revenues and expenses during the reporting period. Actual results could materially differ from those estimates.
Cash - Restricted Cash
Restricted cash at June 30, 2017March 31, 2018 (Successor) and December 31, 2016 (Predecessor)2017 (Successor) was $34.0$25.6 million and $27.6$30.0 million, respectively. The components of restricted cash at June 30, 2017March 31, 2018 (Successor) included $23.9$16.9 million related to the loan and security agreement which provides for a term loan of $50.0 million, or the New Loan Agreement, which is subject to satisfaction of certain release restrictions and $10.1$8.7 million in a cash collateral account related to letters of credit and the Company's corporate credit card program under a new letter of credit facility entered into with Regions, or the New Regions Letter of Credit Facility. The release conditions set forth in the New Loan Agreement include, among other things, (i) no default or event of default under the New Loan Agreement having occurred or being continuing as of the date of the requested release of proceeds of the New Loan Agreement, or that would exist after giving effect to the release requested to be made on such date, and (ii) the Company’s unrestricted cash and cash equivalents being less than $7$7.0 million after giving pro forma effect to the requested release.
Impairment
During the second quarter of 2016, the Company experienced a triggering event resulting from the continuing decline in operating revenues due to an industry-wide slowdown. An impairment loss of $14.5 million was recorded as a component of operating expenses based on the amount that the carrying value of certain intangibles exceeded the fair value of such intangibles during the second quarter of 2016.
Recent Accounting Pronouncements
In January 2017, the Financial Accounting Standards Board, or the FASB, issued Accounting Standards Update, or ASU, No. 2017-01, or ASU 2017-01, "Clarifying the Definition of a Business." ASU 2017-01 provides guidance on whether or not an integrated set of assets and activities constitutes a business. ASU 2017-01 is effective for periods beginning after December 15, 2017 including interim periods within those periods, with early adoption permitted in specific instances. The Company has determined the adoption of this pronouncement will not have a material impact on its consolidated financial statements and related disclosures.
In November 2016, the FASB issued ASU No. 2016-18, "Statement of Cash Flows (Topic 230), Restricted Cash," or ASU 2016-18. ASU 2016-18 provides guidance on the presentation of restricted cash and restricted cash equivalents in the statement of cash flows. Restricted cash and restricted cash equivalents should be included with cash and cash equivalents when reconciling the beginning-of-period and end-of-period amounts shown on the statement of cash flows. The amendments of ASU 2016-18 should be applied using a retrospective transition method and are effective for reporting periods beginning after December 15, 2017 with early adoption permitted. The Company believes the adoption of this pronouncement will only change the presentation of the statement of cash flows for restricted cash.
In August 2016, the FASB issued ASU No. 2016-15, “Statement of Cash Flows (Topic 230): Classification of Certain Cash Receipts and Cash Payments,” or ASU 2016-15. ASU 2016-15 will make eight targeted changes to how cash receipts and cash payments are presented and classified in the statement of cash flows. ASU 2016-15 is effective for fiscal years beginning after December 15, 2017. The new standard will require adoption on a retrospective basis unless it is impracticable to apply, in which case, the new standard would apply the amendments prospectively as of the earliest date practicable. The Company is currently in the process of evaluating the impact of adoption on its consolidated financial statements.
In June 2016, the FASB issued ASU No. 2016-13, "Financial Instruments-Credit Losses (Topic 326): Measurement of Credit Losses on Financial Instruments", or ASU 2016-13, which introduces a new impairment model for financial instruments that is based on expected credit losses rather than incurred credit losses. The new impairment model applies to most financial assets, including trade accounts receivable. The amendments in ASU 2016-13 are effective for interim and annual reporting periods beginning after December 15, 2019 with early adoption permitted for annual periods beginning after December 15, 2018. The Company is currently in the process of evaluating the impact of adoption on its consolidated financial statements.
In February 2016, the FASB issued ASU No. 2016-02, "Leases (Topic 842)," or ASU 2016-02, which increases the transparency and comparability about leases among entities. The new guidance requires lessees to recognize a lease liability and a corresponding lease asset for operating leases with lease terms greater than 12 months. It also requires additional disclosures about leasing arrangements to help users of financial statements better understand the amount, timing, and uncertainty of cash flows arising from leases. ASU 2016-02 becomes effective for interim and annual periods beginning after December 15, 2018 and requires a modified retrospective approach to adoption. Early adoption is permitted. The Company has engaged a third party to assist in evaluating the impact of this new standard on its consolidated financial statements and related disclosures. The Company expects to recognize additional lease assets and liabilities related to operating leases with terms longer than one year.Revenue Recognition
In May 2014, the FASB issued ASU No. 2014-09, “Revenue"Revenue from Contracts with Customers (Topic 606),”" or ASU 2014-09, which provides guidance for revenue recognition and which supersedes nearly all existing revenue recognition guidance under ASU 2014-09.2014-09 and created ASC 606. This ASU provides guidance that an entity should recognize revenue to depict the transfer of promised goods or services to customers in an amount that reflects the consideration to which the entity expects to be entitled in exchange for those goods and services. Additionally,On January 1, 2018, the guidance permits two methods of transition upon adoption: full retrospective and modified retrospective. Under the full retrospective method, the standard would be applied to each prior reporting period presented. Under theCompany adopted ASC 606 on a modified retrospective method,basis for all contracts. As a result of the cumulative effect of applyingCompany's adoption, there were no changes to the standard would be recognized at the date of initial application. The Company is still evaluating which method it will adopt. In August 2015, the FASB issued final revised guidance that defers the effective datetiming of the revenue recognition standard to be for annualor measurement of revenue, and interim periods beginning after December 15, 2017. The Company has engaged a third party to assist in evaluating the impactthere was no cumulative effect of this new standard on its consolidated financial statements and related disclosures. The Company's approach will include performing a detailed review of key contracts representative of our different businesses and comparing historical accounting policies and practices to the new standard. The Company intends to adopt the new standardadoption as of January 1, 2018. Therefore, the only changes to the financial statements related to the adoption are in the footnote disclosures as included here-in.
Revenue is measured as consideration specified in a contract with a customer and excludes any sales incentives and amounts collected on behalf of third parties. The Company recognizes revenue when it satisfies a performance obligation by providing service to a customer. Amounts are billed upon completion of service and are generally due within 30 days.
The Company has its principal revenue generating activities organized into two service lines, well servicing and fluid logistics. The Company's well servicing line consists primarily of maintenance, workover, completion, plugging and abandonment, and tubing testing services. The Company's fluid logistics line provides supporting services to the well servicing line as well as direct sales to customers for fluid management and movement. The Company generally establishes a master services agreement with each customer and provides associated services on a work order basis in increments of days, by the hour for services performed or on occasion, bid/turnkey pricing. Services provided under the well servicing and the fluid logistics segments are short in duration and generally completed within 30 days.
The majority of the Company’s contracts with customers in both the well servicing and fluid logistics segments are short-term in nature and are recognized as “over-time” performance obligations as the services are performed. The Company applies the “as-invoiced” practical expedient as the amount of consideration the Company has a right to invoice corresponds directly with the value of the Company’s performance to date. Because of the short-term nature of the Company’s services, which generally last a few hours to multiple days, the Company does not have any contracts with a duration longer than one year that require disclosure. The Company has no material contract assets or liabilities.
The Company does not have any revenue expected to be recognized in the future related to remaining performance obligations or contracts with a variable consideration related to undelivered performance obligations. There was no revenue recognized in the current period from performance obligations satisfied in previous periods. The Company's significant judgments made in connection with the adoption of ASC 606 included the determination of when the Company satisfies its performance obligation to customers and the applicability of the as invoiced practical expedient.
The following tables show revenue disaggregated by primary geographical markets and major service lines for the three months ended March 31, 2018 (Successor) and March 31, 2017 (Predecessor).
4. Share-Based Compensation |
| | | | | | | | | | | |
| Successor | | | Three months ended March 31, 2018 |
| | | Well Servicing | Fluid Logistics | Total |
| Primary Geographical Markets | | (in thousands) |
| South Texas | | | $ | 19,553 |
| $ | 8,884 |
| $ | 28,437 |
|
East Texas (1) | | | 370 |
| 348 |
| 718 |
|
| Central Texas | | | 2,922 |
| 1,636 |
| 4,558 |
|
| West Texas | | | 12 |
| 1,867 |
| 1,879 |
|
| Total | | | $ | 22,857 |
| $ | 12,735 |
| $ | 35,592 |
|
As discussed in Note 1 - Chapter 11 Proceedings, on the Effective Date, all prior equity interests (which included the Old Common Stock, FES Ltd.’s prior preferred stock, awards under the Prior Compensation Plans and the preferred stock purchase rights under the Rights Agreement) in FES Ltd. were extinguished without recovery.
Management Incentive Plan
On the Effective Date, pursuant to the operation of the Plan, the Management Incentive Plan became effective.
The compensation committee, or the Compensation Committee, of the board of directors of the FES Ltd., or the Board, will administer the Management Incentive Plan. The Compensation Committee has broad authority under the Management Incentive Plan to, among other things: (i) select participants; (ii) determine the terms and conditions, not inconsistent with the Management Incentive Plan, of any award granted under the Management Incentive Plan; (iii) determine the number of shares to be covered by each award granted under the Management Incentive Plan; and (iv) determine the fair market value of awards granted under the Management Incentive Plan, subject to certain exceptions.
Persons eligible to receive awards under the Management Incentive Plan include officers and employees of the Company. The types of awards that may be granted under the Management Incentive Plan include stock options, stock appreciation rights, restricted stock, restricted stock units, performance units, performance shares and other forms of stock based awards.
The maximum number of shares of New Common Stock that may be issued or transferred pursuant to awards under the Management Incentive Plan is 750,000, which number may be increased with the approval of FES Ltd.’s stockholders. If any outstanding award granted under the Management Incentive Plan expires or is terminated or canceled without having been exercised or settled in full, or if shares of New Common Stock acquired pursuant to an award subject to forfeiture are forfeited, the shares of New Common Stock allocable to the terminated portion of such award or such forfeited shares will revert to the Management Incentive Plan and will be available for grant under the Management Incentive Plan as determined by the Compensation Committee in consultation with the Chairman of the Board, subject to certain restrictions.
As is customary in management incentive plans of this nature, in the event of any change in the outstanding shares of New Common Stock by reason of a stock split, stock dividend or other non-recurring dividends or distributions, recapitalization, merger, consolidation, spin-off, combination, repurchase or exchange of stock, reorganization, liquidation, dissolution or other similar corporate transaction, an equitable adjustment will be made in order to prevent dilution or enlargement of the benefits or potential benefits intended to be made available under the Management Incentive Plan. Such adjustment may include an adjustment to the maximum number and kind of shares of stock or other securities or other equity interests as to which awards may be granted under the Management Incentive Plan, the number and kind of shares of stock or other securities or other equity interests subject to outstanding awards and the exercise price thereof, if applicable.
As of June 30, 2017, no awards had been issued under the Management Incentive Plan. |
| | | | | | | | | | | |
| Predecessor | | | Three months ended March 31, 2017 |
| | | Well Servicing | Fluid Logistics | Total |
| Primary Geographical Markets | | (in thousands) |
| South Texas | | | $ | 12,818 |
| $ | 5,219 |
| $ | 18,037 |
|
East Texas (1) | | | 765 |
| 828 |
| 1,593 |
|
| Central Texas | | | — |
| 1,421 |
| 1,421 |
|
| West Texas | | | 3,522 |
| 2,474 |
| 5,996 |
|
| Total | | | $ | 17,105 |
| $ | 9,942 |
| $ | 27,047 |
|
| | | | | | |
| (1) Includes revenues from the Company's operations in Pennsylvania. | | |
5.3. Risk and Uncertainties
As an independent oilfield services contractor that provides a broad range of drilling-related and production-related services to oil and natural gas companies, primarily onshore in Texas, the Company's revenue, profitability, cash flows and future rate of growth are substantially dependent on its ability to (1) maintain adequate equipment utilization, (2) maintain adequate pricing for the services it provides, and (3) maintain a trained workforce. Failure to do so could adversely affect the Company's financial position, results of operations, and cash flows.
Because the Company's revenues are generated primarily from customers who are subject to the same factors as the Company that are generally impacting the oil and natural gas industry, the Company's operations are also susceptible to market volatility resulting from economic, cyclical, weather related, or other factors related to such industry. Changes experienced in the level of operating and capital spending in the industry, decreases in oil and natural gas prices, and/or industry perception about future oil and natural gas prices has materially decreased the demand for the Company's services, and has had an adverse effect on its financial position, results of operations and cash flows.
4. Property and Equipment
Property and equipment consisted of the following:
| | | | | | | | | Successor |
| | Estimated Life in Years | | June 30, 2017, Successor | | | December 31, 2016, Predecessor | Estimated Life in Years | | March 31, 2018 | | December 31, 2017 |
| | | | (in thousands) | | | (in thousands) |
| Well servicing equipment | 9-15 years | | $ | 77,713 |
| | | $ | 411,199 |
| 9-15 years | | $ | 84,333 |
| | $ | 80,899 |
|
| Autos and trucks | 5-10 years | | 33,928 |
| | | 126,580 |
| 5-10 years | | 44,248 |
| | 42,831 |
|
| Disposal wells | 5-15 years | | 3,810 |
| | | 37,752 |
| 5-15 years | | 3,952 |
| | 3,977 |
|
| Building and improvements | 5-30 years | | 5,342 |
| | | 14,125 |
| 5-30 years | | 5,519 |
| | 5,474 |
|
| Furniture and fixtures | 3-15 years | | 1,718 |
| | | 6,779 |
| 3-15 years | | 2,054 |
| | 1,950 |
|
| Land | | 868 |
| | | 1,524 |
| | 868 |
| | 868 |
|
| | | 123,379 |
| | | 597,959 |
| | 140,974 |
| | 135,999 |
|
| Accumulated depreciation | | (5,438 | ) | | | (364,597 | ) | | (25,573 | ) | | (18,808 | ) |
| | | $ | 117,941 |
| | | $ | 233,362 |
| | $ | 115,401 |
| | $ | 117,191 |
|
Depreciation expense was $5.5 million for the period April 13, 2017 through June 30, 2017 (Successor), $1.5 million for the period April 1, 2017 through April 12, 2017 (Predecessor) and $13.4 million for the period January 1, 2017 through April 12, 2017 (Predecessor). Depreciation expense was $13.0$6.9 million and $25.8$12.0 million for the three and six months ended June 30, 2016March 31, 2018 (Successor), and 2017 (Predecessor), respectively.
5. Intangible Assets
The Company's major class of intangible assets subject to amortization consists of trade names. The Company expenses costs associated with extensions or renewals of intangible assets. There were no such extensions or renewals in each of the three months ended March 31, 2018 (Successor) and 2017 (Predecessor). Amortization expense is calculated using the straight-line method over the period indicated. Amortization expense for the three months ended March 31, 2018 (Successor) and March 31, 2017 (Predecessor) was $0.3 million and $0.1 million, respectively.
The following sets forth the identified intangible assets by major asset class: |
| | | | | | | | | | | | | |
| | Useful Life (years) | | Gross Carrying Value | | Accumulated Amortization | | Net Book Value |
| | | | (in thousands) |
| As of March 31, 2018 (Successor) | | | | | | | |
| Customer relationships | 15 | | $ | 8,678 |
| | $ | (560 | ) | | $ | 8,118 |
|
| Trade names | 15 | | 2,472 |
| | (159 | ) | | 2,313 |
|
| Covenants not to compete | 4 | | 1,505 |
| | (364 | ) | | 1,141 |
|
| | | | $ | 12,655 |
| | $ | (1,083 | ) | | $ | 11,572 |
|
| | | | | | | | |
| | Useful Life
(years) | | Gross Carrying Value | | Accumulated Amortization | | Net Book Value |
| | | | (in thousands) |
| As of December 31, 2017 (Successor) | | | | | | | |
| Customer relationships | 15 | | $ | 8,678 |
| | $ | (415 | ) | | $ | 8,263 |
|
| Trade names | 15 | | 2,472 |
| | (118 | ) | | 2,354 |
|
| Covenants not to compete | 4 | | 1,505 |
| | (270 | ) | | 1,235 |
|
| | | | $ | 12,655 |
| | $ | (803 | ) | | $ | 11,852 |
|
6. Long-Term Debt
Long-term debt at June 30, 2017March 31, 2018 and December 31, 20162017 consisted of the following:following (in thousands): |
| | | | | | | | |
| | June 30, 2017, Successor | | | December 31, 2016, Predecessor |
| | (in thousands) |
| Prior Senior Notes, net of deferred financing costs of $2.3 million as of December 31, 2016 | $ | — |
| | | $ | 277,662 |
|
| Prior Loan Agreement | — |
| | | 15,000 |
|
| Third party equipment notes and capital leases | 1,000 |
| | | 1,386 |
|
| Insurance notes | 737 |
| | | 5,124 |
|
| New Loan Agreement, including $0.8 million of accrued interest paid in kind and net of debt discount of $4.6 million as of June 30, 2017 | 46,166 |
| | | — |
|
| Total debt | 47,903 |
| | | 299,172 |
|
| Less: Current portion | (1,456 | ) | | | (298,932 | ) |
| Total long-term debt | $ | 46,447 |
| | | $ | 240 |
|
Prior Senior Notes
On June 7, 2011, FES Ltd. issued $280.0 million in principal amount of the Prior Senior Notes, which were guaranteed by Forbes Energy Services LLC, or FES LLC, C.C. Forbes, LLC, or CCF, TX Energy Services, LLC, or TES, and Forbes Energy International, LLC, or FEI. FES Ltd.’s failure to make the semi-annual interest payments on the Prior Senior Notes on June 15, 2016 and December 15, 2016 after the cure periods provided for in the indenture governing the Prior Senior Notes, or the Prior Senior Indenture, and other events of default resulting from technical breaches of covenants under the Prior Senior Indenture, or collectively, the Prior Indenture Defaults, could have resulted in all outstanding indebtedness due under the Prior Senior Indenture immediately becoming due and payable. However, as discussed in Note 1 - Chapter 11 Proceedings, any efforts to enforce such payment obligations were automatically stayed as a result of the filing of the Bankruptcy Petitions, and the creditors' rights of enforcement in respect of the Prior Senior Indenture were subject to the applicable provisions of the Bankruptcy Code and orders of the Bankruptcy Court. As discussed in Note 1 - Chapter 11 Proceedings, on the Effective Date, the Prior Senior Notes were canceled and each holder of the Prior Senior Notes received such holder’s pro rata share of (i) $20 million in cash and (ii) 100% of the New Common Stock, subject to dilution only as a result of the shares of New Common Stock issued or available for issuance in connection with the Management Incentive Plan.
Prior Loan Agreement
On September 9, 2011, the Debtors entered into the Prior Loan Agreement. Under cross default provisions in the Prior Loan Agreement, an event of default under the Prior Senior Indenture constituted an event of default under the Prior Loan Agreement. As mentioned above, the Debtors experienced the Prior Indenture Defaults under the Prior Senior Indenture and, thus, constituted an event of default under the Prior Loan Agreement, or the Prior Loan Defaults. The Prior Indenture Defaults and the Prior Loan Defaults could have resulted in all outstanding indebtedness due under the Prior Senior Indenture and the Prior Loan Agreement becoming immediately due and payable. However, as discussed in Note 1 - Chapter 11 Proceedings, any efforts to enforce such payment obligations were automatically stayed as a result of the filing of the Bankruptcy Petitions, and the creditors' rights of enforcement in respect of the Prior Senior Indenture and the Prior Loan Agreement were subject to the applicable provisions of the Bankruptcy Code and orders of the Bankruptcy Court. As discussed in Note 1 - Chapter 11 Proceedings, on the Effective Date, the outstanding principal balance of $15.0 million plus outstanding interest and fees under the Prior Loan Agreement were paid off and the Prior Loan Agreement was terminated in accordance with the Plan. Additionally, on the Effective Date, the Debtors entered into the New Regions Letters of Credit Facility to cover letters of credit and certain bank product obligations. |
| | | | | | | | |
| | Successor |
| | March 31, 2018 | | | December 31, 2017 |
| | (in thousands) |
| Third party equipment notes and capital leases | $ | 5,898 |
| | | $ | 5,822 |
|
| Insurance notes | 3,380 |
| | | 5,882 |
|
| New Loan Agreement, including $2.6 million and $1.7 million of accrued interest paid in kind and net of debt discount of $4.3 million and $4.5 million as of March 31, 2018 and December 31, 2017, respectively | 48,266 |
| | | 47,150 |
|
| Total debt | 57,544 |
| | | 58,854 |
|
| Less: Current portion | (5,097 | ) | | | (7,566 | ) |
| Total long-term debt | $ | 52,447 |
| | | $ | 51,288 |
|
New Loan Agreement
As discussed previously, onOn the Effective Date, the Company entered into the New Loan Agreement. FESForbes Energy Services LLC, or the Borrower, is the borrower or the Borrower, under the New Loan Agreement. The Borrower’s obligations have been guaranteed by FES Ltd. and by TES, CCFTexas Energy Services, LLC, C.C. Forbes, LLC and FEI,Forbes Energy International, LLC, each direct subsidiaries of the Borrower and indirect subsidiaries of FES Ltd. The New Loan Agreement provides for a term loan of $50.0 million, which was fully funded on the Effective Date. Subject to certain exceptions and permitted encumbrances, the obligations under this loan are secured by a first priority security interest in substantially all the assets of the Company other than cash collateralizing the New Regions Letters of Credit Facility. Such term loan has a stated maturity date of April 13, 2021. The proceeds of such term loan are only permitted to be used for (i) the payment on account of the Prior Senior Notes in an amount equal to $20.0 million; (ii) the payment of costs, expenses and fees incurred on or prior to the Effective Date in connection with the preparation, negotiation, execution and delivery of the New Loan Agreement and documents related thereto; and (iii) subject to satisfaction of certain release conditions set forth in the New Loan Agreement, for general operating, working capital and other general corporate purposes of the Borrower not otherwise prohibited by the terms of the New Loan Agreement. The release conditions set forth in the New Loan Agreement include, among other things, (i) no default or event of default under the New Loan Agreement having occurred or being continuing as of the date of the requested release of proceeds of the New Loan Agreement, or that would exist after giving effect to the release requested to be made on such date, and (ii) the Company’s unrestricted cash and cash equivalents being less than $7$7.0 million after giving pro forma effect to the requested release. At June 30, 2017, $23.9March 31, 2018, $16.9 million included in restricted cash was subject to these release restrictions.
Borrowings under this term loan bear interest at a rate equal to five percent (5%) per annum payable quarterly in cash, or the Cash Interest Rate, plus (ii) an initial rate for paid in kind interest rate of seven percent (7%) commencing April 13, 2017 to be capitalized and added to the principal amount of the term loan on the first day of each quarter or, at the election of the Borrower, paid in cash. The paid in kind interest increases by two percent (2%) twelve months after the Effective Date and every twelve months thereafter until
maturity. Upon and after the occurrence of an event of default, the Cash Interest Rate will increase by two percentage points per annum. At March 31, 2018, the applicable interest rate was 12% per annum.
The Borrower is also responsible for certain other administrative fees and expenses. In connection with the execution of the New Loan Agreement, the Borrower paid the Lenders a funding fee of $3.0 million and paid certain Lenders a backstop fee of $2.0 million. These amounts were recorded as debt issuance costs, as a reduction in the carrying amount of the New Loan Agreement. The $20.0 million payment referred to above and these fees were funded as draws under the New Loan Agreement.
The Company is able to voluntarily repay the outstanding term loan at any time without premium or penalty. The Company is required to use the net proceeds from certain events, including but not limited to, the disposition of assets, certain judgments, indemnity payments, tax refunds, pension plan refunds, insurance awards and certain incurrences of indebtedness to repay outstanding loans under the New Loan Agreement. The Company may also be required to use cash in excess of $20.0 million to repay outstanding loans under the New Loan Agreement.
The New Loan Agreement includes customary negative covenants for an asset-based term loan, including covenants limiting the ability of the Company to, among other things, (i) effect mergers and consolidations, (ii) sell assets, (iii) create or suffer to exist any lien, (iv) make certain investments, (v) incur debt and (vi) transact with affiliates. In addition, the New Loan Agreement includes customary affirmative covenants for an asset-based term loan, including covenants regarding the delivery of financial statements, reports and notices to the Agent. The New Loan Agreement also contains customary representations and warranties and event of default provisions for a secured term loan.
New Regions Letters of Credit Facility
As discussed previously, onOn the Effective Date the Company entered into the New Regions Letters of Credit Facility to cover letters of credit and certain bank product obligations existing on the Effective Date and pursuant to which Regions may issue, upon request by the Company, letters of credit and continue to provide charge cards for use by the Company. Amounts available under the New Regions Letters of Credit Facility are subject to customary fees and are secured by a first-priority lien on, and security interest in, a cash collateral account with Regions containing cash equal to at least (i) 105% of the sum of (a) all amounts owing for any drawings under letters of credit, including any reimbursement obligations, (b) the aggregate undrawn amount of all outstanding letters of credit, (c) all sums owing to Regions or any affiliate pursuant to any letter of credit document and (d) all obligations of the Company arising thereunder, including any indemnities and obligations for reimbursement of expenses and (ii) 120% of the aggregate line of credit for charge cards issued by Regions to the Company. The fees for each letter of credit for the period from and excluding the date of issuance of such letter of credit to and including the date of expiration or termination, are equal to (x) the average daily face amount of each outstanding letter of credit multiplied by (y) a per annum rate determined by Regions from time to time in its discretion based upon such factors as Regions shall determine, including, without limitation, the credit quality and financial performance of the Company. As of the Effective Date,March 31, 2018, such rate was 3.00%. In the event the Company is unable to repay amounts due under the New Regions Letters of Credit Facility, Regions could proceed against such cash collateral account. Regions has no commitment under the New Regions Letters of Credit Facility to issue letters of credit. At June 30, 2017,March 31, 2018, the facility had $9.0$8.6 million in letters of credit outstanding.
Capital Leases
The Company financed the purchase of certain vehicles and equipment through commercial loans and capital leases with aggregate principal amounts outstanding as of June 30, 2017March 31, 2018 (Successor) and December 31, 20162017 (Successor) of approximately $1.0$5.9 million and $1.4$5.8 million, respectively. These loans are repayable in a range of 42 to 6048 monthly installments with the maturity dates ranging from July 2017April 2018 to June 2021.February 2022. Interest accrues at rates ranging from 3.1%3.4% to 8.4%4.9% and is payable monthly. The loans are collateralized by equipment purchased with the proceeds of such loans. The Company paid total principal payments of approximately $0.3$0.5 million during the period April 13, 2017 through June 30, 2017three months ended March 31, 2018 (Successor), and $0.4 million during the period January 1, 2017 through April 12, 2017 (Predecessor), and $1.1 million and $2.1 million during the three and six months ended June 30, 2016March 31, 2017 (Predecessor), respectively.
.
Following are required principal payments due on capital leases existing as of June 30, 2017:March 31, 2018:
|
| | | | | | | | | | | | | | | | | | |
| | July - December 2017 | | 2018 | | 2019 | | 2020 | 2021 and thereafter |
| | (in thousands) | |
| Capital lease principal payments | $ | 451 |
| | $ | 326 |
| | $ | 89 |
| | $ | 93 |
| $ | 41 |
|
|
| | | | | | | | | | | | | | | | | | | |
| | April - December 2018 | | 2019 | | 2020 | | 2021 | | 2022 and thereafter |
| | (in thousands) |
| Capital lease principal payments | $ | 1,313 |
| | $ | 1,644 |
| | $ | 1,713 |
| | $ | 1,197 |
| | $ | 31 |
|
Management has historically acquired all light duty trucks (pickup trucks) through capital leases and may use capital leases or cash to purchase equipment held under operating leases that have reached the end of the lease term. See Note 98 - Commitments and Contingencies.
Insurance Notes
During October of 2016,2017, the Company entered into an insurance promissory note for the payment of insurance premiums at an interest rate of 2.9% with an aggregate principal amount outstanding as of June 30, 2017March 31, 2018 (Successor) and December 31, 2016,2017 (Successor), of approximately $0.7$3.4 million and $5.1$5.9 million, respectively.
7. Fair Value Measurements
Fair value is defined as the amount that would be received for the sale of an asset or paid to transfer a liability in an orderly transaction between market participants at the measurement date.
Financial Assets and Liabilities
The carrying amounts of cash and cash equivalents, accounts receivable-trade, accounts receivable-other, accounts payable-trade, and insurance notes, approximate fair value because of the short maturity of these instruments. The fair values of third party notes and equipment notes approximate their carrying values, based on current market rates at which the Company could borrow funds with similar maturities (Level 2 in the fair value hierarchy). The fair values of the New Loan Agreement and the Prior Senior Notes as of the respective dates are set forth below:
| | | | June 30, 2017, Successor | | | December 31, 2016, Predecessor | March 31, 2018 | | | December 31, 2017 |
| | Carrying Amount | | Fair Value | | | Carrying Amount | | Fair Value | Carrying Amount | | Fair Value | | | Carrying Amount | | Fair Value |
| | (in thousands) | |
| Successor | | (in thousands) |
| New Loan Agreement | $ | 50,000 |
| | $ | 55,500 |
| | | $ | — |
| | $ | — |
| $ | 48,266 |
| | $ | 50,719 |
| | $ | 47,150 |
| | $ | 55,550 |
|
| Prior Senior Notes | $ | — |
| | $ | — |
| | | $ | 277,662 |
| | $ | 98,570 |
| |
Non-Financial Assets and Liabilities
Non-financial assets and liabilities that are initially measured at fair value are comprised of property, plant and equipment and intangible assets and are not remeasured at fair value in subsequent periods. Such initial measurements are classified as Level 3 since certain significant unobservable inputs are utilized in their determination. These fair value calculations incorporate a market and a cost approach and the inputs include projected revenue, costs, equipment utilization and other assumptions. As discussed in Note 1 - Fresh Start Accounting, property, plant and equipment and intangible assets were remeasured as part of fresh start accounting.
8. Related Party Transactions
The Company enters into transactions with related parties in the normal course of conducting business. The following tables represent related party transactions (in thousands): |
| | | | | | | | | |
| | | As of |
| | | June 30, 2017, Successor | | | December 31, 2016, Predecessor |
| Related parties cash and cash equivalents balances: | | | | | |
Balance at Texas Champion Bank (1) | | $ | 237 |
| | | $ | 295 |
|
| | | | | | |
| Related parties payable: | | | | | |
Alice Environmental Services, LP/Alice Environmental Holding LLC (2) | | $ | (145 | ) | | | $ | — |
|
Tasco Tool Services, Ltd. (3) | | — |
| | | — |
|
Texas Quality Gate Guard Services, LLC (4) | | — |
| | | 18 |
|
Animas Holdings, LLC (5) | | (15 | ) | | | — |
|
| | | $ | (160 | ) | | | $ | 18 |
|
There were no related party capital expenditures for the period April 13, 2017 through June 30, 2017 (Successor), the period January 1, 2017 through April 12, 2017 (Predecessor), and the three and six months ended June 30, 2016 (Predecessor).
|
| | | | | | | | | | | |
| | | | | | | | | | | |
| | Successor | | | Predecessor |
| | April 13 through June 30, 2017 | | | April 1 through April 12, 2017 | | January 1 through April 12, 2017 | | Three months ended June 30, 2016 | | Six months ended June 30, 2016 |
| | (in thousands) |
|
| | | | | | | | | | | | | | | | | | | | | |
| Related parties expense activity: | | | | | | | | | | | |
Alice Environmental Services, LP/Alice Environmental Holdings, LLC (2) | | $ | 148 |
| | | $ | 73 |
| | $ | 296 |
| | $ | 264 |
| | $ | 561 |
|
Tasco Tool Services, Ltd. (3) | | — |
| | | 3 |
| | 11 |
| | — |
| | 15 |
|
Texas Quality Gate Guard Services, LLC(4) | | — |
| | | 17 |
| | 58 |
| | 19 |
| | 65 |
|
Animas Holdings, LLC (5) | | 32 |
| | | 13 |
| | 61 |
| | 44 |
| | 84 |
|
CJW Group, LLC (6) | | 6 |
| | | 3 |
| | 13 |
| | 9 |
| | 19 |
|
| | | $ | 186 |
| | | $ | 109 |
| | $ | 439 |
| | $ | 344 |
| | $ | 744 |
|
|
| | | | | | | | | | | | | | | | | | | | | |
| Other payments to related parties: | | | | | | | | | | | |
SB Factoring, LLC (7) | | $ | — |
| | | $ | 65 |
| | $ | 65 |
| | $ | 89 |
| | $ | 217 |
|
| | | $ | — |
| | | $ | 65 |
| | $ | 65 |
| | $ | 89 |
| | $ | 217 |
|
(1) The Company has a deposit relationship with Texas Champion Bank. Travis Burris is the President, Chief Executive Officer, and director of Texas Champion Bank and served as a Company director until the Effective Date. John E. Crisp, Mr. Crisp, is an executive officer and director of Forbes Energy Services, Ltd, serves on the board of directors of Texas Champion Bank.
(2) Mr. Crisp is a partial owner of Alice Environmental Holdings, LLC, or AEH, and is an indirect shareholder and manager of Alice Environmental Services, LP, or AES and Alice Environmental West Texas, LLC, or AEWT. The Company leases or rents land and buildings from AES.
(3) Tasco Tool Services, Ltd., or Tasco, is a down-hole tool company that is partially owned and managed by a company that is partially owned by Mr. Forbes. Tasco rents and sells tools to the Company from time to time. As of the Effective Date, Tasco is not a related party.
(4) Texas Quality Gate Guard Services, LLC, or Texas Quality Gate Guard Services, is an entity partially owend by Mr. Crisp and a son of Mr. Crisp. Texas Quality Gate Guard Services has provided security services to the Company. Since the Effective Date, Texas Quality Gate Guard Services has not provided services to our Company and we do not anticipate securing their services in the future.
(5) Animas Holdings, LLC, or Animas, is partially owned by two sons of Mr. Crisp. Animas owns land and property that it leases to the Company.
(6) CJW Group, LLC is an entity that leases office space to the Company and is partially owned by Mr. Crisp.
(7) From time to time, vendors of the Company factor their receivables from the Company and direct that the Company make payment of such factored amounts directly to the applicable factor. One such factor to whom payments have been made by the Company is SB Factoring LLC, which is partially owned by Mr. Crisp. The nature of these transactions does not result in recording in the Company’s financial records any revenue, any expense or any receivable and does not result in any payable distinct in amount from the amount payable to such vendors as originally incurred. Since the Effective Date, SB Factoring has not factored vendor receivables from our Company and we do not anticipate they will in the future.
In addition to such related party transactions above, Lawrence “Larry” First, a director of FES Ltd., serves as the Chief Investment Officer and Managing Director of Ascribe Capital LLC, or Ascribe, and Brett G. Wyard, also a director of FES Ltd., serves as a Managing Partner of Solace Capital Partners, or Solace. Pursuant to the Plan, each of Ascribe and Solace had the right to designate one member of the Board. Additionally, Ascribe and Solace had the right to jointly designate one member of the Board and, together with certain other holders of the Prior Senior Notes, the right to designate the one other member of the Board. Furthermore, Ascribe and/or one of more of its affiliates own approximately 24.5% of the outstanding New Common Stock as of August 11, 2017, and is owed approximately $12.6 million of the aggregate principal amount of the New Loan Agreement. Solace and/or one of its affiliates own approximately 18.0% of the outstanding New Common Stock as of August 11, 2017, and is owed approximately $11.5 million of the aggregate principal amount of the term loan covered by the New Loan Agreement. Moreover, an affiliate of Solace and affiliates of Ascribe are parties to that certain registration rights agreement dated as of the Effective Date by and among the Company and certain stockholders of the Company.
9.8. Commitments and Contingencies
Concentrations of Credit Risk
FDIC insurance coverage is currently $250,000 per depositor at each financial institution, and the Company's non-interest bearing cash balances typically exceed federally insured limits. The Company restricts investment of temporary cash investments to financial institutions with high credit standings.
The Company's customer base consists primarily of multi-national and independent oil and natural gas producers. The Company does not require collateral on its trade receivables. For the period of April 13, 2017 through June 30, 2017three months ended March 31, 2018 (Successor), the Company's largest customer, five largest customers, and ten largest customers constituted 13.5%15.2%, 38.3%48.6% and 49.4%60.9% of
consolidated revenues, respectively. For the period of January 1, 2017 through April 12, 2017 (Predecessor), the Company's largest customer, five largest customers, and ten largest customers constituted 14.9%, 46.1% and 58.7% of consolidated revenues, respectively. For the period of April 13, 2017 through June 30, 2017three months ended March 31, 2018 (Successor), two customers constituted 13.5%15.2% and 10% of consolidated revenues, respectively. For the period of January 1, 2017 through April 12, 2017 (Predecessor), two customers constituted 14.9% and 12.4%14.8% of consolidated revenues, respectively. The loss of any one of the Company's top five customers would have a materially adverse effect on the revenues and profits of the Company. Further, the Company's trade accounts receivable are from companies within the oil and natural gas industry and as such the Company is exposed to normal industry credit risks. As of June 30, 2017,March 31, 2018, the Company's largest customer, five largest customers, and ten largest customers constituted 14.2%24.7%, 41.6%48.5% and 53.5%62.9% of accounts receivable, respectively. As
Litigation
From time to time, the Company is subject to various claims and legal actions that arise in the ordinary course of June 30, 2017, one customer constituted 14.2%business. There are no pending material legal proceedings, and the Company is not aware of accounts receivable.any material threatened legal proceedings, to which the Company is a party or to which its property is subject that would have a material adverse effect on the Company's financial statements as of March 31, 2018. It is reasonably possible that cases could be resolved and result in liabilities that exceed the amounts currently reserved.
Self-Insurance
The Company is self-insured under its Employee Group Medical Plan for the first $150 thousand$150,000 per individual. The Company is self-insured with a retention for the first $250 thousand$250,000 in general liability. The Company also retains the first $1.0 million within the auto liability buffer policy which is in excess of a primary $1.0 million auto liability limit. The Company has an additional premium payable clause under its lead $10.0$10 million limit excess policy that states in the event losses exceed $0.5$1 million, a loss additional premium of up to 15% of paid losses in excess of $0.5$1 million will be due. The loss additional premium is payable at the time when the loss is paid and will be payable over a period agreed by insurers. The Company has accrued liabilities totaling $6.4$6.3 million and $7.2 million as of June 30, 2017March 31, 2018 (Successor) and December 31, 2016,2017 (Successor), respectively, for the projected additional premium and self-insured portion of these insurance claims as of the financial statement dates. This accrual includes claims made as well as an estimate for claims incurred but not reported as of the financial statement dates.
LitigationOther
The Company is subject to various other claimscurrently undergoing sales and legal actions that arise in the ordinary course of business.use tax audits for multi-year periods. The Company does not believe that anybelieves the outcome of these claims and actions, separately or in the aggregate,audits will not have a material adverse effect on its business, financial condition, results of operations or cash flows, although itfinancial position. Because certain of these audits are in a preliminary stage, an estimate of the possible loss or range of loss cannot guarantee that a material adverse effect will not occur.reasonably be made.
Off-Balance Sheet Arrangements
The Company is often party to certain transactions that constitute off-balance sheet arrangements such as performance bonds, guarantees, operating leases for equipment, and bank guarantees that are not reflected in the Company's condensed consolidated balance sheets. These arrangements are made in the Company's normal course of business and they are not reasonably likely to have a current or future material adverse effect on its financial condition, results of operations, liquidity, or cash flows. The Company's off-balance sheet arrangements include $9.0$8.6 million in letters of credit and operating leases for equipment.
10. Supplemental Cash Flow Information |
| | | | | | | | | | | |
| | Successor | | | Predecessor |
| | April 13 through June 30, 2017 | | | January 1 through April 12, 2017
| Six months ended June 30, 2016 |
| | (in thousands) |
| Cash paid for | | | | | |
| Interest | $ | 657 |
| | | $ | 453 |
| $ | 261 |
|
| Income tax | $ | — |
| | | $ | — |
| $ | — |
|
| Supplemental schedule of non-cash investing and financing activities | | | | | |
| Changes in accounts payable related to capital expenditures | $ | — |
| | | $ | — |
| $ | (1,450 | ) |
| Capital leases on equipment | $ | 344 |
| | | $ | — |
| $ | — |
|
| Preferred stock dividends and accretion costs | $ | — |
| | | $ | 10 |
| $ | 21 |
|
On the Effective Date, all prior equity interests (which included the Old Common Stock, FES Ltd.’s prior preferred stock, awards under the prior compensation plans and the preferred stock purchase rights under the Rights Agreement) in FES Ltd. were extinguished without recovery.
Management Incentive Plan
On the Effective Date, pursuant to the operation of the Plan, the Management Incentive Plan became effective.
A summary of the Company's share-based compensation expense during the periods presented are as follows (dollar amounts in thousands):
|
| | | | | | | | | | |
| | | | Successor | | | Predecessor |
| | | | Three months ended March 31, 2018 | | | Three months ended March 31, 2017 |
| Share based compensation expense recognized | $ | 250 |
| | | $ | — |
|
| Unrecognized compensation cost | | $ | 3,414 |
| | | $ | — |
|
| Remaining weighted-average service period (years) | | 3.41 |
| | | — |
|
During the year ended December 31, 2017, the Company granted 450,000 restricted stock units to officers and employees subject to the Management Incentive Plan. Below is a summary of the unvested restricted stock units awarded.
|
| | | | | | | | | |
| | | | Number of Shares | | | Weighted Average Fair Value |
| Unvested as of December 31, 2017 (Successor) | 363,300 | | | $ | 11.00 |
|
| Granted | | — |
| | | $ | — |
|
| Vested | | — |
| | | $ | — |
|
| Forfeited | | | — |
| | | $ | — |
|
| Unvested as of March 31, 2018 (Successor) | | | 363,300 |
| | | $ | 11.00 |
|
10. Related Party Transactions
During the three months ended March 31, 2018 (Successor) and 2017 (Predecessor), the Company incurred $266,000 and $330,000, respectively, in related party expenses, primarily related to leases and rents. There was no related party revenue for the three months ended March 31, 2018 (Successor). Related party revenue for the three months ended March 31, 2017 (Predecessor) was $1,000. From time to time, vendors of the Company factor their receivables from the Company with a related party. For the three months ended March 31, 2017 (Predecessor), the Company made payments of $73,000 for receivables factored to a related party. The nature of these transactions do not result in recording in the Company’s financial records any revenue, any expense or any receivable and does not result in any payable distinct in amount from the amount payable to such vendors as originally incurred. There were no such payments made during the three months ended March 31, 2018 (Successor).
As of March 31, 2018 (Successor), related party payables amounted to $1,000 and there were no related party accounts receivable. As of December 31, 2017 (Successor), related party accounts payable were $11,000 and there were no related party or accounts receivable.
In addition to such related party transactions above, Lawrence “Larry” First, a director of FES Ltd., serves as the Chief Investment Officer and Managing Director of Ascribe Capital LLC, or Ascribe, and Brett G. Wyard, also a director of FES Ltd., serves as a Managing Partner of Solace Capital Partners, or Solace. Ascribe and/or one or more of its affiliates own approximately 24.1% of the outstanding New Common Stock as of May 10, 2018, and is owed approximately $13.2 million of the aggregate principal amount of the New Loan Agreement. Solace and/or one of its affiliates own approximately 17.8% of the outstanding New Common Stock as of May 10, 2018, and is owed approximately $11.9 million of the aggregate principal amount of the term loan covered by the New Loan Agreement. Moreover, an affiliate of Solace and affiliates of Ascribe are parties to certain registration rights agreement dated as of the Effective Date by and among the Company and certain stockholders of the Company.
11. Earnings per Share
As discussed in Note 1 - Chapter 11 Proceedings, onOn the Effective Date, the Old Common Stock, the prior Series B Senior Convertible Preferred Stock, or the Prior Preferred Stock, and awards then outstanding under the Prior Compensation Plans were extinguished without recovery.
Basic earnings (loss) per share, or EPS, is computed by dividing net income (loss) available to common stockholders by the weighted average common stock outstanding during the period. Diluted earnings (loss) per share takes into account the potential dilution that could occur if securities or other contracts to issue common stock, such as options and convertible preferred stock, were exercised and converted into common stock. Potential common stock equivalents relate to outstanding stock options and unvested restricted stock units, which are determined using the treasury stock method, and the Prior Preferred Stock, which were determined using the "if-converted" method. In applying the if-converted method, conversion is not assumed for purposes of computing diluted EPS if the effect would be antidilutive.
The following table sets forth the computation of basic and diluted loss per share:
|
| | | | | | | | | | | | |
| | Successor | | | Predecessor |
| | April 13 through June 30, 2017 | | | April 1 through April 12, 2017 | | Three months ended June 30, 2016 |
| | (in thousands, except per share amounts) |
| Basic and diluted: | | | | | | |
| Net income (loss) | $ | (7,001 | ) | | | $ | 49,666 |
| | $ | (38,686 | ) |
| Preferred stock dividends and accretion | — |
| | | — |
| | (194 | ) |
| Net income (loss) attributable to common stockholders | $ | (7,001 | ) | | | $ | 49,666 |
| | $ | (38,880 | ) |
| Weighted-average common shares | 5,250 |
| | | 27,508 |
| | 22,214 |
|
| Basic and diluted net income (loss) per share | $ | (1.33 | ) | | | $ | 1.81 |
| | $ | (1.75 | ) |
| | | | Successor | | | Predecessor | Successor | | | Predecessor |
| | April 13 through June 30, 2017 | | | January 1 through April 12, 2017 | | Six months ended June 30, 2016 | Three months ended March 31, 2018 | | | Three months ended March 31, 2017 |
| | (in thousands, except per share amounts) | (in thousands, except per share amounts) | | | (in thousands, except per share amounts) |
| Basic and diluted: | | | | | | | | | | |
| Net income (loss) | $ | (7,001 | ) | | | $ | 27,228 |
| | $ | (63,154 | ) | |
| Net loss | | $ | (8,547 | ) | | | $ | (22,440 | ) |
| Preferred stock dividends and accretion | — |
| | | (46 | ) | | (388 | ) | — |
| | | (46 | ) |
| Net income (loss) attributable to common stockholders | $ | (7,001 | ) | | | $ | 27,182 |
| | $ | (63,542 | ) | |
| Net loss attributable to common stockholders | | $ | (8,547 | ) | | | $ | (22,486 | ) |
| Weighted-average common shares | 5,250 |
| | | 27,508 |
| | 22,213 |
| 5,336 |
| | | 22,215 |
|
| Basic and diluted net income (loss) per share | $ | (1.33 | ) | | | $ | 0.99 |
| | $ | (2.86 | ) | |
| Basic and diluted net loss per share | | $ | (1.60 | ) | | | $ | (1.01 | ) |
There were 363,300 unvested restricted stock units that were not included in the calculation of diluted EPS for the three months ended March 31, 2018 (Successor) because their effect would have been antidilutive. There were 602,625 stock options and 5,292,531 shares of Old Common Stock equivalents underlying the Prior Preferred Stock included in the weighted average common shares for the period April 1, 2017 through April 12, 2017 (Predecessor) and the period January 1, 2017 through April 12, 2017 (Predecessor) as the Prior Preferred Stock was dilutive and a participating security. There were 602,625 stock options that were not included in the calculation of diluted EPS for the periods of April 1, 2017 through April 12, 2017 (Predecessor) and January 1, 2017 through April 12, 2017 (Predecessor) because their effect would have been antidilutive. There were 614,125 stock options, 715,679 units of unvested restricted stock, and 5,292,531 shares of Old Common Stock equivalents underlying the Prior Preferred Stock outstanding as of June 30, 2016 that were not included in the calculation of diluted EPS for the three and six months ended June 30, 2016March 31, 2017 (Predecessor) because their effect would have been antidilutive.
12. Income Taxes
The Company’s effective tax rate for the period of April 13, 2017 through June 30, 2017 (Successor) was 0.24% based on a pre-tax loss of $7.0 million. The Company’s effective tax rate for the period of January 1, 2017 through April 12, 2017 (Predecessor) was 0.10% based on pre-tax income of $27.3 million. The Company's effective tax rate for the six months ended June 30, 2016 (Predecessor) was (0.1)% based on a pre-tax loss of $63.1 million. The difference between the effective rate and 35.0% statutory rate is mainly due to the application of a valuation allowance in 2017 and 2016. With respect to the application of a valuation allowance, management considered the likelihood of realizing the future benefits associated with the Company's existing deductible temporary differences and carryforwards. As a result of this analysis, and based on the current year pre-tax loss and a cumulative loss in the prior three fiscal years, management determined that it is not more likely than not that the future benefit associated with all of the Company's existing deductible temporary differences and carryforwards will be realized. As a result, the Company maintained a valuation allowance against all of its net deferred tax assets.
The Company has evaluated the impact of the reorganization on its carryover tax attributes and believes it will not incur an immediate cash income tax liability as a result of its emergence from bankruptcy. The Company will be able to fully absorb cancellation of debt income with net operating losses, or NOL, carryforwards, and as a result, its NOL carryforwards will be significantly reduced. The amount of remaining NOL carryforwards available after cancellation of debt income will be limited under Internal Revenue Code Section 382 due to the change in control in connection with the reorganization.
Given the full valuation allowance, the Company did not recognize any tax benefit from operating losses generated for the period of April 13, 2017 through June 30, 2017 (Successor) or the period of January 1, 2017 through April 12, 2017 (Predecessor).
13.12. Business Segment Information
The Company has determined that it has two reportable segments organized based on its products and services—well servicing and fluid logistics. The accounting policies of the segments are the same as those described in the summary of significant accounting policies.
Well Servicing
At June 30, 2017,March 31, 2018, the Company's well servicing segment utilized its fleet of 168 well servicing rigs, which was comprised of 154 workover rigs and 14 swabbing rigs, in addition to six coiled tubing spreads and other related assets and equipment. These assets are used to provide (i) well maintenance, including remedial repairs and removal and replacement of downhole production equipment, (ii) well workovers, including significant downhole repairs, re-completions and re-perforations, (iii) completion and swabbing activities, (iv) plugging and abandonment services, and (v) pressure testing of oil and natural gas production tubing and scanning tubing for pitting and wall thickness using tubing testing units.
Fluid Logistics
The fluid logistics segment utilizes the Company's fleet of 293258 owned or leased fluid transport trucks and related assets, 109 other heavy trucks including specialized vacuum, high pressure pump and tank trucks, 2,8762,868 frac tanks, 1915 salt water disposal wells and facilities, and related equipment. These assets are used to transport, store and dispose of a variety of drilling and produced fluids used in and generated by oil and natural gas production activities. These services are required in most workover and completion projects and are routinely used in the daily operation of producing wells.
The following tables set forth certain financial information with respect to the Company’s reportable segments for the period April 13, 2017 through June 30, 2017three months ended March 31, 2018 (Successor), the period January 1, 2017 through April 12, 2017 (Predecessor) and the three and six months ended June 30, 2016March 31, 2017 (Predecessor) (in thousands):
| | | | April 13 through June 30, 2017 | | | Successor | | | Predecessor |
| Successor | Well Servicing | | Fluid Logistics | | Total | | | | | | | |
| | | Three months ended March 31, 2018 | | | Three months ended March 31, 2017 |
| | | (in thousands) | | | (in thousands) |
| | | Well Servicing | | Fluid Logistics | | Total | | | Well Servicing | | Fluid Logistics | | Total |
| Operating revenues | $ | 18,139 |
| | $ | 9,711 |
| | $ | 27,850 |
| | | | | | | $ | 22,857 |
| | $ | 12,735 |
| | $ | 35,592 |
| | | $ | 17,105 |
| | $ | 9,942 |
| | $ | 27,047 |
|
| Direct operating costs | 13,814 |
| | 9,053 |
| | 22,867 |
| | | | | | | 19,017 |
| | 10,689 |
| | 29,706 |
| | | 14,140 |
| | 9,948 |
| | 24,088 |
|
| Segment operating profit | $ | 4,325 |
| | $ | 658 |
| | $ | 4,983 |
| | | | | | | |
| Segment operating profit (loss) | | $ | 3,840 |
| | $ | 2,046 |
| | $ | 5,886 |
| | | $ | 2,965 |
| | $ | (6 | ) | | $ | 2,959 |
|
| Depreciation and amortization | $ | 2,837 |
| | $ | 2,844 |
| | $ | 5,681 |
| | | | | | | $ | 3,732 |
| | $ | 3,431 |
| | $ | 7,163 |
| | | $ | 6,169 |
| | $ | 5,899 |
| | $ | 12,068 |
|
Capital expenditures (1) | $ | 915 |
| | $ | 454 |
| | $ | 1,368 |
| | | | | | | $ | 955 |
| | 4,377 |
| | $ | 5,332 |
| | | $ | 274 |
| | $ | 103 |
| | $ | 377 |
|
| Total assets | $ | 97,208 |
| | $ | 78,680 |
| | $ | 175,708 |
| | | | | | | $ | 146,825 |
| | $ | 80,456 |
| | $ | 227,281 |
| | | $ | 615,696 |
| | $ | 434,304 |
| | $ | 1,050,000 |
|
| Long-lived assets | $ | 68,672 |
| | $ | 49,269 |
| | $ | 117,941 |
| |
| | | | | $ | 83,615 |
| | $ | 43,358 |
| | $ | 126,973 |
| | | $ | 136,435 |
| | $ | 85,103 |
| | $ | 221,538 |
|
| | | | | | | | | | | | | | | | | | | | | | | |
| | | | | | | | | | | | | |
| | | | | | | | | | | | | |
| Predecessor | April 1, 2017 through April 12, 2017 | | January 1, 2017 through April 12, 2017 | |
| | Well Servicing | | Fluid Logistics | | Total | | Well Servicing | | Fluid Logistics | | Total | |
| Operating revenues | $ | 2,449 |
| | $ | 1,269 |
| | $ | 3,718 |
| | $ | 19,554 |
| | $ | 11,211 |
| | $ | 30,765 |
| |
| Direct operating costs | 1,813 |
| | 1,260 |
| | 3,073 |
| | 15,952 |
| | 11,207 |
| | 27,159 |
| |
| Segment operating profit | $ | 636 |
| | $ | 9 |
| | $ | 645 |
| | $ | 3,602 |
| | $ | 4 |
| | $ | 3,606 |
| |
| Depreciation and amortization | $ | 782 |
| | $ | 751 |
| | $ | 1,533 |
| | $ | 6,927 |
| | $ | 6,674 |
| | $ | 13,601 |
| |
Capital expenditures (1) | $ | 12 |
| | $ | 11 |
| | $ | 23 |
| | $ | 286 |
| | $ | 114 |
| | $ | 400 |
| |
| Total assets | $ | 607,638 |
| | $ | 434,371 |
| | $ | 1,042,009 |
| | $ | 607,638 |
| | $ | 434,371 |
| | $ | 1,042,009 |
| |
| Long-lived assets | $ | 135,942 |
| | $ | 84,384 |
| | $ | 220,326 |
| | $ | 135,942 |
| | $ | 84,384 |
| | $ | 220,326 |
| |
| | | | | |
| | | | | | | |
| Predecessor | Three months ended June 30, 2016 | | Six months ended June 30, 2016 | |
| | Well Servicing | | Fluid Logistics | | Total | | Well Servicing | | Fluid Logistics | | Total | |
| Operating revenues | $ | 16,796 |
| | $ | 11,615 |
| | $ | 28,411 |
| | $ | 35,509 |
| | $ | 24,833 |
| | $ | 60,342 |
| |
| Direct operating costs | 15,668 |
| | 10,931 |
| | 26,599 |
| | 32,388 |
| | 24,092 |
| | 56,480 |
| |
| Segment operating profit | $ | 1,128 |
| | $ | 684 |
| | $ | 1,812 |
| | $ | 3,121 |
| | $ | 741 |
| | $ | 3,862 |
| |
| Depreciation and amortization | $ | 6,927 |
| | $ | 6,743 |
| | $ | 13,670 |
| | $ | 13,603 |
| | $ | 13,556 |
| | $ | 27,159 |
| |
| Impairment of assets | $ | — |
| | $ | 14,512 |
| | $ | 14,512 |
| | $ | — |
| | $ | 14,512 |
| | $ | 14,512 |
| |
Capital expenditures (1) | $ | 720 |
| | $ | 2,437 |
| | $ | 3,157 |
| | $ | 913 |
| | $ | 3,874 |
| | $ | 4,787 |
| |
| Total assets | $ | 611,540 |
| | $ | 444,652 |
| | $ | 1,056,192 |
| | $ | 611,540 |
| | $ | 444,652 |
| | $ | 1,056,192 |
| |
| Long-lived assets | $ | 151,934 |
| | $ | 103,323 |
| | $ | 255,257 |
| | $ | 151,934 |
| | $ | 103,323 |
| | $ | 255,257 |
| |
| | | | | | | | | | | | | |
(1) Capital expenditures listed above include all cash and non-cash additions to property and equipment, including capital leases and fixed assets recorded in accounts payable at period end. | (1) Capital expenditures listed above include all cash and non-cash additions to property and equipment, including capital leases and fixed assets recorded in accounts payable at period end. | (1) Capital expenditures listed above include all cash and non-cash additions to property and equipment, including capital leases and fixed assets recorded in accounts payable at period end. |
| | | | Successor | | | Predecessor | Successor | | | Predecessor |
| | April 13 through June 30, 2017 | | | April 1 through April 12, 2017 | | January 1 through April 12, 2017 | Three months ended March 31, 2018 | | | Three months ended in March 31, 2017 |
| Reconciliation of the Company's Operating Loss As Reported: | (in thousands) | (in thousands) | | | (in thousands) |
| Segment operating profits | $ | 4,983 |
| | | $ | 645 |
| | $ | 3,606 |
| $ | 5,886 |
| | | $ | 2,959 |
|
| General and administrative expense | 3,130 |
| | | 500 |
| | 5,012 |
| 4,888 |
| | | 4,512 |
|
| Depreciation and amortization | 5,681 |
| | | 1,533 |
| | 13,601 |
| 7,163 |
| | | 12,068 |
|
| Operating loss | (3,828 | ) | | | (1,388 | ) | | (15,007 | ) | (6,165 | ) | | | (13,621 | ) |
| Other expense, net | (1,891 | ) | | | (40 | ) | | (2,241 | ) | (2,365 | ) | | | (8,788 | ) |
| Gain (loss) on reorganization items, net | (1,299 | ) | | | 51,090 |
| | 44,503 |
| |
| Pre-tax income (loss) | $ | (7,018 | ) | | | $ | 49,662 |
| | $ | 27,255 |
| |
| | | | | | | |
| | | | Predecessor | |
| | | | Three months ended June 30, 2016 | | Six months ended June 30, 2016 | |
| Reconciliation of the Company's Operating Loss As Reported: | | | (in thousands) | |
| Segment operating profits | | | $ | 1,812 |
| | $ | 3,862 |
| |
| General and administrative expense | | | 5,420 |
| | 11,476 |
| |
| Depreciation and amortization | | | 13,670 |
| | 27,159 |
| |
| Impairment of assets | | | 14,512 |
| | 14,512 |
| |
| Operating loss | | | (31,790 | ) | | (49,285 | ) | |
| Other expense, net | | | (6,905 | ) | | (13,829 | ) | |
| Pre-tax loss | | | $ | (38,695 | ) | | $ | (63,114 | ) | $ | (8,530 | ) | | | $ | (22,409 | ) |
| | | | Successor | | | Predecessor | Successor |
| | June 30, 2017 | | | December 31, 2016 | March 31, 2018 | | December 31, 2017 |
| Reconciliation of the Company's Assets As Reported: | (in thousands) | (in thousands) |
| Total reportable segments | $ | 175,708 |
| | | $ | 1,045,753 |
| $ | 227,281 |
| | $ | 215,134 |
|
| Elimination of internal transactions | (77,769 | ) | | | (1,935,640 | ) | (348,903 | ) | | (311,147 | ) |
| Parent | 110,621 |
| | | 1,202,768 |
| 318,628 |
| | 297,770 |
|
| Total assets | $ | 208,560 |
| | | $ | 312,881 |
| $ | 197,006 |
| | $ | 201,757 |
|
13. Supplemental Cash Flow Information |
| | | | | | | | |
| | |
| | Successor | | | Predecessor |
| | Three months ended March 31, 2018 | | | Three months ended March 31, 2017 |
| Cash paid for | (in thousands) | | | (in thousands) |
| Interest | $ | 921 |
| | | $ | 461 |
|
| Supplemental schedule of non-cash investing and financing activities | | | | |
| Changes in accounts payable related to capital expenditures | $ | 2,414 |
| | | $ | — |
|
| Capital leases on equipment | $ | 583 |
| | | $ | — |
|
| Preferred stock dividends and accretion costs | $ | — |
| | | $ | 46 |
|
14. Equity SecuritiesRecent Accounting Pronouncements
As discussed in Note 1 - Chapter 11 Proceedings,In November 2016, the FASB issued ASU No. 2016-18, "Statement of Cash Flows (Topic 230), Restricted Cash," or ASU 2016-18. ASU 2016-18 provides guidance on the Effective Date,presentation of restricted cash and restricted cash equivalents in the Old Common Stock or Prior Preferred Stock was extinguished without recovery.
Additionally,statement of cash flows. Restricted cash and restricted cash equivalents should be included with cash and cash equivalents when reconciling the beginning-of-period and end-of-period amounts shown on the Effective Date, FES Ltd. createdstatement of cash flows. On January 1, 2018 the New Common Stock.Company adopted the provisions of ASU 2016-18 on a retrospective basis. The New Common Stock carries2017 statement of cash flows has been restated to conform to the requirements of ASU 2016-18 and the 2018 presentation.
The following rights:
•Voting. Holderstable provides a reconciliation of cash and cash equivalents and restricted cash reported within the New Common Stock are entitledconsolidated balance sheets to one vote per sharethe same such amounts shown in the consolidated statements of New Common Stock owned as of the relevant record date on all matters submitted to a vote of stockholders. Except as otherwise required by Delaware law, holders of New Common Stock (as well as holders of any preferred stock of FES Ltd.cash flows.
entitled to vote with such common stockholders) vote together as a single class |
| | | | | | | | | | | | | | | | | |
| | | Successor | | Successor | | | Predecessor | | Predecessor |
| | | March 31, 2018 | | December 31, 2017 | | | March 31, 2017 | | December 31, 2016 |
| | | (in thousands) | | | (in thousands) |
| Cash and cash equivalents | | $ | 7,572 |
| | $ | 5,465 |
| | | $ | 17,647 |
| | $ | 20,437 |
|
| Restricted cash | | 25,601 |
| | 30,015 |
| | | 27,579 |
| | 27,563 |
|
| Cash and cash equivalents and restricted cash as shown in the consolidated statement of cash flows | | $ | 33,173 |
| | $ | 35,480 |
| | | $ | 45,226 |
| | $ | 48,000 |
|
In June 2016, the FASB issued ASU No. 2016-13, "Financial Instruments-Credit Losses (Topic 326): Measurement of Credit Losses on all matters presented to the stockholders for their vote or approval, including the election of directors. The election of directors is determined by a plurality of the votes cast by the stockholders present in person or represented by proxy at the meeting and entitled to vote thereon. All other matters are determined by the vote of a majority of the votes cast by the stockholders present in person or represented by proxy at the meeting and entitled to vote thereon, unless the matter is one upon which, by applicable law, the rules or regulations of any stock exchange applicable to FES Ltd., the Certificate of Incorporation of FES Ltd.Financial Instruments", or the Certificate of Incorporation, or the Second AmendedASU 2016-13, which introduces a new impairment model for financial instruments that is based on expected credit losses rather than incurred credit losses. The new impairment model applies to most financial assets, including trade accounts receivable. The amendments in ASU 2016-13 are effective for interim and Restated Bylaws of FES Ltd., or the Bylaws, a different voteannual reporting periods beginning after December 15, 2019 with early adoption permitted for annual periods beginning after December 15, 2018. The Company is required, in which case such provision shall govern and control the decision of such matter.
•Dividends. Subject to provisions of applicable law and the Certificate of Incorporation, dividends may be declared by and at the discretion of the Board at any meeting and may be paid in cash, in property, or in shares of stock of FES Ltd.
•Liquidation, dissolution or winding up. Except as otherwise required by the Certificate of Incorporation or the Bylaws,currently in the eventprocess of evaluating the liquidation, dissolution or winding-upimpact of FES Ltd., holders of New Common Stock will have all rights and privileges typically associated with such securities as set forth in the General Corporation Law of the State of Delaware in relation to rights upon liquidation.
•Restrictions on transfer. The New Common Stock is not subject to restrictions on transfer as a result of the Certificate of Incorporation or the Bylaws. Nevertheless, there may be restrictions imposed by applicable securities laws or by the terms of other agreements entered into in the future. The Bylaws permit FES Ltd. to place restrictive legendsadoption on its share certificatesconsolidated financial statements.
In February 2016, the FASB issued ASU No. 2016-02, "Leases (Topic 842)," or ASU 2016-02, which increases the transparency and comparability about leases among entities. The new guidance requires lessees to recognize a lease liability and a corresponding lease asset for operating leases with lease terms greater than 12 months. It also requires additional disclosures about leasing arrangements to help users of financial statements better understand the amount, timing, and uncertainty of cash flows arising from leases. ASU 2016-02 becomes effective for interim and annual periods beginning after December 15, 2018 and requires a modified retrospective approach to adoption. The Company has engaged a third party to assist in orderevaluating the impact of this new standard on its consolidated financial statements and related disclosures. The Company expects to ensure compliancerecognize additional lease assets and liabilities related to operating leases with these restrictions.
•Other rights. Holders of the New Common Stock have no preemptive, redemption, conversion or sinking fund rights.terms longer than one year.
The rights, preferences, and privileges of the holders of the New Common Stock will be subject to, and may be adversely affected by, the rights of the holders of any series of preferred stock that may be issued by FES Ltd.
| |
| Item 2. | Management’s Discussion and Analysis of Financial Condition and Results of Operations |
The following discussion and analysis of our financial condition and results of operations should be read in conjunction with the accompanying condensed consolidated financial statements and related notes included elsewhere in this Quarterly Report on Form 10-Q and with the audited consolidated financial statements for the year ended December 31, 20162017 included in our Annual Report on Form 10-K, as amended. Any forward-looking statements made by or on our behalf are made pursuant to the safe harbor provisions of the Private Securities Litigation Reform Act of 1995. Readers are cautioned that such forward-looking statements involve risks and uncertainties in that the actual results may differ materially from those projected in the forward-looking statements. Important factors that could cause actual results to differ include risks set forth in the Risk Factors in our Annual Report on Form 10-K for the year ended December 31, 2016, as amended.2017.
Overview
Forbes Energy Services Ltd., or FES Ltd., is an independent oilfield services contractor that provides a wide range of well site services to oil and natural gas drilling and producing companies to help develop and enhance the production of oil and natural gas. These services include fluid hauling, fluid disposal, well maintenance, completion services, workovers and re-completions, plugging and abandonment, and tubing testing. Our operations are concentrated in the major onshore oil and natural gas producing regions of Texas, plus one location in Pennsylvania. We believe that our broad range of services, which extends from initial drilling, through production, to eventual abandonment, is fundamental to establishing and maintaining the flow of oil and natural gas throughout the life cycle of our customers’ wells. Our headquarters and executive offices are located at 3000 South Business Highway 281, Alice, Texas 78332. We can be reached by phone at (361) 664-0549.
As used in this Quarterly Report on Form 10-Q, the “Company,” “we,” and “our” mean FES Ltd. and its subsidiaries, except as otherwise indicated.
As discussed in Note 2 to the consolidated financial statements in Item 1, we applied fresh start accounting upon emergence from bankruptcy on the Effective Date which resulted in the Company becoming a new entity for financial reporting purposes. The effects of the Plan and the application of fresh start accounting are reflected in our condensed consolidated financial statements from and after April 13, 2017 (Successor) and the adjustments related thereto were recorded in our condensed consolidated statements of operations as reorganization items for the period April 1, 2017 to April 12, 2017 (Predecessor). References to the "Successor" pertain to the Company from and after the Effective Date. References to "Predecessor" pertain to the Company prior to the Effective Date.
We provide a wide range of services to a diverse group of companies. During the period April 13, 2017 through June 30, 2017 (Successor) and the period January 1, 2017 through April 12, 2017 (Predecessor),three months ended March 31, 2018, we provided services to approximately 303306 companies. John E. Crisp and our senior management team, have cultivated deep and ongoing relationships with these customers during their average of over 40 years of experience in the oilfield services industry. During the period April 13, 2017 through June 30, 2017three months ended March 31, 2018 (Successor) and the period January 1, 2017 through April 12, 2017 (Predecessor), we generated consolidated revenues of approximately $27.8 million and $30.8 million, respectively.$35.6 million.
We conduct our operations through the following two business segments:
Well Servicing. Our well servicing segment comprised 65.1% and 63.5%64.2% of consolidated revenues for the period April 13, 2017 through June 30, 2017 (Successor) and the period January 1, 2017 through April 12, 2017 (Predecessor), respectively.three months ended March 31, 2018. At June 30, 2017,March 31, 2018, our well servicing segment utilized our fleet of 168 well servicing rigs, which was comprised of 154 workover rigs and 14 swabbing rigs, as well as six coiled tubing spreads and other related assets and equipment. These assets are used to provide (i) well maintenance, including remedial repairs and removal and replacement of downhole production equipment, (ii) well workovers, including significant downhole repairs, re-completions and re-perforations, (iii) completion and swabbing activities, (iv) plugging and abandonment services, and (v) pressure testing of oil and natural gas production tubing and scanning tubing for pitting and wall thickness using tubing testing units.
Fluid Logistics. Our fluid logistics segment comprised 34.8% and 36.4%35.8% of consolidated revenues for the period April 13, 2017 through June 30, 2017 (Successor) and the period January 1, 2017 through April 12, 2017 (Predecessor), respectively.three months ended March 31, 2018. Our fluid logistics segment utilized our fleet of owned or leased fluid transport trucks and related assets, including specialized vacuum, high-pressure pump and tank trucks, hot oil trucks, frac tanks, fluid mixing tanks, salt water disposal wells and facilities, and related equipment. These assets are used to provide, transport, store, and dispose of a variety of drilling and produced fluids used in, and generated by, oil and natural gas production. These services are required in most workover and completion projects and are routinely used in daily operations of producing wells.
We believe that our two business segments are complementary and create synergies in terms of selling opportunities. Our multiple lines of service are designed to capitalize on our existing customer base to grow it within existing markets, generate more business from existing customers, and increase our operating performance. By offering our customers the ability to reduce the number of vendors they use, we believe that we help improve our customers’ efficiency. This is demonstrated by the fact that 54.8%, 25.4% and 68.1%56.7% of our revenues for the period April 13, 2017 through June 30, 2017 (Successor), the period April 1, 2017 through April 12, 2017 (Predecessor) and the period January 1, 2017 through April 12, 2017 (Predecessor), respectively,three months ended March 31, 2018, were from customers that utilized services of both of
our business segments. Further, by having multiple service offerings that span the life cycle of the well, we believe that we have a competitive advantage over smaller competitors offering more limited services.
Recent Events
Emergence from Chapter 11 Proceedings
On January 22, 2017, FES Ltd. and its domestic subsidiaries, or collectively, the Debtors, filed voluntary petitions, or the Bankruptcy Petitions, for reorganization under chapter 11 of the United States Bankruptcy Code, or the Bankruptcy Code, in the United States Bankruptcy Court for the Southern District of Texas-Corpus Christi Division, or the Bankruptcy Court, pursuant to the terms of a restructuring support agreement that contemplated the reorganization of the Debtors pursuant to a prepackaged plan of reorganization, as amended and supplemented, the Plan. On March 29, 2017, the Bankruptcy Court entered an order confirming the Plan. On April 13, 2017, or the Effective Date, the Plan became effective pursuant to its terms and the Debtors emerged from their chapter 11 cases. Although the Debtors are no longer debtors-in-possession, the Debtors were debtors-in-possession through April 12, 2017. As such, certain aspects of the bankruptcy proceedings of the Debtors and related matters are described below in order to provide context and explain part of the Company's financial condition and results of operations for the period presented.
Effect of the Bankruptcy Proceedings
During the bankruptcy proceedings, the Debtors conducted normal business activities and were authorized to pay certain vendor payments, wage payments and tax payments in the ordinary course. In addition, subject to certain specific exceptions under the Bankruptcy Code, the Bankruptcy Petitions automatically stayed most judicial or administrative actions against the Debtors or their property to recover, collect, or secure a prepetition claim. For example, the Bankruptcy Petitions prohibited lenders or note holders from pursuing claims for defaults under the Debtors’ debt agreements during the pendency of the chapter 11 cases.
The Plan
Under the Plan, which was approved by the Bankruptcy Court and became effective on the Effective Date,:
•FES Ltd. converted from a Texas corporation to a Delaware corporation;
•All prior equity interests (which included FES Ltd.’s prior common stock, par value $0.04 per share, or the Old Common Stock, FES Ltd.’s prior preferred stock, awards under FES Ltd.’s prior incentive compensation plans, or the Prior Compensation Plans, and the preferred stock purchase rights under the rights agreement dated as of May 19, 2008 as subsequently amended on July 8, 2013 between FES Ltd. and CIBC Mellon Trust Company, as rights agent) in FES Ltd. were extinguished without recovery;
•FES Ltd. created a new class of common stock, par value $0.01 per share, or the New Common Stock;
•Approximately $280 million in principal amount of FES Ltd.'s prior 9% senior notes due 2019, or the Prior Senior Notes, plus accrued interest of $28.1 million were canceled and each holder of the Prior Senior Notes received such holder’s pro rata share of (i) $20.0 million in cash and (ii) 100% of the New Common Stock, subject to dilution only as a result of the shares of New Common Stock issued or available for issuance in connection with a management incentive plan, or the Management Incentive Plan. A total of 5,249,997 shares of New Common Stock was issued to the holders of the Prior Senior Notes;
•The Debtors entered into the New Loan Agreement (see Note 6 - Long-Term Debt), with certain financial institutions party thereto from time to time as lenders, or the Lenders, and Wilmington Trust, National Association, as agent for the Lenders;
•FES Ltd. adopted the Management Incentive Plan, which provides for the issuance of equity-based awards with respect to, in the aggregate, up to 750,000 shares of New Common Stock;
•The Debtors’ loan and security agreement governing their revolving credit facility, or the Prior Loan Agreement, dated as of September 9, 2011 as subsequently amended, with Regions Bank, or Regions, as the sole lender party thereto, or the Lender, was terminated and a new letter of credit facility was entered into with Regions, or the New Regions Letters of Credit Facility, which covers letters of credit and certain bank product obligations. Regions continues to hold the cash pledged to support the New Regions Letters of Credit Facility in the amount of $10.1 million as of August 11, 2017;
•The Debtors paid off the outstanding principal balance of $15 million plus outstanding interest and fees under the Prior Loan Agreement, and the Prior Loan Agreement was terminated in accordance with the Plan;
•Holders of allowed creditor claims, aside from holders of the Prior Senior Notes, received, on account of such claims, either payment in full in cash or otherwise had their rights reinstated; and
•FES Ltd. entered into a registration rights agreement with certain of its stockholders to provide registration rights with respect to the New Common Stock.
Fresh Start Accounting
Upon our emergence from bankruptcy, we adopted fresh start accounting in accordance with the provisions of Accounting Standards Codification 852, “Reorganizations,” or ASC 852, as (i) the holders of Old Common Stock received none of the New Common Stock issued upon the Debtors' emergence from bankruptcy and (ii) the reorganization value of our assets immediately prior to confirmation of the Plan was less than the post-petition liabilities and allowed claims. We applied fresh start accounting from and after the Effective Date. Fresh start accounting required us to present our assets, liabilities and equity as if we were a new entity upon emergence from bankruptcy, with no beginning retained earnings or deficit as of the fresh start reporting date. The cancellation of the Old Common Stock and the issuance of the New Common Stock on the Effective Date caused a change of control under ASC 852. As a result of the adoption of fresh start accounting, our unaudited condensed consolidated financial statements from and after April 13, 2017 will not be comparable to our financial statements prior to such date. References to “Successor” or “Successor Company” relate to our financial position and results of operations from and after April 13, 2017. References to “Predecessor” or “Predecessor Company” relate to our financial position and results of operations prior to April 12, 2017.
Factors Affecting Results of Operations
Market Conditions
The oil and natural gas industry has experienced a significant decline in oil exploration and production activity that began in the fourth quarter of 2014 and continued through 2016 and into the first few monthshalf of 2017. The price of West Texas Intermediate or WTI,(“WTI”) oil fell from a price of $106$104 per barrel as of June 30, 2014 to a low of approximately $26$30 per barrel onin February 11,of 2016. Since then,Oil prices traded in a range of approximately $45 to $55 in the last half of 2016 and through most of 2017. During the last half of 2017 oil prices trended upward in response to market conditions, and as of March 31, 2018, the price of WTI was approximately $65 per barrel. As oil has experiencedprices began to rise, U.S. drilling rig count increased by 586 from May 2016 to March 2018, with the count stabilizing in the last half of 2017 then experiencing a modest recovery and settled into a trading range of roughly $42 to $54 per barrel duringincrease in the secondfirst quarter of 2017. On June 30, 2017, the price of WTI oil closed at approximately $46 per barrel. In response to this decrease in WTI oil prices, exploration and production companies decreased the number of U.S. drilling rigs from a peak high of 1,873 operating as of June 30, 2014, to 940 as of June 30, 2017, a decrease of 50%.2018. During this same time period the Texas drilling rig count droppedincreased by 317 rigs, similar to the U.S. count increases. The two basins in which we operate, the Eagle Ford and Permian, had rig count increases of 79 and 235, respectively, from an average monthly high48 and 120. Of note, while we are actively pursuing additional business in the Permian, currently 79.9% of 903our revenues are generated in November of 2014 to an average of 460 in June of 2017, a decrease of 49%.the Eagle Ford where the rig count increased by 79.
Below are three charts that provide total U.S. rig counts, total Texas rig counts and WTI oil price trends for the twelve months ended June 30, 2017March 31, 2018 and 2016.2017.
Source: Rig counts are per Baker Hughes, Inc. (www.bakerhughes.com). Rig counts are the averages of the weekly rig count activity.
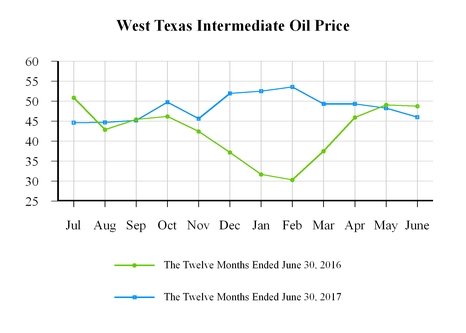
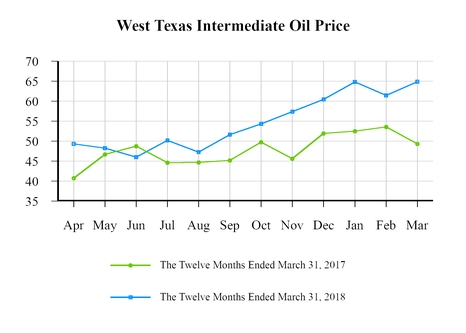
The declines in oil and natural gas prices and exploration activities, that began in 2014 and continued through 2016 and into the first few months of 2017, created a more challenging market for the provision of our services. In response to these market conditions, we implemented cost reduction measures and continued to analyze cost reduction opportunities while ensuring that appropriate functions and capacity were preserved allowing us to be opportunistic as market conditions improved in the second quarter of 2017. Through the first quarter of 2017, capital spending was largely limited to capital commitments incurred before the market downturn, purchases of certain, limited pieces of equipment with greater operating efficiencies to improve margins, and the purchase of certain equipment under operating leases at the end of their term. In the last part of 2017 and the current quarter, we began maintenance capital spending in response to increased demand for our services.
In May 2016, Texas drilling rig count reached a low point with an average of 178 rigs for the month then rose to an average of 460 for the month of June 2017. There were 368, 40, and 84 rigs located in the Permian, Haynesville, and Eagle Ford, respectively. Consolidated revenues for the three months ending June 30, 2017 were $6.3 million, $1.5 million and $20.0 million for West, East and South Texas, respectively.
The second key metric, other than volume of work, that impacts profitability is pricing. In 2015 and 2016, price concessions were granted to customers in recognition of the oil and natural gas pricing declines. Since the oil and natural gas price environment began to improve, price increases have been requested and received from customers in certain operating areas.
Oil and Natural Gas Prices
Demand for well servicing and fluid logistics services is generally a function of the willingness of oil and natural gas companies to make operating and capital expenditures to explore for, develop and produce oil and natural gas, which in turn is affected by current and anticipated levels of oil and natural gas prices. Exploration and production spending is generally categorized as either operating expenditures or capital expenditures. Activities by oil and natural gas companies designed to add oil and natural gas reserves are classified as capital expenditures, and those associated with maintaining or accelerating production, such as workover and fluid logistics services, are categorized as operating expenditures. Operating expenditures are typically more stable than capital expenditures and are less sensitive to oil and natural gas price volatility. However, induring the current market environmentbottom of the downturn our customers arewere even limiting these expenditures. In contrast, capital expenditures by oil and natural gas companies for drilling are more directly influenced by current and expected oil and natural gas prices and generally reflect the volatility of commodity prices including the precipitous decline in oil and natural gas prices that began in late 2014 with only a recent modest increase in the price of oil.
Workover Rig Rates
Our well servicing segment revenues are dependent on the prevailing market rates for workover rigs. Utilization and average rates increased through 2017,while average rates decreasedthe first quarter 2018 (Successor), compared to 2016.
the same period in 2017 (Predecessor).
Fluid Logistics Rates
Our fluid logistics segment revenues are dependent on the prevailing market rates for fluid transport trucks and the related assets, including specialized vacuum, high-pressure pump and tank trucks, hot oil trucks, frac tanks, fluid mixing tanks and salt water disposal wells. Pricing and utilization decreased through 2016 and continued through the first quarter of 2017. During the later part of the second quarter of 2017 we began to see improvements in both utilization and pricing. These improvements have continued through the first quarter of 2018.
Operating Expenses
During the secondfirst quarter of 2017,2018 (Successor), consolidated operating expenses decreasedincreased when compared to the same period in 2016.2017 (Predecessor) consistent with our increased activity. Future earnings and cash flows will be dependent on our ability to manage our overall cost structure as well as continued efforts to maintain or increase rates to customers.
Capital Expenditures
During the secondfirst quarter of 2017,2018, capital expenditures primarily consisted of purchases of equipment and vehicles whose operating leases had reached the end of their term, major equipment overhauls and equipment refurbishments.replacements of heavy trucks.
Results of Operations
Three Months Ended June 30, 2017March 31, 2018 (Successor) Compared to Three Months Ended June 30, 2016March 31, 2017 (Predecessor)
The following tables compare our segment operating results for the period April 13, 2017 through June 30, 2017three months ended March 31, 2018 (Successor), the period April 1, 2017 through April 12, 2017 (Predecessor), and the three months ended June 30, 2016March 31, 2017 (Predecessor) (in thousands, except percentages). Operating expenses exclude general and administrative expenses, depreciation, and amortization.
|
| | | | | | | | | | | | | | | | | | | | | |
| Revenues |
| | Successor | | | | Predecessor |
| | April 13 through June 30, 2017 | % of total revenue | | | | April 1 through April 12, 2017 | % of revenue | | Three months ended June 30, 2016 | | % of total revenue |
| Well Servicing | $ | 18,139 |
| 65.1 | % | | | | $ | 2,449 |
| 65.9 | % | | $ | 16,796 |
| | 59.1 | % |
| Fluid Logistics | 9,711 |
| 34.8 | % | | | | 1,269 |
| 34.1 | % | | 11,615 |
| | 40.9 | % |
| Total | $ | 27,850 |
| | | | | $ | 3,718 |
| | | $ | 28,411 |
| | |
| | | | | | | | | | | | |
| | | | | | | | | | | | |
Operating Expenses (1) |
| | Successor | | | | Predecessor |
| | April 13 through June 30, 2017 | % of segment revenue | | | | April 1 through April 12, 2017 | % of segment revenue | | Three months ended June 30, 2016 | | % of segment revenue |
| Well Servicing | $ | 13,814 |
| 76.2 | % | | | | $ | 1,813 |
| 74.0 | % | | $ | 15,668 |
| | 93.3 | % |
| Fluid Logistics | 9,053 |
| 93.2 | % | | | | 1,260 |
| 99.3 | % | | 10,931 |
| (2 | ) | 94.1 | % |
| Total | $ | 22,867 |
| | | | | $ | 3,073 |
| | | $ | 26,599 |
| | |
| | Segment Profit (1) | |
| Revenues | | Revenues |
| | | Successor | | | Predecessor |
| | Successor | | | | Predecessor | Three months ended March 31, 2018 | % of total revenue | | | Three months ended March 31, 2017 | % of total revenue |
| | April 13 through June 30, 2017 | Gross margin % | | | | April 1 through April 12, 2017 | Gross margin % | | Three months ended June 30, 2016 | | Gross margin % | (in thousands, except percentages) | | | (in thousands, except percentages) |
| Well Servicing | $ | 4,325 |
| 23.8 | % | | | | $ | 636 |
| 26.0 | % | | $ | 1,128 |
| | 6.7 | % | $ | 22,857 |
| 64.2 | % | | | $ | 17,105 |
| 63.2 | % |
| Fluid Logistics | 658 |
| 6.8 | % | | | | 9 |
| 0.7 | % | | 684 |
| (2) | 5.9 | % | 12,735 |
| 35.8 | % | | | 9,942 |
| 36.8 | % |
| Total | $ | 4,983 |
| 17.9 | % | | | | $ | 645 |
| 17.3 | % | | $ | 1,812 |
| | 6.4 | % | $ | 35,592 |
| | | | $ | 27,047 |
| |
| | | | | | | |
Operating Expenses (1) | | Operating Expenses (1) |
| | | Successor | | | Predecessor |
| | | Three months ended March 31, 2018 | % of segment revenue | | | Three months ended March 31, 2017 | % of segment revenue |
| | | (in thousands, except percentages) | | | (in thousands, except percentages) |
| Well Servicing | | $ | 19,017 |
| 83.2 | % | | | $ | 14,140 |
| 82.7 | % |
| Fluid Logistics | | 10,689 |
| 83.9 | % | | | 9,948 |
| 100.1 | % |
| Total | | $ | 29,706 |
| | | | $ | 24,088 |
| |
|
| | | | | | | | | | | | |
Segment Profit (1) |
| | Successor | | | Predecessor |
| | Three months ended March 31, 2018 | Gross margin % | | | Three months ended March 31, 2017 | Gross margin % |
| | (in thousands, except percentages) | | | (in thousands, except percentages) |
| Well Servicing | $ | 3,840 |
| 16.8 | % | | | $ | 2,965 |
| 17.3 | % |
| Fluid Logistics | 2,046 |
| 16.1 | % | | | (6 | ) | (0.1 | )% |
| Total | $ | 5,886 |
| 16.5 | % | | | $ | 2,959 |
| 10.9 | % |
(1) Excluding general and administrative expenses, and depreciation and amortization, and impairment of assets.
(2) Excluding impairment of assets of $14.5 million.amortization.
Revenues
Consolidated Revenues. Consolidated revenues during the periods of April 13, 2017 through June 30, 2017three months ended March 31, 2018 (Successor) and April 1, 2017 through April 12, 2017 (Predecessor) increased as compared to the three months ended June 30, 2016March 31, 2017 (Predecessor) primarily due to an increase in revenuesincreased activity from both our well servicing segment and the general industry upturn.fluid logistics customers as they increased activity in response to rising oil prices.
Well Servicing. The revenues from the well servicing segment during the periods of April 13, 2017 through June 30, 2017three months ended March 31, 2018 (Successor) and April 1, 2017 through April 12, 2017 (Predecessor) increased as compared to the three months ended June 30, 2016March 31, 2017 (Predecessor) due to an 18.2% increase in rates and a 27.7%13.0% increase in hours worked, offset in part by a 4.0% decrease in rates.worked.
Fluid Logistics. Our revenues from the fluid logistics segment during the periods of April 13, 2017 through June 30, 2017three months ended March 31, 2018 (Successor) and April 1, 2017 through April 12, 2017 (Predecessor) decreasedincreased as compared to the three months ended June 30, 2016March 31, 2017 (Predecessor) due to a 10.1% decrease34.0% increase in rates and an 8.8% increase in trucking hours coupled with a modest average price reduction.driven by tank rental and skim oil also contributed to the increase. Our principal fluid logistics assets at June 30,March 31, 2018 and 2017 and 2016 were as follows:
| | | | June 30, | Successor | | Predecessor |
| | 2017 Successor | | 2016 Predecessor | March 31, 2018 | | | March 31, 2017 |
| Fluid Logistics segment: | | | | | | | |
| Vacuum trucks | 293 |
| | 447 |
| 258 |
| | | 365 |
|
| Other heavy trucks | 106 |
| | 109 |
| 109 |
| | | 103 |
|
| Frac tanks | 2,876 |
| | 3,045 |
| 2,868 |
| | | 2,895 |
|
Salt water disposal wells (1) | 19 |
| | 22 |
| 15 |
| | | 20 |
|
(1) At June 30, 2017, 15March 31, 2018, 10 salt water disposal wells, included in the above well count, were subject to ground leases or other operating arrangements towith third parties.
Operating Expenses
| | | | | | | | | | Successor | | | Predecessor |
| | Successor | | | Predecessor | Three months ended March 31, 2018 | | | Three months ended March 31, 2017 |
| | April 13 through June 30, 2017 | | | April 1 through April 12, 2017 | | Three months ended June 30, 2016 | (in thousands) | | | (in thousands) |
| Well servicing | $ | 13,814 |
| | | $ | 1,813 |
| | $ | 15,668 |
| $ | 19,017 |
| | | $ | 14,140 |
|
| Fluid logistics | 9,053 |
| | | 1,260 |
| | 10,931 |
| 10,689 |
| | | 9,948 |
|
| General and administrative | 3,130 |
| | | 500 |
| | 5,420 |
| 4,888 |
| | | 4,512 |
|
| Depreciation and amortization | 5,681 |
| | | 1,533 |
| | 13,670 |
| 7,163 |
| | | 12,068 |
|
| Impairment of assets | — |
| | | — |
| | 14,512 |
| |
| Total expenses | $ | 31,678 |
| | | $ | 5,106 |
| | $ | 60,201 |
| $ | 41,757 |
| | | $ | 40,668 |
|
Consolidated Operating Expenses. Direct operating costs for the periods of April 13, 2017 through June 30, 2017three months ended March 31, 2018 (Successor) and April 1, 2017 through April 12, 2017 (Predecessor) were comparableincreased as compared to the three months ended June 30, 2016March 31, 2017 (Predecessor)., consistent with our increased activity.
Well Servicing. Direct operating costs for our well servicing segment for the periods of April 13, 2017 through June 30, 2017three months ended March 31, 2018 (Successor) and April 1, 2017 through April 12, 2017 (Predecessor) was consistent withincreased as compared to the three months ended June 30, 2016March 31, 2017 (Predecessor). The three months ended June 30, 2017 benefitedThis increase was primarily attributable to higher labor, fuel costs, and repairs and maintenance expenses resulting from a decrease in insurance expense and bad debts expense as business improved in the later partcoiled tubing division of our well servicing segment preparing to deploy additional equipment. Other costs were consistent with the second quarter.increased activity experienced during the period.
Fluid Logistics. Direct operating costs for our fluid logistics segment for the periods of April 13, 2017 through June 30, 2017three months ended March 31, 2018 (Successor) and April 1, 2017 through April 12, 2017 (Predecessor) were comparableincreased as compared to the same periodthree months ended in the prior year.March 31, 2017 (Predecessor), consistent with increased activity. Fluid logistics costs as a percentage of fluid logistics revenue were 93.2%, 99.3% and 93.9%83.9% for the periods April 13 through June 30, 2017 (Successor), April 1 through April 12, 2017 (Predecessor) and the three months ended June 30, 2016March 31, 2018 (Successor) compared to 100.1% for the three months ended March 31, 2017 (Predecessor), respectively.. This percentage decrease was primarily a result of reduced labor costs as a percentage of revenue due to higher composite customer rates and improved utilization and efficiencies of our work force with additional activity. Insurance and property taxes expenses also declined, consistent with normal variations between quarters.
General and Administrative Expenses. General and administrative expenses as a percentage of revenues were 11.2%, 13.4% and 19.1% for the period April 13, 2017 through June 30, 2017 (Successor), the period April 1 through April 12, 2017 and the three months ended June 30, 2016 (Predecessor), respectively. General and administrative expenses for the periods April 1, 2017 through April 12, 2017 (Predecessor) and April 13, 2017 through June 30, 2017March 31, 2018 (Successor) decreasedincreased as compared to the three months ended June 30, 2016March 31, 2017 (Predecessor). General and administrative expenses as a percentage of revenues were 13.7% and 16.7% for the three months ended March 31, 2018 (Successor) and the three months ended March 31, 2017 (Predecessor), respectively. This decrease as a percentage of revenue is primarily due to a reduction in compensation, insurance and entertainment expenses.increased revenues as described above.
Depreciation and Amortization. Depreciation and amortization expenses for the period of April 13, 2017 through June 30, 2017three months ended March 31, 2018 (Successor) decreased as compared to the period of April 1, 2017 through April 12, 2017 (Predecessor) and the three months ended June 30, 2016March 31, 2017 (Predecessor) due to a decrease in the depreciable value of property and equipment as a result of fresh start accounting.
Other Income (Expense)
|
| | | | | | | | | | | | |
| | Successor | | | Predecessor |
| | April 13 through June 30, 2017 | | | April 1 through April 12, 2017 | | Three months ended June 30, 2016 |
| Interest income | $ | 6 |
| | | $ | — |
| | $ | 7 |
|
| Interest expense | (1,897 | ) | | | (40 | ) | | (6,912 | ) |
| Gain (loss) on reorganization items, net | (1,299 | ) | | | 51,090 |
| | — |
|
| Other Income (Expense), net | $ | (3,190 | ) | | | $ | 51,050 |
| | $ | (6,905 | ) |
| | | | | | | |
| Income tax benefit | $ | (17 | ) | | | $ | (4 | ) | | $ | (9 | ) |
|
| | | | | | | | |
| | Successor | | | Predecessor |
| | Three months ended March 31, 2018 | | | Three months ended March 31, 2017 |
| | (in thousands) | | | (in thousands) |
| Interest income | $ | 2 |
| | | $ | 13 |
|
| Interest expense | (2,367 | ) | | | (2,214 | ) |
| Loss on reorganization items, net | — |
| | | (6,587 | ) |
| Other income (expense), net | $ | (2,365 | ) | | | $ | (8,788 | ) |
| | | | | |
| Income tax expense | $ | 17 |
| | | $ | 31 |
|
Interest Expense. Interest expense for the periods of April 13, 2017 through June 30, 2017three months ended March 31, 2018 (Successor) and April 1, 2017 through April 12, 2017 (Predecessor) decreasedwas consistent as compared to the three months ended June 30, 2016 (Predecessor) primarily due to a reduction in interest expense on the Prior Senior Notes because such interest was no longer accrued after the date of Bankruptcy Petitions. Interest expense on the Successor is primarily related to the debt outstanding under the New Loan Agreement and associated amortization of deferred financing costs.
Gain (loss) on reorganization items, net. Gain (loss) on reorganization items, net was $(1.3) million for the period April 13, 2017 through June 30, 2017 (Successor) and $51.1 million for the period April 1, 2017 through April 12,March 31, 2017 (Predecessor). There were no reorganization costs for the same period in the prior year. For the Predecessor period, the $51.1 million gain was generated by the settlement of liabilities subject to compromise of $140.4 million offset by fresh start and reorganization adjustments of $87.1 million and professional and legal fees of $2.2 million.
Income Taxes. We recognized income tax benefit of less than $0.1 million for each of the periods of April 13, 2017 through June 30, 2017 (Successor), the period of April 1, 2017 through April 12, 2017 (Predecessor) and the three months ended June 30, 2016 (Predecessor). Our effective tax rate was 0.24%, (0.01)% and 0.02% for the period April 13, 2017 through June 30, 2017 (Successor), April 1, 2017 through April 12, 2017 (Predecessor), and the three months ended June 30, 2016 (Predecessor), respectively. We have evaluated the impact of the reorganization on our carryover tax attributes and believe we will not incur an immediate cash income tax liability as a result of emergence from bankruptcy. We will be able to fully absorb cancellation of debt income with net operating losses, or NOL, carryforwards, and as a result, our NOL carryforwards will be significantly reduced. The amount of remaining NOL carryforwards available after cancellation of debt income will be limited under Internal Revenue Code Section 382, or IRC Sec. 382, due to the change in control in connection with the reorganization. We determined that it is not more likely than not that we will realize deferred tax assets and accordingly have taken a full valuation allowance to offset our deferred tax assets as of June 30, 2017.
Six Months Ended June 30, 2017 Compared to Six Months Ended June 30, 2016
The following tables compare the operating results of our segments for the periods April 13, 2017 through June 30, 2017 (Successor), January 1, 2017 through April 12, 2017 (Predecessor) and the six months ended June 30, 2016 (Predecessor) (in thousands, except percentages). Operating expenses exclude general and administrative expenses, depreciation and amortization and impairment.
|
| | | | | | | | | | | | | | | | | | | | |
| Revenues |
| | Successor | | | | Predecessor |
| | April 13 through June 30, 2017 | % of revenue | | | | January 1 through April 12, 2017 | % of revenue | | Six months ended June 30, 2016 | | % of revenue |
| Well Servicing | $ | 18,139 |
| 65.1 | % | | | | $ | 19,554 |
| 63.5 | % | | $ | 35,509 |
| | 58.8 | % |
| Fluid Logistics | 9,711 |
| 34.8 | % | | | | 11,211 |
| 36.4 | % | | 24,833 |
| | 41.2 | % |
| Total | $ | 27,850 |
| | | | | $ | 30,765 |
| | | $ | 60,342 |
| | |
| | | | | | | | | | | | |
| | | | | | | | | | | | |
Operating Expenses(1) |
| | Successor | | | | Predecessor |
| | April 13 through June 30, 2017 | % of segment revenue | | | | January 1 through April 12, 2017 | % of segment revenue | | Six months ended June 30, 2016 | | % of segment revenue |
| Well Servicing | $ | 13,814 |
| 76.2 | % | | | | $ | 15,952 |
| 81.6 | % | | $ | 32,388 |
| | 91.2 | % |
| Fluid Logistics | 9,053 |
| 93.2 | % | | | �� | 11,207 |
| 100.0 | % | | 24,092 |
| (2) | 97.0 | % |
| Total | $ | 22,867 |
| | | | | $ | 27,159 |
| | | $ | 56,480 |
| | |
|
| | | | | | | | | | | | | | | | | | | | |
Segment Profit (1) |
| | Successor | | | | Predecessor |
| | April 13 through June 30, 2017 | Gross margin % | | | | January 1 through April 12, 2017 | Gross margin % | | Six months ended June 30, 2016 | | Gross margin % |
| Well Servicing | $ | 4,325 |
| 23.8 | % | | | | $ | 3,602 |
| 18.4 | % | | 3,121 |
| | 8.8 | % |
| Fluid Logistics | 658 |
| 6.8 | % | | | | 4 |
| — | % | | 741 |
| (2) | 3.0 | % |
| Total | $ | 4,983 |
| 17.9 | % | | | | $ | 3,606 |
| 11.7 | % | | $ | 3,862 |
| | 6.4 | % |
(1) Excluding general and administrative expenses, depreciation and amortization, and impairment of assets.
(2) Excluding impairment of assets of $14.5 million.
Revenues
Consolidated Revenues. Consolidated revenues during the periods of April 13, 2017 through June 30, 2017 (Successor) and January 1, 2017 through April 12, 2017 (Predecessor) decreased as compared to the six months ended June 30, 2016 (Predecessor) primarily due to competitive pricing pressures in our fluid logistics business.
Well Servicing. Revenues from our well servicing segment during the periods of April 13, 2017 through June 30, 2017 (Successor) and January 1, 2017 through April 12, 2017 (Predecessor) increased as compared to the six months ended June 30, 2016 (Predecessor) due to a 26.2% increase in hours, offset in part by a 15.9% decrease in rates.
Fluid Logistics. Revenues from our fluid logistics segment during the periods of April 13, 2017 through June 30, 2017 (Successor) and January 1, 2017 through April 12, 2017 (Predecessor) decreased as compared to the six months ended June 30, 2016 (Predecessor) driven by a decrease in rental income and a 10.9% decrease in hours.
Operating Expenses
|
| | | | | | | | | | | | |
| | Successor | | | Predecessor |
| | April 13 through June 30, 2017 | | | January 1 through April 12, 2017 | | Six months ended June 30, 2016 |
| Well servicing | $ | 13,814 |
| | | $ | 15,952 |
| | $ | 32,388 |
|
| Fluid logistics | 9,053 |
| | | 11,207 |
| | 24,092 |
|
| General and administrative | 3,130 |
| | | 5,012 |
| | 11,476 |
|
| Depreciation and amortization | 5,681 |
| | | 13,601 |
| | 27,159 |
|
| Loss on impairment of assets | — |
| | | — |
| | 14,512 |
|
| Total expenses | $ | 31,678 |
| | | $ | 45,772 |
| | $ | 109,627 |
|
Consolidated Operating Expenses. Direct operating expenses for the periods of April 13, 2017 through June 30, 2017 (Successor) and January 1, 2017 through April 12, 2017 (Predecessor) decreased as compared to the six months ended June 30, 2016 (Predecessor) due to decreases in certain expense in both our well servicing and fluid logistics segments.
Well Servicing. Direct operating costs for our well servicing segment for the periods of April 13, 2017 through June 30, 2017 (Successor) and January 1, 2017 through April 12, 2017 (Predecessor) decreased as compared to the six months ended June 30, 2016 (Predecessor) due to a decrease in insurance expense and bad debts as business improved in the later part of the second quarter. In addition, operating lease expense decreased between the two quarters as certain leases reached the end of their terms.
Fluid Logistics. Direct operating costs for our fluid logistics segment for the periods of April 13, 2017 through June 30, 2017 (Successor) and January 1, 2017 through April 12, 2017 (Predecessor) decreased as compared to the six months ended June 30, 2016 (Predecessor) due to gain on sales of assets in the Predecessor period and decreases in operating lease expense and insurance costs. Fluid logistics costs as a percentage of fluid logistics revenue were 93.2%, 100% and 96.8% for the periods April 13 through June 30, 2017 (Successor), January 1 through April 12, 2017 (Predecessor) and the six months ended June 30, 2016 (Predecessor), respectively.
General and Administrative Expenses. General and administrative expenses as a percentage of revenues were 11.2%, 16.3% and 19.0% for the period April 13, 2017 through June 30, 2017 (Successor), the period January 1, 2017 through April 12, 2017 (Predecessor), and thesix months ended June 30, 2016 (Predecessor), respectively. General and administrative expenses for the periods of April 13, 2017 through June 30, 2017 (Successor) and January 1, 2017 through April 12, 2017 (Predecessor) decreased as compared to the six months ended June 30, 2016 (Predecessor) due to a decrease in compensation, insurance and entertainment expenses.
Depreciation and Amortization. Depreciation and amortization expenses for the period of April 13, 2017 through June 30, 2017 (Successor) decreased as compared to the period of January 1, 2017 through April 12, 2017 (Predecessor) and the six months ended June 30, 2016 (Predecessor) due to a decrease in the depreciable value of property and equipment as a result of fresh start accounting.
Other Income (Expense)
|
| | | | | | | | | | | | |
| | Successor | | | Predecessor |
| | April 13 through June 30, 2017 | | | January 1 through April 12, 2017 | | Six months ended June 30, 2016 |
| Interest income | $ | 6 |
| | | $ | 13 |
| | $ | 29 |
|
| Interest expense | (1,897 | ) | | | (2,254 | ) | | (13,858 | ) |
| Gain (loss) on reorganization items, net | (1,299 | ) | | | 44,503 |
| | — |
|
| Other income (expense), net | $ | (3,190 | ) | | | $ | 42,262 |
| | $ | (13,829 | ) |
| | | | | | | |
| Income tax expense (benefit) | $ | (17 | ) | | | $ | 27 |
| | $ | 40 |
|
Interest Expense. Interest expense for the periods of April 13, 2017 through June 30, 2017 (Successor) and January 1, 2017 through April 12, 2017 (Predecessor) decreased as comparedthree months ended March 31, 2018 primarily
related to interest on our New Loan Agreement which is subject to higher interest rates than than our Prior Senior Notes. Compared to the sixthree months ended June 30, 2016 (Predecessor) due to a reduction inMarch 31, 2017 (Successor), the higher interest rates on our New Loan Agreement are offset by reduced interest expense on the Prior Senior Notes during the first quarter of 2017, because suchas interest was no longer incurred after the date of Bankruptcy Petitions as it was discharged in the chapter 11 cases. Interest expense on the Successor is primarily related to the debt outstanding under the New Loan Agreement and associated amortization of deferred financing costs.case.
Gain (loss)Loss on reorganization items, net. Gain (loss) on reorganization items, net was $(1.3) million for the period April 13, 2017 through June 30, 2017 (Successor) and $44.5 million for the period January 1, 2017 through April 12, 2017 (Predecessor). There were no reorganization costs for the same period inthree months ended March 31, 2018 (Successor). Reorganization costs for the prior year. Forthree months ended March 31, 2017 (Predecessor) were $6.6 million. These costs were related to bankruptcy activities during the Predecessor period, the $44.5 million gain was generated by the settlement of liabilities subject to compromise of $140.4 million offset by the fresh start and reorganization adjustments of $87.1 million and legal, professional fess and loan costs of $8.8 million.period.
Income Taxes. We recognized an income tax benefit of less than $0.1 million for the period April 13, 2017 through June 30, 2017 (Successor), and income tax expense of less than $0.1$0.1 million for the period January 1, 2017 through April 12, 2017 (Predecessor) and income tax expenseeach of less than $0.1 million for the sixthree months ended June 30, 2016March 31, 2018 (Successor) and the three months ended March 31, 2017 (Predecessor). Our effective tax rate was 0.24%, 0.1%(0.2)% and (0.1)% for the three months ended March 31, 2018 (Successor)and the period April 13, 2017 through June 30, 2017 (Successor), the period January 1, 2017 through April 12,three months ended March 31, 2017 (Predecessor), andrespectively, due to the six months ended June 30, 2016 (Predecessor). We have evaluatedfact that the impact ofCompany has recorded a full valuation allowance against its net deferred assets. At March 31, 2018 (Successor), we estimate our NOL carryforwards were approximately $52.0 million. On December 22, 2017, the reorganization on our carryoverTax Reform Act was signed into law. The legislation significantly changed U.S. tax attributes and believe we will not incur an immediate cashlaw by, among other things, lowering the U.S. corporate income tax liability asrate from a maximum of 35% to a flat 21% rate, effective January 1, 2018. As a result of emergence from bankruptcy. We will be able to fully absorb cancellation of debtthe decrease in the corporate income with NOL carryforwards, and as a result,tax rate, we revalued our NOL carryforwards will be significantly reduced. The amount of remaining NOL carryforwards available after the cancellation of debtending net deferred tax assets at December 31, 2017, but did not recognize any income will be limited under IRC Sec. 382tax impact in 2017 due to the offsetting change in control in connection with the reorganization.valuation allowance.
“Adjusted EBITDA” is defined as income (loss) from continuing operations before interest, taxes, depreciation, amortization, gain or loss on early extinguishment of debt and non-cash stock based compensation, excluding non-recurring items. Management does not include gain (loss) on extinguishment of debt, non-cash stock based compensation or other nonrecurring items in its calculations of Adjusted EBITDA, because it believes that such amounts are not representative of our core operations. Further, management believes that most investors exclude gain (loss) on extinguishment of debt, stock based compensation recorded under FASB ASC Topic 718 and other nonrecurring items from customary EBITDA calculations as those items are often viewed as either non-recurring and not reflective of ongoing financial performance or have no cash impact on operations.
Adjusted EBITDA is a non-GAAP financial measure that is used as a supplemental financial measure by our management and directors and by our investors to assess the financial performance of our assets without regard to financing methods, capital structure or historical cost basis; the ability of our assets to generate cash sufficient to pay interest on our indebtedness; and our operating performance and return on invested capital as compared to those of other companies in the well services industry, without regard to financing methods and capital structure. We use adjusted EBITDA in other filings with the Commission.
Adjusted EBITDA has limitations as an analytical tool and should not be considered an alternative to net income, operating income, cash flow from operating activities or any other measure of financial performance or liquidity presented in accordance with GAAP. Adjusted EBITDA excludes some, but not all, items that affect net income and operating income and these measures may vary among other companies. Limitations to using Adjusted EBITDA as an analytical tool include:
|
| |
| |
| • | Adjusted EBITDA does not reflect our current or future requirements for capital expenditures or capital commitments; |
| |
| • | Adjusted EBITDA does not reflect changes in, or cash requirements necessary to service interest or principal payments on our debt; |
| |
| • | Adjusted EBITDA does not reflect income taxes; |
| |
| • | Although depreciation and amortization are non-cash charges, the assets being depreciated and amortized will often have to be replaced in the future, and Adjusted EBITDA does not reflect any cash requirements for such replacements; and |
| |
| • | Other companies in our industry may calculate Adjusted EBITDA differently than we do, limiting its usefulness as a comparative measure. |
|
| | | | | | | | | |
| Reconciliation of Adjusted EBITDA to Net Loss |
| (Unaudited) |
| | | | | | |
| | | Successor | | | Predecessor |
| | | Three months ended March 31, 2018 | | | Three months ended March 31, 2017 |
| | | (in thousands) | | | (in thousands) |
| Net Loss | | $ | (8,547 | ) | | | $ | (22,440 | ) |
| Interest income | | (2 | ) | | | (13 | ) |
| Interest expense | | 2,367 |
| | | 2,214 |
|
| Taxes | | 17 |
| | | 31 |
|
| Depreciation | | 6,870 |
| | | 11,930 |
|
| Amortization | | 280 |
| | | 135 |
|
| Accretion | | 13 |
| | | 3 |
|
| Share-based compensation | | 250 |
| | | — |
|
| Mergers and acquisitions expenses | | 192 |
| | | — |
|
| Restructuring expenses | | 188 |
| | | 6,587 |
|
| Litigation/settlements | | 69 |
| | | 339 |
|
| Adjusted EBITDA | | $ | 1,697 |
| | | $ | (1,214 | ) |
Liquidity and Capital Resources
Historically, we have funded our operations, including capital expenditures, through our cash flow from operations, the revolving credit facility under the Prior Loan Agreement, vendor financings, cash flow from operations, the issuance of senior notes and the proceeds from our public and private equity offerings.
As of June 30, 2017,March 31, 2018 (Successor), we had $16.1$7.6 million in unrestricted cash and cash equivalents and $47.9$57.5 million in contractual debt.
Restricted cash at June 30, 2017 and DecemberMarch 31, 2016 is $34.0 million and $27.6 million, respectively.2018 (Successor) was $25.6 million. The components of restricted cash at June 30, 2017March 31, 2018 included $23.9$16.9 million related to the New Loan Agreement which is subject to satisfaction of certain release restrictions and $10.1$8.7 million in a cash collateral account related to letters of credit and our corporate credit card program under the New Regions Letter of Credit Facility. The release conditions set forth in the New Loan Agreement include, among other things, (i) no default or event of default under the New Loan Agreement having occurred or being continuing as of the date of the requested release of proceeds of the New Loan Agreement, or that would exist after giving effect to the release requested to be made on such date, and (ii) our unrestricted cash and cash equivalents being less than $7$7.0 million after giving pro forma effect to the requested release.
The $47.9$57.5 million in contractual debt was comprised of $46.2$48.3 million for the New Loan Agreement net of debt issuance costs, $0.7$3.4 million in insurance notes and $1.0$5.9 million in equipment notes. Of our total debt, $1.5$5.1 million was short-term debt outstanding oron the current portion of long-term debt and $46.4$52.4 million of the outstanding contractual debt was classified as
long-term debt. We incurred $1.0 million, and $0.4 million for capital equipment acquisitions during the period April 13, 2017 through June 30, 2017 (Successor) and the period January 1, 2017 through April 12, 2017 (Predecessor), respectively.
New Loan Agreement and Prior Loan Agreement
Forbes Energy Services LLC, or the Borrower, is the borrower under the New Loan Agreement. The Borrower’s obligations have been guaranteed by the FES Ltd. and by Texas Energy Services, LLC, C.C. Forbes, LLC and Forbes Energy International, LLC, each direct subsidiaries of the Borrower and indirect subsidiaries of FES Ltd. The New Loan Agreement provides for a term loan of $50.0 million, which was fully funded on the Effective Date. Subject to certain exceptions and permitted encumbrances, the obligations under this loan are secured by a first priority security interest in substantially all the assets of the Company other than cash collateralizing the New Regions Letters of Credit Facility. Such term loan has a stated maturity date of April 13, 2021. The proceeds of such term loan are only permitted to be used for (i) the payment on account of the Prior Senior Notes in an amount equal to $20.0 million; (ii) the payment of costs, expenses and fees incurred on or prior to the Effective Date in connection with the preparation, negotiation, execution and delivery of the New Loan Agreement and documents related thereto; and (iii) subject to satisfaction of certain release conditions set forth in the New Loan Agreement, for general operating, working capital and other general corporate purposes of the Borrower not otherwise prohibited by the terms of the New Loan Agreement. The release conditions set forth in the New Loan Agreement include, among other things, (i) no default or event of default under the New Loan Agreement having occurred or being continuing as of the date of the requested release of proceeds of the New Loan Agreement, or that would exist after giving effect to the release requested to be made on such date, and (ii) the Company’s unrestricted cash and cash equivalents being less than $7$7.0 million after giving pro forma effect to the requested release. At June 30, 2017, $23.9March 31, 2018, $16.9 million included in restricted cash was subject to these release restrictions.
Borrowings under this term loan bear interest at a rate equal to five percent (5%) per annum payable quarterly in cash, or the Cash Interest Rate, plus (ii) an initial rate for paid in kind interest of seven percent (7%) commencing April 13, 2017 to be capitalized and added to the principal amount of the term loan on the first day of each quarter, or at the election of the Borrower, paid in cash. The paid in kind interest increases by two percent (2%) twelve months after the Effective Date and every twelve months thereafter until maturity. Upon and after the occurrence of an event of default, the Cash Interest Rate will increase by two percentage points per annum. At March 31, 2018, the applicable interest rate was 12% per annum.
The Borrower is also responsible for certain other administrative fees and expenses. In connection with the execution of the New Loan Agreement, the Borrower paid the Lenders a funding fee of $3.0 million, and paid certain Lenders a backstop fee of $2.0 million. The $20.0 million payment referred to above and these fees were funded as draws under the New Loan Agreement.
We are able to voluntarily repay the outstanding term loan at any time without premium or penalty. We are required to use the net proceeds from certain events, including but not limited to, the disposition of assets, certain judgments, indemnity payments, tax refunds, pension plan refunds, insurance awards and certain incurrences of indebtedness to repay outstanding loans under the New Loan Agreement. We may also be required to use cash in excess of $20.0 million to repay outstanding loans under the New Loan Agreement.
The New Loan Agreement includes customary negative covenants for an asset-based term loan, including covenants limiting our ability to, among other things, (i) effect mergers and consolidations, (ii) sell assets, (iii) create or suffer to exist any lien, (iv) make certain investments, (v) incur debt and (vi) transact with affiliates. In addition, the New Loan Agreement includes customary affirmative covenants for an asset-based term loan, including covenants regarding the delivery of financial statements, reports and notices to the Agent. The New Loan Agreement also contains customary representations and warranties and event of default provisions for a secured term loan.
New Regions Letters of Credit Facility
As discussed in Note 1 - Chapter 11 Proceedings, onOn the Effective Date, we repaid the outstanding principal balance of $15.0 million plus outstanding interest and fees under the Prior Loan Agreement, and entered into the New Regions Letters of Credit Facility to cover letters of credit and certain bank product obligations existing on the Effective Date and pursuant to which Regions may issue, upon request by the Company, letters of credit and continue to provide charge cards for use by the Company. Amounts available under the New Regions Letters of Credit Facility are subject to customary fees and are secured by a first-priority lien on, and security interest in, a cash collateral account with Regions containing cash equal to at least (i) 105% of the sum of (a) all amounts owing for any drawings under letters of credit, including any reimbursement obligations, (b) the aggregate undrawn amount of all outstanding letters of credit, (c) all sums owing to Regions or any affiliate pursuant to any letter of credit document and (d) all obligations of the Company arising thereunder, including any indemnities and obligations
for reimbursement of expenses and (ii) 120% of the aggregate line of credit for charge cards issued by Regions to the Company. The fees for each letter of credit for the period from and excluding the date of issuance of such letter of credit to and including the date of expiration or termination, are equal to (x) the average daily face amount of each outstanding letter of credit multiplied by (y) a per annum rate determined by Regions from time to time in its discretion based upon such factors as Regions shall determine, including, without limitation, the credit quality and financial performance of the Company. As of the Effective Date,March 31, 2018, such rate was 3.00%. In the event we are unable to repay amounts due under the New Regions Letters of Credit Facility, Regions could proceed against such cash collateral account. Regions has no commitment under the New Regions Letters of Credit Facility to issue letters of credit. At March 31, 2018, the facility had $8.6 million in letters of credit outstanding.
Cash Flows
Our cash flows depend, to a large degree, on the level of spending by oil and gas companies' development and production activities. The sustained decreases in the price of oil and natural gas have had a material impact on these activities, and could also materially affect our future cash flows. Certain sources and uses of cash, such as the level of discretionary capital expenditures and issuances and repurchases of debt and our common stock are within our control and are adjusted as necessary based on market conditions.
Cash Flows from Operating Activities
Cash flows provided by (used in)from operating activities was $(3.3) million, $(4.3)$0.3 million, and $2.2$(3.0) million for the period April 13, 2017 through June 30, 2017three months ended March 31, 2018 (Successor), the period January 1, 2017 through April 12, 2017 (Predecessor) and the sixthree months ended June 30, 2016March 31, 2017 (Predecessor), respectively. The decreaseincrease is primarily related to net loss of $(7.0)$8.5 million for the period April 13, 2017 through June 30, 2017three months ended March 31, 2018 (Successor) and offset by the change in depreciation and amortization, reorganization items, accounts receivable, accounts payable and accrued interest payable for the three months ended March 31, 2018 (Successor) and the change in accounts receivable for the period April 13, 2017 through June 30, 2017 (Successor) and the period January 1, 2017 through April 12,three months ended March 31, 2017 (Predecessor).
Cash Flows from Investing Activities
Cash flows provided by (used in)from investing activities was $(0.2) million, $0.5$(2.1) million, and $(5.9)$0.6 million for the period April 13, 2017 through June 30, 2017three months ended March 31, 2018 (Successor), the period January 1, 2017 through April 12, 2017 (Predecessor) and the sixthree months ended June 30, 2016March 31, 2017 (Predecessor), respectively. The decrease was primarily due to reducedincreased purchases of property and equipment and an increasea decrease in proceeds from the sale of property and equipment for the period April 13, 2017 through June 30, 2017three months ended March 31, 2018 (Successor) and the period January 1, 2017 through April 12, 2017 (Predecessor).
Cash Flows from Financing Activities
Cash flows provided by (used in)from financing activities were $(0.3) million, $3.1$(0.5) million, and $(2.3)$(0.4) million for the period April 13, 2017 through June 30, 2017three months ended March 31, 2018 (Successor), the period January 1, 2017 through April 12, 2017 (Predecessor) and the sixthree months ended June 30, 2016March 31, 2017 (Predecessor), respectively. The increase for the period January 1, 2017 through April 12, 2017 (Predecessor), which included the impact of cash transactions occurring upon emergence from bankruptcy, was due to net proceeds from the New Loan Agreement, offset by repayment of the Prior Loan Agreement, repayment of the Prior Senior Notes, and payment of Debt Issuance CostsThese amounts related to the New Loan Agreement.debt payments on our equipment loans.
Notwithstanding the impact of the chapter 11 cases on our liquidity, our current and future liquidity is greatly dependent upon our operating results. Our ability to continue to meet our liquidity needs is subject to and will be affected by cash utilized in operations, the economic or business environment in which we operate, weakness in oil and natural gas industry conditions, the financial condition of our customers and vendors, and other factors. Furthermore, as a result of the challenging market conditions we continue to face, we anticipate continued net cash used in operating activities after capital expenditures. We believe that our current reserves of cash and availability under the New Loan Agreement are sufficient to finance our cash requirements for current and future operations, budgeted capital expenditures, debt service and other obligations for at least the next twelve months.
Off-Balance Sheet Arrangements
We are often party to certain transactions that require off-balance sheet arrangements such as performance bonds, guarantees, operating leases for equipment, and bank guarantees that are not reflected in our condensed consolidated balance sheets. These arrangements are made in our normal course of business and they are not reasonably likely to have a current or future material adverse effect on our financial condition, results of operations, liquidity, or cash flows. See Note 98 - Commitment and Contingencies.
Contractual Obligations
The table below provides estimated timing of future payments for which we were obligated as of June 30, 2017.
|
| | | | | | | | | | | | | | | | | | | |
| Actual | Total | | 2017 | | 2018-2019 | | 2020-2021 | | Thereafter |
| | (dollars in thousands) |
Term Loan (1) | $ | 50,000 |
| | $ | — |
| | $ | — |
| | $ | 50,000 |
| | $ | — |
|
| Capital lease obligations | 1,000 |
| | 451 |
| | 415 |
| | 134 |
| | — |
|
| Cash interest on debt | 12,025 |
| | 1,859 |
| | 5,762 |
| | 4,404 |
| | — |
|
| Total | $ | 63,025 |
| | $ | 2,310 |
| | $ | 6,177 |
| | $ | 54,538 |
| | $ | — |
|
(1) Term Loan does not include interest paid in kind or debt discount.
Seasonality and Cyclical Trends
Our operations are impacted by seasonal factors. Historically, our business has been negatively impacted during the winter months due to inclement weather, fewer daylight hours, and holidays. Our well servicing rigs are mobile and we operate a significant number of oilfield vehicles. During periods of heavy snow, ice or rain, we may not be able to move our equipment between locations, thereby reducing our ability to generate rig or truck hours. In addition, the majority of our well servicing rigs work only during daylight hours. In the winter months, as daylight time becomes shorter, the amount of time that the well servicing rigs work is shortened, which has a negative impact on total hours worked. Finally, we historically have experienced significant slowdown during the Thanksgiving and Christmas holiday seasons.
In addition, theThe oil and natural gas industry has traditionally been volatile and is influenced by a combination of long-term, short-term and cyclical trends, including the domestic and international supply and demand for oil and natural gas, current and expected future prices for oil and natural gas and the perceived stability and sustainability of those prices. Such cyclical trends also include the resultant levels of cash flows generated and allocated by exploration and production companies to their drilling, completion and workover budget. The volatility of the oil and natural gas industry and the decline in oil and natural gas prices have negatively impacted the level of exploration and production activity and capital expenditures by our customers. This has adversely affected, and continues to adversely affect, the demand for our services, which has had, and if it continues, will continue to have, a material adverse effect on our business, financial condition, results of operations, and cash flows.
Critical Accounting Policies and Estimates
The preparation of our condensed consolidated financial statements in accordance with GAAP requires management to make estimates and assumptions that affect the reported amounts of assets and liabilities and the disclosure of contingent assets and liabilities as of the dates of the financial statements and the reported amounts of revenue and expenses during the applicable reporting periods. On an ongoing basis, management reviews its estimates, particularly those related to depreciation and amortization methods, useful lives and impairment of long-lived assets, and asset retirement obligations, using currently available information. Changes in facts and circumstances may result in revised estimates, and actual results could differ from those estimates. There have been no material changes to the critical accounting policies and estimates set forth in Item 7 in our Annual Report on Form 10-K for the year ended December 31, 2016, as amended,2017, except for the application of ASU No. 2014-09 which created FASB ASC 852 “Reorganizations”Topic 606 “Revenue from Contracts with Customers” to our accounting and financial reporting activities as a result of the filing of the Bankruptcy Petitions after emergence from bankruptcy on April 13, 2017. The guidance in ASC 852 is designed to provide readers of the financial statements with information that reflects the financial impact of the bankruptcy proceedings and requires that transactions and events directly associated with the reorganization be distinguished from the ongoing operations of the Company.activities.
Item 3. Quantitative and Qualitative Disclosures About Market Risk
There have been no material changes to the market risk disclosures set forth in Item 7A in our Annual Report on Form 10-K for the year ended December 31, 2016.2017.
Item 4. Controls and Procedures
Evaluation of Disclosure Controls and Procedures
Our management, with the participation of our chief executive officer and chief financial officer, evaluated the effectiveness of our disclosure controls and procedures as of June 30, 2017.March 31, 2018. The term “disclosure controls and procedures,” as defined in Rules 13a-15(e) and 15d-15(e) under the Securities Exchange Act of 1934, as amended or the Exchange Act, means controls and other procedures of a company that are designed to ensure that information required to be disclosed by a company in the reports that it files or submits under the Exchange Act is recorded, processed, summarized and reported, within the time periods specified in the rules and forms of the Security and Exchange Commission, or the SEC. Disclosure controls and procedures include, without limitation, controls and procedures designed to ensure that information required to be disclosed by a company in the reports that it files or submits under the Exchange Act is accumulated and communicated to the company's management, including its principal executive and principal financial officers, as appropriate to allow timely decisions regarding required disclosure. Management recognizes that any controls and procedures, no matter how well designed and operated, can provide only reasonable assurance of achieving their objectives and management necessarily applies its judgment in evaluating the cost-benefit relationship of possible controls and procedures. Based on the evaluation of our disclosure controls and procedures as of June 30, 2017,March 31, 2018, our chief executive officer and chief financial officer concluded that, as of such date, our disclosure controls and procedures over financial reporting were effective.
Changes in Internal Control over Financial Reporting
On January 1, 2018, we adopted ASC 606, Revenue from Contracts with Customers. Although the new revenue recognition standard is not expected to have a material impact on our ongoing net income, we nevertheless implemented changes to our processes related to revenue recognition and the control activities within them.
There was no change in our internal control over financial reporting (as defined in Rules 13-a-15(f) and 15d-15(f) under the Exchange Act) during the fiscal quarter ended June 30, 2017March 31, 2018 that has materially affected, or is reasonably likely to materially affect, our internal control over financial reporting.
PART II—OTHER INFORMATION
There are no pending material legal proceedings, and the Company is not aware of any material threatened legal proceedings, to which the Company is a party or to which its property is subject that would have a material adverse effect on the Company's financial statements as of June 30, 2017.March 31, 2018.
A description of our risk factors can be found in Item 1A of our Annual Report on Form 10-K for the year ended December 31, 2016, as amended.2017.
| |
| Item 2. | Unregistered Sales of Equity Securities and Use of Proceeds |
None.
| |
| Item 3. | Default Upon Senior Securities |
None.
Item 4.Mine Safety Disclosures
Not applicable.
Item 5. Other Information
None.
Item 6. Exhibits
|
| | | | | |
| Number | | | Description of Exhibits |
| | | | |
| 2.1 |
| — |
| | |
| 3.1 |
| — |
| | |
| 3.2 |
| — |
| | |
| 4.1 |
| — |
| | |
| 10.1 |
| — |
| | |
| 10.2 |
| — |
| | Loan and Security Agreement, dated as of April 13, 2017, by and among Forbes Energy Services LLC, as borrower, Forbes Energy International, LLC, TX Energy Services, LLC, C.C. Forbes, LLC and Forbes Energy Services Ltd., as guarantors, Wilmington Trust, N.A., as agent, and certain lenders party thereto (incorporated by reference to Exhibit 10.1 to the Company's Current Report on Form 8-K filed April 18, 2017). |
| 10.3 |
| — |
| | |
| 10.4 |
| — |
| | |
| 10.5 |
| — |
| | |
| 10.6 |
| — |
| | |
| 10.7 |
| — |
| | |
| 10.8 |
| — |
| | |
| 10.9 |
| — |
| | |
| 10.10 |
| — |
| | |
| 31.1* |
| — |
| | |
| 31.2* |
| — |
| | |
| 32.1* |
| — |
| | |
| 32.2* |
| — |
| | |
| 99.1 |
| — |
| | |
| 101* |
| — |
| | Interactive Data Files |
_________________________
SIGNATURES
Pursuant to the requirements of the Securities Exchange Act of 1934, as amended, the registrant has duly caused this report to be signed on its behalf by the undersigned, thereunto duly authorized.
|
| | | | |
| | | FORBES ENERGY SERVICES LTD. |
| | | | |
August 14, 2017May 15, 2018 | | By: | | /s/ JOHN E. CRISP |
| | | | | John E. Crisp Chairman, Chief Executive Officer and President (Principal Executive Officer) |
| | | | | |
| | | | |
August 14, 2017May 15, 2018 | | By: | | /S/ L. MELVIN COOPER |
| | | | | L. Melvin Cooper Senior Vice President, Chief Financial Officer and Assistant Secretary (Principal Financial and Accounting Officer) |
EXHIBIT INDEX
|
| | | | | |
| Number | | | Description of Exhibits |
| 2.1 |
| — |
| | Debtors’ Prepackaged Joint Plan of Reorganization, dated December 21, 2016 (incorporated by reference to Exhibit 99.1 to the Company’s Current Report on Form 8-K filed December 23, 2016). |
| 3.1 |
| — |
| | Certificate of Incorporation of Forbes Energy Services Ltd. (incorporated by reference to Exhibit 3.1 to the Company’s Registration Statement on Form 8-A filed April 18, 2017). |
| 3.2 |
| — |
| | Second Amended and Restated Bylaws of Forbes Energy Services Ltd. (incorporated by reference to Exhibit 3.2 to the Company’s Registration Statement on Form 8-A filed April 18, 2017). |
| 4.1 |
| — |
| | Specimen Certificate for the Company’s common stock, $0.01 par value (incorporated by reference to Exhibit 4.1 to the Company’s Registration Statement on Form 8-A filed April 18, 2017). |
| 10.1 |
| — |
| | Registration Rights Agreement by and among Forbes Energy Services Ltd. and certain holders identified therein dated as of April 13, 2017 (incorporated by reference to Exhibit 10.1 to the Company's Registration Statement on Form 8-A filed April 18, 2017). |
| 10.2 |
| — |
| | Loan and Security Agreement, dated as of April 13, 2017, by and among Forbes Energy Services LLC, as borrower, Forbes Energy International, LLC, TX Energy Services, LLC, C.C. Forbes, LLC and Forbes Energy Services Ltd., as guarantors, Wilmington Trust, N.A., as agent, and certain lenders party thereto (incorporated by reference to Exhibit 10.1 to the Company's Current Report on Form 8-K filed April 18, 2017). |
| 10.3 |
| — |
| | Agreement regarding Cash Collateral and Letters of Credit dated as of April 13, 2017 by and among Forbes Energy Services LLC, Forbes Energy International, LLC, TX Energy Services, LLC, C.C. Forbes, LLC, Forbes Energy Services Ltd. and Regions Bank (incorporated by reference to Exhibit 10.2 to the Company's Current Report on Form 8-K filed April 18, 2017). |
| 10.4 |
| — |
| | Forbes Energy Services Ltd. 2017 Management Incentive Plan (incorporated by reference to Exhibit 10.4 to the Company’s Current Report on Form 8-K filed April 18, 2017). |
| 10.5 |
| — |
| | Amended and Restated Employment Agreement effective April 13, 2017, by and between John E. Crisp and Forbes Energy Services LLC (incorporated by reference to Exhibit 10.5 to the Company’s Current Report on Form 8-K filed April 18, 2017). |
| 10.6 |
| — |
| | Amended and Restated Employment Agreement effective April 13, 2017, by and between L. Melvin Cooper and Forbes Energy Services LLC (incorporated by reference to Exhibit 10.6 to the Company’s Current Report on Form 8-K filed April 18, 2017). |
| 10.7 |
| — |
| | Employment Agreement effective April 13, 2017, by and between Steve Macek and Forbes Energy Services LLC (incorporated by reference to Exhibit 10.7 to the Company’s Current Report on Form 8-K filed April 18, 2017). |
| 10.8 |
| — |
| | Form of Time-Based Restricted Stock Unit Award Agreement (incorporated by reference to Exhibit 10.8 to the Company’s Quarterly Report on Form 10-Q filed May 15, 2017). |
| 10.9 |
| — |
| | Form of Exit Financing Time-Based Restricted Stock Unit Award Agreement (incorporated by reference to Exhibit 10.9 to the Company’s Quarterly Report on Form 10-Q filed May 15, 2017.2017). |
| 10.10 |
| — |
| | Form of Performance-Based Restricted Stock Unit Award Agreement (incorporated by reference to Exhibit 10.10 to the Company’s Quarterly Report on Form 10-Q filed May 15, 2017). |
| 31.1* |
| — |
| | Certification of Chief Executive Officer pursuant to Rule 13a-14(a)/15d-14(a). |
| 31.2* |
| — |
| | Certification of Chief Financial Officer pursuant to Rule 13a-14(a)/15d-14(a). |
| 32.1* |
| — |
| | Certification of Chief Executive Officer Pursuant to Section 18 U.S.C. Section 1350, as Adopted Pursuant to Section 906 of the Sarbanes-Oxley Act of 2002. |
| 32.2* |
| — |
| | Certification of Chief Financial Officer Pursuant to Section 18 U.S.C. Section 1350, as Adopted Pursuant to Section 906 of the Sarbanes-Oxley Act of 2002. |
| 99.1 |
| — |
| | Order Approving the Debtors’ Disclosure Statement For, and Confirming, the Debtors’ Prepackaged Joint Plan of Reorganization, as entered by the Bankruptcy Court on March 29, 2017 (incorporated by reference to Exhibit 99.1 to the Company’s Current Report on Form 8-K filed March 31, 2017). |
| 101* |
| — |
| | Interactive Data Files |
_________________________